HERC HOLDINGS INC
10-Ks and 10-Qs
|
|
|
|
|
|
|
|
|
|
|
|
|
|
|
|
|
|
|
|
|
|
|
|
|
|
|
|
|
|
|
|
|
|
|
|
|
|
|
|
|
|
|
|
|
|
|
|
|
|
|
|
|
|
|
|
UNITED STATES
SECURITIES AND EXCHANGE COMMISSION
WASHINGTON, D.C. 20549
_______________________________________________________________________________
FORM 10-K
|
x
|
ANNUAL REPORT PURSUANT TO SECTION 13 OR 15(d) OF THE SECURITIES EXCHANGE ACT OF 1934
|
|
For the fiscal year ended December 31, 2017
|
|
|
OR
|
|
|
o
|
TRANSITION REPORT PURSUANT TO SECTION 13 OR 15(d) OF THE SECURITIES EXCHANGE ACT OF 1934
|
Commission File Number 001-33139
HERC HOLDINGS INC.
(Exact name of registrant as specified in its charter)
|
Delaware
(State or other jurisdiction of
incorporation or organization)
|
20-3530539
(I.R.S. Employer
Identification Number)
|
|
27500 Riverview Center Blvd.
Bonita Springs, Florida 34134
(239) 301-1000
(Address, including Zip Code, and telephone number,
including area code, of registrant's principal executive offices)
Securities registered pursuant to Section 12(b) of the Act:
|
Title of each class
|
Name of each exchange on which registered
|
|
|
Common Stock, par value $0.01 per share
|
New York Stock Exchange
|
|
Securities registered pursuant to Section 12(g) of the Act: None
Indicate by check mark if the registrant is a well-known seasoned issuer, as defined in Rule 405 of Securities Act. Yes
x
No
o
Indicate by check mark if the registrant is not required to file reports pursuant to Section 13 or Section 15(d) of the Act. Yes
o
No
x
Indicate by check mark whether the registrant (1) has filed all reports required to be filed by Section 13 or 15(d) of the Securities Exchange Act of 1934 during the preceding 12 months (or for such shorter period that the registrant was required to file such reports), and (2) has been subject to such filing requirements for the past 90 days. Yes
x
No
o
Indicate by check mark whether the registrant has submitted electronically and posted on its corporate Web site, if any, every Interactive Data File required to be submitted and posted pursuant to Rule 405 of Regulation S-T (§232.405 of this chapter) during the preceding 12 months (or for such shorter period that the registrant was required to submit and post such files). Yes
x
No
o
Indicate by check mark if disclosure of delinquent filers pursuant to Item 405 of Regulation S-K (§229.405) is not contained herein, and will not be contained, to the best of registrant’s knowledge, in definitive proxy or information statements incorporated by reference in Part III of this Form 10-K or any amendment to this Form 10-K.
o
Indicate by check mark whether the registrant is a large accelerated filer, an accelerated filer, a non-accelerated filer, smaller reporting company, or emerging growth company. See the definitions of "large accelerated filer," "accelerated filer," "smaller reporting company," and "emerging growth company" in Rule 12b-2 of the Exchange Act.
|
Large accelerated filer
|
x
|
Accelerated filer
|
o
|
||
|
Non-accelerated filer
|
o
|
(Do not check if a smaller reporting company)
|
Smaller reporting company
|
o
|
|
|
Emerging growth company
|
o
|
||||
If an emerging growth company, indicate by check mark if the registrant has elected not to use the extended transition period for complying with any new or revised financial accounting standards provided pursuant to Section 13(a) of the Exchange Act.
o
Indicate by check mark whether the registrant is a shell company (as defined in Rule 12b-2 of the Act). Yes
o
No
x
The aggregate market value of the voting and non-voting common equity held by non-affiliates of the registrant as of June 30, 2017, the last business day of the registrant's most recently completed second fiscal quarter, based on the closing price of the stock on the New York Stock Exchange on such date, was $
762.5 million
.
As of February 23, 2018, there were
28,399,244
shares of the registrant's common stock outstanding.
Documents incorporated by reference:
Certain portions, as expressly described in this report, of the Registrant's Proxy Statement for its 2018 annual meeting of stockholders, to be filed within 120 days of
December 31, 2017
, are incorporated by reference into Part III.
HERC HOLDINGS INC. AND SUBSIDIARIES
INDEX
|
|
|
Page
|
HERC HOLDINGS INC. AND SUBSIDIARIES
CAUTIONARY NOTE REGARDING FORWARD-LOOKING STATEMENTS
This Annual Report on Form 10-K for the year ended
December 31, 2017
(this "Report") includes "forward-looking statements," as that term is defined by the federal securities laws. Forward-looking statements include statements concerning our plans, intentions, objectives, goals, strategies, forecasts, future events, future revenue or performance, future capital expenditures, financing needs, business trends and other information that is not historical information. When used in this Report, the words "estimates," "expects," "anticipates," "projects," "plans," "intends," "believes," "forecasts," and future or conditional verbs, such as "will," "should," "could" or "may," as well as variations of such words or similar expressions are intended to identify forward-looking statements, although not all forward-looking statements are so designated. All forward-looking statements are based upon our current expectations and various assumptions, and apply only as of the date of this Report. Our expectations, beliefs and projections are expressed in good faith and we believe there is a reasonable basis for them. However, there can be no assurance that our expectations, beliefs and projections will be achieved.
There are a number of risks, uncertainties and other important factors that could cause our actual results to differ materially from those suggested by our forward-looking statements, including those set forth in Part I, Item 1A "Risk Factors" in this Report and in our other filings with the Securities and Exchange Commission. All forward-looking statements are expressly qualified in their entirety by such cautionary statements. We undertake no obligation to update or revise forward-looking statements that have been made to reflect events or circumstances that arise after the date made or to reflect the occurrence of unanticipated events.
i
HERC HOLDINGS INC. AND SUBSIDIARIES
Our Company
Herc Holdings Inc. ("we," "us," "our," "Herc Holdings," "the Company" or as the context requires, "its") is one of the leading equipment rental suppliers with approximately
275
locations principally in North America. We conduct substantially all of our operations through subsidiaries, including Herc Rentals Inc. ("Herc"). Operations are conducted under the Herc Rentals brand in the United States and under the Hertz Equipment Rental brand in Canada and other international locations.
With over 50 years of experience, we are a full-line equipment rental supplier offering a broad portfolio of equipment for rent. In addition to our principal business of equipment rental, we sell used equipment and contractor supplies such as construction consumables, tools, small equipment and safety supplies; provide repair, maintenance and equipment management services and safety training to certain of our customers; offer equipment re-rental services and provide on-site support to our customers; and provide ancillary services such as equipment transport, rental protection, cleaning, refueling and labor.
Our classic fleet includes aerial, earthmoving, material handling, trucks and trailers, air compressors, compaction and lighting. Our equipment rental business is supported by ProSolutions
TM
, our industry-specific solutions-based services which includes pumping solutions, power generation, climate control, remediation and restoration, and studio and production equipment, and our ProContractor professional grade tools.
Corporate History
On June 30, 2016, the Company, in its previous form as the holding company of both the existing equipment rental operations as well as the former vehicle rental operations (in its form prior to the Spin-Off, "Hertz Holdings"), completed a spin-off (the "Spin-Off") of its global vehicle rental business through a dividend to stockholders of all of the issued and outstanding common stock of Hertz Rental Car Holding Company, Inc., which was re-named Hertz Global Holdings, Inc. ("New Hertz"). New Hertz is an independent public company that trades on the New York Stock Exchange under the symbol "HTZ" and continues to operate its global vehicle rental business through its operating subsidiaries including The Hertz Corporation ("THC"). The Company changed its name to Herc Holdings Inc. on
June 30, 2016
, and trades on the New York Stock Exchange under the symbol "HRI."
For accounting purposes, due to the relative significance of New Hertz to Hertz Holdings, New Hertz was considered the spinnor or divesting entity in the Spin-Off and Herc Holdings was considered the spinnee or divested entity. As a result, despite the legal form of the transaction, New Hertz was the "accounting successor" to Hertz Holdings. Under the accounting rules, the historical financial information of Herc Holdings, including certain information presented in the consolidated financial statements included in this Report, reflects the financial information of the equipment rental business and certain parent legal entities of Herc as historically operated as part of Hertz Holdings, as if Herc Holdings was a stand-alone company for the periods presented.
Herc was incorporated in Delaware in 1965. Since its incorporation and until the Spin-Off, Herc was a wholly-owned subsidiary of Hertz Holdings or one of its subsidiaries operating its equipment rental business. Since the Spin-Off, Herc has been a wholly-owned subsidiary of Herc Holdings. Herc Holdings was incorporated in Delaware in 2005 under a previous name. On October 30, 2015, we sold our operations in France and Spain. Subsequent to the sale of these operations, we generate substantially all of our equipment rental revenue in North America.
Our Industry
The equipment rental industry serves a diverse group of customers from individuals and small local contractors to large national accounts providing a wide variety of rental equipment including mid-size and heavy equipment, specialty equipment and contractor tools. The equipment rental industry is highly fragmented with few national competitors and many regional and local operators.
The growth and financial health of the North American equipment rental industry is driven by a number of factors including economic trends, non-residential construction activity, capital investment in the industrial sector, repair maintenance and overhaul spending, government spending and demand for construction and other rental equipment generally, including for remediation and re-building efforts related to natural disasters. We believe that companies have increasingly turned to the equipment rental market to manage their capital needs, which allows our customers to operate their businesses without incurring the significant acquisition cost and maintenance expense associated with owning their own equipment fleet. We believe the trend from equipment ownership to rental in the North American construction industry will continue in the near term.
1
Our Competitive Strengths
Our competitive strengths include the following:
A Market Leader in North America with Significant Scale and Broad Footprint
—We believe we are one of the largest equipment rental companies in the North American equipment rental industry, with an estimated 3% market share by revenue and approximately
275
company-owned locations in
39
states in the United States and
eight
provinces in Canada. Our scale compared to most of our competitors provides us with a number of significant competitive advantages including:
|
•
|
the ability to provide premium brands and a comprehensive line of equipment and services, allowing us to be a single-source solution for our customers;
|
|
•
|
the ability to track utilization and facilitate the fluid transfer of our fleet across multiple locations to adjust to local customer demand;
|
|
•
|
a geographic footprint that allows us to maintain proximity and local expertise to serve our customers in local markets as well as serve national accounts with geographically dispersed equipment rental needs;
|
|
•
|
favorable purchasing power or volume discount pricing opportunities on material and equipment;
|
|
•
|
operational cost efficiencies across our organization, including with respect to purchasing, information technology, back-office support and marketing;
|
|
•
|
a national sales force with significant expertise across our equipment fleet; and
|
|
•
|
industry-specific expertise to assist our customers with customized solutions.
|
Since the North American equipment rental industry is highly fragmented, with very few national competitors, we believe that the majority of our competitors do not enjoy these same advantages.
Diverse Customer Markets and Expansion into Specialty Rental Markets
—We provide equipment rental services to customers in a wide variety of large markets, including contractors in commercial and residential construction, specialty and remediation and environmental sectors; industrial, including energy, chemical processing and manufacturing; infrastructure, such as highway and bridges, railroads and sewer and waste disposal; and other industries such as facilities management and entertainment production and services. We believe that diversification of our customer base reduces our exposure to any particular market.
Large, Diverse and High-Quality Equipment Fleet
—Our equipment fleet represents a significant investment and reflects our commitment to providing an array of rental equipment to our customers in a variety of industries. We offer a wide range of equipment from leading, globally-known original equipment manufacturers who we believe provide reliable equipment. We also offer a wide range of professional grade tools that target professional contractors. Our extensive and high-quality rental fleet enables us to serve a diverse customer base that requires large quantities and/or varied types of equipment for rent. Our increasing portfolio of specialty equipment further expands our capabilities and customer reach.
In recent years, we took steps to diversify our portfolio into a variety of niche markets that experience business cycles that may vary in intensity and duration from that of the general economy. We believe this diversification also positions us to take advantage of any increase in demand for more specialized rental solutions.
Established National Accounts Program
—Our national account program provides us with longer rental terms for much of our equipment, with many of our larger customers renting equipment from us on a monthly basis for use in large, complex projects. These arrangements provide a number of additional benefits, including recurring revenue, attractive credit profiles, improved fleet utilization and enhanced presence in new markets. National accounts represented
45%
of equipment rental revenue for the year ended
December 31, 2017
. Through our national customer relationship program, our sales teams serve as a single point of contact for those customers' equipment rental needs. This enables us to be a full end-to-end solutions provider.
Superior Customer Service
—We have a well-established reputation for superior customer service, which has been a competitive differentiator for us throughout our history. Senior management remains focused on enhancing our customer service focused culture. We provide a suite of comprehensive services to support our customers and to maintain and service the equipment we rent. We spend significant time and resources training our personnel to effectively address the needs of our customers. We believe that these initiatives help support our pricing strategy and foster customer loyalty.
2
Range of Value-Added Services
—We offer a suite of customer-focused services. These services include equipment transport, fleet management and telematics, power solutions, on-site services and customized advice, engineered solutions, re-rental options, and parts and supplies sales. This combination of services is designed to offer comprehensive value-added solutions to our customers that complement and enhance the rental equipment we offer.
Experienced Senior Leadership Team
—We have an experienced senior leadership team committed to maintaining operational excellence with an average of approximately
20
years of experience in the equipment rental and heavy equipment industries. Our senior leadership team has extensive knowledge of all aspects of these industries, particularly in North America. The team has developed and rolled out the "Herc Way" operating model and other systems and procedures for developing and monitoring our branch network in order to foster a high operational standard throughout our locations. Our team is dedicated to providing our customers a quality rental experience and is committed to further improving our performance capabilities.
Our Strategy
Our long-term strategy is focused on four priorities: expanding and diversifying our revenues; improving our operating effectiveness; enhancing the customer experience; and disciplined capital management.
Expand and Diversify Revenues
—Our strategy to achieve ongoing growth is driven by initiatives that expand and diversify our revenues through customer- and market-focused initiatives. We are actively working to expand and diversify our equipment rental fleet with a broader mix of equipment that increases the range of customers and markets we serve. We are growing our ProSolutions
TM
business which offers specialized equipment and services, including technical expertise and customized solutions, for customers and projects, as well as our ProContractor business, which focuses on professional grade tools and equipment that meet their needs. We will continue to offer a comprehensive equipment rental fleet to maintain our market leadership.
We plan to expand our footprint in North America, with a focus on increasing the number of branches in major urban markets, and to continue to reconfigure existing locations with fleet and expertise tailored to local markets. Our footprint expansion will include locations dedicated to our ProSolutions
TM
and ProContractor business to better support our growing specialty equipment and services operations. We will continue to pursue initiatives that allow us to drive more volume through existing branches.
We are also increasing our focus on generating revenue from ancillary services as part of our total solutions offering.
Improve Operating Effectiveness
—We are focused on generating continuous improvement across our operations, with an emphasis on building a strong safety culture, supplier management, fleet availability and improving margins. We continue to emphasize our commitment to building a safety culture across our business, including ongoing training and institutionalized programs, to embed safety awareness and behaviors into our daily operations. We have reduced the number of suppliers in each equipment category of our equipment rental fleet. This provides us with improved buying power as we negotiate our fleet purchases and lends efficiencies to our services and repair processes. Further, we are concentrating our capital expenditures on premium brands from top-tier suppliers, which we expect will reduce life cycle costs and deliver better end-of-service resale values. We will maintain our focus on reducing fleet unavailable for rent through the ongoing implementation and refinement of our Herc Way operating model, which is designed to ensure a consistently efficient approach to managing, servicing and repairing our fleet.
We are continuing to build a highly professional and technology-enabled sales force and to optimize our sales territories to support our revenue growth objectives. We will continue to improve the effectiveness of our sales team with focused training, strong customer relationship management capabilities, and ongoing technology enhancements.
Enhance the Customer Experience
—We seek to differentiate our business by delivering a superior customer experience through the variety and quality of the equipment we offer, the ease of doing business with us and the added value we offer through services and technologies that improve customers’ productivity and efficiency. Our focused investment in top-tier brands is intended to meet our customers’ preferences and expectations for reliable, safe, efficient and effective gear. We expect to add more expertise across our team to help our customers achieve the best results for their projects. We are committed to delivering technology enhancements that enable us to drive improvements in customers’ efficiency and productivity. In developing these technologies, we are focused on meeting customer expectations related to convenience and on-demand access to data and information. Additionally, we provide training programs to our customers that focus on product use and safety.
3
Disciplined Capital Management
—We manage our equipment rental fleet using a life cycle approach designed to optimize the timing of fleet purchasing, repair and maintenance and disposal, while at the same time satisfying our customers' needs. Through continued use and development of our disciplined approach to efficient fleet management, we seek to maximize our utilization and return on investment.
Our Products and Services
Our principal products and services are described below.
Equipment Rental
—We offer for rent, on an hourly, daily, weekly or monthly basis, equipment from a variety of leading, globally known original equipment manufacturers, with which we maintain strong relationships.
The equipment is typically new at the time of acquisition and is not subject to any repurchase program. As of December 31, 2017, the average age of our equipment fleet was
49
months.
As of
December 31, 2017
, our rental fleet consisted of equipment with a total original equipment cost, based on the guidelines of the American Rental Association, of
$3.65 billion
. The following table provides a breakdown of the composition of our equipment rental fleet based on original equipment cost:
|
% of Original Equipment Cost
|
||||||
|
December 31,
|
||||||
|
Equipment Type
|
2017
|
2016
|
||||
|
Aerial - Booms
|
18.7
|
%
|
19.3
|
%
|
||
|
Aerial - Scissors and Other
|
7.5
|
%
|
6.4
|
%
|
||
|
Total Aerial
|
26.2
|
%
|
25.7
|
%
|
||
|
Material Handling - Telehandlers
|
13.3
|
%
|
13.5
|
%
|
||
|
Material Handling - Industrial
|
3.6
|
%
|
3.2
|
%
|
||
|
Total Material Handling
|
16.9
|
%
|
16.7
|
%
|
||
|
Earthmoving - Heavy
|
8.2
|
%
|
10.7
|
%
|
||
|
Earthmoving - Compact
|
7.7
|
%
|
7.5
|
%
|
||
|
Total Earthmoving
|
15.9
|
%
|
18.2
|
%
|
||
|
ProSolutions
TM
|
13.8
|
%
|
13.4
|
%
|
||
|
Trucks and Trailers
|
12.7
|
%
|
12.9
|
%
|
||
|
ProContractor
|
6.7
|
%
|
4.7
|
%
|
||
|
Air Compressors
|
2.6
|
%
|
3.0
|
%
|
||
|
Lighting
|
1.7
|
%
|
1.7
|
%
|
||
|
Compaction
|
1.6
|
%
|
1.7
|
%
|
||
|
Other
|
1.9
|
%
|
2.0
|
%
|
||
Sales of Used Rental Equipment
—We routinely sell our used rental equipment to manage repair and maintenance costs, as well as the composition, age and size of our fleet. We dispose of our used equipment through a variety of channels, including retail sales to customers and other third parties, sales to wholesalers, brokered sales and auctions. During the year ended
December 31, 2017
, we sold our used rental equipment through the following channels: approximately
44%
through wholesale sales,
30%
through retail sales and
26%
through auction sales.
Sales of New Equipment, Parts and Supplies
—We also sell new equipment. The types of new equipment that we sell vary by location and include a variety of ProContractor tools and supplies, small equipment (such as work lighting, generators, pumps, and compaction equipment and power trowels), safety supplies and expendables. In 2016, we phased out most of our new equipment dealerships to better focus on the rental business.
4
Our Customers
We have a wide range of customers across diverse markets with a large base of local small to mid-size customers as well as customers seeking specialty solutions or equipment. The principal markets we serve, based on our customers’ Standard Industrial Classification (“SIC”) codes, are as follows:
|
•
|
Contractors
-
We serve various types of contractors in non-residential and residential construction, specialty trade, restoration, remediation and environment and facility maintenance. Contractor business represented approximately
34%
of our equipment rental revenue for the year ended
December 31, 2017
.
|
|
•
|
Industrial
-
We serve industrial customers across a broad range of industries, including refineries and petrochemical operations, industrial manufacturing including automotive and aerospace, power, metals and mining, agriculture, pulp, paper and wood and food and beverage. We believe that key drivers of growth within the industrial market include increased levels of spending on industrial capital and maintenance, repairs and overhaul. Industrial customers represented approximately
30%
of our equipment rental revenue for the year ended
December 31, 2017
.
|
|
•
|
Infrastructure and Government
- We serve our infrastructure customers across a wide range of projects such as highways and bridges, sewer and waste, railroads and other transportation, utilities as well as all governmental spending. Infrastructure and government represented approximately
18%
of our equipment rental revenue for the year ended
December 31, 2017
.
|
|
•
|
Other Customers
-
In addition, we serve a variety of other customers across a diverse range of industries, including commercial and retail service, hospitality, healthcare, recreation, entertainment production and special event management. These customers collectively represented approximately
18%
of our equipment rental revenue for the year ended
December 31, 2017
.
|
We operate in mid-size and large urban markets serving a wide range of industries, which enables us to reduce exposure to any single customer or market, with no single customer making up more than 3% of our equipment rental revenue for the years ended
December 31, 2017
,
2016
or
2015
. Our footprint and broad customer base also assist in reducing the seasonality of our revenues and the impact from any one market's cycle.
Financial Information about Geographic Areas
We generate substantially all of our equipment rental revenue in North America. For each of the last three fiscal years, revenues from our external customers attributed to the U.S. and all foreign countries in total are set forth below:
|
Years Ended December 31,
|
||||||||||||
|
2017
|
2016
|
2015
|
||||||||||
|
United States
|
$
|
1,548.1
|
|
$
|
1,361.2
|
|
$
|
1,345.8
|
|
|||
|
International
|
206.4
|
|
193.6
|
|
332.4
|
|
||||||
|
Total revenue
|
$
|
1,754.5
|
|
$
|
1,554.8
|
|
$
|
1,678.2
|
|
|||
Our international revenues decreased in 2016 as compared to 2015 due to the sale of our operations in France and Spain in October 2015, and weakness in the upstream oil and gas markets which negatively impacted our revenues in Canada. See
Note 22
, "
Segment Information
" to our notes to our consolidated financial statements included in Part II, Item 8 of this Report for other financial information by geographic area. Also, see Item 1A "Risk Factors—Risks Related to Our Business" for a description of risks inherent in our international operations.
5
Sales and Marketing
We market and sell our services through a variety of complementary programs. Through a dedicated sales team, we provide our customers with support services, market and application expertise, and sales offerings. For example, we have sales teams committed to servicing various categories of our customer base, including clients in the construction, industrial, government and entertainment industries. Our product experts oversee the specialty products, providing application support and program management services to our clients. Through our national accounts program, our dedicated sales team provides our large customers with support across a number of diverse geographic, functional and equipment sectors. We also provide client support via our sales coordinators, reservation centers and customer care centers to help customers with their comprehensive needs.
We advertise our broad range of offerings through industry catalogs, participation and sponsorship of industry events, trade shows, and via the Internet. Additionally, through our website and mobile apps, our customers can arrange for the rental of equipment, browse and purchase used equipment, review our service offerings and manage their fleet and overall account with us.
Competition
Competition in the equipment rental industry is intense, often taking the form of aggressive price competition. Other competitive factors include customer loyalty, changes in market penetration, the introduction of new equipment, services and technology by competitors, changes in marketing, product diversity and quality and the ability to supply equipment and services to customers in a timely, predictable manner.
Our competitors in the equipment rental industry range from other large national companies to regional and local businesses and include equipment vendors and dealers who both sell and rent equipment directly to customers. The equipment rental industry is highly fragmented, with many companies operating on a regional or local scale and offering a limited number of products. The number of our competitors operating on a national scale is comparatively much smaller, although they often have significant breadth in the categories of equipment they rent. We believe, based on market and industry data, that we are one of the leading participants in the North American equipment rental industry, with the remainder comprised of a small number of multi-location regional operators and a large number of relatively small, independent businesses serving discrete local markets and specialty rental segments. In North America, the other leading national-scale industry participants are United Rentals, Inc., Ashtead Group plc’s Sunbelt Rentals brand, H&E Equipment Services, Inc. and BlueLine Rental LLC. Aggreko is a global competitor in the power generation rental markets in which we also participate.
Seasonality
Our business is seasonal, with demand for our rental equipment tending to be lower in the winter months, particularly in the northern United States and Canada. Our equipment rental business, especially in the construction industry, has historically experienced decreased levels of business from December until late spring and heightened activity during our third and fourth quarters until December. We have the ability to manage certain costs to meet market demand, such as fleet capacity, the most significant portion of our cost structure. For instance, to accommodate increased demand, we increase our available fleet and staff during the second and third quarters of the year. A number of our other major operating costs vary directly with revenues or transaction volumes; however, certain operating expenses, including rent, insurance and administrative overhead, remain fixed and cannot be adjusted for seasonal demand, typically resulting in higher profitability in periods when our revenues are higher, and lower profitability in periods when our revenues are lower. To reduce the impact of seasonality, we are focused on expanding our customer base through specialty products that serve different industries with less seasonality and different business cycles. See Item 1A "Risk Factors—Risks Related to Our Business."
Intellectual Property
We own intellectual property, including trademarks, copyrights and trade secrets, that plays an important role in maintaining our competitive position. While no single copyright or trade secret is, in our opinion, of such value to us that our business would be materially affected by the expiration or termination thereof, taken in the aggregate, these intellectual property rights provide meaningful protection for our business. However, we view the name and primary mark "Herc Rentals" and "Herc" as material to our business as a whole. We own a number of secondary trade names and trademarks applicable to certain aspects of our business that we also view as important.
6
Employees
We have approximately
4,900
employees, with approximately
4,600
persons in our North American operations and
300
persons in our other operations. International employees are covered by a variety of union contracts and governmental regulations affecting, among other things, compensation, job retention rights and pensions. As of
December 31, 2017
, labor contracts covering approximately
315
employees in the United States and
150
employees in Canada were in effect under approximately
20
active contracts with local unions, affiliated primarily with the International Brotherhood of Teamsters and the International Union of Operating Engineers. We have experienced no material work stoppage as a result of labor problems during the last ten years, and we believe our labor relations to be good. Nonetheless, we may be unable to negotiate new labor contracts on terms advantageous to us, or without labor interruption. See Item 1A "Risk Factors—Risks Related to Our Business."
In addition to the employees referred to above, we employ a number of temporary workers, and engage outside services, as is customary in the industry, principally for the non-revenue movement of rental equipment between rental locations and the movement of rental equipment to and from customers’ job sites.
Environmental, Health, and Safety Matters and Governmental Regulation
Environmental, Health, and Safety
—Our operations are subject to numerous national, state, local and international laws and regulations governing environmental protection and occupational health and safety matters. These laws govern such issues as wastewater, storm water, solid and hazardous wastes and materials, air quality and matters of workplace safety. Under these laws and regulations, we may be liable for, among other things, the cost of investigating and remediating contamination at our sites as well as sites to which we send hazardous wastes for disposal or treatment regardless of fault, as well as fines and penalties for non-compliance. Our operations generally do not raise significant environmental, health, or safety risks, but we use hazardous materials to clean and maintain equipment, dispose of solid and hazardous waste and wastewater from equipment washing, and store and dispense petroleum products from storage tanks at certain of our locations.
Based on the conditions currently known to us, we do not believe that any pending or likely remediation and compliance costs will have a material adverse effect on our business. We cannot be certain, however, as to the potential financial impact on our business if new adverse conditions are discovered, or compliance requirements become more stringent. See Item 1A "Risk Factors—Risks Related to Our Business."
Governmental Regulation
—Our operations also expose us to a number of other national, state, local and international laws and regulations, in addition to legal, regulatory and contractual requirements we face as a government contractor. These laws and regulations address multiple aspects of our operations, such as taxes, consumer rights, privacy, data security and employment matters, and also may impact other areas of our business. There are often different requirements in different jurisdictions. Changes in government regulation of our business has the potential to materially alter our business practices or our profitability. Depending on the jurisdiction, those changes may come about through the issuance of new laws and regulations or changes in the interpretation of existing laws and regulations by a court, regulatory body or governmental official. Sometimes those changes may have both a retroactive and prospective effect. This is particularly true when a change is made through reinterpretation of laws or regulations that have been in effect for some time. Moreover, changes in regulation that may seem neutral on their face may have either more or less impact on us than on our competitors, depending on the circumstances. See Item 1A "Risk Factors—Risks Related to Our Business."
Available Company Information
We file annual, quarterly and current reports and other information with the Securities and Exchange Commission ("SEC"). You may also access, free of charge, our reports filed with the SEC (for example, our annual reports on Form 10-K, quarterly reports on Form 10-Q, current reports on Form 8-K and any amendments to those reports filed or furnished pursuant to Section 13(a) or 15(d) of the Securities Exchange Act of 1934, as amended (the "Exchange Act")) through our Internet website (http://ir.hercrentals.com). Reports filed with or furnished to the SEC will be available through our Internet website as soon as reasonably practicable after they are electronically filed with or furnished to the SEC. Our committee charters, Corporate Governance Guidelines and Code of Ethics are also available on our website. From time to time we may amend our Code of Ethics. In accordance with SEC regulations we intend to disclose, by posting on our website, information about any amendments to our Code of Ethics, as well as information concerning any waiver of the Code of Ethics that may be granted by our Board of Directors. The information found on our website is not part of this or any other report filed with or furnished to the SEC. You may also read and copy any
7
documents that we file at the SEC's public reference room at 100 F Street, N.E., Washington, D.C. 20549. You may call the SEC at 1-800-SEC-0330 to obtain further information about the Public Reference Room. In addition, the SEC maintains an Internet website (http://www.sec.gov) that contains reports, proxy and information statements and other information about issuers that file electronically with the SEC, including Herc Holdings.
8
HERC HOLDINGS INC. AND SUBSIDIARIES
Investing in or maintaining your investment in Herc Holdings common stock involves a high degree of risk. You should carefully consider each of the risks and uncertainties set forth below as well as the other information contained in this Report before deciding to invest in our common stock. We have grouped our Risk Factors under captions that we believe describe various categories of potential risk. For the reader’s convenience, we have not duplicated risk factors that could be considered to be included in more than one category. Any of the following risks and uncertainties could materially and adversely affect our business, financial condition, results of operations, liquidity and/or cash flows and the impact could be compounded if multiple risks were to occur. However, the following risks and uncertainties are not the only risks and uncertainties facing us. Additional risks and uncertainties not currently known to us or those we currently view to be immaterial also may materially and adversely affect our business, financial condition, results of operations, liquidity and/or cash flows. In the event that any of these risks have such a material adverse effect, the market price of our common stock could decline and you could lose all or part of your investment.
Risks Related to Material Weaknesses in our Internal Control over Financial Reporting and the Restatement of Financial Statements Previously Issued by Hertz Holdings
We have identified material weaknesses in our internal control over financial reporting that may adversely affect our ability to report our financial condition and results of operations in a timely and accurate manner, which may adversely affect investor and lender confidence in us and, as a result, the value of our common stock and our ability to obtain future financing on acceptable terms, and we may identify additional material weaknesses.
Management concluded that Herc Holdings did not maintain effective internal control over financial reporting as of December 31, 2017, because certain of the material weaknesses that were identified as of December 31, 2016 were not fully remediated, as discussed below and as described in more detail under “Controls and Procedures” in Part II, Item 9A of this Report.
A “material weakness” is a deficiency, or a combination of deficiencies, in internal control over financial reporting, such that there is a reasonable possibility that a material misstatement of the annual or interim financial statements would not be prevented or detected on a timely basis. In the course of completing its assessment of internal control over financial reporting as of December 31, 2017, management determined that the following material weaknesses in its internal control over financial reporting were not remediated as of December 31, 2017:
|
•
|
|
|
•
|
Ineffective design and maintenance of controls in response to the risks of material misstatement;
|
|
•
|
Ineffective design and maintenance of controls over a certain business process in the period-end financial reporting process
|
|
•
|
Ineffective design and maintenance of controls to monitor certain IT systems that the Company outsources to New Hertz under the TSA;
|
|
•
|
Ineffective design and maintenance of controls over our IT systems relevant to the preparation of our consolidated financial statements (which were not part of the TSA);
|
|
•
|
Ineffective design and maintenance of a control over the estimate for earned but unbilled revenue;
|
|
•
|
Ineffective design and maintenance of a control related to the occurrence of revenue from the rental of revenue earning equipment; and
|
|
•
|
Ineffective design and maintenance of controls over income tax accounts.
|
There can be no assurance as to when the material weaknesses will be fully remediated. Because the reliability of the internal control process requires repeatable execution, our material weaknesses will not be considered remediated until all remedial controls (including any additional remediation efforts that our senior management may identify as necessary) have been implemented, each applicable control has operated for a sufficient period of time, and management has concluded, through testing, that the controls are operating effectively. Until all identified material weaknesses are remediated, we will not be able to assert that our internal controls are effective. Further, management may identify other material weaknesses in our internal control over financial reporting.
As a result of our inability to assert that our internal controls are effective and/or of the inability of our independent registered public accounting firm to express an opinion on the effectiveness of our internal controls, we could lose investor and lender
9
confidence in the accuracy and completeness of our financial reports, which would have a material adverse effect on the price of our common stock and possibly impact our ability to obtain future financing on acceptable terms.
Our efforts to design and implement an effective control environment may not be sufficient to remediate the material weaknesses described above or to prevent future material weaknesses from occurring. The failure to implement or maintain required new or improved controls, or any difficulties we encounter in their implementation, could result in additional material weaknesses or material misstatements in our consolidated financial statements. Any such material misstatement could result in a restatement of our consolidated financial statements, which could lead to, among other things, additional legal, accounting and other expenses; delays in filing required financial disclosures; events of default under the credit agreement governing our asset-based revolving credit facility or the indenture governing our senior notes (or significant payments to amend such agreements); additional or expanded investigations or enforcement actions by the New York Stock Exchange, the SEC or other federal or state government agencies or regulatory authorities; sanctions, fines or penalties; a decline in the prices of our securities; and liabilities arising from stockholder litigation. Any negative publicity resulting from our material weaknesses or any of these potential related issues may have a material adverse effect on our ability to attract and retain customers, employees and vendors. We also may lose assets if we do not maintain adequate internal controls. The foregoing circumstances could have a material adverse effect on our reputation, business, financial condition, results of operations, liquidity or cash flows.
We continue to expend significant costs and devote management time and attention and other resources to matters related to our internal control over financial reporting, and our material weaknesses could expose us to additional risks that could materially adversely affect our ability to execute our strategic plan and our financial position, results of operations and cash flows.
We have incurred, and will continue to incur, significant time and expense, including consulting, audit, legal and other professional fees, to remediate the material weaknesses in our internal control over financial reporting and to establish and implement improved processes, systems and internal controls. In addition, the focus on addressing these issues may distract our management and other key employees from running our business and could adversely affect our ability to execute our strategic plan. For further information regarding the identified material weaknesses, please see Part II, Item 9A "Controls and Procedures" of this Report.
Any significant disruption or deficiency in the design of or implementing our information technology ("IT") systems, including the migration of systems from New Hertz, could materially adversely affect our ability to accurately maintain our books and records or otherwise operate our business.
We are engaged in a number of IT systems projects, including the migration of our financial system from the New Hertz system to a stand-alone system, which has required and will continue to require significant investment of human and financial resources. This system is designed to accurately maintain our books and records. In implementing this project, we may experience significant delays, increased costs and other difficulties, as well as challenges in mapping to other systems and establishing sufficient controls. Any significant disruption or deficiency in the design or implementation of the separate financial system could adversely affect our ability to process purchase orders, order equipment, track accounts payable, maintain accurate books and records or otherwise operate our business. While we have invested substantial resources in planning and project management, significant implementation issues may arise that could materially adversely impact our business, financial condition, results of operations, cash flows, ability to timely report accurate financial results and our control environment.
The restatement of Hertz Holdings’ previously issued financial results has been costly and has resulted in government investigations and other legal actions and could result in government enforcement actions and private litigation that could have a material adverse impact on our results of operations, financial condition, liquidity and cash flows.
Certain public disclosures made by Hertz Holdings prior to the Spin-Off have resulted in securities class action litigation. In addition, the New York Regional Office of the SEC is investigating the events disclosed in certain of Hertz Holdings' filings with the SEC and the United States Attorney's Office for the District of New Jersey also requested information regarding the same or similar events. Hertz Holdings expended, and Herc Holdings continues to expend, significant financial and human resources investigating the claims, defending related private litigation and responding to related books and records demands. Moreover, we could become subject to additional private litigation, investigations or government enforcement actions, arising out of the misstatements in Hertz Holdings’ previously issued financial statements. While New Hertz and Herc Holdings have agreed to share any ultimate liability arising from proceedings of this nature pursuant to the separation and distribution agreement entered into in connection with the Spin-Off, we cannot reasonably estimate the potential exposure at this time. Further, although New
10
Hertz will be managing such proceedings pursuant to the separation and distribution agreement, the proceedings may nonetheless require significant time and attention of our management and could have a material adverse impact on our financial condition, results of operations, liquidity and cash flows. For additional discussion of these matters, see
Note 16
, "
Commitments and Contingencies
" and
Note 21
, "
Arrangements with New Hertz
" to the notes to our consolidated financial statements in Part II, Item 8 of this Report.
Risks Related to Our Business
Our business is cyclical and depends on the levels of capital investment and maintenance expenditures by our customers. A slowdown in economic conditions or adverse changes in the level of economic activity or other economic factors specific to our customers or their industries, in particular contractors and industrial customers, could have a material adverse effect on our liquidity, cash flows and results of operations.
Our rental equipment is used by our customers in a wide variety of industries, including contractors in residential and commercial construction and restoration, remediation and environment; general industrial, including refineries and petrochemical operations, manufacturing, power, metals and mining and agriculture; infrastructure; and other customers, including commercial and retail services, facility maintenance, recreation and entertainment production. Many of these industries are cyclical in nature. The demand for our rental equipment is directly affected by the level of economic activity in these industries, which means that when these industries experience a decline in activity, there is likely a corresponding decline in the demand for our rental equipment. This could materially adversely affect our results of operations.
A substantial portion of our revenues are derived from the rental of equipment to various types of contractors, including in the non-residential construction market, and to industrial customers. A decline in construction or industrial activity could lead to a decrease in the demand for our rental equipment and intensified price competition from other equipment rental industry participants. Similarly, declines in oil or gas prices, or even the perception of longer-term lower oil and natural gas prices, could lead to a significant slowdown in business activity, capital investments and maintenance expenditures of industrial customers in the upstream oil and gas markets and related service providers, which could negatively affect our rentals to participants in this industry, and could extend to other markets that we serve. Worsening of economic conditions or not achieving anticipated levels of economic expansion either generally or in our customers’ specific industries, could have an adverse effect on demand for our products and services within those industries and extend to other markets that we serve, and could therefore materially adversely affect our business, financial condition and results of operations.
The following factors, among others, may cause weakness in our markets, either temporarily or long-term:
|
•
|
a decrease in the expected levels of rental versus ownership of equipment;
|
|
•
|
government regulations and policies, including government initiatives for infrastructure improvements or expansions, or the policies of governments regarding exploration for, and production and development of, oil and natural gas reserves;
|
|
•
|
an increase in the cost of construction materials;
|
|
•
|
the level of supply and demand and relative prices or anticipated prices for oil and natural gas;
|
|
•
|
an overcapacity of fleet in the equipment rental industry;
|
|
•
|
a lack of availability of credit;
|
|
•
|
an increase in interest rates; and
|
|
•
|
terrorism or hostilities involving the United States, Canada or the international markets we serve.
|
Additionally, some of our customers may delay capital investment and maintenance even when favorable conditions exist in their industries or markets.
If we were to experience a significant decrease in orders or an increase in order delays or cancellations that can result from the aforementioned economic conditions or other factors beyond our control, it could have a material adverse effect on our business, financial condition, results of operations and cash flows.
11
Our business is heavily reliant upon communications networks and centralized IT systems and the concentration of our systems creates or increases risks for us, including the risk of the misuse or theft of information as a result of cyber security breaches or otherwise, which could harm our brand, reputation or competitive position and give rise to material liabilities.
We rely heavily on communication networks and IT systems, including the Internet, to process rental and sales transactions, manage our pricing, manage our equipment fleet, manage our financing arrangements, account for our activities and otherwise conduct our business. Our major IT systems and accounting functions are centralized in a few locations. Any disruption, termination or substandard provision of these services, whether as the result of computer or telecommunications issues (including operational failures, computer viruses or security breaches), localized conditions (such as a power outage, fire or explosion) or events or circumstances of broader geographic impact (such as an earthquake, storm, flood, other natural disaster, epidemic, strike, act of war, civil unrest or terrorist act), could materially adversely affect our business by disrupting normal operations.
We regularly possess, store and handle non-public information about individuals and businesses, including both credit and debit card information and other sensitive and confidential personal information. In addition, our customers regularly transmit confidential information to us via the Internet and through other electronic means. Our facilities and systems and those of our third-party service providers may contain defects in design or manufacture or other problems that could compromise information security. Unauthorized parties also may attempt to gain access to our systems or facilities, or those of third parties with whom we do business. Many of the techniques used to obtain unauthorized access, including viruses, worms and other malicious software programs, are difficult to anticipate until launched against a target and we may be unable to implement adequate preventative measures.
A compromise of our security systems resulting in unauthorized access to certain personal information about our customers, distributors or employees could adversely affect our corporate reputation as well as our operations, and could result in litigation against us or the imposition of penalties. Security breaches can create system disruptions, shutdowns or unauthorized disclosure of confidential information, which could result in financial damage or loss. Most states have enacted laws requiring companies to notify individuals and often state authorities of data security breaches involving their personal data. These mandatory disclosures regarding a security breach often lead to widespread negative publicity, which would harm our reputation and brand, and may cause our customers and employees to lose confidence in the effectiveness of our data security measures. As a result, a security breach could cause the loss of customers and could also require that we expend significant additional resources related to our information security systems.
In addition, we outsource a significant portion of our IT services and, under a transition services agreement entered into with New Hertz in connection with the Spin-Off, we are reliant upon New Hertz for continued service with several IT systems. Therefore, we are also susceptible to disruptions, failures and breaches of the systems maintained by New Hertz and our other outsourced providers, which we do not control. Any disruption, failure, breach or poor performance of any of these systems could lead to lower revenues, increased costs or other material adverse effects on our business and results of operations.
Failure to maintain, upgrade and consolidate our IT networks could materially adversely affect us.
We continue to upgrade and consolidate our systems, including making changes to legacy systems, replacing legacy systems with successor systems with new functionality, acquiring new systems with new functionality and outsourcing certain IT services. These types of activities subject us to additional costs and inherent risks associated with outsourcing, replacing and changing these systems, including impairment of our ability to manage our business, potential disruption of our internal control structure, substantial capital expenditures, additional administration and operating expenses, demands on management time, and other risks and costs of delays or difficulties in transitioning to outsourcing alternatives or new systems or of integrating new systems into our current systems. We rely on certain software vendors to maintain and periodically upgrade many of these systems so that they can continue to support our business. Further, the software programs supporting many of our systems were licensed to us by independent software developers. The inability of these developers or us to continue to maintain and upgrade these information systems and software programs would disrupt or reduce the efficiency of our operations if we were unable to convert to alternate systems in an efficient and timely manner.
In addition, costs and potential problems and interruptions associated with the implementation of new or upgraded systems and technology, maintenance or adequate support of outdated or other existing systems or our outsourcing initiatives could disrupt or reduce the efficiency of our business operations and could have an adverse effect on our operations if not anticipated and appropriately mitigated. Our competitive position may be adversely affected if we are unable to maintain systems that allow us to
12
manage our business in a competitive manner. Additionally, any systems failures could impede our ability to timely collect and report financial results in accordance with applicable laws and regulations.
We may fail to respond adequately to changes in technology and customer demands.
In recent years, our industry has been characterized by rapid changes in technology and customer demands. For example, industry participants have taken advantage of new technologies to improve fleet efficiency, decrease customer wait times and improve customer satisfaction. Our ability to continually improve our current processes and customer-facing tools in response to changes in technology or in customer expectations is essential in maintaining our competitive position and maintaining current levels of customer satisfaction. We may experience technical or other difficulties that could delay or prevent the development or implementation of new technologies. The effects of these risks may, individually or in the aggregate, materially adversely affect our results of operations, liquidity and cash flows.
We face intense competition, including from our own suppliers, that may lead to downward pricing or an inability to increase prices.
The markets in which we operate are highly competitive. Competitive factors in our industry include increased price competition, the importance of customer loyalty, changes in market penetration, the introduction of new equipment, services and technology by competitors, changes in marketing, product diversity and quality and the ability to supply equipment and services to customers in a timely, predictable manner. Because we do not have multi-year contractual arrangements with many of our customers, these competitive factors could cause our customers to cease renting our equipment and shift suppliers quickly.
The equipment rental market is highly fragmented, and we believe that price is one of the primary competitive factors. The Internet has enabled cost-conscious customers to more easily compare rates available from rental companies. If we try to increase our pricing, our competitors, some of whom may have greater resources and better access to capital or lower fixed operating costs, may seek to compete aggressively on the basis of pricing. In addition, our competitors may reduce prices in order to attempt to gain a competitive advantage, capture market share or compensate for declines in rental activity. To the extent we do not match or remain within a reasonable competitive margin of our competitors’ pricing, our revenues and results of operations could be materially adversely affected. If competitive pressures lead us to match any of our competitors’ downward pricing and we are not able to reduce our operating costs, then our margins, results of operations and cash flows could be materially adversely impacted.
We face competition from traditional rental companies as well as our own suppliers. We purchase our rental equipment from leading, globally-known original equipment manufacturers. Under our supplier arrangements, the suppliers may appoint additional distributors, elect to sell or rent directly to our customers or unilaterally terminate their arrangements with us at any time without cause. Any such actions could have a material adverse effect on our business, financial condition, results of operations, liquidity and cash flows due to a reduction of, or an inability to increase, our revenues.
Our success depends on our ability to attract and retain key management and other key personnel, and the ability of new employees to learn their new roles.
Our ability to successfully execute on our business plan depends upon the contributions of our senior management team as well as other key personnel, such as our dedicated sales force. In recent years we have experienced significant changes to our key personnel, including changes stemming from the formation of our senior management team in preparation for the Spin-Off, the re-configuration of our sales territories, the transition of Hertz Holdings’ corporate offices from Park Ridge, New Jersey to Bonita Springs, Florida, and the movement of our Shared Services Center from Oklahoma City, Oklahoma to Bonita Springs, Florida. Because of these personnel changes, we could experience inefficiencies or a lack of business continuity due to the new employees’ lack of historical knowledge and lack of familiarity with the business processes, operating requirements, policies and procedures, and key information technologies and related infrastructure used in our day-to-day operations and financial reporting. Historically we have noted a ramp-up period before new members of our sales organization typically achieve a level of sales comparable to those who have been employed by the Company for a longer period of time. We may also experience additional costs as new employees learn their roles and gain necessary experience, in addition to the cost of hiring new individuals. It is important to our success that new key employees quickly adapt to and excel in their new roles. If they are unable to do so, our business and financial results could be materially adversely affected. Further, if we cannot meet our needs for IT staff, we may not be able to fulfill our technology initiatives while continuing to provide maintenance on existing systems.
13
If we were to lose the services of members of our senior management team or other key personnel, whether due to death, disability, resignation or termination of employment, our ability to successfully implement our business strategy, financial plans, marketing and other objectives could be significantly impaired. In addition, if we are unable to attract and retain qualified other key personnel, we may not be able to effectively and efficiently manage our business and execute our business plan.
We may have difficulty obtaining the resources that we need to operate, or our costs to do so could increase significantly, either of which could have a material adverse effect on our business, financial condition, results of operations and cash flows.
As a stand-alone company, we have incurred and will continue to incur significant additional recurring costs to replace certain systems, technology, services and employees that remained with New Hertz. Historically, we were able to take advantage of the size and purchasing power of the combined Hertz Holdings organization in procuring technology and services, including, among other things, IT support, credit card processing services, consulting services, employee benefit support and audit services. We are a smaller company than the former Hertz Holdings, and we may not be able to obtain systems, technology, services and human resources on terms as favorable as those available to us prior to the Spin-Off.
In addition, we have engaged and will continue to engage the services of various consultants and professionals to support our internal resources as we assess, develop and implement our own processes, systems and controls. Due to the scope and complexity of the underlying projects relative to these efforts, the total cost of these services could be materially higher than our estimates, and may extend for a longer period of time than expected.
We also pay fees under a transition services agreement we entered into in connection with the Spin-Off, pursuant to which New Hertz or one of its affiliates provides us with certain corporate services (primarily IT services) on a transitional basis. Because the transition services agreement was negotiated in the context of a parent-subsidiary relationship (i.e., between Hertz Holdings and New Hertz prior to the Spin-Off), the terms of the agreement may be less favorable to us than those that would be agreed to by parties bargaining at arm’s length for similar services and the fees charged for the services may be higher than the costs reflected in the allocations in our historical financial results. While such services are being provided to us under the transition services agreement, our operational flexibility to modify or implement changes in such services or the amounts we pay for them is limited. Further, at the end of the term of the transition services agreement, or earlier if New Hertz fails to perform its obligations thereunder, we may be unable to obtain replacement services on terms as favorable as those contained in the transition services agreement. If we do not have our own adequate systems and business functions in place to replace the services performed by New Hertz under the transition services agreement, or are unable to obtain them from other providers, we may not be able to operate our business effectively.
If we are unable to obtain the resources and services required to operate our business on terms comparable to those available to us prior to the Spin-Off, or if our costs increase significantly due to the above factors or others, our business, financial condition, results of operations and cash flows could be materially adversely affected.
Due to seasonality, especially in the construction industry, any occurrence that disrupts rental activity during our peak periods could materially adversely affect our results of operations, liquidity and cash flows.
Significant components of our expenses are fixed in the short-term, including real estate taxes, rent, insurance, utilities, maintenance and other facility-related expenses, the costs of operating our IT systems and certain staffing costs. Seasonal changes in our revenues do not alter those fixed expenses, typically resulting in higher profitability in periods when our revenues are higher, and lower profitability in periods when our revenues are lower. Our business, especially in the construction industry, has historically experienced lower levels of business from December until late spring, particularly in the northern United States and Canada, and heightened activity during our third and fourth quarter until December. Any occurrence that disrupts rental activity during this period of heightened activity, including adverse weather conditions such as prolonged periods of cold, rain, blizzards, floods, fires, hurricanes or other severe weather patterns, could have a disproportionately adverse effect on our business, results of operations, liquidity and cash flows.
14
Doing business in foreign countries exposes us to a number of additional risks, including complying with foreign and local laws and regulations that may conflict with U.S. laws and those under anticorruption, competition, economic sanctions and anti-boycott regulations, that may materially adversely affect our business, financial condition, results of operations, liquidity and cash flows.
We currently operate in a number of foreign countries, including Canada and China. Operating in different countries exposes us to varying risks, which include: (i) multiple, and sometimes conflicting, foreign regulatory requirements and laws that are subject to change, including laws relating to taxes, insurance rates, insurance products, consumer privacy, data security, employment matters, cost and fee recovery, and the protection of our trademarks and other intellectual property; (ii) the effect of foreign currency translation risk; (iii) varying tax regimes, including consequences from changes in applicable tax laws; (iv) local ownership or investment requirements, as well as difficulties in obtaining financing in foreign countries for local operations; and (v) political and economic instability, natural calamities, war and terrorism. The failure to comply with international laws could have an adverse effect on us that is disproportionate to the relative size of our foreign operations.
Our international operations are also subject to U.S. and foreign anti-corruption laws and regulations, such as the Foreign Corrupt Practices Act ("FCPA"), economic sanction programs administered by the U.S. Treasury Department’s Office of Foreign Assets Control ("OFAC") and the anti-boycott regulations administered by the U.S. Department of Commerce's Office of Antiboycott Compliance. As a result of doing business in foreign countries, we are exposed to a heightened risk of violating these and other laws. As part of our business, we regularly deal with foreign officials for regulatory purposes and may deal with state-owned business enterprises, the employees of which are considered foreign officials for purposes of the FCPA. In addition, the provisions of the U.K. Bribery Act of 2010 extend beyond bribery of foreign public officials and are more onerous than the FCPA in a number of other respects. Some of the international locations in which we operate lack a developed legal system and have relatively higher levels of corruption. Economic sanctions programs restrict our business dealings with certain sanctioned countries and other sanctioned individuals and entities. Violations of anti-corruption laws, competition laws and sanctions regulations are punishable by civil penalties, including fines, denial of export privileges, injunctions, asset seizures, debarment (or other loss of business) from government contracts and revocations or restrictions of licenses, as well as criminal fines and imprisonment. We have established policies and procedures designed to assist our compliance with applicable laws and regulations; however, there can be no assurance that they will effectively prevent us from violating these laws and regulations in every transaction in which we may engage. A violation of legal requirements could materially and adversely affect our reputation, business, financial condition, results of operations and cash flows.
Our non-U.S. operations include joint ventures and other alliances. Additional risks characteristic of these arrangements include the risk of conflicts arising between us and our joint venture partners and the lack of unilateral control of management. We also risk circumstances where our joint venture partner may fail to satisfy its obligations, which could result in increased liabilities to us.
In addition, we are subject to limitations on our ability to repatriate funds to the United States from our operations outside of the United States. These limitations arise from regulations in certain countries that limit our ability to remove funds from or transfer funds to foreign subsidiaries, as well as from tax liabilities that would be incurred in connection with such transfers.
The effects of the foregoing risks may, individually or in the aggregate, materially adversely affect our results of operations, liquidity and cash flows.
Some or all of our deferred tax assets could expire if we experience an “ownership change” as defined in Section 382 of the Internal Revenue Code (the "Code").
An "ownership change" could limit our ability to utilize tax attributes, including net operating losses, capital loss carryovers, excess foreign tax carryforwards, and credit carryforwards, to offset future taxable income. As of December 31, 2017, we had unutilized U.S. federal net operating loss carryforwards of approximately
$136.1 million
(which begin to expire in
2031
). Our ability to use such tax attributes to offset future taxable income and tax liabilities may be significantly limited if we experience an "ownership change" as defined in Section 382(g) of the Code. In general, an ownership change will occur if and when the percentage of Herc Holdings’ ownership (by value) of one or more "5-percent shareholders" (as defined in the Code) has increased by more than 50 percentage points over the lowest percentage of stock owned by such shareholders at any time during the prior three years (calculated on a rolling basis). An entity that experiences an ownership change generally should be subject to an annual limitation on its pre-ownership change tax loss carryforward which accumulates each year to the extent that there is any unused limitation from a prior
15
year. The limitation on our ability to utilize tax losses and credit carryforwards arising from an ownership change under Section 382 depends on the value of our equity at the time of any ownership change. If we were to experience an "ownership change,” it is possible that a significant portion of our tax loss carryforwards could expire before we would be able to use them to offset future taxable income. Many states have adopted the federal Section 382 rules and therefore have similar limitations with respect to state tax attributes.
Changes in the legal and regulatory environment that affect our operations, including with respect to taxes, consumer rights, privacy, data security and employment matters, could disrupt our business, increase our expenses or otherwise have a material adverse effect on our results of operations.
We are located in
39
states in the United States and
eight
provinces in Canada, and also have other international operations. Our operations expose us to a number of national, state, local and foreign laws and regulations, in addition to legal, regulatory and contractual requirements we face as a government contractor. These laws and regulations address multiple aspects of our operations, including taxes, worker safety, consumer rights, privacy, data security and employment matters and also may impact other areas of our business. There are often different requirements in different jurisdictions. Changes in government regulation of our businesses have the potential to materially alter our business practices or our profitability. Depending on the jurisdiction, those changes may come about through the issuance of new laws and regulations or changes in the interpretation of existing laws and regulations by a court, regulatory body or governmental official. Sometimes those changes may have both a retroactive and prospective effect; this is particularly true when a change is made through reinterpretation of laws or regulations that have been in effect for some time. For example, the Tax Cuts and Jobs Act of 2017 (the "2017 Tax Act") recently enacted in the U.S. represents a significant overhaul of the U.S. federal tax code. The estimated impact of the new law included in our financial statements for the year ended December 31, 2017 is based on management’s current knowledge and assumptions, although the impacts ultimately recognized could be materially different from current estimates based on our further analysis of the new law and pending interpretations thereof. Moreover, changes in regulation that may seem neutral on their face may have either more or less impact on us than on our competitors, depending on the circumstances. Changes in any legal or regulatory requirements applicable to us, or any material failure by us to comply with them, could negatively impact our reputation, reduce our business, require significant management time and attention and generally otherwise adversely affect our financial position, results of operations or cash flows. Similarly, changes in laws and regulations applicable to our customers or impacting the economy generally may also impact our financial condition and results of operations.
An impairment of our goodwill or our indefinite-lived intangible assets could have a material adverse non-cash impact on our financial condition and results of operations.
We review our goodwill and indefinite-lived intangible assets for impairment whenever events or changes in circumstances indicate that the carrying amount of these assets may not be recoverable and at least annually. Our goodwill and indefinite-lived intangible assets comprised approximately
10.1%
of our total assets as of December 31, 2017. If economic deterioration occurs, we may be required to record charges for goodwill or indefinite-lived intangible asset impairments in the future, which could have a material adverse non-cash impact on our financial condition and results of operations.
Other Operational Risks:
Any decline in our relationships with our key national account customers or the amount of equipment they rent from us could materially adversely affect our business, financial position, results of operations and cash flows.
Our business depends on our ability to maintain positive relations with our key national account customers, which collectively accounted for
45%
of our rental revenue in 2017. We cannot assure you that all of these relationships will continue at current levels or on current terms. Our contracts with our customers generally do not obligate them to rent equipment from us. Revenue from customers that have accounted for significant revenue in past periods, individually or as a group, may not continue in future periods or, if continued, may not reach or exceed historical levels in any period. Further, if our key customers fail to remain competitive in their respective markets or encounter financial or operational problems, our business, financial position, results of operations and cash flows may be materially adversely affected.
16
Our equipment rental fleet is subject to residual value risk upon disposition and may not sell at the prices we expect.
The market value of our equipment at the time of its disposition could be less than its estimated residual value or its depreciated value at such time. A number of factors could affect the value received upon disposition of our equipment, including:
|
•
|
the market price for similar new equipment;
|
|
•
|
the age of the equipment, wear and tear on the equipment relative to its age and the performance of preventive maintenance;
|
|
•
|
the time of year that it is sold;
|
|
•
|
the supply of used equipment relative to the demand for used equipment, including as a result of changes in economic conditions or conditions in the markets that we serve;
|
|
•
|
inventory levels at original equipment manufacturers; and
|
|
•
|
the existence and capacities of different sales outlets.
|
A sale of equipment below its depreciated value could adversely affect our results of operations. Accordingly, decisions to reduce the size of our equipment rental fleet in the event of an economic downturn or to respond to changes in rental demand are subject to the risk of loss based on the residual value of rental equipment.
We incur maintenance and repair costs associated with our equipment rental fleet that could have a material adverse effect on our financial condition, results of operations, liquidity and cash flows in the event these costs are greater than anticipated.
As our fleet of rental equipment ages, the cost of maintaining such equipment, if not replaced within a certain period of time, and the risk of fleet equipment being out of service, generally increase. As of December 31, 2017, the average age of our rental equipment fleet was approximately
49
months. Determining the optimal age at disposition for our rental equipment is subjective and requires considerable estimates by management. We have made estimates regarding the relationship between the age of our rental equipment, the maintenance and repair costs, the availability of our fleet and the market value of used equipment. It is possible that we may allow the average age of our rental equipment fleet to increase, which would increase our costs for maintenance and repair and likely would negatively impact the market value of such equipment at the time of its disposition. If maintenance and repair costs are higher than estimated or in-service times or market values of used equipment are lower than estimated, our financial condition, results of operations, liquidity and cash flows could be materially adversely affected.
We may be unable to protect our trade secrets and other intellectual property rights, and our business could be harmed as a result.
We rely on trade secrets to protect our know-how and other proprietary information, including pricing, purchasing, promotional strategies, customer lists and/or supplier lists. However, trade secrets are difficult to protect. Our employees, consultants, contractors or advisors may unintentionally or willfully disclose our information to competitors. In addition, any confidentiality agreements executed to protect these assets may not be enforceable or provide meaningful protection for our trade secrets or other proprietary information in the event of unauthorized use or disclosure. The effects of these risks may materially adversely affect our business, results of operations, liquidity and cash flows.
We are exposed to a variety of claims and losses arising from our operations, and our insurance may not cover all or any portion of such claims.
We are exposed to a variety of claims arising from our operations, including claims by third parties for injury or property damage arising from the operation of our equipment or acts or omissions of our personnel and workers’ compensation claims. We are currently a defendant in numerous actions and have received numerous claims on which actions have not yet been commenced for liability and property damage arising from the operation of equipment rented from us. We also are exposed to risk of loss from damage to our equipment and resulting business interruption. Our responsibility for such claims and losses is increased when we waive the provisions in certain of our rental contracts that hold a renter responsible for damage or loss under an optional loss or damage waiver that we offer. While we attempt to mitigate our exposure to large liability losses arising from such claims by maintaining general liability, workers' compensation and vehicle liability insurance coverage, our coverage may not be adequate to protect us against these exposures and we self-insure against losses associated with exposures not covered by these insurance policies.
17
Moreover, in the event that insurance coverage does apply, we will bear a portion of the associated losses through the application of deductibles and self-insured retention in the insurance policies. For a company our size, such deductibles or self-insured retention could be substantial. There is also no assurance that insurance policies of these types will be available for purchase or renewal on commercially reasonable terms, or at all, or that the premiums and deductibles under such policies will not substantially increase, including as a result of market conditions in the insurance industry.
If we were to incur one or more liabilities that are significant, individually or in the aggregate, where we are not fully insured, that we self-insure against or that our insurers dispute, it could have a material adverse effect on our financial condition. Even with adequate insurance coverage, we still may experience a significant interruption to our operations as a result of third party claims or other losses arising from our operations.
We may face issues with our union employees.
Labor contracts covering the terms of employment of approximately
315
employees in the U.S. and
150
employees in Canada are presently in effect under approximately
20
active contracts with local unions, affiliated primarily with the International Brotherhood of Teamsters and the International Union of Operating Engineers. These contracts are renegotiated periodically. Failure to negotiate a new labor agreement when required could result in a work stoppage. Although we believe that our labor relations have generally been good, it is possible that we could become subject to additional work rules imposed by agreements with labor unions, or that work stoppages or other labor disturbances could occur in the future. In addition, our non-union workforce has been subject to unionization efforts in the past, and we could be subject to future unionization, which could lead to increases in our operating costs and/or constraints on our operating flexibility.
Environmental, health, and safety laws and regulations and the costs of complying with them, or any change to them impacting our markets, could materially adversely affect our financial position, results of operations or cash flows.
Our operations are subject to numerous national, state, provincial and local laws and regulations governing environmental protection and occupational health and safety matters. These laws govern such issues as wastewater, storm water, solid and hazardous wastes and materials, air quality and matters of workplace safety. Under these laws and regulations, regardless of fault we may be liable for, among other things, the cost of investigating and remediating contamination at our sites as well as sites to which we have sent hazardous wastes for disposal or treatment, and also fines and penalties for non-compliance. We use hazardous materials to clean and maintain equipment, dispose of solid and hazardous waste and wastewater from equipment washing, and store and dispense petroleum products from storage tanks at certain of our locations. We cannot predict the potential financial impact on our business if new adverse environmental, health, or safety conditions are discovered, or environmental, health, and safety requirements become more stringent. If we are required to incur environmental, health, or safety compliance or remediation costs that are not currently anticipated by us, our financial position, results of operations or cash flows could be materially adversely affected, depending on the magnitude of the cost.
In addition, the U.S. Congress and other legislative and regulatory authorities in the United States and internationally have considered, and likely will continue to consider, numerous measures related to climate change, greenhouse gas emissions and other laws and regulations affecting our end markets, such as oil, gas and other natural resource extraction. Should such laws and regulations become effective, demand for our services could be affected, our fleet and/or other costs could increase and our business could be materially adversely affected.
Part of our strategy includes pursuing strategic transactions, which could be difficult to identify and implement, and could disrupt our business or change our business profile significantly.
We may opportunistically consider the acquisition of other companies or service lines of other businesses that either complement or expand our existing business, or we may consider the divestiture of some of our businesses. Any acquisitions or divestitures we may seek to consummate will be subject to the negotiation of definitive agreements, satisfactory financing arrangements and applicable governmental approvals and consents, including under applicable antitrust laws, such as the Hart-Scott-Rodino Act. We cannot assure you that we will be able to identify suitable transactions and, even if we are able to identify such transactions, that we will be able to consummate any such acquisitions or divestitures on acceptable terms. Any future acquisitions or divestitures we pursue may involve a number of risks, including some or all of the following:
|
•
|
the diversion of management’s attention from our core business;
|
18
|
•
|
the disruption of our ongoing business;
|
|
•
|
inaccurate assessment of undisclosed liabilities;
|
|
•
|
potential known and unknown liabilities of the acquired or divested businesses and lack of adequate protections or potential related indemnities;
|
|
•
|
the inability to integrate our acquisitions without substantial costs, delays or other problems;
|
|
•
|
the loss of key customers or employees of the acquired or divested business;
|
|
•
|
increasing demands on our operational systems;
|
|
•
|
the integration of information systems and internal controls; and
|
|
•
|
possible adverse effects on our reported results of operations or financial position, particularly during the first several reporting periods after an acquisition or divestiture is completed.
|
Any acquired entities or assets may not enhance our results of operations. Even if we are able to integrate future acquired businesses with our operations successfully, we cannot assure you that we will realize the cost savings, synergies or revenue enhancements that we anticipate from such integration or that we will realize such benefits within the expected time frame. Any acquisition also may cause us to assume liabilities, record goodwill and other intangible assets that will be subject to impairment testing and potential impairment charges, incur potential restructuring charges and increase working capital and capital expenditure requirements, which may reduce our return on invested capital.
If we were to undertake a substantial acquisition, the acquisition likely would need to be financed in part through additional financing from banks, through public offerings or private placements of debt or equity securities or with other arrangements. We cannot assure you that the necessary acquisition financing would be available to us on acceptable terms if and when required, given our substantial indebtedness and restrictions in the terms of our indebtedness that may limit the additional indebtedness that we may incur or the acquisitions that we may pursue, which may make it difficult or impossible for us to obtain financing for acquisitions. If we were to undertake an acquisition by issuing equity securities or equity-linked securities, the acquisition may have a dilutive effect on the interests of the holders of our common stock.
A significant divestiture would, in the short term, result in loss of revenues and possibly earnings, and could require the amendment or refinancing of our outstanding indebtedness or a portion thereof. Further, to the extent that we agree to accept payment of all or a portion of the sale price over time, we will bear the risk that the portion of the price that is not paid at closing may be uncollectible. In addition, in connection with any divestiture, we may agree to retain obligations related to the business or assets sold and we may agree to indemnify the purchaser for outstanding liabilities or with respect to the representations, warranties or covenants included in the definitive agreement between the parties. These retained obligations and indemnification obligations could result in significant costs and expenses.
Risks Related to the Spin-Off and Our Separation from New Hertz
We and New Hertz have assumed and will share responsibility for certain liabilities in connection with the Spin-Off, any of which could have a material adverse effect on our business, financial condition and results of operations.
Pursuant to the separation and distribution agreement entered into in connection with the Spin-Off, we assumed, among other things, liabilities associated with our equipment rental business and related assets, whether such liabilities arose prior to or subsequent to the Spin-Off, and have agreed to indemnify
New Hertz for any losses arising from such liabilities, as well as any other liabilities we assumed pursuant to the separation and distribution agreement. We also will be responsible for a portion (typically 15%) of certain shared liabilities not otherwise specifically allocated to us or New Hertz under the separation and distribution agreement. Although we will be responsible for a portion of these shared liabilities, New Hertz has the authority to manage the defense and resolution of them. The amount of such liabilities could be greater than anticipated and have a material adverse effect on our business, financial condition, results of operations and cash flows.
In addition, New Hertz has assumed, among other things, liabilities associated with its vehicle rental business and related assets, whether such liabilities arose prior to or subsequent to the Spin-Off, and has agreed to indemnify us for any losses arising from such liabilities, as well as any other liabilities it assumed pursuant to the separation and distribution agreement. New Hertz also will be responsible for a portion (typically 85%) of certain shared liabilities not otherwise specifically allocated to New Hertz or us under the separation and distribution agreement. We rely on New Hertz to manage the defense and resolution of these shared liabilities. If New Hertz fails to satisfy its performance and payment obligations under the separation and distribution agreement,
19
including its indemnification obligations, such failure could have a material adverse effect on our business, financial condition, results of operations and cash flows.
If there is a determination that any portion of the Spin-Off transaction is taxable for U.S. federal income tax purposes, then we and our stockholders could incur significant U.S. federal income tax liabilities.
Hertz Holdings received a favorable private letter ruling from the Internal Revenue Service (the "IRS") to the effect that, subject to the accuracy of and compliance with certain representations, assumptions and covenants, (i) the Spin-Off qualified as a tax-free transaction under Sections 355 and 368(a)(1)(D) of the Code), and (ii) the internal spin-off transactions (collectively with the Spin-Off, the "Spin-Offs") qualified as tax free under Section 355 of the Code. A private letter ruling from the IRS generally is binding on the IRS. However, the IRS ruling does not rule that the Spin-Offs satisfied every requirement for a tax-free spin-off, and Hertz Holdings relied solely on opinions of its tax advisors to determine that such additional requirements were satisfied. The ruling and the opinions relied on certain facts, assumptions, representations and undertakings from Hertz Holdings and New Hertz regarding the past and future conduct of the companies’ respective businesses and other matters. If any of these facts, assumptions, representations or undertakings are incorrect or not otherwise satisfied, Herc Holdings, its affiliates and its stockholders may not be able to rely on the ruling or the opinions of tax advisors and could be subject to significant tax liabilities. Notwithstanding the private letter ruling and opinions of tax advisors, the IRS could determine on audit that the Spin-Offs and related transactions are taxable if it determines that any of these facts, assumptions, representations or undertakings are not correct or have been violated or if it disagrees with the conclusions in the opinions that are not covered by the private letter ruling, or for other reasons, including as a result of certain significant changes in the stock ownership of Herc Holdings or New Hertz after the Spin-Off. If the Spin-Offs or related transactions are determined to be taxable for U.S. federal income tax purposes, we and, in certain cases, our stockholders could incur significant U.S. federal income tax liabilities, including taxation on the value of the New Hertz common stock in the Spin-Off.
If we take or fail to take actions that cause the Spin-Offs to fail to qualify as tax-free transactions, we could be required to indemnify New Hertz for any resulting taxes and related losses.
Under the tax matters agreement with New Hertz, if either Herc Holdings or New Hertz takes or fails to take any action (or permits any of its affiliates to take or fail to take any action) that causes the Spin-Offs to be taxable, or if there is an acquisition of the equity securities or assets of either party (or equity securities or assets of any member of that party's group) that causes the Spin-Offs to be taxable, that party will be required to indemnify the other party for any resulting taxes and related losses.
If any of the Spin-Offs were taxable to any of the applicable companies, such companies would recognize gain equal to the excess, if any, of the fair market value of the stock distributed over the tax basis in that stock, and Herc Holdings and its affiliates would have to pay tax on that gain. The amount of tax would be substantial, and the party causing the Spin-Off to be taxable may not have sufficient financial resources to operate its business after paying any resulting taxes and related losses.
We could incur significant tax or other liability if New Hertz fails to pay the tax liabilities attributable to it under the tax matters agreement or to perform its obligations under the separation and distribution agreement.
Under U.S. federal income tax laws, Herc Holdings and New Hertz (or certain of its subsidiaries) are jointly and severally liable for Hertz Holdings’ federal income taxes attributable to certain periods prior to or including the 2016 taxable year of Hertz Holdings. Although the tax matters agreement allocates responsibility for tax liabilities between us and New Hertz, if New Hertz fails to pay the taxes for which it is responsible under the tax matters agreement, we may be liable for these unpaid liabilities. Certain other jurisdictions may have similar rules. Similarly, the separation and distribution agreement identifies obligations to be borne by New Hertz and liabilities that are shared between us and New Hertz. If New Hertz fails to perform its obligations or pay its share of the shared liabilities, we could incur significant liability which could have a material adverse effect on our business, financial condition, results of operations and cash flows.
The loss of Hertz’s brand and reputation could materially adversely affect our ability to attract and retain customers.
In Canada, where we are involved in litigation regarding the ownership of the name Herc, we operate under the name Hertz Equipment Rental pending the resolution of the litigation. In connection with the Spin-Off, we entered into an intellectual property agreement with New Hertz pursuant to which, among other things, we have been granted a license to continue to use certain intellectual property associated with the Hertz brand, which allows us to, among other things, continue using the name Hertz
20
Equipment Rental outside the U.S. This licensing arrangement will only be effective for a period of four years after the Spin-Off to allow us to transition to our new brand. If we are not able to transition to our Herc name outside the U.S., it may adversely affect our ability to attract and retain customers, which could have a material adverse effect on our business, financial condition, results of operations and cash flows.
Herc Holdings has limited operating history as a stand-alone public company, and our historical financial information for periods prior to July 1, 2016 is not necessarily representative of the results that we would have achieved as a separate, publicly traded company, and may not be a reliable indicator of our future results.
Due to the accounting treatment of the Spin-Off, which considers Herc Holdings to be the spinnee or divested entity, our historical financial information included in this Report for periods prior to July 1, 2016 is derived from the consolidated financial statements and accounting records of Hertz Holdings. Accordingly, the historical financial information included herein for such periods does not necessarily reflect the financial position, results of operations, and cash flows that we would have achieved as a separate, publicly traded company during those periods or those that we will achieve in the future, primarily as a result of the following factors:
|
•
|
Prior to the Spin-Off, our equipment rental business was operated by Hertz Holdings as part of its broader corporate organization, rather than as an independent company. Hertz Holdings or one of its affiliates performed various corporate functions for us, including accounting, corporate affairs, external reporting, human resources, IT, legal services, risk management, tax administration, treasury, and certain governance functions (including internal audit and compliance with the Sarbanes-Oxley Act of 2002). As a result, our historical financial results for periods prior to July 1, 2016 reflect allocations of corporate expenses for these and similar functions. These allocations may be less than the comparable expenses we would have incurred (or may incur in the future) had we operated as a separate public company during such periods.
|
|
•
|
Prior to the Spin-Off, our equipment rental business was integrated with the vehicle rental business of Hertz Holdings, which is now operated by New Hertz following the Spin-Off. Historically, we shared economies of scale in costs, employees, systems, vendor relationships and customer relationships. The loss of these benefits could have a material adverse effect on our financial position, results of operations and cash flows going forward.
|
|
•
|
Generally, our working capital requirements and capital for our general corporate purposes, including capital expenditures and acquisitions, were historically satisfied as part of the enterprise-wide cash management policies of Hertz Holdings. Going forward, we may need to obtain additional financing from banks, through public offerings or private placements of debt or equity securities, strategic relationships or other arrangements. The cost of capital for our business may be higher than Hertz Holdings’ cost of capital prior to the Spin-Off.
|
The adjustments and allocations we have made in preparing our historical combined financial statements may not fully reflect our operations during periods prior to the Spin-Off as if we had in fact operated as a stand-alone entity.
Our ability to engage in financings, acquisitions and other strategic transactions using equity securities is limited because of the U.S. federal income tax requirements for a tax-free distribution.
Current tax law generally creates a presumption that the Spin-Off would be taxable to us (but not to our stockholders) if either we or New Hertz engages in, or enters into an agreement to engage in, a transaction that would result in a 50% or greater change (by vote or by value) in stock ownership during the two-year period after the June 30, 2016 distribution date, unless it is established that the transaction is not pursuant to a plan or series of transactions related to the Spin-Off.
To preserve the tax-free treatment of the Spin-Off, under the tax matters agreement with New Hertz, each of Herc Holdings and New Hertz is subject to restrictions (including restrictions on share issuances and redemptions, business combinations, sales of assets and similar transactions) that are designed to preserve the tax-free status of the Spin-Off. These restrictions may prevent us from entering into transactions that might be advantageous, such as issuing equity securities to satisfy financing needs or acquiring businesses or assets by issuing equity securities. Many of our competitors are not subject to similar restrictions, and therefore may have a competitive advantage over us in this regard.
The Spin-Off may be challenged by creditors as a fraudulent transfer or conveyance.
If, under relevant federal and state fraudulent transfer and conveyance statutes, in a bankruptcy or reorganization case or a lawsuit
21
by or on behalf of unpaid creditors of New Hertz, a court were to find that (i) the Spin-Off and related transactions were undertaken with the intent of hindering, delaying or defrauding current or future creditors of New Hertz, or (ii) at the time that Hertz Holdings undertook the Spin-Off and related transactions, New Hertz was insolvent, or was rendered insolvent, by reason of the completion of the Spin-Off and related transactions, then the court could rescind the Spin-Off or, under certain circumstances, require Herc Holdings to fund liabilities of New Hertz for the benefit of creditors.
The measure of insolvency for purposes of the foregoing considerations will vary depending upon the law of the jurisdiction that is being applied in the relevant legal proceeding. Generally, however, New Hertz would be considered insolvent if, at the time that Hertz Holdings undertook the Spin-Off and related transactions, either:
|
•
|
the sum of New Hertz’s debts, including contingent liabilities, was greater than its assets, at a fair valuation; or
|
|
•
|
the fair saleable value of New Hertz’s assets was less than the amount required to pay the probable liability on its total existing debts and liabilities, including contingent liabilities, as they become absolute and matured.
|
We cannot give you any assurance as to what standards a court would use to determine whether New Hertz was solvent at the relevant time, or whether, whatever standard is used, the Spin-Off would be rescinded or other liabilities would be imposed on us on another of the grounds described above. We believe that no basis exists to challenge the Spin-Off as a fraudulent transfer or conveyance under the foregoing standards. However, in reaching such conclusion we have relied upon the advice of Hertz Holdings’ management and its third-party advisors whose analysis was based on certain projections and other assumptions. We cannot assure you, however, that a court would reach the same conclusion.
Our substantial level of indebtedness exposes or makes us more vulnerable to a number of risks that could materially adversely affect our financial condition, results of operations, cash flows, liquidity and ability to compete.
As of December 31, 2017, we had total outstanding debt of approximately
$2.2 billion
, including our outstanding Notes and the amount drawn under our asset-based revolving credit facility. This substantial indebtedness requires us to dedicate a significant portion of our cash flows from operations and investing activities to make payments on our debt, which reduces the amount available for working capital, capital expenditures or other general corporate purposes and which decreases our profitability and cash flow. We cannot assure you that we will maintain financing activities and cash flows sufficient to permit us to pay the principal, premium, if any, and interest on our indebtedness. In addition, our indebtedness could materially adversely affect us. For example, it could: (i) make it more difficult for us to satisfy our obligations to the holders of our outstanding debt securities and to the lenders under our credit facilities, resulting in possible defaults on, and acceleration of, such indebtedness; (ii) be difficult to refinance or borrow additional funds in the future; (iii) increase our vulnerability to, and limit our flexibility to plan for, or react to, general adverse economic and industry conditions, (iv) place us at a competitive disadvantage to our competitors that have proportionately less debt or comparable debt at more favorable interest rates or on better terms; and (v) limit our ability to react to competitive pressures, or make it difficult for us to carry out capital spending that is necessary or important to our growth strategy and our efforts to improve operating margins. There is also a risk that one or more of the financial institutions providing commitments under our revolving credit facilities could fail to fund an extension of credit under any such facility, due to insolvency or otherwise, leaving us with less liquidity than expected. Our ability to manage these risks will depend, among other things, on financial market conditions as well as our financial and operating performance, which, in turn, is subject to a wide range of risks, including those described above under “—Risks Related to Our Business.”
If our capital resources (including borrowings under our financing arrangements and access to other refinancing indebtedness) and operating cash flows are not sufficient to pay our obligations as they mature or to fund our liquidity needs, we may be forced, among other things, to do one or more of the following: (i) sell certain of our assets; (ii) reduce the size of our equipment rental fleet; (iii) reduce or delay capital expenditures; (iv) obtain additional equity capital; (v) forgo business opportunities, including acquisitions and joint ventures; or (vi) restructure or refinance all or a portion of our debt before maturity. We cannot assure you that we would be able to accomplish any of these alternatives on a timely basis or on satisfactory terms, if at all. If we cannot refinance or otherwise pay our obligations as they mature and fund our liquidity needs, our business, financial condition, results of operations, cash flows, liquidity, ability to obtain financing and ability to compete could be materially adversely affected.
22
Substantially all of our consolidated assets secure certain of our indebtedness, which could materially adversely affect our business and holders of our debt and equity.
Substantially all of our consolidated assets, including our equipment rental fleet, are subject to security interests under our financing arrangements. As a result, the lenders under those financing arrangements
have a secured claim on such assets in the event of our bankruptcy, insolvency, liquidation or reorganization, and we may not have sufficient funds to pay in full, or at all, all of our creditors or make any amount available to holders of our equity. The same is true with respect to structurally senior obligations. In general, all liabilities and other obligations of a subsidiary must be satisfied before the assets of such subsidiary can be made available to the unsecured or junior creditors (or equity holders) of the parent entity.
Because substantially all of our assets are encumbered under financing arrangements, our ability to incur additional secured indebtedness or to sell or dispose of assets to raise capital may be impaired, which could have a material adverse effect on our financial flexibility and liquidity and force us to attempt to incur additional unsecured indebtedness, which may not be available to us.
An increase in interest rates or in our borrowing margin would increase the cost of servicing our debt and could reduce our profitability.
A significant portion of our indebtedness bears interest at floating rates, which increases our vulnerability to general adverse economic and industry conditions (such as economic cycles and credit-related disruptions), including interest rate fluctuations. To the extent we have not hedged against rising interest rates, an increase in the applicable benchmark interest rates would increase our cost of servicing our debt and could reduce our profitability and materially adversely affect our results of operations.
In addition, we may in the future seek to refinance our indebtedness. If interest rates or our borrowing margins increase between the time an existing financing arrangement was consummated and the time such financing arrangement is refinanced, the cost of servicing our debt would increase and our results of operations and liquidity could be materially adversely affected.
Despite our current level of indebtedness, we may still be able to incur substantially more debt. This could further exacerbate the risks described above.
We and our subsidiaries may be able to incur significant additional indebtedness in the future. Although the agreements and instruments governing our financing arrangements contain restrictions on our ability to incur additional indebtedness, these restrictions are subject to a number of qualifications and exceptions, and the additional indebtedness that could be incurred in compliance with these restrictions could be substantial. Further, these restrictions also do not prevent us from incurring obligations that do not constitute indebtedness. If new debt or other obligations are added to our current debt and liability levels without a corresponding refinancing or redemption of our existing indebtedness and obligations, the risks related to our substantial indebtedness could increase.
Risks Related to the Securities Markets and Ownership of Our Common Stock
The market price of our common stock could decline as a result of the sale or distribution of a large number of shares of our common stock in the market or the perception that a sale or distribution could occur. These factors also could make it more difficult for us to raise funds through future offerings of our common stock.
We are unable to predict whether significant amounts of our common stock will be sold in the open market or the potential negative effects that these sales could have on the price of our common stock. Certain shareholders, most notably affiliates of Carl Icahn and Mario Gabelli, have accumulated significant amounts of our common stock. Sales or distributions of substantial amounts of our common stock in the public market, or the perception that such sales or distributions will occur, could adversely affect the market price of our common stock and make it difficult for us to raise funds through securities offerings in the future. As of December 31, 2017, there were
28.3
million shares of our common stock outstanding, which are freely transferable without restriction or further registration under the Securities Act of 1933, as amended (the “Securities Act”), unless held or acquired by our “affiliates” as that term is defined in Rule 144 under the Securities Act. In addition, all shares of our common stock acquired upon exercise of stock options and other equity-based awards granted under our stock incentive plan also will be freely tradable under the Securities Act unless acquired by our affiliates, as will shares acquired by our employees under our employee stock purchase plan. A maximum of
2.2 million
shares of common stock are reserved for issuance under our stock incentive plan, and
23
533,333 shares of common stock are reserved for issuance under our employee stock purchase plan, some of which have been issued as of the date of this Report.
We also may issue additional common stock for a number of reasons, including to finance our operations and business strategy (including acquisitions), to adjust our ratio of debt to equity, or to provide incentives pursuant to certain executive compensation arrangements. Such future issuances of equity securities, or the expectation that they will occur, could cause the market price for our common stock to decline.
Provisions of our Certificate of Incorporation and our By-Laws could discourage potential acquisition proposals and could deter or prevent a change in control.
Our Certificate of Incorporation and By-Laws contain provisions that are intended to deter coercive takeover practices and inadequate takeover bids and to encourage prospective acquirers to negotiate with our Board of Directors rather than to attempt a hostile takeover. These provisions include:
|
•
|
granting to our Board of Directors sole power to set the number of directors and to fill any vacancy on the Board of Directors, whether such vacancy occurs as a result of an increase in the number of directors or otherwise;
|
|
•
|
the ability of our Board of Directors to designate and issue one or more series of preferred stock without stockholder approval, the terms of which may be determined at the sole discretion of our Board of Directors;
|
|
•
|
prohibiting our stockholders from acting by written consent;
|
|
•
|
prohibiting our stockholders from calling special meetings of stockholders;
|
|
•
|
the absence of cumulative voting; and
|
|
•
|
advance notice requirements for stockholder proposals and nominations for election to the Board of Directors at stockholder meetings.
|
We believe that these provisions protect our stockholders from coercive or otherwise unfair takeover tactics by requiring potential acquirers to negotiate with our Board of Directors and by providing our Board of Directors with more time to assess any acquisition proposal. These provisions are not intended to make us immune from takeovers. However, these provisions apply even if the offer may be considered beneficial by some stockholders and could delay or prevent an acquisition that our Board of Directors determines is in our best interests and that of our stockholders. Any or all of the foregoing provisions could limit the price that some investors might be willing to pay for shares of our common stock.
The market price of our common stock may fluctuate significantly.
The market price of Herc Holdings common stock could fluctuate significantly due to a number of factors, including:
|
•
|
our quarterly or annual earnings, or those of other companies in our industry;
|
|
•
|
actual or anticipated fluctuations in our financial position, results of operations, liquidity or cash flows;
|
|
•
|
ongoing remediation of, and developments regarding, weaknesses in our internal control over financial reporting;
|
|
•
|
the public reaction to our press releases, our other public announcements and our filings with the SEC;
|
|
•
|
announcements by us or our competitors of significant acquisitions, dispositions, innovations or new programs and services;
|
|
•
|
comments by institutional investors or media reports regarding our Company, business or industry;
|
|
•
|
changes in earnings or other financial estimates and recommendations by securities analysts following our stock, research and reports that industry or securities analysts may publish about us or the rental industry or the failure of securities analysts to cover our common stock;
|
|
•
|
changes in our ability to meet analyst estimates;
|
|
•
|
purchases or sales of large blocks of our stock by institutional investors;
|
|
•
|
the operating and stock price performance of other comparable companies;
|
|
•
|
general economic conditions and fluctuations in the overall market and the markets served by our customers, including construction and industrial markets;
|
24
|
•
|
anticipated spending by government entities or agencies on infrastructure improvement or expansion projections, or the lack of, delay in or reduction in spending on such projects; and
|
|
•
|
the trading volume of our common stock.
|
In addition, the realization of any of the risks described in these “Risk Factors” could have a material and adverse impact on the market price of our common stock in the future and cause the value of your investment to decline. The securities of many companies and the stock market in general have experienced extreme price and volume volatility that has often been unrelated to the operating performance of particular companies. These fluctuations may adversely affect the trading price of our common stock, regardless of our actual performance. In the past, following periods of volatility in the market price of a company’s securities, stockholders have often instituted securities class action litigation against the company. If we were to be involved in a class action lawsuit, it could divert the attention of senior management, and, if adversely determined, have a material adverse effect on our business, results of operations and financial condition.
None.
As of
December 31, 2017
we had approximately
275
locations primarily in the United States and Canada, with locations also in China, the United Kingdom, Saudi Arabia and Qatar. We also operate regional headquarters, sales offices and service facilities in the foregoing countries in support of our equipment rental operations. Our principal executive offices are located at 27500 Riverview Center Blvd., Bonita Springs, Florida, 34134.
As of
December 31, 2017
, we owned approximately
11%
of the locations from which we operate our equipment rental business, with the remainder leased. Those leases are typically triple net leases, where Herc is responsible for the ongoing expenses of the property, including real estate taxes, insurance, and maintenance, in addition to paying rent and utilities.
Our rental locations generally are located in industrial or commercial zones. A growing number of locations have highway or major thoroughfare visibility. The typical location includes a customer reception area, an equipment service area and storage facilities for equipment. Most branches have stand-alone maintenance and fueling facilities and showrooms.
From time to time the Company is a party to various legal proceedings. Summarized below are the most significant legal proceedings to which the Company is a party.
In re Hertz Global Holdings, Inc. Securities Litigation
—In November 2013, a putative shareholder class action, Pedro Ramirez, Jr. v. Hertz Global Holdings, Inc., et al., was commenced in the U.S. District Court for the District of New Jersey naming Hertz Holdings and certain of its officers as defendants and alleging violations of the federal securities laws. The complaint alleged that Hertz Holdings made material misrepresentations and/or omission of material fact in its public disclosures during the period from February 25, 2013 through November 4, 2013, in violation of Section 10(b) and 20(a) of the Securities Exchange Act of 1934, as amended (the "Exchange Act"), and Rule 10b-5 promulgated thereunder. The complaint sought unspecified monetary damages on behalf of the purported class and an award of costs and expenses, including counsel fees and expert fees. In June 2014, Hertz Holdings moved to dismiss the amended complaint. In October 2014, the court granted Hertz Holdings’ motion to dismiss without prejudice, allowing the plaintiff to amend the complaint a second time. In November 2014, plaintiff filed a second amended complaint which shortened the putative class period and made allegations that were not substantively very different than the allegations in the prior complaint. In early 2015, Hertz Holdings moved to dismiss the second amended complaint. In July 2015, the court granted Hertz Holdings’ motion to dismiss without prejudice, allowing plaintiff to file a third amended complaint. In August 2015, plaintiff filed a third amended complaint which included additional allegations, named additional then-current and former officers as defendants and expanded the putative class period to extend from February 14, 2013 to July 16, 2015. In November 2015, Hertz Holdings moved to dismiss the third amended complaint. The plaintiff then sought leave to add a new plaintiff because of challenges to the standing of the first plaintiff. The court granted plaintiff leave to file a fourth amended complaint to add the new plaintiff, and the new complaint was filed on March 1, 2016. Hertz Holdings and the
25
individual defendants moved to dismiss the fourth amended complaint with prejudice on March 24, 2016. In April 2017, the court granted Hertz Holdings' and the individual defendants' motions to dismiss and dismissed the action with prejudice. In May 2017, plaintiff filed a notice of appeal and, in October 2017, the U.S. Court of Appeals for the Third Circuit issued a briefing schedule. Briefing was completed in February 2018.
Governmental Investigations
—In June 2014, Hertz Holdings was advised by the staff of the New York Regional Office of the SEC that it is investigating the events disclosed in certain of Hertz Holdings’ filings with the SEC. In addition, in December 2014 a state securities regulator requested information from Hertz Holdings regarding the same or similar events. In May 2017, the state securities regulator advised New Hertz that it had closed its investigation. Starting in June 2016, Hertz Holdings and New Hertz have had communications with the United States Attorney’s Office for the District of New Jersey regarding the same or similar events. New Hertz is responsible for managing these matters. The investigations and communications generally involve the restatements included in Hertz Holdings’ 2014 Form 10-K and related accounting for prior periods. Among other matters, the restatements included in Hertz Holdings’ 2014 Form 10-K addressed a variety of accounting matters involving THC's former Brazil vehicle rental operations. Hertz Holdings identified certain activities by THC's former vehicle rental operations in Brazil that may raise issues under the Foreign Corrupt Practices Act and other federal and local laws. THC has self-reported these issues to appropriate government entities, and these issues continue to be investigated. The Company has and intends to continue to cooperate with all governmental requests related to the foregoing. At this time, the Company is currently unable to predict the outcome of these proceedings and issues or to reasonably estimate the range of possible losses, which could be material.
The information concerning other legal proceedings involving us contained in
Note 16
, "
Commitments and Contingencies
" of our consolidated financial statements included in Part II, Item 8 of this Report is incorporated by reference.
Not applicable.
26
HERC HOLDINGS INC. AND SUBSIDIARIES
Market Price of Common Stock and Registered Holders
Our common stock commenced trading on the New York Stock Exchange ("NYSE") under the symbol "HRI" on July 1, 2016. On February 23, 2018, there were 1,152 registered holders of our common stock. The number of beneficial owners is substantially greater than the number of record holders because a large portion of our common stock is held of record in "street name." The following table provides the high and low intraday sales prices of our common stock for each quarter in the last two years as reported by the NYSE:
|
2017
|
2016
|
||||||||||||||
|
Quarter
|
High
|
Low
|
High
|
Low
|
|||||||||||
|
First
|
$
|
52.96
|
|
$
|
39.51
|
|
N/A
|
N/A
|
|||||||
|
Second
|
50.29
|
|
33.27
|
|
N/A
|
N/A
|
|||||||||
|
Third
|
49.88
|
|
35.89
|
|
$
|
37.48
|
|
$
|
29.28
|
|
|||||
|
Fourth
|
65.93
|
|
45.63
|
|
42.95
|
|
28.66
|
|
|||||||
Share Repurchase Program
In March 2014, Hertz Holdings announced a $1.0 billion share repurchase program (the "Share Repurchase Program"). The Share Repurchase Program permits the Company, as the successor to Hertz Holdings, to purchase shares through a variety of methods, including in the open market or through privately negotiated transactions, in accordance with applicable securities laws. It does not obligate the Company to make any repurchases at any specific time or in any specific amount. The timing and extent to which the Company repurchases its shares will depend upon, among other things, market conditions, share price, liquidity targets, contractual restrictions and other factors. Share repurchases may be commenced or suspended at any time or from time to time, subject to legal and contractual requirements, without prior notice. During 2015, Hertz Holdings repurchased 2.5 million shares (on a reverse split adjusted basis) at an aggregate purchase price of approximately
$604.5 million
under the Share Repurchase Program. There were no repurchases during 2017 or 2016. Repurchases are included in treasury stock in the accompanying consolidated balance sheets as of
December 31, 2017
and
December 31, 2016
. As of
December 31, 2017
, the approximate dollar value that remains available for share purchases under the Share Repurchase Program is $395.9 million.
Dividends
We paid no cash dividends on our common stock in
2017
or
2016
, and we do not expect to pay dividends on our common stock for the foreseeable future. The agreements governing our indebtedness restrict our ability to pay dividends. See Item 7, "Management Discussion and Analysis of Financial Condition and Results of Operations — Liquidity and Capital Resources — Dividends," in this Report.
Equity Compensation Plan Information
The following table summarizes the securities authorized for issuance pursuant to our equity compensation plans as of
December 31, 2017
:
|
|
Number of securities to be issued upon exercise of outstanding options, warrants and rights
|
Weighted average exercise price of outstanding options, warrants and rights
(1)
|
Number of securities remaining available for future issuance under equity compensation plans (excluding securities reflected in column (a))
(2)
|
||||||
|
Plan category
|
(a)
|
(b)
|
(c)
|
||||||
|
Equity compensation plans approved by security holders
|
1,090,996
|
|
$
|
37.25
|
|
551,206
|
|
||
|
Equity compensation plans not approved by security holders
|
—
|
|
—
|
|
—
|
|
|||
|
Total
|
1,090,996
|
|
551,206
|
|
|||||
|
(1)
|
Represents the weighted average exercise price of
440,642
outstanding stock options as of
December 31, 2017
. The remaining securities under this plan as of
December 31, 2017
are restricted stock units and performance stock units, which have no exercise price and have been excluded from the calculation of the weighted average exercise price above.
|
|
(2)
|
All of the securities remaining available for future issuance are available under our 2008 Omnibus Incentive Plan.
|
27
HERC HOLDINGS INC. AND SUBSIDIARIES
Recent Performance
The following graph compares the cumulative total stockholder return on Herc Holdings common stock from July 1, 2016, the first day of trading for our stock on the NYSE, through
December 31, 2017
, with the cumulative total returns of the Standard & Poor's Small Cap 600 Index and an industry peer group. The industry peer group is comprised of publicly traded companies participating in the equipment rental industry and other relevant companies of comparable size in the broader industry in which we compete. Our industry peer group is comprised of Aggreko plc, Applied Industrial Tech Inc., Ashstead Group plc, Beacon Roofing Supply, Inc., Fastenal Company, GATX Corp., H&E Equipment Services, KAR Auction Services Inc., McGrath Rentcorp, Mobile Mini, Inc., NOW Inc., Pool Corp., Ritchie Bros. Auctioneers Incorporated, Triton International Ltd., Watsco Inc. and United Rentals, Inc. Neff Corporation was previously included in our peer group, however, as they were acquired by United Rentals, Inc. in October 2017, we have excluded them from the graph below.
The graph assumes that $100 was invested on July 1, 2016 over the indicated time periods and assumes reinvestment of all dividends, if any, paid on the securities. We have not paid any cash dividends and, therefore, the cumulative total return calculation for Herc Holdings is based solely upon stock price appreciation. The stock price performance shown on the graph is not necessarily indicative of future price performance.
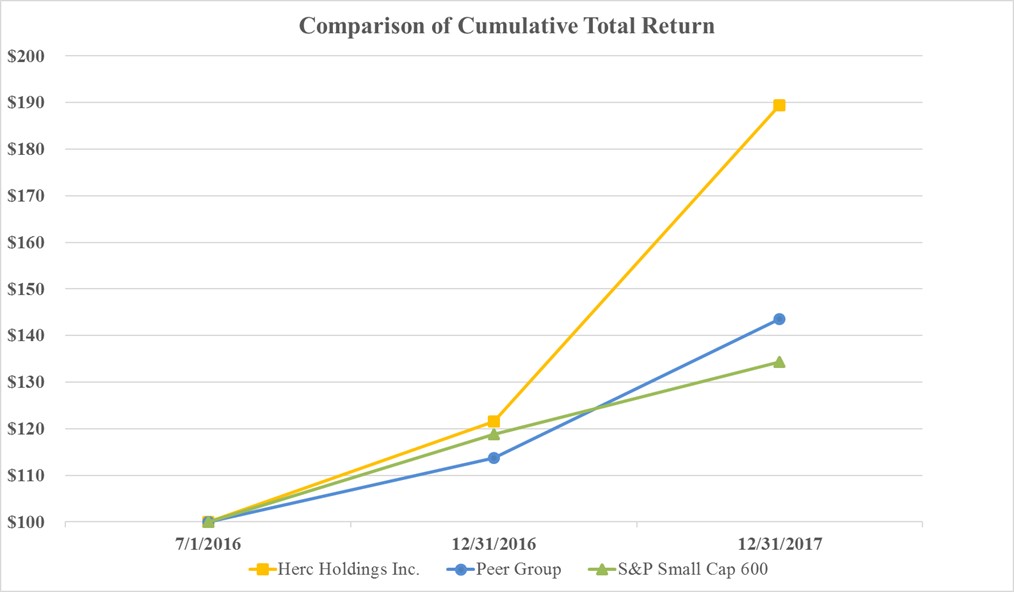
28
HERC HOLDINGS INC. AND SUBSIDIARIES
The following tables present selected consolidated financial information and are not necessarily indicative of results of future operations. Additionally, the historical financial information of the Company presented below for periods prior to the Spin-Off is not necessarily indicative of what the Company's financial position or results of operations actually would have been had it operated as a separate, independent company for such periods. The information presented should be read in conjunction with Item 7, "Management’s Discussion and Analysis of Financial Condition and Results of Operations" and the consolidated financial statements and related notes thereto included in this Report in Item 8, "Financial Statements and Supplementary Data," to fully understand factors that may affect the comparability of the information presented below. The selected consolidated financial data in this section is not intended to replace the consolidated financial statements.
|
Years ended December 31,
|
||||||||||||||||||||
|
(In millions, except per share data)
|
2017
|
2016
|
2015
|
2014
|
2013
|
|||||||||||||||
|
Statement of Operations Data
|
||||||||||||||||||||
|
Total revenues
|
$
|
1,754.5
|
|
$
|
1,554.8
|
|
$
|
1,678.2
|
|
$
|
1,770.4
|
|
$
|
1,735.6
|
|
|||||
|
Total expenses
(a)
|
1,818.9
|
|
1,559.7
|
|
1,521.3
|
|
1,625.9
|
|
1,582.5
|
|
||||||||||
|
Income (loss) before income taxes
|
(64.4
|
)
|
(4.9
|
)
|
156.9
|
|
144.5
|
|
153.1
|
|
||||||||||
|
Income tax benefit (provision)
(b)
|
224.7
|
|
(14.8
|
)
|
(45.6
|
)
|
(54.8
|
)
|
(55.0
|
)
|
||||||||||
|
Net income (loss)
|
$
|
160.3
|
|
$
|
(19.7
|
)
|
$
|
111.3
|
|
$
|
89.7
|
|
$
|
98.1
|
|
|||||
|
Earnings (loss) per share:
|
||||||||||||||||||||
|
Basic
|
$
|
5.66
|
|
$
|
(0.70
|
)
|
$
|
3.69
|
|
$
|
3.00
|
|
$
|
3.48
|
|
|||||
|
Diluted
|
$
|
5.60
|
|
$
|
(0.70
|
)
|
$
|
3.69
|
|
$
|
2.87
|
|
$
|
3.17
|
|
|||||
|
As of December 31,
|
|||||||||||||||||||
|
(In millions)
|
2017
|
2016
|
2015
|
2014
|
2013
|
||||||||||||||
|
Balance Sheet Data
|
|||||||||||||||||||
|
Cash and cash equivalents
(c)
|
$
|
41.5
|
|
$
|
24.0
|
|
$
|
24.7
|
|
$
|
28.0
|
|
$
|
15.4
|
|
||||
|
Total assets
|
3,549.7
|
|
3,466.0
|
|
3,397.0
|
|
3,599.7
|
|
4,132.1
|
|
|||||||||
|
Total debt
(d)
|
2,159.8
|
|
2,194.3
|
|
136.7
|
|
866.1
|
|
673.5
|
|
|||||||||
|
Total equity
(e)
|
510.4
|
|
317.7
|
|
2,302.0
|
|
1,693.7
|
|
1,877.4
|
|
|||||||||
|
(a)
|
Total expenses were impacted by long-lived asset impairments in 2017 and 2014 of $
29.7 million
and $9.6 million, respectively, losses on extinguishment of debt in 2017, 2014 and 2013 of
$11.4 million
, $0.8 million and $39.4 million, respectively, and the gain on the sale of our operations in France and Spain in 2015 of $50.9 million.
|
|
(b)
|
Income tax benefit in 2017 includes an estimated
$207.1 million
net benefit resulting from the 2017 Tax Act.
|
|
(c)
|
Includes the correction of an error which increased the amount by
$12.4 million
,
$9.0 million
and $9.1 million as of December 31, 2016, 2015 and 2014, respectively. See
Note 2
, "
Basis of Presentation and Recently Issued Accounting Pronouncements
" to the notes to our consolidated financial statements included in Part II, Item 8 of this Report.
|
|
(d)
|
Includes net loans payable to affiliates as of December 31, 2015, 2014 and 2013 of $73.2 million, $449.0 million and $226.0 million, respectively.
|
|
(e)
|
Total equity as of
December 31, 2016
was impacted by
$2.0 billion
of distributions and transfers to THC related to the Spin-Off.
|
29
HERC HOLDINGS INC. AND SUBSIDIARIES
Management’s discussion and analysis of financial condition and results of operations ("MD&A") should be read in conjunction with the consolidated financial statements and accompanying notes included in Item 8 of this Report, which include additional information about our accounting policies, practices and the transactions underlying our financial results. The preparation of our consolidated financial statements in conformity with accounting principles generally accepted in the United States of America ("U.S. GAAP") requires us to make estimates and assumptions that affect the reported amounts in our consolidated financial statements and the accompanying notes including depreciation of revenue earning equipment, pension and postretirement benefits, the recoverability of long-lived assets, useful lives and impairment of long-lived tangible and intangible assets including goodwill and trade name, accounting for income taxes, valuation of stock-based compensation, reserves for litigation and other contingencies, allowance for accounts receivable and other matters arising during the normal course of business. We apply our best judgment, our knowledge of existing facts and circumstances and our knowledge of actions that we may undertake in the future in determining the estimates that will affect our consolidated financial statements. We evaluate our estimates on an ongoing basis using our historical experience, as well as other factors we believe appropriate under the circumstances, such as current economic conditions, and adjust or revise our estimates as circumstances change. As future events and their effects cannot be determined with precision, actual results may differ from these estimates.
THE SPIN-OFF
On
June 30, 2016
, the Company, in its previous form as the holding company of both the existing equipment rental operations as well as the former vehicle rental operations (in its form prior to the Spin-Off, "Hertz Holdings"), completed a spin-off (the "Spin-Off") of its global vehicle rental business through a dividend to stockholders of all of the issued and outstanding common stock of Hertz Rental Car Holding Company, Inc., which was re-named Hertz Global Holdings, Inc. ("New Hertz"), on a one-for-five basis. New Hertz is now an independent public company that trades on the New York Stock Exchange under the symbol "HTZ." New Hertz continues to operate its global vehicle rental business through its operating subsidiaries including The Hertz Corporation ("THC"). The Company changed its name to Herc Holdings Inc. on
June 30, 2016
and trades on the New York Stock Exchange under the symbol "HRI." Following the Spin-Off, the Company continues to operate its global equipment rental business through its operating subsidiaries, including Herc.
On
June 30, 2016
, the Company effected a 1-for-15 reverse stock split. The reverse stock split reduced the number of authorized shares of common stock and preferred stock to 133.3 million and 13.3 million, respectively. All share data and per share amounts have been retroactively adjusted for the reverse stock split in the accompanying consolidated financial statements and notes thereto for all periods presented.
For accounting purposes, due to the relative significance of New Hertz to Hertz Holdings, New Hertz was considered the spinnor or divesting entity in the Spin-Off and Herc Holdings was considered the spinnee or divested entity. As a result, despite the legal form of the transaction, New Hertz was the “accounting successor” to Hertz Holdings. Under the accounting rules, the historical financial information of New Hertz is required to reflect the financial information of Hertz Holdings, as if New Hertz spun off Herc Holdings in the Spin-Off. In contrast, the historical financial information of Herc Holdings, including certain information presented in this Report, reflects the financial information of the equipment rental business and certain parent legal entities of Herc as historically operated as part of Hertz Holdings, as if Herc Holdings was a stand-alone company for all periods presented. The historical financial information of the Company presented in the following MD&A for periods prior to the Spin-Off is not necessarily indicative of what the Company's financial position or results of operations actually would have been had it operated as a separate, independent company for the periods presented.
OVERVIEW OF OUR BUSINESS AND OPERATING ENVIRONMENT
We are engaged principally in the business of renting equipment. Ancillary to our principal business of equipment rental, we also sell used rental equipment, sell new equipment and consumables and offer certain service and support to our customers. Our profitability is dependent upon a number of factors including the volume, mix and pricing of rental transactions and the utilization of equipment. Significant changes in the purchase price or residual values of equipment or interest rates can have a significant effect on our profitability depending on our ability to adjust pricing for these changes. Our business requires significant expenditures for equipment, and consequently we require substantial liquidity to finance such expenditures. See "Liquidity and Capital Resources" below.
30
HERC HOLDINGS INC. AND SUBSIDIARIES
ITEM 7. MANAGEMENT'S DISCUSSION AND ANALYSIS OF FINANCIAL CONDITION AND RESULTS OF OPERATIONS (Continued)
Our revenues primarily are derived from rental and related charges and consist of:
|
•
|
Equipment rental (includes all revenue associated with the rental of equipment including ancillary revenue from delivery, rental protection programs and fueling charges);
|
|
•
|
Sales of revenue earning equipment and sales of new equipment, parts and supplies; and
|
|
•
|
Service and other revenue (primarily relating to training and labor provided to customers).
|
Our expenses primarily consist of:
|
•
|
Direct operating expenses (primarily wages and related benefits, facility costs and other costs relating to the operation and rental of revenue earning equipment, such as delivery, maintenance and fuel costs);
|
|
•
|
Cost of sales of revenue earning equipment, new equipment, parts and supplies;
|
|
•
|
Depreciation expense relating to revenue earning equipment;
|
|
•
|
Selling, general and administrative expenses; and
|
|
•
|
Interest expense.
|
2017 Financial Overview
An overview of our business and financial performance in 2017 and key factors influencing our results include:
|
•
|
Equipment rental revenue increased
$146.3 million
, or
10.8%
, during the year ended
December 31, 2017
when compared with 2016. The increase was attributable to a higher level of revenue earning equipment on rent resulting from higher demand from existing customers as well as diversifying and growing our customer base, including through increases in our ProSolutions
TM
and ProContractor
product offerings. Additionally, pricing increased by
1.9%
during the year ended
December 31, 2017
as compared to 2016.
|
|
•
|
In March and October 2017, we drew down on our ABL Credit Facility and cumulatively redeemed
$122.0 million
in aggregate principal amount of the 2022 Notes and
$125.0 million
in aggregate principal amount of the 2024 Notes and recorded an
$11.4 million
loss on the early extinguishment of debt, comprised of a
3%
cash premium totaling
$7.4 million
and a non-cash charge of
$4.0 million
for the write-off of unamortized debt issuance costs. The losses on early extinguishment of debt are included in "Interest expense, net” in the consolidated statement of operations.
|
|
•
|
In October 2017, we consummated a sale-leaseback transaction pursuant to which we sold
42
of our properties located in the U.S. for gross proceeds of approximately
$119.5 million
, which has been reflected as a financing obligation on our consolidated balance sheet.
|
|
•
|
An impairment charge of
$29.7 million
was recorded during 2017 primarily related to the decision to discontinue developing a new financial and point of sale system that was initiated prior to the Spin-Off.
|
|
•
|
In the fourth quarter of 2017, we recognized an estimated
$207.1 million
net income tax benefit related to the enactment of the 2017 Tax Act.
|
31
HERC HOLDINGS INC. AND SUBSIDIARIES
ITEM 7. MANAGEMENT'S DISCUSSION AND ANALYSIS OF FINANCIAL CONDITION AND RESULTS OF OPERATIONS (Continued)
RESULTS OF OPERATIONS
|
Year Ended December 31,
|
2017 vs. 2016
|
2016 vs. 2015
|
|||||||||||||||||||||||
|
($ in millions)
|
2017
|
2016
|
2015
|
$ Change
|
% Change
|
$ Change
|
% Change
|
||||||||||||||||||
|
Equipment rental
|
$
|
1,499.0
|
|
$
|
1,352.7
|
|
$
|
1,411.7
|
|
$
|
146.3
|
|
10.8
|
%
|
$
|
(59.0
|
)
|
(4.2
|
)%
|
||||||
|
Sales of revenue earning equipment
|
190.8
|
|
122.5
|
|
161.2
|
|
68.3
|
|
55.8
|
|
(38.7
|
)
|
(24.0
|
)
|
|||||||||||
|
Sales of new equipment, parts and supplies
|
52.3
|
|
68.2
|
|
92.1
|
|
(15.9
|
)
|
(23.3
|
)
|
(23.9
|
)
|
(26.0
|
)
|
|||||||||||
|
Service and other revenue
|
12.4
|
|
11.4
|
|
13.2
|
|
1.0
|
|
8.8
|
|
(1.8
|
)
|
(13.6
|
)
|
|||||||||||
|
Total revenues
|
1,754.5
|
|
1,554.8
|
|
1,678.2
|
|
199.7
|
|
12.8
|
|
(123.4
|
)
|
(7.4
|
)
|
|||||||||||
|
Direct operating
|
721.6
|
|
655.2
|
|
713.4
|
|
66.4
|
|
10.1
|
|
(58.2
|
)
|
(8.2
|
)
|
|||||||||||
|
Depreciation of revenue earning equipment
|
378.9
|
|
350.5
|
|
343.7
|
|
28.4
|
|
8.1
|
|
6.8
|
|
2.0
|
|
|||||||||||
|
Cost of sales of revenue earning equipment
|
192.0
|
|
144.0
|
|
146.8
|
|
48.0
|
|
33.3
|
|
(2.8
|
)
|
(1.9
|
)
|
|||||||||||
|
Cost of sales of new equipment, parts and supplies
|
39.5
|
|
53.0
|
|
73.0
|
|
(13.5
|
)
|
(25.5
|
)
|
(20.0
|
)
|
(27.4
|
)
|
|||||||||||
|
Selling, general and administrative
|
320.6
|
|
275.2
|
|
267.6
|
|
45.4
|
|
16.5
|
|
7.6
|
|
2.8
|
|
|||||||||||
|
Impairment
|
29.7
|
|
—
|
|
—
|
|
29.7
|
|
NM
|
|
—
|
|
—
|
|
|||||||||||
|
Interest expense, net
|
140.0
|
|
84.2
|
|
32.9
|
|
55.8
|
|
66.3
|
|
51.3
|
|
155.9
|
|
|||||||||||
|
Other income, net
|
(3.4
|
)
|
(2.4
|
)
|
(56.1
|
)
|
(1.0
|
)
|
41.7
|
|
53.7
|
|
NM
|
|
|||||||||||
|
Income (loss) before income taxes
|
(64.4
|
)
|
(4.9
|
)
|
156.9
|
|
(59.5
|
)
|
NM
|
|
(161.8
|
)
|
(103.1
|
)
|
|||||||||||
|
Income tax benefit (provision)
|
224.7
|
|
(14.8
|
)
|
(45.6
|
)
|
239.5
|
|
NM
|
|
30.8
|
|
(67.5
|
)
|
|||||||||||
|
Net income (loss)
|
$
|
160.3
|
|
$
|
(19.7
|
)
|
$
|
111.3
|
|
$
|
180.0
|
|
NM
|
|
$
|
(131.0
|
)
|
(117.7
|
)%
|
||||||
NM - Not Meaningful
Year Ended December 31, 2017 Compared with Year Ended December 31, 2016
Equipment rental revenue increased
$146.3 million
, or
10.8%
, during the year ended
December 31, 2017
when compared with 2016. The increase was attributable to a higher level of revenue earning equipment on rent resulting from higher demand from existing customers as well as diversifying and growing our customer base, including through increases in our ProSolutions
TM
and ProContractor
product offerings. Additionally, pricing increased by
1.9%
during the year ended
December 31, 2017
as compared to 2016.
Sales of revenue earning equipment increased
$68.3 million
, or
55.8%
, during the year ended
December 31, 2017
when compared to 2016. During 2017, the level of revenue earning equipment sold increased as part of our strategy to shift the mix of our fleet as well as higher sales due to the rotation of our revenue earning equipment based on normal holding periods. The corresponding cost of sales of revenue earning equipment as a percentage of the related revenue was
100.6%
in 2017 compared to
117.6%
in 2016. Losses on the sale of revenue earning equipment decreased in 2017 as the volume of sales made through the lower-margin auction channel was reduced and shifted toward the wholesale channel. The loss on sale of revenue earning equipment in 2016 was primarily due to the higher level of sales through the auction channel of equipment used in the upstream oil and gas markets and equipment manufactured by certain suppliers as we reduced the number of brands of equipment we carry in our fleet.
Sales of new equipment, parts and supplies decreased
$15.9 million
, or
23.3%
, during the year ended
December 31, 2017
when compared with 2016. This decrease was driven by our implementation of changes to de-emphasize new equipment sales programs. The cost of sales of new equipment, parts and supplies as a percentage of the related revenue was
75.5%
for the year ended
December 31, 2017
compared to
77.7%
for 2016. The decrease was due to the mix of the new equipment sold.
32
HERC HOLDINGS INC. AND SUBSIDIARIES
ITEM 7. MANAGEMENT'S DISCUSSION AND ANALYSIS OF FINANCIAL CONDITION AND RESULTS OF OPERATIONS (Continued)
Direct operating expenses increased
$66.4 million
, or
10.1%
, during the year ended
December 31, 2017
when compared to 2016 primarily due to the following:
|
•
|
Fleet and related expenses increased
$38.3 million
primarily as a result of higher delivery and freight expense of
$17.6 million
mainly due to an increase in deliveries associated with higher equipment rental revenue. Equipment re-rent expense increased
$7.3 million
to supplement our fleet due to additional customer demand. Fuel expense increased by
$6.2 million
driven by higher gas prices and sales volume during the year ended
December 31, 2017
as compared to 2016. Additionally, maintenance expense increased by
$5.9 million
in an effort to reduce our fleet unavailable for rent.
|
|
•
|
Personnel-related expenses increased
$24.4 million
as a result of an increase in salary expense of
$17.6 million
primarily associated with continued investment in branch management to drive operational improvements and investments in branch operating personnel to support revenue growth. Additionally, there was an increase in benefits expense of
$5.7 million
primarily due to higher healthcare insurance costs as a stand-alone company.
|
|
•
|
Other direct operating costs increased
$3.7 million
primarily due to increased depreciation of
$7.0 million
related to the increase in service vehicles. These increases were partially offset by a decrease in restructuring expense of
$5.7 million
resulting from charges taken for several location closures during 2016 and 2015.
|
Depreciation of revenue earning equipment increased
$28.4 million
, or
8.1%
, during the year ended
December 31, 2017
when compared with 2016. The increase was due to a larger fleet size during the year ended
December 31, 2017
as compared to the same period in 2016 and an increase of
$18.0 million
due to the impact of the 2016 reduction in residual values and the planned holding period of certain classes of equipment.
Selling, general and administrative expenses increased
$45.4 million
, or
16.5%
, during the year ended
December 31, 2017
compared to 2016. The increase is primarily due to higher stand-alone public company costs and information technology costs related to the Spin-Off of
$19.8 million
, a
$14.8 million
increase for additional sales personnel and related commissions to drive revenue growth, and an
$8.5 million
increase in provision for bad debt attributable to higher revenue and levels of receivables.
Impairment charges of
$29.7 million
were recorded during the year ended
December 31, 2017
. The impairments related to the write-off of intangible assets previously capitalized as part of the development of new financial and point of sale systems of
$25.3 million
and the impairment of certain revenue earning equipment of
$4.4 million
that was deemed held for sale at
December 31, 2017
. See
Note 6
, "
Impairment
" to the notes to our consolidated financial statements for further information.
Interest expense, net increased
$55.8 million
, or
66.3%
, during the year ended
December 31, 2017
compared to the prior-year period due to interest incurred on the Notes issued in June 2016, an
$11.4 million
loss on the early extinguishment of a portion of the Notes, and borrowings under the ABL Credit Facility. The increases were partially offset by decreases in interest on the predecessor asset-based revolving credit facility (the "Predecessor ABL Facility") and loans from THC and its affiliates, which were settled as part of the Spin-Off in June 2016.
Other income was
$3.4 million
during the year ended
December 31, 2017
, primarily comprised of earnings from our joint ventures and proceeds received from insurance. Other income was
$2.4 million
during the
year ended December 31, 2016
, primarily comprised of earnings from our joint ventures.
Income tax benefit was
$224.7 million
during the year ended
December 31, 2017
compared to an income tax provision of
$14.8 million
in 2016. The income tax benefit during the year ended
December 31, 2017
was primarily driven by an estimated
$207.1 million
net benefit related to the enactment of the 2017 Tax Act and
pre-tax losses. Income tax expense in 2016 included
$11.2 million
of state taxes, primarily due to the Spin-Off, and
$3.2 million
of non-deductible items and transaction costs related to the Spin-Off.
Year Ended December 31, 2016 Compared with Year Ended December 31, 2015
Equipment rental revenue decreased
$59.0 million
, or
4.2%
, during the year ended
December 31, 2016
when compared with 2015. An increase in key market equipment rental revenue of
8.1%
in 2016 and an increase in the average equipment on rent in the
year ended December 31, 2016
, as compared to 2015 partially offset the absence of revenue from our operations in France and Spain
33
HERC HOLDINGS INC. AND SUBSIDIARIES
ITEM 7. MANAGEMENT'S DISCUSSION AND ANALYSIS OF FINANCIAL CONDITION AND RESULTS OF OPERATIONS (Continued)
that were divested in October 2015, which accounted for
$59.6 million
of revenue during the year ended December 31, 2015, the
$6.6 million
negative impact of foreign currency translation, and continuing weakness in upstream oil and gas markets. Revenue in upstream oil and gas markets represented
16.6%
of equipment rental revenue in 2016, excluding currency effects and was down
25.6%
as compared to 2015, as major oil producers reduced spending.
Sales of revenue earning equipment declined
$38.7 million
, or
24.0%
, during the
December 31, 2016
as compared to 2015. During the year ended
December 31, 2016
, the level of revenue earning equipment sold decreased as a part of our equipment rotation plan based on an average useful life of approximately seven years, reflecting lower capital expenditures during 2008 and 2009. Additionally, during the year ended December 31, 2015, there was higher sales activity due to management's initiative that began in the fourth quarter of 2014 to reduce the fleet size in certain markets in accordance with projected customer demand and the declining demand in the upstream oil and gas industry, and also to reduce the fleet unavailable for rent. The corresponding cost of sales of revenue earning equipment as a percent of revenue was
117.6%
during 2016 compared to
91.1%
in 2015. The loss on sales of revenue earning equipment in 2016 was primarily due to additional sales through the auction channel of equipment used in the upstream oil and gas markets and equipment manufactured by certain suppliers as we reduced the number of brands of equipment we carry in our fleet.
Sales of new equipment, parts and supplies decreased
$23.9 million
, or
26.0%
, during the year ended
December 31, 2016
as compared to 2015. The decrease was driven by our implementation of changes in new equipment sales programs, including the elimination of certain equipment dealerships. This decrease is also due to a decline in the volume of sales during 2016 partially due to the decline in spending from our oil and gas customers. The corresponding cost of sales of new equipment, parts and supplies as a percent of revenue was
77.7%
for 2016 compared to
79.3%
for 2015. The slight decrease was due to the mix of the new equipment sold.
Direct operating expenses decreased
$58.2 million
, or
8.2%
, in the year ended
December 31, 2016
when compared to 2015 primarily due to the following:
|
•
|
Fleet and related expenses decreased $23.8 million primarily as a result of lower vehicle operating costs of $11.6 million driven by lower external delivery costs due to increased use of internal equipment delivery personnel and reduced deliveries to customers in upstream oil and gas markets based on the decreased demand in those markets. Additionally, fleet and related expenses were lower by $13.6 million in 2016 due to the sale of our operations in France and Spain in 2015.
|
|
•
|
Personnel related expenses increased $3.8 million as a result of an increase in salary and benefits expense of $20.8 million primarily associated with a reinvestment in branch management to drive operational improvements and additional sales personnel to drive revenue growth, which was partially offset by a decrease in salary and benefits expense of $17.1 million due to the sale of our operations in France and Spain in 2015.
|
|
•
|
Other direct operating costs decreased $38.2 million due to lower amortization of $32.5 million primarily due to customer list intangibles that became fully amortized at December 31, 2015 and a decrease of $16.0 million due to the sale of our operations in France and Spain in 2015. Partially offsetting the decreases was an increase in facilities expense of $4.7 million.
|
Depreciation of revenue earning equipment increased
$6.8 million
, or
2.0%
, in the year ended
December 31, 2016
when compared with 2015. This increase was primarily due to a larger fleet size compared to the year ended December 31, 2015 and an increase of
$9.4 million
related to the reduction in residual values and the planned holding period of certain classes of equipment. The increase was partially offset by the absence of depreciation expense of $17.3 million due to the sale of our operations in France and Spain in 2015.
Selling, general and administrative expenses increased
$7.6 million
, or
2.8%
, from the prior year. The increase is due to higher information technology costs, professional fees and other costs of
$33.1 million
, mostly related to the Spin-Off and other stand-alone public company costs. The increase was partially offset by decreases related to the sale of our operations in France and Spain, which accounted for $10.5 million in expense during 2015, a decrease in provision for bad debt of $6.8 million during the
year ended December 31, 2016
due to improved collection efforts specifically on aged balances, and a reduction of $5.0 million of cost incurred associated with the separation of a senior executive during 2015.
34
HERC HOLDINGS INC. AND SUBSIDIARIES
ITEM 7. MANAGEMENT'S DISCUSSION AND ANALYSIS OF FINANCIAL CONDITION AND RESULTS OF OPERATIONS (Continued)
Interest expense, net increased
$51.3 million
, or
155.9%
, from the prior year. The increase is due to interest incurred on the Notes that were issued in June 2016 and borrowings under the new ABL Credit Facility, which was partially offset by decreases in interest on the Predecessor ABL Facility and loans from THC and its affiliates, which were settled as part of the Spin-Off in June 2016.
Other income was
$2.4 million
in 2016 as compared to
$56.1 million
in 2015. During 2015, we recognized a gain on the sale of our France and Spain businesses of
$50.9 million
. Other income in both periods includes earnings from our joint ventures.
Income tax expense was
$14.8 million
in 2016 compared to
$45.6 million
in 2015. The overall decrease was primarily driven by lower operating results in 2016. Income tax expense in 2016 included
$11.2 million
of state taxes, primarily due to the Spin-Off, and
$3.2 million
of non-deductible items and transactions costs related to the Spin-Off. Income tax expense in 2015 was primarily driven by higher operating income, a portion of which included a non-taxable book gain realized on the sale of operations in France and Spain.
LIQUIDITY AND CAPITAL RESOURCES
Our primary liquidity needs include the payment of operating expenses, purchases of rental equipment to be used in our operations and servicing of debt. Our primary sources of funding are operating cash flows, cash received from the disposal of equipment and borrowings under our debt arrangements. As of
December 31, 2017
, we had approximately
$2.2 billion
of total nominal indebtedness outstanding. We are highly leveraged and a substantial portion of our liquidity needs arise from debt service on our indebtedness and from the funding of our costs of operations and capital expenditures.
Our liquidity as of
December 31, 2017
consisted of cash and cash equivalents and unused commitments under our ABL Credit Facility. See "Borrowing Capacity and Availability" below. Our practice is to maintain sufficient liquidity through cash from operations and our ABL Credit Facility, to mitigate the impacts of any adverse financial market conditions on our operations. We believe that cash generated from operations and cash received from the disposal of equipment, together with amounts available under the ABL Credit Facility, will be adequate to permit us to meet our obligations over the next 12 months.
In October 2017, we consummated a sale-leaseback transaction pursuant to which we sold
42
of our properties located in the U.S. for gross proceeds of approximately
$119.5 million
, which has been reflected as a financing obligation on our consolidated balance sheet, and entered into a master lease agreement pursuant to which we will continue operations at those properties as a tenant. The lease agreement has an initial term of
twenty
years, subject to extension, at our option, for up to
five
additional periods of
five
years each.
In March and October 2017, we drew down on our ABL Credit Facility and cumulatively redeemed
$122.0 million
in aggregate principal amount of the 2022 Notes and
$125.0 million
in aggregate principal amount of the 2024 Notes.
Cash Flows
Significant factors driving our liquidity position include cash flows generated from operating activities and capital expenditures. Historically, we have generated and expect to continue to generate positive cash flow from operations. Our ability to fund our capital needs will be affected by our ongoing ability to generate cash from operations and access to capital markets.
Prior to the Spin-Off in 2016, as a subsidiary of Hertz Holdings, Herc's cash was swept regularly by Hertz Holdings at its discretion. Hertz Holdings also funded Herc's operating and investing activities as needed. Cash flows related to first half 2016 financing activities included changes in Hertz Holdings' investments in Herc. Transfers of cash to and from Hertz Holdings in the first half of 2016 are reflected within financing activities in our consolidated statements of cash flows.
35
HERC HOLDINGS INC. AND SUBSIDIARIES
ITEM 7. MANAGEMENT'S DISCUSSION AND ANALYSIS OF FINANCIAL CONDITION AND RESULTS OF OPERATIONS (Continued)
The following table summarizes the change in cash and cash equivalents for the periods shown (in millions):
|
|
Years Ended December 31,
|
2017 vs. 2016
|
2016 vs. 2015
|
||||||||||||||||
|
2017
|
2016
|
2015
|
$ Change
|
$ Change
|
|||||||||||||||
|
Cash provided by (used in):
|
|||||||||||||||||||
|
Operating activities
|
$
|
341.7
|
|
$
|
433.4
|
|
$
|
496.3
|
|
$
|
(91.7
|
)
|
$
|
(62.9
|
)
|
||||
|
Investing activities
|
(403.0
|
)
|
(395.0
|
)
|
(389.9
|
)
|
(8.0
|
)
|
(5.1
|
)
|
|||||||||
|
Financing activities
|
77.5
|
|
(38.7
|
)
|
(105.4
|
)
|
116.2
|
|
66.7
|
|
|||||||||
|
Effect of exchange rate changes
|
1.3
|
|
(0.4
|
)
|
(4.3
|
)
|
1.7
|
|
3.9
|
|
|||||||||
|
Net change in cash and cash equivalents
|
$
|
17.5
|
|
$
|
(0.7
|
)
|
$
|
(3.3
|
)
|
$
|
18.2
|
|
$
|
2.6
|
|
||||
Year Ended
December 31, 2017
Compared with Year Ended
December 31, 2016
Operating Activities
During the year ended
December 31, 2017
, cash provided by operating activities decreased
$91.7 million
compared to
2016
. The decrease was primarily related to a
$61.0 million
increase in interest payments as well as lower operating income resulting from higher information technology and other stand-alone public company costs, as well as the timing of collections of accounts receivable and payments of liabilities during the year ended
December 31, 2017
as compared to
2016
.
Investing Activities
Cash used in investing activities increased
$8.0 million
during the year ended
December 31, 2017
as compared to
2016
. Our primary use of cash in investing activities is for the acquisition of revenue earning equipment and non-rental capital expenditures, which increased primarily due to investments in our information technology, service vehicles and facilities, and was partially offset by a decrease in our investments in revenue earning equipment. We renew our equipment and manage our fleet of rental equipment in line with customer demand. Changes in our net capital expenditures are described in more detail in the "Capital Expenditures" section below.
Financing Activities
Cash flows from financing activities increased
$116.2 million
during the year ended
December 31, 2017
as compared to
2016
. Cash flows from financing activities during the year ended
December 31, 2017
primarily represents our changes in debt, which included the net draw down of
$222.7 million
on our revolving lines of credit and proceeds of
$119.5 million
received from financing obligations, partially offset by the redemption of
$247.0 million
of our Notes. Cash used in financing activities in
2016
mainly related to
$2.1 billion
of financing and transfer activities with Hertz Holdings, which primarily funded our operations prior to the Spin-Off and was settled using total proceeds of
$2.1 billion
, net of issuance costs, from our Notes and ABL Credit Facility.
Year Ended
December 31, 2016
Compared with Year Ended
December 31, 2015
Operating Activities
During the year ended
December 31, 2016
, cash provided by operating activities decreased
$62.9 million
compared to
2015
. The decrease was primarily related to lower operating results, which included lower revenues, increased costs attributed to information technology and professional fees and higher interest expense, which included a
$43.0 million
increase in cash paid for interest.
Investing Activities
Cash used in investing activities increased slightly by
$5.1 million
in
2016
as compared to
2015
. The slight overall increase in cash used in investing activities in
2016
is primarily due to the
$126.4 million
of proceeds received from the sale of our France and Spain operations in
2015
, which mostly offset the higher level of capital expenditures in
2015
.
36
HERC HOLDINGS INC. AND SUBSIDIARIES
ITEM 7. MANAGEMENT'S DISCUSSION AND ANALYSIS OF FINANCIAL CONDITION AND RESULTS OF OPERATIONS (Continued)
Financing Activities
Cash used in financing activities decreased
$66.7 million
for the year ended
December 31, 2016
compared to the same period in
2015
. Cash used in financing activities in
2016
included financing and transfer activities with Hertz Holdings, including the Spin-Off distribution, totaling
$2.1 billion
, and the payment of
$41.5 million
in debt issuance costs. Cash provided by financing activities in
2016
included the issuance of
$1.2 billion
i
n long-term debt and the net borrowings of
$910.0 million
on our ABL Credit Facility. In
2015
, cash outflows included net payments of
$343.6 million
on our Predecessor ABL Facility and a
$604.5 million
purchase of treasury stock by Hertz Holdings, which was partially offset by net cash inflows of
$852.6 million
provided by our financing and transfer activities with Hertz Holdings and affiliates.
Capital Expenditures
Our capital expenditures relate largely to purchases of revenue earning equipment, with the remaining portion representing purchases of other property and equipment. The table below sets forth the capital expenditures related to our revenue earning equipment and related disposals for the periods noted (in millions).
|
Years Ended December 31,
|
|||||||||||
|
2017
|
2016
|
2015
|
|||||||||
|
Revenue earning equipment expenditures
|
$
|
501.4
|
|
$
|
468.3
|
|
$
|
600.0
|
|
||
|
Disposals of revenue earning equipment
|
(160.1
|
)
|
(115.4
|
)
|
(151.9
|
)
|
|||||
|
Net revenue earning equipment expenditures
|
$
|
341.3
|
|
$
|
352.9
|
|
$
|
448.1
|
|
||
Net capital expenditures for revenue earning equipment decreased
$11.6 million
during the year ended
December 31, 2017
compared to
2016
. During
2017
, we purchased more revenue earning equipment as part of our fleet mix transformation out of large earthmoving equipment and into more compact earthmoving, ProSolutions
TM
and ProContractor equipment. Our disposals also increased in
2017
due to a shift in the mix and rotation of our fleet.
Net capital expenditures for revenue earning equipment decreased
$95.2 million
during the year ended
December 31, 2016
compared to
2015
. During
2015
, we purchased more revenue earning equipment as part of our strategy to refresh the fleet and invest in higher quality equipment; however, we also sold more equipment in certain markets in order to reduce fleet in those markets impacted by the decline in the upstream oil and gas industry.
In 2018, we expect our net revenue earning equipment capital expenditures to be in the range of
$525.0 million
to
$575.0 million
.
Borrowing Capacity and Availability
Our ABL Credit Facility provides our borrowing capacity and availability. Creditors under our ABL Credit Facility have a claim on a specific pool of assets as collateral. Our ability to borrow under the ABL Credit Facility is a function of, among other things, the value of the assets in the relevant collateral pool. We refer to the amount of debt we can borrow given a certain pool of assets as the "Borrowing Base."
Substantially all of the assets of Herc and certain of its U.S. and Canadian subsidiaries are encumbered in favor of our lenders under our ABL Credit Facility and our Notes. None of such assets are available to satisfy the claims of our general creditors. See
Note 9
, "
Debt
" to the notes to our consolidated financial statements included in Part II, Item 8 of this Report for more information.
As of
December 31, 2017
, the following was available (in millions):
|
Remaining
Capacity
|
Availability Under
Borrowing Base
Limitation
|
||||||
|
ABL Credit Facility
|
$
|
597.2
|
|
$
|
597.2
|
|
|
In addition, as of
December 31, 2017
, the Company's subsidiary in China had uncommitted credit facilities, of which
$7.4 million
was available for borrowing.
37
HERC HOLDINGS INC. AND SUBSIDIARIES
ITEM 7. MANAGEMENT'S DISCUSSION AND ANALYSIS OF FINANCIAL CONDITION AND RESULTS OF OPERATIONS (Continued)
With respect to the ABL Credit Facility, we refer to "Remaining Capacity" as the maximum principal amount of debt permitted to be outstanding under the ABL Credit Facility (i.e., the amount of debt we could borrow assuming we possessed sufficient assets as collateral) less the principal amount of debt then-outstanding under the facility. We refer to "Availability Under Borrowing Base Limitation" as the lower of (A) Remaining Capacity and (B) the amount of debt we could borrow under our existing Borrowing Base less the principal amount of debt then-outstanding under the facility (i.e., the amount of debt we could borrow given the collateral we possess at such time).
As of
December 31, 2017
, the ABL Credit Facility had
$227.2 million
available under the letter of credit facility sublimit, subject to borrowing base restrictions, and
$22.8 million
of standby letters of credit were issued and outstanding, upon which
none
have been drawn.
Covenants
Our ABL Credit Facility and our Notes contain a number of covenants that, among other things, limit or restrict our ability to dispose of assets, incur additional indebtedness, incur guarantee obligations, prepay certain indebtedness, make certain restricted payments (including paying dividends, redeeming stock or making other distributions), create liens, make investments, make acquisitions, engage in mergers, fundamentally change the nature of our business, make capital expenditures, or engage in certain transactions with certain affiliates.
Under the terms of our ABL Credit Facility and our Notes, we are not subject to ongoing financial maintenance covenants; however, under the ABL Credit Facility, failure to maintain certain levels of liquidity will subject us to a contractually specified fixed charge coverage ratio of not less than
1
:
1
for the four quarters most recently ended. We are in compliance with our covenants as of
December 31, 2017
.
At
December 31, 2017
, Herc Holdings' balance sheet was substantially identical to that of Herc, the borrower, with the exception of the components of shareholders equity. For the year ended
December 31, 2017
, the statements of operations of Herc Holdings and Herc were identical. For the years ended
December 31, 2016
and
2015
, the statements of operations were substantially identical, except for approximately
$3.8 million
of interest expense to Hertz Holdings that is included in Herc Holdings' statements of operations in each year but is not included in Herc's statements of operations.
For further information on the terms of our Notes and ABL Credit Facility, see
Note 9
, "
Debt
" to the notes to our consolidated financial statements included in this Report. For a discussion of the risks associated with our significant indebtedness, see Part I, Item 1A "Risk Factors" contained in this Report.
Dividends
Hertz Holdings did not historically pay dividends. Our payment of dividends on our common stock will be determined by our board of directors in its sole discretion and will depend on our business conditions, financial condition, earnings, liquidity and capital requirements, contractual restrictions and other factors. The amounts available to pay cash dividends are restricted by our debt agreements. As of the date of this Report, we have no plans to pay dividends on our common stock.
38
HERC HOLDINGS INC. AND SUBSIDIARIES
ITEM 7. MANAGEMENT'S DISCUSSION AND ANALYSIS OF FINANCIAL CONDITION AND RESULTS OF OPERATIONS (Continued)
CONTRACTUAL OBLIGATIONS
The following table details the contractual cash obligations for debt and related interest payable, capital and operating leases, and other purchase obligations as of
December 31, 2017
(in millions):
|
Payments Due by Period
|
|||||||||||||||||||
|
Total
|
2018
|
2019-2020
|
2021-2022
|
After 2022
|
|||||||||||||||
|
Debt principal, including current maturities
|
$
|
2,120.6
|
|
$
|
2.6
|
|
$
|
—
|
|
$
|
1,618.0
|
|
$
|
500.0
|
|
||||
|
Interest
(a)
|
542.4
|
|
113.4
|
|
226.2
|
|
147.9
|
|
54.9
|
|
|||||||||
|
Financing obligations
(b)
|
156.5
|
|
7.9
|
|
15.8
|
|
15.8
|
|
117.0
|
|
|||||||||
|
Capital lease obligations
(c)
|
57.3
|
|
22.1
|
|
35.2
|
|
—
|
|
—
|
|
|||||||||
|
Operating lease obligations
(d)
|
166.7
|
|
32.6
|
|
49.1
|
|
28.7
|
|
56.3
|
|
|||||||||
|
Purchase obligations and other
(e)
|
22.4
|
|
8.9
|
|
11.7
|
|
1.6
|
|
0.2
|
|
|||||||||
|
Total
|
$
|
3,065.9
|
|
$
|
187.5
|
|
$
|
338.0
|
|
$
|
1,812.0
|
|
$
|
728.4
|
|
||||
|
(a)
|
Estimated interest payments have been calculated based on the applicable interest rates as of
December 31, 2017
.
|
|
(b)
|
Includes obligations under financing agreements primarily for the lease of 42 properties. See
Note 10
, "
Financing Obligations
" to the notes to our consolidated financial statements included in Part II, Item 8 of this Report.
|
|
(c)
|
Includes obligations under lease agreements primarily for service vehicles. See
Note 14
, "
Leases
" to the notes to our consolidated financial statements included in Part II, Item 8 of this Report.
|
|
(d)
|
Includes obligations under lease agreements for real estate and office and computer equipment. Such obligations are reflected to the extent of their minimum non-cancelable terms. See
Note 14
, "
Leases
" included in the notes to our consolidated financial statements included in Part II, Item 8 of this Report.
|
|
(e)
|
Purchase obligations and other represent agreements to purchase goods or services that are legally binding on us and that specify all significant terms, including fixed or minimum quantities; fixed, minimum or variable price provisions; and the approximate timing of the transaction. Only the minimum non-cancelable portion of purchase agreements and related cancellation penalties are included as obligations. In the case of contracts that state minimum quantities of goods or services, amounts reflect only the stipulated minimums; all other contracts reflect estimated amounts. Of the total obligations,
$0.2 million
represents our tax liability for uncertain tax positions.
|
The table excludes our pension and other postretirement benefit obligations. See
Note 11
, "
Employee Retirement Benefits
" to the notes to our consolidated financial statements included in Part II, Item 8 of this Report.
OFF-BALANCE SHEET COMMITMENTS AND ARRANGEMENTS
As of
December 31, 2017
and
2016
, the following guarantees (including indemnification commitments) were issued and outstanding.
Indemnification Obligations
In the ordinary course of business, we execute contracts involving indemnification obligations customary in the relevant industry and indemnifications related to a specific transaction such as the sale of a business. These indemnification obligations might include claims relating to the following: environmental matters; condition of property; intellectual property rights; governmental regulations and employment-related matters; customer, supplier and other commercial contractual relationships; and financial or other matters. Performance under these indemnification obligations would generally be triggered by a breach of terms of the contract or by a third party claim. We regularly evaluate the probability of having to incur costs associated with these indemnification obligations and accrue for expected losses that are probable and estimable. Also see
Note 21
, "
Arrangements with New Hertz
" to the notes to our consolidated financial statements included in Part II, Item 8 of this Report. For discussion of the risks associated with indemnification obligations in the context of divestitures, "Risks Related to our Business—Other Operational Risks" in Part I, Item 1A "Risk Factors" contained in this Report.
39
HERC HOLDINGS INC. AND SUBSIDIARIES
ITEM 7. MANAGEMENT'S DISCUSSION AND ANALYSIS OF FINANCIAL CONDITION AND RESULTS OF OPERATIONS (Continued)
Contingencies and Environmental Matters
The information concerning the ongoing securities litigation and governmental investigation contained in Part I, Item 3 "Legal Proceedings" of this Report and the information concerning other contingencies, including environmental contingencies and the amount currently held in reserve for environmental matters, contained in
Note 16
, "
Commitments and Contingencies
" to the notes to our consolidated financial statements included in Part II, Item 8 of this Report is incorporated herein by reference. The additional information concerning environmental matters included in Part I, Item 1 "Business—Environmental, Health and Safety Matters and Governmental Regulation" of this Report is also incorporated herein by reference.
CRITICAL ACCOUNTING POLICIES AND ESTIMATES
Our discussion and analysis of financial condition and results of operations are based upon our consolidated financial statements, which have been prepared in accordance with U.S. GAAP. The preparation of the consolidated financial statements requires management to make estimates and judgments that affect the reported amounts in our consolidated financial statements and accompanying notes.
Certain of our accounting policies, as discussed below, involve a higher degree of judgment and complexity in their application and, therefore, represent the critical accounting policies used in the preparation of our financial statements. If different assumptions or conditions were to prevail, the results could be materially different from our reported results. For additional discussion of our critical accounting policies, as well as our significant accounting policies, see
Note 2
, "
Basis of Presentation and Recently Issued Accounting Pronouncements
" to the notes to our consolidated financial statements included in Part II, Item 8 of this Report.
Revenue Recognition
Equipment rental revenue includes revenue generated from renting equipment to customers and is recognized on a straight-line basis over the length of the rental contract. Also included in equipment rental revenue are fees for equipment delivery and pick-up and fees for our rental protection program which allows customers to limit risk of financial loss in the event our equipment is damaged or lost. Delivery and pick-up fees are recognized as revenue when the services are performed and fees related to our rental protection program are recognized over the length of the contract term.
Revenue from the sale of revenue earning equipment, new equipment, parts and supplies are recognized at the time the customer takes possession, when collectability is reasonably assured and when all obligations under the sales contract have been fulfilled. Sales tax amounts collected from customers are recorded on a net basis.
We generally recognize revenue from the sale of new equipment purchased from other companies based on the gross amount billed as we establish our own pricing and retain related inventory risk, are the primary obligor in sales transactions with our customers, and assume the credit risk for amounts billed to our customers.
Service and other revenue is recognized as the services are performed.
Revenue Earning Equipment
Our principal assets are revenue earning equipment, which represented approximately
66.9%
and
69.0%
of our total assets as of
December 31, 2017
and
2016
, respectively. Revenue earning equipment consists of equipment utilized in our equipment rental operations. When revenue earning equipment is acquired, we use historical experience, industry residual value guidebooks and the monitoring of market conditions to set depreciation rates. Generally, we estimate the period that we will hold the asset, primarily based on historical measures of the amount of equipment usage and the targeted age of equipment at the time of disposal. We also estimate the residual value of the applicable revenue earning equipment at the expected time of disposal. The residual value for revenue earning equipment is affected by factors which include equipment age and amount of usage. Depreciation is recorded over the estimated holding period. Depreciation rates are reviewed regularly based on management's ongoing assessment of present and estimated future market conditions, their effect on residual values at the time of disposal and the estimated holding periods. Market conditions for used equipment sales also can be affected by external factors such as the economy, natural disasters, fuel prices, supply of similar used equipment, the market price for similar new equipment and incentives offered by manufacturers. As
40
HERC HOLDINGS INC. AND SUBSIDIARIES
ITEM 7. MANAGEMENT'S DISCUSSION AND ANALYSIS OF FINANCIAL CONDITION AND RESULTS OF OPERATIONS (Continued)
a result of this ongoing assessment, we make periodic adjustments to depreciation rates of revenue earning equipment in response to changing market conditions.
Defined Benefit Pension Obligations
Prior to the Spin-Off, we participated in certain THC-sponsored U.S. defined benefit plans covering substantially all U.S. employees, as well as certain non-U.S. defined benefit plans covering eligible non-U.S. employees. For each of these plans, we recorded our portion of the expense and the related obligations which were actuarially determined and the assets were allocated proportionally. In July 2016, we established the Herc Holdings Retirement Plan (the "Plan"). All assets and liabilities under the THC-sponsored plans attributable to current and former employees of the equipment rental business were transferred to the Plan following the Spin-Off. Additionally, pursuant to various collective bargaining agreements, certain union-represented employees participate in multiemployer pension plans.
Employee pension costs and obligations are dependent on assumptions used by actuaries in calculating such amounts. These assumptions include discount rates, salary growth, long-term return on plan assets, retirement rates, mortality rates and other factors. Actual results that differ from our assumptions are accumulated and amortized over future periods and, therefore, generally affect our recognized expense in such future periods. While we believe that the assumptions used are appropriate, significant differences in actual experience or significant changes in assumptions would affect our pension costs and obligations. The various employee-related actuarial assumptions (e.g., retirement rates, mortality rates and salary growth) used in determining pension costs and plan liabilities are reviewed periodically by management, assisted by the enrolled actuary, and updated as warranted. The discount rate used to value the pension liabilities and related expenses and the expected rate of return on plan assets are the two most significant assumptions impacting pension expense. The discount rate used is a market-based rate as of the valuation date. For the expected return on assets assumption, we use a forward-looking rate that is based on the expected return for each asset class (including the value added by active investment management), weighted by the target asset allocation. The past annualized long-term performance of the Plan's assets has generally been in line with the long-term rate of return assumption.
See
Note 11
, "
Employee Retirement Benefits
" to the notes to our consolidated financial statements included in Part II, Item 8 of this Report.
Goodwill and Indefinite-Lived Intangible Assets
On an annual basis and at interim periods when circumstances require, we test the recoverability of our goodwill. Goodwill impairment is deemed to exist if the carrying value of goodwill of a reporting unit exceeds its fair value. A reporting unit is an operating segment or a business one level below that operating segment (the component level) if discrete financial information is prepared and regularly reviewed by segment management. However, components are aggregated as a single reporting unit if they have similar economic characteristics. We estimate the fair value of our reporting unit using a combination of an income approach on the present value of estimated future cash flows and a market approach based on published earnings multiples of comparable entities with similar operations and economic characteristics as well as acquisition multiples paid in recent transactions.
The key assumptions used in the discounted cash flow valuation model for impairment testing include discount rates, growth rates, cash flow projections and terminal value rates. Discount rates are set by using the weighted average cost of capital, or "WACC," methodology. The WACC methodology considers market and industry data as well as company specific risk factors for each reporting unit in determining the appropriate discount rates to be used. The discount rate utilized for each reporting unit is indicative of the return an investor would expect to receive for investing in such a business. The cash flows represent management's most recent planning assumptions. These assumptions are based on a combination of industry outlooks, views on general economic conditions and our expected pricing plans. Terminal value rate determination follows common methodology of capturing the present value of perpetual cash flow estimates beyond the last projected period assuming a constant WACC and low long-term growth rates. If the carrying value of the reporting unit is greater than its fair value, we recognize an impairment charge for the amount equal to that excess. A significant decline in the projected cash flows or a change in the WACC used to determine fair value could result in a future goodwill impairment charge.
Indefinite-lived intangible assets, primarily trademarks, are not amortized but are evaluated annually for impairment and whenever events or changes in circumstances indicate that the carrying amount of this asset may exceed its fair value. If the carrying value of an indefinite-lived intangible asset exceeds its fair value, an impairment loss is recognized in an amount equal to that excess.
41
HERC HOLDINGS INC. AND SUBSIDIARIES
ITEM 7. MANAGEMENT'S DISCUSSION AND ANALYSIS OF FINANCIAL CONDITION AND RESULTS OF OPERATIONS (Continued)
Our impairment analysis for goodwill and indefinite-lived intangible assets was conducted as of October 1, 2017. We performed the analysis using one reporting unit, worldwide equipment rental, and concluded that there was no impairment related to such assets. See
Note 2
, "
Basis of Presentation and Recently Issued Accounting Pronouncements
" to the notes to our consolidated financial statements included in Part II, Item 8 of this Report for discussion of the early adoption of guidance related to simplifying the test for goodwill impairment.
See
Note 5
, "
Goodwill and Intangible Assets
" to the notes to our consolidated financial statements included in Part II, Item 8 of this Report.
Finite-Lived Intangible and Long-Lived Assets
Intangible assets include technology, customer relationships, trade names and other intangibles. Intangible assets with finite lives are amortized using the straight-line method over the estimated economic lives of the assets, which range from
three
to
10
years. Long-lived assets, including intangible assets with finite lives, are reviewed for impairment whenever events or changes in circumstances indicate that the carrying amount of such assets may not be recoverable. Determination of recoverability is based on an estimate of undiscounted future cash flows resulting from the use of the asset and its eventual disposition. Measurement of an impairment loss for long-lived assets that management expects to hold and use is based on the estimated fair value of the asset. Long-lived assets to be disposed of are reported at the lower of carrying amount or estimated fair value less costs to sell.
Income Taxes
For 2015 and the first half of 2016, we were included in the consolidated income tax returns of Hertz Holdings. Deferred tax assets and liabilities are recognized for the future tax consequences attributable to differences between the financial statement carrying amounts of existing assets and liabilities and their respective tax bases. Deferred tax assets and liabilities are measured using enacted tax rates expected to apply to taxable income in the years in which those temporary differences are expected to be recovered or settled. The effect of a change in tax rates is recognized in the statement of operations in the period that includes the enactment date. Valuation allowances are recorded to reduce deferred tax assets when it is more likely than not that a tax benefit will not be realized. Subsequent changes to enacted tax rates will result in changes to deferred taxes and any related valuation allowances. We have recorded a deferred tax asset for unutilized net operating loss carryforwards in various tax jurisdictions. The taxing authorities may examine the positions that led to the generation of those net operating losses. If the utilization of any of those losses are disallowed, a deferred tax asset may have to be reduced.
See
Note 13
, "
Income Taxes
" to the notes to our consolidated financial statements included in Part II, Item 8 of this Report.
Financial Instruments
We are exposed to a variety of market risks, including the effects of changes in interest rates and foreign currency exchange rates. We manage exposure to these market risks through regular operating and financing activities and, when deemed appropriate, through the use of financial instruments. Financial instruments are viewed as risk management tools and have not been used for speculative or trading purposes. In addition, financial instruments are entered into with a diversified group of major financial institutions in order to manage our exposure to counterparty nonperformance on such instruments. We account for all financial instruments in accordance with U.S. GAAP, which requires that they be recorded on the balance sheet as either assets or liabilities measured at their fair value. For financial instruments that are designated and qualify as hedging instruments, we designate the hedging instrument, based upon the exposure being hedged, as either a fair value hedge or a cash flow hedge. The effective portion of changes in fair value of financial instruments designated as cash flow hedging instruments is recorded as a component of other comprehensive income (loss). Amounts included in accumulated other comprehensive income (loss) for cash flow hedges are reclassified into earnings in the same period that the hedged item is recognized in earnings. The ineffective portion of changes in the fair value of financial instruments designated as cash flow hedges is recognized currently in earnings within the same line item as the hedged item, based upon the nature of the hedged item. For financial instruments that are not part of a qualified hedging relationship, the changes in their fair value are recognized currently in earnings.
42
HERC HOLDINGS INC. AND SUBSIDIARIES
Stock Based Compensation
For all periods presented prior to the Spin-Off, all stock-based compensation awards held by our employees were granted by Hertz Holdings, under various Hertz Holdings' sponsored plans, based on the common stock of Hertz Holdings. In connection with the Spin-Off, outstanding equity awards were adjusted and converted in accordance with a formula designed to preserve the intrinsic economic value of the original equity awards after taking into account the Spin-Off and the reverse stock split. All stock-based compensation award disclosures are measured in terms of common stock of Herc Holdings. The cost of employee services received in exchange for an award of equity instruments is based on the grant date fair value of the award. That cost is recognized over the period during which the employee is required to provide service in exchange for the award, referred to as the vesting period. In addition to the service vesting condition, the performance stock units had an additional vesting condition which called for the number of units that will be awarded based on achievement of a certain level of corporate EBITDA, or other performance measures as defined in the applicable award agreements, over the applicable measurement period.
We estimated the fair value of options issued at the date of grant using a Black-Scholes option-pricing model, which includes assumptions related to volatility, expected term, dividend yield and risk-free interest rate. These factors combined with the stock price on the date of grant result in a fixed expense which is recorded on a straight-line basis over the vesting period. The assumed volatility
was calculated based on a blend of peer group volatility and implied volatility as we do not have sufficient stock price data to calculate historical volatility.
The assumed dividend yield is zero. The risk-free interest rate is the implied zero-coupon yield for U.S. Treasury securities having a maturity approximately equal to the expected term of the options, as of the grant dates.
See
Note 12
, "
Stock-Based Compensation
" to the notes to our consolidated financial statements included in Part II, Item 8 of this Report.
RECENT ACCOUNTING PRONOUNCEMENTS
For a discussion of recent accounting pronouncements, see
Note 2
, "
Basis of Presentation and Recently Issued Accounting Pronouncements
" to the notes to our consolidated financial statements included in Part II, Item 8 of this Report.
RISK MANAGEMENT
For a discussion of additional risks arising from our operations, see Part I, Item 1A "Risk Factors" included in this Report.
Market Risk
We are exposed to a variety of market risks, including the effects of changes in interest rates (including credit spreads), foreign currency exchange rates and fluctuations in fuel prices. We manage our exposure to these market risks through our regular operating and financing activities and, when deemed appropriate, through the use of derivative financial instruments. Derivative financial instruments are viewed as risk management tools and have not been used for speculative or trading purposes. In addition, derivative financial instruments are entered into with a diversified group of major financial institutions in order to manage our exposure to counterparty nonperformance on such instruments.
Interest Rate Risk
We have assessed our exposure to changes in interest rates by analyzing the sensitivity to our earnings assuming various changes in market interest rates. Assuming a hypothetical increase of one percentage point in interest rates on our ABL Credit Facility and cash and cash equivalents as of
December 31, 2017
, our pre-tax earnings would decrease by an estimated
$10.9 million
over a 12-month period.
From time to time, we may enter into interest rate swap agreements to manage interest rate risk on our mix of fixed and floating rate debt. See
Note 17
, "
Financial Instruments
" to the notes to our consolidated financial statements included in Part II, Item 8 of this Report.
43
HERC HOLDINGS INC. AND SUBSIDIARIES
Consistent with the terms of certain agreements governing our debt obligations, we may decide to hedge a portion of the floating rate interest exposure under the ABL Credit Facility to provide protection in respect of such exposure.
Foreign Currency Risk
We have foreign currency exposure to exchange rate fluctuations, primarily with respect to the Canadian dollar, Euro, Chinese yuan and British pound.
We manage our foreign currency risk primarily by incurring, to the extent practicable, operating and financing expenses in the local currency in the countries in which we operate, including making fleet and equipment purchases and borrowing locally.
We also manage exposure to fluctuations in currency risk on cross currency intercompany loans we make to certain of our subsidiaries by entering into foreign currency forward contracts, when possible, which are intended to offset the impact of foreign currency movements on the underlying intercompany loan obligations.
We do not hedge our operating results against currency movement as they are primarily translational in nature. Using foreign currency forward rates as of
December 31, 2017
, each hypothetical one percentage point change in foreign currency movements would not have a significant impact on our revenue or earnings.
44
HERC HOLDINGS INC. AND SUBSIDIARIES
REPORT OF INDEPENDENT REGISTERED PUBLIC ACCOUNTING FIRM
To the Board of Directors
and Stockholders of
Herc Holdings Inc.
Opinions on the Financial Statements and Internal Control over Financial Reporting
We have audited the accompanying consolidated balance sheets of Herc Holdings Inc. and its subsidiaries
as of
December 31, 2017
and
2016
,
and the related consolidated statements of operations, comprehensive income (loss), changes in equity and cash flows for each of the three years in the period ended
December 31, 2017
, including the related notes and schedule of valuation and qualifying accounts for each of the three years in the period ended
December 31, 2017
appearing under Item 15(a)(2) (collectively referred to as the “consolidated financial statements”).
We also have audited the Company's internal control over financial reporting as of
December 31, 2017
, based on criteria established in
Internal Control - Integrated Framework
(2013)
issued by the Committee of Sponsoring Organizations of the Treadway Commission (COSO).
In our opinion, the consolidated financial statements referred to above present fairly, in all material respects, the financial position of the Company as of
December 31, 2017
and
2016
, and the results of their operations and their cash flows for each of the three years in the period ended
December 31, 2017
in conformity with accounting principles generally accepted in the United States of America. Also in our opinion, the Company did not maintain, in all material respects, effective internal control over financial reporting as of December 31, 2017, based on criteria established in
Internal Control - Integrated Framework
(2013)
issued by the COSO because
material weaknesses in internal control over financial reporting existed as of that date related to (i) risk assessment as the Company did not effectively design and maintain controls in response to the risks of material misstatement, (ii) ineffective design and maintenance of a control over earned but unbilled revenue (iii) ineffective design and maintenance of controls related to the occurrence of revenue for the rental of revenue earning equipment and (iv) accounting for income taxes. The risk assessment material weakness contributed to additional material weaknesses as the Company did not design and maintain effective controls over (v) certain business processes including their period-end financial reporting process; (vi) monitoring certain information technology systems that the Company outsources under a Transition Service Agreement (TSA), and (vii) information technology systems which were not part of a TSA relevant to the preparation of the consolidated financial statements.
A material weakness is a deficiency, or a combination of deficiencies, in internal control over financial reporting, such that there is a reasonable possibility that a material misstatement of the annual or interim financial statements will not be prevented or detected on a timely basis. The material weaknesses referred to above are described in Management’s Report on Internal Control Over Financial Reporting appearing under Item 9A. We considered these material weaknesses in determining the nature, timing, and extent of audit tests applied in our audit of the 2017 consolidated
financial statements, and our opinion regarding the effectiveness of the Company’s internal control over financial reporting does not affect our opinion on those consolidated
financial statements.
Basis for Opinions
The Company's management is responsible for these consolidated financial statements, for maintaining effective internal control over financial reporting, and for its assessment of the effectiveness of internal control over financial reporting included in management's report referred to above. Our responsibility is to express opinions on the Company’s consolidated
financial statements and on the Company's internal control over financial reporting based on our audits. We are a public accounting firm registered with the Public Company Accounting Oversight Board (United States) ("PCAOB") and are required to be independent with respect to the Company in accordance with the U.S. federal securities laws and the applicable rules and regulations of the Securities and Exchange Commission and the PCAOB.
We conducted our audits in accordance with the standards of the PCAOB. Those standards require that we plan and perform the audits to obtain reasonable assurance about whether the consolidated financial statements are free of material misstatement, whether due to error or fraud, and whether effective internal control over financial reporting was maintained in all material respects.
Our audits of the consolidated financial statements included performing procedures to assess the risks of material misstatement of the consolidated financial statements, whether due to error or fraud, and performing procedures that respond to those risks. Such procedures included examining, on a test basis, evidence regarding the amounts and disclosures in the consolidated financial statements. Our audits also included evaluating the accounting principles used and significant estimates made by management, as well as evaluating the overall presentation of the consolidated financial statements. Our audit of internal control over financial
45
HERC HOLDINGS INC. AND SUBSIDIARIES
reporting included obtaining an understanding of internal control over financial reporting, assessing the risk that a material weakness exists, and testing and evaluating the design and operating effectiveness of internal control based on the assessed risk. Our audits also included performing such other procedures as we considered necessary in the circumstances. We believe that our audits provide a reasonable basis for our opinions.
Definition and Limitations of Internal Control over Financial Reporting
A company’s internal control over financial reporting is a process designed to provide reasonable assurance regarding the reliability of financial reporting and the preparation of financial statements for external purposes in accordance with generally accepted accounting principles. A company’s internal control over financial reporting includes those policies and procedures that (i) pertain to the maintenance of records that, in reasonable detail, accurately and fairly reflect the transactions and dispositions of the assets of the company; (ii) provide reasonable assurance that transactions are recorded as necessary to permit preparation of financial statements in accordance with generally accepted accounting principles, and that receipts and expenditures of the company are being made only in accordance with authorizations of management and directors of the company; and (iii) provide reasonable assurance regarding prevention or timely detection of unauthorized acquisition, use, or disposition of the company’s assets that could have a material effect on the financial statements.
Because of its inherent limitations, internal control over financial reporting may not prevent or detect misstatements. Also, projections of any evaluation of effectiveness to future periods are subject to the risk that controls may become inadequate because of changes in conditions, or that the degree of compliance with the policies or procedures may deteriorate.
/s/ PricewaterhouseCoopers LLP
Certified Public Accountants
Tampa, Florida
February 28, 2018
We have served as the Company's auditor since 2013.
46
HERC HOLDINGS INC. AND SUBSIDIARIES
(In millions, except par value)
|
December 31,
2017 |
December 31, 2016
|
||||||
|
ASSETS
|
|
|
|||||
|
Cash and cash equivalents
|
$
|
41.5
|
|
$
|
24.0
|
|
|
|
Restricted cash and cash equivalents
|
—
|
|
7.0
|
|
|||
|
Receivables, net of allowance of $26.9 and $24.9, respectively
|
386.3
|
|
293.3
|
|
|||
|
Inventory
|
23.7
|
|
24.1
|
|
|||
|
Prepaid and other current assets
|
23.0
|
|
23.3
|
|
|||
|
Total current assets
|
474.5
|
|
371.7
|
|
|||
|
Revenue earning equipment, net
|
2,374.6
|
|
2,390.0
|
|
|||
|
Property and equipment, net
|
286.3
|
|
272.0
|
|
|||
|
Intangible assets, net
|
283.9
|
|
303.9
|
|
|||
|
Goodwill
|
91.0
|
|
91.0
|
|
|||
|
Other long-term assets
|
38.1
|
|
34.7
|
|
|||
|
Deferred tax assets
|
1.3
|
|
2.7
|
|
|||
|
Total assets
|
$
|
3,549.7
|
|
$
|
3,466.0
|
|
|
|
LIABILITIES AND EQUITY
|
|
|
|||||
|
Current maturities of long-term debt and financing obligations
|
$
|
25.4
|
|
$
|
15.7
|
|
|
|
Accounts payable
|
152.0
|
|
139.0
|
|
|||
|
Accrued liabilities
|
113.3
|
|
88.2
|
|
|||
|
Total current liabilities
|
290.7
|
|
242.9
|
|
|||
|
Long-term debt, net
|
2,137.1
|
|
2,178.6
|
|
|||
|
Financing obligations, net
|
112.9
|
|
—
|
|
|||
|
Deferred taxes
|
462.8
|
|
694.8
|
|
|||
|
Other long-term liabilities
|
35.8
|
|
32.0
|
|
|||
|
Total liabilities
|
3,039.3
|
|
3,148.3
|
|
|||
|
Commitments and contingencies (Note 16)
|
|
|
|||||
|
Equity:
|
|
|
|||||
|
Preferred stock, $0.01 par value, 13.3 shares authorized, no shares issued and outstanding
|
—
|
|
—
|
|
|||
|
Common stock, $0.01 par value, 133.3 shares authorized, 31.1 and 31.0 shares issued and 28.3 and 28.3 shares outstanding
|
0.3
|
|
0.3
|
|
|||
|
Additional paid-in capital
|
1,763.1
|
|
1,753.3
|
|
|||
|
Accumulated deficit
|
(462.4
|
)
|
(625.2
|
)
|
|||
|
Accumulated other comprehensive loss
|
(98.6
|
)
|
(118.7
|
)
|
|||
|
Treasury stock, at cost, 2.7 shares and 2.7 shares
|
(692.0
|
)
|
(692.0
|
)
|
|||
|
Total equity
|
510.4
|
|
317.7
|
|
|||
|
Total liabilities and equity
|
$
|
3,549.7
|
|
$
|
3,466.0
|
|
|
The accompanying notes are an integral part of these financial statements.
47
HERC HOLDINGS INC. AND SUBSIDIARIES
(In millions, except per share data)
|
Years Ended December 31,
|
|||||||||||
|
|
2017
|
2016
|
2015
|
||||||||
|
Revenues:
|
|||||||||||
|
Equipment rental
|
$
|
1,499.0
|
|
$
|
1,352.7
|
|
$
|
1,411.7
|
|
||
|
Sales of revenue earning equipment
|
190.8
|
|
122.5
|
|
161.2
|
|
|||||
|
Sales of new equipment, parts and supplies
|
52.3
|
|
68.2
|
|
92.1
|
|
|||||
|
Service and other revenue
|
12.4
|
|
11.4
|
|
13.2
|
|
|||||
|
Total revenues
|
1,754.5
|
|
1,554.8
|
|
1,678.2
|
|
|||||
|
Expenses:
|
|||||||||||
|
Direct operating
|
721.6
|
|
655.2
|
|
713.4
|
|
|||||
|
Depreciation of revenue earning equipment
|
378.9
|
|
350.5
|
|
343.7
|
|
|||||
|
Cost of sales of revenue earning equipment
|
192.0
|
|
144.0
|
|
146.8
|
|
|||||
|
Cost of sales of new equipment, parts and supplies
|
39.5
|
|
53.0
|
|
73.0
|
|
|||||
|
Selling, general and administrative
|
320.6
|
|
275.2
|
|
267.6
|
|
|||||
|
Impairment
|
29.7
|
|
—
|
|
—
|
|
|||||
|
Interest expense, net
|
140.0
|
|
84.2
|
|
32.9
|
|
|||||
|
Other income, net
|
(3.4
|
)
|
(2.4
|
)
|
(56.1
|
)
|
|||||
|
Total expenses
|
1,818.9
|
|
1,559.7
|
|
1,521.3
|
|
|||||
|
Income (loss) before income taxes
|
(64.4
|
)
|
(4.9
|
)
|
156.9
|
|
|||||
|
Income tax benefit (provision)
|
224.7
|
|
(14.8
|
)
|
(45.6
|
)
|
|||||
|
Net income (loss)
|
$
|
160.3
|
|
$
|
(19.7
|
)
|
$
|
111.3
|
|
||
|
Weighted average shares outstanding:
|
|||||||||||
|
Basic
|
28.3
|
|
28.3
|
|
30.2
|
|
|||||
|
Diluted
|
28.6
|
|
28.3
|
|
30.2
|
|
|||||
|
Income (loss) per share:
|
|||||||||||
|
Basic
|
$
|
5.66
|
|
$
|
(0.70
|
)
|
$
|
3.69
|
|
||
|
Diluted
|
$
|
5.60
|
|
$
|
(0.70
|
)
|
$
|
3.69
|
|
||
The accompanying notes are an integral part of these financial statements.
48
HERC HOLDINGS INC. AND SUBSIDIARIES
CONSOLIDATED STATEMENTS OF COMPREHENSIVE INCOME (LOSS)
(In millions)
|
|
Years Ended December 31,
|
||||||||||
|
2017
|
2016
|
2015
|
|||||||||
|
Net income (loss)
|
$
|
160.3
|
|
$
|
(19.7
|
)
|
$
|
111.3
|
|
||
|
Other comprehensive income (loss):
|
|||||||||||
|
Foreign currency translation adjustments
|
17.7
|
|
15.8
|
|
(56.8
|
)
|
|||||
|
Reclassification of foreign currency items to other income, net
|
—
|
|
—
|
|
(41.6
|
)
|
|||||
|
Unrealized gains on hedging instruments:
|
|||||||||||
|
Unrealized gains on hedging instruments
|
2.1
|
|
—
|
|
—
|
|
|||||
|
Income tax provision related to hedging instruments
|
(0.8
|
)
|
—
|
|
—
|
|
|||||
|
Pension and postretirement benefit liability adjustments:
|
|||||||||||
|
Amortization of net losses and settlement losses included in net periodic pension cost
|
2.3
|
|
1.4
|
|
0.5
|
|
|||||
|
Pension and postretirement benefit liability adjustments arising during the period
|
—
|
|
0.1
|
|
(8.1
|
)
|
|||||
|
Income tax benefit (provision) related to pension and postretirement plans
|
(1.2
|
)
|
(0.6
|
)
|
2.9
|
|
|||||
|
Total other comprehensive income (loss)
|
20.1
|
|
16.7
|
|
(103.1
|
)
|
|||||
|
Total comprehensive income (loss)
|
$
|
180.4
|
|
$
|
(3.0
|
)
|
$
|
8.2
|
|
||
The accompanying notes are an integral part of these financial statements.
49
HERC HOLDINGS INC. AND SUBSIDIARIES
CONSOLIDATED STATEMENTS OF CHANGES IN EQUITY
(In millions)
|
Common Stock
|
Additional
Paid-In Capital |
Retained Earnings (Accumulated
Deficit) |
Accumulated
Other Comprehensive Income (Loss) |
Treasury Stock
|
Total
Equity |
|||||||||||||||||||||
|
Balance at:
|
Shares
|
Amount
|
||||||||||||||||||||||||
|
December 31, 2014
|
30.6
|
|
$
|
0.3
|
|
$
|
2,530.0
|
|
$
|
(716.8
|
)
|
$
|
(32.3
|
)
|
$
|
(87.5
|
)
|
$
|
1,693.7
|
|
||||||
|
Net income
|
—
|
|
—
|
|
—
|
|
111.3
|
|
—
|
|
—
|
|
111.3
|
|
||||||||||||
|
Other comprehensive loss
|
—
|
|
—
|
|
—
|
|
—
|
|
(103.1
|
)
|
—
|
|
(103.1
|
)
|
||||||||||||
|
Net settlement on vesting of equity awards
|
0.1
|
|
—
|
|
(5.0
|
)
|
—
|
|
—
|
|
—
|
|
(5.0
|
)
|
||||||||||||
|
Stock-based compensation charges
|
—
|
|
—
|
|
2.7
|
|
—
|
|
—
|
|
—
|
|
2.7
|
|
||||||||||||
|
Exercise of stock options
|
—
|
|
—
|
|
5.1
|
|
—
|
|
—
|
|
—
|
|
5.1
|
|
||||||||||||
|
Share repurchase
|
(2.5
|
)
|
—
|
|
—
|
|
—
|
|
—
|
|
(604.5
|
)
|
(604.5
|
)
|
||||||||||||
|
Capital contributions from affiliates
|
—
|
|
—
|
|
198.8
|
|
—
|
|
—
|
|
—
|
|
198.8
|
|
||||||||||||
|
Net transfers from THC
|
—
|
|
—
|
|
1,003.0
|
|
—
|
|
—
|
|
—
|
|
1,003.0
|
|
||||||||||||
|
December 31, 2015
|
28.2
|
|
0.3
|
|
3,734.6
|
|
(605.5
|
)
|
(135.4
|
)
|
(692.0
|
)
|
2,302.0
|
|
||||||||||||
|
Net loss
|
—
|
|
—
|
|
—
|
|
(19.7
|
)
|
—
|
|
—
|
|
(19.7
|
)
|
||||||||||||
|
Other comprehensive income
|
—
|
|
—
|
|
—
|
|
—
|
|
16.7
|
|
—
|
|
16.7
|
|
||||||||||||
|
Net settlement on vesting of equity awards
|
—
|
|
—
|
|
(0.5
|
)
|
—
|
|
—
|
|
—
|
|
(0.5
|
)
|
||||||||||||
|
Stock-based compensation charges
|
—
|
|
—
|
|
5.5
|
|
—
|
|
—
|
|
—
|
|
5.5
|
|
||||||||||||
|
Exercise of stock options and other
|
0.1
|
|
—
|
|
10.0
|
|
—
|
|
—
|
|
—
|
|
10.0
|
|
||||||||||||
|
Distribution and net transfers to THC
|
—
|
|
—
|
|
(1,996.3
|
)
|
—
|
|
—
|
|
—
|
|
(1,996.3
|
)
|
||||||||||||
|
December 31, 2016
|
28.3
|
|
0.3
|
|
1,753.3
|
|
(625.2
|
)
|
(118.7
|
)
|
(692.0
|
)
|
317.7
|
|
||||||||||||
|
Net income
|
—
|
|
—
|
|
—
|
|
160.3
|
|
—
|
|
—
|
|
160.3
|
|
||||||||||||
|
Other comprehensive income
|
—
|
|
—
|
|
—
|
|
—
|
|
20.1
|
|
—
|
|
20.1
|
|
||||||||||||
|
Cumulative effect of a change in accounting for stock-based payments (Note 2)
|
—
|
|
—
|
|
—
|
|
2.5
|
|
—
|
|
—
|
|
2.5
|
|
||||||||||||
|
Net settlement on vesting of equity awards
|
—
|
|
—
|
|
(0.1
|
)
|
—
|
|
—
|
|
—
|
|
(0.1
|
)
|
||||||||||||
|
Stock-based compensation charges
|
—
|
|
—
|
|
10.1
|
|
—
|
|
—
|
|
—
|
|
10.1
|
|
||||||||||||
|
Employee stock purchase plan
|
—
|
|
—
|
|
1.1
|
|
—
|
|
—
|
|
—
|
|
1.1
|
|
||||||||||||
|
Exercise of stock options
|
—
|
|
—
|
|
0.7
|
|
—
|
|
—
|
|
—
|
|
0.7
|
|
||||||||||||
|
Net transfers with THC
|
—
|
|
—
|
|
(2.0
|
)
|
—
|
|
—
|
|
—
|
|
(2.0
|
)
|
||||||||||||
|
December 31, 2017
|
28.3
|
|
$
|
0.3
|
|
$
|
1,763.1
|
|
$
|
(462.4
|
)
|
$
|
(98.6
|
)
|
$
|
(692.0
|
)
|
$
|
510.4
|
|
||||||
The accompanying notes are an integral part of these financial statements.
50
HERC HOLDINGS INC. AND SUBSIDIARIES
(In millions)
|
Years Ended December 31,
|
|||||||||||
|
|
2017
|
2016
|
2015
|
||||||||
|
Cash flows from operating activities:
|
|||||||||||
|
Net income (loss)
|
$
|
160.3
|
|
$
|
(19.7
|
)
|
$
|
111.3
|
|
||
|
Adjustments to reconcile net income (loss) to net cash provided by operating activities:
|
|
||||||||||
|
Depreciation of revenue earning equipment
|
378.9
|
|
350.5
|
|
343.7
|
|
|||||
|
Depreciation of property and equipment
|
46.8
|
|
39.7
|
|
39.6
|
|
|||||
|
Amortization of intangible assets
|
4.7
|
|
5.1
|
|
37.6
|
|
|||||
|
Amortization of deferred debt and financing obligations costs
|
6.4
|
|
5.6
|
|
4.5
|
|
|||||
|
Stock-based compensation charges
|
10.1
|
|
5.5
|
|
2.7
|
|
|||||
|
Gain on disposal of business
|
—
|
|
—
|
|
(50.9
|
)
|
|||||
|
Impairment
|
29.7
|
|
—
|
|
—
|
|
|||||
|
Provision for receivables allowance
|
52.4
|
|
44.4
|
|
42.8
|
|
|||||
|
Deferred taxes
|
(228.4
|
)
|
12.3
|
|
22.3
|
|
|||||
|
Loss (gain) on sale of revenue earning equipment
|
1.2
|
|
21.5
|
|
(14.4
|
)
|
|||||
|
Income from joint ventures
|
(1.9
|
)
|
(2.3
|
)
|
(4.1
|
)
|
|||||
|
Other
|
5.8
|
|
8.6
|
|
9.3
|
|
|||||
|
Changes in assets and liabilities:
|
|||||||||||
|
Receivables
|
(131.6
|
)
|
(59.2
|
)
|
(20.1
|
)
|
|||||
|
Inventory, prepaid and other assets
|
(2.1
|
)
|
(19.0
|
)
|
(18.5
|
)
|
|||||
|
Accounts payable
|
(10.0
|
)
|
9.2
|
|
(5.2
|
)
|
|||||
|
Accrued liabilities and other long-term liabilities
|
19.4
|
|
31.2
|
|
(4.3
|
)
|
|||||
|
Net cash provided by operating activities
|
341.7
|
|
433.4
|
|
496.3
|
|
|||||
|
Cash flows from investing activities:
|
|
||||||||||
|
Net change in restricted cash and cash equivalents
|
7.0
|
|
—
|
|
3.2
|
|
|||||
|
Revenue earning equipment expenditures
|
(501.4
|
)
|
(468.3
|
)
|
(600.0
|
)
|
|||||
|
Proceeds from disposal of revenue earning equipment
|
160.1
|
|
115.4
|
|
151.9
|
|
|||||
|
Non-rental capital expenditures
|
(74.6
|
)
|
(47.8
|
)
|
(76.9
|
)
|
|||||
|
Proceeds from disposal of property and equipment
|
5.9
|
|
5.7
|
|
6.0
|
|
|||||
|
Proceeds from disposal of business
|
—
|
|
—
|
|
126.4
|
|
|||||
|
Other investing activities
|
—
|
|
—
|
|
(0.5
|
)
|
|||||
|
Net cash used in investing activities
|
(403.0
|
)
|
(395.0
|
)
|
(389.9
|
)
|
|||||
The accompanying notes are an integral part of these financial statements.
51
HERC HOLDINGS INC. AND SUBSIDIARIES
CONSOLIDATED STATEMENTS OF CASH FLOWS (Continued)
(In millions)
|
Years Ended December 31,
|
|||||||||||
|
|
2017
|
2016
|
2015
|
||||||||
|
Cash flows from financing activities:
|
|
||||||||||
|
Proceeds from issuance of long-term debt
|
—
|
|
1,235.0
|
|
—
|
|
|||||
|
Repayments of long-term debt
|
(247.0
|
)
|
—
|
|
—
|
|
|||||
|
Proceeds from revolving lines of credit
|
561.9
|
|
1,791.0
|
|
1,865.0
|
|
|||||
|
Repayments on revolving lines of credit
|
(339.2
|
)
|
(881.0
|
)
|
(2,208.6
|
)
|
|||||
|
Proceeds from financing obligations
|
119.5
|
|
—
|
|
—
|
|
|||||
|
Principal payments under capital lease and financing obligations
|
(16.7
|
)
|
(12.4
|
)
|
(10.0
|
)
|
|||||
|
Proceeds from exercise of stock options and other
|
0.7
|
|
10.0
|
|
5.1
|
|
|||||
|
Net settlement on vesting of equity awards
|
(0.1
|
)
|
(0.5
|
)
|
(5.0
|
)
|
|||||
|
Proceeds from employee stock purchase plan
|
1.1
|
|
—
|
|
—
|
|
|||||
|
Purchase of treasury stock
|
—
|
|
—
|
|
(604.5
|
)
|
|||||
|
Capital contributions from affiliates
|
—
|
|
—
|
|
198.8
|
|
|||||
|
Distributions and net transfers to THC
|
—
|
|
(2,071.9
|
)
|
1,003.0
|
|
|||||
|
Net financing activities with affiliates
|
—
|
|
(67.4
|
)
|
(349.2
|
)
|
|||||
|
Payment of financing obligations and debt financing costs
|
(2.7
|
)
|
(41.5
|
)
|
—
|
|
|||||
|
Net cash provided by (used in) financing activities
|
77.5
|
|
(38.7
|
)
|
(105.4
|
)
|
|||||
|
Effect of foreign exchange rate changes on cash and cash equivalents
|
1.3
|
|
(0.4
|
)
|
(4.3
|
)
|
|||||
|
Net increase (decrease) in cash and cash equivalents during the period
|
17.5
|
|
(0.7
|
)
|
(3.3
|
)
|
|||||
|
Cash and cash equivalents at beginning of period
|
24.0
|
|
24.7
|
|
28.0
|
|
|||||
|
Cash and cash equivalents at end of period
|
$
|
41.5
|
|
$
|
24.0
|
|
$
|
24.7
|
|
||
|
Supplemental disclosures of cash flow information:
|
|||||||||||
|
Cash paid for interest
|
$
|
131.7
|
|
$
|
70.7
|
|
$
|
27.7
|
|
||
|
Cash paid (refunded) for income taxes, net
|
$
|
(5.5
|
)
|
$
|
2.9
|
|
$
|
10.1
|
|
||
|
Supplemental disclosures of non-cash investing activity:
|
|||||||||||
|
Purchases of revenue earning equipment in accounts payable
|
$
|
22.8
|
|
$
|
15.1
|
|
$
|
—
|
|
||
|
Disposals of revenue earning equipment in accounts receivable
|
$
|
12.6
|
|
$
|
—
|
|
$
|
—
|
|
||
|
Non-rental capital expenditures in accounts payable
|
$
|
—
|
|
$
|
7.8
|
|
$
|
—
|
|
||
|
Supplemental disclosures of non-cash financing activity:
|
|||||||||||
|
Non-cash settlement of transactions with THC through equity
|
$
|
2.0
|
|
$
|
75.6
|
|
$
|
—
|
|
||
|
Supplemental disclosures of non-cash investing and financing activity:
|
|||||||||||
|
Equipment acquired through capital lease
|
$
|
0.4
|
|
$
|
20.3
|
|
$
|
—
|
|
||
The accompanying notes are an integral part of these financial statements.
52
Note 1
—
Background
Herc Holdings Inc. ("Herc Holdings" or the "Company") is one of the leading equipment rental suppliers with approximately
275
locations as of
December 31, 2017
, principally in North America. The Company conducts substantially all of its operations through subsidiaries, including Herc Rentals Inc. ("Herc"). Operations are conducted under the Herc Rentals brand in the United States and under the Hertz Equipment Rental brand in Canada and other international locations. With over 50 years of experience, we are a full-line equipment rental supplier offering a broad portfolio of equipment for rent. In addition to our principal business of equipment rental, we sell used equipment and contractor supplies such as construction consumables, tools, small equipment and safety supplies; provide repair, maintenance, equipment management services and safety training to certain of our customers; offer equipment re-rental services and provide on-site support to our customers; and provide ancillary services such as equipment transport, rental protection, cleaning, refueling and labor.
Our classic fleet includes aerial, earthmoving, material handling, trucks and trailers, air compressors, compaction and lighting. Our equipment rental business is supported by ProSolutions
TM
our industry-specific solutions-based services which includes pumping solutions, power generation, climate control, remediation and restoration, and studio and production equipment, and our ProContractor professional grade tools.
On
June 30, 2016
, the Company, in its previous form as the holding company of both the existing equipment rental operations as well as the former vehicle rental operations (in its form prior to the Spin-Off, "Hertz Holdings"), completed a spin-off (the "Spin-Off") of its global vehicle rental business through a dividend to stockholders of all of the issued and outstanding common stock of Hertz Rental Car Holding Company, Inc., which was re-named Hertz Global Holdings, Inc. ("New Hertz"). New Hertz is an independent public company that trades on the New York Stock Exchange under the symbol "HTZ" and continues to operate its global vehicle rental business through its operating subsidiaries including The Hertz Corporation ("THC"). The Company changed its name to Herc Holdings Inc. on
June 30, 2016
, and trades on the New York Stock Exchange under the symbol "HRI." The Company continues to operate its global equipment rental business through its operating subsidiaries, including Herc.
For accounting purposes, due to the relative significance of New Hertz to Hertz Holdings, New Hertz was considered the spinnor or divesting entity in the Spin-Off and Herc Holdings was considered the spinnee or divested entity. As a result, despite the legal form of the transaction, New Hertz was the "accounting successor" to Hertz Holdings. Under the accounting rules, the historical financial information of New Hertz is required to reflect the financial information of Hertz Holdings, as if New Hertz spun off Herc Holdings in the Spin-Off. In contrast, the historical financial information of Herc Holdings, for the year ended
December 31, 2015
and the first half of 2016, reflects the financial information of the equipment rental business and certain parent legal entities of Herc as historically operated as part of Hertz Holdings, as if Herc Holdings was a stand-alone company for such periods. The historical financial information of Herc Holdings presented in these consolidated financial statements is not necessarily indicative of what Herc Holdings’ financial position or results of operations actually would have been had Herc Holdings operated as a separate, independent company for all periods presented.
These consolidated financial statements consist of Herc Holdings, the top level holding company with no material assets or stand-alone operations, and Herc and its consolidated subsidiaries.
Note 2
—
Basis of Presentation and Recently Issued Accounting Pronouncements
Basis of Presentation
The Company prepares its consolidated financial statements in conformity with accounting principles generally accepted in the United States of America ("U.S. GAAP"). The preparation of financial statements in conformity with U.S. GAAP requires management to make estimates and assumptions that affect the amounts reported in the financial statements and footnotes. Actual results could differ materially from those estimates.
Significant estimates inherent in the preparation of the consolidated financial statements include depreciation of revenue earning equipment, pension and postretirement benefits, the recoverability of long-lived assets, useful lives and impairment of long-lived tangible and intangible assets including goodwill and trade name, accounting for income taxes, valuation of stock-based
53
HERC HOLDINGS INC. AND SUBSIDIARIES
NOTES TO CONSOLIDATED FINANCIAL STATEMENTS (Continued)
compensation, reserves for litigation and other contingencies, allowances for receivables and, prior to the Spin-Off, allocated general corporate expenses from THC, among others.
Since the Spin-Off occurred on
June 30, 2016
, the consolidated financial statements included in this Annual Report on Form 10-K for the year ended December 31, 2017 (this "Report") represent the carve-out financial results for the first six months of 2016, including Spin-Off impacts, and the actual results for the last six months of 2016 and all of 2017. Amounts included for the year ended
December 31, 2015
represent carve-out financial results.
Principles of Consolidation
The consolidated financial statements include the accounts of Herc Holdings and its wholly owned subsidiaries. In the event that the Company is a primary beneficiary of a variable interest entity, the assets, liabilities and results of operations of the variable interest entity are included in the Company's consolidated financial statements. The Company accounts for its investments in joint ventures using the equity method when it has significant influence but not control and is not the primary beneficiary. All significant intercompany transactions have been eliminated in consolidation.
Transactions between the Company and THC and its affiliates prior to the Spin-Off are herein referred to as "related party" or "affiliated" transactions. Effective with the Spin-Off on
June 30, 2016
, all then-existing transactions with THC and its affiliates were settled and paid in full. Effective upon the Spin-Off, the Company entered into certain agreements with New Hertz, including a transition services agreement ("TSA"). See
Note 21
, "
Arrangements with New Hertz
" for further information.
For periods prior to the Spin-Off, the consolidated financial statements include net interest expense on loans receivable and payable to affiliates and expense allocations for certain corporate functions historically performed by THC, including, but not limited to, general corporate expenses related to finance, legal, information technology, human resources, communications, employee benefits and incentives, insurance and stock-based compensation. These expenses were allocated to the Company on the basis of direct usage when identifiable, with the remainder allocated on the basis of revenues, operating expenses, headcount or other relevant measures. Management believes the assumptions underlying the consolidated financial statements, including the assumptions regarding the allocation of corporate expenses from THC, are reasonable. Nevertheless, the consolidated financial statements may not include all of the expenses that would have been incurred had the Company been a stand-alone company during the periods presented and may not reflect the Company's consolidated financial position, results of operations and cash flows had the Company been a stand-alone company during the periods presented. Actual costs that would have been incurred if the Company had been a stand-alone company would have depended on multiple factors, including organizational structure and strategic decisions made in various areas, including information technology and infrastructure. For additional information related to costs allocated to the Company by THC prior to the Spin-Off, see
Note 20
, "
Related Party Transactions
."
Stock Split
On
June 30, 2016
, the Company effected a
1-for-15
reverse stock split. The reverse stock split reduced the number of authorized shares of common stock and preferred stock to
133.3 million
and
13.3 million
, respectively. All share data and per share amounts have been retroactively adjusted for the reverse stock split in the accompanying consolidated financial statements and notes thereto for all periods presented. The retroactive adjustments resulted in the reclassification of
$4.3 million
from common stock to additional paid-in capital on the consolidated statements of changes in equity at December 31, 2015 and December 31, 2014.
Reclassification of Prior Period Presentation
Certain prior period amounts have been reclassified for consistency with the current period presentation. These reclassifications had no effect on the reported consolidated balance sheets, results of operations, equity or cash flows for any period presented.
Correction of Errors
During the first quarter of 2017, the Company identified an error related to its classification of certain restricted cash. Accordingly, the Company revised its consolidated balance sheet as of
December 31, 2016
to correct the classification of
$12.4 million
from restricted cash to cash and cash equivalents as the cash was determined to be available for use in general operations. This correction impacted the consolidated statements of cash flows for the year ended
December 31, 2016
by decreasing cash used in investing activities by
$3.4 million
and increasing cash and cash equivalents at the beginning and end of the period by
$9.0 million
and
54
HERC HOLDINGS INC. AND SUBSIDIARIES
NOTES TO CONSOLIDATED FINANCIAL STATEMENTS (Continued)
$12.4 million
, respectively. In addition, the Company corrected the classification of
$9.0 million
from restricted cash to cash and cash equivalents as of
December 31, 2015
which impacted the consolidated statement of cash flows for the year ended
December 31, 2015
by increasing cash used in investing activities by
$0.1 million
and increasing cash and cash equivalents at the beginning and end of the period by
$9.1 million
and
$9.0 million
, respectively. The Company assessed the materiality of the error from qualitative and quantitative perspectives and concluded the adjustments were not material to its previously issued annual and interim financial statements. There was no impact of this error on the consolidated statements of operations, consolidated statements of other comprehensive income (loss) or consolidated statement of equity for any period, including those presented in this Report.
Cash and Cash Equivalents
Cash and cash equivalents include cash on hand and highly liquid investments with an original maturity of three months or less.
Restricted Cash and Cash Equivalents
Restricted cash and cash equivalents includes cash and cash equivalents that are not readily available for the Company's normal disbursements. Historically, restricted cash and cash equivalents were restricted for the purchase of revenue earning equipment under the Company's Like-Kind Exchange Program ("LKE Program"). As a result of the Tax Cuts and Jobs Act of 2017 (the "2017 Tax Act"), the Company ceased its LKE Program and therefore reflects zero restricted cash as of
December 31, 2017
. See "Income Taxes" below for additional information related to the LKE Program.
Concentration of Credit Risk
The Company's cash and cash equivalents are held in checking accounts, various investment grade institutional money market accounts or bank term deposits. Deposits held at banks may exceed the amount of insurance provided on such deposits. Generally, these deposits may be redeemed upon demand and are maintained with financial institutions with reputable credit and therefore bear minimal credit risk. The Company seeks to mitigate such risks by spreading the risk across multiple counterparties and monitoring the risk profiles of these counterparties. In addition, the Company has credit risk from financial instruments used in hedging activities. The Company limits its exposure relating to financial instruments by diversifying the financial instruments among various counterparties, which consist of major financial institutions.
No single customer accounted for more than
3%
of the Company’s equipment rental revenue during the years ended
December 31, 2017
,
2016
and
2015
. As of
December 31, 2017
and
2016
, no single customer accounted for more than
3%
of accounts receivable.
Receivables
Receivables are stated net of allowances and represent credit extended to customers and manufacturers that satisfy defined credit criteria. The estimate of the allowance for doubtful accounts is based on the Company's historical experience and its judgment as to the likelihood of ultimate collection. Actual receivables are written-off against the allowance for doubtful accounts when the Company determines the balance will not be collected. Estimates for future credit memos are based on historical experience and are reflected as reductions to revenue, while the provision for bad debt is reflected as a component of "Selling, general and administrative expenses" in the Company's consolidated statements of operations.
Inventory
Inventory is comprised of finished goods and consists of new equipment, supplies, tools, parts, fuel and related supply items. Inventory is stated at the lower of cost and net realizable value. Cost is determined by inventory type on the average cost method.
Revenue Earning Equipment
Revenue earning equipment is stated at cost, net of related discounts, with holding periods ranging from
two
to
15
years. Generally, when revenue earning equipment is acquired, the Company estimates the period that it will hold the asset, primarily based on historical measures of the amount of rental activity (e.g. equipment usage) and the targeted age of equipment at the time of disposal. The Company also estimates the residual value of the applicable revenue earning equipment at the expected time of disposal. The residual value for rental equipment is affected by factors which include equipment age and amount of usage. Depreciation is recorded over the estimated holding period. Depreciation rates are reviewed on a quarterly basis based on management's ongoing
55
HERC HOLDINGS INC. AND SUBSIDIARIES
NOTES TO CONSOLIDATED FINANCIAL STATEMENTS (Continued)
assessment of present and estimated future market conditions, their effect on residual values at the time of disposal and the estimated holding periods. Market conditions for used equipment sales can also be affected by external factors such as the economy, natural disasters, fuel prices, supply of similar used equipment, the market price for similar new equipment and incentives offered by manufacturers of new equipment. These key factors are considered when estimating future residual values and assessing depreciation rates. As a result of this ongoing assessment, the Company makes periodic adjustments to depreciation rates of revenue earning equipment in response to changed market conditions. For certain equipment at or nearing the end of its useful life, the Company considers the option of refurbishing the equipment as an alternative to replacing it based upon the economics of each alternative. Refurbishment costs that extend the useful life of the asset are capitalized and amortized over the remaining useful life of the asset.
Property and Equipment
Property and equipment are stated at cost and are depreciated utilizing the straight-line method over the estimated useful lives of the related assets. Leasehold improvements are amortized over the estimated useful lives of the related assets or leases, whichever is shorter.
Useful lives are as follows:
|
Buildings
|
8 to 33 years
|
|
Service vehicles
|
3 to 13 years
|
|
Machinery and equipment
|
1 to 15 years
|
|
Computer equipment
|
1 to 5 years
|
|
Furniture and fixtures
|
2 to 10 years
|
|
Leasehold improvements
|
The lesser of the economic life or the lease term
|
The Company follows the practice of charging routine maintenance and repairs, including the cost of minor replacements, to maintenance expense. Costs of major replacements are capitalized and depreciated.
Leases
The Company leases certain property and equipment used in operations.
If the lease is considered an operating lease, it is not recorded on the balance sheet and rent expense is recognized on a straight-line basis over the expected lease term.
Certain property and equipment are held under capital leases. These assets are included in property and equipment and depreciated over the term of the lease. Rent expense is not recognized for a capital lease. Rather, rental payments under the lease are recognized as a reduction of the capital lease obligation and interest expense.
In certain instances, the Company may sell property and enter into an arrangement to lease the property back from the landlord. In these instances, the Company performs a sale-leaseback analysis to determine if the assets can be removed from the balance sheet. If certain criteria are met, the Company recognizes the transaction as a sale, removes the assets from its balance sheet and reflects the future rental payments as rent expense. If the criteria for sale is not met, such as available repurchase options or continuing involvement with the property, the Company is considered the owner for accounting purposes. In these instances, the Company is precluded from derecognizing the assets from its balance sheet and will continue to depreciate the assets over the expected lease term. In conjunction with these arrangements, the Company records a financing obligation equal to the cash proceeds or fair market value of the assets received from the landlord. Rent payments for these properties are recognized as interest expense and a reduction of the financing obligation using the effective interest method. At the end of the lease term, including exercise of any renewal options, the net remaining financing obligation over the net carrying value of the fixed asset will be recognized as a non-cash gain on sale of the property.
Public Liability and Property Damage
The obligation for public liability and property damage on self-insured U.S. and international equipment represents an estimate
56
HERC HOLDINGS INC. AND SUBSIDIARIES
NOTES TO CONSOLIDATED FINANCIAL STATEMENTS (Continued)
for both reported accident claims not yet paid, and claims incurred but not yet reported. The related liabilities are recorded on a non-discounted basis. Reserve requirements are based on actuarial evaluations of historical accident claim experience and trends, as well as future projections of ultimate losses, expenses, premiums and administrative costs. The adequacy of the liability is regularly monitored based on evolving accident claim history and insurance-related state legislation changes. If the Company's estimates change or if actual results differ from these assumptions, the amount of the recorded liability is adjusted to reflect these results.
Defined Benefit Pension Plans and Other Employee Benefits
The Company's employee pension costs and obligations are developed from actuarial valuations. Inherent in these valuations are key assumptions, including discount rates, salary growth, long-term return on plan assets, retirement rates, mortality rates and other factors. The selection of assumptions is based on historical trends and known economic and market conditions at the time of valuation, as well as independent studies of trends performed by actuaries. However, actual results may differ substantially from the estimates that were based on the critical assumptions. The Company uses a December 31 measurement date for all of the plans.
Actual results that differ from the Company's assumptions are accumulated and amortized over future periods and, therefore, generally affect its recognized expense in such future periods. While management believes that the assumptions used are appropriate, significant differences in actual experience or significant changes in assumptions would affect the Company's pension costs and obligations.
The Company maintains reserves for employee medical claims, up to its insurance stop-loss limit, and workers' compensation claims. These are regularly evaluated and revised, as needed, based on a variety of information, including historical experience, actuarial estimates and current employee statistics.
Foreign Currency Translation and Transactions
Assets and liabilities of international subsidiaries whose functional currency is the local currency are translated at the rate of exchange in effect on the balance sheet date; income and expenses are translated at the average exchange rates throughout the year. The related translation adjustments are reflected in “Accumulated other comprehensive income (loss)” in the equity section of the Company's consolidated balance sheets. Foreign currency gains and losses resulting from transactions are included in earnings.
Financial Instruments
The Company is exposed to a variety of market risks, including the effects of changes in interest rates and foreign currency exchange rates. The Company manages exposure to these market risks through ongoing processes to monitor the impact of market changes and, when deemed appropriate, through the use of financial instruments. Financial instruments are viewed as risk management tools and have not been used for speculative or trading purposes. The Company accounts for all derivatives in accordance with U.S. GAAP, which requires that they be recorded on the balance sheet as either assets or liabilities measured at their fair value. For financial instruments that are designated and qualify as hedging instruments, the Company designates the hedging instrument, based upon the exposure being hedged, as either a fair value hedge or a cash flow hedge. The effective portion of changes in fair value of financial instruments designated as cash flow hedging instruments is recorded as a component of other comprehensive income (loss). Amounts included in accumulated other comprehensive income (loss) for cash flow hedges are reclassified into earnings in the same period that the hedged item is recognized in earnings. The ineffective portion of changes in the fair value of financial instruments designated as cash flow hedges is recognized currently in earnings within the same line item as the hedged item, based upon the nature of the hedged item. For financial instruments that are not part of a qualified hedging relationship, the changes in their fair value are recognized currently in earnings.
Goodwill and Indefinite-Lived Intangible Assets
On an annual basis and at interim periods when circumstances require, the Company tests the recoverability of its goodwill. The Company has
one
reporting unit and compares the carrying value of its reporting unit to its fair value. If the carrying value of the reporting unit is greater than its fair value, the Company recognizes an impairment charge for the amount equal to that excess. The fair value of the reporting unit is estimated using a combination of an income approach on the present value of estimated future cash flows and a market approach based on published earnings multiples of comparable entities with similar operations and
57
HERC HOLDINGS INC. AND SUBSIDIARIES
NOTES TO CONSOLIDATED FINANCIAL STATEMENTS (Continued)
economic characteristics as well as acquisition multiples paid in recent transactions. The Company’s discounted cash flows are based upon reasonable and appropriate assumptions, which are weighted for their likely probability of occurrence, about the underlying business activities of the Company.
Indefinite-lived intangible assets, primarily our trade name, are not amortized but are evaluated annually for impairment and whenever events or changes in circumstances indicate that the carrying amount of this asset may exceed its fair value. If the carrying value of an indefinite-lived intangible asset exceeds its fair value, an impairment charge is recognized in an amount equal to that excess.
Finite-Lived Intangible and Long-Lived Assets
Intangible assets include customer relationships and technology. Intangible assets with finite lives are amortized using the straight-line method over the estimated economic lives of the assets, which range from
three
to
10
years. Long-lived assets, including intangible assets with finite lives, are reviewed for impairment whenever events or changes in circumstances indicate that the carrying amount of such assets may not be recoverable. Determination of recoverability is based on an estimate of undiscounted future cash flows resulting from the use of the asset and its eventual disposition. Measurement of an impairment loss for long-lived assets that management expects to hold and use is based on the estimated fair value of the asset. Long-lived assets to be disposed of are reported at the lower of carrying amount or estimated fair value less costs to sell.
Revenue Recognition
On January 1, 2018, the guidance in Accounting Standards Codification ("ASC") Topic 606,
Revenue with Contracts from Customers
("Topic 606") became effective. Topic 606 is the new revenue recognition guidance issued by the Financial Accounting Standards Board ("FASB") as discussed below under "Recently Issued Accounting Pronouncements." Topic 606 replaces ASC Topic 605,
Revenue Recognition
("Topic 605"), which was the revenue recognition standard in effect during the three-year period ended
December 31, 2017
. The Company has historically recorded revenue under Topic 605 and ASC Topic 840,
Leases
, ("Topic 840"). The table below summarizes the Company's revenue by type and by the accounting standard used to determine the accounting (in millions).
|
Year Ended December 31,
|
|||||||||||||||||||||||||||||||||||
|
2017
|
2016
|
2015
|
|||||||||||||||||||||||||||||||||
|
Topic 840
|
Topic 605
|
Total
|
Topic 840
|
Topic 605
|
Total
|
Topic 840
|
Topic 605
|
Total
|
|||||||||||||||||||||||||||
|
Revenues:
|
|||||||||||||||||||||||||||||||||||
|
Equipment rental
|
$
|
1,372.3
|
|
$
|
—
|
|
$
|
1,372.3
|
|
$
|
1,247.1
|
|
$
|
—
|
|
$
|
1,247.1
|
|
$
|
1,305.9
|
|
$
|
—
|
|
$
|
1,305.9
|
|
||||||||
|
Other rental revenue:
|
|||||||||||||||||||||||||||||||||||
|
Delivery and pick-up
|
—
|
|
75.2
|
|
75.2
|
|
—
|
|
66.9
|
|
66.9
|
|
—
|
|
73.6
|
|
73.6
|
|
|||||||||||||||||
|
Other
|
51.5
|
|
—
|
|
51.5
|
|
38.7
|
|
—
|
|
38.7
|
|
32.2
|
|
—
|
|
32.2
|
|
|||||||||||||||||
|
Total other rental revenues
|
51.5
|
|
75.2
|
|
126.7
|
|
38.7
|
|
66.9
|
|
105.6
|
|
32.2
|
|
73.6
|
|
105.8
|
|
|||||||||||||||||
|
Total equipment rentals
|
1,423.8
|
|
75.2
|
|
1,499.0
|
|
1,285.8
|
|
66.9
|
|
1,352.7
|
|
1,338.1
|
|
73.6
|
|
1,411.7
|
|
|||||||||||||||||
|
Sales of revenue earning equipment
|
—
|
|
190.8
|
|
190.8
|
|
—
|
|
122.5
|
|
122.5
|
|
—
|
|
161.2
|
|
161.2
|
|
|||||||||||||||||
|
Sales of new equipment, parts and supplies
|
—
|
|
52.3
|
|
52.3
|
|
—
|
|
68.2
|
|
68.2
|
|
—
|
|
92.1
|
|
92.1
|
|
|||||||||||||||||
|
Service and other revenues
|
—
|
|
12.4
|
|
12.4
|
|
—
|
|
11.4
|
|
11.4
|
|
—
|
|
13.2
|
|
13.2
|
|
|||||||||||||||||
|
Total revenues
|
$
|
1,423.8
|
|
$
|
330.7
|
|
$
|
1,754.5
|
|
$
|
1,285.8
|
|
$
|
269.0
|
|
$
|
1,554.8
|
|
$
|
1,338.1
|
|
$
|
340.1
|
|
$
|
1,678.2
|
|
||||||||
58
HERC HOLDINGS INC. AND SUBSIDIARIES
NOTES TO CONSOLIDATED FINANCIAL STATEMENTS (Continued)
Topic 840 revenues
Equipment rental
Equipment rental revenue includes revenue generated from renting equipment to customers and is recognized on a straight-line basis over the length of the rental contract. Equipment is available for rent on a daily, weekly or monthly basis with most rental agreements cancellable upon return of the equipment. Also included in equipment rental revenue is re-rent revenue in which the Company will rent from vendors and then rent to its customers. Re-rent revenue is accounted for in the same manner as equipment rental revenue generated from the Company's owned revenue earning equipment. Provisions for discounts, rebates to customers and other adjustments are provided for in the period the related revenue is recorded.
Other
Other equipment rental revenue is primarily comprised of fees for the rental protection program which allows customers to limit their risk of financial loss in the event the Company's equipment is damaged or lost and environmental charges associated with the rental of equipment.
Topic 605 revenues
Delivery and pick-up
Delivery and pick-up revenue associated with renting equipment is recognized when the services are performed.
Sales of revenue earning equipment, new equipment, parts and supplies
Revenue from the sale of revenue earning equipment, new equipment, parts and supplies is recognized at the time the customer takes possession, when collectability is reasonably assured and when all obligations under the sales contract have been fulfilled.
The Company generally recognizes revenue from the sale of new equipment purchased from other companies based on the gross amount billed as the Company establishes its own pricing and retains related inventory risk, is the primary obligor in sales transactions with its customers, and assumes the credit risk for amounts billed to its customers.
Service and other
Service and other revenue is primarily revenue earned from providing repair and maintenance to revenue earning equipment owned by the Company's customers. Service revenue is recognized as the services are performed.
Sales tax amounts collected from customers and remitted to governmental authorities are accounted for on a net basis and therefore excluded from revenue.
Advertising
Advertising and sales promotion costs are expensed the first time the advertising or sales promotion takes place. Advertising costs are reflected as a component of "Selling, general and administrative" expense in the Company's consolidated statements of operations. For the years ended
December 31, 2017
,
2016
and
2015
, advertising costs were
$2.7 million
,
$3.6 million
and
$2.9 million
, respectively.
Stock Based Compensation
Under the Company's stock based compensation plans, certain employees and members of the Company's board of directors have received grants of restricted stock units, performance stock units and stock options for Herc Holdings common stock.
The Company measures the cost of employee services received in exchange for an award of equity instruments based on the grant date fair value of the award. That cost is recognized over the period during which the employee is required to provide service in exchange for the award. The Company estimates the fair value of options issued at the date of grant using a Black-Scholes option-pricing model, which includes assumptions related to volatility, expected term, dividend yield and risk-free interest rate.
59
HERC HOLDINGS INC. AND SUBSIDIARIES
NOTES TO CONSOLIDATED FINANCIAL STATEMENTS (Continued)
The Company accounts for restricted stock unit and performance stock unit awards as equity classified awards. For restricted stock units, the expense is based on the grant date fair value of the stock and the number of shares that vest, recognized over the service period. For performance stock units, the expense is based on the grant date fair value of the stock, recognized over a service period depending upon the applicable performance condition. For performance stock units, the Company re-assesses the probability of achieving the applicable performance condition each reporting period and adjusts the recognition of expense accordingly.
Income Taxes
The Company’s operations are subject to U.S. federal, state and local, and foreign income taxes, portions of which have historically been included in the Hertz Holdings consolidated U.S. federal income tax return, along with certain state and local and foreign income tax returns. In preparing its combined financial statements for periods prior to the Spin-Off, the Company has determined the tax provision for those operations that are included in the Hertz Holdings consolidated tax return on a separate company return basis, assuming that the Company had filed on a stand-alone basis separate from Hertz Holdings (“Separate Return Basis”).
The current and deferred tax related balances and related tax carryforwards reflected in the Company’s combined financial statements for periods prior to the Spin-Off have been determined on a Separate Return Basis. As a result, the tax balances and carryforwards on the Company’s tax returns post Spin-Off, including net operating losses and tax credits, will be different from those reflected in the combined financial statements. In addition, as a consequence of the Company’s inclusion in the Hertz Holdings' consolidated income tax returns, the Company is severally liable, with other members of the consolidated group, for any additional taxes that may be assessed. There are no unrecognized tax benefits based on the Herc operations prior to the Spin-Off reflected in these combined financial statements.
Herc's LKE Program was in place for several years. Pursuant to the program, Herc disposed of equipment and acquires replacement equipment in a form intended to allow such dispositions and replacements to qualify as tax-deferred "like-kind exchanges" pursuant to Section 1031 of the Internal Revenue Code ("Section 1031"). The program had resulted in deferral of federal and state income taxes in prior years. The 2017 Tax Act eliminated the eligibility of personal property for Section 1031 treatment. The 2017 Tax Act also enacted an election to immediately expense all purchases of new and used personal property placed in service after September 27, 2017. As a result of the 2017 Tax Act, the Company ceased its LKE Program and therefore reflects zero restricted cash as of
December 31, 2017
.
The Company applies the provisions of Financial Accounting Standards Board ("FASB") Accounting Standards Codification Topic 740, Income Taxes ("ASC 740"), and computes the provision for income taxes on a Separate Return Basis. Under ASC 740, deferred tax assets and liabilities are determined based on differences between the financial statement carrying amounts and tax bases of assets and liabilities and are measured using the enacted tax rates and laws that will be in effect when the differences are expected to reverse. The effect of a change in tax rates is recognized in the statement of operations in the period that includes the enactment date. The Company records a valuation allowance to reduce its deferred tax assets to the amount that is more likely than not to be realized. Subsequent changes to enacted tax rates and changes in the interpretations thereof will result in deferred taxes and any related valuation allowances. Provisions are not made for income taxes on undistributed earnings of international subsidiaries that are intended to be indefinitely reinvested outside of the United States or are expected to be remitted free of taxes. Future distributions, if any, from these international subsidiaries to the United States or changes in U.S. tax rules may require a charge to reflect tax on these amounts.
In accordance with ASC 740, the Company recognizes, in its consolidated financial statements, the impact of the Company's tax positions that are more likely than not to be sustained upon examination based on the technical merits of the positions. The Company recognizes interest and penalties for uncertain tax positions in income tax expense.
The 2017 Tax Act, which was enacted in December 2017, had a substantial impact on the income tax benefit for the year ended
December 31, 2017
. The Company expects to meaningfully benefit from its enactment in future periods. See
Note 13
, "
Income Taxes
" for further detail.
60
HERC HOLDINGS INC. AND SUBSIDIARIES
NOTES TO CONSOLIDATED FINANCIAL STATEMENTS (Continued)
Recently Issued Accounting Pronouncements
Adopted
Simplifying the Subsequent Measurement of Inventory
In July 2015, the FASB issued guidance that requires inventory to be measured at the lower of cost and net realizable value (rather than cost or market), excluding inventory measured using the last-in, first-out method or the retail inventory method. Net realizable value is defined as the estimated selling prices in the ordinary course of business, less reasonably predictable costs of completion, disposal and transportation. The Company adopted this guidance on January 1, 2017 in accordance with the effective date. Adoption of this guidance did not impact the Company's financial position, results of operations or cash flows.
Simplifying the Transition to the Equity Method of Accounting
In March 2016, the FASB issued guidance that eliminates the requirement to apply the equity method of accounting retrospectively when significant influence over a previously held investment is obtained. Rather, the guidance requires the investor to add the cost of acquiring the additional interest in the investee to the current basis of the investor’s previously held interest and adopt the equity method of accounting as of the date the investment becomes qualified for equity method of accounting. The Company adopted this guidance on January 1, 2017 in accordance with the effective date. Adoption of this guidance did not impact the Company's financial position, results of operations or cash flows.
Improvements to Employee Share-Based Payment Accounting
In March 2016, the FASB issued guidance that simplifies several areas of employee share-based payment accounting, including: (i) eliminating tracking of tax "windfalls" in a separate pool within additional paid-in capital; instead, excess tax benefits and tax deficiencies are recorded within income tax expense; (ii) eliminating the requirement that excess tax benefits be realized before they can be recognized, which is required to be recorded as an adjustment to opening retained earnings with respect to which the Company recorded a
$2.5 million
adjustment upon adoption; (iii) presentation of excess tax benefits as an operating activity on the statement of cash flows, which had no impact on the Company; (iv) presentation of employee taxes paid directly to a taxing authority when directly withholding shares for tax-withholding purposes as a financing activity on the statement of cash flows, which had no impact as the Company has historically followed this presentation and (v) making a policy election regarding treatment of forfeitures, with respect to which the Company will continue to estimate forfeitures. The Company adopted this guidance on January 1, 2017 in accordance with the effective date. Adoption of this guidance did not impact the Company's consolidated statement of operations.
Improvements to Accounting for Hedging Activities
In August 2017, the FASB issued guidance that amends the hedge accounting recognition and presentation requirements to improve the transparency and understandability of information conveyed to financial statement users about an entity’s risk management activities. The guidance is effective for fiscal years beginning after December 15, 2018 and interim periods therein; however, early adoption is permitted. The Company adopted this guidance in the third quarter of 2017 using a modified retrospective approach, as required, which did not have a significant impact on its financial position, results of operations or cash flows.
Simplifying the Test for Goodwill Impairment
In January 2017, the FASB issued guidance to simplify the subsequent measurement of goodwill by removing the second step of the two-step impairment test. The guidance requires that an entity recognize an impairment charge for the amount by which the carrying amount of the reporting unit exceeds the reporting unit’s fair value. This guidance is effective for annual and interim periods beginning after December 15, 2019, with early adoption permitted. The Company adopted this guidance in the fourth quarter of 2017 when it performed its annual goodwill impairment test as of October 1, 2017. Adoption of the guidance did not impact the Company's financial position, results of operations or cash flows.
61
HERC HOLDINGS INC. AND SUBSIDIARIES
NOTES TO CONSOLIDATED FINANCIAL STATEMENTS (Continued)
Not Yet Adopted
Revenue from Contracts with Customers
In May 2014, the FASB issued guidance that will replace most existing revenue recognition guidance in U.S. GAAP. The new guidance applies to all contracts with customers except for leases, insurance contracts, financial instruments, certain nonmonetary exchanges and certain guarantees. The core principle of the guidance is that an entity should recognize revenue for the transfer of goods or services equal to the amount that it expects to be entitled to receive for those goods or services. The new principles-based revenue recognition model requires an entity to perform five steps in its analysis: (i) identify the contract(s) with a customer, (ii) identify the performance obligations in the contract, (iii) determine the transaction price, (iv) allocate the transaction price to the performance obligations in the contract, and (v) recognize revenue when (or as) the entity satisfies a performance obligation. Under the new guidance, performance obligations in a contract will be separately identified, which may impact the timing of recognition of the revenue allocated to each obligation. The measurement of revenue recognized may also be impacted by identification of new performance obligations and other matters, such as collectability and variable consideration. Also, additional disclosures are required about the nature, amount, timing and uncertainty of revenue and cash flows arising from customer contracts, including significant judgments and changes in judgments. The new guidance may be adopted on either a full or modified retrospective basis. As originally issued, the guidance was effective for annual reporting periods beginning after December 15, 2016, including interim periods within those reporting periods. However, in July 2015, the FASB agreed to defer the effective date until annual and interim reporting periods beginning after December 15, 2017.
In March 2016, the FASB issued clarifying guidance on assessing whether an entity is a principal or an agent in a revenue transaction, which impacts whether an entity reports revenue on a gross or net basis. In April 2016, the FASB issued guidance that reduces the complexity for identifying performance obligations and clarifies the implementation guidance on licensing for intellectual property. In May 2016, the FASB issued guidance that clarifies the collectability criterion, the presentation of sales taxes and non-cash consideration, and provides additional implementation practical expedients.
The Company expects to adopt the new revenue guidance on January 1, 2018 using the modified retrospective approach. The Company's accounting for equipment rental revenue is primarily outside of the scope of the new revenue guidance and will be evaluated under the new lease guidance, which is described further under the subheading "Leases" below. The Company's review of its revenue accounting with respect to sales of revenue earning equipment, sales of new equipment, parts and supplies and service and other revenue is ongoing; however, the Company does not believe this guidance will have a significant impact on its financial statements. Additionally, the Company is evaluating the disclosure requirements of the new revenue guidance which requires the Company to disaggregate revenue into categories that depict how the nature, amount, timing and uncertainty of revenue and cash flows are affected by economic factors. The Company has provided a disaggregation of its revenue under the heading "Revenue Recognition" above
and anticipates it will disaggregate revenues consistent with this presentation upon adoption. The Company is also assessing the impact of the guidance on its internal control over financial reporting.
Leases
In February 2016, the FASB issued guidance that replaces the existing lease guidance. The new guidance establishes a right-of-use (“ROU”) model that requires a lessee to record a ROU asset and lease liability on the balance sheet for all leases with terms longer than 12 months. Leases will be classified as either finance or operating, with classification affecting the pattern of expense recognition in the income statement. This guidance also expands the requirements for lessees to record leases embedded in other arrangements and the required quantitative and qualitative disclosures surrounding leases. Accounting guidance for lessors is largely unchanged. This guidance is effective for annual periods beginning after December 15, 2018 and interim periods within those annual periods using a modified retrospective transition approach. The Company is in the process of assessing the potential impacts of adopting this guidance on its financial position, results of operations and cash flows.
Statement of Cash Flows: Classification of Certain Cash Receipts and Cash Payments
In August 2016, the FASB issued guidance to eliminate the diversity in practice related to the classification of certain cash receipts and payments in the statement of cash flows, by adding or clarifying guidance on eight specific cash flow issues. This guidance is effective for annual and interim reporting periods beginning after December 15, 2017, with early adoption permitted. The Company expects to adopt this guidance upon its effective date of January 1, 2018 and does not expect the guidance to have a significant impact on its cash flows.
62
HERC HOLDINGS INC. AND SUBSIDIARIES
NOTES TO CONSOLIDATED FINANCIAL STATEMENTS (Continued)
Statement of Cash Flows: Restricted Cash
In November 2016, the FASB issued guidance requiring restricted cash and cash equivalents to be included with cash and cash equivalents on the statement of cash flows. This guidance is effective for annual and interim reporting periods beginning after December 15, 2017, with early adoption permitted. The Company expects to adopt this guidance upon its effective date of January 1, 2018 and does not expect the guidance to have a significant impact on its cash flows.
Income Taxes: Intra-Entity Transfers of Assets Other Than Inventory
In October 2016, the FASB issued guidance requiring an entity to recognize upon transfer the income tax consequences of an intra-entity transfer of an asset other than inventory, eliminating the current recognition exception. Two common examples of assets included in the scope of this standard are intellectual property and property, plant and equipment. This guidance is effective for annual and interim reporting periods beginning after December 15, 2017. The Company expects to adopt this guidance upon its effective date of January 1, 2018 and does not expect the guidance to have a significant impact on its financial position, results of operations and cash flows.
Improving the Presentation of Net Periodic Pension Cost and Net Periodic Postretirement Benefit Costs
In March 2017, the FASB issued guidance on the presentation of net periodic pension and postretirement benefit costs in the income statement and on the components eligible for capitalization. The guidance requires the reporting of the service cost component of the net periodic benefit costs in the same income statement line item as other components of net periodic costs arising from services rendered by an employee during the period, and that non-service cost components be presented in the income statement separately from the service cost components and outside a subtotal of income from operations. The guidance also allows for the capitalization of the service cost components, when applicable. This guidance is effective for annual and interim periods beginning after December 15, 2017. The Company expects to adopt this guidance upon its effective date of January 1, 2018. Adoption of this guidance will not have a significant impact on the Company's results of operations.
Compensation - Stock Compensation
In May 2017, the FASB issued guidance pursuant to which changes to the terms or conditions of a share-based payment award require an entity to apply modification accounting. Under the updated guidance, a modification is defined as a change in the terms or conditions of a share-based payment award, and an entity should account for the effects of a modification unless all of the following are met:
|
1.
|
The fair value of the modified award is the same as the fair value of the original award immediately before the original award is modified. If the modification does not affect any of the inputs to the valuation techniques that the entity uses to value the award, the entity is not required to estimate the value immediately before and after the modification.
|
|
2.
|
The vesting conditions of the modified award are the same as the vesting conditions of the original award immediately before the original award is modified.
|
|
3.
|
The classification of the modified award as an equity instrument or a liability instrument is the same as the classification of the original award immediately before the original award is modified.
|
This guidance requires prospective adoption and is effective for annual and interim periods beginning after December 15, 2017, with early adoption permitted. The Company expects to adopt this guidance upon its effective date of January 1, 2018 and does not expect the guidance to have a significant impact on its financial position, results of operations or cash flows.
Income Statement - Reporting Comprehensive Income
In February 2018, the FASB issued guidance that allows reclassification from accumulated other comprehensive income to retained earnings for certain tax effects resulting from the 2017 Tax Act that would otherwise be stranded in accumulated other comprehensive income. This guidance is effective for annual and interim periods beginning after December 15, 2018, with early adoption permitted. The Company is in the process of assessing the potential impacts of adopting this guidance on its financial position, results of operations or cash flows.
63
HERC HOLDINGS INC. AND SUBSIDIARIES
NOTES TO CONSOLIDATED FINANCIAL STATEMENTS (Continued)
Note 3
—
Revenue Earning Equipment
Revenue earning equipment consists of the following (in millions):
|
December 31, 2017
|
December 31, 2016
|
||||||
|
Revenue earning equipment
|
$
|
3,757.2
|
|
$
|
3,695.5
|
|
|
|
Less: Accumulated depreciation
|
(1,382.6
|
)
|
(1,305.5
|
)
|
|||
|
Revenue earning equipment, net
|
$
|
2,374.6
|
|
$
|
2,390.0
|
|
|
Depreciation rates on the Company's revenue earning equipment are reviewed regularly based on management's ongoing assessment of present and estimated future market conditions, their effect on residual values at the time of disposal and estimated holding periods. The impact of depreciation rate changes increased expense
$18.0 million
,
$9.4 million
and
$1.9 million
for the years ended
December 31, 2017
,
2016
and
2015
, respectively.
For certain equipment at or nearing the end of its useful life, the Company considers the option of refurbishing the equipment as an alternative to replacing it based upon the economics of each alternative. Therefore, the number of units refurbished each year can fluctuate based on several factors including the market conditions for used equipment sales and incentives offered by manufacturers of new equipment. The capitalized cost of refurbishing revenue earning equipment was $
0.5 million
,
$6.5 million
and
$40.1 million
for the years ended
December 31, 2017
,
2016
and
2015
, respectively.
During 2017, the Company deemed certain revenue earning equipment, with a net book value of approximately
$4.3 million
, to be held for sale and reclassified such equipment to "Prepaid and other current assets" in the consolidated balance sheet. The Company also performed an impairment assessment of revenue earning equipment and recorded an impairment charge as discussed further in
Note 6
, "
Impairment
."
Note 4
—
Property and Equipment
Property and equipment consists of the following (in millions):
|
December 31, 2017
|
December 31, 2016
|
||||||
|
Land and buildings
|
$
|
123.5
|
|
$
|
115.1
|
|
|
|
Service vehicles
|
260.4
|
|
242.6
|
|
|||
|
Leasehold improvements
|
74.4
|
|
63.4
|
|
|||
|
Machinery and equipment
|
25.7
|
|
21.6
|
|
|||
|
Computer equipment and software
|
58.4
|
|
47.8
|
|
|||
|
Furniture and fixtures
|
11.8
|
|
8.2
|
|
|||
|
Construction in progress
|
20.2
|
|
23.7
|
|
|||
|
Property and equipment, gross
|
574.4
|
|
522.4
|
|
|||
|
Less: accumulated depreciation
|
(288.1
|
)
|
(250.4
|
)
|
|||
|
Property and equipment, net
|
$
|
286.3
|
|
$
|
272.0
|
|
|
Depreciation expense for the years ended
December 31, 2017
,
2016
and
2015
was
$46.8 million
,
$39.7 million
and
$39.6 million
, respectively. Depreciation expense for property and equipment is included in "Direct operating" and "Selling, general and administrative" expenses in the Company's consolidated statements of operations.
The Company leases certain of its service vehicles under capital leases. Depreciation of assets held under capital leases is included in depreciation expense. The gross amounts of property and equipment and related depreciation recorded under capital leases, included in service vehicles in the table above, were as follows (in millions):
|
December 31, 2017
|
December 31, 2016
|
||||||
|
Service vehicles
|
$
|
107.4
|
|
$
|
109.9
|
|
|
|
Less: accumulated depreciation
|
(55.2
|
)
|
(41.8
|
)
|
|||
|
$
|
52.2
|
|
$
|
68.1
|
|
||
64
HERC HOLDINGS INC. AND SUBSIDIARIES
NOTES TO CONSOLIDATED FINANCIAL STATEMENTS (Continued)
During October 2017, the Company entered into a financing obligation to lease certain of its properties as discussed further in
Note 10
, "
Financing Obligations
." Depreciation of assets held under financing obligations is included in depreciation expense. The gross amounts of land, building and leasehold improvements and related depreciation recorded under financing obligations, included in the table above, were as follows (in millions):
|
December 31, 2017
|
|||
|
Land, building and leasehold improvements
|
$
|
70.1
|
|
|
Less: accumulated depreciation
|
(25.7
|
)
|
|
|
$
|
44.4
|
|
|
Note 5
—
Goodwill and Intangible Assets
Goodwill
The Company performed its annual goodwill impairment test and determined that
no
impairment existed for the years ended
December 31, 2017
and
2016
.
The following summarizes the Company's goodwill (in millions):
|
Year Ended December 31,
|
|||||||
|
2017
|
2016
|
||||||
|
Balance at the beginning and end of the period:
|
|||||||
|
Goodwill
|
$
|
765.9
|
|
$
|
765.9
|
|
|
|
Accumulated impairment losses
|
(674.9
|
)
|
(674.9
|
)
|
|||
|
$
|
91.0
|
|
$
|
91.0
|
|
||
Intangible Assets
The Company performed its annual impairment test of indefinite-lived intangible assets and determined that
no
impairment existed for the years ended
December 31, 2017
and
2016
. The Company also reviewed its finite-lived intangible assets for impairment and determined that certain assets were impaired during the year ended
December 31, 2017
as further discussed in
Note 6
, "
Impairment
." There were
no
impairment charges for the year ended
December 31, 2016
.
Intangible assets, net, consisted of the following major classes (in millions):
|
|
December 31, 2017
|
||||||||||
|
|
Gross Carrying Amount
|
Accumulated Amortization
|
Net Carrying Value
|
||||||||
|
Finite-lived intangible assets:
|
|
|
|||||||||
|
Customer-related
|
$
|
14.8
|
|
$
|
(9.4
|
)
|
$
|
5.4
|
|
||
|
Internally developed software
(a)
|
19.3
|
|
(6.8
|
)
|
12.5
|
|
|||||
|
Total
|
34.1
|
|
(16.2
|
)
|
17.9
|
|
|||||
|
Indefinite-lived intangible assets:
|
|
||||||||||
|
Trade name
|
266.0
|
|
—
|
|
266.0
|
|
|||||
|
Total intangible assets, net
|
$
|
300.1
|
|
$
|
(16.2
|
)
|
$
|
283.9
|
|
||
|
(a)
|
Includes capitalized costs of
$5.4 million
yet to be placed into service.
|
65
HERC HOLDINGS INC. AND SUBSIDIARIES
NOTES TO CONSOLIDATED FINANCIAL STATEMENTS (Continued)
|
|
December 31, 2016
|
||||||||||
|
|
Gross Carrying
Amount |
Accumulated
Amortization |
Net Carrying Value
|
||||||||
|
Finite-lived intangible assets:
|
|
|
|||||||||
|
Customer-related
|
$
|
14.8
|
|
$
|
(7.7
|
)
|
$
|
7.1
|
|
||
|
Other
(a)
|
34.8
|
|
(4.0
|
)
|
30.8
|
|
|||||
|
Total
|
49.6
|
|
(11.7
|
)
|
37.9
|
|
|||||
|
Indefinite-lived intangible assets:
|
|
|
|||||||||
|
Trade name
|
266.0
|
|
—
|
|
266.0
|
|
|||||
|
Total intangible assets, net
|
$
|
315.6
|
|
$
|
(11.7
|
)
|
$
|
303.9
|
|
||
|
(a)
|
Other amortizable intangible assets primarily consisted of internally developed software of which
$26.0 million
had yet to be placed into service, most of which was impaired during 2017.
|
Amortization of intangible assets for the years ended
December 31, 2017
,
2016
and
2015
was approximately
$4.7 million
,
$5.1 million
and
$37.6 million
, respectively. Based on the amortizable assets in-service as of December 31, 2017, the Company expects amortization expense to be approximately
$4.1 million
in 2018,
$3.2 million
in 2019,
$2.9 million
in 2020,
$2.0 million
in 2021 and
$0.3 million
in 2022.
Note 6
—
Impairment
The Company had been in the process of developing a new financial system and point of sale system as part of the separation from New Hertz that was initiated prior to the Spin-Off. During June 2017, the Company made the decision to discontinue developing these new systems based on the inability to provide the anticipated substantive service potential and significantly higher costs than were originally expected to develop the systems. As a result, the Company recorded an impairment charge of
$25.3 million
during the year ended
December 31, 2017
.
The Company performed an impairment assessment of certain revenue earning equipment and recorded an impairment charge of
$4.4 million
during the year ended
December 31, 2017
. This revenue earning equipment has a remaining net book value of
$4.3 million
and has been reclassified to held for sale and included in "Prepaid and other current assets" in the consolidated balance sheet.
Note 7
—
Divestitures
In October 2015, the Company sold its operations in France and Spain comprised of
60
locations in France and
two
in Spain and realized a gain on the sale of
$50.9 million
that was recorded in "Other income, net" in the Company's consolidated statements of operations. A portion of the gain,
$41.6 million
, represents the release of currency translation adjustments from accumulated other comprehensive loss with the remainder of the gain attributable to the assets and liabilities sold.
66
HERC HOLDINGS INC. AND SUBSIDIARIES
NOTES TO CONSOLIDATED FINANCIAL STATEMENTS (Continued)
Note 8
—
Accrued Liabilities
Accrued liabilities consists of the following (in millions):
|
December 31, 2017
|
December 31, 2016
|
||||||
|
Accrued compensation and benefit costs
|
$
|
27.5
|
|
$
|
24.9
|
|
|
|
National accounts accrual
|
29.7
|
|
23.3
|
|
|||
|
Accrued property, sales, use and other related taxes
|
14.8
|
|
9.9
|
|
|||
|
Accrued interest
|
7.5
|
|
9.1
|
|
|||
|
Customer deposits
|
7.7
|
|
4.1
|
|
|||
|
Self-insurance reserves
|
6.2
|
|
8.1
|
|
|||
|
Income taxes payable
|
7.1
|
|
0.1
|
|
|||
|
Other
|
12.8
|
|
8.7
|
|
|||
|
Total accrued liabilities
|
$
|
113.3
|
|
$
|
88.2
|
|
|
Note 9
—
Debt
The Company's debt consists of the following (in millions):
|
Weighted Average Effective Interest Rate at December 31, 2017
|
Weighted Average Stated Interest Rate at December 31, 2017
|
Fixed or Floating Interest Rate
|
Maturity
|
December 31,
2017 |
December 31,
2016 |
||||||||||
|
Senior Secured Second Priority Notes
|
|||||||||||||||
|
2022 Notes
|
7.88%
|
7.50%
|
Fixed
|
2022
|
$
|
488.0
|
|
$
|
610.0
|
|
|||||
|
2024 Notes
|
8.06%
|
7.75%
|
Fixed
|
2024
|
500.0
|
|
625.0
|
|
|||||||
|
Other Debt
|
|||||||||||||||
|
ABL Credit Facility
|
N/A
|
3.26%
|
Floating
|
2021
|
1,130.0
|
|
910.0
|
|
|||||||
|
Capital leases
|
4.02%
|
N/A
|
Fixed
|
2018-2020
|
53.7
|
|
70.3
|
|
|||||||
|
Other borrowings
|
N/A
|
4.79%
|
Floating
|
2018
|
2.6
|
|
—
|
|
|||||||
|
Unamortized Debt Issuance Costs
(a)
|
(14.5
|
)
|
(21.0
|
)
|
|||||||||||
|
Total debt
|
2,159.8
|
|
2,194.3
|
|
|||||||||||
|
Less: Current maturities of long-term debt
|
(22.7
|
)
|
(15.7
|
)
|
|||||||||||
|
Long-term debt, net
|
$
|
2,137.1
|
|
$
|
2,178.6
|
|
|||||||||
|
(a)
|
Unamortized debt issuance costs totaling
$13.3 million
and
$17.1 million
related to the ABL Credit Facility (as defined below) are included in "Other long-term assets" in the consolidated balance sheet as of
December 31, 2017
and
December 31, 2016
, respectively.
|
The effective interest rates for the fixed rate 2022 Notes and 2024 Notes (as defined below) include the stated interest on the notes and the amortization of any debt issuance costs.
67
HERC HOLDINGS INC. AND SUBSIDIARIES
NOTES TO CONSOLIDATED FINANCIAL STATEMENTS (Continued)
Maturities
The nominal principal amounts of maturities of debt for each of the periods ending December 31 are as follows (in millions):
|
2018
|
$
|
22.7
|
|
|
2019
|
22.1
|
|
|
|
2020
|
11.5
|
|
|
|
2021
|
1,130.0
|
|
|
|
2022
|
488.0
|
|
|
|
After 2022
|
500.0
|
|
|
|
Total
|
$
|
2,174.3
|
|
The Company is highly leveraged and its liquidity needs arise from the funding of its costs of operations and capital expenditures and from debt service on its indebtedness. The Company believes that cash generated from operations and cash received from the disposal of equipment, together with amounts available under its asset-based revolving credit facility (the "ABL Credit Facility"), will be adequate to permit the Company to meet its obligations over the next 12 months.
Senior Secured Second Priority Notes
In June 2016, Herc issued
$610.0 million
aggregate principal amount of
7.50%
senior secured second priority notes due 2022 (the "2022 Notes") and
$625.0 million
aggregate principal amount of
7.75%
senior secured second priority notes due 2024 (the "2024 Notes" and, together with the 2022 Notes, the "Notes"). The funds were used to: (i) finance the Spin-Off and make a cash transfer to New Hertz and its affiliates in connection therewith and (ii) pay fees and other transaction expenses in connection therewith.
The following summarizes other significant terms and conditions of the Notes:
Interest
Interest on the 2022 Notes accrues at the rate of
7.50%
per annum and is payable semi-annually in arrears on
June 1
and
December 1
. The 2022 Notes mature on
June 1, 2022
. Interest on the 2024 Notes accrues at the rate of
7.75%
per annum and is payable semi-annually in arrears on
June 1
and
December 1
. The 2024 Notes mature on
June 1, 2024
.
Guarantees
The Notes are guaranteed, on a senior secured basis, by each wholly-owned domestic subsidiary of Herc, subject to certain exceptions. The guarantee of each subsidiary is a senior secured obligation of that subsidiary.
Collateral
Substantially all of the assets of Herc and certain of its U.S. and Canadian subsidiaries are encumbered in favor of Herc's lenders under the terms of the indenture dated as of June 9, 2016 (the "Indenture"), among Herc, as issuer, and Wilmington Trust National Association, as trustee and note collateral agent, and the related collateral documents. The security interests in the collateral may be released without the consent of the holders of the Notes if collateral is disposed of in a transaction that complies with the terms of the Indenture and the related collateral documents, and will be released, so long as any obligations under the ABL Credit Facility are outstanding, upon the release of all liens on such collateral securing the obligations under the ABL Credit Facility obligations.
68
HERC HOLDINGS INC. AND SUBSIDIARIES
NOTES TO CONSOLIDATED FINANCIAL STATEMENTS (Continued)
Redemption
Herc may redeem the 2022 Notes, in whole or in part, at any time prior to June 1, 2019, at a price equal to
100%
of the principal amount thereof, plus accrued and unpaid interest, if any, to, but excluding, the redemption date, plus the applicable make-whole premium. Herc may redeem the 2022 Notes, in whole or in part, at any time (i) on or after June 1, 2019 and prior to June 1, 2020, at a price equal to
103.750%
of the principal amount of the 2022 Notes, (ii) on or after June 1, 2020 and prior to June 1, 2021, at a price equal to
101.875%
of the principal amount of the 2022 Notes, and (iii) on or after June 1, 2021, at a price equal to
100%
of the principal amount of the 2022 Notes, in each case, plus accrued and unpaid interest, if any, to, but not including, the applicable redemption date. In addition, at any time prior to June 1, 2019, Herc at its option may redeem up to
40%
of the original aggregate principal amount of the 2022 Notes with the proceeds of one or more equity offerings at a redemption price of
107.500%
, plus accrued and unpaid interest, if any, to, but excluding, the date of redemption.
Herc may redeem the 2024 Notes, in whole or in part, at any time prior to June 1, 2019, at a price equal to
100%
of the principal amount thereof, plus accrued and unpaid interest, if any, to, but excluding, the redemption date, plus the applicable make-whole premium. Herc may redeem the 2024 Notes, in whole or in part, at any time (i) on or after June 1, 2019 and prior to June 1, 2020, at a price equal to
105.813%
of the principal amount of the 2024 Notes, (ii) on or after June 1, 2020 and prior to June 1, 2021, at a price equal to
103.875%
of the principal amount of the 2024 Notes, (iii) on or after June 1, 2021 and prior to June 1, 2022, at a price equal to
101.938%
of the principal amount of the 2024 Notes and (iv) on or after June 1, 2022, at a price equal to
100%
of the principal amount of the 2024 Notes, in each case, plus accrued and unpaid interest, if any, to, but not including, the applicable redemption date. In addition, at any time prior to June 1, 2019, Herc at its option may redeem up to
40%
of the original aggregate principal amount of the 2024 Notes with the proceeds of one or more equity offerings at a redemption price of
107.750%
, plus accrued and unpaid interest, if any, to, but excluding, the date of redemption.
Herc, at its option may redeem, for the redemption period from June 1, 2018 to May 31, 2019, up to
10%
of the original aggregate principal amount of the 2022 Notes and up to
10%
of the original aggregate principal amount of the 2024 Notes, in each case at a redemption price equal to
103%
of the aggregate principal amount thereof, plus accrued and unpaid interest, if any, to, but excluding, the date of redemption.
In March and October 2017, Herc drew down on its ABL Credit Facility and cumulatively redeemed
$122.0 million
in aggregate principal amount of the 2022 Notes and
$125.0 million
in aggregate principal amount of the 2024 Notes and recorded an
$11.4 million
loss on the early extinguishment of debt, comprised of a
3%
cash premium totaling
$7.4 million
and a non-cash charge of
$4.0 million
for the write-off of unamortized debt issuance costs. The losses on early extinguishment of debt are included in "Interest expense, net” in the Company's consolidated statement of operations.
Covenants
The Indenture contains covenants that, among other things, limit the ability of Herc to incur additional indebtedness, guarantee indebtedness or issue certain preferred shares; pay dividends on, redeem or repurchase stock or make other distributions in respect of its capital stock; repurchase, prepay or redeem subordinated indebtedness; make loans and investments; create liens; transfer or sell assets; consolidate, merge or sell or otherwise dispose of all or substantially all of its assets; enter into certain transactions with affiliates; and designate subsidiaries as unrestricted subsidiaries. Upon the occurrence of certain events constituting a change of control triggering event, Herc is required to make an offer to repurchase all or any part of the Notes (unless otherwise redeemed) at a purchase price equal to
101%
of their principal amount, plus accrued and unpaid interest, if any to (but excluding) the repurchase date. If Herc sells assets under certain circumstances, it must use the proceeds to make an offer to purchase the Notes at a price equal to
100%
of their principal amount, plus accrued and unpaid interest, if any, to, but excluding, the repurchase date.
Events of Default
The following are events of default under the Indenture (subject to customary exceptions, thresholds and grace periods): the nonpayment of principal when due; the nonpayment of interest when due continued for
30
days; the failure to comply for
60
days after receipt of requisite notice with specified obligations, covenants or agreements contained in the Notes or the Indenture; the failure of any subsidiary guarantor to comply for
45
days with its obligations under its guarantee or a failure of any guarantee of a significant subsidiary to be in full force and effect; the failure to pay any indebtedness for borrowed money after final maturity or cross acceleration of material debt if the total amount of such indebtedness exceeds
$150.0 million
; certain events of bankruptcy, insolvency or reorganization; the failure to discharge any judgment in excess of
$100.0 million
; and the failure of any security
69
HERC HOLDINGS INC. AND SUBSIDIARIES
NOTES TO CONSOLIDATED FINANCIAL STATEMENTS (Continued)
document securing the Notes to be in full force and effect with respect to any collateral having a fair market value in excess of
$150.0 million
.
ABL Credit Facility
The Company's ABL Credit Facility held by its Herc subsidiary, provides for senior secured revolving loans up to a maximum aggregate principal amount of
$1,750 million
(subject to availability under a borrowing base), including revolving loans in an aggregate principal amount of
$350 million
available to Canadian borrowers and U.S. borrowers. Up to
$250 million
of the revolving loan facility is available for the issuance of letters of credit, subject to certain conditions including issuing lender participation. Extensions of credit under the ABL Credit Facility are limited by a borrowing base calculated periodically based on specified percentages of the value of eligible rental equipment, eligible service vehicles, eligible spare parts and merchandise, eligible accounts receivable, and eligible unbilled accounts subject to certain reserves and other adjustments. Subject to the satisfaction of certain conditions and limitations, the ABL Credit Facility allows for the addition of incremental revolving and/or term loan commitments. In addition, the ABL Credit Facility permits Herc to increase the amount of commitments under the ABL Credit Facility with the consent of each lender providing an additional commitment, subject to satisfaction of certain conditions.
The following summarizes the significant terms and conditions of the ABL Credit Facility:
Interest and Fees
The interest rates applicable to the loans under the ABL Credit Facility are based on a fluctuating rate of interest measured by reference to either, at the borrowers’ option, (i) an adjusted London inter-bank offered rate, plus a borrowing margin or (ii) an alternate base rate, plus a borrowing margin (or, in the case of the Canadian borrowers, a rate equal to the rate on bankers’ acceptances with the same maturity, plus a borrowing margin). The borrowing margin on the ABL Credit Facility is determined based on a pricing grid that is bifurcated based on corporate credit ratings, with levels within the grid based on available commitments. Customary fees are also payable in respect of the ABL Credit Facility, including a commitment fee on the unutilized portion thereof.
Maturity and Prepayments
The ABL Credit Facility matures on
June 30, 2021
. The ABL Credit Facility may be prepaid at the borrowers’ option at any time without premium or penalty and will be subject to mandatory prepayment (i) if the outstanding U.S. dollar or Canadian dollar denominated revolving loans under the ABL Credit Facility exceed either the aggregate commitments with respect thereto or the current applicable borrowing base, in an amount equal to such excess or (ii) if, following the occurrence of asset dispositions or any settlement of or payment in respect of any property or casualty insurance claim or any condemnation proceeding relating to the collateral, less than
100%
of the net cash proceeds have been reinvested in Herc’s business within
365
days and the available loan commitments are less than
$250 million
.
Guarantees and Security
Herc and certain of its subsidiaries, including Canadian subsidiaries, are the borrowers under the ABL Credit Facility. Herc Intermediate Holdings LLC, Herc and each direct and indirect domestic subsidiary of Herc (and, in the case of Canadian obligations, each direct and indirect Canadian subsidiary of Herc) guarantees the borrowers’ payment obligations under the ABL Credit Facility, subject to certain exceptions.
The ABL Credit Facility and the guarantees thereof are secured by (i) a first priority pledge of (A) all of the capital stock of Herc and each domestic borrower, (B) all of the capital stock of all domestic subsidiaries owned by Herc, each domestic borrower and each domestic subsidiary guarantor and (C)
65%
of the capital stock of any foreign subsidiary held directly by Herc, any domestic borrower or any domestic subsidiary guarantor and (ii) a first priority security interest in substantially all other tangible and intangible assets owned by Herc, each domestic borrower and each domestic subsidiary guarantor, in each case to the extent permitted by applicable law and subject to certain exceptions.
The Canadian obligations under the ABL Credit Facility are also secured, pursuant to a Canadian guarantee and collateral agreement made by the Canadian borrowers and certain Canadian subsidiaries of Herc in favor of the Canadian agent and Canadian ABL collateral agent, by a first priority security interest in substantially all assets of the Canadian borrowers and the Canadian guarantors, subject to certain exceptions.
70
HERC HOLDINGS INC. AND SUBSIDIARIES
NOTES TO CONSOLIDATED FINANCIAL STATEMENTS (Continued)
The liens securing the ABL Credit Facility are first in priority (as between the ABL Credit Facility and the Notes) with respect to the collateral.
Covenants
The ABL Credit Facility contains a number of negative covenants that, among other things, limit or restrict the ability of the borrowers and, in certain cases, their restricted subsidiaries to dispose of assets, incur additional indebtedness, incur guarantee obligations, prepay certain indebtedness, make certain dividends, create liens, make investments, make acquisitions, engage in mergers, change the nature of their business, engage in certain transactions with affiliates and enter into certain restrictive agreements.
Failure to maintain certain levels of liquidity will subject the Herc credit group to a contractually specified fixed charge coverage ratio of not less than
1
:1 for the four quarters most recently ended. As of
December 31, 2017
, the Company was not subject to the fixed charge coverage ratio test.
Covenants in the ABL Credit Facility restrict payment of cash dividends to any parent of Herc, including Herc Holdings, except in an aggregate amount, taken together with certain investments, acquisitions and optional prepayments, not to exceed
$200 million
. Herc may also pay additional cash dividends under the ABL Credit Facility under certain circumstances.
The ABL Credit Facility also contains certain affirmative covenants, including financial and other reporting requirements.
Events of Default
The ABL Credit Facility provides for customary events of default (subject to customary exceptions, thresholds and grace periods), including, without limitation, non-payment of principal, interest or fees, violation of covenants, material inaccuracy of representations or warranties, specified cross default and cross acceleration to other material indebtedness, certain bankruptcy events, certain ERISA events, material invalidity of guarantees or security interest, material judgments and change of control.
Other Borrowings
In June 2017, the Company's subsidiary in China entered into uncommitted credit agreements with a bank for up to the aggregate principal amount of
$10.0 million
. Interest accrues on the loans drawn under these facilities at a rate of
110%
of the prevailing base lending rates published by People's Bank of China and is payable quarterly. As of
December 31, 2017
, the Company had short-term borrowings under these facilities totaling
$2.6 million
.
Borrowing Capacity and Availability
After outstanding borrowings, the following was available to the Company under the ABL Credit Facility as of
December 31, 2017
(in millions):
|
Remaining
Capacity
|
Availability Under
Borrowing Base
Limitation
|
||||||
|
ABL Credit Facility
|
$
|
597.2
|
|
$
|
597.2
|
|
|
In addition, as of
December 31, 2017
, the Company's subsidiary in China had uncommitted credit facilities of which
$7.4 million
was available for borrowing.
Letters of Credit
As of
December 31, 2017
, the ABL Credit Facility had
$227.2 million
available under the letter of credit facility sublimit, subject to borrowing base restrictions as
$22.8 million
of standby letters of credit were issued and outstanding, upon which
none
have been drawn.
71
HERC HOLDINGS INC. AND SUBSIDIARIES
NOTES TO CONSOLIDATED FINANCIAL STATEMENTS (Continued)
Debt Issuance Costs
In connection with the issuance of the Notes and entry into the ABL Credit Facility in 2016, the Company capitalized
$41.5 million
in deferred debt issuance costs, of which
$22.5 million
were recorded to "Long-term debt" and
$19.0 million
were recorded to "Other long-term assets" in the consolidated balance sheet as of
December 31, 2017
. The debt issuance costs are being amortized to interest expense using the effective interest method for costs related to the Notes and on a straight-line basis for costs related to the ABL Credit Facility over the respective contractual terms of the applicable debt. Non-cash interest expense related to the amortization of these debt issuance costs for the years ended
December 31, 2017
and
2016
were
$6.3 million
and
$3.4 million
, respectively. The Company wrote off
$4.0 million
of unamortized deferred financing costs during the year ended December 31, 2017 related to the March and October partial redemptions of its Notes.
Note 10
—
Financing Obligations
In October 2017, Herc consummated a sale-leaseback transaction pursuant to which it sold
42
of its properties located in the U.S. for gross proceeds of approximately
$119.5 million
, and entered into a master lease agreement pursuant to which it will continue operations at those properties as a tenant. The triple net lease agreement has an initial term of
20
years, subject to extension, at Herc's option, for up to
five
additional periods of
five
years each. The sale of the properties did not qualify for sale-leaseback accounting due to continuing involvement with the properties. Therefore, the book value of the building and land will remain on the Company's consolidated balance sheet.
In connection with the sale-leaseback, the Company capitalized
$2.7 million
in deferred financing obligations issuance costs. The costs are being amortized to interest expense using the effective interest method. Non-cash interest expense related to the amortization of these costs for the year ended
December 31, 2017
was
$0.1 million
.
The Company's financing obligations consist of the following (in millions):
|
Weighted Average Effective Interest Rate at December 31, 2017
|
Maturity
|
December 31, 2017
|
||||||
|
Financing Obligations
|
4.62%
|
2037
|
$
|
118.2
|
|
|||
|
Unamortized Financing Issuance Costs
|
(2.6
|
)
|
||||||
|
Total financing obligations
|
115.6
|
|
||||||
|
Less: Current maturities of financing obligations
|
(2.7
|
)
|
||||||
|
Financing obligations, net
|
$
|
112.9
|
|
|||||
As of
December 31, 2017
, future minimum financing payments for the agreement referred to above are as follows (in millions):
|
2018
|
$
|
7.9
|
|
|
|
2019
|
7.9
|
|
||
|
2020
|
7.9
|
|
||
|
2021
|
7.9
|
|
||
|
2022
|
7.9
|
|
||
|
Thereafter
|
117.0
|
|
||
|
Total minimum financing obligations payments
|
156.5
|
|
||
|
Obligations subject to non-cash gain on future sale of property
|
32.4
|
|
||
|
Less amount representing interest (at a weighted-average interest rate of 4.62%)
|
(70.7
|
)
|
||
|
Total financing obligations
|
$
|
118.2
|
|
|
72
HERC HOLDINGS INC. AND SUBSIDIARIES
NOTES TO CONSOLIDATED FINANCIAL STATEMENTS (Continued)
Note 11
—
Employee Retirement Benefits
401(k) Savings Plan and Other Defined Contribution Plans
Prior to the Spin-Off, the Company participated in a THC-sponsored U.S. defined contribution plan covering substantially all U.S. employees (the "Hertz Savings Plan"), as well as certain non-U.S. defined contribution plans covering eligible non-U.S. employees, primarily in Canada.
On July 1, 2016, the Company established the Herc Holdings Savings Plan covering all of its U.S. employees. Following the Spin-Off, the accounts (including loans) of the Company's current and former employees were transferred from the Hertz Savings Plan to the new Herc Holdings Savings Plan.
Contributions to the plans are made by both the employee and the Company. Company contributions to these plans are based on the level of employee contributions and formulas determined by the Company. Expenses for the defined contribution plans for the years ended
December 31, 2017
,
2016
and
2015
were approximately
$9.4 million
,
$7.5 million
and
$7.4 million
, respectively.
Defined Benefit Pension and Postretirement Plans
Prior to the Spin-Off, the Company participated in certain THC-sponsored U.S. defined benefit pension and postretirement plans covering substantially all U.S. employees, as well as certain non-U.S. defined benefit plans covering eligible non-U.S. employees. Qualified U.S. employees of the Company, after completion of specified periods of service, were eligible to participate in The Hertz Corporation Account Balance Defined Benefit Pension Plan (the "Hertz Plan"), a cash balance plan that was frozen effective December 31, 2014.
In July 2016, the Company established the Herc Holdings Retirement Plan (the "Plan"), a U.S. qualified pension plan. The majority of assets and liabilities of the Hertz Plan attributable to current and former employees of the equipment rental business were transferred to the Plan following the Spin-Off based on a preliminary allocation. The final allocations and transfers were completed in April and August 2017 and were lower than the preliminary allocation, resulting in a
$3.6 million
increase to the pension liability funded status and a corresponding offset of
$2.0 million
, net of taxes, to additional paid-in capital.
Postretirement benefits, other than pensions, provide healthcare benefits, and in some instances, life insurance benefits for certain eligible retired employees in the U.S.
The Company reflects the funded status of defined benefit pension and other postretirement benefit plans as an asset or liability. This amount is defined as the difference between the fair value of plan assets and the benefit obligation. The Company is required to recognize as a component of other comprehensive income (loss), net of tax, the actuarial gains/losses and prior service credits that arise but were not previously required to be recognized as components of net periodic benefit cost. Other comprehensive income (loss) is adjusted as these amounts are later recognized in the statement of operations as components of net periodic benefit cost.
The Company’s policy for funded plans is to contribute, at a minimum, amounts required by applicable laws, regulations and union agreements. The Plan represents approximately
98%
of the Company's defined benefit plan obligations and
100%
of its plan assets. The Company did
not
make any cash contributions to the Plan or the predecessor Hertz Plan in
2017
,
2016
or
2015
and does not anticipate making any contributions during
2018
. The level of future contributions will vary, and is dependent on a number of factors including investment returns, interest rate fluctuations, plan demographics, funding regulations and the results of the final actuarial valuation.
Additionally, pursuant to various collective bargaining agreements, certain union-represented employees participate in multiemployer pension plans.
73
HERC HOLDINGS INC. AND SUBSIDIARIES
NOTES TO CONSOLIDATED FINANCIAL STATEMENTS (Continued)
The following table provides a reconciliation of benefit obligations and plan assets of the Company’s pension plans and postretirement benefit plans (in millions):
|
Pension
|
Postretirement
|
||||||||||||||
|
2017
|
2016
|
2017
|
2016
|
||||||||||||
|
Change in Projected Benefit Obligations
|
|||||||||||||||
|
Benefit obligations at beginning of year
|
$
|
149.4
|
|
$
|
143.0
|
|
$
|
1.0
|
|
$
|
1.0
|
|
|||
|
Service cost
|
—
|
|
0.1
|
|
—
|
|
—
|
|
|||||||
|
Interest cost
|
6.1
|
|
5.8
|
|
—
|
|
—
|
|
|||||||
|
Employee contributions
|
—
|
|
—
|
|
—
|
|
0.1
|
|
|||||||
|
Plan settlements
|
(6.8
|
)
|
(0.1
|
)
|
—
|
|
—
|
|
|||||||
|
Benefits paid
|
(0.3
|
)
|
(3.7
|
)
|
—
|
|
(0.1
|
)
|
|||||||
|
Net transfer
(1)
|
—
|
|
3.6
|
|
—
|
|
—
|
|
|||||||
|
Actuarial loss
|
11.6
|
|
0.7
|
|
0.1
|
|
—
|
|
|||||||
|
Benefit obligations at end of year
|
$
|
160.0
|
|
$
|
149.4
|
|
$
|
1.1
|
|
$
|
1.0
|
|
|||
|
Change in Fair Value of Plan Assets
|
|||||||||||||||
|
Fair value of plan assets at beginning of year
|
$
|
133.2
|
|
$
|
124.3
|
|
$
|
—
|
|
$
|
—
|
|
|||
|
Actual return on plan assets
|
17.9
|
|
9.4
|
|
—
|
|
—
|
|
|||||||
|
Company contributions
|
—
|
|
0.1
|
|
—
|
|
—
|
|
|||||||
|
Employee contributions
|
—
|
|
—
|
|
—
|
|
0.1
|
|
|||||||
|
Plan settlements
|
(6.8
|
)
|
(0.1
|
)
|
—
|
|
—
|
|
|||||||
|
Benefits paid
|
(0.3
|
)
|
(3.7
|
)
|
—
|
|
(0.1
|
)
|
|||||||
|
Adjustment
(2)
|
(3.6
|
)
|
3.2
|
|
—
|
|
—
|
|
|||||||
|
Fair value of plan assets at end of year
|
$
|
140.4
|
|
$
|
133.2
|
|
$
|
—
|
|
$
|
—
|
|
|||
|
Funded Status
|
$
|
(19.6
|
)
|
$
|
(16.2
|
)
|
$
|
(1.1
|
)
|
$
|
(1.0
|
)
|
|||
|
Accumulated benefit obligations
|
$
|
160.0
|
|
$
|
149.4
|
|
|||||||||
(1) The benefit obligation is determined each January 1, based upon updated participant information. In connection with the Spin-Off, the net transfer in 2016 represented a liability adjustment related to updated participant information.
(2) In connection with the Spin-Off, assets were allocated between THC and the Company in proportion to the associated liability. The adjustment for
2017
represented the final allocations and settlements with the Hertz Plan and for
2016
represented an adjustment for the updated liability.
74
HERC HOLDINGS INC. AND SUBSIDIARIES
NOTES TO CONSOLIDATED FINANCIAL STATEMENTS (Continued)
|
Pension
|
Postretirement
|
||||||||||||||
|
2017
|
2016
|
2017
|
2016
|
||||||||||||
|
Amounts Recognized in Balance Sheet
|
|||||||||||||||
|
Accrued liabilities
|
$
|
(0.1
|
)
|
$
|
(0.2
|
)
|
$
|
(0.1
|
)
|
$
|
(0.1
|
)
|
|||
|
Other long-term liabilities
|
(19.5
|
)
|
(16.0
|
)
|
(1.0
|
)
|
(0.9
|
)
|
|||||||
|
Net amount recognized
|
$
|
(19.6
|
)
|
$
|
(16.2
|
)
|
$
|
(1.1
|
)
|
$
|
(1.0
|
)
|
|||
|
Amounts Recognized in Accumulated Other Comprehensive Loss
|
|||||||||||||||
|
Net actuarial gain (loss)
|
$
|
(21.8
|
)
|
$
|
(24.2
|
)
|
$
|
0.1
|
|
$
|
0.1
|
|
|||
|
Prior service credits
|
0.2
|
|
0.2
|
|
—
|
|
—
|
|
|||||||
|
Net amount recognized
|
$
|
(21.6
|
)
|
$
|
(24.0
|
)
|
$
|
0.1
|
|
$
|
0.1
|
|
|||
|
Weighted‑Average Assumptions Used to Determine Projected Benefit Obligations
|
|||||||||||||||
|
Discount rate
|
3.6
|
%
|
4.1
|
%
|
3.5
|
%
|
4.0
|
%
|
|||||||
|
Average rate of increase in compensation
|
—
|
%
|
—
|
%
|
—
|
%
|
—
|
%
|
|||||||
|
Initial healthcare cost trend rate
|
6.4
|
%
|
6.7
|
%
|
|||||||||||
|
Ultimate healthcare cost trend rate
|
4.5
|
%
|
4.5
|
%
|
|||||||||||
The benefit obligations and fair value of plan assets for the Company’s qualified and non-qualified pension and postretirement plans with projected benefit obligations or accumulated benefit obligations in excess of plan assets are as follows (in millions):
|
|
Pension
|
Postretirement
|
|||||||||||||
|
|
2017
|
2016
|
2017
|
2016
|
|||||||||||
|
Plans with Benefit Obligations in Excess of Plan Assets
|
|||||||||||||||
|
Projected benefit obligations
|
$
|
160.0
|
|
$
|
149.4
|
|
$
|
1.1
|
|
$
|
1.0
|
|
|||
|
Accumulated benefit obligations
|
160.0
|
|
149.4
|
|
—
|
|
—
|
|
|||||||
|
Fair value of plan assets
|
140.4
|
|
133.2
|
|
—
|
|
—
|
|
|||||||
The following table sets forth the net periodic pension cost (benefit) (in millions):
|
Years Ended December 31,
|
|||||||||||
|
2017
|
2016
|
2015
|
|||||||||
|
Components of Net Periodic Pension Cost (Benefit):
|
|||||||||||
|
Service cost
|
$
|
—
|
|
$
|
0.1
|
|
$
|
0.1
|
|
||
|
Interest cost
|
6.1
|
|
5.8
|
|
5.6
|
|
|||||
|
Expected return on plan assets
|
(6.2
|
)
|
(8.0
|
)
|
(8.7
|
)
|
|||||
|
Net amortization of actuarial net loss
|
1.4
|
|
1.4
|
|
0.3
|
|
|||||
|
Settlement loss
|
0.9
|
|
—
|
|
0.2
|
|
|||||
|
Net periodic pension cost (benefit)
|
$
|
2.2
|
|
$
|
(0.7
|
)
|
$
|
(2.5
|
)
|
||
|
Weighted‑Average Assumptions Used to Determine Net Periodic Pension Cost (Benefit)
|
|||||||||||
|
Discount rate
|
4.1
|
%
|
4.3
|
%
|
3.9
|
%
|
|||||
|
Expected return on assets
|
6.5
|
%
|
7.2
|
%
|
7.4
|
%
|
|||||
|
Average rate of increase in compensation
|
—
|
%
|
4.3
|
%
|
4.0
|
%
|
|||||
The net periodic postretirement cost was insignificant in
2017
,
2016
and
2015
.
75
HERC HOLDINGS INC. AND SUBSIDIARIES
NOTES TO CONSOLIDATED FINANCIAL STATEMENTS (Continued)
The discount rate reflects the rate the Company would have to pay to purchase high-quality investments that would provide cash sufficient to settle its current pension obligations. The discount rate is determined based on a range of factors, including the rates of return on high-quality, fixed-income corporate bonds and the related expected duration of the obligations. The discount rate for the Plan is based on the rate from the Mercer Pension Discount Curve-Above Mean Yield that is appropriate for the duration of the obligations. The discount rate used to measure the pension obligation at the end of the year is also used to measure pension cost in the following year.
The expected return on plan assets for the U.S. qualified plan is based on expected future investment returns considering the target investment mix of plan assets. It reflects the average rate of earnings expected on the funds invested, or to be invested, to provide for the benefits included in the projected benefit obligations. In determining the expected long-term rate of return on plan assets, the Company considers the relative weighting of plan assets, the historical performance of total plan assets and individual asset classes and economic and other indicators of future performance.
There was no average rate of increase in compensation for
2017
as there are no longer any employees in the Plan accruing benefits. Rates prior to
2017
reflected expected long-term average rate of salary increases and were based on historic salary increase experience and management’s expectations of future salary increases.
The ultimate healthcare cost trend rates for the postretirement benefit plans are expected to be reached in
2038
. Changing the assumed health care cost trend rates by one percentage point is estimated to have an insignificant (less than
$0.1 million
) impact on the accumulated postretirement benefit obligation as of
December 31, 2017
and the
2017
aggregate of service and interest costs.
The Company expects to amortize
$0.6 million
of net actuarial losses from accumulated other comprehensive loss into net periodic pension cost (benefit) in
2018
.
Plan Assets
The Company has a long-term investment outlook for its Plan assets, which is consistent with the long-term nature of the Plan's respective liabilities.
The Plan currently has a target asset allocation of
35%
equity and
65%
fixed income. The equity portion of the assets are invested in one passively managed U.S. large cap index fund, one actively managed U.S. small/mid cap fund, one actively managed international fund and one actively managed emerging markets fund. The fixed income portion of the assets is actively managed with the majority invested in long and intermediate duration government/credit funds and smaller allocations to an actively managed high yield fund, a bank loan fund and a hard currency emerging market debt fund. A modest amount of cash is maintained to facilitate payment of benefits and plan expenses.
76
HERC HOLDINGS INC. AND SUBSIDIARIES
NOTES TO CONSOLIDATED FINANCIAL STATEMENTS (Continued)
The fair value measurements of all plan assets are based upon significant other observable inputs (Level 2), except for cash which is based upon quoted market prices in active markets for identical assets (Level 1). The following represents the Company's pension plan assets (in millions):
|
Asset Category
|
December 31, 2017
|
December 31, 2016
|
|||||
|
Cash
|
$
|
2.2
|
|
$
|
1.5
|
|
|
|
Short Term Investments
|
0.1
|
|
0.2
|
|
|||
|
Equity Securities:
|
|||||||
|
U.S. Large Cap
|
16.3
|
|
34.7
|
|
|||
|
U.S. Mid Cap
|
7.3
|
|
11.3
|
|
|||
|
U.S. Small Cap
|
1.6
|
|
9.5
|
|
|||
|
International Large Cap
|
17.8
|
|
20.8
|
|
|||
|
International Emerging Markets
|
6.8
|
|
6.9
|
|
|||
|
Fixed Income Securities:
|
|||||||
|
U.S. Treasuries
|
20.8
|
|
6.8
|
|
|||
|
Corporate Bonds
|
43.7
|
|
21.4
|
|
|||
|
Government Bonds
|
9.3
|
|
3.5
|
|
|||
|
Municipal Bonds
|
2.3
|
|
3.2
|
|
|||
|
Mortgage-Backed Securities
|
2.8
|
|
1.8
|
|
|||
|
Asset-Backed Securities
|
2.7
|
|
1.2
|
|
|||
|
Bank Loans
|
6.4
|
|
—
|
|
|||
|
Other
|
0.3
|
|
—
|
|
|||
|
140.4
|
|
122.8
|
|
||||
|
Plan assets receivable from the Hertz Plan
|
—
|
|
10.4
|
|
|||
|
Total fair value of pension plan assets
|
$
|
140.4
|
|
$
|
133.2
|
|
|
Estimated Future Benefit Payments
The following table presents estimated future benefit payments (in millions):
|
Pension
|
Postretirement
|
||||||
|
2018
|
$
|
5.5
|
|
$
|
0.1
|
|
|
|
2019
|
6.4
|
|
0.1
|
|
|||
|
2020
|
7.3
|
|
0.1
|
|
|||
|
2021
|
7.8
|
|
0.1
|
|
|||
|
2022
|
8.8
|
|
0.1
|
|
|||
|
2023-2027
|
58.3
|
|
0.5
|
|
|||
|
$
|
94.1
|
|
$
|
1.0
|
|
||
77
HERC HOLDINGS INC. AND SUBSIDIARIES
NOTES TO CONSOLIDATED FINANCIAL STATEMENTS (Continued)
Multiemployer Pension Plans
The Company contributes to several multiemployer defined benefit pension plans under collective bargaining agreements that cover certain union represented employees. The risks of participating in such plans are different from the risks of single-employer plans, in the following respects:
(a) Assets contributed to a multiemployer plan by one employer may be used to provide benefits to employees of other participating employers;
(b) If a participating employer ceases to contribute to the plan, the unfunded obligations of the plan may be borne by the remaining participating employers; and
(c) If the Company ceases to have an obligation to contribute to the multiemployer plan in which the Company had been a contributing employer, the Company may be required to pay to the plan an amount based on the underfunded status of the plan and on the history of the Company's participation in the plan prior to the cessation of its obligation to contribute. The amount that an employer that has ceased to have an obligation to contribute to a multiemployer plan is required to pay to the plan is referred to as a withdrawal liability.
The Company's participation in multiemployer plans for the annual period ended
December 31, 2017
is outlined in the table below. For each plan that is individually significant to the Company, the following information is provided:
|
•
|
The
"EIN / Pension Plan Number"
column provides the Employer Identification Number assigned to a plan by the Internal Revenue Service.
|
|
•
|
The
"Pension Protection Act Zone Status"
available is for plan years that ended in 2017 and 2016. The zone status is based on information provided to the Company and other participating employers by each plan and is certified by the plan's actuary. A plan in the "red" zone has been determined to be in "critical status," based on criteria established under the Internal Revenue Code, or the "Code," and is generally less than 65% funded. A plan in the "yellow" zone has been determined to be in "endangered status," based on criteria established under the Code, and is generally less than 80% funded. A plan in the "green" zone has been determined to be neither in "critical status" nor in "endangered status," and is generally at least 80% funded.
|
|
•
|
The
"FIP/RP Status Pending/Implemented"
column indicates whether a Funding Improvement Plan, as required under the Code to be adopted by plans in the "yellow" zone, or a Rehabilitation Plan, as required under the Code to be adopted by plans in the “red” zone, is pending or has been implemented as of the end of the plan year that ended in 2017.
|
|
•
|
The
"Surcharge Imposed"
column indicates whether a surcharge was paid during the most recent annual period presented for the Company's contributions to any plan in the red zone in accordance with the requirements of the Code. The last column lists the expiration dates of the collective bargaining agreements pursuant to which the Company contributed to the plans.
|
There are no plans where the amount contributed by the Company represents more than 5% of the total contributions to the plan for the years ended
December 31, 2017
,
2016
and
2015
.
|
(In millions)
|
EIN / Pension
Plan Number |
Pension
Protection Act Zone Status |
FIP /
RP Status Pending / Implemented |
Contributions
|
Surcharge Imposed
|
Expiration
Date of Collective Bargaining Agreement |
||||||||||||||||||
|
Pension Fund
|
2017
|
2016
|
2017
|
2016
|
2015
|
|||||||||||||||||||
|
Midwest Operating Engineers
|
36-6140097
|
Green
|
Green
|
N/A
|
$
|
0.8
|
|
$
|
0.7
|
|
$
|
0.7
|
|
N/A
|
8/31/2018
|
|||||||||
|
Other Plans
(a)
|
0.9
|
|
0.8
|
|
0.7
|
|
||||||||||||||||||
|
Total Contributions
|
$
|
1.7
|
|
$
|
1.5
|
|
$
|
1.4
|
|
|||||||||||||||
(a) Consists of
six
plans, none of which are individually significant to the Company.
78
HERC HOLDINGS INC. AND SUBSIDIARIES
NOTES TO CONSOLIDATED FINANCIAL STATEMENTS (Continued)
Note 12
—
Stock-Based Compensation
Prior to the Spin-Off, certain of the Company's employees participated in stock-based compensation plans sponsored by Hertz Holdings. Stock-based compensation awards are measured on their grant date using a fair value method and are recognized in the statement of operations over the requisite service period. The stock-based compensation plan provides for grants of both equity and cash awards, including non-qualified stock options, incentive stock options, stock appreciation rights, performance awards (shares and units), restricted awards (shares and units) and deferred stock units to key executives, employees and non-management directors.
In connection with the Spin-Off, Herc Holdings inherited the Hertz Global Holdings, Inc. 2008 Omnibus Incentive Plan, which was renamed the Herc Holdings Inc. 2008 Omnibus Incentive Plan (the “Omnibus Plan”). Outstanding equity awards at the time of the Spin-Off were adjusted and converted in accordance with a formula designed to preserve the intrinsic economic value of the original equity awards after taking into account the Spin-Off and the reverse stock split. Adjusted awards for active and former Herc employees were denominated in the common stock of Herc Holdings after the Spin-Off. Generally, the adjusted awards were subject to the same terms and vesting conditions as the original Hertz Holdings awards. The adjusted awards for performance stock units included adjusted performance metrics to reflect the separation of the vehicle rental and equipment rental businesses, and the adjusted awards contained such additional or adjusted provisions as were required.
The total number of common shares authorized for issuance under the Omnibus Plan after the reverse stock split is approximately
2,200,000
, of which
551,000
remains available as of
December 31, 2017
for future incentive awards. The share and per share data presented in this note have been retroactively adjusted to reflect the impact of the separation and conversion, including the reverse stock split.
The Company's stock-based compensation expense is included in “Selling, general and administrative” expense in the Company's consolidated statements of operations. The following table summarizes the expenses and associated income tax benefits recognized (in millions):
|
|
Years Ended December 31,
|
||||||||||
|
|
2017
|
2016
|
2015
|
||||||||
|
Compensation expense
|
$
|
10.1
|
|
$
|
5.5
|
|
$
|
2.7
|
|
||
|
Income tax benefit
|
(2.5
|
)
|
(2.1
|
)
|
(1.1
|
)
|
|||||
|
Total
|
$
|
7.6
|
|
$
|
3.4
|
|
$
|
1.6
|
|
||
Stock-based compensation expense includes expense attributable to the Company based on the terms of the awards granted under the Omnibus Plan to the participants in the Omnibus Plan. Additionally, during the years ended
December 31, 2016
and
2015
, stock-based compensation expense includes an allocation of THC's corporate and shared functional employee expenses of
$2.0 million
and
$1.8 million
, respectively, on a pre-tax basis. The expenses are for the employees of THC and its non-Herc Holdings subsidiaries whose costs of services were allocated to the Company for the applicable periods presented. For additional information related to costs allocated to the Company by THC, see
Note 20
, "
Related Party Transactions
."
As of
December 31, 2017
, there was
$17.2 million
of total unrecognized compensation cost related to non-vested stock options, restricted stock units ("RSUs") and performance stock units ("PSUs") granted under the Omnibus Plan. The total unrecognized compensation cost is expected to be recognized over the remaining
1.8
years, on a weighted average basis, of the requisite service period that began on the grant dates.
Stock Options
All stock options granted under the Omnibus Plan had a per-share exercise price of not less than the fair market value of one share of common stock on the grant date. Stock options vest based on a minimum period of service or the occurrence of events (such as a change in control, as defined in the Omnibus Plan).
No
stock options are exercisable after
ten
years from the grant date.
The Company’s practice is to grant stock options at fair market value. Options vest over
four
years with terms of
five
to
10
years, assuming continued employment with certain exceptions.
Vesting of the option awards is contingent upon meeting certain service conditions. The fair value of option grants is estimated using the Black-Scholes option pricing model. The fair value is then
79
HERC HOLDINGS INC. AND SUBSIDIARIES
NOTES TO CONSOLIDATED FINANCIAL STATEMENTS (Continued)
amortized on a straight-line basis over the requisite service periods of the awards, which is generally the vesting period. Use of a valuation model requires management to make certain assumptions with respect to selected model inputs. For stock option grants during 2016, expected volatility was calculated based on a blended volatility of peer group volatility and implied volatility as the Company does not have sufficient stock price data to calculate historical volatility. The Company used the simplified method under Staff Accounting Bulletin Topic 14,
Share-Based Payment
as the basis for estimating the expected life of an option because the exercise data for participants who held options as employees of a subsidiary of our former parent is not necessarily indicative of future exercise patterns. The risk-free interest rate was based on U.S. Treasury zero-coupon issues with a remaining term which approximates the expected life assumed at the date of grant. The compensation expense recognized for all stock-based awards is net of estimated forfeitures. Forfeitures were estimated based on an analysis of actual option forfeitures.
The weighted average assumptions used in the Black-Scholes option pricing model are as follows:
|
Years Ended December 31,
|
|||||
|
2017
|
2016
|
2015
|
|||
|
Expected volatility
|
N/A
|
50%
|
39.0%
|
||
|
Expected dividend yield
|
N/A
|
—%
|
—%
|
||
|
Expected term (years)
|
N/A
|
4.8
|
5.0
|
||
|
Risk-free interest rate
|
N/A
|
1.09%
|
1.22%
|
||
The weighted average per share grant date fair values of options granted during
2016
and
2015
were
$14.28
and
$18.06
, respectively. There were no options granted during
2017
.
A summary of option activity under the Omnibus Plan is presented below.
|
Options
|
Weighted
Average Exercise Price |
Weighted
Average Remaining Contractual Term (Years) |
Aggregate Intrinsic
Value (in millions of dollars) (a) |
|||||||
|
Outstanding at December 31, 2016
|
529,675
|
|
$
|
37.90
|
|
|||||
|
Granted
|
—
|
|
—
|
|
||||||
|
Exercised
|
(18,940
|
)
|
37.50
|
|
||||||
|
Forfeited or expired
|
(70,093
|
)
|
41.91
|
|
||||||
|
Outstanding at December 31, 2017
|
440,642
|
|
$
|
37.25
|
|
|||||
|
Vested and Unvested Expected to Vest at December 31, 2017
|
292,051
|
|
$
|
36.31
|
|
5.3
|
7.7
|
|||
|
Exercisable at December 31, 2017
|
127,891
|
|
$
|
39.91
|
|
4.6
|
3.0
|
|||
(a) Market price per share on December 29, 2017, the last trading day of the year, was
$62.61
. The intrinsic value is zero for options with exercise prices above market value.
Stock options as of
December 31, 2017
:
|
Options Outstanding
|
Options Exercisable
|
||||||||||||||||||
|
Range of Exercise Prices
|
Number Outstanding
|
Weighted
Average Exercise Price |
Weighted
Average Remaining Contractual Term (Years) |
Number Outstanding
|
Weighted
Average Exercise Price |
Weighted
Average Remaining Contractual Term (Years) |
|||||||||||||
|
$20.00-30.00
|
6,383
|
|
$
|
27.58
|
|
1.3
|
|
6,383
|
|
$
|
27.58
|
|
1.3
|
|
|||||
|
30.01-40.00
|
360,895
|
|
33.19
|
|
5.6
|
|
85,957
|
|
33.19
|
|
5.6
|
|
|||||||
|
40.01-50.00
|
5,997
|
|
42.59
|
|
4.8
|
|
3,360
|
|
43.14
|
|
3.9
|
|
|||||||
|
50.01-60.00
|
50,428
|
|
55.86
|
|
2.5
|
|
23,407
|
|
56.12
|
|
2.5
|
|
|||||||
|
60.01-70.00
|
—
|
|
—
|
|
—
|
|
—
|
|
—
|
|
—
|
|
|||||||
|
70.01-80.00
|
16,939
|
|
70.14
|
|
2.1
|
|
8,784
|
|
70.14
|
|
2.1
|
|
|||||||
|
440,642
|
|
$
|
37.25
|
|
127,891
|
|
$
|
39.91
|
|
||||||||||
80
HERC HOLDINGS INC. AND SUBSIDIARIES
NOTES TO CONSOLIDATED FINANCIAL STATEMENTS (Continued)
Additional information pertaining to stock option activity under the Omnibus Plan is as follows (in millions):
|
Year Ended December 31,
|
|||||||||||
|
2017
|
2016
|
2015
|
|||||||||
|
Aggregate intrinsic value of stock options exercised
(a)
|
$
|
0.3
|
|
$
|
0.1
|
|
$
|
—
|
|
||
|
Cash received from the exercise of stock options
(b)
|
0.7
|
|
0.4
|
|
—
|
|
|||||
|
Tax benefit realized on exercise of stock options
|
0.1
|
|
—
|
|
—
|
|
|||||
|
(a)
|
The intrinsic value is the difference between the market value of the shares on the exercise date and the exercise price of the option.
|
|
(b)
|
In addition to the cash received in the table above, cash received from exercise of stock options by Hertz Holdings employees prior to the Spin-Off for 2016 and 2015 was
$9.6 million
and
$5.1 million
, respectively, as reflected in the accompanying consolidated statements of cash flows.
|
Performance Stock Units
PSUs granted under the Omnibus Plan will vest based on the achievement of pre-determined performance goals over performance periods determined by the Company's Compensation Committee. Each of the units granted under the Omnibus Plan represent the right to receive one share of the Company's common stock on a specified future date. Compensation expense for PSUs is based on the grant date fair value, and is recognized ratably over the
three
-year vesting period. In addition to the service vesting condition, the PSUs have an additional vesting condition which calls for the number of units to be awarded being based on the achievement of certain performance measures over the applicable measurement period. In the event of an employee's death or disability, a pro rata portion of the employee's PSUs will vest to the extent performance goals are achieved at the end of the performance period.
A summary of the PSU activity under the Omnibus Plan is presented below.
|
Units
|
Weighted
Average Grant Date Fair Value |
|||||
|
Nonvested at December 31, 2016
|
144,964
|
|
$
|
36.02
|
|
|
|
Granted
|
122,428
|
|
47.88
|
|
||
|
Vested
|
—
|
|
—
|
|
||
|
Forfeited
|
(20,215
|
)
|
38.79
|
|
||
|
Nonvested at December 31, 2017
|
247,177
|
|
$
|
41.67
|
|
|
The weighted average per share grant-date fair values of PSUs granted during
2017
,
2016
and
2015
were
$47.88
,
$29.77
and
$59.50
, respectively. The total fair value of PSUs that vested during
2015
was
$0.6 million
. There were
no
PSUs that vested during
2017
or
2016
.
PSUs granted in 2017 include vesting conditions based on the achievement of the Company's return on invested capital performance measure over a three-year period from 2017 to 2019. PSUs granted in 2016 include vesting conditions based on the achievement of the Company's corporate EBITDA performance measure over a
three
-year period from 2016 to 2018. PSUs granted in
2015
include vesting conditions based on the achievement of certain performance measures over a
three
-year period from 2015 to 2017. For 2015, the performance measure was based on Hertz Holdings' corporate EBITDA performance measure which was not achieved and, therefore, the PSUs for the 2015 performance period were forfeited. In connection with the Spin-Off, the awards' vesting condition for the 2016 and 2017 performance periods was changed by Hertz Holdings to a Herc stand-alone EBITDA performance measure. The change in the performance measure was treated as a modification of the awards and did not have a significant impact on the Company's results of operations.
Restricted Stock Units
RSUs granted under the Omnibus Plan will vest based on a minimum period of service or the occurrence of events (such as a change in control, as defined in the Omnibus Plan) specified by the Compensation Committee. Compensation expense for RSUs is based on the grant date fair value, and is recognized ratably over the vesting period which generally ranges from
one
to
three
years.
81
HERC HOLDINGS INC. AND SUBSIDIARIES
NOTES TO CONSOLIDATED FINANCIAL STATEMENTS (Continued)
A summary of the RSU activity under the Omnibus Plan is presented below.
|
Units
|
Weighted
Average Grant Date Fair Value |
|||||
|
Nonvested at December 31, 2016
|
297,898
|
|
$
|
32.63
|
|
|
|
Granted
|
194,598
|
|
45.61
|
|
||
|
Vested
|
(42,920
|
)
|
37.44
|
|
||
|
Forfeited
|
(46,399
|
)
|
37.39
|
|
||
|
Nonvested at December 31, 2017
|
403,177
|
|
$
|
38.33
|
|
|
The weighted average per share grant date fair values of RSUs granted during
2017
,
2016
and
2015
were
$45.61
,
$32.36
and
$56.13
, respectively. The total fair value of RSUs that vested during
2017
,
2016
and
2015
was
$1.6 million
,
$0.3 million
and
$0.6 million
, respectively.
Note 13
—
Income Taxes
For 2015 and the first half of 2016, Herc is included in the consolidated income tax returns of Hertz Holdings. With respect to these time periods, the income tax provision included in these financial statements has been calculated using a separate return basis, as if Herc filed separate consolidated group income tax returns, and was not part of the consolidated income tax returns of Hertz Holdings.
In
December
2017
the Tax Cuts and Jobs Act of 2017 (the "2017 Tax Act") was enacted. This legislation had significant impact on the current tax environment in the U.S. Subsequent to the enactment of the 2017 Tax Act, the Securities and Exchange Commission ("SEC") provided guidance on how public companies should report the effects of the 2017 Tax Act in future SEC filings. The Company has performed an initial analysis of the 2017 Tax Act in accordance with this guidance. The Company recognized an income tax net benefit of
$207.1 million
for the year ended
December 31, 2017
associated with the items that were reasonably estimable. This net benefit reflects (i) a
$245.2 million
revaluation of the Company's net deferred tax liability based on a U.S. federal tax rate of
21%
, partially offset by (ii) a one-time transition tax of
$38.1 million
on unremitted foreign earnings and profits due to the utilization of net operating loss ("NOL") carryforwards.
Below is a summary of the key provisions of the 2017 Tax Act:
Tax Rate Reduction
The 2017 Tax Act reduces the federal income tax rate from
35%
to
21%
beginning in 2018. Accordingly, the Company recorded an estimated tax benefit of
$245.2 million
for the year ended
December 31, 2017
associated with the reduction in net deferred tax liabilities.
Deemed Repatriation
Under the 2017 Tax Act, companies are required, as part of the
December 31, 2017
income tax reporting, to calculate the amount of previously unrepatriated earnings from foreign operations and remit a one-time tax (“Toll Charge”) on these previously untaxed earnings. The Company has recognized a tax expense of
$38.1 million
associated with this deemed repatriation for the year ended
December 31, 2017
. The reported amount is an estimate of the expected tax based on information available as of
December 31, 2017
including, but not limited to, cumulative earnings and profits from foreign operations, cash equivalent balances, and current state impact on the earnings. These estimates will be finalized during 2018. The Company elected to utilize current NOL carryforwards to offset the deemed repatriation income and therefore recorded no income taxes payable for U.S. federal tax purposes.
82
HERC HOLDINGS INC. AND SUBSIDIARIES
NOTES TO CONSOLIDATED FINANCIAL STATEMENTS (Continued)
Interest Expense Limitation
Beginning in 2018, interest expense deductions are limited to 30% of adjusted taxable income, subject to certain provisions. No current tax has been recorded with respect to this item as the item is not effective until 2018. The Company will review the impact of this provision on a current basis during 2018.
Territorial Taxation
The 2017 Tax Act generally allows for the receipt of foreign dividends on a tax-free basis beginning in 2018. However, the 2017 Tax Act also enacts various new taxes with respect to transactions with, and operations of, foreign related parties. As of
December 31, 2017
, the Company does not believe this provision impacts currently reported deferred taxes. As a result, the Company has not recorded any tax impacts associated with this provision. The Company will continue to review the impact of this provision, along with new guidance provided by the Internal Revenue Service ("IRS"), during 2018.
Fixed Assets
The 2017 Tax Act allows for a special 100% bonus depreciation deduction to be claimed on many fixed assets purchased subsequent to September 27, 2017 through December 2022. Additionally, the 2017 Tax Act terminated the availability of Section 1031 LKE treatment with respect to personal property items. As a result, the Company has elected to cease matching asset sales with newly acquired assets effective October 1, 2017. Likewise, the Company has elected to begin utilizing the 100% expensing provision effective as of October 1, 2017.
The Company is still analyzing the 2017 Tax Act and refining calculations, which could potentially impact the measurement of the tax balances. A substantial portion of the expected
2017
impact of the enactment of the 2017 Tax Act is reflected in the tables below.
The components of income (loss) before income taxes for the periods were as follows (in millions):
|
Years Ended December 31,
|
|||||||||||
|
2017
|
2016
|
2015
|
|||||||||
|
Domestic
|
$
|
(59.2
|
)
|
$
|
2.5
|
|
$
|
102.4
|
|
||
|
Foreign
|
(5.2
|
)
|
(7.4
|
)
|
54.5
|
|
|||||
|
Income (loss) before income taxes
|
$
|
(64.4
|
)
|
$
|
(4.9
|
)
|
$
|
156.9
|
|
||
The provision for income taxes consists of the following (in millions):
|
Years Ended December 31,
|
|||||||||||
|
2017
|
2016
|
2015
|
|||||||||
|
Current:
|
|||||||||||
|
Federal
|
$
|
2.0
|
|
$
|
—
|
|
$
|
15.8
|
|
||
|
Foreign
|
5.0
|
|
2.4
|
|
3.3
|
|
|||||
|
State and local
|
(3.3
|
)
|
0.1
|
|
4.2
|
|
|||||
|
Total current
|
3.7
|
|
2.5
|
|
23.3
|
|
|||||
|
Deferred:
|
|||||||||||
|
Federal
|
(214.9
|
)
|
3.5
|
|
20.4
|
|
|||||
|
Foreign
|
(4.6
|
)
|
(2.3
|
)
|
0.1
|
|
|||||
|
State and local
|
(8.9
|
)
|
11.1
|
|
1.8
|
|
|||||
|
Total deferred
|
(228.4
|
)
|
12.3
|
|
22.3
|
|
|||||
|
Total income tax (benefit) provision
|
$
|
(224.7
|
)
|
$
|
14.8
|
|
$
|
45.6
|
|
||
83
HERC HOLDINGS INC. AND SUBSIDIARIES
NOTES TO CONSOLIDATED FINANCIAL STATEMENTS (Continued)
The principal items of the U.S. and foreign net deferred tax assets and liabilities are as follows (in millions):
|
December 31, 2017
|
December 31, 2016
|
||||||
|
Deferred tax assets:
|
|||||||
|
Employee benefit plans
|
$
|
5.4
|
|
$
|
7.1
|
|
|
|
Tax credit carryforwards
|
4.2
|
|
1.5
|
|
|||
|
Accrued and prepaid expenses
|
31.7
|
|
38.6
|
|
|||
|
Net operating loss carryforwards
|
46.5
|
|
90.7
|
|
|||
|
Total deferred tax assets
|
87.8
|
|
137.9
|
|
|||
|
Less: valuation allowance
|
(7.6
|
)
|
(4.5
|
)
|
|||
|
Total net deferred tax assets
|
80.2
|
|
133.4
|
|
|||
|
Deferred tax liabilities:
|
|||||||
|
Deferred state gain
|
(5.8
|
)
|
(5.5
|
)
|
|||
|
Depreciation on tangible assets
|
(469.7
|
)
|
(721.1
|
)
|
|||
|
Intangible assets
|
(66.2
|
)
|
(98.9
|
)
|
|||
|
Total deferred tax liabilities
|
(541.7
|
)
|
(825.5
|
)
|
|||
|
Net deferred tax liability
|
$
|
(461.5
|
)
|
$
|
(692.1
|
)
|
|
In connection with the Spin-Off in 2016, NOL carryforwards were split between the Company and New Hertz pursuant to the Code and regulations. The split of net operating loss carryforwards was adjusted in 2017 after the income tax returns were finalized. Accordingly, the Company recorded an adjustment to the federal and state net operating losses of
$0.9 million
and
$4.0 million
, respectively. As of
December 31, 2017
, deferred tax assets of
$28.5 million
, net of
$0.2 million
recorded for uncertain tax positions, were recorded for unutilized federal NOL carryforwards of
$28.7 million
. The total federal NOL carryforwards are
$136.1 million
. The federal NOL carryforwards begin to expire in
2031
. State NOL carryforwards have generated a deferred tax asset of
$14.1 million
. The state NOL carryforwards expire over various years beginning in 2018 depending upon the particular jurisdictions.
As of
December 31, 2017
, deferred tax assets of
$4.2 million
were recorded for federal Alternative Minimum Tax, Fuel Tax Credits and various non-U.S. Tax Credits.
As of
December 31, 2017
, deferred tax assets of
$3.9 million
were recorded for foreign NOL carryforwards of
$16.3 million
. The foreign NOL carryforwards of
$16.3 million
include
$1.7 million
that have an indefinite carryforward period and associated deferred tax assets of
$0.3 million
. The remaining foreign NOL carryforwards of
$14.6 million
are subject to expiration beginning in 2018 and have associated deferred tax assets of
$3.6 million
.
In determining the valuation allowance, an assessment of positive and negative evidence was performed regarding realization of the net deferred tax assets in accordance with ASC Topic 740,
Accounting for Income Taxes
. This assessment included the evaluation of scheduled reversals of deferred tax liabilities, the availability of carryforwards and estimates of projected future taxable income. Based on the assessment, as of
December 31, 2017
, total valuation allowances of
$7.6 million
were recorded against deferred tax assets. Although realization is not assured, the Company has concluded that it is more likely than not the remaining deferred tax assets of
$80.2 million
will be realized and as such no valuation allowance has been provided on these assets.
84
HERC HOLDINGS INC. AND SUBSIDIARIES
NOTES TO CONSOLIDATED FINANCIAL STATEMENTS (Continued)
The income tax in the accompanying consolidated statements of operations differs from the income tax calculated by applying the statutory federal income tax rate to income (loss) before income taxes due to the following (in millions):
|
Years Ended December 31,
|
|||||||||||
|
2017
|
2016
|
2015
|
|||||||||
|
Income tax (benefit) provision at statutory rate
|
$
|
(22.5
|
)
|
$
|
(1.7
|
)
|
$
|
54.9
|
|
||
|
Increases (decreases) resulting from:
|
|||||||||||
|
Foreign taxes
|
1.9
|
|
0.8
|
|
2.2
|
|
|||||
|
State and local income taxes, net of federal income tax
|
0.9
|
|
11.2
|
|
4.5
|
|
|||||
|
Federal and foreign
|
0.5
|
|
3.2
|
|
(0.3
|
)
|
|||||
|
Enactment of the 2017 Tax Act
|
(207.1
|
)
|
—
|
|
—
|
|
|||||
|
Finalization of estimates from Spin-Off
|
(0.9
|
)
|
—
|
|
—
|
|
|||||
|
Change in valuation allowance
|
2.8
|
|
1.3
|
|
3.8
|
|
|||||
|
Benefit from sale of non-U.S. operations
|
—
|
|
—
|
|
(20.4
|
)
|
|||||
|
All other items, net
|
(0.3
|
)
|
—
|
|
0.9
|
|
|||||
|
Income tax (benefit) provision
|
$
|
(224.7
|
)
|
$
|
14.8
|
|
$
|
45.6
|
|
||
The income tax benefit for
2017
is approximately
$202.2 million
greater than the benefit calculated using the statutory federal tax rate. The increase is primarily due to the
$207.1 million
net impact of the 2017 Tax Act. State and local income taxes are primarily impacted by
$13.5 million
for state rate and state impacts of the federal rate reduction, offset by a
$7.3 million
benefit from the finalization of the 2016 tax returns.
As a result of the 2017 Tax Act, previously undistributed earnings from foreign subsidiaries are deemed to have been repatriated as of December 31, 2017 for federal income tax purposes, while uncertainties exist with respect to the impact on state income taxes. Beginning in 2018, companies will generally be able to repatriate earnings from foreign subsidiaries with no U.S. federal income tax impact. However, certain foreign limitations may still exist including, but not limited to, withholding taxes. Additionally, the repatriated earnings may have state tax expense associated with the transaction. As December 31, 2017, deferred tax liabilities have not been recorded for such earnings because, while it is management’s current intention to permanently reinvest such undistributed earnings offshore, management is continuing to evaluate this position. Due to uncertainty it is not practicable to estimate the actual amount of such deferred tax liabilities. Further, the Company is still analyzing the 2017 Tax Act which could potentially impact the measurement of certain tax balances.
As a consequence of the Company’s inclusion in the Hertz Global Holdings, Inc. consolidated income tax returns, it is joint and severally liable, with other members of the consolidated group, for any additional taxes that may be assessed against Hertz Global Holdings, Inc. for the periods prior to
June 30, 2016
. As of
December 31, 2017
and
December 31, 2016
, the Company has recorded a
$0.2 million
liability related to New Hertz which could impact the NOL allocated to the Company and which is included in the consolidated group for the first half of 2016. The Company classifies net, after-tax interest and penalties related to the liabilities for unrecognized tax benefits as a component of “Income tax benefit (provision)” in the consolidated statements of operations. However,
no
penalties or interest have been calculated on the balance of unrecognized tax benefits for the years ended
December 31, 2017
,
2016
and
2015
as any additional taxable income would be covered by the Company's NOL carryforwards.
The Company conducts business globally and, as a result, files one or more income tax returns in the U.S. and non-U.S. jurisdictions. In the normal course of business, the Company is subject to examination by taxing authorities throughout the world. The open tax years for these jurisdictions span from 2005 to 2016. The IRS completed its audit of the Company's 2007 to 2011 consolidated income tax returns, which Herc is included in, and had no changes to the previously filed tax returns. The Company was recently notified that the IRS will be auditing the 2014 and 2015 income tax returns. Several U.S. state and non-U.S. jurisdictions are under audit. The Company does not expect any material assessments resulting from these audits.
85
HERC HOLDINGS INC. AND SUBSIDIARIES
NOTES TO CONSOLIDATED FINANCIAL STATEMENTS (Continued)
Note 14
—
Leases
The Company has various operating leases under which the following amounts were expensed (in millions):
|
Years Ended December 31,
|
|||||||||||
|
2017
|
2016
|
2015
|
|||||||||
|
Real estate
|
$
|
32.2
|
|
$
|
31.8
|
|
$
|
31.5
|
|
||
|
Office and other equipment
|
2.8
|
|
1.2
|
|
1.7
|
|
|||||
|
35.0
|
|
33.0
|
|
33.2
|
|
||||||
|
Sublease income
|
(0.4
|
)
|
(0.5
|
)
|
(0.5
|
)
|
|||||
|
Total
|
$
|
34.6
|
|
$
|
32.5
|
|
$
|
32.7
|
|
||
As of
December 31, 2017
,
minimum obligations under existing agreements referred to above are as follows (in millions):
|
2018
|
$
|
32.6
|
|
|
|
2019
|
27.9
|
|
||
|
2020
|
21.2
|
|
||
|
2021
|
16.0
|
|
||
|
2022
|
12.7
|
|
||
|
After 2022
|
56.3
|
|
||
|
Total
|
$
|
166.7
|
|
|
The future minimum rent payments in the above table have been reduced by minimum future sublease rental inflows in the aggregate amount of
$1.4 million
as of
December 31, 2017
.
Many of the Company's real estate leases require the Company to pay or reimburse operating expenses, such as real estate taxes, insurance and maintenance expenses. Such obligations are not reflected in the table of minimum future obligations appearing immediately above. The Company operates from various leased premises under operating leases with terms of up to
15
years. A number of the Company's operating leases contain renewal options. These renewal options vary, but the majority include clauses for renewal for various term lengths at various rates, both fixed and market.
Capital Leases
As of
December 31, 2017
and
2016
, the Company has gross assets under capital leases of
$107.4 million
and
$109.9 million
, respectively. Capital lease obligations consist primarily of service vehicle leases with periods expiring at various dates through 2020.
As of
December 31, 2017
, future minimum capital lease payments for existing agreements referred to above are as follows (in millions):
|
2018
|
$
|
22.1
|
|
|
|
2019
|
23.2
|
|
||
|
2020
|
12.0
|
|
||
|
Total minimum lease payments
|
57.3
|
|
||
|
Less amount representing interest (at a weighted-average interest rate of 4.02%)
|
(3.6
|
)
|
||
|
Total capital lease obligations
|
$
|
53.7
|
|
|
86
HERC HOLDINGS INC. AND SUBSIDIARIES
NOTES TO CONSOLIDATED FINANCIAL STATEMENTS (Continued)
Note 15
—
Accumulated Other Comprehensive Income (Loss)
The changes in the accumulated other comprehensive income (loss) balance by component (net of tax) are presented in the tables below (in millions).
|
Pension and Other Post-Employment Benefits
|
Unrealized Gains on Hedging Instruments
|
Foreign Currency Items
|
Accumulated Other Comprehensive Income (Loss)
|
||||||||||||
|
Balance at December 31, 2016
|
$
|
(14.6
|
)
|
$
|
—
|
|
$
|
(104.1
|
)
|
$
|
(118.7
|
)
|
|||
|
Other comprehensive income before reclassification
|
—
|
|
1.3
|
|
17.7
|
|
19.0
|
|
|||||||
|
Amounts reclassified from accumulated other comprehensive loss
|
1.1
|
|
—
|
|
—
|
|
1.1
|
|
|||||||
|
Net current period other comprehensive income
|
1.1
|
|
1.3
|
|
17.7
|
|
20.1
|
|
|||||||
|
Balance at December 31, 2017
|
$
|
(13.5
|
)
|
$
|
1.3
|
|
$
|
(86.4
|
)
|
$
|
(98.6
|
)
|
|||
|
Pension and Other Post-Employment Benefits
|
Unrealized Gains on Hedging Instruments
|
Foreign Currency Items
|
Accumulated Other Comprehensive Income (Loss)
|
||||||||||||
|
Balance at December 31, 2015
|
$
|
(15.5
|
)
|
$
|
—
|
|
$
|
(119.9
|
)
|
$
|
(135.4
|
)
|
|||
|
Other comprehensive income before reclassification
|
—
|
|
—
|
|
15.8
|
|
15.8
|
|
|||||||
|
Amounts reclassified from accumulated other comprehensive loss
|
0.9
|
|
—
|
|
—
|
|
0.9
|
|
|||||||
|
Net current period other comprehensive income
|
0.9
|
|
—
|
|
15.8
|
|
16.7
|
|
|||||||
|
Balance at December 31, 2016
|
$
|
(14.6
|
)
|
$
|
—
|
|
$
|
(104.1
|
)
|
$
|
(118.7
|
)
|
|||
Amounts reclassified from accumulated other comprehensive income (loss) to net income (loss) were as follows (in millions):
|
Years Ended December 31,
|
|||||||||||||
|
2017
|
2016
|
2015
|
Statement of Operations Caption
|
||||||||||
|
Amortization of actuarial losses
|
$
|
1.4
|
|
$
|
1.4
|
|
$
|
0.3
|
|
Selling, general and administrative
|
|||
|
Settlement loss
|
0.9
|
|
—
|
|
0.2
|
|
Selling, general and administrative
|
||||||
|
Reclassification of foreign currency items to other income, net
(a)
|
—
|
|
—
|
|
(41.6
|
)
|
Other income, net
|
||||||
|
Total
|
2.3
|
|
1.4
|
|
(41.1
|
)
|
|||||||
|
Tax benefit
|
(1.2
|
)
|
(0.5
|
)
|
(0.2
|
)
|
Income tax benefit (provision)
|
||||||
|
Total reclassifications for the period
|
$
|
1.1
|
|
$
|
0.9
|
|
$
|
(41.3
|
)
|
||||
(a) Related to the sale of the Company's operations in France and Spain in October 2015, see
Note 7
, "
Divestitures
."
Note 16
—
Commitments and Contingencies
Legal Proceedings
From time to time the Company is a party to various legal proceedings. Summarized below are the most significant legal proceedings to which the Company is a party.
In re Hertz Global Holdings, Inc. Securities Litigation
—In November 2013, a putative shareholder class action, Pedro Ramirez, Jr. v. Hertz Global Holdings, Inc., et al., was commenced in the U.S. District Court for the District of New Jersey naming Hertz Holdings and certain of its officers as defendants and alleging violations of the federal securities laws. The complaint alleged that Hertz Holdings made material misrepresentations and/or omission of material fact in its public disclosures during the period from February 25, 2013 through November 4, 2013, in violation of Section 10(b) and 20(a) of the Securities Exchange Act of 1934, as amended (the "Exchange Act"), and Rule 10b-5 promulgated
87
HERC HOLDINGS INC. AND SUBSIDIARIES
NOTES TO CONSOLIDATED FINANCIAL STATEMENTS (Continued)
thereunder. The complaint sought unspecified monetary damages on behalf of the purported class and an award of costs and expenses, including counsel fees and expert fees. In June 2014, Hertz Holdings moved to dismiss the amended complaint. In October 2014, the court granted Hertz Holdings’ motion to dismiss without prejudice, allowing the plaintiff to amend the complaint a second time. In November 2014, plaintiff filed a second amended complaint which shortened the putative class period and made allegations that were not substantively very different than the allegations in the prior complaint. In early 2015, Hertz Holdings moved to dismiss the second amended complaint. In July 2015, the court granted Hertz Holdings’ motion to dismiss without prejudice, allowing plaintiff to file a third amended complaint. In August 2015, plaintiff filed a third amended complaint which included additional allegations, named additional then-current and former officers as defendants and expanded the putative class period to extend from February 14, 2013 to July 16, 2015. In November 2015, Hertz Holdings moved to dismiss the third amended complaint. The plaintiff then sought leave to add a new plaintiff because of challenges to the standing of the first plaintiff. The court granted plaintiff leave to file a fourth amended complaint to add the new plaintiff, and the new complaint was filed on March 1, 2016. Hertz Holdings and the individual defendants moved to dismiss the fourth amended complaint with prejudice on March 24, 2016. In April 2017, the court granted Hertz Holdings' and the individual defendants' motions to dismiss and dismissed the action with prejudice. In May 2017, plaintiff filed a notice of appeal and, in October 2017, the U.S. Court of Appeals for the Third Circuit issued a briefing schedule. Briefing was completed in February 2018.
Governmental Investigations
—In June 2014, Hertz Holdings was advised by the staff of the New York Regional Office of the SEC that it is investigating the events disclosed in certain of Hertz Holdings’ filings with the SEC. In addition, in December 2014 a state securities regulator requested information from Hertz Holdings regarding the same or similar events. In May 2017, the state securities regulator advised New Hertz that it had closed its investigation. Starting in June 2016, Hertz Holdings and New Hertz have had communications with the United States Attorney’s Office for the District of New Jersey regarding the same or similar events. New Hertz is responsible for managing these matters. The investigations and communications generally involve the restatements included in Hertz Holdings’ 2014 Form 10-K and related accounting for prior periods. Among other matters, the restatements included in Hertz Holdings’ 2014 Form 10-K addressed a variety of accounting matters involving THC's former Brazil vehicle rental operations. Hertz Holdings identified certain activities by THC's former vehicle rental operations in Brazil that may raise issues under the Foreign Corrupt Practices Act and other federal and local laws. THC has self-reported these issues to appropriate government entities, and these issues continue to be investigated. The Company has and intends to continue to cooperate with all governmental requests related to the foregoing. At this time, the Company is currently unable to predict the outcome of these proceedings and issues or to reasonably estimate the range of possible losses, which could be material.
In addition, the Company is subject to a number of claims and proceedings that generally arise in the ordinary conduct of its business. These matters include, but are not limited to, claims arising from the operation of rented equipment and workers' compensation claims. The Company does not believe that the liabilities arising from such ordinary course claims and proceedings will have a material adverse effect on the Company's consolidated financial position, results of operations or cash flows.
The Company has established reserves for matters where the Company believes the losses are probable and can be reasonably estimated. For matters where a reserve has not been established, including certain of those described above, the ultimate outcome or resolution cannot be predicted at this time, or the amount of ultimate loss, if any, cannot be reasonably estimated. Litigation is subject to many uncertainties and there can be no assurance as to the outcome of the individual litigated matters. It is possible that certain of the actions, claims, inquiries or proceedings, including those discussed above, could be decided unfavorably to the Company or any of its subsidiaries involved. Accordingly, it is possible that an adverse outcome from such a proceeding could exceed the amount accrued in an amount that could be material to the Company's consolidated financial condition, results of operations or cash flows in any particular reporting period.
Off-Balance Sheet Commitments
Indemnification Obligations
In the ordinary course of business, the Company executes contracts involving indemnification obligations customary in the relevant industry and indemnifications specific to a transaction such as the sale of a business or assets. These indemnification obligations might include claims relating to the following: environmental matters; intellectual property rights; governmental regulations; employment-related matters; customer, supplier and other commercial contractual relationships; condition of assets; and financial or other matters. Performance under these indemnification obligations would generally be triggered by a breach of terms of the
88
HERC HOLDINGS INC. AND SUBSIDIARIES
NOTES TO CONSOLIDATED FINANCIAL STATEMENTS (Continued)
contract or by a third party claim. The Company regularly evaluates the probability of having to incur costs associated with these indemnification obligations and has accrued for expected losses that are probable and estimable. The types of indemnification obligations for which payments are possible include the following:
The Spin-Off
In connection with the Spin-Off, pursuant to the separation and distribution agreement (as discussed in
Note 21
, "
Arrangements with New Hertz
"), the Company has assumed the liability for, and control of, all pending and threatened legal matters related to its equipment rental business and related assets, as well as assumed or retained liabilities, and will indemnify New Hertz for any liability arising out of or resulting from such assumed legal matters. The separation and distribution agreement also provides for certain liabilities to be shared by the parties. The Company is responsible for a portion of these shared liabilities (typically
15%
), as set forth in that agreement. New Hertz is responsible for managing the settlement or other disposition of such shared liabilities. Pursuant to the tax matters agreement, the Company has agreed to indemnify New Hertz for any resulting taxes and related losses if the Company takes or fails to take any action (or permits any of its affiliates to take or fail to take any action) that causes the Spin-Off and related transactions to be taxable, or if there is an acquisition of the equity securities or assets of the Company or of any member of the Company’s group that causes the Spin-Off and related transactions to be taxable.
Environmental
The Company has indemnified various parties for the costs associated with remediating numerous hazardous substance storage, recycling or disposal sites in many states and, in some instances, for natural resource damages. The amount of any such expenses or related natural resource damages for which the Company may be held responsible could be substantial. The probable expenses that the Company expects to incur for such matters have been accrued, and those expenses are reflected in the Company's consolidated financial statements. As of
December 31, 2017
and
December 31, 2016
, the aggregate amounts accrued for environmental liabilities, including liability for environmental indemnities, reflected in the Company's consolidated balance sheets in "Accrued liabilities" were
$0.1 million
and
$0.2 million
, respectively. The accrual generally represents the estimated cost to study potential environmental issues at sites deemed to require investigation or clean-up activities, and the estimated cost to implement remediation actions, including on-going maintenance, as required. Cost estimates are developed by site. Initial cost estimates are based on historical experience at similar sites and are refined over time on the basis of in-depth studies of the sites. For many sites, the remediation costs and other damages for which the Company ultimately may be responsible cannot be reasonably estimated because of uncertainties with respect to factors such as the Company's connection to the site, the materials there, the involvement of other potentially responsible parties, the application of laws and other standards or regulations, site conditions, and the nature and scope of investigations, studies, and remediation to be undertaken (including the technologies to be required and the extent, duration, and success of remediation).
Note 17
—
Financial Instruments
The Company established risk management policies and procedures, which seek to reduce the Company’s risk exposure to fluctuations in foreign currency exchange rates and interest rates. However, there can be no assurance that these policies and procedures will be successful. Although the instruments utilized involve varying degrees of credit, market and interest risk, the counterparties to the agreements are expected to perform fully under the terms of the agreements. The Company monitors counterparty credit risk, including lenders, on a regular basis, but cannot be certain that all risks will be discerned or that its risk management policies and procedures will always be effective. Additionally, in the event of default under the Company’s master derivative agreements, the non-defaulting party has the option to set-off any amounts owed with regard to open derivative positions.
89
HERC HOLDINGS INC. AND SUBSIDIARIES
NOTES TO CONSOLIDATED FINANCIAL STATEMENTS (Continued)
Foreign Currency Exchange Rate Risk
The Company’s objective in managing exposure to foreign currency fluctuations is to limit the exposure of certain cash flows and earnings to foreign currency exchange rate changes through the use of various derivative contracts. The Company experiences foreign currency risks in its global operations as a result of various factors, including intercompany local currency denominated loans, rental operations in various currencies and purchasing fleet in various currencies.
Interest Rate Swap Arrangement
The Company entered into a
three
-year LIBOR-based interest rate swap arrangement on a portion of its outstanding ABL Credit Facility. The aggregate amount of the swap is equal to a portion of the U.S. dollar principal amount of the ABL Credit Facility and the payment dates of the swap coincide with the interest payment dates of the ABL Credit Facility. The swap contract provides for the Company to pay a fixed interest rate and receive a floating rate. The variable interest rate resets monthly. The swap has been accounted for as a cash flow hedge of a portion of the ABL Credit Facility.
The following table summarizes the outstanding interest rate swap arrangement as of
December 31, 2017
(dollars in millions):
|
Aggregate Notional Amount
|
Receive Rate
|
Receive Rate as of December 31, 2017
|
Pay Rate
|
||||||||
|
ABL Credit Facility
|
$
|
350.0
|
|
1 month LIBOR + 1.75%
|
3.3
|
%
|
3.5
|
%
|
|||
The following table summarizes the estimated fair value of the Company's financial instruments (in millions):
|
|
Fair Value of Financial Instruments
|
||||||||||||||
|
|
Other Long-Term Assets
|
Accrued Liabilities
|
|||||||||||||
|
December 31,
2017 |
December 31,
2016 |
December 31,
2017 |
December 31,
2016 |
||||||||||||
|
Derivatives Designated as Hedging Instruments
|
|||||||||||||||
|
Interest rate swap
|
$
|
2.1
|
|
$
|
—
|
|
$
|
—
|
|
$
|
—
|
|
|||
|
Derivatives Not Designated as Hedging Instruments
|
|||||||||||||||
|
Foreign currency forward contracts
|
$
|
—
|
|
$
|
0.1
|
|
$
|
—
|
|
$
|
—
|
|
|||
The following table summarizes the gains and losses on derivative instruments for the periods indicated. Gains and losses recognized on foreign currency forward contracts and the effective portion of interest rate swaps are included in the consolidated statements of operations together with the corresponding offsetting gains and losses on the underlying hedged transactions. All gains and losses recognized are included in "Selling, general and administrative" in the consolidated statements of operations (in millions).
|
Gain (Loss) Recognized
|
|||||||||||
|
|
2017
|
2016
|
2015
|
||||||||
|
Derivatives Not Designated as Hedging Instruments
|
|||||||||||
|
Foreign currency forward contracts
|
$
|
(4.0
|
)
|
$
|
5.0
|
|
$
|
(5.9
|
)
|
||
Note 18
—
Fair Value Measurements
Fair value is defined as the price that would be received to sell an asset or paid to transfer a liability in an orderly transaction between market participants in the principal market or, if none exists, the most advantageous market, for the specific asset or liability at the measurement date (referred to as the "exit price"). Fair value is a market-based measurement that should be determined based upon assumptions that market participants would use in pricing an asset or liability, including consideration of nonperformance risk.
The Company assesses the inputs used to measure fair value using the three-tier hierarchy promulgated under U.S. GAAP. This hierarchy indicates the extent to which inputs used in measuring fair value are observable in the market.
Level 1: Inputs that reflect quoted prices for identical assets or liabilities in active markets that are observable.
90
HERC HOLDINGS INC. AND SUBSIDIARIES
NOTES TO CONSOLIDATED FINANCIAL STATEMENTS (Continued)
Level 2: Inputs other than quoted prices included in Level 1 that are observable either directly or indirectly, including quoted prices for similar assets or liabilities in active markets; quoted prices for identical or similar assets or liabilities in markets that are not active; or model-derived valuations in which significant inputs are observable or can be derived principally from, or corroborated by, observable market data.
Level 3: Inputs that are unobservable to the extent that observable inputs are not available for the asset or liability at the measurement date and include management's judgment about assumptions that market participants would use in pricing the asset or liability.
Under U.S. GAAP, entities are allowed to measure certain financial instruments and other items at fair value. The Company has not elected the fair value measurement option for any of its assets or liabilities that meet the criteria for this option. Irrespective of the fair value option previously described, U.S. GAAP requires certain financial and non-financial assets and liabilities of the Company to be measured on either a recurring basis or on a nonrecurring basis as shown in the sections that follow.
Assets and Liabilities Measured at Fair Value on a Recurring Basis
The fair value of cash, accounts receivable, accounts payable and accrued liabilities, to the extent the underlying liability will be settled in cash, approximates carrying values because of the short-term nature of these instruments. The Company's assessment of goodwill and other intangible assets for impairment includes an assessment using various Level 2 (EBITDA multiples and discount rate) and Level 3 (forecasted cash flows) inputs. See
Note 2
,
"
Basis of Presentation and Recently Issued Accounting Pronouncements
-Goodwill and Indefinite-Lived Intangible Assets," for more information on the application of the use of fair value methodology.
Cash Equivalents and Investments
Cash equivalents, when held, primarily consist of money market accounts which are classified as Level 1 assets which the Company measures at fair value on a recurring basis. The Company determines the fair value of cash equivalents using a market approach based on quoted prices in active markets. The Company had no cash equivalents at
December 31, 2017
or
2016
.
Financial Instruments
The fair value of the Company's financial instruments as of
December 31, 2017
and
2016
are shown in
Note 17
, "
Financial Instruments
."
The Company's financial instruments are classified as Level 2 assets and liabilities and are priced using quoted market prices for similar assets or liabilities in active markets.
Debt Obligations
The fair value of the Company's debt is estimated based on quoted market rates as well as borrowing rates currently available for loans with similar terms and average maturities (Level 2 inputs) (in millions).
|
December 31, 2017
|
December 31, 2016
|
||||||||||||||
|
Nominal Unpaid Principal Balance
|
Aggregate Fair Value
|
Nominal Unpaid Principal Balance
|
Aggregate Fair Value
|
||||||||||||
|
Debt
|
$
|
2,174.3
|
|
$
|
2,260.9
|
|
$
|
2,215.3
|
|
$
|
2,275.5
|
|
|||
Note 19
—
Equity and Earnings (Loss) Per Share
Earnings (Loss) Per Share
Basic earnings (loss) per share has been computed based upon the weighted average number of common shares outstanding. Diluted earnings (loss) per share has been computed based upon the weighted average number of common shares outstanding plus the effect of all potentially dilutive common stock equivalents, except when the effect would be anti-dilutive.
91
HERC HOLDINGS INC. AND SUBSIDIARIES
NOTES TO CONSOLIDATED FINANCIAL STATEMENTS (Continued)
On June 30, 2016, the Company effected a
1-for-15
reverse stock split. All share data, per share amounts and dilutive and antidilutive amounts have been retroactively adjusted to reflect the impact of the separation and conversion, including the reverse stock split, in the accompanying consolidated financial statements and notes thereto for all periods presented.
The following table sets forth the computation of basic and diluted earnings (loss) per share (in millions, except per share data).
|
Year Ended December 31,
|
|||||||||||
|
2017
|
2016
|
2015
|
|||||||||
|
Basic and diluted earnings (loss) per share:
|
|||||||||||
|
Numerator:
|
|||||||||||
|
Net income (loss), basic and diluted
|
$
|
160.3
|
|
$
|
(19.7
|
)
|
$
|
111.3
|
|
||
|
Denominator:
|
|
|
|||||||||
|
Basic weighted average common shares
|
28.3
|
|
28.3
|
|
30.2
|
|
|||||
|
Stock options, RSUs and PSUs
(a)
|
0.3
|
|
—
|
|
—
|
|
|||||
|
Weighted average shares used to calculate diluted earnings (loss) per share
|
28.6
|
|
28.3
|
|
30.2
|
|
|||||
|
Earnings (loss) per share:
|
|||||||||||
|
Basic
|
$
|
5.66
|
|
$
|
(0.70
|
)
|
$
|
3.69
|
|
||
|
Diluted
|
$
|
5.60
|
|
$
|
(0.70
|
)
|
$
|
3.69
|
|
||
|
Antidilutive stock options, RSUs and PSUs
(a)
|
0.4
|
|
0.3
|
|
—
|
|
|||||
(a) The dilutive impact of stock options, RSUs and PSUs for the years ended
December 31, 2016
and
2015
and antidilutive impact for the year ended
2015
, rounds to zero for each period.
Share Repurchase Program
In March 2014, Hertz Holdings announced a
$1.0 billion
share repurchase program (the "Share Repurchase Program"), which replaced an earlier program. The Share Repurchase Program permits the Company, as the successor to Hertz Holdings, to purchase shares through a variety of methods, including in the open market or through privately negotiated transactions, in accordance with applicable securities laws. It does not obligate the Company to make any repurchases at any specific time or in any specific amount. The timing and extent to which the Company repurchases its shares will depend upon, among other things, market conditions, share price, liquidity targets, contractual restrictions and other factors. Share repurchases may be commenced or suspended at any time or from time to time, subject to legal and contractual requirements, without prior notice. During 2015, Hertz Holdings repurchased
2.5 million
shares (on a reverse split adjusted basis) at an aggregate purchase price of approximately
$604.5 million
under the Share Repurchase Program. Repurchases are included in treasury stock in the accompanying consolidated balance sheets as of December 31, 2017 and December 31, 2016. There were no share repurchases during the years ended
December 31, 2017
or
2016
. As of December 31, 2017, the approximate dollar value that remains available for share purchases under the Share Repurchase Program is
$395.9 million
.
Note 20
—
Related Party Transactions
Transactions between the Company and THC and its affiliates prior to the Spin-Off are herein referred to as "related party" or "affiliated" transactions. Effective with the Spin-Off on
June 30, 2016
, all transactions with THC and its affiliates were settled and paid in full. Effective upon the Spin-Off, the Company entered into, among other things, a transition services agreement with New Hertz. See
Note 21
, "
Arrangements with New Hertz
" for further information.
Loans with Affiliates
Prior to the Spin-Off, the Company entered into various loan agreements with affiliates as part of a centralized approach to the financing of worldwide operations by THC. The amounts due to and from other affiliates had various interest rates and maturity dates but were generally short-term in nature. Effective with the Spin-Off on
June 30, 2016
, any loans with affiliates were settled and paid in full, including any accrued interest.
92
HERC HOLDINGS INC. AND SUBSIDIARIES
NOTES TO CONSOLIDATED FINANCIAL STATEMENTS (Continued)
Intercompany Transactions
Prior to the Spin-Off, all significant intercompany payable and receivable balances between the Company and THC were considered to be effectively settled for cash in the consolidated financial statements at the time the transaction was recorded.
Corporate Allocations
Prior to the Spin-Off, THC provided services to and funded certain expenses for the Company that were recorded at the THC level. As discussed in
Note 2
, "
Basis of Presentation and Recently Issued Accounting Pronouncements
," the financial information in these consolidated financial statements includes, in periods prior to
June 30, 2016
, direct costs of the Company incurred by THC on the Company’s behalf and an allocation of general corporate expenses of THC which were not historically allocated to the Company for certain support functions that were provided on a centralized basis within THC and not recorded at the business unit level, such as expenses related to finance, human resources, information technology, facilities and legal, among others, and that would have been incurred had the Company been a separate, stand-alone entity.
Costs incurred and allocated by THC that were included in the consolidated statements of operations are shown in the following table (in millions). No costs were allocated by THC after the Spin-Off occurred on
June 30, 2016
.
|
Year Ended December 31,
|
||||||||
|
2016
|
2015
|
|||||||
|
Direct operating
|
$
|
0.6
|
|
$
|
(0.9
|
)
|
||
|
Selling, general and administrative
|
18.0
|
|
36.0
|
|
||||
|
Total allocated expenses
|
$
|
18.6
|
|
$
|
35.1
|
|
||
Agreements with Carl C. Icahn
The Company is subject to the Nomination and Standstill Agreement, dated September 15, 2014 (the "Nomination and Standstill Agreement"), with Carl C. Icahn, High River Limited Partnership, Hopper Investments LLC, Barberry Corp., Icahn Partners LP, Icahn Partners Master Fund LP, Icahn Enterprises G.P. Inc., Icahn Enterprises Holdings L.P., IPH GP LLC, Icahn Capital LP, Icahn Onshore LP, Icahn Offshore LP, Beckton Corp., Vincent J. Intrieri, Samuel Merksamer and Daniel A. Ninivaggi (collectively, the "Original Icahn Group"). In connection with their appointments to the Company’s board of directors, each of Courtney Mather, Louis J. Pastor and Stephen A. Mongillo (collectively, the "Icahn Designees," and, together with the Original Icahn Group, the "Icahn Group") executed a Joinder Agreement agreeing to become bound as a party to the terms and conditions of the Nomination and Standstill Agreement (such Joinder Agreements, together with the Nomination and Standstill Agreement, are collectively referred to herein as the "Icahn Agreements").
Pursuant to the Icahn Agreements, the Icahn Designees were appointed to the Company’s board of directors effective June 30, 2016. Pursuant to the Icahn Agreements, so long as an Icahn Designee is a member of the Company's board of directors, the board of directors will not be expanded beyond its current size of 11 members without approval from the Icahn Designees then on the board of directors. In addition, pursuant to the Icahn Agreements, subject to certain restrictions and requirements, the Icahn Group will have certain replacement rights in the event an Icahn Designee resigns or is otherwise unable to serve as a director (other than as a result of not being nominated by the Company for an annual meeting).
In addition, until the date that no Icahn Designee is a member of the Company's Board of Directors (or otherwise deemed to be on the Company's Board of Directors pursuant to the terms of the Icahn Agreements), the Icahn Group agrees to vote all of its shares of the Company’s common stock in favor of the election of all of the Company’s director nominees at each annual or special meeting of the Company’s stockholders, and, subject to limited exceptions, the Icahn Group further agrees to (i) adhere to certain standstill obligations, including the obligation to not solicit proxies or consents or influence others with respect to the same, and (ii) not acquire or otherwise beneficially own more than
20%
of the Company’s outstanding voting securities.
Pursuant to the Icahn Agreements, the Company will not create a separate executive committee of its Board of Directors so long as an Icahn Designee is a member of the board of directors.
93
HERC HOLDINGS INC. AND SUBSIDIARIES
NOTES TO CONSOLIDATED FINANCIAL STATEMENTS (Continued)
Under the Icahn Agreements, if the Icahn Group ceases to hold a “net long position,” as defined in the Nomination and Standstill Agreement, in at least (A)
1,900,000
shares of the Company’s common stock, the Icahn Group will cause
one
Icahn Designee to resign from the Company’s board of directors; (B)
1,520,000
shares of the Company’s common stock, the Icahn Group will cause
two
Icahn Designees to promptly resign from the Company's Board of Directors; and (C)
1,266,667
shares of the Company’s common stock, the Icahn Group will cause all of the Icahn Designees to promptly resign from the board of directors and the Company’s obligations under the Icahn Agreements will terminate.
In addition, pursuant to the Icahn Agreements, the Company entered into a registration rights agreement, effective June 30, 2016 (the "Registration Rights Agreement"), with High River Limited Partnership, Icahn Partners LP and Icahn Partners Master Fund LP, on behalf of any person who is a member of the "Icahn group" (as such term is defined therein) who owns applicable securities at the relevant time and is or has become a party to the Registration Rights Agreement. The Registration Rights Agreement provides for customary demand and piggyback registration rights and obligations.
Note 21
—
Arrangements with New Hertz
In connection with the Spin-Off, the Company entered into a separation and distribution agreement (the “Separation Agreement”) with New Hertz. In connection therewith, the Company also entered into various other ancillary agreements with New Hertz to effect the Spin-Off and provide a framework for its relationship with New Hertz. The following summarizes some of the most significant agreements and relationships that Herc Holdings continues to have with New Hertz.
Separation and Distribution Agreement
The Separation Agreement sets forth agreements with New Hertz relating to the Spin-Off and that govern aspects of the Company’s relationship with New Hertz following the Spin-Off, as follows:
Internal Reorganization and Related Financing Transactions
. The Separation Agreement provided for the transfers of entities and assets and assumptions of liabilities that were necessary to complete the Spin-Off, including the series of internal reorganization transactions such that New Hertz holds the entities associated with the vehicle rental business and the Company holds the entities associated with the equipment rental business.
Pursuant to the Separation Agreement, Herc made certain cash transfers in the total amount of approximately
$2.1 billion
to New Hertz and its subsidiaries in 2016.
Legal Matters and Claims; Sharing of Certain Liabilities
. Subject to any specified exceptions, each party to the Separation Agreement assumed the liability for, and control of, all pending and threatened legal matters related to its own business, as well as assumed or retained liabilities, and will indemnify the other party for any liability arising out of or resulting from such assumed legal matters.
The Separation Agreement provides for certain liabilities to be shared by the parties. New Hertz and the Company are each responsible for a portion of these shared liabilities (typically 15% for the Company), as set forth in the Separation Agreement. New Hertz is responsible for managing the settlement or other disposition of such shared liabilities.
Other Matters.
The Separation Agreement, among other things, (i) governed the transfer of assets and liabilities generally, (ii) terminated all intercompany arrangements between New Hertz and the Company except for specified agreements and arrangements, (iii) released certain claims between the parties and their affiliates, (iv) allocated expenses of the Spin-Off between the parties, (v) contains further assurances, terms and conditions that require New Hertz and the Company to use commercially reasonable efforts to consummate the transactions contemplated by the Separation Agreement and the ancillary agreements, and (vi) contains mutual indemnification clauses.
Transition Services Agreement
The Company entered into a TSA pursuant to which New Hertz or its affiliates provide specified services to the Company on a transitional basis to help ensure an orderly transition following the Spin-Off, although New Hertz may request certain transition services to be performed by the Company. The ongoing services being provided by New Hertz or its affiliates to the Company primarily consist of IT support. Other services previously provided by New Hertz or its affiliates after the Spin-Off included human
94
HERC HOLDINGS INC. AND SUBSIDIARIES
NOTES TO CONSOLIDATED FINANCIAL STATEMENTS (Continued)
resources, payroll and benefits; treasury; tax matters; network and telecommunications systems support; and administrative services. The TSA generally provides for a term of up to two years following the Spin-Off, though the recipient of the services may elect to terminate a service at any time upon advance written notice. During years ended
December 31, 2017
and
2016
, the Company incurred expenses of
$18.4 million
and
$10.9 million
, respectively, under the TSA which is included in "Direct operating" and "Selling, general and administrative" expenses in the Company's consolidated statements of operations.
Tax Matters Agreement
The Company entered into a tax matters agreement (the “Tax Matters Agreement”) with New Hertz that governs the parties' rights, responsibilities and obligations after the Spin-Off with respect to tax liabilities and benefits, tax attributes, tax contests and other tax matters regarding income taxes, other taxes and related tax returns.
Under the Tax Matters Agreement, each party is responsible for their respective tax liabilities. The agreement provided for no compensation due to any change in a tax attribute, such as a net operating loss. Tax attributes were allocated between the entities based on the applicable federal or state income tax law and regulations. The Tax Matters Agreement also requires that an unqualified opinion from a nationally recognized law firm, supplemental ruling from the IRS, or waiver from the other party be obtained upon the occurrence or contemplated occurrence of certain events which could impact the taxability of the transaction under the U.S. federal income tax law. A tax return for 2016 was filed with six months activity of New Hertz and 12 months activity of Herc Holdings.
Employee Matters Agreement
The Company and New Hertz entered into an employee matters agreement to allocate liabilities and responsibilities relating to employment matters, employee compensation, benefit plans and programs and other related matters for current and former employees of the vehicle rental business and the equipment rental business.
Intellectual Property Agreement
The Company and New Hertz entered into an intellectual property agreement (the “Intellectual Property Agreement”) that provides for ownership, licensing and other arrangements regarding the trademarks and related intellectual property that New Hertz and the Company use in conducting their businesses. The Intellectual Property Agreement allocates ownership between New Hertz and the Company of all trademarks, domain names and certain copyrights that Hertz Holdings or its subsidiaries owned immediately prior to the Spin-Off.
The Intellectual Property Agreement provides that the Company has the right to use certain intellectual property associated with the Hertz brand for a period of
four
years on a royalty-free basis. It also provides that, for so long as the Company continues to use certain intellectual property associated with the Hertz brand, the Company will not directly or indirectly engage in the business of renting and leasing cars, subject to certain exceptions, including that the Company may continue to rent vehicles to the extent Herc had done so immediately prior to the Spin-Off.
Real Estate Arrangements
The Company and New Hertz entered into certain real estate lease agreements pursuant to which the Company leases certain office space from New Hertz and New Hertz leases certain rental facilities space from the Company. Rent payments were negotiated based on comparable fair market rental rates.
Note 22
—
Segment Information
The Company consists of a single reportable segment, worldwide equipment rental. The Company considered guidance in ASC 280, "Segment Reporting" and used the management approach in determining its reportable segments.
International revenues, which are primarily generated in Canada and, prior to divestiture in October 2015, France, totaled
$206.4 million
,
$193.6 million
and
$332.4 million
for the years ended
December 31, 2017
,
2016
and
2015
, respectively.
95
HERC HOLDINGS INC. AND SUBSIDIARIES
NOTES TO CONSOLIDATED FINANCIAL STATEMENTS (Continued)
Geographic information for long-lived assets, which consist primarily of revenue earning equipment and property and equipment, was as follows (in millions):
|
December 31, 2017
|
December 31, 2016
|
||||||
|
Total assets at end of year
|
|||||||
|
United States
|
$
|
3,259.0
|
|
$
|
3,206.0
|
|
|
|
International
|
290.7
|
|
260.0
|
|
|||
|
Total
|
$
|
3,549.7
|
|
$
|
3,466.0
|
|
|
|
Revenue earning equipment, net, at end of year
|
|||||||
|
United States
|
$
|
2,111.2
|
|
$
|
2,111.0
|
|
|
|
International
|
263.4
|
|
279.0
|
|
|||
|
Total
|
$
|
2,374.6
|
|
$
|
2,390.0
|
|
|
|
Property and equipment, net, at end of year
|
|||||||
|
United States
|
$
|
256.5
|
|
$
|
243.2
|
|
|
|
International
|
29.8
|
|
28.8
|
|
|||
|
Total
|
$
|
286.3
|
|
$
|
272.0
|
|
|
Note 23
—
Quarterly Financial Information (Unaudited)
Provided below is a summary of the quarterly operating results during
2017
and
2016
. Amounts are computed independently each quarter. As a result, the sum of the quarter's amounts may not equal the total amount for the respective year.
|
First Quarter
|
Second Quarter
|
Third Quarter
|
Fourth Quarter
|
||||||||||||
|
(In millions, except per share data)
|
2017
|
2017
|
2017
|
2017
|
|||||||||||
|
Revenues
|
$
|
389.4
|
|
$
|
415.8
|
|
$
|
457.6
|
|
$
|
491.7
|
|
|||
|
Income (loss) before income taxes
|
(54.3
|
)
|
(49.8
|
)
|
18.6
|
|
21.1
|
|
|||||||
|
Net income (loss)
(a)
|
(39.2
|
)
|
(27.6
|
)
|
12.8
|
|
214.3
|
|
|||||||
|
Earnings (loss) per share:
|
|||||||||||||||
|
Basic
|
$
|
(1.39
|
)
|
$
|
(0.98
|
)
|
$
|
0.45
|
|
$
|
7.57
|
|
|||
|
Diluted
|
$
|
(1.39
|
)
|
$
|
(0.98
|
)
|
$
|
0.45
|
|
$
|
7.44
|
|
|||
|
First Quarter
|
Second Quarter
|
Third Quarter
|
Fourth Quarter
|
||||||||||||
|
(In millions, except per share data)
|
2016
|
2016
|
2016
|
2016
|
|||||||||||
|
Revenues
|
$
|
365.6
|
|
$
|
380.4
|
|
$
|
403.6
|
|
$
|
405.2
|
|
|||
|
Income (loss) before income taxes
|
(1.5
|
)
|
(2.7
|
)
|
6.7
|
|
(7.4
|
)
|
|||||||
|
Net income (loss)
|
(1.5
|
)
|
(8.0
|
)
|
3.0
|
|
(13.2
|
)
|
|||||||
|
Earnings (loss) per share:
|
|||||||||||||||
|
Basic
|
$
|
(0.05
|
)
|
$
|
(0.28
|
)
|
$
|
0.11
|
|
$
|
(0.47
|
)
|
|||
|
Diluted
|
$
|
(0.05
|
)
|
$
|
(0.28
|
)
|
$
|
0.11
|
|
$
|
(0.47
|
)
|
|||
|
(a)
|
Net income for the fourth quarter and full year
2017
includes an estimated net benefit of
$207.1 million
associated with the enactment of the 2017 Tax Act discussed further in
Note 13
, "
Income Taxes
." The second quarter includes an impairment charge of
$29.3 million
related to the write-off of assets previously capitalized as part of the development of new financial and point of sale systems and the impairment of certain revenue earning equipment discussed further in
Note 6
, "
Impairment
." The first and fourth quarters of 2017 each include the early redemption of
$123.5 million
of Notes, resulting in losses on the early extinguishment of debt of
$5.8 million
and
$5.6 million
, respectively, as discussed in
Note 9
,
"
Debt
.
"
|
96
SCHEDULE II
VALUATION AND QUALIFYING ACCOUNTS
HERC HOLDINGS INC. AND SUBSIDIARIES
(In millions)
|
Beginning Balance
|
Provisions
|
Translation Adjustments
|
Deductions
|
Ending Balance
|
|||||||||||||||
|
Receivables allowances:
|
|||||||||||||||||||
|
Year to date December 31, 2017
|
$
|
24.9
|
|
$
|
52.4
|
|
$
|
0.3
|
|
$
|
(50.7
|
)
|
$
|
26.9
|
|
||||
|
Year to date December 31, 2016
|
23.8
|
|
44.4
|
|
0.1
|
|
(43.4
|
)
|
24.9
|
|
|||||||||
|
Year to date December 31, 2015
|
28.4
|
|
42.8
|
|
—
|
|
(47.4
|
)
|
23.8
|
|
|||||||||
|
Tax valuation allowances:
|
|||||||||||||||||||
|
Year to date December 31, 2017
|
$
|
4.5
|
|
$
|
2.8
|
|
$
|
0.3
|
|
$
|
—
|
|
$
|
7.6
|
|
||||
|
Year to date December 31, 2016
|
3.6
|
|
1.2
|
|
(0.3
|
)
|
—
|
|
4.5
|
|
|||||||||
|
Year to date December 31, 2015
|
31.5
|
|
0.6
|
|
0.9
|
|
(29.4
|
)
|
3.6
|
|
|||||||||
97
HERC HOLDINGS INC. AND SUBSIDIARIES
None.
Disclosure Controls and Procedures
Our senior management has evaluated the effectiveness of the design and operation of our disclosure controls and procedures, as defined under Exchange Act Rules 13a-15(e) and 15d-15(e) under the Securities Exchange Act of 1934, as amended (the "Exchange Act"), as of the end of the period covered by this Report. Based on this evaluation, our Chief Executive Officer and Chief Financial Officer have concluded that as of December 31, 2017, due to the identification of material weaknesses in our internal control over financial reporting as further described below, our disclosure controls and procedures were not effective to provide reasonable assurance that the information required to be disclosed by us in the reports that we file or submit under the Exchange Act is recorded, processed, summarized and reported within the time periods specified in the SEC’s rules and forms, and that such information is accumulated and communicated to management as appropriate to allow timely decisions regarding required disclosures.
Notwithstanding the material weaknesses in our internal controls over financial reporting as of December 31, 2017 described below, senior management has concluded that the consolidated financial statements included in this Report present fairly, in all material respects, our financial position, results of operations and cash flows for the periods presented in conformity with accounting principles generally accepted in the United States.
Spin-Off Transaction
Prior to the Spin-Off on June 30, 2016, Herc had operated as the equipment rental division of Hertz Holdings. Management was required to assess and report for the first time on our internal control over financial reporting as of December 31, 2016. In making its initial and subsequent assessments, management considered certain infrastructure and systems that we inherited in connection with the Spin-Off and certain information technology ("IT") and other services that we receive from New Hertz under the TSA entered into in connection with the Spin-Off that continue to impact Herc Holdings' control environment and, therefore, our internal control over financial reporting.
Management’s Report on Internal Control Over Financial Reporting
Management is responsible for establishing and maintaining adequate internal control over financial reporting, as such term is defined in Exchange Act Rules 13a-15(f) and 15d-15(f). Herc Holdings’ management, with the participation of our Chief Executive Officer and Chief Financial Officer, evaluated the effectiveness of our internal control over financial reporting based on the framework in
Internal Control - Integrated Framework
(2013) issued by the Committee of Sponsoring Organizations of the Treadway Commission. Based on this assessment, management concluded that Herc Holdings did not maintain effective internal control over financial reporting as of December 31, 2017 because of the material weaknesses discussed below.
A material weakness is a deficiency, or a combination of deficiencies, in internal control over financial reporting, such that there is a reasonable possibility that a material misstatement of our annual or interim financial statements will not be prevented or detected on a timely basis.
Our management has determined that the following control deficiencies identified during or prior to 2016 constitute material weaknesses as of December 31, 2017:
Risk Assessment
We did not effectively design and maintain controls in response to the risks of material misstatement. This material weakness contributed to the following additional material weaknesses:
|
•
|
Ineffective design and maintenance of controls over a certain business process in the period-end financial reporting process, specifically the identification and execution of controls over the preparation, analysis and review of significant account reconciliations and closing adjustments required to assess the appropriateness of certain account balances at period end. These control deficiencies did not result in adjustments to our 2017 consolidated financial statements. These control deficiencies resulted in immaterial adjustments and a revision
|
98
to our historical consolidated financial statements for the years ended December 31, 2016 and 2015, respectively, included in this Report, as well as prior year ends not included in this Report.
|
•
|
Ineffective design and maintenance of controls to monitor certain IT systems that the Company outsources to New Hertz under the TSA. Specifically, controls were not effectively designed and maintained at New Hertz related to: (i) user access controls to adequately restrict user and privileged access to financial applications and data to appropriate personnel, (ii) effective controls to monitor developers’ access to production, and (iii) effective controls related to access and monitoring of critical jobs.
|
|
•
|
Ineffective design and maintenance of controls over our IT systems relevant to the preparation of our consolidated financial statements (which were not part of the TSA). Specifically, we did not design and maintain user access controls to appropriately segregate duties and adequately restrict user and privileged access to financial applications and data to appropriate personnel.
|
The IT material weaknesses
described above did not result in material misstatements to the consolidated financial statements; however, the deficiencies, when aggregated, could impact the effectiveness of IT-dependent controls (such as automated controls that address the risk of material misstatement to one or more assertions, along with the IT controls and underlying data that support the effectiveness of system-generated data and reports) that could result in misstatements potentially impacting all financial statement accounts and disclosures that would not be prevented or detected in a timely manner.
Control Activities
|
•
|
Ineffective design and maintenance of a control over the estimate for earned but unbilled revenue. Specifically, a control was not maintained over the effective review of the model, assumptions and data used in developing estimates related to earned but unbilled revenue.
This control deficiency did not result in adjustments to our consolidated financial statements.
|
|
•
|
Ineffective design and maintenance of a control related to the occurrence of revenue from the rental of revenue earning equipment.
This control deficiency did not result in adjustments to our consolidated financial statements.
|
|
•
|
Ineffective design and maintenance of controls over income tax accounts. Specifically, the Company failed to properly design controls over the accounting for the provision for income taxes. These control deficiencies did not result in adjustments to our 2017 consolidated financial statements.
These control deficiencies resulted in immaterial adjustments to the income tax accounts and equity in our consolidated financial statements for the years ended December 31, 2016 and 2015.
|
Additionally, each of the material weaknesses described above could result in a material misstatement of the annual or interim consolidated financial statements that would not be prevented or detected.
The effectiveness of our internal control over financial reporting as of December 31, 2017 has been audited by PricewaterhouseCoopers LLP, an independent registered certified public accounting firm, as stated in their report, which appears in this Report.
Remediation of Prior Material Weaknesses
Control Environment
Complement of Personnel
We have remediated the material weakness associated with the insufficient complement of personnel with an appropriate level of knowledge, experience and training commensurate with our financial reporting requirements to properly apply U.S. GAAP by: (i) hiring personnel with the appropriate education, experience, and certifications for all of the key positions in the financial reporting and accounting function, and in some cases creating new higher level positions and increasing the level of supervision, including the employment of 15 certified public accountants in the accounting organization, (ii) creating a culture of accountability in the accounting organization by enforcing policies and procedures including disciplining employees for non-compliance, and
99
(iii) improving communication with staff and routinely training staff on technical accounting matters and our policies and procedures.
Non-fleet Procurement
We have remediated the material weakness over the non-fleet procurement process. We improved our controls over appropriate approvals for payables transactions and purchasing methods and processes including more closely monitoring non-fleet spending and centrally managing certain purchases. We also continued to train our personnel on proper and timely purchase order initiation and timely receipt of goods and implemented system enhancements for approval and processing of procurement card purchases.
Certain Accounting Estimates
We have remediated the material weaknesses over certain accounting estimates, specifically the allowances for uncollectible accounts receivable and customer credit memos by designing and maintaining controls over the effective review of the models, assumptions and data used in developing these estimates. We also hired accounting personnel with an appropriate level of knowledge and experience to execute the underlying accounting methodologies and established policies and procedures for the review, approval and application of U.S. GAAP for these estimates.
Manual Journal Entries
We have remediated the material weakness associated with the review, approval, and documentation of manual journal entries by: (i) establishing comprehensive and clear policies and procedures to govern the completion and review of journal entries, supported by adequate documentation, which is independently reviewed and approved, and (ii) delivering supplemental training to the accounting organization covering the Company’s journal entry policies and review controls.
Payroll
We have remediated the material weakness over payroll by adding additional qualified resources, enhancing policies and procedures over administering payroll to properly establish that controls are properly executed and further supported by adequate documentation which is independently reviewed and approved. Additionally, we delivered supplemental training to appropriate personnel covering the Company’s payroll policies and review controls.
Sale of Revenue Earning Equipment
We have remediated the material weakness over the design and maintenance of controls related to the occurrence of revenue for the sale of revenue earning equipment. We enhanced policies and procedures and implemented controls over the validation and cut-off of the sale of revenue earning equipment. Additionally, we delivered supplemental training to appropriate personnel covering the Company’s sale of revenue earning equipment policies and review controls.
Monitoring
We have remediated the material weakness associated with monitoring activities by (i) the appointment in 2016 of an experienced Vice President, Internal Audit, (ii) the continued hiring of additional resources with an appropriate level of knowledge and expertise and, (iii) supplementing the monitoring staff with qualified co-sourcing resources to ensure an adequate level of technical competency. We also enhanced our processes associated with the scoping and identification of key controls and systems, testing key controls and reporting results to senior management and the Audit Committee.
Remediation Efforts and Status of Remaining Material Weaknesses
We have taken certain remediation steps to address the material weaknesses remaining outstanding referenced above as of December 31, 2017, and to improve our internal control over financial reporting. If not remediated, these deficiencies could result in material misstatements to our consolidated financial statements. Senior management and the Board of Directors take the control and integrity of the Company’s financial statements seriously and believe that the remediation steps described below are essential to maintaining a strong internal control environment.
As we continue to evaluate and implement improvements to our internal control over financial reporting, our senior management may decide to take additional measures to address our control deficiencies or to modify the remediation efforts described in this section. Because the reliability of the internal control process requires repeatable execution, our material weaknesses will not be considered remediated until all remedial controls (including any additional remediation efforts that our senior management may
100
identify as necessary) have been implemented, each applicable control has operated for a sufficient period of time, and management has concluded, through testing, that the controls are operating effectively. Until all identified material weaknesses are remediated, we will not be able to assert that our internal controls are effective. Further, management may identify other material weaknesses in our internal control over financial reporting.
Risk Assessment
Period-end Financial Reporting Process
To address the material weakness associated with controls over account reconciliations, we have designed, and where appropriate, enhanced controls over the preparation, analysis and review of transactions and the execution of balance sheet and significant account reconciliations. In addition, we have reinforced existing policies and procedures and enacted new policies and procedures, where necessary, to better define requirements for effective and timely reconciliations of balance sheet and other significant accounts, including independent review. We have also implemented a training program specific to the documentation, preparation and review of account reconciliations. To consider this material weakness fully remediated, we believe additional time is needed to demonstrate sustainability as it relates to the revised controls.
IT Systems
To address the material weaknesses associated with controls over IT systems and IT general controls, we established and are continuing to establish our own stand-alone IT systems and infrastructure that will allow us to replace services provided under the TSA and manage our IT applications with a focus on remediating, enhancing or implementing IT systems that improve our internal control over financial reporting. Additionally, we plan to enhance the design and operation of control activities and procedures associated with user access to our IT systems, appropriate segregation of duties, and to restrict users and privileged access to financial applications and data. We also plan to deliver training to control owners regarding risks, controls and maintaining adequate control evidence, as well as dedicate additional resources to administer IT general controls.
Control Activities
Accounting Estimates - Earned but Unbilled Revenue
To address the material weakness associated with a control over the estimate for earned but unbilled revenue, we have taken steps to improve our design and maintenance of this control, including (i) identifying, implementing and documenting a control over the completeness and accuracy of the data and the underlying assumptions for the earned but unbilled revenue estimate in December 2017 and (ii) hiring personnel with the appropriate education, experience, and certifications to execute this control as designed. To consider this material weakness fully remediated, we believe additional time is needed to demonstrate sustainability as it relates to the revised control.
Rental of Revenue Earning Equipment
To address the material weakness over the design and maintenance of controls related to the occurrence of revenue for the rental of revenue earning equipment, we have further enhanced policies and procedures and are in the process of implementing controls over the validation of the rental of equipment. We are also in the process of delivering supplemental training to appropriate field personnel with the objective of developing a thorough understanding of the Company’s policies and revising controls being implemented regarding rental of revenue earning equipment. In the fourth quarter of 2017, we redesigned controls related to the occurrence of rental revenue, delivered training to all branch personnel and piloted a program in certain regions to operate the newly designed controls. We will continue to refine the design of the controls and implement the redesigned controls over the occurrence of revenue for the rental of revenue earning equipment and plan to extend the program to all regions.
Income Taxes
To address the material weakness over the design and maintenance of controls related to the accounting for income taxes, during 2017 we established an in-house tax function, designed and, where appropriate, enhanced controls over the tax provision process and implemented tax provision software which improved the tax provision process. In 2018, management intends to continue the ongoing remediation efforts related to improving the tax accounting process and enhancing our income tax controls. To consider this material weakness fully remediated, we believe additional time is needed to demonstrate sustainability as it relates to the revised controls.
101
Changes in Internal Control Over Financial Reporting
Our remediation efforts were ongoing during the quarter ended December 31, 2017. During the quarter ended December 31, 2017, we completed the transition of our revenue and fleet management front end system from New Hertz (under the TSA) to Herc Holdings. The transition of our revenue and fleet management front end system was a material change in our internal control over financial reporting that occurred during the quarter ended December 31, 2017 that materially affected, or that is reasonably likely to materially affect, our internal control over financial reporting.
None.
102
HERC HOLDINGS INC. AND SUBSIDIARIES
Executive Officers
The name, age, position and a description of the business experience of each of our executive officers is provided below. There is no family relationship among the executive officers or between any executive officer and a director.
|
Name
|
Age
|
Position
|
|
Lawrence H. Silber
|
61
|
President and Chief Executive Officer, Director
|
|
Barbara L. Brasier
|
59
|
Senior Vice President and Chief Financial Officer
|
|
Christian J. Cunningham
|
56
|
Senior Vice President and Chief Human Resources Officer
|
|
J. Bruce Dressel
|
54
|
Senior Vice President and Chief Operating Officer
|
|
Tamir Peres
|
48
|
Senior Vice President and Chief Information Officer
|
|
Maryann A. Waryjas
|
66
|
Senior Vice President, Chief Legal Officer and Secretary
|
Lawrence H. Silber.
Mr. Silber joined the Company in May 2015. Prior to that, Mr. Silber most recently served as an executive advisor at Court Square Capital Partners, LLP, a private equity firm primarily investing in the business services, healthcare, general industrial and technology and telecommunications sectors, from April 2014 to May 2015. Mr. Silber led Hayward Industries, one of the world’s largest swimming pool equipment manufacturers, as chief operating officer from 2008 to 2012, overseeing a successful transition through the recession and returning the company to solid profitability. From 1978 to 2008, Mr. Silber worked for Ingersoll-Rand plc, a publicly traded manufacturer of industrial products and components, in a number of roles of increasing responsibility. He led major Ingersoll-Rand business groups, including Utility Equipment, Rental and Remarketing and the Equipment and Services businesses. Earlier in his career, he led sales, marketing and operations functions in Ingersoll-Rand’s Power Tool Division and Construction and Mining Group. Mr. Silber served on the board of directors of SMTC Corporation, a mid-size provider of end-to-end electronics manufacturing services, from 2012 to 2015 (and from May 2013 through January 2014 served as its interim president and CEO).
Barbara L. Brasier
. Ms. Brasier joined the Company in November 2015 from Mondelez International, Inc. (formerly Kraft Foods, Inc.), where she served as senior vice president, tax and treasury since October 2012, when Mondelez spun off Kraft Foods Group, Inc. Ms. Brasier served as the senior vice president and treasurer of Kraft Foods Inc. from October 2011 to September 2012 and from April 2009 to December 2010 and senior vice president, finance of Kraft Foods Europe from December 2010 to October 2011. Prior to Kraft, Ms. Brasier was a vice president and treasurer of Ingersoll-Rand from April 2004 to June 2008 and held roles of increasing responsibility at Mead Corporation and MeadWestvaco from June 1984 to March 2004. Ms. Brasier started her career in accounting at Touche Ross, now Deloitte & Touche, LLP.
Christian J. Cunningham.
Mr. Cunningham joined the Company in September 2014 from DFC Global Corporation where he served as vice president, corporate HR and HR services since June 2013 with global responsibility for all human resource matters for corporate staff. Previously, Mr. Cunningham held the position of vice president, HR, compensation and benefits at Sunoco Inc. and Sunoco Logistics from 2010 to 2013. Prior to Sunoco, Mr. Cunningham served at ARAMARK as vice president, global compensation and strategy (2008 to 2010); at Scholastic Inc. as vice president, compensation, benefits and HRIS (2006 to 2007); and at Pep Boys as assistant vice president, human resources (2005 to 2006). Previously, Mr. Cunningham held director and regional managerial positions in roles with increasing levels of responsibility at Pep Boys (1995 to 2005) and Tire Service Corporation, Inc. (1985 to 1995).
J. Bruce Dressel.
Mr. Dressel joined the Company in June 2015, bringing with him significant expertise in the equipment rental industry and more than 30 years of experience in various leadership and senior management roles. Mr. Dressel served as president and CEO of Sunbelt Rentals, Inc. from February 1997 to July 2003, where he grew the company from 24 to 195 locations and expanded equipment rental offerings. Mr. Dressel began his career in the equipment rental business in 1984 and held various positions in a privately held company that was acquired by Sunbelt in 1996. Following Sunbelt, from 2004 to 2013, Mr. Dressel held roles of increasing responsibility, including serving as chief sales officer, for ADS, Inc., a provider of industry-leading equipment and logistics support solutions to the Department of Defense and other federal agencies. From 2013 until he joined the Company in 2015, Mr. Dressel had been consulting within the equipment rental industry.
Tamir Peres.
Mr. Peres joined the Company in September 2017 from Sunoco Logistics, a publicly-traded, midstream energy company, where he served as vice president and chief information officer since 2012, leading the Sunoco Logistics Information Technology group. From 2005 to 2012, Mr. Peres held the position of director of corporate information technology
103
HERC HOLDINGS INC. AND SUBSIDIARIES
at Sunoco, Inc., where he was responsible for all strategic and tactical aspects of technology across the Refining and Supply, Retail Marketing, Chemicals, Logistics and Coke business units. He was previously director of Worldwide Financial Systems for Kulicke & Soffa Industries, Inc., a global manufacturer and supplier of semiconductor equipment, and before that he worked for Ernst & Young, including as a Senior Auditor in its Assurance Services area.
Maryann A. Waryjas.
Ms. Waryjas joined the Company in November 2015 from Great Lakes Dredge & Dock Corporation, one of the largest providers of dredging services in the United States. At Great Lakes, Ms. Waryjas served as senior vice president, chief legal officer and corporate secretary from August 2012 to November 2015. From 2000 until joining Great Lakes, Ms. Waryjas was a partner at the law firm of Katten Muchin Rosenman, LLP, and was co-chair of the firm’s Corporate Governance and Mergers and Acquisitions practices during 2011 and 2012. Ms. Waryjas served two consecutive terms on Katten’s board of directors. Prior to Katten, Ms. Waryjas was a partner at the law firms of Jenner & Block LLP and Kirkland & Ellis LLP.
Directors and Corporate Governance
Other information required by this Item is incorporated by reference to the applicable information in the Proxy Statement.
The information required by this Item is incorporated by reference to the applicable information in the Proxy Statement.
The information required by this Item is incorporated by reference to the applicable information in the Proxy Statement.
The information required by this Item is incorporated by reference to the applicable information in the Proxy Statement.
The information required by this Item is incorporated by reference to the applicable information in the Proxy Statement.
104
HERC HOLDINGS INC. AND SUBSIDIARIES
(a) Documents filed as part of this Report
(1) Consolidated financial statements:
Report of Independent Registered Public Accounting Firm
Herc Holdings Inc. and Subsidiaries Consolidated Balance Sheets at
December 31, 2017
and
2016
Herc Holdings Inc. and Subsidiaries Consolidated Statements of Operations for the years ended
December 31, 2017
,
2016
and
2015
Herc Holdings Inc. and Subsidiaries Consolidated Statements of Comprehensive Income (Loss) for the years ended
December 31, 2017
,
2016
and
2015
Herc Holdings Inc. and Subsidiaries Consolidated Statements of Changes in Equity for the years ended
December 31, 2017
2016
and
2015
Herc Holdings Inc. and Subsidiaries Consolidated Statements of Cash Flows for the years ended
December 31, 2017
,
2016
and
2015
Notes to Consolidated Financial Statements
(2) Schedule to the financial statements
Schedule II Valuation and Qualifying Accounts
(3) Exhibits
|
Exhibit
Number
|
Description
|
|
2.1***
|
|
|
3.1.1
|
|
|
3.1.2
|
|
|
3.1.3
|
|
|
3.1.4
|
|
|
3.2
|
|
|
4.1
|
|
|
4.2
|
|
|
4.3
|
|
|
4.4
|
|
|
4.5
|
|
105
HERC HOLDINGS INC. AND SUBSIDIARIES
|
4.6
|
|
|
4.7
|
|
|
4.8
|
|
|
10.1
|
|
|
10.2
|
|
|
10.3
|
|
|
10.4
|
|
|
10.5
|
|
|
10.6
|
|
|
10.7
|
|
|
10.8
|
|
|
10.9
t
|
|
|
10.10.1
t
|
|
|
10.10.2
t
|
|
|
10.10.3
t
|
|
|
10.10.4
t
|
|
|
10.10.5
t
|
|
|
10.11.1
|
|
|
10.11.2
|
|
106
HERC HOLDINGS INC. AND SUBSIDIARIES
|
10.12.1
t
|
|
|
10.12.2
t
|
|
|
10.12.3
t
|
|
|
10.12.4
t
|
|
|
10.12.5
t
|
|
|
10.12.6
t
|
|
|
10.12.7
t
|
|
|
10.12.8
t
|
|
|
10.13.1
t
|
|
|
10.13.2
t
|
|
|
10.13.3
t
|
|
|
10.19
t
|
|
|
10.20
|
|
|
10.21
t
|
|
|
14.1
|
|
|
21.1*
|
|
|
23.1*
|
|
|
31.1*
|
|
|
31.2*
|
|
|
32.1**
|
|
|
101.INS*
|
XBRL Instance Document
|
|
101.SCH*
|
XBRL Taxonomy Extension Schema Document
|
|
101.CAL*
|
XBRL Taxonomy Extension Calculation Linkbase Document
|
|
101.DEF*
|
XBRL Taxonomy Extension Definition Linkbase Document
|
|
101.LAB*
|
XBRL Taxonomy Extension Label Linkbase Document
|
|
101.PRE*
|
XBRL Taxonomy Extension Presentation Linkbase Document
|
|
*
|
Filed herewith
|
|
**
|
Furnished herewith
|
|
***
|
Omitted schedules will be furnished supplementally to the SEC upon request.
|
|
t
|
Indicates management contracts and compensatory agreements.
|
107
HERC HOLDINGS INC. AND SUBSIDIARIES
Not applicable.
108
HERC HOLDINGS INC. AND SUBSIDIARIES
SIGNATURES
Pursuant to the requirements of Section 13 or 15(d) of the Securities Exchange Act of 1934, the registrant has duly caused this report to be signed on its behalf by the undersigned, thereunto duly authorized.
|
HERC HOLDINGS INC.
(Registrant) |
|
|
By:
|
/s/ BARBARA L. BRASIER
|
|
Name:
|
Barbara L. Brasier
|
|
Title:
|
Senior Vice President and Chief Financial Officer
|
|
(On behalf of the Registrant)
|
|
|
Date: February 28, 2018
|
|
Pursuant to the requirements of the Securities Exchange Act of 1934, this report has been signed below by the following persons on behalf of the registrant and in the capacities indicated as of February 28, 2018:
|
Signature
|
Title
|
|
|
/s/ LAWRENCE H. SILBER
|
President and Chief Executive Officer, Director
|
|
|
Lawrence H. Silber
|
(Principal Executive Officer)
|
|
|
/s/ BARBARA L. BRASIER
|
Senior Vice President and Chief Financial Officer
|
|
|
Barbara L. Brasier
|
(Principal Financial Officer)
|
|
|
/s/ MARK HUMPHREY
|
Vice President, Controller and Chief Accounting Officer
|
|
|
Mark Humphrey
|
(Principal Accounting Officer)
|
|
|
/s/ HERBERT L. HENKEL
|
Non-Executive Chairman of the Board
|
|
|
Herbert L. Henkel
|
||
|
/s/ JAMES H. BROWNING
|
Director
|
|
|
James H. Browning
|
||
|
/s/ PATRICK D. CAMPBELL
|
Director
|
|
|
Patrick D. Campbell
|
||
|
/s/ JEAN K. HOLLEY
|
Director
|
|
|
Jean K. Holley
|
||
|
/s/ JACOB M. KATZ
|
Director
|
|
|
Jacob M. Katz
|
||
|
/s/ MICHAEL A. KELLY
|
Director
|
|
|
Michael A. Kelly
|
||
|
/s/ COURTNEY MATHER
|
Director
|
|
|
Courtney Mather
|
||
|
/s/ STEPHEN A. MONGILLO
|
Director
|
|
|
Stephen A. Mongillo
|
||
|
/s/ LOUIS J. PASTOR
|
Director
|
|
|
Louis J. Pastor
|
||
|
/s/ MARY PAT SALOMONE
|
Director
|
|
|
Mary Pat Salomone
|
||
109
TABLE OF CONTENTS
Part IItem L. BusinessItem L. Business (continued)Item 1A. Risk FactorsItem La. Risk Factors (continued)Item 1B. Unresolved Staff CommentsItem 2. PropertiesItem 3. Legal ProceedingsItem 3. Legal Proceedings (continued)Item 4. Mine Safety DisclosuresPart IIItem 5. Market For Registrant's Common Equity, Related Stockholder Matters and Issuer Purchases Of Equity SecuritiesItem 5. Market For Registrant's Common Equity, Related Stockholder Matters and Issuer Purchases Of Equity Securities (continued)Item 6. Selected Financial DataItem 7. Management's Discussion and Analysis Of Financial Condition and Results Of OperationsItem 7. Management's Discussion and Analysis Of Financial Condition and Results Of Operations (continued)Item 7A. Quantitative and Qualitative Disclosures About Market RiskItem 7A. Quantitative and Qualitative Disclosures About Market Risk (continued)Item 8. Financial Statements and Supplementary DataNote 1 BackgroundNote 2 Basis Of Presentation and Recently Issued Accounting PronouncementsNote 3 Revenue Earning EquipmentNote 4 Property and EquipmentNote 5 Goodwill and Intangible AssetsNote 6 ImpairmentNote 7 DivestituresNote 8 Accrued LiabilitiesNote 9 DebtNote 10 Financing ObligationsNote 11 Employee Retirement BenefitsNote 12 Stock-based CompensationNote 13 Income TaxesNote 14 LeasesNote 15 Accumulated Other Comprehensive Income (loss)Note 16 Commitments and ContingenciesNote 17 Financial InstrumentsNote 18 Fair Value MeasurementsNote 19 Equity and Earnings (loss) Per ShareNote 20 Related Party TransactionsNote 21 Arrangements with New HertzNote 22 Segment InformationNote 23 Quarterly Financial Information (unaudited)Item 9. Changes in and Disagreements with Accountants on Accounting and Financial DisclosuresItem 9A. Controls and ProceduresItem 9A. Controls and Procedures (continued)Item 9B. Other InformationPart IIIItem 10. Directors, Executive Officers and Corporate GovernanceItem 10. Directors, Executive Officers and Corporate Governance (continued)Item 11. Executive CompensationItem 12. Security Ownership Of Certain Beneficial Owners and Management and Related Stockholder MattersItem 13. Certain Relationships and Related Transactions, and Director IndependenceItem 14. Principal Accountant Fees and ServicesPart IVItem 15. Exhibits and Financial Statement ScheduleItem 16. Form 10-k Summary