As filed with the Securities and Exchange Commission on February 20, 2018.
SECURITIES AND EXCHANGE COMMISSION
WASHINGTON, D.C. 20549
FORM 20-F
|
REGISTRATION STATEMENT PURSUANT TO SECTION 12(b) OR 12(g) OF THE SECURITIES EXCHANGE ACT OF 1934
|
|
Or
|
þ
|
ANNUAL REPORT PURSUANT TO SECTION 13 OR 15(d) OF THE SECURITIES EXCHANGE ACT OF 1934
|
For the fiscal year ended December 31, 2017
Or
|
TRANSITION REPORT PURSUANT TO SECTION 13 OR 15(d) OF THE SECURITIES EXCHANGE ACT OF 1934
|
|
Or
|
SHELL COMPANY REPORT PURSUANT TO SECTION 13 OR 15(d) OF THE SECURITIES EXCHANGE ACT OF 1934
|
|
Date of event requiring this shell company report ____________
For the transition period from N/A to N/A
Commission file number: 001-14930
HSBC Holdings plc
(Exact name of Registrant as specified in its charter)
|
N/A
|
United Kingdom
|
|
|
(Translation of Registrant’s name into English)
|
(Jurisdiction of incorporation or organisation)
|
|
8 Canada Square
London E14 5HQ
United Kingdom
(Address of principal executive offices)
Gavin A Francis
8 Canada Square
London E14 5HQ
United Kingdom
Tel +44 (0) 20 7991 8888
Fax +44 (0) 20 7992 4880
(Name, Telephone, Email and/or Facsimile number and Address of Company Contact Person)
Securities registered or to be registered pursuant to Section 12(b) of the Securities Exchange Act of 1934:
|
Title of each class
|
Name of each exchange on which registered
|
|
|
Ordinary Shares, nominal value US$0.50 each.
|
London Stock Exchange
|
|
|
Hong Kong Stock Exchange
|
||
|
Euronext Paris
|
||
|
Bermuda Stock Exchange
|
||
|
New York Stock Exchange*
|
||
|
American Depository Shares, each representing 5
Ordinary Shares of nominal value US$0.50 each.
|
New York Stock Exchange
|
|
|
6.20% Non-Cumulative Dollar Preference Shares, Series A
|
New York Stock Exchange*
|
|
|
American Depositary Shares evidenced by American Depositary receipts, each representing one-fortieth of a Share of 6.20% Non-Cumulative Dollar Preference Shares, Series A
|
New York Stock Exchange
|
|
|
5.10% Senior Unsecured Notes Due 2021
|
New York Stock Exchange
|
|
|
4.00% Senior Unsecured Notes Due 2022
|
New York Stock Exchange
|
|
|
4.875% Senior Unsecured Notes Due 2022
|
New York Stock Exchange
|
|
|
7.625% Subordinated Notes due 2032
|
New York Stock Exchange
|
|
|
7.35% Subordinated Notes due 2032
|
New York Stock Exchange
|
|
|
6.5% Subordinated Notes 2036
|
New York Stock Exchange
|
|
|
6.5% Subordinated Notes 2037
|
New York Stock Exchange
|
|
|
6.8% Subordinated Notes Due 2038
|
New York Stock Exchange
|
|
|
6.100% Senior Unsecured Notes due 2042
|
New York Stock Exchange
|
|
|
8.125% Perpetual Subordinated Capital Securities Exchangeable at the Issuer’s Option into Non-Cumulative Dollar Preference Shares
|
New York Stock Exchange
|
|
|
8.00% Perpetual Subordinated Capital Securities Exchangeable at the Issuer’s Option into Non-
Cumulative Dollar Preference Shares, Series 2
|
New York Stock Exchange
|
|
|
4.250% Subordinated Notes due 2024
|
New York Stock Exchange
|
|
|
5.250% Subordinated Notes due 2044
|
New York Stock Exchange
|
|
|
4.250% Subordinated Notes due 2025
|
New York Stock Exchange
|
|
|
3.400% Senior Unsecured Notes due 2021
|
New York Stock Exchange
|
|
|
4.300% Senior Unsecured Notes due 2026
|
New York Stock Exchange
|
|
|
Floating Rate Senior Unsecured Notes due 2021
|
New York Stock Exchange
|
|
|
2.950% Senior Unsecured Notes due 2021
|
New York Stock Exchange
|
|
|
3.600% Senior Unsecured Notes due 2023
|
New York Stock Exchange
|
|
|
3.900% Senior Unsecured Notes due 2026
|
New York Stock Exchange
|
|
|
Floating Rate Senior Unsecured Notes due 2021
|
New York Stock Exchange
|
|
|
2.650% Senior Unsecured Notes due 2022
|
New York Stock Exchange
|
|
|
Floating Rate Senior Unsecured Notes due 2022
|
New York Stock Exchange
|
|
|
4.375% Subordinated Notes due 2026
|
New York Stock Exchange
|
|
|
3.262% Fixed Rate/Floating Rate Senior Unsecured Notes due 2023
|
New York Stock Exchange
|
|
|
3.033% Fixed Rate/Floating Rate Senior Unsecured Notes due 2023
|
New York Stock Exchange
|
|
|
4.041% Fixed Rate/Floating Rate Senior Unsecured Notes due 2028
|
New York Stock Exchange
|
|
Securities registered or to be registered pursuant to Section 12(g) of the Securities Exchange Act of 1934:
None
Securities for which there is a reporting obligation pursuant to Section 15(d) of the Securities Exchange Act of 1934:
None
Indicate the number of outstanding shares of each of the issuer’s classes of capital or common stock as of the close of the period covered by the annual report:
Ordinary Shares, nominal value US$0.50 each
20,321,372,907
Indicate by check mark if the registrant is a well-known seasoned issuer, as defined in Rule 405 of the Securities Act.
þ
Yes
¨
No
If this report is an annual or transition report, indicate by check mark if the registrant is not required to file reports pursuant to Section 13 or 15(d) of the Securities Exchange Act of 1934.
¨
Yes
þ
No
Indicate by check mark whether the registrant (1) has filed all reports required to be filed by Section 13 or 15(d) of the Securities Exchange Act of 1934 during the preceding 12 months (or for such shorter period that the registrant was required to file such reports), and (2) has been subject to such filing requirements for the past 90 days.
þ
Yes
¨
No
Indicate by check mark whether the registrant has submitted electronically and posted on its corporate Web site, if any, every Interactive Data File required to be submitted and posted pursuant to Rule 405 of Regulation S-T (§232.405 of this chapter) during the preceding 12 months (or for such shorter period that the registrant was required to submit and post such files).
þ
Yes
¨
No
Indicate by check mark whether the registrant is a large accelerated filer, an accelerated filer, or a non-accelerated filer. See definition of “accelerated filer and large accelerated filer” in Rule 12b-2 of the Exchange Act. (Check one):
|
Large accelerated filer
þ
|
Accelerated filer
|
Non-accelerated filer
|
||
Indicate by check mark which basis of accounting the registrant has used to prepare the financial statements included in this filing:
|
U.S. GAAP
|
International Financial Reporting Standards as issued by the
International Accounting Standards Board
þ
|
Other
|
||
If “Other” has been checked in response to the previous question indicate by check mark which financial statement item the registrant has elected to follow.
¨
Item 17
¨
Item 18
If this is an annual report, indicate by check mark whether the registrant is a shell company (as defined in Rule 12b-2 of the Exchange Act).
¨
Yes
þ
No
|
*
|
Not for trading, but only in connection with the registration of American Depositary Shares.
|
Connecting customers to opportunities
HSBC aims to be where the growth is, enabling business to thrive and economies to prosper, and ultimately helping people to fulfil their hopes and realise their ambitions.
Our cover image
Guangzhou is one of China’s largest and most dynamic cities. It is the capital of Guangdong Province and lies at the heart of China’s Pearl River Delta (PRD), one of the country’s fastest growing economic regions. The PRD in recent years has transformed from being the exporting factory floor of the world into a global leader in digital commerce and innovation. HSBC has had a presence in China for more than 150 years. China is an important part of the Group’s strategy and we have branches across the PRD. In December 2017 HSBC Qianhai Securities Limited, the first joint venture securities company in mainland China to be majority-owned by a foreign bank, opened for business in the PRD.
Inside front cover image
Dubai financial district.
Our photo competition winners
This report showcases five images taken by our employees around the world. The images were selected from more than 2,100 submissions to a Group-wide photography competition. Launched in June 2017, HSBC NOW Photo is an ongoing project that encourages employees to capture and share the diverse world around them with a camera.
None of the websites referred to in this Annual Report on Form 20-F for the year ended December 31, 2017 (the “Form 20-F”), including where a link is provided, nor any of the information contained on such websites is incorporated by reference in the Form 20-F.
Contents
Strategic Report
An overview of how we are structured, what we do and where, our strategic actions, the principal risks we face, and high-level performance information. The section is introduced by both the Group Chairman and the Group Chief Executive, and also explains the role of the Board.
This Strategic Report was approved by the Board on 20 February 2018.
Mark E Tucker
Group Chairman
2
Highlights
1a Forward-looking statements and Certain defined terms
4
Group Chairman’s Statement
7
Group Chief Executive’s Review
10
Our strategy
12
Strategic actions
14
Financial overview
18
Global businesses
22
How we do business
28
Risk overview
30
Remuneration
Financial Review
Detailed reporting of our financial performance, at Group level as well as within our matrix structure. It also includes our full risk report and reporting on how we manage capital.
32
Financial summary
64
Global businesses and geographical regions
83
Other information
86
Regulation and supervision
93 Disclosures pursuant to section 13(r) of the Securities Exchange Act
95
Risk
162
Capital
Corporate Governance
Details of our Board of Directors and senior management, and our approach to corporate governance and remuneration.
166
Corporate Governance Report
167
Biographies of Directors and senior management
171
Board of Directors
172
Board committees
178
Internal control
179
Going concern
179
Share capital and other disclosures
183
Employees
186
Directors’ Remuneration Report
Financial Statements
Our financial statements and related notes and reports.
210
Report of the Independent Registered Public Accounting Firm to the Board of Directors and Shareholders of HSBC Holdings plc
211
Financial Statements
222
Notes on the Financial Statements
Other Information
Important information for our shareholders, including contact information. Like any industry and company, we have our set of abbreviations and terminology. Accordingly, we provide an explanation of the abbreviations used. A glossary of key terms is available online at www.hsbc.com/investor-relations.
298
Shareholder information
306
Glossary of accounting terms and US equivalents
307 2016 HSBC 20F reconciliations table
309
Abbreviations
Our values
Our values define who we are as an organisation and make us distinctive.
Dependable
We are dependable, standing firm for what is right and delivering on commitments.
Open
We are open to different ideas and cultures, and value diverse perspectives.
Connected
We are connected to our customers, communities, regulators and each other, caring about individuals and their progress.
As a reminder
Reporting currency
We use US dollars.
Adjusted
measures
We supplement our IFRS figures with adjusted measures used by management internally. These measures are highlighted with the following symbol:
<
>
Ñ
Further explanation may be found on page
32
.
|
HSBC Holdings plc
|
1
|
|
Cautionary statement regarding forward-looking statements
The
Form 20-F
contains certain forward-looking statements with respect to HSBC’s financial condition, results of operations and business.
Statements that are not historical facts, including statements about HSBC’s beliefs and expectations, are forward-looking statements. Words such as ‘expects’, ‘targets’, ‘anticipates’, ‘intends’, ‘plans’, ‘believes’, ‘seeks’, ‘estimates’, ‘potential’ and ‘reasonably possible’, variations of these words and similar expressions are intended to identify forward-looking statements. These statements are based on current plans, estimates and projections, and therefore undue reliance should not be placed on them. Forward-looking statements speak only as of the date they are made. HSBC makes no commitment to revise or update any forward-looking statements to reflect events or circumstances occurring or existing after the date of any forward-looking statements.
Written and/or oral forward-looking statements may also be made in the periodic reports to the US Securities and Exchange Commission, summary financial statements to shareholders, proxy statements, offering circulars and prospectuses, press releases and other written materials, and in oral statements made by HSBC’s Directors, officers or employees to third parties, including financial analysts.
Forward-looking statements involve inherent risks and uncertainties. Readers are cautioned that a number of factors could cause actual results to differ, in some instances materially, from those anticipated or implied in any forward-looking statement. These include, but are not limited to:
|
•
|
Changes in general economic conditions in the markets in which we operate, such as continuing or deepening recessions and fluctuations in employment beyond those factored into consensus forecasts; changes in foreign exchange rates and interest rates; volatility in equity markets; lack of liquidity in wholesale funding markets; illiquidity and downward price pressure in national real estate markets; adverse changes in central banks’ policies with respect to the provision of liquidity support to financial markets; heightened market concerns over sovereign creditworthiness in over-indebted countries; adverse changes in the funding status of public or private defined benefit pensions; and consumer perception as to the continuing availability of credit and price competition in the market segments we serve.
|
|
•
|
Changes in government policy and regulation, including the monetary, interest rate and other policies of central banks and other regulatory authorities; initiatives to change the size, scope of activities and interconnectedness of financial institutions in connection with the implementation of stricter regulation of financial institutions in key markets worldwide; revised capital and liquidity benchmarks which could serve to deleverage bank balance sheets and lower returns available from the current business model and portfolio mix; imposition of levies or taxes designed to change business mix and risk appetite; the practices, pricing or responsibilities of financial institutions serving their consumer markets; expropriation, nationalisation, confiscation of assets and changes in legislation relating to foreign ownership; changes in bankruptcy legislation in the principal markets in which we operate and the consequences thereof; general changes in government policy that may significantly influence investor decisions; extraordinary government actions as a result of current market turmoil; other unfavourable political or diplomatic developments producing social instability or legal uncertainty which in turn may affect demand for our products and services; the costs, effects and outcomes of product regulatory reviews, actions or litigation, including any additional compliance requirements; and the effects of competition in the markets where we operate including increased competition from non-bank financial services companies, including securities firms.
|
|
•
|
Factors specific to HSBC, including our success in adequately identifying the risks we face, such as the incidence of loan losses or delinquency, and managing those risks (through account management, hedging and other techniques). Effective risk management depends on, among other things, our ability through stress testing and other techniques to prepare for events that cannot be captured by the statistical models it uses; and our success in addressing operational, legal and regulatory, and litigation challenges; and other risks and uncertainties we identify in ‘top and emerging risks’ on pages
95
to
106
.
|
Certain defined terms
Unless the context requires otherwise, ‘HSBC Holdings’ means HSBC Holdings plc and ‘HSBC’, the ‘Group’, ‘we’, ‘us’ and ‘our’ refer to HSBC Holdings together with its subsidiaries. Within this document the Hong Kong Special Administrative Region of the People’s Republic of China is referred to as ‘Hong Kong’. When used in the terms ‘shareholders’ equity’ and ‘total shareholders’ equity’, ‘shareholders’ means holders of HSBC Holdings ordinary shares and those preference shares and capital securities issued by HSBC Holdings classified as equity. The abbreviations ‘$m’, ‘$bn’ and ‘$tn’ represent millions, billions (thousands of millions) and trillions of US dollars, respectively.
|
HSBC Holdings plc
|
1a
|
Highlights
Our international network, universal banking model and capital strength deliver long-term value for customers and shareholders.
Group
For year ended 31 Dec 2017
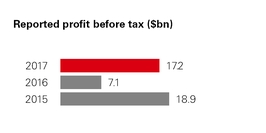
(2016:
$7.1bn
)
$17.2bn

(2016:
$18.9bn
)
$21.0bn

(2016:
$48.0bn
)
$51.4bn
At 31 Dec 2017
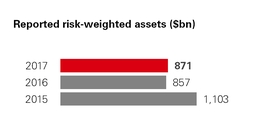
(2016:
$857
bn)
$871bn
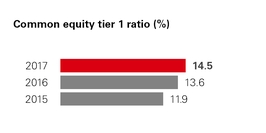
(2016: 13.6%)
14.5
%
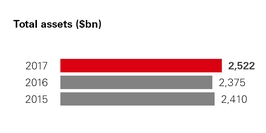
(2016:
$2,375bn
)
$2,522bn
Strategy execution
|
–
|
Delivered growth from our international network with a 6% increase in transaction banking product revenue and a 13% rise in revenue synergies between global businesses compared with 2016.
|
|
–
|
Achieved annualised run-rate savings of $6.1bn since our Investor Update in 2015, while continuing to invest in growth, and regulatory programmes and compliance; 2017 exit run-rate in line with 2014 cost base.
|
|
–
|
Exceeded our risk-weighted assets (‘RWAs’) reduction target; extracting a total of $338bn of RWAs from the business since the start of 2015.
|
|
–
|
Pivot to Asia generating returns and driving over 75% of Group reported and adjusted profit in 2017.
|
|
–
|
Delivered a return on equity of 5.9% in 2017, up from 0.8% in 2016. We will continue to invest for growth and manage our capital efficiently to achieve our medium-term ROE target of >10%.
|
About HSBC
Around
38 million
customers bank with us.
We employ
229,000
people around the world*.
We have
200,000
shareholders in 131 countries and territories.
Today, HSBC has around
3,900
offices in 67 countries and territories worldwide.
*Full-time equivalent staff
|
2
|
HSBC Holdings plc
|
Our global businesses
Our operating model consists of four global businesses and a Corporate Centre, supported by HSBC Operations Services and Technology, and
11
global functions, including: risk, finance, financial crime risk, legal, marketing and human resources.
|
Retail Banking and Wealth Management (‘RBWM’)
|
Commercial Banking (‘CMB’)
|
Global Banking and Markets (‘GB&M’)
|
Global Private Banking (‘GPB’)
|
|
We help millions of people across the world to manage their finances, buy their homes, and save and invest for the future. Our Insurance and Asset Management businesses support all our global businesses in meeting their customers’ needs.
|
We support approximately 1.7 million business customers in 53 countries and territories with banking products and services to help them operate and grow. Our customers range from small enterprises focused primarily on their domestic markets, through to large companies operating globally.
|
We provide financial services and products to companies, governments and institutions. Our comprehensive range of products and solutions, across capital financing, advisory and transaction banking services, can be combined and customised to meet clients’ specific objectives.
|
We help high net worth individuals and their families to grow, manage and preserve their wealth.
|
|
Adjusted profit before tax
<
>
|
|||
|
(2016: $5.2bn)
|
(2016: $5.9bn)
|
(2016: $5.5bn)
|
(2016: $0.3bn)
|
|
$6.5bn
|
$6.8bn
|
$5.8bn
|
$0.3bn
|
|
Adjusted risk-weighted assets
<
>
|
|||
|
(31 Dec 2016: $114.7bn)
|
(31 Dec 2016: $286.9bn)
|
(31 Dec 2016: $307.7bn)
|
(31 Dec 2016: $15.7bn)
|
|
$121.5bn
|
$301.0bn
|
$299.3bn
|
$16.0bn
|
<
>
Our global businesses are presented on an adjusted basis, which is consistent with the way in which we assess the performance of our global businesses.
Delivery against Group financial targets
|
Return on equity
5.9%
|
Adjusted jaws
<
>
+1%
|
Dividends per ordinary share in respect of 2017
$0.51
|
Ñ
For further details, see page
17
.
|
HSBC Holdings plc
|
3
|
|
Group Chairman’s Statement
With an international network covering 90% of global trade flows and a leading presence in the world’s fastest growing region, we are in a prime position to help our customers capitalise on broad-based global growth.
Our 2017 results demonstrate both the strength and the potential of the Group. A large increase in reported profit before tax reflected both a healthy business and the non-recurrence of significant items from 2016. All of our global businesses grew adjusted profits and our three main global businesses generated improved adjusted revenue.
Strong revenue growth more than covered the cost of business investment, and increased lending laid a foundation for future performance. Asia again contributed a substantial proportion of the Group’s profits, particularly in Commercial Banking and Retail Banking and Wealth Management. Together, this delivered an adjusted Group profit before tax of $21bn, up 11% on 2016.
This performance has enabled us to approve an unchanged fourth interim dividend of $0.21. This brings the total dividend for 2017 to $0.51, representing a total shareholder return of 24% for 2017.
Board changes
As I start my first full year as Group Chairman, I am very grateful to my predecessor, Douglas Flint, and to Stuart Gulliver for ensuring a smooth handover. They steered HSBC through challenging waters during and after the global financial crisis, and renewed HSBC’s reputation as one of the world’s strongest and safest international banks. They have passed on a strong legacy.
My first responsibility as Group Chairman was to appoint a successor to Stuart who would be capable of building on his achievements while further enhancing the qualities that make HSBC unique. With an exceptional record of managing a diverse range of international businesses and a deep understanding of HSBC’s heritage and culture, John Flint was clearly the outstanding candidate. The Board and I look forward to working closely with John and his management team.
2017 also saw other Board changes as we said goodbye to Rachel Lomax, Sam Laidlaw and Paul Walsh. All three provided valuable service and wise counsel to the Board and I thank them warmly for their advice and support. I am especially grateful to Rachel for her excellent work as the Senior Independent Director and to Sam for his thoughtful leadership of the Nomination Committee.
|
4
|
HSBC Holdings plc
|
The year ahead
The Board is focused on sustaining resilience by enhancing reputation and performance. We will further develop our strategy to deliver value to all of our stakeholders within a governance framework that provides stability, prudence and effective oversight.
We expect the world’s major economies to show reasonable growth in 2018, helped by relatively low unemployment, recovering consumer confidence and improving trade. Fears of a hard landing in China have receded, and markets across Asia look set for a strong year. The anticipated conclusion of large regional trade agreements in 2018, mostly involving Asian nations, also provides cause for optimism. With an international network covering 90% of global trade flows and a leading presence in the world’s fastest growing region, we are in a prime position to help our customers capitalise on this broad-based global growth.
While we are optimistic about the prospects for the global economy, rising international tensions, the threat of protectionism and a lack of inclusive growth all have the potential to disrupt economic activity. We continue to model and anticipate a wide range of scenarios as part of our day-to-day risk management, to cover unlikely but not impossible events. As a well-diversified business underpinned by historically stable revenue generation and significant capital strength, HSBC is well equipped to manage the risks and uncertainty inherent in today’s world.
|
HSBC Holdings plc
|
5
|
|
Transparency and disclosure
Last year, we published a range of environmental, social and governance (‘ESG’) metrics to enable investors and customers to assess our non-financial performance. The data we disclose will continue to evolve as we learn more about what our stakeholders find useful and improve our ability to collect the necessary information. We will publish our next ESG Update on our website in April 2018.
We are also making our first disclosure under the terms of the Financial Stability Board’s Task Force on Climate-related Financial Disclosures. This can be found on page 27. As one of the world’s largest international banks, we take seriously our responsibility to help develop a voluntary, consistent and comparable system of climate-related financial disclosure. We intend to continue to expand and improve the quality and specificity of these disclosures, and to encourage all those who work with us to do the same.
Supporting our people
It is important not just to achieve good results, but to do so in a way that treats all of our stakeholders – employees, customers, regulators and shareholders – in a fair and transparent way. We are committed to holding ourselves to account in meeting that aim, and to being accountable to our stakeholders for our actions.
As part of this commitment, the Board and I are determined to ensure that HSBC remains a place where all our people have the opportunity to fulfil their potential in a nurturing environment that encourages the right behaviour. Our stakeholders expect honesty and integrity and we will continue to promote a culture in which people do the right thing.
My special thanks are due on behalf of the Board to each of the 229,000 people who work for HSBC around the world. In my short time as Group Chairman I have been enormously impressed by the effort, energies and ability of our people in each country I have visited. These results are a testament to their hard work and dedication.
Mark E Tucker
Group Chairman
20 February 2018
|
6
|
HSBC Holdings plc
|
Group Chief Executive’s Review
HSBC is simpler, stronger and more secure than it was in 2011, and better able to connect customers to opportunities in the world’s fastest growing regions.
2017 was an important year for HSBC. We completed the transformation programme that we started in 2015, maximising the benefits of our network and increasing our competitive advantages. By the end of the year we had exceeded our risk-weighted asset and cost-saving targets, rebuilt our Mexico business, delivered revenue growth from our international network in excess of global economic growth, and accelerated investment in our operations in Asia. We also opened new businesses and launched products that considerably strengthen the service that we offer our international clients.
These achievements, and the work that preceded them, were a critical factor in delivering a strong financial performance in 2017. The strength of our three main global businesses generated significant increases in both reported and adjusted Group profit before tax (‘PBT’), while reported PBT also benefited from the non-recurrence of a number of large significant items from 2016. Adjusted PBT and adjusted revenue were up in four out of five regions. We grew adjusted revenue faster than adjusted costs, and continued to increase our market share in strategic product areas.
Business performance
Retail Banking and Wealth Management had an excellent 2017, with strong adjusted revenue increases across a number of business lines. In Retail Banking, interest rate rises helped to grow revenue as our robust balance sheet and capital strength continued to attract deposits, particularly in Hong Kong. We continued to grow lending in our target markets, especially Hong Kong, the UK and Mexico. Wealth Management benefited from improving customer investment appetite, strong product sales across all categories and the impact of market movements on our life insurance manufacturing businesses.
Commercial Banking adjusted revenue grew well on the back of an outstanding performance in Global Liquidity and Cash Management. Higher lending volumes helped Credit and Lending overcome the impact of narrower spreads. Global Trade and Receivables Finance revenue stabilised after a difficult 2016 and we increased our share of major markets, including trade finance in Hong Kong and receivables finance in the UK. HSBC was voted market leader for trade finance in
Euromoney’s
annual trade finance survey in January 2018.
Global Banking and Markets grew adjusted revenue, driven particularly by strong growth in Global Liquidity and Cash Management, and Securities Services. Growth in the first three quarters of the year in Markets and Banking enabled both to withstand the effects of subdued market activity in the fourth quarter.
Global Private Banking adjusted revenue reflected the impact of historical repositioning, but was stable over the course of 2017. The business grew adjusted revenue by 10% in its target markets.
Our strong revenue generation meant that the Group achieved positive adjusted jaws in 2017. We accelerated investment to grow the business, particularly in Retail Banking and Wealth Management, which contributed to an increase in adjusted costs. Performance-related compensation also grew in line with profit before tax.
|
HSBC Holdings plc
|
7
|
|
Adjusted loan impairment charges were significantly lower than 2016, mainly due to improved conditions in the oil and gas industry in North America.
Our strong common equity tier one ratio of 14.5% included the effect of recent changes in US tax legislation, which reduced our capital position by 9 basis points. It also included the impact of our most recent $2bn share buy-back. In 2017, we returned a total of $3bn to shareholders through share buy-backs and paid more in dividends than any other European or American bank. We achieved this while maintaining one of the strongest capital ratios in the industry.
Strategic actions
The strength of our business is due in large part to the strategic actions that we first announced in June 2015. This programme concluded at the end of 2017 with eight out of ten actions completed on time and on target (see page
12
).
HSBC is much more capital efficient and capable of producing stronger returns for investors as a consequence of these actions. Our cost-reduction programmes have enabled us to absorb the cost of growing the business and protecting HSBC from financial crime, while improving the efficiency and security of our processes.
Our previously underperforming Mexico business is increasingly profitable and well positioned for further growth. Whilst our US business remains a work in progress, it is a valuable source of business for other regions and continues to make important progress. We also completed the run-off of our legacy US consumer and mortgage lending portfolio, bringing an end to a difficult chapter in HSBC’s recent history.
Our international network is now much better able to connect customers to opportunities and delivering revenue growth above that of the global economy. 53% of client revenue now comes from international clients, up from 50% in 2015. Global Liquidity and Cash Management in particular is now a major component of the bank’s success, and Global Trade and Receivables Finance has extended its leadership of the global trade finance market.
The Group’s business mix is more oriented towards Asia, improving our ability to channel the economic and social changes taking place within the world’s fastest growing region. Asia contributes a larger proportion of the Group’s profits than in 2015, reflecting regional investment in growing our loan book, building our insurance and asset management businesses, and connecting customers to opportunities within the region.
We continued to expand our presence in mainland China with the launch of new retail banking products and increased lending in the Pearl River Delta. In December we launched HSBC Qianhai Securities, the first securities joint venture in mainland China to be
majority-owned by an international bank. This allows us to offer our clients increased access to China’s rapidly expanding capital markets and provides an unprecedented opportunity to establish and grow a securities business in mainland China with strong international standards. This underlines our status as the leading international bank in mainland China.
We won a number of significant new business mandates related to the China-led Belt and Road Initiative in 2017, and opened new China desks in Poland, Luxembourg, Thailand and Macau to capture further opportunities. We now have a total of 24 China desks aimed at supporting Chinese businesses with global outbound ambitions, 20 of which are along the ‘Belt and Road’ routes. In November we were named ‘Best Bank for Belt and Road’ at the
FinanceAsia
Achievement Awards 2017.
|
8
|
HSBC Holdings plc
|
Fighting financial crime
For the past five years, we have been weaving Global Standards into the fabric of HSBC. The investment that we have made in our financial crime risk management capabilities has considerably strengthened our ability to protect the integrity of the financial system. We have assembled a highly expert team which is helping to shape the debate about our industry’s role in the fight against financial crime. We have made great strides in building a compliance function fit for the many evolving challenges we face, and built partnerships to combat financial crime with regulatory and law enforcement authorities around the world.
The expiration in December of the five-year deferred prosecution agreement that we entered into with the US Department of Justice in 2012 (‘AML DPA’) was an important milestone for HSBC. Nevertheless, exiting the AML DPA was a product rather than the focus of the essential work that we have done to transform our compliance capabilities and protect the financial system. This work will continue as we seek to ensure that the changes we have made are effective and sustainable. Combating financial crime is a never-ending exercise and will be a constant focus for the Group’s management.
Thank you
As I prepare to pass on the stewardship of HSBC to my successor, I am proud of our achievements of the last seven and a half years. After the most extensive transformation programme in HSBC’s 153 year history, HSBC is simpler, stronger and more secure than it was in 2011, and better able to connect customers to opportunities in the world’s fastest growing regions. We have also delivered excellent value to shareholders through a higher share price, $64.7bn in declared dividends and $5.5bn in share buy-backs, representing a total shareholder return of 70.3% from 2011 to the end of 2017.
I am pleased to be handing over to such a capable successor as John Flint, whose intimate knowledge of HSBC and its culture will be a considerable asset to the bank and its clients. I am grateful to my colleagues on the Group Management Board for their support since 2011, and to Douglas Flint and Mark Tucker for their backing.
Finally, my sincere thanks go to all of my HSBC colleagues around the world, past and present, whose hard work and commitment are the foundation of the bank’s success. It has been my privilege to work with them for the last 38 years.
Stuart Gulliver
Group Chief Executive
20 February 2018
|
HSBC Holdings plc
|
9
|
|
Our strategy
We have developed a long-term strategy that reflects our purpose and enables us to capture value from our international network.
Two-pronged long-term strategy
Develop our international network
To serve enterprises across geographies and facilitate international trade and capital flows, thereby helping our clients to grow their business.
Invest in wealth and retail businesses with local scale
To make the most of global social mobility, wealth creation and long-term demographic changes in our select retail banking and wealth management markets.
Value of the network and our strategy
Access to global growth opportunities
Our unparalleled network covers countries accounting for approximately 90% of global GDP, trade and capital flows. We have a leading presence in large and fast-growing economies.
Our network covers all of the world’s 30 largest trade corridors forecast for 2030. These top 30 corridors are expected to have a compound annual growth rate well in excess of GDP growth expectations from 2016 to 2030.
Lower risk profile and volatility from our geographically diversified universal banking model
We operate a balanced universal banking model across both wholesale and retail businesses and we are geographically diversified. This has resulted in a lower risk profile and lower earnings volatility compared to our global peers. Our business model has remained resilient through business cycles, and it helps ensure stable funding and liquidity.
Strong capital and funding base
CET1 ratio of
14.5
% supported by increased shareholders’ equity to meet new regulatory requirements since the end of 2010.
Four interconnected, global businesses share balance sheets and liquidity in addition to strong commercial links.
Stable shareholder returns
Industry leading dividend – approximately $65bn declared from 2011 to 2017 – as well as circa $5.5bn of share repurchases.
|
10
|
HSBC Holdings plc
|
Long-term trends
Our strategy positions us to capitalise on several long-term trends.
Increasing connectivity and global flows of trade, finance and data are key drivers of GDP growth.

Source: Global Insight’s Comparative World Overview.
Emerging market economies are expected to be twice the size of developed economies by 2050.

Source: United Nations Conference on Trade and Development.
The middle class is expected to grow by over two billion people from 2017 to 2030, driven by growth in Asia’s middle class.

Source: Global Economy and Development at Brookings, The Unprecedented Expansion of the Middle Class (2017).
Climate change is accelerating and global temperatures are trending significantly higher. Investment in renewable energy capacity will be needed to limit the global temperature increase to 2°C.

|
Required by 2050 as per IEA 66% 2°C scenario
|
|
|
Current (2016)
|
|
Source: OECD, Investing in Climate, Investing in Growth (2017).
*
The scenario assumes a 66% probability of keeping the mean global surface temperature rise throughout the 21st century to below 2°C above pre-industrialised levels.
Client examples
Trina Solar (‘Trina’): China, renewable energy
Exporter of solar panels globally. Trina’s aim is to bring China’s green energy solutions to countries along the Belt and Road Initiative route, and has thus stepped up its overseas investment, particularly in the ASEAN region. HSBC created a digital platform for Trina that gave its headquarters a transparent view of its ASEAN-region subsidiaries’ cash positions and set up a cash pool in Singapore to seamlessly connect Trina’s HSBC accounts globally.
Reckitt Benckiser (‘RB’): UK, consumer goods
Global consumer health and hygiene company. HSBC acted as financial adviser and lead financier to Reckitt Benckiser on its $18bn acquisition of Mead Johnson Nutrition Company, a leader in infant and children’s nutrition. This acquisition marked one of the largest UK into US transactions and considerably strengthened RB’s presence in developing markets, particularly China.
Zhejiang Geely: China, automotive
Leading automobile manufacturer. HSBC served as sole financial adviser for Zhejiang Geely on two interlinked China outbound investments, one in Malaysian carmaker Proton Holdings and the second in Lotus Advance Technologies, a subsidiary of Proton based in the UK. These transactions were enabled by collaboration between HSBC teams in mainland China, Hong Kong, Singapore, Malaysia and London.
Morgan McKinley: Ireland, professional services
Global recruitment agency with operations in Ireland, UK, EMEA and APAC. In 2017, Morgan McKinley expanded HSBC’s global mandate to include cross-border Global Trade and Receivables Finance (‘GTRF’) facilities and Global Liquidity and Cash Management (‘GLCM’) services in Canada and Japan. HSBC’s ‘one-team’ approach, not separated by product, was cited by the client as being a key driver in the decision to switch to HSBC.
|
HSBC Holdings plc
|
11
|
|
Strategic actions
We met eight out of ten targets from the strategic actions outlined in our Investor Update in June 2015.
Capturing value from our international network
In June 2015, we outlined a series of strategic actions to make the most of our competitive advantages and respond to a changing environment.
These actions focused on using our resources more efficiently and on investing for growth. Each action had targets defined to the end of 2017. The table opposite contains a summary of our progress with additional details provided below.
Resizing and simplifying our business
We passed several significant milestones in resizing and simplifying our business in 2017. Our management actions delivered a gross reduction of risk-weighted assets (‘RWAs’) by $338bn, exceeding our RWA reduction target from management initiatives by $60bn on an FX-adjusted basis.
Among our NAFTA region Investor Update targets, we did not reach our US profit before tax (‘PBT’) target of $2bn. However, we have taken steps forward in, for example, our US Retail Banking and Wealth Management (‘RBWM’) business, where we increased PBT, revenues and deposits, and migrated over one million customers to our impending new core banking platform. We also completed the wind-down of our US consumer and mortgage lending (‘CML’) run-off portfolio. In Mexico, our adjusted PBT reached $440m, surpassing our Investor Update target on a local currency basis. We also grew adjusted revenue in Mexico by 11% compared with 2016, supported by increased loan balances from market share gains.
We remain on course to complete the set-up of our UK ring-fenced bank (‘RFB’) ahead of the 1 January 2019 statutory deadline. In 2017, we received a restricted bank licence for the RFB and are working through an agreed mobilisation plan with the Prudential Regulatory Authority and Financial Conduct Authority to receive an unrestricted licence in 2018.
We successfully concluded our cost-saving programme and realised $6.1bn of annual run-rate savings, over $1bn more than our Investor Update target. The programme enabled 2017 exit run-rate adjusted costs to be kept flat compared with the 2014 cost base. The savings offset increased costs from areas such as regulatory programmes and compliance, and investments to help facilitate further business growth. For example, in RBWM, we expanded the use of biometrics globally with over 1.5 million customers using voice recognition, and with fingerprint technology launched in nine of our markets. For our corporate customers, we improved our key digital channels with significant improvements to HSBCnet and HSBC Connect. Our costs-to-achieve transformation concluded with approximately $7bn spent since the start of the programme.
Redeploying capital to grow our business
Our international network remains core to our strategy, and we achieved our Investor Update target of revenue growth above GDP. In 2017, we grew our revenue from transaction banking products by 6%, including double-digit percentage growth in GLCM and HSBC Security Services (‘HSS’). We grew GTRF market share in key markets, in particular Hong Kong and receivables finance in the UK. Cross-border revenues from our priority corridors grew 10%, with double-digit percentage growth in four of our five largest priority corridors including our China-US corridor. We were named ‘Top Global Trade Finance Bank’ by our clients in the
Euromoney
Trade Finance Survey 2018.
We delivered on our 2015 Investor Update commitment to prioritise and accelerate investments in Asia. In 2017, we grew our loan portfolio in the region by $53bn to $426bn. Our asset management and insurance businesses in Asia realised 17% and 8% growth in AUM and annualised new business premiums, respectively. In mainland China, we reached over 400,000 cards in circulation since launching credit cards at the end of 2016, and we grew our customer loans in the Pearl River Delta region by 23%. We launched HSBC Qianhai Securities, the first securities joint venture in mainland China to be majority-owned by an international bank.
Revenue tied to renminbi (‘RMB’) internationalisation in 2017 of $1.2bn did not meet our Investor Update target of $2.0bn to $2.5bn. This was largely due to a decrease in overall market volumes. However, we continue to be recognised as the leading bank for international RMB products and services. We ranked first in
Bloomberg
’s offshore RMB bond underwriting league table in 2017 with 28% market share and first for the sixth year in a row in the
Asiamoney
Offshore RMB Poll 2017. We had the largest share, at 53%, of approved quota of RMB Qualified Foreign Institutional Investor (‘RQFII’) custodian business.
Selected awards and recognition
Euromoney Trade Finance Survey 2018
Top Global Trade Finance Bank
Euromoney Awards for Excellence 2017
World’s Best Bank
World’s Best Investment Bank in the Emerging Markets
Asia’s Best Bank
North America’s Best Bank for Transaction Services
Euromoney Cash Management Survey 2017
Best Global Cash Manager for Corporates
Best Global Cash Manager for Financial Institutions for all Transactions
Asiamoney New Silk Road Finance Awards 2017
Best Overall International Bank for Belt and Road Initiative
|
12
|
HSBC Holdings plc
|
This page is intentionally left blank
|
HSBC Holdings plc
|
13
|
|
Financial overview
Reported results
|
Reported results
|
2017
$m
|
|
2016
$m
|
|
2015
$m
|
|
|
Net interest income
|
28,176
|
|
29,813
|
|
32,531
|
|
|
Net fee income
|
12,811
|
|
12,777
|
|
14,705
|
|
|
Net trading income
|
7,719
|
|
9,452
|
|
8,723
|
|
|
Other income
|
2,739
|
|
(4,076
|
)
|
3,841
|
|
|
Net operating income before loan impairment charges and other credit risk provisions (‘revenue’)
|
51,445
|
|
47,966
|
|
59,800
|
|
|
Loan impairment charges and other credit risk provisions
|
(1,769
|
)
|
(3,400
|
)
|
(3,721
|
)
|
|
Net operating income
|
49,676
|
|
44,566
|
|
56,079
|
|
|
Total operating expenses
|
(34,884
|
)
|
(39,808
|
)
|
(39,768
|
)
|
|
Operating profit
|
14,792
|
|
4,758
|
|
16,311
|
|
|
Share of profit in associates and joint ventures
|
2,375
|
|
2,354
|
|
2,556
|
|
|
Profit before tax
|
17,167
|
|
7,112
|
|
18,867
|
|
This table shows our reported results for the last three years, ended 31 December 2017, 2016 and 2015.
All commentary in this financial overview compares the 2017 results with 2016, unless otherwise stated.
Reported profit before tax
Reported profit before tax of
$17.2bn
was
$10.1bn
or
141%
higher, mainly reflecting a net favourable movement of significant items of
$8.5bn
, which is described in more detail on page
32
. Excluding significant items and an adverse effect of foreign currency translation of
$0.5bn
, profit before tax increased by
$2.1bn
or
11%
.
Reported revenue
Reported revenue of
$51.4bn
was
$3.5bn
or
7%
higher, partly reflecting a net favourable movement in significant items of
$2.0bn
, which included:
|
–
|
in 2016, unfavourable fair value movements on our own debt designated at fair value reflecting changes in our own credit spread of
$1.8bn
, which are now reported in other comprehensive income, following our partial early adoption of IFRS 9 ‘Financial Instruments’ on 1 January 2017; and
|
|
–
|
favourable fair value movements in 2017 of
$0.1bn
on non-qualifying hedges, compared with adverse movements of
$0.7bn
in 2016.
|
Net favourable movements were partly offset by:
|
–
|
in 2016, a
$0.7bn
gain on the disposal of our membership interests in Visa Europe and Visa Inc. This compared with a
$0.3bn
gain on the disposal of our shares in Visa Inc. during 2017;
|
|
–
|
adverse debit value adjustments on derivative contracts in 2017 of
$0.4bn
, compared with minimal movements in 2016; and
|
|
–
|
in 2017, a
$0.1bn
provision related to customer redress programmes in the UK, and a $0.1bn charge arising from the opportunity to increase our investment in new businesses.
|
Significant items also included a loss of $1.7bn recognised in 2016 on the sale of operations in Brazil to Banco Bradesco S.A., which was completed on 1 July 2016. This loss was substantially offset by the reported revenue earned by the Brazil business during 2016 of $1.5bn.
Excluding significant items, and an adverse effect of foreign currency translation of
$0.7bn
, revenue increased by
$2.2bn
or
5%
, reflecting growth in Retail Banking and Wealth Management (‘RBWM’), Commercial Banking (‘CMB’) and Global Banking and Markets (‘GB&M’).
Reported LICs
Reported loan impairment charges and other credit risk provisions (‘LICs’) of
$1.8bn
were
$1.6bn
lower, in part reflecting the effect of significant items, which comprised the LICs incurred by our operations in Brazil in 2016 of
$0.7bn
.
Excluding significant items and the adverse effect of foreign currency translation of
$0.1bn
, LICs decreased by
$0.8bn
or
32%
. The reduction in LICs was primarily in CMB, RBWM and Corporate Centre.
Reported operating expenses
Reported operating expenses of
$34.9bn
were
$4.9bn
or
12%
lower. This included a net decrease in significant items of
$5.6bn
, including:
|
–
|
a
$3.2bn
write-off of goodwill in our GPB business in Europe in 2016;
|
|
–
|
a net release of
$0.4bn
in settlements and provisions in connection with legal matters, compared with charges in 2016 of
$0.7bn
;
|
|
–
|
operating expenses of
$1.1bn
in 1H16 incurred by the operations in Brazil that we sold; and
|
|
–
|
costs to achieve of
$3.0bn
, compared with
$3.1bn
in 2016.
|
Excluding significant items and a favourable effect of foreign currency translation of
$0.3bn
, operating expenses increased by
$1.1bn
. This increase mainly reflected increased investment in growth programmes, primarily in RBWM, where investments were partly funded by the proceeds from our disposal of Visa shares, and higher performance-related pay.
|
14
|
HSBC Holdings plc
|
Reported income from associates and joint ventures
Reported income from associates and joint ventures of
$2.4bn
increased by
$21m
.
Dividends
On 20 February 2018, the Board announced a fourth interim dividend of $0.21 per ordinary share.
Adjusted performance
Our reported results are prepared in accordance with IFRSs as detailed in the Financial Statements on page
222
.
We present adjusted performance measures to align internal and external reporting, identify and quantify items management believes to be significant, and provide insight into how management assesses period-on-period performance. Adjusted performance measures are highlighted with the following symbol:
<
>
To derive adjusted performance, we adjust for:
|
–
|
the year-on-year effects of foreign currency translation differences; and
|
|
–
|
the effect of significant items that distort year-on-year comparisons and are excluded in order to improve understanding of the underlying trends in the business.
|
Ñ
For reconciliations of our reported results to an adjusted basis, including lists of significant items, see page
66
.
Adjusted results
<
>
This table shows our adjusted results for 2017 and 2016. These are discussed in more detail on the following pages.
|
Adjusted results
<
>
|
2017
$m
|
|
2016
$m
|
|
(%)
|
|
|
Net operating income before loan impairment charges and other credit risk provisions (adjusted revenue)
|
51,524
|
|
49,290
|
|
5
|
%
|
|
Loan impairment charges and other credit risk provisions
|
(1,769
|
)
|
(2,594
|
)
|
32
|
%
|
|
Total operating expenses
|
(31,140
|
)
|
(30,084
|
)
|
(4
|
)%
|
|
Operating profit
|
18,615
|
|
16,612
|
|
12
|
%
|
|
Share of profit in associates and joint ventures
|
2,375
|
|
2,322
|
|
2
|
%
|
|
Profit before tax
|
20,990
|
|
18,934
|
|
11
|
%
|

Adjusted profit before tax
<
>
On an adjusted basis, profit before tax of
$21.0bn
was
$2.1bn
or
11%
higher. This was driven by higher revenue (up
$2.2bn
), with growth in our three main global businesses, and a significant reduction in LICs (down
$0.8bn
), notably as 2016 included charges relating to exposures to the oil and gas, and mining sectors. These movements were partly offset by higher operating expenses (up
$1.1bn
), in part due to investment in growth initiatives. In 2017, we achieved positive adjusted jaws of
1.0%
.
|
HSBC Holdings plc
|
15
|
|
Adjusted revenue
<
>
Adjusted revenue of
$51.5bn
was
$2.2bn
or
5%
higher, as growth in our three main global businesses was partly offset by reductions in GPB and Corporate Centre.
|
–
|
In RBWM, revenue increased by
$1.7bn
or
9%
, driven by growth in Retail Banking from current accounts, savings and deposits, reflecting balance growth and wider spreads primarily in Hong Kong, and also in the US and Mexico, partly offset by lower personal lending revenue. Revenue also increased in Wealth Management, mainly in insurance manufacturing driven by favourable market impacts compared with adverse market impacts in 2016, notably in Asia. In addition, investment distribution income increased, reflecting increased investor confidence in Hong Kong.
|
|
–
|
In CMB, revenue increased by
$0.6bn
or
5%
, driven by growth in Global Liquidity and Cash Management (‘GLCM’), notably in Asia. This primarily reflected wider spreads and increased average deposit balances. Revenue in Credit and Lending (‘C&L’)
|
increased as we grew lending balances in key markets, while revenue in Global Trade and Receivables Finance (‘GTRF’) fell marginally, due to managed client exits in MENA despite balance sheet growth in Asia and the UK.
|
–
|
In GB&M, revenue increased by
$0.4bn
or
3%
, mainly in GLCM and Securities Services. In Global Markets, revenue was marginally higher as growth in Equities, reflecting increased market share in Prime Financing, was partly offset by lower revenue in Fixed Income, Currencies and Commodities that reflected lower market volatility, as well as a net adverse movement on credit and funding valuations adjustments.
|
These increases were partly offset:
|
–
|
In GPB, revenue was
$45m
or
3%
lower, reflecting the impact of our customer repositioning actions. This was partly offset by increased revenue in the markets that we have targeted for growth, notably Hong Kong, due to higher investment revenue reflecting increased client activity and growth in deposit revenue as we benefited from wider spreads.
|
|
–
|
In Corporate Centre, revenue decreased by
$0.4bn
, with reductions in the US run-off portfolio (down
$0.7bn
), following the disposal of the remaining portfolio during 2017, and in Central Treasury (down
$0.1bn
). These decreases were partly offset in other income (up
$0.4
bn), which included revaluation gains on investment properties.
|
Movement in adjusted revenue compared with 2016
<
>
|
2017
$m
|
|
2016
$m
|
|
Variance
$m
|
|
%
|
|
|
|
Retail Banking and Wealth Management
|
20,287
|
|
18,542
|
|
1,745
|
|
9
|
%
|
|
Commercial Banking
|
13,223
|
|
12,619
|
|
604
|
|
5
|
%
|
|
Global Banking and Markets
|
15,091
|
|
14,715
|
|
376
|
|
3
|
%
|
|
Global Private Banking
|
1,703
|
|
1,748
|
|
(45
|
)
|
(3
|
)%
|
|
Corporate Centre
|
1,220
|
|
1,666
|
|
(446
|
)
|
(27
|
)%
|
|
Total
|
51,524
|
|
49,290
|
|
2,234
|
|
5
|
%
|
Adjusted LICs
<
>
Adjusted LICs of
$1.8bn
were
$0.8bn
lower, reflecting reductions in:
|
–
|
CMB (
$0.5bn
lower), notably in the UK and North America, primarily as 2016 included charges against exposures in the oil and gas sector. In addition, there were reductions in France, Spain and Singapore as we incurred individually assessed LICs against a small number of corporate exposures in 2016.
|
|
–
|
RBWM (
$0.2bn
lower), primarily in Turkey and the US, reflecting improved credit quality, partly offset by increases in Mexico, notably from growth in unsecured lending which resulted in an associated increase in delinquency rates.
|
|
–
|
LICs in GB&M of
$0.5bn
were broadly unchanged from the prior year. LICs in the current year related to two large corporate exposures in Europe. This compared with a small number of individually assessed LICs, notably on exposures in the oil and gas, and mining sectors in the US in 2016.
|
Adjusted operating expenses
<
>
Adjusted operating expenses of
$31.1bn
were
$1.1bn
or
4%
higher. This reflected investments in business growth programmes ($0.6bn), primarily in RBWM where investments were partly funded by the proceeds from the disposal of our shares in Visa, as well as an increase in performance-related pay (up
$0.4bn
). Compared with 2016, our UK bank levy charge was broadly unchanged, at $916m. The impact of our cost-saving initiatives broadly offset inflation and continued investment in our regulatory programmes and compliance.
Our total investment in regulatory programmes and compliance was $3.0bn, up $0.2bn or 7%. This notably reflected the continued implementation of our Global Standards programme to enhance financial crime risk controls and capabilities.
The number of employees expressed in full-time equivalent staff at 31 December 2017 was 228,687, a decrease of 6,488 from 31 December 2016. This reflected reductions resulting from our transformation programmes and the completion of these programmes, partly offset by increases from our investments in Global Standards and in our business growth programmes.
Adjusted income from associates and joint ventures
<
>
Adjusted income from associates and joint ventures of
$2.4bn
increased by
$0.1bn
.
|
UK bank levy
|
Adjusted operating expenses (excluding bank levy)
|
||

2016:
$30.1bn
2017:
$31.1bn
|
16
|
HSBC Holdings plc
|
Balance sheet strength
Total reported assets were $
2.5tn
, 6% higher than at 31 December 2016 on a reported basis, and 1% higher on a constant currency basis. We have maintained the strength of our balance sheet, as we continued our targeted asset growth, notably in Asia.
Distributable reserves
The distributable reserves of HSBC Holdings at 31 December 2017 were $38bn, compared with $42bn at 31 December 2016. The decrease was driven by distributions to shareholders of $8.3bn, which were higher than profits generated of $5.5bn, as well as fair value losses net of tax due to movements in our own credit risk of $0.8bn.
Capital strength
We manage our capital in an effort to ensure we exceed current regulatory requirements and are well placed to meet those expected in the future. We monitor our position using capital ratios. These measure capital relative to a regulatory assessment of risks taken. We quantify how these risks relate to our businesses using RWAs.
Ñ
Details of these risks are included on page
162
.
Our CET1 ratio at 31 December 2017 was
14.5%
,
up
from 13.6% at 31 December 2016.
Implementation of IFRS 9
IFRS 9 ‘Financial Instruments’ was adopted on 1 January 2018. The adoption of IFRS 9 will reduce the Group’s net assets at 1 January 2018 by $1.0bn. We do not expect this to have a significant impact on our regulatory capital position.
Ñ
Further explanation of the expected impact of the implementation of IFRS 9 is provided in Note 1 on the Financial Statements on page
222
.
Delivery against Group financial targets

Return on equity
Our medium-term target is to achieve a return on equity (‘RoE’) of more than 10%. In 2017, we achieved an RoE of 5.9% compared with 0.8% in 2016. In 2016, significant items, which included a write-off of goodwill in GPB in Europe, costs to achieve and adverse fair value movements arising from changes in credit spread on our own debt designated at fair value, had a significant effect on our reported RoE.
Adjusted jaws
<
>
|
Adjusted revenue up
|
|
||
|
5
|
%
|
Adjusted jaws
|
|
|
1
|
%
|
||
|
Adjusted costs up
|
|
||
|
4
|
%
|
||
Jaws measures the difference between the rates of change for revenue and costs. Positive jaws occurs when the figure for the annual percentage change in revenue is higher than, or less negative than, the corresponding rate for costs.
We calculate adjusted jaws using adjusted revenue and costs. Our target is to maintain positive adjusted jaws.
In 2017, adjusted revenue increased by
5%
and our adjusted operating expenses increased by
4%
. Adjusted jaws was therefore positive
1%
.
Dividends
In the current uncertain environment, we plan to sustain the annual dividend in respect of the year at its current level for the foreseeable future. Growing our dividend will depend on the overall profitability of the Group, delivering further release of less efficiently deployed capital and meeting regulatory capital requirements in a timely manner. Actions to address these points were core elements of our Investor Update in June 2015.
|
HSBC Holdings plc
|
17
|
|
Global businesses
We manage our products and services globally through our global businesses.
The ‘Management view of adjusted revenue’ tables provide a breakdown of revenue by major products, and reflect the basis on which each business is assessed and managed.
Ñ
The comparative period has been restated to reflect changes to reportable segments, as described on page
64
.
Commentary is on an adjusted basis, which is consistent with how we assess the performance of our global businesses.
<
>
Retail Banking and Wealth Management (‘RBWM’)
RBWM serves close to
37 million
customers worldwide through four main businesses: Retail Banking, Wealth Management, Asset Management and Insurance. Our HSBC Premier and Advance propositions are aimed at mass affluent and emerging affluent customers who value international connectivity and benefit from our global reach and scale. For customers with simpler banking needs, RBWM offers a full range of products and services reflecting local requirements.
Key events
|
–
|
Significant investment in digital transformation across our
six
core markets, reshaping the branch network and sales force, and improving customer engagement, including the launch of a payment app in Hong Kong (PayMe) and voice biometrics in the UK.
|
|
–
|
Continued to attract customer deposits (up
5%
), providing the potential to benefit from future interest rate rises; lending balances increased by
7%
.
|
|
–
|
Strong growth in sales of investment products, notably equities (up
45%
) and mutual funds (up
22%
), and growth in insurance annualised new business premiums (up
7%
), primarily in Asia.
|
Financial performance
Adjusted profit before tax of
$6.5bn
was
$1.2bn
or
24%
higher, reflecting strong revenue growth from deposits and Wealth Management, as well as lower LICs, partly offset by higher operating expenses. We achieved positive adjusted jaws of
4.0%
.
Adjusted revenue of
$20.3bn
was
$1.7bn
or
9%
higher, reflecting:
Higher revenue in Retail Banking (up
$0.8bn
or
6%
):
|
–
|
Growth in revenue from current accounts, savings and deposits (up
$1.1bn
) due to wider spreads and higher balances primarily in Hong Kong, and also in the US and Mexico.
|
This was partly offset by:
|
–
|
Lower personal lending revenue (down
$0.3bn
), reflecting mortgage spread compression, primarily in Hong Kong, mainland China and the US. This was partly offset by lending growth of
$22.2bn
, notably driven by mortgages in the UK and Hong Kong, where we grew our market share.
|
Higher revenue in Wealth Management (up
$0.9bn
or
18%
):
|
–
|
Growth in life insurance manufacturing revenue (up
$0.5bn
) including favourable movements in market impacts of
$0.3bn
in 2017 compared with adverse movements of
$0.4bn
in 2016, due to interest rate and equity market movements, notably in Asia and France, and to a lesser extent higher insurance sales in Asia.
|
|
–
|
Higher investment distribution revenue (up
$0.4bn
), primarily from higher sales of mutual funds and retail securities in Hong Kong, reflecting increased investor confidence.
|
Adjusted LICs of
$1.0bn
were
$0.2bn
or
14%
lower, reflecting reductions in Turkey of
$85m
and in the US of
$44m
, as credit quality improved. This was partly offset in Mexico where higher LICs (
$24m
) reflected targeted growth in unsecured lending and associated higher delinquency rates. In the UK LICs of
$132m
were marginally higher, but remained at very low levels (
10
bps of the portfolio) as higher LICs relating to mortgages and unsecured lending were partly offset by a release from the sale of a loan portfolio.
Adjusted operating expenses of
$12.8bn
were
$0.7bn
or
5%
higher, mainly due to investment in growth initiatives, notably in retail business banking, in our international proposition as we introduced new products and services, and in mainland China. Transformational and other cost savings partly offset inflation and higher performance-related pay.
|
2017 vs 2016
|
|||||||||||
|
Management view of adjusted revenue
<
>
|
Footnotes
|
2017
$m
|
|
2016
$m
|
|
2015
$m
|
|
$m
|
|
%
|
|
|
Net operating income
|
3
|
||||||||||
|
Retail Banking
|
13,495
|
|
12,695
|
|
12,508
|
|
800
|
|
6
|
%
|
|
|
– c
urrent accounts, savings and deposits
|
6,344
|
|
5,213
|
|
4,814
|
|
1,131
|
|
22
|
%
|
|
|
–
personal lending
|
7,151
|
|
7,482
|
|
7,694
|
|
(331
|
)
|
(4
|
)%
|
|
|
mortgages
|
2,337
|
|
2,546
|
|
2,648
|
|
(209
|
)
|
(8
|
)%
|
|
|
credit cards
|
2,899
|
|
3,034
|
|
3,218
|
|
(135
|
)
|
(4
|
)%
|
|
|
other personal lending
|
4
|
1,915
|
|
1,902
|
|
1,828
|
|
13
|
|
1
|
%
|
|
Wealth Management
|
6,224
|
|
5,292
|
|
5,748
|
|
932
|
|
18
|
%
|
|
|
– investment distribution
|
5
|
3,276
|
|
2,904
|
|
3,230
|
|
372
|
|
13
|
%
|
|
– life insurance manufacturing
|
1,893
|
|
1,401
|
|
1,544
|
|
492
|
|
35
|
%
|
|
|
– asset management
|
1,055
|
|
987
|
|
974
|
|
68
|
|
7
|
%
|
|
|
Other
|
6
|
568
|
|
555
|
|
582
|
|
13
|
|
2
|
%
|
|
Year ended 31 Dec
|
20,287
|
|
18,542
|
|
18,838
|
|
1,745
|
|
9
|
%
|
|
|
Adjusted RoRWA (%)
|
7
|
5.5
|
|
4.6
|
|
4.8
|
|
||||
Ñ
For footnotes, see page
85
.

Change in adjusted profit before tax
+24%
|
18
|
HSBC Holdings plc
|
Commercial Banking (‘CMB’)
CMB serves approximately
1.7 million
customers in
53
countries and territories. Our customers range from small enterprises focused primarily on their domestic markets to corporates operating globally. We support customers with tailored financial products and services to allow them to operate efficiently and grow.
Services provided include working capital, term loans, payment services and international trade facilitation, as well as expertise in mergers and acquisitions, and access to financial markets.
Key events
|
–
|
Corporate customer value from our international subsidiary banking proposition grew
19%
*
compared with 2016, continuing to demonstrate the value of our global network.
|
|
–
|
In GLCM we launched a number of mobile solutions, including the government sponsored Unified Payments Interface in India, and Omni-Channel mobile collections in China. We also rolled out Voice and Touch ID in
37
markets and launched the next generation of HSBCnet.
|
|
–
|
HSBC was named the world’s Best Trade Finance Bank and Most Innovative Bank by
Global Trade Review
magazine. We also announced a strategic partnership with Tradeshift, the world’s largest business commerce platform, which will enable companies of all sizes to manage their global supply chains and working capital requirements from one simple online platform, from any device.
|
Financial performance
Adjusted profit before tax of
$6.8bn
was
$0.9bn
or
15%
higher, reflecting higher revenue and lower LICs. This was partly offset by an increase in operating expenses. We achieved positive adjusted jaws of
1.3%
.
Adjusted revenue of
$13.2bn
was
$0.6bn
or
5%
higher, as strong growth in GLCM and increased revenue in C&L were partly offset by a reduction in GTRF revenue.
|
–
|
In GLCM, revenue increased by
$536m
or
13%
, notably in Hong Kong and mainland China, reflecting wider spreads. Average balances grew 5%, reflecting customer deposit retention and new customer acquisitions. In the UK, average balance sheet growth of
10%
was more than offset by narrower spreads due to the impact of the base rate reduction in 2016.
|
|
–
|
In C&L, revenue increased by
$52m
or
1%
. In the UK, revenue increased as lending growth more than offset narrower spreads. By contrast, revenue in Asia was lower, as balance growth in Hong Kong was more than offset by the effects of spread compression in Hong Kong and mainland China, in part reflecting competitive pressures. Revenue in the US was lower, as we reposition the portfolio towards higher returns.
|
|
–
|
In GTRF, revenue was
$21m
or
1%
lower, representing a stabilisation in performance following a challenging 2016. Notably, revenue increased in both Asia and the UK, reflecting balance sheet growth. However, this was more than offset by a reduction in revenue in the Middle East and North Africa (‘MENA’), reflecting the effect of managed customer exits in the UAE.
|
Adjusted LICs of
$0.5bn
were
$0.5bn
or
49%
lower, notably in North America and the UK, primarily related to exposures in the oil and gas sector, and were also lower in France and Spain. In Asia, lower LICs in Singapore and mainland China were largely offset by higher LICs in Hong Kong, across various sectors.
Adjusted operating expenses were
$0.2bn
or
3%
higher. This reflected our continued investment in Global Standards and digital capabilities, as well as inflation. This was partly offset by a reduction from our cost-saving initiatives.
Adjusted RWAs increased by
5%
to
$301bn
reflecting growth in lending, mainly in Asia and Europe, in part funded through management initiatives which reduced RWAs by
$14
bn.
|
2017 vs 2016
|
|||||||||||
|
Management view of adjusted revenue
<
>
|
Footnotes
|
2017
$m
|
|
2016
$m
|
|
2015
$m
|
|
$m
|
|
%
|
|
|
Net operating income
|
3
|
||||||||||
|
Global Trade and Receivables Finance
|
1,817
|
|
1,838
|
|
2,039
|
|
(21
|
)
|
(1
|
)%
|
|
|
Credit and Lending
|
5,061
|
|
5,009
|
|
4,934
|
|
52
|
|
1
|
%
|
|
|
Global Liquidity and Cash Management
|
4,783
|
|
4,247
|
|
4,077
|
|
536
|
|
13
|
%
|
|
|
Markets products, Insurance and Investments and Other
|
8
|
1,562
|
|
1,525
|
|
1,457
|
|
37
|
|
2
|
%
|
|
Year ended 31 Dec
|
13,223
|
|
12,619
|
|
12,507
|
|
604
|
|
5
|
%
|
|
|
Adjusted RoRWA (%)
|
7
|
2.3
|
|
2.1
|
|
1.9
|
|
||||
Ñ
For footnotes, see page
85
.

Change in adjusted profit before tax
+15%
|
*
|
Analysis relates to corporate client income which includes total income from GB&M synergy products, including Foreign Exchange and Debt Capital Markets. This measure differs from reported revenue in that it excludes Business Banking and Other and internal cost of funds.
|
|
HSBC Holdings plc
|
19
|
|
Global Banking and Markets (‘GB&M’)
GB&M serves approximately
4,100
clients in more than
50
countries and territories. It supports major government, corporate and institutional clients worldwide. Our product specialists continue to deliver a comprehensive range of transaction banking, financing, advisory, capital markets and risk management services.
Key events
|
–
|
The first foreign bank with a majority-owned securities joint venture in China, Qianhai Securities Limited, which will allow us to provide GB&M and CMB clients with a broad spectrum of investment banking and markets services in China.
|
|
–
|
Issued the world’s first corporate sustainable development bond.
|
Financial performance
Adjusted profit before tax of
$5.8bn
was
$0.3bn
or
5%
higher, reflecting a strong revenue performance, partly offset by higher operating expenses, while achieving positive adjusted jaws of
1.3%
.
Adjusted revenue of
$15.1bn
was
$0.4bn
or
3%
higher, with growth in all of our businesses. The increase included a net adverse movement of
$0.2bn
on credit and funding valuation adjustments. Excluding these movements, adjusted revenue increased by
$0.6bn
or
4%
. The increase in revenue primarily reflected the following:
|
–
|
Revenue growth in all of our transaction banking products, notably GLCM (up
$0.3bn
) and Securities Services (up
$0.2bn
). These increases reflected continued momentum as we won and retained client mandates, and benefited from higher interest rates, particularly in Asia and the US.
|
|
–
|
Global Markets revenue was resilient (up
$33m
), despite lower volatility in 2017, compared with more robust trading conditions in 2016. In Equities revenue increased by
$0.3bn
, as we continued to capture market share from Prime Financing products. This was largely offset by Fixed Income, Currencies and Commodities, where revenue decreased by
$0.2bn
, reflecting subdued trading conditions.
|
|
–
|
Global Banking revenue was marginally higher than 2016 (up
$16m
), reflecting growth in lending balances and continued momentum in investment banking products, which broadly offset the effects of tightening spreads on lending in Asia.
|
Adjusted LICs of
$0.5bn
were broadly unchanged from the prior year. LICs in 2017 related to two large corporate exposures in Europe, compared with 2016, which included a small number of individually assessed LICs, notably on exposures in the oil and gas, and mining sectors in the US.
Adjusted operating expenses increased by
$0.1bn
or
1%
, reflecting higher performance-related pay, pension and severance costs. Our continued cost management and efficiency improvements, and saves from technology investments, broadly offset the effects of inflation.
We have exceeded the RWA reduction target set in our Investor Update in June 2015, with a cumulative reduction in RWAs from management initiatives of
$128
bn. This includes a further RWA reduction of
$32
bn in 2017. Our adjusted RoRWA improved to
1.9%
from
1.7%
in 2016.
|
2017 vs 2016
|
|||||||||||
|
Management view of adjusted revenue
<
>
|
Footnotes
|
2017
$m
|
|
2016
$m
|
|
2015
$m
|
|
$m
|
|
%
|
|
|
Net operating income
|
3
|
||||||||||
|
Global Markets
|
6,689
|
|
6,656
|
|
6,010
|
|
33
|
|
—
|
%
|
|
|
Foreign Exchange
|
2,568
|
|
2,764
|
|
2,658
|
|
(196
|
)
|
(7
|
)%
|
|
|
Rates
|
1,970
|
|
2,120
|
|
1,404
|
|
(150
|
)
|
(7
|
)%
|
|
|
Credit
|
900
|
|
781
|
|
606
|
|
119
|
|
15
|
%
|
|
|
– FICC
|
5,438
|
|
5,665
|
|
4,668
|
|
(227
|
)
|
(4
|
)%
|
|
|
– Equities
|
1,251
|
|
991
|
|
1,342
|
|
260
|
|
26
|
%
|
|
|
Global Banking
|
3,807
|
|
3,791
|
|
3,757
|
|
16
|
|
—
|
%
|
|
|
Global Liquidity and Cash Management
|
2,197
|
|
1,885
|
|
1,744
|
|
312
|
|
17
|
%
|
|
|
Securities Services
|
1,746
|
|
1,561
|
|
1,600
|
|
185
|
|
12
|
%
|
|
|
Global Trade and Receivables Finance
|
700
|
|
689
|
|
682
|
|
11
|
|
2
|
%
|
|
|
Principal Investments
|
318
|
|
226
|
|
226
|
|
92
|
|
41
|
%
|
|
|
Credit and funding valuation adjustments
|
9
|
(262
|
)
|
(51
|
)
|
186
|
|
(211
|
)
|
(414
|
)%
|
|
Other
|
10
|
(104
|
)
|
(42
|
)
|
73
|
|
(62
|
)
|
(148
|
)%
|
|
Year ended 31 Dec
|
15,091
|
|
14,715
|
|
14,278
|
|
376
|
|
3
|
%
|
|
|
Adjusted RoRWA (%)
|
7
|
1.9
|
|
1.7
|
|
1.5
|
|
||||
Ñ
For footnotes, see page
85
.

Change in adjusted profit before tax
+5%
|
20
|
HSBC Holdings plc
|
Global Private Banking (‘GPB’)
GPB serves high net worth individuals and families, including those with international banking needs.
We provide a full range of private banking services, including Investment Management, which includes advisory and brokerage services, and Private Wealth Solutions, which comprises trusts and estate planning, to protect and preserve wealth for future generations.
Key events
|
–
|
Net new money inflows of
$15bn
in key markets targeted for growth, especially in Hong Kong.
|
|
–
|
Significant progress made with repositioning, with outflows of over
$15b
n in 2017.
|
|
–
|
Positive momentum with significant growth in discretionary and advisory mandates in 2017.
|
Financial performance
Adjusted profit before tax of
$296m
was
$24m
or
9%
higher as a reduction in operating expenses was partly offset by lower revenue. We achieved positive adjusted jaws of
3.2%
.
Adjusted revenue of
$1.7bn
was
$45m
or
3%
lower, reflecting the continued impact of client repositioning. Revenue from the markets that we have targeted for growth increased by
10%
. This was mainly in Hong Kong, due to growth in investment revenue reflecting increased client activity, and higher deposit income from wider spreads.
Adjusted LICs of
$16m
in 2017 primarily related to a single client in the UK.
Adjusted operating expenses of
$1.4bn
were
$85m
or
6%
lower, mainly as a result of a managed reduction in FTEs and the impact of our cost-saving initiatives.
|
2017 vs 2016
|
|||||||||||
|
Management view of adjusted revenue
<
>
|
Footnotes
|
2017
$m
|
|
2016
$m
|
|
2015
$m
|
|
$m
|
|
%
|
|
|
Net operating income
|
3
|
||||||||||
|
Investment revenue
|
693
|
|
733
|
|
902
|
|
(40
|
)
|
(5
|
)%
|
|
|
Lending
|
387
|
|
411
|
|
411
|
|
(24
|
)
|
(6
|
)%
|
|
|
Deposit
|
401
|
|
342
|
|
354
|
|
59
|
|
17
|
%
|
|
|
Other
|
222
|
|
262
|
|
299
|
|
(40
|
)
|
(15
|
)%
|
|
|
Year ended 31 Dec
|
1,703
|
|
1,748
|
|
1,966
|
|
(45
|
)
|
(3
|
)%
|
|
|
Adjusted RoRWA (%)
|
7
|
1.8
|
|
1.6
|
|
2.1
|
|
||||
Ñ
For footnotes, see page
85
.

Change in adjusted profit before tax
+9%
Corporate Centre
Corporate Centre comprises Central Treasury, including Balance Sheet Management (‘BSM’), our legacy businesses, interests in our associates and joint ventures, central stewardship costs and the UK bank levy.
Financial performance
Adjusted profit before tax of
$1.7bn
was
$0.4bn
or
17%
lower, reflecting lower revenue and higher operating expenses, partly offset by a fall in LICs.
Adjusted revenue fell by
$0.4bn
or
27%
, mainly due to a decrease of
$0.7bn
related to the US run-off portfolio with respect to the disposal of the remaining loan portfolio during 2017. In Central Treasury revenue also decreased (down
$0.1bn
), due to:
|
–
|
higher interest on our debt (up
$0.3
bn), mainly from higher costs of debt issued to meet regulatory requirements; and
|
|
–
|
a reduction in revenue in BSM (down
$0.3
bn) reflecting lower yield rates and increased utilisation of the Group’s surplus liquidity by the global businesses; partly offset by:
|
|
–
|
favourable fair value movements relating to the economic hedging of interest and exchange rate risk on our long-term debt with long-term derivatives of
$0.1
bn, compared with adverse movements of
$0.3
bn in 2016.
|
Other income increased by
$0.4
bn, which included revaluation gains on investment properties.
Net loan impairment releases of
$182m
compared with adjusted LICs of
$22m
in 2016. This reflected lower LICs in the US run-off portfolio, and higher net releases related to our legacy credit portfolio.
Adjusted operating expenses of
$2.1bn
were
$0.2bn
or
8%
higher due to investment in regulatory programmes and compliance, partly offset by lower US run-off portfolio costs.
Adjusted income from associates rose by
$55m
or
2%
.
|
2017 vs 2016
|
|||||||||||
|
Management view of adjusted revenue
<
>
|
Footnotes
|
2017
$m
|
|
2016
$m
|
|
2015
$m
|
|
$m
|
|
%
|
|
|
Net operating income
|
3
|
||||||||||
|
Central Treasury
|
11
|
1,340
|
|
1,454
|
|
1,760
|
|
(114
|
)
|
(8
|
)%
|
|
Legacy portfolios
|
8
|
|
724
|
|
1,233
|
|
(716
|
)
|
(99
|
)%
|
|
|
– US run-off portfolio
|
40
|
|
692
|
|
1,165
|
|
(652
|
)
|
(94
|
)%
|
|
|
– Legacy credit
|
(32
|
)
|
32
|
|
68
|
|
(64
|
)
|
(200
|
)%
|
|
|
Other
|
12
|
(128
|
)
|
(512
|
)
|
(160
|
)
|
384
|
|
(75
|
)%
|
|
Year ended 31 Dec
|
1,220
|
|
1,666
|
|
2,833
|
|
(446
|
)
|
(27
|
)%
|
|
Ñ
For footnotes, see page
85
.
|
HSBC Holdings plc
|
21
|
|
How we do business
Supporting sustainable growth
We conduct our business intent on supporting the sustained success of our customers, people and communities.
Customers
We aim to be the world’s leading international bank and strive for excellence.
Our customers are at the heart of everything we do and we are working to make life simpler, faster and better for them.
Understanding our customers
In this section we focus on our global business with the largest amount of customers. We also measure and report on customer data for Retail Banking and Wealth Management (‘RBWM’) and Commercial Banking in another eight markets within our Environmental, Social and Governance (‘ESG’) Update.
Taking responsibility for the service we provide
Operating with high standards of conduct is central to our long-term success and ability to serve customers, and we have clear policies, frameworks and governance in place to support our delivery of that commitment. These cover the way we behave, design products and services, train and incentivise employees, and interact with customers and each other. Our Conduct Framework guides activities to strengthen our business and increases our understanding of how the decisions we make affect customers and other stakeholders. Details on our Conduct Framework are available at www.hsbc.com and for further information on conduct, see pages
84
and
117
.
Senior leaders have ultimate responsibility for customer service standards and monitor these through key metrics aligned to performance objectives. These include:
|
–
|
How customers feel about recommending us; and
|
|
–
|
The speed and quality of complaint handling.
|
The targets for each of these metrics are carefully set and managed to instil the right behaviours among our employees.
Ñ
For more information about what we have done, see our ESG reporting available on www.hsbc.com/our-approach/measuring-our-impact.
|
Our largest global business
|
|
|
RBWM
|
Supports approximately 37 million customers worldwide
|
|
Our largest markets
|
|
|
United Kingdom
|
More than $401bn in customer accounts
|
|
Hong Kong
|
More than $477bn in customer accounts
|
Customer recommendation*
RBWM

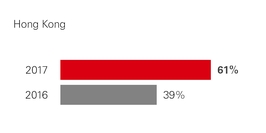
*Percentage of customers providing an 8 or above score out of 10. In Hong Kong the survey methodology changed in 2017, with surveys migrated from telephone to online. This may affect the comparison with prior year figures.
Complaints resolution
Time taken to resolve complaints (excluding PPI complaints)
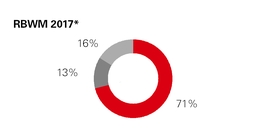

|
Same day or next working day
|
Between 2-5 days
|
Longer than 5 days
|
|||
*2017 figures do not include First Direct UK complaint volumes, which were not available at time of publication. They are not expected to materially impact results.
|
22
|
HSBC Holdings plc
|
What customers are telling us
In 2017, our CMB and RBWM customers told us there were three main issues that we needed to focus on to improve their experience of our products and services:
|
What our customers are telling us
|
Our response
|
|
Accessibility
|
|
|
Customers in all of our channels have provided feedback on length of queues in branches, call waiting and handling time in our contact centres, the length of appointments with our relationship managers, and the complexity of logging on to our online and mobile banking.
|
–
Increased capacity in our contact centres.
–
Introduced new multi-channel appointment booking tools.
–
Added biometrics to make it easier for customers to authenticate themselves using their unique voice and digital fingerprint.
|
|
Complexity
|
|
|
Customers told us our processes and procedures are too complicated which affects the quality and length of time required to service our customers day-to-day.
|
–
Delivered training to 53,500 employees globally to use plain language in communicating with our customers.
–
For our commercial customers we have simplified options on their online platform, HSBCnet.
|
|
Fees and charges
|
|
|
Our industry can be complex, and our customers can find it difficult to understand when and why they will be charged for our services.
|
–
Introduced instantaneous text message notifications in Hong Kong to provide application status and account servicing updates. This has helped many customers to better manage their accounts and to avoid incurring charges.
|
A digital transformation
Our customers are becoming increasingly digitally oriented in their everyday lives. This means their expectations of us are changing.
Customers are now using branches less often. In the future, we will have fewer – but better – branches and our front-line employees will be using a greater range of technology to support all our customers’ needs.
|
HSBC Holdings plc
|
23
|
|
Our employees
Our employees are key to our success. We are focused on creating a diverse and inclusive environment where people can speak up, build their skills and develop their careers. We want our employees to feel that they can contribute to our purpose and fulfil their potential with our support.
Giving employees a voice
Since 2012, we have been hosting HSBC Exchange to give employees a voice. Exchanges are meetings with no agendas, where managers and leaders simply listen and employees do the talking. It’s an innovative approach that provides a forum for people to share their views on any issue and talk about what matters most to them.
Our monthly employee survey – Snapshot – tests the views of a representative sample of colleagues on topics such as our strategy, regulation, culture and customer experience. Results are presented to the Group Management Board and relevant executive committees of the global functions and businesses, regions and countries.
Whilst 77% of employees feel able to speak up when they see behaviour which they think is wrong and 72% believe that HSBC is genuine in its commitment to encourage colleagues to speak up, a smaller proportion of employees – 61% – say that where they work people can state their opinions without fear of negative consequence.
The insight from Snapshot surveys, Exchanges and other employee engagement initiatives, informs policy, process and strategy across the Group and helps leadership make decisions that take employees into account.
Creating a diverse and inclusive environment
We believe that a diverse and inclusive workforce is critical to running a sustainable and successful business. Our approach aims to increase and leverage diversity of thought to drive greater innovation, better manage risks, enhance collaboration and improve workforce agility.
Our commitment
We are committed to enabling a thriving environment where people are valued, respected and supported. We create business value by drawing on the richness of ideas, backgrounds, styles and perspectives of our employees.
Gender balance at senior leadership
We focus on improving gender balance in senior leadership across the Group. Our objective was for the female share of our senior leadership** to be more than 26.3% by the end of 2017, and we achieved 26.8%. This is a 1.4 percentage point increase on our 2016 year-end position and is an improvement to the trend year on year.
Employee networks
Our seven global employee networks play a key role in building community, highlighting opportunities and achieving our diversity and inclusion ambitions. The networks focus on gender, age, ethnicity, LGBT+, faith, working parents and carers, and ability. Additionally we have common interest groups sharing experiences and engaging with others both internally and externally.
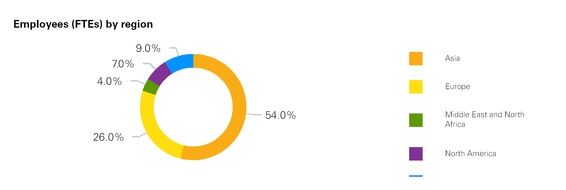
Employee retention
85.7%
(2016: 81.7%)
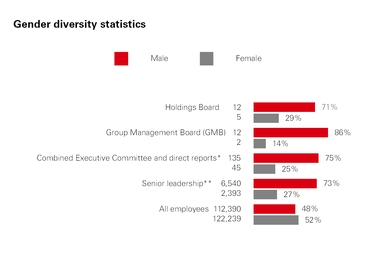
|
Male
|
Female
|
||
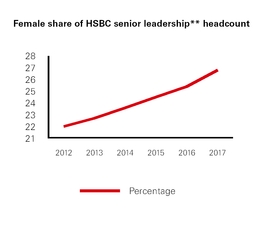
*Combined Executive Committee and direct reports was reported as at 30 June 2017 to the UK’s Hampton Alexander Review and includes the Executive Directors, Group Managing Directors and their direct reports (excluding administrative staff).
**Senior leadership refers to employees performing roles classified as 0, 1, 2 or 3 in our Global Career Band Structure.
Whistleblowing
We work hard to create an environment in which people feel able to speak up, but understand that employees may not always feel comfortable raising concerns through their regular escalation channels. There will also be some circumstances which require more discretion. We operate a global whistleblowing standard, HSBC Confidential, which allows individuals to report matters of concern confidentially. We also maintain an external email address for concerns about accounting and internal financial controls or auditing matters (accountingdisclosures@hsbc.com). The Group has a strict policy prohibiting retaliation against those who raise concerns. All allegations of retaliation reported are escalated to senior management.
|
24
|
HSBC Holdings plc
|
HSBC Confidential is overseen by our Conduct & Values Committee and Group Audit Committee. Investigations are carried out thoroughly and independently, drawing on the expertise of a variety of teams, including Regulatory Compliance, Human Resources, Legal, Financial Crime Risk, Information Security and Internal Audit.
1,585
Cases were raised during 2017 (2016: 1,102 cases). All cases are subject to investigation. In 30% of the closed cases in 2017 (2016: 34%), allegations were substantiated in whole or in part and appropriate remedial action taken.
Common themes:
|
–
|
Allegations of internal fraud by staff.
|
|
–
|
Issues with staff behaviour and personal conduct.
|
|
–
|
Weaknesses in adherence to information security protocols.
|
Other
HSBC’s purpose is to connect people with opportunities. With this purpose comes the responsibility to protect our customers, our communities and the integrity of the financial system.
Non-financial risks
We use a range of tools to monitor and manage our non-financial risks including our risk appetite, risk map, top and emerging risks and stress testing processes. In 2017, HSBC completed a multi-year Operational Risk Transformation Programme, the purpose of which was to make it easier to manage operational risk consistently in HSBC. This included the implementation of a new operational risk management framework (‘ORMF’) and system of record. The new ORMF provides an end-to-end view of non-financial risks, enhancing focus on associated controls and the capital we hold. It provides a platform to drive forward-looking risk awareness and assist management focus. Further details may be found in the Risk section on page
95
and page
117
.
Financial crime compliance
HSBC operates in many countries around the world. As part of financial crime risk management, we have built a strong financial crime compliance system with a global footprint, and have a dedicated Financial Crime Risk team. We have invested heavily in training and communication for all employees. Our risk appetite has been set formally. Further details may be found in the Risk section on page
95
.
Anti-bribery and corruption
As part of financial crime risk management, we have a global anti-bribery and corruption policy. The policy gives practical effect to global initiatives such as the Organisation of Economic Co-operation and Development (‘OECD’) Convention on Combating Bribery of Foreign Public Officials in International Business Transactions and Principle 10 of the United Nations Global Compact. We continue to invest in technology and training; in 2017 98% of our workforce was trained via a mandatory e-learning course ‘My Financial Crime Risk Responsibilities’.
Tax
Total: $6.8bn

We apply the letter and the spirit of the law in all territories where we operate. We have adopted the UK tax authority’s
Code of Practice on Taxation for Banks
. As a consequence, we pay our fair share of tax in the countries in which we operate. We continue to strengthen our processes to help ensure our banking services are not associated with any arrangements known or suspected to facilitate tax evasion. HSBC continues to apply global initiatives to improve tax transparency such as:
|
–
|
The US Foreign Account Tax Compliance Act (‘FATCA’);
|
|
–
|
The OECD Standard for Automatic Exchange of Financial Account Information (also known as the Common Reporting Standard);
|
|
–
|
The Capital Requirements Directive IV (‘CRD IV’) Country by Country Reporting; and
|
|
–
|
The OECD Base Erosion and Profit Shifting (‘BEPS’) initiative.
|
We do not expect BEPS or similar initiatives adopted by national governments to adversely impact HSBC’s results.
Human rights
Our statement on modern slavery can be found on www.hsbc.com/our-approach/measuring-our-impact. Our supplier code of
conduct takes into account legislation on modern slavery and human rights; over 4,000 of our largest suppliers have signed the code.
Supporting sustainable growth
In 2017 we launched our strategy to support sustainable growth, which focuses on three main areas: sustainable finance; sustainable networks and entrepreneurship; and future skills. Full details are available in our ESG Supplement released in November 2017. This year we contributed $136m to charitable programmes and our employees volunteered 272,000 hours to community activities during the working day. We continue our flagship environmental partnership, the HSBC Water Programme.
Ñ
For more information about what we have done, see our ESG reporting available on www.hsbc.com/our-approach/measuring-our-impact.
|
HSBC Holdings plc
|
25
|
|
Sustainable finance
Each and every one of us has a stake in developing a sustainable economic system. It is the combined responsibility of all players in society to respond to climate change, rapid technological evolution and continuing globalisation to secure a prosperous future.
Since its foundation in 1865, HSBC has adapted to and helped serve the needs of a changing world. It has financed economic growth, fostered international trade and overcome events such as economic crises. We recognise that governments, corporations, the financial system and civil society are all stakeholders in mitigating the effects of climate change and meeting sustainability challenges.
Now more than ever, there is a need to develop the skills, business innovation and low-carbon solutions needed to secure long-term prosperity for all. For HSBC, these are the key elements of sustainable growth that HSBC can influence.
Our network covers many of the world’s largest and fastest growing trade corridors and economic zones. As such, we are uniquely positioned to provide the connections needed to foster sustainable growth across borders and geographies.
We have a proud record of supporting the communities and environments in which we operate and our global sustainability strategy builds on this legacy.
HSBC’s sustainable finance commitments
In our November Environmental, Social, Governance (‘ESG’) Update, we published our five sustainable finance commitments. In this section we summarise key aspects of each commitment we aim to fulfil.
Ñ
For our full commitments see our ESG Supplement released in November 2017.
Provide $100bn of sustainable financing and investment by 2025
We provide $100bn of financing and investments, including facilitation, to develop clean energy, lower-carbon technologies, and projects that contribute to the delivery of the Paris Agreement and the UN Sustainable Development Goals.
$10.5bn
Volume of green, social, sustainability bonds facilitated by HSBC in 2017*
HSBC Asset Management launched three low-carbon funds in 2017.
*Source: Dealogic HSBC portion of notional value.
Source 100% of our electricity from renewable sources by 2030, with an interim target of 90% by 2025
We
s
ource 100% renewable electricity via direct investment or purchases via power purchase agreements that directly help the financing of new renewable electricity assets.
27%
of signed renewable power purchase agreements (2016: 23%).
Reduce our exposure to thermal coal and actively manage the transition path for other high-carbon sectors
To reduce our exposure, we expect to discontinue the financing of:
|
–
|
new thermal coal mines or new customers dependent on thermal coal mining; and
|
|
–
|
new coal-fired power plants in developed countries.
|
In addition we expect to:
|
–
|
routinely reinforce lending criteria in developing countries, taking into account the state of climate transition and access to alternative sources of energy in individual countries; and
|
|
–
|
actively engage with clients in high-carbon sectors to support and influence their transition strategies, review their approach to reduce greenhouse gas emissions and assess their exposure to potentially stranded assets.
|
Adopt the recommendations of the Task Force on Climate-related Financial Disclosures (‘TCFD’) to improve transparency
The Financial Stability Board (‘FSB’) established the Task Force on Climate-related Financial Disclosures in 2015 to develop recommendations for more effective and efficient climate-related disclosures. This year, HSBC is reporting qualitatively on the
governance, strategy and risk management components of the recommendations published in 2017. See our first TCFD disclosure on page
27
.
Lead and shape the debate around sustainable finance and investment
We aim to do this in two ways:
|
–
|
Establish a Centre of Sustainable Finance to provide thought leadership about climate change and the role of the financial services sector.
|
|
–
|
Drive the sustainable finance agenda by promoting the development of sector activities (such as industry-wide definitions, standards, tools and metrics) to improve market analysis of sustainability issues and impacts.
|
20
Number of Sustainability-focused industry forums of which HSBC is a member.
Ñ
For more information about what we have done, see our ESG reporting available on www.hsbc.com/our-approach/measuring-our-impact.
|
26
|
HSBC Holdings plc
|
Task Force on Climate-related Financial Disclosures (‘TCFD’)
Initial response to the Financial Stability Board
Reducing global carbon dioxide emissions is a critical challenge for everyone. We recognise its importance and seek to be a leader in managing climate change risk while developing opportunities with – and for – our customers. We welcome the new disclosure recommendations from the FSB taskforce, which assist the understanding of climate-related risks, and we were a signatory to the June 2017 TCFD report. This represents our first disclosure under the framework. We recognise this will evolve and expand over time.
Governance
Sustainability is a key concern of the HSBC Group Management Board, with five presentations taking place during 2017.
HSBC’s 2016 Statement on Climate Change may be found on our website at www.hsbc.com/our-approach/measuring-our-impact. The site gives information on our approach to low/high carbon transition, managing our direct impact and partnerships.
Our Climate Business Council (‘CBC’), established in 2010, is an internal strategic committee whose role is to coordinate across the bank, identifying and developing products and services to meet customers’ sustainable finance needs. There is also a group-wide ESG steering group, chaired by the Group Finance Director, leading our approach to ESG issues, including external disclosure and materiality considerations.
Strategy
HSBC’s strategy is to connect customers to opportunities across a diversified range of products and services. This, along with our geographical presence in developing markets, gives us a unique opportunity to engage with our customers and support their transition strategies. HSBC has committed to directing $100bn of financing and investment to the low-carbon economy by 2025.
In order to facilitate the transition to the low-carbon economy for us and our clients, during 2017 we created a ‘Global Head of Sustainable Finance’ and an ‘HSBC Centre of Sustainable Finance’. Additionally, via training, we have expanded our in-house sustainability expertise to approximately 1,300 employees across the Group. We are committed to strengthening our role as a thought leader in the financial services industry.
During 2017, HSBC’s Global Research Climate Change Centre was ranked number one by Extel and HSBC was the second-ranked bookrunner by Dealogic for green, social and sustainability bonds. We will work with our customers in all our businesses to develop sustainable products and support innovation.
Risk Management
Climate risk, both physical and transition, is an increasing risk. During 2017 the Executive Risk Management Committee approved a framework for measuring transition risks across our loan portfolio. We have identified the higher transition risk sectors as oil and gas, metals and mining, power and utilities, automobiles, building and construction, and chemicals. We actively engage with clients in these sectors to support their transition strategies. We monitor and report our exposure internally, and will do so externally in 2018. Over time we expect a reduction in the carbon intensity of our portfolio.
Our Sustainability risk policies cover all our lending to sensitive sectors and we apply the Equator Principles to project finance. Details are available at www.hsbc.com/our-approach/measuring-our-impact. We also manage the physical risks to our global network relating to climate change by undertaking regular operational stress testing and contingency planning.
Next steps
The HSBC Centre of Sustainable Finance, Risk Management and Finance will work with external experts to develop climate-related scenario analysis and related disclosures.
|
HSBC Holdings plc
|
27
|
|
Risk overview
We actively manage risk to protect and enable the business.
Managing risk
HSBC has maintained a conservative and consistent approach to risk throughout its history, helping to ensure we protect customers’ funds, lend responsibly and support economies. By carefully aligning our risk appetite to our strategy, we aim to deliver sustainable long-term shareholder returns.
All employees are responsible for the management of risk, with the ultimate accountability residing with the Board. We have a strong risk culture, which is embedded through clear and consistent communication and appropriate training for all employees. A comprehensive risk management framework is applied throughout the Group, with governance and corresponding risk management tools. This framework is underpinned by our risk culture and reinforced by the HSBC Values.
Our Global Risk function oversees the framework and is led by the Group Chief Risk Officer, an executive Director. It is independent from the global businesses, including our sales and trading functions, to provide challenge, appropriate oversight and balance in risk/reward decisions.
HSBC’s risk appetite defines our desired forward-looking risk profile, and informs the strategic and financial planning process.
It is articulated in our risk appetite statement, which is approved by the Board. Key elements include:
|
–
|
risks that we accept as part of doing business, such as credit risk and market risk;
|
|
–
|
risks that we incur as part of doing business, such as operational risk, which are actively managed to remain below an acceptable tolerance; and
|
|
–
|
risks for which we have zero tolerance, such as knowingly engaging in activities where foreseeable reputational risk has not been considered.
|
Internal stress tests are an important element in our risk management and capital management frameworks. They include potential adverse macroeconomic, geopolitical and operational risk events, and other potential events that are specific to HSBC. The selection of scenarios reflects our top and emerging risks identification process and our risk appetite. Stress testing analysis helps management understand the nature and extent of vulnerabilities to which the bank is exposed.
We operate a comprehensive stress testing programme to help ensure the strength and resilience of HSBC, taking part in regulators’ as well as our own stress tests. In 2017, the results for HSBC as published by the Bank of England (‘BoE’) showed that our capital ratios, after taking account of CRD IV restrictions and strategic management actions, exceeded the BoE’s requirements. This outcome reflected our strong capital position, conservative risk appetite and diversified geographical and business mix. It also reflected our ongoing strategic actions, including the sale of operations in Brazil, ongoing RWA reduction initiatives and continued sales from our US CML run-off portfolio.
|
Key risk appetite metrics
|
||||
|
Component
|
Measure
|
Risk appetite
|
2017
|
|
|
Returns
|
Return on average ordinary shareholders’ equity
|
≥10.0%
|
5.9
|
%
|
|
Capital
|
Common equity tier 1 ratio – CRD IV end point basis
|
≥11.5%
|
14.5
|
%
|
|
Loan impairment charges
|
Loan impairment charges as % of advances: RBWM
|
≤0.50%
|
0.37
|
%
|
|
Loan impairment charges as % of advances: wholesale (CMB, GB&M and GPB)
|
≤0.45%
|
0.27
|
%
|
|
Ñ
Our risk management framework and risks associated with our banking and insurance manufacturing operations are described on pages
106
and
118
, respectively.
Top and emerging risks
Our top and emerging risks framework helps enable us to identify current and forward-looking risks so that we may take action to either prevent them materialising or limit their effect.
Top risks are those that may have a material impact on the financial results, reputation or business model of the Group in the year ahead. Emerging risks are those that have large unknown components and may form beyond a one-year horizon. If these risks occurred, they could have a material effect on HSBC.
During 2017, we made three changes to our top and emerging risks to reflect our assessment of their potential effect on HSBC. The thematic issue ‘Regulatory focus on conduct of business and financial crime’ was removed and ‘Financial crime risk environment’ was added to further emphasise the heightened focus on, and robust oversight, monitoring and active risk management of, financial crime risks. In addition, we removed the thematic issue ‘US DPA and Related Agreements and Consent Orders’ following the expiration in December 2017 of the AML DPA relating to past anti-money laundering and sanctions deficiencies.
In addition, three thematic issues were renamed to better reflect the challenges facing the Group. We use the new name in the table opposite, which summarises our top and emerging risks.
Ñ
Our current top and emerging risks are summarised on the next page and discussed in more detail on page
95
.
Ñ
Our approach to identifying and monitoring top and emerging risks is described on page
107
.
|
28
|
HSBC Holdings plc
|
|
Risk
|
Trend
|
Mitigants
|
|
|
Externally driven
|
|||
|
Economic outlook and capital flows
|
^
|
We actively monitor our wholesale credit and trading portfolios, including undertaking stress tests, to identify sectors and clients that may come under stress due to economic conditions in the eurozone, mainland China and in the UK as negotiations to exit from the EU continue.
|
|
|
Geopolitical risk
|
^
|
We continually assess the impact of geopolitical events on our businesses and exposures, and take steps to mitigate them, where required, to help ensure we remain within our risk appetite. We have also strengthened physical security at our premises where the risk of terrorism is heightened.
|
|
|
l
|
The credit cycle
|
>
|
We continue to undertake detailed reviews of our portfolios and are proactively assessing customers and sectors likely to come under stress as a result of geopolitical or macroeconomic events, reducing limits where appropriate.
|
|
Cyber threat and unauthorised access to systems
|
^
|
We continue to strengthen our cyber control framework and implement initiatives to improve our resilience and cybersecurity capabilities, including threat detection and analysis, access control, payment systems controls, data protection and backup and recovery.
|
|
|
l
|
Regulatory, technological and sustainability developments including conduct, with adverse impact on business model and profitability
|
>
|
We proactively engage with regulators wherever possible to help ensure new regulatory requirements are effectively implemented, and work with them in relation to their investigations into historical activities. We also engage with non-governmental organisations to help ensure our policies address environmental concerns.
|
|
Financial crime risk environment
|
>
|
We continue to develop and enhance the Financial Crime Risk function and augment our risk management capabilities to further improve our financial crime detection and compliance capabilities. We will continue to take steps to enhance our defences against financial crime across our operations globally to help ensure our Global Standards are sustainable over the long term.
|
|
|
Internally driven
|
|||
|
IT systems infrastructure and resilience
|
>
|
We continue to monitor and improve service resilience across our technology infrastructure, enhancing our problem diagnosis/resolution and change execution capabilities, reducing service disruption to our customers.
|
|
|
Impact of organisational change and regulatory demands on employees
|
>
|
We continue to focus on resourcing and employee development to meet regulatory changes as well as to maintain and enhance our leadership succession strength.
|
|
|
Execution risk
|
>
|
The Group Change Committee oversees the progress of the highest priority programmes, underpinning the implementation of our strategic actions to help ensure that we achieve a consistent on time, on budget and on quality delivery across these critical initiatives.
|
|
|
l
|
Risks arising from the receipt of services from third parties
|
>
|
We have strengthened essential governance processes and relevant policies relating to how we identify, assess, mitigate and manage risks across the range of third parties with which we do business. This includes control monitoring and assurance throughout the third-party lifecycle.
|
|
Enhanced model risk management expectations
|
>
|
We have strengthened our model risk management framework by establishing an independent second line of defence Model Risk Management sub-function, and we continue to enhance our existing policy and standards in order to address evolving regulatory, external and internal requirements.
|
|
|
Data management
|
^
|
We continue to improve our insights, consistency of data aggregation, reporting and decisions through ongoing enhancement of our data governance, data quality and architecture framework.
|
|
|
^
|
Risk heightened during 2017
|
|
>
|
Risk remained at the same level as 2016
|
|
•
|
Thematic risk renamed during 2017
|
|
HSBC Holdings plc
|
29
|
|
Remuneration
Our remuneration policy supports the achievement of our strategic objectives by balancing reward for short- and long-term sustainable performance.
Remuneration principles
The remuneration strategy for our employees is based on a series of key principles.
What we do
|
–
|
Focus on total compensation with a strong link between pay and performance
|
|
–
|
Judge not only what is achieved, but also how it is achieved, in line with the HSBC Values
|
|
–
|
Operate a thorough performance management and HSBC Values assessment process
|
|
–
|
Recognise and reward our employees for outstanding positive behaviour
|
|
–
|
Design our policy to align compensation with long-term stakeholder interests
|
|
–
|
Apply consequence management to strengthen the alignment between risk and reward
|
What we don’t do
|
–
|
Reward inappropriate or excessive risk taking or short-term performance at the expense of long-term company sustainability
|
|
–
|
Use only a formulaic approach to determine bonuses for our executives
|
|
–
|
Award discretionary bonuses to employees rated unacceptable against the HSBC Values and behaviours
|
|
–
|
Allow our employees to hedge against their unvested or retained awards
|
|
–
|
Offer employment contracts with a notice period of more than 12 months
|
|
–
|
Have pre-arranged individual severance agreements
|
Embedding our values in our remuneration framework
Instilling the right behaviours, and driving and encouraging actions that are aligned to organisational values and expectations, are essential. We therefore have a number of programmes to reinforce our values.
|
Pay
|
Outcomes
|
|
Positive adjustments
|
- Individuals who exhibit exceptional conduct and behaviours which go beyond the normal course of an employee’s responsibilities, and set an outstanding example of our Values-aligned behaviours and conduct expectations, are awarded positive variable pay adjustments during the year.
|
|
Global consequence management policy
|
- This provides a set of guidelines designed to align the handling of employee conduct breaches, and support line managers in delivering greater consistency of outcomes and messages.
- Ensures clear messaging to employees on the impact of any inappropriate conduct as part of reward communications. |
|
Global recognition programme
|
- Introduced from July 2015 as the Group’s global peer-to-peer recognition programme, designed to incentivise compliance by allowing colleagues to recognise and reward positive behaviours.
- Includes communication of positive stories on our intranet (HSBC Now).
|
|
Performance management
|
- Employees set objectives, which connect business, team and individual goals, and are guided by expected behaviours aligned to our core values.
- All employees receive a behaviour rating based on their adherence to HSBC Values to ensure performance is judged not only on what is achieved, but also on how it is achieved.
- Employees and managers are encouraged to hold frequent conversations throughout the year, exploring alternative ways to stay connected outside the regular performance management cycle using a mix of informal and formal check-ins on a range of topics, including performance, development and well-being.
|
|
30
|
HSBC Holdings plc
|
How we set our variable pay pool
When deciding on the variable pay pool, the Remuneration Committee considers a number of factors, which are set out in the following table:
|
Performance and risk appetite statement
|
– Our variable pay pool takes into account our performance in the context of our risk appetite.
|
|
Countercyclical funding methodology
|
– To dampen effects of economic cycles, the variable pay pool’s size has a floor and a ceiling, and we also limit the payout ratio as performance increases to prevent the risk of inappropriate behaviour.
|
|
Distribution of profits
|
– Our funding methodology ensures that the distribution of post-tax profit between capital, shareholders and variable pay is appropriate, and that the majority of post-tax profit is allocated to capital and shareholders.
|
|
Commerciality and affordability
|
– We face challenges arising from being headquartered in the UK, which has more stringent reward practices. We take into account these challenges in determining the size of the variable pay pool to ensure we can continue to attract and retain talent in key markets.
|
Our variable pay pool is
$3,303
m, an increase of
8.8%
compared with 2016.

Variable pay for our executive Directors
Variable pay for our executive Directors is driven by scorecard achievement. Targets in the scorecard are set according to our key performance indicators to ensure linkages between our strategy and remuneration policies and outcome.
Ñ
See the Directors’ Remuneration Report on page
191
for further details.
Remuneration for our executive Directors
Our remuneration policy for executive Directors was approved in our 2016 Annual General Meeting (‘AGM’) and is intended to apply for three performance years until the AGM in 2019. Full details of our remuneration policy can be found online in our Directors’ Remuneration Policy Supplement 2017.
The table below shows the amount our executive Directors earned in 2017.
Ñ
For details of Directors’ pay and performance for 2017, see the Directors’ Remuneration Report on page
186
.
(Audited)
|
(in £000)
|
Base salary
|
|
Fixed pay allowance
|
|
Cash in lieu of pension
|
|
Annual incentive
|
|
LTI
1
|
|
Sub-total
|
|
Taxable benefits
|
|
Non-taxable benefits
|
|
Notional returns
|
|
Total
|
|
|
|
Douglas Flint
2
|
2017
|
1,125
|
|
—
|
|
338
|
|
—
|
|
—
|
|
1,463
|
|
83
|
|
64
|
|
—
|
|
1,610
|
|
|
2016
|
1,500
|
|
—
|
|
450
|
|
—
|
|
—
|
|
1,950
|
|
100
|
|
86
|
|
—
|
|
2,136
|
|
|
|
Stuart Gulliver
3
|
2017
|
1,250
|
|
1,700
|
|
375
|
|
2,127
|
|
—
|
|
5,452
|
|
500
|
|
71
|
|
63
|
|
6,086
|
|
|
2016
|
1,250
|
|
1,700
|
|
375
|
|
1,695
|
|
—
|
|
5,020
|
|
557
|
|
71
|
|
27
|
|
5,675
|
|
|
|
Iain Mackay
|
2017
|
700
|
|
950
|
|
210
|
|
1,334
|
|
—
|
|
3,194
|
|
64
|
|
37
|
|
42
|
|
3,337
|
|
|
2016
|
700
|
|
950
|
|
210
|
|
987
|
|
—
|
|
2,847
|
|
52
|
|
37
|
|
17
|
|
2,953
|
|
|
|
Marc Moses
|
2017
|
700
|
|
950
|
|
210
|
|
1,358
|
|
—
|
|
3,218
|
|
16
|
|
38
|
|
42
|
|
3,314
|
|
|
2016
|
700
|
|
950
|
|
210
|
|
1,005
|
|
—
|
|
2,865
|
|
15
|
|
38
|
|
18
|
|
2,936
|
|
|
|
1.
|
The first LTI award was made in February 2017, with a performance period ending in 2019. Vesting of the first LTI award will be included in the single figure table for the financial year ending on 31 December 2019.
|
|
2.
|
Douglas Flint stepped down from the Board on 30 September 2017 and his remuneration reflects time served as an executive Director. Details on retirement arrangements are provided on page
196
.
|
|
3.
|
To meet regulatory deferral requirements for 2017,
60%
of the annual incentive award of Stuart Gulliver has been deferred in shares and will vest in five equal instalments between the third and seventh anniversary of the grant date.
|
|
HSBC Holdings plc
|
31
|
|
Report of the Directors
| Financial summary
|
Financial summary
|
|
|
Page
|
|
|
Use of non-GAAP financial measures
|
|
|
Critical accounting estimates and judgements
|
|
|
Consolidated income statement
|
|
|
Group performance by income and expense item
|
|
|
Net interest income
|
|
|
Net fee income
|
|
|
Net trading income
|
|
|
Net income/(expense) from financial instruments designated at fair value
|
|
|
Gains less losses from financial investments
|
|
|
Net insurance premium income
|
|
|
Other operating income
|
|
|
Net insurance claims and benefits paid and movement
in liabilities to policyholders
|
|
|
Loan impairment charges and other credit risk provisions
|
|
|
Operating expenses
|
|
|
Share of profit in associates and joint ventures
|
|
|
Tax expense
|
|
|
2016 compared with 2015
|
|
|
Consolidated balance sheet
|
|
|
Movement in 2017
|
|
|
Average balance sheet
|
|
|
Average balance sheet and net interest income
|
|
|
Analysis of changes in net interest income and net interest expense
|
|
|
Short-term borrowings
|
|
|
Contractual obligations
|
60
|
|
Loan maturity and interest sensitivity analysis
|
60
|
|
Deposits
|
61
|
|
Certificates of deposit and other time deposits
|
|
The management commentary included in the Strategic Report, the Report of the Directors: ‘Financial Review’, together with the ‘Employees’ and ‘Corporate sustainability’ sections of ‘Corporate Governance’ and the ‘Directors’ Remuneration Report’ is presented in compliance with the IFRSs Practice Statement ‘Management Commentary’ issued by the IASB.
|
Use of non-GAAP financial measures
|
To measure our performance we also use non-GAAP financial measures, including those derived from our reported results that eliminate factors that distort year-on-year comparisons. The ‘adjusted performance’ measure used throughout this report is described below, and where others are used they are described. All non-GAAP financial measures are reconciled to the closest reported financial measure.
The global business segmental results on pages
64
to
82
are presented on an adjusted basis in accordance with IFRS 8 ‘Operating Segments’ as detailed in ‘Basis of preparation’ on page
64
.
Adjusted performance
Adjusted performance is computed by adjusting reported results for the effects of foreign currency translation differences and significant items, which both distort year-on-year comparisons.
Foreign currency translation differences are described below. ‘Significant items’ refers collectively to the items that management and investors would ordinarily identify and consider separately to understand better the underlying trends in the business.
We consider adjusted performance provides useful information for investors by aligning internal and external reporting, identifying and quantifying items management believes to be significant and providing insight into how management assesses year-on-year performance.
Foreign currency translation differences
Foreign currency translation differences reflect the movements of the US dollar against most major currencies during
2017
. We exclude them to derive constant currency data, allowing us to assess balance sheet and income statement performance on a like-for-like basis and better understand the underlying trends in the business.
|
Foreign currency translation differences
Foreign currency translation differences for 2017 are computed by retranslating into US dollars for non-US dollar branches, subsidiaries, joint ventures and associates:
•
the income statements for 2016 and 2015 at the average rates of exchange for 2017; and
•
the balance sheets at 31 December 2016 and 31 December 2015 at the prevailing rates of exchange on 31 December 2017.
No adjustment has been made to the exchange rates used to translate foreign currency denominated assets and liabilities into the functional currencies of any HSBC branches, subsidiaries, joint ventures or associates. When reference is made to foreign currency translation differences in tables or commentaries, comparative data reported in the functional currencies of HSBC’s operations have been translated at the appropriate exchange rates applied in the current period on the basis described above.
|
Changes to presentation from 1 January 2017
Own credit spread
‘Own credit spread’ includes the fair value movements on our long-term debt attributable to credit spread where the net result of such movements will be zero upon maturity of the debt. This does not include fair value changes due to own credit risk in respect of trading liabilities or derivative liabilities. On 1 January 2017, HSBC adopted the requirements of IFRS 9 ‘Financial Instruments’ relating to the presentation of gains and losses on financial liabilities designated at fair value. As a result, the effects of changes in those liabilities’ credit risk is presented in other comprehensive income. These requirements were adopted in the separate financial statements of HSBC Holdings plc on 1 January 2016. Refer to ‘Compliance with International Financial Reporting Standards’ on page
222
for further detail.
Adjusted performance – foreign currency translation of significant items
The foreign currency translation differences related to significant items are presented as a separate component of significant items. This is considered a more meaningful presentation as it allows better comparison of year-on-year movements in performance.
Significant items
The tables on pages
67
to
69
and pages
78
to
80
detail the effects of significant items on each of our global business segments and geographical regions in
2017
,
2016
and
2015
.
|
Critical accounting estimates and judgements
|
|
•
|
Impairment of loans and advances: For collective impairment allowances, estimation methods include the use of historical information supplemented by significant management judgement about whether current economic and credit conditions are such that actual incurred losses are likely to be greater or less than experienced in the past. For individually assessed loans, judgements are made about the financial condition of individual borrowers, which can involve a wide range of factors relating to their business and the value of any
|
|
32
|
HSBC Holdings plc
|
security. The exercise of judgement requires the use of assumptions that are highly subjective and sensitive, in particular to changes in economic and credit conditions across a large number of geographical areas. See Note
1.2(d)
on page
226
.
|
•
|
Deferred tax assets: The most significant judgements relate to those made in respect of expected future profitability. See Note
1.2(h)
on page
230
.
|
|
•
|
Valuation of financial instruments: In determining the fair value of financial instruments a variety of valuation techniques are used, some of which feature significant unobservable inputs and are subject to substantial uncertainty. See Note
1.2(c)
on page
225
.
|
|
•
|
Impairment of interests in associates: Impairment testing involves significant judgement in determining the value in use, and in particular estimating the present values of cash flows expected to arise from continuing to hold the investment,
|
based on a number of management assumptions. See Note
1.2(a)
on page
224
.
|
•
|
Goodwill impairment: A high degree of uncertainty is involved in estimating the future cash flows of the cash generating units (‘CGUs’) and the rates used to discount these cash flows. See Note
1.2(a)
on page
224
.
|
|
•
|
Provisions: A high degree of judgement may be required due to the high degree of uncertainty associated with determining whether a present obligation exists, and estimating the probability and amount of any outflows that may arise. See Note
1.2(i)
on page
230
.
|
Given the inherent uncertainties and the high level of subjectivity involved in the recognition or measurement of the items above, it is possible that the outcomes in the next financial year could differ from the expectations on which management’s estimates are based, resulting in the recognition and measurement of materially different amounts from those estimated by management in these Financial Statements.
|
Consolidated income statement
|
|
Summary consolidated income statement
|
||||||||||
|
2017
|
|
2016
|
|
2015
|
|
2014
|
|
2013
|
|
|
|
$m
|
|
$m
|
|
$m
|
|
$m
|
|
$m
|
|
|
|
Net interest income
|
28,176
|
|
29,813
|
|
32,531
|
|
34,705
|
|
35,539
|
|
|
Net fee income
|
12,811
|
|
12,777
|
|
14,705
|
|
15,957
|
|
16,434
|
|
|
Net trading income
|
7,719
|
|
9,452
|
|
8,723
|
|
6,760
|
|
8,690
|
|
|
Net income/(expense) from financial instruments designated at fair value
|
3,698
|
|
(2,666
|
)
|
1,532
|
|
2,473
|
|
768
|
|
|
Gains less losses from financial investments
|
1,150
|
|
1,385
|
|
2,068
|
|
1,335
|
|
2,012
|
|
|
Dividend income
|
106
|
|
95
|
|
123
|
|
311
|
|
322
|
|
|
Net insurance premium income
|
9,779
|
|
9,951
|
|
10,355
|
|
11,921
|
|
11,940
|
|
|
Other operating income/(expense)
|
337
|
|
(971
|
)
|
1,055
|
|
1,131
|
|
2,632
|
|
|
Total operating income
|
63,776
|
|
59,836
|
|
71,092
|
|
74,593
|
|
78,337
|
|
|
Net insurance claims and benefits paid and movement in liabilities to policyholders
|
(12,331
|
)
|
(11,870
|
)
|
(11,292
|
)
|
(13,345
|
)
|
(13,692
|
)
|
|
Net operating income before loan impairment charges and other
credit risk provisions |
51,445
|
|
47,966
|
|
59,800
|
|
61,248
|
|
64,645
|
|
|
Loan impairment charges and other credit risk provisions
|
(1,769
|
)
|
(3,400
|
)
|
(3,721
|
)
|
(3,851
|
)
|
(5,849
|
)
|
|
Net operating income
|
49,676
|
|
44,566
|
|
56,079
|
|
57,397
|
|
58,796
|
|
|
Total operating expenses
|
(34,884
|
)
|
(39,808
|
)
|
(39,768
|
)
|
(41,249
|
)
|
(38,556
|
)
|
|
Operating profit
|
14,792
|
|
4,758
|
|
16,311
|
|
16,148
|
|
20,240
|
|
|
Share of profit in associates and joint ventures
|
2,375
|
|
2,354
|
|
2,556
|
|
2,532
|
|
2,325
|
|
|
Profit before tax
|
17,167
|
|
7,112
|
|
18,867
|
|
18,680
|
|
22,565
|
|
|
Tax expense
|
(5,288
|
)
|
(3,666
|
)
|
(3,771
|
)
|
(3,975
|
)
|
(4,765
|
)
|
|
Profit for the year
|
11,879
|
|
3,446
|
|
15,096
|
|
14,705
|
|
17,800
|
|
|
Attributable to:
|
||||||||||
|
– ordinary shareholders of the parent company
|
9,683
|
|
1,299
|
|
12,572
|
|
13,115
|
|
15,631
|
|
|
– preference shareholders of the parent company
|
90
|
|
90
|
|
90
|
|
90
|
|
90
|
|
|
– other equity holders
|
1,025
|
|
1,090
|
|
860
|
|
483
|
|
483
|
|
|
– non-controlling interests
|
1,081
|
|
967
|
|
1,574
|
|
1,017
|
|
1,596
|
|
|
Profit for the year
|
11,879
|
|
3,446
|
|
15,096
|
|
14,705
|
|
17,800
|
|
|
Five-year financial information
|
|||||||||||
|
2017
|
|
2016
|
|
2015
|
|
2014
|
|
2013
|
|
||
|
Footnotes
|
$
|
|
$
|
|
$
|
|
$
|
|
$
|
|
|
|
Basic earnings per share
|
0.48
|
|
0.07
|
|
0.65
|
|
0.69
|
|
0.84
|
|
|
|
Diluted earnings per share
|
0.48
|
|
0.07
|
|
0.64
|
|
0.69
|
|
0.84
|
|
|
|
Dividends per ordinary share
|
13
|
0.51
|
|
0.51
|
|
0.50
|
|
0.49
|
|
0.48
|
|
|
|
%
|
|
%
|
|
%
|
|
%
|
|
%
|
|
|
|
Dividend payout ratio
|
14
|
106.3
|
|
728.6
|
|
76.5
|
|
71.0
|
|
57.1
|
|
|
Post-tax return on average total assets
|
0.5
|
|
0.1
|
|
0.6
|
|
0.5
|
|
0.7
|
|
|
|
Return on average risk-weighted assets
|
15
|
2.0
|
|
0.7
|
|
1.6
|
|
1.5
|
|
2.0
|
|
|
Return on average ordinary shareholders’ equity
|
5.9
|
|
0.8
|
|
7.2
|
|
7.3
|
|
9.2
|
|
|
|
Average foreign exchange translation rates to $:
|
|
|
|
|
|
||||||
|
$1: £
|
0.777
|
|
0.741
|
|
0.654
|
|
0.607
|
|
0.639
|
|
|
|
$1: €
|
0.887
|
|
0.904
|
|
0.902
|
|
0.754
|
|
0.753
|
|
|
For footnotes, see page
85
.
Unless stated otherwise, all tables in the
Annual Report and Accounts 2017
are presented on a reported basis.
For a summary of our financial performance in 2017, see page
14
.
For further financial performance data for each global business and geographical region, see pages
64
to
75
and
76
to
82
, respectively.
|
HSBC Holdings plc
|
33
|
Report of the Directors
| Financial summary
|
Group performance by income and expense item
|
Net interest income
|
2017
|
|
2016
|
2015
|
||||
|
Footnotes
|
$m
|
|
$m
|
|
$m
|
|
|
|
Interest income
|
40,995
|
|
42,414
|
|
47,189
|
|
|
|
Interest expense
|
(12,819
|
)
|
(12,601
|
)
|
(14,658
|
)
|
|
|
Net interest income
|
28,176
|
|
29,813
|
|
32,531
|
|
|
|
Average interest-earning assets
|
1,726,120
|
|
1,723,702
|
|
1,726,949
|
|
|
|
%
|
|
%
|
|
%
|
|
||
|
Gross interest yield
|
16
|
2.37
|
|
2.46
|
|
2.73
|
|
|
Less: cost of funds
|
(0.88
|
)
|
(0.87
|
)
|
(1.00
|
)
|
|
|
Net interest spread
|
17
|
1.49
|
|
1.59
|
|
1.73
|
|
|
Net interest margin
|
18
|
1.63
|
|
1.73
|
|
1.88
|
|
For footnotes, see page
85
.
In July 2016, we completed the sale of operations in Brazil. During 2016, we earned net interest income of $0.9bn in Brazil from
average interest earning assets of $25.8bn. In 2016, our net interest margin excluding Brazil was 1.70%.
|
Summary of interest income by type of asset
|
||||||||||||||||
|
2017
|
2016
|
2015
|
||||||||||||||
|
Average
balance
|
|
Interest
income
|
|
Yield
|
Average
balance
|
|
Interest
income
|
|
Yield
|
Average
balance
|
|
Interest
income
|
|
Yield
|
||
|
Footnotes
|
$m
|
|
$m
|
|
%
|
$m
|
|
$m
|
|
%
|
$m
|
|
$m
|
|
%
|
|
|
Short-term funds and loans and advances to banks
|
236,126
|
|
2,030
|
|
0.86
|
203,799
|
|
1,510
|
|
0.74
|
221,924
|
|
2,277
|
|
1.03
|
|
|
Loans and advances to customers
|
902,214
|
|
28,751
|
|
3.19
|
865,356
|
|
29,272
|
|
3.38
|
909,707
|
|
33,104
|
|
3.64
|
|
|
Reverse repurchase agreements – non-trading
|
173,760
|
|
2,191
|
|
1.26
|
168,207
|
|
1,227
|
|
0.73
|
162,308
|
|
1,301
|
|
0.80
|
|
|
Financial investments
|
389,807
|
|
7,440
|
|
1.91
|
430,775
|
|
7,248
|
|
1.68
|
396,113
|
|
7,508
|
|
1.90
|
|
|
Other interest-earning assets
|
24,213
|
|
583
|
|
2.41
|
55,565
|
|
3,157
|
|
5.68
|
36,897
|
|
2,999
|
|
8.13
|
|
|
Total interest-earning assets
|
1,726,120
|
|
40,995
|
|
2.37
|
1,723,702
|
|
42,414
|
|
2.46
|
1,726,949
|
|
47,189
|
|
2.73
|
|
|
Trading assets and financial assets designated at fair value
|
19, 20
|
186,673
|
|
4,245
|
|
2.27
|
179,780
|
|
3,897
|
|
2.17
|
195,285
|
|
4,626
|
|
2.37
|
|
Impairment allowances
|
(7,841
|
)
|
|
|
|
(9,127
|
)
|
|
|
|
(10,606
|
)
|
|
|
|
|
|
Non-interest-earning assets
|
616,688
|
|
|
|
|
653,115
|
|
|
|
|
682,143
|
|
|
|
|
|
|
Year ended 31 Dec
|
2,521,640
|
|
45,240
|
|
1.79
|
2,547,470
|
|
46,311
|
|
1.82
|
2,593,771
|
|
51,815
|
|
2.00
|
|
For footnotes, see page
85
.
|
Summary of interest expense by type of liability and equity
|
||||||||||||||||
|
2017
|
2016
|
2015
|
||||||||||||||
|
Average
balance
|
|
Interest
expense
|
|
Cost
|
Average
balance
|
|
Interest
expense
|
|
Cost
|
Average
balance
|
|
Interest
expense
|
|
Cost
|
||
|
Footnotes
|
$m
|
|
$m
|
|
%
|
$m
|
|
$m
|
|
%
|
$m
|
|
$m
|
|
%
|
|
|
Deposits by banks
|
21
|
47,337
|
|
451
|
|
0.95
|
49,782
|
|
342
|
|
0.69
|
55,863
|
|
378
|
|
0.68
|
|
Financial liabilities designated at fair value – own debt issued
|
22
|
60,566
|
|
1,261
|
|
2.08
|
62,042
|
|
942
|
|
1.52
|
58,489
|
|
717
|
|
1.23
|
|
Customer accounts
|
23
|
1,094,920
|
|
5,405
|
|
0.49
|
1,074,661
|
|
5,492
|
|
0.51
|
1,075,901
|
|
7,401
|
|
0.69
|
|
Repurchase agreements – non-trading
|
136,561
|
|
1,665
|
|
1.22
|
118,789
|
|
626
|
|
0.53
|
117,947
|
|
355
|
|
0.30
|
|
|
Debt securities in issue
|
108,677
|
|
3,130
|
|
2.88
|
114,343
|
|
2,807
|
|
2.45
|
129,039
|
|
3,521
|
|
2.73
|
|
|
Other interest-bearing liabilities
|
7,009
|
|
907
|
|
12.94
|
22,387
|
|
2,392
|
|
10.68
|
28,396
|
|
2,286
|
|
8.05
|
|
|
Total interest-bearing liabilities
|
1,455,070
|
|
12,819
|
|
0.88
|
1,442,004
|
|
12,601
|
|
0.87
|
1,465,635
|
|
14,658
|
|
1.00
|
|
|
Trading liabilities and financial liabilities designated at fair value (excluding own debt issued)
|
153,776
|
|
2,325
|
|
1.51
|
138,486
|
|
1,986
|
|
1.43
|
151,294
|
|
2,071
|
|
1.37
|
|
|
Non-interest bearing current accounts
|
197,104
|
|
|
|
184,016
|
|
|
|
190,914
|
|
|
|
||||
|
Total equity and other non-interest bearing liabilities
|
715,690
|
|
|
|
782,964
|
|
|
|
785,928
|
|
|
|
||||
|
Year ended 31 Dec
|
2,521,640
|
|
15,144
|
|
0.60
|
2,547,470
|
|
14,587
|
|
0.57
|
2,593,771
|
|
16,729
|
|
0.64
|
|
For footnotes, see page
85
.
|
34
|
HSBC Holdings plc
|
|
Significant items and currency translation
|
||||
|
2017
|
|
2016
|
|
|
|
$m
|
|
$m
|
|
|
|
Significant items
|
(108
|
)
|
1,110
|
|
|
– customer redress programmes
|
(108
|
)
|
2
|
|
|
– trading results from disposed-of operations in Brazil
|
—
|
|
949
|
|
|
– currency translation on significant items
|
|
|
159
|
|
|
Currency translation
|
524
|
|
||
|
Year ended 31 Dec
|
(108
|
)
|
1,634
|
|
Net interest income of $
28.2bn
decreased by $1.6bn or 5% compared with 2016, including the effects of significant items and foreign currency translation totalling $1.7bn. Excluding the effects of significant items and foreign currency translation, our net interest income remained broadly unchanged from 2016.
Net interest margin of
1.63
% was 10 basis points (‘bps’) lower than in 2016, including the effects of the significant items and foreign currency translation, which decreased net interest margin by 7bps in total. Excluding these factors, net interest margin decreased by 3bps, mainly reflecting the run-off of our US CML portfolio, pressures on asset yields, notably in Europe and Asia, and higher cost of Group debt. These were partly offset by higher yields on surplus liquidity due to US dollar and Hong Kong dollar rate rises.
Interest income
Interest income decreased by $1.4bn compared with 2016, including the adverse effects of the significant items and foreign currency translation totalling $3.7bn. Excluding these, interest income increased by $2.3bn mainly driven by higher income on surplus liquidity and reverse repurchase agreements.
Interest income on short-term funds and financial investments increased by $0.7bn compared with 2016, which included adverse effects of the disposal of our operations in Brazil and currency translation of $0.2bn. Excluding these, interest income on short-term funds and financial investments increased by $0.9bn, primarily in Asia and North America, reflecting the central bank rate rises. This was partly offset by a reduction in Europe, notably due to the base rate cut in the UK in 2016.
Interest income on reverse repurchase agreements – non-trading was $1.0bn higher, driven by increased income in all regions, notably in Asia and North America, reflecting higher balances and increased market rates. This movement is in line with an increase in interest expense on repurchase agreements.
Interest income on loans and advances to customers was marginally higher, excluding the adverse effects of the UK customer redress programme, our sale of operations in Brazil and foreign currency translation totalling $0.7bn, reflecting increases in:
|
•
|
Asia, mainly due to growth in term lending and mortgage balances, although term lending yields decreased as a result of competitive pressures; and
|
|
•
|
Latin America, notably in Mexico reflecting higher yields on mortgages and term lending driven by central bank rate rises, and growth in mortgage balances.
|
These increases were partly offset by lower income in:
|
•
|
North America, primarily as a result of the continuing run-off of the higher-yielding CML portfolio in the US; and
|
|
•
|
Europe, as the effects of decreased lending yields more than offset balance growth in mortgages, term lending and overdrafts, resulting from lower central bank rates, negative interest rates in continental Europe, and market competition.
|
Interest expense
Reported interest expense increased by $0.2bn, including the effects of the disposal of our operations in Brazil in 2016 and foreign currency translation totalling $2.0bn. Excluding these impacts, interest expense was $2.2bn higher, primarily due to increases in interest expense on repurchase agreements and Group debt.
Interest expense on repurchase agreements increased by $1.0bn, in line with the increase in interest income on reverse repurchase agreements, notably in North America reflecting increased balances and higher market rates, and in Europe reflecting increased balances.
Interest expense on debt securities in issue and own debt at fair value was $0.6bn higher. The increase reflected a rise in the cost of funds, although average balances fell as an increase in debt issued by HSBC Holdings to meet regulatory requirements was more than offset by redemptions of senior debt across the Group. The increase in the cost of debt reflected both longer maturities and the structural subordination of our new issuances.
Interest expense on customer accounts was $0.1bn higher, excluding the effects of our sale of operations in Brazil and foreign currency translation, reflecting average balance growth in most of our geographical regions. The net increase also reflects changes in interest rates in key markets, including:
|
•
|
rate rises in North America and Mexico; partly offset by,
|
|
•
|
the 2016 reduction in the UK base rate and negative interest rates in continental Europe on current and savings and deposit accounts; and
|
|
•
|
central bank rate reductions in Asia, notably in India and Australia, and a change in portfolio mix.
|
|
HSBC Holdings plc
|
35
|
Report of the Directors
| Financial summary
|
Net fee income
|
||||||
|
2017
|
|
2016
|
|
2015
|
|
|
|
$m
|
|
$m
|
|
$m
|
|
|
|
Account services
|
2,244
|
|
2,417
|
|
2,745
|
|
|
Funds under management
|
2,188
|
|
2,076
|
|
2,570
|
|
|
Cards
|
1,994
|
|
1,970
|
|
2,281
|
|
|
Credit facilities
|
1,718
|
|
1,795
|
|
1,919
|
|
|
Broking income
|
1,191
|
|
1,060
|
|
1,441
|
|
|
Unit trusts
|
1,010
|
|
863
|
|
1,007
|
|
|
Underwriting
|
829
|
|
705
|
|
762
|
|
|
Remittances
|
759
|
|
766
|
|
772
|
|
|
Imports/exports
|
736
|
|
820
|
|
971
|
|
|
Global custody
|
692
|
|
662
|
|
721
|
|
|
Insurance agency commission
|
410
|
|
419
|
|
519
|
|
|
Other
|
2,082
|
|
2,116
|
|
2,308
|
|
|
Fee income
|
15,853
|
|
15,669
|
|
18,016
|
|
|
Less: fee expense
|
(3,042
|
)
|
(2,892
|
)
|
(3,311
|
)
|
|
Year ended 31 Dec
|
12,811
|
|
12,777
|
|
14,705
|
|
|
Significant items and currency translation
|
||||
|
2017
|
|
2016
|
|
|
|
$m
|
|
$m
|
|
|
|
Significant items
|
—
|
|
271
|
|
|
– trading results from disposed-of operations in Brazil
|
—
|
|
233
|
|
|
– currency translation on significant items
|
|
|
38
|
|
|
Currency translation
|
|
|
111
|
|
|
Year ended 31 Dec
|
—
|
|
382
|
|
Net fee income of
$12.8bn
was broadly unchanged compared with 2016 and included the disposal of our operations in Brazil which reduced net fee income by
$0.2bn
, notably fee income from account services and cards. It also included the adverse effects of currency translation of
$0.1bn
.
Excluding the effects of our sale of operations in Brazil and currency translation, net fee income increased by
$0.4bn
, mainly due to higher fee income from broking and unit trusts in RBWM and higher fee income from corporate finance (disclosed within ‘Other’) and underwriting in GB&M.
Fee income from Broking and Unit trusts increased by
$0.3bn
, largely due to a strong performance in Hong Kong as renewed investor confidence resulted in higher sales of mutual funds and retail securities compared to a weaker performance in 2016.
Fee income from corporate finance and underwriting increased by
$0.2bn
, reflecting continued momentum across our investment banking products, primarily in the UK, the US and Hong Kong.
Fee income from funds under management rose by
$0.1bn
, notably in Hong Kong, reflecting higher turnover due to a more favourable equity market environment.
These increases were partly offset by lower fee income from credit facilities, primarily due to lower commercial lending activity in the US in CMB.
In addition, fee expense increased by
$0.2bn
, in part from cards due to increased customer activity in Hong Kong.
|
Net trading income
|
|||||||
|
2017
|
|
2016
|
|
2015
|
|
||
|
Footnote
|
$m
|
|
$m
|
|
$m
|
|
|
|
Trading activities
|
5,990
|
|
8,702
|
|
7,285
|
|
|
|
Net interest income on trading activities
|
1,621
|
|
1,386
|
|
1,775
|
|
|
|
Gain/(loss) on termination of hedges
|
3
|
|
1
|
|
(11
|
)
|
|
|
Other trading income – hedge ineffectiveness
|
|
|
|
|
|
|
|
|
– on cash flow hedges
|
(5
|
)
|
(5
|
)
|
15
|
|
|
|
– on fair value hedges
|
4
|
|
23
|
|
(11
|
)
|
|
|
Fair value movement on non-qualifying hedges
|
24
|
106
|
|
(655
|
)
|
(330
|
)
|
|
Year ended 31 Dec
|
7,719
|
|
9,452
|
|
8,723
|
|
|
For footnotes, see page
85
.
|
Significant items and currency translation
|
|||||
|
2017
|
|
2016
|
|
||
|
Footnote
|
$m
|
|
$m
|
|
|
|
Significant items
|
(245
|
)
|
(475
|
)
|
|
|
– debit valuation adjustment on derivative contracts
|
(373
|
)
|
26
|
|
|
|
– fair value movement on non-qualifying hedges
|
24
|
128
|
|
(687
|
)
|
|
– trading results from disposed-of operations in Brazil
|
—
|
|
179
|
|
|
|
– currency translation on significant items
|
|
|
7
|
|
|
|
Currency translation
|
|
|
219
|
|
|
|
Year ended 31 Dec
|
(245
|
)
|
(256
|
)
|
|
For footnotes, see page
85
.
|
36
|
HSBC Holdings plc
|
Net trading income of
$7.7bn
was
$1.7bn
lower than in 2016. The net favourable effects of
$0.2bn
of significant items was largely offset by the adverse effect of currency translation of
$0.2bn
summarised in the prior table.
The decrease of $1.7bn, excluding the fair value movement on non-qualifying hedges, debit valuation adjustment on derivative contracts, the disposal of our operations in Brazil and currency translation, was primarily driven by:
|
•
|
adverse movements on assets held as economic hedges of foreign currency debt designated at fair value of
$0.3bn
in 2017 compared with favourable movements of
$1.6bn
in 2016. These
|
movements were offset by favourable movements in foreign currency debt designated at fair value in ‘Net income/(expense) from financial instruments designated at fair value’; and
|
•
|
decreases in GB&M (
$0.2bn
), notably in Foreign Exchange and Rates, reflecting subdued trading activity in the fourth quarter, partly offset by Credit and Equities, where we gained market share in Prime Financing. We also recorded adverse movements of
$262m
in credit and funding valuation adjustments compared with adverse movements of
$51m
in the prior year, primarily relating to movements in our own credit spread on structured liabilities.
|
|
Net income/(expense) from financial instruments designated at fair value
|
|||||||
|
|
|
2017
|
|
2016
|
|
2015
|
|
|
|
Footnote
|
$m
|
|
$m
|
|
$m
|
|
|
Net income/(expense) arising from:
|
|
|
|
|
|
|
|
|
Financial assets held to meet liabilities under insurance and investment contracts
|
|
3,211
|
|
1,480
|
|
531
|
|
|
Liabilities to customers under investment contracts
|
|
(375
|
)
|
(218
|
)
|
34
|
|
|
HSBC’s long-term debt issued and related derivatives
|
|
672
|
|
(3,975
|
)
|
863
|
|
|
– change in own credit spread on long-term debt (significant item)
|
25
|
—
|
|
(1,792
|
)
|
1,002
|
|
|
– other changes in fair value
|
|
672
|
|
(2,183
|
)
|
(139
|
)
|
|
Other instruments designated at fair value and related derivatives
|
|
190
|
|
47
|
|
104
|
|
|
Year ended 31 Dec
|
|
3,698
|
|
(2,666
|
)
|
1,532
|
|
For footnotes, see page
85
.
The majority of our financial liabilities designated at fair value are fixed-rate, long-term debt issuances, and are managed in conjunction with interest rate swaps as part of our interest rate management strategy.
These liabilities are discussed further on page
266
.
In accordance with IFRS 9 ‘Financial Instruments’, fair value movements attributable to changes in our own credit spread on our own debt designated at fair value are now reported in other comprehensive income; by contrast, 2016 included adverse movements of $1.8bn in the fair value of our long-term debt reflecting changes in credit spread.
|
Significant items and currency translation
|
|||||
|
2017
|
|
2016
|
|
||
|
Footnote
|
$m
|
|
$m
|
|
|
|
Significant items
|
—
|
|
(1,477
|
)
|
|
|
– own credit spread
|
25
|
—
|
|
(1,792
|
)
|
|
– trading results from disposed-of operations in Brazil
|
—
|
|
304
|
|
|
|
– currency translation on significant items
|
11
|
|
|||
|
Currency translation
|
|
|
(186
|
)
|
|
|
Year ended 31 Dec
|
—
|
|
(1,663
|
)
|
|
For footnotes, see page
85
.
Net income from financial instruments designated at fair value was
$3.7bn
in 2017, compared with a net expense of
$2.7bn
in 2016. This included a net favourable movement in significant items and currency translation of
$1.7bn
, primarily due to the effects of adverse fair value movements attributable to changes in our own credit spread on our own debt designated at fair value of
$1.8bn
in 2016, now reported in other comprehensive income, as mentioned above.
The remaining movement reflected an increase in ‘Other changes in fair value’ on our long-term debt and related derivatives, which included:
|
•
|
favourable movements of
$0.3bn
compared with adverse movements of
$1.6bn
in 2016 on foreign currency debt designated at fair value and issued as part of our overall funding strategy (offset in ‘Net trading income’ by assets held as economic hedges); and
|
|
•
|
favourable movements of
$0.1bn
compared with adverse movements of
$0.3bn
in 2016 relating to the economic hedging of interest and exchange rate risk on our long-term debt, reported in Corporate Centre.
|
In addition, net income from financial assets and liabilities from insurance and investment contracts increased by
$1.6bn
, primarily due to improved equity market performance in Asia and Europe in 2017.
Net income arising from financial assets held to meet liabilities under insurance and investment contracts results in a corresponding movement in liabilities to customers, reflecting the extent to which they participate in the investment performance of the associated asset portfolio. These offsetting movements are recorded in ‘Net income/(expense) arising from liabilities to customers under investment contracts’ and ‘Net insurance claims and benefits paid and movement in liabilities to policyholders’.
|
HSBC Holdings plc
|
37
|
Report of the Directors
| Financial summary
|
Gains less losses from financial investments
|
||||||
|
|
2017
|
|
2016
|
|
2015
|
|
|
|
$m
|
|
$m
|
|
$m
|
|
|
Net gains from disposal
|
1,248
|
|
1,421
|
|
2,179
|
|
|
– debt securities
|
403
|
|
357
|
|
345
|
|
|
– equity securities
|
838
|
|
1,058
|
|
1,829
|
|
|
– other financial investments
|
7
|
|
6
|
|
5
|
|
|
Impairment of available-for-sale equity securities
|
(98
|
)
|
(36
|
)
|
(111
|
)
|
|
Year ended 31 Dec
|
1,150
|
|
1,385
|
|
2,068
|
|
|
Significant items and currency translation
|
||||
|
|
2017
|
|
2016
|
|
|
|
$m
|
|
$m
|
|
|
Significant items
|
434
|
|
648
|
|
|
– gain on disposal of our membership interest in Visa – Europe
|
—
|
|
584
|
|
|
– gain on disposal of our membership interest in Visa – US
|
308
|
|
116
|
|
|
– gain on disposal of our investment in Vietnam Technological and Commercial Joint Stock Bank
|
126
|
|
—
|
|
|
– trading results from disposed-of operations in Brazil
|
—
|
|
1
|
|
|
– currency translation on significant items
|
|
|
(53
|
)
|
|
Currency translation
|
|
|
70
|
|
|
Year ended 31 Dec
|
434
|
|
718
|
|
Gains less losses from financial investments of
$1.2bn
decreased by
$0.2bn
compared with 2016. This was largely due to a decrease in gains on the disposal of equity securities
$0.2bn
, notably the non-recurrence of the gain on disposal of our membership interest in Visa Europe of
$0.6bn
in 2016. This was partly offset by higher gains on disposal resulting from the sale of our shares in Visa Inc. of
$0.3bn
, compared with
$0.1bn
in 2016. We also recorded gains on disposal of our investment in Vietnam Technological and Commercial Joint Stock Bank (‘Techcombank’) of
$0.1bn
in 2017.
In addition, the decrease in gains less losses from financial investments included higher impairments of AFS equity securities in GB&M.
These decreases were partly offset by gains on disposal of debt securities, which included higher gains on disposal of AFS assets in BSM in Corporate Centre, notably in the UK and Hong Kong.
|
Net insurance premium income
|
||||||
|
2017
|
|
2016
|
|
2015
|
|
|
|
$m
|
|
$m
|
|
$m
|
|
|
|
Gross insurance premium income
|
10,802
|
|
10,588
|
|
11,012
|
|
|
Reinsurance premiums
|
(1,023
|
)
|
(637
|
)
|
(657
|
)
|
|
Year ended 31 Dec
|
9,779
|
|
9,951
|
|
10,355
|
|
|
Significant items and currency translation
|
||||
|
2017
|
|
2016
|
|
|
|
$m
|
|
$m
|
|
|
|
Significant items
|
—
|
|
420
|
|
|
– trading results from disposed-of operations in Brazil
|
—
|
|
362
|
|
|
– currency translation on significant items
|
58
|
|
||
|
Currency translation
|
(33
|
)
|
||
|
Year ended 31 Dec
|
—
|
|
387
|
|
Net insurance premium income was
$0.2bn
lower than in 2016, and included reductions due to the disposal of our operations in Brazil (
$0.4bn
) and minimal currency translation movements.
Excluding these, net insurance premium income increased by
$0.2bn
due to the following:
|
•
|
growth in Hong Kong driven by increased gross premium income, partly offset by the effect of a new reinsurance agreement;
|
|
•
|
an increase in France, driven by higher volumes of unit-linked products.
|
This was partly offset by:
|
•
|
lower sales through third-party channels in Singapore.
|
|
38
|
HSBC Holdings plc
|
|
Other operating income
|
||||||
|
2017
|
|
2016
|
|
2015
|
|
|
|
$m
|
|
$m
|
|
$m
|
|
|
|
Rent received
|
171
|
|
157
|
|
171
|
|
|
Gains/(losses) recognised on assets held for sale
|
214
|
|
(1,949
|
)
|
(244
|
)
|
|
Gains on investment properties
|
48
|
|
4
|
|
61
|
|
|
Gain on disposal of property, plant and equipment, intangible assets and non-financial investments
|
46
|
|
35
|
|
53
|
|
|
Change in present value of in-force long-term insurance business
|
24
|
|
902
|
|
799
|
|
|
Other
|
(166
|
)
|
(120
|
)
|
215
|
|
|
Year ended 31 Dec
|
337
|
|
(971
|
)
|
1,055
|
|
|
Change in present value of in-force long-term insurance business
|
||||||
|
2017
|
|
2016
|
|
2015
|
|
|
|
$m
|
|
$m
|
|
$m
|
|
|
|
Value of new business
|
919
|
|
900
|
|
809
|
|
|
Expected return
|
(599
|
)
|
(532
|
)
|
(552
|
)
|
|
Assumption changes and experience variances
|
(280
|
)
|
513
|
|
504
|
|
|
Other adjustments
|
(16
|
)
|
21
|
|
38
|
|
|
Year ended 31 Dec
|
24
|
|
902
|
|
799
|
|
|
Significant items and currency translation
|
||||
|
2017
|
|
2016
|
|
|
|
$m
|
|
$m
|
|
|
|
Significant items
|
(160
|
)
|
(1,928
|
)
|
|
– portfolio disposals
|
(158
|
)
|
(163
|
)
|
|
– gain/(loss) and trading results from disposed-of operations in Brazil
|
19
|
|
(1,763
|
)
|
|
– investment in new businesses
|
(99
|
)
|
—
|
|
|
– other acquisitions, disposals and dilutions
|
78
|
|
—
|
|
|
– currency translation on significant items
|
|
|
(2
|
)
|
|
Currency translation
|
|
|
(14
|
)
|
|
Year ended 31 Dec
|
(160
|
)
|
(1,942
|
)
|
Other operating income was
$0.3bn
in 2017, compared with a net expense of
$1.0bn
in 2016. This was primarily due to net losses recognised on assets held for sale in 2016, most notably a loss of
$1.8bn
from the disposal of our operations in Brazil. This compared with gains of
$0.2bn
on assets held for sale in 2017, which included a gain on the sale of our holding in VocaLink in the UK, and a gain on the sale of our operations in Lebanon.
This increase was partly offset by lower favourable movements of
$0.9bn
in the present value of in-force (‘PVIF’) long-term insurance business, of which
$0.8bn
related to ‘Assumption changes and experience variances’ (for further details, please see Note
20
on the Financial Statements). This reflected:
|
•
|
adverse movements in Hong Kong of $0.4bn, reflecting the future sharing of investment returns with policyholders; and
|
|
•
|
adverse movements in Hong Kong and Singapore of $0.4bn, reflecting adjustments offsetting the impact of regulatory-driven changes in the valuation of liabilities (the corresponding movement is recorded in ‘Net insurance claims and benefits paid and movement in liabilities to policyholders’).
|
These adverse movements were partly offset by favourable movements in France, due to market-driven changes in interest rate assumptions.
|
Net insurance claims and benefits paid and movement in liabilities to policyholders
|
||||||
|
2017
|
|
2016
|
|
2015
|
|
|
|
$m
|
|
$m
|
|
$m
|
|
|
|
Gross
|
13,208
|
|
12,508
|
|
11,872
|
|
|
Less reinsurers’ share
|
(877
|
)
|
(638
|
)
|
(580
|
)
|
|
Year ended 31 Dec
|
12,331
|
|
11,870
|
|
11,292
|
|
|
Significant items and currency translation
|
||||
|
2017
|
|
2016
|
|
|
|
$m
|
|
$m
|
|
|
|
Significant items
|
—
|
|
627
|
|
|
– trading results from disposed-of operations in Brazil
|
—
|
|
538
|
|
|
– currency translation on significant items
|
|
|
89
|
|
|
Currency translation
|
|
|
(89
|
)
|
|
Year ended 31 Dec
|
—
|
|
538
|
|
|
HSBC Holdings plc
|
39
|
Report of the Directors
| Financial summary
Net insurance claims and benefits paid and movement in liabilities to policyholders were
$0.5bn
higher compared with 2016, and included reductions due to the disposal of our operations in Brazil (
$0.5bn
).
This increase was primarily due to improved returns on financial assets supporting contracts where the policyholder shares the investment risk, reflecting improved equity market performance in Hong Kong and France compared with 2016.
In addition, movements in liabilities to policyholders were higher due to increased premium income.
These increases were partly offset by the impact of regulatory-driven changes in the valuation of liabilities in Hong Kong and Singapore (the corresponding movement is recorded in ‘Assumption changes and experience variances’ in PVIF).
The gains or losses recognised on the financial assets designated at fair value that are held to support these insurance contract liabilities are reported in ‘Net income/(expense) from financial instruments designated at fair value’ on page
37
.
|
Loan impairment charges and other credit risk provisions
|
||||||
|
2017
|
|
2016
|
|
2015
|
|
|
|
$m
|
|
$m
|
|
$m
|
|
|
|
New allowances net of allowance releases
|
2,636
|
|
3,977
|
|
4,400
|
|
|
Recoveries of amounts previously written off
|
(644
|
)
|
(627
|
)
|
(808
|
)
|
|
Loan impairment charges
|
1,992
|
|
3,350
|
|
3,592
|
|
|
– individually assessed allowances
|
1,114
|
|
1,831
|
|
1,505
|
|
|
– collectively assessed allowances
|
878
|
|
1,519
|
|
2,087
|
|
|
Releases of impairment on available-for-sale debt securities
|
(190
|
)
|
(63
|
)
|
(17
|
)
|
|
Other credit risk provisions
|
(33
|
)
|
113
|
|
146
|
|
|
Year ended 31 Dec
|
1,769
|
|
3,400
|
|
3,721
|
|
|
Impairment charges on loans and advances to customers as a percentage of average gross loans and advances to customers
|
0.22%
|
|
0.39%
|
|
0.39%
|
|
|
Significant items and currency translation
|
||||
|
2017
|
|
2016
|
|
|
|
$m
|
|
$m
|
|
|
|
Significant items
|
—
|
|
867
|
|
|
– trading results from disposed-of operations in Brazil
|
—
|
|
748
|
|
|
– currency translation on significant items
|
|
|
119
|
|
|
Currency translation
|
|
|
(61
|
)
|
|
Year ended 31 Dec
|
—
|
|
806
|
|
Loan impairment charges and other credit risk provisions (‘LICs’) of
$1.8bn
were
$1.6bn
or
48%
lower compared with 2016. This reduction included the favourable effects of the disposal of our operations in Brazil (
$0.9bn
) in July 2016, which was partly offset by the impact of adverse foreign currency translation. Excluding these factors, LICs decreased by
$0.8bn
or
32%
, driven by lower LICs in our CMB and RBWM businesses.
Individually assessed LICs of
$1.1bn
were
$0.7bn
or
39%
lower compared with 2016. This included a reduction of
$0.2bn
following our sale of operations in Brazil.
The remaining variance arose:
|
•
|
In CMB (down
$0.5bn
), notably in North America primarily against exposures in the oil and gas sector, as well as reductions in France, Spain and Singapore, as 2016 included a small number of specific charges in relation to corporate exposures. This was partly offset by higher individually assessed LICs in Hong Kong relating to a small number of customers across various sectors.
|
|
•
|
In GB&M, individually assessed LICs were broadly unchanged, with LICs in 2017 primarily related to two large corporate exposures in Europe, partly offset by a net release of allowances in the US. In 2016, individually assessed LICs included charges in the US against exposures in the oil and gas sector, as well as a single mining-related corporate client.
|
Collectively assessed LICs of
$0.9bn
were
$0.6bn
or
42%
lower compared with 2016. This included a reduction of
$0.6bn
following the sale of operations in Brazil and the adverse effects of foreign currency translation of
$48m
.
The remaining variance arose:
|
•
|
In Corporate Centre (down
$0.1bn
), driven by the run-off of the CML portfolio in the US.
|
|
•
|
In RBWM (down
$0.1bn
), notably in Turkey reflecting improved credit quality and lower lending balances, and in the US and Hong Kong from improvements in credit quality. These decreases were partly offset by increased collective allowances in Mexico, reflecting growth in unsecured lending balances and an increase in delinquencies. In addition, we increased collective allowances in the UK against our mortgages and cards exposures, in part offset by a release following the sale of a portfolio of loans. LICs in the UK remain at low levels, representing approximately 10bps of the overall portfolio.
|
This was partly offset:
|
•
|
In GB&M (up
$0.1bn
), notably in the UK, as 2016 included net releases of collective allowances.
|
|
•
|
In CMB (up
$38m
), notably in Hong Kong in part due to asset growth and an increase in historical loss rates, partly offset by lower charges in the UK relating to reduced exposures in the oil and gas sector.
|
In 2017, we recorded higher net releases of impairment allowances against available-for-sale debt securities (
$0.2bn
). These were primarily related to asset-backed securities in our legacy credit portfolio in Corporate Centre and reflected an improvement in collateral values.
A net release of other credit risk provisions of
$33m
in 2017 largely related to oil and gas sector exposures in the US and the construction sector in Canada. This compared with a net charge in the prior year in these markets, also related to the oil and gas sector.
|
40
|
HSBC Holdings plc
|
Operating expenses
|
In addition to detailing operating expense items by category, as set out in the table below, we also categorise operating expenses as follows:
|
|
|
•
‘Run-the-bank’ costs comprise business-as-usual running costs that keep operations functioning at the required quality and standard year on year, maintain IT infrastructure and support revenue growth. Run-the-bank costs are split between front office and back office, reflecting the way the Group is organised into four global businesses (‘front office’) supported by global functions (‘back office’).
•
‘Change-the-bank’ costs comprise expenses relating to the implementation of mandatory regulatory changes and other investment costs incurred relating to projects to change business-as-usual activity to enhance future operating capabilities.
|
•
‘Costs to achieve’ comprise those specific costs relating to the achievement of the strategic actions set out in the Investor Update in June 2015. They comprise costs incurred between 1 July 2015 and 31 December 2017, and do not include ongoing initiatives such as Global Standards. Any costs arising within this category have been incurred as part of a significant transformation programme. Costs to achieve are included within significant items and incorporate restructuring costs that were identified as a separate significant item prior to 1 July 2015.
|
|
Operating expenses
|
||||||
|
2017
|
|
2016
|
|
2015
|
|
|
|
$m
|
|
$m
|
|
$m
|
|
|
|
By expense category
|
||||||
|
Employee compensation and benefits
|
17,315
|
|
18,089
|
|
19,900
|
|
|
Premises and equipment (excluding depreciation and impairment)
|
3,530
|
|
3,758
|
|
3,830
|
|
|
General and administrative expenses
|
12,177
|
|
12,715
|
|
13,832
|
|
|
Administrative expenses
|
33,022
|
|
34,562
|
|
37,562
|
|
|
Depreciation and impairment of property, plant and equipment
|
1,166
|
|
1,229
|
|
1,269
|
|
|
Amortisation and impairment of intangible assets
|
696
|
|
777
|
|
937
|
|
|
Goodwill impairment
|
—
|
|
3,240
|
|
—
|
|
|
Year ended 31 Dec
|
34,884
|
|
39,808
|
|
39,768
|
|
|
2017
|
|
2016
|
|
|
|
$m
|
|
$m
|
|
|
|
By expense group
|
||||
|
Run-the-bank – front office
|
14,254
|
|
13,240
|
|
|
Run-the-bank – back office
|
12,974
|
|
13,003
|
|
|
Change-the-bank
|
2,996
|
|
2,919
|
|
|
Bank levy
|
916
|
|
922
|
|
|
Significant items
|
3,744
|
|
9,393
|
|
|
Currency translation
|
|
|
331
|
|
|
Year ended 31 Dec
|
34,884
|
|
39,808
|
|
|
Staff numbers (full-time equivalents)
|
||||||
|
2017
|
|
2016
|
|
2015
|
|
|
|
Global businesses
|
||||||
|
Retail Banking and Wealth Management
|
129,402
|
|
124,810
|
|
145,868
|
|
|
Commercial Banking
|
44,871
|
|
44,712
|
|
48,651
|
|
|
Global Banking and Markets
|
45,725
|
|
46,659
|
|
47,894
|
|
|
Global Private Banking
|
7,250
|
|
8,054
|
|
8,513
|
|
|
Corporate Centre
|
1,439
|
|
10,940
|
|
4,277
|
|
|
At 31 Dec
|
228,687
|
|
235,175
|
|
255,203
|
|
Reported operating expenses of
$34.9bn
were
$4.9bn
lower than in 2016. This reflected a reduction in significant items of
$5.6bn
which included:
|
•
|
a $3.2bn write-off of the goodwill in our GPB business in Europe in 2016 (please see Note
20
on the Financial Statements for further details);
|
|
•
|
a net release of
$0.4bn
in settlements and provisions in connection with legal matters, compared with charges in 2016 of
$0.7bn
;
|
|
•
|
the operating expenses incurred by our Brazil business of
$1.1bn
in 2016; and
|
|
•
|
costs to achieve of
$3.0bn
, compared with
$3.1bn
in 2016.
|
The reduction in reported operating expenses also included the favourable effects of currency translation of
$0.3bn
.
|
HSBC Holdings plc
|
41
|
Report of the Directors
| Financial summary
|
Significant items and currency translation
|
||||
|
2017
|
|
2016
|
|
|
|
$m
|
|
$m
|
|
|
|
Significant items
|
3,744
|
|
9,393
|
|
|
– costs associated with portfolio disposals
|
53
|
|
28
|
|
|
– costs associated with the UK’s exit from the EU
|
28
|
|
—
|
|
|
– costs to achieve
|
3,002
|
|
3,118
|
|
|
– costs to establish UK ring-fenced bank
|
392
|
|
223
|
|
|
– customer redress programmes
|
655
|
|
559
|
|
|
– gain on partial settlement of pension obligation
|
(188
|
)
|
—
|
|
|
– impairment of GPB – Europe goodwill
|
—
|
|
3,240
|
|
|
– regulatory provisions in GPB
|
164
|
|
344
|
|
|
– settlements and provisions in connection with legal matters
|
(362
|
)
|
681
|
|
|
– trading results from disposed-of operations in Brazil
|
—
|
|
1,059
|
|
|
– currency translation on significant items
|
141
|
|
||
|
Currency translation
|
|
|
331
|
|
|
Year ended 31 Dec
|
3,744
|
|
9,724
|
|
Excluding the significant items and currency translation tabulated above, operating expenses of
$31.1bn
were
$1.1bn
higher than in 2016. This increase reflected investments in business growth programmes (up $0.6bn), primarily in RBWM, where investments were partly funded by the proceeds from our disposal of Visa Inc. shares, as well as higher performance-related pay (up
$0.4bn
). The impact of our cost-saving initiatives more than offset inflation and continued investment in regulatory programmes and compliance.
Our total investment in regulatory programmes and compliance was $3.0bn, up $0.2bn or 7% compared with 2016. This reflected the continued implementation of our Global Standards programme to enhance our financial crime risk controls and capabilities.
In 2017, we realised $2.1bn of cost savings, and achieved annualised run-rate savings of $6.1bn since our Investor Update in June 2015. We have completed our ‘costs to achieve’ transformation programme, incurring a total cost of $7.0bn since 2015, and continue to realise the benefits of our cost-saving initiatives:
|
•
|
In global businesses, savings of $0.6bn reflected the impact of our branch optimisation programme enabled by our digital initiatives as well as transformation of online and mobile banking for corporates.
|
|
•
|
In Operations and Technology, savings of $1.1bn reflected migrations to lower cost locations, automation, the simplification of our IT structure and the implementation of target operating models.
|
|
•
|
In our back office functions, savings of $0.4bn were realised as a result of the re-engineering and simplification of processes and the implementation of global operating models.
|
The number of employees expressed in FTEs at 31 December 2017 was 228,687, a decrease of 6,488 since 31 December 2016. This included a 18,601 reduction realised across global businesses and global functions from our transformation programme, partly offset by investment in Global Standards of 3,016 FTEs and an increase of 9,097 FTEs, in part attributable to investment for growth.
|
Share of profit in associates and joint ventures
|
|||
|
|
2017
|
2016
|
2015
|
|
|
$m
|
$m
|
$m
|
|
Share of profit in associates
|
2,349
|
2,326
|
2,518
|
|
– Bank of Communications Co., Limited
|
1,863
|
1,892
|
2,011
|
|
– The Saudi British Bank
|
422
|
415
|
462
|
|
– other
|
64
|
19
|
45
|
|
Share of profit in joint ventures
|
26
|
28
|
38
|
|
Year ended 31 Dec
|
2,375
|
2,354
|
2,556
|
Our share of profit in associates and joint ventures was
$2.4bn
, an increase of
$21m
or
1%
compared with 2016 and including the adverse effects of currency translation of
$33m
.
Excluding the effects of currency translation, our share of profit in associates and joint ventures increased by
$53m
, compared with 2016. This mainly comprised gains from the sale of investments held by Business Growth Fund, a joint venture with other UK banks to support small- and medium-sized enterprises (‘SMEs’) in the UK.
Our share of profit in our largest associate, BoCom, was
$1.9bn
. This was broadly unchanged from 2016 after excluding the effects of currency translation. At 31 December 2017, we performed an impairment review of our investment in BoCom and concluded that it was not impaired, based on our value in use calculation (see Note
17
on the Financial Statements for further details).
In future periods, the value in use may increase or decrease depending on the effect of changes to model inputs. It is expected that the carrying amount will increase in 2018 due to retained profits earned by BoCom. At the point where the carrying amount exceeds the value in use, HSBC will determine whether an impairment exists. If so, we would continue to recognise its share of BoCom’s profit or loss, but the carrying amount would be reduced to equal the value in use, with a corresponding reduction in income, unless the market value has increased to a level above the carrying amount.
|
42
|
HSBC Holdings plc
|
|
Tax expense
|
||||||
|
2017
|
|
2016
|
|
2015
|
|
|
|
$m
|
|
$m
|
|
$m
|
|
|
|
Profit before tax
|
17,167
|
|
7,112
|
|
18,867
|
|
|
Tax expense
|
(5,288
|
)
|
(3,666
|
)
|
(3,771
|
)
|
|
Profit after tax for the year ended 31 Dec
|
11,879
|
|
3,446
|
|
15,096
|
|
|
Effective tax rate
|
30.80%
|
|
51.55%
|
|
19.99%
|
|
The effective tax rate for 2017 of 30.8% includes a charge of $1.3bn due to the remeasurement of US deferred tax balances to reflect the reduction in the US federal tax rate from 35% to 21% from 2018. This charge increased the 2017 effective tax rate by 7.5%. The effective tax rate in 2017 was lower than the 51.6% in
2016 as 2016 included the unfavourable impact of a non-deductible goodwill write-down and loss on disposal of operations in Brazil. Further detail is provided in Note
7
on the Financial Statements.
|
2016 compared with 2015
|
Net interest income
In 2016, we earned reported net interest income of $0.9bn in Brazil (2015: $2.1bn) from average interest earning assets in Brazil of $25.8bn (2015: $40.0bn). Our net interest margin excluding Brazil was 1.70% (2015: 1.79%).
Reported net interest income of $29.8bn decreased by $2.7bn or 8% compared with 2015. This was partly the impact of the disposal of our operations in Brazil on 1 July 2016, which reduced net interest income by $1.2bn, and adverse effects of currency translation differences between 2016 and 2015. These decreases were partly offset by growth in net interest income in Asia, notably in Hong Kong, and in Mexico, partly offset by a decrease in the UK and the US.
Net interest margin in 2016 of 1.73% was 15 basis points (‘bps’) lower than 2015. This reflected the effects of the disposal and currency translation noted above, which had an adverse effect of 8bps. The remainder of the decrease was primarily as a result of lower yields on customer lending, which had an adverse effect of 9bps on our net interest margin, partly reflecting the continuing run-off of our US CML portfolio. In addition, we recorded an increase in the cost of debt, partly offset by a lower cost of funds on customer accounts, notably in Hong Kong.
Interest income
Reported interest income decreased by $4.8bn compared with 2015, notably driven by our sale of Brazil operations ($3.1bn) and currency translation differences between 2016 and 2015. Excluding these factors, total interest income increased marginally.
Interest income on loans and advances to customers decreased by $3.8bn, driven by a reduction of $1.9bn relating to our operations in Brazil, and the adverse effects of currency translation differences between 2016 and 2015. Excluding these factors, interest income on customer lending was broadly unchanged. The effects of growth in balances in Europe and Mexico, together with central bank rate rises in Mexico and Argentina, were broadly offset by the run-off of our US CML portfolio and the effect of lower average balances in Asia.
Income growth in Mexico was driven by growth in average balances, reflecting gains in market share and higher yields, notably on term lending due to central bank rate increases. Income increased in Europe as the effect of growth in average balances, primarily an increase in term lending volumes, more than offset the effect of lower yields on both term lending and mortgages, reflecting competitive pricing in the market and lower interest rates in the eurozone. By contrast, interest income decreased in Asia, as a result of lower average balances in term lending, despite increased mortgage balances, notably in Hong Kong. Yields in Asia also decreased marginally as a result of
central bank rate cuts in China during 2015, although these were partly offset by rate rises in Hong Kong.
Interest income on short-term funds and financial investments decreased by $1.0bn in 2016, including a decrease of $0.7bn relating to Brazil. Excluding the effect of currency translation differences between 2016 and 2015 and Brazil, interest income on short-term funds and financial investments increased by $0.2bn. The movement mainly reflected increases in available-for-sale debt securities in Asia, reflecting growth in our surplus liquidity. In North America income increased, driven by higher balances primarily due to net purchase of US Treasury securities, and a higher yield, following the US rate rise at the end of 2015.
Interest income on reverse repurchase agreements – non-trading was $0.1bn lower, including a decrease relating to Brazil ($0.4bn). Excluding currency translation differences between 2016 and 2015 and Brazil, income increased primarily in North America, reflecting higher balances and increased market rates.
Interest expense
Reported interest expense decreased by $2.1bn, driven by the reductions relating to Brazil ($1.8bn) and currency translation differences between 2016 and 2015. Excluding these factors, interest expense rose by $0.4bn, as increases in the cost of debt and repurchase agreements were partly offset by decreases in interest expense on customer accounts.
Interest expense on customer accounts decreased by $1.9bn, including amounts relating to Brazil ($0.8bn) and currency translation differences between 2016 and 2015. Excluding these factors, interest expense on customer accounts decreased by $0.5bn, driven by Asia and Europe, partly offset by Mexico, Argentina and North America. In Asia, the effect of an increase in balances was more than offset by a lower cost of funds, partly due to a change in portfolio mix towards lower-cost accounts in Hong Kong, which more than offset the effect of central bank rate rises. In addition to these factors, the central bank rate cuts in a number of markets, including mainland China, Australia and India, further lowered our cost of funds. In Europe, interest expense decreased as a result of a reduction in the cost of funds, partly due to negative interest rates in continental Europe, although the average balances increased, notably in the UK. These decreases were partly offset by higher interest expense on customer accounts in the US, Mexico and Argentina, reflecting promotional deposit offerings and the central bank rate rises.
Interest expense on debt securities in issue and own debt designated at fair value decreased by $0.5bn, including the impact of Brazil ($0.8bn). Excluding currency translation differences between 2016 and 2015 and the effect of Brazil, interest expense increased by $0.4bn. This was driven by an increase in the cost of funds and an increase in average balances, as redemptions across the Group were more than offset by issuances of senior debt from HSBC Holdings plc (‘HSBC Holdings’). The increase in the cost of debt designated at fair value was as a result of longer maturities and the structural subordination of our new issuances from HSBC Holdings.
Interest expense increased on repurchase agreements by $0.3bn, notably in North America, reflecting higher balances and market rates.
Net fee income
Reported net fee income fell by $1.9bn compared with 2015, partly as a result of the adverse effects of currency translation differences between 2016 and 2015 of $0.6bn, primarily in the UK, Argentina and Mexico, which notably affected account
|
HSBC Holdings plc
|
43
|
Report of the Directors
| Financial summary
services, cards and fee expense. The disposal of our operations in Brazil to Banco Bradesco S.A. reduced net fee income by a further $0.3bn. In addition, the decrease was driven by RBWM in Hong Kong, reflecting risk-averse retail investor sentiment in Asia.
Fee income from broking and unit trusts decreased by $525m, largely due to a strong performance in Hong Kong in the first half of 2015. The decrease was mainly in RBWM in Hong Kong, from lower securities broking income resulting from a reduction in stock market turnover.
In addition, fee income from cards decreased by $311m, primarily reflecting lower interchange fees in the UK, following regulatory change in late 2015.
Fee income from funds under management decreased by $0.5bn, partly driven by a reclassification between fee income from funds under management and fee expense in Germany ($0.2bn). In addition, fee income from funds under management decreased in RBWM’s Global Asset Management business, driven by a change in the product mix towards lower margin fixed income products, as well as in GPB in Switzerland.
The reduction in fee income from funds under management was partly offset by a fall in fee expense of $419m, primarily reflecting lower brokerage fees, and the reclassification noted above.
Net trading income
Reported net trading income of $9.5bn was $0.7bn higher than in 2015, despite the net adverse effects of $1.3bn of significant items and currency translation differences between 2016 and 2015. The increase, excluding significant items and currency translation, was driven by:
|
•
|
favourable movements on assets held as economic hedges of foreign currency debt designated at fair value of $1.7bn in 2016 compared to minimal movements in 2015. These movements were offset by adverse movements in foreign currency debt designated at fair value in ‘Net income/(expense) from financial instruments designated at fair value’; and
|
|
•
|
increases in GB&M ($0.2bn), notably in Rates and in Credit, as we gained market share in Europe, partly offset by a decrease in Equities, reflecting lower trading volumes in Europe and Asia. In addition, we recorded adverse movements of $70m in credit and funding valuation adjustments compared with favourable movements of $227m in 2015, primarily relating to movements in our own credit spread on structured liabilities.
|
Net income/(expense) from financial instruments designated at fair value
The majority of our financial liabilities designated at fair value are fixed-rate, long-term debt issuances, and are managed in conjunction with interest rate swaps as part of our interest rate management strategy.
We recorded a reported net expense from financial instruments designated at fair value of $2.7bn in 2016, compared with net income of $1.5bn in 2015. In 2016, there were unfavourable movements of $1.8bn in the fair value of our own long-term debt reflecting changes in credit spread, compared with favourable movements of $1.0bn in 2015.
The decrease was also as a result of ‘Other changes in fair value’ on our long-term debt and related derivatives, which reflected:
|
•
|
higher adverse movements of $1.7bn in 2016 compared with minimal movements in 2015 on foreign currency debt designated at fair value and issued as part of our overall funding strategy (offset by assets held as economic hedges in ‘Net trading income’); and
|
|
•
|
higher adverse movements of $0.2bn relating to the economic hedging of interest and exchange rate risk on our long-term debt.
|
By contrast, net income from financial assets held to meet liabilities under insurance and investment contracts of $1.5bn was $0.9bn higher than in 2015. This was primarily driven by
improved equity market performance in Asia and Europe in 2016, partly offset by the disposal of our operations in Brazil in July 2016.
Net income arising from financial assets held to meet liabilities under insurance and investment contracts results in a corresponding movement in liabilities to customers, reflecting the extent to which they participate in the investment performance of the associated asset portfolio. These offsetting movements are recorded in ‘Net income/(expense) arising from liabilities to customers under investment contracts’ and ‘Net insurance claims and benefits paid and movement in liabilities to policyholders’.
In 2016, the majority of the variance arose in unit-linked contracts where the policyholder bears the investment risk, and was therefore offset by movements in liabilities to customers.
Gains less losses from financial investments
In 2016, reported gains less losses from financial investments decreased by $0.7bn compared with 2015. This was largely due to the movement in significant items and currency translation differences between 2016 and 2015 of $0.7bn, notably the non-recurrence of the gain on the partial sale of our shareholding in Industrial Bank of $1.4bn in 2015, partly offset by gains on disposal of our membership interests in Visa Europe of $0.6bn and our shares in Visa Inc. of $0.1bn in 2016.
Net insurance premium income
Reported net insurance premium income was $0.4bn lower than in 2015, and included reductions due to the disposal of our operations in Brazil ($0.4bn) and currency translation differences between 2016 and 2015 of $0.2bn. Net insurance premium income increased in Hong Kong, partly offset by reductions in France in response to low interest rates and market volatility, and in the UK, following the disposal of our pension business in 2015.
Other operating income
Reported other operating income was $2.0bn lower than in 2015. This was as a result of a net adverse movement in significant items and currency translation differences between 2016 and 2015 of $1.9bn, notably the loss on the disposal of our operations in Brazil of $1.7bn. In addition, we recorded lower revaluation gains on investment properties.
These decreases were partly offset by higher favourable movements of $0.1bn in present value of in-force (‘PVIF’) long-term insurance business, which was primarily driven by an increase in the value of new business written in Hong Kong,
partly offset by a reduction in France and the impact of the disposal of our operations in Brazil.
In 2016, we recognised $513m of income in ‘Assumption changes and experience variances’, which was broadly unchanged from the $504m recognised in 2015. For further details, please see Note 20 of the Financial Statements in the
2016 Form 20-F
.
Net insurance claims and benefits paid and movement in liabilities to policyholders
Reported net insurance claims and benefits paid and movement in liabilities to policyholders were $0.6bn higher compared with 2015, and included reductions due to the disposal of our operations in Brazil ($0.4bn) and currency translation differences between 2016 and 2015 of $0.2bn.
This increase was primarily due to improved returns on financial assets supporting unit-linked contracts, where the policyholder bears the investment risk, reflecting improved equity market performance in Hong Kong compared with 2015. In addition, movements in liabilities to policyholders were higher due to increased premium income, and interest rate-driven changes to liability valuations in Hong Kong.
These increases were partly offset by lower premiums and falling investment returns in France.
The gains or losses recognised on the financial assets designated at fair value that are held to support these insurance contract liabilities are reported in ‘Net income/(expense) from financial
|
44
|
HSBC Holdings plc
|
instruments designated at fair value’ on page 235 of the
2016 Form 20-F
.
Loan impairment charges and other credit risk provisions
Reported loan impairment charges and other credit risk provisions (‘LICs’) of $3.4bn were $0.3bn lower than in 2015. This was partly as a result of favourable currency translation differences between 2016 and 2015 of $0.2bn, notably in Mexico and the UK. The disposal of our operations in Brazil reduced charges by a further $0.2bn.
Collectively assessed LICs of $1.5bn were $568m lower than in 2015. This reduction included the net favourable effect of $230m as a result of the disposal of our operations in Brazil and favourable currency translation differences between 2016 and 2015 of $95m. The remaining variance reflected the following:
|
•
|
In CMB (down $226m), a net release of collectively assessed LICs compared with a net charge in 2015. The net release of allowances in 2016 was mainly on exposures related to the oil and gas sector, notably in the US and Canada, the UAE and Asia. This reflected a more positive outlook for this sector. By contrast, in 2015 we increased our collective allowances on exposures related to the oil and gas sector. The reduction in collectively assessed LICs was partly offset by an increase in the UK, mainly from new allowances against exposures in the oil and gas sector.
|
|
•
|
In GB&M, a net release of collectively assessed LICs, notably in the UK and US, compared with a net charge in 2015.
|
This was partly offset:
|
•
|
In RBWM, where collectively assessed LICs rose by $75m. The increase was mainly in Mexico reflecting our strategic focus on growing unsecured lending, as well as an increase in delinquency rates. By contrast, collectively assessed LICs decreased in a small number of markets in the Middle East and North Africa and Asia.
|
|
•
|
In Corporate Centre, LICs increased in our US CML run-off portfolio by $67m.
|
Individually assessed LICs of $1.8bn increased by $326m compared with 2015. Higher charges in GB&M were partly offset by a reduction in CMB and favourable currency translation differences between 2016 and 2015 of $79m. This primarily reflected the following:
|
•
|
In GB&M (up $0.6bn), an increase primarily in the US, related to a significant specific charge against a mining-related corporate exposure, as well as charges relating to exposures in the oil and gas sector. Additionally, in Hong Kong, an increase in individually assessed LICs in 2016 was largely related to a single corporate exposure. This compared with a net release of LICs in 2015.
|
This was partly offset:
|
•
|
In CMB, where lower individually assessed LICs (down $261m), included favourable currency translation differences between 2016 and 2015 of $70m and a net favourable effect of $45m attributable to the disposal of our operations in Brazil. The decrease also reflected lower individually assessed LICs in Indonesia, where charges in 2015 related to a small number of exposures across a number of sectors. Lower charges in both the UK and the UAE also contributed to the reduction. These decreases were partly offset by higher LICs in Hong Kong, arising in various sectors including manufacturing, and in Canada due to a rise in the number of exposures in the oil and gas sector migrating to default. Notably, the increase in individually assessed LICs in Canada was more than offset by the movement in collective allowances related to the oil and gas sector, discussed above.
|
In 2016, we recorded higher net releases of impairment allowances against available-for-sale debt securities. These were primarily related to asset-backed securities (‘ABSs’) in our Legacy Credit business in Corporate Centre.
Operating expenses
Reported operating expenses of $39.8bn were $40m higher than in 2015. This reflected an increase in significant items of $3.3bn which included:
|
•
|
the $3.2bn write-off of goodwill in our GPB business in Europe (please see Note 20 on the Financial Statements of the
2016 Form 20-F
for further details);
|
|
•
|
costs to achieve of $3.1bn, compared with $0.9bn in 2015; partly offset by
|
|
•
|
the operating expenses incurred in our Brazil business of $1.1bn in 2016, compared with $2.5bn in 2015; and
|
|
•
|
a reduction of $1.0bn in settlements and provisions in connection with legal matters.
|
The increase in significant items was partly offset by the favourable effects of currency translation differences between 2016 and 2015 of $2.1bn.
Excluding significant items and currency translation, operating expenses of $30.6bn were $1.2bn lower than in 2015. This mainly reflected cost savings of $2.2bn achieved in 2016 and a reduction in the UK bank levy of $0.5bn. This was partly offset by the impact of inflation and continued investment in regulatory programmes and compliance.
Run-the-bank costs of $26.9bn were $0.3bn lower than in 2015 and change-the-bank costs of $2.7bn were $0.4bn lower than in 2015.
Our total investment in regulatory programmes and compliance, comprising both run-the-bank and change-the-bank elements, was $3.0bn, up $0.4bn or 14% from 2015. This reflected the ongoing implementation of our Global Standards programme to enhance our financial crime risk controls and capabilities, and to meet our external commitments.
We have maintained our transformational efforts and continue to realise the benefit of our cost-saving programme:
|
•
|
In RBWM, savings of $0.4bn reflected the impact of our branch optimisation programme enabled by our digital initiatives.
|
|
•
|
In Operations and Technology, savings of $1.2bn reflected migrations to lower cost locations, the simplification of our IT structure and the implementation of target operating models.
|
|
•
|
In our back office functions, savings of $0.4bn were realised as a result of the re-engineering and simplification of processes and the implementation of global operating models.
|
Taking the 2016 savings into account, our run-rate savings are now $3.7bn since the start of our initiatives.
The number of employees expressed in FTEs at 31 December 2016 was 235,175, a decrease of 20,028 since 31 December 2015. This included a 19,145 reduction following the disposal of our operations in Brazil. Excluding this, the decrease in FTE was 883 as a reduction of 17,855 FTEs realised across global businesses and global functions was largely offset by investment in our Global Standards Programme of 5,694 FTEs, costs to achieve FTEs of 8,073 and investment for growth.
|
HSBC Holdings plc
|
45
|
Report of the Directors
| Financial summary
Share of profit in associates and joint ventures
Our reported share of profit in associates and joint ventures was $2.4bn, a decrease of $0.2bn or 8%, which included the adverse effects of currency translation differences between 2016 and 2015 of $0.1bn, notably affecting our share of profit in BoCom.
Excluding the impact of currency translation, our share of profit in associates and joint ventures fell by $0.1bn or 4%, relating to higher impairment charges in the Saudi British Bank and lower revenue in HSBC Saudi Arabia, reflecting lower asset management and investment banking revenue. This was partly offset by revenue growth in Saudi British Bank and well-managed costs in both associates.
Our share of profit in BoCom for the year was $1.9bn. At 31 December 2016, we performed an impairment review of our investment in BoCom and concluded that it was not impaired, based on our value in use calculation (see Note 20 on the Financial Statements of the
2016 Form 20-F
for further details).
In future periods, the value in use may increase or decrease depending on the effect of changes to model inputs. It is
expected that the carrying amount will increase in 2017 due to retained profits earned by BoCom. At the point where the carrying amount exceeds the value in use, HSBC would continue to recognise its share of BoCom’s profit or loss, but the carrying amount would be reduced to equal the value in use, with a corresponding reduction in income, unless the market value has increased to a level above the carrying amount.
Tax expense
The effective tax rate for 2016 of 51.6% was higher than the 20.0% in 2015, reflecting events that occurred in 2016 that reduced the reported profit before tax but not taxable profits. These included the non-deductible goodwill impairment and the non-deductible loss on our disposal of operations in Brazil. The 2016 tax charge includes tax losses not recognised, prior year adjustments and the impact of the 8% bank corporation tax surcharge applicable in the UK from 1 January 2016. Further detail is provided in Note 7 on the Financial Statements of the
2016 Form 20-F
.
|
46
|
HSBC Holdings plc
|
|
Consolidated balance sheet
|
|
Five-year summary consolidated balance sheet
|
|||||||||||
|
2017
|
|
2016
|
|
2015
|
|
2014
|
|
2013
|
|
||
|
Footnote
|
$m
|
|
$m
|
|
$m
|
|
$m
|
|
$m
|
|
|
|
Assets
|
|||||||||||
|
Cash and balances at central banks
|
180,624
|
|
128,009
|
|
98,934
|
|
129,957
|
|
166,599
|
|
|
|
Trading assets
|
287,995
|
|
235,125
|
|
224,837
|
|
304,193
|
|
303,192
|
|
|
|
Financial assets designated at fair value
|
29,464
|
|
24,756
|
|
23,852
|
|
29,037
|
|
38,430
|
|
|
|
Derivatives
|
219,818
|
|
290,872
|
|
288,476
|
|
345,008
|
|
282,265
|
|
|
|
Loans and advances to banks
|
90,393
|
|
88,126
|
|
90,401
|
|
112,149
|
|
120,046
|
|
|
|
Loans and advances to customers
|
26
|
962,964
|
|
861,504
|
|
924,454
|
|
974,660
|
|
992,089
|
|
|
Reverse repurchase agreements – non-trading
|
201,553
|
|
160,974
|
|
146,255
|
|
161,713
|
|
179,690
|
|
|
|
Financial investments
|
389,076
|
|
436,797
|
|
428,955
|
|
415,467
|
|
425,925
|
|
|
|
Other assets
|
159,884
|
|
148,823
|
|
183,492
|
|
161,955
|
|
163,082
|
|
|
|
Total assets at 31 Dec
|
2,521,771
|
|
2,374,986
|
|
2,409,656
|
|
2,634,139
|
|
2,671,318
|
|
|
|
Liabilities and equity
|
|||||||||||
|
Liabilities
|
|||||||||||
|
Deposits by banks
|
69,922
|
|
59,939
|
|
54,371
|
|
77,426
|
|
86,507
|
|
|
|
Customer accounts
|
1,364,462
|
|
1,272,386
|
|
1,289,586
|
|
1,350,642
|
|
1,361,297
|
|
|
|
Repurchase agreements – non-trading
|
130,002
|
|
88,958
|
|
80,400
|
|
107,432
|
|
164,220
|
|
|
|
Trading liabilities
|
184,361
|
|
153,691
|
|
141,614
|
|
190,572
|
|
207,025
|
|
|
|
Financial liabilities designated at fair value
|
94,429
|
|
86,832
|
|
66,408
|
|
76,153
|
|
89,084
|
|
|
|
Derivatives
|
216,821
|
|
279,819
|
|
281,071
|
|
340,669
|
|
274,284
|
|
|
|
Debt securities in issue
|
64,546
|
|
65,915
|
|
88,949
|
|
95,947
|
|
104,080
|
|
|
|
Liabilities under insurance contracts
|
85,667
|
|
75,273
|
|
69,938
|
|
73,861
|
|
74,181
|
|
|
|
Other liabilities
|
113,690
|
|
109,595
|
|
139,801
|
|
121,459
|
|
120,181
|
|
|
|
Total liabilities at 31 Dec
|
2,323,900
|
|
2,192,408
|
|
2,212,138
|
|
2,434,161
|
|
2,480,859
|
|
|
|
Equity
|
|||||||||||
|
Total shareholders’ equity
|
190,250
|
|
175,386
|
|
188,460
|
|
190,447
|
|
181,871
|
|
|
|
Non-controlling interests
|
7,621
|
|
7,192
|
|
9,058
|
|
9,531
|
|
8,588
|
|
|
|
Total equity at 31 Dec
|
197,871
|
|
182,578
|
|
197,518
|
|
199,978
|
|
190,459
|
|
|
|
Total liabilities and equity at 31 Dec
|
2,521,771
|
|
2,374,986
|
|
2,409,656
|
|
2,634,139
|
|
2,671,318
|
|
|
For footnotes, see page
85
.
A more detailed consolidated balance sheet is contained in the Financial Statements on page
214
.
|
Five-year selected financial information
|
|||||||||||
|
|
|
2017
|
|
2016
|
|
2015
|
|
2014
|
|
2013
|
|
|
|
Footnotes
|
$m
|
|
$m
|
|
$m
|
|
$m
|
|
$m
|
|
|
Called up share capital
|
|
10,160
|
|
10,096
|
|
9,842
|
|
9,609
|
|
9,415
|
|
|
Capital resources
|
27, 28
|
182,383
|
|
172,358
|
|
189,833
|
|
190,730
|
|
194,009
|
|
|
Undated subordinated loan capital
|
|
1,969
|
|
1,967
|
|
2,368
|
|
2,773
|
|
2,777
|
|
|
Preferred securities and dated subordinated loan capital
|
29
|
42,147
|
|
42,600
|
|
42,844
|
|
47,208
|
|
48,114
|
|
|
Risk-weighted assets
|
27
|
871,337
|
|
857,181
|
|
1,102,995
|
|
1,219,765
|
|
1,092,653
|
|
|
Financial statistics
|
|
|
|
|
|
|
|
|
|
|
|
|
Loans and advances to customers as a percentage of customer accounts
|
|
70.6
|
|
67.7
|
|
71.7
|
|
72.2
|
|
72.9
|
|
|
Average total shareholders’ equity to average total assets
|
|
7.33
|
|
7.37
|
|
7.31
|
|
7.01
|
|
6.55
|
|
|
Net asset value per ordinary share at year-end ($)
|
30
|
8.35
|
|
7.91
|
|
8.73
|
|
9.28
|
|
9.27
|
|
|
Number of $0.50 ordinary shares in issue (millions)
|
|
20,321
|
|
20,192
|
|
19,685
|
|
19,218
|
|
18,830
|
|
|
Closing foreign exchange translation rates to $:
|
|
|
|
|
|
|
|
|
|
|
|
|
$1: £
|
|
0.740
|
|
0.811
|
|
0.675
|
|
0.642
|
|
0.605
|
|
|
$1: €
|
|
0.834
|
|
0.949
|
|
0.919
|
|
0.823
|
|
0.726
|
|
For footnotes, see page
85
.
|
HSBC Holdings plc
|
47
|
Report of the Directors
| Financial summary
Movement in 2017
Total assets of
$2.5tn
were
6%
higher than at 31 December 2016 on a reported basis, and 1% higher on a constant currency basis.
We increased the strength of our balance sheet by targeting growth in lending, notably in Asia, where we increased balances by 14% on a constant currency basis, reflecting continued momentum from our initiatives to grow corporate lending in the region. During 2017 we also completed the run-off of our US CML portfolio.
Our ratio of customer advances to customer accounts was
71%
, up from
68%
at 31 December 2016, reflecting our focus on lending growth. Loans and advances increased on a reported basis by
$101bn
or
12%
, and customer accounts increased by
$92bn
or
7%
.
Assets
Cash and balances at central banks increased by
$53bn
. This included higher euro-denominated balances in continental Europe, and higher sterling balances in the UK, as we deployed our commercial surplus to maximise returns. This increase was partly offset by a reduction in the US as we redeployed our surplus to maximise returns, notably to reverse repurchase agreements – non-trading.
Trading assets increased by
$53bn
, notably equity securities, in the UK, reflecting higher client activity in our Equities business, and from increased debt securities in Asia.
Reverse repurchase agreements – non-trading increased by
$41bn
, notably in Europe and the US, driven by customer demand in our Markets business. In the US, balances also increased as we redeployed our commercial surplus to maximise returns.
Derivative assets decreased by
$71bn
, primarily reflecting revaluation movements, as a result of changes in yield curves and exchange rates, notably in the UK, Hong Kong and France. These movements were broadly offset by a reduction in derivative liabilities.
Financial investments decreased by
$48bn
. In the UK this was due to our redeployment of available-for-sale investments into cash to manage our liquidity, as well as for risk management purposes, whereas in Hong Kong this primarily reflected a managed reduction in our commercial surplus.
Loans and advances to customers increased by
$101bn
compared with 31 December 2016, notably in Asia and Europe. This included:
|
•
|
favourable currency translation of $45bn, primarily affecting Europe; partly offset by
|
|
•
|
the $5bn transfer to ‘Assets held for sale’, and subsequent disposal, of the US first lien mortgage balance in Corporate Centre.
|
Excluding these factors, customer lending balances increased by $62bn or 7%. This growth was primarily in Asia, which contributed $53bn of this increase.
In Asia, lending grew in GB&M (up $24bn) and CMB (up $16bn), particularly in Hong Kong, from increased term lending reflecting our continued focus on loan growth in the region and higher customer demand. Trade lending in Hong Kong contributed $3bn of the increase in CMB, reflecting increased market share, but it was broadly unchanged in GB&M. We also increased balances in RBWM in Asia by $11bn, primarily in mortgages in Hong Kong, where we grew our market share.
In addition, we grew lending in Europe by $10bn, notably in UK mortgages (up $8bn), reflecting our focus on broker originated mortgages. We also grew balances in CMB by $9bn, driven by higher term lending, which more than offset an $8bn fall in GB&M, notably due to a reclassification of short-term balances to reverse repurchase agreements. Balances also decreased in our Global Banking business, as a small number of customers paid down large balances, as well as a reduction in short-term lending.
Liabilities
Customer accounts increased by
$92bn
on a reported basis, including a favourable foreign currency translation movement of $56bn.
Excluding the effect of currency translation, customer accounts increased by $36bn, notably in RBWM which grew by $28bn. The increase was driven by Hong Kong (up $18bn), reflecting higher customer inflows from surplus liquidity in the region, and the UK (up $6bn), primarily in current accounts. We grew balances in GB&M in France ($5bn) and Germany ($2bn), from higher foreign currency corporate deposits, as we priced competitively to facilitate higher stable funding. In addition we grew CMB balances (up $8bn), notably in the UK, as we won new client mandates and increased balances with existing customers.
These increases were partly offset by a reduction in GB&M in the UK, reflecting a large deposit from 2016 being withdrawn in 2017, as well as an increase in customers who settled their asset and liability balances net, resulting in lower lending and customer accounts. Deposit balances also fell in GPB (down $6bn), partly reflecting the customer repositioning during 2017, as well as active redeployment of clients’ deposits to maximise their returns.
Repurchase agreements – non-trading increased by
$41bn
primarily in the UK and the US, mainly driven by an increased use of repurchase agreements for funding in our Markets business.
Trading liabilities increased by
$31bn
, notably in the UK and France, the latter reflecting an increase in net short positions.
Derivative liabilities decreased by
$63bn
, which is in line with the decrease in derivative assets because the underlying risk is broadly matched.
Equity
Total shareholders’ equity increased by
$14.9bn
or
8%
. This was driven by the effects of profits generated in the period, a reduction in accumulated foreign exchange losses reflecting the appreciation of the euro and sterling against the US dollar during 2017, and the issue of convertible capital securities. These increases more than offset the effects of dividends paid to shareholders and the $3.0bn share buy-back completed during 2017.
Risk-weighted assets
Risk-weighted assets (‘RWAs’) were $871.3bn at 31 December 2017, an increase of $14.1bn compared with 31 December 2016. After foreign currency translation differences, RWAs reduced by $13.6bn in 2017. This reflected targeted RWA reduction initiatives of $70.8bn and improvement in asset quality of $4.6bn, less increases due to growth in asset size of $48.4bn, methodology and policy changes of $8.2bn and model updates of $6.2bn.
The RWA initiatives included:
|
•
|
$21.3bn from the accelerated sell-down of our consumer mortgage portfolio in the US and our legacy credit book; and
|
|
•
|
$40.0bn from process improvements, exposure reductions, trade actions and refined calculations.
|
Asset size movements principally represent:
|
•
|
$40.4bn lending growth, mainly in GB&M and CMB in Asia and Europe; and
|
|
•
|
new transactions and movements in market parameters increasing counterparty credit risk and market risk by $9.0bn.
|
|
48
|
HSBC Holdings plc
|
|
Customer accounts by country
|
||||
|
2017
|
|
2016
|
|
|
|
$m
|
|
$m
|
|
|
|
Europe
|
505,182
|
|
446,615
|
|
|
– UK
|
401,733
|
|
361,278
|
|
|
– France
|
45,833
|
|
35,996
|
|
|
– Germany
|
17,355
|
|
13,925
|
|
|
– Switzerland
|
7,936
|
|
9,474
|
|
|
– other
|
32,325
|
|
25,942
|
|
|
Asia
|
657,395
|
|
631,723
|
|
|
– Hong Kong
|
477,104
|
|
461,626
|
|
|
– mainland China
|
45,991
|
|
46,576
|
|
|
– Singapore
|
41,144
|
|
39,062
|
|
|
– Australia
|
20,212
|
|
18,030
|
|
|
– Malaysia
|
14,027
|
|
12,904
|
|
|
– Taiwan
|
13,459
|
|
11,731
|
|
|
– India
|
13,228
|
|
11,289
|
|
|
– Indonesia
|
4,211
|
|
5,092
|
|
|
– other
|
28,019
|
|
25,413
|
|
|
Middle East and North Africa (excluding Saudi Arabia)
|
34,658
|
|
34,766
|
|
|
– United Arab Emirates
|
16,602
|
|
16,532
|
|
|
– Turkey
|
3,772
|
|
4,122
|
|
|
– Egypt
|
3,912
|
|
3,790
|
|
|
– other
|
10,372
|
|
10,322
|
|
|
North America
|
143,432
|
|
138,790
|
|
|
– US
|
89,887
|
|
88,751
|
|
|
– Canada
|
45,510
|
|
42,096
|
|
|
– other
|
8,035
|
|
7,943
|
|
|
Latin America
|
23,795
|
|
20,492
|
|
|
– Mexico
|
17,809
|
|
14,423
|
|
|
– other
|
5,986
|
|
6,069
|
|
|
At 31 Dec
|
1,364,462
|
|
1,272,386
|
|
|
HSBC Holdings plc
|
49
|
Report of the Directors
| Financial summary
|
Average balance sheet
|
Average balance sheet and net interest income
Average balances and related interest are shown for the domestic operations of our principal commercial banks by geographical region. ‘Other operations’ comprise the operations of our principal commercial banking and consumer finance entities outside their domestic markets and all other banking operations, including investment banking balances and transactions.
Average balances are based on daily averages for the principal areas of our banking activities with monthly or less frequent averages used elsewhere. Balances and transactions with fellow subsidiaries are reported gross in the principal commercial
banking and consumer finance entities, and the elimination entries are included within ‘Other operations’.
Net interest margin numbers are calculated by dividing net interest income as reported in the income statement by the average interest-earning assets from which interest income is reported within the ‘Net interest income’ line of the income statement. Total interest-earning assets include loans where the carrying amount has been adjusted as a result of impairment allowances. In accordance with IFRSs, we recognise interest income on assets after the carrying amount has been adjusted as a result of impairment. Fee income that forms an integral part of the effective interest rate of a financial instrument is recognised as an adjustment to the effective interest rate and recorded in ‘Interest income’.
|
Assets
|
||||||||||||||||||||
|
2017
|
2016
|
2015
|
||||||||||||||||||
|
Average
balance
|
|
Interest
income
|
|
Yield
|
|
Average
balance
|
|
Interest
income
|
|
Yield
|
|
Average
balance
|
|
Interest
income
|
|
Yield
|
|
|||
|
|
$m
|
|
$m
|
|
%
|
|
$m
|
|
$m
|
|
%
|
|
$m
|
|
$m
|
|
%
|
|
||
|
Summary
|
|
|
|
|
|
|
|
|
|
|
|
|
|
|
|
|
|
|
|
|
|
Interest-earning assets measured at amortised cost (itemised below)
|
|
1,726,120
|
|
40,995
|
|
2.37
|
|
1,723,702
|
|
42,414
|
|
2.46
|
|
1,726,949
|
|
47,189
|
|
2.73
|
|
|
|
Trading assets and financial assets designated at fair value
|
|
186,673
|
|
4,245
|
|
2.27
|
|
179,780
|
|
3,897
|
|
2.17
|
|
195,285
|
|
4,626
|
|
2.37
|
|
|
|
Impairment allowances
|
|
(7,841
|
)
|
|
|
|
|
(9,127
|
)
|
|
|
|
|
(10,606
|
)
|
|
|
|
|
|
|
Non-interest-earning assets
|
|
616,688
|
|
|
|
|
|
653,115
|
|
|
|
|
|
682,143
|
|
|
|
|
|
|
|
Total assets and interest income
|
|
2,521,640
|
|
45,240
|
|
1.79
|
|
2,547,470
|
|
46,311
|
|
1.82
|
|
2,593,771
|
|
51,815
|
|
2.00
|
|
|
|
Average yield on all interest-earning assets
|
|
|
|
|
|
2.37
|
|
|
|
|
|
2.43
|
|
|
|
|
|
2.70
|
|
|
|
Short-term funds and loans and advances to banks
|
|
|
|
|
|
|
|
|
|
|
|
|
|
|
|
|
|
|
|
|
|
Europe
|
HSBC Bank
|
|
83,855
|
|
256
|
|
0.31
|
|
68,015
|
|
276
|
|
0.41
|
|
79,101
|
|
827
|
|
1.05
|
|
|
|
HSBC Private Banking Holdings (Suisse)
|
|
11,815
|
|
1
|
|
0.01
|
|
10,597
|
|
—
|
|
—
|
|
11,498
|
|
4
|
|
0.03
|
|
|
|
HSBC France
|
|
13,260
|
|
41
|
|
0.31
|
|
5,705
|
|
27
|
|
0.47
|
|
5,242
|
|
40
|
|
0.76
|
|
|
Asia
|
Hang Seng Bank
|
|
10,865
|
|
201
|
|
1.85
|
|
10,533
|
|
133
|
|
1.26
|
|
14,379
|
|
210
|
|
1.46
|
|
|
|
The Hongkong and Shanghai
Banking Corporation |
|
53,502
|
|
604
|
|
1.13
|
|
50,741
|
|
490
|
|
0.97
|
|
55,951
|
|
536
|
|
0.96
|
|
|
|
HSBC Bank Malaysia
|
|
1,906
|
|
55
|
|
2.89
|
|
3,680
|
|
99
|
|
2.69
|
|
3,994
|
|
121
|
|
3.03
|
|
|
MENA
|
HSBC Bank Middle East
|
|
2,556
|
|
39
|
|
1.53
|
|
3,658
|
|
30
|
|
0.82
|
|
5,038
|
|
30
|
|
0.60
|
|
|
North America
|
HSBC Bank USA
|
|
40,476
|
|
461
|
|
1.14
|
|
34,858
|
|
214
|
|
0.61
|
|
35,271
|
|
134
|
|
0.38
|
|
|
|
HSBC Bank Canada
|
|
366
|
|
3
|
|
0.82
|
|
745
|
|
2
|
|
0.27
|
|
767
|
|
2
|
|
0.26
|
|
|
Latin America
|
HSBC Mexico
|
|
2,164
|
|
150
|
|
6.93
|
|
2,217
|
|
92
|
|
4.15
|
|
2,463
|
|
76
|
|
3.09
|
|
|
|
Brazilian operations
|
|
–
|
|
–
|
|
–
|
|
—
|
|
—
|
|
—
|
|
1,717
|
|
193
|
|
11.24
|
|
|
|
HSBC Bank Argentina
|
|
1,083
|
|
1
|
|
0.09
|
|
818
|
|
8
|
|
0.98
|
|
1,050
|
|
4
|
|
0.38
|
|
|
Other operations
|
|
|
14,278
|
|
218
|
|
1.53
|
|
12,232
|
|
139
|
|
1.14
|
|
5,453
|
|
100
|
|
1.83
|
|
|
|
|
236,126
|
|
2,030
|
|
0.86
|
|
203,799
|
|
1,510
|
|
0.74
|
|
221,924
|
|
2,277
|
|
1.03
|
|
|
|
50
|
HSBC Holdings plc
|
|
Assets (continued)
|
||||||||||||||||||||
|
2017
|
2016
|
2015
|
||||||||||||||||||
|
Average
balance
|
|
Interest
income
|
|
Yield
|
|
Average
balance
|
|
Interest
income
|
|
Yield
|
|
Average
balance
|
|
Interest
income
|
|
Yield
|
|
|||
|
|
$m
|
|
$m
|
|
%
|
|
$m
|
|
$m
|
|
%
|
|
$m
|
|
$m
|
|
%
|
|
||
|
Loans and advances to customers
|
|
|
|
|
|
|
|
|
|
|
|
|
|
|
|
|
|
|
||
|
Europe
|
HSBC Bank
|
280,689
|
|
8,046
|
|
2.87
|
|
277,995
|
|
9,203
|
|
3.31
|
|
291,311
|
|
9,916
|
|
3.40
|
|
|
|
|
HSBC Private Banking Holdings (Suisse)
|
8,921
|
|
152
|
|
1.70
|
|
10,528
|
|
143
|
|
1.36
|
|
12,006
|
|
136
|
|
1.13
|
|
|
|
|
HSBC France
|
51,480
|
|
920
|
|
1.79
|
|
42,676
|
|
1,026
|
|
2.40
|
|
41,257
|
|
1,252
|
|
3.03
|
|
|
|
Asia
|
Hang Seng Bank
|
94,943
|
|
2,695
|
|
2.84
|
|
87,073
|
|
2,540
|
|
2.92
|
|
86,149
|
|
2,579
|
|
2.99
|
|
|
|
|
The Hongkong and Shanghai
Banking Corporation |
289,819
|
|
8,506
|
|
2.93
|
|
253,802
|
|
7,630
|
|
3.01
|
|
261,705
|
|
8,082
|
|
3.09
|
|
|
|
|
HSBC Bank Malaysia
|
11,523
|
|
536
|
|
4.65
|
|
11,636
|
|
546
|
|
4.69
|
|
12,517
|
|
589
|
|
4.71
|
|
|
|
MENA
|
HSBC Bank Middle East
|
20,498
|
|
861
|
|
4.20
|
|
23,595
|
|
883
|
|
3.74
|
|
27,240
|
|
1,041
|
|
3.82
|
|
|
|
North America
|
HSBC Bank USA
|
67,317
|
|
2,210
|
|
3.28
|
|
73,002
|
|
2,187
|
|
3.00
|
|
74,013
|
|
1,981
|
|
2.68
|
|
|
|
|
HSBC Finance
|
1,939
|
|
173
|
|
8.92
|
|
13,169
|
|
1,089
|
|
8.27
|
|
21,529
|
|
1,705
|
|
7.92
|
|
|
|
|
HSBC Bank Canada
|
36,557
|
|
1,205
|
|
3.30
|
|
35,894
|
|
1,070
|
|
2.98
|
|
33,280
|
|
1,086
|
|
3.26
|
|
|
|
Latin America
|
HSBC Mexico
|
14,923
|
|
1,766
|
|
11.83
|
|
14,050
|
|
1,427
|
|
10.16
|
|
14,304
|
|
1,319
|
|
9.22
|
|
|
|
|
Brazilian operations
|
–
|
|
–
|
|
–
|
|
—
|
|
—
|
|
—
|
|
10,388
|
|
1,915
|
|
18.43
|
|
|
|
|
HSBC Bank Argentina
|
3,284
|
|
706
|
|
21.50
|
|
2,642
|
|
715
|
|
27.06
|
|
3,381
|
|
880
|
|
26.03
|
|
|
|
Other operations
|
|
20,321
|
|
975
|
|
4.80
|
|
19,294
|
|
813
|
|
4.21
|
|
20,627
|
|
623
|
|
3.02
|
|
|
|
|
902,214
|
|
28,751
|
|
3.19
|
|
865,356
|
|
29,272
|
|
3.38
|
|
909,707
|
|
33,104
|
|
3.64
|
|
||
|
Reverse repurchase agreements – non-trading
|
|
|
|
|
|
|
|
|
|
|
|
|
|
|
|
|
|
|
||
|
Europe
|
HSBC Bank
|
40,082
|
|
502
|
|
1.25
|
|
47,663
|
|
305
|
|
0.64
|
|
53,036
|
|
354
|
|
0.67
|
|
|
|
|
HSBC France
|
16,907
|
|
1
|
|
0.01
|
|
10,338
|
|
1
|
|
0.01
|
|
12,986
|
|
7
|
|
0.05
|
|
|
|
Asia
|
The Hongkong and Shanghai
Banking Corporation |
41,829
|
|
596
|
|
1.42
|
|
33,257
|
|
298
|
|
0.90
|
|
26,714
|
|
273
|
|
1.02
|
|
|
|
|
HSBC Bank Malaysia
|
531
|
|
16
|
|
3.01
|
|
1,141
|
|
35
|
|
3.07
|
|
1,001
|
|
32
|
|
3.20
|
|
|
|
MENA
|
HSBC Bank Middle East
|
1,101
|
|
14
|
|
1.27
|
|
650
|
|
9
|
|
1.38
|
|
272
|
|
2
|
|
0.74
|
|
|
|
North America
|
HSBC Bank USA
|
5,442
|
|
124
|
|
2.28
|
|
11,632
|
|
131
|
|
1.13
|
|
4,589
|
|
23
|
|
0.50
|
|
|
|
|
HSBC Bank Canada
|
5,225
|
|
44
|
|
0.84
|
|
5,985
|
|
30
|
|
0.50
|
|
5,814
|
|
40
|
|
0.69
|
|
|
|
Latin America
|
HSBC Mexico
|
882
|
|
61
|
|
6.92
|
|
754
|
|
33
|
|
4.38
|
|
877
|
|
27
|
|
3.08
|
|
|
|
|
Brazilian operations
|
–
|
|
–
|
|
–
|
|
—
|
|
—
|
|
—
|
|
3,248
|
|
421
|
|
12.96
|
|
|
|
|
HSBC Bank Argentina
|
70
|
|
15
|
|
21.43
|
|
59
|
|
13
|
|
22.03
|
|
42
|
|
7
|
|
16.67
|
|
|
|
Other operations
|
|
61,691
|
|
818
|
|
1.33
|
|
56,728
|
|
372
|
|
0.66
|
|
53,729
|
|
115
|
|
0.21
|
|
|
|
|
173,760
|
|
2,191
|
|
1.26
|
|
168,207
|
|
1,227
|
|
0.73
|
|
162,308
|
|
1,301
|
|
0.80
|
|
||
|
Financial investments
|
|
|
|
|
|
|
|
|
|
|
|
|
|
|
|
|
|
|
||
|
Europe
|
HSBC Bank
|
53,754
|
|
715
|
|
1.33
|
|
71,215
|
|
965
|
|
1.36
|
|
73,043
|
|
753
|
|
1.03
|
|
|
|
|
HSBC Private Banking Holdings (Suisse)
|
4,826
|
|
60
|
|
1.24
|
|
5,905
|
|
57
|
|
0.97
|
|
7,479
|
|
75
|
|
1.00
|
|
|
|
|
HSBC France
|
10,657
|
|
(9
|
)
|
(0.08
|
)
|
14,753
|
|
10
|
|
0.07
|
|
13,608
|
|
17
|
|
0.12
|
|
|
|
Asia
|
Hang Seng Bank
|
50,129
|
|
776
|
|
1.55
|
|
49,469
|
|
686
|
|
1.39
|
|
39,891
|
|
647
|
|
1.62
|
|
|
|
|
The Hongkong and Shanghai
Banking Corporation |
136,232
|
|
2,235
|
|
1.64
|
|
154,087
|
|
2,079
|
|
1.35
|
|
128,922
|
|
1,909
|
|
1.48
|
|
|
|
|
HSBC Bank Malaysia
|
2,899
|
|
96
|
|
3.31
|
|
1,766
|
|
61
|
|
3.45
|
|
2,864
|
|
104
|
|
3.63
|
|
|
|
MENA
|
HSBC Bank Middle East
|
6,406
|
|
83
|
|
1.30
|
|
6,654
|
|
68
|
|
1.02
|
|
8,186
|
|
70
|
|
0.86
|
|
|
|
North America
|
HSBC Bank USA
|
47,018
|
|
945
|
|
2.01
|
|
52,479
|
|
952
|
|
1.81
|
|
49,268
|
|
893
|
|
1.81
|
|
|
|
|
HSBC Bank Canada
|
17,304
|
|
214
|
|
1.24
|
|
17,769
|
|
209
|
|
1.18
|
|
17,486
|
|
199
|
|
1.14
|
|
|
|
Latin America
|
HSBC Mexico
|
5,537
|
|
296
|
|
5.35
|
|
4,709
|
|
234
|
|
4.97
|
|
6,301
|
|
286
|
|
4.54
|
|
|
|
|
Brazilian operations
|
–
|
|
–
|
|
–
|
|
—
|
|
—
|
|
—
|
|
3,520
|
|
515
|
|
14.63
|
|
|
|
|
HSBC Bank Argentina
|
378
|
|
67
|
|
17.72
|
|
627
|
|
142
|
|
22.65
|
|
650
|
|
149
|
|
22.92
|
|
|
|
Other operations
|
|
54,667
|
|
1,962
|
|
3.59
|
|
51,342
|
|
1,785
|
|
3.48
|
|
44,895
|
|
1,891
|
|
4.21
|
|
|
|
|
389,807
|
|
7,440
|
|
1.91
|
|
430,775
|
|
7,248
|
|
1.68
|
|
396,113
|
|
7,508
|
|
1.90
|
|
||
|
HSBC Holdings plc
|
51
|
Report of the Directors
| Financial summary
|
Assets (continued)
|
||||||||||||||||||||
|
2017
|
2016
|
2015
|
||||||||||||||||||
|
Footnote
|
Average
balance
|
|
Interest
income
|
|
Yield
|
|
Average
balance
|
|
Interest
income
|
|
Yield
|
|
Average
balance
|
|
Interest
income
|
|
Yield
|
|
||
|
|
$m
|
|
$m
|
|
%
|
|
$m
|
|
$m
|
|
%
|
|
$m
|
|
$m
|
|
%
|
|
||
|
Other interest-earning assets
|
|
|
|
|
|
|
|
|
|
|
|
|
|
|
|
|
|
|||
|
Europe
|
HSBC Bank
|
1
|
52,575
|
|
188
|
|
0.36
|
|
65,884
|
|
105
|
|
0.16
|
|
61,355
|
|
100
|
|
0.16
|
|
|
|
HSBC Private Banking Holdings (Suisse)
|
1,579
|
|
24
|
|
1.52
|
|
1,874
|
|
24
|
|
1.28
|
|
2,200
|
|
24
|
|
1.09
|
|
|
|
|
HSBC France
|
1
|
2,546
|
|
344
|
|
13.51
|
|
2,106
|
|
245
|
|
11.60
|
|
2,818
|
|
145
|
|
5.14
|
|
|
Asia
|
Hang Seng Bank
|
1,009
|
|
17
|
|
1.68
|
|
1,828
|
|
15
|
|
0.82
|
|
3,551
|
|
14
|
|
0.39
|
|
|
|
|
The Hongkong and Shanghai
Banking Corporation |
1
|
106,511
|
|
1,066
|
|
1.00
|
|
92,650
|
|
617
|
|
0.67
|
|
82,422
|
|
451
|
|
0.55
|
|
|
|
HSBC Bank Malaysia
|
223
|
|
1
|
|
0.45
|
|
242
|
|
—
|
|
—
|
|
92
|
|
—
|
|
—
|
|
|
|
MENA
|
HSBC Bank Middle East
|
4,044
|
|
66
|
|
1.63
|
|
1,942
|
|
80
|
|
4.12
|
|
1,263
|
|
37
|
|
2.93
|
|
|
|
North America
|
HSBC Bank USA
|
5,221
|
|
83
|
|
1.59
|
|
7,930
|
|
130
|
|
1.64
|
|
4,012
|
|
132
|
|
3.29
|
|
|
|
|
HSBC Finance
|
5,641
|
|
84
|
|
1.49
|
|
2,975
|
|
6
|
|
0.20
|
|
5,538
|
|
7
|
|
0.13
|
|
|
|
|
HSBC Bank Canada
|
1,060
|
|
10
|
|
0.94
|
|
352
|
|
6
|
|
1.70
|
|
249
|
|
5
|
|
2.01
|
|
|
|
Latin America
|
HSBC Mexico
|
843
|
|
8
|
|
0.95
|
|
587
|
|
1
|
|
0.17
|
|
517
|
|
1
|
|
0.19
|
|
|
|
|
Brazilian operations
|
–
|
|
–
|
|
–
|
|
25,783
|
|
2,705
|
|
10.49
|
|
20,972
|
|
2,744
|
|
13.08
|
|
|
|
|
HSBC Bank Argentina
|
58
|
|
1
|
|
1.72
|
|
76
|
|
—
|
|
—
|
|
69
|
|
—
|
|
—
|
|
|
|
Other operations
|
1
|
(157,097
|
)
|
(1,309
|
)
|
|
|
(148,664
|
)
|
(777
|
)
|
|
(148,161
|
)
|
(661
|
)
|
|
|||
|
|
24,213
|
|
583
|
|
2.41
|
|
55,565
|
|
3,157
|
|
5.68
|
|
36,897
|
|
2,999
|
|
8.13
|
|
||
|
Total interest-earning assets
|
|
|
|
|
|
|
|
|
|
|
|
|
||||||||
|
Europe
|
HSBC Bank
|
510,955
|
|
9,707
|
|
1.90
|
|
530,772
|
|
10,833
|
|
2.04
|
|
557,846
|
|
11,950
|
|
2.14
|
|
|
|
|
HSBC Private Banking Holdings (Suisse)
|
27,141
|
|
237
|
|
0.87
|
|
28,904
|
|
224
|
|
0.77
|
|
33,183
|
|
239
|
|
0.72
|
|
|
|
|
HSBC France
|
94,850
|
|
1,297
|
|
1.37
|
|
75,578
|
|
1,109
|
|
1.47
|
|
75,911
|
|
1,377
|
|
1.81
|
|
|
|
Asia
|
Hang Seng Bank
|
156,946
|
|
3,689
|
|
2.35
|
|
148,903
|
|
3,374
|
|
2.27
|
|
143,970
|
|
3,450
|
|
2.40
|
|
|
|
|
The Hongkong and Shanghai
Banking Corporation |
627,893
|
|
13,007
|
|
2.07
|
|
584,537
|
|
11,112
|
|
1.90
|
|
555,714
|
|
11,251
|
|
2.02
|
|
|
|
|
HSBC Bank Malaysia
|
17,082
|
|
704
|
|
4.12
|
|
18,465
|
|
741
|
|
4.01
|
|
20,468
|
|
846
|
|
4.13
|
|
|
|
MENA
|
HSBC Bank Middle East
|
34,605
|
|
1,063
|
|
3.07
|
|
36,499
|
|
1,070
|
|
2.93
|
|
41,999
|
|
1,180
|
|
2.81
|
|
|
|
North America
|
HSBC Bank USA
|
165,474
|
|
3,823
|
|
2.31
|
|
179,901
|
|
3,614
|
|
2.01
|
|
167,153
|
|
3,163
|
|
1.89
|
|
|
|
|
HSBC Finance
|
7,580
|
|
257
|
|
3.39
|
|
16,144
|
|
1,095
|
|
6.78
|
|
27,067
|
|
1,712
|
|
6.33
|
|
|
|
|
HSBC Bank Canada
|
60,512
|
|
1,476
|
|
2.44
|
|
60,745
|
|
1,317
|
|
2.17
|
|
57,596
|
|
1,332
|
|
2.31
|
|
|
|
Latin America
|
HSBC Mexico
|
24,349
|
|
2,281
|
|
9.37
|
|
22,317
|
|
1,787
|
|
8.01
|
|
24,462
|
|
1,709
|
|
6.99
|
|
|
|
|
Brazilian operations
|
–
|
|
–
|
|
–
|
|
25,783
|
|
2,705
|
|
10.49
|
|
39,845
|
|
5,788
|
|
14.53
|
|
|
|
|
HSBC Bank Argentina
|
4,873
|
|
790
|
|
16.21
|
|
4,222
|
|
878
|
|
20.80
|
|
5,192
|
|
1,040
|
|
20.03
|
|
|
|
Other operations
|
(6,140
|
)
|
2,664
|
|
|
|
(9,068
|
)
|
2,555
|
|
|
(23,457
|
)
|
2,152
|
|
|
||||
|
|
|
1,726,120
|
|
40,995
|
|
2.37
|
|
1,723,702
|
|
42,414
|
|
2.46
|
|
1,726,949
|
|
47,189
|
|
2.73
|
|
|
|
1
|
Comparatives have been restated for changes in assumptions relating to interest income for other interest-earning assets.
|
|
Equity and liabilities
|
||||||||||||||||||
|
2017
|
2016
|
2015
|
||||||||||||||||
|
Average
balance
|
|
Interest
expense
|
|
Cost
|
|
Average
balance
|
|
Interest
expense
|
|
Cost
|
|
Average
balance
|
|
Interest
expense
|
|
Cost
|
|
|
|
|
$m
|
|
$m
|
|
%
|
|
$m
|
|
$m
|
|
%
|
|
$m
|
|
$m
|
|
%
|
|
|
Summary
|
|
|
|
|
|
|
|
|
|
|
|
|
|
|
|
|
|
|
|
Interest-bearing liabilities measured at amortised cost (itemised below)
|
1,455,070
|
|
12,819
|
|
0.88
|
|
1,442,004
|
|
12,601
|
|
0.87
|
|
1,465,635
|
|
14,658
|
|
1.00
|
|
|
Trading liabilities and financial liabilities designated at fair value (excluding own debt issued)
|
153,776
|
|
2,325
|
|
1.51
|
|
138,486
|
|
1,986
|
|
1.43
|
|
151,294
|
|
2,071
|
|
1.37
|
|
|
Non-interest bearing current accounts
|
197,104
|
|
|
|
|
|
184,016
|
|
|
|
190,914
|
|
|
|
||||
|
Total equity and other non-interest bearing liabilities
|
715,690
|
|
|
|
|
|
782,964
|
|
|
|
785,928
|
|
|
|
||||
|
Total equity and liabilities
|
2,521,640
|
|
15,144
|
|
0.60
|
|
2,547,470
|
|
14,587
|
|
0.57
|
|
2,593,771
|
|
16,729
|
|
0.64
|
|
|
Average cost on all interest-bearing liabilities
|
|
|
|
|
0.94
|
|
|
|
0.92
|
|
|
|
1.03
|
|
||||
|
52
|
HSBC Holdings plc
|
|
Equity and liabilities (continued)
|
||||||||||||||||||||
|
2017
|
2016
|
2015
|
||||||||||||||||||
|
Average
balance
|
|
Interest
expense
|
|
Cost
|
|
Average
balance
|
|
Interest
expense
|
|
Cost
|
|
Average
balance
|
|
Interest
expense
|
|
Cost
|
|
|||
|
|
Footnotes
|
$m
|
|
$m
|
|
%
|
|
$m
|
|
$m
|
|
%
|
|
$m
|
|
$m
|
|
%
|
|
|
|
Deposits by banks
|
44a
|
|
|
|
|
|
|
|
|
|
|
|
|
|
|
|
|
|
|
|
|
Europe
|
HSBC Bank
|
|
9,402
|
|
48
|
|
0.51
|
|
12,408
|
|
49
|
|
0.39
|
|
16,333
|
|
75
|
|
0.46
|
|
|
|
HSBC Private Banking Holdings (Suisse)
|
|
189
|
|
2
|
|
1.06
|
|
186
|
|
2
|
|
1.08
|
|
400
|
|
1
|
|
0.25
|
|
|
|
HSBC France
|
|
9,175
|
|
29
|
|
0.32
|
|
7,520
|
|
33
|
|
0.44
|
|
7,323
|
|
41
|
|
0.56
|
|
|
Asia
|
Hang Seng Bank
|
|
589
|
|
8
|
|
1.36
|
|
587
|
|
11
|
|
1.87
|
|
1,098
|
|
19
|
|
1.73
|
|
|
|
The Hongkong and Shanghai
Banking Corporation |
|
19,191
|
|
164
|
|
0.85
|
|
19,867
|
|
125
|
|
0.63
|
|
19,426
|
|
80
|
|
0.41
|
|
|
|
HSBC Bank Malaysia
|
|
272
|
|
5
|
|
1.84
|
|
360
|
|
4
|
|
1.11
|
|
974
|
|
26
|
|
2.67
|
|
|
MENA
|
HSBC Bank Middle East
|
|
695
|
|
10
|
|
1.44
|
|
492
|
|
4
|
|
0.81
|
|
737
|
|
3
|
|
0.41
|
|
|
North America
|
HSBC Bank USA
|
|
3,627
|
|
41
|
|
1.13
|
|
5,316
|
|
30
|
|
0.56
|
|
5,503
|
|
17
|
|
0.31
|
|
|
|
HSBC Bank Canada
|
|
231
|
|
1
|
|
0.43
|
|
358
|
|
1
|
|
0.28
|
|
319
|
|
1
|
|
0.31
|
|
|
Latin America
|
HSBC Mexico
|
|
1,820
|
|
120
|
|
6.59
|
|
1,631
|
|
70
|
|
4.29
|
|
1,506
|
|
55
|
|
3.65
|
|
|
|
Brazilian operations
|
|
–
|
|
–
|
|
–
|
|
—
|
|
—
|
|
—
|
|
1,024
|
|
49
|
|
4.79
|
|
|
|
HSBC Bank Argentina
|
|
3
|
|
1
|
|
33.33
|
|
2
|
|
—
|
|
—
|
|
10
|
|
2
|
|
20.00
|
|
|
Other operations
|
|
2,143
|
|
22
|
|
1.03
|
|
1,055
|
|
13
|
|
1.23
|
|
1,210
|
|
9
|
|
0.74
|
|
|
|
|
|
47,337
|
|
451
|
|
0.95
|
|
49,782
|
|
342
|
|
0.69
|
|
55,863
|
|
378
|
|
0.68
|
|
|
|
Financial liabilities designated at fair value – own debt issued
|
44b
|
|
|
|
|
|
|
|
|
|
|
|
|
|
|
|
|
|
|
|
|
Europe
|
HSBC Holdings
|
|
30,506
|
|
944
|
|
3.09
|
|
26,900
|
|
609
|
|
2.26
|
|
18,816
|
|
263
|
|
1.40
|
|
|
|
HSBC Bank
|
|
12,598
|
|
220
|
|
1.75
|
|
15,548
|
|
225
|
|
1.45
|
|
20,758
|
|
316
|
|
1.52
|
|
|
|
HSBC France
|
|
8,769
|
|
17
|
|
0.19
|
|
8,821
|
|
15
|
|
0.17
|
|
8,472
|
|
31
|
|
0.37
|
|
|
North America
|
HSBC Bank USA
|
|
2,115
|
|
44
|
|
2.08
|
|
2,039
|
|
38
|
|
1.86
|
|
2,100
|
|
32
|
|
1.52
|
|
|
|
HSBC Finance
|
|
696
|
|
13
|
|
1.87
|
|
1,498
|
|
19
|
|
1.27
|
|
5,169
|
|
47
|
|
0.91
|
|
|
Other operations
|
|
|
5,882
|
|
23
|
|
0.39
|
|
7,236
|
|
36
|
|
0.50
|
|
3,174
|
|
28
|
|
0.88
|
|
|
|
|
|
60,566
|
|
1,261
|
|
2.08
|
|
62,042
|
|
942
|
|
1.52
|
|
58,489
|
|
717
|
|
1.23
|
|
|
Customer accounts
|
44c
|
|
|
|
|
|
|
|
|
|
|
|
|
|
|
|
|
|
||
|
Europe
|
HSBC Bank
|
|
342,776
|
|
1,186
|
|
0.35
|
|
352,318
|
|
1,613
|
|
0.46
|
|
364,503
|
|
2,051
|
|
0.56
|
|
|
|
HSBC Private Banking Holdings
(Suisse) |
|
6,598
|
|
70
|
|
1.06
|
|
6,128
|
|
31
|
|
0.51
|
|
7,201
|
|
29
|
|
0.40
|
|
|
|
HSBC France
|
|
17,199
|
|
84
|
|
0.49
|
|
14,697
|
|
93
|
|
0.63
|
|
15,900
|
|
116
|
|
0.73
|
|
|
Asia
|
Hang Seng Bank
|
|
115,705
|
|
300
|
|
0.26
|
|
111,457
|
|
339
|
|
0.30
|
|
106,783
|
|
464
|
|
0.43
|
|
|
|
The Hongkong and Shanghai
Banking Corporation |
|
439,356
|
|
1,926
|
|
0.44
|
|
421,711
|
|
1,981
|
|
0.47
|
|
394,313
|
|
2,446
|
|
0.62
|
|
|
|
HSBC Bank Malaysia
|
|
10,572
|
|
205
|
|
1.94
|
|
11,055
|
|
228
|
|
2.06
|
|
11,865
|
|
264
|
|
2.23
|
|
|
MENA
|
HSBC Bank Middle East
|
|
9,807
|
|
40
|
|
0.41
|
|
10,780
|
|
27
|
|
0.25
|
|
14,360
|
|
53
|
|
0.37
|
|
|
North America
|
HSBC Bank USA
|
|
66,711
|
|
375
|
|
0.56
|
|
64,546
|
|
205
|
|
0.32
|
|
61,314
|
|
147
|
|
0.24
|
|
|
|
HSBC Bank Canada
|
|
38,150
|
|
305
|
|
0.80
|
|
37,125
|
|
194
|
|
0.52
|
|
35,998
|
|
197
|
|
0.55
|
|
|
Latin America
|
HSBC Mexico
|
|
11,662
|
|
406
|
|
3.48
|
|
10,996
|
|
227
|
|
2.06
|
|
12,568
|
|
201
|
|
1.60
|
|
|
|
Brazilian operations
|
|
–
|
|
–
|
|
–
|
|
—
|
|
—
|
|
—
|
|
6,938
|
|
830
|
|
11.96
|
|
|
|
HSBC Bank Argentina
|
|
3,292
|
|
245
|
|
7.44
|
|
2,574
|
|
351
|
|
13.64
|
|
2,989
|
|
436
|
|
14.59
|
|
|
Other operations
|
|
|
33,092
|
|
263
|
|
0.79
|
|
31,274
|
|
203
|
|
0.65
|
|
41,169
|
|
167
|
|
0.41
|
|
|
|
|
|
1,094,920
|
|
5,405
|
|
0.49
|
|
1,074,661
|
|
5,492
|
|
0.51
|
|
1,075,901
|
|
7,401
|
|
0.69
|
|
|
Repurchase agreements – non-trading
|
|
|
|
|
|
|
|
|
|
|
|
|
|
|
|
|
|
|
|
|
|
Europe
|
HSBC Bank
|
|
39,444
|
|
340
|
|
0.86
|
|
29,171
|
|
88
|
|
0.30
|
|
31,782
|
|
119
|
|
0.37
|
|
|
|
HSBC France
|
|
6,664
|
|
–
|
|
–
|
|
7,145
|
|
—
|
|
—
|
|
8,965
|
|
2
|
|
0.02
|
|
|
Asia
|
Hang Seng Bank
|
|
837
|
|
23
|
|
2.75
|
|
410
|
|
9
|
|
2.20
|
|
203
|
|
4
|
|
1.97
|
|
|
|
The Hongkong and Shanghai
Banking Corporation |
|
6,028
|
|
118
|
|
1.96
|
|
5,130
|
|
111
|
|
2.16
|
|
3,022
|
|
70
|
|
2.32
|
|
|
|
HSBC Bank Malaysia
|
|
18
|
|
–
|
|
–
|
|
23
|
|
1
|
|
4.35
|
|
43
|
|
1
|
|
2.33
|
|
|
MENA
|
HSBC Bank Middle East
|
|
32
|
|
1
|
|
3.13
|
|
—
|
|
—
|
|
—
|
|
—
|
|
—
|
|
—
|
|
|
North America
|
HSBC Bank USA
|
|
3,690
|
|
57
|
|
1.54
|
|
3,543
|
|
30
|
|
0.85
|
|
6,828
|
|
26
|
|
0.38
|
|
|
|
HSBC Bank Canada
|
|
3,702
|
|
30
|
|
0.81
|
|
2,933
|
|
14
|
|
0.48
|
|
2,534
|
|
17
|
|
0.67
|
|
|
Latin America
|
HSBC Mexico
|
|
3,845
|
|
259
|
|
6.74
|
|
2,085
|
|
94
|
|
4.51
|
|
2,127
|
|
62
|
|
2.91
|
|
|
|
Brazilian operations
|
|
–
|
|
–
|
|
–
|
|
—
|
|
—
|
|
—
|
|
334
|
|
6
|
|
1.80
|
|
|
|
HSBC Bank Argentina
|
|
15
|
|
3
|
|
20.00
|
|
7
|
|
2
|
|
28.57
|
|
5
|
|
—
|
|
—
|
|
|
Other operations
|
|
|
72,286
|
|
834
|
|
1.15
|
|
68,342
|
|
277
|
|
0.41
|
|
62,104
|
|
48
|
|
0.08
|
|
|
|
|
|
136,561
|
|
1,665
|
|
1.22
|
|
118,789
|
|
626
|
|
0.53
|
|
117,947
|
|
355
|
|
0.30
|
|
|
HSBC Holdings plc
|
53
|
Report of the Directors
| Financial summary
|
Equity and liabilities (continued)
|
||||||||||||||||||||
|
2017
|
2016
|
2015
|
||||||||||||||||||
|
Average
balance
|
|
Interest
expense
|
|
Cost
|
|
Average
balance
|
|
Interest
expense
|
|
Cost
|
|
Average
balance
|
|
Interest
expense
|
|
Cost
|
|
|||
|
|
Footnotes
|
$m
|
|
$m
|
|
%
|
|
$m
|
|
$m
|
|
%
|
|
$m
|
|
$m
|
|
%
|
|
|
|
Debt securities in issue
|
|
|
|
|
|
|
|
|
|
|
|
|
|
|
|
|
|
|
||
|
Europe
|
HSBC Holdings
|
43,121
|
|
1,533
|
|
3.56
|
|
25,145
|
|
1,087
|
|
4.32
|
|
16,230
|
|
904
|
|
5.57
|
|
|
|
|
HSBC Bank
|
15,590
|
|
355
|
|
2.28
|
|
27,290
|
|
397
|
|
1.45
|
|
41,413
|
|
359
|
|
0.87
|
|
|
|
|
HSBC France
|
7,367
|
|
4
|
|
0.05
|
|
7,471
|
|
11
|
|
0.15
|
|
12,379
|
|
40
|
|
0.32
|
|
|
|
Asia
|
Hang Seng Bank
|
78
|
|
3
|
|
3.85
|
|
208
|
|
6
|
|
2.88
|
|
428
|
|
7
|
|
1.64
|
|
|
|
|
The Hongkong and Shanghai
Banking Corporation |
3,588
|
|
75
|
|
2.09
|
|
4,245
|
|
88
|
|
2.07
|
|
5,520
|
|
123
|
|
2.23
|
|
|
|
|
HSBC Bank Malaysia
|
259
|
|
11
|
|
4.25
|
|
363
|
|
15
|
|
4.13
|
|
385
|
|
17
|
|
4.42
|
|
|
|
MENA
|
HSBC Bank Middle East
|
1,329
|
|
20
|
|
1.50
|
|
1,793
|
|
20
|
|
1.12
|
|
2,199
|
|
33
|
|
1.50
|
|
|
|
North America
|
HSBC Bank USA
|
27,017
|
|
678
|
|
2.51
|
|
35,571
|
|
690
|
|
1.94
|
|
31,089
|
|
542
|
|
1.74
|
|
|
|
|
HSBC Finance
|
2,512
|
|
168
|
|
6.69
|
|
4,577
|
|
266
|
|
5.81
|
|
8,961
|
|
407
|
|
4.54
|
|
|
|
|
HSBC Bank Canada
|
7,466
|
|
163
|
|
2.18
|
|
8,026
|
|
192
|
|
2.39
|
|
8,718
|
|
211
|
|
2.42
|
|
|
|
Latin America
|
HSBC Mexico
|
1,198
|
|
77
|
|
6.43
|
|
928
|
|
60
|
|
6.47
|
|
2,005
|
|
90
|
|
4.49
|
|
|
|
|
Brazilian operations
|
–
|
|
–
|
|
–
|
|
—
|
|
—
|
|
—
|
|
4,795
|
|
782
|
|
16.31
|
|
|
|
|
HSBC Bank Argentina
|
55
|
|
15
|
|
27.27
|
|
—
|
|
—
|
|
—
|
|
—
|
|
—
|
|
—
|
|
|
|
Other operations
|
|
(903
|
)
|
28
|
|
–
|
|
(1,274
|
)
|
(25
|
)
|
|
|
(5,083
|
)
|
6
|
|
|
|
|
|
|
108,677
|
|
3,130
|
|
2.88
|
|
114,343
|
|
2,807
|
|
2.45
|
|
129,039
|
|
3,521
|
|
2.73
|
|
||
|
Other interest-bearing liabilities
|
|
|
|
|
|
|
|
|
|
|
|
|
|
|
|
|
|
|
||
|
Europe
|
HSBC Bank
|
72,281
|
|
942
|
|
1.30
|
|
79,358
|
|
732
|
|
0.92
|
|
77,583
|
|
471
|
|
0.61
|
|
|
|
|
HSBC Private Banking Holdings (Suisse)
|
7,358
|
|
122
|
|
1.66
|
|
6,885
|
|
100
|
|
1.45
|
|
8,347
|
|
94
|
|
1.13
|
|
|
|
|
HSBC France
|
12,081
|
|
453
|
|
3.75
|
|
8,371
|
|
276
|
|
3.30
|
|
10,481
|
|
112
|
|
1.07
|
|
|
|
Asia
|
Hang Seng Bank
|
921
|
|
27
|
|
2.93
|
|
1,338
|
|
30
|
|
2.24
|
|
1,899
|
|
35
|
|
1.84
|
|
|
|
|
The Hongkong and Shanghai
Banking Corporation |
106,795
|
|
1,133
|
|
1.06
|
|
81,764
|
|
598
|
|
0.73
|
|
78,630
|
|
412
|
|
0.52
|
|
|
|
|
HSBC Bank Malaysia
|
784
|
|
18
|
|
2.30
|
|
771
|
|
14
|
|
1.82
|
|
1,158
|
|
15
|
|
1.30
|
|
|
|
MENA
|
HSBC Bank Middle East
|
2,414
|
|
73
|
|
3.02
|
|
2,994
|
|
82
|
|
2.74
|
|
2,429
|
|
46
|
|
1.89
|
|
|
|
North America
|
HSBC Bank USA
|
19,479
|
|
241
|
|
1.24
|
|
20,187
|
|
152
|
|
0.75
|
|
16,250
|
|
81
|
|
0.50
|
|
|
|
|
HSBC Finance
|
1,059
|
|
50
|
|
4.72
|
|
4,936
|
|
173
|
|
3.50
|
|
5,807
|
|
241
|
|
4.15
|
|
|
|
|
HSBC Bank Canada
|
3,478
|
|
67
|
|
1.93
|
|
3,759
|
|
63
|
|
1.68
|
|
2,539
|
|
7
|
|
0.28
|
|
|
|
Latin America
|
HSBC Mexico
|
61
|
|
25
|
|
40.98
|
|
782
|
|
22
|
|
2.81
|
|
837
|
|
16
|
|
1.91
|
|
|
|
|
Brazilian operations
|
–
|
|
–
|
|
–
|
|
18,936
|
|
1,748
|
|
9.23
|
|
16,943
|
|
1,897
|
|
11.20
|
|
|
|
|
HSBC Bank Argentina
|
97
|
|
4
|
|
4.12
|
|
53
|
|
5
|
|
9.43
|
|
22
|
|
4
|
|
18.18
|
|
|
|
Other operations
|
|
(219,799
|
)
|
(2,248
|
)
|
|
|
(207,747
|
)
|
(1,603
|
)
|
|
|
(194,529
|
)
|
(1,145
|
)
|
|
|
|
|
|
7,009
|
|
907
|
|
12.94
|
|
22,387
|
|
2,392
|
|
10.68
|
|
28,396
|
|
2,286
|
|
8.05
|
|
||
|
Total interest-bearing liabilities
|
|
|
|
|
|
|
|
|
|
|
|
|
|
|
|
|
|
|
||
|
Europe
|
HSBC Holdings
|
73,627
|
|
2,477
|
|
3.36
|
|
52,045
|
|
1,696
|
|
3.26
|
|
35,046
|
|
1,167
|
|
3.33
|
|
|
|
|
HSBC Bank
|
492,091
|
|
3,091
|
|
0.63
|
|
516,093
|
|
3,104
|
|
0.60
|
|
552,372
|
|
3,391
|
|
0.61
|
|
|
|
|
HSBC Private Banking Holdings (Suisse)
|
14,145
|
|
194
|
|
1.37
|
|
13,199
|
|
133
|
|
1.01
|
|
15,948
|
|
124
|
|
0.78
|
|
|
|
|
HSBC France
|
61,255
|
|
587
|
|
0.96
|
|
54,025
|
|
428
|
|
0.79
|
|
63,520
|
|
342
|
|
0.54
|
|
|
|
Asia
|
Hang Seng Bank
|
118,130
|
|
361
|
|
0.31
|
|
114,000
|
|
395
|
|
0.35
|
|
110,411
|
|
533
|
|
0.48
|
|
|
|
|
The Hongkong and Shanghai
Banking Corporation |
574,958
|
|
3,416
|
|
0.59
|
|
532,717
|
|
2,903
|
|
0.54
|
|
500,911
|
|
3,131
|
|
0.63
|
|
|
|
|
HSBC Bank Malaysia
|
11,905
|
|
239
|
|
2.01
|
|
12,572
|
|
262
|
|
2.08
|
|
14,425
|
|
323
|
|
2.24
|
|
|
|
MENA
|
HSBC Bank Middle East
|
14,277
|
|
144
|
|
1.01
|
|
16,059
|
|
133
|
|
0.83
|
|
20,580
|
|
148
|
|
0.72
|
|
|
|
North America
|
HSBC Bank USA
|
122,639
|
|
1,436
|
|
1.17
|
|
131,202
|
|
1,145
|
|
0.87
|
|
123,084
|
|
845
|
|
0.69
|
|
|
|
|
HSBC Finance
|
4,267
|
|
231
|
|
5.41
|
|
11,011
|
|
458
|
|
4.16
|
|
19,937
|
|
695
|
|
3.49
|
|
|
|
|
HSBC Bank Canada
|
53,027
|
|
566
|
|
1.07
|
|
52,201
|
|
464
|
|
0.89
|
|
50,108
|
|
433
|
|
0.86
|
|
|
|
Latin America
|
HSBC Mexico
|
18,586
|
|
887
|
|
4.77
|
|
16,422
|
|
473
|
|
2.88
|
|
19,043
|
|
424
|
|
2.23
|
|
|
|
|
Brazilian operations
|
–
|
|
–
|
|
–
|
|
18,936
|
|
1,748
|
|
9.23
|
|
30,034
|
|
3,564
|
|
11.87
|
|
|
|
|
HSBC Bank Argentina
|
3,462
|
|
268
|
|
7.74
|
|
2,636
|
|
358
|
|
13.58
|
|
3,026
|
|
442
|
|
14.61
|
|
|
|
Other operations
|
|
(107,299
|
)
|
(1,078
|
)
|
|
|
(101,114
|
)
|
(1,099
|
)
|
|
|
(92,810
|
)
|
(904
|
)
|
|
|
|
|
|
1,455,070
|
|
12,819
|
|
0.88
|
|
1,442,004
|
|
12,601
|
|
0.87
|
|
1,465,635
|
|
14,658
|
|
1.00
|
|
||
For footnotes, see page
85
.
|
54
|
HSBC Holdings plc
|
|
Net interest margin
44d
|
|||||||
|
2017
|
|
2016
|
2015
|
||||
|
%
|
|
%
|
|
%
|
|
||
|
Europe
|
HSBC Bank
|
1.29
|
|
1.46
|
|
1.53
|
|
|
|
HSBC Private Banking Holdings (Suisse)
|
0.16
|
|
0.31
|
|
0.35
|
|
|
|
HSBC France
|
0.75
|
|
0.90
|
|
1.36
|
|
|
Asia
|
Hang Seng Bank
|
2.12
|
|
2.00
|
|
2.03
|
|
|
|
The Hongkong and Shanghai Banking Corporation
|
1.53
|
|
1.40
|
|
1.46
|
|
|
|
HSBC Bank Malaysia
|
2.72
|
|
2.59
|
|
2.56
|
|
|
MENA
|
HSBC Bank Middle East
|
2.66
|
|
2.57
|
|
2.46
|
|
|
North America
|
HSBC Bank USA
|
1.44
|
|
1.37
|
|
1.39
|
|
|
|
HSBC Finance
|
0.34
|
|
3.95
|
|
3.76
|
|
|
|
HSBC Bank Canada
|
1.50
|
|
1.40
|
|
1.56
|
|
|
Latin America
|
HSBC Mexico
|
5.73
|
|
5.89
|
|
5.25
|
|
|
|
Brazilian operations
|
–
|
|
3.71
|
|
5.58
|
|
|
|
HSBC Bank Argentina
|
10.71
|
|
12.32
|
|
11.52
|
|
|
Total
|
1.63
|
|
1.73
|
|
1.88
|
|
|
|
Distribution of average total assets
|
|||||||
|
2017
|
|
2016
|
|
2015
|
|
||
|
%
|
|
%
|
|
%
|
|
||
|
Europe
|
HSBC Bank
|
34.7
|
|
36.9
|
|
37.0
|
|
|
|
HSBC Private Banking Holdings (Suisse)
|
1.2
|
|
1.2
|
|
1.4
|
|
|
|
HSBC France
|
7.4
|
|
6.9
|
|
7.4
|
|
|
Asia
|
Hang Seng Bank
|
7.2
|
|
6.7
|
|
6.5
|
|
|
|
The Hongkong and Shanghai Banking Corporation
|
34.2
|
|
32.2
|
|
30.0
|
|
|
|
HSBC Bank Malaysia
|
0.8
|
|
0.8
|
|
0.9
|
|
|
MENA
|
HSBC Bank Middle East
|
1.5
|
|
1.6
|
|
1.9
|
|
|
North America
|
HSBC Bank USA
|
9.5
|
|
10.1
|
|
9.6
|
|
|
|
HSBC Finance
|
0.4
|
|
0.8
|
|
1.2
|
|
|
|
HSBC Bank Canada
|
2.9
|
|
2.9
|
|
2.8
|
|
|
Latin America
|
HSBC Mexico
|
—
|
|
1.3
|
|
1.4
|
|
|
|
Brazilian operations
|
—
|
|
1.2
|
|
2.0
|
|
|
|
HSBC Bank Argentina
|
—
|
|
—
|
|
—
|
|
|
Other operations (including consolidation adjustments)
|
0.2
|
|
(2.6
|
)
|
(2.1
|
)
|
|
|
100.0
|
|
100.0
|
|
100.0
|
|
||
For footnote, see page
85
.
|
HSBC Holdings plc
|
55
|
Report of the Directors
| Financial summary
Analysis of changes in net interest income and net interest expense
The following tables allocate changes in net interest income and net interest expense between volume and rate for
2017
compared
with
2016
, and for
2016
compared with
2015
. We isolate volume variances and allocate any change arising from both volume and rate to rate.
|
Interest income
|
|||||||||||||||
|
Increase/(decrease)
in 2017 compared with 2016 |
Increase/(decrease)
in 2016 compared with 2015 |
||||||||||||||
|
2017
|
|
Volume
|
|
Rate
|
|
2016
|
Volume
|
|
Rate
|
|
2015
|
|
|||
|
|
|
$m
|
|
$m
|
|
$m
|
|
$m
|
|
$m
|
|
$m
|
|
$m
|
|
|
Short-term funds and loans and advances to banks
|
|
|
|
|
|
|
|
|
|
|
|
|
|
|
|
|
Europe
|
HSBC Bank
|
256
|
|
65
|
|
(85
|
)
|
276
|
|
(116
|
)
|
(435
|
)
|
827
|
|
|
|
HSBC Private Banking Holdings (Suisse)
|
1
|
|
–
|
|
1
|
|
—
|
|
—
|
|
(4
|
)
|
4
|
|
|
|
HSBC France
|
41
|
|
36
|
|
(22
|
)
|
27
|
|
4
|
|
(17
|
)
|
40
|
|
|
Asia
|
Hang Seng Bank
|
201
|
|
4
|
|
64
|
|
133
|
|
(56
|
)
|
(21
|
)
|
210
|
|
|
|
The Hongkong and Shanghai
Banking Corporation |
604
|
|
27
|
|
87
|
|
490
|
|
(50
|
)
|
4
|
|
536
|
|
|
|
HSBC Bank Malaysia
|
55
|
|
(48
|
)
|
4
|
|
99
|
|
(10
|
)
|
(12
|
)
|
121
|
|
|
MENA
|
HSBC Bank Middle East
|
39
|
|
(9
|
)
|
18
|
|
30
|
|
(8
|
)
|
8
|
|
30
|
|
|
North America
|
HSBC Bank USA
|
461
|
|
34
|
|
213
|
|
214
|
|
(2
|
)
|
82
|
|
134
|
|
|
|
HSBC Bank Canada
|
3
|
|
(1
|
)
|
2
|
|
2
|
|
(1
|
)
|
1
|
|
2
|
|
|
Latin America
|
HSBC Mexico
|
150
|
|
(2
|
)
|
60
|
|
92
|
|
(8
|
)
|
24
|
|
76
|
|
|
|
Brazilian operations
|
–
|
|
–
|
|
–
|
|
—
|
|
(193
|
)
|
—
|
|
193
|
|
|
|
HSBC Bank Argentina
|
1
|
|
3
|
|
(10
|
)
|
8
|
|
(1
|
)
|
5
|
|
4
|
|
|
Other operations
|
|
218
|
|
23
|
|
56
|
|
139
|
|
124
|
|
(85
|
)
|
100
|
|
|
|
|
2,030
|
|
239
|
|
281
|
|
1,510
|
|
(187
|
)
|
(580
|
)
|
2,277
|
|
|
Loans and advances to customers
|
|
|
|
|
|
|
|
|
|
|
|
|
|
|
|
|
Europe
|
HSBC Bank
|
8,046
|
|
89
|
|
(1,246
|
)
|
9,203
|
|
(453
|
)
|
(260
|
)
|
9,916
|
|
|
|
HSBC Private Banking Holdings (Suisse)
|
152
|
|
(22
|
)
|
31
|
|
143
|
|
(17
|
)
|
24
|
|
136
|
|
|
|
HSBC France
|
920
|
|
211
|
|
(317
|
)
|
1,026
|
|
43
|
|
(269
|
)
|
1,252
|
|
|
Asia
|
Hang Seng Bank
|
2,695
|
|
230
|
|
(75
|
)
|
2,540
|
|
28
|
|
(67
|
)
|
2,579
|
|
|
|
The Hongkong and Shanghai
Banking Corporation |
8,506
|
|
1,084
|
|
(208
|
)
|
7,630
|
|
(244
|
)
|
(208
|
)
|
8,082
|
|
|
|
HSBC Bank Malaysia
|
536
|
|
(5
|
)
|
(5
|
)
|
546
|
|
(41
|
)
|
(2
|
)
|
589
|
|
|
MENA
|
HSBC Bank Middle East
|
861
|
|
(116
|
)
|
94
|
|
883
|
|
(139
|
)
|
(19
|
)
|
1,041
|
|
|
North America
|
HSBC Bank USA
|
2,210
|
|
(171
|
)
|
194
|
|
2,187
|
|
(27
|
)
|
233
|
|
1,981
|
|
|
|
HSBC Finance
|
173
|
|
(929
|
)
|
13
|
|
1,089
|
|
(662
|
)
|
46
|
|
1,705
|
|
|
|
HSBC Bank Canada
|
1,205
|
|
20
|
|
115
|
|
1,070
|
|
85
|
|
(101
|
)
|
1,086
|
|
|
Latin America
|
HSBC Mexico
|
1,766
|
|
89
|
|
250
|
|
1,427
|
|
(23
|
)
|
131
|
|
1,319
|
|
|
|
Brazilian operations
|
–
|
|
–
|
|
–
|
|
—
|
|
(1,915
|
)
|
—
|
|
1,915
|
|
|
|
HSBC Bank Argentina
|
706
|
|
174
|
|
(183
|
)
|
715
|
|
(192
|
)
|
27
|
|
880
|
|
|
Other operations
|
|
975
|
|
43
|
|
119
|
|
813
|
|
(40
|
)
|
230
|
|
623
|
|
|
|
|
28,751
|
|
1,246
|
|
(1,767
|
)
|
29,272
|
|
(1,614
|
)
|
(2,218
|
)
|
33,104
|
|
|
Reverse repurchase agreements – non-trading
|
|
|
|
|
|
|
|
|
|
|
|
|
|
|
|
|
Europe
|
HSBC Bank
|
502
|
|
(49
|
)
|
246
|
|
305
|
|
(36
|
)
|
(13
|
)
|
354
|
|
|
|
HSBC France
|
1
|
|
1
|
|
(1
|
)
|
1
|
|
(1
|
)
|
(5
|
)
|
7
|
|
|
Asia
|
The Hongkong and Shanghai
Banking Corporation |
596
|
|
77
|
|
221
|
|
298
|
|
67
|
|
(42
|
)
|
273
|
|
|
|
HSBC Bank Malaysia
|
16
|
|
(19
|
)
|
—
|
|
35
|
|
4
|
|
(1
|
)
|
32
|
|
|
MENA
|
HSBC Bank Middle East
|
14
|
|
6
|
|
(1
|
)
|
9
|
|
3
|
|
4
|
|
2
|
|
|
North America
|
HSBC Bank USA
|
124
|
|
(70
|
)
|
63
|
|
131
|
|
35
|
|
73
|
|
23
|
|
|
|
HSBC Bank Canada
|
44
|
|
(4
|
)
|
18
|
|
30
|
|
1
|
|
(11
|
)
|
40
|
|
|
Latin America
|
HSBC Mexico
|
61
|
|
6
|
|
22
|
|
33
|
|
(4
|
)
|
10
|
|
27
|
|
|
|
Brazilian operations
|
—
|
|
—
|
|
—
|
|
—
|
|
(421
|
)
|
—
|
|
421
|
|
|
|
HSBC Bank Argentina
|
15
|
|
2
|
|
—
|
|
13
|
|
3
|
|
3
|
|
7
|
|
|
Other operations
|
|
818
|
|
33
|
|
413
|
|
372
|
|
6
|
|
251
|
|
115
|
|
|
|
|
2,191
|
|
41
|
|
923
|
|
1,227
|
|
47
|
|
(121
|
)
|
1,301
|
|
|
56
|
HSBC Holdings plc
|
|
Interest income (continued)
|
|||||||||||||||
|
Increase/(decrease)
in 2017 compared with 2016 |
Increase/(decrease)
in 2016 compared with 2015 |
||||||||||||||
|
2017
|
|
Volume
|
|
Rate
|
|
2016
|
Volume
|
|
Rate
|
|
2015
|
||||
|
|
|
$m
|
|
$m
|
|
$m
|
|
$m
|
|
$m
|
|
$m
|
|
$m
|
|
|
Financial investments
|
|
|
|
|
|
|
|
|
|
|
|
|
|
||
|
Europe
|
HSBC Bank
|
715
|
|
(237
|
)
|
(13
|
)
|
965
|
|
(19
|
)
|
231
|
|
753
|
|
|
|
HSBC Private Banking Holdings (Suisse)
|
60
|
|
(10
|
)
|
13
|
|
57
|
|
(16
|
)
|
(2
|
)
|
75
|
|
|
|
HSBC France
|
(9
|
)
|
(3
|
)
|
(16
|
)
|
10
|
|
1
|
|
(8
|
)
|
17
|
|
|
Asia
|
Hang Seng Bank
|
776
|
|
9
|
|
81
|
|
686
|
|
155
|
|
(116
|
)
|
647
|
|
|
|
The Hongkong and Shanghai
Banking Corporation |
2,235
|
|
(241
|
)
|
397
|
|
2,079
|
|
372
|
|
(202
|
)
|
1,909
|
|
|
|
HSBC Bank Malaysia
|
96
|
|
39
|
|
(4
|
)
|
61
|
|
(40
|
)
|
(3
|
)
|
104
|
|
|
MENA
|
HSBC Bank Middle East
|
83
|
|
(3
|
)
|
18
|
|
68
|
|
(13
|
)
|
11
|
|
70
|
|
|
North America
|
HSBC Bank USA
|
945
|
|
(99
|
)
|
92
|
|
952
|
|
58
|
|
1
|
|
893
|
|
|
|
HSBC Bank Canada
|
214
|
|
(5
|
)
|
10
|
|
209
|
|
3
|
|
7
|
|
199
|
|
|
Latin America
|
HSBC Mexico
|
296
|
|
41
|
|
21
|
|
234
|
|
(72
|
)
|
20
|
|
286
|
|
|
|
Brazilian operations
|
—
|
|
—
|
|
—
|
|
—
|
|
(515
|
)
|
—
|
|
515
|
|
|
|
HSBC Bank Argentina
|
67
|
|
(56
|
)
|
(19
|
)
|
142
|
|
(5
|
)
|
(2
|
)
|
149
|
|
|
Other operations
|
|
1,962
|
|
115
|
|
62
|
|
1,785
|
|
271
|
|
(377
|
)
|
1,891
|
|
|
|
7,440
|
|
(689
|
)
|
881
|
|
7,248
|
|
659
|
|
(919
|
)
|
7,508
|
|
|
|
Interest expense
|
|||||||||||||||
|
Increase/(decrease)
in 2017 compared with 2016 |
Increase/(decrease)
in 2016 compared with 2015 |
||||||||||||||
|
2017
|
|
Volume
|
|
Rate
|
|
2016
|
|
Volume
|
|
Rate
|
|
2015
|
|||
|
|
|
$m
|
|
$m
|
|
$m
|
|
$m
|
|
$m
|
|
$m
|
|
$m
|
|
|
Deposits by banks
|
|
|
|
|
|
|
|
||||||||
|
Europe
|
HSBC Bank
|
48
|
|
(12
|
)
|
11
|
|
49
|
|
(18
|
)
|
(8
|
)
|
75
|
|
|
|
HSBC Private Banking Holdings (Suisse)
|
2
|
|
–
|
|
–
|
|
2
|
|
(1
|
)
|
2
|
|
1
|
|
|
|
HSBC France
|
29
|
|
7
|
|
(11
|
)
|
33
|
|
1
|
|
(9
|
)
|
41
|
|
|
Asia
|
Hang Seng Bank
|
8
|
|
–
|
|
(3
|
)
|
11
|
|
(9
|
)
|
1
|
|
19
|
|
|
|
The Hongkong and Shanghai
Banking Corporation |
164
|
|
(4
|
)
|
43
|
|
125
|
|
2
|
|
43
|
|
80
|
|
|
|
HSBC Bank Malaysia
|
5
|
|
(1
|
)
|
2
|
|
4
|
|
(16
|
)
|
(6
|
)
|
26
|
|
|
MENA
|
HSBC Bank Middle East
|
10
|
|
2
|
|
4
|
|
4
|
|
(1
|
)
|
2
|
|
3
|
|
|
North America
|
HSBC Bank USA
|
41
|
|
(9
|
)
|
20
|
|
30
|
|
(1
|
)
|
14
|
|
17
|
|
|
|
HSBC Bank Canada
|
1
|
|
–
|
|
–
|
|
1
|
|
—
|
|
—
|
|
1
|
|
|
Latin America
|
HSBC Mexico
|
120
|
|
8
|
|
42
|
|
70
|
|
5
|
|
10
|
|
55
|
|
|
|
Brazilian operations
|
–
|
|
–
|
|
–
|
|
—
|
|
(49
|
)
|
—
|
|
49
|
|
|
|
HSBC Bank Argentina
|
1
|
|
–
|
|
1
|
|
—
|
|
(2
|
)
|
—
|
|
2
|
|
|
Other operations
|
|
22
|
|
13
|
|
(4
|
)
|
13
|
|
(1
|
)
|
5
|
|
9
|
|
|
|
|
451
|
|
(17
|
)
|
126
|
|
342
|
|
(41
|
)
|
5
|
|
378
|
|
|
Customer accounts
|
|
|
|
|
|
|
|
|
|
|
|
||||
|
Europe
|
HSBC Bank
|
1,186
|
|
(44
|
)
|
(383
|
)
|
1,613
|
|
(68
|
)
|
(370
|
)
|
2,051
|
|
|
|
HSBC Private Banking Holdings (Suisse)
|
70
|
|
2
|
|
37
|
|
31
|
|
(4
|
)
|
6
|
|
29
|
|
|
|
HSBC France
|
84
|
|
16
|
|
(25
|
)
|
93
|
|
(9
|
)
|
(14
|
)
|
116
|
|
|
Asia
|
Hang Seng Bank
|
300
|
|
13
|
|
(52
|
)
|
339
|
|
20
|
|
(145
|
)
|
464
|
|
|
|
The Hongkong and Shanghai
Banking Corporation |
1,926
|
|
83
|
|
(138
|
)
|
1,981
|
|
170
|
|
(635
|
)
|
2,446
|
|
|
|
HSBC Bank Malaysia
|
205
|
|
(10
|
)
|
(13
|
)
|
228
|
|
(18
|
)
|
(18
|
)
|
264
|
|
|
MENA
|
HSBC Bank Middle East
|
40
|
|
(2
|
)
|
15
|
|
27
|
|
(13
|
)
|
(13
|
)
|
53
|
|
|
North America
|
HSBC Bank USA
|
375
|
|
7
|
|
163
|
|
205
|
|
8
|
|
50
|
|
147
|
|
|
|
HSBC Bank Canada
|
305
|
|
5
|
|
106
|
|
194
|
|
6
|
|
(9
|
)
|
197
|
|
|
Latin America
|
HSBC Mexico
|
406
|
|
14
|
|
165
|
|
227
|
|
(25
|
)
|
51
|
|
201
|
|
|
|
Brazilian operations
|
–
|
|
–
|
|
–
|
|
—
|
|
(830
|
)
|
—
|
|
830
|
|
|
|
HSBC Bank Argentina
|
245
|
|
98
|
|
(204
|
)
|
351
|
|
(61
|
)
|
(24
|
)
|
436
|
|
|
Other operations
|
|
263
|
|
12
|
|
48
|
|
203
|
|
(41
|
)
|
77
|
|
167
|
|
|
|
|
5,405
|
|
103
|
|
(190
|
)
|
5,492
|
|
(9
|
)
|
(1,900
|
)
|
7,401
|
|
|
HSBC Holdings plc
|
57
|
Report of the Directors
| Financial summary
|
Interest expense (continued)
|
|||||||||||||||
|
Increase/(decrease)
in 2017 compared with 2016 |
Increase/(decrease)
in 2016 compared with 2015 |
||||||||||||||
|
2017
|
|
Volume
|
|
Rate
|
|
2016
|
|
Volume
|
|
Rate
|
|
2015
|
|||
|
|
|
$m
|
|
$m
|
|
$m
|
|
$m
|
|
$m
|
|
$m
|
|
$m
|
|
|
Repurchase agreements – non-trading
|
|
|
|
|
|
|
|
|
|
|
|
|
|
|
|
|
Europe
|
HSBC Bank
|
340
|
|
31
|
|
221
|
|
88
|
|
(10
|
)
|
(21
|
)
|
119
|
|
|
|
HSBC France
|
–
|
|
–
|
|
–
|
|
—
|
|
—
|
|
(2
|
)
|
2
|
|
|
Asia
|
Hang Seng Bank
|
23
|
|
9
|
|
5
|
|
9
|
|
4
|
|
1
|
|
4
|
|
|
|
The Hongkong and Shanghai
Banking Corporation |
118
|
|
19
|
|
(12
|
)
|
111
|
|
49
|
|
(8
|
)
|
70
|
|
|
|
HSBC Bank Malaysia
|
–
|
|
–
|
|
(1
|
)
|
1
|
|
—
|
|
—
|
|
1
|
|
|
HSBC Bank Middle East
|
1
|
|
–
|
|
1
|
|
—
|
|
—
|
|
—
|
|
—
|
|
|
|
North America
|
HSBC Bank USA
|
57
|
|
1
|
|
26
|
|
30
|
|
(12
|
)
|
16
|
|
26
|
|
|
|
HSBC Bank Canada
|
30
|
|
4
|
|
12
|
|
14
|
|
3
|
|
(6
|
)
|
17
|
|
|
Latin America
|
HSBC Mexico
|
259
|
|
79
|
|
86
|
|
94
|
|
(1
|
)
|
33
|
|
62
|
|
|
|
Brazilian operations
|
–
|
|
–
|
|
–
|
|
—
|
|
(6
|
)
|
—
|
|
6
|
|
|
|
HSBC Bank Argentina
|
3
|
|
2
|
|
(1
|
)
|
2
|
|
—
|
|
2
|
|
—
|
|
|
Other operations
|
|
834
|
|
16
|
|
541
|
|
277
|
|
5
|
|
224
|
|
48
|
|
|
1,665
|
|
94
|
|
945
|
|
626
|
|
3
|
|
268
|
|
355
|
|
||
|
Debt securities in issue
|
|
|
|
|
|
|
|
|
|
|
|
|
|
|
|
|
Europe
|
HSBC Holdings
|
1,533
|
|
777
|
|
(331
|
)
|
1,087
|
|
497
|
|
(314
|
)
|
904
|
|
|
|
HSBC Bank
|
355
|
|
(170
|
)
|
128
|
|
397
|
|
(123
|
)
|
161
|
|
359
|
|
|
|
HSBC France
|
4
|
|
–
|
|
(7
|
)
|
11
|
|
(16
|
)
|
(13
|
)
|
40
|
|
|
Asia
|
Hang Seng Bank
|
3
|
|
(4
|
)
|
1
|
|
6
|
|
(4
|
)
|
3
|
|
7
|
|
|
|
The Hongkong and Shanghai
Banking Corporation |
75
|
|
(14
|
)
|
1
|
|
88
|
|
(28
|
)
|
(7
|
)
|
123
|
|
|
|
HSBC Bank Malaysia
|
11
|
|
(4
|
)
|
–
|
|
15
|
|
(1
|
)
|
(1
|
)
|
17
|
|
|
MENA
|
HSBC Bank Middle East
|
20
|
|
(5
|
)
|
5
|
|
20
|
|
(6
|
)
|
(7
|
)
|
33
|
|
|
North America
|
HSBC Bank USA
|
678
|
|
(166
|
)
|
154
|
|
690
|
|
78
|
|
70
|
|
542
|
|
|
|
HSBC Finance
|
168
|
|
(120
|
)
|
22
|
|
266
|
|
(199
|
)
|
58
|
|
407
|
|
|
|
HSBC Bank Canada
|
163
|
|
(13
|
)
|
(16
|
)
|
192
|
|
(17
|
)
|
(2
|
)
|
211
|
|
|
Latin America
|
HSBC Mexico
|
77
|
|
17
|
|
–
|
|
60
|
|
(48
|
)
|
18
|
|
90
|
|
|
|
Brazilian operations
|
—
|
|
–
|
|
—
|
|
—
|
|
(782
|
)
|
—
|
|
782
|
|
|
HSBC Bank Argentina
|
15
|
|
—
|
|
15
|
|
—
|
|
—
|
|
—
|
|
—
|
|
|
|
Other operations
|
|
28
|
|
–
|
|
53
|
|
(25
|
)
|
—
|
|
(31
|
)
|
6
|
|
|
3,130
|
|
(139
|
)
|
462
|
|
2,807
|
|
(401
|
)
|
(313
|
)
|
3,521
|
|
||
|
58
|
HSBC Holdings plc
|
Short-term borrowings
Short-term borrowings in the form of repurchase agreements – non-trading are shown separately on the face of the balance sheet. Other forms of short-term borrowings are included within customer accounts, deposits by banks, debt securities in issue and trading liabilities. Short-term borrowings are defined by the US Securities and Exchange Commission as Federal funds purchased and securities sold under agreements to repurchase, commercial paper and other short-term borrowings.
Our only significant short-term borrowings are securities sold under agreements to repurchase and certain debt securities in issue. For securities sold under agreements to repurchase, we run matched repo and reverse repo trading books. We generally observe lower year-end demand in our reverse repo lending business, which results in lower repo balances at the balance sheet date. Additional information on these is provided in the table below.
|
Repos and short-term bonds
|
||||||
|
|
2017
|
|
2016
|
|
2015
|
|
|
|
$m
|
|
$m
|
|
$m
|
|
|
Securities sold under agreements to repurchase
|
|
|
|
|
||
|
Outstanding at 31 December
|
132,257
|
|
90,386
|
|
80,842
|
|
|
Average amount outstanding during the year
|
138,957
|
|
119,850
|
|
120,241
|
|
|
Maximum quarter-end balance outstanding during the year
|
148,259
|
|
110,362
|
|
120,141
|
|
|
Weighted average interest rate during the year
|
1.2%
|
|
0.5%
|
|
0.4%
|
|
|
Weighted average interest rate at the year-end
|
1.4%
|
|
0.8%
|
|
0.8%
|
|
|
Short-term bonds
|
|
|
||||
|
Outstanding at 31 December
|
25,874
|
|
24,580
|
|
36,614
|
|
|
Average amount outstanding during the year
|
27,283
|
|
24,359
|
|
40,449
|
|
|
Maximum quarter-end balance outstanding during the year
|
29,885
|
|
25,946
|
|
42,483
|
|
|
Weighted average interest rate during the year
|
1.3%
|
|
1.4%
|
|
1.3%
|
|
|
Weighted average interest rate at the year-end
|
1.7%
|
|
1.4%
|
|
1.2%
|
|
|
HSBC Holdings plc
|
59
|
Report of the Directors
| Financial summary
Contractual obligations
The table below provides details of our material contractual obligations at 31 December 2017.
|
Payments due by period
|
||||||||||
|
Total
|
|
Less than 1 year
|
|
1-3 years
|
|
3-5 years
|
|
More than 5 years
|
|
|
|
$m
|
|
$m
|
|
$m
|
|
$m
|
|
$m
|
|
|
|
Long-term debt obligations
|
196,844
|
|
38,449
|
|
37,040
|
|
46,348
|
|
75,007
|
|
|
Term deposits and certificates of deposit
|
97,696
|
|
85,479
|
|
8,963
|
|
1,533
|
|
1,721
|
|
|
Capital (finance) lease obligations
|
26
|
|
3
|
|
4
|
|
4
|
|
15
|
|
|
Operating lease obligations
|
3,950
|
|
850
|
|
1,231
|
|
780
|
|
1,089
|
|
|
Purchase obligations
|
1,131
|
|
1,040
|
|
5
|
|
34
|
|
52
|
|
|
Short positions in debt securities and equity shares
|
67,735
|
|
67,572
|
|
48
|
|
26
|
|
89
|
|
|
Current tax liability
|
928
|
|
928
|
|
—
|
|
—
|
|
—
|
|
|
Pension/healthcare obligation
|
15,302
|
|
1,341
|
|
2,876
|
|
3,090
|
|
7,995
|
|
|
383,612
|
|
195,662
|
|
50,167
|
|
51,815
|
|
85,968
|
|
|
Loan maturity and interest sensitivity analysis
At 31 December 2017, the geographical analysis of loan maturity and interest sensitivity by loan type on a contractual repayment basis was as follows.
|
|
Europe
|
|
Asia
|
|
MENA
|
|
North America
|
|
Latin America
|
|
Total
|
|
|
|
$m
|
|
$m
|
|
$m
|
|
$m
|
|
$m
|
|
$m
|
|
|
Maturity of 1 year or less
|
|
|
|
|
|
|
|
|
|
|
|
|
|
Loans and advances to banks
|
9,806
|
|
50,364
|
|
6,347
|
|
10,703
|
|
3,471
|
|
80,691
|
|
|
Commercial loans to customers
|
|
|
|
|
|
|
||||||
|
– manufacturing and international trade and services
|
47,957
|
|
91,713
|
|
8,912
|
|
9,479
|
|
3,874
|
|
161,935
|
|
|
– real estate and other property related
|
10,496
|
|
26,843
|
|
1,562
|
|
6,593
|
|
388
|
|
45,882
|
|
|
– non-bank financial institutions
|
21,123
|
|
17,150
|
|
457
|
|
7,470
|
|
367
|
|
46,567
|
|
|
– governments
|
1,152
|
|
884
|
|
1,239
|
|
282
|
|
192
|
|
3,749
|
|
|
– other commercial
|
26,010
|
|
19,349
|
|
1,701
|
|
5,545
|
|
1,723
|
|
54,328
|
|
|
|
106,738
|
|
155,939
|
|
13,871
|
|
29,369
|
|
6,544
|
|
312,461
|
|
|
Maturity after 1 year but within 5 years
|
|
|
|
|
|
|
|
|
|
|
|
|
|
Loans and advances to banks
|
4,107
|
|
3,951
|
|
156
|
|
76
|
|
—
|
|
8,290
|
|
|
Commercial loans to customers
|
|
|
|
|
|
|
||||||
|
– manufacturing and international trade and services
|
36,673
|
|
22,483
|
|
3,405
|
|
13,400
|
|
2,087
|
|
78,048
|
|
|
– real estate and other property related
|
20,769
|
|
50,317
|
|
574
|
|
8,542
|
|
906
|
|
81,108
|
|
|
– non-bank financial institutions
|
7,803
|
|
8,142
|
|
614
|
|
3,352
|
|
913
|
|
20,824
|
|
|
– governments
|
1,427
|
|
4,413
|
|
121
|
|
53
|
|
5
|
|
6,019
|
|
|
– other commercial
|
15,232
|
|
18,463
|
|
1,612
|
|
5,044
|
|
952
|
|
41,303
|
|
|
|
81,904
|
|
103,818
|
|
6,326
|
|
30,391
|
|
4,863
|
|
227,302
|
|
|
Interest rate sensitivity of loans and advances to banks and commercial loans to customers
|
|
|
|
|
|
|
|
|
|
|
|
|
|
Fixed interest rate
|
17,759
|
|
1,192
|
|
2,037
|
|
4,393
|
|
610
|
|
25,991
|
|
|
Variable interest rate
|
68,254
|
|
106,576
|
|
4,446
|
|
26,074
|
|
4,253
|
|
209,603
|
|
|
|
86,013
|
|
107,768
|
|
6,483
|
|
30,467
|
|
4,863
|
|
235,594
|
|
|
Maturity after 5 years
|
|
|
|
|
|
|
|
|
|
|
||
|
Loans and advances to banks
|
268
|
|
1,103
|
|
—
|
|
41
|
|
—
|
|
1,412
|
|
|
Commercial loans to customers
|
|
|
|
|
|
|
||||||
|
– manufacturing and international trade and services
|
9,617
|
|
2,419
|
|
649
|
|
1,896
|
|
520
|
|
15,101
|
|
|
– real estate and other property related
|
2,675
|
|
9,249
|
|
371
|
|
1,781
|
|
581
|
|
14,657
|
|
|
– non-bank financial institutions
|
3,167
|
|
1,019
|
|
36
|
|
104
|
|
2
|
|
4,328
|
|
|
– governments
|
1,040
|
|
470
|
|
6
|
|
71
|
|
373
|
|
1,960
|
|
|
– other commercial
|
9,470
|
|
4,345
|
|
1,370
|
|
2,226
|
|
747
|
|
18,158
|
|
|
|
25,969
|
|
17,502
|
|
2,432
|
|
6,078
|
|
2,223
|
|
54,204
|
|
|
Interest rate sensitivity of loans and advances to banks and commercial loans to customers
|
|
|
|
|
|
|
|
|
|
|
||
|
Fixed interest rate
|
5,654
|
|
1,281
|
|
855
|
|
994
|
|
90
|
|
8,874
|
|
|
Variable interest rate
|
20,583
|
|
17,324
|
|
1,577
|
|
5,126
|
|
2,133
|
|
46,743
|
|
|
|
26,237
|
|
18,605
|
|
2,432
|
|
6,120
|
|
2,223
|
|
55,617
|
|
|
60
|
HSBC Holdings plc
|
Deposits
The following tables summarise the average amount of bank deposits, customer deposits and certificates of deposit (‘CDs’) and other money market instruments (that are included within ‘Debt securities in issue’ in the balance sheet), together with the average
interest rates paid thereon for each of the past three years. The geographical analysis of average deposits is based on the location of the office in which the deposits are recorded and excludes balances with HSBC companies.
|
Deposits by banks
|
|
|
||||||||
|
|
2017
|
2016
|
2015
|
|||||||
|
|
Average
balance |
|
Average
rate |
Average balance
|
|
Average
rate |
Average
balance
|
|
Average
rate
|
|
|
|
$m
|
|
%
|
$m
|
|
%
|
$m
|
|
%
|
|
|
Europe
|
33,483
|
|
|
32,232
|
|
|
32,297
|
|
||
|
–
demand and other – non-interest bearing
|
12,825
|
|
—
|
11,696
|
|
—
|
8,076
|
|
—
|
|
|
–
demand – interest bearing
|
6,780
|
|
0.4
|
6,730
|
|
0.2
|
5,412
|
|
0.3
|
|
|
–
time
|
11,747
|
|
0.3
|
8,426
|
|
0.4
|
9,833
|
|
0.8
|
|
|
–
other
|
2,131
|
|
1.1
|
5,380
|
|
0.5
|
8,976
|
|
0.2
|
|
|
Asia
|
25,253
|
|
|
26,945
|
|
|
27,618
|
|
||
|
–
demand and other – non-interest bearing
|
5,201
|
|
—
|
5,835
|
|
—
|
6,114
|
|
—
|
|
|
–
demand – interest bearing
|
12,521
|
|
0.5
|
13,230
|
|
0.4
|
16,107
|
|
0.5
|
|
|
–
time
|
3,355
|
|
1.5
|
3,593
|
|
1.9
|
2,209
|
|
1.5
|
|
|
–
other
|
4,176
|
|
1.6
|
4,287
|
|
0.6
|
3,188
|
|
0.5
|
|
|
Middle East and North Africa
|
1,311
|
|
|
1,158
|
|
|
1,548
|
|
||
|
–
demand and other – non-interest bearing
|
430
|
|
—
|
391
|
|
—
|
748
|
|
—
|
|
|
–
demand – interest bearing
|
2
|
|
—
|
8
|
|
—
|
3
|
|
—
|
|
|
–
time
|
871
|
|
3.0
|
742
|
|
2.2
|
775
|
|
0.8
|
|
|
–
other
|
8
|
|
—
|
17
|
|
—
|
22
|
|
—
|
|
|
North America
|
5,721
|
|
|
7,594
|
|
|
9,327
|
|
||
|
–
demand and other – non-interest bearing
|
1,853
|
|
—
|
1,916
|
|
—
|
3,499
|
|
—
|
|
|
–
demand – interest bearing
|
1,744
|
|
0.5
|
2,402
|
|
0.3
|
1,956
|
|
0.2
|
|
|
–
time
|
2,116
|
|
1.6
|
3,185
|
|
0.8
|
3,746
|
|
0.4
|
|
|
–
other
|
8
|
|
—
|
91
|
|
—
|
126
|
|
—
|
|
|
Latin America
|
2,042
|
|
|
1,820
|
|
|
2,719
|
|
||
|
–
demand and other – non-interest bearing
|
164
|
|
—
|
129
|
|
—
|
88
|
|
—
|
|
|
–
demand – interest bearing
|
376
|
|
6.9
|
313
|
|
5.4
|
205
|
|
7.8
|
|
|
–
time
|
1,502
|
|
6.5
|
1,378
|
|
5.7
|
1,905
|
|
4.5
|
|
|
–
other
|
—
|
|
—
|
—
|
|
—
|
521
|
|
10.4
|
|
|
Total
|
67,810
|
|
|
69,749
|
|
|
73,509
|
|
||
|
–
demand and other – non-interest bearing
|
20,473
|
|
—
|
19,967
|
|
—
|
18,525
|
|
—
|
|
|
–
demand – interest bearing
|
21,423
|
|
0.6
|
22,683
|
|
0.4
|
23,683
|
|
0.5
|
|
|
–
time
|
19,591
|
|
1.2
|
17,324
|
|
1.3
|
18,468
|
|
1.2
|
|
|
–
other
|
6,323
|
|
0.4
|
9,775
|
|
0.5
|
12,833
|
|
0.6
|
|
|
HSBC Holdings plc
|
61
|
Report of the Directors
| Financial summary
|
Customer accounts
|
||||||||||||
|
2017
|
2016
|
2015
|
||||||||||
|
Average
balance |
|
Average
rate |
|
Average
balance |
|
Average
rate |
|
Average
balance
|
|
Average
rate
|
|
|
|
$m
|
|
%
|
|
$m
|
|
%
|
|
$m
|
|
%
|
|
|
|
Europe
|
458,710
|
|
|
|
449,033
|
|
|
|
469,799
|
|
||
|
– demand and other – non-interest bearing
|
76,205
|
|
—
|
|
64,779
|
|
—
|
|
72,841
|
|
—
|
|
|
– demand – interest bearing
|
310,887
|
|
0.3
|
|
312,808
|
|
0.3
|
|
316,055
|
|
0.4
|
|
|
– savings
|
39,488
|
|
0.4
|
|
39,032
|
|
0.5
|
|
44,010
|
|
0.6
|
|
|
– time
|
30,939
|
|
0.8
|
|
31,309
|
|
0.7
|
|
35,198
|
|
0.8
|
|
|
– other
|
1,191
|
|
1.8
|
|
1,105
|
|
2.4
|
|
1,695
|
|
2.0
|
|
|
Asia
|
639,925
|
|
613,303
|
|
|
|
590,436
|
|
||||
|
– demand and other – non-interest bearing
|
73,704
|
|
—
|
|
68,772
|
|
—
|
|
67,460
|
|
—
|
|
|
– demand – interest bearing
|
459,067
|
|
0.1
|
|
433,656
|
|
0.1
|
|
399,209
|
|
0.2
|
|
|
– savings
|
87,551
|
|
1.8
|
|
90,175
|
|
2.0
|
|
100,801
|
|
2.3
|
|
|
– time
|
17,183
|
|
1.0
|
|
19,530
|
|
0.8
|
|
22,035
|
|
0.9
|
|
|
– other
|
2,420
|
|
0.3
|
|
1,170
|
|
0.4
|
|
931
|
|
3.7
|
|
|
Middle East and North Africa
|
35,105
|
|
40,036
|
|
|
|
44,826
|
|
||||
|
– demand and other – non-interest bearing
|
17,977
|
|
—
|
|
19,548
|
|
—
|
|
19,989
|
|
—
|
|
|
– demand – interest bearing
|
6,586
|
|
0.5
|
|
9,558
|
|
0.3
|
|
11,303
|
|
0.3
|
|
|
– savings
|
9,734
|
|
2.9
|
|
10,034
|
|
3.5
|
|
12,178
|
|
3.9
|
|
|
– time
|
808
|
|
1.6
|
|
896
|
|
4.1
|
|
1,356
|
|
4.1
|
|
|
– other
|
—
|
|
—
|
|
—
|
|
—
|
|
—
|
|
—
|
|
|
North America
|
141,192
|
|
140,491
|
|
|
|
136,773
|
|
||||
|
– demand and other – non-interest bearing
|
28,542
|
|
—
|
|
30,350
|
|
—
|
|
29,390
|
|
—
|
|
|
– demand – interest bearing
|
39,050
|
|
0.3
|
|
37,382
|
|
0.2
|
|
37,234
|
|
0.2
|
|
|
– savings
|
63,786
|
|
0.7
|
|
64,464
|
|
0.4
|
|
60,157
|
|
0.4
|
|
|
– time
|
9,769
|
|
1.1
|
|
8,251
|
|
0.5
|
|
9,927
|
|
0.4
|
|
|
– other
|
45
|
|
—
|
|
44
|
|
—
|
|
65
|
|
—
|
|
|
Latin America
|
21,865
|
|
20,699
|
|
|
|
32,097
|
|
||||
|
– demand and other – non-interest bearing
|
5,451
|
|
—
|
|
5,454
|
|
—
|
|
8,349
|
|
—
|
|
|
– demand – interest bearing
|
7,217
|
|
2.1
|
|
6,629
|
|
1.3
|
|
6,848
|
|
0.9
|
|
|
– savings
|
3,830
|
|
6.2
|
|
3,451
|
|
32.9
|
|
10,896
|
|
18.3
|
|
|
– time
|
5,346
|
|
5.3
|
|
5,145
|
|
3.2
|
|
5,952
|
|
2.5
|
|
|
– other
|
21
|
|
—
|
|
20
|
|
10.0
|
|
52
|
|
9.6
|
|
|
Total
|
1,296,797
|
|
1,263,562
|
|
|
|
1,273,931
|
|
||||
|
– demand and other – non-interest bearing
|
201,879
|
|
—
|
|
188,903
|
|
—
|
|
198,029
|
|
—
|
|
|
– demand – interest bearing
|
822,807
|
|
0.2
|
|
800,033
|
|
0.2
|
|
770,649
|
|
0.3
|
|
|
– savings
|
204,389
|
|
1.3
|
|
207,156
|
|
1.8
|
|
228,042
|
|
2.3
|
|
|
– time
|
64,045
|
|
1.3
|
|
65,131
|
|
1.0
|
|
74,468
|
|
0.9
|
|
|
– other
|
3,677
|
|
1.0
|
|
2,339
|
|
1.9
|
|
2,743
|
|
1.9
|
|
|
Certificates of deposit and other money market instruments
|
|||||||||||
|
|
2017
|
2016
|
2015
|
||||||||
|
|
Average
balance |
|
Average
rate |
|
Average
balance
|
|
Average
rate
|
|
Average
balance
|
|
Average
rate
|
|
|
$m
|
|
%
|
|
$m
|
|
%
|
|
$m
|
|
%
|
|
Europe
|
12,506
|
|
0.6
|
|
22,188
|
|
0.5
|
|
22,539
|
|
0.5
|
|
Asia
|
523
|
|
2.7
|
|
609
|
|
2.3
|
|
1,275
|
|
2.4
|
|
North America
|
6,950
|
|
1.6
|
|
12,387
|
|
0.9
|
|
11,336
|
|
0.4
|
|
Latin America
|
1,333
|
|
5.4
|
|
1,135
|
|
6.2
|
|
6,971
|
|
12.0
|
|
|
21,312
|
|
1.3
|
|
36,319
|
|
0.9
|
|
42,121
|
|
2.4
|
|
62
|
HSBC Holdings plc
|
Certificates of deposit and other time deposits
The maturity analysis of certificates of deposit (‘CDs’) and other wholesale time deposits is expressed by remaining maturity. The
majority of CDs and time deposits are in amounts of $100,000 and over or the equivalent in other currencies.
|
|
At 31 December 2017
|
|||||||||
|
|
3 months
or less |
|
After
3 months but within 6 months |
|
After
6 months but within 12 months |
|
After
12 months |
|
Total
|
|
|
|
$m
|
|
$m
|
|
$m
|
|
$m
|
|
$m
|
|
|
Europe
|
31,893
|
|
2,526
|
|
6,733
|
|
8,812
|
|
49,964
|
|
|
– certificates of deposit
|
629
|
|
—
|
|
4,102
|
|
—
|
|
4,731
|
|
|
– time deposits:
|
|
|
|
|
|
|||||
|
banks
|
3,864
|
|
412
|
|
425
|
|
7,518
|
|
12,219
|
|
|
customers
|
27,400
|
|
2,114
|
|
2,206
|
|
1,294
|
|
33,014
|
|
|
Asia
|
20,550
|
|
1,175
|
|
671
|
|
392
|
|
22,788
|
|
|
– certificates of deposit
|
281
|
|
529
|
|
193
|
|
390
|
|
1,393
|
|
|
– time deposits:
|
|
|
|
|
|
|||||
|
banks
|
3,625
|
|
72
|
|
155
|
|
—
|
|
3,852
|
|
|
customers
|
16,644
|
|
574
|
|
323
|
|
2
|
|
17,543
|
|
|
Middle East and North Africa
|
254
|
|
35
|
|
114
|
|
369
|
|
772
|
|
|
– certificates of deposit
|
—
|
|
—
|
|
—
|
|
—
|
|
—
|
|
|
– time deposits:
|
|
|
|
|
|
|||||
|
banks
|
251
|
|
35
|
|
112
|
|
160
|
|
558
|
|
|
customers
|
3
|
|
—
|
|
2
|
|
209
|
|
214
|
|
|
North America
|
9,155
|
|
2,284
|
|
3,217
|
|
888
|
|
15,544
|
|
|
– certificates of deposit
|
1,208
|
|
1,725
|
|
2,065
|
|
—
|
|
4,998
|
|
|
– time deposits:
|
|
|
|
|
|
|||||
|
banks
|
1,620
|
|
1
|
|
—
|
|
—
|
|
1,621
|
|
|
customers
|
6,327
|
|
558
|
|
1,152
|
|
888
|
|
8,925
|
|
|
Latin America
|
5,720
|
|
720
|
|
432
|
|
1,756
|
|
8,628
|
|
|
– certificates of deposit
|
437
|
|
235
|
|
338
|
|
512
|
|
1,522
|
|
|
– time deposits:
|
|
|
|
|
|
|||||
|
banks
|
500
|
|
—
|
|
15
|
|
1,232
|
|
1,747
|
|
|
customers
|
4,783
|
|
485
|
|
79
|
|
12
|
|
5,359
|
|
|
Total
|
67,572
|
|
6,740
|
|
11,167
|
|
12,217
|
|
97,696
|
|
|
– certificates of deposit
|
2,555
|
|
2,489
|
|
6,698
|
|
902
|
|
12,644
|
|
|
– time deposits:
|
|
|
|
|
|
|||||
|
banks
|
9,860
|
|
520
|
|
707
|
|
8,910
|
|
19,997
|
|
|
customers
|
55,157
|
|
3,731
|
|
3,762
|
|
2,405
|
|
65,055
|
|
|
HSBC Holdings plc
|
63
|
Report of the Directors
| Financial summary
|
Global businesses and
geographical regions
|
|
|
Page
|
|
|
Change in reportable segments
|
64
|
|
Analysis of adjusted results by global business
|
64
|
|
Reconciliation of reported and adjusted items
|
66
|
|
Reconciliation of reported and adjusted items - global businesses
|
67
|
|
Retail Banking and Wealth Management
|
73
|
|
Commercial Banking
|
54
|
|
Global Banking and Markets
|
54
|
|
Global Private Banking
|
75
|
|
Corporate Centre
|
55
|
|
Analysis of reported results by geographical regions
|
76
|
|
Reconciliation of reported and adjusted items - geographical regions
|
78
|
|
Analysis of reported results by country
|
81
|
|
Summary
|
|
Basis of preparation
The Group Chief Executive, supported by the rest of the GMB, is considered the Chief Operating Decision Maker (‘CODM’) for the purposes of identifying the Group’s reportable segments.
Analysis by global business is considered more prominent than the geographical region view in the way the CODM assesses performance and allocates resources. The global businesses are therefore considered our reportable segments under IFRS 8.
|
|
Global business results are assessed by the CODM on the basis of adjusted performance that removes the effects of significant items and currency translation from reported results. We therefore present these results on an adjusted basis as required by IFRSs. The 2016 and 2015 adjusted performance information is presented on a constant currency basis as described on page 32.
As required by IFRS 8, reconciliations of the total adjusted global business results to the Group reported results are presented on page 64. Supplementary reconciliations from reported to adjusted results by global business are presented on pages 67 to 69 for information purposes.
Our operations are closely integrated and, accordingly, the presentation of data includes internal allocations of certain items of income and expense. These allocations include the costs of certain support services and global functions to the extent that they can be meaningfully attributed to operational business lines and geographical regions. While such allocations have been made on a systematic and consistent basis, they necessarily involve a degree of subjectivity. Costs which are not allocated to global businesses are included in the Corporate Centre.
Where relevant, income and expense amounts presented include the results of inter-segment funding along with inter-company and inter-business line transactions. All such transactions are undertaken on arm’s length terms. The intra-Group elimination items for the global businesses are presented in the Corporate Centre.
The expense of the UK bank levy is included in the Europe geographical region as HSBC regards the levy as a cost of being headquartered in the UK. For the purposes of the presentation by global business, the cost of the levy is included in the Corporate Centre.
The results of geographical regions are presented on a reported basis.
Geographical information is classified by the location of the principal operations of the subsidiary or, for The Hongkong and Shanghai Banking Corporation, HSBC Bank plc, HSBC Bank Middle East and HSBC Bank USA, by the location of the branch responsible for reporting the results or providing funding.
|
A description of the global businesses is provided in the
Strategic Report,
pages
3
and
18
to
21
.
|
Analysis of adjusted results by global business
|
|
HSBC adjusted profit before tax and balance sheet data
|
|||||||||||||
|
2017
|
|||||||||||||
|
Retail
Banking and Wealth Management |
|
Commercial
Banking |
|
Global
Banking and Markets |
|
Global
Private Banking |
|
Corporate Centre
|
|
Total
|
|
||
|
Footnotes
|
$m
|
|
$m
|
|
$m
|
|
$m
|
|
$m
|
|
$m
|
|
|
|
Net interest income/(expense)
|
13,959
|
|
9,062
|
|
4,886
|
|
816
|
|
(439
|
)
|
28,284
|
|
|
|
Net fee income/(expense)
|
5,156
|
|
3,518
|
|
3,489
|
|
704
|
|
(56
|
)
|
12,811
|
|
|
|
Net trading income
|
31
|
453
|
|
539
|
|
5,995
|
|
170
|
|
807
|
|
7,964
|
|
|
Other income
|
33
|
719
|
|
104
|
|
721
|
|
13
|
|
908
|
|
2,465
|
|
|
Net operating income before loan impairment charges and other credit risk provisions
|
3
|
20,287
|
|
13,223
|
|
15,091
|
|
1,703
|
|
1,220
|
|
51,524
|
|
|
– external
|
17,040
|
|
13,383
|
|
16,378
|
|
1,438
|
|
3,285
|
|
51,524
|
|
|
|
– inter-segment
|
3,247
|
|
(160
|
)
|
(1,287
|
)
|
265
|
|
(2,065
|
)
|
—
|
|
|
|
Loan impairment (charges)/recoveries and other credit risk provisions
|
(980
|
)
|
(496
|
)
|
(459
|
)
|
(16
|
)
|
182
|
|
(1,769
|
)
|
|
|
Net operating income
|
19,307
|
|
12,727
|
|
14,632
|
|
1,687
|
|
1,402
|
|
49,755
|
|
|
|
Total operating expenses
|
(12,847
|
)
|
(5,947
|
)
|
(8,858
|
)
|
(1,391
|
)
|
(2,097
|
)
|
(31,140
|
)
|
|
|
Operating profit/(loss)
|
6,460
|
|
6,780
|
|
5,774
|
|
296
|
|
(695
|
)
|
18,615
|
|
|
|
Share of profit in associates and joint ventures
|
18
|
|
—
|
|
—
|
|
—
|
|
2,357
|
|
2,375
|
|
|
|
Adjusted profit before tax
|
6,478
|
|
6,780
|
|
5,774
|
|
296
|
|
1,662
|
|
20,990
|
|
|
|
%
|
|
%
|
|
%
|
|
%
|
|
%
|
|
%
|
|
||
|
Share of HSBC’s adjusted profit before tax
|
30.9
|
|
32.3
|
|
27.5
|
|
1.4
|
|
7.9
|
|
100.0
|
|
|
|
Adjusted cost efficiency ratio
|
63.3
|
|
45.0
|
|
58.7
|
|
81.7
|
|
171.9
|
|
60.4
|
|
|
|
Adjusted balance sheet data
|
$m
|
|
$m
|
|
$m
|
|
$m
|
|
$m
|
|
$m
|
|
|
|
Loans and advances to customers (net)
|
346,148
|
|
316,533
|
|
252,474
|
|
40,326
|
|
7,483
|
|
962,964
|
|
|
|
Interests in associates and joint ventures
|
366
|
|
—
|
|
—
|
|
—
|
|
22,378
|
|
22,744
|
|
|
|
Total external assets
|
468,281
|
|
348,243
|
|
980,485
|
|
45,745
|
|
679,017
|
|
2,521,771
|
|
|
|
Customer accounts
|
639,592
|
|
362,908
|
|
283,943
|
|
66,512
|
|
11,507
|
|
1,364,462
|
|
|
|
Adjusted risk-weighted assets
|
34
|
121,466
|
|
300,995
|
|
299,272
|
|
16,036
|
|
130,848
|
|
868,617
|
|
|
64
|
HSBC Holdings plc
|
|
HSBC adjusted profit before tax and balance sheet data (continued)
|
|||||||||||||
|
|
2016
|
||||||||||||
|
Retail
Banking
and Wealth Management |
|
Commercial
Banking |
|
Global
Banking and Markets |
|
Global
Private Banking |
|
Corporate Centre
|
|
Total
|
|
||
|
Footnotes
|
$m
|
|
$m
|
|
$m
|
|
$m
|
|
$m
|
|
$m
|
|
|
|
Net interest income
|
12,919
|
|
8,491
|
|
4,798
|
|
801
|
|
1,170
|
|
28,179
|
|
|
|
Net fee income/(expense)
|
4,756
|
|
3,559
|
|
3,394
|
|
749
|
|
(63
|
)
|
12,395
|
|
|
|
Net trading income
|
31
|
426
|
|
442
|
|
6,231
|
|
183
|
|
2,426
|
|
9,708
|
|
|
Other income/(expense)
|
33
|
441
|
|
127
|
|
292
|
|
15
|
|
(1,867
|
)
|
(992
|
)
|
|
Net operating income before loan impairment charges and other credit risk provisions
|
3
|
18,542
|
|
12,619
|
|
14,715
|
|
1,748
|
|
1,666
|
|
49,290
|
|
|
– external
|
16,052
|
|
12,641
|
|
17,412
|
|
1,487
|
|
1,698
|
|
49,290
|
|
|
|
– inter-segment
|
2,490
|
|
(22
|
)
|
(2,697
|
)
|
261
|
|
(32
|
)
|
—
|
|
|
|
Loan impairment charges and other credit risk provisions
|
(1,142
|
)
|
(969
|
)
|
(461
|
)
|
—
|
|
(22
|
)
|
(2,594
|
)
|
|
|
Net operating income
|
17,400
|
|
11,650
|
|
14,254
|
|
1,748
|
|
1,644
|
|
46,696
|
|
|
|
Total operating expenses
|
(12,184
|
)
|
(5,746
|
)
|
(8,745
|
)
|
(1,476
|
)
|
(1,933
|
)
|
(30,084
|
)
|
|
|
Operating profit/(loss)
|
5,216
|
|
5,904
|
|
5,509
|
|
272
|
|
(289
|
)
|
16,612
|
|
|
|
Share of profit in associates and joint ventures
|
20
|
|
—
|
|
—
|
|
—
|
|
2,302
|
|
2,322
|
|
|
|
Adjusted profit before tax
|
5,236
|
|
5,904
|
|
5,509
|
|
272
|
|
2,013
|
|
18,934
|
|
|
|
%
|
|
%
|
|
%
|
|
%
|
|
%
|
|
%
|
|
||
|
Share of HSBC’s adjusted profit before tax
|
27.7
|
|
31.2
|
|
29.1
|
|
1.4
|
|
10.6
|
|
100.0
|
|
|
|
Adjusted cost efficiency ratio
|
65.7
|
|
45.5
|
|
59.4
|
|
84.4
|
|
116.0
|
|
61.0
|
|
|
|
Adjusted balance sheet data
|
$m
|
|
$m
|
|
$m
|
|
$m
|
|
$m
|
|
$m
|
|
|
|
Loans and advances to customers (net)
|
323,986
|
|
294,952
|
|
237,655
|
|
36,972
|
|
12,494
|
|
906,059
|
|
|
|
Interests in associates and joint ventures
|
394
|
|
—
|
|
—
|
|
—
|
|
20,340
|
|
20,734
|
|
|
|
Total external assets
|
435,839
|
|
320,173
|
|
981,893
|
|
43,234
|
|
708,320
|
|
2,489,459
|
|
|
|
Customer accounts
|
611,846
|
|
356,885
|
|
272,159
|
|
72,730
|
|
15,037
|
|
1,328,657
|
|
|
|
Adjusted risk-weighted assets
|
34
|
114,683
|
|
286,912
|
|
307,736
|
|
15,649
|
|
153,324
|
|
878,304
|
|
|
2015
|
|||||||||||||
|
Net interest income
|
12,299
|
|
8,287
|
|
4,422
|
|
819
|
|
2,167
|
|
27,994
|
|
|
|
Net fee income/(expense)
|
5,446
|
|
3,672
|
|
3,514
|
|
939
|
|
(121
|
)
|
13,450
|
|
|
|
Net trading income
|
31
|
427
|
|
460
|
|
5,960
|
|
206
|
|
721
|
|
7,774
|
|
|
Other income
|
33
|
666
|
|
88
|
|
382
|
|
2
|
|
66
|
|
1,204
|
|
|
Net operating income before loan impairment charges and other credit risk provisions
|
3
|
18,838
|
|
12,507
|
|
14,278
|
|
1,966
|
|
2,833
|
|
50,422
|
|
|
– external
|
16,451
|
|
12,585
|
|
16,633
|
|
1,689
|
|
3,064
|
|
50,422
|
|
|
|
– inter-segment
|
2,387
|
|
(78
|
)
|
(2,355
|
)
|
277
|
|
(231
|
)
|
—
|
|
|
|
Loan impairment charges and other credit risk provisions
|
(1,023
|
)
|
(1,447
|
)
|
(71
|
)
|
(11
|
)
|
(27
|
)
|
(2,579
|
)
|
|
|
Net operating income
|
17,815
|
|
11,060
|
|
14,207
|
|
1,955
|
|
2,806
|
|
47,843
|
|
|
|
Total operating expenses
|
(12,332
|
)
|
(5,826
|
)
|
(8,903
|
)
|
(1,582
|
)
|
(2,814
|
)
|
(31,457
|
)
|
|
|
Operating profit/(loss)
|
5,483
|
|
5,234
|
|
5,304
|
|
373
|
|
(8
|
)
|
16,386
|
|
|
|
Share of profit/(loss) in associates and joint ventures
|
23
|
|
—
|
|
(1
|
)
|
—
|
|
2,387
|
|
2,409
|
|
|
|
Adjusted profit before tax
|
5,506
|
|
5,234
|
|
5,303
|
|
373
|
|
2,379
|
|
18,795
|
|
|
|
%
|
|
%
|
|
%
|
|
%
|
|
%
|
|
%
|
|
||
|
Share of HSBC’s adjusted profit before tax
|
29.3
|
|
27.8
|
|
28.2
|
|
2.0
|
|
12.7
|
|
100.0
|
|
|
|
Adjusted cost efficiency ratio
|
65.5
|
|
46.6
|
|
62.4
|
|
80.5
|
|
99.3
|
|
62.4
|
|
|
|
Adjusted balance sheet data
|
$m
|
|
$m
|
|
$m
|
|
$m
|
|
$m
|
|
$m
|
|
|
|
Loans and advances to customers (net)
|
313,927
|
|
281,826
|
|
243,662
|
|
42,592
|
|
23,690
|
|
905,697
|
|
|
|
Interests in associates and joint ventures
|
391
|
|
—
|
|
—
|
|
—
|
|
18,673
|
|
19,064
|
|
|
|
Total external assets
|
422,322
|
|
309,266
|
|
886,750
|
|
51,190
|
|
651,847
|
|
2,321,378
|
|
|
|
Customer accounts
|
569,183
|
|
341,717
|
|
256,374
|
|
80,442
|
|
13,956
|
|
1,261,672
|
|
|
|
Adjusted risk-weighted assets
|
34
|
116,047
|
|
282,149
|
|
318,818
|
|
17,661
|
|
313,100
|
|
1,047,775
|
|
For footnotes, see page
85
.
|
HSBC Holdings plc
|
65
|
Report of the Directors
| Financial summary
|
Reconciliation of reported and adjusted items
|
(Audited)
|
Adjusted results reconciliation
|
|||||||||||||||||||||||
|
2017
|
2016
|
2015
|
|||||||||||||||||||||
|
Adjusted
|
|
Significant items
|
|
Reported
|
|
Adjusted
|
|
Currency translation
|
|
Significant items
|
|
Reported
|
|
Adjusted
|
|
Currency translation
|
|
Significant items
|
|
Reported
|
|
||
|
Footnote
|
$m
|
|
$m
|
|
$m
|
|
$m
|
|
$m
|
|
$m
|
|
$m
|
|
$m
|
|
$m
|
|
$m
|
|
$m
|
|
|
|
Revenue
|
3
|
51,524
|
|
(79
|
)
|
51,445
|
|
49,290
|
|
736
|
|
(2,060
|
)
|
47,966
|
|
50,422
|
|
3,727
|
|
5,651
|
|
59,800
|
|
|
LICs
|
(1,769
|
)
|
—
|
|
(1,769
|
)
|
(2,594
|
)
|
61
|
|
(867
|
)
|
(3,400
|
)
|
(2,579
|
)
|
(127
|
)
|
(1,015
|
)
|
(3,721
|
)
|
|
|
Operating expenses
|
(31,140
|
)
|
(3,744
|
)
|
(34,884
|
)
|
(30,084
|
)
|
(331
|
)
|
(9,393
|
)
|
(39,808
|
)
|
(31,457
|
)
|
(2,434
|
)
|
(5,877
|
)
|
(39,768
|
)
|
|
|
Share of profit in associates
and joint ventures
|
2,375
|
|
—
|
|
2,375
|
|
2,322
|
|
33
|
|
(1
|
)
|
2,354
|
|
2,409
|
|
149
|
|
(2
|
)
|
2,556
|
|
|
|
Profit/(loss) before tax
|
20,990
|
|
(3,823
|
)
|
17,167
|
|
18,934
|
|
499
|
|
(12,321
|
)
|
7,112
|
|
18,795
|
|
1,315
|
|
(1,243
|
)
|
18,867
|
|
|
|
Adjusted balance sheet reconciliation
|
||||||||||||||||
|
2017
|
2016
|
2015
|
||||||||||||||
|
Reported and Adjusted
|
|
Adjusted
|
|
Currency translation
|
|
Reported
|
|
Adjusted
|
|
Currency translation
|
|
Brazil operations
1
|
|
Reported
|
|
|
|
$m
|
|
$m
|
|
$m
|
|
$m
|
|
$m
|
|
$m
|
|
$m
|
|
$m
|
|
|
|
Loans and advances to customers (net)
|
962,964
|
|
906,059
|
|
(44,555
|
)
|
861,504
|
|
905,697
|
|
18,757
|
|
—
|
|
924,454
|
|
|
Interests in associates and joint ventures
|
22,744
|
|
20,734
|
|
(705
|
)
|
20,029
|
|
19,064
|
|
75
|
|
—
|
|
19,139
|
|
|
Total external assets
|
2,521,771
|
|
2,489,459
|
|
(114,473
|
)
|
2,374,986
|
|
2,321,378
|
|
39,164
|
|
49,114
|
|
2,409,656
|
|
|
Customer accounts
|
1,364,462
|
|
1,328,657
|
|
(56,271
|
)
|
1,272,386
|
|
1,261,672
|
|
27,914
|
|
—
|
|
1,289,586
|
|
|
1
|
Includes effects of foreign currency translation.
|
|
Adjusted profit reconciliation
|
|||||||
|
2017
|
|
2016
|
|
2015
|
|
||
|
Footnotes
|
$m
|
|
$m
|
|
$m
|
|
|
|
For the year ended 31 Dec
|
|||||||
|
Adjusted profit before tax
|
20,990
|
|
18,934
|
|
18,795
|
|
|
|
Significant items
|
(3,823
|
)
|
(12,321
|
)
|
(1,243
|
)
|
|
|
– customer redress programmes (revenue)
|
(108
|
)
|
2
|
|
(10
|
)
|
|
|
– DVA on derivative contracts
|
(373
|
)
|
26
|
|
230
|
|
|
|
– fair value movements on non-qualifying hedges
|
32
|
128
|
|
(687
|
)
|
(327
|
)
|
|
– gain on disposal of our investment in Vietnam Technological and Commercial Joint Stock Bank
|
126
|
|
—
|
|
—
|
|
|
|
– gain on disposal of our membership interest in Visa – Europe
|
—
|
|
584
|
|
—
|
|
|
|
– gain on disposal of our membership interest in Visa – US
|
308
|
|
116
|
|
—
|
|
|
|
– gain on the partial sale of shareholding in Industrial Bank
|
—
|
|
—
|
|
1,372
|
|
|
|
– gain/(loss) and trading results from disposed-of operations in Brazil
|
19
|
|
(2,081
|
)
|
(13
|
)
|
|
|
– investment in new businesses
|
(99
|
)
|
—
|
|
—
|
|
|
|
– other acquisitions, disposals and dilutions
|
78
|
|
—
|
|
—
|
|
|
|
– own credit spread
|
25
|
—
|
|
(1,792
|
)
|
1,002
|
|
|
– portfolio disposals
|
(158
|
)
|
(163
|
)
|
(214
|
)
|
|
|
– costs associated with portfolio disposals
|
(53
|
)
|
(28
|
)
|
—
|
|
|
|
– costs associated with the UK’s exit from the EU
|
(28
|
)
|
—
|
|
—
|
|
|
|
– costs to achieve
|
(3,002
|
)
|
(3,118
|
)
|
(908
|
)
|
|
|
– costs to establish UK ring-fenced bank
|
(392
|
)
|
(223
|
)
|
(89
|
)
|
|
|
– customer redress programmes (operating expenses)
|
(655
|
)
|
(559
|
)
|
(541
|
)
|
|
|
– gain on partial settlement of pension obligation
|
188
|
|
—
|
|
—
|
|
|
|
– impairment of GPB – Europe goodwill
|
—
|
|
(3,240
|
)
|
—
|
|
|
|
– regulatory provisions in GPB
|
(164
|
)
|
(344
|
)
|
(172
|
)
|
|
|
– restructuring and other related costs
|
—
|
|
—
|
|
(117
|
)
|
|
|
– settlements and provisions in connection with legal matters
|
362
|
|
(681
|
)
|
(1,649
|
)
|
|
|
– currency translation on significant items
|
|
|
(133
|
)
|
193
|
|
|
|
Currency translation
|
|
|
499
|
|
1,315
|
|
|
|
Reported profit before tax
|
17,167
|
|
7,112
|
|
18,867
|
|
|
For footnotes, see page
85
.
|
66
|
HSBC Holdings plc
|
|
Reconciliation of reported and adjusted items – global businesses
|
Supplementary unaudited analysis of significant items by global business is presented below.
|
Reconciliation of reported and adjusted items
|
|||||||||||||
|
|
|
2017
|
|||||||||||
|
|
|
Retail
Banking and Wealth Management |
|
Commercial
Banking |
|
Global
Banking and Markets |
|
Global
Private Banking |
|
Corporate Centre
|
|
Total
|
|
|
|
Footnotes
|
$m
|
|
$m
|
|
$m
|
|
$m
|
|
$m
|
|
$m
|
|
|
Revenue
|
3
|
|
|
|
|
|
|
|
|
|
|
|
|
|
Reported
|
|
20,519
|
|
13,120
|
|
14,617
|
|
1,723
|
|
1,466
|
|
51,445
|
|
|
Significant items
|
|
(232
|
)
|
103
|
|
474
|
|
(20
|
)
|
(246
|
)
|
79
|
|
|
– customer redress programmes
|
3
|
|
103
|
|
2
|
|
—
|
|
—
|
|
108
|
|
|
|
– DVA on derivative contracts
|
|
—
|
|
—
|
|
373
|
|
—
|
|
—
|
|
373
|
|
|
– fair value movements on non-qualifying hedges
|
32
|
—
|
|
—
|
|
—
|
|
—
|
|
(128
|
)
|
(128
|
)
|
|
– gain on disposal of our investment in Vietnam Technological and Commercial Joint Stock Bank
|
|
—
|
|
—
|
|
—
|
|
—
|
|
(126
|
)
|
(126
|
)
|
|
– gain on disposal of our membership interest in Visa – US
|
|
(308
|
)
|
—
|
|
—
|
|
—
|
|
—
|
|
(308
|
)
|
|
– investment in new businesses
|
|
—
|
|
—
|
|
99
|
|
—
|
|
—
|
|
99
|
|
|
– portfolio disposals
|
|
73
|
|
—
|
|
—
|
|
(20
|
)
|
105
|
|
158
|
|
|
– gain on disposal of operations in Brazil
|
—
|
|
—
|
|
—
|
|
—
|
|
(19
|
)
|
(19
|
)
|
|
|
– other acquisitions, disposal and dilutions
|
|
—
|
|
—
|
|
—
|
|
—
|
|
(78
|
)
|
(78
|
)
|
|
Adjusted
|
|
20,287
|
|
13,223
|
|
15,091
|
|
1,703
|
|
1,220
|
|
51,524
|
|
|
Loan impairment charge and other credit risk provisions (‘LICs’)
|
|
|
|
|
|
|
|
|
|
|
|
|
|
|
Reported
|
|
(980
|
)
|
(496
|
)
|
(459
|
)
|
(16
|
)
|
182
|
|
(1,769
|
)
|
|
Adjusted
|
|
(980
|
)
|
(496
|
)
|
(459
|
)
|
(16
|
)
|
182
|
|
(1,769
|
)
|
|
Operating expenses
|
|
|
|
|
|
|
|
|
|
|
|
|
|
|
Reported
|
|
(13,734
|
)
|
(6,001
|
)
|
(8,723
|
)
|
(1,586
|
)
|
(4,840
|
)
|
(34,884
|
)
|
|
Significant items
|
|
887
|
|
54
|
|
(135
|
)
|
195
|
|
2,743
|
|
3,744
|
|
|
– costs associated with portfolio disposals
|
|
—
|
|
—
|
|
—
|
|
31
|
|
22
|
|
53
|
|
|
– costs associated with the UK’s exit from the EU
|
|
—
|
|
1
|
|
8
|
|
—
|
|
19
|
|
28
|
|
|
– costs to achieve
|
|
270
|
|
44
|
|
240
|
|
3
|
|
2,445
|
|
3,002
|
|
|
– costs to establish UK ring-fenced bank
|
|
6
|
|
2
|
|
—
|
|
—
|
|
384
|
|
392
|
|
|
– customer redress programmes
|
637
|
|
16
|
|
2
|
|
—
|
|
—
|
|
655
|
|
|
|
– gain on partial settlement of pension obligation
|
(26
|
)
|
(9
|
)
|
(9
|
)
|
(3
|
)
|
(141
|
)
|
(188
|
)
|
|
|
– regulatory provisions in GPB
|
—
|
|
—
|
|
—
|
|
164
|
|
—
|
|
164
|
|
|
|
– settlements and provisions in connection with legal matters
|
|
—
|
|
—
|
|
(376
|
)
|
—
|
|
14
|
|
(362
|
)
|
|
Adjusted
|
|
(12,847
|
)
|
(5,947
|
)
|
(8,858
|
)
|
(1,391
|
)
|
(2,097
|
)
|
(31,140
|
)
|
|
Share of profit in associates and joint ventures
|
|
|
|
|
|
|
|
|
|
|
|
|
|
|
Reported
|
|
18
|
|
—
|
|
—
|
|
—
|
|
2,357
|
|
2,375
|
|
|
Adjusted
|
|
18
|
|
—
|
|
—
|
|
—
|
|
2,357
|
|
2,375
|
|
|
Profit/(loss) before tax
|
|
|
|
|
|
|
|
|
|
|
|
|
|
|
Reported
|
|
5,823
|
|
6,623
|
|
5,435
|
|
121
|
|
(835
|
)
|
17,167
|
|
|
Significant items
|
|
655
|
|
157
|
|
339
|
|
175
|
|
2,497
|
|
3,823
|
|
|
– revenue
|
|
(232
|
)
|
103
|
|
474
|
|
(20
|
)
|
(246
|
)
|
79
|
|
|
– operating expenses
|
|
887
|
|
54
|
|
(135
|
)
|
195
|
|
2,743
|
|
3,744
|
|
|
Adjusted
|
|
6,478
|
|
6,780
|
|
5,774
|
|
296
|
|
1,662
|
|
20,990
|
|
|
HSBC Holdings plc
|
67
|
Report of the Directors
| Financial summary
|
Reconciliation of reported and adjusted items (continued)
|
|||||||||||||
|
|
|
2016
|
|||||||||||
|
|
|
Retail
Banking and Wealth Management |
|
Commercial
Banking |
|
Global
Banking and Markets |
|
Global
Private Banking |
|
Corporate Centre
|
|
Total
|
|
|
|
Footnotes
|
$m
|
|
$m
|
|
$m
|
|
$m
|
|
$m
|
|
$m
|
|
|
Revenue
|
3
|
|
|
|
|
|
|
|
|
|
|
|
|
|
Reported
|
|
20,338
|
|
13,405
|
|
15,213
|
|
1,745
|
|
(2,735
|
)
|
47,966
|
|
|
Currency translation
|
|
(257
|
)
|
(242
|
)
|
(182
|
)
|
(7
|
)
|
(48
|
)
|
(736
|
)
|
|
Significant items
|
|
(1,539
|
)
|
(544
|
)
|
(316
|
)
|
10
|
|
4,449
|
|
2,060
|
|
|
– customer redress programmes
|
—
|
|
—
|
|
—
|
|
(2
|
)
|
—
|
|
(2
|
)
|
|
|
– DVA on derivative contracts
|
|
—
|
|
—
|
|
(26
|
)
|
—
|
|
—
|
|
(26
|
)
|
|
– fair value movements on non-qualifying hedges
|
32
|
—
|
|
—
|
|
—
|
|
—
|
|
687
|
|
687
|
|
|
– gain on disposal of our membership interest in
Visa – Europe |
|
(354
|
)
|
(230
|
)
|
—
|
|
—
|
|
—
|
|
(584
|
)
|
|
– gain on disposal of our membership interest in
Visa – US |
|
(72
|
)
|
—
|
|
—
|
|
—
|
|
(44
|
)
|
(116
|
)
|
|
– own credit spread
|
25
|
—
|
|
—
|
|
—
|
|
—
|
|
1,792
|
|
1,792
|
|
|
– portfolio disposals
|
|
—
|
|
—
|
|
—
|
|
26
|
|
137
|
|
163
|
|
|
– loss and trading results from disposed-of operations in Brazil
|
|
(987
|
)
|
(288
|
)
|
(268
|
)
|
(12
|
)
|
1,828
|
|
273
|
|
|
– currency translation on significant items
|
|
(126
|
)
|
(26
|
)
|
(22
|
)
|
(2
|
)
|
49
|
|
(127
|
)
|
|
Adjusted
|
|
18,542
|
|
12,619
|
|
14,715
|
|
1,748
|
|
1,666
|
|
49,290
|
|
|
LICs
|
|
|
|
|
|
|
|
|
|
|
|
|
|
|
Reported
|
|
(1,633
|
)
|
(1,272
|
)
|
(471
|
)
|
1
|
|
(25
|
)
|
(3,400
|
)
|
|
Currency translation
|
|
(45
|
)
|
(12
|
)
|
(6
|
)
|
(1
|
)
|
3
|
|
(61
|
)
|
|
Significant items
|
|
536
|
|
315
|
|
16
|
|
—
|
|
—
|
|
867
|
|
|
– trading results from disposed-of operations in Brazil
|
|
462
|
|
272
|
|
14
|
|
—
|
|
—
|
|
748
|
|
|
– currency translation on significant items
|
|
74
|
|
43
|
|
2
|
|
—
|
|
—
|
|
119
|
|
|
Adjusted
|
|
(1,142
|
)
|
(969
|
)
|
(461
|
)
|
—
|
|
(22
|
)
|
(2,594
|
)
|
|
Operating expenses
|
|
|
|
|
|
|
|
|
|
|
|
|
|
|
Reported
|
|
(14,138
|
)
|
(6,087
|
)
|
(9,302
|
)
|
(5,074
|
)
|
(5,207
|
)
|
(39,808
|
)
|
|
Currency translation
|
|
133
|
|
69
|
|
125
|
|
(8
|
)
|
12
|
|
331
|
|
|
Significant items
|
|
1,821
|
|
272
|
|
432
|
|
3,606
|
|
3,262
|
|
9,393
|
|
|
– costs associated with portfolio disposals
|
|
—
|
|
—
|
|
—
|
|
10
|
|
18
|
|
28
|
|
|
– costs to achieve
|
|
393
|
|
62
|
|
233
|
|
6
|
|
2,424
|
|
3,118
|
|
|
– costs to establish UK ring-fenced bank
|
|
2
|
|
1
|
|
—
|
|
—
|
|
220
|
|
223
|
|
|
– customer redress programmes
|
497
|
|
34
|
|
28
|
|
—
|
|
—
|
|
559
|
|
|
|
– impairment of GPB – Europe goodwill
|
|
—
|
|
—
|
|
—
|
|
3,240
|
|
—
|
|
3,240
|
|
|
– regulatory provisions in GPB
|
|
—
|
|
—
|
|
—
|
|
341
|
|
3
|
|
344
|
|
|
– settlements and provisions in connection with legal matters
|
|
—
|
|
—
|
|
94
|
|
—
|
|
587
|
|
681
|
|
|
– trading results from disposed-of operations in Brazil
|
|
805
|
|
155
|
|
82
|
|
8
|
|
9
|
|
1,059
|
|
|
– currency translation on significant items
|
|
124
|
|
20
|
|
(5
|
)
|
1
|
|
1
|
|
141
|
|
|
Adjusted
|
|
(12,184
|
)
|
(5,746
|
)
|
(8,745
|
)
|
(1,476
|
)
|
(1,933
|
)
|
(30,084
|
)
|
|
Share of profit in associates and joint ventures
|
|
|
|
|
|
|
|
|
|
|
|
|
|
|
Reported
|
|
20
|
|
—
|
|
—
|
|
—
|
|
2,334
|
|
2,354
|
|
|
Currency translation
|
|
—
|
|
—
|
|
—
|
|
—
|
|
(33
|
)
|
(33
|
)
|
|
Significant items
|
|
—
|
|
—
|
|
—
|
|
—
|
|
1
|
|
1
|
|
|
– trading results from disposed-of operations in Brazil
|
|
—
|
|
—
|
|
—
|
|
—
|
|
1
|
|
1
|
|
|
– currency translation on significant items
|
|
—
|
|
—
|
|
—
|
|
—
|
|
—
|
|
—
|
|
|
Adjusted
|
|
20
|
|
—
|
|
—
|
|
—
|
|
2,302
|
|
2,322
|
|
|
Profit/(loss) before tax
|
|
|
|
|
|
|
|
|
|
|
|
|
|
|
Reported
|
|
4,587
|
|
6,046
|
|
5,440
|
|
(3,328
|
)
|
(5,633
|
)
|
7,112
|
|
|
Currency translation
|
|
(169
|
)
|
(185
|
)
|
(63
|
)
|
(16
|
)
|
(66
|
)
|
(499
|
)
|
|
Significant items
|
|
818
|
|
43
|
|
132
|
|
3,616
|
|
7,712
|
|
12,321
|
|
|
– revenue
|
|
(1,539
|
)
|
(544
|
)
|
(316
|
)
|
10
|
|
4,449
|
|
2,060
|
|
|
– LICs
|
|
536
|
|
315
|
|
16
|
|
—
|
|
—
|
|
867
|
|
|
– operating expenses
|
|
1,821
|
|
272
|
|
432
|
|
3,606
|
|
3,262
|
|
9,393
|
|
|
– share of profit in associates and joint ventures
|
|
—
|
|
—
|
|
—
|
|
—
|
|
1
|
|
1
|
|
|
Adjusted
|
|
5,236
|
|
5,904
|
|
5,509
|
|
272
|
|
2,013
|
|
18,934
|
|
|
68
|
HSBC Holdings plc
|
|
Reconciliation of reported and adjusted items (continued)
|
|||||||||||||
|
|
|
2015
|
|||||||||||
|
|
|
Retail
Banking and Wealth Management |
|
Commercial
Banking |
|
Global
Banking and Markets |
|
Global
Private Banking |
|
Corporate Centre
|
|
Total
|
|
|
|
Footnotes
|
$m
|
|
$m
|
|
$m
|
|
$m
|
|
$m
|
|
$m
|
|
|
Revenue
|
3
|
|
|
|
|
|
|
|
|
|
|
|
|
|
Reported
|
|
22,624
|
|
14,198
|
|
15,972
|
|
2,076
|
|
4,930
|
|
59,800
|
|
|
Currency translation
|
|
(1,486
|
)
|
(969
|
)
|
(984
|
)
|
(55
|
)
|
(233
|
)
|
(3,727
|
)
|
|
Significant items
|
|
(2,300
|
)
|
(722
|
)
|
(710
|
)
|
(55
|
)
|
(1,864
|
)
|
(5,651
|
)
|
|
– customer redress programmes
|
22
|
|
18
|
|
—
|
|
(30
|
)
|
—
|
|
10
|
|
|
|
– DVA on derivative contracts
|
|
—
|
|
—
|
|
(230
|
)
|
—
|
|
—
|
|
(230
|
)
|
|
– fair value movements on non-qualifying hedges
|
32
|
—
|
|
—
|
|
—
|
|
—
|
|
327
|
|
327
|
|
|
– gain on the partial sale of shareholding in Industrial
Bank |
|
—
|
|
—
|
|
—
|
|
—
|
|
(1,372
|
)
|
(1,372
|
)
|
|
– own credit spread
|
25
|
—
|
|
—
|
|
—
|
|
—
|
|
(1,002
|
)
|
(1,002
|
)
|
|
– portfolio disposals
|
|
—
|
|
—
|
|
—
|
|
—
|
|
214
|
|
214
|
|
|
– trading results from disposed-of operations in Brazil
|
|
(2,239
|
)
|
(712
|
)
|
(483
|
)
|
(29
|
)
|
(69
|
)
|
(3,532
|
)
|
|
– currency translation on significant items
|
|
(83
|
)
|
(28
|
)
|
3
|
|
4
|
|
38
|
|
(66
|
)
|
|
Adjusted
|
|
18,838
|
|
12,507
|
|
14,278
|
|
1,966
|
|
2,833
|
|
50,422
|
|
|
LICs
|
|
|
|
|
|
|
|
|
|
|
|
|
|
|
Reported
|
|
(1,878
|
)
|
(1,761
|
)
|
(47
|
)
|
(13
|
)
|
(22
|
)
|
(3,721
|
)
|
|
Currency translation
|
|
82
|
|
40
|
|
8
|
|
2
|
|
(5
|
)
|
127
|
|
|
Significant items
|
|
773
|
|
274
|
|
(32
|
)
|
—
|
|
—
|
|
1,015
|
|
|
– trading results from disposed-of operations in Brazil
|
|
731
|
|
262
|
|
(28
|
)
|
—
|
|
—
|
|
965
|
|
|
– currency translation on significant items
|
|
42
|
|
12
|
|
(4
|
)
|
—
|
|
—
|
|
50
|
|
|
Adjusted
|
|
(1,023
|
)
|
(1,447
|
)
|
(71
|
)
|
(11
|
)
|
(27
|
)
|
(2,579
|
)
|
|
Operating expenses
|
|
|
|
|
|
|
|
|
|
|
|
|
|
|
Reported
|
|
(15,970
|
)
|
(6,852
|
)
|
(10,767
|
)
|
(1,840
|
)
|
(4,339
|
)
|
(39,768
|
)
|
|
Currency translation
|
|
1,119
|
|
403
|
|
768
|
|
29
|
|
115
|
|
2,434
|
|
|
Significant items
|
|
2,519
|
|
623
|
|
1,096
|
|
229
|
|
1,410
|
|
5,877
|
|
|
– costs to achieve
|
|
153
|
|
163
|
|
69
|
|
16
|
|
507
|
|
908
|
|
|
– costs to establish UK ring-fenced bank
|
|
—
|
|
—
|
|
—
|
|
—
|
|
89
|
|
89
|
|
|
– customer redress programmes
|
541
|
|
18
|
|
(19
|
)
|
—
|
|
1
|
|
541
|
|
|
|
– regulatory provisions in GPB
|
|
—
|
|
—
|
|
—
|
|
171
|
|
1
|
|
172
|
|
|
– restructuring and other related costs
|
|
9
|
|
5
|
|
22
|
|
18
|
|
63
|
|
117
|
|
|
– settlements and provisions in connection with legal matters
|
|
—
|
|
—
|
|
949
|
|
—
|
|
700
|
|
1,649
|
|
|
– trading results from disposed-of operations in Brazil
|
|
1,822
|
|
434
|
|
222
|
|
23
|
|
78
|
|
2,579
|
|
|
– currency translation on significant items
|
|
(6
|
)
|
3
|
|
(147
|
)
|
1
|
|
(29
|
)
|
(178
|
)
|
|
Adjusted
|
|
(12,332
|
)
|
(5,826
|
)
|
(8,903
|
)
|
(1,582
|
)
|
(2,814
|
)
|
(31,457
|
)
|
|
Share of profit in associates and joint ventures
|
|
|
|
|
|
|
|
|
|
|
|
|
|
|
Reported
|
|
23
|
|
—
|
|
—
|
|
—
|
|
2,533
|
|
2,556
|
|
|
Currency translation
|
|
—
|
|
—
|
|
(1
|
)
|
—
|
|
(148
|
)
|
(149
|
)
|
|
Significant items
|
|
—
|
|
—
|
|
—
|
|
—
|
|
2
|
|
2
|
|
|
– trading results from disposed-of operations in Brazil
|
|
—
|
|
—
|
|
—
|
|
—
|
|
1
|
|
1
|
|
|
– currency translation on significant items
|
|
—
|
|
—
|
|
—
|
|
—
|
|
1
|
|
1
|
|
|
Adjusted
|
|
23
|
|
—
|
|
(1
|
)
|
—
|
|
2,387
|
|
2,409
|
|
|
Profit/(loss) before tax
|
|
|
|
|
|
|
|
|
|
|
|
|
|
|
Reported
|
|
4,799
|
|
5,585
|
|
5,158
|
|
223
|
|
3,102
|
|
18,867
|
|
|
Currency translation
|
|
(285
|
)
|
(526
|
)
|
(209
|
)
|
(24
|
)
|
(271
|
)
|
(1,315
|
)
|
|
Significant items
|
|
992
|
|
175
|
|
354
|
|
174
|
|
(452
|
)
|
1,243
|
|
|
– revenue
|
|
(2,300
|
)
|
(722
|
)
|
(710
|
)
|
(55
|
)
|
(1,864
|
)
|
(5,651
|
)
|
|
– LICs
|
|
773
|
|
274
|
|
(32
|
)
|
—
|
|
—
|
|
1,015
|
|
|
– operating expenses
|
|
2,519
|
|
623
|
|
1,096
|
|
229
|
|
1,410
|
|
5,877
|
|
|
– share of profit in associates and joint ventures
|
|
—
|
|
—
|
|
—
|
|
—
|
|
2
|
|
2
|
|
|
Adjusted
|
|
5,506
|
|
5,234
|
|
5,303
|
|
373
|
|
2,379
|
|
18,795
|
|
For footnotes, see page
85
.
|
HSBC Holdings plc
|
69
|
Report of the Directors
| Financial summary
|
Reconciliation of reported and adjusted risk-weighted assets
|
||||||||||||
|
At 31 Dec 2017
|
||||||||||||
|
Retail
Banking and
Wealth
Management |
|
Commercial
Banking |
|
Global
Banking and Markets |
|
Global Private
Banking |
|
Corporate Centre
|
|
Total
|
|
|
|
$bn
|
|
$bn
|
|
$bn
|
|
$bn
|
|
$bn
|
|
$bn
|
|
|
|
Risk-weighted assets
|
||||||||||||
|
Reported
|
121.5
|
|
301.0
|
|
299.3
|
|
16.0
|
|
133.5
|
|
871.3
|
|
|
Disposals
|
—
|
|
—
|
|
—
|
|
—
|
|
(2.7
|
)
|
(2.7
|
)
|
|
– Brazil operations
|
—
|
|
—
|
|
—
|
|
—
|
|
(2.6
|
)
|
(2.6
|
)
|
|
– Lebanon operations
|
—
|
|
—
|
|
—
|
|
—
|
|
(0.1
|
)
|
(0.1
|
)
|
|
Adjusted
|
121.5
|
|
301.0
|
|
299.3
|
|
16.0
|
|
130.8
|
|
868.6
|
|
|
At 31 Dec 2016
|
||||||||||||
|
Risk-weighted assets
|
||||||||||||
|
Reported
|
115.1
|
|
275.9
|
|
300.4
|
|
15.3
|
|
150.5
|
|
857.2
|
|
|
Currency translation
|
3.0
|
|
12.4
|
|
8.0
|
|
0.4
|
|
3.5
|
|
27.3
|
|
|
Disposals
|
(3.4
|
)
|
(1.4
|
)
|
(0.7
|
)
|
—
|
|
(0.7
|
)
|
(6.2
|
)
|
|
– Brazil operations
|
(3.2
|
)
|
(1.0
|
)
|
(0.7
|
)
|
—
|
|
(0.2
|
)
|
(5.1
|
)
|
|
– Lebanon operations
|
(0.2
|
)
|
(0.4
|
)
|
—
|
|
—
|
|
(0.5
|
)
|
(1.1
|
)
|
|
Adjusted
|
114.7
|
|
286.9
|
|
307.7
|
|
15.7
|
|
153.3
|
|
878.3
|
|
|
At 31 Dec 2015
|
||||||||||||
|
Risk-weighted assets
|
||||||||||||
|
Reported
|
130.7
|
|
302.2
|
|
330.3
|
|
18.0
|
|
321.8
|
|
1,103.0
|
|
|
Currency translation
|
(1.0
|
)
|
(3.5
|
)
|
1.4
|
|
(0.1
|
)
|
(5.0
|
)
|
(8.2
|
)
|
|
Disposals
|
(13.7
|
)
|
(16.5
|
)
|
(12.9
|
)
|
(0.2
|
)
|
(3.7
|
)
|
(47.0
|
)
|
|
– Brazil operations
|
(13.5
|
)
|
(16.1
|
)
|
(12.9
|
)
|
(0.2
|
)
|
(3.1
|
)
|
(45.8
|
)
|
|
– Lebanon operations
|
(0.2
|
)
|
(0.4
|
)
|
—
|
|
—
|
|
(0.6
|
)
|
(1.2
|
)
|
|
Adjusted
|
116.0
|
|
282.2
|
|
318.8
|
|
17.7
|
|
313.1
|
|
1,047.8
|
|
|
Retail Banking and Wealth Management
|
Adjusted profit before tax of
$6.5bn
was
$1.2bn
or
24%
higher. This reflected strong revenue growth, notably in net interest income from deposits, and an increase in Wealth Management, as well as lower LICs. This was partly offset by higher operating expenses. We achieved positive adjusted jaws of
4.0%
.
Adjusted revenue of
$20.3bn
was
$1.7bn
or
9%
higher, reflecting:
Higher revenue in Retail Banking (up
$0.8bn
or
6%
to
$13.5bn
):
|
•
|
Growth in revenue from current accounts, savings and deposits (up
$1.1bn
to
$6.3bn
) from higher net interest income due to wider spreads and higher balances, primarily in Hong Kong and also in the US and Mexico.
|
This was partly offset by:
|
•
|
Lower personal lending revenue (down
$0.3bn
to
$7.2bn
), reflecting mortgage spread compression, primarily in Hong Kong, mainland China and the US. This was partly offset by lending growth of
$22.2bn
, notably driven by mortgages in the UK and Hong Kong, where we grew our market share.
|
Higher revenue in Wealth Management (up
$0.9bn
or
18%
to
$6.2bn
):
|
•
|
Growth in insurance manufacturing revenue (up
$0.5bn
to
$1.9bn
) was a significant factor in the rise in other income. This included favourable movements in market impacts of
$0.3bn
in 2017 compared with adverse movements of
$0.4bn
in 2016, due to interest rate and equity market movements, notably in Asia and France, and to a lesser extent higher insurance sales in Asia
|
|
•
|
Higher investment distribution revenue (up
$0.4bn
to
$3.3bn
), driven by an increase in fee income, primarily from higher sales of mutual funds and retail securities in Hong Kong, reflecting increased investor confidence.
|
Adjusted LICs of
$1.0bn
were
$0.2bn
or
14%
lower, reflecting reductions in Turkey of
$85m
, and in the US of
$44m
, as credit
quality improved. This was partly offset in Mexico where higher LICs (
$24m
) reflected targeted growth in unsecured lending and associated higher delinquency rates. In the UK LICs of
$132m
were marginally higher, but remained at very low levels (10bps of the portfolio) as higher LICs relating to mortgages and unsecured lending were partly offset by a release from the sale of a loan portfolio.
Adjusted operating expenses of
$12.8bn
were
$0.7bn
or
5%
higher, mainly due to investment in growth initiatives, notably in retail business banking, in our international proposition as we introduced new products and services, and in mainland China. Transformational and other cost savings
partly offset inflation and higher performance-related pay
.
|
70
|
HSBC Holdings plc
|
2016 compared with 2015
Adjusted profit before tax of
$5.2bn
was
$0.3bn
or
5%
lower compared with 2015. This was driven by lower revenue in Wealth Management, together with higher LICs, while operating expenses were broadly unchanged.
Adjusted revenue of
$18.5bn
was
$0.3bn
or
2%
lower, as growth in Retail Banking revenue resulted in higher net interest income, but this was more than offset by a fall in Wealth Management, notably in net fee income.
Revenue of
$5.3bn
in Wealth Management fell by
$0.5bn
or
8%
, which resulted from:
|
•
|
lower investment distribution revenue (down
$0.3bn
to
$2.9bn
), mainly in Hong Kong as a result of lower fee income from mutual fund and retail securities turnover reflecting weaker market sentiment. This compared with a strong performance in the first half of 2015.
|
|
•
|
lower revenue in insurance manufacturing (down
$0.1bn
or
9%
to
$1.4bn
), mainly in other income reflecting higher adverse market impacts compared with 2015. This was partly offset by the value of new business.
|
Revenue of
$12.7bn
in Retail Banking increased by
$0.2bn
or
1%
resulted from:
|
•
|
income in current accounts, savings and deposits of
$5.2bn
increased by
$0.4bn
or
8%
, reflecting increased net interest income as a result of strong growth in balances, notably in Hong Kong and the UK. We also benefited from wider deposit spreads in Hong Kong and Mexico.
|
This was partly offset by:
|
•
|
lower personal lending revenue of
$7.5bn
fell by
$0.2bn
or
3%
, despite growth in balances, notably in Hong Kong, the UK and Mexico. The reduction in revenue primarily reflected spread compression, mainly in the UK.
|
Adjusted LICs of
$1.1bn
increased by
$0.1bn
or
12%
, mainly in Mexico reflecting our strategic focus on growing unsecured lending, as well as an increase in delinquency rates.
Adjusted operating expenses of
$12.2bn
were
$0.1bn
or
1%
lower as inflation and investments were substantially offset by transformational and other cost-saving initiatives.
A breakdown of RBWM by business unit is presented below to reflect the basis of how the revenue performance of the business units is assessed and managed.
|
RBWM – adjusted profit before tax data
|
|||||||||
|
Consists of
|
|||||||||
|
Total
RBWM
|
|
Banking
operations
|
|
Insurance manufacturing
|
|
Asset
management
|
|
||
|
Footnote
|
$m
|
|
$m
|
|
$m
|
|
$m
|
|
|
|
Year ended 31 Dec 2017
|
|||||||||
|
Net operating income before loan impairment charges and other credit risk provisions
|
3
|
20,287
|
|
17,235
|
|
1,997
|
|
1,055
|
|
|
– net interest income
|
13,959
|
|
11,947
|
|
2,012
|
|
—
|
|
|
|
– net fee income/(expense)
|
5,156
|
|
4,642
|
|
(494
|
)
|
1,008
|
|
|
|
– other income
|
1,172
|
|
646
|
|
479
|
|
47
|
|
|
|
LICs
|
(980
|
)
|
(980
|
)
|
—
|
|
—
|
|
|
|
Net operating income
|
19,307
|
|
16,255
|
|
1,997
|
|
1,055
|
|
|
|
Total operating expenses
|
(12,847
|
)
|
(11,748
|
)
|
(408
|
)
|
(691
|
)
|
|
|
Operating profit
|
6,460
|
|
4,507
|
|
1,589
|
|
364
|
|
|
|
Income from associates
|
18
|
|
7
|
|
11
|
|
—
|
|
|
|
Profit before tax
|
6,478
|
|
4,514
|
|
1,600
|
|
364
|
|
|
|
Year ended 31 Dec 2016
|
|||||||||
|
Net operating income before loan impairment charges and other credit risk provisions
|
3
|
18,542
|
|
16,029
|
|
1,526
|
|
987
|
|
|
– net interest income
|
12,919
|
|
11,015
|
|
1,895
|
|
9
|
|
|
|
– net fee income/(expense)
|
4,755
|
|
4,361
|
|
(538
|
)
|
932
|
|
|
|
– other income
|
868
|
|
653
|
|
169
|
|
46
|
|
|
|
LICs
|
(1,142
|
)
|
(1,142
|
)
|
—
|
|
—
|
|
|
|
Net operating income
|
17,400
|
|
14,887
|
|
1,526
|
|
987
|
|
|
|
Total operating expenses
|
(12,181
|
)
|
(11,147
|
)
|
(374
|
)
|
(660
|
)
|
|
|
Operating profit
|
5,219
|
|
3,740
|
|
1,152
|
|
327
|
|
|
|
Income from associates
|
20
|
|
—
|
|
20
|
|
—
|
|
|
|
Profit before tax
|
5,239
|
|
3,740
|
|
1,172
|
|
327
|
|
|
For footnote, see page
85
.
|
HSBC Holdings plc
|
71
|
Report of the Directors
| Financial summary
Insurance manufacturing
RBWM insurance manufacturing performance reported above excludes insurance manufacturing related adjusted net operating income of $202m (2016: $167m) and adjusted profit before tax of $145m (2016: $117m) contributed by other global businesses.
Of the total RBWM insurance manufacturing adjusted revenue of $1,997m, $1,893m was disclosed within Wealth Management (2016: $1,401m) and $104m within Other (2016: $125m) in the Management view of adjusted revenue on page
18
.
Annualised new business premiums of $2,805m (2016: $2,626m) were generated in Insurance manufacturing, of which $2,730m (2016: $2,557m) related to RBWM.
Distribution of insurance products by HSBC channels contributed $1,035m of net fee income (2016: $1,034m) of which RBWM channels earned $911m (2016: $909m). Of this total income, $629m was in respect of HSBC manufactured products (2016: $612m) and a corresponding fee expense is therefore recognised within insurance manufacturing.
|
Commercial Banking
|
Adjusted profit before tax of
$6.8bn
was
$0.9bn
or
15%
higher, reflecting higher revenue and lower LICs. This was partly offset by an increase in operating expenses. We achieved positive jaws of
1.3%
.
Adjusted revenue of
$13.2bn
was
$0.6bn
or
5%
higher, notably in net interest income, as strong growth in GLCM and increased revenue in C&L were partly offset by a reduction in GTRF revenue.
|
•
|
In GLCM, revenue increased by
$536m
or
13%
to
$4.8bn
, notably in Hong Kong and mainland China, as higher net interest income reflected wider spreads. Average balances grew 5%, reflecting customer deposit retention and new customer acquisitions. In the UK, average balance sheet growth of
10%
was more than offset by narrower spreads due to the impact of the base rate reduction in 2016.
|
|
•
|
In C&L, revenue increased by
$52m
or
1%
to
$5.1bn
. In the UK, net interest income increased as lending growth more than offset narrower spreads. By contrast, revenue in Asia was lower, mainly driven by lower net interest income, as balance growth in Hong Kong was more than offset by the effects of spread compression in Hong Kong and mainland China, in part reflecting competitive pressures. Revenue in the US was lower, as we reposition the portfolio towards higher returns.
|
|
•
|
In GTRF, revenue was
$21m
or
1%
lower at
$1.8bn
, representing a stabilisation in performance following a challenging 2016. Notably, revenue increased in both Asia and the UK, reflecting balance sheet growth. However, this was more than offset by a reduction in revenue in the Middle East and North Africa (‘MENA’), reflecting the effect of managed customer exits in the UAE.
|
Adjusted LICs of
$0.5bn
were
$0.5bn
or
49%
lower, notably in North America and the UK, primarily related to exposures in the oil and gas sectors, and were also lower in France and Spain. In Asia, lower LICs in Singapore and mainland China were largely offset by higher LICs in Hong Kong, across various sectors.
Adjusted operating expenses of
$5.9bn
were
$0.2bn
or
3%
higher. This reflected our continued investment in Global Standards and digital capabilities,
as well as inflation
. This was partly offset by a reduction from our cost-saving initiatives.
Adjusted RWAs increased by
5%
to
$301bn
reflecting growth in lending, mainly in Asia and Europe, in part funded through management initiatives which reduced RWAs by
$14
bn.
2016 compared with 2015
Adjusted profit before tax of
$5.9bn
was
$0.7bn
or
13%
higher than in 2015 primarily because of lower LICs, and revenue growth despite lower levels of global trade. We achieved positive adjusted jaws of
2.3%
, as revenue grew by
0.9%
, while costs fell by 1.4%.
Adjusted revenue rose by
$0.1bn
(or
1%
) to
$12.6bn
, reflecting an increase in net interest income in GLCM and C&L, partly offset by lower net fee income in GTRF.
|
•
|
In GLCM revenue increased by
$170m
(or
4%
) to
$4.2bn
, from growth in net interest income arising from increased balances and wider spreads in Hong Kong, also higher in the UK from strong balance growth, partly offset by narrower spreads. Net interest income fell in Canada and France as a result of narrower spreads.
|
|
•
|
Revenue in C&L increased by
$75m
(or
2%
) to
$5.0bn
, reflecting increased net interest income from continued loan growth in the UK, also higher in Mexico as a result of balance growth and wider spreads.
|
This was partly offset by:
|
•
|
In GTRF, revenue decreased by
$201m
(or
10%
) to
$1.8bn
, mainly reflecting lower net fee income as a result of customer and product repositioning in Hong Kong, also lower in the UAE from managed customer exits.
|
Adjusted LICs of
$1.0bn
reduced by
$0.5bn
or
33%
as 2016 included lower levels of individually assessed LICs, notably in Indonesia, where charges in 2015 related to a small number of exposures in a number of sectors. Lower charges in both the UK and the UAE also contributed to the reduction in individually assessed LICs. In addition, LICs in 2016 included a net release of collective allowances, notably in the oil and gas sector in the US and Canada, the UAE and Asia. This reflected a more positive outlook for this sector. By contrast, in 2015 we increased our collective allowances on exposures related to the oil and gas sector.
Adjusted operating expenses were
$0.1bn
or
1%
lower compared with 2015 as the effect of inflation and investment in Global Standards was more than offset by ongoing cost discipline and the impact of our transformation initiatives.
Management initiatives drove a further reduction in RWAs of $23bn in 2016, leading to a cumulative reduction of $46bn since our Investor Update in 2015, $18bn above our target.
|
72
|
HSBC Holdings plc
|
|
Global Banking and Markets
|
Adjusted profit before tax of
$5.8bn
was
$0.3bn
or
5%
higher, reflecting a strong revenue performance, partly offset by higher operating expenses, while achieving positive adjusted jaws of
1.3%
.
Adjusted revenue of
$15.1bn
was
$0.4bn
or
3%
higher, with growth in all of our businesses. The increase included a net adverse movement of
$0.2bn
on credit and funding valuation adjustments. Excluding these movements, adjusted revenue increased by
$0.6bn
or
4%
. The increase in revenue primarily reflected the following
:
|
•
|
Revenue growth in all of our transaction banking products, notably GLCM (up
$0.3bn
to
$2.2bn
) and Securities Services (up
$0.2bn
to
$1.7bn
). These increases reflected continued momentum as we won and retained client mandates, and benefited from higher interest rates, particularly in Asia and the US.
|
|
•
|
Global Markets revenue was resilient, (up
$33m
to
$6.7bn
), despite lower volatility in 2017, compared with more robust trading conditions in 2016. In Equities revenue increased by
$0.3bn
to
$1.3bn
, as we continued to capture market share from Prime Financing products. This was largely offset by Fixed Income, Currencies and Commodities, where revenue decreased by
$0.2bn
to
$5.4bn
, reflecting subdued trading conditions.
|
|
•
|
Global Banking revenue was marginally higher than 2016 (up
$16m
to
$3.8bn
), reflecting growth in lending balances and continued momentum in investment banking products, which broadly offset the effects of tightening spreads on lending in Asia.
|
Adjusted LICs of
$0.5bn
were broadly unchanged from the prior year. LICs in 2017 related to two large corporate exposures in Europe, compared with 2016, which included a small number of individually assessed LICs, notably on exposures in the oil and gas, and mining sectors in the US.
Adjusted operating expenses increased by
$0.1bn
or
1%
to
$8.9bn
, reflecting higher performance-related pay, pension and severance costs. Our continued cost management and efficiency improvements, and savings from technology investments, broadly offset the effects of inflation.
We have exceeded the RWA reduction target set in our Investor Update in June 2015, with a cumulative reduction in RWAs from management initiatives of
$128
bn. This includes a further RWA reduction of
$32
bn in 2017. Our adjusted RoRWA improved to
1.9%
from
1.7%
in 2016.
2016 compared with 2015
Adjusted profit before tax of
$5.5bn
was
$206m
higher than in 2015, as revenue increased and operating expenses decreased, reflecting transformational cost savings, partly offset by an increase in LICs. We achieved positive adjusted jaws of
4.9%
.
Adjusted revenue of
$14.7bn
rose
$0.4bn
or
3%
, despite adverse movements in credit and funding valuation adjustments compared with favourable movements in 2015 (net effect
$237m
lower), primarily relating to movements on our own credit spreads on structured liabilities. Excluding these movements, adjusted revenue rose
$0.7bn
or
5%
:
|
•
|
Global Markets revenue increased by
$0.6bn
or
11%
, mainly in Rates (up
$0.7bn
) and Credit (up
$0.2bn
), as we gained market share in Europe. This was partly in Equities where revenue fell by
$0.4bn
, primarily reflecting lower trading volumes in Europe and Asia.
|
|
•
|
In GLCM, revenue increased by
$0.1bn
from growth in average balances reflecting an increase in client mandates. We also benefited from wider deposit spreads.
|
Adjusted LICs increased (up
$0.4bn
), mainly driven by a small number of individually assessed exposures within the oil and gas, and metals and mining sectors, notably in the first half of 2016 in the US.
Adjusted operating expenses fell by
$158m
, reflecting reduced performance-related pay, disciplined cost management, efficiency improvements including technology delivery rationalisation, and FTE reductions. These reductions more than offset the investments we made in the business.
Through 2016, we continued to focus on delivery of our RWA reductions, and achieved a reduction of $11bn, which included $39bn through management initiatives, partly offset by business growth.
|
Global Private Banking
|
Adjusted profit before tax of
$296m
was
$24m
or
9%
higher as a reduction in operating expenses was partly offset by lower revenue. We achieved positive adjusted jaws of
3.2%
.
Adjusted revenue of
$1.7bn
was
$45m
or
3%
lower, mainly due to a reduction in net trading income and net fee income, reflecting the continued impact of client repositioning. Revenue from the markets that we have targeted for growth increased by 10%. This was mainly in Hong Kong, due to growth in investment fee income reflecting increased client activity, and higher net interest income from deposits reflecting wider spreads.
Adjusted LICs of
$16m
in 2017 primarily related to a single client in the UK.
Adjusted operating expenses of
$1.4bn
were
$85m
or
6%
lower, mainly as a result of a managed reduction in FTEs and the impact of our cost-saving initiatives.
In 2017, net new money inflows of
$15bn
in key markets targeted for growth, especially in Hong Kong, were offset by outflows resulting from the repositioning of the business.
|
HSBC Holdings plc
|
73
|
Report of the Directors
| Financial summary
2016 compared with 2015
Adjusted profit before tax of
$0.3bn
fell by
$101m
or
27%
as revenue decreased, partly offset by a reduction in operating expenses.
Adjusted revenue of
$1.7bn
fell by
$0.2bn
or
11%
, as net fee income from brokerage and trading activity in both Europe and Asia decreased. This reflected the continued impact of our client repositioning actions, in addition to adverse market sentiment and unfavourable market conditions throughout the year.
Adjusted operating expenses of
$1.5bn
decreased by
$106m
or
7%
, primarily as a result of a managed reduction in FTEs, and the impact of our cost-saving initiatives.
In 2016, we recorded negative net new money of $17bn, primarily reflecting the repositioning of the business. However, in key markets that we have targeted for growth we attracted positive net new money, notably in the UK, Channel Islands and Hong Kong.
|
74
|
HSBC Holdings plc
|
For GPB, a key measure of business performance is client assets, which is presented below.
|
GPB – reported client assets
35
|
||||||
|
2017
|
|
2016
|
|
2015
|
|
|
|
$bn
|
|
$bn
|
|
$bn
|
|
|
|
At 1 Jan
|
298
|
|
349
|
|
365
|
|
|
Net new money
|
—
|
|
(17
|
)
|
1
|
|
|
– of which: areas targeted for growth
|
15
|
|
2
|
|
14
|
|
|
Value change
|
21
|
|
(1
|
)
|
1
|
|
|
Disposals
|
(10
|
)
|
(24
|
)
|
—
|
|
|
Exchange and other
|
21
|
|
(9
|
)
|
(18
|
)
|
|
At 31 Dec
|
330
|
|
298
|
|
349
|
|
|
GPB – reported client assets by geography
|
|||||||
|
2017
|
|
2016
|
|
2015
|
|
||
|
Footnote
|
$bn
|
|
$bn
|
|
$bn
|
|
|
|
Europe
|
162
|
|
147
|
|
168
|
|
|
|
Asia
|
129
|
|
108
|
|
112
|
|
|
|
North America
|
39
|
|
40
|
|
61
|
|
|
|
Latin America
|
—
|
|
3
|
|
8
|
|
|
|
Middle East
|
36
|
—
|
|
—
|
|
—
|
|
|
At 31 Dec
|
330
|
|
298
|
|
349
|
|
|
For footnote, see page
85
.
|
Corporate Centre
|
Adjusted profit before tax of
$1.7bn
was
$0.4bn
or
17%
lower, reflecting lower revenue and higher operating expenses, partly offset by a fall in LICs.
Adjusted revenue fell by
$0.4bn
or
27%
to
$1.2bn
, mainly due to a decrease of
$0.7bn
related to the US run-off portfolio with respect to the disposal of the remaining loan portfolio during 2017. In Central Treasury revenue also decreased (down
$0.1bn
), due to:
|
•
|
higher interest on our debt (up
$0.3
bn), mainly from higher costs of debt issued to meet regulatory requirements; and
|
|
•
|
a reduction in revenue in BSM (
$0.3
bn)
reflecting lower yield rates and increased utilisation of the Group’s surplus liquidity by the global businesses; partly offset by:
|
|
•
|
favourable fair value movements relating to the economic hedging of interest and exchange rate risk on our long-term debt with long-term derivatives of
$0.1
bn, compared with adverse movements of
$0.3
bn in 2016.
|
Other income increased by
$0.4
bn, which included revaluation gains on investment properties.
Net loan impairment releases of
$182m
compared with adjusted LICs of
$22m
in 2016. This reflected lower LICs in the US run-off portfolio, and higher net releases related to our legacy credit portfolio.
Adjusted operating expenses of
$2.1bn
were
$0.2bn
or
8%
higher due to investment in regulatory programmes and compliance, partly offset by lower US run-off portfolio costs.
Adjusted income from associates rose by
$55m
or
2%
.
2016 compared with 2015
Adjusted profit before tax of
$2.0bn
was
$0.4bn
or
15%
lower, driven by a fall in revenue and lower income from associates, partly offset by lower operating expenses, notably a reduced charge relating to the UK bank levy.
Adjusted revenue fell by
$1.2bn
or
41%
, partly driven by reductions in our US run-off portfolio (down
$0.5bn
) as a result of lower average lending balances and portfolio sales. Revenue also fell in Central Treasury (down
$0.3bn
) as a result of:
|
•
|
higher adverse fair value movements relating to the economic hedging of interest and exchange rate risk on our long-term debt with long-term derivatives ($0.2bn); and
|
|
•
|
higher interest expense on our debt (up $0.3bn), mainly reflecting a higher cost of debt.
|
Adjusted LICs of
$22m
were
$5m
or
19%
lower compared with 2015, as increased charges in the US run-off portfolio were offset by higher releases of credit risk provisions in our Legacy Credit portfolio.
Adjusted operating expenses were
$0.9bn
or
31%
lower, partly reflecting the benefits of transformational savings in our technology, operations and other functions, and a lower UK bank levy charge (down $0.5bn).
Adjusted income from associates was
$85m
or
4%
lower, primarily in Saudi Arabia.
|
HSBC Holdings plc
|
75
|
Report of the Directors
| Financial summary
|
Analysis of reported results by geographical regions
|
|
HSBC reported profit/(loss) before tax and balance sheet data
|
|||||||||||||||
|
2017
|
|||||||||||||||
|
Europe
|
|
Asia
|
|
MENA
|
|
North America
|
|
Latin America
|
|
Intra-HSBC
items |
|
Total
|
|
||
|
Footnotes
|
$m
|
|
$m
|
|
$m
|
|
$m
|
|
$m
|
|
$m
|
|
$m
|
|
|
|
Net interest income
|
6,970
|
|
14,153
|
|
1,752
|
|
3,441
|
|
2,098
|
|
(238
|
)
|
28,176
|
|
|
|
Net fee income
|
4,161
|
|
5,631
|
|
619
|
|
1,880
|
|
520
|
|
—
|
|
12,811
|
|
|
|
Net trading income
|
3,425
|
|
2,944
|
|
180
|
|
527
|
|
405
|
|
238
|
|
7,719
|
|
|
|
Other income
|
33
|
2,864
|
|
3,078
|
|
109
|
|
865
|
|
202
|
|
(4,379
|
)
|
2,739
|
|
|
Net operating income before loan impairment charges and other credit risk provisions
|
3
|
17,420
|
|
25,806
|
|
2,660
|
|
6,713
|
|
3,225
|
|
(4,379
|
)
|
51,445
|
|
|
Loan impairment charges and other credit risk provisions
|
(658
|
)
|
(570
|
)
|
(207
|
)
|
189
|
|
(523
|
)
|
—
|
|
(1,769
|
)
|
|
|
Net operating income
|
16,762
|
|
25,236
|
|
2,453
|
|
6,902
|
|
2,702
|
|
(4,379
|
)
|
49,676
|
|
|
|
Total operating expenses
|
(18,665
|
)
|
(11,790
|
)
|
(1,394
|
)
|
(5,305
|
)
|
(2,109
|
)
|
4,379
|
|
(34,884
|
)
|
|
|
Operating profit/(loss)
|
(1,903
|
)
|
13,446
|
|
1,059
|
|
1,597
|
|
593
|
|
—
|
|
14,792
|
|
|
|
Share of profit in associates and joint ventures
|
39
|
|
1,883
|
|
442
|
|
4
|
|
7
|
|
—
|
|
2,375
|
|
|
|
Profit/(loss) before tax
|
(1,864
|
)
|
15,329
|
|
1,501
|
|
1,601
|
|
600
|
|
—
|
|
17,167
|
|
|
|
%
|
|
%
|
|
%
|
|
%
|
|
%
|
|
%
|
|
||||
|
Share of HSBC’s profit before tax
|
(10.8
|
)
|
89.3
|
|
8.7
|
|
9.3
|
|
3.5
|
|
|
|
100.0
|
|
|
|
Cost efficiency ratio
|
107.1
|
|
45.7
|
|
52.4
|
|
79.0
|
|
65.4
|
|
|
|
67.8
|
|
|
|
Balance sheet data
|
$m
|
|
$m
|
|
$m
|
|
$m
|
|
$m
|
|
$m
|
|
$m
|
|
|
|
Loans and advances to customers (net)
|
381,547
|
|
425,971
|
|
28,050
|
|
107,607
|
|
19,789
|
|
—
|
|
962,964
|
|
|
|
Total assets
|
1,169,515
|
|
1,008,498
|
|
57,469
|
|
391,292
|
|
48,413
|
|
(153,416
|
)
|
2,521,771
|
|
|
|
Customer accounts
|
505,182
|
|
657,395
|
|
34,658
|
|
143,432
|
|
23,795
|
|
—
|
|
1,364,462
|
|
|
|
Risk-weighted assets
|
37
|
311,612
|
|
357,808
|
|
59,196
|
|
131,276
|
|
36,372
|
|
—
|
|
871,337
|
|
|
76
|
HSBC Holdings plc
|
|
HSBC reported profit/(loss) before tax and balance sheet data (continued)
|
|||||||||||||||
|
2016
|
|||||||||||||||
|
Europe
|
|
Asia
|
|
MENA
|
|
North America
|
|
Latin America
|
|
Intra-HSBC
items
|
|
Total
|
|
||
|
Footnotes
|
$m
|
|
$m
|
|
$m
|
|
$m
|
|
$m
|
|
$m
|
|
$m
|
|
|
|
Net interest income
|
8,346
|
|
12,490
|
|
1,831
|
|
4,220
|
|
3,006
|
|
(80
|
)
|
29,813
|
|
|
|
Net fee income
|
4,247
|
|
5,200
|
|
709
|
|
1,898
|
|
723
|
|
—
|
|
12,777
|
|
|
|
Net trading income
|
4,949
|
|
3,127
|
|
385
|
|
462
|
|
449
|
|
80
|
|
9,452
|
|
|
|
Other income/(expense)
|
33
|
(2,026
|
)
|
2,503
|
|
44
|
|
485
|
|
(1,492
|
)
|
(3,590
|
)
|
(4,076
|
)
|
|
Net operating income before loan impairment charges and other credit risk provisions
|
3
|
15,516
|
|
23,320
|
|
2,969
|
|
7,065
|
|
2,686
|
|
(3,590
|
)
|
47,966
|
|
|
Loan impairment charges and other credit risk provisions
|
(446
|
)
|
(677
|
)
|
(316
|
)
|
(732
|
)
|
(1,229
|
)
|
—
|
|
(3,400
|
)
|
|
|
Net operating income
|
15,070
|
|
22,643
|
|
2,653
|
|
6,333
|
|
1,457
|
|
(3,590
|
)
|
44,566
|
|
|
|
Total operating expenses
|
(21,845
|
)
|
(10,785
|
)
|
(1,584
|
)
|
(6,147
|
)
|
(3,037
|
)
|
3,590
|
|
(39,808
|
)
|
|
|
Operating profit/(loss)
|
(6,775
|
)
|
11,858
|
|
1,069
|
|
186
|
|
(1,580
|
)
|
—
|
|
4,758
|
|
|
|
Share of profit/(loss) in associates and joint ventures
|
1
|
|
1,921
|
|
434
|
|
(1
|
)
|
(1
|
)
|
—
|
|
2,354
|
|
|
|
Profit/(loss) before tax
|
(6,774
|
)
|
13,779
|
|
1,503
|
|
185
|
|
(1,581
|
)
|
—
|
|
7,112
|
|
|
|
%
|
|
%
|
|
%
|
|
%
|
|
%
|
|
%
|
|
||||
|
Share of HSBC’s profit before tax
|
(95.2
|
)
|
193.7
|
|
21.1
|
|
2.6
|
|
(22.2
|
)
|
|
|
100.0
|
|
|
|
Cost efficiency ratio
|
140.8
|
|
46.2
|
|
53.4
|
|
87.0
|
|
113.1
|
|
|
|
83.0
|
|
|
|
Balance sheet data
|
$m
|
|
$m
|
|
$m
|
|
$m
|
|
$m
|
|
$m
|
|
$m
|
|
|
|
Loans and advances to customers (net)
|
336,670
|
|
365,430
|
|
30,740
|
|
111,710
|
|
16,954
|
|
—
|
|
861,504
|
|
|
|
– reported in held for sale
|
1,057
|
|
—
|
|
474
|
|
2,092
|
|
—
|
|
—
|
|
3,623
|
|
|
|
Total assets
|
1,068,446
|
|
965,730
|
|
60,472
|
|
409,021
|
|
43,137
|
|
(171,820
|
)
|
2,374,986
|
|
|
|
Customer accounts
|
446,615
|
|
631,723
|
|
34,766
|
|
138,790
|
|
20,492
|
|
—
|
|
1,272,386
|
|
|
|
– reported in held for sale
|
2,012
|
|
—
|
|
701
|
|
—
|
|
—
|
|
—
|
|
2,713
|
|
|
|
Risk-weighted assets
|
37
|
298,384
|
|
333,987
|
|
59,065
|
|
150,714
|
|
34,341
|
|
—
|
|
857,181
|
|
|
2015
|
|||||||||||||||
|
Net interest income
|
9,686
|
|
12,184
|
|
1,849
|
|
4,532
|
|
4,318
|
|
(38
|
)
|
32,531
|
|
|
|
Net fee income
|
4,702
|
|
6,032
|
|
822
|
|
2,018
|
|
1,131
|
|
—
|
|
14,705
|
|
|
|
Net trading income
|
3,968
|
|
3,090
|
|
418
|
|
545
|
|
664
|
|
38
|
|
8,723
|
|
|
|
Other income
|
33
|
2,116
|
|
3,997
|
|
90
|
|
562
|
|
479
|
|
(3,403
|
)
|
3,841
|
|
|
Net operating income before loan impairment charges and other credit risk provisions
|
3
|
20,472
|
|
25,303
|
|
3,179
|
|
7,657
|
|
6,592
|
|
(3,403
|
)
|
59,800
|
|
|
Loan impairment charges and other credit risk provisions
|
(519
|
)
|
(693
|
)
|
(470
|
)
|
(544
|
)
|
(1,495
|
)
|
—
|
|
(3,721
|
)
|
|
|
Net operating income
|
19,953
|
|
24,610
|
|
2,709
|
|
7,113
|
|
5,097
|
|
(3,403
|
)
|
56,079
|
|
|
|
Total operating expenses
|
(19,274
|
)
|
(10,889
|
)
|
(1,721
|
)
|
(6,501
|
)
|
(4,786
|
)
|
3,403
|
|
(39,768
|
)
|
|
|
Operating profit
|
679
|
|
13,721
|
|
988
|
|
612
|
|
311
|
|
—
|
|
16,311
|
|
|
|
Share of profit/(loss) in associates and joint ventures
|
9
|
|
2,042
|
|
504
|
|
2
|
|
(1
|
)
|
—
|
|
2,556
|
|
|
|
Profit before tax
|
688
|
|
15,763
|
|
1,492
|
|
614
|
|
310
|
|
—
|
|
18,867
|
|
|
|
%
|
|
%
|
|
%
|
|
%
|
|
%
|
|
%
|
|
||||
|
Share of HSBC’s profit before tax
|
3.6
|
|
83.5
|
|
7.9
|
|
3.3
|
|
1.7
|
|
|
|
100.0
|
|
|
|
Cost efficiency ratio
|
94.1
|
|
43.0
|
|
54.1
|
|
84.9
|
|
72.6
|
|
|
|
66.5
|
|
|
|
Balance sheet data
|
38
|
$m
|
|
$m
|
|
$m
|
|
$m
|
|
$m
|
|
$m
|
|
$m
|
|
|
Loans and advances to customers (net)
|
385,037
|
|
356,375
|
|
36,898
|
|
128,851
|
|
17,293
|
|
—
|
|
924,454
|
|
|
|
– reported in held for sale
|
—
|
|
—
|
|
—
|
|
2,020
|
|
17,001
|
|
—
|
|
19,021
|
|
|
|
Total assets
|
1,121,401
|
|
889,747
|
|
70,157
|
|
393,960
|
|
86,262
|
|
(151,871
|
)
|
2,409,656
|
|
|
|
Customer accounts
|
491,520
|
|
598,620
|
|
42,824
|
|
135,152
|
|
21,470
|
|
—
|
|
1,289,586
|
|
|
|
– reported in held for sale
|
—
|
|
—
|
|
—
|
|
1,588
|
|
15,094
|
|
—
|
|
16,682
|
|
|
|
Risk-weighted assets
|
37
|
327,219
|
|
459,680
|
|
70,585
|
|
191,611
|
|
73,425
|
|
—
|
|
1,102,995
|
|
|
HSBC Holdings plc
|
77
|
Report of the Directors
| Financial summary
|
Reconciliation of reported and adjusted items – geographical regions
|
|
Reconciliation of reported and adjusted items
|
|||||||||||||||||
|
|
|
2017
|
|||||||||||||||
|
|
|
Europe
|
|
Asia
|
|
MENA
|
|
North
America* |
|
Latin
America † |
|
Total
|
|
UK
|
|
Hong
Kong |
|
|
|
Footnotes
|
$m
|
|
$m
|
|
$m
|
|
$m
|
|
$m
|
|
$m
|
|
$m
|
|
$m
|
|
|
Revenue
|
3
|
|
|
|
|
|
|
|
|
|
|
|
|
|
|
|
|
|
Reported
|
39
|
17,420
|
|
25,806
|
|
2,660
|
|
6,713
|
|
3,225
|
|
51,445
|
|
12,922
|
|
16,117
|
|
|
Significant items
|
|
64
|
|
121
|
|
1
|
|
(93
|
)
|
(14
|
)
|
79
|
|
54
|
|
(51
|
)
|
|
– customer redress programmes
|
108
|
|
—
|
|
—
|
|
—
|
|
—
|
|
108
|
|
108
|
|
—
|
|
|
|
– DVA on derivative contracts
|
|
211
|
|
123
|
|
1
|
|
34
|
|
4
|
|
373
|
|
179
|
|
43
|
|
|
– fair value movements on non-qualifying hedges
|
32
|
(157
|
)
|
25
|
|
—
|
|
3
|
|
1
|
|
(128
|
)
|
(155
|
)
|
32
|
|
|
– gain on disposal of our investment in Vietnam Technological and Commercial Joint Stock Bank
|
|
—
|
|
(126
|
)
|
—
|
|
—
|
|
—
|
|
(126
|
)
|
—
|
|
(126
|
)
|
|
– gain on disposal of our membership interest in Visa – US
|
|
—
|
|
—
|
|
—
|
|
(308
|
)
|
—
|
|
(308
|
)
|
—
|
|
—
|
|
|
– investment in new businesses
|
|
—
|
|
99
|
|
—
|
|
—
|
|
—
|
|
99
|
|
—
|
|
—
|
|
|
– portfolio disposals
|
|
(20
|
)
|
—
|
|
—
|
|
178
|
|
—
|
|
158
|
|
—
|
|
—
|
|
|
– gain on disposal of operations in Brazil
|
—
|
|
—
|
|
—
|
|
—
|
|
(19
|
)
|
(19
|
)
|
—
|
|
—
|
|
|
|
– other acquisitions, disposals and dilutions
|
|
(78
|
)
|
—
|
|
—
|
|
—
|
|
—
|
|
(78
|
)
|
(78
|
)
|
—
|
|
|
Adjusted
|
39
|
17,484
|
|
25,927
|
|
2,661
|
|
6,620
|
|
3,211
|
|
51,524
|
|
12,976
|
|
16,066
|
|
|
LICs
|
|
|
|
|
|
|
|
|
|
|
|
|
|
|
|
|
|
|
Reported
|
|
(658
|
)
|
(570
|
)
|
(207
|
)
|
189
|
|
(523
|
)
|
(1,769
|
)
|
(492
|
)
|
(396
|
)
|
|
Adjusted
|
|
(658
|
)
|
(570
|
)
|
(207
|
)
|
189
|
|
(523
|
)
|
(1,769
|
)
|
(492
|
)
|
(396
|
)
|
|
Operating expenses
|
|
|
|
|
|
|
|
|
|
|
|
|
|
|
|
|
|
|
Reported
|
39
|
(18,665
|
)
|
(11,790
|
)
|
(1,394
|
)
|
(5,305
|
)
|
(2,109
|
)
|
(34,884
|
)
|
(15,086
|
)
|
(6,131
|
)
|
|
Significant items
|
|
2,804
|
|
640
|
|
34
|
|
200
|
|
66
|
|
3,744
|
|
2,469
|
|
308
|
|
|
– costs associated with portfolio disposals
|
|
36
|
|
—
|
|
—
|
|
17
|
|
—
|
|
53
|
|
—
|
|
—
|
|
|
– costs associated with the UK’s exit from the EU
|
|
28
|
|
—
|
|
—
|
|
—
|
|
—
|
|
28
|
|
18
|
|
—
|
|
|
– costs to achieve
|
|
1,908
|
|
623
|
|
34
|
|
371
|
|
66
|
|
3,002
|
|
1,766
|
|
291
|
|
|
– costs to establish UK ring-fenced bank
|
|
392
|
|
—
|
|
—
|
|
—
|
|
—
|
|
392
|
|
392
|
|
—
|
|
|
– customer redress programmes
|
655
|
|
—
|
|
—
|
|
—
|
|
—
|
|
655
|
|
655
|
|
—
|
|
|
|
– gain on partial settlement of pension obligation
|
—
|
|
—
|
|
—
|
|
(188
|
)
|
—
|
|
(188
|
)
|
—
|
|
—
|
|
|
|
– regulatory provisions in GPB
|
147
|
|
17
|
|
—
|
|
—
|
|
—
|
|
164
|
|
—
|
|
17
|
|
|
|
– settlements and provisions in connection with legal matters
|
|
(362
|
)
|
—
|
|
—
|
|
—
|
|
—
|
|
(362
|
)
|
(362
|
)
|
—
|
|
|
Adjusted
|
39
|
(15,861
|
)
|
(11,150
|
)
|
(1,360
|
)
|
(5,105
|
)
|
(2,043
|
)
|
(31,140
|
)
|
(12,617
|
)
|
(5,823
|
)
|
|
Share of profit in associates and joint ventures
|
|
|
|
|
|
|
|
|
|
|
|
|
|
|
|
|
|
|
Reported
|
|
39
|
|
1,883
|
|
442
|
|
4
|
|
7
|
|
2,375
|
|
38
|
|
8
|
|
|
Adjusted
|
|
39
|
|
1,883
|
|
442
|
|
4
|
|
7
|
|
2,375
|
|
38
|
|
8
|
|
|
Profit/(loss) before tax
|
|
|
|
|
|
|
|
|
|
|
|
|
|
|
|
|
|
|
Reported
|
|
(1,864
|
)
|
15,329
|
|
1,501
|
|
1,601
|
|
600
|
|
17,167
|
|
(2,618
|
)
|
9,598
|
|
|
Significant items
|
|
2,868
|
|
761
|
|
35
|
|
107
|
|
52
|
|
3,823
|
|
2,523
|
|
257
|
|
|
– revenue
|
|
64
|
|
121
|
|
1
|
|
(93
|
)
|
(14
|
)
|
79
|
|
54
|
|
(51
|
)
|
|
– operating expenses
|
|
2,804
|
|
640
|
|
34
|
|
200
|
|
66
|
|
3,744
|
|
2,469
|
|
308
|
|
|
Adjusted
|
40
|
1,004
|
|
16,090
|
|
1,536
|
|
1,708
|
|
652
|
|
20,990
|
|
(95
|
)
|
9,855
|
|
|
*
|
Of which US Principal: adjusted revenue $4,737m (RBWM: $1,194m; CMB: $947m; GB&M $1,951m; GPB: $317m); adjusted LICs $118m; adjusted operating expenses $(3,936)m; adjusted PBT $920m (RBWM: $(58)m; CMB: $432m; GB&M $527m; GPB: $64m); adjusted RWAs (RBWM: $11.0bn; CMB: $25.1bn; GB&M $45.2bn; GPB: $4.2bn; Corporate Centre: $10.0bn).
|
|
†
|
Of which Mexico: adjusted revenue $2,164m (RBWM: $1,442m; CMB: $350m; GB&M $284m); adjusted LICs $(473)m; adjusted operating expenses $(1,251)m; adjusted PBT $440m (RBWM: $147m; CMB: $105m; GB&M $162m); adjusted RWAs (RBWM: $6.9bn; CMB: $5.9bn; GB&M $8.3bn; Corporate Centre: $2.8bn).
|
|
78
|
HSBC Holdings plc
|
|
Reconciliation of reported and adjusted items (continued)
|
|||||||||||||||||
|
|
|
2016
|
|||||||||||||||
|
|
|
Europe
|
|
Asia
|
|
MENA
|
|
North
America* |
|
Latin
America † |
|
Total
|
|
UK
|
|
Hong
Kong |
|
|
|
Footnotes
|
$m
|
|
$m
|
|
$m
|
|
$m
|
|
$m
|
|
$m
|
|
$m
|
|
$m
|
|
|
Revenue
|
3
|
|
|
|
|
|
|
|
|
|
|
|
|
|
|
|
|
|
Reported
|
39
|
15,516
|
|
23,320
|
|
2,969
|
|
7,065
|
|
2,686
|
|
47,966
|
|
10,893
|
|
14,014
|
|
|
Currency translation
|
39
|
(545
|
)
|
8
|
|
(363
|
)
|
32
|
|
130
|
|
(736
|
)
|
(668
|
)
|
(53
|
)
|
|
Significant items
|
|
1,848
|
|
(7
|
)
|
(9
|
)
|
155
|
|
73
|
|
2,060
|
|
1,898
|
|
(1
|
)
|
|
– customer redress programmes
|
(2
|
)
|
—
|
|
—
|
|
—
|
|
—
|
|
(2
|
)
|
(2
|
)
|
—
|
|
|
|
– DVA on derivative contracts
|
|
(56
|
)
|
(15
|
)
|
—
|
|
9
|
|
36
|
|
(26
|
)
|
(63
|
)
|
(22
|
)
|
|
– fair value movements on non-qualifying hedges
|
32
|
563
|
|
17
|
|
—
|
|
107
|
|
—
|
|
687
|
|
532
|
|
26
|
|
|
– gain on the disposal of our membership
interest in Visa – Europe |
|
(573
|
)
|
—
|
|
(11
|
)
|
—
|
|
—
|
|
(584
|
)
|
(441
|
)
|
—
|
|
|
– gain on disposal of our membership
interest in Visa – US |
|
—
|
|
—
|
|
—
|
|
(116
|
)
|
—
|
|
(116
|
)
|
—
|
|
—
|
|
|
– own credit spread
|
25
|
1,782
|
|
(8
|
)
|
—
|
|
18
|
|
—
|
|
1,792
|
|
1,769
|
|
(5
|
)
|
|
– portfolio disposals
|
|
26
|
|
—
|
|
—
|
|
137
|
|
—
|
|
163
|
|
—
|
|
—
|
|
|
– loss and trading results from disposed-of
operations in Brazil |
|
—
|
|
—
|
|
—
|
|
—
|
|
273
|
|
273
|
|
—
|
|
—
|
|
|
– currency translation on significant items
|
|
108
|
|
(1
|
)
|
2
|
|
—
|
|
(236
|
)
|
(127
|
)
|
103
|
|
—
|
|
|
Adjusted
|
39
|
16,819
|
|
23,321
|
|
2,597
|
|
7,252
|
|
2,889
|
|
49,290
|
|
12,123
|
|
13,960
|
|
|
LICs
|
|
|
|
|
|
|
|
|
|
|
|
|
|
|
|
|
|
|
Reported
|
|
(446
|
)
|
(677
|
)
|
(316
|
)
|
(732
|
)
|
(1,229
|
)
|
(3,400
|
)
|
(245
|
)
|
(321
|
)
|
|
Currency translation
|
|
27
|
|
(3
|
)
|
27
|
|
1
|
|
(113
|
)
|
(61
|
)
|
33
|
|
1
|
|
|
Significant items
|
|
—
|
|
—
|
|
—
|
|
—
|
|
867
|
|
867
|
|
—
|
|
—
|
|
|
– trading results from disposed-of operations in Brazil
|
|
—
|
|
—
|
|
—
|
|
—
|
|
748
|
|
748
|
|
—
|
|
—
|
|
|
– currency translation on significant items
|
|
—
|
|
—
|
|
—
|
|
—
|
|
119
|
|
119
|
|
—
|
|
—
|
|
|
Adjusted
|
|
(419
|
)
|
(680
|
)
|
(289
|
)
|
(731
|
)
|
(475
|
)
|
(2,594
|
)
|
(212
|
)
|
(320
|
)
|
|
Operating expenses
|
|
|
|
|
|
|
|
|
|
|
|
|
|
|
|
|
|
|
Reported
|
39
|
(21,845
|
)
|
(10,785
|
)
|
(1,584
|
)
|
(6,147
|
)
|
(3,037
|
)
|
(39,808
|
)
|
(14,562
|
)
|
(5,646
|
)
|
|
Currency translation
|
39
|
300
|
|
11
|
|
143
|
|
(21
|
)
|
(100
|
)
|
331
|
|
367
|
|
22
|
|
|
Significant items
|
|
6,611
|
|
434
|
|
90
|
|
991
|
|
1,267
|
|
9,393
|
|
2,642
|
|
182
|
|
|
– costs associated with portfolio disposals
|
|
28
|
|
—
|
|
—
|
|
—
|
|
—
|
|
28
|
|
—
|
|
—
|
|
|
– costs to achieve
|
|
2,098
|
|
476
|
|
103
|
|
402
|
|
39
|
|
3,118
|
|
1,838
|
|
229
|
|
|
– costs to establish UK ring-fenced bank
|
|
223
|
|
—
|
|
—
|
|
—
|
|
—
|
|
223
|
|
223
|
|
—
|
|
|
– customer redress programmes
|
559
|
|
—
|
|
—
|
|
—
|
|
—
|
|
559
|
|
559
|
|
—
|
|
|
|
– impairment of GPB – Europe goodwill
|
|
3,240
|
|
—
|
|
—
|
|
—
|
|
—
|
|
3,240
|
|
—
|
|
—
|
|
|
– regulatory provisions in GPB
|
|
390
|
|
(46
|
)
|
—
|
|
—
|
|
—
|
|
344
|
|
—
|
|
(46
|
)
|
|
– settlements and provisions in connection
with legal matters |
|
94
|
|
—
|
|
—
|
|
587
|
|
—
|
|
681
|
|
50
|
|
—
|
|
|
– trading results from disposed-of operations
in Brazil |
|
—
|
|
—
|
|
—
|
|
—
|
|
1,059
|
|
1,059
|
|
—
|
|
—
|
|
|
– currency translation on significant items
|
|
(21
|
)
|
4
|
|
(13
|
)
|
2
|
|
169
|
|
141
|
|
(28
|
)
|
(1
|
)
|
|
Adjusted
|
39
|
(14,934
|
)
|
(10,340
|
)
|
(1,351
|
)
|
(5,177
|
)
|
(1,870
|
)
|
(30,084
|
)
|
(11,553
|
)
|
(5,442
|
)
|
|
Share of profit in associates and joint ventures
|
|
|
|
|
|
|
|
|
|
|
|
|
|
|
|
|
|
|
Reported
|
|
1
|
|
1,921
|
|
434
|
|
(1
|
)
|
(1
|
)
|
2,354
|
|
1
|
|
22
|
|
|
Currency translation
|
|
1
|
|
(34
|
)
|
—
|
|
—
|
|
—
|
|
(33
|
)
|
1
|
|
(1
|
)
|
|
Significant items
|
|
—
|
|
—
|
|
—
|
|
—
|
|
1
|
|
1
|
|
—
|
|
—
|
|
|
– trading results from disposed-of operations
in Brazil |
|
—
|
|
—
|
|
—
|
|
—
|
|
1
|
|
1
|
|
—
|
|
—
|
|
|
– currency translation on significant items
|
|
—
|
|
—
|
|
—
|
|
—
|
|
—
|
|
—
|
|
—
|
|
—
|
|
|
Adjusted
|
|
2
|
|
1,887
|
|
434
|
|
(1
|
)
|
—
|
|
2,322
|
|
2
|
|
21
|
|
|
Profit/(loss) before tax
|
|
|
|
|
|
|
|
|
|
|
|
|
|
|
|
|
|
|
Reported
|
|
(6,774
|
)
|
13,779
|
|
1,503
|
|
185
|
|
(1,581
|
)
|
7,112
|
|
(3,913
|
)
|
8,069
|
|
|
Currency translation
|
|
(217
|
)
|
(18
|
)
|
(193
|
)
|
12
|
|
(83
|
)
|
(499
|
)
|
(267
|
)
|
(31
|
)
|
|
Significant items
|
|
8,459
|
|
427
|
|
81
|
|
1,146
|
|
2,208
|
|
12,321
|
|
4,540
|
|
181
|
|
|
– revenue
|
|
1,848
|
|
(7
|
)
|
(9
|
)
|
155
|
|
73
|
|
2,060
|
|
1,898
|
|
(1
|
)
|
|
– LICs
|
|
—
|
|
—
|
|
—
|
|
—
|
|
867
|
|
867
|
|
—
|
|
—
|
|
|
– operating expenses
|
|
6,611
|
|
434
|
|
90
|
|
991
|
|
1,267
|
|
9,393
|
|
2,642
|
|
182
|
|
|
– share of profit in associates and joint ventures
|
|
—
|
|
—
|
|
—
|
|
—
|
|
1
|
|
1
|
|
—
|
|
—
|
|
|
Adjusted
|
|
1,468
|
|
14,188
|
|
1,391
|
|
1,343
|
|
544
|
|
18,934
|
|
360
|
|
8,219
|
|
|
*
|
Of which US Principal: adjusted revenue $4,698m (RBWM: $1,161m; CMB: $981m; GB&M $1,979m; GPB: $303m); adjusted LICs $(503)m; adjusted operating expenses $(3,808)m; adjusted PBT $387m (RBWM: $(81)m; CMB: $341m; GB&M $100m; GPB: $67m); adjusted RWAs (RBWM: $11.0bn; CMB: $26.8bn; GB&M $48.3bn; GPB: $4.1bn; Corporate Centre: $13.6bn).
|
|
†
|
Of which Mexico: adjusted revenue $1,949m (RBWM: $1,285m; CMB: $336m; GB&M $217m; GPB: $13m); adjusted LICs $(450)m; adjusted operating expenses $(1,225)m; adjusted PBT $274m (RBWM: $100m; CMB: $83m; GB&M $79m; GPB: $5m); adjusted RWAs (RBWM: $6.4bn; CMB: $6.3bn; GB&M $6.7bn; Corporate Centre: $1.7bn).
|
|
HSBC Holdings plc
|
79
|
Report of the Directors
| Financial summary
|
Reconciliation of reported and adjusted items (continued)
|
|||||||||||||||||
|
|
|
2015
|
|||||||||||||||
|
|
|
Europe
|
|
Asia
|
|
MENA
|
|
North
America |
|
Latin
America |
|
Total
|
|
UK
|
|
Hong
Kong |
|
|
|
Footnotes
|
$m
|
|
$m
|
|
$m
|
|
$m
|
|
$m
|
|
$m
|
|
$m
|
|
$m
|
|
|
Revenue
|
3
|
|
|
|
|
|
|
|
|
|
|
|
|
|
|
|
|
|
Reported
|
39
|
20,472
|
|
25,303
|
|
3,179
|
|
7,657
|
|
6,592
|
|
59,800
|
|
15,493
|
|
15,616
|
|
|
Currency translation
|
39
|
(2,263
|
)
|
(330
|
)
|
(497
|
)
|
(30
|
)
|
(685
|
)
|
(3,727
|
)
|
(2,298
|
)
|
(74
|
)
|
|
Significant items
|
|
(611
|
)
|
(1,425
|
)
|
(10
|
)
|
98
|
|
(3,703
|
)
|
(5,651
|
)
|
(546
|
)
|
(1,378
|
)
|
|
– customer redress programmes
|
10
|
|
—
|
|
—
|
|
—
|
|
—
|
|
10
|
|
10
|
|
—
|
|
|
|
– DVA on derivative contracts
|
|
(95
|
)
|
(58
|
)
|
(1
|
)
|
(21
|
)
|
(55
|
)
|
(230
|
)
|
(78
|
)
|
(13
|
)
|
|
– fair value movements on non-qualifying hedges
|
32
|
200
|
|
2
|
|
—
|
|
124
|
|
1
|
|
327
|
|
204
|
|
6
|
|
|
– gain on the partial sale of shareholding in Industrial Bank
|
|
—
|
|
(1,372
|
)
|
—
|
|
—
|
|
—
|
|
(1,372
|
)
|
—
|
|
(1,372
|
)
|
|
– own credit spread
|
25
|
(771
|
)
|
(3
|
)
|
(9
|
)
|
(219
|
)
|
—
|
|
(1,002
|
)
|
(731
|
)
|
(4
|
)
|
|
– portfolio disposals
|
|
—
|
|
—
|
|
—
|
|
214
|
|
—
|
|
214
|
|
—
|
|
—
|
|
|
– trading results from disposed-of operations in Brazil
|
|
—
|
|
—
|
|
—
|
|
—
|
|
(3,532
|
)
|
(3,532
|
)
|
—
|
|
—
|
|
|
– currency translation on significant items
|
|
45
|
|
6
|
|
—
|
|
—
|
|
(117
|
)
|
(66
|
)
|
49
|
|
5
|
|
|
Adjusted
|
39
|
17,598
|
|
23,548
|
|
2,672
|
|
7,725
|
|
2,204
|
|
50,422
|
|
12,649
|
|
14,164
|
|
|
LICs
|
|
|
|
|
|
|
|
|
|
|
|
|
|
|
|
|
|
|
Reported
|
|
(519
|
)
|
(693
|
)
|
(470
|
)
|
(544
|
)
|
(1,495
|
)
|
(3,721
|
)
|
(248
|
)
|
(155
|
)
|
|
Currency translation
|
|
24
|
|
11
|
|
47
|
|
(5
|
)
|
50
|
|
127
|
|
34
|
|
1
|
|
|
Significant items
|
|
—
|
|
—
|
|
—
|
|
—
|
|
1,015
|
|
1,015
|
|
—
|
|
—
|
|
|
– trading results from disposed-of operations in Brazil
|
|
—
|
|
—
|
|
—
|
|
—
|
|
965
|
|
965
|
|
—
|
|
—
|
|
|
– currency translation on significant items
|
|
—
|
|
—
|
|
—
|
|
—
|
|
50
|
|
50
|
|
—
|
|
—
|
|
|
Adjusted
|
|
(495
|
)
|
(682
|
)
|
(423
|
)
|
(549
|
)
|
(430
|
)
|
(2,579
|
)
|
(214
|
)
|
(154
|
)
|
|
Operating expenses
|
|
|
|
|
|
|
|
|
|
|
|
|
|
|
|
|
|
|
Reported
|
39
|
(19,274
|
)
|
(10,889
|
)
|
(1,721
|
)
|
(6,501
|
)
|
(4,786
|
)
|
(39,768
|
)
|
(15,555
|
)
|
(5,686
|
)
|
|
Currency translation
|
39
|
1,668
|
|
191
|
|
223
|
|
13
|
|
417
|
|
2,434
|
|
1,698
|
|
30
|
|
|
Significant items
|
|
2,115
|
|
131
|
|
14
|
|
851
|
|
2,766
|
|
5,877
|
|
1,858
|
|
48
|
|
|
– costs to achieve
|
|
600
|
|
122
|
|
14
|
|
103
|
|
69
|
|
908
|
|
536
|
|
43
|
|
|
– costs to establish the UK ring-fenced bank
|
|
89
|
|
—
|
|
—
|
|
—
|
|
—
|
|
89
|
|
89
|
|
—
|
|
|
– customer redress programmes
|
541
|
|
—
|
|
—
|
|
—
|
|
—
|
|
541
|
|
541
|
|
—
|
|
|
|
– regulatory provisions in GPB
|
|
172
|
|
—
|
|
—
|
|
—
|
|
—
|
|
172
|
|
—
|
|
—
|
|
|
– restructuring and other related costs
|
|
68
|
|
8
|
|
1
|
|
34
|
|
6
|
|
117
|
|
50
|
|
6
|
|
|
– settlements and provisions in connection with legal matters
|
|
935
|
|
—
|
|
—
|
|
714
|
|
—
|
|
1,649
|
|
935
|
|
—
|
|
|
– trading results from disposed-of operations in Brazil
|
|
—
|
|
—
|
|
—
|
|
—
|
|
2,579
|
|
2,579
|
|
—
|
|
—
|
|
|
– currency translation on significant items
|
|
(290
|
)
|
1
|
|
(1
|
)
|
—
|
|
112
|
|
(178
|
)
|
(293
|
)
|
(1
|
)
|
|
Adjusted
|
39
|
(15,491
|
)
|
(10,567
|
)
|
(1,484
|
)
|
(5,637
|
)
|
(1,603
|
)
|
(31,457
|
)
|
(11,999
|
)
|
(5,608
|
)
|
|
Share of profit in associates and joint ventures
|
|
|
|
|
|
|
|
|
|
|
|
|
|
|
|
|
|
|
Reported
|
|
9
|
|
2,042
|
|
504
|
|
2
|
|
(1
|
)
|
2,556
|
|
10
|
|
31
|
|
|
Currency translation
|
|
—
|
|
(149
|
)
|
—
|
|
—
|
|
—
|
|
(149
|
)
|
(1
|
)
|
—
|
|
|
Significant items
|
|
—
|
|
—
|
|
—
|
|
—
|
|
2
|
|
2
|
|
—
|
|
—
|
|
|
– trading results from disposed-of operations in Brazil
|
|
—
|
|
—
|
|
—
|
|
—
|
|
1
|
|
1
|
|
—
|
|
—
|
|
|
– currency translation on significant items
|
|
—
|
|
—
|
|
—
|
|
—
|
|
1
|
|
1
|
|
—
|
|
—
|
|
|
Adjusted
|
|
9
|
|
1,893
|
|
504
|
|
2
|
|
1
|
|
2,409
|
|
9
|
|
31
|
|
|
Profit/(loss) before tax
|
|
|
|
|
|
|
|
|
|
|
|
|
|
|
|
|
|
|
Reported
|
|
688
|
|
15,763
|
|
1,492
|
|
614
|
|
310
|
|
18,867
|
|
(300
|
)
|
9,806
|
|
|
Currency translation
|
|
(571
|
)
|
(277
|
)
|
(227
|
)
|
(22
|
)
|
(218
|
)
|
(1,315
|
)
|
(567
|
)
|
(43
|
)
|
|
Significant items
|
|
1,504
|
|
(1,294
|
)
|
4
|
|
949
|
|
80
|
|
1,243
|
|
1,312
|
|
(1,330
|
)
|
|
– revenue
|
|
(611
|
)
|
(1,425
|
)
|
(10
|
)
|
98
|
|
(3,703
|
)
|
(5,651
|
)
|
(546
|
)
|
(1,378
|
)
|
|
– LICs
|
|
—
|
|
—
|
|
—
|
|
—
|
|
1,015
|
|
1,015
|
|
—
|
|
—
|
|
|
– operating expenses
|
|
2,115
|
|
131
|
|
14
|
|
851
|
|
2,766
|
|
5,877
|
|
1,858
|
|
48
|
|
|
– share of profit in associates and joint ventures
|
|
—
|
|
—
|
|
—
|
|
—
|
|
2
|
|
2
|
|
—
|
|
—
|
|
|
Adjusted
|
|
1,621
|
|
14,192
|
|
1,269
|
|
1,541
|
|
172
|
|
18,795
|
|
445
|
|
8,433
|
|
For footnotes, see page
85
.
|
80
|
HSBC Holdings plc
|
|
Analysis of reported results by country
|
|
Profit/(loss) before tax by priority markets within global businesses
|
|||||||||||||
|
Retail Banking
and Wealth Management |
|
Commercial
Banking |
|
Global
Banking and Markets |
|
Global
Private Banking |
|
Corporate
Centre |
|
Total |
|
||
|
Footnotes
|
$m
|
|
$m
|
|
$m
|
|
$m
|
|
$m
|
|
$m
|
|
|
|
Europe
|
(159
|
)
|
1,899
|
|
777
|
|
(231
|
)
|
(4,150
|
)
|
(1,864
|
)
|
|
|
– UK
|
(177
|
)
|
1,539
|
|
192
|
|
(23
|
)
|
(4,149
|
)
|
(2,618
|
)
|
|
|
of which: HSBC Holdings
|
41
|
(658
|
)
|
(372
|
)
|
(739
|
)
|
(89
|
)
|
(3,308
|
)
|
(5,166
|
)
|
|
– France
|
(12
|
)
|
204
|
|
228
|
|
5
|
|
(156
|
)
|
269
|
|
|
|
– Germany
|
21
|
|
61
|
|
141
|
|
9
|
|
39
|
|
271
|
|
|
|
– Switzerland
|
(2
|
)
|
7
|
|
1
|
|
(192
|
)
|
2
|
|
(184
|
)
|
|
|
– other
|
11
|
|
88
|
|
215
|
|
(30
|
)
|
114
|
|
398
|
|
|
|
Asia
|
5,372
|
|
3,394
|
|
3,135
|
|
285
|
|
3,143
|
|
15,329
|
|
|
|
– Hong Kong
|
5,039
|
|
2,460
|
|
1,357
|
|
257
|
|
485
|
|
9,598
|
|
|
|
– Australia
|
122
|
|
101
|
|
108
|
|
(1
|
)
|
35
|
|
365
|
|
|
|
– India
|
21
|
|
159
|
|
362
|
|
—
|
|
374
|
|
916
|
|
|
|
– Indonesia
|
(24
|
)
|
76
|
|
98
|
|
—
|
|
30
|
|
180
|
|
|
|
– mainland China
|
(44
|
)
|
161
|
|
387
|
|
(4
|
)
|
1,988
|
|
2,488
|
|
|
|
– Malaysia
|
85
|
|
50
|
|
162
|
|
—
|
|
28
|
|
325
|
|
|
|
– Singapore
|
69
|
|
94
|
|
202
|
|
34
|
|
64
|
|
463
|
|
|
|
– Taiwan
|
43
|
|
10
|
|
107
|
|
(1
|
)
|
40
|
|
199
|
|
|
|
– other
|
61
|
|
283
|
|
352
|
|
—
|
|
99
|
|
795
|
|
|
|
Middle East and North Africa
|
144
|
|
199
|
|
593
|
|
—
|
|
565
|
|
1,501
|
|
|
|
– Egypt
|
26
|
|
69
|
|
164
|
|
—
|
|
46
|
|
305
|
|
|
|
– UAE
|
110
|
|
53
|
|
268
|
|
—
|
|
48
|
|
479
|
|
|
|
– Saudi Arabia
|
—
|
|
—
|
|
—
|
|
—
|
|
441
|
|
441
|
|
|
|
– other
|
8
|
|
77
|
|
161
|
|
—
|
|
30
|
|
276
|
|
|
|
North America
|
305
|
|
932
|
|
671
|
|
67
|
|
(374
|
)
|
1,601
|
|
|
|
– US
|
166
|
|
435
|
|
494
|
|
66
|
|
(444
|
)
|
717
|
|
|
|
– Canada
|
61
|
|
453
|
|
132
|
|
—
|
|
43
|
|
689
|
|
|
|
– other
|
78
|
|
44
|
|
45
|
|
1
|
|
27
|
|
195
|
|
|
|
Latin America
|
161
|
|
199
|
|
259
|
|
—
|
|
(19
|
)
|
600
|
|
|
|
– Mexico
|
139
|
|
105
|
|
158
|
|
—
|
|
(12
|
)
|
390
|
|
|
|
– other
|
22
|
|
94
|
|
101
|
|
—
|
|
(7
|
)
|
210
|
|
|
|
Year ended 31 Dec 2017
|
5,823
|
|
6,623
|
|
5,435
|
|
121
|
|
(835
|
)
|
17,167
|
|
|
|
Europe
|
524
|
|
2,129
|
|
1,009
|
|
(3,695
|
)
|
(6,741
|
)
|
(6,774
|
)
|
|
|
– UK
|
338
|
|
1,834
|
|
385
|
|
86
|
|
(6,556
|
)
|
(3,913
|
)
|
|
|
of which: HSBC Holdings
|
41, 42
|
(676
|
)
|
(379
|
)
|
(425
|
)
|
(63
|
)
|
(3,748
|
)
|
(5,291
|
)
|
|
– France
|
147
|
|
198
|
|
289
|
|
9
|
|
(53
|
)
|
590
|
|
|
|
– Germany
|
23
|
|
68
|
|
142
|
|
7
|
|
13
|
|
253
|
|
|
|
– Switzerland
|
—
|
|
9
|
|
—
|
|
(493
|
)
|
(7
|
)
|
(491
|
)
|
|
|
– other
|
16
|
|
20
|
|
193
|
|
(3,304
|
)
|
(138
|
)
|
(3,213
|
)
|
|
|
Asia
|
4,115
|
|
2,920
|
|
3,211
|
|
268
|
|
3,265
|
|
13,779
|
|
|
|
– Hong Kong
|
3,796
|
|
2,191
|
|
1,298
|
|
221
|
|
563
|
|
8,069
|
|
|
|
– Australia
|
108
|
|
74
|
|
156
|
|
—
|
|
31
|
|
369
|
|
|
|
– India
|
15
|
|
123
|
|
355
|
|
10
|
|
240
|
|
743
|
|
|
|
– Indonesia
|
(9
|
)
|
66
|
|
110
|
|
—
|
|
11
|
|
178
|
|
|
|
– mainland China
|
(72
|
)
|
68
|
|
456
|
|
(3
|
)
|
2,158
|
|
2,607
|
|
|
|
– Malaysia
|
65
|
|
65
|
|
172
|
|
—
|
|
53
|
|
355
|
|
|
|
– Singapore
|
107
|
|
43
|
|
170
|
|
42
|
|
77
|
|
439
|
|
|
|
– Taiwan
|
24
|
|
10
|
|
102
|
|
(1
|
)
|
13
|
|
148
|
|
|
|
– other
|
81
|
|
280
|
|
392
|
|
(1
|
)
|
119
|
|
871
|
|
|
|
Middle East and North Africa
|
20
|
|
290
|
|
652
|
|
—
|
|
541
|
|
1,503
|
|
|
|
– Egypt
|
58
|
|
104
|
|
213
|
|
—
|
|
79
|
|
454
|
|
|
|
– UAE
|
83
|
|
94
|
|
298
|
|
—
|
|
5
|
|
480
|
|
|
|
– Saudi Arabia
|
1
|
|
—
|
|
—
|
|
—
|
|
434
|
|
435
|
|
|
|
– other
|
(122
|
)
|
92
|
|
141
|
|
—
|
|
23
|
|
134
|
|
|
|
North America
|
64
|
|
648
|
|
259
|
|
90
|
|
(876
|
)
|
185
|
|
|
|
– US
|
(28
|
)
|
336
|
|
86
|
|
67
|
|
(932
|
)
|
(471
|
)
|
|
|
– Canada
|
46
|
|
292
|
|
155
|
|
—
|
|
47
|
|
540
|
|
|
|
– other
|
46
|
|
20
|
|
18
|
|
23
|
|
9
|
|
116
|
|
|
|
Latin America
|
(136
|
)
|
59
|
|
309
|
|
9
|
|
(1,822
|
)
|
(1,581
|
)
|
|
|
– Mexico
|
94
|
|
84
|
|
79
|
|
5
|
|
(15
|
)
|
247
|
|
|
|
– other
|
(230
|
)
|
(25
|
)
|
230
|
|
4
|
|
(1,807
|
)
|
(1,828
|
)
|
|
|
of which: Brazil
|
(281
|
)
|
(139
|
)
|
176
|
|
4
|
|
(1,836
|
)
|
(2,076
|
)
|
|
|
Year ended 31 Dec 2016
|
4,587
|
|
6,046
|
|
5,440
|
|
(3,328
|
)
|
(5,633
|
)
|
7,112
|
|
|
|
HSBC Holdings plc
|
81
|
Report of the Directors
| Financial summary
|
Profit/(loss) before tax by priority markets within global businesses (continued)
|
|||||||||||||
|
Retail Banking
and Wealth Management |
|
Commercial
Banking |
|
Global
Banking and Markets |
|
Global Private Banking
|
|
Corporate
Centre
|
|
Total
|
|
||
|
Footnotes
|
$m
|
|
$m
|
|
$m
|
|
$m
|
|
$m
|
|
$m
|
|
|
|
Europe
|
914
|
|
1,953
|
|
122
|
|
(93
|
)
|
(2,208
|
)
|
688
|
|
|
|
– UK
|
560
|
|
1,722
|
|
(361
|
)
|
126
|
|
(2,347
|
)
|
(300
|
)
|
|
|
of which: HSBC Holdings
|
41, 42
|
(530
|
)
|
(399
|
)
|
(274
|
)
|
(91
|
)
|
(2,892
|
)
|
(4,186
|
)
|
|
– France
|
357
|
|
130
|
|
84
|
|
14
|
|
54
|
|
639
|
|
|
|
– Germany
|
23
|
|
66
|
|
137
|
|
20
|
|
(7
|
)
|
239
|
|
|
|
– Switzerland
|
—
|
|
8
|
|
—
|
|
(267
|
)
|
43
|
|
(216
|
)
|
|
|
– other
|
(26
|
)
|
27
|
|
262
|
|
14
|
|
49
|
|
326
|
|
|
|
Asia
|
4,154
|
|
2,843
|
|
3,653
|
|
252
|
|
4,861
|
|
15,763
|
|
|
|
– Hong Kong
|
3,811
|
|
2,317
|
|
1,629
|
|
177
|
|
1,872
|
|
9,806
|
|
|
|
– Australia
|
60
|
|
51
|
|
232
|
|
—
|
|
30
|
|
373
|
|
|
|
– India
|
(25
|
)
|
79
|
|
321
|
|
14
|
|
217
|
|
606
|
|
|
|
– Indonesia
|
(6
|
)
|
(128
|
)
|
76
|
|
—
|
|
51
|
|
(7
|
)
|
|
|
– mainland China
|
32
|
|
97
|
|
574
|
|
(3
|
)
|
2,360
|
|
3,060
|
|
|
|
– Malaysia
|
118
|
|
78
|
|
196
|
|
—
|
|
50
|
|
442
|
|
|
|
– Singapore
|
105
|
|
81
|
|
193
|
|
65
|
|
63
|
|
507
|
|
|
|
– Taiwan
|
10
|
|
17
|
|
113
|
|
—
|
|
15
|
|
155
|
|
|
|
– other
|
49
|
|
251
|
|
319
|
|
(1
|
)
|
203
|
|
821
|
|
|
|
Middle East and North Africa
|
(1
|
)
|
188
|
|
610
|
|
2
|
|
693
|
|
1,492
|
|
|
|
– Egypt
|
50
|
|
92
|
|
179
|
|
—
|
|
89
|
|
410
|
|
|
|
– UAE
|
85
|
|
(24
|
)
|
270
|
|
—
|
|
36
|
|
367
|
|
|
|
– Saudi Arabia
|
2
|
|
—
|
|
—
|
|
—
|
|
498
|
|
500
|
|
|
|
– other
|
(138
|
)
|
120
|
|
161
|
|
2
|
|
70
|
|
215
|
|
|
|
North America
|
(23
|
)
|
445
|
|
444
|
|
59
|
|
(311
|
)
|
614
|
|
|
|
– US
|
(112
|
)
|
194
|
|
319
|
|
64
|
|
(424
|
)
|
41
|
|
|
|
– Canada
|
57
|
|
240
|
|
101
|
|
—
|
|
87
|
|
485
|
|
|
|
– other
|
32
|
|
11
|
|
24
|
|
(5
|
)
|
26
|
|
88
|
|
|
|
Latin America
|
(245
|
)
|
156
|
|
329
|
|
3
|
|
67
|
|
310
|
|
|
|
– Mexico
|
70
|
|
(8
|
)
|
(70
|
)
|
(2
|
)
|
42
|
|
32
|
|
|
|
– other
|
(315
|
)
|
164
|
|
399
|
|
5
|
|
25
|
|
278
|
|
|
|
– of which: Brazil
|
(344
|
)
|
13
|
|
341
|
|
6
|
|
(11
|
)
|
5
|
|
|
|
Year ended 31 Dec 2015
|
4,799
|
|
5,585
|
|
5,158
|
|
223
|
|
3,102
|
|
18,867
|
|
|
For footnotes, see page
85
.
|
82
|
HSBC Holdings plc
|
|
Other information
|
|
|
Page
|
|
|
Funds under management and assets held in custody
|
61
|
|
Taxes paid by region and country
|
83
|
|
Conduct-related matters
|
84
|
|
Carbon dioxide emissions
|
84
|
|
Disclosure controls
|
78
|
|
Management’s assessment of internal controls over financial reporting
|
79
|
|
Funds under management and assets held
in custody
|
|
Funds under management
|
|||||
|
2017
|
|
2016
|
|
||
|
Footnote
|
$bn
|
|
$bn
|
|
|
|
Funds under management
|
43
|
||||
|
At 1 Jan
|
831
|
|
896
|
|
|
|
Net new money
|
2
|
|
(8
|
)
|
|
|
Value change
|
77
|
|
25
|
|
|
|
Exchange and other
|
33
|
|
(40
|
)
|
|
|
Disposals
|
0
|
|
(42
|
)
|
|
|
At 31 Dec
|
943
|
|
831
|
|
|
|
Funds under management by business
|
|||||
|
Global Asset Management
|
462
|
|
410
|
|
|
|
Global Private Banking
|
258
|
|
222
|
|
|
|
Affiliates
|
4
|
|
2
|
|
|
|
Other
|
219
|
|
197
|
|
|
|
At 31 Dec
|
943
|
|
831
|
|
|
For footnote, see page
85
.
Funds under management (‘FuM’) represents assets managed, either actively or passively, on behalf of our customers. At 31 December 2017, FuM amounted to $943bn, an increase of 13% as a result of favourable market performance and favourable foreign currency movements.
Global Asset Management FuM increased by 13% to $462bn compared with 31 December 2016. Excluding foreign currency movements, FuM increased by 6% primarily as a result of positive market performance, with net new money from our retail and institutional customers mainly from fixed income and multi asset products in Asia and money market solutions in North America, partly offset by net outflows from our customers in Europe.
GPB FuM increased by 16% to $258bn compared with 31 December 2016. Excluding currency translation, FuM increased by 6%, reflecting the market performance and the positive net new money in areas targeted for growth, mainly Hong Kong. This was partly offset by the ongoing repositioning of our client base.
Other FuM, of which the main element is a corporate trust business in Asia, increased by 11% to $219bn.
Assets held in custody
43
and under administration
Custody is the safekeeping and servicing of securities and other financial assets on behalf of clients. At 31 December 2017, we held assets as custodian of $7.7tn, 24% higher than the $6.3tn held at 31 December 2016. The increase was mainly driven by net asset inflows and favourable foreign exchange movements in Asia and Europe, together with the onboarding of new clients in North America and Asia.
Our Assets Under Administration business, which includes the provision of bond and loan administration services and the valuation of portfolios of securities and other financial assets on behalf of clients, complements the Custody business. At 31 December 2017, the value of assets held under administration by the Group amounted to $3.6tn. This was 19% higher than the $3.0tn held at 31 December 2016. The increase was mainly driven
by net asset inflows in Europe and Asia together with favourable foreign exchange movements in Europe.
|
Taxes paid by region and country
|
Taxes paid by HSBC relate to HSBC’s own tax liabilities including tax on profits earned, employer taxes, bank levy and other duties/levies such as stamp duty. Numbers are reported on a cash flow basis.
|
Taxes paid by country
|
|||||||
|
2017
|
|
2016
|
|
2015
|
|
||
|
Footnote
|
$m
|
|
$m
|
|
$m
|
|
|
|
Europe
|
44
|
3,340
|
|
3,151
|
|
3,644
|
|
|
– UK
|
2,654
|
|
2,385
|
|
2,526
|
|
|
|
of which: HSBC Holdings
|
1,078
|
|
1,253
|
|
1,348
|
|
|
|
– France
|
530
|
|
553
|
|
620
|
|
|
|
– Germany
|
140
|
|
124
|
|
108
|
|
|
|
– Switzerland
|
(67
|
)
|
34
|
|
92
|
|
|
|
– other
|
83
|
|
55
|
|
298
|
|
|
|
Asia
|
2,277
|
|
2,755
|
|
2,780
|
|
|
|
– Hong Kong
|
1,043
|
|
1,488
|
|
1,415
|
|
|
|
– Australia
|
142
|
|
147
|
|
173
|
|
|
|
– mainland China
|
227
|
|
241
|
|
277
|
|
|
|
– India
|
297
|
|
315
|
|
285
|
|
|
|
– Indonesia
|
84
|
|
46
|
|
70
|
|
|
|
– Malaysia
|
81
|
|
99
|
|
92
|
|
|
|
– Singapore
|
64
|
|
85
|
|
80
|
|
|
|
– Taiwan
|
42
|
|
35
|
|
53
|
|
|
|
– other
|
297
|
|
299
|
|
335
|
|
|
|
Middle East and North Africa
|
419
|
|
293
|
|
449
|
|
|
|
– Saudi Arabia
|
170
|
|
60
|
|
151
|
|
|
|
– UAE
|
101
|
|
89
|
|
120
|
|
|
|
– Egypt
|
58
|
|
97
|
|
136
|
|
|
|
– other
|
90
|
|
47
|
|
42
|
|
|
|
North America
|
317
|
|
276
|
|
353
|
|
|
|
– US
|
134
|
|
135
|
|
127
|
|
|
|
– Canada
|
182
|
|
141
|
|
226
|
|
|
|
– other
|
1
|
|
—
|
|
—
|
|
|
|
Latin America
|
443
|
|
965
|
|
1,184
|
|
|
|
– Mexico
|
129
|
|
79
|
|
91
|
|
|
|
– other
|
314
|
|
886
|
|
1,093
|
|
|
|
of which: Brazil
|
36
|
|
658
|
|
735
|
|
|
|
Year ended 31 Dec
|
6,796
|
|
7,440
|
|
8,410
|
|
|
For footnote, see page
85
.
|
HSBC Holdings plc
|
83
|
Report of the Directors
| Financial summary
|
Conduct-related matters
|
|
Conduct-related costs included in significant items
|
||||||
|
2017
|
|
2016
|
|
2015
|
|
|
|
$m
|
|
$m
|
|
$m
|
|
|
|
Income statement
|
||||||
|
Net interest income/(expense)
|
(108
|
)
|
2
|
|
(10
|
)
|
|
– customer redress programmes
|
(108
|
)
|
2
|
|
(10
|
)
|
|
Operating expenses
|
||||||
|
Comprising:
|
|
|
||||
|
Legal proceedings and regulatory matters
|
(198
|
)
|
1,025
|
|
1,821
|
|
|
– regulatory provisions in GPB
|
164
|
|
344
|
|
172
|
|
|
– settlements and provisions in connection with legal matters
|
(362
|
)
|
681
|
|
1,649
|
|
|
Customer redress programmes
|
655
|
|
559
|
|
541
|
|
|
Total operating expenses
|
457
|
|
1,584
|
|
2,362
|
|
|
Total charge for the year relating to significant items
|
565
|
|
1,582
|
|
2,372
|
|
|
– of which:
|
||||||
|
total provisions charge for the year
|
565
|
|
1,584
|
|
2,362
|
|
|
total provisions utilised during the year
|
1,136
|
|
2,265
|
|
1,021
|
|
|
Balance sheet at 31 Dec
|
||||||
|
Total provisions
|
2,595
|
|
3,056
|
|
3,926
|
|
|
– legal proceedings and regulatory matters
|
1,248
|
|
2,060
|
|
2,729
|
|
|
– customer redress programmes
|
1,347
|
|
996
|
|
1,197
|
|
|
Accruals, deferred income and other liabilities
|
20
|
|
106
|
|
168
|
|
The table above provides a summary of conduct-related costs incurred and included within significant items (see pages
35
and
42
).
The HSBC approach to conduct is designed to ensure that through our actions and behaviours we deliver fair outcomes for our customers and do not disrupt the orderly and transparent operation of financial markets. The Board places a strong emphasis on conduct, requiring adherence to high behavioural standards and adhering to the HSBC Values. Board oversight of conduct matters is provided by the Conduct & Values Committee, which oversees the embedding of HSBC Values and our required global conduct outcomes, and the Remuneration Committee, which considers conduct and compliance-related matters relevant to remuneration. These committees’ reports may be found on pages
176
to
178
.
The management of business conduct and the steps taken to raise standards are described on page
117
under ‘Regulatory compliance risk management’.
Provisions relating to significant items raised for conduct costs in 2017 resulted from the ongoing consequences of a small number of historical events.
Operating expenses included significant items related to conduct matters in respect of legal proceedings and regulatory matters of $(0.2)bn and customer remediation costs of $0.7bn. This included the release of provisions recognised in prior years in relation to the regulatory investigations into HSBC’s historical foreign exchange activities giving rise to a civil money penalty order in September 2017 with the Federal Reserve Board, and the three-year deferred prosecution agreement with the US Department of Justice in January 2018. For further details on payment protection insurance and legal proceedings and regulatory matters, see Notes
26
and
34
on the Financial Statements, respectively.
|
Carbon dioxide emissions
|
In 2017, we collected data on energy use and business travel for our operations in 28 countries, which accounted for approximately 93% of our full-time employees (‘FTEs’). To estimate the emissions of our operations in countries where we have operational control
and a small presence, we scale up the emissions data from 93% to 100%.
We then apply emission uplift rates to reflect uncertainty concerning the quality and coverage of emission measurement and estimation. The rates are 4% for electricity, 10% for other energy and 6% for business travel. This is consistent both with the Intergovernmental Panel on Climate Change’s
Good Practice Guidance and Uncertainty Management in National Greenhouse Gas Inventories
and our internal analysis of data coverage and quality.
|
Carbon dioxide emissions in tonnes
|
||||
|
2017
|
|
2016
|
|
|
|
Total
|
580,000
|
|
617,000
|
|
|
From energy
|
473,000
|
|
529,000
|
|
|
From travel
|
107,000
|
|
88,000
|
|
|
Carbon dioxide emissions in tonnes per FTE
|
||||
|
2017
|
|
2016
|
|
|
|
Total
|
2.49
|
|
2.63
|
|
|
From energy
|
2.03
|
|
2.25
|
|
|
From travel
|
0.46
|
|
0.38
|
|
The reduction in our carbon emissions continues to be driven by energy efficiency initiatives, as well as our procurement of electricity from renewable sources under Power Purchase Agreements. Travel emissions increased after a record low in 2016.
Our greenhouse gas reporting year runs from October to September. For the year from 1 October 2016 to 30 September 2017, carbon dioxide emissions from our global operations were 580,000 tonnes. Independent assurance of our carbon dioxide emissions will be available in the first half of 2018 on our website.
|
84
|
HSBC Holdings plc
|
|
Disclosure controls
|
There have been no changes in HSBC Holdings’ internal control over financial reporting during the year ended 31 December 2017 that have materially affected, or are reasonably likely to materially affect, HSBC Holdings’ internal control over financial reporting.
|
Management’s assessment of internal
controls over financial reporting
|
Based on the assessment performed, management concluded that for the year ended 31 December 2017, the Group’s internal controls over financial reporting were effective.
PricewaterhouseCoopers LLP, which has audited the consolidated financial statements of the Group for the year ended 31 December 2017, has also audited the effectiveness of the Group’s internal control over financial reporting under Auditing Standard No. 5 of the Public Company Accounting Oversight Board (United States) as stated in their report on page
210
.
|
Footnotes to strategic report, financial
summary, global businesses, geographical
regions and other information
|
|
|
1
|
Achieved Mexico profit before tax target on a local currency basis; US dollar target set using the 2014 average exchange rate.
|
|
2
|
Further detail on the Monitor can be found on page 118.
|
|
3
|
Net operating income before loan impairment charges and other credit risk provisions, also referred to as revenue.
|
|
4
|
‘Other personal lending’ includes personal non-residential closed-end loans and personal overdrafts.
|
|
5
|
‘Investment distribution’ includes Investments, which comprises mutual funds (HSBC manufactured and third party), structured products and securities trading, and Wealth Insurance distribution, consisting of HSBC manufactured and third-party life, pension and investment insurance products.
|
|
6
|
‘Other’ mainly includes the distribution and manufacturing (where applicable) of retail and credit protection insurance.
|
|
7
|
Adjusted return on average risk-weighted assets (‘RoRWA’) is used to measure the performance of RBWM, CMB, GB&M and GPB. Adjusted RoRWA is calculated using profit before tax and reported average risk-weighted assets at constant currency adjusted for the effects of significant items.
|
|
8
|
‘Markets products, Insurance and Investments and Other’ includes revenue from Foreign Exchange, insurance manufacturing and distribution, interest rate management and global banking products.
|
|
9
|
In 2017, credit and funding valuation adjustments included an adverse fair value movement of $546m on the tightening of own credit spreads on structured liabilities (2016: adverse fair value movement of $125m; 2015: favourable fair value movement of $163m).
|
|
10
|
‘Other’ in GB&M includes net interest earned on free capital held in the global business not assigned to products, allocated funding costs and gains resulting from business disposals. Within the management view of adjusted revenue, notional tax credits are allocated to the businesses to reflect the economic benefit generated by certain activities which is not reflected within operating income; for example, notional credits on income earned from tax-exempt investments where the economic benefit of the activity is reflected in tax expense. In order to reflect the total operating income on an IFRS basis, the offsets to these tax credits are included within ‘Other’.
|
|
11
|
Central Treasury includes revenue relating to BSM of $2,688m (2016: $3,007m; 2015: $2,805m), interest expense of $1,275m (2016: $967m; 2015: $696m) and favourable valuation differences on issued long-term debt and associated swaps of $122m (2016: loss of $271m; 2015: loss of $63m). Revenue relating to BSM includes other internal allocations, including notional tax credits to reflect the economic benefit generated by certain activities which is not reflected within operating income, for example notional credits on income earned from tax-exempt investments where the economic benefit of the activity is reflected in tax expense. In order to reflect the total operating income on an IFRS basis, the offsets to these tax credits are included in other Central Treasury.
|
|
12
|
Other miscellaneous items in Corporate Centre includes internal allocations relating to Legacy Credit.
|
|
13
|
Dividends recorded in the financial statements are dividends per ordinary share declared in a year and are not dividends in respect of, or for, that year.
|
|
14
|
Dividends per ordinary share expressed as a percentage of basic earnings per share.
|
|
15
|
Return on average risk-weighted assets is calculated using profit before tax and reported average risk-weighted assets.
|
|
16
|
Gross interest yield is the average annualised interest rate earned on average interest-earning assets (‘AIEA’).
|
|
17
|
Net interest spread is the difference between the average annualised interest rate earned on AIEA, net of amortised premiums and loan fees, and the average annualised interest rate payable on average interest-bearing funds.
|
|
18
|
Net interest margin is net interest income expressed as an annualised percentage of AIEA.
|
|
19
|
Interest income on trading assets is reported as ‘Net trading income’ in the consolidated income statement.
|
|
20
|
Interest income on financial assets designated at fair value is reported as ‘Net income/(expense) from financial instruments designated at fair value’ in the consolidated income statement.
|
|
21
|
Including interest-bearing bank deposits only.
|
|
22
|
Interest expense on financial liabilities designated at fair value is reported as ‘Net income on financial instruments designated at fair value’ in the consolidated income statement, other than interest on own debt, which is reported in ‘Interest expense’.
|
|
23
|
Including interest-bearing customer accounts only.
|
|
24
|
Trading income also includes movements on non-qualifying hedges. These hedges are derivatives entered into as part of a documented interest rate management strategy for which hedge accounting was not, nor could be, applied. They are principally cross-currency and interest rate swaps used to economically hedge fixed rate debt issued by HSBC Holdings and floating rate debt issued by HSBC Finance. The size and direction of the changes in the fair value of non-qualifying hedges that are recognised in the income statement can be volatile from year-to-year, but do not alter the cash flows expected as part of the documented interest rate management strategy for both the instruments and the underlying economically hedged assets and liabilities if the derivative is held to maturity.
|
|
25
|
‘Own credit spread’ includes the fair value movements on our long-term debt attributable to credit spread where the net result of such movements will be zero upon maturity of the debt. This does not include fair value changes due to own credit risk in respect of trading liabilities or derivative liabilities. From 1 January 2017, HSBC adopted, in its consolidated financial statements, the requirements of IFRS 9 ‘Financial Instruments’ relating to the presentation of gains and losses on financial liabilities designated at fair value. As a result, changes in fair value attributable to changes in own credit risk are presented in other comprehensive income with the remainder of the effect presented in profit and loss.
|
|
26
|
Net of impairment allowances.
|
|
27
|
On 1 January 2014, CRD IV came into force and the calculation of capital resources and RWAs for 2014 to 2017 are calculated and presented on this basis. 2013 comparative is on a Basel 2.5 basis.
|
|
28
|
Capital resources are regulatory capital, the calculation of which is set out on page 162.
|
|
29
|
Including perpetual preferred securities, details of which can be found in Note 27 on the Financial Statements.
|
|
30
|
The definition of net asset value per ordinary share is total shareholders’ equity, less non-cumulative preference shares and capital securities, divided by the number of ordinary shares in issue excluding shares the company has purchased and are held in treasury.
|
|
HSBC Holdings plc
|
85
|
Report of the Directors
| Financial summary
|
31
|
Net trading income includes interest expense relating to the internal funding of trading assets, in GB&M. In the statutory presentation, internal funding in GB&M net trading income is eliminated through Corporate Centre, and in our other global businesses it is eliminated within net interest income.
|
|
32
|
Excludes items where there are substantial offsets in the income statement for the same year.
|
|
33
|
‘Other income’ in this context comprises where applicable net income/expense from other financial instruments designated at fair value, gains less losses from financial investments, dividend income, net insurance premium income and other operating income less net insurance claims and benefits paid and movement in liabilities to policyholders.
|
|
34
|
Adjusted risk-weighted assets are calculated using reported risk-weighted assets adjusted for the effects of currency translation differences and significant items.
|
|
35
|
‘Client assets’ are translated at the rates of exchange applicable for their respective period-ends, with the effects of currency translation reported separately. The main components of client assets were funds under management ($258bn at 31 December 2017) which were not reported on the Group’s balance sheet, and customer deposits ($72bn at 31 December 2017), of which $67bn was reported on the Group’s balance sheet and $5bn were off-balance sheet deposits.
|
|
36
|
Client assets related to our Middle East clients are booked across to various other regions, primarily in Europe.
|
|
37
|
Risk-weighted assets are non-additive across geographical regions due to market risk diversification effects within the Group.
|
|
38
|
In the first half of 2015 our operations in Brazil were classified as held for sale. As a result, balance sheet accounts were classified as ‘Assets held for sale’ and ‘Liabilities of disposal groups held for sale’. There was no separate income statement classification. The sale completed on 1 July 2016.
|
|
39
|
Amounts are non-additive across geographical regions due to inter-company transactions within the Group.
|
|
40
|
Europe’s adjusted 2017 profit of $1.0bn includes a number of items incurred centrally on behalf of the Group as a whole, but which are disclosed in the Europe segment, including consolidation adjustments and Holdings costs such as interest costs on Group debt and the UK bank levy.
|
|
41
|
Excludes intra-Group dividend income.
|
|
42
|
For the purposes of the analysis of reported results by country table, HSBC Holdings profit/(loss) is presented excluding the effect of the early adoption of the requirements of IFRS 9 ‘Financial Instruments’ relating to the presentation of gains and losses on financial liabilities designated at fair value’, which was early adopted in the separate financial statements of HSBC Holdings but not in the consolidated financial statements of HSBC.
|
|
43
|
Funds under management and assets held in custody are not reported on the Group’s balance sheet, except where it is deemed that we are acting as principal rather than agent in our role as investment manager, and these assets are consolidated as Structured entities (see Note 19 on the Financial Statements).
|
|
44
|
Taxes paid by HSBC relate to HSBC’s own tax liabilities, including tax on profits earned, employer taxes, the UK bank levy and other duties/levies such as stamp duty. Numbers are reported on a cash flow basis.
|
|
44a
|
This includes interest-bearing bank deposits only. See page
24
for an analysis of all bank deposits.
|
|
44b
|
Interest expense on financial liabilities designated at fair value is reported as ‘Net income on financial instruments designated at fair value’ in the consolidated income statement, other than interest on own debt, which is reported in ‘Interest Expense’.
|
|
44c
|
This includes interest-bearing customer accounts only. See page
25
for an analysis of all customer accounts.
|
|
44d
|
Net interest margin is calculated as net interest income divided by average interest-earning assets.
|
|
86
|
HSBC Holdings plc
|
|
Regulation and supervision
|
A statement of our compliance with the provisions of the UK Corporate Governance Code issued by the Financial Reporting Council and with the Hong Kong Corporate Governance Code set out in Appendix 14 to the Rules Governing the Listing of Securities on The Stock Exchange of Hong Kong Limited can be found in the ‘Report of the Directors: Corporate Governance Codes’ on page
185
.
Our operations throughout the world are regulated and supervised globally by approximately 400 different regulatory authorities, central banks and other bodies in those jurisdictions in which we have offices, branches or subsidiaries. These authorities impose a variety of requirements and controls designed to provide financial stability, transparency in financial markets and a contribution to economic growth. Requirements to which our operations must adhere include those relating to capital and liquidity, disclosure standards and restrictions on certain types of products or transaction structures, requirements on recovery and resolution, governance standards and those relating to conduct of business and financial crime.
The Prudential Regulation Authority (‘PRA’) is the HSBC Group’s consolidated lead regulator. The other UK regulator, the FCA, supervises 16 HSBC-regulated entities in the UK, including eight where the PRA is responsible for prudential supervision. The FCA also supervises the Group globally in relation to financial crime matters. Additionally, both the PRA and FCA have certain direct supervisory powers over our unregulated qualifying parent company, HSBC Holdings, including (in the FCA’s case) pursuant to agreements entered into with HSBC Holdings as part of a global settlement with a number of US authorities in relation to the Group’s failure to comply with anti-money laundering (‘AML’) rules, US sanctions requirements and related matters (‘the FCA Requirements Notice’). In addition, each operating bank, finance company or insurance operation within HSBC is regulated by local supervisors.
The Group’s primary regulatory authorities are those in the UK, Hong Kong and the US, our principal jurisdictions of operation. However, and in addition, with the implementation of the EU’s Single Supervisory Mechanism (‘SSM’) in 2014, the European Central Bank (‘ECB’) assumed direct supervisory responsibility for HSBC France and HSBC Malta as ‘significant supervised entities’ within the eurozone for the purposes of the EU’s SSM Regulation and HSBC Germany may also come under ECB supervision in the near future. Under the SSM, the ECB increasingly engages with the relevant ‘National Competent Authorities’ in relation to HSBC’s businesses in other eurozone countries and more widely with other HSBC regulators. It is therefore expected that we will continue to see changes in how the Group is regulated and supervised on a day-to-day basis in the eurozone and, more generally, as the ECB and other of our regulators develop their powers having regard to some of the regulatory initiatives highlighted in this report including the UK’s decision to exit the European Union.
UK regulation and supervision
The UK financial services regulatory structure is comprised of three regulatory bodies: the Financial Policy Committee (‘FPC’), a committee of the Bank of England (‘BoE’); the PRA, a subsidiary of the BoE; and the FCA.
The FPC is responsible for macro-prudential supervision, focusing on systemic risk that may affect the UK’s financial stability. The BoE prudentially regulates and supervises financial services firms through the PRA and in addition to its wider role as the UK’s central bank, the BoE is also responsible for taking action to manage the failure of financial institutions in the UK if necessary.
The PRA and the FCA are micro-prudential supervisors. The Group’s banking subsidiaries, such as HSBC Bank plc and HSBC UK, are ‘dual-regulated’ firms, subject to prudential regulation by the PRA and to conduct regulation by the FCA. Other (generally smaller, non-bank) UK-based Group subsidiaries are ‘solo regulated’ by the FCA (i.e. the FCA is responsible for both prudential and conduct regulation of those subsidiaries). HSBC Group is subject to consolidated supervision by the PRA.
UK banking and financial services institutions are subject to multiple regulations. The primary UK statute in this context is the Financial Services and Markets Act 2000 (‘FSMA’), as amended by subsequent legislation. Other UK financial services legislation currently includes that derived from EU directives and regulations relating to banking, securities, insurance, investments and sales of personal financial services.
The PRA and FCA are together responsible for authorising and supervising all our operating businesses in the UK that require authorisation under FSMA. These include deposit-taking, retail banking, consumer credit, life and general insurance, pensions, investments, mortgages, custody and share-dealing businesses, and treasury and capital markets activity. The FCA is also responsible for promoting effective competition in the interests of consumers, and an independent subsidiary of the FCA, the Payment Systems Regulator, regulates payment systems in the UK.
The PRA and FCA rules establish the minimum criteria for the authorisation of banks and other financial sector entities that carry out regulated activities. In the UK, the PRA and FCA have the right to object, on prudential grounds, to persons who hold, or intend to hold, 10% or more of the voting power or shares of a financial institution that they regulate, or of its parent undertaking. In its capacity as our supervisor on a consolidated basis, the PRA receives information on the capital adequacy of, and sets requirements for, the Group as a whole, as well as conducting stress tests both on HSBC’s UK entities and more widely on the Group, including in conjunction with other regulators. Individual banking subsidiaries in the Group are directly regulated by their local banking supervisors, who set and monitor,
inter alia
, their capital adequacy requirements.
The Group is subject to capital requirements as set out in CRD IV and implemented by the PRA. The Pillar 1 regulatory capital framework has been, and continues to be, significantly enhanced. It is also envisaged that existing capital requirements will be complemented by a specification of total loss absorbing capacity (‘TLAC’), in accordance with the final standards adopted by the Financial Stability Board which are to apply to G-SIBs from 1 January 2019. In the EU, the TLAC requirements will be introduced in the form of minimum requirements for own funds and eligible liabilities (although the rules are still to be finalised), that can absorb losses in the event of a failure of a bank or be bailed in to provide additional capital resources.
The Group is also subject to liquidity requirements as set out in CRD IV and implemented by the PRA, and will in due course become subject to the net stable funding requirements prescribed under Basel III and expected to be implemented in or around 2019 through changes to CRD IV or otherwise.
The PRA and FCA monitor authorised institutions through ongoing supervision and the review of routine and ad hoc reports relating to financial, prudential and conduct of business matters. They may also obtain independent reports from a skilled person on the
|
HSBC Holdings plc
|
87
|
Report of the Directors
| Financial summary
adequacy of procedures and systems covering internal control and governing records and accounting. The PRA meet regularly with the Group’s senior executives to discuss our adherence to the PRA’s prudential guidelines. In addition, both the PRA and FCA regularly discuss fundamental matters relating to our business in the UK and internationally with relevant management, including areas such as strategic and operating plans, risk control, loan portfolio composition and organisational changes,succession planning and recovery and resolution arrangements.
There are a substantial number of other ongoing regulatory initiatives affecting the Group driven by or from the UK. Current and anticipated areas of particular focus for the UK regulators include:
|
•
|
changes to UK law and regulation following the UK's decision to leave the EU;
|
|
•
|
the UK’s implementation of the final reforms to Basel III including the changes to the market risk framework and the implementation of revised approaches to calculate credit, counterparty, operational and credit valuation adjustment (‘CVA’) risk, RWAs, changes to the leverage ratio framework and the application of capital floors;
|
|
•
|
the UK’s implementation of the outstanding elements of Basel III reforms, including the sovereign risk regime and the long-term treatment of International Financial Reporting Standard 9, Financial Instruments (‘IFRS 9’) provisions;
|
|
•
|
the UK’s implementation of the FSB’s principles and standards relating to resolution regimes and including TLAC requirements for G-SIBS and changes to UK law and regulation following changes in European legislation revising the European requirements in the area of prudential rules and including recovery and resolution and TLAC/MREL requirements;
|
|
•
|
ongoing implementation of requirements regarding resolution plans (see further details outlined below under ‘Recovery and resolution’);
|
|
•
|
implementation and operation of the ring-fencing requirements to separate retail banking activities;
|
|
•
|
implementation of revisions to the PRA’s approach to groups policy (and including double-leverage) and large exposures/intra-group regimes;
|
|
•
|
post implementation review and monitoring of the revised EU Markets in Financial Instruments Directive and Regulation (MiFID II), which became effective in January 2018 and which is intended to result in substantial changes to market transparency requirements and other obligations for trading in financial instruments, as well as enhanced client conduct of business obligations;
|
|
•
|
embedding of the Senior Managers and Certification Regime, aimed at strengthening accountability in banking and its extension to all UK authorised firms during 2019;
|
|
•
|
standards issued by the Fixed Income, Currencies and Commodities Market Standards Board aimed at improving conduct in the fixed income, commodities and currency markets. The FCA expects firms to adhere to these standards, many of which have global application;
|
|
•
|
proposed plans to increase consumer access to financial advice;
|
|
•
|
proposals driven by the UK Competition and Markets Authority’s (‘CMA’) investigation into the supply of retail banking services that are designed to deliver increased transparency and innovation;
|
|
•
|
continued high level of focus by the FCA on management of conduct of business and customer outcomes as well as on controls to combat financial crime (including market abuse and fraud); and
|
|
•
|
cyber risk, financial technology and data security initiatives which may require changes to systems and processes.
|
The UK legal and regulatory requirement to separate retail and SME banking from trading activities in the UK ('ring-fencing') must
be completed by 1 January 2019.Our implementation plans are well advanced with the internal separation of our systems and infrastructure now complete. Our UK ring-fenced bank, HSBC UK plc, will be fully established by mid-2018, well ahead of the regulatory deadline.
The FCA also continues to apply close scrutiny to the Group’s financial crime control framework both generally in conjunction with the exercise of its wider powers under FSMA and more specifically under the FCA Requirements Notice described above.
As a result of the decision of the UK to leave the EU following the referendum on 23 June 2016, there could be significant changes to those EU laws applicable in the UK (depending on whether the UK will subsequently be readmitted to the European Free Trade Association and European Economic Area (‘EEA’), and therefore remain subject to EU legislation applicable to the EEA). Leaving the EU should not in and of itself affect existing UK laws and it is expected that EU laws and regulations which are directly applicable to UK firms should be transposed into UK law and regulation ahead of the official date of exit but the process of transposition has not yet been agreed by the UK Parliament. There may be changes in the application of laws and regulations concerning banking and financial services as a result of this process and there could be other ancillary impacts as a result of the UK’s exit from the EU. In particular, EU laws may be revised, placing restrictions on third country access to EU Member States and/or on the ability for EU based firms to outsource, delegate or transfer material risk to non-EU firms.
Hong Kong regulation and supervision
Banking in Hong Kong is subject to the provisions of the Banking Ordinance and to the powers, functions and duties ascribed by the Banking Ordinance to the Hong Kong Monetary Authority (the ‘HKMA’). The HKMA is the government authority in Hong Kong responsible for maintaining monetary and banking stability. One of the principal functions of the HKMA is to promote the stability and integrity of the financial system, including the banking system in Hong Kong. The HKMA is responsible for regulating and supervising banking business and the business of taking deposits in Hong Kong. Under the Banking Ordinance, the HKMA is the licensing authority responsible for the authorisation, suspension and revocation of authorised institutions. To provide checks and balances, the HKMA is required under the Ordinance to consult with the Financial Secretary on important authorisation decisions, such as suspension and revocation.
The Hongkong and Shanghai Banking Corporation Limited and its overseas branches and subsidiaries are licensed under the Banking Ordinance and hence subject to the supervision, regulation and examination of the HKMA.
The HKMA follows international practices as recommended by the Basel Committee on Banking Supervision (‘Basel Committee’) to supervise authorised institutions. The HKMA adopts a risk-based supervisory approach based on a policy of ‘continuous supervision’ through on-site examinations, off-site reviews, prudential meetings, cooperation with external auditors and sharing information with other supervisors. The HKMA requires all authorised institutions to have adequate systems of internal control and requires the institutions’ external auditors, upon request, to report on those systems and other matters, such as the accuracy of information provided to the HKMA. In addition, the HKMA may from time to time conduct tripartite discussions with authorised institutions and their external auditors.
The HKMA aims to ensure that the standards for regulatory disclosure in Hong Kong remain in line with those of other leading financial centres. The Banking (Disclosure) Rules take into account the latest disclosure standards released by the Basel Committee, which prescribe quarterly, semi-annual and annual disclosure of specified items, including in the form of standard templates and tables, in order to promote user-relevance and the consistency and comparability of regulatory disclosure among banks and across jurisdictions.
The HKMA's powers to collect prudential data from authorised institutions on a routine or ad hoc basis are provided by Section 63
|
88
|
HSBC Holdings plc
|
of the Banking Ordinance. The same section of the Ordinance also empowers the HKMA to require any holding company or subsidiary or sister company of an authorised institution to submit such information as may be required for the exercise of the HKMA’s functions under the Ordinance.
The HKMA has the power to serve a notice of objection on persons if they are no longer deemed to be fit and proper to be controllers of the authorised institution, if they may otherwise threaten the interests of depositors or potential depositors, or if they have contravened any conditions specified by the HKMA. The HKMA may revoke authorisation in the event of an institution’s non-compliance with the provisions of the Banking Ordinance. These provisions require, among other things, the furnishing of accurate reports.
The HKMA is the relevant authority under the Anti-Money Laundering and Counter-Terrorist Financing (Financial Institutions) Ordinance (‘AMLO’) for supervising authorised institutions’ compliance with the legal and supervisory requirements set out in the AMLO and the Guideline on Anti-Money Laundering and Counter-Terrorist Financing (for Authorised Institutions). The HKMA requires authorised institutions in Hong Kong and its overseas branches and subsidiaries to establish effective systems and controls to prevent and detect money laundering and terrorist financing. They work closely with other stakeholders within both the Government and the industry to ensure that the banking sector is able to play its gatekeeper role in Hong Kong’s Anti-Money Laundering and Counter-Terrorist Financing regime.
To enhance the exchange of supervisory information and cooperation, the HKMA has entered into Memoranda of Understanding or other formal arrangements with a number of banking supervisory authorities within and outside Hong Kong.
The marketing of, dealing in and provision of advice and asset management services in relation to securities and futures in Hong Kong are subject to the provisions of the Securities and Futures Ordinance of Hong Kong. Entities engaging in activities regulated by the Ordinance are required to be licensed or registered with the Securities and Futures Commission (‘SFC’). The HKMA is the frontline regulator for banks involved in the securities and futures business.
The HKMA and the SFC work very closely to ensure that there is an open market with a level playing field for all intermediaries in the securities industry of Hong Kong. The HKMA has entered into a Memorandum of Understanding with the SFC, which elaborates on the legal framework and sets out the operational details relating to the respective roles and responsibilities of the two regulators regarding the securities related activities of authorised institutions. The HKMA and the SFC hold regular meetings under the Memorandum of Understanding to discuss matters of mutual interest. The training programmes of either regulator are also made available to the staff of the other where relevant.
Among other functions, the Securities and Futures Ordinance vested the SFC with powers to set and enforce market regulations, including investigating breaches of rules and market misconduct and taking appropriate enforcement action. The SFC is responsible for licensing and supervising intermediaries conducting SFC-regulated activities; for example investment advisors, fund managers and brokers. Additionally, the SFC sets standards for the authorisation and regulation of investment products, and reviews and authorises offering documents of retail investment products to be marketed to the public.
The HKMA and the Insurance Authority (‘IA’) have signed a Memorandum of Understanding to enhance the co-operation, exchange of information and mutual assistance between the two authorities. Under this Memorandum of Understanding, the HKMA and the IA agree to work together to co-ordinate the supervision of the insurance-related activities of authorised institutions in Hong Kong (such as when they act as insurance intermediaries) and authorised insurers that are connected to them and to promote information exchange and sharing, as permitted under the Banking Ordinance and the Insurance Ordinance, between the HKMA and the IA in order to assist each other to exercise their respective statutory functions.
Under the statutory regime for the regulation of Mandatory Provident Fund ('MPF') intermediaries, the Mandatory Provident Fund Schemes Authority is the lead regulator in respect of regulation of MPF intermediaries whereas the HKMA, the IA and the SFC are the frontline regulators of the MPF intermediaries. A Memorandum of Understanding Concerning the Regulation of Regulated Persons with Respect to Registered Schemes under the Mandatory Provident Fund Schemes Ordinance has been signed by the four regulators. It sets out certain administrative and operational arrangements among the four regulators regarding the exercise of their respective functions under the Mandatory Provident Fund Schemes Ordinance concerning regulation of MPF intermediaries Hong Kong’s Financial Institutions (Resolution) Ordinance (the Ordinance) that was passed in June 2016 and came into effect on 7 July 2017.
The Ordinance established the legal basis for a cross-sector resolution regime in Hong Kong, under which the HKMA is the resolution authority for banking sector entities including all authorised institutions. The HKMA is also designated as the lead resolution authority for the cross-sectoral groups in Hong Kong that involve both banking sector entities and securities and futures sector entities. The HKMA’s function as a resolution authority is supported by the Resolution Office within the HKMA. The Resolution Office is operationally independent and has a direct reporting line to the Chief Executive of the HKMA. As a resolution authority, the HKMA is responsible for:
|
•
|
setting resolution standards for authorised institutions ('AIs');
|
|
•
|
undertaking resolution planning and resolvability assessments for AIs;
|
|
•
|
identifying, and requiring AIs to remove, impediments to their orderly resolution; and
|
|
•
|
executing, where necessary, the orderly resolution of any failing AIs through the application of resolution powers under the Ordinance.
|
The Hong Kong Government, along with the HKMA, the IA and the SFC, will maintain close liaison with the industry and the relevant stakeholders in the formulation of regulations, rules and codes of practice. They will also carry out publicity through their respective websites and publications to explain the work being undertaken to make the regime operational and the implications of resolution for relevant stakeholders.
US regulation and supervision
The Group is subject to federal and state supervision and regulation in the US. Banking laws and regulations of the Federal Reserve Board (‘FRB’), the Office of the Comptroller of the Currency (the ‘OCC’) and the Federal Deposit Insurance Corporation (the ‘FDIC’) (collectively, the ‘US banking regulators’) govern all aspects of our US business. Furthermore, since we have substantial operations outside the US that conduct many of their day-to-day transactions with the US, HSBC entities’ operations outside the US are also subject to the extra-territorial effects of US regulation in many respects.
In September 2017, HSBC Holdings and HSBC North America Holdings Inc. (‘HNAH’) consented to a civil money penalty order with the FRB in connection with its investigation into HSBC’s historical foreign exchange activities. Under the terms of the order, HSBC Holdings and HNAH agreed to
undertake certain remedial steps and to
pay a civil money penalty to the FRB. In January 2018, HSBC Holdings entered into a three-year deferred prosecution agreement with the Criminal Division of the US Department of Justice (‘DoJ’) (the 'FX DPA'),
regarding fraudulent conduct in connection with two particular transactions in 2010 and 2011. This
concluded the DoJ's investigation into HSBC’s historical foreign exchange activities. Under the terms of the FX DPA, HSBC has a number of ongoing obligations, including continuing to cooperate with authorities and implementing enhancements to its internal controls and procedures in its Global Markets business, which will be the subject of annual reports to the DoJ. In addition, HSBC agreed to pay a financial penalty and restitution. For further details, see Note 34 on the Financial Statements.
|
HSBC Holdings plc
|
89
|
Report of the Directors
| Financial summary
HSBC Holdings and its US operations are subject to supervision, regulation and examination by the FRB because HSBC Holdings is a ‘bank holding company’ under the US Bank Holding Company Act of 1956, as a result of its control of HSBC Bank USA, N.A., McLean, Virginia (‘HSBC Bank USA’) and HSBC Trust Company (Delaware), N.A., Wilmington, Delaware (‘HTCD’). HNAH is also a ‘bank holding company’. Both HSBC Holdings and HNAH have elected to be financial holding companies pursuant to the provisions of the Gramm-Leach-Bliley Act (the ‘GLBA’) and, accordingly, may affiliate with securities firms and insurance companies, and engage in other activities that are financial in nature or incidental or complementary to activities that are financial in nature.
Under regulations implemented by the FRB, if any financial holding company, or any depository institution controlled by a financial holding company, ceases to meet certain capital or management standards, the FRB may impose corrective capital and/or managerial requirements on the financial holding company and place limitations on its ability to conduct the broader financial activities permissible for financial holding companies. In addition, the FRB may require divestiture of the holding company’s depository institutions or its affiliates engaged in broader financial activities in reliance on financial holding company status under the GLBA if the deficiencies persist. The regulations also provide that if any depository institution controlled by a financial holding company fails to maintain a satisfactory rating under the Community Reinvestment Act of 1977, the FRB must prohibit the financial holding company and its subsidiaries from engaging in any additional activities other than those permissible for bank holding companies that are not financial holding companies. See page
98
for further information on the regulatory consent orders with which HSBC Bank USA must comply in accordance with the agreement entered into with the OCC in December 2012 (the ‘GLBA Agreement').
The two US banks, HSBC Bank USA and HTCD, are subject to regulation and examination primarily by the OCC. HSBC Bank USA and HTCD are subject to additional regulation and supervision, secondly by the FDIC, and by the FRB and the Consumer Financial Protection Bureau (‘CFPB’). Banking laws and regulations restrict many aspects of their operations and administration, including the establishment and maintenance of branch offices, capital and reserve requirements, deposits and borrowings, investment and lending activities, payment of dividends and numerous other matters.
In the US, parent company insolvencies are governed by the US Bankruptcy Code, 11 U.S.C. § 101 et seq. (the ‘Bankruptcy Code’). Chapter 7 of the Bankruptcy Code sets forth the procedures for liquidation of a debtor company’s assets for distribution to creditors, whereas Chapter 11 permits the operation of the debtor’s business while either negotiating a plan of reorganisation with the company’s creditors or liquidating the business. Subsidiary banks are subject to the Federal Deposit Insurance Act (the ‘FDIA’). Under the FDIA, the FDIC has the authority as receiver to liquidate and wind up a bank’s affairs and to succeed to all rights, titles, powers and privileges of the bank and relevant associated persons.
Under a special regime introduced by Title II of the Dodd-Frank Wall Street Reform and Consumer Protection Act (‘Dodd-Frank’), the US Secretary of the Treasury has the authority to appoint the FDIC as receiver of certain qualifying parent companies and their subsidiaries under specified conditions. The FDIC’s powers under what is referred to as the Orderly Liquidation Authority (‘OLA’) incorporate elements of both the FDIA and the Bankruptcy Code, and are intended to minimise the adverse effects of a complex financial group’s failure on the financial stability of the US. In respect of a banking group with a parent company not organised under the laws of the US, any actions under the OLA would likely be directed at the US-based intermediate holding company.
In January 2014, the FRB implemented the Basel III capital framework for bank holding companies such as HNAH, which were required to phase in many of the requirements, including a minimum supplementary leverage ratio of 3% and an effective
minimum total risk-based capital ratio of 10.5% over a transition period from 2014 to 2019. The 10.5% ratio includes the capital conservation buffer, which is not a minimum requirement, per se, but rather a necessary condition to allow capital distributions. A countercyclical capital buffer requirement, applicable to banking organisations that meet the advanced approaches thresholds, also applies to HNAH and HSBC Bank USA, and the buffer has been currently set at 0%. Additionally, failure to maintain minimum regulatory ratios in simulated stress conditions, as required by the FRB’s Comprehensive Capital Analysis and Review (‘CCAR’) programme, would restrict HNAH from engaging in capital distributions such as dividends or share repurchases. In addition to the CCAR stress testing requirements, the Dodd-Frank Act Stress Test (‘DFAST’) requires HNAH and HSBC Bank USA to undergo regulatory stress tests conducted by the FRB annually, and to conduct and publish the results of its own internal stress tests semi-annually.
As part of the CCAR process, the FRB undertakes a supervisory assessment of the capital adequacy of bank holding companies, including HNAH, based on a review of a comprehensive capital plan submitted by each participating bank holding company to the FRB that describes the company’s planned capital actions, such as plans to pay or increase common stock dividends, reinstate or increase common stock repurchase programs, or redeem preferred stock or other regulatory capital instruments, during the nine-quarter review period, as well as the results of stress tests conducted by both the company and the FRB under different hypothetical macroeconomic scenarios, including a supervisory adverse scenario and severely adverse scenario provided by the FRB. The FRB can object to a capital plan for qualitative or quantitative reasons, in which case the company cannot make capital distributions without specific FRB approval.
HNAH submitted its latest CCAR capital plan and annual company-run DFAST results in April 2017. HSBC Bank USA is also subject to the OCC's DFAST requirements, which require certain banks to conduct annual company-run DFAST, and submitted its latest annual DFAST results in April 2017. The company-run stress tests are forward-looking exercises to assess the impact of hypothetical macroeconomic baseline, adverse and severely adverse scenarios provided by the FRB and the OCC for the annual exercise, and internally developed scenarios for both the annual and mid-cycle exercises, on the financial condition and capital adequacy of a bank-holding company or bank over a nine-quarter planning horizon.
In June 2017, the FRB informed HNAH that it did not object to HNAH’s capital plan or the planned capital distributions included in its 2017 CCAR submission.
HSBC Holdings and HSBC Bank USA are also required to file resolution plans with regard to their US operations describing what strategy would be followed to resolve the institutions. If the FRB and the FDIC both determine that these resolution plans are not ‘credible’ (which, although not defined, is generally believed to mean the regulators do not believe the plans are feasible or would otherwise allow for the rapid and orderly resolution of the US businesses in a way that protects systematically important functions without severe systematic disruption and without exposing taxpayers to loss), our failure to cure deficiencies in a resolution plan required by Dodd-Frank to be filed by HSBC Holdings and HSBC Bank USA would enable the FRB and the FDIC, acting jointly, to impose more stringent prudential limits or require the divestiture of assets or operations.
In 2015, HSBC Holdings and HSBC Bank USA submitted their required resolution plans to the FDIC and the FRB. In June 2017, HSBC Bank USA received feedback from the FDIC regarding its resolution plan that will be addressed in its next plan submission.
In January 2018, the FRB and FDIC provided HSBC Holdings with their expectations as to the content of its next US resolution plan submission. These expectations requested additional information regarding HSBC Holdings’ methodology for estimating capital needs and liquidity capabilities and its plans for maintaining continuity of payments, clearance and settlement activities and shared support services for its US operations in a resolution
|
90
|
HSBC Holdings plc
|
scenario.
In addition, HSBC Holdings and HSBC Bank USA have been advised that the next submission dates for their plans have been extended to 31 December 2018 and 1 July 2018 respectively.
In 2014, the FRB adopted a rule requiring enhanced supervision of the US operations of non-US banks such as HSBC Holdings. The rule required HSBC to establish a single intermediate holding company (‘IHC’) to hold their US bank and non-bank subsidiaries, although because the HSBC Group had been operating in the United States through such an IHC structure (i.e. HNAH), the implementation of this requirement did not by itself have a significant impact on our US operations.
However, in 2016, the FRB, issued a re-proposal of its requirements relating to single counterparty credit limits that would apply to IHCs, such as HNAH. The re-proposal is still under consideration. In addition, the FRB is still considering an ‘early remediation’ framework under which the FRB would implement prescribed restrictions and penalties against banking organisations, such as HNAH and HSBC, if certain risk-based capital, leverage, liquidity, stress testing or other risk management requirements are not met, and would authorise limitations on, or possible termination of, their US operations under certain circumstances.
An IHC may calculate its capital requirements under the US standardised approach, even if it meets the asset thresholds that would require a bank holding company to use advanced approaches. HNAH and HSBC Bank USA received regulatory approval to opt out of the advanced approach in 2015. In 2017, HSBC Bank USA submitted an annual statement to the OCC to renew its opt out of the advanced approaches. HNAH and HSBC Bank USA remain subject to the other capital requirements applicable to advanced-approaches banking organisations, such as the supplementary leverage ratio, the countercyclical capital buffer, stress testing requirements, certain deductions and adjustments to capital, enhanced risk management standards, enhanced governance and stress testing requirements for liquidity management, and other applicable prudential standards. Most of these requirements became effective on 1 July 2016.
The US banking regulators adopted a final rule in 2014 that implemented a quantitative liquidity requirement consistent with the liquidity coverage ratio standard established by the Basel Committee. The final rule established a liquidity coverage ratio (‘LCR’), which is designed to ensure that a banking organisation maintains an adequate level of unencumbered high-quality liquid assets equal to the entity’s expected net cash outflow for a 30-day time horizon under an acute liquidity stress scenario. The rule is more stringent than the Basel III LCR in several respects. Starting on 1 January 2017, companies subject to the rule, including HNAH and HSBC Bank USA, were required to maintain an LCR of 100%.
In 2016, the US banking regulators proposed a rule to implement the Basel Committee’s final standard for NSFR calculated by dividing the level of a banking organisation’s available stable funding by its required stable funding. The minimum NSFR requirement for HNAH and HSBC Bank USA under the NSFR proposal would be 100%. A banking organisation’s available stable funding would be calculated as the sum of the banking organisation’s liabilities and regulatory capital elements, which are first multiplied by factors determined based on their tenor, funding type and counterparty type. The required stable funding would be calculated as the sum of the banking organisation’s assets, commitments and derivatives, which are first multiplied by factors based on their relative liquidity. Consistent with the Basel Committee’s NSFR final standard, the FRB’s NSFR proposal was proposed to take effect on 1 January 2018. However, the NSFR proposal has not yet been finalised and the potential effects of the NSFR continue to be evaluated.
In 2015, the Financial Stability Board (‘FSB’) issued final standards for TLAC requirements for global systemically important banks (‘G-SIBs'), which will apply to HSBC Holdings once implemented in the UK. The new standards also permit authorities in host jurisdictions to require ‘internal’ TLAC to be prepositioned (issued by local entities to either parent entities or third parties). The purpose of these new standards is to ensure that G-SIBs have
sufficient loss absorbing and recapitalisation capacity available to implement an orderly resolution with continuity of critical functions and minimal impact on financial stability and to ensure cooperation between home and host authorities during resolution. The new standards call for all G-SIBs to be subject to TLAC requirements starting 1 January 2019, to be fully phased in by 1 January 2022. In the US, the FRB adopted final rules on 15 December 2016 implementing the FSB’s TLAC standard in the US. The rules require, among other things, the US intermediate holding companies of non US G-SIBs, including HNAH, to maintain minimum amounts of TLAC that would include minimum levels of tier 1 capital and long-term debt satisfying certain eligibility criteria, and a related TLAC buffer commencing 1 January 2019 without the benefit of a phase-in period. The TLAC rules also include ‘clean holding company requirements’ that impose limitations on the types of financial transactions HSBC’s US intermediate holding company, HNAH, could engage in.
HSBC Bank USA and HTCD are subject to risk-based assessments from the FDIC, which insures deposits generally to a maximum of $250,000 per depositor for domestic deposits. Dodd-Frank changed the FDIC’s risk-based deposit insurance assessment framework primarily by basing assessments on an FDIC-insured institution’s total assets less tangible equity rather than US domestic deposits, which is expected to shift a greater portion of the aggregate assessments to large FDIC-insured institutions. In 2016, the FDIC imposed an additional temporary surcharge on the quarterly assessments of insured depository institutions with total consolidated assets of $10bn or more, including HSBC Bank USA. The new large bank pricing system will result in higher assessment rates for banks with high-risk asset concentrations, less stable balance sheet liquidity or potentially higher loss severity in the event of failure.
HSBC’s US consumer finance operations are subject to extensive state-by-state regulation in the US, and to laws relating to consumer protection (both in general, and in respect of sub-prime lending operations, which have been subject to enhanced regulatory scrutiny); discrimination in extending credit; use of credit reports; privacy matters; disclosure of credit terms; and correction of billing errors. These operations are subject to regulations and legislation that limit operations in certain jurisdictions.
Title VII of Dodd-Frank provides for an extensive framework for the regulation of over-the-counter (‘OTC’) derivatives by the Commodity Futures Trading Commission (‘CFTC’) and the SEC, including mandatory clearing, exchange trading, and public and regulatory transaction reporting of certain OTC derivatives, as well as rules regarding the registration of swap dealers and major swap participants, and related capital, margin, business conduct, record keeping and other requirements applicable to such entities.
The CFTC has adopted rules implementing many of the most significant provisions of Title VII, most of which came into effect in 2013 and 2014. In particular, HSBC Bank USA and HSBC Bank plc are provisionally registered as swap dealers with the CFTC. Because HSBC Bank plc is a non-US swap dealer, the CFTC generally limits its direct regulation of HSBC Bank plc’s swap transactions to swaps with US persons and certain affiliates of US persons. However, the CFTC continues to consider whether to apply mandatory clearing, exchange trading, public transaction reporting, margin and business conduct rules to swaps with non-US persons arranged, negotiated or executed by US personnel or agents. The CFTC is also considering whether to apply regulatory transaction reporting requirements on all swaps entered into by a non-US swap dealer or instead to permit reliance on transaction reporting under comparable EU rules. The application of CFTC rules to HSBC Bank plc’s swaps with non-US persons could have an adverse effect on the willingness of non-US counterparties to trade swaps with HSBC Bank plc, and we continue to assess how developments in these areas will affect our business. On 25 July 2017, the CFTC extended pre-existing relief from the requirement for non-US swap dealers (e.g., HSBC Bank plc) to comply with clearing, trade execution, reporting, and business conduct rules for swaps with non-US counterparties, when using personnel or agents located in the US to arrange, negotiate, or execute such
|
HSBC Holdings plc
|
91
|
Report of the Directors
| Financial summary
swaps. This relief extends until the CFTC takes further action on whether to subject such swaps to particular rule requirements. The CFTC also finalised rules in 2016 that will require additional interest rate swaps to be cleared, which are expected to come into effect in phases based on the implementation of parallel clearing requirements in non-US jurisdictions, and in any event by October 2018, and has also proposed rules that would apply position limits to certain physical commodity swaps.
In 2014, the SEC finalised rules regarding the cross-border application of the security-based swap dealer (‘SBS’) and major SBS participant definitions. These rules share many similarities with parallel guidance finalised by the CFTC in July 2013. In January 2015, the SEC also finalised rules regarding reporting and public dissemination requirements for SBS transaction data. In August 2015, the SEC also finalised rules for the registration of SBS dealers and major SBS participants. The SEC has not yet finalised the implementation dates for these rules or finalised several related Title VII rules. Because our equity and credit derivatives businesses are also subject to the CFTC’s jurisdiction under Title VII, material differences between the final SEC rules and existing CFTC rules could materially increase our costs of compliance with Title VII by requiring the implementation of significant additional policies, procedures, documentation, systems and controls for those businesses. On 13 July 2016, the SEC delayed its SBS reporting requirement to one month after its SBS dealer registration rule takes effect. SBS dealer registration will not be required until six months after the SEC finalises a number of additional rules, including on capital, margin and segregation. Previously, the timelines for SBS reporting and registration were independent of each other, raising the prospect of pre-registration reporting followed by significant post-registration changes to reporting hierarchies. The ultimate timeframe for finalisation and effectiveness of remaining SEC rulemakings, including SBS dealer and major SBS participant registration, remains uncertain.
In 2015, the OCC, jointly with other US banking regulators, adopted final rules establishing margin requirements. The final margin rules require HSBC Bank USA and HSBC Bank plc to collect and post initial and variation margin for certain non-cleared swaps and SBS entered into with other swap dealers and financial end-users that exceed a minimum threshold of transactional activity. For certain non-cleared swaps and SBS entered into with financial end-users that do not meet the minimum transactional activity threshold, HSBC Bank USA and HSBC Bank plc will only be required to collect and post variation margin (but not initial margin). The US banking regulators’ final rules do not impose margin requirements for non-cleared swaps and SBS entered into with non-financial end-users, certain sovereigns and multilateral development banks or qualifying hedging transactions with certain small depository institutions.
The final margin rules also limit the types of assets that are eligible to satisfy initial and variation margin requirements, require initial margin to be segregated at a third-party custodian, impose requirements on internal models used to calculate initial margin requirements and contain specific provisions for cross-border transactions and inter-affiliate transactions. The final margin rules follow a phased implementation schedule, with variation margin requirements and certain initial margin requirements already in effect and additional initial margin requirements to be phased in on an annual basis through September 2020, with the relevant compliance dates depending on the transactional volume of the parties and their affiliates. These final rules, as well as parallel margin rules from the CFTC, the SEC and certain non-US regulators will increase the costs and liquidity burden associated with trading non-cleared swaps and SBS, and may adversely affect our business in such products. In particular, the imposition of initial margin requirements on inter-affiliate transactions will significantly increase the cost of certain consolidated risk management activities and may adversely affect HSBC to a greater extent than some of our competitors.
Dodd-Frank also included a ‘swaps push-out’ provision that would have effectively limited the range of OTC derivatives activities in which an insured depository institution, including HSBC Bank
USA, could engage. The scope of this provision was significantly reduced in December 2014, and now effectively only restricts HSBC Bank USA’s ability to enter into certain ‘structured finance swaps’ after 16 July 2015 that are not entered into for hedging or risk mitigation purposes.
Dodd-Frank grants the SEC discretionary rule-making authority to modify the standard of care that applies to brokers, dealers and investment advisers when providing personalised investment advice to retail customers and to harmonise other rules applying to these regulated entities. Dodd-Frank also expands the extra-territorial jurisdiction of US courts over actions brought by the SEC or the US with respect to violations of the anti-fraud provisions in the Securities Act, the Securities Exchange Act of 1934 and the Investment Advisers Act of 1940. In addition, regulations which the FSOC, the CFPB or other regulators may adopt could affect the nature of the activities that our FDIC-insured depository institution subsidiaries may conduct, and may impose restrictions and limitations on the conduct of such activities.
The implementation of the remaining Dodd-Frank provisions, including those related to the recommended imposition of the fiduciary standard on broker-dealers, could result in additional costs or limit or restrict the way we conduct our business in the US.
Global and regional prudential and other regulatory developments
The Group is subject to regulation and supervision by a large number of regulatory bodies and other agencies. In addition to changes being introduced at a country level, changes are often driven by global bodies such as the G‑20, the FSB and Basel Committee, which are then implemented at country level or regionally through the EU sometimes with modifications and with separate additional measures.
We are also subject to regulatory stress testing in many jurisdictions. These have increased both in frequency and in the granularity of information required by supervisors. They include the programmes of the BoE, the FRB (as explained in the ‘US regulation and supervision’ section), the OCC, the EBA, the ECB, the HKMA and other regulators. For further details, see ‘Stress testing’ on page
109
.
The Basel Committee finalised the package of revisions to the Basel III framework on 6 December 2017. These will affect the measurement of market, credit, counterparty, CVA and operational risk RWAs and will incorporate a floor to the modelled capital calculations based on standardised approaches. It is also consulting on changes to the sovereign risk regime. In addition, in March 2017, the Basel Committee proposed several changes to the framework for assessing and designating G-SIBs and determining their respective surcharges. The proposed changes would maintain the current assessment categories but would revise indicators relating to certain categories that could lead to increased surcharges. Changes in local capital regimes are expected to result from the final Basel agreement. Further details can be found in the ‘Regulatory developments’ on page
3
of the
Pillar 3 Disclosures at 31 December 2017
.
Recovery and resolution
We are working with our primary regulators to develop and agree a resolution strategy for HSBC. It is our view that the most appropriate resolution strategy for the HSBC Group would include the bail-in of external TLAC and the conversion of internal TLAC to equity in order to stabilise the Group and keep the Group together, at least initially. Thereafter, the resolution strategy allows for the restructuring and potential break up of the Group at a subsidiary bank level following the initial stabilisation via bail-in. This two step strategy is aligned to our existing legal and business structure and to the approach to TLAC issuance taken by the Group.
Similar to all G-SIBs, we are working with our regulators to mitigate or remove critical inter-dependencies between our subsidiaries to further facilitate the resolution of the Group. In particular, in order to remove operational dependencies (where one subsidiary bank provides critical services to another), we are
|
92
|
HSBC Holdings plc
|
in the process of transferring critical services from our subsidiary banks to a separate internal service company sub-group.
European regulation
Through the UK’s membership of the EU, HSBC is currently both directly and indirectly subject to European financial services regulation.
As part of the SSM, a Single Resolution Mechanism (‘SRM’) was also established to apply to all banks covered by the SSM. This is intended to ensure that bank resolution is managed effectively through a Single Resolution Board and a Single Resolution Fund financed by the banking sector.
In the EU, the Bank Recovery and Resolution Directive (‘BRRD’) provides the framework for the recovery and resolution of credit institutions, including requirements for banks to maintain at all times a sufficient aggregate amount of own funds and ‘eligible liabilities’ (that is, liabilities that may be bailed in using the bail-in tool) known as the minimum requirements for eligible liabilities (‘MREL’). The Bank of England has set out how MREL requirements will be applied in the UK in a manner that is also consistent with the FSB’s global proposals on TLAC.
On 23 November 2016, the European Commission published proposals for amendments to the BRRD and CRD IV, designed to implement (among other changes) global standards for TLAC and some, but not all, of the reforms to Basel III prescribed by the Basel Committee, as well as various related changes to the EU prudential framework. These proposals are yet to be finalised, and it is unclear, particularly in light of the vote to leave the EU, how these requirements (including the intermediate holding requirement for non-EU banking groups) will affect the HSBC Group.
The EU will continue to drive forward with implementation of its General Data Protection Regulation and is expected also to focus on the embedding of recently implemented measures such as Markets in Financial Instrument Regulation/Directive (‘MiFID II’), the EU’s Framework for Benchmarks and Indices, the Packaged Retail Investment and Insurance Products Regulation, the Second Payment Services Directive, Money Markets Fund Regulation, Securities Financing Transactions Regulation, and the Fourth Money Laundering Directive. Various proposals falling under the EU’s Capital Markets Union initiative in the areas of consumer protection and financial markets are also likely to progress to final legislative measures through 2018 and 2019. Cyber-risk and risks emerging from the use and development of financial technology and data use and processing are becoming an increasing priority of EU and other regulatory authorities globally more generally. These regulations and directives are expected to continue to apply to HSBC’s UK business after the UK’s exit from the EU under the UK withdrawal arrangements as currently understood. The Group continues to enhance and strengthen its governance and resourcing more generally around regulatory change management and the implementation of required measures, actively to address this ongoing and significant agenda of regulatory change.
Anti-money laundering and sanctions regulation
HSBC requires all Group companies to adhere to the letter and spirit of all applicable laws and regulations, and we have policies, procedures and training in place to ensure that our employees know and understand our criteria for determining the risk rating of client or business relationships.
The European Commission updated the Fourth Directive on the prevention of the use of the financial system for money laundering and terrorist financing during 2016 and member states were required to incorporate the updated Directive into national laws by 26 June 2017. Financial institutions were required to comply with these laws from this date; HSBC’s Global Anti-money Laundering ('AML') policy incorporates the requirements of the updated directive.
We continue to monitor activities relating to those countries which are subject to economic sanctions programmes administered by the United States ('US'), the United Nations ('UN'), the United Kingdom ('UK') and the European Union ('EU'). Additionally, our
sanctions screening also incorporates local lists as required in the jurisdictions in which we operate.
HSBC policy requires all Group companies to comply to the extent applicable with US sanctions laws. This means that US subsidiaries and US nationals must comply with US sanctions and that HSBC subsidiaries outside the US which are not US persons must not participate in transactions within US jurisdictions (including most US dollar transactions) that would contravene US sanctions.
During 2017 the US issued new legislation expanding sanctions on Russia, Venezuela, and North Korea, and issued an executive order modifying sanctions with respect to Sudan. HSBC’s Global
Sanctions Policy has been updated to ensure compliance with the various requirements resulting from changes in US sanctions laws.
We do not consider that our business activities with counterparties with whom transactions are restricted or prohibited under US sanctions are material to our business, and such activities represented a very small part of the Group’s total assets at 31 December 2017 and total revenues for the year ended 31 December 2017.
We entered into agreements with the US Department of Justice (‘DoJ’) and the UK Financial Conduct Authority (‘FCA’) in 2012, including the five-year Deferred Prosecution Agreement (‘DPA’) which required the implementation of an effective AML and sanctions compliance programme. On 11 December 2017, with the DoJ’s agreement, the DPA expired and the charges deferred by the DPA were dismissed on 12 December 2017. Despite the expiration of the DPA and the dismissal of the charges contained within, we will continue to develop the AML and sanctions compliance programme.
Holdings entered into a Consent Order with the Federal Reserve Bank of Chicago (FRB-C) in 2012 which also required the implementation of an effective AML and sanctions compliance programme. This Consent Order remains in effect as of year-end 2017.
Other
HSBC Bank USA entered into a Consent Order with the Office of the Comptroller of the Currency, and HSBC North American Holdings (‘HNAH’) entered into a Consent Order with the Federal Reserve Board in October 2010. These Orders required improvement of our compliance risk management programme, including AML controls across our US businesses. HSBC Bank USA and HNAH have taken appropriate steps to comply with the requirements of these Orders while ensuring that effective policies and procedures are maintained.
Disclosures pursuant to Section 13(r) of the Securities Exchange Act
Section 13(r) of the Securities Exchange Act requires each issuer registered with the SEC to disclose in its annual or quarterly reports whether it or any of its affiliates have knowingly engaged in specified activities or transactions with persons or entities targeted by US sanctions programmes relating to Iran, terrorism, or the proliferation of weapons of mass destruction, even if those activities are not prohibited by US law and are conducted outside the US by non-US affiliates in compliance with local laws and regulations.
To comply with this requirement, HSBC Holdings plc (together with its affiliates, ‘HSBC’) has requested relevant information from its affiliates globally. The following activities conducted by HSBC are disclosed in response to Section 13(r):
Loans in repayment
Between 2001 and 2005, the Project and Export Finance business of HSBC arranged or participated in a portfolio of loans to Iranian energy companies and banks. All of these loans were guaranteed by European and Asian export credit agencies and have varied maturity dates with final maturity in 2018. For those loans that remain outstanding, we continue to seek repayment in accordance with our obligations to the supporting export credit agencies. Details of these loans follow.
|
HSBC Holdings plc
|
93
|
Report of the Directors
| Financial summary
At 31 December 2017, we had five loans outstanding to an Iranian petrochemical company. These loans are supported by the official export credit agencies of the following countries: the UK, South Korea and Japan. We continue to seek repayments from the Iranian company under the outstanding loans in accordance with their original maturity profiles. Two repayments have been made under each of the five loans in 2017.
We also acted as a sub-participant in a Spanish Export Credit Agency supported loan provided by another international bank to Bank Mellat. This loan matured in 2013 with claims for non-payment being settled by the agency. A small balance which had remained unpaid by Bank Mellat in relation to this legacy asset was recovered in the first quarter of 2017.
Estimated gross revenue and net profit generated by these loans in repayment for 2017, which includes interest and fees, was approximately $107,000. While we intend to continue to seek repayment under the existing loans, all of which were entered into before the petrochemical sector of Iran became a target of US sanctions, we do not currently intend to extend any new loans.
Legacy contractual obligations related to guarantees
Between 1996 and 2007, we provided guarantees to a number of our non-Iranian customers in Europe and the Middle East for various business activities in Iran. In a number of cases, we issued counter-indemnities in support of guarantees issued by Iranian banks as the Iranian beneficiaries of the guarantees required that they be backed directly by Iranian banks. The Iranian banks to which we provided counter-indemnities included Bank Tejarat, Bank Melli and the Bank of Industry and Mine.
There was no measurable gross revenue in 2017 under those guarantees and counter indemnities. We do not allocate direct costs to fees and commissions and, therefore, have not disclosed a separate net profit measure. We are seeking to cancel all relevant guarantees and counter-indemnities and do not currently intend to provide any new guarantees or counter-indemnities involving Iran. None were cancelled in 2017 and approximately 19 remain outstanding.
Other relationships with Iranian banks
Activity related to US-sanctioned Iranian banks not covered elsewhere in this disclosure includes the following:
|
•
|
We maintain several accounts in the UK for an Iranian-owned, UK-regulated financial institution. These accounts are generally no longer restricted under UK law, though we maintain restrictions on the accounts as a matter of policy. We are seeking to exit these accounts and have begun transferring the funds to the clients' accounts at other financial institutions. Estimated gross revenue in 2017 on these accounts, which includes fees and/or commissions, was approximately $109,090.
|
|
•
|
We act as the trustee and administrator for a pension scheme involving eight employees of a US-sanctioned Iranian bank in Hong Kong, six of whom joined the scheme during 2017. Under the rules of this scheme, we accept contributions from the Iranian bank each month and allocate the funds into the pension accounts of the Iranian bank’s employees. We run and operate this pension scheme in accordance with Hong Kong laws and regulations. Estimated gross revenue, which includes fees and/or commissions, generated by this pension scheme in 2017 was approximately $2,910.
|
For the Iranian bank-related activity discussed above, we do not allocate direct costs to fees and commissions and, therefore, have not disclosed a separate net profit measure.
We have been holding a safe custody box for the Central Bank of Iran. For a number of years, the box has not been accessed by the Central Bank of Iran and no fees have been charged to the Central Bank of Iran.
We currently intend to continue to wind down the activity discussed in this section, to the extent legally permissible, and not enter into any new such activity.
Activity related to US Executive Order 13224
We maintain an account for a corporate customer whose owner was designated under Executive Order 13382 during the first quarter of 2017. The customer made a payment of $370,000 shortly after the owner’s designation, which was cleared locally. The account was subsequently frozen. There was no measurable gross revenue or net profit generated from this transaction in 2017.
Other activity
We have an insurance company customer in the United Arab Emirates that during 2017 made six payments and processed five cheques for the reimbursement of medical treatment to a hospital located in the United Arab Emirates and owned by the Government of Iran. HSBC processed all 11 transactions to the hospital made by its customer.
We have a travel agent customer in Europe that made 12 payments to an airline owned by the Government of Iran for the purchase of airline tickets on behalf of a customer.
We maintain an account for an individual customer that made a payment to the Embassy of Iran in Malaysia through a depository account during the first quarter of 2017, which pertained to charges for sending a document to his father in Iran.
We maintain an account for a corporate customer that received a payment from an Iranian-owned financial institution during the first quarter of 2017.
We maintain an account for an individual customer that received a cheque payment from an Iranian state owned entity during the first quarter of 2017.
We maintain an account for a corporate customer that received a cheque payment issued by an Iranian-owned financial institution during the first quarter of 2017.
We maintain accounts for certain individual and corporate customers that have used HSBC credit cards to make payments to Iranian owned entities (such as Iranian embassies located in different countries for consular services), during 2017.
For the activity in this section, there was no measurable gross revenue or net profit to HSBC in 2017.
Frozen accounts and transactions
We maintain several accounts that are frozen as a result of relevant sanctions programmes, and safekeeping boxes and other similar custodial relationships, for which no activity, except as licensed or otherwise authorised, took place during 2017. There was no measurable gross revenue or net profit to HSBC in 2017 relating to these frozen accounts.
|
94
|
HSBC Holdings plc
|
|
Risk
|
|
|
Page
|
|
|
Our conservative risk appetite
|
|
|
Top and emerging risks
|
|
|
Externally driven
|
|
|
Internally driven
|
|
|
Risk factors
|
|
|
Areas of special interest
|
|
|
Process of UK withdrawal from the European Union
|
|
|
Risk management
|
|
|
Our risk management framework
|
|
|
Our material banking and insurance risks
|
|
|
Credit risk management
|
|
|
Liquidity and funding risk management
|
|
|
Market risk management
|
|
|
Operational risk management
|
|
|
Regulatory compliance risk management
|
|
|
Financial crime risk management
|
|
|
Insurance manufacturing operations risk management
|
|
|
Other material risks
|
|
|
– Reputational risk management
|
|
|
– Sustainability risk management
|
|
|
– Pension risk management
|
|
|
Key developments and risk profile in 2017
|
|
|
Key developments in 2017
|
|
|
Credit risk profile
|
|
|
Liquidity and funding risk profile
|
|
|
Market risk profile
|
|
|
Operational risk profile
|
|
|
Insurance manufacturing operations risk profile
|
|
|
Our conservative risk appetite
|
The following principles guide the Group’s overarching risk appetite and determine how its businesses and risks are managed.
Enterprise-wide application
|
•
|
Our risk appetite encapsulates consideration of financial and non-financial risks and is expressed in both quantitative and qualitative terms.
|
|
•
|
It is applied at the global business level, at the regional level, and to material operating entities.
|
Financial position
|
•
|
Strong capital position, defined by regulatory and internal capital ratios.
|
|
•
|
Liquidity and funding management for each operating entity, on a stand-alone basis.
|
Operating model
|
•
|
Returns generated in line with risk taken.
|
|
•
|
Sustainable and diversified earnings mix, delivering consistent returns for shareholders.
|
Business practice
|
•
|
Zero tolerance for knowingly engaging in any business, activity or association where foreseeable reputational risk or damage has not been considered and/or mitigated.
|
|
•
|
No appetite for deliberately or knowingly causing detriment to consumers, or incurring a breach of the letter or spirit of regulatory requirements.
|
|
•
|
No appetite for inappropriate market conduct by a member of staff or by any Group business.
|
|
Top and emerging risks
|
Externally driven
Economic outlook and capital flows
Although global economic activity strengthened in 2017, growth was weak in many countries and headwinds remain in both developed and emerging economies. Global central banks have initiated a gradual tightening of monetary policy that will likely continue into 2018. Sharper than expected interest rate rises, or economic and/or geopolitical shocks, could lead to an increase in capital flows volatility, especially for emerging markets, potentially impacting economic growth.
Protectionism is on the rise in many parts of the world, driven by both populist sentiment and structural challenges facing developed economies. This rise could contribute to weaker global trade, potentially affecting HSBC’s traditional lines of business.
The ongoing uncertainty regarding the terms of the UK’s exit from the EU, the UK’s future relationship with the EU, and its trading relationship with the rest of the world, may lead to market volatility, which could affect both the Group and its customers.
The level of indebtedness in mainland China remains high. Any policy action to restrain credit growth could have wider ramifications for regional and global economic growth, trade and capital flows.
Increased tensions in the Middle East may have significant regional economic and political consequences which could impact the Group’s operations within the region.
Oil prices have staged a partial recovery since mid-2017, returning to levels last seen in late 2014. Nevertheless, certain producers, exporters and oil services companies are still under financial strain, which could negatively affect their investment budgets and thus business prospects for HSBC.
Mitigating actions
|
•
|
We actively assess the impact of economic developments in key markets on specific customer segments and portfolios and take appropriate mitigating actions. These actions include revising risk appetite and/or limits, as circumstances evolve.
|
|
•
|
We use internal stress testing and scenario analysis, as well as regulatory stress test programmes, to evaluate the potential impact of macroeconomic shocks on our businesses and portfolios. Our approach to stress testing is described on page
109
.
|
|
•
|
We have carried out detailed reviews and stress tests of our wholesale credit and trading portfolios to determine those sectors and customers most vulnerable to the UK’s exit from the EU, in order to proactively manage and mitigate this risk.
|
Geopolitical risk
Our operations and portfolios are exposed to risks associated with political instability, civil unrest and military conflict, which could lead to disruption to our operations, physical risk to our staff and/or physical damage to our assets. In addition, rising protectionism and the increasing trend of using trade and investment policies as diplomatic tools may also adversely affect global trade flows.
Geopolitical risk remained heightened throughout 2017. While elections across the EU during 2017 have temporarily stemmed a populist tide, political uncertainty remains high in the UK as negotiations progress towards an exit from the EU (see ‘Process of UK withdrawal from the European Union’ in Areas of special interest on page
106
). In addition, the threat of terrorism within the region remains high.
|
HSBC Holdings plc
|
95
|
Report of the Directors
| Risk
In the Middle East, a number of countries severed diplomatic and transport ties with Qatar, a leading exporter of liquefied natural gas and a significant global investor. Further sanctions may be imposed on Iran outside the guidelines laid out in the Joint Comprehensive Plan of Action, which was decertified, rather than dismantled, by the Trump administration. The tensions between Saudi Arabia, the US and Iran may remain.
In Asia, tensions continue to rise between North Korea and the US as a result of North Korean progress in its missile and nuclear programmes. The stronger Chinese enforcement of UN sanctions on North Korea may not halt further missile and nuclear tests. Any escalation could have a significant impact on regional and global trade.
Mitigating actions
|
•
|
We continually monitor the geopolitical outlook, in particular in countries where we have material exposures and/or a physical presence. We have also established dedicated forums to monitor geopolitical developments.
|
|
•
|
We use internal stress tests and scenario analysis as well as regulatory stress test programmes, to adjust limits and exposures to reflect our risk appetite and mitigate risks as appropriate. Our internal credit risk ratings of sovereign counterparties take into account geopolitical developments that could potentially disrupt our portfolios and businesses.
|
|
•
|
Contingency planning for the UK’s exit from the EU continues and we are assessing the potential impact on our portfolios, operations and staff.
|
|
•
|
We have taken steps to enhance physical security in those geographical areas deemed to be at high risk from terrorism and military conflicts.
|
The credit cycle
The credit environment remains benign as evidenced by the continued fall in loan impairment charges during 2017.
However, there is a risk that the credit cycle could turn sharply as a result of shocks. These could occur as a result of political events in the US, UK and EU, or sentiment towards mainland China deteriorating amid concerns over increasing leverage in the financial system.
Additionally, a renewed downward trend in oil prices could increase financial difficulties in the oil and gas sector.
Substantial amounts of external refinancing are due in emerging markets in 2018. Stress could appear in a wide array of credit segments and impairment allowances could increase if the credit quality of our customers is affected by less favourable global economic conditions in some markets.
Mitigating actions
|
•
|
We closely monitor economic developments in key markets and sectors and undertake scenario analysis. This enables us to take portfolio actions where necessary, including enhanced monitoring, amending our risk appetite and/or reducing limits and exposures.
|
|
•
|
We stress test portfolios of particular concern to identify sensitivity to loss under a range of scenarios, with management actions being taken to rebalance exposures and manage risk appetite where necessary.
|
|
•
|
Reviews of key portfolios are undertaken regularly to help ensure that individual customer or portfolio risks are understood and our ability to manage the level of facilities offered through any downturn is appropriate.
|
Cyber-threat and unauthorised access to systems
HSBC and other public and private organisations continue to be the targets of increasingly sophisticated cyber-attacks. Ransomware and distributed denial of service attacks appear to be an increasingly dominant threat to the financial industry, which may result in disruption to our operations and customer-facing websites or loss of customer data.
Mitigating actions
|
•
|
We continue to strengthen and significantly invest in our ability to prevent, detect and respond to the ever-increasing and sophisticated threat of cyber-attacks. Specifically, we continue to enhance our capabilities to protect against increasingly sophisticated malware, denial of service attacks and data leakage prevention, as well as enhancing our security event detection and incident response processes.
|
|
•
|
Cyber risk is a priority area for the Board and is regularly reported at Board level to ensure appropriate visibility, governance and executive support for our ongoing cybersecurity programme.
|
|
•
|
We participate in intelligence sharing with both law enforcement and industry schemes to help improve our understanding of, and ability to respond to, the evolving threats faced by us and our peers.
|
Regulatory, technological and sustainability developments including conduct, with adverse impact on business model and profitability
Financial service providers continue to face stringent regulatory and supervisory requirements, particularly in the areas of capital and liquidity management, conduct of business, financial crime, internal control frameworks, the use of models and the integrity of financial services delivery. The competitive landscape in which the Group operates may be significantly altered by future regulatory changes and government intervention. Regulatory changes, including any resulting from the UK’s exit from the EU, may affect the activities of the Group as a whole, or of some or all of its principal subsidiaries.
In September 2017, HSBC Holdings and HSBC North America Holdings Inc. (‘HNAH’) consented to a civil money penalty order with the US Federal Reserve Board (‘FRB’) in connection with its investigation into HSBC’s foreign exchange activities. Under the terms of the order, HSBC Holdings and HNAH agreed to undertake certain remedial steps and to pay a civil money penalty to the FRB. In January 2018, HSBC Holdings entered into a three-year deferred prosecution agreement with the US Department of Justice (‘DoJ’) (‘FX DPA’), regarding fraudulent conduct in connection with two particular transactions in 2010 and 2011. This concluded the DoJ’s investigation into HSBC’s historical foreign exchange activities. Under the terms of the FX DPA, HSBC has a number of ongoing obligations, including continuing to cooperate with authorities and implementing enhancements to its internal controls and procedures in its Global Markets business which will be the subject of annual reports to the DoJ. In addition, HSBC agreed to pay a financial penalty and restitution.
While we are actively engaging in opportunities, there is a risk that the rise of financial technology (‘fintech’) could disrupt the traditional business model of financial institutions.
The financial sector has also been subject to an increasing number of campaigns promoting environmental objectives, including climate change related risks (see page
27
), as the sophistication of campaigns and research capabilities of non-governmental organisations (‘NGOs’) develop.
Mitigating actions
|
•
|
We are fully engaged with governments and regulators in the countries in which we operate to help ensure that new requirements are considered properly by regulatory authorities and the financial sector and can be implemented effectively. Significant regulatory programmes, such as Global Standards (see page
13
) and the establishment of the UK ring-fenced bank, are overseen by the Group Change Committee (‘GCC’).
|
|
•
|
We hold regular meetings with UK authorities to discuss strategic contingency plans covering a wide range of scenarios relating to the UK’s exit from the EU.
|
|
•
|
We have invested significant resources and have taken, and will continue to take, a number of steps to improve our compliance systems and controls relating to global markets activities.
For
|
|
96
|
HSBC Holdings plc
|
further details, see ‘Regulatory compliance risk management’ on page
117
.
|
•
|
The HSBC Digital Solutions team is actively pursuing opportunities in the fintech space and is deploying solutions with a higher level of agility than our traditional model, helping to enable us to be more competitive in this area.
|
|
•
|
We continue to work with NGOs to enhance our policies to support sustainable finance.
|
Financial crime risk environment
Financial institutions remain under considerable regulatory scrutiny regarding their ability to prevent and detect financial crime. Financial crime threats continue to evolve, often in tandem with geopolitical developments. The financial crime risks related to the use of innovative fintech are not yet fully understood, while the changing sanctions regulatory landscape presents execution challenges.
Recent terrorist attacks in Europe and the US may increase law enforcement and/or regulatory focus on bank controls to combat terrorist financing and timely reporting to authorities. This focus may also lead to conflicts between data demands from law enforcement and the data protections which HSBC is required to enforce.
HSBC Bank USA entered into a consent cease and desist order with the OCC in October 2010 and HSBC North America Holdings entered into a consent cease and desist order with the FRB. HSBC Bank USA further entered into an enterprise-wide compliance consent order in 2012. HSBC Holdings consented to a cease and desist order with the FRB in December 2012. Together, these orders required improvements to establish an effective compliance risk management programme across HSBC, including risk management related to the Bank Secrecy Act, AML and compliance with US sanctions laws. Failure to comply with these orders by HSBC could place further restrictions on the operations of HSBC entities, and therefore impact the achievement of our strategic objectives.
HSBC Bank USA, as the primary US dollar correspondent bank for the Group, is subject to heightened financial crime risk arising from business conducted on behalf of clients as well as its non-US HSBC affiliates. If HSBC Bank USA fails to conduct adequate due diligence on clients, including its affiliates, or otherwise inappropriately processes US dollar payments on behalf of non-US HSBC affiliates, it could be in breach of applicable US AML and sanctions laws and regulations and become subject to legal or regulatory enforcement actions by the Office of Foreign Assets Control and other US agencies.
Mitigating actions
|
•
|
We continued to enhance our Financial Crime Risk function which brings together all areas of financial crime risk management at HSBC (see page
118
).
|
|
•
|
We strengthened governance processes during 2017 by establishing formal financial crime risk governance committees at region, global business and country levels of the organisation. This will help to ensure appropriate oversight and escalation of issues to the Financial Crime Risk Management Meeting of the Group Management Board.
|
|
•
|
We are working to develop enhanced risk management capabilities through better use of sophisticated analytical techniques.
|
|
•
|
We are working to ensure that the reforms we have put in place are both effective and sustainable over the long term. Work in these areas will continue to be consistent with the terms of the orders by which we
are bound and the strategic objectives of the Group.
|
Internally driven
IT systems infrastructure and resilience
HSBC continues to invest in the reliability and resilience of our IT systems and critical services. We do so to help prevent disruption to customer services, which could result in reputational and regulatory damage.
Mitigating actions
|
•
|
Strategic initiatives are transforming how technology is developed, delivered and maintained, with a particular focus on providing high-quality, stable and secure services. As part of this, we are concentrating on materially improving system resilience and service continuity testing. In addition, we have enhanced the security of our development life cycle and improved our testing processes and tools.
|
|
•
|
During 2017, we continued to monitor and upgrade our IT systems, simplifying our service provision and replacing older IT infrastructure and applications. These enhancements led to a further improvement in service availability during the year for our customers and employees.
|
Impact of organisational change and regulatory demands on employees
Our success in delivering the Group’s strategic priorities, as well as significant regulatory change programmes, depends in part on the retention of key members of our management team and wider employee base. The ability to continue to attract, train, motivate and retain highly qualified professionals in an employment market where expertise is often mobile and in short supply is critical. This may depend on factors beyond our control, including economic, market and regulatory conditions. In addition, the impact of the UK’s exit from the EU on our employees and the scale of the resultant organisational change is yet to be fully understood.
Mitigating actions
|
•
|
Risks related to organisational change are subject to close management oversight. A range of actions are being developed to address the risks associated with the Group’s major change initiatives, including recruitment, development and extensive relocation support to existing employees in the UK ring-fenced bank.
|
|
•
|
Through dedicated work streams, we continue to develop succession plans using a broad array of talent-sourcing channels for key management roles, which are reviewed on a regular basis.
|
|
•
|
Contingency planning to address the potential impacts of the UK’s exit from the EU on our staff is underway with regular updates provided to the UK authorities.
|
Execution risk
In order to deliver our strategic objectives and meet mandatory regulatory requirements, it is important for HSBC to maintain a strong focus on execution risk. This requires robust management of significant resource-intensive and time-sensitive programmes. Risks arising from the magnitude and complexity of change may include regulatory censure, reputational damage or financial losses.
Mitigating actions
|
•
|
The GCC, chaired by the Group Chief Operating Officer, oversees these key regulatory and strategic initiatives, managing interdependencies and providing direction and support to help ensure their effective and timely delivery.
|
|
•
|
In 2017, we continued to manage execution risks through closely monitoring the punctual delivery of critical initiatives, internal and external dependencies, and key risks, to allow better portfolio management across Group. The GCC also monitors the ongoing completion of material deliverables across these programmes in order to address any resourcing challenges.
|
|
•
|
The GCC escalates any necessary issues to the Group Risk Management Meeting of the Group Management Board.
|
|
HSBC Holdings plc
|
97
|
Report of the Directors
| Risk
Risks arising from the receipt of services from third parties
We utilise third parties for the provision of a range of services, in common with other financial service providers. Risks arising from the use of third-party service providers may be less transparent and therefore more challenging to manage or influence. It is critical that we ensure that we have appropriate risk management policies, processes and practices, including adequate control over the selection, governance and oversight of third parties, particularly for key processes and controls that could affect operational resilience. Any deficiency in our management of risks arising from the use of third parties could affect our ability to meet strategic, regulatory or client expectations.
Mitigating actions
|
•
|
In the fourth quarter, we commenced the deployment of our delivery model in the first line of defence by establishing a dedicated team and developing associated processes, controls and technology for undertaking assessments of third-party service providers against key criteria throughout the third-party life cycle. In addition, we started to roll out associated control monitoring, testing and assurance processes.
|
|
•
|
We established a dedicated oversight forum in the second line of defence to monitor the embedding of policy requirements and performance against risk appetite.
|
Enhanced model risk management expectations
We use models for a range of purposes in managing our business, including regulatory capital calculations, stress testing, credit approvals, financial crime risk management and financial reporting. Internal and external factors have had a significant impact on our approach to model risk management. Moreover, the adoption of more sophisticated modelling techniques and technology across the industry could also lead to increased model risk.
Mitigating actions
|
•
|
We have established a model risk management sub-function in the second line of defence to strengthen governance and oversight of this risk type.
|
|
•
|
We further strengthened our model risk management framework throughout 2017 by establishing additional global model oversight committees and implementing policies and standards in accordance with key regulatory requirements.
|
|
•
|
As we adopt new modelling technologies, we are updating our model risk management framework and governance standards to help address any new risks arising.
|
Data management
The Group uses a large number of systems and applications to support key business processes and operations. As a result, we often need to reconcile multiple data sources, including customer data sources, to reduce the risk of error. HSBC, along with other organisations, also needs to meet external/regulatory obligations such as the General Data Protection Regulation (‘GDPR’) which requires implementation of data privacy and protection capabilities across our customer data systems by May 2018.
Mitigating actions
|
•
|
We continue to improve data quality across a large number of systems globally. Our data management and aggregation continues to strengthen and enhance the effectiveness of internal systems and processes. We are implementing data controls for critical processes in the ‘front-office’ systems to improve our data capture at the point of entry.
|
|
•
|
We continue to proactively monitor customer and transaction data resolving any associated data issues. We have also implemented data controls and enhanced reconciliation in order to improve the reliability of data used by our customers and staff.
|
|
•
|
Our data culture is strengthening with ownership and accountability attributed to our businesses and increased focus on data as a Group asset.
|
|
•
|
We have deployed risk and finance data aggregation and advanced reporting capabilities to key markets in 2017. We are on track for completing actions for the remaining countries in scope by the end of 2018.
|
|
•
|
A dedicated programme of work has been mobilised to execute the GDPR requirements in order to enhance our customers’ data protection and privacy.
|
|
Risk factors
|
Macroeconomic and geopolitical risk
Current economic and market conditions may adversely affect our results
Our earnings are affected by global and local economic and market conditions.
Uncertain and at times volatile economic conditions can create a challenging operating environment for financial services companies such as HSBC. In particular, we may face the following challenges to our operations and operating model in connection with these factors:
|
•
|
the demand for borrowing from creditworthy customers may diminish if economic activity slows or remains subdued;
|
|
•
|
if capital flows are disrupted, some emerging markets may impose protectionist measures that could affect financial institutions and their clients, and other emerging, as well as developed markets, may be tempted to follow suit;
|
|
•
|
if interest rates begin to increase, consumers and businesses may struggle with the additional debt burden which could lead to increased delinquencies and loan impairment charges;
|
|
•
|
our ability to borrow from other financial institutions or to engage in funding transactions may be adversely affected by market disruption;
|
|
•
|
market developments may depress consumer and business confidence beyond expected levels. If economic growth is subdued, for example, asset prices and payment patterns may be adversely affected, leading to greater than expected increases in delinquencies, default rates and loan impairment charges. However, if growth is too rapid, new asset valuation bubbles could appear, particularly in the real estate sector, with potentially negative consequences for banks; and
|
|
•
|
a rise in protectionism, including as may be driven by populist sentiment and structural challenges facing developed economies. This rise could contribute to weaker global trade, potentially affecting HSBC’s traditional lines of business.
|
The occurrence of any of these events or circumstances could have a material adverse effect on our business prospects, financial condition, customers and results of operations.
We are subject to political risks in the countries in which we operate, including the risk of government intervention
We operate through an international network of subsidiaries and affiliates in over 65 countries and territories around the world. Our operations are subject to potential unfavourable political developments (which may include coups and/or civil wars), currency fluctuations, social instability and changes in
|
98
|
HSBC Holdings plc
|
government policies in the countries in which we operate or where we have exposure. These may take the form of expropriation, restrictions on international ownership, interest-rate caps, limits on dividend flows and tax in the jurisdictions in which we operate. Such developments could cause disruptions to our operations and result in a material adverse effect on our business, prospects, financial condition and results of operations.
The UK’s withdrawal from the European Union may adversely affect our operating model and financial results
The UK electorate’s vote and the exit agreement to leave the European Union may have a significant impact on general macroeconomic conditions in the United Kingdom, the European Union and
globally. Negotiations of the UK’s exit agreement, its future relationship with the EU and its trading relationships with the rest of the world will likely take a number of years to resolve. This may result in a prolonged period of uncertainty and market volatility, until the UK’s future relationship with the EU and the rest of the world is clearer. Given the time frame and the complex negotiations involved, a clearer picture is not expected to emerge for some time.
Uncertainty as to the precise terms of these arrangements, and the future legal and regulatory landscape, may lead to unstable economic conditions, market volatility and currency fluctuations. Among other issues, the UK’s future relationship with the EU may have implications for the future business model for our London-based European cross-border banking operations, which relies on unrestricted access to the European financial services market. The current negotiating stance of the UK government is likely to include the loss of EU ‘passporting rights’ (that would require us to make use of alternative licensing arrangements for our operations in EU jurisdictions), a discontinuation of the free movement of services and significant changes to the UK’s immigration policy. As a result, meeting our clients' needs following the UK’s departure from the EU will likely require adjustments to our London-based European cross-border banking operations.
These types of challenging market conditions have historically resulted in reduced liquidity, greater volatility, widening of credit spreads and lack of price transparency in credit and capital markets. The adverse market conditions have impacted investment markets globally, including adverse changes and increased volatility in interest rates and exchange rates, and decreased returns from equity, property and other investments.
We may face the following challenges to our operations and operating model in connection with these factors, as a result of the UK’s exit from the EU:
|
•
|
our operating costs could increase, and we could be forced to relocate UK staff and businesses to other jurisdictions;
|
|
•
|
the demand for borrowing from creditworthy customers may diminish if economic activity slows or remains subdued;
|
|
•
|
if capital flows are disrupted, some emerging markets may impose protectionist measures that could affect financial institutions and their clients;
|
|
•
|
our ability to borrow from other financial institutions or to engage in funding transactions may be adversely affected by market disruption; for example, in the event of contagion from stress in the eurozone and global sovereign and financial sectors;
|
|
•
|
market developments may depress consumer and business confidence beyond expected levels. If economic growth remains subdued, for example, asset prices and payment patterns may be adversely affected, leading to greater than expected increases in delinquencies, default rates, write-offs and loan impairment charges. However, if growth is too rapid, new asset valuation bubbles could appear, particularly in the real estate sector, with potentially negative consequences for banks; and
|
|
•
|
the other challenges due to uncertain and at times volatile economic conditions, as described under 'Current economic
|
and market conditions may adversely affect our results', could be exacerbated.
The occurrence of any of the events described above could have a material adverse effect on HSBC’s business, financial condition and prospects, the results of the operations and/or our customers.
Changes in foreign currency exchange rates may affect our results
We prepare our accounts in US dollars because the US dollar and currencies linked to it form the major currency bloc in which we transact and fund our business. However, a substantial portion of our assets, liabilities, assets under management, revenues and expenses are denominated in other currencies. Changes in foreign exchange rates, including those that may result from a currency becoming de-pegged from the US dollar, have an effect on our reported income, cash flows and shareholders’ equity, and could have a material adverse effect on our business, prospects, financial condition and results of operations.
Macro-prudential, regulatory and legal risks to our business model
We may fail to effectively manage affiliate risk
HSBC Bank USA, as the primary US dollar correspondent bank for the Group, is subject to heightened financial crime risk arising from business conducted on behalf of clients, as well as its non-US HSBC affiliates. If HSBC Bank USA fails to conduct adequate due diligence on clients, including its affiliates, or otherwise inappropriately processes US dollar payments on behalf of non-US HSBC affiliates, it could be in breach of applicable US AML and sanctions laws and regulations, become subject to legal or regulatory enforcement actions by OFAC or other US agencies and be required to pay substantial fines or penalties.
Failure to comply with certain regulatory requirements would have a material adverse effect on our results and operations
HSBC Bank USA is also subject to an agreement entered into with the OCC in December 2012, the Gramm-Leach-Bliley Act (‘GLBA’) Agreement and other consent orders. As reflected in the agreement entered into with the OCC in December 2012 (‘the GLBA Agreement’), the OCC has determined that HSBC Bank USA is not in compliance with the requirements that a national bank, and each depository institution affiliate of the national bank, must be both well capitalised and well managed in order to own or control a financial subsidiary. As a result, HSBC Bank USA and its parent holding companies, including HSBC Holdings, do not meet the qualification requirements for financial holding company status. If all of our affiliate depository institutions are not in compliance with these requirements within the time periods specified in the GLBA Agreement, as they may be extended, HSBC could be required either to divest HSBC Bank USA or to divest or terminate any financial activities conducted in reliance on financial holding company status under the GLBA. Similar consequences could result for financial subsidiaries of HSBC Bank USA that engage in activities in reliance on expanded powers provided for in the GLBA. Any such divestiture or termination of activities would have a material adverse effect on our business, prospects, financial condition and results of operation.
We may fail to meet the requirements of regulatory stress tests
We are subject to regulatory stress testing in many jurisdictions which are described on page
118
. These exercises are designed to assess the resilience of banks to potential adverse economic or financial developments and ensure that they have robust, forward-looking capital planning processes that account for the risks associated with their business profile. Assessment by regulators is on both a quantitative and qualitative basis, the latter focusing on our data provision, stress testing capability and internal management processes and controls.
Failure to meet quantitative or qualitative requirements of regulatory stress test programmes, or the failure by regulators to approve our stress results and capital plans, could have a material
|
HSBC Holdings plc
|
99
|
Report of the Directors
| Risk
adverse effect on our prospects, financial condition and results of operations.
We are subject to a number of legal and regulatory actions and investigations, the outcomes of which are inherently difficult to predict
We face significant legal and regulatory risks in our business. The volume and amount of damages claimed in litigation, regulatory proceedings and other adversarial proceedings against financial institutions are increasing for many reasons, including a substantial increase in the number of regulatory changes taking place globally, increased media attention and higher expectations from regulators and the public. In addition, criminal prosecutions of financial institutions for, among other things, alleged conduct, breaches of AML and sanctions regulations, antitrust violations, market manipulation, aiding and abetting tax evasion, and providing unlicensed cross-border banking services, have become more commonplace and may increase in frequency due to increased media attention and higher expectations from prosecutors and the public. Any such prosecution of HSBC or one or more of its subsidiaries could result in substantial fines, penalties and/or forfeitures, and could have a material adverse effect on our business, financial condition, results of operations, prospects and reputation, including the potential loss of key licences, requirement to exit certain businesses and withdrawal of funding from depositors and other stakeholders.
Additionally, we continue to be subject to a number of material legal proceedings, regulatory actions and investigations,
including for example in relation to HSBC’s historical foreign exchange sales and trading activities, which concluded with the entry into a deferred prosecution agreement with the Criminal Division of the DoJ (the ‘FX DPA’)
as described in Note 34 on the Financial Statements. It is inherently difficult to predict the outcome of many of the legal, regulatory and other adversarial proceedings involving our businesses, particularly those cases in which the matters are brought on behalf of various classes of claimants, seek damages of unspecified or indeterminate amounts or involve novel legal claims.
Additionally, potential consequences of breaching the FX DPA could include the imposition of additional terms and conditions on HSBC, an extension of the agreement or the criminal prosecution of HSBC, which could, in turn, entail further financial penalties and collateral consequences.
Moreover, we may face additional legal proceedings, investigations or regulatory actions in the future, including in other jurisdictions and/or with respect to matters similar to, or broader than, the existing legal proceedings, investigations or regulatory actions. An unfavourable result in one or more of these proceedings could have a material adverse effect on our business, prospects, financial condition, reputation and/or results of operations.
We are subject to unfavourable legislative or regulatory developments and changes in the policy of regulators or governments
Our businesses are subject to ongoing regulation and associated regulatory risks, including the effects of changes in the laws, regulations, policies, voluntary codes of practice and interpretations in the UK, the US, Hong Kong, the EU and the other markets in which we operate. This is particularly the case given the current environment, where we expect government and regulatory intervention in the banking sector to remain high for the foreseeable future. Additionally, many of these changes have an effect beyond the country in which they are enacted, as regulators either deliberately enact regulation with extra-territorial impact or our operations mean that the Group is obliged to give effect to ‘local’ laws and regulations on a wider basis.
In recent years, regulators and governments have focused on reforming both the prudential regulation of the financial services industry and the ways in which the business of financial services is conducted. Measures include enhanced capital, liquidity and funding requirements, the separation or prohibition of certain activities by banks, changes in the operation of capital markets activities, the introduction of tax levies and transaction taxes, changes in compensation practices and more detailed requirements on how business is conducted. The governments
and regulators in the UK, the US, Hong Kong, the EU or elsewhere may intervene further in relation to areas of industry risk already identified, or in new areas, which could adversely affect us.
More stringent regulatory requirements, including further capital, liquidity and funding requirements, and adjustments in the use of models for measuring risk, may adversely affect elements of our business, particularly if capital requirements are increased.
There may be changes in laws, rules or regulations, or in their interpretation or enforcement, or in how new laws, rules or regulations are implemented. Further, there may be uncertainty and lack of international regulatory coordination as enhanced supervisory standards are developed and implemented. These developments are expected to continue to change the way in which we are regulated and supervised, and could affect the manner in which we conduct our business activities, capital requirements, risk management or how the Group is structured; all of which could have a material adverse effect on our business, prospects, financial condition, reputation and results of operations.
We may not manage risks associated with the replacement of benchmark indices effectively
The expected replacement of the key London Interbank Offered Rate (‘LIBOR’) with alternative benchmark rates introduces a number of risks for HSBC, its clients, and the financial services industry more widely. This includes, but is not limited to:
|
•
|
Legal risks, as changes required to documentation for new and existing transactions may be required;
|
|
•
|
Financial risks, arising from any changes in the valuation of financial instruments linked to benchmark rates;
|
|
•
|
Pricing risks, as changes to benchmark indices could impact pricing mechanisms on some instruments;
|
|
•
|
Operational risks, due to the potential requirement to adapt IT systems, trade reporting infrastructure and operational processes; and
|
|
•
|
Conduct risks, relating to communication with potential impact on customers, and engagement during the transition period.
|
The replacement of benchmarks together with the timetable and mechanisms for implementation have not yet been confirmed by central banks. Accordingly, it is not currently possible to determine whether, or to what extent, any such changes would affect HSBC. However, the implementation of alternative benchmark rates may have a material adverse effect on our financial condition, customers and operations.
We may fail to comply with all applicable regulations, particularly any changes thereto
Authorities in many jurisdictions have the power to bring administrative or judicial proceedings against us that could result in, among other things, the suspension or revocation of our licences, cease and desist orders, fines, civil penalties, criminal penalties or other disciplinary actions.
Areas where changes could have an adverse effect on our business, prospects, financial condition or results of operations include, but are not limited to:
|
•
|
general changes in government, central bank, regulatory or competition policy, or changes in regulatory regimes that may influence investor decisions in particular markets in which we operate;
|
|
•
|
the structural separation of certain banking and other activities proposed or enacted in a number of jurisdictions;
|
|
•
|
requirements flowing from arrangements for the resolution strategy of the Group and its individual operating entities, that may have different effects in different countries;
|
|
•
|
the implementation of extra-territorial laws, including initiatives to share tax information;
|
|
•
|
the implementation in January 2018 of Directive 2014/65/EU and Regulation 600/2014/EU (collectively referred to as 'MiFID II'), which impose (among others) enhanced transparency
|
|
100
|
HSBC Holdings plc
|
requirements and related restrictions in relation to dealings with clients, markets and regulators;
|
•
|
the implementation of Directive 2014/59/EU establishing the framework for the recovery and resolution of credit institutions and investment firms (the ‘BRRD’), including minimum requirements for own funds and eligible liabilities or MREL, by the Bank of England (‘BoE’) and its interaction with TLAC requirements for G-SIBs in other jurisdictions discussed on page
86
;
|
|
•
|
the UK’s exit from the EU, which could result in significant changes to those EU laws (including taxation laws) applicable in the UK;
|
|
•
|
the implementation of the European Commission’s proposals for amendments to the BRRD and CRD IV, designed to implement various changes to the EU prudential framework and the implementation of the remaining reforms to the Basel III package including the approaches to credit risk, operational risk, credit valuation adjustment capital charges and the application of capital floors;
|
|
•
|
the proposal that EU banking groups with two or more institutions in the EU, but whose ultimate parent is outside the EU, must establish an EU parent undertaking that would be subject to consolidated prudential supervision in the EU and subject to capital requirements, recovery and resolution measures and separate reporting and disclosure requirements. It is unclear, particularly in light of the UK’s exit from the EU, how these requirements will affect the Group or how the Group will arrange any required restructuring in order to comply with the requirements;
|
|
•
|
the completion of the outstanding work by the Basel Committee in relation to the Basel II framework, including the treatment of sovereign risk and the long-term regulatory treatment for International Financial Reporting Standard 9, Financial Instruments (‘IFRS 9’) provisions;
|
|
•
|
the corporate governance, business conduct, capital, margin, reporting, clearing, execution and other regulatory requirements to which HSBC Bank USA and certain of our affiliates are or may become subject to in their role as a swap dealer, including as imposed by the CFTC and the SEC;
|
|
•
|
the increasing focus by regulators on how institutions conduct business, particularly with regard to the delivery of fair outcomes for customers and orderly/transparent markets, promoting effective competition in the interests of consumers and ensuring the orderly and transparent operation of global financial markets;
|
|
•
|
restrictions on the structure of remuneration and increasing requirements to detail management accountability within the Group (e.g. the requirements of the Senior Managers and Certification Regime in the UK and similar regimes in Hong Kong and elsewhere that are under consideration/implementation);
|
|
•
|
the implementation of any conduct measures as a result of regulators’ increased focus on institutional culture, employee behaviour and whistleblowing, including measures resulting from ongoing thematic work into the workings of the retail, SME and wholesale banking sectors and the provision of financial advice to consumers;
|
|
•
|
the focus globally on data (including on data processing and subject rights / transfer of information) and financial technology risks and cybersecurity and the introduction of new and/or enhanced standards in this area;
|
|
•
|
changes in national or supra-national requirements regarding the ability to offshore or outsource the provision of services and resources or transfer material risk to financial services companies located in other countries, that impact our ability to implement globally consistent and efficient operating models;
|
|
•
|
external bodies applying or interpreting standards or laws differently to us;
|
|
•
|
further requirements relating to financial reporting, corporate governance and employee compensation; and
|
|
•
|
expropriation, nationalisation, confiscation of assets and changes in legislation or regulations relating to foreign ownership.
|
We and our UK subsidiaries may become subject to stabilisation provisions under the Banking Act 2009, as amended, in certain significant stress situations
The Banking Act 2009, as amended, implements the BRRD in the UK and creates a special resolution regime (the ‘SRR’). Under the SRR, HM Treasury, the BoE and the PRA and FCA (together, the ‘Authorities’) are granted substantial powers to resolve and stabilise UK-incorporated institutions with permission to accept deposits pursuant to Part 4A of the FSMA that are failing or are likely to fail to satisfy the threshold conditions (within the meaning of section 55B of the FSMA) where it is in the public interest to do so. The SRR presently consists of five stabilisation options: (i) transfer of all of the business of a relevant entity or the shares of the relevant entity to a private sector purchaser; (ii) transfer of all or part of the business of the relevant entity to a ‘bridge bank’ wholly owned by the BoE; (iii) transfer of part of the assets, rights or liabilities of the relevant entity to one or more asset management vehicles for management of the transferor’s assets, rights or liabilities; (iv) the write-down, conversation, transfer, modification, or suspension of the relevant entity’s equity, capital instruments and liabilities; and (v) temporary public ownership of the relevant entity. These tools may also be applied to a parent company or affiliate of a relevant entity where certain conditions are met. In addition, the SRR provides for modified insolvency and administration procedures for relevant entities. It also confers ancillary powers on the Authorities, including the power to modify or override certain contractual arrangements in certain circumstances. The Authorities are also empowered by order to amend the law for the purpose of enabling the powers under the SRR to be used effectively. Such orders may promulgate provisions with retrospective applicability.
In general, the Banking Act requires the Authorities to have regard to specified objectives in exercising the powers provided for by the Banking Act. One of the objectives (which is required to be balanced as appropriate with the other specified objectives) refers to the protection and enhancement of the stability of the financial system of the UK. The Banking Act includes provisions related to compensation in respect of transfer instruments and orders made under it.
There is considerable uncertainty about how the Authorities may exercise the powers granted to them under the Banking Act. However, if we are at or approaching the point of non-viability, such as to require regulatory intervention, any exercise of any resolution regime powers by the Authorities may result in holders of our ordinary shares or other instruments that may fall within the scope of the ‘bail in’ powers described above being adversely affected, including by the cancellation of shares, the write-down or conversion into shares of other instruments, the loss of rights associated with shares or other instruments (including rights to dividends or interest payments), the dilution of their percentage ownership of our share capital, and any corresponding material adverse effect on the market price of our ordinary shares and other instruments.
Structural separation requirements of banking and trading activities enacted in the UK could have a material adverse effect on us
In December 2013, the UK Financial Services (Banking Reform) Act 2013 received Royal Assent. It implements the recommendations of the Independent Commission on Banking which, among other things, establish a framework for ‘ring-fencing’ UK retail banking in separately incorporated banking entities (‘ring-fenced banks’) from trading activities. Secondary legislation and regulatory rules have also been finalised.
The separation of retail and SME banking in the UK will be a material change to the structure of HSBC Bank plc, and the cost of implementing structural separation
has been and may continue to
|
HSBC Holdings plc
|
101
|
Report of the Directors
| Risk
be material, which could have a material adverse effect on our business, prospects, financial condition and results of operations.
We are subject to tax-related risks in the countries in which we operate
We are subject to the substance and interpretation of tax laws in all countries in which we operate and are subject to routine review and audit by tax authorities in relation thereto. Our interpretation or application of these tax laws may differ from those of the relevant tax authorities and we provide for potential tax liabilities that may arise on the basis of the amounts expected to be paid to the tax authorities. The amounts ultimately paid may differ materially from the amounts provided depending on the ultimate resolution of such matters. For example, the new US tax legislation (the ‘Tax Legislation’) contains certain complex provisions such as the Base Erosion and Anti-Abuse Tax, which may have a material impact in future periods on income tax expense for certain of our subsidiaries, depending upon, among other things, the future issuance of regulatory guidelines and other interpretive guidance. Additionally, it is not yet clear how the Tax Legislation will impact our clients and there is a risk that the Tax Legislation could have an adverse impact on our commercial relationship with those clients. Changes to tax law, tax rates and penalties for failing to comply could have a material adverse effect on our business, prospects, financial condition and results of operations.
Risks related to our business, business operations, governance and internal control systems
The delivery of our strategic actions is subject to execution risk
Robust management of critical time-sensitive and resource-intensive projects is required to effectively deliver the Group's strategic priorities. We continue to implement a number of externally driven regulatory programmes and the magnitude and complexity of the projects required to meet these demands present heightened execution risk. The cumulative impact of the collective change initiatives underway within the Group is significant and has direct implications on resourcing and our people. In addition, the completion of these strategic actions is subject to economic and market conditions, which may be negatively affected as described under ‘Current economic and market conditions may adversely affect our results’.
The failure to successfully deliver key strategic actions or other regulatory programmes could have a significant impact on our financial condition, profitability, prospects and share price, as well as wider reputational and regulatory implications.
There also remains heightened risk around the execution of a number of disposals across the Group in line with our strategy. The potential risks of disposals include regulatory breaches, industrial action, loss of key personnel and interruption to systems and processes during business transformation. They can have both financial and reputational implications, and could also adversely affect the successful delivery of our strategic priorities.
We may not achieve any of the expected benefits of our strategic initiatives
The Group’s strategy (see pages
10
to
11
), is built around two trends – the continued growth of international trade and capital flows, and wealth creation, particularly in faster-growing markets. We have analysed those trends and developed criteria to help us better deploy capital in response. The development and implementation of our strategy requires difficult, subjective and complex judgements, including forecasts of economic conditions in various parts of the world. We may fail to correctly identify the trends we seek to exploit and the relevant factors in making decisions as to capital deployment and cost reduction.
Key to achieving our growth strategy is increasing the number of HSBC products held by our customers through cross-selling and driving synergies across our global businesses to grow revenue and earnings. Key opportunities to drive business synergies arise
between CMB and GB&M, and separately in RBWM, which are both areas where many of our competitors also focus. In both instances, this may limit our ability to cross-sell additional products to our customers or may influence us to sell our products at lower prices, reducing our net interest income and revenue from our fee-based products. A failure to deliver the cross-selling and/or business synergies required to achieve our growth strategy could have a material adverse effect on our business, prospects,financial condition and results of operations.
Our ability to execute our strategy may be limited by our operational capacity and the increasing complexity of the regulatory environment in which we operate. We continue to pursue our cost management initiatives, though they may not be as effective as expected, and we may be unable to meet our cost saving targets. In addition, factors beyond our control, including but not limited to economic and market conditions, could limit our ability to achieve any of the expected benefits of these initiatives.
Failure to achieve any of the expected benefits of our strategic initiatives could have a material adverse effect on our business, prospects, financial condition and results of operations.
We operate in markets that are highly competitive
We compete with other financial institutions in a highly competitive industry that continues to undergo significant change as a result of financial regulatory reform, including Open Banking in the UK, as well as increased public scrutiny stemming from the financial crisis and continued challenging economic conditions.
We target internationally mobile clients who need sophisticated global solutions and generally compete on the basis of the quality of our customer service, the wide variety of products and services that we can offer our customers, and the ability of those products and services to satisfy our customers’ needs, the extensive distribution channels available for our customers, our innovation and our reputation. Continued and increased competition in any one or all of these areas may negatively affect our market share and/or cause us to increase our capital investment in our businesses in order to remain competitive. Additionally, our products and services may not be accepted by our targeted clients.
In many markets, there is increased competitive pressure to provide products and services at current or lower prices. Consequently, our ability to reposition or reprice our products and services from time to time may be limited, and could be influenced significantly by the actions of our competitors who may or may not charge similar fees for their products and services. Any changes in the types of products and services that we offer our customers, and/or the pricing for those products and services, could result in a loss of customers and market share.
Further, new entrants to the market or new technologies could require us to spend more to modify or adapt our products to attract and retain customers. We may not respond effectively to these competitive threats from existing and new competitors, and may be forced to increase our investment in our business to modify or adapt our existing products and services or develop new products and services to respond to our customers’ needs.
Any of these factors may have a material adverse effect on our business, prospects, financial condition and results of operations.
Our risk management measures may not be successful
The management of risk is an integral part of all our activities. Risk constitutes our exposure to uncertainty and the consequent variability of return. Specifically, risk equates to the adverse effect on profitability or financial condition arising from different sources of uncertainty, including retail and wholesale credit risk, market risk, non-traded market risk, operational risk, insurance risk, concentration risk, liquidity and funding risk, litigation risk, reputational risk, strategic risk, pension risk and regulatory risk. While we employ a broad and diversified set of risk monitoring and mitigation techniques, such methods and the judgements that accompany their application cannot anticipate every unfavourable event or the specifics and timing of every outcome. Failure to manage risks appropriately could have a material adverse effect on
|
102
|
HSBC Holdings plc
|
our business prospects, reputation, financial condition and results of operations.
Operational risks are inherent in our business
We are exposed to many types of operational risk that are inherent in banking operations, including fraudulent and other criminal activities (both internal and external), breakdowns in processes or procedures and systems failure or non-availability. These risks are also present when we rely on outside suppliers or vendors to provide services to us and our customers. These operational risks could have a material adverse effect on our business, prospects, financial condition and results of operations.
Our operations are subject to the threat of fraudulent activity
Fraudsters may target any of our products, services and delivery channels, including lending, internet banking, payments, bank accounts and cards. This may result in financial loss to the Group, an adverse customer experience, reputational damage and potential regulatory action depending on the circumstances of the event, any of which could have a material adverse effect on our business, prospects, financial condition and results of operations.
Our operations are subject to disruption from the external environment
HSBC operates in many geographical locations, which are subject to events that are outside our control. These events may be acts of God, such as natural disasters and epidemics, geopolitical risks, including acts of terrorism and social unrest, and infrastructure issues, such as transport or power failure. These risk events may give rise to disruption to our services, result in physical damage and/or loss of life, which could have a material adverse effect on our business, prospects, financial condition and results of operations.
Our operations utilise third-party suppliers and service providers
HSBC relies on third parties to supply goods and services. Global regulators have increased their scrutiny of the use of third-party service providers by financial institutions, including with respect to how outsourcing decisions are made and how key relationships are managed. Risks arising from the use of third parties may be less transparent and therefore more challenging to manage. The inadequate management of third-party risk could impact our ability to meet strategic, regulatory and client expectations. This may lead to a range of effects, including regulatory censure, civil penalties or damage both to shareholder value and to our reputation, which could have a material adverse effect on our business, prospects, financial condition and results of operations.
Our operations are highly dependent on our information technology systems
The reliability and security of our information and technology infrastructure, and our customer databases are crucial to maintaining the service availability of banking applications and processes and to protecting the HSBC brand. The proper functioning of our payment systems, financial control, risk management, credit analysis and reporting, accounting, customer service and other information technology systems, as well as the communication networks between our branches and main data processing centres, are critical to our operations.
Critical system failure, any prolonged loss of service availability or any material breach of data security, particularly involving confidential customer data, could cause serious damage to our ability to service our clients, could breach regulations under which we operate and cause long-term damage to our business and brand that could have a material adverse effect on our business, prospects, financial condition and results of operations.
We remain susceptible to a wide range of cyber-risks that impact and/or are facilitated by technology.
The threat from cyber-attacks remains a concern for our organisation, and failure to protect our operations from internet
crime or cyber attacks may result in financial loss, business disruption and/or loss of customer services and data or other sensitive information that could undermine our reputation and our ability to attract and keep customers.
Ransomware and Distributed Denial of Service ('DDOS') attacks are an increasingly dominant threat across the industry. In 2017, the bank was subjected to a small number of DDOS attacks on our external facing websites across the Group and no ransomware attacks.
Although cyber-attacks in 2017 had a negligible effect on our customers, services or firm, due to the increasing sophistication of cyber-attacks there is the potential for future attacks to have a material adverse effect on our business, prospects, financial condition, reputation and results of operations.
Our data management policies and processes may not be sufficiently robust
Critical business processes across the Group rely on large volumes of data from a number of different systems and sources. If data governance including retention and deletion, data quality and data architecture policies and procedures are not sufficiently robust, manual intervention, adjustments and reconciliations may be required to reduce the risk of error in reporting to senior management or regulators. Inadequate policies and processes may also affect our ability to use data within the Group to service customers more effectively and/or improve our product offering. This could have a material adverse effect on our business, prospects, financial condition and results of operations. Moreover, financial institutions that fail to comply with the principles for effective risk data aggregation and risk reporting as set out by the Basel Committee by the required deadline may face supervisory measures. In addition, failure to comply with new Global Data Privacy Requirements may result in regulatory sanctions. Any of these failures could have a material adverse effect on our business, prospects, financial condition and results of operations.
Our operations have inherent reputational risk
Reputational risk is the risk of failing to meet stakeholder expectations as a result of any event, behaviour, action or inaction, either by HSBC, our employees or those with whom we are associated. This might cause stakeholders to form a negative view of the Group and result in financial or non-financial effects or loss of confidence in the Group.
Reputational risk relates to stakeholders’ perceptions, whether fact-based or otherwise. Stakeholders’ expectations change constantly and so reputational risk is dynamic and varies between geographical regions, groups and individuals. We have an unwavering commitment to operating at the high standards we set for ourselves in every jurisdiction. Any material lapse in standards of integrity, compliance, customer service or operating efficiency may represent a potential reputational risk.
Modern technologies, in particular online social media channels and other broadcast tools that facilitate communication with large audiences in short time frames and with minimal costs may significantly enhance and accelerate the effect of damaging information and allegations. It could also arise from negative public opinion about the actual, or perceived, manner in which we conduct our business activities, or financial performance, as well as actual or perceived practices in banking and the financial services industry generally. Negative public opinion may adversely affect our ability to retain and attract customers, in particular, corporate and retail depositors, and retain and motivate staff, and could have a material adverse effect on our business, prospects, financial condition, reputation and results of operations.
We may suffer losses due to employee misconduct
Our businesses are exposed to risk from potential non-compliance with Group policies, including the HSBC Values, and related behaviours and employee misconduct such as fraud or negligence, all of which could result in regulatory sanctions or reputational or financial harm. In recent years, a number of multinational financial institutions have suffered material losses due to the actions of ‘rogue traders’ or other employees. It is not always possible to
|
HSBC Holdings plc
|
103
|
Report of the Directors
| Risk
deter employee misconduct, and the precautions we take to prevent and detect this activity may not always be effective. Employee misconduct could have a material adverse effect on our business, prospects, financial condition and results of operations.
We rely on recruiting, retaining and developing appropriate senior management and skilled personnel
The demands being placed on the human capital of the Group are unprecedented. The cumulative workload arising from a regulatory reform programme that is often extra-territorial and regularly evolving consumes significant human resources, placing increasingly complex and conflicting demands on a workforce that operates in an employment market where expertise in key markets is often in short supply and mobile.
Our continued success depends in part on the retention of key members of our management team and wider employee base. The ability to continue to attract, train, motivate and retain highly qualified professionals is a key element of our strategy. The successful implementation of our growth strategy depends on the availability of skilled management in each of our global businesses and global functions, which may depend on factors beyond our control, including economic, market and regulatory conditions.
If global businesses or global functions fail to staff their operations appropriately or lose one or more of their key senior executives and fail to successfully replace them in a satisfactory and timely manner, or fail to implement successfully the organisational changes required to support the Group’s strategy, our business prospects, financial condition and results of operations, including control and operational risks, could be materially adversely affected.
Our financial statements are based in part on judgements, estimates and assumptions that are subject to uncertainty
The preparation of financial statements requires management to make judgements, estimates and assumptions that affect the reported amounts of assets, liabilities, income and expenses. Due to the inherent uncertainty in making estimates, particularly those involving the use of complex models, actual results reported in future periods may be based upon amounts which differ from those estimates. Estimates, judgements, assumptions and models are continually evaluated, and are based on historical experience and other factors, including expectations of future events that are believed to be reasonable under the circumstances. Revisions to accounting estimates are recognised in the period in which the estimate is revised and in any future periods affected. The accounting policies deemed critical to our results and financial position, based upon materiality and significant judgements and estimates, include impairment of loans and advances, goodwill impairment, valuation of financial instruments, deferred tax assets, provisions and interests in associates, which are discussed in detail in ‘Critical accounting estimates and judgements’ on page
32
.
The valuation of financial instruments measured at fair value can be subjective, in particular where models are used that include unobservable inputs. Given the uncertainty and subjectivity associated with valuing such instruments, future outcomes may differ materially from those assumed using information available at the reporting date. The effect of these differences on the future results of operations and the future financial position of the Group may be material. For further details, see ‘Critical accounting estimates and judgements’ on page
32
.
If the judgement, estimates and assumptions we use in preparing our consolidated financial statements are subsequently found to be materially different from those assumed using information available at the reporting date, this could affect our business, prospects, financial condition and results of operations.
Changes in accounting standards may have a material impact on how we report our financial results and financial condition
We prepare our consolidated financial statements of HSBC in accordance with International Financial Reporting Standards
(‘IFRSs’) as issued by the International Accounting Standards Board (‘IASB’), including interpretations (‘IFRICS’) issued by the IFRS Interpretations Committee, and as endorsed by the EU. From time to time, the IASB or the IFRS Interpretations Committee may issue new accounting standards or interpretations which could materially impact how we report and disclose our financial results and financial condition as well as affect the calculation of our capital ratios, including the CET1 ratio. We could also be required to apply a new or revised standards retrospectively, resulting in our restating prior period financial statements in material amounts.
We could incur losses or be required to hold additional capital as a result of model limitations or failure
HSBC uses models for a range of purposes in managing our business, including regulatory capital calculations, stress testing, credit approvals, calculation of loan impairment charges on an IFRS 9 basis, financial crime and fraud risk management and financial reporting. HSBC could face adverse consequences as a result of decisions that may lead to actions by management based on models that are poorly developed, implemented or used, or as a result of the modelled outcome being misunderstood or the use of such information for purposes for which it was not designed. Regulatory scrutiny and supervisory concerns over banks’ use of models is considerable, particularly the internal models and assumptions used by banks in the calculation of regulatory capital. Risks arising from the use of models could have a material adverse effect on our business, prospects, financial condition, results of operations, minimum capital requirements and reputation.
Third parties may use us as a conduit for illegal activities without our knowledge
We are required to comply with applicable AML laws and regulations, and have adopted various policies and procedures, including internal control and ‘know your customer’ procedures, aimed at preventing use of HSBC products and services for the purpose of committing or concealing financial crime. A major focus of US and UK government policy relating to financial institutions in recent years has been combating money laundering and enforcing compliance with US and EU economic sanctions. This focus is reflected in part by our agreements with US and UK authorities relating to various investigations regarding past inadequate compliance with AML and sanctions laws. These consent orders do not preclude additional enforcement actions by bank regulatory, governmental or law enforcement agencies or private litigation.
A number of the remedial actions have been taken as a result of the matters to which the US DPA related, which are intended to ensure that the Group’s businesses are better protected in respect of these risks. However, there can be no assurance that these will be completely effective.
Moreover, in relevant situations, and where permitted by regulation, we may rely upon certain counterparties to maintain and properly apply their own appropriate AML procedures. While permitted by regulation, such reliance may not be effective in preventing third parties from using us (and our relevant counterparties) as a conduit for money laundering, including illegal cash operations, without our knowledge (and that of our relevant counterparties). Becoming a party to money laundering, association with, or even accusations of being associated with, money laundering will damage our reputation and could make us subject to fines, sanctions and/or legal enforcement. Any one of these outcomes could have a material adverse effect on our business, prospects, financial condition and results of operations.
We have significant exposure to counterparty risk
We are exposed to counterparties that are involved in virtually all major industries, and we routinely execute transactions with counterparties in financial services, including brokers and dealers, central clearing counterparties, commercial banks, investment banks, mutual and hedge funds, and other institutional clients. Many of these transactions expose us to credit risk in the event of default by our counterparty or client. Our ability to engage in routine transactions to fund our operations and manage our
|
104
|
HSBC Holdings plc
|
risks could be materially adversely affected by the actions and commercial soundness of other financial services institutions. Financial institutions are necessarily interdependent because of trading, clearing, counterparty or other relationships. As a consequence, a default by, or decline in market confidence in, individual institutions, or anxiety about the financial services industry generally, can lead to further individual and/or systemic difficulties, defaults and losses.
Mandatory central clearing of OTC derivatives, including under Dodd-Frank and the EU’s European Market Infrastructure Regulation, poses risks to HSBC. As a clearing member, we will be required to underwrite losses incurred at a Central Counterparty (‘CCP’) by the default of other clearing members and their clients. Hence,
increased moves towards central clearing brings with it a further element of interconnectedness between clearing members and clients that we believe may increase rather than reduce our exposure to systemic risk. At the same time, our ability to manage such risk ourselves will be reduced because control has been largely outsourced to CCPs, and it is unclear at present how, at a time of stress, regulators and resolution authorities will intervene.
Where bilateral counterparty risk has been mitigated by taking collateral, our credit risk may remain high if the collateral we hold cannot be realised or has to be liquidated at prices that are insufficient to recover the full amount of our loan or derivative exposure. There is a risk that collateral cannot be realised, including situations where this arises by change of law that may influence our ability to foreclose on collateral or otherwise enforce contractual rights.
The Group also has credit exposure arising from mitigants, such as credit default swaps (‘CDSs’), and other credit derivatives, each of which is carried at fair value. The risk of default by counterparties to CDSs and other credit derivatives used as mitigants affects the fair value of these instruments depending on the valuation and the perceived credit risk of the underlying instrument against which protection has been purchased. Any such adjustments or fair value changes may have a material adverse effect on our financial condition and results of operations.
Market fluctuations may reduce our income or the value of our portfolios
Our businesses are inherently subject to risks in financial markets and in the wider economy, including changes in, and increased volatility of, interest rates, inflation rates, credit spreads, foreign exchange rates, commodity, equity, bond and property prices, and the risk that our customers act in a manner inconsistent with our business, pricing and hedging assumptions.
Market movements will continue to significantly affect us in a number of key areas. For example, banking and trading activities are subject to interest rate risk, foreign exchange risk, inflation risk and credit spread risk. Changes in interest rate levels, interbank spreads over official rates, yield curves and spreads affect the interest rate spread realised between lending and borrowing costs. A declining or low interest rate environment could increase prepayment activity that reduces the weighted average lives of our interest-earning assets and could have a material adverse effect on us. The potential for future volatility and margin changes remains. Competitive pressures on fixed rates or product terms in existing loans and deposits sometimes restrict our ability to change interest rates applying to customers in response to changes in official and wholesale market rates. Our pension scheme assets include equity and debt securities, the cash flows of which change as equity prices and interest rates vary.
Our insurance businesses are exposed to the risk that market fluctuations will cause mismatches to occur between product liabilities and the investment assets that back them. Market risks can affect our insurance products in a number of ways depending upon the product and associated contract. For example, mismatches between assets and liability yields and maturities give rise to interest rate risk. Some of these risks are borne directly by the customer and some are borne by the insurance businesses, with their excess capital invested in the markets. Some insurance
contracts involve guarantees and options that increase in value in adverse investment markets. There is a risk that the insurance businesses will bear some of the cost of such guarantees and options. The performance of the investment markets will thus have a direct effect upon the value embedded in the insurance and investment contracts and our operating results, financial condition and prospects.
It is difficult to predict with any degree of accuracy changes in market conditions, and such changes may have a material adverse effect on our business, prospects, financial condition and results of operations.
Liquidity, or ready access to funds, is essential to our businesses
Our ability to borrow on a secured or unsecured basis, and the cost of doing so, can be affected by increases in interest rates or credit spreads, the availability of credit, regulatory requirements relating to liquidity or the market perceptions of risk relating to HSBC or the banking sector, including our perceived or actual creditworthiness.
Current accounts and savings deposits payable on demand or at short notice form a significant part of our funding, and we place considerable importance on maintaining their stability. For deposits, stability depends upon preserving investor confidence in our capital strength and liquidity, and on comparable and transparent pricing. Although deposits have been a stable source of funding historically, this may not continue.
We also access wholesale markets in order to provide funding for entities that do not accept deposits, to align asset and liability maturities and currencies, and to maintain a presence in local markets.
In 2017, we issued the equivalent of $38.5bn of debt securities in the public capital markets in a range of currencies and maturities from a number of Group entities, including $11.7bn of senior securities issued by HSBC Holdings.
An inability to obtain financing in the unsecured long-term or short-term debt capital markets, or to access the secured lending markets, could have a substantial adverse effect on our liquidity. Unfavourable macroeconomic developments, market disruptions or regulatory developments may increase our funding costs or challenge our ability to raise funds to support or expand our businesses.
If we are unable to raise funds through deposits and/or in the capital markets, our liquidity position could be adversely affected, and we might be unable to meet deposit withdrawals on demand or at their contractual maturity, to repay borrowings as they mature, to meet our obligations under committed financing facilities and insurance contracts or to fund new loans, investments and businesses. We may need to liquidate unencumbered assets to meet our liabilities. In a time of reduced liquidity, we may be unable to sell some of our assets, or we may need to sell assets at reduced prices, which in either case could materially adversely affect our business, prospects, financial condition and results of operations.
Any reduction in the credit rating assigned to HSBC Holdings, any subsidiaries of HSBC Holdings or any of their respective debt securities could increase the cost or decrease the availability of our funding and adversely affect our liquidity position and net interest margin
Credit ratings affect the cost and other terms upon which we are able to obtain market funding. Rating agencies regularly evaluate HSBC Holdings and certain of its subsidiaries, as well as their respective debt securities. Their ratings are based on a number of factors, including their assessment of the relative financial strength of HSBC or of the relevant entity, as well as conditions affecting the financial services industry generally. There can be no assurance that the rating agencies will maintain HSBC’s or the relevant entity’s current ratings or outlook, particularly given the rating agencies’ current review of their bank rating methodologies and the potential impact on HSBC’s or its subsidiaries’ ratings.
|
HSBC Holdings plc
|
105
|
Report of the Directors
| Risk
At the date hereof, HSBC Holdings’ long-term debt was rated ‘AA-’ by Fitch, ‘A’ by Standard and Poor’s (‘S&P’) and ‘A2’ by Moody’s. The ratings outlook by Fitch was stable and the ratings outlooks by both S&P and Moody’s were negative. Any reductions in these ratings and outlook could increase the cost of our funding, limit access to capital markets and require additional collateral to be placed and, consequently, materially adversely affect our interest margins and our liquidity position.
Under the terms of our current collateral obligations under derivative contracts, we could be required to post additional collateral as a result of a downgrade in HSBC’s credit rating, as described in Pillar 3 disclosures on page 66
Risks concerning borrower credit quality are inherent in our businesses
Risks arising from changes in credit quality and the recoverability of loans and amounts due from borrowers and counterparties (e.g. reinsurers and counterparties in derivative transactions) are inherent in a wide range of our businesses. Adverse changes in the credit quality of our borrowers and counterparties arising from a general deterioration in economic conditions or systemic risks in the financial systems could reduce the recoverability and value of our assets, and require an increase in our loan impairment charges.
We estimate and recognise impairment allowances for credit losses inherent in our credit exposure. This process, which is critical to our results and financial condition, requires difficult, subjective and complex judgements, including forecasts of how the economic conditions might impair the ability of our borrowers to repay their loans and the ability of other counterparties to meet their obligations. As is the case with any such assessments, we may fail to estimate accurately the effect of factors that we identify or fail to identify relevant factors. Further, the information we use to assess the creditworthiness of our counterparties may be inaccurate or incorrect. Any failure by us to accurately estimate the ability of our counterparties to meet their obligations may have a material adverse effect on our business, prospects, financial condition and results of operations.
Our insurance businesses are subject to risks relating to insurance claim rates and changes in insurance customer behaviour
We provide various insurance products for customers with whom we have a banking relationship, including several types of life insurance products. The cost of claims and benefits can be influenced by many factors, including mortality and morbidity rates, lapse and surrender rates and, if the policy has a savings element, the performance of assets to support the liabilities. Adverse developments in any of these factors may materially adversely affect our business, prospects, financial condition and results of operations.
HSBC Holdings is a holding company and, as a result, is dependent on loan payments and dividends from its subsidiaries to meet its obligations, including obligations with respect to its debt securities, and to provide profits for payment of future dividends to shareholders
HSBC Holdings is a non-operating holding company and, as such, its principal source of income is from operating subsidiaries that hold the principal assets of HSBC. As a separate legal entity, HSBC Holdings relies on remittance of its subsidiaries’ loan interest payments and dividends in order to be able to pay obligations to debt holders as they fall due, and to pay dividends to its shareholders. The ability of our subsidiaries and affiliates to pay us remittances and dividends could be restricted by changes in regulation, exchange controls and other requirements.
We may be required to make substantial contributions to our pension plans
We operate a number of pension plans throughout the world, including defined benefit plans. Pension scheme obligations fluctuate with changes in long-term interest rates, inflation, salary levels and the longevity of scheme members. The level of
contributions we make to our pension plans has a direct effect on our cash flow. To the extent plan assets are insufficient to cover existing liabilities, higher levels of contributions will be required. As a result, deficits in those pension plans may have a material adverse effect on our business, prospects, financial condition and results of operations.
|
Areas of special interest
|
Process of UK withdrawal from the European Union
The UK is due to formally leave the EU in March 2019. Before this can happen, the UK and the EU have to finalise the Article 50 Withdrawal Agreement, which will then need to be approved by their respective Parliaments. Concluding negotiations on a comprehensive trade deal within this time frame could be challenging. A period of transition is therefore possible but the scope and length of any such arrangement would need to be agreed between the UK and the EU. Uncertainty therefore continues and with it the risk of significant market volatility.
Our objective in all scenarios is to continue to meet customers’ needs and minimise disruption. This is likely to require adjustments to our cross-border banking model, with impacted business transferring from the UK to our existing subsidiary in France or other European subsidiaries, as appropriate.
Given the tight time frame and the complexity of the negotiations, we have put in place a robust contingency plan. It is based on a scenario whereby the UK exits the EU in March 2019, without access to the single market or customs union, and without a transitional arrangement. When negotiation positions and timelines become clearer, we will update our contingency plan.
|
Risk management
|
Our risk management framework
We use an enterprise risk management framework across the organisation and across all risk types. It is underpinned by our risk culture and is reinforced by the HSBC Values and our Global Standards programme.
The framework fosters continuous monitoring of the risk environment, and an integrated evaluation of risks and their interactions. It also ensures a consistent approach to monitoring, managing and mitigating the risks we accept and incur in our activities.
The following diagram and descriptions summarise key aspects of the framework, including governance and structure, our risk management tools and our risk culture, which together help align employee behaviour with our risk appetite.
|
106
|
HSBC Holdings plc
|
|
Key components of our risk management framework
|
||||||||||
|
HSBC Values and risk culture
|
||||||||||
|
Risk governance
|
Non-executive risk governance
|
The Board approves the Group’s risk appetite, plans and performance targets. It sets the ‘tone from the top’ and is advised by the Group Risk Committee, the Financial System Vulnerabilities Committee, and the Conduct & Values Committee (see page 172).
|
||||||||
|
Executive risk governance
|
Responsible for the enterprise-wide management of all risks, including key policies and frameworks for the management of risk within the Group (see pages 107 and 109).
|
|||||||||
|
Roles and responsibilities
|
Three lines of defence model
|
Our three lines of defence model defines roles and responsibilities for risk management. An independent Global Risk function helps ensure the necessary balance in risk/return decisions (see page 108).
|
||||||||
|
Processes and tools
|
Risk appetite
|
Processes to identify/assess, monitor, manage and report risks to ensure we remain within our risk appetite (see pages 107 to 109).
|
||||||||
|
Enterprise-wide risk management tools
|
||||||||||
|
Active risk management: identification/assessment, monitoring, management and reporting
|
||||||||||
|
Internal controls
|
Policies and procedures
|
Policies and procedures define the minimum requirements for the controls required to manage our risks.
|
||||||||
|
Control activities
|
The operational risk management framework defines minimum standards and processes for managing operational risks and internal controls (see page 117).
|
|||||||||
|
Systems and infrastructure
|
Systems and/or processes that support the identification, capture and exchange of information to support risk management activities.
|
|||||||||
|
Systems and tools
|
||||||||||
Our risk culture
Risk culture refers to HSBC’s norms, attitudes and behaviours related to risk awareness, risk taking and risk management.
HSBC has long recognised the importance of a strong risk culture, the fostering of which is a key responsibility of senior executives. Our risk culture is reinforced by the HSBC Values and our Global Standards programme. It is instrumental in aligning the behaviours of individuals with our attitude to assuming and managing risk, which helps to ensure that our risk profile remains in line with our risk appetite.
We use clear and consistent employee communication on risk to convey strategic messages and set the tone from senior management and the Board. We also deploy mandatory training on risk and compliance topics to embed skills and understanding in order to strengthen our risk culture and reinforce the attitude to risk in the behaviour expected of employees, as described in our risk policies.
We operate a global whistleblowing platform, HSBC Confidential, allowing staff to report matters of concern confidentially. We also maintain an external email address for concerns about accounting and internal financial controls or auditing matters (accountingdisclosures@hsbc.com). The Group has a strict policy prohibiting retaliation against those who raise their concerns. All allegations of retaliation reported are escalated to senior management. For further details on whistleblowing, see page
23
and also our ESG reporting available on www.hsbc.com/our-approach/measuring-our-impact and for details on the governance of our whistleblowing policy, see pages
172
and
177
.
Our risk culture is also reinforced by our approach to remuneration. Individual awards, including those for senior executives, are based on compliance with the HSBC Values and the achievement of financial and non-financial objectives, which are aligned to our risk appetite and global strategy
.
For further information on remuneration, see the Directors’ Remuneration Report on page
186
.
Governance and structure
The Board has ultimate responsibility for the effective management of risk and approves HSBC’s risk appetite. It is advised on risk-related matters by the Group Risk Committee (‘GRC’), the Financial System Vulnerabilities Committee (‘FSVC’), and the Conduct & Values Committee (‘CVC’) (see pages
175
,
176
and
177
respectively).
Executive accountability for the ongoing monitoring, assessment and management of the risk environment and the effectiveness of the risk management framework resides with the Group Chief Risk Officer. He is supported by the Risk Management Meeting of the Group Management Board (‘RMM’).
The management of financial crime risk resides with the Group Head of Financial Crime Risk. He is supported by the Financial Crime Risk Management Meeting, as described under ‘Financial crime risk management’ on page
118
.
Day-to-day responsibility for risk management is delegated to senior managers with individual accountability for decision making. All employees have a role to play in risk management. These roles are defined using the three lines of defence model, which takes into account the Group’s business and functional structures as described below.
We use a defined executive risk governance structure to help ensure appropriate oversight and accountability of risk, which facilitates reporting and escalation to the RMM. This structure is summarised in the following table.
|
HSBC Holdings plc
|
107
|
Report of the Directors
| Risk
|
Governance structure for the management of risk
|
||
|
Authority
|
Membership
|
Responsibilities include:
|
|
Risk Management Meeting of the Group Management Board
|
Group Chief Risk Officer
Chief Legal Officer
Group Chief Executive
Group Finance Director
All other Group Managing Directors
|
•
Supporting the Group Chief Risk Officer in exercising Board-delegated risk management authority
•
Overseeing the implementation of risk appetite and the enterprise risk management framework
•
Forward-looking assessment of the risk environment, analysing possible risk impacts and taking appropriate action
•
Monitoring all categories of risk and determining appropriate mitigating action
•
Promoting a supportive Group culture in relation to risk management and conduct
|
|
Global Risk Management Board
|
Group Chief Risk Officer
Chief Risk Officers of HSBC’s global businesses and regions
Heads of Global Risk sub-functions
|
•
Supporting the Group Chief Risk Officer in providing strategic direction for the Global Risk function, setting priorities and providing oversight
•
Overseeing a consistent approach to accountability for, and mitigation of, risk across the Global Risk function
|
|
Global business/regional risk management meetings
|
Global Business/Regional Chief Risk Officer
Global Business/Regional Chief Executive
Global Business/Regional Chief Financial Officer
Global Business/Regional Heads of global functions
|
•
Supporting the Chief Risk Officer in exercising Board-delegated risk management authority
•
Forward-looking assessment of the risk environment, analysing the possible risk impact and taking appropriate action
•
Implementation of risk appetite and the enterprise risk management framework
•
Monitoring all categories of risk and determining appropriate mitigating actions
•
Embedding a supportive culture in relation to risk management and controls
|
The Board committees with responsibility for oversight of risk-related matters are set out on page
172
.
Our responsibilities
All employees are responsible for identifying and managing risk within the scope of their role as part of the three lines of defence model.
Three lines of defence
To create a robust control environment to manage risks, we use an activity-based three lines of defence model. This model delineates management accountabilities and responsibilities for risk management and the control environment.
The model underpins our approach to risk management by clarifying responsibility, encouraging collaboration, and enabling efficient coordination of risk and control activities. The three lines of defence are summarised below:
|
•
|
The first line of defence owns the risks and is responsible for identifying, recording, reporting and managing them, and ensuring that the right controls and assessments are in place to mitigate them.
|
|
•
|
The second line of defence sets the policy and guidelines for managing specific risk areas, provides advice and guidance in relation to the risk, and challenges the first line of defence on effective risk management.
|
|
•
|
The third line of defence is our Internal Audit function, which provides independent and objective assurance of the adequacy of the design and operational effectiveness of the Group’s risk management framework and control governance process.
|
Global Risk function
We have a Global Risk function, headed by the Group Chief Risk Officer, which is responsible for the Group’s risk management framework. This responsibility includes establishing global policy, monitoring risk profiles, and forward-looking risk identification and management. Global Risk is made up of sub-functions covering all risks to our operations. Global Risk forms part of the second line of defence. It is independent from the global businesses, including sales and trading functions, to provide challenge, appropriate oversight and balance in risk/return decisions.
Enterprise-wide risk management tools
The Group uses a range of tools to identify, monitor and manage risk. The key enterprise-wide risk management tools are summarised below.
Risk appetite
Our risk appetite encapsulates consideration of financial and non-financial risks and is expressed in both quantitative and qualitative terms. It is applied at the global business level, at the regional level, and to material operating entities.
The Group’s risk appetite defines its desired forward-looking risk profile, and informs the strategic and financial planning process. Furthermore, it is integrated with other key risk management tools, such as stress testing and our top and emerging risk reports, to help ensure consistency in risk management practices.
The Group sets out the aggregated level and risk types it accepts in order to achieve its business objectives in a risk appetite statement (‘RAS’). The RAS is reviewed on an ongoing basis, and formally approved by the Board every six months on the recommendation of the GRC.
The Group’s actual performance is reported monthly against the approved RAS to the RMM, enabling senior management to monitor the risk profile and guide business activity to balance risk and return. This reporting allows risks to be promptly identified and mitigated, and informs risk-adjusted remuneration to drive a strong risk culture.
Global businesses, regions and strategically important countries are required to have their own RASs, which are monitored to ensure they remain aligned with the Group’s. All RASs and business activities are guided and underpinned by qualitative principles (see page
176
). Additionally, for key risk areas, quantitative metrics are defined along with appetite and tolerance thresholds.
Risk map
The Group risk map provides a point-in-time view of the risk profiles of countries, regions and global businesses across HSBC’s risk taxonomy. It assesses the potential for these risks to have a material impact on the Group’s financial results, reputation and the sustainability of its business. Risk stewards assign ‘current’ and ‘projected’ risk ratings, supported by commentary. Risks that have an ‘amber’ or ‘red’ risk rating require monitoring and mitigating action plans to be either in place or initiated to manage the risk down to acceptable levels.
Descriptions of our material banking and insurance risks are set out on page
110
.
|
108
|
HSBC Holdings plc
|
Top and emerging risks
We use a top and emerging risks process to provide a forward-looking view of issues with the potential to threaten the execution of our strategy or operations over the medium to long term.
We proactively assess the internal and external risk environment, as well as review the themes identified across our regions and global businesses, for any risks that may require global escalation, updating our top and emerging risks as necessary.
We define a ‘top risk’ as a thematic issue that may form and crystallise in between six months and one year, and that has the potential to materially affect the Group’s financial results, reputation or business model. It may arise across any combination of risk types, regions or global businesses. The impact may be well understood by senior management and some mitigating actions may already be in place. Stress tests of varying granularity may also have been carried out to assess the impact.
An ‘emerging risk’ is a thematic issue with large unknown components that may form and crystallise beyond a one-year time horizon. If it were to materialise, it could have a material effect on the Group’s long-term strategy, profitability and/or reputation. Existing mitigation plans are likely to be minimal, reflecting the uncertain nature of these risks at this stage. Some high-level analysis and/or stress testing may have been carried out to assess the potential impact.
Our current top and emerging risks are discussed on page
95
.
Stress testing
HSBC operates a comprehensive stress testing programme that supports our risk management and capital planning. It includes execution of stress tests mandated by our regulators. Our stress testing is supported by dedicated teams and infrastructure, and is overseen at the most senior levels of the Group.
Our stress testing programme assesses our capital strength through a rigorous examination of our resilience to external shocks. It also helps us understand and mitigate risks and informs our decisions about capital levels. As well as undertaking regulatory-driven stress tests, we conduct our own internal stress tests.
Many of our regulators – including the BoE, the FRB and the HKMA – use stress testing as a prudential regulatory tool and the Group has focused significant governance and resources to meet their requirements.
Bank of England stress test results for 2017
The BoE’s Annual Cyclical Scenario (‘ACS’) stress test in 2017 specified a global downturn with severe effects in the UK, US, Hong Kong and mainland China, which accounted for approximately two-thirds of HSBC’s RWAs at the end of 2016. We estimated that the economic shock to global GDP in this scenario was about as severe as in the global financial crisis of 2007 to 2009, but with a greater impact on emerging markets: for example, the scenario featured a contraction of 1.2% of the Chinese economy in the first year. Additionally, and in contrast to 2016, the ACS featured a 32% depreciation of sterling in the first year and a rise of UK base rates to 4%. The assumed GDP growth rates are detailed in the following table.
|
Assumed GDP growth rates in the 2017 Bank of England ACS
stress test
|
||||||||
|
2016
|
|
2017
|
|
2018
|
|
2019
|
|
|
|
%
|
|
%
|
|
%
|
|
%
|
|
|
|
UK
|
2.2
|
|
(4.7
|
)
|
0.7
|
|
1.3
|
|
|
USA
|
1.9
|
|
(3.5
|
)
|
0.7
|
|
1.4
|
|
|
Mainland China
|
6.8
|
|
(1.2
|
)
|
3.7
|
|
5.0
|
|
|
Hong Kong
|
1.8
|
|
(7.9
|
)
|
1.1
|
|
2.3
|
|
Source: Bank of England.
PRA assumed GDP growth rates are shown in terms of fourth quarter on fourth quarter annual changes.
In 2017, the results for HSBC as published by the BoE showed that our capital ratios, after taking account of CRD IV restrictions and strategic management actions, exceeded the BoE’s requirements.
This outcome reflected our strong capital position, conservative risk appetite and diversified geographical and business mix. It also reflected our ongoing strategic actions, including the sale of operations in Brazil, ongoing RWA reduction initiatives and continued sales from our US CML run-off portfolio.
The following table shows the results of the stress test for the past three years, and reflects HSBC’s resilience. From a starting CET1 ratio of 13.6% at the end of 2016, the BoE’s 2017 stress test results showed a projected minimum stressed CET1 ratio of 8.9% after the impact of strategic management actions.
|
Results of Bank of England stress tests for the past three years
|
|||
|
2017
|
2016
|
2015
|
|
|
%
|
%
|
%
|
|
|
CET1 ratio at scenario start point
|
13.6
|
11.9
|
10.9
|
|
Minimum stressed CET1 ratio after
strategic management actions
|
8.9
|
9.1
|
7.7
|
|
Fall in CET1 ratio
|
4.7
|
2.8
|
3.2
|
Source: Bank of England.
Data is presented in terms of the minimum CET1 ratio reached net of strategic management actions as per the results published by the PRA.
Internal stress tests are an important element in our risk management and capital management frameworks. Our capital plan is assessed through a range of stress scenarios which explore risks identified by management. They include potential adverse macroeconomic, geopolitical and operational risk events, and other potential events that are specific to HSBC. The selection of scenarios reflects our top and emerging risks identification process and our risk appetite. Stress testing analysis helps management understand the nature and extent of vulnerabilities to which the bank is exposed. Using this information, management decides whether risks can or should be mitigated through management actions or, if they were to crystallise, should be absorbed through capital. This in turn informs decisions about preferred capital levels.
We conduct reverse stress tests each year at Group and, where required, subsidiary entity level in order to understand which potential extreme conditions would make our business model non-viable. Reverse stress testing identifies potential stresses and vulnerabilities we might face, and helps inform early warning triggers, management actions and contingency plans designed to mitigate risks.
In addition to the Group-wide stress testing scenarios, each major HSBC subsidiary conducts regular macroeconomic and event-driven scenario analyses specific to its region. They also participate as required in the regulatory stress testing programmes of the jurisdictions in which they operate, such as the Comprehensive Capital Analysis and Review and Dodd-Frank Act Stress Test programmes in the US, and the stress tests of the HKMA. Global functions and businesses also perform bespoke stress testing to inform their assessment of risks in potential scenarios.
The Group stress testing programme is overseen by the GRC and results are reported, where appropriate, to the RMM and GRC.
|
HSBC Holdings plc
|
109
|
Report of the Directors
| Risk
Our material banking and insurance risks
The material risk types associated with our banking and insurance manufacturing operations are described in the following tables:
|
Description of risks – banking operations
|
||
|
Risks
|
Arising from
|
Measurement, monitoring and management of risk
|
|
Credit risk (see page 112)
|
||
|
Credit risk is the risk of financial loss if a customer or counterparty fails to meet an obligation under a contract.
|
Credit risk arises principally from direct lending, trade finance and leasing business, but also from certain other products such as guarantees and derivatives.
|
Credit risk is:
•
measured as the amount that could be lost if a customer or counterparty fails to make repayments;
•
monitored using various internal risk management measures and within limits approved by individuals within a framework of delegated authorities; and
•
managed through a robust risk control framework which outlines clear and consistent policies, principles and guidance for risk managers.
|
|
Liquidity and funding risk (see page 113)
|
||
|
Liquidity risk is the risk that we do not have sufficient financial resources to meet our obligations as they fall due or that we can only do so at an excessive cost.
Funding risk is the risk that funding considered to be sustainable, and therefore used to fund assets, is not sustainable over time.
|
Liquidity risk arises from mismatches in the timing of cash flows.
Funding risk arises when illiquid asset positions cannot be funded at the expected terms and when required.
|
Liquidity and funding risk is:
•
measured using a range of metrics including liquidity coverage ratio and net stable funding ratio;
•
assessed through the internal liquidity adequacy assessment process (‘ILAAP’);
•
monitored against the Group’s liquidity and funding risk framework; and
•
managed on a stand-alone basis with no reliance on any Group entity (unless pre-committed) or central bank unless this represents routine established business-as-usual market practice.
|
|
Market risk (see page 114)
|
||
|
Market risk is the risk that movements in market factors, such as foreign exchange rates, interest rates, credit spreads, equity prices and commodity prices, will reduce our income or the value of our portfolios.
|
Exposure to market risk is separated into two portfolios: trading and
non-trading. Market risk exposures arising from our insurance operations are discussed on page 159. |
Market risk is:
•
measured using sensitivities, value at risk (‘VaR’) and stress testing, giving a detailed picture of potential gains and losses for a range of market movements and scenarios, as well as tail risks over specified time horizons;
•
monitored using VaR, stress testing and other measures including the sensitivity of net interest income and the sensitivity of structural foreign exchange; and
•
managed using risk limits approved by the RMM and the risk management meeting in various global businesses.
|
|
Operational risk (see page 117)
|
||
|
Operational risk is the risk to achieving our strategy or objectives as a result of inadequate or failed internal processes, people and systems or from external events.
|
Operational risk arises from day-to-day operations or external events, and is relevant to every aspect of our business.
Regulatory compliance risk and financial crime compliance risk are discussed below.
|
Operational risk is:
•
Measured using the risk and control assessment process, which assesses the level of risk and the effectiveness of controls, and measured for Economic Capital management using risk event losses and scenario analysis;
•
monitored using key indicators and other internal control activities; and
•
managed primarily by global business and functional managers who identify and assess risks, implement controls to manage them and monitor the effectiveness of these controls using the operational risk management framework.
|
|
Regulatory compliance risk (see page 117)
|
||
|
Regulatory compliance risk is the risk that we fail to observe the letter and spirit of all relevant laws, codes, rules, regulations and standards of good market practice, and incur fines and penalties and suffer damage to our business as a consequence.
|
Regulatory compliance risk is part of operational risk, and arises from the risks associated with breaching our duty to clients and other counterparties, inappropriate market conduct and breaching other regulatory requirements.
|
Regulatory compliance risk is:
•
measured by reference to identified metrics, incident assessments, regulatory feedback and the judgement and assessment of our regulatory compliance teams;
•
monitored against the first line of defence risk and control assessments, the results of the monitoring and control assurance activities of the second line of defence functions, and the results of internal and external audits and regulatory inspections; and
•
managed by establishing and communicating appropriate policies and procedures, training employees in them, and monitoring activity to help ensure their observance. Proactive risk control and/or remediation work is undertaken where required.
|
|
Financial crime risk (see page 118)
|
||
|
Financial crime risk is the risk that we knowingly or unknowingly help parties to commit or to further potentially illegal activity through HSBC.
|
Financial crime risk is part of operational risk and arises from day-to-day banking operations.
|
Financial crime risk is:
•
measured by reference to identified metrics, incident assessments, regulatory feedback and the judgement and assessment of our financial crime risk teams;
•
monitored against our financial crime risk appetite statements and metrics, the results of the monitoring and control activities of the second line of defence functions, and the results of internal and external audits and regulatory inspections; and
•
managed by establishing and communicating appropriate policies and procedures, training employees in them, and monitoring activity to help ensure their observance. Proactive risk control and/or remediation work is undertaken where required.
|
|
110
|
HSBC Holdings plc
|
|
Description of risks – banking operations (continued)
|
||
|
Risks
|
Arising from
|
Measurement, monitoring and management of risk
|
|
Other material risks
|
||
|
Reputational risk (see page 119)
|
||
|
Reputational risk is the risk of failure to meet stakeholder expectations as a result of any event, behaviour, action or inaction, either by HSBC itself, our employees or those with whom we are associated, that might cause stakeholders to form a negative view of the Group.
|
Primary reputational risks arise directly from an action or inaction by HSBC, its employees or associated parties that are not the consequence of another type of risk. Secondary reputational risks are those arising indirectly and are a result of a failure to control any other risks.
|
Reputational risk is:
•
measured by reference to our reputation as indicated by our dealings with all relevant stakeholders, including media, regulators, customers and employees;
•
monitored through a reputational risk management framework that is integrated into the Group’s broader risk management framework; and
•
managed by every member of staff, and covered by a number of policies and guidelines. There is a clear structure of committees and individuals charged with mitigating reputational risk.
|
|
Pension risk (see page 120)
|
||
|
Pension risk is the risk of increased costs to HSBC from offering post-employment benefit plans to its employees.
|
Pension risk arises from investments delivering an inadequate return, adverse changes in interest rates or inflation, or members living longer than expected. Pension risk also includes operational and reputational risk of sponsoring pension plans.
|
Pension risk is:
•
measured in terms of the scheme’s ability to generate sufficient funds to meet the cost of their accrued benefits;
•
monitored through the specific risk appetite that has been developed at both Group and regional levels; and
•
managed locally through the appropriate pension risk governance structure and globally through the Global Pensions Oversight Forum and ultimately the RMM.
|
|
Sustainability risk (see page 120)
|
||
|
Sustainability risk is the risk that financial services provided to customers by the Group indirectly result in unacceptable impacts on people or the environment.
|
Sustainability risk arises from the provision of financial services to companies or projects which indirectly result in unacceptable impacts on people or on the environment.
|
Sustainability risk is:
•
measured by assessing the potential sustainability effect of a customer’s activities and assigning a sustainability risk rating to all high-risk transactions;
•
monitored quarterly by the RMM and monthly by the Group’s sustainability risk function; and
•
managed using sustainability risk policies covering project finance lending and sector-based sustainability policies for sectors and themes with potentially large environmental or social impacts.
|
Our insurance manufacturing subsidiaries are regulated separately from our banking operations. Risks in our insurance entities are managed using methodologies and processes that are subject to
Group oversight. Our insurance operations are also subject to some of the same risks as our banking operations, which are covered by the Group’s risk management processes.
|
Description of risks – insurance manufacturing operations
|
||
|
Risks
|
Arising from
|
Measurement, monitoring and management of risk
|
|
Financial risk (see page 159)
|
||
|
Our ability to effectively match liabilities arising under insurance contracts with the asset portfolios that back them is contingent on the management of financial risks and the extent to which these are borne by policyholders.
|
Exposure to financial risk arises from:
•
market risk affecting the fair values of financial assets or their future cash flows;
•
credit risk; and
•
liquidity risk of entities being unable to make payments to policyholders as they fall due.
|
Financial risk is:
•
measured (i) for credit risk, in terms of economic capital and the amount that could be lost if a counterparty fails to make repayments; (ii) for market risk, in terms of economic capital, internal metrics and fluctuations in key financial variables; and (iii) for liquidity risk, in terms of internal metrics including stressed operational cash flow projections;
•
monitored through a framework of approved limits and delegated authorities; and
•
managed through a robust risk control framework which outlines clear and consistent policies, principles and guidance. This includes using product design, asset liability matching and bonus rates.
|
|
Insurance risk (see page 161)
|
||
|
Insurance risk is the risk that, over time, the cost of insurance policies written, including claims and benefits, may exceed the total amount of premiums and investment income received.
|
The cost of claims and benefits can be influenced by many factors, including mortality and morbidity experience, as well as lapse and surrender rates.
|
Insurance risk is:
•
measured in terms of life insurance liabilities and economic capital allocated to insurance underwriting risk;
•
monitored through a framework of approved limits and delegated authorities; and
•
managed through a robust risk control framework which outlines clear and consistent policies, principles and guidance. This includes using product design, underwriting, reinsurance and claims-handling procedures.
|
|
HSBC Holdings plc
|
111
|
Report of the Directors
| Risk
Credit risk management
Details of changes in our credit risk profile in 2017 can be found on page
121
, in
‘Key developments and risk profile in 2017’
.
There were no material changes to the policies and practices for the management of credit risk in 2017.
Credit risk sub-function
(Audited)
Credit approval authorities are delegated by the Board to the Group Chief Executive together with the authority to sub-delegate them. The Credit Risk sub-function in Global Risk is responsible for the key policies and processes for managing credit risk, which include formulating Group credit policies and risk rating frameworks, guiding the Group’s appetite for credit risk exposures, undertaking independent reviews and objective assessment of credit risk, and monitoring performance and management of portfolios.
The principal objectives of our credit risk management are:
|
•
|
to maintain across HSBC a strong culture of responsible lending, and robust risk policies and control frameworks;
|
|
•
|
to both partner and challenge our businesses in defining, implementing and continually re-evaluating our risk appetite under actual and scenario conditions; and
|
|
•
|
to ensure there is independent, expert scrutiny of credit risks, their costs and their mitigation.
|
Concentration of exposure
(Audited)
Concentrations of credit risk arise when a number of counterparties or exposures have comparable economic characteristics, or such counterparties are engaged in similar activities or operate in the same geographical areas or industry sectors so that their collective ability to meet contractual obligations is uniformly affected by changes in economic, political
or other conditions. We use a number of controls and measures to minimise undue concentration of exposure in our portfolios across industries, countries and global businesses. These include portfolio and counterparty limits, approval and review controls, and stress testing.
Credit quality of financial instruments
(Audited)
Our risk rating system facilitates the internal ratings-based approach under the Basel framework adopted by the Group to support calculation of our minimum credit regulatory capital requirement.
The customer risk rating (‘CRR’) 10-grade scale summarises a more granular underlying 23-grade scale of obligor probability of default (‘PD’). All corporate customers are rated using the 10- or 23-grade scale, depending on the degree of sophistication of the Basel II approach adopted for the exposure.
Each CRR band is associated with an external rating grade by reference to long-run default rates for that grade, represented by the average of issuer-weighted historical default rates. This mapping between internal and external ratings is indicative and may vary over time.
The expected loss (‘EL’) 10-grade scale for retail business summarises a more granular underlying EL scale for this customer segment. This combines obligor and facility/product risk factors in a composite measure.
For the five credit quality classifications defined, each encompasses a range of granular internal credit rating grades assigned to wholesale and retail lending businesses, and the external ratings attributed by external agencies to debt securities.
For debt securities and certain other financial instruments, external ratings have been aligned to the five quality classifications based upon the mapping of related CRR to external credit rating.
|
Credit quality classification
|
|||||||
|
Sovereign debt securities
and bills
|
Other debt
securities
and bills
|
Wholesale lending
and derivatives
|
Retail lending
|
||||
|
Footnotes
|
External credit rating
|
External credit rating
|
Internal credit rating
|
12-month probability of default %
|
Internal credit rating
|
Expected loss %
|
|
|
Quality classification
|
|||||||
|
Strong
|
1, 2
|
BBB and above
|
A- and above
|
CRR 1 to CRR 2
|
0 – 0.169
|
EL 1 to EL 2
|
0 – 0.999
|
|
Good
|
BBB- to BB
|
BBB+ to BBB-
|
CRR 3
|
0.170 – 0.740
|
EL 3
|
1.000 – 4.999
|
|
|
Satisfactory
|
BB- to B and unrated
|
BB+ to B and unrated
|
CRR 4 to CRR 5
|
0.741 – 4.914
|
EL 4 to EL 5
|
5.000 – 19.999
|
|
|
Sub-standard
|
B- to C
|
B- to C
|
CRR 6 to CRR 8
|
4.915 – 99.999
|
EL 6 to EL 8
|
20.000 – 99.999
|
|
|
Impaired
|
3
|
Default
|
Default
|
CRR 9 to CRR 10
|
100
|
EL 9 to EL 10
|
100+ or defaulted
|
|
1
|
Customer risk rating (‘CRR’).
|
|
2
|
Expected loss (‘EL’).
|
|
3
|
The EL percentage is derived through a combination of probability of default (‘PD’) and loss given default (‘LGD’), and may exceed 100% in circumstances where the LGD is above 100% reflecting the cost of recoveries.
|
|
Quality classification definitions
•
‘Strong’ exposures demonstrate a strong capacity to meet financial commitments, with negligible or low probability of default and/or low levels of expected loss.
•
‘Good’ exposures require closer monitoring and demonstrate a good capacity to meet financial commitments, with low default risk.
•
‘Satisfactory’ exposures require closer monitoring and demonstrate an average-to-fair capacity to meet financial commitments, with moderate default risk.
•
‘Sub-standard’ exposures require varying degrees of special attention and default risk is of greater concern.
•
‘Impaired’ exposures have been assessed as impaired, as described on page 126. These also include retail accounts classified as EL 1 to EL 8 that are delinquent by more than 90 days, unless individually they have been assessed as not impaired, and renegotiated loans that have met the requirements to be disclosed as impaired and have not yet met the criteria to be returned to the unimpaired portfolio (see following page
)
.
|
|
112
|
HSBC Holdings plc
|
Renegotiated loans and forbearance
(Audited)
‘Forbearance’ describes concessions made on the contractual terms of a loan in response to an obligor’s financial difficulties.
A loan is classed as ‘renegotiated’ when we modify the contractual payment terms, on concessionary terms, because we have significant concerns about the borrowers’ ability to meet contractual payments when due.
Non-payment related concessions (e.g. covenant waivers), while potential indicators of impairment, do not trigger identification as renegotiated loans.
Loans that have been identified as renegotiated retain this designation until maturity or derecognition. A loan that is renegotiated is derecognised if the existing agreement is cancelled and a new agreement is made on substantially different terms, or if the terms of an existing agreement are modified such that the renegotiated loan is substantially a different financial instrument. Loans arising as a result of derecognition events will continue to be disclosed as renegotiated loans.
Credit quality of renegotiated loans
On execution of a renegotiation, the loan will also be classified as impaired if it is not already so classified. In wholesale lending, all facilities with a customer, including loans which have not been modified, are considered impaired following the provision of a renegotiated loan.
Those loans that are considered impaired retain the impaired classification for a minimum of one year. Renegotiated loans will continue to be disclosed as impaired until there is sufficient evidence to demonstrate a significant reduction in the risk of non-payment of future cash flows (the evidence typically comprises a history of payment performance against the original or revised terms), and there are no other indicators of impairment.
Renegotiated loans and recognition of impairment allowances
(Audited)
For retail lending, renegotiated loans are segregated from other parts of the loan portfolio for collective impairment assessment to reflect the higher rates of losses typically encountered with renegotiated loans.
For wholesale lending, renegotiated loans are typically assessed individually. Credit risk ratings are intrinsic to the impairment assessments. The individual impairment assessment takes into account the higher risk of the non-payment of future cash flows inherent in renegotiated loans.
Impairment assessment
(Audited)
For details of our impairment policies on loans and advances and financial investments, see Note
1.2(d)
on the Financial Statements.
Write-off of loans and advances
(Audited)
For details of our policy on the write-off of loans and advances, see Note
1.2(d)
on the Financial Statements.
Unsecured personal facilities, including credit cards, are generally written off at between 150 and 210 days past due. The standard period runs until the end of the month in which the account becomes 180 days contractually delinquent. Write-off periods may be extended, generally to no more than 360 days past due. However, in exceptional circumstances, they may be extended further. For example, in a few countries where local regulation or legislation constrain earlier write-off, or where the realisation of collateral for secured real estate lending takes more time.
For secured personal facilities, final write-off should generally occur within 60 months of the default.
In the event of bankruptcy or analogous proceedings, write-off may occur earlier than the maximum periods stated above. Collection procedures may continue after write-off.
Impairment methodologies for available-for-sale asset-backed securities (‘ABSs’)
(Audited)
To identify objective evidence of impairment for available-for-sale ABSs, an industry standard valuation model is normally applied which uses data with reference to the underlying asset pools and models their projected future cash flows. The estimated future cash flows of the securities are assessed at the specific financial asset level to determine whether any of them are unlikely to be recovered as a result of loss events occurring on or before the reporting date.
The principal assumptions and inputs to the models are typically the delinquency status of the underlying loans, the probability of delinquent loans progressing to default, the prepayment profiles of the underlying assets and the loss severity in the event of default. However, the models utilise other variables relevant to specific classes of collateral to forecast future defaults and recovery rates. Management uses externally available data and applies judgement when determining the appropriate assumptions in respect of these factors. We use a modelling approach which incorporates historically observed progression rates to default to determine if the decline in aggregate projected cash flows from the underlying collateral will lead to a shortfall in contractual cash flows. In such cases, the security is considered to be impaired.
In respect of collateralised debt obligations (‘CDOs’), expected future cash flows for the underlying collateral are assessed to determine whether there is likely to be a shortfall in the contractual cash flows of the CDO.
When a security benefits from a contract provided by a monoline insurer that insures payments of principal and interest, the expected recovery on the contract is assessed in determining the total expected credit support available to the ABS.
Liquidity and funding risk management
Details of HSBC’s Liquidity and Funding Risk Management Framework (‘LFRF’) can be found in the Group’s
Pillar 3 Disclosures at December 2017
document.
Liquidity and funding risk management framework
The LFRF aims to allow us to withstand very severe liquidity stresses. It is designed to be adaptable to changing business models, markets and regulations. The Group Treasurer, who reports to the Group Finance Director, has responsibility for the oversight of the LFRF. Asset, Liability and Capital Management (‘ALCM’) teams are responsible for the application of the LFRF at a local operating entity level. This comprises of the following elements:
|
•
|
stand-alone management of liquidity and funding by operating entity;
|
|
•
|
operating entity classification by inherent liquidity risk (‘ILR’) categorisation;
|
|
•
|
minimum LCR requirement depending on ILR categorisation;
|
|
•
|
minimum NSFR requirement depending on ILR categorisation;
|
|
•
|
legal entity depositor concentration limit;
|
|
•
|
three-month and 12-month cumulative rolling term contractual maturity limits covering deposits from banks, deposits from non-bank financial institutions and securities issued;
|
|
•
|
annual individual liquidity adequacy assessment by principal operating entity;
|
|
•
|
minimum LCR requirement by currency;
|
|
•
|
management and monitoring of intra-day liquidity;
|
|
•
|
liquidity funds transfer pricing; and
|
|
•
|
forward-looking funding assessments.
|
|
HSBC Holdings plc
|
113
|
Report of the Directors
| Risk
Risk governance and oversight
The elements of the LFRF are underpinned by a robust governance framework, the two major elements of which are:
|
•
|
Group, regional and entity level asset and liability management committees (‘ALCOs’).
|
|
•
|
Annual internal liquidity adequacy assessment process (‘ILAAP’) for principal operating entities used to validate risk tolerance and set risk appetite.
|
Liquidity and funding are predominantly managed at an entity level. Where appropriate, management may be expanded to cover a consolidated group of legal entities or narrowed to a principal office (branch) of a wider legal entity to reflect the management under internal or regulatory definitions.
The RMM reviews and agrees annually the list of countries, legal entities or consolidated groups it directly oversees and the composition of these entities (‘principal operating entities’). This list forms the basis of liquidity and funding risk disclosures.
There were no material changes to the policies and practices for the management of liquidity and funding risk in 2017.
HSBC Holdings
HSBC Holdings’ primary sources of liquidity are dividends received from subsidiaries, interest on and repayment of intra-group loans and securities, and interest earned on its own liquid funds. HSBC Holdings also raises ancillary funds in the debt capital markets through subordinated and senior debt issuances. Cash is primarily used for the provision of capital and subordinated funding to subsidiaries, payment of operating expenses, interest payments to debt holders and dividend payments to shareholders.
HSBC Holdings is also subject to contingent liquidity risk by virtue of credit-related commitments and guarantees and similar contracts issued relating to its subsidiaries. Such commitments and guarantees are only issued after due consideration of HSBC Holdings’ ability to finance the commitments and guarantees and the likelihood of the need arising.
HSBC Holdings actively manages the cash flows from its subsidiaries to optimise the amount of cash held at the holding company level. During 2017, consistent with the Group’s capital plan, the Group’s subsidiaries did not experience any significant restrictions on paying dividends or repaying loans and advances. Also, there are no foreseen restrictions envisaged with regard to planned dividends or payments. However, the ability of subsidiaries to pay dividends or advance monies to HSBC Holdings depends on, among other things, their respective local regulatory capital and banking requirements, exchange controls, statutory reserves, and financial and operating performance.
Market risk management
Details of changes in our market risk profile in 2017 can be found on page
121
, in ‘
Key developments and risk profile in 2017
’.
There were no material changes to our policies and practices for the management of market risk in 2017.
Market risk in global businesses
The diagram below summarises the main business areas where trading and non-trading market risks reside, and the market risk measures used to monitor and limit exposures.
|
Risk types
|
Trading risk
|
Non-trading risk
|
|||
|
•
Foreign exchange and commodities
•
Interest rates
•
Credit spreads
•
Equities
|
•
Structural foreign exchange
•
Interest rates
1
•
Credit spreads
|
||||
|
Global business
|
GB&M and BSM
2
|
GB&M, BSM
2
, GPB, CMB and RBWM
|
|||
|
Risk measure
|
VaR | Sensitivity | Stress Testing
|
VaR | Sensitivity | Stress Testing
|
|||
|
1
|
The interest rate risk on the fixed-rate securities issued by HSBC Holdings is not included in the Group VaR. The management of this risk is described on page
145
.
|
|
2
|
BSM, for external reporting purposes, forms part of Corporate Centre while daily operations and risk are managed within GB&M.
|
Where appropriate, we apply similar risk management policies and measurement techniques to both trading and non-trading portfolios. Our objective is to manage and control market risk exposures to optimise return on risk while maintaining a market profile consistent with our established risk appetite.
The nature of the hedging and risk mitigation strategies performed across the Group corresponds to the market risk management instruments available within each operating jurisdiction. These strategies range from the use of traditional market instruments, such as interest rate swaps, to more sophisticated hedging strategies to address a combination of risk factors arising at the portfolio level.
Market risk governance
(Audited)
Market risk is managed and controlled through limits approved by the RMM for HSBC Holdings. These limits are allocated across business lines and to the Group’s legal entities.
|
B&M manages market risk, where the majority of HSBC’s total value at risk (excluding insurance) and almost all trading VaR resides, using risk limits approved by the GMB. VaR limits are set for portfolios, products and risk types, with market liquidity being a primary factor in determining the level of limits set. Global Risk is responsible for setting market risk management policies and measurement techniques.
Each major operating entity has an independent market risk management and control sub-function which is responsible for measuring market risk exposures, monitoring and reporting these exposures against the prescribed limits on a daily basis. The market risk limits are governed according to the framework illustrated to the left.
Each operating entity is required to assess the market risks arising on each product in its business and to transfer them to either its local GB&M unit for management, or to separate books managed under the supervision of the local ALCO.
Model risk is governed through Model Oversight Committees (‘MOCs’) at the regional and global Wholesale Credit and Market Risk levels. They have direct oversight and approval responsibility for all traded risk models utilised for risk measurement and management and stress testing. We are committed to the ongoing development of our in-house risk models.
The Markets MOC reports into the Group MOC, which oversees all model risk types at Group level. The Group MOC informs the RMM about material issues at least two times a year. The RMM is the Group’s ‘Designated Committee’ according to regulatory rules and has delegated day-to-day governance of all traded risk models to the Markets MOC.
Global Risk enforces trading in permissible instruments approved for each site, new product approval procedures, restricting trading in the more complex derivative products only to offices with appropriate levels of product expertise and robust control systems.
|
||||
|
General
measures |
HSBC Holdings Board
|
GB&M manages market risk, where the majority of HSBC’s total value at risk (excluding insurance) and almost all trading VaR resides, using risk limits approved by the RMM. VaR limits are set for portfolios, products and risk types, with market liquidity being a primary factor in determining the level of limits set. Global Risk is responsible for setting market risk management policies and measurement techniques.
Each major operating entity has an independent market risk management and control sub-function which is responsible for measuring market risk exposures, monitoring and reporting these exposures against the prescribed limits on a daily basis. The market risk limits are governed according to the framework illustrated to the left.
Each operating entity is required to assess the market risks arising on each product in its business and to transfer them to either its local GB&M unit for management, or to separate books managed under the supervision of the local ALCO.
Model risk is governed through Model Oversight Committees (‘MOCs’) at the regional and global Wholesale Credit and Market Risk levels. They have direct oversight and approval responsibility for all traded risk models used for risk measurement and management and stress testing. We are committed to the ongoing development of our in-house risk models.
The Markets MOC reports into the Group MOC, which oversees all model risk types at Group level. The Group MOC informs the RMM about material issues at least two times a year. The RMM is the Group’s ‘Designated Committee’ according to regulatory rules and has delegated day-to-day governance of all traded risk models to the Markets MOC.
Global Risk enforces trading in permissible instruments approved for each site, new product approval procedures, restricting trading in the more complex derivative products only to offices with appropriate levels of product expertise and robust control systems.
|
||
|
q
|
||||
|
Group Chairman/
Group Chief Executive |
||||
|
q
|
||||
|
Risk Management Meeting of the GMB
|
||||
|
q
|
||||
|
Group traded risk
|
||||
|
q
|
||||
|
Specific
measures |
Entity risk management committee
|
|||
|
q
|
||||
|
Principal office manager
|
||||
|
q
|
||||
|
Business/desk/trader
|
||||
|
114
|
HSBC Holdings plc
|
Market risk measures
Monitoring and limiting market risk exposures
Our objective is to manage and control market risk exposures while maintaining a market profile consistent with our risk appetite.
We use a range of tools to monitor and limit market risk exposures including sensitivity analysis, value at risk and stress testing.
Sensitivity analysis
Sensitivity analysis measures the impact of individual market factor movements on specific instruments or portfolios, including interest rates, foreign exchange rates and equity prices, such as the effect of a one basis point change in yield. We use sensitivity measures to monitor the market risk positions within each risk type. Sensitivity limits are set for portfolios, products and risk types, with the depth of the market being a principal factor in determining the level.
Value at risk
(Audited)
Value at risk (‘VaR’) is a technique for estimating potential losses on risk positions as a result of movements in market rates and prices over a specified time horizon and to a given level of confidence. The use of VaR is integrated into market risk management and calculated for all trading positions regardless of how we capitalise them. Where there is not an approved internal model, we use the appropriate local rules to capitalise exposures. In addition, we calculate VaR for non-trading portfolios to have a complete picture of risk. Where we do not calculate VaR explicitly, we use alternative tools as summarised in the ‘Stress testing’ section below.
Our models are predominantly based on historical simulation that incorporates the following features:
|
•
|
historical market rates and prices are calculated with reference to foreign exchange rates, commodity prices, interest rates, equity prices and the associated volatilities;
|
|
•
|
potential market movements utilised for VaR are calculated with reference to data from the past two years; and
|
|
•
|
VaR measures are calculated to a 99% confidence level and use a one-day holding period.
|
The models also incorporate the effect of option features on the underlying exposures. The nature of the VaR models means that an increase in observed market volatility will lead to an increase in VaR without any changes in the underlying positions.
VaR model limitations
Although a valuable guide to risk, VaR should always be viewed in the context of its limitations. For example:
|
•
|
use of historical data as a proxy for estimating future events may not encompass all potential events, particularly extreme ones;
|
|
•
|
the use of a holding period assumes that all positions can be liquidated or the risks offset during that period, which may not fully reflect the market risk arising at times of severe illiquidity, when the holding period may be insufficient to liquidate or hedge all positions fully;
|
|
•
|
the use of a 99% confidence level does not take into account losses that might occur beyond this level of confidence; and
|
|
•
|
VaR is calculated on the basis of exposures outstanding at the close of business and therefore does not necessarily reflect intra-day exposures.
|
Risk not in VaR framework
The risks not in VaR (‘RNIV’) framework aims to capture and capitalise material market risks that are not adequately covered in the VaR model, such as the LIBOR tenor basis.
Risk factors are reviewed on a regular basis and either incorporated directly in the VaR models, where possible, or quantified through the VaR-based RNIV approach or a stress test
approach within the RNIV framework. The outcome of the VaR-based RNIV is included in the VaR calculation and back-testing; a stressed VaR RNIV is also computed for the risk factors considered in the VaR-based RNIV approach.
Stress-type RNIVs include a gap risk exposure measure to capture risk on non-recourse margin loans and a de-peg risk measure to capture risk to pegged and heavily-managed currencies.
Stress testing
Stress testing is an important procedure that is integrated into our market risk management framework to evaluate the potential impact on portfolio values of more extreme, although plausible, events or movements in a set of financial variables. In such scenarios, losses can be much greater than those predicted by VaR modelling.
Stress testing is implemented at legal entity, regional and overall Group levels. A set of scenarios is used consistently across all regions within the Group. Scenarios are tailored to capture the relevant potential events or market movements at each level. The risk appetite around potential stress losses for the Group is set and monitored against referral limits.
Market risk reverse stress tests are undertaken on the premise that there is a fixed loss. The stress testing process identifies which scenarios lead to this loss. The rationale behind the reverse stress test is to understand scenarios that are beyond normal business settings and could have contagion and systemic implications.
Stressed VaR and stress testing, together with reverse stress testing and the management of gap risk, provide management with insights regarding the ‘tail risk’ beyond VaR, for which HSBC’s appetite is limited.
Trading portfolios
Back-testing
We routinely validate the accuracy of our VaR models by back-testing them against both actual and hypothetical profit and loss against the corresponding VaR numbers. Hypothetical profit and loss excludes non-modelled items such as fees, commissions and revenues of intra-day transactions.
We would expect, on average, to see two or three profits and two or three losses in excess of VaR at the 99% confidence level over a one-year period. The actual number of profits or losses in excess of VaR over this period can therefore be used to gauge how well the models are performing.
We back-test our Group VaR at various levels that reflect a full legal entity scope of HSBC, including entities that do not have local permission to use VaR for regulatory purposes.
Structural foreign exchange exposures
Structural foreign exchange exposures represent net investments in subsidiaries, branches and associates, the functional currencies of which are currencies other than the US dollar. An entity’s functional currency is normally that of the primary economic environment in which the entity operates.
Exchange differences on structural exposures are recognised in ‘Other comprehensive income’. We use the US dollar as our presentation currency in our consolidated financial statements because the US dollar and currencies linked to it form the major currency bloc in which we transact and fund our business. Our consolidated balance sheet is, therefore, affected by exchange differences between the US dollar and all the non-US dollar functional currencies of underlying subsidiaries.
Our structural foreign exchange exposures are managed with the primary objective of ensuring, where practical, that our consolidated capital ratios and the capital ratios of individual banking subsidiaries are largely protected from the effect of changes in exchange rates. We hedge structural foreign exchange exposures only in limited circumstances.
For further details of our structural foreign exchange exposures, please see page
153
.
|
HSBC Holdings plc
|
115
|
Report of the Directors
| Risk
Interest rate risk in the banking book
Overview
Interest rate risk in the banking book is the risk of an adverse impact to earnings or capital due to changes in market interest rates. It is generated by our non-traded assets and liabilities and is monitored and controlled at Group level by Group Treasury and at the entity level by Asset, Liability and Capital Management (‘ALCM’). Group Treasury and ALCM functions are governed by RMM who approve risk limits used in the management of interest rate risk. Interest rate risk in the banking book is transferred to and managed by BSM, which is overseen by Wholesale Market Risk, Product Control and Group Treasury functions.
Key risk drivers
The bank’s interest rate risk in the banking book can be segregated into the following drivers:
|
•
|
Managed rate risk – the risk that the pricing of products, which are dependent upon business line decisions, do not correlate to movements in market interest rates.
|
|
•
|
Re-investment risk – risk arising due to change in rates when behaviouralised balances are reinvested as per the transfer pricing policy.
|
|
•
|
Basis risk – the risk arising from assets and liabilities that are priced referencing different market indices creating a repricing mismatch.
|
|
•
|
Prepayment risk – the risk that the actual customer prepayment in different interest rate scenarios does not match the profile used to hedge the interest rate risk.
|
|
•
|
Duration risk – the risk that there are changes in the maturities of assets and liabilities due to changes in interest rate, which create or exacerbate a mismatch.
|
Governance and structure
Group Treasury and ALCM monitor and control non-traded interest rate risk. This includes reviewing and challenging the business prior to the release of new products and in respect of proposed behavioural assumptions used for hedging activities. ALCM are also responsible for maintaining and updating the transfer pricing framework, informing the Asset and Liability Committee (‘ALCO’) of the Group’s overall banking book interest rate risk exposure and managing the balance sheet in conjunction with BSM.
The internal transfer pricing framework is constructed to ensure that structural interest rate risk, arising due to differences in the repricing timing of assets and liabilities, is transferred to BSM and business lines are correctly allocated income and expense based on the products they write, inclusive of activities to mitigate this risk. Contractual principal repayments, payment schedules, expected prepayments, contractual rate indices used for repricing and interest rate reset dates are examples of elements transferred for risk management by BSM.
The internal transfer pricing framework is governed by each entity’s ALCO. The ALCO defines each operating entity’s transfer pricing curve, reviews and approves the transfer pricing policy, including behaviouralisation assumptions used for products where there is either no defined maturity or customer optionality exists. The ALCO is also responsible for monitoring and reviewing each entity’s overall structural interest rate risk position. Interest rate behaviouralisation policies have to be formulated in line with the Group’s behaviouralisation policies and approved at least annually by local ALCOs.
Non-traded assets and liabilities are transferred to BSM based on their repricing and maturity characteristics. For assets and liabilities with no defined maturity or repricing characteristics behaviouralisation is used to assess the interest rate risk profile; the maximum average duration to which a portfolio of non-maturity defined customer balances or equity can be behaviouralised is five years. The maximum percentage of any portfolio that can be behaviouralised is 90% with the residual treated as overnight.
BSM manages the banking book interest rate positions transferred to it within the Market Risk limits approved by RMM. Effective governance of BSM is supported by the dual reporting lines it has to the Chief Executive Officer of GB&M and to the Group Treasurer. The global businesses can only transfer non-trading assets and liabilities to BSM provided BSM can economically hedge the risk they receive. Hedging is generally executed through vanilla interest rate derivatives or fixed rate government bonds. Any interest rate risk which BSM cannot economically hedge is not transferred and will remain within the global business where the risk is originated.
Measurement of interest rate risk in the banking book
ALCM uses a number of measures to monitor and control interest rate risk in the banking book, including:
|
•
|
non-traded VaR;
|
|
•
|
net Interest Income (‘NII’) sensitivity; and
|
|
•
|
economic value of equity (‘EVE’).
|
Non-traded VaR
Non-traded VaR uses the same models as those used in the trading book and excludes both HSBC Holdings and the elements of risk which are not transferred to BSM.
NII sensitivity
A principal part of our management of non-traded interest rate risk is to monitor the sensitivity of expected net interest income under varying interest rate scenarios (simulation modelling), where all other economic variables are held constant. This monitoring is undertaken at an entity level by local ALCOs, where entities forecast both one-year and five-year net interest income sensitivities across a range of interest rate scenarios.
Entities apply a combination of scenarios and assumptions relevant to their local businesses, and standard scenarios which are required throughout HSBC. The latter are consolidated to illustrate the combined pro forma effect on a hypothetical base case of our consolidated net interest income.
Projected net interest income sensitivity figures represent the effect of the pro forma movements in projected yield curves based on a static balance sheet size and structure, other than where the size of the balances or repricing is deemed interest rate sensitive, for example, non-interest bearing current account migration and fixed rate loan early prepayment. These sensitivity calculations do not incorporate actions which would be taken by BSM or in the business units to mitigate the effect of interest rate movements.
The net interest income sensitivity calculations assume that interest rates of all maturities move by the same amount in the ‘up-shock’ scenario. Rates are not assumed to become negative in the ‘down-shock’ scenario unless the central bank rate is already negative. In these cases, rates are not assumed to go further negative, which may, in certain currencies, effectively result in non-parallel shock. In addition, the net interest income sensitivity calculations take account of the effect on net interest income of anticipated differences in changes between interbank interest rates and internally determined interest rates over which the entity has discretion in terms of the timing and extent of rate changes.
Tables showing our calculations of net interest income sensitivity can be found on page
153
.
Economic value of equity
EVE represents the present value of the future banking book cash flows that could be distributed to equity providers under a managed run-off scenario, i.e. the current book value of equity plus the present value of future net interest income in this scenario. This can be used to assess the economic capital required to support IRRBB. An EVE sensitivity is the extent to which the EVE value will change due to a pre-specified movements in interest rates, where all other economic variables are held constant. Operating entities are required to monitor EVE sensitivity as a percentage of capital resources.
|
116
|
HSBC Holdings plc
|
HSBC Holdings
HSBC Holdings is a financial services holding company. Its activities predominantly involve maintaining sufficient capital resources to support the Group’s diverse activities; allocating these capital resources across our businesses; earning dividend and interest income on its investments in our businesses; payment of operating expenses; providing dividend payments to its equity shareholders and interest payments to providers of debt capital; and maintaining a supply of short-term liquid assets for deployment under extraordinary circumstances.
The main market risks to which HSBC Holdings is exposed are banking book interest rate risk and foreign currency risk. Exposure to these risks arises from short-term cash balances, funding positions held, loans to subsidiaries, investments in long-term financial assets and financial liabilities including debt capital issued. The objective of HSBC Holdings’ market risk management strategy is to reduce exposure to these risks and minimise volatility in capital resources, cash flows and distributable reserves. Market risk for HSBC Holdings is monitored by Holdings ALCO in accordance with its risk appetite statement.
HSBC Holdings uses interest rate swaps and cross-currency interest rate swaps to manage the interest rate risk and foreign currency risk arising from its long-term debt issues.
Operational risk management
Details of our operational risk profile in 2017 can be found on page
156
, in ‘Operational risk exposures in 2017’.
Overview
The objective of our operational risk management is to manage and control operational risk in a cost-effective manner within targeted levels of operational risk consistent with our risk appetite, as defined by the GMB.
Key developments in 2017
During 2017 we implemented a new operational risk management framework (‘ORMF’) and group-wide risk management system. The new ORMF provides an end-to-end view of non-financial risks, enhancing focus on the risks that matter the most and associated controls. It provides a platform to drive forward-looking risk awareness and assist management focus. It also helps the organisation understand the level of risk it is willing to accept.
We also maintained activity to continually strengthen our risk culture. In particular, we focused on the use of the three lines of defence model to reinforce individual accountability. It sets our roles and responsibilities for managing operational risk on a daily basis.
Further information on the three lines of defence model can be found in the ‘Our risk management framework’ section on page
106
.
Governance and structure
The ORMF defines minimum standards and processes, and the governance structure for the management of operational risk and internal control in our geographical regions, global businesses and global functions. The ORMF has been codified in a high-level standards manual, supplemented with detailed policies, which describes our approach to identifying, assessing, monitoring and controlling operational risk and gives guidance on mitigating action to be taken when weaknesses are identified.
We have a dedicated Global Operational Risk sub-function within our Global Risk function. It is responsible for leading the embedding of the ORMF, and assuring adherence to associated policies and processes across the first and second lines of defence. It supports the Group Chief Risk Officer and the Global Operational Risk Committee, which meets at least quarterly to discuss key risk issues and review implementation of the ORMF. The sub-function is also responsible for preparation of operational risk reporting at Group level, including reports for consideration by the RMM and Group Risk Committee. A formal governance structure provides oversight of the sub-function’s management.
Key risk management processes
Business managers throughout the Group are responsible for maintaining an acceptable level of internal control commensurate with the scale and nature of operations, and for identifying and assessing risks, designing controls and monitoring the effectiveness of these controls. The ORMF helps managers to fulfil these responsibilities by defining a standard risk assessment methodology and providing a tool for the systematic reporting of operational loss data.
A group-wide risk management system is used to record the results of the operational risk management process. Operational risk and control self-assessments, along with issue and action plans, are entered and maintained by business units. Business and functional management monitor the progress of documented action plans to address shortcomings. To help ensure that operational risk losses are consistently reported and monitored at Group level, all Group companies are required to report individual losses when the net loss is expected to exceed $10,000, and to aggregate all other operational risk losses under $10,000. Losses are entered into the group-wide risk management system and reported to governance on a monthly basis.
Regulatory compliance risk management
Overview
The Regulatory Compliance sub-function (‘RC’) provides independent, objective oversight and challenge, and promotes a compliance-orientated culture that supports the business in delivering fair outcomes for customers, maintaining the integrity of financial markets and achieving HSBC’s strategic objectives.
Key developments in 2017
There were no material changes to the policies and practices for the management of RC risk in 2017, except for the following:
|
•
|
We implemented a number of initiatives to raise our standards in relation to the conduct of our business, as described below under ‘Conduct of business’.
|
|
•
|
Surveillance capabilities have been strengthened during the year with the deployment of an unauthorised trading detection tool in London, New York and Hong Kong, implementation of a foreign exchange trade analytics platform and expanded coverage of electronic communications surveillance. Infrastructure to support the effective delivery and reporting of surveillance activity continues to mature.
|
|
•
|
We continued to take steps to enhance our regulatory compliance risk management and controls, and to work with regulators in relation to their investigations into historical activities. This included, in September 2017, matt
ers giving rise to a civil money penalty order with the Federal Reserve Board in connection with its investigation into HSBC’s historical foreign exchange activities, and in January 2018, matters giving rise to HSBC’s entry into a three-year deferred prosecution agreement with the US Department of Justice (‘DoJ’)
regarding fraudulent conduct in connection with two particular transactions in 2010 and 2011 which concluded the DoJ’s investigation into HSBC’s historical foreign exchange activities
. For further details, see Note
34
on the Financial Statements.
|
Governance and structure
The Global Head of RC reports to the Group Chief Risk Officer. To align with our global business structure and help ensure coverage of local regulatory requirements, RC is structured as a global function with regional and country RC teams, which support and advise each global business and global function.
Key risk management processes
We regularly review our policies and procedures. Global policies and procedures require the prompt identification and escalation of any actual or potential regulatory breach to RC. Reportable events are escalated to the RMM and the Group Risk Committee, as appropriate. Matters relating to the Group’s regulatory conduct of business are reported to the Conduct & Values Committee.
|
HSBC Holdings plc
|
117
|
Report of the Directors
| Risk
Conduct of business
In 2017, we focused on embedding conduct considerations in business-as-usual activity and decision making across the Group, reflecting our values and required behaviours, to deliver fair outcomes for customers and maintain market integrity. During the year, we continued to focus on work relating to potentially vulnerable customers, third parties, digital channels, markets trading surveillance and monitoring and testing. Other key activities in 2017 included:
|
•
|
Ongoing oversight of the breadth, depth and effectiveness of conduct management and governance at country level.
|
|
•
|
Identification and integration of conduct considerations in the enterprise-wide risk management framework and the Group’s planning processes.
|
|
•
|
Expansion of conduct management information to identify actual or potential issues for resolution, in the global functions and HSBC Operations Services and Technology, complementing global business conduct management information.
|
|
•
|
Implementing new conduct-specific global mandatory training modules and an enhanced programme of conduct communications.
|
|
•
|
Enhancing the assessment of conduct in performance appraisal scorecards and remuneration decision-making processes.
|
The Board maintained oversight of conduct matters through the Conduct & Values Committee.
Further detail can be found under the Our conduct section of www.hsbc.com. For conduct-related costs relating to significant items, see page
84
.
Financial crime risk management
Overview
HSBC continued its progress towards implementing an effective financial crime risk management capability across the Group. We completed the roll-out of major compliance systems and shifted our focus towards embedding a sustainable approach to financial crime risk management everywhere we operate. This was underpinned by the implementation of a target operating model for the Financial Crime Risk function and by the completion of a country-by-country assessment against our financial crime risk framework.
Key developments in 2017
During 2017, HSBC continued to increase its efforts to assist with keeping financial crime out of the financial system. We completed the roll-out of compliance systems to support our anti-money laundering and sanctions policies, having invested $1bn in new and upgraded IT systems since 2015.
To ensure we have a clear view of our progress, we completed an assessment of each country in which we operate against the capabilities set out in our financial crime risk framework.
We implemented a new target operating model for the Financial Crime Risk function which puts in place a sustainable structure at a global, regional and country level, and across all lines of business, and continued to build the function’s leadership at the most senior levels.
An engaged and well-trained workforce is crucial and in 2017 we continued to invest significantly in this area. We relaunched and refreshed our global mandatory training for all employees and introduced targeted training for relationship managers and other key roles.
Working in partnership is vital to managing financial crime risk. HSBC is a strong proponent of public-private partnerships and information-sharing initiatives. During 2017 we joined three new partnerships – in Australia, Singapore and Hong Kong – and co-sponsored a major public report into the future of financial intelligence sharing. We also worked with, or invested in, a number of financial technology (‘fintech’) firms to help us continue to strengthen our analytical and innovative approach to financial crime risk management.
Key risk management processes
During 2017, HSBC introduced a strengthened financial crime risk management governance framework, mandating Financial Crime Risk Management Committees with a standardised agenda at country, region and global business line levels.
At a Group level, the Financial System Vulnerabilities Committee continues to report to the Board on matters relating to financial crime, and we introduced new members with significant external expertise in this area. Throughout the year the committee, which is attended by the Group Head of Financial Crime Risk, received regular reports on actions being taken to address issues and vulnerabilities.
We strengthened our approach to affiliate risk management, implementing an effective Group-level process to assess and remediate affiliate risk, and established a strong investigations and analytical capability to enable us to proactively identify emergent risk issues.
The Monitor
Under the agreements entered into with the US Department of Justice (‘DoJ’) and the UK Financial Conduct Authority (‘FCA’) in 2012, including the five-year deferred prosecution agreement (‘AML DPA’) and a Direction issued by the FCA, the Monitor (who is, for FCA purposes, a ‘skilled person’ under section 166 of the Financial Services and Markets Act) was appointed in July 2013 for an expected five-year period to produce annual assessments of the effectiveness of the Group’s AML and sanctions compliance programme. Additionally, under the Cease and Desist Order issued by the US Federal Reserve Board (‘FRB’) in 2012, the Monitor also serves as an independent consultant to conduct annual assessments.
In December 2017, the AML DPA expired and the charges deferred by the AML DPA were dismissed. The Monitor will continue working in his capacity as a skilled person and independent consultant for a period of time at the FCA’s and FRB’s discretion.
In February 2018, the Monitor delivered his fourth annual follow-up review report based on various thematic and country reviews he had conducted during 2017. In his report, the Monitor concluded that, in 2017, HSBC made significant progress in developing a reasonably effective and sustainable AML and sanctions compliance programme and expressed confidence that HSBC can achieve its target end state within the next 18 months if it is able to maintain the concerted effort and focus it has demonstrated in remediating and enhancing its programme over the last five years. Nonetheless, the Monitor identified various challenges that HSBC faces in achieving this objective, noted deficiencies in HSBC’s financial crime compliance controls and areas of HSBC’s programme that require further work, and highlighted potential instances of financial crime and certain areas in which he believes that HSBC is not yet adequately managing financial crime risk. As described on page
282
of note
34
, the Monitor identified potential anti-money laundering and sanctions compliance issues that HSBC is reviewing further with the DoJ, FRB and/or FCA.
Throughout 2017, the FSVC received regular reports on HSBC’s relationship with the Monitor and its compliance with the AML DPA. The FSVC received regular updates on the Monitor’s review activity as part of the fourth annual review, and has received the Monitor’s fourth annual review report.
Insurance manufacturing operations risk management
Details of changes in our insurance manufacturing operations risk profile in 2017 can be found on page
156
, under ‘Insurance manufacturing operations risk profile’.
There were no material changes to our policies and practices for the management of risks arising in our insurance manufacturing operations in 2017.
|
118
|
HSBC Holdings plc
|
Governance
(Audited)
Insurance risks are managed to a defined risk appetite, which is aligned to the Group’s risk appetite and risk management framework, including its three lines of defence model. For details of the Group’s governance framework, see page
106
. The Global Insurance Risk Management Meeting oversees the control framework globally and is accountable to the RBWM Risk Management Meeting on risk matters relating to the insurance business.
The monitoring of the risks within our insurance operations is carried out by insurance risk teams. Specific risk functions, including Wholesale Credit & Market Risk, Operational Risk, Information Security Risk and Financial Crime Risk and Regulatory Compliance support Insurance Risk teams in their respective areas of expertise.
Stress and scenario testing
(Audited)
Stress testing forms a key part of the risk management framework for the insurance business. We participate in local and Group-wide regulatory stress tests, including the Bank of England stress test of the banking system, the Hong Kong Monetary Authority stress test, the European Insurance and Occupational Pensions Authority stress test, and individual country insurance regulatory stress tests.
These have highlighted that a key risk scenario for the insurance business is a prolonged low interest rate environment. In order to mitigate the impact of this scenario, the insurance operations have taken a number of actions including repricing some products to reflect lower interest rates, launching less capital intensive products, investing in more capital efficient assets and developing investment strategies to optimise the expected returns against the cost of economic capital.
Management and mitigation of key risk types
Market risk
(Audited)
All our insurance manufacturing subsidiaries have market risk mandates which specify the investment instruments in which they are permitted to invest and the maximum quantum of market risk which they may retain. They manage market risk by using, among others, some or all of the techniques listed below, depending on the nature of the contracts written:
|
•
|
For products with discretionary participating features (‘DPF’), adjusting bonus rates to manage the liabilities to policyholders. The effect is that a significant portion of the market risk is borne by the policyholder.
|
|
•
|
Asset and liability matching where asset portfolios are structured to support projected liability cash flows. The Group manages its assets using an approach that considers asset quality, diversification, cash flow matching, liquidity, volatility and target investment return. It is not always possible to match asset and liability durations, due to uncertainty over the receipt of all future premiums and the timing of claims; and because the forecast payment dates of liabilities may exceed the duration of the longest dated investments available. We use models to assess the effect of a range of future scenarios on the values of financial assets and associated liabilities, and ALCOs employ the outcomes in determining how best to structure asset holdings to support liabilities.
|
|
•
|
Using derivatives to protect against adverse market movements or better match liability cash flows.
|
|
•
|
For new products with investment guarantees, considering the cost when determining the level of premiums or the price structure.
|
|
•
|
Periodically reviewing products identified as higher risk, which contain investment guarantees and embedded optionality features linked to savings and investment products, for active management.
|
|
•
|
Designing new products to mitigate market risk, such as changing the investment return sharing portion between policyholders and the shareholder.
|
|
•
|
Exiting, to the extent possible, investment portfolios whose risk is considered unacceptable.
|
|
•
|
Repricing premiums charged to policyholders.
|
Credit risk
(Audited)
Our insurance manufacturing subsidiaries are responsible for the credit risk, quality and performance of their investment portfolios. Our assessment of the creditworthiness of issuers and counterparties is based primarily upon internationally recognised credit ratings and other publicly available information.
Investment credit exposures are monitored against limits by our insurance manufacturing subsidiaries, and are aggregated and reported to the Group Insurance Credit Risk and Group Credit Risk functions. Stress testing is performed on investment credit exposures using credit spread sensitivities and default probabilities.
We use tools to manage and monitor credit risk. These include a credit report containing a watch-list of investments with current credit concerns, primarily investments that may be at risk of future impairment or where high concentrations to counterparties are present in the investment portfolio. The report is circulated monthly to senior management in Group Insurance and individual country chief risk officers to identify investments that may be at risk of future impairment.
Liquidity risk
(Audited)
Risk is managed by cash flow matching and maintaining sufficient cash resources, investing in high credit-quality investments with deep and liquid markets, monitoring investment concentrations and restricting them where appropriate, and establishing committed contingency borrowing facilities.
Insurance manufacturing subsidiaries are required to complete quarterly liquidity risk reports for the Group Insurance Risk
function and an annual review of the liquidity risks to which they are exposed.
Insurance risk
HSBC Insurance primarily uses the following techniques to manage and mitigate insurance risk:
|
•
|
formalised product approval process covering product design, pricing and overall proposition management (for example, management of lapses by introducing surrender charges);
|
|
•
|
underwriting policy;
|
|
•
|
claims management processes; and
|
|
•
|
reinsurance which cedes risks above our acceptable thresholds to an external reinsurer thereby limiting our exposure.
|
Reputational risk management
Overview
Reputational risk is the risk of failing to meet stakeholder expectations as a result of any event, behaviour, action or inaction, either by HSBC, our employees or those with whom we are associated. This might cause stakeholders to form a negative view of the Group and result in financial or non-financial effects and loss of confidence in the Group. Stakeholders’ expectations change constantly, and so reputational risk is dynamic and varies between geographical regions, groups and individuals. We have an unwavering commitment to operating at the high standards we set for ourselves in every jurisdiction. Any material lapse in standards of integrity, compliance, customer service or operating efficiency may represent a potential reputational risk.
|
HSBC Holdings plc
|
119
|
Report of the Directors
| Risk
Key developments in 2017
There were no material changes to the policies and practices for the management of reputational risk in 2017, except for the formation of a new Group Reputational Risk Committee which replaced the Group Reputational Risk Policy Committee and the Global Risk Resolution Committee, as described below.
Governance and structure
From December, the development of policies and an effective control environment for the identification, assessment, management and mitigation of reputational risk, are considered by the new Group Reputational Risk Committee (‘GRRC’) which is chaired by the Group Chief Risk Officer. It is the highest decision-making forum in the Group for dealing with matters arising from clients or transactions that either present a serious potential reputational risk to the Group or merit a Group-led decision to ensure a consistent risk management approach across the regions, global businesses and global functions. The committee is responsible for keeping the RMM apprised of areas and activities presenting significant reputational risk and, where appropriate, for making recommendations to the RMM to mitigate such risk.
Prior to December, these responsibilities were split between the Group Reputational Risk Policy Committee and the Global Risk Resolution Committee which were demised to create the GRRC.
Key risk management processes
The Global Communications function maintains policies and gives policy advice for the issues that might affect HSBC’s reputation and standing with customers, employees, opinion formers and the public. It oversees the identification, management and control of reputational risk for all HSBC entities in the areas of media relations and engagement with non-governmental organisations and other external stakeholders.
Our Reputational Risk and Client Selection (‘RRCS’) team, which reports to both the Global Head of Financial Crime Compliance and the Global Head of Regulatory Compliance, oversees the identification, management and control of all other significant reputational risks across the Group. It is responsible for setting policies to guide the Group’s reputational risk management, devising strategies to protect against reputational risk, and advising the global businesses and global functions to help them identify, assess and mitigate such risks, where possible. It is led by a headquarters-based team. This is supported by teams in each business line and region, which help ensure that issues are directed to the appropriate forums, that decisions are made and implemented effectively, and that management information is generated to aid senior management in the businesses and regions in understanding where reputational risk exists. Each global business has established a governance process that empowers the RRCS’s committees to address reputational risk issues at the right level, escalating decisions where appropriate. The global functions manage and escalate reputational risks within established operational risk frameworks.
Our policies set out our risk appetite and operational procedures for all areas of reputational risk, including financial crime prevention, regulatory compliance, conduct-related concerns, environmental impacts, human rights matters and employee relations.
For further details of our financial crime risk management and regulatory compliance risk management, see ‘Financial crime risk management’ on page
118
and ‘Regulatory compliance risk management’ on page
117
respectively.
Further details can be found at www.hsbc.com.
Sustainability risk management
Overview
Assessing the environmental and social impacts of providing finance to our customers is integral to our overall risk management processes.
Key developments in 2017
We periodically review our sustainability risk policies. In 2017, we issued a revised Agricultural Commodities policy, requiring palm oil customers to make further commitments in line with recently enhanced sustainability standards in the industry. We are also currently conducting a review of our Energy Policy.
In 2017, we rolled out a training module for relevant relationship managers globally on our sustainability risk policies and their responsibilities, to ensure consistent implementation. By the end of the year, over 9,000 of our employees had completed this training.
Governance and structure
The Global Risk function is mandated to manage sustainability risk globally, working with the Global Businesses, Global Functions and local offices as appropriate. Sustainability risk managers have regional or national responsibilities for advising on and managing environmental and social risks.
Key risk management processes
The Global Risk function’s responsibilities in relation to sustainability risk include:
|
•
|
Formulating sustainability risk policies. This includes work in several key areas: overseeing our sustainability risk standards; overseeing our application of the Equator Principles, which provide a framework for banks to assess and manage the social and environmental impact of large projects to which they provide financing; overseeing our application of our sustainability policies, covering agricultural commodities, chemicals, defence, energy, forestry, freshwater infrastructure, mining and metals, UNESCO World Heritage Sites and the Ramsar Convention on Wetlands; undertaking independent reviews of transactions where sustainability risks are assessed to be high; and supporting our operating companies to assess similar risks of a lesser magnitude.
|
|
•
|
Building and implementing systems-based processes to help ensure consistent application of policies, reduce the costs of sustainability risk reviews, and capture management information to measure and report on the effect of our lending and investment activities on sustainable development.
|
|
•
|
Providing training and capacity building within our operating companies to ensure sustainability risks are identified and mitigated consistently to appropriate standards.
|
Pension risk management
There were no material changes to our policies and practices for the management of pension risk in 2017.
Governance and structure
A global pension risk framework and accompanying global policies on the management of risks related to defined benefit and defined contribution plans are in place. Pension risk is managed by a network of local and regional pension risk forums. The Global Pensions Oversight Forum is responsible for the governance and oversight of all pension plans sponsored by HSBC around the world.
Key risk management processes
Our global pensions strategy is to move from defined benefit to defined contribution plans, where local law allows and it is considered competitive to do so.
In defined contribution pension plans, the contributions that HSBC is required to make are known, while the ultimate pension benefit will vary, typically with investment returns achieved by investment choices made by the employee. While the market risk to HSBC of defined contribution plans is low, the Group is still exposed to operational and reputational risk.
In defined benefit pension plans, the level of pension benefit is known. Therefore, the level of contributions required by HSBC will vary due to a number of risks, including:
|
•
|
investments delivering a return below that required to provide the projected plan benefits;
|
|
120
|
HSBC Holdings plc
|
|
•
|
the prevailing economic environment leading to corporate failures, thus triggering write-downs in asset values (both equity and debt);
|
|
•
|
a change in either interest rates or inflation expectations, causing an increase in the value of plan liabilities; and
|
|
•
|
plan members living longer than expected (known as longevity risk).
|
Pension risk is assessed using an economic capital model that takes into account potential variations in these factors. The impact of these variations on both pension assets and pension liabilities is assessed using a one-in-200-year stress test. Scenario analysis and other stress tests are also used to support pension risk management.
To fund the benefits associated with defined benefit plans, sponsoring Group companies, and in some instances employees, make regular contributions in accordance with advice from actuaries and in consultation with the plan’s trustees where relevant. These contributions are normally set to ensure that there are sufficient funds to meet the cost of the accruing benefits for the future service of active members. However, higher contributions are required when plan assets are considered insufficient to cover the existing pension liabilities. Contribution rates are typically revised annually or once every three years, depending on the plan.
The defined benefit plans invest contributions in a range of investments designed to limit the risk of assets failing to meet a plan’s liabilities. Any changes in expected returns from the investments may also change future contribution requirements. In pursuit of these long-term objectives, an overall target allocation of the defined benefit plan assets between asset classes is established. In addition, each permitted asset class has its own benchmarks, such as stock-market or property valuation indices. The benchmarks are reviewed at least once every three to five years and more frequently if required by local legislation or circumstances. The process generally involves an extensive asset and liability review.
|
Key developments and risk profile in 2017
|
Key developments in 2017
In 2017, HSBC undertook a number of initiatives to enhance its approach to the management of risk. These included:
|
•
|
Implementing a new operational risk management framework (‘ORMF’) and system of record (known as Helios), as described on page
117
of the ‘Operational risk management’ section.
|
|
•
|
We have completed the introduction of the major compliance IT systems, put in place our AML and sanctions policy framework, and assessed our current financial crime risk management capabilities to identify any gaps and enable integration into our day-to-day operations. All of the actions that we committed to in 2013 as part of the Global Standards programme have been completed or superseded. Further improvements are underway to make our reforms more effective and sustainable.
|
|
•
|
We
continued to take steps to enhance our regulatory compliance risk management and controls, implementing a number of initiatives to raise our standards in relation to the conduct of our business and other regulatory compliance-related initiatives
, as described on page
117
of the ‘Regulatory compliance risk management’ section.
|
|
•
|
The formation of a new Group Reputational Risk Committee which replaced the Group Reputational Risk Policy Committee and the Global Risk Resolution Committee, as described on page
119
under ‘Reputational risk management’.
|
Credit risk in 2017
Credit risk is the risk of financial loss if a customer or counterparty fails to meet an obligation under a contract. It arises principally from direct lending, trade finance and leasing business, but also from other products, such as guarantees and credit derivatives and from holding assets in the form of debt securities. All amounts shown by geographical region or country are based on the location of the principal operations of the lending subsidiary or, in the case of the operations of The Hongkong and Shanghai Banking Corporation, HSBC Bank plc, HSBC Bank Middle East Limited and HSBC Bank USA, by the location of the lending branch.
For details on the adoption of IFRS 9, see Note
1.1(c)
on the Financial Statements.
A summary of our current policies and practices regarding the management of credit risk is provided from page
112
.
Gross loans and advances increased by
$103bn
to
$1,060bn
. This included foreign exchange movements increasing balances by
$48bn
.
Loan impairment charges and other credit provisions (‘LICs’) for the year were
$1.8bn
, which was
$1.6bn
lower than the prior year.
In wholesale lending, balances increased by
$67bn
to
$684bn
. This increase included foreign exchange movements of
$30bn
. Excluding foreign exchange movements, Asia grew strongly with loans and advances increasing by
$34bn
. In North America and Latin America, loans and advances increased by
$2.3bn
in each region, while Europe increased by
$1.8bn
. These increases were offset by a decrease in loans and advances in MENA of
$3.2bn
.
In personal lending, balances increased by $
37
bn to $
376
bn. This increase included foreign exchange movements of $
19
bn. Excluding foreign exchange movements, lending balances increased by $
13
bn in Asia and $
9.0
bn in Europe. Growth was partly offset by a $
3.7
bn fall in North America, due to the final loans sales of $
5.0
bn in our US CML run-off portfolio, which were sold through 2017. MENA and Latin America lending balances were broadly unchanged.
Information on constant currency movements is provided on page
32
.
|
HSBC Holdings plc
|
121
|
Report of the Directors
| Risk
|
Summary of credit risk
|
||||||
|
2017
|
|
2016
|
|
|||
|
$bn
|
|
$bn
|
|
Page
|
|
|
|
At 31 Dec
|
||||||
|
Maximum exposure to credit risk
|
3,030
|
|
2,898
|
|
123
|
|
|
– total assets subject to credit risk
|
2,306
|
|
2,205
|
|
||
|
– off-balance sheet commitments subject to credit risk
|
724
|
|
693
|
|
||
|
Gross loans and advances
|
1,060
|
|
958
|
|
||
|
– personal lending
|
376
|
|
340
|
|
136
|
|
|
– wholesale lending
|
684
|
|
618
|
|
130
|
|
|
Impaired loans
|
15
|
|
18
|
|
126
|
|
|
– personal lending
|
5
|
|
6
|
|
||
|
– wholesale lending
|
10
|
|
12
|
|
||
|
%
|
|
%
|
|
|||
|
Impaired loans as a % of gross loans and advances
|
|
|
||||
|
Personal lending
|
1.3
|
|
1.8
|
|
||
|
Wholesale lending
|
1.5
|
|
1.9
|
|
||
|
Total
|
1.5
|
|
1.9
|
|
||
|
$bn
|
|
$bn
|
|
|||
|
Impairment allowances
|
7.5
|
|
7.9
|
|
130
|
|
|
– personal lending
|
1.7
|
|
2.0
|
|
129
|
|
|
– wholesale lending
|
5.8
|
|
5.9
|
|
131
|
|
|
Loans and advances net of
impairment allowances |
1,053
|
|
950
|
|
||
|
For year ended 31 Dec
|
|
|
||||
|
Loan impairment charge
|
2.0
|
|
3.3
|
|
128
|
|
|
– personal lending
|
1.0
|
|
1.7
|
|
||
|
– wholesale lending
|
1.0
|
|
1.6
|
|
||
|
Other credit risk provisions
|
(0.2
|
)
|
0.1
|
|
||
|
1.8
|
|
3.4
|
|
|||
|
Gross loans to customers and banks over five years ($bn)
|
|
Personal
|
Wholesale
|
||||||

|
Unimpaired
|
Impaired
|
||


|
122
|
HSBC Holdings plc
|
|
Loan impairment allowances over five years ($bn)
|
|
Personal
|
Wholesale
|
||||||

|
–
|
w
|
–
|
Loan impairment allowances as
a percentage of impaired loans
|
Loan impairment allowances ($bn)
|
|
Credit exposure
Maximum exposure to credit risk
(Audited)
The table that follows provides information on balance sheet items, offsets, and loan and other credit-related commitments. Commentary on consolidated balance sheet movements in 2017 is provided on page
48
.
The offset on derivatives remains in line with the movements in maximum exposure amounts.
|
‘Maximum exposure to credit risk’ table
The following table presents our maximum exposure before taking account of any collateral held or other credit enhancements (unless such enhancements meet accounting offsetting requirements). The table excludes financial instruments whose carrying amount best represents the net exposure to credit risk and it excludes equity securities as they are not subject to credit risk. For the financial assets recognised on the balance sheet, the maximum exposure to credit risk equals their carrying amount; for financial guarantees and similar contracts granted, it is the maximum amount that we would have to pay if the guarantees were called upon. For loan commitments and other credit-related commitments, it is generally the full amount of the committed facilities. The offset in the table relates to amounts where there is a legally enforceable right of offset in the event of counterparty default and where, as a result, there is a net exposure for credit risk purposes. However, as there is no intention to settle these balances on a net basis under normal circumstances, they do not qualify for net presentation for accounting purposes. No offset has been applied to off-balance sheet collateral. In the case of derivatives the offset column also includes collateral received in cash and other financial assets. |
Other credit risk mitigants
While not disclosed as an offset in the following ‘Maximum exposure to credit risk’ table, other arrangements are in place which reduce our maximum exposure to credit risk. These include a charge over collateral on borrowers’ specific assets such as residential properties, collateral held in the form of financial instruments that are not held on balance sheet and short positions in securities. In addition, for financial assets held as part of linked insurance/investment contracts the risk is predominantly borne by the policyholder. See Note
29
and pages
226
and
229
on the Financial Statements for further details of collateral in respect of certain loans and advances and derivatives.
|
Maximum exposure to credit risk
|
|||||||||||||
|
(Audited)
|
|||||||||||||
|
2017
|
2016
|
||||||||||||
|
|
Maximum
exposure |
|
Offset
|
|
Net
|
|
Maximum
exposure |
|
Offset
|
|
Net
|
|
|
|
$m
|
|
$m
|
|
$m
|
|
$m
|
|
$m
|
|
$m
|
|
||
|
Derivatives
|
219,818
|
|
(204,829
|
)
|
14,989
|
|
290,872
|
|
(262,233
|
)
|
28,639
|
|
|
|
Loans and advances to customers held at amortised cost
|
962,964
|
|
(35,414
|
)
|
927,550
|
|
861,504
|
|
(33,657
|
)
|
827,847
|
|
|
|
– personal
|
374,762
|
|
(2,946
|
)
|
371,816
|
|
337,826
|
|
(3,629
|
)
|
334,197
|
|
|
|
– corporate and commercial
|
516,754
|
|
(29,459
|
)
|
487,295
|
|
460,209
|
|
(27,686
|
)
|
432,523
|
|
|
|
– non-bank financial institutions
|
71,448
|
|
(3,009
|
)
|
68,439
|
|
63,469
|
|
(2,342
|
)
|
61,127
|
|
|
|
Loans and advances to banks held at amortised cost
|
90,393
|
|
(273
|
)
|
90,120
|
|
88,126
|
|
(248
|
)
|
87,878
|
|
|
|
Reverse repurchase agreements – non-trading
|
201,553
|
|
(3,724
|
)
|
197,829
|
|
160,974
|
|
(4,764
|
)
|
156,210
|
|
|
|
Total balance sheet exposure to credit risk
|
2,305,592
|
|
(244,240
|
)
|
2,061,352
|
|
2,204,751
|
|
(300,902
|
)
|
1,903,849
|
|
|
|
Total off-balance sheet
|
723,917
|
|
—
|
|
723,917
|
|
692,915
|
|
—
|
|
692,915
|
|
|
|
– financial guarantees and similar contracts
|
38,328
|
|
—
|
|
38,328
|
|
37,072
|
|
—
|
|
37,072
|
|
|
|
– loan and other credit-related commitments
|
685,589
|
|
—
|
|
685,589
|
|
655,843
|
|
—
|
|
655,843
|
|
|
|
At 31 Dec
|
3,029,509
|
|
(244,240
|
)
|
2,785,269
|
|
2,897,666
|
|
(300,902
|
)
|
2,596,764
|
|
|
|
HSBC Holdings plc
|
123
|
Report of the Directors
| Risk
Concentration of exposure
The geographical diversification of our lending portfolio, and our broad range of global businesses and products, ensured that we did not overly depend on a few markets or businesses to generate growth in 2017.
For an analysis of:
|
•
|
financial investments, see Note
15
on the Financial Statements;
|
|
•
|
trading assets, see Note
10
on the Financial Statements;
|
|
•
|
derivatives, see page
134
and Note
14
on the Financial Statements; and
|
|
•
|
loans and advances by industry sector and by the location of the principal operations of the lending subsidiary (or, in the case of the operations of The Hongkong and Shanghai Banking Corporation, HSBC Bank plc, HSBC Bank Middle East Limited and HSBC Bank USA, by the location of the lending branch) see page
130
for wholesale lending and page
135
for personal lending.
|
Credit quality of financial instruments
(Audited)
We assess the credit quality of all financial instruments that are subject to credit risk. Additional credit quality information in respect of our consolidated holdings of ABSs is provided on page
140
.
For the purpose of the following disclosure, loans past due up to 90 days and not otherwise classified as impaired are separately classified as past due but not impaired, irrespective of their credit quality grade. Trading assets, financial assets designated at fair value and financial investments exclude equity securities as they are not subject to credit risk.
|
Distribution of financial instruments by credit quality
|
|||||||||||||||||||
|
(Audited)
|
|||||||||||||||||||
|
|
Neither past due nor impaired
|
Past due
but not impaired |
|
Impaired
|
|
Total
gross amount |
|
Impairment
allowances |
|
Total
|
|
||||||||
|
|
Strong
|
|
Good
|
|
Satisfactory
|
|
Sub-
standard |
|
|||||||||||
|
|
$m
|
|
$m
|
|
$m
|
|
$m
|
|
$m
|
|
$m
|
|
$m
|
|
$m
|
|
$m
|
|
|
|
Cash and balances at central banks
|
179,155
|
|
1,043
|
|
407
|
|
19
|
|
|
|
|
|
180,624
|
|
|
|
180,624
|
|
|
|
Items in the course of collection from other banks
|
6,322
|
|
29
|
|
273
|
|
4
|
|
|
|
|
|
6,628
|
|
|
|
6,628
|
|
|
|
Hong Kong Government certificates of indebtedness
|
34,186
|
|
—
|
|
—
|
|
—
|
|
|
|
|
|
34,186
|
|
|
|
34,186
|
|
|
|
Trading assets
|
137,983
|
|
22,365
|
|
26,438
|
|
1,949
|
|
|
|
|
|
188,735
|
|
|
|
188,735
|
|
|
|
– treasury and other eligible bills
|
15,412
|
|
531
|
|
491
|
|
1,098
|
|
|
|
|
|
17,532
|
|
|
|
17,532
|
|
|
|
– debt securities
|
84,493
|
|
9,517
|
|
12,978
|
|
498
|
|
|
|
|
|
107,486
|
|
|
|
107,486
|
|
|
|
– loans and advances to banks
|
15,496
|
|
5,778
|
|
4,757
|
|
26
|
|
|
|
|
|
26,057
|
|
|
|
26,057
|
|
|
|
– loans and advances to customers
|
22,582
|
|
6,539
|
|
8,212
|
|
327
|
|
|
|
|
|
37,660
|
|
|
|
37,660
|
|
|
|
Financial assets designated at fair value
|
3,378
|
|
269
|
|
1,029
|
|
28
|
|
|
|
|
|
4,704
|
|
|
|
4,704
|
|
|
|
Derivatives
|
181,195
|
|
31,827
|
|
5,874
|
|
922
|
|
|
|
|
|
219,818
|
|
|
|
219,818
|
|
|
|
Loans and advances to customers held at amortised cost
|
503,759
|
|
222,343
|
|
204,162
|
|
16,114
|
|
8,600
|
|
15,470
|
|
970,448
|
|
(7,484
|
)
|
962,964
|
|
|
|
– personal
|
324,960
|
|
26,612
|
|
14,549
|
|
780
|
|
4,658
|
|
4,922
|
|
376,481
|
|
(1,719
|
)
|
374,762
|
|
|
|
– corporate and commercial
|
140,382
|
|
176,745
|
|
176,661
|
|
14,784
|
|
3,422
|
|
10,254
|
|
522,248
|
|
(5,494
|
)
|
516,754
|
|
|
|
– non-bank financial institutions
|
38,417
|
|
18,986
|
|
12,952
|
|
550
|
|
520
|
|
294
|
|
71,719
|
|
(271
|
)
|
71,448
|
|
|
|
Loans and advances to banks held at amortised cost
|
77,175
|
|
9,026
|
|
4,144
|
|
39
|
|
9
|
|
—
|
|
90,393
|
|
—
|
|
90,393
|
|
|
|
Reverse repurchase agreements – non-trading
|
143,154
|
|
32,321
|
|
25,636
|
|
442
|
|
—
|
|
—
|
|
201,553
|
|
—
|
|
201,553
|
|
|
|
Financial investments
|
356,065
|
|
10,463
|
|
15,017
|
|
2,886
|
|
—
|
|
728
|
|
385,159
|
|
|
|
385,159
|
|
|
|
Other assets
|
12,714
|
|
6,526
|
|
10,705
|
|
681
|
|
107
|
|
143
|
|
30,876
|
|
(48
|
)
|
30,828
|
|
|
|
– endorsements and acceptances
|
1,430
|
|
4,636
|
|
3,455
|
|
183
|
|
15
|
|
31
|
|
9,750
|
|
|
|
9,750
|
|
|
|
– accrued income and other
|
11,175
|
|
1,837
|
|
7,124
|
|
361
|
|
91
|
|
56
|
|
20,644
|
|
|
|
20,644
|
|
|
|
– assets held for sale
|
109
|
|
53
|
|
126
|
|
137
|
|
1
|
|
56
|
|
482
|
|
(48
|
)
|
434
|
|
|
|
At 31 Dec 2017
|
1,635,086
|
|
336,212
|
|
293,685
|
|
23,084
|
|
8,716
|
|
16,341
|
|
2,313,124
|
|
(7,532
|
)
|
2,305,592
|
|
|
|
|
%
|
|
%
|
|
%
|
|
%
|
|
%
|
|
%
|
|
%
|
|
|
|
|
|
|
|
Percentage of total gross amount
|
70.7
|
|
14.5
|
|
12.7
|
|
1.0
|
|
0.4
|
|
0.7
|
|
100.0
|
|
|
|
|
|
|
|
124
|
HSBC Holdings plc
|
|
Distribution of financial instruments by credit quality (continued)
|
||||||||||||||||||
|
Neither past due nor impaired
|
Past due
but not
impaired
|
|
Impaired
|
|
Total
gross
amount
|
|
Impairment
allowances
|
|
Total
|
|
||||||||
|
Strong
|
|
Good
|
|
Satisfactory
|
|
Sub-
standard
|
|
|||||||||||
|
$m
|
|
$m
|
|
$m
|
|
$m
|
|
$m
|
|
$m
|
|
$m
|
|
$m
|
|
$m
|
|
|
|
Cash and balances at central banks
|
126,838
|
|
711
|
|
444
|
|
16
|
|
|
|
|
|
128,009
|
|
|
|
128,009
|
|
|
Items in the course of collection from other banks
|
4,656
|
|
14
|
|
329
|
|
4
|
|
|
|
|
|
5,003
|
|
|
|
5,003
|
|
|
Hong Kong Government certificates of indebtedness
|
31,228
|
|
—
|
|
—
|
|
—
|
|
|
|
|
|
31,228
|
|
|
|
31,228
|
|
|
Trading assets
|
127,997
|
|
20,345
|
|
21,947
|
|
1,232
|
|
171,521
|
|
171,521
|
|
||||||
|
– treasury and other eligible bills
|
13,595
|
|
672
|
|
138
|
|
46
|
|
14,451
|
|
14,451
|
|
||||||
|
– debt securities
|
73,171
|
|
7,746
|
|
12,741
|
|
396
|
|
94,054
|
|
94,054
|
|
||||||
|
– loans and advances to banks
|
15,356
|
|
6,119
|
|
3,250
|
|
44
|
|
24,769
|
|
24,769
|
|
||||||
|
– loans and advances to customers
|
25,875
|
|
5,808
|
|
5,818
|
|
746
|
|
38,247
|
|
38,247
|
|
||||||
|
Financial assets designated at fair value
|
3,249
|
|
367
|
|
542
|
|
314
|
|
|
|
|
|
4,472
|
|
|
|
4,472
|
|
|
Derivatives
|
236,693
|
|
45,961
|
|
7,368
|
|
850
|
|
|
|
|
|
290,872
|
|
|
|
290,872
|
|
|
Loans and advances to customers
held at amortised cost |
437,531
|
|
200,385
|
|
185,717
|
|
18,831
|
|
8,662
|
|
18,228
|
|
869,354
|
|
(7,850
|
)
|
861,504
|
|
|
– personal
|
290,313
|
|
24,544
|
|
12,505
|
|
884
|
|
5,062
|
|
6,490
|
|
339,798
|
|
(1,972
|
)
|
337,826
|
|
|
– corporate and commercial
|
111,848
|
|
158,878
|
|
163,107
|
|
17,504
|
|
3,128
|
|
11,362
|
|
465,827
|
|
(5,618
|
)
|
460,209
|
|
|
– non-bank financial institutions
|
35,370
|
|
16,963
|
|
10,105
|
|
443
|
|
472
|
|
376
|
|
63,729
|
|
(260
|
)
|
63,469
|
|
|
Loans and advances to banks held at amortised cost
|
73,516
|
|
8,238
|
|
6,293
|
|
73
|
|
6
|
|
—
|
|
88,126
|
|
—
|
|
88,126
|
|
|
Reverse repurchase agreements – non-trading
|
123,822
|
|
18,223
|
|
18,166
|
|
763
|
|
—
|
|
—
|
|
160,974
|
|
—
|
|
160,974
|
|
|
Financial investments
|
401,010
|
|
13,579
|
|
13,570
|
|
2,940
|
|
—
|
|
1,031
|
|
432,130
|
|
|
|
432,130
|
|
|
Other assets
|
12,977
|
|
5,884
|
|
9,619
|
|
1,071
|
|
360
|
|
1,251
|
|
31,162
|
|
(250
|
)
|
30,912
|
|
|
– endorsements and acceptances
|
1,160
|
|
3,688
|
|
3,125
|
|
474
|
|
35
|
|
92
|
|
8,574
|
|
8,574
|
|
||
|
– accrued income and other
|
10,043
|
|
1,660
|
|
6,102
|
|
331
|
|
89
|
|
129
|
|
18,354
|
|
18,354
|
|
||
|
– assets held for sale
|
1,774
|
|
536
|
|
392
|
|
266
|
|
236
|
|
1,030
|
|
4,234
|
|
(250
|
)
|
3,984
|
|
|
At 31 Dec 2016
|
1,579,517
|
|
313,707
|
|
263,995
|
|
26,094
|
|
9,028
|
|
20,510
|
|
2,212,851
|
|
(8,100
|
)
|
2,204,751
|
|
|
%
|
|
%
|
|
%
|
|
%
|
|
%
|
|
%
|
|
%
|
|
|||||
|
Percentage of total gross amount
|
71.4
|
|
14.2
|
|
11.9
|
|
1.2
|
|
0.4
|
|
0.9
|
|
100.0
|
|
||||
Past due but not impaired gross financial instruments
(Audited)
Past due but not impaired gross financial instruments are those loans where, although customers have failed to make payments in accordance with the contractual terms of their facilities, they have not met the impaired loan criteria described on page
126
.
In North America, past due but not impaired balances decreased, mainly due to the final loan sales in our US CML run-off portfolio. Past due but not impaired balances are concentrated in the up to 29 days ageing bucket.
|
Past due but not impaired gross financial instruments by geographical region
|
||||||||||||
|
(Audited)
|
||||||||||||
|
Europe
|
|
Asia
|
|
MENA
|
|
North
America |
|
Latin
America |
|
Total
|
|
|
|
$m
|
|
$m
|
|
$m
|
|
$m
|
|
$m
|
|
$m
|
|
|
|
At 31 Dec 2017
|
1,324
|
|
3,892
|
|
852
|
|
2,015
|
|
633
|
|
8,716
|
|
|
At 31 Dec 2016
|
1,206
|
|
3,484
|
|
1,260
|
|
2,549
|
|
529
|
|
9,028
|
|
|
Ageing analysis of days for past due but not impaired gross financial instruments
|
||||||||||||
|
(Audited)
|
||||||||||||
|
|
Up to 29 days
|
|
30-59
days |
|
60-89
days |
|
90-179
days |
|
180 days
and over |
|
Total
|
|
|
|
$m
|
|
$m
|
|
$m
|
|
$m
|
|
$m
|
|
$m
|
|
|
Loans and advances to customers and banks held at amortised cost
|
6,837
|
|
1,255
|
|
493
|
|
10
|
|
14
|
|
8,609
|
|
|
– personal
|
3,455
|
|
866
|
|
337
|
|
—
|
|
—
|
|
4,658
|
|
|
– corporate and commercial
|
2,899
|
|
343
|
|
156
|
|
10
|
|
14
|
|
3,422
|
|
|
– financial
|
483
|
|
46
|
|
—
|
|
—
|
|
—
|
|
529
|
|
|
Other financial instruments
|
33
|
|
12
|
|
18
|
|
12
|
|
32
|
|
107
|
|
|
At 31 Dec 2017
|
6,870
|
|
1,267
|
|
511
|
|
22
|
|
46
|
|
8,716
|
|
|
Loans and advances to customers and banks held at amortised cost
|
6,743
|
|
1,320
|
|
587
|
|
11
|
|
7
|
|
8,668
|
|
|
– personal
|
3,696
|
|
986
|
|
380
|
|
—
|
|
—
|
|
5,062
|
|
|
– corporate and commercial
|
2,593
|
|
316
|
|
201
|
|
11
|
|
7
|
|
3,128
|
|
|
– financial
|
454
|
|
18
|
|
6
|
|
—
|
|
—
|
|
478
|
|
|
Other financial instruments
|
264
|
|
47
|
|
23
|
|
12
|
|
14
|
|
360
|
|
|
At 31 Dec 2016
|
7,007
|
|
1,367
|
|
610
|
|
23
|
|
21
|
|
9,028
|
|
|
HSBC Holdings plc
|
125
|
Report of the Directors
| Risk
Impaired loans
(Audited)
Impaired loans and advances are those that meet any of the following criteria:
|
•
|
Wholesale loans and advances classified as customer risk rating (‘CRR’) 9 or CRR 10: these grades are assigned when HSBC considers that the customer is either unlikely to pay their credit obligations in full without recourse to security, or is more than 90 days past due on any material credit obligation to HSBC.
|
|
•
|
Retail loans and advances classified as expected loss (‘EL’) 9 or EL 10: these grades are typically assigned to retail loans and
|
advances more than 90 days past due unless they have been individually assessed as not impaired.
|
•
|
Renegotiated loans and advances: loans where we have changed the contractual cash flows due to credit distress of the obligor. Renegotiated loans remain classified as impaired until there is sufficient evidence to demonstrate a significant reduction in the risk of non-payment of future cash flows.
|
In personal lending, the completion of loan sales in our US CML run-off portfolio reduced impaired loan balances by a further $
1.5
bn. The reduction in corporate and commercial balances is a result of fewer significant current year impaired loans together with loan credit grade improvements
, repayments and write-offs.
|
Movement in impaired loans by industry sector
|
||||||||||||||||
|
2017
|
2016
|
|||||||||||||||
|
Personal
|
|
Corporate and commercial
|
|
Financial
|
|
Total
|
|
Personal
|
|
Corporate and commercial
|
|
Financial
|
|
Total
|
|
|
|
$m
|
|
$m
|
|
$m
|
|
$m
|
|
$m
|
|
$m
|
|
$m
|
|
$m
|
|
|
|
At 1 Jan
|
6,490
|
|
11,362
|
|
376
|
|
18,228
|
|
11,507
|
|
11,949
|
|
322
|
|
23,778
|
|
|
Classified as impaired during the year
|
2,671
|
|
3,691
|
|
17
|
|
6,379
|
|
3,521
|
|
6,032
|
|
133
|
|
9,686
|
|
|
Transferred from impaired to unimpaired during
the year |
(677
|
)
|
(1,324
|
)
|
(8
|
)
|
(2,009
|
)
|
(1,210
|
)
|
(922
|
)
|
(7
|
)
|
(2,139
|
)
|
|
Amounts written off
|
(1,330
|
)
|
(1,257
|
)
|
(53
|
)
|
(2,640
|
)
|
(1,252
|
)
|
(1,720
|
)
|
(11
|
)
|
(2,983
|
)
|
|
Net repayments and other
|
(2,232
|
)
|
(2,218
|
)
|
(38
|
)
|
(4,488
|
)
|
(6,076
|
)
|
(3,977
|
)
|
(61
|
)
|
(10,114
|
)
|
|
At 31 Dec
|
4,922
|
|
10,254
|
|
294
|
|
15,470
|
|
6,490
|
|
11,362
|
|
376
|
|
18,228
|
|
|
Impaired loans by industry sector and geographical region
|
||||||||||||
|
Europe
|
|
Asia
|
|
MENA
|
|
North
America |
|
Latin
America |
|
Total
|
|
|
|
$m
|
|
$m
|
|
$m
|
|
$m
|
|
$m
|
|
$m
|
|
|
|
Non-renegotiated impaired loans
|
4,551
|
|
1,645
|
|
870
|
|
1,180
|
|
452
|
|
8,698
|
|
|
– personal
|
1,648
|
|
475
|
|
227
|
|
665
|
|
280
|
|
3,295
|
|
|
– corporate and commercial
|
2,895
|
|
1,146
|
|
639
|
|
508
|
|
172
|
|
5,360
|
|
|
– financial
|
8
|
|
24
|
|
4
|
|
7
|
|
—
|
|
43
|
|
|
Renegotiated impaired loans
|
3,491
|
|
604
|
|
1,079
|
|
1,426
|
|
172
|
|
6,772
|
|
|
– personal
|
381
|
|
125
|
|
120
|
|
958
|
|
43
|
|
1,627
|
|
|
– corporate and commercial
|
2,926
|
|
478
|
|
895
|
|
466
|
|
129
|
|
4,894
|
|
|
– financial
|
184
|
|
1
|
|
64
|
|
2
|
|
—
|
|
251
|
|
|
At 31 Dec 2017
|
8,042
|
|
2,249
|
|
1,949
|
|
2,606
|
|
624
|
|
15,470
|
|
|
Impaired loans % of total gross loans and advances
|
2.0%
|
|
0.5%
|
|
5.4%
|
|
2.2%
|
|
2.6%
|
|
1.5%
|
|
|
Non-renegotiated impaired loans
|
4,354
|
|
1,771
|
|
1,042
|
|
1,913
|
|
399
|
|
9,479
|
|
|
– personal
|
1,239
|
|
453
|
|
459
|
|
1,043
|
|
220
|
|
3,414
|
|
|
– corporate and commercial
|
3,029
|
|
1,291
|
|
582
|
|
865
|
|
179
|
|
5,946
|
|
|
– financial
|
86
|
|
27
|
|
1
|
|
5
|
|
—
|
|
119
|
|
|
Renegotiated impaired loans
|
3,708
|
|
728
|
|
1,188
|
|
2,929
|
|
196
|
|
8,749
|
|
|
– personal
|
648
|
|
113
|
|
72
|
|
2,213
|
|
30
|
|
3,076
|
|
|
– corporate and commercial
|
2,868
|
|
614
|
|
1,052
|
|
716
|
|
166
|
|
5,416
|
|
|
– financial
|
192
|
|
1
|
|
64
|
|
—
|
|
—
|
|
257
|
|
|
At 31 Dec 2016
|
8,062
|
|
2,499
|
|
2,230
|
|
4,842
|
|
595
|
|
18,228
|
|
|
Impaired loans % of total gross loans and advances
|
2.3%
|
|
0.6%
|
|
5.5%
|
|
4.1%
|
|
2.9%
|
|
1.9%
|
|
|
Currency translation adjustment
|
855
|
|
72
|
|
(25
|
)
|
37
|
|
20
|
|
959
|
|
|
31 Dec 2016 at 31 Dec 2017 exchange rates
|
8,917
|
|
2,571
|
|
2,205
|
|
4,879
|
|
615
|
|
19,187
|
|
|
Movement – constant currency basis
|
(875
|
)
|
(322
|
)
|
(256
|
)
|
(2,273
|
)
|
9
|
|
(3,717
|
)
|
|
31 Dec 2017 as reported
|
8,042
|
|
2,249
|
|
1,949
|
|
2,606
|
|
624
|
|
15,470
|
|
|
126
|
HSBC Holdings plc
|
Renegotiated loans and forbearance
The following tables show the gross carrying amounts of the Group’s holdings of renegotiated loans and advances to customers by industry sector, geographical region, credit quality classification and arrangement type.
The completion of loan sales in our US CML run-off portfolio reduced renegotiated loans by $
2.0
bn during 2017.
|
Renegotiated loans and advances to customers by industry sector
|
||||||||||
|
First lien residential mortgages
|
|
Other personal lending
|
|
Corporate and commercial
|
|
Non-bank financial institutions
|
|
Total
|
|
|
|
$m
|
|
$m
|
|
$m
|
|
$m
|
|
$m
|
|
|
|
Neither past due nor impaired
|
476
|
|
268
|
|
2,082
|
|
257
|
|
3,083
|
|
|
Past due but not impaired
|
58
|
|
49
|
|
120
|
|
—
|
|
227
|
|
|
Impaired
|
1,329
|
|
298
|
|
4,894
|
|
251
|
|
6,772
|
|
|
At 31 Dec 2017
|
1,863
|
|
615
|
|
7,096
|
|
508
|
|
10,082
|
|
|
Impairment allowances on renegotiated loans
|
165
|
|
127
|
|
1,584
|
|
151
|
|
2,027
|
|
|
Neither past due nor impaired
|
976
|
|
282
|
|
1,848
|
|
260
|
|
3,366
|
|
|
Past due but not impaired
|
346
|
|
78
|
|
301
|
|
—
|
|
725
|
|
|
Impaired
|
2,751
|
|
325
|
|
5,416
|
|
257
|
|
8,749
|
|
|
At 31 Dec 2016
|
4,073
|
|
685
|
|
7,565
|
|
517
|
|
12,840
|
|
|
Impairment allowances on renegotiated loans
|
267
|
|
150
|
|
1,667
|
|
130
|
|
2,214
|
|
|
Renegotiated loans and advances to customers by geographical region
|
||||||||||||
|
Europe
|
|
Asia
|
|
MENA
|
|
North America
|
|
Latin
America |
|
Total
|
|
|
|
$m
|
|
$m
|
|
$m
|
|
$m
|
|
$m
|
|
$m
|
|
|
|
At 31 Dec 2017
|
5,667
|
|
921
|
|
1,622
|
|
1,604
|
|
268
|
|
10,082
|
|
|
At 31 Dec 2016
|
5,855
|
|
1,046
|
|
1,871
|
|
3,736
|
|
332
|
|
12,840
|
|
A range of forbearance strategies are employed in order to improve the management of customer relationships, maximise collection opportunities and, if possible, avoid default, foreclosure or repossession.
The following tables show renegotiated loans by arrangement type as a percentage of the total value of arrangements offered. In personal lending, renegotiated loans have been allocated to the single most dominant arrangement type.
The movements in personal lending arrangement types in 2017 are mainly driven by the loan sales in our US CML run-off portfolio.
|
Renegotiated loans by arrangement type: personal lending
|
||
|
2017
|
2016
|
|
|
%
|
%
|
|
|
Interest rate and terms modifications
|
42.6
|
21.9
|
|
Payment concessions
|
15.8
|
14.3
|
|
Collection re-age
|
2.1
|
19.2
|
|
Modification re-age
|
24.0
|
34.6
|
|
Other
|
15.5
|
10.0
|
|
At 31 Dec 2017
|
100.0
|
100.0
|
Corporate renegotiated loans often require the granting of more than one arrangement type as part of an effective strategy. The percentages reported in the table below include the effect of loans being reported in more than one arrangement type.
|
Renegotiated loans by arrangement type: corporate and commercial, and financial
|
||
|
2017
|
2016
|
|
|
%
|
%
|
|
|
Maturity term extensions
|
35.8
|
37.3
|
|
Reductions in margin, principal forgiveness, debt equity swaps and interest, fees or penalty payment forgiveness
|
23.8
|
21.4
|
|
Other changes to repayment profile
|
17.7
|
19.4
|
|
Interest only conversion
|
9.0
|
9.3
|
|
Other
|
13.7
|
12.6
|
|
At 31 Dec 2017
|
100.0
|
100.0
|
|
HSBC Holdings plc
|
127
|
Report of the Directors
| Risk
Impairment of loans and advances
(Audited)
For an analysis of LICs by global business, see page
40
.
The tables below analyse the loan impairment charges for the year by industry sector for impaired loans and advances that are either
individually or collectively assessed, and for collective impairment allowances on loans and advances that are classified as not impaired.
|
Loan impairment charge to the income statement by industry sector
|
|||||||||||||
|
Europe
|
|
Asia
|
|
MENA
|
|
North
America
|
|
Latin
America
|
|
Total
|
|
||
|
Footnote
|
$m
|
|
$m
|
|
$m
|
|
$m
|
|
$m
|
|
$m
|
|
|
|
Personal
|
140
|
|
243
|
|
92
|
|
32
|
|
452
|
|
959
|
|
|
|
– first lien residential mortgages
|
6
|
|
(1
|
)
|
5
|
|
—
|
|
(27
|
)
|
(17
|
)
|
|
|
– other personal
|
134
|
|
244
|
|
87
|
|
32
|
|
479
|
|
976
|
|
|
|
Corporate and commercial
|
619
|
|
298
|
|
83
|
|
(163
|
)
|
90
|
|
927
|
|
|
|
– manufacturing and international trade and services
|
314
|
|
236
|
|
95
|
|
18
|
|
59
|
|
722
|
|
|
|
– commercial real estate and other property-related
|
200
|
|
21
|
|
(4
|
)
|
9
|
|
—
|
|
226
|
|
|
|
– other commercial
|
105
|
|
41
|
|
(8
|
)
|
(190
|
)
|
31
|
|
(21
|
)
|
|
|
Financial
|
66
|
|
17
|
|
22
|
|
1
|
|
—
|
|
106
|
|
|
|
At 31 Dec 2017
|
825
|
|
558
|
|
197
|
|
(130
|
)
|
542
|
|
1,992
|
|
|
|
Personal
|
162
|
|
264
|
|
226
|
|
219
|
|
832
|
|
1,703
|
|
|
|
– first lien residential mortgages
|
1
|
|
(1
|
)
|
10
|
|
149
|
|
7
|
|
166
|
|
|
|
– other personal
|
161
|
|
265
|
|
216
|
|
70
|
|
825
|
|
1,537
|
|
|
|
Corporate and commercial
|
337
|
|
388
|
|
53
|
|
500
|
|
330
|
|
1,608
|
|
|
|
– manufacturing and international trade and services
|
38
|
|
306
|
|
105
|
|
81
|
|
195
|
|
725
|
|
|
|
– commercial real estate and other property-related
|
(15
|
)
|
(28
|
)
|
(16
|
)
|
3
|
|
25
|
|
(31
|
)
|
|
|
– other commercial
|
314
|
|
110
|
|
(36
|
)
|
416
|
|
110
|
|
914
|
|
|
|
Financial
|
34
|
|
2
|
|
13
|
|
(10
|
)
|
—
|
|
39
|
|
|
|
At 31 Dec 2016
|
45
|
533
|
|
654
|
|
292
|
|
709
|
|
1,162
|
|
3,350
|
|
For footnote, see page
161
.
|
Charge for impairment losses as a percentage of average gross loans and advances to customers by geographical region
|
||||||||||||
|
|
Europe
|
|
Asia
|
|
MENA
|
|
North
America |
|
Latin
America |
|
Total
|
|
|
|
%
|
|
%
|
|
%
|
|
%
|
|
%
|
|
%
|
|
|
New allowances net of allowance releases
|
0.33
|
|
0.17
|
|
0.79
|
|
(0.05
|
)
|
3.20
|
|
0.29
|
|
|
Recoveries
|
(0.09
|
)
|
(0.03
|
)
|
(0.14
|
)
|
(0.07
|
)
|
(0.41
|
)
|
(0.07
|
)
|
|
At 31 Dec 2017
|
0.24
|
|
0.14
|
|
0.65
|
|
(0.12
|
)
|
2.79
|
|
0.22
|
|
|
Amount written off net of recoveries
|
0.23
|
|
0.13
|
|
1.35
|
|
0.28
|
|
2.42
|
|
0.28
|
|
|
New allowances net of allowance releases
|
0.23
|
|
0.23
|
|
0.93
|
|
0.62
|
|
7.02
|
|
0.46
|
|
|
Recoveries
|
(0.08
|
)
|
(0.04
|
)
|
(0.13
|
)
|
(0.06
|
)
|
(0.56
|
)
|
(0.07
|
)
|
|
At 31 Dec 2016
|
0.15
|
|
0.19
|
|
0.80
|
|
0.56
|
|
6.46
|
|
0.39
|
|
|
Amount written off net of recoveries
|
0.26
|
|
0.14
|
|
0.84
|
|
0.48
|
|
2.99
|
|
0.32
|
|
|
128
|
HSBC Holdings plc
|
|
Movement in impairment allowances by industry sector and by geographical region
|
||||||||||||
|
Europe
|
|
Asia
|
|
MENA
|
|
North
America |
|
Latin
America |
|
Total
|
|
|
|
$m
|
|
$m
|
|
$m
|
|
$m
|
|
$m
|
|
$m
|
|
|
|
At 1 Jan 2017
|
2,789
|
|
1,635
|
|
1,681
|
|
1,272
|
|
473
|
|
7,850
|
|
|
Amounts written off
|
|
|
|
|
|
|
|
|
|
|
|
|
|
Personal
|
(438
|
)
|
(366
|
)
|
(329
|
)
|
(100
|
)
|
(487
|
)
|
(1,720
|
)
|
|
– first lien residential mortgages
|
(8
|
)
|
(6
|
)
|
(42
|
)
|
(26
|
)
|
(9
|
)
|
(91
|
)
|
|
– other personal
|
(430
|
)
|
(360
|
)
|
(287
|
)
|
(74
|
)
|
(478
|
)
|
(1,629
|
)
|
|
Corporate and commercial
|
(648
|
)
|
(273
|
)
|
(119
|
)
|
(273
|
)
|
(63
|
)
|
(1,376
|
)
|
|
– manufacturing and international trade and services
|
(318
|
)
|
(250
|
)
|
(74
|
)
|
(44
|
)
|
(18
|
)
|
(704
|
)
|
|
– commercial real estate and other property-related
|
(121
|
)
|
(10
|
)
|
(37
|
)
|
(20
|
)
|
(4
|
)
|
(192
|
)
|
|
– other commercial
|
(209
|
)
|
(13
|
)
|
(8
|
)
|
(209
|
)
|
(41
|
)
|
(480
|
)
|
|
Financial
|
(74
|
)
|
(1
|
)
|
—
|
|
(2
|
)
|
—
|
|
(77
|
)
|
|
Total amounts written off
|
(1,160
|
)
|
(640
|
)
|
(448
|
)
|
(375
|
)
|
(550
|
)
|
(3,173
|
)
|
|
Recoveries of amounts written off in previous years
|
|
|
|
|
|
|
|
|
|
|
|
|
|
Personal
|
296
|
|
104
|
|
39
|
|
38
|
|
68
|
|
545
|
|
|
– first lien residential mortgages
|
9
|
|
4
|
|
—
|
|
17
|
|
25
|
|
55
|
|
|
– other personal
|
287
|
|
100
|
|
39
|
|
21
|
|
43
|
|
490
|
|
|
Corporate and commercial
|
35
|
|
10
|
|
2
|
|
37
|
|
13
|
|
97
|
|
|
– manufacturing and international trade and services
|
10
|
|
9
|
|
1
|
|
11
|
|
3
|
|
34
|
|
|
– commercial real estate and other property-related
|
8
|
|
—
|
|
1
|
|
1
|
|
—
|
|
10
|
|
|
– other commercial
|
17
|
|
1
|
|
—
|
|
25
|
|
10
|
|
53
|
|
|
Financial
|
2
|
|
—
|
|
—
|
|
—
|
|
—
|
|
2
|
|
|
Total recoveries of amounts written off in previous years
|
333
|
|
114
|
|
41
|
|
75
|
|
81
|
|
644
|
|
|
Charge to income statement
|
825
|
|
558
|
|
197
|
|
(130
|
)
|
542
|
|
1,992
|
|
|
Exchange and other movements
|
274
|
|
5
|
|
(10
|
)
|
(51
|
)
|
(47
|
)
|
171
|
|
|
At 31 Dec 2017
|
3,061
|
|
1,672
|
|
1,461
|
|
791
|
|
499
|
|
7,484
|
|
|
Impairment allowances against banks:
|
|
|
|
|
|
|
|
|
|
|
|
|
|
– individually assessed
|
—
|
|
—
|
|
—
|
|
—
|
|
—
|
|
—
|
|
|
Impairment allowances against customers:
|
|
|
|
|
|
|
|
|
|
|
|
|
|
– individually assessed
|
2,296
|
|
1,056
|
|
1,104
|
|
383
|
|
121
|
|
4,960
|
|
|
– collectively assessed
|
765
|
|
616
|
|
357
|
|
408
|
|
378
|
|
2,524
|
|
|
Impairment allowances at 31 Dec 2017
|
3,061
|
|
1,672
|
|
1,461
|
|
791
|
|
499
|
|
7,484
|
|
|
At 1 Jan 2016
|
3,477
|
|
1,525
|
|
1,810
|
|
2,041
|
|
720
|
|
9,573
|
|
|
Amounts written off
|
|
|
|
|
|
|
|
|
|
|
|
|
|
Personal
|
(412
|
)
|
(358
|
)
|
(208
|
)
|
(284
|
)
|
(340
|
)
|
(1,602
|
)
|
|
– first lien residential mortgages
|
(10
|
)
|
(6
|
)
|
(3
|
)
|
(142
|
)
|
(12
|
)
|
(173
|
)
|
|
– other personal
|
(402
|
)
|
(352
|
)
|
(205
|
)
|
(142
|
)
|
(328
|
)
|
(1,429
|
)
|
|
Corporate and commercial
|
(730
|
)
|
(285
|
)
|
(137
|
)
|
(381
|
)
|
(297
|
)
|
(1,830
|
)
|
|
– manufacturing and international trade and services
|
(380
|
)
|
(172
|
)
|
(78
|
)
|
(125
|
)
|
(10
|
)
|
(765
|
)
|
|
– commercial real estate and other property-related
|
(109
|
)
|
(31
|
)
|
(54
|
)
|
(35
|
)
|
(223
|
)
|
(452
|
)
|
|
– other commercial
|
(241
|
)
|
(82
|
)
|
(5
|
)
|
(221
|
)
|
(64
|
)
|
(613
|
)
|
|
Financial
|
(1
|
)
|
(5
|
)
|
(18
|
)
|
—
|
|
—
|
|
(24
|
)
|
|
Total amounts written off
|
(1,143
|
)
|
(648
|
)
|
(363
|
)
|
(665
|
)
|
(637
|
)
|
(3,456
|
)
|
|
Recoveries of amounts written off in previous years
|
|
|
|
|
|
|
|
|
|
|
|
|
|
Personal
|
225
|
|
124
|
|
34
|
|
54
|
|
78
|
|
515
|
|
|
– first lien residential mortgages
|
3
|
|
4
|
|
—
|
|
26
|
|
8
|
|
41
|
|
|
– other persona
l
|
222
|
|
120
|
|
34
|
|
28
|
|
70
|
|
474
|
|
|
Corporate and commercial
|
35
|
|
24
|
|
10
|
|
18
|
|
22
|
|
109
|
|
|
– manufacturing and international trade and services
|
15
|
|
23
|
|
5
|
|
9
|
|
16
|
|
68
|
|
|
– commercial real estate and other property-related
|
9
|
|
—
|
|
—
|
|
2
|
|
—
|
|
11
|
|
|
– other commercial
|
11
|
|
1
|
|
5
|
|
7
|
|
6
|
|
30
|
|
|
Financial
|
1
|
|
1
|
|
—
|
|
1
|
|
—
|
|
3
|
|
|
Total recoveries of amounts written off in previous years
|
261
|
|
149
|
|
44
|
|
73
|
|
100
|
|
627
|
|
|
Charge to income statement
|
533
|
|
654
|
|
292
|
|
709
|
|
1,162
|
|
3,350
|
|
|
Exchange and other movements
|
(339
|
)
|
(45
|
)
|
(102
|
)
|
(886
|
)
|
(872
|
)
|
(2,244
|
)
|
|
At 31 Dec 2016
|
2,789
|
|
1,635
|
|
1,681
|
|
1,272
|
|
473
|
|
7,850
|
|
|
Impairment allowances against banks:
|
|
|
|
|
|
|
|
|
|
|
|
|
|
– individually assessed
|
—
|
|
—
|
|
—
|
|
—
|
|
—
|
|
—
|
|
|
Impairment allowances against customers:
|
|
|
|
|
|
|
|
|
|
|
|
|
|
– individually assessed
|
2,060
|
|
1,038
|
|
1,137
|
|
540
|
|
157
|
|
4,932
|
|
|
– collectively assessed
|
729
|
|
597
|
|
544
|
|
732
|
|
316
|
|
2,918
|
|
|
Impairment allowances at 31 Dec 2016
|
2,789
|
|
1,635
|
|
1,681
|
|
1,272
|
|
473
|
|
7,850
|
|
|
HSBC Holdings plc
|
129
|
Report of the Directors
| Risk
|
Movement in impairment allowances on loans and advances to customers and banks
|
||||||||||||||||
|
(Audited)
|
||||||||||||||||
|
2017
|
2016
|
|||||||||||||||
|
Banks
individually
assessed
|
|
Customers
|
Banks
individually
assessed
|
|
Customers
|
|||||||||||
|
Individually
assessed
|
|
Collectively
assessed
|
|
Total
|
|
Individually
assessed
|
|
Collectively
assessed
|
|
Total
|
|
|||||
|
$m
|
|
$m
|
|
$m
|
|
$m
|
|
$m
|
|
$m
|
|
$m
|
|
$m
|
|
|
|
At 1 Jan
|
—
|
|
4,932
|
|
2,918
|
|
7,850
|
|
18
|
|
5,402
|
|
4,153
|
|
9,573
|
|
|
Amounts written off
|
—
|
|
(1,468
|
)
|
(1,705
|
)
|
(3,173
|
)
|
(18
|
)
|
(1,831
|
)
|
(1,607
|
)
|
(3,456
|
)
|
|
Recoveries of loans and advances previously written off
|
—
|
|
119
|
|
525
|
|
644
|
|
—
|
|
107
|
|
520
|
|
627
|
|
|
Charge to income statement
|
—
|
|
1,114
|
|
878
|
|
1,992
|
|
—
|
|
1,831
|
|
1,519
|
|
3,350
|
|
|
Exchange and other movements
|
—
|
|
263
|
|
(92
|
)
|
171
|
|
—
|
|
(577
|
)
|
(1,667
|
)
|
(2,244
|
)
|
|
At 31 Dec
|
—
|
|
4,960
|
|
2,524
|
|
7,484
|
|
—
|
|
4,932
|
|
2,918
|
|
7,850
|
|
|
Impairment allowances % of loans and advances
|
—
|
|
0.5%
|
|
0.3%
|
|
0.8%
|
|
—
|
|
0.6%
|
|
0.3%
|
|
0.8%
|
|
Wholesale lending
Total wholesale lending balances
increased
by
$67bn
with foreign exchange differences accounting for
$30bn
of the increase.
While the tables are presented on a reported basis, the commentary that follows is on a constant currency basis.
In Asia, particularly within Hong Kong, lending balances
increased
by
$34bn
. In this region, demand for lending increased across most industry sectors with notable growth in commercial real estate and property-related lending of
$15bn
and international trade services of
$10bn
.
In Europe, overall lending increased by
$1.8bn
owing to decreased lending in the UK of
$2.8bn
being offset by increased lending in the rest of Europe, mainly in France and Germany.
In North America, lending
increased
by
$2.3bn
in the US and Canada. The US bank loans increased by
$5.8bn
largely due to excess liquidity placement. This was mostly offset by decreased US corporate and commercial lending of
$5.1bn
as paydowns and maturities exceeded new loan originations owing to our continued efforts to improve returns.
In MENA, overall lending fell by
$3.2bn
, mainly within the UAE owing to a combination of large run-offs and repayments together with the exiting of some customer relationships.
In Latin America, lending increased by
$2.3bn
largely in Mexico.
|
Total wholesale lending gross loans
|
|||||||||||||
|
|
Europe
|
|
Asia
|
|
MENA
|
|
North
America |
|
Latin
America |
|
Total
|
|
Total as a % of total gross loans
|
|
|
$m
|
|
$m
|
|
$m
|
|
$m
|
|
$m
|
|
$m
|
|
%
|
|
Corporate and commercial
|
182,501
|
|
250,950
|
|
21,533
|
|
54,915
|
|
12,349
|
|
522,248
|
|
49.2
|
|
– manufacturing
|
29,098
|
|
32,275
|
|
2,836
|
|
14,503
|
|
3,145
|
|
81,857
|
|
7.7
|
|
– international trade and services
|
65,149
|
|
84,340
|
|
10,130
|
|
10,272
|
|
3,336
|
|
173,227
|
|
16.3
|
|
– commercial real estate
|
25,956
|
|
40,246
|
|
687
|
|
8,917
|
|
1,506
|
|
77,312
|
|
7.3
|
|
– other property-related
|
7,982
|
|
46,164
|
|
1,821
|
|
7,999
|
|
369
|
|
64,335
|
|
6.1
|
|
– government
|
3,619
|
|
5,767
|
|
1,366
|
|
406
|
|
570
|
|
11,728
|
|
1.1
|
|
– other commercial
|
50,697
|
|
42,158
|
|
4,693
|
|
12,818
|
|
3,423
|
|
113,789
|
|
10.7
|
|
Financial
|
46,274
|
|
81,730
|
|
7,609
|
|
21,746
|
|
4,753
|
|
162,112
|
|
15.3
|
|
– non-bank financial institutions
|
32,093
|
|
26,311
|
|
1,107
|
|
10,926
|
|
1,282
|
|
71,719
|
|
6.8
|
|
– banks
|
14,181
|
|
55,419
|
|
6,502
|
|
10,820
|
|
3,471
|
|
90,393
|
|
8.5
|
|
Gross loans at 31 Dec 2017
|
228,775
|
|
332,680
|
|
29,142
|
|
76,661
|
|
17,102
|
|
684,360
|
|
64.5
|
|
Loan and other credit-related commitments
|
143,015
|
|
195,396
|
|
17,935
|
|
123,267
|
|
11,666
|
|
491,279
|
|
|
|
– corporate and commercial
|
123,972
|
|
179,302
|
|
17,390
|
|
102,666
|
|
10,795
|
|
434,125
|
|
|
|
– financial
|
19,043
|
|
16,094
|
|
545
|
|
20,601
|
|
871
|
|
57,154
|
|
|
|
|
|
|
|
|
|
|
|
|
|
|
|
|
|
|
Corporate and commercial
|
161,653
|
|
212,848
|
|
22,078
|
|
58,276
|
|
10,972
|
|
465,827
|
|
48.6
|
|
– manufacturing
|
27,005
|
|
32,564
|
|
2,941
|
|
15,348
|
|
2,785
|
|
80,643
|
|
8.4
|
|
– international trade and services
|
55,875
|
|
72,166
|
|
8,448
|
|
11,035
|
|
2,518
|
|
150,042
|
|
15.6
|
|
– commercial real estate
|
21,460
|
|
32,798
|
|
724
|
|
7,849
|
|
1,340
|
|
64,171
|
|
6.7
|
|
– other property-related
|
7,025
|
|
37,628
|
|
1,856
|
|
8,823
|
|
306
|
|
55,638
|
|
5.8
|
|
– government
|
3,009
|
|
2,919
|
|
1,619
|
|
354
|
|
541
|
|
8,442
|
|
0.9
|
|
– other commercial
|
47,279
|
|
34,773
|
|
6,490
|
|
14,867
|
|
3,482
|
|
106,891
|
|
11.2
|
|
Financial
|
43,666
|
|
79,254
|
|
10,370
|
|
14,823
|
|
3,742
|
|
151,855
|
|
15.9
|
|
– non-bank financial institutions
|
31,307
|
|
19,517
|
|
2,599
|
|
9,750
|
|
556
|
|
63,729
|
|
6.7
|
|
– banks
|
12,359
|
|
59,737
|
|
7,771
|
|
5,073
|
|
3,186
|
|
88,126
|
|
9.2
|
|
Gross loans at 31 Dec 2016
|
205,319
|
|
292,102
|
|
32,448
|
|
73,099
|
|
14,714
|
|
617,682
|
|
64.5
|
|
|
|
|
|
|
|
|
|
|
|
|
|
|
|
|
Currency translation adjustment
|
21,696
|
|
6,604
|
|
(84
|
)
|
1,297
|
|
40
|
|
29,553
|
|
|
|
31 Dec 2016 at 31 Dec 2017 exchange rates
|
227,015
|
|
298,706
|
|
32,364
|
|
74,396
|
|
14,754
|
|
647,235
|
|
|
|
Movement – constant currency basis
|
1,760
|
|
33,974
|
|
(3,222
|
)
|
2,265
|
|
2,348
|
|
37,125
|
|
|
|
31 Dec 2017 as reported
|
228,775
|
|
332,680
|
|
29,142
|
|
76,661
|
|
17,102
|
|
684,360
|
|
|
|
Loan and other credit-related commitments
|
135,394
|
|
183,508
|
|
18,562
|
|
124,720
|
|
9,849
|
|
472,033
|
|
|
|
– corporate and commercial
|
112,229
|
|
167,298
|
|
18,474
|
|
96,301
|
|
9,174
|
|
403,476
|
|
|
|
– financial
|
23,165
|
|
16,210
|
|
88
|
|
28,419
|
|
675
|
|
68,557
|
|
|
|
130
|
HSBC Holdings plc
|
|
Total wholesale lending impairment allowances
|
||||||||||||
|
|
Europe
|
|
Asia
|
|
MENA
|
|
North America
|
|
Latin
America |
|
Total
|
|
|
|
$m
|
|
$m
|
|
$m
|
|
$m
|
|
$m
|
|
$m
|
|
|
Corporate and commercial
|
2,286
|
|
1,375
|
|
1,092
|
|
557
|
|
184
|
|
5,494
|
|
|
– manufacturing
|
332
|
|
372
|
|
188
|
|
114
|
|
70
|
|
1,076
|
|
|
– international trade and services
|
671
|
|
612
|
|
480
|
|
101
|
|
35
|
|
1,899
|
|
|
– commercial real estate
|
362
|
|
10
|
|
142
|
|
75
|
|
—
|
|
589
|
|
|
– other property-related
|
347
|
|
44
|
|
161
|
|
41
|
|
42
|
|
635
|
|
|
– government
|
3
|
|
—
|
|
6
|
|
—
|
|
—
|
|
9
|
|
|
– other commercial
|
571
|
|
337
|
|
115
|
|
226
|
|
37
|
|
1,286
|
|
|
Financial
|
183
|
|
27
|
|
39
|
|
22
|
|
—
|
|
271
|
|
|
– non-bank financial institutions
|
183
|
|
27
|
|
39
|
|
22
|
|
—
|
|
271
|
|
|
– banks
|
—
|
|
—
|
|
—
|
|
—
|
|
—
|
|
—
|
|
|
Impairment allowances at 31 Dec 2017
|
2,469
|
|
1,402
|
|
1,131
|
|
579
|
|
184
|
|
5,765
|
|
|
Impairment allowances % of impaired loans
|
41.1%
|
|
85.0%
|
|
70.6%
|
|
58.9%
|
|
61.1%
|
|
54.7%
|
|
|
|
|
|
|
|
|
|
|
|
|
|
|
|
|
Corporate and commercial
|
2,048
|
|
1,343
|
|
1,137
|
|
880
|
|
210
|
|
5,618
|
|
|
– manufacturing
|
411
|
|
342
|
|
174
|
|
139
|
|
38
|
|
1,104
|
|
|
– international trade and services
|
473
|
|
647
|
|
476
|
|
81
|
|
35
|
|
1,712
|
|
|
– commercial real estate
|
402
|
|
11
|
|
144
|
|
67
|
|
36
|
|
660
|
|
|
– other property-related
|
167
|
|
34
|
|
202
|
|
37
|
|
55
|
|
495
|
|
|
– government
|
2
|
|
—
|
|
1
|
|
—
|
|
1
|
|
4
|
|
|
– other commercial
|
593
|
|
309
|
|
140
|
|
556
|
|
45
|
|
1,643
|
|
|
Financial
|
216
|
|
9
|
|
15
|
|
20
|
|
—
|
|
260
|
|
|
– non-bank financial institutions
|
216
|
|
9
|
|
15
|
|
20
|
|
—
|
|
260
|
|
|
– banks
|
—
|
|
—
|
|
—
|
|
—
|
|
—
|
|
—
|
|
|
Impairment allowances at 31 Dec 2016
|
2,264
|
|
1,352
|
|
1,152
|
|
900
|
|
210
|
|
5,878
|
|
|
Impairment allowances % of impaired loans
|
36.7%
|
|
69.9%
|
|
67.8%
|
|
56.7%
|
|
60.9%
|
|
50.0%
|
|
|
|
|
|
|
|
|
|
|
|
|
|
|
|
|
Currency translation adjustment
|
260
|
|
33
|
|
(5
|
)
|
19
|
|
9
|
|
316
|
|
|
31 Dec 2016 at 31 Dec 2017 exchange rates
|
2,524
|
|
1,385
|
|
1,147
|
|
919
|
|
219
|
|
6,194
|
|
|
Movement – on constant currency basis
|
(55
|
)
|
17
|
|
(16
|
)
|
(340
|
)
|
(35
|
)
|
(429
|
)
|
|
31 Dec 2017 as reported
|
2,469
|
|
1,402
|
|
1,131
|
|
579
|
|
184
|
|
5,765
|
|
Commercial real estate
|
Commercial real estate lending
|
||||||||||||||||
|
|
Europe
|
|
Asia
|
|
MENA
|
|
North America
|
|
Latin America
|
|
Total
|
|
UK
|
|
Hong Kong
|
|
|
|
$m
|
|
$m
|
|
$m
|
|
$m
|
|
$m
|
|
$m
|
|
$m
|
|
$m
|
|
|
Gross loans and advances
|
|
|
|
|
|
|
|
|
|
|
|
|
|
|
|
|
|
Neither past due nor impaired
|
24,822
|
|
40,175
|
|
500
|
|
8,637
|
|
1,407
|
|
75,541
|
|
18,361
|
|
31,325
|
|
|
Past due but not impaired
|
56
|
|
55
|
|
5
|
|
197
|
|
34
|
|
347
|
|
2
|
|
49
|
|
|
Impaired loans
|
1,078
|
|
16
|
|
182
|
|
83
|
|
65
|
|
1,424
|
|
895
|
|
11
|
|
|
At Dec 2017
|
25,956
|
|
40,246
|
|
687
|
|
8,917
|
|
1,506
|
|
77,312
|
|
19,258
|
|
31,385
|
|
|
–
of which: renegotiated loans
|
1,112
|
|
—
|
|
190
|
|
97
|
|
79
|
|
1,478
|
|
1,010
|
|
—
|
|
|
Impairment allowances
|
362
|
|
10
|
|
142
|
|
75
|
|
—
|
|
589
|
|
302
|
|
7
|
|
|
Gross loans and advances
|
||||||||||||||||
|
Neither past due nor impaired
|
20,208
|
|
32,688
|
|
541
|
|
7,650
|
|
1,255
|
|
62,342
|
|
15,143
|
|
25,561
|
|
|
Past due but not impaired
|
41
|
|
88
|
|
—
|
|
89
|
|
3
|
|
221
|
|
1
|
|
29
|
|
|
Impaired loans
|
1,212
|
|
22
|
|
183
|
|
110
|
|
81
|
|
1,608
|
|
1,027
|
|
15
|
|
|
At Dec 2016
|
21,461
|
|
32,798
|
|
724
|
|
7,849
|
|
1,339
|
|
64,171
|
|
16,171
|
|
25,605
|
|
|
–
of which: renegotiated loans
|
1,117
|
|
—
|
|
192
|
|
118
|
|
98
|
|
1,525
|
|
997
|
|
—
|
|
|
Impairment allowances
|
403
|
|
11
|
|
144
|
|
67
|
|
35
|
|
660
|
|
330
|
|
8
|
|
Commercial real estate lending includes the financing of corporate, institutional and high net worth customers who are investing primarily in income-producing assets and, to a lesser extent, in their construction and development. The portfolio is globally diversified with larger concentrations in Hong Kong, the UK, the US and Canada.
Our global exposure is centred largely on cities with economic, political or cultural significance. In many less-developed markets, industry is moving from the development and rapid construction of recent years to an increasing focus on investment stock consistent with more developed markets.
In more developed markets, our exposure mainly comprises the financing of investment assets, the redevelopment of existing stock and the augmentation of both commercial and residential markets to support economic and population growth. In less-developed commercial real estate markets, our exposures comprise lending for development assets on relatively short tenors with a particular focus on supporting larger, better capitalised developers involved in residential construction or assets supporting economic expansion.
Commercial real estate lending grew
$13bn
, including foreign exchange movements of
$2.9bn
, mainly in Hong Kong and, to a lesser extent, within the UK and Canada.
|
HSBC Holdings plc
|
131
|
Report of the Directors
| Risk
Refinance risk in commercial real estate
Commercial real estate lending tends to require the repayment of a significant proportion of the principal at maturity. Typically, a customer will arrange repayment through the acquisition of a new loan to settle the existing debt. Refinance risk is the risk that a
customer, being unable to repay the debt on maturity, fails to refinance it at commercial rates. We monitor our commercial real estate portfolio closely, assessing indicators for signs of potential issues with refinancing.
|
Commercial real estate loans and advances maturity analysis
|
||||||||||||||||
|
|
Europe
|
|
Asia
|
|
MENA
|
|
North
America |
|
Latin America
|
|
Total
|
|
UK
|
|
Hong Kong
|
|
|
|
$m
|
|
$m
|
|
$m
|
|
$m
|
|
$m
|
|
$m
|
|
$m
|
|
$m
|
|
|
On demand, overdrafts or revolving
|
|
|
|
|
|
|
|
|
|
|
|
|
||||
|
< 1 year
|
6,192
|
|
10,559
|
|
268
|
|
4,678
|
|
260
|
|
21,957
|
|
4,651
|
|
8,531
|
|
|
1-2 years
|
4,440
|
|
7,693
|
|
119
|
|
1,178
|
|
58
|
|
13,488
|
|
3,339
|
|
5,502
|
|
|
2-5 years
|
13,109
|
|
15,856
|
|
117
|
|
2,199
|
|
734
|
|
32,015
|
|
10,716
|
|
11,723
|
|
|
> 5 years
|
2,215
|
|
6,138
|
|
183
|
|
862
|
|
454
|
|
9,852
|
|
552
|
|
5,629
|
|
|
At Dec 2017
|
25,956
|
|
40,246
|
|
687
|
|
8,917
|
|
1,506
|
|
77,312
|
|
19,258
|
|
31,385
|
|
|
On demand, overdrafts or revolving
|
||||||||||||||||
|
< 1 year
|
5,687
|
|
7,773
|
|
280
|
|
3,568
|
|
328
|
|
17,636
|
|
4,701
|
|
5,574
|
|
|
1-2 years
|
2,904
|
|
5,075
|
|
72
|
|
1,453
|
|
27
|
|
9,531
|
|
1,930
|
|
3,365
|
|
|
2-5 years
|
10,846
|
|
13,691
|
|
250
|
|
1,733
|
|
309
|
|
26,829
|
|
8,778
|
|
10,858
|
|
|
> 5 years
|
2,024
|
|
6,259
|
|
122
|
|
1,095
|
|
675
|
|
10,175
|
|
762
|
|
5,808
|
|
|
At Dec 2016
|
21,461
|
|
32,798
|
|
724
|
|
7,849
|
|
1,339
|
|
64,171
|
|
16,171
|
|
25,605
|
|
Collateral on loans and advances
Collateral held is analysed separately for commercial real estate and for other corporate, commercial and financial (non-bank) lending. The following tables include off-balance sheet loan commitments, primarily undrawn credit lines.
The collateral measured in the following tables consists of fixed first charges on real estate, and charges over cash and marketable financial instruments. The values in the tables represent the expected market value on an open market basis; no adjustment has been made to the collateral for any expected costs of recovery. Marketable securities are measured at their fair value.
Other types of collateral such as unsupported guarantees and floating charges over the assets of a customer’s business are not measured in the tables below. While such mitigants have value, often providing rights in insolvency, their assignable value is not sufficiently certain and they are therefore assigned no value for disclosure purposes.
For impaired loans, the collateral values cannot be directly compared with impairment allowances recognised. The loan-to-value (‘LTV’) figures use open market values with no adjustments. Impairment allowances are calculated on a different basis, by considering other cash flows and adjusting collateral values for costs of realising collateral as explained further on page
225
.
Commercial real estate loans and advances
The value of commercial real estate collateral is determined by using a combination of external and internal valuations and physical inspections. For CRR 1–7, local valuation policies determine the frequency of review on the basis of local market conditions because of the complexity of valuing collateral for commercial real estate. For CRR 8–10, almost all collateral would have been revalued within the last three years.
In Hong Kong, market practice is typically for lending to major property companies to be either secured by guarantees or unsecured. In Europe, facilities of a working capital nature are generally not secured by a first fixed charge, and are therefore disclosed as not collateralised.
|
132
|
HSBC Holdings plc
|
|
Commercial real estate loans and advances including loan commitments by level of collateral
|
||||||||||||||||
|
(Audited)
|
|
|
|
|
||||||||||||
|
|
Europe
|
|
Asia
|
|
MENA
|
|
North America
|
|
Latin America
|
|
Total
|
|
UK
|
|
Hong Kong
|
|
|
|
$m
|
|
$m
|
|
$m
|
|
$m
|
|
$m
|
|
$m
|
|
$m
|
|
$m
|
|
|
Rated CRR/EL 1 to 7
|
|
|
|
|
|
|
|
|
|
|
|
|
|
|
|
|
|
Not collateralised
|
6,114
|
|
18,338
|
|
315
|
|
590
|
|
397
|
|
25,754
|
|
4,812
|
|
12,678
|
|
|
Fully collateralised
|
25,958
|
|
30,289
|
|
192
|
|
11,201
|
|
931
|
|
68,571
|
|
20,709
|
|
24,708
|
|
|
Partially collateralised (A)
|
1,631
|
|
1,623
|
|
—
|
|
1,797
|
|
149
|
|
5,200
|
|
968
|
|
1,229
|
|
|
– collateral value on A
|
1,270
|
|
975
|
|
—
|
|
1,281
|
|
76
|
|
3,602
|
|
568
|
|
729
|
|
|
Total
|
33,703
|
|
50,250
|
|
507
|
|
13,588
|
|
1,477
|
|
99,525
|
|
26,489
|
|
38,615
|
|
|
Rated CRR/EL 8
|
|
|
|
|
|
|
|
|
|
|
|
|
|
|
|
|
|
Not collateralised
|
5
|
|
—
|
|
—
|
|
—
|
|
—
|
|
5
|
|
3
|
|
—
|
|
|
Fully collateralised
|
145
|
|
—
|
|
—
|
|
77
|
|
—
|
|
222
|
|
129
|
|
—
|
|
|
– LTV ratio: less than 50%
|
64
|
|
—
|
|
—
|
|
3
|
|
—
|
|
67
|
|
64
|
|
—
|
|
|
– 51% to 75%
|
34
|
|
—
|
|
—
|
|
7
|
|
—
|
|
41
|
|
32
|
|
—
|
|
|
– 76% to 90%
|
23
|
|
—
|
|
—
|
|
66
|
|
—
|
|
89
|
|
19
|
|
—
|
|
|
– 91% to 100%
|
24
|
|
—
|
|
—
|
|
1
|
|
—
|
|
25
|
|
14
|
|
—
|
|
|
Partially collateralised (B)
|
62
|
|
—
|
|
—
|
|
10
|
|
—
|
|
72
|
|
55
|
|
—
|
|
|
– collateral value on B
|
42
|
|
—
|
|
—
|
|
1
|
|
—
|
|
43
|
|
40
|
|
—
|
|
|
Total
|
212
|
|
—
|
|
—
|
|
87
|
|
—
|
|
299
|
|
187
|
|
—
|
|
|
Rated CRR/EL 9 to 10
|
|
|
|
|
|
|
|
|
|
|
|
|
|
|
|
|
|
Not collateralised
|
56
|
|
—
|
|
2
|
|
2
|
|
3
|
|
63
|
|
46
|
|
—
|
|
|
Fully collateralised
|
445
|
|
10
|
|
194
|
|
45
|
|
16
|
|
710
|
|
376
|
|
5
|
|
|
– LTV ratio: less than 50%
|
82
|
|
6
|
|
19
|
|
26
|
|
15
|
|
148
|
|
60
|
|
—
|
|
|
– 51% to 75%
|
165
|
|
2
|
|
—
|
|
6
|
|
1
|
|
174
|
|
149
|
|
2
|
|
|
– 76% to 90%
|
127
|
|
2
|
|
—
|
|
13
|
|
—
|
|
142
|
|
122
|
|
2
|
|
|
– 91% to 100%
|
71
|
|
—
|
|
175
|
|
—
|
|
—
|
|
246
|
|
45
|
|
1
|
|
|
Partially collateralised (C)
|
441
|
|
6
|
|
—
|
|
36
|
|
10
|
|
493
|
|
351
|
|
6
|
|
|
– collateral value on C
|
250
|
|
3
|
|
—
|
|
13
|
|
32
|
|
298
|
|
188
|
|
3
|
|
|
Total
|
942
|
|
16
|
|
196
|
|
83
|
|
29
|
|
1,266
|
|
773
|
|
11
|
|
|
At 31 Dec 2017
|
34,857
|
|
50,266
|
|
703
|
|
13,758
|
|
1,506
|
|
101,090
|
|
27,449
|
|
38,626
|
|
|
Rated CRR/EL 1 to 7
|
||||||||||||||||
|
Not collateralised
|
3,887
|
|
12,714
|
|
391
|
|
561
|
|
760
|
|
18,313
|
|
2,888
|
|
9,971
|
|
|
Fully collateralised
|
21,815
|
|
27,296
|
|
152
|
|
10,618
|
|
449
|
|
60,330
|
|
18,009
|
|
21,821
|
|
|
Partially collateralised (A)
|
1,360
|
|
1,106
|
|
—
|
|
1,388
|
|
63
|
|
3,917
|
|
1,004
|
|
644
|
|
|
– collateral value on A
|
1,021
|
|
552
|
|
—
|
|
991
|
|
7
|
|
2,571
|
|
672
|
|
314
|
|
|
Total
|
27,062
|
|
41,116
|
|
543
|
|
12,567
|
|
1,272
|
|
82,560
|
|
21,901
|
|
32,436
|
|
|
Rated CRR/EL 8
|
||||||||||||||||
|
Not collateralised
|
12
|
|
—
|
|
—
|
|
1
|
|
—
|
|
13
|
|
11
|
|
—
|
|
|
Fully collateralised
|
190
|
|
—
|
|
—
|
|
6
|
|
—
|
|
196
|
|
158
|
|
—
|
|
|
– LTV ratio: less than 50%
|
54
|
|
—
|
|
—
|
|
4
|
|
—
|
|
58
|
|
39
|
|
—
|
|
|
– 51% to 75%
|
76
|
|
—
|
|
—
|
|
1
|
|
—
|
|
77
|
|
70
|
|
—
|
|
|
– 76% to 90%
|
44
|
|
—
|
|
—
|
|
—
|
|
—
|
|
44
|
|
39
|
|
—
|
|
|
– 91% to 100%
|
16
|
|
—
|
|
—
|
|
1
|
|
—
|
|
17
|
|
10
|
|
—
|
|
|
Partially collateralised (B)
|
91
|
|
—
|
|
—
|
|
11
|
|
—
|
|
102
|
|
82
|
|
—
|
|
|
– collateral value on B
|
70
|
|
—
|
|
—
|
|
1
|
|
—
|
|
71
|
|
61
|
|
—
|
|
|
Total
|
293
|
|
—
|
|
—
|
|
18
|
|
—
|
|
311
|
|
251
|
|
—
|
|
|
Rated CRR/EL 9 to 10
|
||||||||||||||||
|
Not collateralised
|
62
|
|
3
|
|
4
|
|
4
|
|
2
|
|
75
|
|
16
|
|
—
|
|
|
Fully collateralised
|
764
|
|
14
|
|
194
|
|
85
|
|
61
|
|
1,118
|
|
740
|
|
10
|
|
|
– LTV ratio: less than 50%
|
79
|
|
7
|
|
19
|
|
5
|
|
31
|
|
141
|
|
62
|
|
4
|
|
|
– 51% to 75%
|
571
|
|
5
|
|
—
|
|
34
|
|
14
|
|
624
|
|
569
|
|
4
|
|
|
– 76% to 90%
|
64
|
|
1
|
|
—
|
|
7
|
|
16
|
|
88
|
|
64
|
|
1
|
|
|
– 91% to 100%
|
50
|
|
1
|
|
175
|
|
39
|
|
—
|
|
265
|
|
45
|
|
1
|
|
|
Partially collateralised (C)
|
384
|
|
5
|
|
—
|
|
21
|
|
2
|
|
412
|
|
361
|
|
5
|
|
|
– collateral value on C
|
148
|
|
5
|
|
—
|
|
13
|
|
36
|
|
202
|
|
131
|
|
5
|
|
|
Total
|
1,210
|
|
22
|
|
198
|
|
110
|
|
65
|
|
1,605
|
|
1,117
|
|
15
|
|
|
At 31 Dec 2016
|
28,565
|
|
41,138
|
|
741
|
|
12,695
|
|
1,337
|
|
84,476
|
|
23,269
|
|
32,451
|
|
Other corporate, commercial and financial (non-bank) loans are analysed separately in the table below, which focuses on the regions containing the majority of our loans and advances balances. For financing activities in other corporate and commercial lending, collateral value is not strongly correlated to principal repayment performance.
Collateral values are generally refreshed when an obligor’s general credit performance deteriorates and we have to assess the likely performance of secondary sources of repayment should it prove necessary to rely on them.
Accordingly, the table below reports values only for customers with CRR 8 to 10, recognising that these loans and advances generally have valuations that are comparatively recent.
|
HSBC Holdings plc
|
133
|
Report of the Directors
| Risk
|
Other corporate, commercial and non-bank financial institutions loans and advances including loan commitments by level of
collateral rated CRR/EL 8 to 10 only |
||||||||||||||||
|
(Audited)
|
||||||||||||||||
|
|
Europe
|
|
Asia
|
|
MENA
|
|
North
America |
|
Latin America
|
|
Total
|
|
UK
|
|
Hong Kong
|
|
|
|
$m
|
|
$m
|
|
$m
|
|
$m
|
|
$m
|
|
$m
|
|
$m
|
|
$m
|
|
|
Rated CRR/EL 8
|
|
|
|
|
|
|
|
|
|
|
|
|
|
|
|
|
|
Not collateralised
|
1,730
|
|
42
|
|
109
|
|
1,721
|
|
121
|
|
3,723
|
|
320
|
|
15
|
|
|
Fully collateralised
|
293
|
|
9
|
|
25
|
|
222
|
|
4
|
|
553
|
|
103
|
|
5
|
|
|
– LTV ratio: less than 50%
|
72
|
|
7
|
|
9
|
|
96
|
|
4
|
|
188
|
|
25
|
|
3
|
|
|
– 51% to 75%
|
73
|
|
2
|
|
12
|
|
69
|
|
—
|
|
156
|
|
65
|
|
2
|
|
|
– 76% to 90%
|
16
|
|
—
|
|
4
|
|
19
|
|
—
|
|
39
|
|
11
|
|
—
|
|
|
– 91% to 100%
|
132
|
|
—
|
|
—
|
|
38
|
|
—
|
|
170
|
|
2
|
|
—
|
|
|
Partially collateralised (A)
|
94
|
|
140
|
|
34
|
|
224
|
|
—
|
|
492
|
|
91
|
|
135
|
|
|
– collateral value on A
|
62
|
|
12
|
|
3
|
|
128
|
|
1
|
|
206
|
|
59
|
|
10
|
|
|
Total
|
2,117
|
|
191
|
|
168
|
|
2,167
|
|
125
|
|
4,768
|
|
514
|
|
155
|
|
|
Rated CRR/EL 9 to 10
|
|
|
|
|
|
|
|
|
|
|
|
|
|
|
|
|
|
Not collateralised
|
1,710
|
|
926
|
|
875
|
|
73
|
|
150
|
|
3,734
|
|
1,508
|
|
511
|
|
|
Fully collateralised
|
1,520
|
|
365
|
|
180
|
|
460
|
|
54
|
|
2,579
|
|
1,223
|
|
105
|
|
|
– LTV ratio: less than 50%
|
634
|
|
113
|
|
30
|
|
14
|
|
22
|
|
813
|
|
516
|
|
69
|
|
|
– 51% to 75%
|
431
|
|
27
|
|
62
|
|
64
|
|
21
|
|
605
|
|
403
|
|
9
|
|
|
– 76% to 90%
|
256
|
|
39
|
|
88
|
|
11
|
|
3
|
|
397
|
|
235
|
|
20
|
|
|
– 91% to 100%
|
199
|
|
186
|
|
—
|
|
371
|
|
8
|
|
764
|
|
69
|
|
7
|
|
|
Partially collateralised (B)
|
452
|
|
343
|
|
404
|
|
517
|
|
27
|
|
1,743
|
|
397
|
|
161
|
|
|
– collateral value on B
|
243
|
|
208
|
|
68
|
|
337
|
|
18
|
|
874
|
|
210
|
|
119
|
|
|
Total
|
3,682
|
|
1,634
|
|
1,459
|
|
1,050
|
|
231
|
|
8,056
|
|
3,128
|
|
777
|
|
|
At 31 Dec 2017
|
5,799
|
|
1,825
|
|
1,627
|
|
3,217
|
|
356
|
|
12,824
|
|
3,642
|
|
932
|
|
|
Rated CRR/EL 8
|
||||||||||||||||
|
Not collateralised
|
1,766
|
|
405
|
|
51
|
|
2,976
|
|
85
|
|
5,283
|
|
172
|
|
287
|
|
|
Fully collateralised
|
141
|
|
3
|
|
94
|
|
362
|
|
—
|
|
600
|
|
70
|
|
1
|
|
|
– LTV ratio: less than 50%
|
86
|
|
2
|
|
10
|
|
151
|
|
—
|
|
249
|
|
30
|
|
1
|
|
|
– 51% to 75%
|
34
|
|
1
|
|
15
|
|
118
|
|
—
|
|
168
|
|
28
|
|
—
|
|
|
– 76% to 90%
|
10
|
|
—
|
|
7
|
|
79
|
|
—
|
|
96
|
|
5
|
|
—
|
|
|
– 91% to 100%
|
11
|
|
—
|
|
62
|
|
14
|
|
—
|
|
87
|
|
7
|
|
—
|
|
|
Partially collateralised (A)
|
191
|
|
12
|
|
20
|
|
242
|
|
—
|
|
465
|
|
187
|
|
12
|
|
|
– collateral value on A
|
23
|
|
3
|
|
5
|
|
26
|
|
—
|
|
57
|
|
19
|
|
3
|
|
|
Total
|
2,098
|
|
420
|
|
165
|
|
3,580
|
|
85
|
|
6,348
|
|
429
|
|
300
|
|
|
Rated CRR/EL 9 to 10
|
||||||||||||||||
|
Not collateralised
|
1,439
|
|
848
|
|
900
|
|
154
|
|
167
|
|
3,508
|
|
1,347
|
|
377
|
|
|
Fully collateralised
|
1,394
|
|
447
|
|
160
|
|
488
|
|
56
|
|
2,545
|
|
1,159
|
|
144
|
|
|
– LTV ratio: less than 50%
|
570
|
|
126
|
|
54
|
|
59
|
|
29
|
|
838
|
|
449
|
|
54
|
|
|
– 51% to 75%
|
412
|
|
104
|
|
6
|
|
85
|
|
8
|
|
615
|
|
367
|
|
32
|
|
|
– 76% to 90%
|
180
|
|
86
|
|
87
|
|
53
|
|
8
|
|
414
|
|
144
|
|
44
|
|
|
– 91% to 100%
|
232
|
|
131
|
|
13
|
|
291
|
|
11
|
|
678
|
|
199
|
|
14
|
|
|
Partially collateralised (B)
|
478
|
|
642
|
|
442
|
|
771
|
|
35
|
|
2,368
|
|
454
|
|
305
|
|
|
– collateral value on B
|
322
|
|
268
|
|
75
|
|
353
|
|
16
|
|
1,034
|
|
300
|
|
150
|
|
|
Total
|
3,311
|
|
1,937
|
|
1,502
|
|
1,413
|
|
258
|
|
8,421
|
|
2,960
|
|
826
|
|
|
At 31 Dec 2016
|
5,409
|
|
2,357
|
|
1,667
|
|
4,993
|
|
343
|
|
14,769
|
|
3,389
|
|
1,126
|
|
Other credit risk exposures
In addition to collateralised lending, other credit enhancements are employed and methods used to mitigate credit risk arising from financial assets. These are summarised below:
|
•
|
Some securities issued by governments, banks and other financial institutions benefit from additional credit enhancement provided by government guarantees that cover the assets.
|
|
•
|
Debt securities issued by banks and financial institutions include ABSs and similar instruments which are supported by underlying pools of financial assets. Credit risk associated with ABSs is reduced through the purchase of credit default swap (‘CDS’) protection.
|
Disclosure of the Group’s holdings of ABSs and associated CDS protection is provided on page
140
.
|
•
|
Trading loans and advances mainly consist of cash collateral posted to satisfy margin requirements. There is limited credit risk on cash collateral posted since in the event of default of the counterparty these would be set off against the related liability. Reverse repos and stock borrowing are by their nature collateralised.
|
Collateral accepted as security that the Group is permitted to sell or repledge under these arrangements is described on page
256
of the Financial Statements.
|
•
|
The Group’s maximum exposure to credit risk includes financial guarantees and similar contracts granted, as well as loan and other credit-related commitments. Depending on the terms of the arrangement, we may use additional credit mitigation if a guarantee is called upon or a loan commitment is drawn and subsequently defaults.
|
For further information on these arrangements, see Note
32
on the Financial Statements.
Derivatives
HSBC participates in transactions exposing us to counterparty credit risk. Counterparty credit risk is the risk of financial loss if the counterparty to a transaction defaults before satisfactorily settling it. It arises principally from over-the-counter (‘OTC’) derivatives and securities financing transactions and is calculated in both the trading and non-trading books. Transactions vary in value by reference to a market factor such as an interest rate, exchange rate or asset price.
|
134
|
HSBC Holdings plc
|
The counterparty risk from derivative transactions is taken into account when reporting the fair value of derivative positions. The adjustment to the fair value is known as the credit value adjustment (‘CVA’).
For an analysis of CVAs, see Note
11
on the Financial Statements.
The table below reflects by risk type the fair values and gross notional contract amounts of derivatives cleared through an exchange, central counterparty and non-central counterparty.
|
Notional contract amounts and fair values of derivatives by product type
|
||||||||||||
|
2017
|
2016
|
|||||||||||
|
Notional
|
|
Fair value
|
Notional
|
|
Fair value
|
|||||||
|
amount
|
|
Assets
|
|
Liabilities
|
|
amount
|
|
Assets
|
|
Liabilities
|
|
|
|
$m
|
|
$m
|
|
$m
|
|
$m
|
|
$m
|
|
$m
|
|
|
|
Foreign exchange
|
6,244,286
|
|
78,517
|
|
75,768
|
|
5,846,095
|
|
127,413
|
|
119,781
|
|
|
– exchange traded
|
13,520
|
|
37
|
|
105
|
|
12,657
|
|
209
|
|
65
|
|
|
– central counterparty cleared OTC
|
70,719
|
|
1,312
|
|
1,394
|
|
66,209
|
|
698
|
|
748
|
|
|
– non-central counterparty cleared OTC
|
6,160,047
|
|
77,168
|
|
74,269
|
|
5,767,229
|
|
126,506
|
|
118,968
|
|
|
Interest rate
|
19,929,866
|
|
236,795
|
|
233,031
|
|
13,944,763
|
|
255,385
|
|
250,022
|
|
|
– exchange traded
|
1,536,818
|
|
240
|
|
189
|
|
1,075,299
|
|
277
|
|
214
|
|
|
– central counterparty cleared OTC
|
11,730,237
|
|
114,003
|
|
115,020
|
|
8,207,550
|
|
120,017
|
|
122,022
|
|
|
– non-central counterparty cleared OTC
|
6,662,811
|
|
122,552
|
|
117,822
|
|
4,661,914
|
|
135,091
|
|
127,786
|
|
|
Equity
|
590,156
|
|
9,353
|
|
11,845
|
|
472,169
|
|
7,410
|
|
9,240
|
|
|
– exchange traded
|
313,483
|
|
1,104
|
|
2,463
|
|
250,810
|
|
919
|
|
2,173
|
|
|
– non-central counterparty cleared OTC
|
276,673
|
|
8,249
|
|
9,382
|
|
221,359
|
|
6,491
|
|
7,067
|
|
|
Credit
|
391,798
|
|
4,692
|
|
5,369
|
|
448,220
|
|
5,199
|
|
5,767
|
|
|
– central counterparty cleared OTC
|
107,370
|
|
2,715
|
|
2,980
|
|
122,832
|
|
1,954
|
|
1,941
|
|
|
– non-central counterparty cleared OTC
|
284,428
|
|
1,977
|
|
2,389
|
|
325,388
|
|
3,245
|
|
3,826
|
|
|
Commodity and other
|
59,716
|
|
886
|
|
1,233
|
|
62,009
|
|
2,020
|
|
1,564
|
|
|
– exchange traded
|
5,389
|
|
56
|
|
47
|
|
5,596
|
|
117
|
|
—
|
|
|
– non-central counterparty cleared OTC
|
54,327
|
|
830
|
|
1,186
|
|
56,413
|
|
1,903
|
|
1,564
|
|
|
Total OTC derivatives
|
25,346,612
|
|
328,806
|
|
324,442
|
|
19,428,894
|
|
395,905
|
|
383,922
|
|
|
– total OTC derivatives cleared by central counterparties
|
11,908,326
|
|
118,030
|
|
119,394
|
|
8,396,591
|
|
122,669
|
|
124,711
|
|
|
– total OTC derivatives not cleared by central counterparties
|
13,438,286
|
|
210,776
|
|
205,048
|
|
11,032,303
|
|
273,236
|
|
259,211
|
|
|
Total exchange traded derivatives
|
1,869,210
|
|
1,437
|
|
2,804
|
|
1,344,362
|
|
1,522
|
|
2,452
|
|
|
Gross
|
27,215,822
|
|
330,243
|
|
327,246
|
|
20,773,256
|
|
397,427
|
|
386,374
|
|
|
Offset
|
|
|
(110,425
|
)
|
(110,425
|
)
|
|
|
(106,555
|
)
|
(106,555
|
)
|
|
At 31 Dec
|
|
|
219,818
|
|
216,821
|
|
|
|
290,872
|
|
279,819
|
|
The purposes for which HSBC uses derivatives are described in Note
14
on the Financial Statements.
The International Swaps and Derivatives Association (‘ISDA’) Master Agreement is our preferred agreement for documenting derivatives activity. It is common, and our preferred practice, for the parties to execute a Credit Support Annex (‘CSA’) in conjunction with the ISDA Master Agreement. Under a CSA, collateral is passed between the parties to mitigate the counterparty risk inherent in outstanding positions. The majority of our CSAs are with financial institutional clients.
We manage the counterparty exposure on our OTC derivative contracts by using collateral agreements with counterparties and netting agreements. Currently, we do not actively manage our general OTC derivative counterparty exposure in the credit markets, although we may manage individual exposures in certain circumstances.
We place strict policy restrictions on collateral types and as a consequence the types of collateral received and pledged are, by value, highly liquid and of a strong quality, being predominantly cash.
Where a collateral type is required to be approved outside the collateral policy, approval is required from a committee of senior representatives from Markets, Legal and Risk.
See page
275
and Note
29
on the Financial Statements for details regarding legally enforceable right of offset in the event of counterparty default and collateral received in respect of derivatives.
Personal lending
On a reported basis, total personal lending increased by $
37
bn to
$
376
bn. This increase included foreign exchange movements of
$
19
bn. Excluding foreign exchange movements, lending balances increased by $
13
bn in Asia and $
9.0
bn in Europe. Growth was partly offset by
a $
3.7
bn fall in North America, due to the final loans sales of
$
5.0
bn
in our US CML run-off portfolio, which were sold through 2017
. Balances grew on an underlying basis by $
0.7
bn in Latin America and reduced by $
0.8
bn in MENA.
Loan impairment allowances for personal lending were broadly unchanged at $
1.7
bn.
Loan impairment charges for personal lending were $
1.0
bn for 2017, $
0.7
bn lower compared with 2016, mainly due to our sale of operations in Brazil in 2016 and the US CML run-off portfolio. For further analysis of LICs by global business, see page
40
.
While the tables are presented on a reported basis, the commentary that follows is on a constant currency basis and excludes the effect of the loan sales in the US CML run-off portfolio.
Overall, personal lending increased by $
23
bn, mainly driven by mortgage balances which grew $
19
bn. UK mortgage balances increased by $
8.2
bn reflecting stronger acquisition performance, including the expanded use of broker relationships. Mortgages in Asia grew by $
9.3
bn, mainly driven by Hong Kong, Australia and China, as a result of business growth initiatives and property market growth. Mortgages in Canada grew by $
2.3
bn, mainly due to business growth initiatives and competitive product offerings.
The quality of both our Hong Kong and UK mortgage books remained high, with negligible defaults and impairment allowances. The average LTV ratio on new mortgage lending in Hong Kong was
50%
compared with an estimated
31%
for the overall mortgage portfolio. The average LTV ratio on new lending in the UK was
59%
compared with an estimated
40%
for the overall mortgage portfolio.
Group credit policy prescribes the range of acceptable residential property LTV thresholds, with the maximum upper limit for new loans set at between 75% and 95%. Specific LTV thresholds and debt-to-income ratios are managed at regional and country levels. LTV thresholds must comply with the Group’s policies, strategy and risk appetite, but vary to reflect the local factors: economic and housing market conditions, regulations, portfolio performance, pricing and product features.
|
HSBC Holdings plc
|
135
|
Report of the Directors
| Risk
Other personal lending balances increased by $
3.7
bn, mainly due to growth of $
2.9
bn in loans and overdrafts, and $
1.0
bn in credit cards, as a result of business growth initiatives and increased demand. Loans and overdrafts grew by $
3.1
bn in Hong Kong
mainly due to Private Bank growth, and $
1.0
bn in France, partially offset by decreases in North America and MENA. Credit cards grew by $
0.4
bn in Hong Kong, $
0.3
bn in China and $
0.3
bn in the UK.
|
Total personal lending gross loans
|
|||||||||||||||||
|
Europe
|
|
Asia
|
|
MENA
|
|
North
America |
|
Latin
America |
|
Total
|
|
UK
|
|
Hong Kong
|
|
Total as a %
of total gross loans |
|
|
$m
|
|
$m
|
|
$m
|
|
$m
|
|
$m
|
|
$m
|
|
$m
|
|
$m
|
|
||
|
First lien residential mortgages
|
126,685
|
|
109,502
|
|
2,375
|
|
37,330
|
|
2,281
|
|
278,173
|
|
119,770
|
|
70,279
|
|
26.2
|
|
– of which:
|
|
|
|
|
|
|
|
|
|
|
|
|
|
|
|
|
|
|
interest only (including offset)
|
35,242
|
|
873
|
|
65
|
|
92
|
|
—
|
|
36,272
|
|
33,468
|
|
—
|
|
3.4
|
|
affordability (including US adjustable rate mortgages)
|
409
|
|
3,111
|
|
—
|
|
13,742
|
|
—
|
|
17,262
|
|
—
|
|
3
|
|
1.6
|
|
Other personal lending
|
43,329
|
|
40,880
|
|
4,496
|
|
5,227
|
|
4,376
|
|
98,308
|
|
19,790
|
|
27,868
|
|
9.3
|
|
– other
|
32,995
|
|
29,400
|
|
2,663
|
|
2,919
|
|
2,205
|
|
70,182
|
|
10,039
|
|
19,977
|
|
6.7
|
|
– credit cards
|
10,235
|
|
11,435
|
|
1,531
|
|
1,037
|
|
1,642
|
|
25,880
|
|
9,751
|
|
7,891
|
|
2.4
|
|
– second lien residential mortgages
|
99
|
|
21
|
|
2
|
|
1,233
|
|
—
|
|
1,355
|
|
—
|
|
—
|
|
0.1
|
|
– motor vehicle finance
|
—
|
|
24
|
|
300
|
|
38
|
|
529
|
|
891
|
|
—
|
|
—
|
|
0.1
|
|
At 31 Dec 2017
|
170,014
|
|
150,382
|
|
6,871
|
|
42,557
|
|
6,657
|
|
376,481
|
|
139,560
|
|
98,147
|
|
35.5
|
|
Loan and other credit-related commitments
|
50,384
|
|
120,312
|
|
3,975
|
|
14,443
|
|
5,196
|
|
194,310
|
|
48,413
|
|
89,994
|
|
|
|
|
|
|
|
|
|
|
|
|
|
|
|
|
|
|
|
|
|
|
First lien residential mortgages
|
108,008
|
|
98,072
|
|
2,535
|
|
39,239
|
|
1,924
|
|
249,778
|
|
101,822
|
|
63,565
|
|
26.1
|
|
– of which:
|
|
|
|
|
|
|
|
|
|
|
|
|
|
|
|
|
|
|
interest only (including offset)
|
33,045
|
|
876
|
|
92
|
|
113
|
|
—
|
|
34,126
|
|
31,893
|
|
—
|
|
3.6
|
|
affordability (including US adjustable rate mortgages)
|
297
|
|
3,427
|
|
—
|
|
14,182
|
|
—
|
|
17,906
|
|
—
|
|
5
|
|
1.9
|
|
Other personal lending
|
38,491
|
|
36,628
|
|
5,209
|
|
5,717
|
|
3,975
|
|
90,020
|
|
17,820
|
|
24,558
|
|
9.4
|
|
– other
|
29,297
|
|
26,059
|
|
3,072
|
|
3,061
|
|
2,018
|
|
63,507
|
|
9,189
|
|
17,042
|
|
6.6
|
|
– credit cards
|
9,096
|
|
10,438
|
|
1,816
|
|
993
|
|
1,595
|
|
23,938
|
|
8,631
|
|
7,516
|
|
2.5
|
|
– second lien residential mortgages
|
97
|
|
24
|
|
2
|
|
1,631
|
|
—
|
|
1,754
|
|
—
|
|
—
|
|
0.2
|
|
– motor vehicle finance
|
1
|
|
107
|
|
319
|
|
32
|
|
362
|
|
821
|
|
—
|
|
—
|
|
0.1
|
|
At 31 Dec 2016
|
146,499
|
|
134,700
|
|
7,744
|
|
44,956
|
|
5,899
|
|
339,798
|
|
119,642
|
|
88,123
|
|
35.5
|
|
|
|
|
|
|
|
|
|
|
|
|
|
|
|
|
|
|
|
|
Currency translation adjustment
|
14,499
|
|
2,890
|
|
(120
|
)
|
1,337
|
|
53
|
|
18,659
|
|
11,406
|
|
(672
|
)
|
|
|
31 Dec 2016 at 31 Dec 2017
exchange rates |
160,998
|
|
137,590
|
|
7,624
|
|
46,293
|
|
5,952
|
|
358,457
|
|
131,048
|
|
87,451
|
|
|
|
Movement – constant currency basis
|
9,016
|
|
12,792
|
|
(753
|
)
|
(3,736
|
)
|
705
|
|
18,024
|
|
8,512
|
|
10,696
|
|
|
|
31 Dec 2017 as reported
|
170,014
|
|
150,382
|
|
6,871
|
|
42,557
|
|
6,657
|
|
376,481
|
|
139,560
|
|
98,147
|
|
|
|
Loan and other credit-related commitments
|
49,029
|
|
111,123
|
|
4,291
|
|
13,944
|
|
5,423
|
|
183,810
|
|
47,250
|
|
85,208
|
|
|
|
Total personal lending impairment allowances
|
|||||||||||||||||
|
|
|
Europe
|
|
Asia
|
|
MENA
|
|
North
America |
|
Latin
America |
|
Total
|
|
UK
|
|
Hong Kong
|
|
|
|
|
$m
|
|
$m
|
|
$m
|
|
$m
|
|
$m
|
|
$m
|
|
$m
|
|
$m
|
|
|
First lien residential mortgages
|
|
262
|
|
30
|
|
68
|
|
148
|
|
16
|
|
524
|
|
145
|
|
—
|
|
|
Other personal lending
|
|
341
|
|
237
|
|
259
|
|
60
|
|
298
|
|
1,195
|
|
257
|
|
86
|
|
|
– other
|
|
230
|
|
109
|
|
132
|
|
17
|
|
151
|
|
639
|
|
147
|
|
36
|
|
|
– credit cards
|
|
111
|
|
128
|
|
122
|
|
30
|
|
140
|
|
531
|
|
110
|
|
50
|
|
|
– second lien residential mortgages
|
|
—
|
|
—
|
|
—
|
|
13
|
|
—
|
|
13
|
|
—
|
|
—
|
|
|
– motor vehicle finance
|
|
—
|
|
—
|
|
5
|
|
—
|
|
7
|
|
12
|
|
—
|
|
—
|
|
|
At 31 Dec 2017
|
|
603
|
|
267
|
|
327
|
|
208
|
|
314
|
|
1,719
|
|
402
|
|
86
|
|
|
Impairment allowances % of impaired loans
|
|
29.7%
|
|
44.5%
|
|
94.2%
|
|
12.8%
|
|
97.2%
|
|
34.9%
|
|
28.3%
|
|
62.3%
|
|
|
|
|
|
|
|
|
|
|
|
|
|
|
|
|
|
|
|
|
|
First lien residential mortgages
|
|
225
|
|
34
|
|
81
|
|
289
|
|
14
|
|
643
|
|
123
|
|
—
|
|
|
Other personal lending
|
|
300
|
|
249
|
|
448
|
|
83
|
|
249
|
|
1,329
|
|
231
|
|
99
|
|
|
– other
|
|
224
|
|
122
|
|
226
|
|
23
|
|
128
|
|
723
|
|
155
|
|
42
|
|
|
– credit cards
|
|
76
|
|
127
|
|
217
|
|
34
|
|
117
|
|
571
|
|
76
|
|
57
|
|
|
– second lien residential mortgages
|
|
—
|
|
—
|
|
—
|
|
26
|
|
—
|
|
26
|
|
—
|
|
—
|
|
|
– motor vehicle finance
|
|
—
|
|
—
|
|
5
|
|
—
|
|
4
|
|
9
|
|
—
|
|
—
|
|
|
At 31 Dec 2016
|
|
525
|
|
283
|
|
529
|
|
372
|
|
263
|
|
1,972
|
|
354
|
|
99
|
|
|
Impairment allowances % of impaired loans
|
|
27.8%
|
|
50.0%
|
|
99.6%
|
|
11.4%
|
|
105.2%
|
|
30.4%
|
|
26.0%
|
|
67.8%
|
|
|
|
|
|
|
|
|
|
|
|
|
|
|
|
|
|
|
|
|
|
Currency translation adjustment
|
|
58
|
|
12
|
|
(20
|
)
|
1
|
|
7
|
|
58
|
|
33
|
|
(1
|
)
|
|
31 Dec 2016 at 31 Dec 2017 exchange rates
|
|
583
|
|
295
|
|
509
|
|
373
|
|
270
|
|
2,030
|
|
387
|
|
98
|
|
|
Movement – constant currency basis
|
|
20
|
|
(28
|
)
|
(182
|
)
|
(165
|
)
|
44
|
|
(311
|
)
|
15
|
|
(12
|
)
|
|
31 Dec 2017 as reported
|
|
603
|
|
267
|
|
327
|
|
208
|
|
314
|
|
1,719
|
|
402
|
|
86
|
|
|
136
|
HSBC Holdings plc
|
Exposure to UK interest-only mortgage loans
Of total UK mortgage lending, interest-only mortgage products contributed $
33
bn, including $
12
bn of offset mortgages in First Direct and $
1.1
bn of endowment mortgages.
On a constant currency basis, total UK interest-only mortgage products declined by $
1.6
bn on prior year.
The following information is presented for HSBC Bank plc’s UK interest-only mortgage loans with balances of $
16
bn at the end of
2017. During the year, $
0.17
bn of interest-only mortgages matured. Of these,
1,290
loans with total balances of $
0.06
bn were repaid in full,
153
loans with balances of $
0.01
bn have agreed future repayment plans and
438
loans with balances of $
0.10
bn are subject to ongoing individual assessment.
The profile of expiring
HSBC Bank plc’s UK
interest-only loans was as follows.
|
UK interest-only mortgage loans
|
||
|
|
$m
|
|
|
Expired interest-only mortgage loans
|
216
|
|
|
Interest-only mortgage loans by maturity
|
|
|
|
– 2018
|
465
|
|
|
– 2019
|
520
|
|
|
– 2020
|
532
|
|
|
– 2021
|
652
|
|
|
– 2022-2026
|
3,185
|
|
|
– Post 2026
|
10,215
|
|
|
At 31 Dec 2017
|
15,785
|
|
Collateral and other credit enhancements held
(Audited)
The following table shows the values of the fixed charges we hold over specific assets where we are able to enforce collateral in satisfying a debt because the borrower has failed to meet
contractual obligations, and where the collateral is cash or can be realised by sale in an established market.
The collateral valuation excludes any adjustments for obtaining and selling the collateral and, in particular, loans shown as not collateralised or partially collateralised may also benefit from other forms of credit mitigants.
|
Residential mortgage loans including loan commitments by level of collateral
|
||||||||||||||||
|
(Audited)
|
||||||||||||||||
|
Europe
|
|
Asia
|
|
MENA
|
|
North
America |
|
Latin
America |
|
Total
|
|
UK
|
|
Hong
Kong |
|
|
|
$m
|
|
$m
|
|
$m
|
|
$m
|
|
$m
|
|
$m
|
|
$m
|
|
$m
|
|
|
|
Non-impaired loans and advances
|
||||||||||||||||
|
Fully collateralised
|
131,205
|
|
115,928
|
|
2,194
|
|
35,597
|
|
2,164
|
|
287,088
|
|
124,736
|
|
72,073
|
|
|
– LTV ratio: less than 50%
|
72,513
|
|
77,286
|
|
582
|
|
12,902
|
|
827
|
|
164,110
|
|
69,679
|
|
55,237
|
|
|
– 51% to 60%
|
21,702
|
|
16,891
|
|
321
|
|
8,948
|
|
425
|
|
48,287
|
|
20,706
|
|
8,340
|
|
|
– 61% to 70%
|
16,500
|
|
10,900
|
|
445
|
|
8,786
|
|
423
|
|
37,054
|
|
15,422
|
|
3,282
|
|
|
– 71% to 80%
|
12,857
|
|
7,848
|
|
579
|
|
4,341
|
|
268
|
|
25,893
|
|
11,992
|
|
3,402
|
|
|
– 81% to 90%
|
6,347
|
|
2,316
|
|
230
|
|
391
|
|
161
|
|
9,445
|
|
5,824
|
|
1,376
|
|
|
– 91% to 100%
|
1,286
|
|
687
|
|
37
|
|
229
|
|
60
|
|
2,299
|
|
1,113
|
|
436
|
|
|
Partially collateralised:
|
||||||||||||||||
|
Greater than 100% (A)
|
309
|
|
53
|
|
71
|
|
216
|
|
11
|
|
660
|
|
174
|
|
—
|
|
|
– 101% to 110%
|
125
|
|
34
|
|
15
|
|
89
|
|
7
|
|
270
|
|
89
|
|
—
|
|
|
– 111% to 120%
|
46
|
|
10
|
|
7
|
|
57
|
|
1
|
|
121
|
|
16
|
|
—
|
|
|
– greater than120%
|
138
|
|
9
|
|
49
|
|
70
|
|
3
|
|
269
|
|
69
|
|
—
|
|
|
Collateral on A
|
258
|
|
48
|
|
48
|
|
187
|
|
9
|
|
550
|
|
125
|
|
—
|
|
|
Non-impaired loans and advances
|
131,514
|
|
115,981
|
|
2,265
|
|
35,813
|
|
2,175
|
|
287,748
|
|
124,910
|
|
72,073
|
|
|
Impaired loans and advances
|
||||||||||||||||
|
Fully collateralised
|
1,241
|
|
284
|
|
46
|
|
1,306
|
|
127
|
|
3,004
|
|
1,008
|
|
46
|
|
|
– LTV ratio: less than 50%
|
637
|
|
133
|
|
12
|
|
446
|
|
10
|
|
1,238
|
|
538
|
|
42
|
|
|
– 51% to 60%
|
236
|
|
40
|
|
4
|
|
230
|
|
8
|
|
518
|
|
196
|
|
3
|
|
|
– 61% to 70%
|
157
|
|
36
|
|
10
|
|
210
|
|
3
|
|
416
|
|
130
|
|
—
|
|
|
– 71% to 80%
|
116
|
|
37
|
|
6
|
|
191
|
|
4
|
|
354
|
|
85
|
|
1
|
|
|
– 81% to 90%
|
53
|
|
27
|
|
6
|
|
135
|
|
102
|
|
323
|
|
40
|
|
—
|
|
|
– 91% to 100%
|
42
|
|
11
|
|
8
|
|
94
|
|
—
|
|
155
|
|
19
|
|
—
|
|
|
Partially collateralised:
|
||||||||||||||||
|
Greater than 100% (B)
|
86
|
|
10
|
|
56
|
|
187
|
|
3
|
|
342
|
|
38
|
|
—
|
|
|
– 101% to 110%
|
38
|
|
5
|
|
9
|
|
49
|
|
—
|
|
101
|
|
15
|
|
—
|
|
|
– 111% to 120%
|
13
|
|
2
|
|
12
|
|
34
|
|
—
|
|
61
|
|
5
|
|
—
|
|
|
– greater than 120%
|
35
|
|
3
|
|
35
|
|
104
|
|
3
|
|
180
|
|
18
|
|
—
|
|
|
Collateral on B
|
67
|
|
9
|
|
48
|
|
143
|
|
2
|
|
269
|
|
31
|
|
—
|
|
|
Impaired loans and advances
|
1,327
|
|
294
|
|
102
|
|
1,493
|
|
130
|
|
3,346
|
|
1,046
|
|
46
|
|
|
At 31 Dec 2017
|
132,841
|
|
116,275
|
|
2,367
|
|
37,306
|
|
2,305
|
|
291,094
|
|
125,956
|
|
72,119
|
|
|
HSBC Holdings plc
|
137
|
Report of the Directors
| Risk
|
Residential mortgage loans including loan commitments by level of collateral (continued)
|
||||||||||||||||
|
(Audited)
|
||||||||||||||||
|
Europe
|
|
Asia
|
|
MENA
|
|
North
America
|
|
Latin
America
|
|
Total
|
|
UK
|
|
Hong
Kong
|
|
|
|
$m
|
|
$m
|
|
$m
|
|
$m
|
|
$m
|
|
$m
|
|
$m
|
|
$m
|
|
|
|
Non impaired loans and advances
|
||||||||||||||||
|
Fully collateralised
|
111,799
|
|
104,122
|
|
2,333
|
|
35,773
|
|
1,813
|
|
255,840
|
|
106,006
|
|
65,480
|
|
|
– LTV ratio:
less than 50%
|
63,404
|
|
63,009
|
|
617
|
|
12,454
|
|
676
|
|
140,160
|
|
61,128
|
|
44,732
|
|
|
– 51% to 60%
|
19,129
|
|
18,198
|
|
369
|
|
8,124
|
|
316
|
|
46,136
|
|
18,094
|
|
10,656
|
|
|
– 61% to 70%
|
14,437
|
|
10,908
|
|
505
|
|
9,471
|
|
366
|
|
35,687
|
|
13,222
|
|
3,851
|
|
|
– 71% to 80%
|
9,029
|
|
7,370
|
|
659
|
|
4,374
|
|
253
|
|
21,685
|
|
8,433
|
|
2,958
|
|
|
– 81% to 90%
|
4,963
|
|
3,463
|
|
148
|
|
888
|
|
144
|
|
9,606
|
|
4,509
|
|
2,324
|
|
|
– 91% to 100%
|
837
|
|
1,174
|
|
35
|
|
462
|
|
58
|
|
2,566
|
|
620
|
|
959
|
|
|
Partially collateralised:
|
||||||||||||||||
|
Greater than 100% (A)
|
430
|
|
41
|
|
69
|
|
373
|
|
26
|
|
939
|
|
284
|
|
1
|
|
|
– 101% to110%
|
150
|
|
20
|
|
15
|
|
179
|
|
17
|
|
381
|
|
106
|
|
1
|
|
|
– 111% to 120%
|
64
|
|
2
|
|
11
|
|
85
|
|
5
|
|
167
|
|
33
|
|
—
|
|
|
– greater than 120%
|
216
|
|
19
|
|
43
|
|
109
|
|
4
|
|
391
|
|
145
|
|
—
|
|
|
Collateral on A
|
342
|
|
27
|
|
40
|
|
328
|
|
25
|
|
762
|
|
197
|
|
1
|
|
|
Non-impaired loans and advances
|
112,229
|
|
104,163
|
|
2,402
|
|
36,146
|
|
1,839
|
|
256,779
|
|
106,290
|
|
65,481
|
|
|
Impaired loans and advances
|
||||||||||||||||
|
Fully collateralised
|
1,213
|
|
247
|
|
59
|
|
2,905
|
|
85
|
|
4,509
|
|
1,059
|
|
42
|
|
|
– LTV ratio:
less than 50%
|
580
|
|
109
|
|
21
|
|
825
|
|
8
|
|
1,543
|
|
521
|
|
34
|
|
|
– 51% to 60%
|
222
|
|
49
|
|
3
|
|
527
|
|
3
|
|
804
|
|
200
|
|
4
|
|
|
– 61% to 70%
|
180
|
|
24
|
|
13
|
|
540
|
|
4
|
|
761
|
|
158
|
|
1
|
|
|
– 71% to 80%
|
122
|
|
29
|
|
4
|
|
449
|
|
3
|
|
607
|
|
101
|
|
1
|
|
|
– 81% to 90%
|
66
|
|
19
|
|
9
|
|
336
|
|
67
|
|
497
|
|
52
|
|
1
|
|
|
– 91% to 100%
|
43
|
|
17
|
|
9
|
|
228
|
|
—
|
|
297
|
|
27
|
|
1
|
|
|
Partially collateralised:
|
||||||||||||||||
|
Greater than 100% (B)
|
80
|
|
7
|
|
73
|
|
182
|
|
—
|
|
342
|
|
42
|
|
—
|
|
|
– 101% to110%
|
37
|
|
3
|
|
10
|
|
94
|
|
—
|
|
144
|
|
17
|
|
—
|
|
|
– 111% to 120%
|
12
|
|
2
|
|
12
|
|
38
|
|
—
|
|
64
|
|
7
|
|
—
|
|
|
– greater than 120%
|
31
|
|
2
|
|
51
|
|
50
|
|
—
|
|
134
|
|
18
|
|
—
|
|
|
Collateral value on B
|
66
|
|
5
|
|
64
|
|
152
|
|
—
|
|
287
|
|
33
|
|
—
|
|
|
Impaired loans
|
1,293
|
|
254
|
|
132
|
|
3,087
|
|
85
|
|
4,851
|
|
1,101
|
|
42
|
|
|
At 31 Dec 2016
|
113,522
|
|
104,417
|
|
2,534
|
|
39,233
|
|
1,924
|
|
261,630
|
|
107,391
|
|
65,523
|
|
|
138
|
HSBC Holdings plc
|
Supplementary information
|
Gross loans and advances to customers by country
|
||||||||||
|
First lien residential mortgages
|
|
Other personal
|
|
Property-related
|
|
Commercial, international trade and other
|
|
Total
|
|
|
|
$m
|
|
$m
|
|
$m
|
|
$m
|
|
$m
|
|
|
|
Europe
|
126,685
|
|
43,329
|
|
33,938
|
|
180,656
|
|
384,608
|
|
|
– UK
|
119,770
|
|
19,790
|
|
26,012
|
|
131,938
|
|
297,510
|
|
|
– France
|
2,910
|
|
16,650
|
|
6,255
|
|
28,440
|
|
54,255
|
|
|
– Germany
|
1
|
|
234
|
|
361
|
|
10,485
|
|
11,081
|
|
|
– Switzerland
|
839
|
|
5,776
|
|
491
|
|
1,284
|
|
8,390
|
|
|
– other
|
3,165
|
|
879
|
|
819
|
|
8,509
|
|
13,372
|
|
|
Asia
|
109,502
|
|
40,880
|
|
86,410
|
|
190,851
|
|
427,643
|
|
|
– Hong Kong
|
70,279
|
|
27,868
|
|
66,668
|
|
104,876
|
|
269,691
|
|
|
– Australia
|
12,444
|
|
838
|
|
2,851
|
|
10,815
|
|
26,948
|
|
|
– India
|
1,185
|
|
441
|
|
1,110
|
|
6,437
|
|
9,173
|
|
|
– Indonesia
|
64
|
|
322
|
|
164
|
|
4,107
|
|
4,657
|
|
|
– mainland China
|
8,877
|
|
1,170
|
|
5,674
|
|
25,202
|
|
40,923
|
|
|
– Malaysia
|
3,003
|
|
3,385
|
|
2,144
|
|
5,676
|
|
14,208
|
|
|
– Singapore
|
5,760
|
|
4,952
|
|
4,727
|
|
13,073
|
|
28,512
|
|
|
– Taiwan
|
4,877
|
|
822
|
|
19
|
|
5,342
|
|
11,060
|
|
|
– other
|
3,013
|
|
1,082
|
|
3,053
|
|
15,323
|
|
22,471
|
|
|
Middle East and North Africa (excluding Saudi Arabia)
|
2,375
|
|
4,496
|
|
2,508
|
|
20,132
|
|
29,511
|
|
|
– Egypt
|
—
|
|
283
|
|
39
|
|
1,342
|
|
1,664
|
|
|
– Turkey
|
206
|
|
1,035
|
|
265
|
|
2,702
|
|
4,208
|
|
|
– UAE
|
1,880
|
|
1,682
|
|
1,727
|
|
11,172
|
|
16,461
|
|
|
– other
|
289
|
|
1,496
|
|
477
|
|
4,916
|
|
7,178
|
|
|
North America
|
37,330
|
|
5,227
|
|
16,916
|
|
48,925
|
|
108,398
|
|
|
– US
|
17,415
|
|
2,278
|
|
11,092
|
|
34,790
|
|
65,575
|
|
|
– Canada
|
18,639
|
|
2,731
|
|
5,429
|
|
13,583
|
|
40,382
|
|
|
– other
|
1,276
|
|
218
|
|
395
|
|
552
|
|
2,441
|
|
|
Latin America
|
2,281
|
|
4,376
|
|
1,875
|
|
11,756
|
|
20,288
|
|
|
– Mexico
|
2,129
|
|
3,044
|
|
1,702
|
|
8,735
|
|
15,610
|
|
|
– other
|
152
|
|
1,332
|
|
173
|
|
3,021
|
|
4,678
|
|
|
At 31 Dec 2017
|
278,173
|
|
98,308
|
|
141,647
|
|
452,320
|
|
970,448
|
|
|
Europe
|
108,008
|
|
38,491
|
|
28,485
|
|
164,465
|
|
339,449
|
|
|
– UK
|
101,822
|
|
17,820
|
|
21,707
|
|
124,341
|
|
265,690
|
|
|
– France
|
2,676
|
|
13,786
|
|
5,220
|
|
22,153
|
|
43,835
|
|
|
– Germany
|
1
|
|
192
|
|
413
|
|
8,322
|
|
8,928
|
|
|
– Switzerland
|
506
|
|
5,848
|
|
213
|
|
1,660
|
|
8,227
|
|
|
– other
|
3,003
|
|
845
|
|
932
|
|
7,989
|
|
12,769
|
|
|
Asia
|
98,072
|
|
36,628
|
|
70,426
|
|
161,940
|
|
367,066
|
|
|
– Hong Kong
|
63,566
|
|
24,558
|
|
54,219
|
|
88,921
|
|
231,264
|
|
|
– Australia
|
10,134
|
|
757
|
|
2,164
|
|
6,804
|
|
19,859
|
|
|
– India
|
1,280
|
|
388
|
|
1,040
|
|
5,979
|
|
8,687
|
|
|
– Indonesia
|
63
|
|
334
|
|
165
|
|
4,384
|
|
4,946
|
|
|
– mainland China
|
7,192
|
|
1,107
|
|
4,788
|
|
20,451
|
|
33,538
|
|
|
– Malaysia
|
2,719
|
|
3,065
|
|
1,693
|
|
4,179
|
|
11,656
|
|
|
– Singapore
|
6,194
|
|
4,502
|
|
2,920
|
|
11,832
|
|
25,448
|
|
|
– Taiwan
|
4,036
|
|
671
|
|
55
|
|
5,074
|
|
9,836
|
|
|
– other
|
2,888
|
|
1,246
|
|
3,382
|
|
14,316
|
|
21,832
|
|
|
Middle East and North Africa (excluding Saudi Arabia)
|
2,535
|
|
5,209
|
|
2,580
|
|
22,107
|
|
32,431
|
|
|
– Egypt
|
—
|
|
272
|
|
73
|
|
1,327
|
|
1,672
|
|
|
– Turkey
|
301
|
|
1,554
|
|
247
|
|
2,214
|
|
4,316
|
|
|
– UAE
|
1,981
|
|
1,867
|
|
1,883
|
|
13,037
|
|
18,768
|
|
|
– other
|
253
|
|
1,516
|
|
377
|
|
5,529
|
|
7,675
|
|
|
North America
|
39,239
|
|
5,717
|
|
16,672
|
|
51,355
|
|
112,983
|
|
|
– US
|
22,756
|
|
2,676
|
|
11,835
|
|
38,199
|
|
75,466
|
|
|
– Canada
|
15,220
|
|
2,831
|
|
4,586
|
|
12,515
|
|
35,152
|
|
|
– other
|
1,263
|
|
210
|
|
251
|
|
641
|
|
2,365
|
|
|
Latin America
|
1,924
|
|
3,975
|
|
1,646
|
|
9,880
|
|
17,425
|
|
|
– Mexico
|
1,803
|
|
2,849
|
|
1,528
|
|
7,118
|
|
13,298
|
|
|
– other
|
121
|
|
1,126
|
|
118
|
|
2,762
|
|
4,127
|
|
|
At 31 Dec 2016
|
249,778
|
|
90,020
|
|
119,809
|
|
409,747
|
|
869,354
|
|
|
HSBC Holdings plc
|
139
|
Report of the Directors
| Risk
HSBC Holdings
(Audited)
Risk in HSBC Holdings is overseen by the HSBC Holdings Asset and Liability Management Committee (‘Holdings ALCO’). The major risks faced by HSBC Holdings are credit risk, liquidity risk and market risk (in the form of interest rate risk and foreign exchange risk).
Credit risk in HSBC Holdings primarily arises from transactions with Group subsidiaries and from guarantees issued in support of obligations assumed by certain Group operations in the normal conduct of their business. It principally represents claims on Group subsidiaries in Europe and North America.
In HSBC Holdings, the maximum exposure to credit risk arises from two components:
|
•
|
financial instruments on the balance sheet (see page
219
); and
|
|
•
|
financial guarantees and similar contracts, where the maximum exposure is the maximum that we would have to pay if the guarantees were called upon (see Note
32
).
|
In the case of our derivative balances, we have amounts with a legally enforceable right of offset in the case of counterparty default that are not included in the carrying value. These offsets also include collateral received in cash and other financial assets. The total offset relating to our derivative balances is
$2.1
bn at 31 December 2017 (2016:
$1.8
bn).
The credit quality of loans and advances and financial investments, both of which consist of intra-Group lending, is assessed as ‘strong’ or ‘good’, with
100%
of the exposure being neither past due nor impaired (2016:
100%
). For further details of credit quality classification, see page
113
.
Securitisation exposures and other structured products
The following table summarises the carrying amount of our ABS exposure by categories o
f
collateral and includes assets held in the legacy credit portfolio (held within the Corporate Centre) with a carrying value of
$9b
n (2016:
$11b
n).
At 31 December 2017, the available-for-sale reserve in respect of ABSs was a deficit of
$466m
(2016: deficit of
$749m
). For 2017, the impairment write-back in respect of ABSs was
$240m
(2016: write-back of
$121m
).
|
Carrying amount of HSBC’s consolidated holdings of ABSs
|
||||||||||||||
|
Trading
|
|
Available for sale
|
|
Held to maturity
|
|
Designated at fair value through profit or loss
|
|
Loans and receivables
|
|
Total
|
|
Of which
held through consolidated SEs |
|
|
|
$m
|
|
$m
|
|
$m
|
|
$m
|
|
$m
|
|
$m
|
|
$m
|
|
|
|
Mortgage-related assets
|
1,767
|
|
14,221
|
|
13,965
|
|
—
|
|
1,762
|
|
31,715
|
|
1,826
|
|
|
–
sub-prime residential
|
22
|
|
918
|
|
—
|
|
—
|
|
32
|
|
972
|
|
484
|
|
|
–
US Alt-A residential
|
—
|
|
1,102
|
|
3
|
|
—
|
|
—
|
|
1,105
|
|
1,041
|
|
|
–
US Government agency and sponsored enterprises: MBSs
|
331
|
|
11,750
|
|
13,962
|
|
—
|
|
—
|
|
26,043
|
|
—
|
|
|
–
other residential
|
814
|
|
181
|
|
—
|
|
—
|
|
1,595
|
|
2,590
|
|
75
|
|
|
–
commercial property
|
600
|
|
270
|
|
—
|
|
—
|
|
135
|
|
1,005
|
|
226
|
|
|
Leveraged finance-related assets
|
128
|
|
373
|
|
—
|
|
—
|
|
45
|
|
546
|
|
283
|
|
|
Student loan-related assets
|
155
|
|
2,198
|
|
—
|
|
—
|
|
—
|
|
2,353
|
|
2,158
|
|
|
Other assets
|
1,266
|
|
731
|
|
—
|
|
2
|
|
3,553
|
|
5,552
|
|
428
|
|
|
At 31 Dec 2017
|
3,316
|
|
17,523
|
|
13,965
|
|
2
|
|
5,360
|
|
40,166
|
|
4,695
|
|
|
Mortgage-related assets
|
1,320
|
|
17,575
|
|
12,793
|
|
—
|
|
338
|
|
32,026
|
|
2,859
|
|
|
–
sub-prime residential
|
63
|
|
1,544
|
|
—
|
|
—
|
|
104
|
|
1,711
|
|
618
|
|
|
–
US Alt-A residential
|
—
|
|
1,453
|
|
5
|
|
—
|
|
39
|
|
1,497
|
|
1,382
|
|
|
–
US Government agency and sponsored enterprises: MBSs
|
247
|
|
13,070
|
|
12,788
|
|
—
|
|
—
|
|
26,105
|
|
—
|
|
|
–
other residential
|
662
|
|
362
|
|
—
|
|
—
|
|
54
|
|
1,078
|
|
152
|
|
|
–
commercial property
|
348
|
|
1,146
|
|
—
|
|
—
|
|
141
|
|
1,635
|
|
707
|
|
|
Leveraged finance-related assets
|
175
|
|
1,284
|
|
—
|
|
—
|
|
70
|
|
1,529
|
|
735
|
|
|
Student loan-related assets
|
140
|
|
2,865
|
|
—
|
|
—
|
|
11
|
|
3,016
|
|
2,616
|
|
|
Other assets
|
1,278
|
|
730
|
|
—
|
|
19
|
|
48
|
|
2,075
|
|
404
|
|
|
At 31 Dec 2016
|
2,913
|
|
22,454
|
|
12,793
|
|
19
|
|
467
|
|
38,646
|
|
6,614
|
|
|
140
|
HSBC Holdings plc
|
|
Risk elements in the loan portfolio
|
|
•
|
impaired loans;
|
|
•
|
unimpaired loans contractually more than 90 days past due as to interest or principal; and
|
|
•
|
troubled debt restructurings not included in the above.
|
|
Interest forgone on impaired and restructured loans
|
||||
|
2017
|
|
2016
|
|
|
|
$m
|
|
$m
|
|
|
|
Europe
|
154
|
|
189
|
|
|
Asia
|
169
|
|
180
|
|
|
Middle East and North Africa
|
153
|
|
155
|
|
|
North America
|
147
|
|
387
|
|
|
Latin America
|
33
|
|
267
|
|
|
Year ended 31 Dec
|
656
|
|
1,178
|
|
|
Interest recognised on impaired and restructured loans
|
||||
|
2017
|
2016
|
|||
|
$m
|
|
$m
|
|
|
|
Europe
|
52
|
|
71
|
|
|
Asia
|
53
|
|
62
|
|
|
Middle East and North Africa
|
20
|
|
21
|
|
|
North America
|
121
|
|
413
|
|
|
Latin America
|
39
|
|
98
|
|
|
Year ended 31 Dec
|
285
|
|
665
|
|
Impaired loans
A loan is impaired, and an impairment allowance is recognised, when there is objective evidence of a loss event that has an effect on the cash flows of the loan that can be reliably estimated. In accordance with IFRSs, we recognise interest income on assets after they have been written down as a result of an impairment loss.
The balance of impaired loans at 31 December 2017 was $
2.8bn
lower than at 31 December 2016. This reduction was largely due to the completion of loan sales in our US CML run-off portfolio and a reduction in corporate and commercial impaired balances as a result of fewer significant current year impaired loans together with loan credit grade improvements, repayments and write-offs.
Unimpaired loans more than 90 days past due
Examples of unimpaired loans more than 90 days past due include individually assessed mortgages that are in arrears more than 90 days where there are no other indicators of impairment, but where the value of collateral is sufficient to repay both the principal debt and all potential interest for at least one year; and short-term trade facilities past due more than 90 days for technical reasons such as delays in documentation, but where there is no concern over the creditworthiness of the counterparty.
The amount of unimpaired loans contractually more than 90 days past due as to principal or interest at 31 December 2017 was
$24m
,
$6m
higher than at 31 December 2016. The increase was in Middle East and North Africa, partially offset by a decrease in North America.
Troubled debt restructurings
Under US GAAP, a troubled debt restructuring (‘TDR’) is a loan, the terms of which have been modified for economic or legal reasons related to the borrower’s financial difficulties to grant a concession to the borrower that the lender would not otherwise consider. A modification that results in a delay in payment that is considered insignificant is not regarded as a concession for the purposes of
this disclosure. The SEC requires separate disclosure of any loans that meet the definition of a TDR that are not included in the previous two loan categories. These are classified as TDRs in the table on page
141
. Loans that have been identified as a TDR under the US guidance retain this designation until maturity or derecognition. This treatment differs from the Group’s impaired loans disclosure convention under IFRSs under which a loan may return to unimpaired status after demonstrating a significant reduction in the risk of non-payment of future cash flows. As a result, reported TDRs include those loans that have returned to unimpaired status under the Group’s disclosure convention for renegotiated loans.
The balance of TDRs not included as impaired loans at 31 December 2017 was
$2.9bn
,
$0.5bn
lower than 2016 mainly due to a reduction in North America due to the completion of loan sales in our US CML run-off portfolio.
Potential problem loans
Potential problem loans are loans where information on possible credit problems among borrowers causes management to seriously doubt their ability to comply with the loan repayment terms. The following concentrations of credit risk have a higher risk of containing potential problem loans.
‘Personal lending’ on page
135
includes disclosure about certain homogeneous groups of loans that are collectively assessed for impairment, which may represent exposures to potential problem loans, including interest only mortgages and affordability mortgages, including adjustable rate mortgages. Collectively assessed loans and advances, although not classified as impaired until more than 90 days past due, are assessed collectively for losses that have been incurred but have not yet been individually identified. For details of our impairment policies on loans and advances and financial investments, see Note
1.2(d)
on the Financial Statements.
‘Renegotiated loans and forbearance’ on page
127
includes disclosure about the credit quality of loans whose contractual terms have been changed at some point in the life of the loan because of significant concerns about the borrower’s ability to make contractual payments when due. Renegotiated loans are classified as impaired when:
|
•
|
there has been a change in contractual cash flow as a result of a concession that the lender would otherwise not consider; and
|
|
•
|
it is probable that without the concession, the borrower would be unable to meet contractual payment obligations in full.
|
This presentation applies unless the concession is insignificant and there are no other indicators of impairment. The renegotiated loan will continue to be disclosed as impaired until there is sufficient evidence to demonstrate a significant reduction in the risk of non-repayment of future cash flows, and there are no other indicators of impairment.
Renegotiated loans that are not classified as impaired may have a higher risk of becoming delinquent in the future, and may therefore be potential problem loans. Further information regarding the credit quality classification of renegotiated loans can be found on page
113
.
Risk elements in the loan portfolio by geographical region
The following table sets out the amount of risk elements in loan portfolios included within loans and advances to customers and banks in the consolidated balance sheet, trading loans classified as in default and assets obtained by taking possession of security. The table excludes the amount of risk elements in loan portfolios classified as ‘Assets held for sale’ in the consolidated balance sheet.
|
HSBC Holdings plc
|
141
|
Report of the Directors
| Risk
|
2017
|
|
2016
|
|
2015
|
|
2014
|
|
2013
|
|
|
|
$m
|
|
$m
|
|
$m
|
|
$m
|
|
$m
|
|
|
|
Impaired loans
|
||||||||||
|
Europe
|
8,042
|
|
8,062
|
|
9,265
|
|
9,709
|
|
12,654
|
|
|
Asia
|
2,249
|
|
2,499
|
|
2,375
|
|
2,048
|
|
1,623
|
|
|
Middle East and North Africa
|
1,949
|
|
2,230
|
|
2,178
|
|
2,514
|
|
2,859
|
|
|
North America
|
2,606
|
|
4,842
|
|
8,930
|
|
11,694
|
|
15,123
|
|
|
Latin America
|
624
|
|
595
|
|
1,030
|
|
3,365
|
|
4,244
|
|
|
15,470
|
|
18,228
|
|
23,778
|
|
29,330
|
|
36,503
|
|
|
|
Unimpaired loans contractually more than 90 days past due as to principal or interest
|
||||||||||
|
Europe
|
—
|
|
—
|
|
7
|
|
6
|
|
25
|
|
|
Asia
|
—
|
|
—
|
|
2
|
|
1
|
|
33
|
|
|
Middle East and North Africa
|
24
|
|
15
|
|
96
|
|
59
|
|
56
|
|
|
North America
|
—
|
|
3
|
|
27
|
|
3
|
|
13
|
|
|
Latin America
|
—
|
|
—
|
|
—
|
|
3
|
|
—
|
|
|
24
|
|
18
|
|
132
|
|
72
|
|
127
|
|
|
|
Troubled debt restructurings (not included in the classifications above)
|
|
|
||||||||
|
Europe
|
1,890
|
|
1,900
|
|
1,495
|
|
1,652
|
|
1,427
|
|
|
Asia
|
273
|
|
269
|
|
284
|
|
267
|
|
277
|
|
|
Middle East and North Africa
|
459
|
|
549
|
|
584
|
|
778
|
|
406
|
|
|
North America
|
174
|
|
518
|
|
3,698
|
|
3,932
|
|
4,643
|
|
|
Latin America
|
83
|
|
130
|
|
164
|
|
353
|
|
482
|
|
|
2,879
|
|
3,366
|
|
6,225
|
|
6,982
|
|
7,235
|
|
|
|
Trading loans classified as in default
|
|
|
||||||||
|
North America
|
—
|
|
—
|
|
—
|
|
4
|
|
133
|
|
|
Europe
|
56
|
|
—
|
|
—
|
|
—
|
|
—
|
|
|
56
|
|
—
|
|
—
|
|
4
|
|
133
|
|
|
|
Risk elements on loans
|
||||||||||
|
Europe
|
9,988
|
|
9,962
|
|
10,767
|
|
11,367
|
|
14,106
|
|
|
Asia
|
2,522
|
|
2,768
|
|
2,661
|
|
2,316
|
|
1,933
|
|
|
Middle East and North Africa
|
2,432
|
|
2,794
|
|
2,858
|
|
3,351
|
|
3,321
|
|
|
North America
|
2,780
|
|
5,363
|
|
12,655
|
|
15,633
|
|
19,912
|
|
|
Latin America
|
707
|
|
725
|
|
1,194
|
|
3,721
|
|
4,726
|
|
|
18,429
|
|
21,612
|
|
30,135
|
|
36,388
|
|
43,998
|
|
|
|
Assets held for sale
|
||||||||||
|
Europe
|
14
|
|
16
|
|
23
|
|
28
|
|
44
|
|
|
Asia
|
51
|
|
46
|
|
19
|
|
14
|
|
10
|
|
|
Middle East and North Africa
|
—
|
|
1
|
|
1
|
|
1
|
|
2
|
|
|
North America
|
11
|
|
57
|
|
116
|
|
186
|
|
370
|
|
|
Latin America
|
18
|
|
22
|
|
20
|
|
16
|
|
27
|
|
|
94
|
|
142
|
|
179
|
|
245
|
|
453
|
|
|
|
Total risk elements
|
||||||||||
|
Europe
|
10,002
|
|
9,978
|
|
10,790
|
|
11,395
|
|
14,150
|
|
|
Asia
|
2,573
|
|
2,814
|
|
2,680
|
|
2,330
|
|
1,943
|
|
|
Middle East and North Africa
|
2,432
|
|
2,795
|
|
2,859
|
|
3,352
|
|
3,323
|
|
|
North America
|
2,791
|
|
5,420
|
|
12,771
|
|
15,819
|
|
20,282
|
|
|
Latin America
|
725
|
|
747
|
|
1,214
|
|
3,737
|
|
4,753
|
|
|
At 31 Dec
|
18,523
|
|
21,754
|
|
30,314
|
|
36,633
|
|
44,451
|
|
|
%
|
|
%
|
|
%
|
|
%
|
|
%
|
|
|
|
Loan impairment allowances as a percentage of risk elements on loans
|
40.6
|
|
36.3
|
|
31.8
|
|
34.0
|
|
34.7
|
|
|
142
|
HSBC Holdings plc
|
Supplementary information
|
Gross loans and advances by industry sector over five years
|
|||||||||||
|
2017
|
|
2016
|
|
2015
|
|
2014
|
|
2013
|
|
||
|
$m
|
|
$m
|
|
$m
|
|
$m
|
|
$m
|
|
||
|
Personal
|
376,481
|
|
339,798
|
|
374,082
|
|
393,554
|
|
410,728
|
|
|
|
–
first lien residential mortgages
|
278,173
|
|
249,778
|
|
274,511
|
|
286,524
|
|
299,875
|
|
|
|
–
other personal
|
98,308
|
|
90,020
|
|
99,571
|
|
107,030
|
|
110,853
|
|
|
|
Corporate and commercial
|
522,248
|
|
465,827
|
|
499,513
|
|
542,625
|
|
545,981
|
|
|
|
–
manufacturing
|
81,857
|
|
80,643
|
|
95,858
|
|
106,986
|
|
113,850
|
|
|
|
–
international trade and services
|
173,227
|
|
150,042
|
|
159,019
|
|
180,791
|
|
184,668
|
|
|
|
–
commercial real estate
|
77,312
|
|
64,171
|
|
67,926
|
|
73,293
|
|
74,846
|
|
|
|
–
other property-related
|
64,335
|
|
55,638
|
|
53,464
|
|
52,387
|
|
44,832
|
|
|
|
–
government
|
11,728
|
|
8,442
|
|
7,455
|
|
6,143
|
|
7,277
|
|
|
|
–
other commercial
|
113,789
|
|
106,891
|
|
115,791
|
|
123,025
|
|
120,508
|
|
|
|
Financial
|
162,112
|
|
151,855
|
|
150,833
|
|
163,016
|
|
170,627
|
|
|
|
–
non-bank financial institutions
|
71,719
|
|
63,729
|
|
60,414
|
|
50,818
|
|
50,523
|
|
|
|
–
banks
|
90,393
|
|
88,126
|
|
90,419
|
|
112,198
|
|
120,104
|
|
|
|
Total gross loans and advances
|
1,060,841
|
|
957,480
|
|
1,024,428
|
|
1,099,195
|
|
1,127,336
|
|
|
|
Impaired loans and advances to customers
|
15,470
|
|
18,228
|
|
23,758
|
|
29,283
|
|
36,428
|
|
|
|
Impairment allowances on loans and advances to customers
|
7,484
|
|
7,850
|
|
9,555
|
|
12,337
|
|
15,143
|
|
|
|
Loan impairment charge
|
1,992
|
|
3,350
|
|
3,592
|
|
4,055
|
|
6,048
|
|
|
|
–
new allowances net of allowance releases
|
2,636
|
|
3,977
|
|
4,400
|
|
5,010
|
|
7,344
|
|
|
|
–
recoveries
|
(644
|
)
|
(627
|
)
|
(808
|
)
|
(955
|
)
|
(1,296
|
)
|
|
|
Loan impairment charges by industry sector over five years
|
|||||||||||
|
2017
|
|
2016
|
|
2015
|
|
2014
|
|
2013
|
|
||
|
$m
|
|
$m
|
|
$m
|
|
$m
|
|
$m
|
|
||
|
Loan impairment charge/(release)
|
|||||||||||
|
Personal
|
959
|
|
1,703
|
|
1,834
|
|
1,803
|
|
3,196
|
|
|
|
Corporate and commercial
|
927
|
|
1,608
|
|
1,769
|
|
2,256
|
|
2,974
|
|
|
|
Financial
|
106
|
|
39
|
|
(11
|
)
|
(4
|
)
|
(122
|
)
|
|
|
Year ended 31 Dec
|
1,992
|
|
3,350
|
|
3,592
|
|
4,055
|
|
6,048
|
|
|
|
Charge for impairment losses as a percentage of average gross loans and advances to customers
|
|||||||||||
|
2017
|
|
2016
|
|
2015
|
|
2014
|
|
2013
|
|
||
|
%
|
|
%
|
|
%
|
|
%
|
|
%
|
|
||
|
New allowances net of allowance releases
|
0.29
|
|
0.46
|
|
0.48
|
|
0.53
|
|
0.81
|
|
|
|
Recoveries
|
(0.07
|
)
|
(0.07
|
)
|
(0.09
|
)
|
(0.10
|
)
|
(0.14
|
)
|
|
|
Total charge for impairment losses
|
0.22
|
|
0.39
|
|
0.39
|
|
0.43
|
|
0.67
|
|
|
|
Amount written off net of recoveries
|
0.28
|
|
0.32
|
|
0.37
|
|
0.58
|
|
0.59
|
|
|
|
HSBC Holdings plc
|
143
|
Report of the Directors
| Risk
|
Movement in impairment allowances over five years
|
|||||||||||
|
2017
|
|
2016
|
|
2015
|
|
2014
|
|
2013
|
|
||
|
$m
|
|
$m
|
|
$m
|
|
$m
|
|
$m
|
|
||
|
Impairment allowances at 1 Jan
|
7,850
|
|
9,573
|
|
12,386
|
|
15,201
|
|
16,169
|
|
|
|
Amounts written off
|
(3,173
|
)
|
(3,456
|
)
|
(4,194
|
)
|
(6,379
|
)
|
(6,655
|
)
|
|
|
–
personal
|
(1,720
|
)
|
(1,602
|
)
|
(2,707
|
)
|
(3,733
|
)
|
(4,367
|
)
|
|
|
–
corporate and commercial
|
(1,376
|
)
|
(1,830
|
)
|
(1,473
|
)
|
(2,425
|
)
|
(2,229
|
)
|
|
|
–
financial
|
(77
|
)
|
(24
|
)
|
(14
|
)
|
(221
|
)
|
(59
|
)
|
|
|
Recoveries of amounts written off in previous years
|
644
|
|
627
|
|
808
|
|
955
|
|
1,296
|
|
|
|
–
personal
|
545
|
|
515
|
|
681
|
|
818
|
|
1,097
|
|
|
|
–
corporate and commercial
|
97
|
|
109
|
|
124
|
|
128
|
|
198
|
|
|
|
–
financial
|
2
|
|
3
|
|
3
|
|
9
|
|
1
|
|
|
|
Loan impairment charge
|
1,992
|
|
3,350
|
|
3,592
|
|
4,055
|
|
6,048
|
|
|
|
E
xchange and other movements
|
171
|
|
(2,244
|
)
|
(3,019
|
)
|
(1,446
|
)
|
(1,657
|
)
|
|
|
Impairment allowances at 31 Dec
|
7,484
|
|
7,850
|
|
9,573
|
|
12,386
|
|
15,201
|
|
|
|
Impairment allowances
|
|
|
|
|
|
|
|
|
|
|
|
|
–
individually assessed
|
4,960
|
|
4,932
|
|
5,420
|
|
6,244
|
|
7,130
|
|
|
|
–
collectively assessed
|
2,524
|
|
2,918
|
|
4,153
|
|
6,142
|
|
8,071
|
|
|
|
Impairment allowances at 31 Dec
|
7,484
|
|
7,850
|
|
9,573
|
|
12,386
|
|
15,201
|
|
|
|
Movement in renegotiated loans and advances to customers
|
||||||||||||||||
|
2017
|
2016
|
|||||||||||||||
|
Personal
|
|
Corporate and commercial
|
|
Financial
|
|
Total
|
|
Personal
|
|
Corporate and commercial
|
|
Financial
|
|
Total
|
|
|
|
$m
|
|
$m
|
|
$m
|
|
$m
|
|
$m
|
|
$m
|
|
$m
|
|
$m
|
|
|
|
Renegotiated loans as at 1 Jan
|
4,758
|
|
7,565
|
|
517
|
|
12,840
|
|
13,974
|
|
8,369
|
|
616
|
|
22,959
|
|
|
Loans renegotiated in the year without derecognition
|
688
|
|
1,700
|
|
7
|
|
2,395
|
|
1,076
|
|
2,947
|
|
1
|
|
4,024
|
|
|
Loans renegotiated in the year resulting in recognition of a new loan
|
—
|
|
36
|
|
—
|
|
36
|
|
—
|
|
183
|
|
—
|
|
183
|
|
|
Net repayments and other
|
(2,968
|
)
|
(2,205
|
)
|
(16
|
)
|
(5,189
|
)
|
(10,292
|
)
|
(3,934
|
)
|
(100
|
)
|
(14,326
|
)
|
|
– r
epayments
|
(644
|
)
|
(2,279
|
)
|
(32
|
)
|
(2,955
|
)
|
(1,401
|
)
|
(2,644
|
)
|
(2
|
)
|
(4,047
|
)
|
|
– a
mounts written off
|
(100
|
)
|
(338
|
)
|
(1
|
)
|
(439
|
)
|
(158
|
)
|
(614
|
)
|
(2
|
)
|
(774
|
)
|
|
– o
ther
|
(2,224
|
)
|
412
|
|
17
|
|
(1,795
|
)
|
(8,733
|
)
|
(676
|
)
|
(96
|
)
|
(9,505
|
)
|
|
Renegotiated loans at 31 Dec
|
2,478
|
|
7,096
|
|
508
|
|
10,082
|
|
4,758
|
|
7,565
|
|
517
|
|
12,840
|
|
|
Country distribution of outstandings and
cross-border exposures
|
The following table summarises the aggregate of our in-country foreign currency and cross-border outstandings by type of borrower to countries which individually represent in
excess of 0.75% of our total assets. The classification is based on the country of residence of the borrower but also recognises the transfer of country risk in respect of third-party guarantees, eligible collateral held and residence of the head office when the borrower is a branch. In accordance with the Bank of England Country Exposure Report (Form CE) guidelines, outstandings comprise loans and advances (excluding settlement accounts), amounts receivable under finance leases, acceptances, commercial bills, certificates of deposit and debt and equity securities (net of short positions), and exclude accrued interest and intra-HSBC exposures.
|
144
|
HSBC Holdings plc
|
|
In-country foreign currency and cross-border amounts outstanding
|
|||||||||
|
|
|
Banks
|
|
Government
and official institutions |
|
Other
|
|
Total
|
|
|
|
Footnotes
|
$bn
|
|
$bn
|
|
$bn
|
|
$bn
|
|
|
At 31 Dec 2017
|
|
|
|
|
|
|
|
|
|
|
US
|
|
5.8
|
|
29.5
|
|
37.6
|
|
72.9
|
|
|
Mainland China
|
|
25.5
|
|
10.3
|
|
30.3
|
|
66.1
|
|
|
UK
|
|
21.4
|
|
4.8
|
|
33.7
|
|
59.9
|
|
|
Japan
|
|
16.7
|
|
26.5
|
|
13.3
|
|
56.5
|
|
|
Hong Kong
|
|
4.3
|
|
0.3
|
|
39.3
|
|
43.9
|
|
|
Germany
|
10.8
|
|
8.8
|
|
10.7
|
|
30.3
|
|
|
|
France
|
6.9
|
|
4.7
|
|
14.1
|
|
25.7
|
|
|
|
Singapore
|
1
|
2.9
|
|
5.7
|
|
11.9
|
|
20.5
|
|
|
Canada
|
1
|
7.3
|
|
6.8
|
|
5.8
|
|
19.9
|
|
|
|
|
|
|
|
|
|
|
|
|
|
At 31 Dec 2016
|
|
|
|
|
|
|
|
|
|
|
US
|
|
4.4
|
|
41.9
|
|
19.5
|
|
65.8
|
|
|
Mainland China
|
|
20.8
|
|
9.2
|
|
24.3
|
|
54.3
|
|
|
UK
|
|
21.0
|
|
9.3
|
|
24.0
|
|
54.3
|
|
|
Japan
|
10.5
|
|
22.6
|
|
9.9
|
|
43.0
|
|
|
|
Hong Kong
|
|
4.5
|
|
0.4
|
|
32.1
|
|
37.0
|
|
|
Germany
|
|
12.3
|
|
19.9
|
|
8.1
|
|
40.3
|
|
|
France
|
6.4
|
|
8.1
|
|
12.1
|
|
26.6
|
|
|
|
Singapore
|
1
|
4.2
|
|
3.0
|
|
9.6
|
|
16.8
|
|
|
Canada
|
1
|
5.9
|
|
8.0
|
|
6.7
|
|
20.6
|
|
|
|
|
|
|
|
|
|
|
|
|
|
At 31 Dec 2015
|
|
|
|
|
|
|
|
|
|
|
US
|
|
4.7
|
|
51.3
|
|
24.7
|
|
80.7
|
|
|
Mainland China
|
|
21.2
|
|
6.8
|
|
26.0
|
|
54.0
|
|
|
UK
|
|
23.1
|
|
9.2
|
|
25.3
|
|
57.6
|
|
|
Japan
|
7.6
|
|
19.4
|
|
14.4
|
|
41.4
|
|
|
|
Hong Kong
|
|
3.1
|
|
0.5
|
|
30.0
|
|
33.6
|
|
|
Germany
|
|
7.0
|
|
23.1
|
|
6.9
|
|
37.0
|
|
|
France
|
1
|
4.2
|
|
7.1
|
|
13.0
|
|
24.3
|
|
|
Singapore
|
1
|
6.4
|
|
0.8
|
|
9.4
|
|
16.6
|
|
|
Canada
|
1
|
6.2
|
|
8.3
|
|
7.5
|
|
22.0
|
|
|
1
|
These balances were between 0.75% and 1% of total assets. All other balances were above 1%. Singapore balances in 2016 and 2015 were below 0.75% and have been included for comparative purposes.
|
Liquidity and funding risk in 2017
This section provides a summary of our current policies and practices regarding the management of liquidity and funding risk.
The liquidity position of the Group remained strong in 2017. The amount of our unencumbered liquid assets was $600bn (2016: $560bn). We recognised $536bn (2016: $447bn) of these liquid assets for the purposes of the Group consolidated Liquidity Coverage Ratio (’LCR’), which was 142% (2016: 136%).
Management of liquidity and funding risk
Liquidity coverage ratio
The LCR aims to ensure that a bank has sufficient unencumbered high-quality liquid assets (‘HQLA’) to meet its liquidity needs in a 30-calendar-day liquidity stress scenario. HQLA consist of cash or assets that can be converted into cash at little or no loss of value.
The Group’s LCR is calculated on a European Commission (‘EC’) basis and at 31 December 2017 was 142% (31 December 2016: 136%).
We assume no transferability of liquidity from non-EU entities other than to the extent currently permitted. This results in $64bn of HQLA being excluded from the Group’s LCR. If there were no exclusions on transferability of liquidity between entities, the Group’s LCR would have been 160% (31 December 2016: 171%), reflecting this additional $64bn (31 December 2016: $113bn) of HQLAs.
|
HSBC Holdings plc
|
145
|
Report of the Directors
| Risk
At 31 December 2017, all the Group’s principal operating entities were within the LCR risk tolerance level established by the Board and applicable under the Group’s internal liquidity and funding risk management framework (‘LFRF’).
The following table displays the individual LCR levels for our principal operating entities on an EC LCR basis, a key element of our LFRF. This basis may vary from local LCR measures due to differences in the way non-EU regulators have implemented the Basel III recommendations.
|
Operating entities’ LCRs
|
|||
|
At
|
|||
|
31 Dec
|
31 Dec
|
||
|
2017
|
2016
|
||
|
Footnotes
|
%
|
%
|
|
|
HSBC UK liquidity group
|
46
|
139
|
123
|
|
The Hongkong and Shanghai Banking Corporation – Hong Kong Branch
|
47
|
151
|
185
|
|
The Hongkong and Shanghai Banking Corporation – Singapore Branch
|
47
|
181
|
154
|
|
HSBC Bank USA
|
132
|
130
|
|
|
HSBC France
|
48
|
149
|
122
|
|
Hang Seng Bank
|
204
|
218
|
|
|
HSBC Canada
|
48
|
123
|
142
|
|
HSBC Bank China
|
162
|
253
|
|
|
HSBC Middle East – UAE Branch
|
197
|
241
|
|
|
HSBC Mexico
|
215
|
177
|
|
|
HSBC Private Bank
|
220
|
178
|
|
For footnotes, see page
161
.
Net stable funding ratio
We are required to maintain sufficient stable funding. The Net Stable Funding Ratio (‘NSFR’) measures stable funding relative to required stable funding, and reflects a bank’s long-term funding profile (funding with a term of more than a year). It is designed to complement the LCR.
At 31 December 2017, the Group’s principal operating entities were within the NSFR risk tolerance level established by the Board and applicable under the LFRF.
The table below displays the NSFR levels for the principal HSBC operating entities.
|
Operating entities’ NSFRs
|
|||
|
At
|
|||
|
31 Dec
|
31 Dec
|
||
|
2017
|
2016
|
||
|
Footnotes
|
%
|
%
|
|
|
HSBC UK liquidity group
|
46
|
108
|
116
|
|
The Hongkong and Shanghai Banking Corporation – Hong Kong Branch
|
47
|
144
|
157
|
|
The Hongkong and Shanghai Banking Corporation – Singapore Branch
|
47
|
117
|
112
|
|
HSBC Bank USA
|
129
|
120
|
|
|
HSBC France
|
48
|
116
|
120
|
|
Hang Seng Bank
|
155
|
162
|
|
|
HSBC Canada
|
48
|
136
|
139
|
|
HSBC Bank China
|
148
|
149
|
|
|
HSBC Middle East – UAE Branch
|
143
|
141
|
|
|
HSBC Mexico
|
123
|
128
|
|
|
HSBC Private Bank
|
185
|
155
|
|
Depositor concentration and term funding maturity concentration
The LCR and NSFR metrics assume a stressed outflow based on a portfolio of depositors within retail, corporate and financial deposit segments. The validity of these assumptions is challenged if the portfolio of depositors is not large enough to avoid depositor concentration.
Operating entities are exposed to term refinancing concentration risk if the current maturity profile results in future maturities being overly concentrated in any defined period.
At 31 December 2017, all principal operating entities were within the risk tolerance levels set for depositor concentration and term funding maturity concentration. These risk tolerances were established by the Board and are applicable under the LFRF.
|
146
|
HSBC Holdings plc
|
Liquid assets of HSBC’s principal operating entities
The table below shows the unweighted liquidity value of assets categorised as liquid, which is used for the purposes of calculating the LCR metric.
This reflects the stock of unencumbered liquid assets at the reporting date, using the regulatory definition of liquid assets. The
amount recognised by entity at the Group level is different from the amount recognised at a solo entity level, reflecting liquidity that cannot be freely transferred up to Group.
|
Liquid assets of HSBC’s principal entities
|
|||||||||
|
31 Dec 2017
|
31 Dec 2016
|
||||||||
|
Recognised at Group and entity level
|
|
Recognised at entity level only
|
|
Recognised at Group and entity level
|
|
Recognised at entity level only
|
|
||
|
Footnotes
|
$m
|
|
$m
|
|
$m
|
|
$m
|
|
|
|
HSBC UK liquidity group
|
46
|
|
|
|
|
||||
|
Level 1
|
161,036
|
|
161,036
|
|
143,884
|
|
143,884
|
|
|
|
Level 2a
|
2,914
|
|
2,914
|
|
2,085
|
|
2,085
|
|
|
|
Level 2b
|
18,777
|
|
18,777
|
|
7,663
|
|
7,663
|
|
|
|
The Hongkong and Shanghai Banking Corporation – Hong Kong Branch
|
|
|
|
|
|||||
|
Level 1
|
68,335
|
|
77,217
|
|
48,342
|
|
98,963
|
|
|
|
Level 2a
|
26,848
|
|
26,848
|
|
23,790
|
|
23,790
|
|
|
|
Level 2b
|
5,528
|
|
5,528
|
|
3,450
|
|
3,450
|
|
|
|
HSBC Bank USA
|
|
|
|
|
|||||
|
Level 1
|
46,443
|
|
65,131
|
|
53,409
|
|
72,931
|
|
|
|
Level 2a
|
13,690
|
|
13,690
|
|
14,995
|
|
14,995
|
|
|
|
Level 2b
|
39
|
|
39
|
|
10
|
|
10
|
|
|
|
Hang Seng Bank
|
|
|
|
|
|||||
|
Level 1
|
20,804
|
|
31,091
|
|
21,798
|
|
37,525
|
|
|
|
Level 2a
|
3,287
|
|
3,287
|
|
1,474
|
|
1,474
|
|
|
|
Level 2b
|
197
|
|
197
|
|
199
|
|
199
|
|
|
|
Total of HSBC’s other principal entities
|
49
|
|
|
|
|
||||
|
Level 1
|
77,958
|
|
88,281
|
|
74,239
|
|
90,579
|
|
|
|
Level 2a
|
7,899
|
|
7,899
|
|
6,240
|
|
6,240
|
|
|
|
Level 2b
|
1,003
|
|
1,003
|
|
226
|
|
226
|
|
|
For footnotes, see page
161
.
Sources of funding
(Audited)
Our primary sources of funding are customer current accounts and customer savings deposits payable on demand or at short notice. We issue wholesale securities (secured and unsecured) to supplement our customer deposits and change the currency mix, maturity profile or location of our liabilities.
The adjacent ‘Funding sources and uses’ table provides a consolidated view of how our balance sheet is funded, and should be read in light of the LFRF, which requires operating entities to manage liquidity and funding risk on a stand-alone basis.
The table analyses our consolidated balance sheet according to the assets that primarily arise from operating activities and the sources of funding primarily supporting these activities. Assets and liabilities that do not arise from operating activities are presented as a net balancing source or deployment of funds.
In 2017, the level of customer accounts continued to exceed the level of loans and advances to customers. The positive funding gap was predominantly deployed in liquid assets (cash and balances with central banks and financial investments) as required by the LFRF.
Loans and advances to banks continued to exceed deposits by banks, meaning the Group remained a net unsecured lender to the banking sector.
|
Funding sources and uses
|
||||
|
2017
|
|
2016
|
|
|
|
$m
|
|
$m
|
|
|
|
Sources
|
||||
|
Customer accounts
|
1,364,462
|
|
1,272,386
|
|
|
Deposits by banks
|
69,922
|
|
59,939
|
|
|
Repurchase agreements – non-trading
|
130,002
|
|
88,958
|
|
|
Debt securities in issue
|
64,546
|
|
65,915
|
|
|
Liabilities of disposal groups held for sale
|
1,286
|
|
2,790
|
|
|
Subordinated liabilities
|
19,826
|
|
20,984
|
|
|
Financial liabilities designated at fair value
|
94,429
|
|
86,832
|
|
|
Liabilities under insurance contracts
|
85,667
|
|
75,273
|
|
|
Trading liabilities
|
184,361
|
|
153,691
|
|
|
– repos
|
2,255
|
|
1,428
|
|
|
– stock lending
|
8,363
|
|
3,643
|
|
|
– settlement accounts
|
11,198
|
|
15,271
|
|
|
– other trading liabilities
|
162,545
|
|
133,349
|
|
|
Total equity
|
197,871
|
|
182,578
|
|
|
At 31 Dec
|
2,212,372
|
|
2,009,346
|
|
|
Uses
|
||||
|
Loans and advances to customers
|
962,964
|
|
861,504
|
|
|
Loans and advances to banks
|
90,393
|
|
88,126
|
|
|
Reverse repurchase agreements – non-trading
|
201,553
|
|
160,974
|
|
|
Assets held for sale
|
781
|
|
4,389
|
|
|
Trading assets
|
287,995
|
|
235,125
|
|
|
– reverse repos
|
10,224
|
|
4,780
|
|
|
– stock borrowing
|
6,895
|
|
5,427
|
|
|
– settlement accounts
|
15,258
|
|
17,850
|
|
|
– other trading assets
|
255,618
|
|
207,068
|
|
|
Financial investments
|
389,076
|
|
436,797
|
|
|
Cash and balances with central banks
|
180,624
|
|
128,009
|
|
|
Net deployment in other balance sheet assets and liabilities
|
98,986
|
|
94,422
|
|
|
At 31 Dec
|
2,212,372
|
|
2,009,346
|
|
|
HSBC Holdings plc
|
147
|
Report of the Directors
| Risk
Wholesale term debt maturity profile
The maturity profile of our wholesale term debt obligations is set out in the following table.
The balances in the table are not directly comparable with those in the consolidated balance sheet because the table presents gross
cash flows relating to principal payments and not the balance sheet carrying value, which include debt securities and subordinated liabilities measured at fair value.
|
Wholesale funding cash flows payable by HSBC under financial liabilities by remaining contractual maturities
|
||||||||||||||||||
|
Due not
more than
1 month
|
|
Due over
1 month but not more than
3 months
|
|
Due over
3 months but not more than
6 months
|
|
Due over
6 months but not more than
9 months
|
|
Due over
9 months
but not more
than
1 year
|
|
Due over
1 year
but not more than
2 years
|
|
Due over
2 years
but not more than
5 years
|
|
Due over
5 years
|
|
Total
|
|
|
|
$m
|
|
$m
|
|
$m
|
|
$m
|
|
$m
|
|
$m
|
|
$m
|
|
$m
|
|
$m
|
|
|
|
Debt securities issued
|
7,502
|
|
8,409
|
|
9,435
|
|
8,132
|
|
15,111
|
|
13,000
|
|
55,347
|
|
48,234
|
|
165,170
|
|
|
– unsecured CDs and CP
|
1,085
|
|
3,636
|
|
4,334
|
|
3,064
|
|
6,132
|
|
137
|
|
386
|
|
277
|
|
19,051
|
|
|
– unsecured senior MTNs
|
1,614
|
|
2,973
|
|
3,047
|
|
2,924
|
|
5,109
|
|
6,564
|
|
41,090
|
|
39,544
|
|
102,865
|
|
|
– unsecured senior structured notes
|
1,298
|
|
1,796
|
|
2,054
|
|
1,935
|
|
2,870
|
|
4,586
|
|
10,156
|
|
5,328
|
|
30,023
|
|
|
– secured covered bonds
|
—
|
|
—
|
|
—
|
|
209
|
|
—
|
|
212
|
|
2,494
|
|
1,655
|
|
4,570
|
|
|
– secured asset-backed commercial paper
|
3,479
|
|
—
|
|
—
|
|
—
|
|
—
|
|
—
|
|
—
|
|
—
|
|
3,479
|
|
|
– secured ABS
|
—
|
|
—
|
|
—
|
|
—
|
|
—
|
|
—
|
|
914
|
|
436
|
|
1,350
|
|
|
– others
|
26
|
|
4
|
|
—
|
|
—
|
|
1,000
|
|
1,501
|
|
307
|
|
994
|
|
3,832
|
|
|
Subordinated liabilities
|
3
|
|
1,918
|
|
74
|
|
—
|
|
170
|
|
2,371
|
|
4,077
|
|
32,000
|
|
40,612
|
|
|
– subordinated debt securities
|
3
|
|
1,918
|
|
74
|
|
—
|
|
170
|
|
2,371
|
|
3,618
|
|
30,162
|
|
38,315
|
|
|
– preferred securities
|
—
|
|
—
|
|
—
|
|
—
|
|
—
|
|
—
|
|
459
|
|
1,838
|
|
2,297
|
|
|
At 31 Dec 2017
|
7,505
|
|
10,327
|
|
9,509
|
|
8,132
|
|
15,281
|
|
15,371
|
|
59,424
|
|
80,234
|
|
205,782
|
|
|
Debt securities issued
|
7,462
|
|
10,110
|
|
11,834
|
|
6,930
|
|
8,043
|
|
21,906
|
|
43,764
|
|
44,164
|
|
154,213
|
|
|
– unsecured CDs and CP
|
691
|
|
5,906
|
|
5,530
|
|
3,152
|
|
2,384
|
|
242
|
|
133
|
|
12
|
|
18,050
|
|
|
– unsecured senior MTNs
|
837
|
|
1,706
|
|
3,727
|
|
2,699
|
|
3,580
|
|
13,626
|
|
30,519
|
|
36,240
|
|
92,934
|
|
|
– unsecured senior structured notes
|
1,088
|
|
1,675
|
|
1,389
|
|
882
|
|
2,066
|
|
5,940
|
|
8,344
|
|
3,885
|
|
25,269
|
|
|
– secured covered bonds
|
1,584
|
|
—
|
|
295
|
|
71
|
|
—
|
|
207
|
|
1,357
|
|
2,559
|
|
6,073
|
|
|
– secured asset-backed commercial paper
|
3,196
|
|
—
|
|
—
|
|
—
|
|
—
|
|
—
|
|
—
|
|
—
|
|
3,196
|
|
|
– secured ABS
|
11
|
|
23
|
|
893
|
|
126
|
|
13
|
|
91
|
|
908
|
|
439
|
|
2,504
|
|
|
– others
|
55
|
|
800
|
|
—
|
|
—
|
|
—
|
|
1,800
|
|
2,503
|
|
1,029
|
|
6,187
|
|
|
Subordinated liabilities
|
13
|
|
63
|
|
145
|
|
—
|
|
500
|
|
1,775
|
|
7,292
|
|
32,179
|
|
41,967
|
|
|
– subordinated debt securities
|
13
|
|
63
|
|
145
|
|
—
|
|
500
|
|
1,775
|
|
6,881
|
|
30,425
|
|
39,802
|
|
|
– preferred securities
|
—
|
|
—
|
|
—
|
|
—
|
|
—
|
|
—
|
|
411
|
|
1,754
|
|
2,165
|
|
|
At 31 Dec 2016
|
7,475
|
|
10,173
|
|
11,979
|
|
6,930
|
|
8,543
|
|
23,681
|
|
51,056
|
|
76,343
|
|
196,180
|
|
|
148
|
HSBC Holdings plc
|
Contractual maturity of financial liabilities
The table below shows, on an undiscounted basis, all cash flows relating to principal and future coupon payments (except for trading liabilities and derivatives not treated as hedging derivatives). For this reason, balances in the table below do not agree directly with those in our consolidated balance sheet. Undiscounted cash flows payable in relation to hedging derivative liabilities are classified according to their contractual maturities. Trading liabilities and derivatives not treated as hedging derivatives are included in the ‘On demand’ time bucket and not by contractual maturity.
A maturity analysis of repos and debt securities in issue included in trading liabilities is presented in Note
28
on the Financial Statements.
In addition, loans and other credit-related commitments, financial guarantees and similar contracts are generally not recognised on our balance sheet. The undiscounted cash flows potentially payable under loan and other credit-related commitments, and financial guarantees and similar contracts are classified on the basis of the earliest date they can be called. Application of this policy throughout the Group was improved in 2017, and therefore comparative information has been represented.
|
Cash flows payable by HSBC under financial liabilities by remaining contractual maturities
|
||||||||||
|
(Audited)
|
||||||||||
|
|
On
demand |
|
Due within
3 months |
|
Due between
3 and 12 months |
|
Due between
1 and 5 years |
|
Due after
5 years |
|
|
|
$m
|
|
$m
|
|
$m
|
|
$m
|
|
$m
|
|
|
Deposits by banks
|
48,247
|
|
10,596
|
|
1,877
|
|
7,814
|
|
1,508
|
|
|
Customer accounts
|
1,159,962
|
|
153,018
|
|
44,348
|
|
7,238
|
|
675
|
|
|
Repurchase agreements – non-trading
|
20,550
|
|
106,236
|
|
2,270
|
|
1,085
|
|
—
|
|
|
Trading liabilities
|
184,361
|
|
—
|
|
—
|
|
—
|
|
—
|
|
|
Financial liabilities designated at fair value
|
715
|
|
1,249
|
|
7,117
|
|
39,596
|
|
59,428
|
|
|
Derivatives
|
212,797
|
|
219
|
|
1,221
|
|
3,170
|
|
1,506
|
|
|
Debt securities in issue
|
11
|
|
12,624
|
|
21,066
|
|
25,654
|
|
11,092
|
|
|
Subordinated liabilities
|
3
|
|
2,227
|
|
841
|
|
7,011
|
|
21,775
|
|
|
Other financial liabilities
|
48,407
|
|
18,780
|
|
3,701
|
|
1,994
|
|
1,314
|
|
|
|
1,675,053
|
|
304,949
|
|
82,441
|
|
93,562
|
|
97,298
|
|
|
Loan and other credit-related commitments
|
570,132
|
|
96,670
|
|
9,176
|
|
7,261
|
|
2,350
|
|
|
Financial guarantees and similar contracts
|
16,712
|
|
4,029
|
|
10,410
|
|
5,856
|
|
1,321
|
|
|
At 31 Dec 2017
|
2,261,897
|
|
405,648
|
|
102,027
|
|
106,679
|
|
100,969
|
|
|
Proportion of cash flows payable in period
|
76%
|
|
14%
|
|
3%
|
|
4%
|
|
3%
|
|
|
Deposits by banks
|
40,277
|
|
10,222
|
|
3,284
|
|
5,233
|
|
1,033
|
|
|
Customer accounts
|
1,079,866
|
|
145,932
|
|
38,273
|
|
8,676
|
|
559
|
|
|
Repurchase agreements – non-trading
|
18,134
|
|
66,801
|
|
2,929
|
|
1,048
|
|
—
|
|
|
Trading liabilities
|
153,691
|
|
—
|
|
—
|
|
—
|
|
—
|
|
|
Financial liabilities designated at fair value
|
1,307
|
|
2,265
|
|
5,003
|
|
34,707
|
|
61,929
|
|
|
Derivatives
|
274,283
|
|
287
|
|
1,129
|
|
2,472
|
|
1,727
|
|
|
Debt securities in issue
|
9
|
|
13,118
|
|
19,492
|
|
29,487
|
|
8,089
|
|
|
Subordinated liabilities
|
1
|
|
400
|
|
1,378
|
|
10,302
|
|
21,552
|
|
|
Other financial liabilities
|
45,569
|
|
15,844
|
|
3,050
|
|
1,525
|
|
843
|
|
|
|
1,613,137
|
|
254,869
|
|
74,538
|
|
93,450
|
|
95,732
|
|
|
Loan and other credit-related commitments
|
554,801
|
|
84,800
|
|
8,162
|
|
6,865
|
|
1,216
|
|
|
Financial guarantees and similar contracts
|
12,608
|
|
4,647
|
|
10,301
|
|
8,138
|
|
1,378
|
|
|
At 31 Dec 2016
|
2,180,546
|
|
344,316
|
|
93,001
|
|
108,453
|
|
98,326
|
|
|
Proportion of cash flows payable in period
|
78%
|
|
12%
|
|
3%
|
|
4%
|
|
3%
|
|
HSBC Holdings
Liquidity risk in HSBC Holdings is overseen by Holdings ALCO. This risk arises because of HSBC Holdings’ obligation to make payments to debt holders as they fall due and to pay its operating expenses. The liquidity risk related to these cash flows is managed by matching external debt obligations with internal loan cash flows and by maintaining an appropriate liquidity buffer that is monitored by Holdings ALCO.
The balances in the table below are not directly comparable with those on the balance sheet of HSBC Holdings as the table
incorporates, on an undiscounted basis, all cash flows relating to principal and future coupon payments (except for derivatives not treated as hedging derivatives). Undiscounted cash flows payable in relation to hedging derivative liabilities are classified according to their contractual maturities. Derivatives not treated as hedging derivatives are included in the ‘On demand’ time bucket.
In addition, loan commitments and financial guarantees and similar contracts are generally not recognised on our balance sheet. The undiscounted cash flows potentially payable under financial guarantees and similar contracts are classified on the basis of the earliest date on which they can be called.
|
HSBC Holdings plc
|
149
|
Report of the Directors
| Risk
|
Cash flows payable by HSBC Holdings under financial liabilities by remaining contractual maturities
|
||||||||||
|
(Audited)
|
||||||||||
|
On
demand |
|
Due within
3 months |
|
Due between
3 and 12 months |
|
Due between
1 and 5 years |
|
Due after
5 years |
|
|
|
$m
|
|
$m
|
|
$m
|
|
$m
|
|
$m
|
|
|
|
Amounts owed to HSBC undertakings
|
—
|
|
2,525
|
|
46
|
|
—
|
|
—
|
|
|
Financial liabilities designated at fair value
|
—
|
|
286
|
|
875
|
|
16,554
|
|
19,465
|
|
|
Derivatives
|
2,008
|
|
—
|
|
—
|
|
293
|
|
781
|
|
|
Debt securities in issue
|
—
|
|
232
|
|
1,787
|
|
13,975
|
|
26,452
|
|
|
Subordinated liabilities
|
—
|
|
2,113
|
|
537
|
|
2,852
|
|
20,944
|
|
|
Other financial liabilities
|
—
|
|
849
|
|
200
|
|
—
|
|
—
|
|
|
2,008
|
|
6,005
|
|
3,445
|
|
33,674
|
|
67,642
|
|
|
|
Loan commitments
|
—
|
|
—
|
|
—
|
|
—
|
|
—
|
|
|
Financial guarantees and similar contracts
|
7,778
|
|
—
|
|
—
|
|
—
|
|
—
|
|
|
At 31 Dec 2017
|
9,786
|
|
6,005
|
|
3,445
|
|
33,674
|
|
67,642
|
|
|
Amounts owed to HSBC undertakings
|
—
|
|
2,051
|
|
—
|
|
105
|
|
—
|
|
|
Financial liabilities designated at fair value
|
—
|
|
314
|
|
960
|
|
11,964
|
|
25,665
|
|
|
Derivatives
|
3,841
|
|
—
|
|
—
|
|
592
|
|
592
|
|
|
Debt securities in issue
|
—
|
|
157
|
|
478
|
|
8,393
|
|
19,164
|
|
|
Subordinated liabilities
|
—
|
|
196
|
|
598
|
|
4,461
|
|
20,899
|
|
|
Other financial liabilities
|
—
|
|
1,343
|
|
164
|
|
—
|
|
—
|
|
|
3,841
|
|
4,061
|
|
2,200
|
|
25,515
|
|
66,320
|
|
|
|
Loan commitments
|
—
|
|
—
|
|
—
|
|
—
|
|
—
|
|
|
Financial guarantees and similar contracts
|
7,619
|
|
—
|
|
—
|
|
—
|
|
—
|
|
|
At 31 Dec 2016
|
11,460
|
|
4,061
|
|
2,200
|
|
25,515
|
|
66,320
|
|
|
Market risk profile
|
|
|
Page
|
|
|
Market risk in 2017
|
|
|
Trading portfolios
|
|
|
Non-trading portfolios
|
|
|
Market risk balance sheet linkages
|
|
|
Structural foreign exchange exposures
|
|
|
Net interest income sensitivity
|
|
|
Sensitivity of capital and reserves
|
|
|
Third-party assets in Balance Sheet Management
|
|
|
Defined benefit pension schemes
|
|
|
Additional market risk measures applicable only to the parent company
|
|
Market risk in 2017
Market risk is the risk that movements in market factors, such as foreign exchange rates, interest rates, credit spreads, equity prices and commodity prices, will reduce our income or the value of our portfolios. Exposure to market risk is separated into two portfolios:
|
•
|
trading portfolios; and
|
|
•
|
non-trading portfolios.
|
Market risk exposures arising from our insurance manufacturing operations are discussed on page
118
.
A summary of our current policies and practices regarding the management of market risk is set out on page
115
.
Global markets were influenced by positive global growth forecasts and broadly accommodative monetary policies. Although bond yields have started to increase, yield curves remain low and flat by historical standards. Outside of the US and UK, where central banks started to raise interest rates, other key central banks kept reference interest rates unchanged.
Realised and implied volatilities also remain low by historical standards, despite various geopolitical tensions that create uncertainty for markets. The impact of these risks on markets, in particular China, where debt levels remain high, did not crystallise into significant market moves or volatility during 2017.
Equity markets continued to reach new highs into the year end, in both developed and emerging markets, supported by robust earnings forecasts.
The EU and UK have agreed to move to the next phase of the ‘Brexit’ talks, however the ongoing uncertainty regarding the terms of the exit from the EU remains.
Trading value at risk (‘VaR’) ended the year higher when compared to the previous year. The trading VaR composition changed during the year, where equity and credit spread trading VaR increased relative to interest rate VaR. The increases in equity and credit spread trading VaR during 2H17 has resulted in these asset classes becoming major contributors to the overall trading VaR, in addition to interest rate risk trading VaR.
Non-trading interest rate VaR ended the year lower when compared to the previous year. In 1H17 non-trading interest rate VaR decreased as exposures were managed down and was largely range bound during 2H17.
Trading portfolios
Value at risk of the trading portfolios
Trading VaR predominantly resides within Global Markets where
trading VaR was higher at 31 December 2017 compared with 31 December 2016. In 1H17, the trading VaR from the credit spread asset class increased reflecting larger exposures. This was partly offset by a reduction in the interest rate asset class, from modelling enhancements, which led to an improved measure.
In 2H17, trading VaR increased from two asset classes: credit spread and equity. The increase in the credit spread trading VaR was driven by increased exposures and changes to the calibration of benchmark curves used for lower rated trading portfolios. The change in equity trading VaR was from fluctuations in dividend and correlation exposures. These increases into year-end in the VaR measures for these asset classes were partially offset by a reduction in the interest rates asset class VaR.
|
150
|
HSBC Holdings plc
|
The daily levels of total trading VaR over the last year are set out in the graph below.
|
Daily VaR (trading portfolios), 99% 1 day ($m)
|
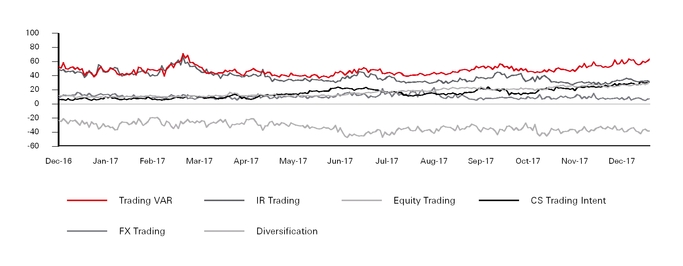
The Group trading VaR for the year is shown in the table below.
|
Trading VaR, 99% 1 day
50
|
||||||||||||
|
(Audited)
|
||||||||||||
|
Foreign
exchange (FX)
and commodity
|
|
Interest
rate (IR)
|
|
Equity (EQ)
|
|
Credit
spread (CS)
|
|
Portfolio diversification
51
|
|
Total
52
|
|
|
|
$m
|
|
$m
|
|
$m
|
|
$m
|
|
$m
|
|
$m
|
|
|
|
Balance at 31 Dec 2017
|
7.4
|
|
30.8
|
|
32.6
|
|
31.1
|
|
(38.2
|
)
|
63.7
|
|
|
Average
|
10.4
|
|
38.2
|
|
16.7
|
|
15.4
|
|
(32.9
|
)
|
47.8
|
|
|
Maximum
|
23.0
|
|
67.1
|
|
32.6
|
|
31.8
|
|
|
|
70.8
|
|
|
Minimum
|
4.9
|
|
27.2
|
|
9.1
|
|
5.1
|
|
|
|
36.6
|
|
|
Balance at 31 Dec 2016
|
8.9
|
|
49.8
|
|
11.8
|
|
5.9
|
|
(23.5
|
)
|
52.8
|
|
|
Average
|
11.1
|
|
42.8
|
|
20.4
|
|
13.5
|
|
(30.3
|
)
|
57.5
|
|
|
Maximum
|
16.9
|
|
64.2
|
|
32.4
|
|
28.1
|
|
|
|
91.5
|
|
|
Minimum
|
5.4
|
|
31.8
|
|
11.8
|
|
5.0
|
|
|
|
42.1
|
|
For footnotes, see page
161
.
Back-testing
In 2017, the Group experienced two back-testing exceptions against hypothetical profit and loss in December: a loss exception, driven by a margin loan; and a profit exception, driven by gains on Japanese yen cross currency swaps, and gains in strategic foreign exchange hedges.
There was no evidence of model errors or control failures.
The back-testing result excludes exceptions due to changes in fair value adjustments.
Non-trading portfolios
Value at risk of the non-trading portfolios
Non-trading VaR of the Group includes contributions from all global businesses. There is no commodity risk in the non-trading portfolios.
The gradual reduction in the non-trading interest rate VaR was due to de-risking the banking book in 2017.
Non-trading VaR includes the interest rate risk in the banking book transferred to and managed by Balance Sheet Management (‘BSM’) and the non-trading financial instruments held by BSM. The management of interest rate risk in the banking book and the role of BSM are described further in Interest rate risk in the banking book section below.
Non-trading VaR excludes the insurance operations which are discussed further on page
156
and the interest rate risk in the banking book arising from HSBC Holdings.
|
HSBC Holdings plc
|
151
|
Report of the Directors
| Risk
The daily levels of total non-trading VaR over the last year are set out in the graph below.
|
Daily VaR (non-trading portfolios), 99% 1 day ($m)
|
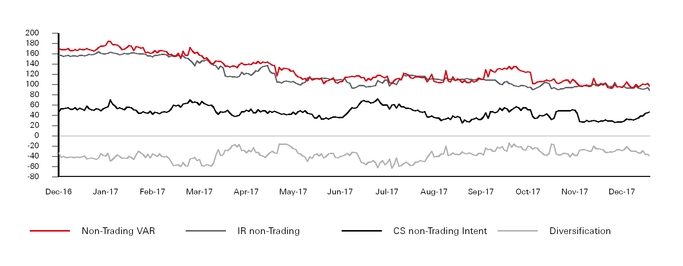
The Group non-trading VaR for the year is shown in the table below.
|
Non-trading VaR, 99% 1 day
|
||||||||
|
(Audited)
|
||||||||
|
Interest
rate (IR)
|
|
Credit
spread (CS)
|
|
Portfolio
diversification 51 |
|
Total
52
|
|
|
|
$m
|
|
$m
|
|
$m
|
|
$m
|
|
|
|
Balance at 31 Dec 2017
|
88.5
|
|
46.7
|
|
(38.9
|
)
|
96.3
|
|
|
Average
|
119.0
|
|
46.1
|
|
(36.9
|
)
|
128.2
|
|
|
Maximum
|
164.1
|
|
71.9
|
|
|
|
183.8
|
|
|
Minimum
|
88.5
|
|
24.5
|
|
|
|
93.3
|
|
|
Balance at 31 Dec 2016
|
157.0
|
|
46.5
|
|
(32.1
|
)
|
171.4
|
|
|
Average
|
131.6
|
|
52.8
|
|
(32.1
|
)
|
152.2
|
|
|
Maximum
|
171.9
|
|
82.8
|
|
182.1
|
|
||
|
Minimum
|
100.2
|
|
36.9
|
|
123.3
|
|
||
For footnotes, see page
161
.
Non-trading VaR excludes equity risk on available-for-sale securities, structural foreign exchange risk and interest rate risk on fixed-rate securities issued by HSBC Holdings. This section and the sections below describe the scope of HSBC’s management of market risks in non-trading books.
Equity securities classified as available for sale
|
Fair value of equity securities
|
|||||
|
(Audited)
|
|||||
|
2017
|
|
2016
|
|
||
|
Footnotes
|
$bn
|
|
$bn
|
|
|
|
Private equity holdings
|
53
|
1.0
|
|
1.2
|
|
|
Investment to facilitate ongoing business
|
54
|
1.6
|
|
1.5
|
|
|
Other strategic investments
|
1.3
|
|
2.0
|
|
|
|
At 31 Dec
|
3.9
|
|
4.7
|
|
|
For footnotes, see page
161
.
The table above sets out the maximum possible loss on shareholders’ equity from available-for-sale equity securities.
The fair value of equity securities classified as available for sale reduced from $4.7bn to $3.9bn. The decrease in ‘Other strategic investments’ was largely due to the sale of two investments: Visa and First Data.
Market risk balance sheet linkages
Below are the balance sheet lines in the Group’s consolidated position that are subject to market risk.
Trading assets and liabilities
The Group’s trading assets and liabilities are in almost all cases originated by GB&M. These assets and liabilities are treated as traded risk for the purposes of market risk management, other than a limited number of exceptions, primarily in Global Banking where the short-term acquisition and disposal of the assets are linked to other non-trading related activities such as loan origination.
Derivative assets and liabilities
We undertake derivative activity for three primary purposes: to create risk management solutions for clients, to manage the portfolio risks arising from client business, and to manage and hedge our own risks. Most of our derivative exposures arise from sales and trading activities within GB&M, and are treated as traded risk for market risk management purposes.
The assets and liabilities included in trading VaR give rise to a large proportion of the income included in net trading income.
As set out on page
212
, HSBC’s net trading income in 2017 was $7,719m (2016: $9,452m). Adjustments to trading income such as valuation adjustments do not affect the trading VaR model.
For information on the accounting policies applied to financial instruments at fair value, see Note
13
on the Financial Statements.
|
152
|
HSBC Holdings plc
|
Structural foreign exchange exposures
For our policies and procedures for managing structural foreign exchange exposures, see page
115
of the Risk management section.
Structural foreign exchange exposures represent net investments in subsidiaries, branches and associates, the functional currencies of which are currencies other than the US dollar. Exchange differences on structural exposures are recognised in ‘Other comprehensive income’.
|
Net structural foreign exchange exposures
|
||||
|
2017
|
|
2016
|
|
|
|
$m
|
|
$m
|
|
|
|
Currency of structural exposure
|
||||
|
Pound sterling
1
|
37,039
|
|
27,527
|
|
|
Hong Kong dollars
|
33,992
|
|
32,472
|
|
|
Chinese renminbi
|
27,968
|
|
24,504
|
|
|
Euros
|
20,269
|
|
17,397
|
|
|
Indian rupees
|
4,286
|
|
3,901
|
|
|
Mexican pesos
|
4,270
|
|
3,826
|
|
|
Canadian dollars
|
4,241
|
|
3,734
|
|
|
Saudi riyals
|
3,971
|
|
3,690
|
|
|
Malaysian ringgit
|
2,461
|
|
2,079
|
|
|
Singapore dollars
|
2,433
|
|
1,995
|
|
|
UAE dirhams
|
2,054
|
|
2,073
|
|
|
Australian dollars
|
1,892
|
|
1,667
|
|
|
Taiwanese dollars
|
1,877
|
|
1,753
|
|
|
Indonesian rupiah
|
1,845
|
|
1,439
|
|
|
Korean won
|
1,423
|
|
1,260
|
|
|
Swiss francs
|
950
|
|
2,226
|
|
|
Turkish lira
|
778
|
|
734
|
|
|
Thai baht
|
766
|
|
736
|
|
|
Argentine pesos
|
753
|
|
860
|
|
|
Brazilian real
|
745
|
|
755
|
|
|
Others, each less than $700m
|
5,623
|
|
5,728
|
|
|
At 31 Dec
|
159,636
|
|
140,356
|
|
|
1
|
At 31 December, we maintained forward foreign exchange contracts of $5bn (2016: $5bn) in order to manage our sterling structural foreign exchange exposure.
|
Shareholders’ equity would decrease by $2,659m (2016: $2,247m) if euro and sterling foreign currency exchange rates weakened by 5% relative to the US dollar.
Net interest income sensitivity
These disclosures have been enhanced in order to show sensitivity effects above one year. The tables set out the assessed impact to a hypothetical base case projection of our net interest income (‘NII’) (excluding insurance) under the following scenarios:
|
•
|
a series of four quarterly parallel shocks of 25 basis points to the current market-implied path of interest rates across all currencies at the beginning of each quarter from 1 January 2018 (effect over 1 year);
|
|
•
|
an immediate shock of 25 basis points to the current market-implied path of interest rates across all currencies on 1 January 2018 (effects over 1 year and 5 years); and
|
|
•
|
an immediate shock of 100 basis points to the current market-implied path of interest rates across all currencies on 1 January 2018 (effects over 1 year and 5 years).
|
The sensitivities shown represent our assessment of the change to a hypothetical base case NII, assuming a static balance sheet and no management actions from BSM. They incorporate the effect of interest rate behaviouralisation, managed rate product pricing assumptions and customer behaviour, for example, prepayment of mortgages or customer migration from non-interest bearing to interest bearing deposit accounts under the specific interest rate scenarios. The scenarios represent interest rate shocks to the current market implied path of rates.
The NII sensitivities shown are indicative and based on simplified scenarios. A sequence of four quarterly 25 bps rises would increase projected net interest income for 2018 by $2,178m (2017: $1,709), while a sequence of four quarterly 25bps falls would decrease projected net interest income in 2018 by $2,492, (2017: $2,409). These figures reflect a reassessment of assumptions from those used in 2017.
The structural sensitivity arising from the four global businesses, excluding Global Markets, is positive in a rising rate environment and negative in a falling rate environment. Both BSM and Global Markets have NII sensitivity profiles that offset this to some degree. The tables do not include BSM management actions or changes in Global Markets’ net trading income that may further limit the offset.
The limitations of this analysis are discussed within the ‘Risk management’ section on page
116
.
|
Net interest income sensitivity (12 months)
|
||||||||||||
|
(Audited)
|
||||||||||||
|
US dollar
|
|
HK dollar
|
|
Sterling
|
|
Euro
|
|
Other
|
|
Total
|
|
|
|
$m
|
|
$m
|
|
$m
|
|
$m
|
|
$m
|
|
$m
|
|
|
|
Change in 2018 net interest income arising from a shift in yield curves of:
|
|
|
|
|
|
|
|
|
|
|
|
|
|
+25 basis points at the beginning of each quarter
|
563
|
|
511
|
|
407
|
|
249
|
|
448
|
|
2,178
|
|
|
-
25 basis points at the beginning of each quarter
|
(821
|
)
|
(789
|
)
|
(494
|
)
|
17
|
|
(405
|
)
|
(2,492
|
)
|
|
|
|
|
|
|
|
|
|
|
|
|
|
|
|
Change in 2017 net interest income arising from a shift in yield curves of:
|
|
|
|
|
|
|
|
|
|
|
|
|
|
+25 basis points at the beginning of each quarter
|
577
|
|
504
|
|
61
|
|
153
|
|
414
|
|
1,709
|
|
|
-
25 basis points at the beginning of each quarter
|
(985
|
)
|
(797
|
)
|
(261
|
)
|
9
|
|
(372
|
)
|
(2,406
|
)
|
|
NII sensitivity to an instantaneous change in yield curves (12 months)
|
||||||||||||
|
Currency
|
||||||||||||
|
US dollar
|
|
HK dollar
|
|
Sterling
|
|
Euro
|
|
Other
|
|
Total
|
|
|
|
$m
|
|
$m
|
|
$m
|
|
$m
|
|
$m
|
|
$m
|
|
|
|
+25bps parallel
|
227
|
|
179
|
|
147
|
|
50
|
|
203
|
|
806
|
|
|
-25bps parallel
|
(287
|
)
|
(305
|
)
|
(181
|
)
|
8
|
|
(160
|
)
|
(925
|
)
|
|
+100bps parallel
|
845
|
|
711
|
|
600
|
|
412
|
|
731
|
|
3,299
|
|
|
-100bps parallel
|
(1,444
|
)
|
(1,425
|
)
|
(631
|
)
|
31
|
|
(732
|
)
|
(4,201
|
)
|
The net interest income sensitivities arising from the scenarios presented in the tables above are not directly comparable. This is due to timing differences relating to interest rate changes and the repricing of assets and liabilities.
|
HSBC Holdings plc
|
153
|
Report of the Directors
| Risk
|
NII sensitivity to an instantaneous change in yield curves (5 years)
|
||||||||||||
|
Year 1
|
|
Year 2
|
|
Year 3
|
|
Year 4
|
|
Year 5
|
|
Total
|
|
|
|
$m
|
|
$m
|
|
$m
|
|
$m
|
|
$m
|
|
$m
|
|
|
|
+25bps parallel
|
806
|
|
1,153
|
|
1,326
|
|
1,439
|
|
1,507
|
|
6,231
|
|
|
-25bps parallel
|
(925
|
)
|
(872
|
)
|
(1,154
|
)
|
(1,271
|
)
|
(1,381
|
)
|
(5,603
|
)
|
|
+100bps parallel
|
3,299
|
|
4,463
|
|
5,105
|
|
5,472
|
|
5,759
|
|
24,098
|
|
|
-100bps parallel
|
(4,201
|
)
|
(4,538
|
)
|
(5,102
|
)
|
(5,498
|
)
|
(5,813
|
)
|
(25,152
|
)
|
Sensitivity of capital and reserves
Under CRD IV, available-for-sale (‘AFS’) reserves are included as part of CET1 capital. We measure the potential downside risk to the CET1 ratio due to interest rate and credit spread risk in the AFS portfolio using the portfolio’s stressed VaR, with a 99% confidence level and an assumed holding period of one quarter. At December 2017, the stressed VaR of the portfolio was $2.6bn (2016: $3.2bn).
We monitor the sensitivity of reported cash flow hedging reserves to interest rate movements on a monthly basis by assessing the
expected reduction in valuation of cash flow hedges due to parallel movements of plus or minus 100bps in all yield curves. These particular exposures form only a part of our overall interest rate exposure.
The following table describes the sensitivity of our cash flow hedge reported reserves to the stipulated movements in yield curves and the maximum and minimum month-end figures during the year. The sensitivities are indicative and based on simplified scenarios.
|
Sensitivity of cash flow hedging reported reserves to interest rate movements
|
||||||
|
Maximum
impact
|
|
Minimum
impact
|
|
|||
|
$m
|
|
$m
|
|
$m
|
|
|
|
At 31 Dec 2017
|
|
|
|
|
|
|
|
+100 basis point parallel move in all yield curves
|
(684
|
)
|
(839
|
)
|
(684
|
)
|
|
As a percentage of total shareholders’ equity
|
(0.36)%
|
|
(0.44)%
|
|
(0.36)%
|
|
|
-100 basis point parallel move in all yield curves
|
720
|
|
860
|
|
720
|
|
|
As a percentage of total shareholders’ equity
|
0.38%
|
|
0.45%
|
|
0.38%
|
|
|
|
|
|
|
|
|
|
|
At 31 Dec 2016
|
|
|
|
|
|
|
|
+100 basis point parallel move in all yield curves
|
(1,051
|
)
|
(1,173
|
)
|
(1,051
|
)
|
|
As a percentage of total shareholders’ equity
|
(0.6)%
|
|
(0.7)%
|
|
(0.60)%
|
|
|
-100 basis point parallel move in all yield curves
|
1,080
|
|
1,145
|
|
1,080
|
|
|
As a percentage of total shareholders’ equity
|
0.6%
|
|
0.7%
|
|
0.60%
|
|
Third-party assets in Balance Sheet Management
For our BSM governance framework, see page
116
of ‘Risk management’.
Third-party assets in BSM increased by 1% during 2017. Cash and balances at central banks increased by $52bn, predominantly in Europe as a result of Financial investment maturities and disposals.
Financial investments decreased by $50bn, predominantly in Europe, along with a decrease in Asia, where funds were deployed into other business lines.
|
Third-party assets in Balance Sheet Management
|
||||
|
2017
|
|
2016
|
|
|
|
$m
|
|
$m
|
|
|
|
Cash and balances at central banks
|
161,715
|
|
110,052
|
|
|
Trading assets
|
637
|
|
414
|
|
|
Loans and advances:
|
|
|
||
|
– to banks
|
36,047
|
|
38,188
|
|
|
– to customers
|
3,202
|
|
2,564
|
|
|
Reverse repurchase agreements
|
38,842
|
|
35,143
|
|
|
Financial investments
|
309,908
|
|
360,315
|
|
|
Other
|
4,648
|
|
4,839
|
|
|
At 31 Dec
|
554,999
|
|
551,515
|
|
Defined benefit pension schemes
Market risk arises within our defined benefit pension schemes to the extent that the obligations of the schemes are not fully matched by assets with determinable cash flows.
For details of our defined benefit schemes, including asset allocation, see Note
5
on the Financial Statements, and for pension risk management see page
120
.
Additional market risk measures applicable only to the parent company
HSBC Holdings uses VaR to monitor and manage foreign exchange risk. In order to manage interest rate risk, HSBC Holdings uses the project sensitivity of its net interest income to future changes in yield curves and the interest rate gap repricing tables.
|
154
|
HSBC Holdings plc
|
Foreign exchange risk
Total foreign exchange VaR arising within HSBC Holdings in 2017 was as follows.
|
HSBC Holdings – foreign exchange VaR
|
||||
|
2017
|
|
2016
|
|
|
|
$m
|
|
$m
|
|
|
|
At 31 Dec
|
78.9
|
|
32.1
|
|
|
Average
|
86.1
|
|
44.4
|
|
|
Minimum
|
74.9
|
|
32.1
|
|
|
Maximum
|
101.2
|
|
58.2
|
|
The foreign exchange risk arises from loans to subsidiaries of a capital nature that are not denominated in the functional currency of either the provider or the recipient and which are accounted for as financial assets, and from structural foreign exchange hedges. Changes in the carrying amount of these loans due to foreign exchange rate differences, and changes in the fair value of foreign
exchange hedges are taken directly to HSBC Holdings’ income statement.
Sensitivity of net interest income
HSBC Holdings monitors NII sensitivity over a five-year time horizon reflecting the longer-term perspective on interest rate risk management appropriate to a financial services holding company. These sensitivities assume that any issuance where HSBC Holdings has an option to reimburse at a future call date is called at this date. The table below sets out the effect on HSBC Holdings’ future NII over a five-year time horizon of incremental 25 basis point parallel falls or rises in all yield curves at the beginning of each quarter during the 12 months from 1 January 2018.
Assuming no management actions, under the scenarios outlined above, base case NII for the next five years would increase by $981m (2017: increase of $746m) under rising rates, and decrease by $904m (2017: decrease of $723m) under falling rates.
|
Sensitivity of HSBC Holdings’ net interest income to interest rate movements
|
||||||||
|
US dollar
|
|
Sterling
|
|
Euro
|
|
Total
|
|
|
|
$m
|
|
$m
|
|
$m
|
|
$m
|
|
|
|
Change in projected net interest income as at 31 Dec arising from a shift in yield curves
|
||||||||
|
2018
|
||||||||
|
of +25 basis points at the beginning of each quarter
|
|
|
|
|
|
|
|
|
|
0-1 year
|
86
|
|
9
|
|
(13
|
)
|
82
|
|
|
2-3 years
|
362
|
|
39
|
|
41
|
|
442
|
|
|
4-5 years
|
365
|
|
41
|
|
52
|
|
458
|
|
|
of -25 basis points at the beginning of each quarter
|
|
|
|
|
|
|
|
|
|
0-1 year
|
(86
|
)
|
(7
|
)
|
24
|
|
(69
|
)
|
|
2-3 years
|
(362
|
)
|
(36
|
)
|
7
|
|
(391
|
)
|
|
4-5 years
|
(365
|
)
|
(41
|
)
|
(38
|
)
|
(444
|
)
|
|
2017
|
||||||||
|
of +25 basis points at the beginning of each quarter
|
||||||||
|
0-1 year
|
84
|
|
6
|
|
—
|
|
90
|
|
|
2-3 years
|
299
|
|
20
|
|
6
|
|
325
|
|
|
4-5 years
|
304
|
|
20
|
|
8
|
|
332
|
|
|
of -25 basis points at the beginning of each quarter
|
|
|
|
|
|
|
|
|
|
0-1 year
|
(84
|
)
|
(4
|
)
|
—
|
|
(88
|
)
|
|
2-3 years
|
(299
|
)
|
(13
|
)
|
—
|
|
(312
|
)
|
|
4-5 years
|
(304
|
)
|
(19
|
)
|
(1
|
)
|
(324
|
)
|
|
NII sensitivity to an instantaneous change in yield curves (5 years)
|
||||||||||||
|
Year 1
|
|
Year 2
|
|
Year 3
|
|
Year 4
|
|
Year 5
|
|
Total
|
|
|
|
$m
|
|
$m
|
|
$m
|
|
$m
|
|
$m
|
|
$m
|
|
|
|
+25bps parallel
|
34
|
|
52
|
|
52
|
|
53
|
|
53
|
|
244
|
|
|
-25bps parallel
|
(26
|
)
|
(47
|
)
|
(57
|
)
|
(53
|
)
|
(53
|
)
|
(236
|
)
|
|
+100bps parallel
|
135
|
|
208
|
|
210
|
|
210
|
|
210
|
|
973
|
|
|
-100bps parallel
|
(97
|
)
|
(168
|
)
|
(189
|
)
|
(201
|
)
|
(205
|
)
|
(860
|
)
|
For footnote, see page
161
.
The interest rate sensitivities tabulated above are indicative and based on simplified scenarios. The figures represent hypothetical movements in NII based on our projected yield curve scenarios, HSBC Holdings’ current interest rate risk profile and assumed changes to that profile during the next five years.
The sensitivities represent our assessment of the change to a hypothetical base case based on a static balance sheet assumption and do not take into account the effect of actions that could be taken to mitigate this interest rate risk.
Interest rate repricing gap table
The interest rate risk on the fixed-rate securities issued by HSBC Holdings is not included within the Group VaR but is managed on a repricing gap basis. The interest rate repricing gap table below analyses the full-term structure of interest rate mismatches within HSBC Holdings’ balance sheet where debt issuances are reflected based on either the next reprice date if floating rate or the maturity/call date, whichever is first, if fixed rate.
|
HSBC Holdings plc
|
155
|
Report of the Directors
| Risk
|
Repricing gap analysis of HSBC Holdings
|
||||||||||||
|
Total
|
|
Up to
1 year
|
|
From over
1 to 5 years
|
|
From over
5 to 10 years
|
|
More than
10 years
|
|
Non-interest
bearing
|
|
|
|
$m
|
|
$m
|
|
$m
|
|
$m
|
|
$m
|
|
$m
|
|
|
|
Cash at bank and in hand:
|
||||||||||||
|
– balances with HSBC undertakings
|
1,985
|
|
1,985
|
|
—
|
|
—
|
|
—
|
|
—
|
|
|
Derivatives
|
2,388
|
|
—
|
|
—
|
|
—
|
|
—
|
|
2,388
|
|
|
Loans and advances to HSBC undertakings
|
88,571
|
|
63,237
|
|
6,027
|
|
12,521
|
|
3,351
|
|
3,435
|
|
|
Financial investments in HSBC undertakings
|
4,264
|
|
2,375
|
|
—
|
|
—
|
|
—
|
|
1,889
|
|
|
Investments in subsidiaries
|
92,930
|
|
4,866
|
|
2,640
|
|
—
|
|
85,424
|
|
||
|
Other assets
|
1,596
|
|
—
|
|
—
|
|
—
|
|
—
|
|
1,596
|
|
|
Total assets
|
191,734
|
|
72,463
|
|
8,667
|
|
12,521
|
|
3,351
|
|
94,732
|
|
|
Amounts owed to HSBC undertakings
|
(2,571
|
)
|
—
|
|
(2,571
|
)
|
||||||
|
Financial liabilities designated at fair values
|
(30,890
|
)
|
—
|
|
(12,895
|
)
|
(10,175
|
)
|
(4,453
|
)
|
(3,367
|
)
|
|
Derivatives
|
(3,082
|
)
|
—
|
|
—
|
|
—
|
|
—
|
|
(3,082
|
)
|
|
Debt securities in issue
|
(34,258
|
)
|
(8,433
|
)
|
(9,017
|
)
|
(14,517
|
)
|
(3,351
|
)
|
1,060
|
|
|
Other liabilities
|
(1,269
|
)
|
—
|
|
—
|
|
—
|
|
—
|
|
(1,269
|
)
|
|
Subordinated liabilities
|
(15,877
|
)
|
(1,918
|
)
|
(1,798
|
)
|
(2,000
|
)
|
(9,713
|
)
|
(448
|
)
|
|
Total equity
|
(103,787
|
)
|
(7,450
|
)
|
(6,047
|
)
|
(8,899
|
)
|
(1,498
|
)
|
(79,893
|
)
|
|
Total liabilities and equity
|
(191,734
|
)
|
(17,801
|
)
|
(29,757
|
)
|
(35,591
|
)
|
(19,015
|
)
|
(89,570
|
)
|
|
Off-balance sheet items attracting interest rate sensitivity
|
(41,199
|
)
|
17,812
|
|
14,171
|
|
7,705
|
|
1,511
|
|
||
|
Net interest rate risk gap at 31 Dec 2017
|
13,463
|
|
(3,278
|
)
|
(8,899
|
)
|
(7,959
|
)
|
6,673
|
|
||
|
Cumulative interest rate gap
|
13,463
|
|
10,185
|
|
1,286
|
|
(6,673
|
)
|
—
|
|
||
|
Cash at bank and in hand:
|
||||||||||||
|
– balances with HSBC undertakings
|
247
|
|
247
|
|
—
|
|
—
|
|
—
|
|
—
|
|
|
Derivatives
|
2,148
|
|
—
|
|
—
|
|
—
|
|
—
|
|
2,148
|
|
|
Loans and advances to HSBC undertakings
|
77,421
|
|
72,288
|
|
279
|
|
405
|
|
—
|
|
4,449
|
|
|
Financial investments in HSBC undertakings
|
3,590
|
|
2,675
|
|
731
|
|
8
|
|
—
|
|
176
|
|
|
Investments in subsidiaries
|
95,850
|
|
4,751
|
|
2,445
|
|
—
|
|
—
|
|
88,654
|
|
|
Other assets
|
1,542
|
|
—
|
|
105
|
|
—
|
|
—
|
|
1,437
|
|
|
Total assets
|
180,798
|
|
79,961
|
|
3,560
|
|
413
|
|
—
|
|
96,864
|
|
|
Amounts owed to HSBC undertakings
|
(2,157
|
)
|
(105
|
)
|
(2,052
|
)
|
||||||
|
Financial liabilities designated at fair values
|
(30,113
|
)
|
(1,109
|
)
|
(7,344
|
)
|
(12,588
|
)
|
(6,422
|
)
|
(2,650
|
)
|
|
Derivatives
|
(5,025
|
)
|
—
|
|
—
|
|
—
|
|
—
|
|
(5,025
|
)
|
|
Debt securities in issue
|
(21,805
|
)
|
(4,199
|
)
|
(2,997
|
)
|
(11,708
|
)
|
(3,916
|
)
|
1,015
|
|
|
Other liabilities
|
(1,651
|
)
|
—
|
|
—
|
|
—
|
|
—
|
|
(1,651
|
)
|
|
Subordinated liabilities
|
(15,189
|
)
|
—
|
|
(3,267
|
)
|
(2,000
|
)
|
(9,445
|
)
|
(477
|
)
|
|
Total equity
|
(104,858
|
)
|
(7,450
|
)
|
(3,500
|
)
|
(7,502
|
)
|
—
|
|
(86,406
|
)
|
|
Total liabilities and equity
|
(180,798
|
)
|
(12,863
|
)
|
(17,108
|
)
|
(33,798
|
)
|
(19,783
|
)
|
(97,246
|
)
|
|
Off-balance sheet items attracting interest rate sensitivity
|
(57,089
|
)
|
13,608
|
|
26,296
|
|
13,441
|
|
3,744
|
|
||
|
Net interest rate risk gap at 31 Dec 2016
1
|
10,009
|
|
60
|
|
(7,089
|
)
|
(6,342
|
)
|
3,362
|
|
||
|
Cumulative interest rate gap
|
10,009
|
|
10,069
|
|
2,980
|
|
(3,362
|
)
|
—
|
|
||
|
1
|
Investments in subsidiaries and equity have been allocated based on call dates for any callable bonds. The prior year figures have been amended to reflect this.
|
Operational risk profile
Operational risk is the risk to achieving our strategy or objectives as a result of inadequate or failed internal processes, people and systems or from external events.
Responsibility for minimising operational risk lies with HSBC’s employees. They are required to manage the operational risks of the business and operational activities for which they are responsible.
A summary of our current policies and practices regarding the management of operational risk is set out on page
117
.
Operational risk exposures in 2017
In 2017 we continued our ongoing work to strengthen those controls that manage our most material risks. Among other measures, we:
|
•
|
further developed controls to help ensure that we know our customers, ask the right questions, monitor transactions and escalate concerns to detect, prevent and deter financial crime risk;
|
|
•
|
implemented a number of initiatives to raise our standards in relation to the conduct of our business and other regulatory compliance-related initiatives, as described on page
117
of the ‘Regulatory compliance risk management’ section;
|
|
•
|
increased monitoring and enhanced detective controls to manage those fraud risks which arise from new technologies and new ways of banking;
|
|
•
|
strengthened internal security controls to prevent cyber-attacks;
|
|
•
|
improved controls and security to protect customers when using digital channels; and
|
|
•
|
enhanced our third-party risk management capability to enable the consistent risk assessment of any third-party service.
|
Further information on the nature of these risks is provided in ‘Top and emerging risks’ on page
95
and in ‘Risk management’ from pages
106
to
121
.
Operational risk losses in 2017
Operational risk losses in 2017 are lower than in 2016, reflecting a reduction in losses incurred relating to large legacy conduct-related events. Provisions related to the civil money penalty order associated with the Federal Reserve Board agreed in September 2017 and the deferred prosecution agreement with the US Department of Justice in January 2018, in connection with investigations into HSBC’s historical foreign exchange activities, were recognised in prior periods. For further details see Note
34
on the Financial Statements and on conduct-related costs included in significant items on page
84
.
|
156
|
HSBC Holdings plc
|
Insurance manufacturing operations risk in 2017
The majority of the risk in our insurance business derives from manufacturing activities and can be categorised as financial risk or insurance risk. Financial risks include market risk, credit risk and liquidity risk. Insurance risk is the risk, other than financial risk, of loss transferred from the holder of the insurance contract to the issuer (HSBC).
A summary of our current policies and practices regarding the management of insurance risk is set out on page
118
.
HSBC’s bancassurance model
We operate an integrated bancassurance model that provides insurance products principally for customers with whom we have a banking relationship.
The insurance contracts we sell relate to the underlying needs of our banking customers, which we can identify from our point-of-sale contacts and customer knowledge. For the products we manufacture, the majority of sales are of savings, universal life and credit and term life contracts.
By focusing largely on personal and SME lines of business, we are able to optimise volumes and diversify individual insurance risks. We choose to manufacture these insurance products in HSBC subsidiaries based on an assessment of operational scale and risk appetite. Manufacturing insurance allows us to retain the risks and rewards associated with writing insurance contracts by keeping part of the underwriting profit and investment income within the Group.
We have life insurance manufacturing subsidiaries in nine countries (Argentina, mainland China, France, Hong Kong, Malaysia, Malta, Mexico, Singapore and the UK). We also have a life insurance manufacturing associate in India.
Where we do not have the risk appetite or operational scale to be an effective insurance manufacturer, we engage with a handful of leading external insurance companies in order to provide insurance products to our customers through our banking network and direct channels. These arrangements are generally structured with our exclusive strategic partners and earn the Group a combination of commissions, fees and a share of profits. We distribute insurance products in all of our geographical regions.
Insurance products are sold worldwide, predominantly by RBWM, CMB and GPB through our branches and direct channels.
Measurement
(Audited)
The risk profile of our insurance manufacturing businesses is measured using an economic capital approach. Assets and liabilities are measured on a market value basis, and a capital requirement is defined to ensure that there is a less than one-in-200 chance of insolvency over a one-year time horizon, given the risks to which the businesses are exposed. The methodology for the economic capital calculation is largely aligned to the pan-European Solvency II insurance capital regulations. The economic capital coverage ratio (economic net asset value divided by the economic capital requirement) is a key risk appetite measure.
The business has a current appetite to remain above
140%
with a tolerance of
110%
. In addition to economic capital, the regulatory solvency ratio is also a metric used to manage risk appetite on an entity basis.
The following tables show the composition of assets and liabilities by contract type and by geographical region. A portfolio of business in our Maltese insurance operations was reported as held for sale at 31 December 2017.
|
HSBC Holdings plc
|
157
|
Report of the Directors
| Risk
|
Balance sheet of insurance manufacturing subsidiaries by type of contract
55
|
|||||||||||
|
(Audited)
|
|||||||||||
|
With
DPF
|
|
Unit-linked
|
|
Other contracts
64
|
|
Shareholder
assets and liabilities |
|
Total
|
|
||
|
Footnotes
|
$m
|
|
$m
|
|
$m
|
|
$m
|
|
$m
|
|
|
|
Financial assets
|
65,112
|
|
9,081
|
|
14,849
|
|
6,662
|
|
95,704
|
|
|
|
– trading assets
|
—
|
|
—
|
|
—
|
|
—
|
|
—
|
|
|
|
– financial assets designated at fair value
|
15,533
|
|
8,814
|
|
2,951
|
|
1,259
|
|
28,557
|
|
|
|
– derivatives
|
286
|
|
—
|
|
13
|
|
41
|
|
340
|
|
|
|
– financial investments – HTM
|
57
|
29,302
|
|
—
|
|
6,396
|
|
3,331
|
|
39,029
|
|
|
– financial investments – AFS
|
57
|
15,280
|
|
—
|
|
4,836
|
|
1,877
|
|
21,993
|
|
|
– other financial assets
|
58
|
4,711
|
|
267
|
|
653
|
|
154
|
|
5,785
|
|
|
Reinsurance assets
|
1,108
|
|
274
|
|
1,154
|
|
—
|
|
2,536
|
|
|
|
PVIF
|
59
|
—
|
|
—
|
|
—
|
|
6,610
|
|
6,610
|
|
|
Other assets and investment properties
|
1,975
|
|
2
|
|
164
|
|
1,126
|
|
3,267
|
|
|
|
Total assets
|
68,195
|
|
9,357
|
|
16,167
|
|
14,398
|
|
108,117
|
|
|
|
Liabilities under investment contracts designated at fair value
|
—
|
|
1,750
|
|
3,885
|
|
—
|
|
5,635
|
|
|
|
Liabilities under insurance contracts
|
67,137
|
|
7,548
|
|
10,982
|
|
—
|
|
85,667
|
|
|
|
Deferred tax
|
60
|
14
|
|
6
|
|
9
|
|
1,230
|
|
1,259
|
|
|
Other liabilities
|
—
|
|
—
|
|
—
|
|
3,325
|
|
3,325
|
|
|
|
Total liabilities
|
67,151
|
|
9,304
|
|
14,876
|
|
4,555
|
|
95,886
|
|
|
|
Total equity
|
—
|
|
—
|
|
—
|
|
12,231
|
|
12,231
|
|
|
|
Total liabilities and equity at 31 Dec 2017
|
67,151
|
|
9,304
|
|
14,876
|
|
16,786
|
|
108,117
|
|
|
|
Financial assets
|
57,004
|
|
8,877
|
|
13,021
|
|
5,141
|
|
84,043
|
|
|
|
– trading assets
|
—
|
|
—
|
|
2
|
|
—
|
|
2
|
|
|
|
– financial assets designated at fair value
|
12,134
|
|
8,592
|
|
2,889
|
|
684
|
|
24,299
|
|
|
|
– derivatives
|
212
|
|
2
|
|
13
|
|
46
|
|
273
|
|
|
|
– financial investments – HTM
|
57
|
25,867
|
|
—
|
|
5,329
|
|
2,919
|
|
34,115
|
|
|
– financial investments – AFS
|
57
|
14,359
|
|
—
|
|
4,206
|
|
1,355
|
|
19,920
|
|
|
– other financial assets
|
58
|
4,432
|
|
283
|
|
582
|
|
137
|
|
5,434
|
|
|
Reinsurance assets
|
498
|
|
322
|
|
1,048
|
|
—
|
|
1,868
|
|
|
|
PVIF
|
59
|
—
|
|
—
|
|
—
|
|
6,502
|
|
6,502
|
|
|
Other assets and investment properties
|
1,716
|
|
5
|
|
171
|
|
525
|
|
2,417
|
|
|
|
Total assets
|
59,218
|
|
9,204
|
|
14,240
|
|
12,168
|
|
94,830
|
|
|
|
Liabilities under investment contracts designated at fair value
|
—
|
|
2,197
|
|
3,805
|
|
—
|
|
6,002
|
|
|
|
Liabilities under insurance contracts
|
58,800
|
|
6,949
|
|
9,524
|
|
—
|
|
75,273
|
|
|
|
Deferred tax
|
60
|
13
|
|
3
|
|
7
|
|
1,166
|
|
1,189
|
|
|
Other liabilities
|
—
|
|
—
|
|
—
|
|
1,805
|
|
1,805
|
|
|
|
Total liabilities
|
58,813
|
|
9,149
|
|
13,336
|
|
2,971
|
|
84,269
|
|
|
|
Total equity
|
—
|
|
—
|
|
—
|
|
10,561
|
|
10,561
|
|
|
|
Total liabilities and equity at 31 Dec 2016
|
58,813
|
|
9,149
|
|
13,336
|
|
13,532
|
|
94,830
|
|
|
For footnotes, see page
161
.
|
158
|
HSBC Holdings plc
|
|
Balance sheet of insurance manufacturing subsidiaries by geographical region
55, 61
|
|||||||||
|
(Audited)
|
|||||||||
|
Europe
|
|
Asia
|
|
Latin
America |
|
Total
|
|
||
|
Footnotes
|
$m
|
|
$m
|
|
$m
|
|
$m
|
|
|
|
Financial assets
|
30,231
|
|
63,973
|
|
1,500
|
|
95,704
|
|
|
|
– trading assets
|
—
|
|
—
|
|
—
|
|
—
|
|
|
|
– financial assets designated at fair value
|
12,430
|
|
15,633
|
|
494
|
|
28,557
|
|
|
|
– derivatives
|
169
|
|
171
|
|
—
|
|
340
|
|
|
|
– financial investments – HTM
|
57
|
—
|
|
38,506
|
|
523
|
|
39,029
|
|
|
– financial investments – AFS
|
57
|
15,144
|
|
6,393
|
|
456
|
|
21,993
|
|
|
– other financial assets
|
58
|
2,488
|
|
3,270
|
|
27
|
|
5,785
|
|
|
Reinsurance assets
|
469
|
|
2,063
|
|
4
|
|
2,536
|
|
|
|
PVIF
|
59
|
773
|
|
5,709
|
|
128
|
|
6,610
|
|
|
Other assets and investment properties
|
1,666
|
|
1,577
|
|
24
|
|
3,267
|
|
|
|
Total assets
|
33,139
|
|
73,322
|
|
1,656
|
|
108,117
|
|
|
|
Liabilities under investment contracts designated at fair value
|
739
|
|
4,896
|
|
—
|
|
5,635
|
|
|
|
Liabilities under insurance contracts
|
28,416
|
|
56,047
|
|
1,204
|
|
85,667
|
|
|
|
Deferred tax
|
60
|
217
|
|
1,033
|
|
9
|
|
1,259
|
|
|
Other liabilities
|
2,043
|
|
1,209
|
|
73
|
|
3,325
|
|
|
|
Total liabilities
|
31,415
|
|
63,185
|
|
1,286
|
|
95,886
|
|
|
|
Total equity
|
1,724
|
|
10,137
|
|
370
|
|
12,231
|
|
|
|
Total liabilities and equity at 31 Dec 2017
|
33,139
|
|
73,322
|
|
1,656
|
|
108,117
|
|
|
|
Financial assets
|
26,238
|
|
56,371
|
|
1,434
|
|
84,043
|
|
|
|
– trading assets
|
—
|
|
—
|
|
2
|
|
2
|
|
|
|
– financial assets designated at fair value
|
10,171
|
|
13,618
|
|
510
|
|
24,299
|
|
|
|
– derivatives
|
187
|
|
86
|
|
—
|
|
273
|
|
|
|
– financial investments – HTM
|
57
|
—
|
|
33,624
|
|
491
|
|
34,115
|
|
|
– financial investments – AFS
|
57
|
13,812
|
|
5,735
|
|
373
|
|
19,920
|
|
|
– other financial assets
|
58
|
2,068
|
|
3,308
|
|
58
|
|
5,434
|
|
|
Reinsurance assets
|
362
|
|
1,499
|
|
7
|
|
1,868
|
|
|
|
PVIF
|
59
|
711
|
|
5,682
|
|
109
|
|
6,502
|
|
|
Other assets and investment properties
|
871
|
|
1,493
|
|
53
|
|
2,417
|
|
|
|
Total assets
|
28,182
|
|
65,045
|
|
1,603
|
|
94,830
|
|
|
|
Liabilities under investment contracts designated at fair value
|
1,321
|
|
4,681
|
|
—
|
|
6,002
|
|
|
|
Liabilities under insurance contracts
|
24,310
|
|
49,793
|
|
1,170
|
|
75,273
|
|
|
|
Deferred tax
|
60
|
238
|
|
919
|
|
32
|
|
1,189
|
|
|
Other liabilities
|
841
|
|
914
|
|
50
|
|
1,805
|
|
|
|
Total liabilities
|
26,710
|
|
56,307
|
|
1,252
|
|
84,269
|
|
|
|
Total equity
|
1,472
|
|
8,738
|
|
351
|
|
10,561
|
|
|
|
Total liabilities and equity at 31 Dec 2016
|
28,182
|
|
65,045
|
|
1,603
|
|
94,830
|
|
|
For footnotes, see page
161
.
Key risk types
The key risks for the insurance operations are market risks (in particular interest rate and equity) and credit risks, followed by insurance underwriting risk and operational risks. Liquidity risk, while significant for the bank, is minor for our insurance operations
.
Market risk
(Audited)
Description and exposure
Market risk is the risk of changes in market factors affecting HSBC’s capital or profit. Market factors include interest rates, equity and growth assets and foreign exchange rates.
Our exposure varies depending on the type of contract issued. Our most significant life insurance products are contracts with discretionary participating features (‘DPF’) issued in France and Hong Kong. These products typically include some form of capital guarantee or guaranteed return on the sums invested by the policyholders, to which discretionary bonuses are added if allowed by the overall performance of the funds. These funds are primarily invested in bonds, with a proportion allocated to other asset classes to provide customers with the potential for enhanced returns.
DPF products expose HSBC to the risk of variation in asset returns, which will impact our participation in the investment performance.
In addition, in some scenarios the asset returns can become insufficient to cover the policyholders’ financial guarantees, in which case the shortfall has to be met by HSBC. Reserves are held against the cost of such guarantees, calculated by stochastic modelling.
Where local rules require, these reserves are held as part of liabilities under insurance contracts. Any remainder is accounted for as a deduction from the present value of in-force (‘PVIF’) long-term insurance business on the relevant product. The following table shows the total reserve held for the cost of guarantees, the range of investment returns on assets supporting these products and the implied investment return that would enable the business to meet the guarantees.
The cost of guarantees increased to
$696m
(2016:
$625m
) primarily due to the impact of modelling changes.
For unit-linked contracts, market risk is substantially borne by the policyholder, but some market risk exposure typically remains, as fees earned are related to the market value of the linked assets.
|
HSBC Holdings plc
|
159
|
|
Financial return guarantees
55
|
|||||||||
|
(Audited)
|
|||||||||
|
2017
|
2016
|
||||||||
|
Investment returns implied by guarantee
|
Long-term investment returns on relevant portfolios
|
Cost of guarantees
|
|
Investment returns implied by guarantee
|
Long-term investment returns on relevant portfolios
|
Cost of guarantees
|
|
||
|
Footnote
|
%
|
%
|
$m
|
|
%
|
%
|
$m
|
|
|
|
Capital
|
0.0
|
0.0–3.2
|
103
|
|
0.0
|
0.0–3.0
|
59
|
|
|
|
Nominal annual return
|
0.1–2.0
|
3.2–3.7
|
64
|
|
0.1–2.0
|
3.7–3.8
|
64
|
|
|
|
Nominal annual return
|
62
|
2.1–4.0
|
3.2–4.4
|
459
|
|
2.1–4.0
|
3.0–4.4
|
426
|
|
|
Nominal annual return
|
4.1–5.0
|
3.2–4.1
|
70
|
|
4.1–5.0
|
3.0–4.1
|
76
|
|
|
|
At 31 Dec
|
|
|
696
|
|
|
|
625
|
|
|
For footnotes, see page
161
.
Sensitivities
Changes in financial market factors, from the economic assumptions in place at the start of the year, had a positive impact on reported profit before tax of $296m (2016: $386m negative).
The following table illustrates the effects of selected interest rate, equity price and foreign exchange rate scenarios on our profit for the year and the total equity of our insurance manufacturing subsidiaries.
Where appropriate, the effects of the sensitivity tests on profit after tax and equity incorporate the impact of the stress on the PVIF. The relationship between the profit and total equity and
the risk factors is non-linear, therefore the results disclosed should not be extrapolated to measure sensitivities to different levels of stress. For the same reason, the impact of the stress is not symmetrical on the upside and downside. The sensitivities are stated before allowance for management actions which may mitigate the effect of changes in the market environment. The sensitivities presented allow for adverse changes in policyholder behaviour that may arise in response to changes in market rates.
Interest rate movements have a greater impact on total equity as changes in market value of available-for-sale bonds are not recognised in profit after tax.
|
Sensitivity of HSBC’s insurance manufacturing subsidiaries to market risk factors
|
|||||||||
|
(Audited)
|
|||||||||
|
2017
|
2016
|
||||||||
|
Effect on
profit after tax
|
|
Effect on
total equity
|
|
Effect on
profit after tax
|
|
Effect on
total equity
|
|
||
|
Footnote
|
$m
|
|
$m
|
|
$m
|
|
$m
|
|
|
|
+100 basis point parallel shift in yield curves
|
42
|
|
(583
|
)
|
63
|
|
(494
|
)
|
|
|
-100 basis point parallel shift in yield curves
|
63
|
(140
|
)
|
617
|
|
(182
|
)
|
490
|
|
|
10% increase in equity prices
|
223
|
|
237
|
|
189
|
|
190
|
|
|
|
10% decrease in equity prices
|
(225
|
)
|
(239
|
)
|
(191
|
)
|
(191
|
)
|
|
|
10% increase in US dollar exchange rate compared with all currencies
|
24
|
|
24
|
|
19
|
|
19
|
|
|
|
10% decrease in US dollar exchange rate compared with all currencies
|
(24
|
)
|
(24
|
)
|
(19
|
)
|
(19
|
)
|
|
For footnote, see page
161
.
Credit risk
(Audited)
Description and exposure
Credit risk is the risk of financial loss if a customer or counterparty fails to meet their obligation under a contract. It arises in two main areas for our insurance manufacturers:
|
•
|
risk associated with credit spread volatility and default by debt security counterparties after investing premiums to generate a return for policyholders and shareholders; and
|
|
•
|
risk of default by reinsurance counterparties and non-reimbursement for claims made after ceding insurance risk.
|
The amounts outstanding at the balance sheet date in respect of these items are shown in the table on page
158
.
The credit quality of the reinsurers’ share of liabilities under insurance contracts is assessed as ‘satisfactory’ or higher (as defined on page
112
), with
100%
of the exposure being neither past due nor impaired (2016:
100%
).
Credit risk on assets supporting unit-linked liabilities is predominantly borne by the policyholder; therefore, our exposure is primarily related to liabilities under non-linked insurance and investment contracts and shareholders’ funds. The credit quality of insurance financial assets is included in the table on page
124
.
Liquidity risk
(Audited)
Description and exposure
Liquidity risk is the risk that an insurance operation, though solvent, either does not have sufficient financial resources available to meet its obligations when they fall due, or can secure them only at excessive cost.
The following table shows the expected undiscounted cash flows for insurance liabilities at 31 December 2017. The liquidity risk exposure is wholly borne by the policyholder in the case of unit-linked business and is shared with the policyholder for non-linked insurance.
The profile of the expected maturity of insurance contracts at 31 December 2017 remained comparable with 2016.
The remaining contractual maturity of investment contract liabilities is included in Note
28
.
|
160
|
HSBC Holdings plc
|
|
Expected maturity of insurance contract liabilities
55
|
||||||||||
|
(Audited)
|
||||||||||
|
Expected cash flows (undiscounted)
|
||||||||||
|
Within 1 year
|
|
1-5 years
|
|
5-15 years
|
|
Over 15 years
|
|
Total
|
|
|
|
$m
|
|
$m
|
|
$m
|
|
$m
|
|
$m
|
|
|
|
Unit-linked
|
969
|
|
3,041
|
|
4,695
|
|
6,814
|
|
15,519
|
|
|
With DPF and Other contracts
|
6,916
|
|
26,453
|
|
43,784
|
|
45,334
|
|
122,487
|
|
|
At 31 Dec 2017
|
7,885
|
|
29,494
|
|
48,479
|
|
52,148
|
|
138,006
|
|
|
Unit-linked
|
630
|
|
2,468
|
|
5,101
|
|
9,513
|
|
17,712
|
|
|
With DPF and Other contracts
|
5,582
|
|
23,136
|
|
40,621
|
|
40,447
|
|
109,786
|
|
|
At 31 Dec 2016
|
6,212
|
|
25,604
|
|
45,722
|
|
49,960
|
|
127,498
|
|
For footnotes, see page
161
.
Insurance risk
Description and exposure
Insurance risk is the risk of loss through adverse experience, in either timing or amount, of insurance underwriting parameters (non-economic assumptions). These parameters include mortality, morbidity, longevity, lapses and unit costs.
The principal risk we face is that, over time, the cost of the contract, including claims and benefits, may exceed the total amount of premiums and investment income received.
The tables on pages
158
and
159
analyse our life insurance risk exposures by type of contract and by geographical region.
The insurance risk profile and related exposures remain largely consistent with those observed at 31 December 2016.
Sensitivities
(Audited)
The following table shows the sensitivity of profit and total equity to reasonably possible changes in non-economic assumptions across all our insurance manufacturing subsidiaries.
Mortality and morbidity risk is typically associated with life insurance contracts. The effect on profit of an increase in mortality or morbidity depends on the type of business being written.
Our largest exposures to mortality and morbidity risk exist in Hong Kong and Singapore.
Sensitivity to lapse rates depends on the type of contracts being written. For a portfolio of term assurance, an increase in lapse rates typically has a negative effect on profit due to the loss of future income on the lapsed policies. However, some contract lapses have a positive effect on profit due to the existence of policy surrender charges.
We are most sensitive to a change in lapse rates on unit-linked and universal life contracts in Hong Kong and Singapore, and DPF contracts in France.
Expense rate risk is the exposure to a change in the cost of administering insurance contracts. To the extent that increased expenses cannot be passed on to policyholders, an increase in expense rates will have a negative effect on our profits.
|
Sensitivity analysis
|
||||
|
(Audited)
|
||||
|
2017
|
|
2016
|
|
|
|
$m
|
|
$m
|
|
|
|
Effect on profit after tax and total equity
at 31 Dec |
||||
|
10% increase in mortality and/or morbidity rates
|
(77
|
)
|
(71
|
)
|
|
10% decrease in mortality and/or morbidity rates
|
82
|
|
75
|
|
|
10% increase in lapse rates
|
(93
|
)
|
(80
|
)
|
|
10% decrease in lapse rates
|
106
|
|
93
|
|
|
10% increase in expense rates
|
(92
|
)
|
(89
|
)
|
|
10% decrease in expense rates
|
91
|
|
87
|
|
|
Footnotes to Risk
|
|
45
|
2016 includes loan impairment charges from the operations in Brazil that we sold on 1 July 2016.
|
|
46
|
The HSBC UK Liquidity Group shown comprises four legal entities: HSBC Bank plc (including all overseas branches, and SPEs consolidated by HSBC Bank plc for Financial Statement purposes), Marks and Spencer Financial Services plc, HSBC Private Bank (UK) Ltd and HSBC Trust Company (UK) Limited, managed as a single operating entity, in line with the application of UK liquidity regulation as agreed with the UK PRA.
|
|
47
|
The Hongkong and Shanghai Banking Corporation – Hong Kong branch and The Hongkong and Shanghai Banking Corporation – Singapore branch represent the material activities of The Hongkong and Shanghai Banking Corporation. Each branch is monitored and controlled for liquidity and funding risk purposes as a stand-alone operating entity.
|
|
48
|
HSBC France and HSBC Canada represent the consolidated banking operations of the Group in France and Canada, respectively. HSBC France and HSBC Canada are each managed as single distinct operating entities for liquidity purposes.
|
|
49
|
The total shown for other principal HSBC operating entities represents the combined position of all the other operating entities overseen directly by the Risk Management Meeting of the GMB.
|
|
50
|
Trading portfolios comprise positions arising from the market-making and warehousing of customer-derived positions.
|
|
51
|
Portfolio diversification is the market risk dispersion effect of holding a portfolio containing different risk types. It represents the reduction in unsystematic market risk that occurs when combining a number of different risk types; for example, interest rate, equity and foreign exchange, together in one portfolio. It is measured as the difference between the sum of the VaR by individual risk type and the combined total VaR. A negative number represents the benefit of portfolio diversification. As the maximum and minimum occurs on different days for different risk types, it is not meaningful to calculate a portfolio diversification benefit for these measures.
|
|
52
|
The total VaR is non-additive across risk types due to diversification effects.
|
|
53
|
Investments in private equity are primarily made through managed funds that are subject to limits on the amount of investment. Potential new commitments are subject to risk appraisal to ensure that industry and geographical concentrations remain within acceptable levels for the portfolio as a whole. Regular reviews are performed to substantiate the valuation of the investments within the portfolio.
|
|
54
|
Investments held to facilitate ongoing business include holdings in government-sponsored enterprises and local stock exchanges.
|
|
55
|
Does not include associated insurance companies SABB Takaful Company and Canara HSBC Oriental Bank of Commerce Life Insurance Company Limited.
|
|
56
|
‘Other Contracts’ includes term insurance, credit life insurance, universal life insurance and investment contracts not included in the ‘Unit-linked’ or ‘With DPF’ columns.
|
|
57
|
Financial investments held to maturity (‘HTM’) and available for sale (‘AFS’).
|
|
58
|
Comprise mainly loans and advances to banks, cash and inter-company balances with other non-insurance legal entities.
|
|
59
|
Present value of in-force long-term insurance business.
|
|
60
|
‘Deferred tax’ includes the deferred tax liabilities arising on recognition of PVIF.
|
|
61
|
HSBC has no insurance manufacturing subsidiaries in Middle East and North Africa or North America.
|
|
62
|
A block of contracts in France with guaranteed nominal annual returns in the range 1.25%-3.72% is reported entirely in the 2.1%-4.0% category in line with the average guaranteed return of 2.6% offered to policyholders by these contracts.
|
|
63
|
For 2016, where a -100 basis point parallel shift in the yield curve would result in a negative interest rate, the effects on profit after tax and total equity have been calculated using a minimum rate of 0%.
|
|
HSBC Holdings plc
|
161
|
Report of the Directors
| Capital
|
Capital overview
|
|
Capital ratios
|
||||
|
At
|
||||
|
31 Dec
|
|
31 Dec
|
|
|
|
2017
|
|
2016
|
|
|
|
%
|
|
%
|
|
|
|
CRD IV transitional
|
||||
|
Common equity tier 1 ratio
|
14.5
|
|
13.6
|
|
|
Tier 1 ratio
|
17.3
|
|
16.1
|
|
|
Total capital ratio
|
20.9
|
|
20.1
|
|
|
CRD IV end point
|
||||
|
Common equity tier 1 ratio
|
14.5
|
|
13.6
|
|
|
Tier 1 ratio
|
16.4
|
|
14.9
|
|
|
Total capital ratio
|
18.3
|
|
16.8
|
|
|
Total regulatory capital and risk-weighted assets
|
||||
|
At
|
||||
|
31 Dec
|
|
31 Dec
|
|
|
|
2017
|
|
2016
|
|
|
|
$m
|
|
$m
|
|
|
|
CRD IV transitional
|
||||
|
Common equity tier 1 capital
|
126,144
|
|
116,552
|
|
|
Additional tier 1 capital
|
24,810
|
|
21,470
|
|
|
Tier 2 capital
|
31,429
|
|
34,336
|
|
|
Total regulatory capital
|
182,383
|
|
172,358
|
|
|
Risk-weighted assets
|
871,337
|
|
857,181
|
|
|
CRD IV end point
|
||||
|
Common equity tier 1 capital
|
126,144
|
|
115,984
|
|
|
Additional tier 1 capital
|
16,531
|
|
11,351
|
|
|
Tier 2 capital
|
16,413
|
|
16,289
|
|
|
Total regulatory capital
|
159,088
|
|
143,624
|
|
|
Risk-weighted assets
|
871,337
|
|
855,762
|
|
|
RWAs by risk types
|
||||
|
RWAs
|
|
Capital required
1
|
|
|
|
$bn
|
|
$bn
|
|
|
|
Credit risk
|
685.2
|
|
54.8
|
|
|
Counterparty credit risk
|
54.5
|
|
4.4
|
|
|
Market risk
|
38.9
|
|
3.1
|
|
|
Operational risk
|
92.7
|
|
7.4
|
|
|
At 31 Dec 2017
|
871.3
|
|
69.7
|
|
|
1
|
‘Capital required’ represents the Pillar 1 capital charge at 8% of RWAs.
|
|
Capital management
|
Our objective in the management of Group capital is to maintain appropriate levels to support our business strategy, and meet our regulatory and stress testing related requirements.
Approach and policy
Our approach to capital management is driven by our strategic and organisational requirements, taking into account the regulatory, economic and commercial environment. We aim to maintain a strong capital base to support the risks inherent in our business and invest in accordance with our strategy, meeting both consolidated and local regulatory capital requirements at all times. Our policy on capital management is underpinned by a capital management framework and our internal capital adequacy assessment process (‘ICAAP’), which enables us to manage our capital in a consistent manner. The framework incorporates a number of different capital measures calculated on an economic capital and regulatory capital basis. The ICAAP is an assessment of the bank’s capital position, outlining both regulatory and internal capital resources and requirements with HSBC’s business model, strategy, performance and planning, risks to capital, and the implications of stress testing to capital.
Our assessment of capital adequacy is aligned to our assessment of risks. These include credit, market, operational, pensions, insurance, structural foreign exchange risk, residual risks and interest rate risk in the banking book.
Planning and performance
Capital and RWA plans form part of the Annual Operating Plan that is approved by the Board. Revised RWA forecasts are submitted to the GMB on a monthly basis, and reported RWAs are monitored against the plan.
The responsibility for global capital allocation principles rests with the Group Finance Director. Through our internal governance processes, we seek to maintain discipline over our investment and capital allocation decisions, and seek to ensure that returns on investment meet the Group’s management objectives. Our strategy is to allocate capital to businesses and entities to support growth objectives where above hurdle returns have been identified and in order to meet their regulatory and economic capital needs.
We manage business returns by using a return on risk-weighted assets (‘RoRWA’) measure and a return on tangible equity (‘RoTE’) measure.
Risks to capital
Outside the stress testing framework, other risks may be identified that have the potential to affect our RWAs and/or capital position. The downside or upside scenarios are assessed against our capital management objectives and mitigating actions are assigned as necessary.
There are a number of regulatory changes on the horizon. The impacts of these are included in the Annual Operating Plan where the rules are sufficiently certain to estimate a reliable impact. Foremost among these changes are the final reforms to the Basel III package, which were published in December 2017. Due to the number of national discretions, the recalibration of the market risk framework and the need to transpose the requirements into national law, it remains too early to assess reliably the impact.
Stress testing
In addition to annual internal stress tests, the Group is subject to supervisory stress testing in many jurisdictions. Supervisory stress testing requirements are increasing in frequency and in the granularity with which the results are required. These exercises include the programmes of the Prudential Regulatory Authority (‘PRA’), the Federal Reserve Board (‘FRB’), the European Banking Authority (‘EBA’), the European Central Bank (‘ECB’) and the Hong Kong Monetary Authority (‘HKMA’), as well as stress tests undertaken in other jurisdictions. We take into account the results of regulatory stress testing and our internal stress tests when assessing our internal capital requirements. The outcome of stress testing exercises carried out by the PRA also feeds into a PRA buffer under Pillar 2 requirements, where required.
|
162
|
HSBC Holdings plc
|
Capital generation
HSBC Holdings is the provider of equity capital to its subsidiaries and also provides them with non-equity capital where necessary. These investments are substantially funded by HSBC Holdings’
own capital issuance and profit retention. As part of its capital management process, HSBC Holdings seeks to maintain a prudent balance between the composition of its capital and its investment in subsidiaries.
|
Capital
|
|
Transitional own funds disclosure
|
||||||
|
(Audited)
|
||||||
|
At
|
||||||
|
31 Dec
|
|
31 Dec
|
|
|||
|
2017
|
|
2016
|
|
|||
|
Ref
*
|
Footnotes
|
$m
|
|
$m
|
|
|
|
Common equity tier 1 (‘CET1’) capital: instruments and reserves
|
||||||
|
1
|
Capital instruments and the related share premium accounts
|
18,932
|
|
21,310
|
|
|
|
– ordinary shares
|
18,932
|
|
21,310
|
|
||
|
2
|
Retained earnings
|
1
|
124,679
|
|
129,552
|
|
|
3
|
Accumulated other comprehensive income (and other reserves)
|
9,433
|
|
560
|
|
|
|
5
|
Minority interests (amount allowed in consolidated CET1)
|
4,905
|
|
3,878
|
|
|
|
5a
|
Independently reviewed interim net profits net of any foreseeable charge or dividend
|
1
|
608
|
|
(6,009
|
)
|
|
6
|
Common equity tier 1 capital before regulatory adjustments
|
158,557
|
|
149,291
|
|
|
|
Common equity tier 1 capital: regulatory adjustments
|
||||||
|
7
|
Additional value adjustments
|
(1,146
|
)
|
(1,358
|
)
|
|
|
8
|
Intangible assets (net of related deferred tax liability)
|
(16,872
|
)
|
(15,037
|
)
|
|
|
10
|
Deferred tax assets that rely on future profitability excluding those arising from temporary differences (net of related tax liability)
|
(1,181
|
)
|
(1,696
|
)
|
|
|
11
|
Fair value reserves related to gains or losses on cash flow hedges
|
208
|
|
(52
|
)
|
|
|
12
|
Negative amounts resulting from the calculation of expected loss amounts
|
(2,820
|
)
|
(4,025
|
)
|
|
|
14
|
Gains or losses on liabilities at fair value resulting from changes in own credit standing
|
3,731
|
|
1,052
|
|
|
|
15
|
Defined-benefit pension fund assets
|
(6,740
|
)
|
(3,680
|
)
|
|
|
16
|
Direct and indirect holdings of own CET1 instruments
|
(40
|
)
|
(1,573
|
)
|
|
|
19
|
Direct, indirect and synthetic holdings by the institution of the CET1 instruments of financial sector entities where the institution has a significant investment in those entities (amount above 10% threshold and net of eligible short positions)
|
(7,553
|
)
|
(6,370
|
)
|
|
|
28
|
Total regulatory adjustments to common equity tier 1
|
(32,413
|
)
|
(32,739
|
)
|
|
|
29
|
Common equity tier 1 capital
|
126,144
|
|
116,552
|
|
|
|
Additional tier 1 (‘AT1’) capital: instruments
|
||||||
|
30
|
Capital instruments and the related share premium accounts
|
16,399
|
|
11,259
|
|
|
|
31
|
– classified as equity under IFRSs
|
16,399
|
|
11,259
|
|
|
|
33
|
Amount of qualifying items and the related share premium accounts subject to phase out from AT1
|
6,622
|
|
7,946
|
|
|
|
34
|
Qualifying tier 1 capital included in consolidated AT1 capital (including minority interests not included in CET1) issued by subsidiaries and held by third parties
|
1,901
|
|
2,419
|
|
|
|
35
|
– of which: instruments issued by subsidiaries subject to phase out
|
1,374
|
|
1,522
|
|
|
|
36
|
Additional tier 1 capital before regulatory adjustments
|
24,922
|
|
21,624
|
|
|
|
Additional tier 1 capital: regulatory adjustments
|
||||||
|
37
|
Direct and indirect holdings of own AT1 instruments
|
(60
|
)
|
(60
|
)
|
|
|
41b
|
Residual amounts deducted from AT1 capital with regard to deduction from tier 2 (‘T2’) capital during the transitional period
|
(52
|
)
|
(94
|
)
|
|
|
– direct and indirect holdings by the institution of the T2 instruments and subordinated loans of financial sector entities where the institution has a significant investment in those entities
|
(52
|
)
|
(94
|
)
|
||
|
43
|
Total regulatory adjustments to additional tier 1 capital
|
(112
|
)
|
(154
|
)
|
|
|
44
|
Additional tier 1 capital
|
24,810
|
|
21,470
|
|
|
|
45
|
Tier 1 capital (T1 = CET1 + AT1)
|
150,954
|
|
138,022
|
|
|
|
Tier 2 capital: instruments and provisions
|
||||||
|
46
|
Capital instruments and the related share premium accounts
|
16,880
|
|
16,732
|
|
|
|
47
|
Amount of qualifying items and the related share premium accounts subject to phase out from T2
|
4,746
|
|
5,695
|
|
|
|
48
|
Qualifying own funds instruments included in consolidated T2 capital (including minority interests and AT1 instruments not included in CET1 or AT1) issued by subsidiaries and held by third parties
|
10,306
|
|
12,323
|
|
|
|
49
|
– of which: instruments issued by subsidiaries subject to phase out
|
10,236
|
|
12,283
|
|
|
|
51
|
Tier 2 capital before regulatory adjustments
|
31,932
|
|
34,750
|
|
|
|
Tier 2 capital: regulatory adjustments
|
||||||
|
52
|
Direct and indirect holdings of own T2 instruments
|
(40
|
)
|
(40
|
)
|
|
|
55
|
Direct and indirect holdings by the institution of the T2 instruments and subordinated loans of financial sector entities where the institution has a significant investment in those entities (net of eligible short positions)
|
(463
|
)
|
(374
|
)
|
|
|
57
|
Total regulatory adjustments to tier 2 capital
|
(503
|
)
|
(414
|
)
|
|
|
58
|
Tier 2 capital
|
31,429
|
|
34,336
|
|
|
|
59
|
Total capital (TC = T1 + T2)
|
182,383
|
|
172,358
|
|
|
|
*
|
The references identify the lines prescribed in the EBA template, which are applicable and where there is a value.
|
|
1
|
In the comparative period, dividend paid has been reallocated from row 2 to row 5a.
|
|
HSBC Holdings plc
|
163
|
Report of the Directors
| Capital
CET1 capital increased during the year by $
9.5
bn, due to:
|
•
|
$
3.7
bn of capital generation through profits, net of dividends and scrip;
|
|
•
|
$
6.3
bn of favourable foreign currency translation differences;
|
|
•
|
regulatory netting of $
1.5
bn;
|
|
•
|
a decrease of $
1.3
bn in the deduction for excess expected loss; and
|
|
•
|
an increase of $
1.0
bn in the value of minority interests allowed in CET1.
|
These increases were partly offset by:
|
•
|
the
$3.0b
n share buy-back; and
|
|
•
|
a $
1.2
bn decrease as a result of the change in US tax legislation; this change also reduces RWAs by
$3.1b
n.
|
|
Risk-weighted assets
|
RWAs increased by $14.1bn during the year, including an increase of $27.7bn due to foreign currency translation differences. The resulting decrease of $13.6bn (excluding foreign currency translation differences) was primarily due to RWA initiatives of $70.8bn and asset quality improvement of $4.6bn, less increases from asset size growth of $48.4bn, changes in methodology and policy of $8.2bn and model updates of $6.2bn.
The following comments describe RWA movements in 2017, excluding foreign currency translation differences.
RWA initiatives
Continued reduction in legacy credit and US run-off portfolios reduced RWAs by $21.3bn. Further savings mainly came from process improvements $13.7bn, exposure reductions $9.9bn, trade actions $9.7bn and refined calculations $8.3bn.
Asset size
Asset size movements principally represent $40.4bn of lending growth, mainly in GB&M and CMB in Asia and Europe, and new transactions and movements in market parameters increasing counterparty credit risk and market risk by $9.0bn.
Methodology and policy
Methodology and policy movements increased credit risk RWAs by $11.3bn, mainly as a result of changes to:
|
•
|
the treatment of non-performing exposures of $5.0bn;
|
|
•
|
the netting of current accounts of $2.1bn;
|
|
•
|
non-recourse purchased receivables of $1.6bn; and
|
|
•
|
risk-weight floors for HK residential mortgages of $0.6bn
.
|
Market risk RWAs decreased by $3.7bn as a result of increased diversification following regulatory approval to consolidate additional companies.
|
RWAs by global business
|
||||||||||||
|
RBWM
|
|
CMB
|
|
GB&M
|
|
GPB
|
|
Corporate Centre
|
|
Total
|
|
|
|
$bn
|
|
$bn
|
|
$bn
|
|
$bn
|
|
$bn
|
|
$bn
|
|
|
|
Credit risk
|
94.2
|
|
277.3
|
|
180.2
|
|
13.0
|
|
120.5
|
|
685.2
|
|
|
Counterparty credit risk
|
—
|
|
—
|
|
52.4
|
|
0.2
|
|
1.9
|
|
54.5
|
|
|
Market risk
|
—
|
|
—
|
|
35.9
|
|
—
|
|
3.0
|
|
38.9
|
|
|
Operational risk
|
27.3
|
|
23.7
|
|
30.8
|
|
2.8
|
|
8.1
|
|
92.7
|
|
|
At 31 Dec 2017
|
121.5
|
|
301.0
|
|
299.3
|
|
16.0
|
|
133.5
|
|
871.3
|
|
|
Credit risk
|
84.6
|
|
250.6
|
|
170.8
|
|
12.2
|
|
137.5
|
|
655.7
|
|
|
Counterparty credit risk
|
—
|
|
—
|
|
59.1
|
|
0.2
|
|
2.7
|
|
62.0
|
|
|
Market risk
|
—
|
|
—
|
|
38.5
|
|
—
|
|
3.0
|
|
41.5
|
|
|
Operational risk
|
30.5
|
|
25.3
|
|
32.0
|
|
2.9
|
|
7.3
|
|
98.0
|
|
|
At 31 Dec 2016
|
115.1
|
|
275.9
|
|
300.4
|
|
15.3
|
|
150.5
|
|
857.2
|
|
|
RWAs by geographical region
|
||||||||||||
|
Europe
|
|
Asia
|
|
MENA
|
|
North
America
|
|
Latin
America
|
|
Total
|
|
|
|
$bn
|
|
$bn
|
|
$bn
|
|
$bn
|
|
$bn
|
|
$bn
|
|
|
|
Credit risk
|
225.9
|
|
284.2
|
|
47.7
|
|
101.2
|
|
26.2
|
|
685.2
|
|
|
Counterparty credit risk
|
27.8
|
|
13.0
|
|
1.1
|
|
10.9
|
|
1.7
|
|
54.5
|
|
|
Market risk
1
|
29.0
|
|
23.5
|
|
3.3
|
|
7.1
|
|
1.0
|
|
38.9
|
|
|
Operational risk
|
28.9
|
|
37.1
|
|
7.1
|
|
12.1
|
|
7.5
|
|
92.7
|
|
|
At 31 Dec 2017
|
311.6
|
|
357.8
|
|
59.2
|
|
131.3
|
|
36.4
|
|
871.3
|
|
|
Credit risk
|
205.8
|
|
260.0
|
|
49.0
|
|
118.5
|
|
22.4
|
|
655.7
|
|
|
Counterparty credit risk
|
30.9
|
|
16.1
|
|
1.2
|
|
12.6
|
|
1.2
|
|
62.0
|
|
|
Market risk
1
|
30.8
|
|
21.3
|
|
1.4
|
|
6.8
|
|
0.5
|
|
41.5
|
|
|
Operational risk
|
30.9
|
|
36.6
|
|
7.5
|
|
12.8
|
|
10.2
|
|
98.0
|
|
|
At 31 Dec 2016
|
298.4
|
|
334.0
|
|
59.1
|
|
150.7
|
|
34.3
|
|
857.2
|
|
|
1
|
RWAs are non-additive across geographical regions due to market risk diversification effects within the Group.
|
|
164
|
HSBC Holdings plc
|
|
RWA movement by global business by key driver
|
||||||||||||||
|
Credit risk, counterparty credit risk and operational risk
|
||||||||||||||
|
RBWM
|
|
CMB
|
|
GB&M
|
|
GPB
|
|
Corporate Centre
|
|
Market
risk
|
|
Total
RWAs
|
|
|
|
$bn
|
|
$bn
|
|
$bn
|
|
$bn
|
|
$bn
|
|
$bn
|
|
$bn
|
|
|
|
RWAs at 1 Jan 2017
|
115.1
|
|
275.9
|
|
261.9
|
|
15.3
|
|
147.5
|
|
41.5
|
|
857.2
|
|
|
RWA initiatives
|
(0.4
|
)
|
(13.8
|
)
|
(27.6
|
)
|
(0.2
|
)
|
(24.8
|
)
|
(4.0
|
)
|
(70.8
|
)
|
|
Asset size
|
4.4
|
|
16.7
|
|
21.9
|
|
0.8
|
|
(0.6
|
)
|
5.2
|
|
48.4
|
|
|
Asset quality
|
0.2
|
|
1.5
|
|
(6.1
|
)
|
0.2
|
|
(0.4
|
)
|
—
|
|
(4.6
|
)
|
|
Model updates
|
1.1
|
|
5.0
|
|
0.3
|
|
(0.1
|
)
|
—
|
|
(0.1
|
)
|
6.2
|
|
|
– portfolios moving onto IRB approach
|
0.2
|
|
—
|
|
—
|
|
(0.1
|
)
|
—
|
|
(0.1
|
)
|
—
|
|
|
– new/updated models
|
0.9
|
|
5.0
|
|
0.3
|
|
—
|
|
—
|
|
—
|
|
6.2
|
|
|
Methodology and policy
|
(1.8
|
)
|
3.6
|
|
4.8
|
|
(0.5
|
)
|
5.8
|
|
(3.7
|
)
|
8.2
|
|
|
– internal updates
|
(2.5
|
)
|
3.6
|
|
4.8
|
|
(0.5
|
)
|
5.8
|
|
(3.7
|
)
|
7.5
|
|
|
– external updates – regulatory
|
0.7
|
|
—
|
|
—
|
|
—
|
|
—
|
|
—
|
|
0.7
|
|
|
Acquisitions and disposals
|
(0.1
|
)
|
(0.4
|
)
|
—
|
|
—
|
|
(0.5
|
)
|
—
|
|
(1.0
|
)
|
|
Foreign exchange movements
|
3.0
|
|
12.5
|
|
8.2
|
|
0.5
|
|
3.5
|
|
—
|
|
27.7
|
|
|
Total RWA movement
|
6.4
|
|
25.1
|
|
1.5
|
|
0.7
|
|
(17.0
|
)
|
(2.6
|
)
|
14.1
|
|
|
RWAs at 31 Dec 2017
|
121.5
|
|
301.0
|
|
263.4
|
|
16.0
|
|
130.5
|
|
38.9
|
|
871.3
|
|
|
RWA movement by geographical region by key driver
|
||||||||||||||
|
Credit risk, counterparty credit risk and operational risk
|
||||||||||||||
|
Europe
|
|
Asia
|
|
MENA
|
|
North
America
|
|
Latin
America
|
|
Market
risk
|
|
Total
RWAs
|
|
|
|
$bn
|
|
$bn
|
|
$bn
|
|
$bn
|
|
$bn
|
|
$bn
|
|
$bn
|
|
|
|
RWAs at 1 Jan 2017
|
267.6
|
|
312.7
|
|
57.7
|
|
143.9
|
|
33.8
|
|
41.5
|
|
857.2
|
|
|
RWA initiatives
|
(26.6
|
)
|
(14.0
|
)
|
(1.4
|
)
|
(22.2
|
)
|
(2.6
|
)
|
(4.0
|
)
|
(70.8
|
)
|
|
Asset size
|
11.1
|
|
27.8
|
|
(0.2
|
)
|
1.0
|
|
3.5
|
|
5.2
|
|
48.4
|
|
|
Asset quality
|
1.4
|
|
(5.7
|
)
|
1.1
|
|
(2.3
|
)
|
0.9
|
|
—
|
|
(4.6
|
)
|
|
Model updates
|
6.4
|
|
0.1
|
|
—
|
|
(0.2
|
)
|
—
|
|
(0.1
|
)
|
6.2
|
|
|
– portfolios moving onto IRB approach
|
—
|
|
0.1
|
|
—
|
|
—
|
|
—
|
|
(0.1
|
)
|
—
|
|
|
– new/updated models
|
6.4
|
|
—
|
|
—
|
|
(0.2
|
)
|
—
|
|
—
|
|
6.2
|
|
|
Methodology and policy
|
3.7
|
|
6.2
|
|
(0.1
|
)
|
2.1
|
|
—
|
|
(3.7
|
)
|
8.2
|
|
|
– internal updates
|
3.6
|
|
5.7
|
|
(0.1
|
)
|
2.0
|
|
—
|
|
(3.7
|
)
|
7.5
|
|
|
– external updates – regulatory
|
0.1
|
|
0.5
|
|
—
|
|
0.1
|
|
—
|
|
—
|
|
0.7
|
|
|
Acquisitions and disposals
|
—
|
|
—
|
|
(1.0
|
)
|
—
|
|
—
|
|
—
|
|
(1.0
|
)
|
|
Foreign exchange movements
|
19.0
|
|
7.2
|
|
(0.2
|
)
|
1.9
|
|
(0.2
|
)
|
—
|
|
27.7
|
|
|
Total RWA movement
|
15.0
|
|
21.6
|
|
(1.8
|
)
|
(19.7
|
)
|
1.6
|
|
(2.6
|
)
|
14.1
|
|
|
RWAs at 31 Dec 2017
|
282.6
|
|
334.3
|
|
55.9
|
|
124.2
|
|
35.4
|
|
38.9
|
|
871.3
|
|
|
Leverage ratio
|
|
At
|
|||||
|
31 Dec
|
|
31 Dec
|
|
||
|
2017
|
|
2016
|
|
||
|
Ref
*
|
$bn
|
|
$bn
|
|
|
|
20
|
Tier 1 capital
|
142.7
|
|
127.3
|
|
|
21
|
Total leverage ratio exposure
|
2,557.1
|
|
2,354.4
|
|
|
%
|
|
%
|
|
||
|
22
|
Leverage ratio
|
5.6
|
|
5.4
|
|
|
EU-23
|
Choice of transitional arrangements for the definition of the capital measure
|
Fully phased-in
|
|
Fully phased-in
|
|
|
UK leverage ratio exposure – quarterly average
|
2,351.4
|
|
n/a
|
|
|
|
%
|
|
%
|
|
||
|
UK leverage ratio – quarterly average
|
6.1
|
|
n/a
|
|
|
|
UK leverage ratio – quarter end
|
6.1
|
|
5.7
|
|
|
|
*
|
The references identify the lines prescribed in the EBA template.
|
Our leverage ratio calculated in accordance with CRD IV was
5.6
% at 31 December 2017, up from 5.4% at 31 December 2016. Growth in tier 1 capital was partly offset by a rise in exposure, primarily due to growth in customer advances, balances at central banks and trading assets.
In October 2017, following the FPC recommendation, the PRA increased the minimum requirement for the UK leverage ratio from 3% to 3.25%, following a change in its guidance to exclude central bank balances from the exposure measure.
At 31 December 2017, our UK minimum leverage ratio requirement of 3.25% was supplemented by an additional leverage ratio buffer of
0.4
% and a countercyclical leverage ratio
buffer of
0.1
%. These additional buffers translate into capital values of $
10.3
bn and $
1.8
bn respectively. We comfortably exceeded these leverage requirements.
Pillar 3 disclosure requirements
Pillar 3 of the Basel regulatory framework is related to market discipline and aims to make firms more transparent by requiring publication, at least annually, of wide-ranging information on their risks, capital and management. Our
Pillar 3 Disclosures at December 2017
is published on our website, www.hsbc.com, under Investor Relations.
|
HSBC Holdings plc
|
165
|
Report of the Directors
| Corporate Governance
|
Corporate Governance Report
|
|
|
Page
|
|
|
The Board
|
|
|
Operation of the Board
|
|
|
Director and Group Managing Director biographies
|
|
|
Board of Directors
|
|
|
Board committees
|
|
|
Internal control
|
|
|
Internal audit
|
|
|
Going concern
|
|
|
Share capital and other disclosures
|
|
|
Employees
|
|
|
Statement of compliance
|
|
|
The Board
|
Led by the Group Chairman, the Board sets the Group’s strategy and risk appetite. It also approves capital and operating plans for achieving strategic objectives on the recommendation of management.
Group Chairman
Douglas Flint retired as Group Chairman on 30 September 2017. Mark Tucker was appointed to the Board as an independent non-executive Director on 1 September 2017. He became non-executive Group Chairman on 1 October 2017.
Executive Directors
The Group Chief Executive, the Group Finance Director and the Group Chief Risk Officer are HSBC employees.
Independent non-executive Directors
The Board comprises a majority of independent non-executive Directors. Their role is to challenge and scrutinise the performance of management and to help develop proposals on strategy. They also review the performance of management in meeting agreed goals and objectives and monitor the Group’s risk profile.
The Board considers all non-executive Directors to be independent of HSBC and has concluded that there are no relationships or circumstances likely to affect any individual non-executive Director’s judgement. To satisfy the Rules Governing the Listing of Securities on the HKEx, all non-executive Directors have provided confirmation of their independence during the year. The non-executive Group Chairman was considered to be independent upon appointment.
Board and executive responsibilities
The roles of Group Chairman and Group Chief Executive are separate, with a clear division of responsibilities between the running of the Board and executive responsibility for running HSBC’s business.
Jonathan Symonds was appointed as Senior Independent Director (‘SID’) in April 2017 following the retirement of Rachel Lomax.
The roles of the Group Chairman, Group Chief Executive and SID are set out in writing and are available on the website at www.hsbc.com/about-hsbc/corporate-governance/board-committees.
The Board delegates day-to-day management of the business and implementation of strategy to the Group Chief Executive. To assist the Group Chief Executive in his day-to-day management of the Group, as delegated by the Board, he is supported with recommendations and advice from the Group Management Board (‘GMB’), an executive forum which he chairs.
There are special meetings of the GMB that provide oversight of risk matters (the Risk Management Meeting (‘RMM’), chaired by the Group Chief Risk Officer) and of financial crime risk (the
Financial Crime Risk Management Meeting, chaired by the Group Head of Financial Crime Risk).
Powers of the Board
In exercising its duty to promote the success of the Company, the Board is responsible for overseeing the management of HSBC globally and, in so doing, may exercise its powers, subject to any relevant laws, regulations and HSBC Holdings’ Articles of Association (the ‘Articles of Association’).
However, certain matters, including the review and approval of annual operating plans, risk appetite, performance targets, credit or market risk limits, acquisitions, disposals, investments, capital expenditure or realisation or creation of a new venture, specified senior appointments and any substantial change in balance sheet management policy, are reserved to the Board for its approval.
The Board regularly reviews reports on performance against financial and other strategic objectives, key business challenges, risk, business developments, and investor and external relations. During 2017, it also considered presentations on strategy and performance by each of the global businesses and across the principal geographical areas.
|
Operation of the Board
|
All of HSBC’s activities involve the measurement, evaluation, acceptance and management of risk or combinations of risks. The Board, advised by the Group Risk Committee (‘GRC’), the Conduct & Values Committee (‘CVC’) and the Financial System Vulnerabilities Committee (‘FSVC’), promotes a strong risk governance culture which shapes the Group’s attitude to risk.
The Board and these committees support the maintenance of a strong risk management framework.
Under the direction of the Group Chairman, the Group Company Secretary is responsible for ensuring good information flows within the Board and its committees and between senior management and non-executive Directors, as well as facilitating induction and assisting with professional development as required.
The Group Chairman meets with the independent non-executive Directors without the executive Directors in attendance after each Board meeting and otherwise, as necessary.
The Directors are encouraged to have free and open contact with management at all levels and full access to all relevant information. When attending off-site Board meetings and when travelling for other reasons, non-executive Directors are encouraged to visit local business operations and meet local management.
Directors may take independent professional advice, if necessary, at HSBC Holdings’ expense.
Board performance evaluation
The Board is committed to regular, independent evaluation of its own effectiveness and that of its committees. Following on from the review of the Board undertaken by JCA Group in 2016, the actions identified and agreed were addressed during 2017. These actions included a stronger focus for the Board on individual business unit strategy and performance, as well as opportunities to address particular business themes, such as digital and IT innovation. The actions that have not already been closed out from this review form part of an ongoing assessment of the Group's governance framework being led by the Group Chairman.
Director performance evaluation
For non-executive Directors, individual performance evaluation is undertaken by the Group Chairman. In 2017, this involved a discussion about each Director’s individual contribution, their individual training and development needs, and the time commitment that is required to continue to deliver the role effectively.
Executive Directors’ individual performance evaluation is undertaken as part of the performance management process for all employees. The results are considered by the Group Remuneration Committee when determining variable pay awards
|
166
|
HSBC Holdings plc
|
each year, as set out in the Directors' Remuneration Report contained in this Annual Report.
The Group Chairman’s performance is evaluated by the non-executive Directors, led by the SID.
|
Non-executive Group Chairman
|
|
Mark E Tucker,
60
Non-executive Group Chairman
Appointed to the Board: September 2017
Group Chairman since October 2017
|

|
|
Chairman of the Nomination Committee
Skills and experience:
Mark has extensive experience in the financial services industry in Asia and the UK. Most recently he was Group Chief Executive and President of AIA Group Limited (‘AIA’). Before joining AIA, Mark was Group Chief Executive of Prudential plc and the founding Chief Executive of Prudential Corporation Asia Limited. Mark also previously served as a non-executive director of the Court of The Bank of England, as an independent non-executive director of the Goldman Sachs Group and as Group Finance Director of HBOS plc.
Current appointments include:
Serves on the Asia Business Council and the Advisory Board of the Asia Global Institute.
|
Executive Directors
|
|
Stuart Gulliver,
58
Group Chief Executive
Appointed to the Board: May 2008
Group Chief Executive since January 2011
Retiring from Board: 21 February 2018
|

|
|
Skills and experience:
Stuart has more than 37 years’ international banking experience, having joined HSBC in 1980. He played a leading role in developing and expanding Global Banking and Markets, and has held key roles in the Group’s operations worldwide, working in London, Hong Kong, Tokyo, Kuala Lumpur and the United Arab Emirates. Former appointments include Chairman of HSBC Bank plc, HSBC Bank Middle East Limited, HSBC Private Banking Holdings (Suisse) SA and HSBC France. He was also Deputy Chairman of HSBC Trinkaus & Burkhardt AG and a member of its supervisory board.
Current appointments include:
Chairman of the Group Management Board, and The Hongkong and Shanghai Banking Corporation Limited.
|
Iain Mackay,
56
Group Finance Director
Appointed to the Board: December 2010
|

|
|
Skills and experience:
Iain has extensive financial and international experience, having worked in London, Paris, the US, Africa and Asia. He joined HSBC in 2007 as Chief Financial Officer of HSBC North America Holdings Inc. Other former appointments include director of Hang Seng Bank Limited; Chief Financial Officer, HSBC Asia-Pacific. Before joining HSBC, Iain worked at General Electric (‘GE’), serving as Controller of its Global
Consumer Finance Unit, Chief Financial Officer of GE Consumer Finance Americas, and Chief Financial Officer of GE Healthcare – Global Diagnostic Imaging. Iain is a member of the Institute of Chartered Accountants of Scotland.
Current appointments include:
Member of the Board of Trustees of the British Heart Foundation and chairman of its audit and risk committee. Iain is also an Independent Member of the Court of the University of Aberdeen.
|
Marc Moses,
60
Group Chief Risk Officer
Appointed to the Board: January 2014
|

|
|
Skills and experience:
Marc joined HSBC in 2005 as Chief Financial and Risk Officer for Global Banking and Markets, and in December 2010 became Group Chief Risk Officer. He has extensive risk management and financial experience. Marc is a Fellow of the Institute of Chartered Accountants in England and Wales. He was European chief financial officer at J.P. Morgan and an audit partner at Price Waterhouse.
|
Independent non-executive Directors
|
|
Phillip Ameen,
69
Independent non-executive Director
Appointed to the Board: January 2015
|

|
|
Member of the Group Audit Committee.
Skills and experience:
Phillip has extensive financial and accounting experience. He served as Vice President, Comptroller, and Principal Accounting Officer of General Electric. Prior to that, he was a partner of KPMG. He also served on the International Financial Reporting Interpretations Committee of the International Accounting Standards Board, the Accounting Standards Executive Committee of the American Institute of Certified Public Accountants and the Financial Accounting Standards Board Emerging Issues Task Force.
Current appointments include:
A non-executive director of HSBC North America Holdings Inc., HSBC Bank USA N.A., HSBC Finance Corporation and HSBC USA Inc.
|
Kathleen Casey,
51
Independent non-executive Director
Appointed to the Board: March 2014
|

|
|
Member of the Group Audit Committee and the Financial System Vulnerabilities Committee.
Skills and experience:
Kathleen has extensive financial regulatory policy experience. She is a former Commissioner of the US Securities and Exchange Commission, and acted as its principal representative in multilateral and bilateral regulatory dialogues with the G-20 Financial Stability Board and the International Organisation of Securities Commissions. Other former appointments include Staff Director and Counsel to the United States Senate Committee on Banking, Housing, and Urban Affairs; Chair of the Alternative Investment Management
|
HSBC Holdings plc
|
167
|
Report of the Directors
| Corporate Governance
Association; and Legislative Director and Chief of Staff for a US Senator.
Current appointments include:
Senior adviser to Patomak Global Partners and to a number of public bodies in the US, and a member of the Board of Trustees of the Financial Accounting Foundation.
|
Laura Cha,
GBM, 68
Independent non-executive Director
Appointed to the Board: March 2011
|

|
|
Chairman of the Philanthropic & Community Investment Oversight Committee and member of the Conduct & Values Committee and the Nomination Committee.
Skills and experience:
Laura has extensive regulatory and policy making experience in the finance and securities sector in Hong Kong and mainland China. She is the former Vice Chairman of the China Securities Regulatory Commission. Other former appointments include serving as a non-executive director of Bank of Communications Co., Limited; and Tata Consultancy Services Limited. She also served as Deputy Chairman of the Securities and Futures Commission in Hong Kong.
Current appointments include:
A non-executive Deputy Chairman of The Hongkong and Shanghai Banking Corporation Limited, Chairman of Hong Kong’s Financial Services Development Council and a non-executive director of China Telecom Corporation Limited, Unilever PLC and Unilever N.V.
|
Henri de Castries,
63
Independent non-executive Director
Appointed to the Board: March 2016
|

|
|
Member of the Group Remuneration Committee
Skills and experience:
Henri has more than 25 years’ international experience in the financial services industry. He joined AXA in 1989 holding a number of senior roles, ultimately as Chairman and Chief Executive Officer of AXA SA until 1 September 2016.
Current appointments include:
Chairman of Europe and Special Advisor of General Atlantic, Chairman of Institut Montaigne, a French think-tank; the lead independent director of Nestlé S.A. and a non-executive director of the French National Foundation for Political Science.
|
Lord Evans of Weardale,
60
Independent non-executive Director
Appointed to the Board: August 2013
|

|
|
Chairman of the Financial System Vulnerabilities Committee, and member of the Conduct & Values Committee and the Philanthropic & Community Investment Oversight Committee.
Skills and experience:
Jonathan has 30 years of experience in national security policy and operations. He was formerly Director General of the UK‘s Security Service (MI5) and had oversight of the Joint Terrorist Analysis Centre and the Centre for the
Protection of National Infrastructure, and attended the National Security Council.
Current appointments include:
A non-executive director of Ark Data Centres and an adviser to various cybersecurity and technology companies.
|
Joachim Faber,
67
Independent non-executive Director
Appointed to the Board: March 2012
|

|
|
Skills and experience:
Joachim has extensive international experience in banking and asset management. He is a former Chief Executive Officer of Allianz Global Investors AG and a former member of the management board of Allianz SE. He spent 14 years with Citicorp, holding positions in Trading and Project Finance, and as Head of Capital Markets for Europe, North America and Japan. He was also Chairman of various Allianz subsidiaries. He was previously a member of the supervisory board and Chairman of the audit and risk committee of OSRAM Licht AG. He was also a member of the German Council for Sustainable Development and a member of the advisory board of the Siemens Group Pension Board.
Current appointments include:
Chairman of the supervisory board of Deutsche Börse AG and the Shareholder Committee of Joh. A. Benckiser SARL, and a director of Coty Inc.
|
Irene Lee,
64
Independent non-executive Director
Appointed to the Board: July 2015
|

|
|
Skills and experience:
Irene has more than 40 years’ finance industry experience, having held senior investment banking and fund management positions in the UK, the US and Australia, including positions at Citibank and the Commonwealth Bank of Australia. Other former appointments include serving as a member of the Advisory Council of J.P. Morgan Australia and the Australian Takeovers Panel.
Current appointments include:
Executive Chairman of Hysan Development Company Limited and a non-executive director of The Hongkong and Shanghai Banking Corporation Limited, Hang Seng Bank Limited, Cathay Pacific Airways Limited and CLP Holdings Limited.
|
John Lipsky,
71
Independent non-executive Director
Appointed to the Board: March 2012
|

|
|
Member of the Group Risk Committee, the Nomination Committee and the Group Remuneration Committee.
Skills and experience:
John worked for the International Monetary Fund (IMF) in Washington and Chile, for Salomon Brothers in New York and London, and for JP Morgan in New York. At JP Morgan, he was Vice Chair of the Investment Bank, and at the IMF he served as the First Deputy Managing Director – also serving
pro tem
as the Acting Managing Director. Other former appointments include Trustee of the Economic Club of New York, and Chairman of the World Economic Forum’s Global Agenda
|
168
|
HSBC Holdings plc
|
Council on the International Monetary System.
Current appointments include:
Peterson Distinguished Scholar at the Kissinger Centre for Global Affairs of Johns Hopkins University‘s School of Advanced International Studies. He also serves as the Vice Chair of the National Bureau of Economic Research (NBER), and of the Centre for Global Development.
|
Heidi Miller,
64
Independent non-executive Director
Appointed to the Board: September 2014
|

|
|
Member of the Group Risk Committee.
Skills and experience:
Heidi is a former President of International at JP Morgan Chase, and was responsible for leading the global expansion and the international business strategy across its investment bank, asset management, and treasury and securities services divisions. She was also a non-executive director of Merck & Co., Inc. and Progressive Corp.; Executive Vice President and Chief Financial Officer of Bank One Corporation; Senior Executive Vice President of Priceline.com Inc.; and Executive Vice President and Chief Financial Officer of Citigroup Inc.
Current appointments include:
Chairman of HSBC North American Holdings Inc., a non-executive director of First Data Corporation and General Mills Inc., and an advisory director of SRS Acquiom LLC.
|
David Nish,
57
Independent non-executive Director
Appointed to the Board: May 2016
|

|
|
Member of the Group Audit Committee and Group Remuneration Committee.
Skills and experience:
David served as Chief Executive Officer of Standard Life plc between 2010 and 2015, having joined as Finance Director in 2006. Other former appointments include non-executive director of the UK Green Investment Bank plc, Group Finance Director of Scottish Power plc, non-executive director of HDFC Life (India) and partner of Price Waterhouse. He is a qualified chartered accountant.
Current appointments include:
A non-executive director of Vodafone plc, London Stock Exchange Group plc and Zurich Insurance Group.
|
Jonathan Symonds,
CBE, 58
Independent non-executive Director
Appointed to the Board: April 2014
Senior Independent Director since April 2017
|

|
|
Chairman of the Group Audit Committee and member of the Nomination Committee and the Conduct & Values Committee.
Skills and experience:
Jonathan is a former Chief Financial Officer of Novartis AG and AstraZeneca plc. He was also a partner and Managing Director of Goldman Sachs, a partner of KPMG, and a non-executive director and chair of the Audit Committee of Diageo plc. He is a fellow of the Institute of Chartered Accountants in England and Wales.
Current appointments include:
Chairman of HSBC Bank plc and Proteus Digital Health Inc., and a non-executive director of Genomics England Limited.
|
Jackson Tai,
67
Independent non-executive Director
Appointed to the Board: September 2016
|

|
|
Chairman of the Group Risk Committee and member of the Financial System Vulnerabilities Committee.
Skills and experience:
Jackson was formerly Vice Chairman and Chief Executive of DBS Group and DBS Bank Ltd, having served the group as Chief Financial Officer and then as President and Chief Operating Officer. He previously worked at J.P. Morgan & Co. Incorporated as an investment banker in New York, Tokyo and San Francisco. Other former appointments include non-executive director of Bank of China Limited, Singapore Airlines, NYSE Euronext, ING Groep N.V., CapitaLand Ltd, SingTel Ltd. and Jones Lang LaSalle Inc. Jackson also served as Vice Chairman of Islamic Bank of Asia.
Current appointments include:
Non-executive director of Eli Lilly and Company, Koninklijke Philips Electronics N.V., Mastercard Incorporated and the Canada Pension Plan Investment Board.
|
Pauline van der Meer Mohr,
57
Independent non-executive Director
Appointed to the Board: September 2015
|

|
Chairman of the Group Remuneration Committee and the Conduct & Values Committee and member of the Group Nomination Committee.
Skills and experience:
Pauline has extensive legal and human resources experience across a number of different sectors, and contributed to the Dutch Banking Code Monitoring Commission. Former appointments include President of Erasmus University Rotterdam; Senior Executive Vice President and Head of Group Human Resources at ABN AMRO Bank NV; Group Human Resources Director at TNT NV; HR Director, Information Technology, Royal Dutch Shell Group; and Senior Legal Counsel, Shell International.
Current appointments include:
Chair of the supervisory board of EY Netherlands and member of the supervisory boards of ASML Holding N.V. and Royal DSM N.V.
|
Group Company Secretary
|
|
Ben Mathews,
50
Group Company Secretary
|

|
|
Ben joined HSBC in June 2013 and became Group Company Secretary in July 2013. He is a Fellow of the Institute of Chartered Secretaries and Administrators. Former appointments include Group Company Secretary of Rio Tinto plc and of BG Group plc.
|
HSBC Holdings plc
|
169
|
Report of the Directors
| Corporate Governance
|
Group Chief Executive Designate
|
|
John Flint,
49
Group Chief Executive Designate
|

|
|
John joined HSBC in 1989 and became a Group Managing Director in 2013. Former appointments include: a director of HSBC Private Banking Holdings (Suisse) SA, a director of HSBC Bank Canada, Chief of Staff to the Group Chief Executive and Group Head of Strategy and Planning, Chief Executive Officer HSBC Global Asset Management, Group Treasurer and Deputy Head of Global Markets. John was CEO, Retail Banking and Wealth Management until January 2018. John was appointed as a director of The HongKong and Shanghai Banking Corporation Limited on 16 January 2018 and will take over from Stuart Gulliver as Group Chief Executive on 21 February 2018.
|
Group Managing Directors
|
|
Elaine Arden,
49
Group Head of Human Resources
|
Elaine joined HSBC in June 2017 as Group Head of Human Resources. She has previously held senior human resources and employee relations roles in a number of other financial institutions. Elaine is a fellow of the Chartered Institute of Banking in Scotland and a member of the Chartered Institute of Personnel & Development.
|
Samir Assaf,
57
Chief Executive, Global Banking and Markets
|
Samir joined HSBC in 1994 and became a Group Managing Director in 2011. He is Chairman and a non-executive director of HSBC France; a director of HSBC Trinkaus & Burkhardt AG and The Saudi British Bank. Former appointments include: a director of HSBC Bank plc; HSBC Global Asset Management Limited and HSBC Bank Egypt S.A.E.; and Head of Global Markets for Europe, Middle East and Africa.
|
Colin Bell,
50
Group Head of Financial Crime Risk
|
Colin Bell joined HSBC in July 2016 and was appointed a Group Managing Director in March 2017. Colin previously worked at UBS, where he was Head of Compliance and Operational Risk Control. He has 10 years of experience in managing risk and financial crime, following 16 years in the British Army.
|
Peter Boyles,
62
Chief Executive Officer of Global Private Banking |
Peter joined HSBC in 1975 and became a Group Managing Director in 2013. He is a director of HSBC Global Asset Management Limited and HSBC Private Bank (UK) Limited. Former appointments include: Chief Executive of HSBC France; a director of HSBC Bank plc, HSBC Bank Malta plc and HSBC Trinkaus & Burkhardt AG.
|
Patrick Burke,
56
President and Chief Executive Officer of HSBC USA
|
Patrick joined HSBC in 1989 and became a Group Managing Director in 2015. He is also an Executive Director, President and
CEO of HSBC North America Holdings Inc. and Chairman of HSBC Bank USA, N.A., HSBC Finance Corporation, HSBC USA Inc. and HSBC Global Asset Management (USA) Inc.
|
Pierre Goad,
56
Group Head of Global Communications
|
Pierre first joined HSBC in 2001. In 2010 he left and joined Zurich Insurance Group as Head of Communications. He rejoined HSBC in 2011 and became a Group Managing Director in 2015. He is a director of HSBC Bank Canada. Former appointments include: Global Co-Head of Communications; and Head of Corporate Development, Europe, Middle East and Global Businesses.
|
Pam Kaur,
54
Group Head of Internal Audit
|
Pam joined HSBC and became a Group Managing Director in 2013. She is a co-opted Council member of The Institute of Chartered Accountants in England and Wales. Former appointments include: Global Head of Group Audit for Deutsche Bank AG; Chief Financial Officer and Chief Operating Officer of the Restructuring and Risk Division, Royal Bank of Scotland Group plc; Group Head of Compliance and AML, Lloyds TSB; and Global Director of Compliance, Global Consumer Group, Citigroup
.
|
Stuart Levey,
54
Chief Legal Officer
|
Stuart joined HSBC and became a Group Managing Director in 2012. Former appointments include: Under Secretary for Terrorism and Financial Intelligence in the US Department of the Treasury; Senior Fellow for National Security and Financial Integrity at the Council on Foreign Relations; Principal Associate Deputy Attorney General at the US Department of Justice; and a Partner at Miller, Cassidy, Larroca & Lewin LLP and at Baker Botts LLP.
|
Andy Maguire,
51
Group Chief Operating Officer
|
Andy joined HSBC in 2014 as Group Chief Operating Officer and became a Group Managing Director in 2015. He is Chairman of HSBC Global Services (UK) Limited and a director of HSBC Global Services Limited and HSBC Group Management Services Limited. He is formerly a Managing Partner (UK and Ireland) of the Boston Consulting Group.
|
Paulo Maia,
59
Chief Executive, Latin America
|
Paulo joined HSBC in 1993 and became a Group Managing Director on 1 February 2016. He is Chairman of Grupo Financiero HSBC Mexico S.A. de C.V., HSBC Argentina Holdings S.A. and a Director of HSBC North America Holdings Inc. Former appointments include: Chief Executive of HSBC Bank Canada and HSBC Bank Australia Limited.
|
Charlie Nunn,
46
Chief Executive Officer, Retail Banking and Wealth Management
|
Charlie joined HSBC in 2011 and became a Group Managing Director and CEO, Retail Banking and Wealth Management in January 2018. Charlie was previously Head of Group Retail Banking and Wealth Management, leading the teams supporting HSBC’s Retail and Wealth businesses globally. Prior to this, he was Group Head of Wealth Management and before that Global Chief Operating Officer for Retail Banking and Wealth Management. Charlie has extensive financial services experience and was formerly a Partner at Accenture and a Senior Partner at McKinsey & Co.
|
170
|
HSBC Holdings plc
|
|
Noel Quinn,
56
Chief Executive, Global Commercial Banking
|
Noel joined HSBC in 1992 when the Group acquired Midland Bank and became a Group Managing Director on 1 September 2016. Former appointments include: Head of Specialised and Equity Finance, Director of Strategy & Development for Commercial Banking, Head of Commercial Finance Europe, Head of Commercial Banking UK and Head of Commercial Banking Asia.
|
Antonio Simoes,
42
Chief Executive, HSBC Bank plc
|
Antonio joined HSBC in 2007 and became a Group Managing Director on 1 February 2016. He is a director of HSBC Bank plc and HSBC France. Former appointments include: Chief Executive of HSBC UK; Head of Retail Banking and Wealth Management, Europe; and Chief of Staff to the Group Chief Executive and Group Head of Strategy and Planning. Antonio was also formerly the Chairman of the Practitioner Panel of the FCA, a Partner of McKinsey & Company and an Associate at Goldman Sachs.
|
Peter Wong,
66
Deputy Chairman and Chief Executive,
The Hongkong and Shanghai Banking Corporation Limited
|
Peter joined HSBC in 2005 and became a Group Managing Director in 2010. He is Chairman and non-executive Director of HSBC Bank (China) Company Limited and a non-executive director of Hang Seng Bank Limited and HSBC Bank Malaysia Berhad. He is also non-executive Vice Chairman of Bank of Communications Co., Limited and an independent non-executive Director of Cathay Pacific Airways Limited. Other appointments include President of the Hong Kong Institute of Bankers, Vice Chairman of the Hong Kong General Chamber of Commerce and First Vice President, Board Member and Chairman of the Executive Committee and Nominating Committee of The Community Chest of Hong Kong.
|
Board of Directors
|
Appointments to the Board are made on merit and candidates are considered against objective criteria, having due regard to the benefits of the diversity of the Board. A rigorous selection process is followed in relation to the appointment of Directors and certain specified senior appointments. For further details on the appointments made in 2017 please refer to the report of the Nomination Committee.
The number of Directors must not be less than five nor exceed 25. The Board may at any time appoint any person as a Director, either to fill a vacancy or as an addition to the existing Board. The Board may appoint any Director to hold any employment or executive office and may revoke or terminate any such appointment. Shareholders may, by ordinary resolution, appoint a person as a Director or remove any Director before the expiration of his or her period of office.
Newly appointed Directors retire at the Annual General Meeting (‘AGM’) following appointment and are eligible for election. Directors are nominated for annual re-election by shareholders subject to continued satisfactory performance based upon an assessment by the Group Chairman and the Nomination Committee.
Non-executive Directors are appointed for an initial three-year term and, subject to re-election by shareholders at each AGM, are typically expected to serve two three-year terms. The Board may invite a Director to serve additional periods. Any term beyond six years is subject to particularly rigorous review.
The terms and conditions of appointment of non-executive Directors are set out in a letter of appointment, which includes the expectations of them and the time estimated to meet their
commitment to the Group. The current anticipated minimum time commitment, which is subject to periodic review, is around 30 days per year. Non-executive Directors are also advised that the time they need to devote to the Group may be considerably more if they serve on Board Committees or as other matters require. All non-executive Directors have confirmed they can meet this requirement, taking into account any other commitments they have at the time of appointment, and, in practice, most devote considerably more time.
During their term of appointment, non-executive Directors are expected to consult the Group Chairman or the Group Company Secretary if they are considering whether to accept or vary any commitments outside the Group. The agreement of the Group Chairman is required if any additional or changed commitment might affect the time that a Director is able to devote to his or her role with the Group.
Letters setting out the terms of appointment of each non-executive Director are available for inspection at the registered office of HSBC Holdings.
The Board diversity policy is available at www.hsbc.com/
investor-
relations/governance/corporate-governance-codes.
Induction
Formal induction programmes are arranged for newly appointed Directors, based on the individual’s needs, skills and experience. Typically, these consist of a series of meetings with other Directors and senior executives, as well as local site visits, to provide familiarity with the business. Directors also receive comprehensive guidance from the Group Company Secretary on the Group’s governance framework and associated policies, as well as their duties as Directors on the Board.
Conflicts of interest, indemnification of Directors and contracts of significance
The Board has established a policy and procedures relating to Directors’ conflicts of interest. Where conflicts of interest arise, the Board has the power to authorise them. A review of those conflicts which have been authorised, and the terms of those authorisations, is undertaken by the Board annually.
The Articles of Association contain a qualifying third-party indemnity provision which entitles Directors and other Officers to be indemnified out of the assets of HSBC Holdings against claims from third parties in respect of certain liabilities. All Directors have the benefit of directors’ and officers’ liability insurance.
None of the Directors had, during the year, a material interest, directly or indirectly, in any contract of significance with any HSBC company. Each Director is routinely reminded of their obligations in respect of transacting in HSBC Group securities and has confirmed that he or she has complied with regulatory requirements.
Training and development
Training and development is provided for each Director supported by the Group Company Secretary. Non-executive Directors develop and refresh their skills and knowledge through day-to-day interactions and briefings with senior management of the Group’s businesses and functions. During the year, all Directors were provided with training on MiFID 2, anti-money laundering, anti-bribery and corruption, embedding good conduct, protecting information and sanctions.
A two-day forum for all of the Group’s non-executive Directors was held during the year. Awareness and discussion sessions were conducted by senior executives and subject matter experts on emerging technologies, financial crime compliance, culture and conduct and business developments.
Jonathan Symonds, Chair of the Group Audit Committee (‘GAC’), and Jackson Tai, Chair of the GRC, hosted a separate forum for the chairs of the Group's subsidiary audit and risk committees.
In addition, non-executive Directors sitting on risk and audit committees across the Group received training on IFRS 9.
|
HSBC Holdings plc
|
171
|
Report of the Directors
| Corporate Governance
Shareholder engagement
Communication with shareholders is given high priority by the Board. Extensive information about HSBC and its activities is provided to shareholders in its
Annual Report and Accounts
, the
Strategic Report
and the
Interim Report
as well as at www.hsbc.com.
To complement these publications, there is regular dialogue with institutional investors. Enquiries from individuals on matters relating to their shareholdings and HSBC’s business are welcomed.
Directors are encouraged to develop an understanding of the views of major shareholders.
As SID, Jonathan Symonds is available to shareholders if they have concerns that cannot be resolved or for which the normal channels would be inappropriate. He may be contacted via the Group Company Secretary at 8 Canada Square, London E14 5HQ.
The AGM and other general meetings
The 2018 AGM will be held at the Queen Elizabeth II Conference Centre, Broad Sanctuary, Westminster, London SW1P 3EE on Friday 20 April at 11.00am and a live webcast will be available on www.hsbc.com. A recording of the proceedings will be available on www.hsbc.com shortly after the conclusion of the AGM until 20 May 2018. Shareholders are encouraged to attend the meeting. Shareholders may send enquiries to the Board in writing via the Group Company Secretary, HSBC Holdings plc, 8 Canada Square, London E14 5HQ or by sending an email to shareholderquestions@hsbc.com.
Shareholders may require the Directors to call a general meeting other than an AGM as provided by the UK Companies Act 2006. Requests to call a general meeting may be made by members representing at least 5% of the paid-up capital of HSBC Holdings that carries the right of voting at its general meetings (excluding any paid-up capital held as treasury shares). A request must state the general nature of the business to be dealt with at the meeting and may include the text of a resolution that may properly be moved and is intended to be moved at the meeting. A request may be in hard copy form or in electronic form and must be authenticated by the person or persons making it. A request may be made in writing to HSBC Holdings at its UK address, referred to in the paragraph above or by sending an email to shareholderquestions@hsbc.com. At any general meeting convened on such request, no business shall be transacted except that stated by the requisition or proposed by the Board.
|
Board Committees
|
The Chairs of each Committee report matters of significance to the Board after each meeting and the minutes of the meetings are made available to all Board members.
The detailed roles and responsibilities of each Committee are set out in its terms of reference, which can be found on the website at www.hsbc.com/about-hsbc/corporate-governance/board-committees.
Interaction with principal subsidiaries
The Board manages relationships with the regions through seven principal subsidiary companies. There are close interactions between the subsidiary boards and the Group Board and their respective committees, including the sharing of minutes and a requirement for certain appointments to subsidiary boards to be approved by the Group Board.
As explained in more detail in the reports of the GAC and the GRC on pages
173
and
175
, this interaction is reinforced through an Audit and Risk Committee Chairs' Forum. The Chairs of the subsidiary audit and risk committees globally are invited to attend the forum to raise and discuss current and future global risk and audit issues.
Board members are encouraged to, and do, make visits to the regions and attend principal subsidiary meetings as guests. Similarly, directors from the regions regularly are invited to attend committee meetings at a Group level.
The GAC and GRC make a number of recommendations to the Board in relation to the preparation of the financial statements which are supported by certificates from the principal subsidiaries.
Whistleblowing
The GAC and the CVC are responsible for reviewing the Group’s whistleblowing procedures and receive regular updates on relevant concerns raised under these procedures, together with management actions taken in response.
Committee effectiveness
The effectiveness of the Committees is evaluated as part of the overall performance evaluation of the Board and through annual effectiveness reviews at a Committee level. In addition, the Committees review the papers and the effectiveness of each meeting as a standing agenda item to ensure that they continue to be effective, challenging and well-managed, and review a rolling planner of proposed committee business.
|
172
|
HSBC Holdings plc
|
|
2017 Board and Committee attendance
|
||||||||||||||||||
|
AGM
|
|
Board*
|
|
Group Audit
Committee
|
|
Group Risk
Committee
|
|
Group
Remuneration
Committee
|
|
Nomination
Committee
|
|
Financial
System
Vulnerabilities
Committee
|
|
Conduct &
Values
Committee
|
|
Philanthropic & Community Investment
Oversight Committee
|
|
|
|
Number of meetings held*
|
1
|
|
8
|
|
8
|
|
7
|
|
7
|
|
7
|
|
7
|
|
6
|
|
3
|
|
|
Group Chairman
|
||||||||||||||||||
|
Mark Tucker
1
|
n/a
|
|
3/3
|
|
—
|
|
—
|
|
—
|
|
2/2
|
|
—
|
|
—
|
|
—
|
|
|
Douglas Flint
2
|
1
|
|
6/6
|
|
—
|
|
—
|
|
—
|
|
—
|
|
—
|
|
—
|
|
—
|
|
|
Executive Directors
|
||||||||||||||||||
|
Stuart Gulliver
|
1
|
|
8
|
|
—
|
|
—
|
|
—
|
|
—
|
|
—
|
|
—
|
|
—
|
|
|
Iain Mackay
|
1
|
|
8
|
|
—
|
|
—
|
|
—
|
|
—
|
|
—
|
|
—
|
|
—
|
|
|
Marc Moses
|
1
|
|
8
|
|
—
|
|
—
|
|
—
|
|
—
|
|
—
|
|
—
|
|
—
|
|
|
Non-executive Directors
|
||||||||||||||||||
|
Phillip Ameen
|
1
|
|
8
|
|
8
|
|
—
|
|
—
|
|
—
|
|
—
|
|
—
|
|
—
|
|
|
Kathleen Casey
|
1
|
|
8
|
|
8
|
|
—
|
|
—
|
|
—
|
|
7
|
|
—
|
|
—
|
|
|
Laura Cha
|
1
|
|
7
|
|
—
|
|
—
|
|
—
|
|
7
|
|
—
|
|
6
|
|
3
|
|
|
Henri de Castries
3
|
1
|
|
6
|
|
—
|
|
—
|
|
4/4
|
|
—
|
|
—
|
|
—
|
|
—
|
|
|
Lord Evans of Weardale
|
1
|
|
7
|
|
—
|
|
—
|
|
—
|
|
—
|
|
7
|
|
6
|
|
3
|
|
|
Joachim Faber
4
|
1
|
|
8
|
|
—
|
|
6
|
|
—
|
|
—
|
|
—
|
|
—
|
|
—
|
|
|
Sam Laidlaw
5
|
1
|
|
3/3
|
|
—
|
|
—
|
|
2/2
|
|
2/2
|
|
—
|
|
—
|
|
—
|
|
|
Irene Lee
|
1
|
|
8
|
|
—
|
|
—
|
|
—
|
|
—
|
|
—
|
|
—
|
|
—
|
|
|
John Lipsky
|
1
|
|
8
|
|
—
|
|
7
|
|
7
|
|
7
|
|
—
|
|
—
|
|
—
|
|
|
Rachel Lomax
6
|
1
|
|
3/3
|
|
—
|
|
3/3
|
|
—
|
|
2/2
|
|
—
|
|
2/2
|
|
—
|
|
|
Heidi Miller
|
1
|
|
8
|
|
—
|
|
7
|
|
—
|
|
—
|
|
—
|
|
—
|
|
—
|
|
|
David Nish
7
|
1
|
|
6
|
|
8
|
|
—
|
|
4/4
|
|
—
|
|
—
|
|
—
|
|
—
|
|
|
Jonathan Symonds
8
|
1
|
|
8
|
|
8
|
|
—
|
|
—
|
|
5/5
|
|
—
|
|
5
|
|
—
|
|
|
Jackson Tai
|
1
|
|
7
|
|
—
|
|
7
|
|
—
|
|
—
|
|
7
|
|
—
|
|
—
|
|
|
Pauline van der Meer Mohr
|
1
|
|
8
|
|
—
|
|
—
|
|
7
|
|
6
|
|
—
|
|
6
|
|
—
|
|
|
Paul Walsh
9
|
—
|
|
2/2
|
|
—
|
|
—
|
|
0/1
|
|
0/1
|
|
—
|
|
—
|
|
—
|
|
*Board meetings in 2017 were held in London, New York and Hong Kong. In addition to the Board meetings listed there were also Chairman’s Committee meetings held in 2017.
|
1
|
Appointed to the Board and as Chair of the Nomination Committee on 1 September 2017. Appointed as Group Chairman on 1 October 2017.
|
|
2
|
Resigned from the Board 30 September 2017.
|
|
3
|
Appointed to the Group Remuneration Committee 26 May 2017
|
|
4
|
Stepped down from the Group Risk Committee 30 November 2017.
|
|
5
|
Resigned from the Board 28 April 2017.
|
|
6
|
Resigned from the Board 28 April 2017.
|
|
7
|
Appointed to the Group Remuneration Committee 26 May 2017.
|
|
8
|
Appointed as interim Chair of the Nomination Committee from 28 April 2017 to 1 September 2017. Appointed as Senior Independent Director on 28 April 2017.
|
|
9
|
Resigned from the Board 21 April 2017.
|
|
Group Audit Committee
|
Jonathan Symonds (Chairman)
Phillip Ameen
Kathleen Casey
David Nish
Role and responsibilities
The GAC has non-executive responsibility for reviewing matters relating to financial reporting, including Pillar 3 disclosures, and the effectiveness of internal financial control systems. The Committee also safeguards the independence of the Group Internal Audit function and oversees its performance.
Governance
The Group Finance Director, Group Chief Accounting Officer, Group Head of Internal Audit, Group Financial Controller and other members of senior management routinely attend meetings of the GAC. The external auditor also attended all meetings. The Chairman of the GAC had regular meetings with management to discuss agenda planning and specific issues as they arose during the year.
How the Committee discharges its responsibilities
Financial reporting
The GAC reviews HSBC’s financial and reporting judgements and their application to the Group’s financial reporting, including Pillar 3 disclosures, Costs to Achieve and significant items. It also
reviews presentations to external analysts including the key financial metrics relating to HSBC’s strategic actions.
The GAC assesses the adequacy of resources of the accounting and financial reporting function. It also monitors the legal and regulatory environment relevant to its responsibilities.
Linkages with principal subsidiary audit committees
The GAC maintains links with the audit committees of The Hong Kong and Shanghai Banking Corporation, HSBC North America Holdings Inc., HSBC Bank Canada, HSBC Bank plc, HSBC Latin America Holdings (UK) Limited, HSBC Bank Middle East Limited and HSBC Private Banking Holdings (Suisse) SA (‘the Principal Subsidiaries’).
During the year, in addition to the annual Audit and Risk Committee Chairs‘ Forum, the Chairman attended an audit committee meeting of The Hongkong and Shanghai Banking Corporation to discuss key judgements made in the Bank of Communications impairment assessment.
Any new appointments to the audit committees of the Principal Subsidiaries are also reviewed by the GAC. The GAC Chairman meets with any proposed new chairs of the Principal Subsidiary audit committees.
Internal controls
The GAC assesses the effectiveness of the internal control system for financial reporting and any developments affecting it in support of the Board’s assessment of internal control over financial reporting in accordance with section 404 of the Sarbanes-Oxley Act.
|
HSBC Holdings plc
|
173
|
Report of the Directors
| Corporate Governance
The GAC has received confirmation that executive management has taken or is taking the necessary actions to remedy any failings or weaknesses identified through the operation of the Group's framework of controls.
Further detail of how the Board reviews the effectiveness of key aspects of internal control can be found on page
178
.
External audit
The GAC reviews the external auditor’s approach, strategy for the annual audit and audit findings.
All non-audit services provided by the external auditor are pre-approved by the GAC in accordance with the auditor independence policy to ensure that services do not create a conflict. Details of the significant engagements for non-audit services are contained in Note
6
.
A policy is in place and monitored by the GAC on hiring employees or former employees of the external auditor.
The GAC regularly meets privately with the external auditor and the GAC Chairman maintains regular contact with the audit partner throughout the year.
Fees payable to PwC for the year ended 31 December 2017 totalled $129.7m, of which $44.9m or 34.6% was payable in respect of non-audit services. A further breakdown of the fees paid to the auditors for each of the last three financial years can be found in Note
6
on the Financial Statements.
The GAC reviewed the findings of the Financial Reporting Council's audit quality review carried out on the 2016 audit and endorsed PwC's proposed action plan in response.
The GAC considered PwC to be independent and PwC, in accordance with professional ethical standards, provided the GAC with written confirmation of its independence for the duration of 2017.
The GAC has therefore recommended to the Board that PwC be reappointed as auditor. Resolutions concerning the reappointment of PwC and their audit fee for 2018 will be proposed to shareholders at the 2018 AGM.
Internal Audit
The GAC approves Internal Audit’s annual plan, resource and budget, and reviews the performance and effectiveness of the Group Head of Internal Audit. The Group Head of Internal Audit reports to the Chairman of the GAC and administratively to the Group Chief Executive. The Committee regularly meets with the Group Head of Internal Audit without other management present.
Compliance with Regulatory Requirements
The Board is satisfied that each member of the GAC is independent according to SEC criteria, may be regarded as audit committee financial experts for the purposes of section 407 of the Sarbanes-Oxley Act and has recent and relevant financial experience for the purposes of the UK and Hong Kong Corporate Governance Codes.
The Committee has complied with the relevant parts of the Competition and Markets Authority Final Order on the statutory audit market for the year ended 31 December 2017.
Principal activities and significant issues considered during 2017
Internal control framework
The GAC continued to monitor the progress being made to upgrade entity level controls. During 2017, the GAC undertook a series of deep dives to monitor the remediation of identified control deficiencies, noting that good progress was made during the year. The GAC continued to monitor the remediation of controls over access management in IT.
IFRS 9 implementation
The GAC continued to receive detailed presentations and updates from management on the Group’s readiness to implement IFRS 9 and considered the possible commercial impact of IFRS 9 on the global businesses.
Bank of Communications (‘BoCom’)
The GAC received regular updates on the assumptions underpinning the valuation of BoCom. It monitored indicators
of impairment, both macro and BoCom specific, and reviewed
the results of the impairment assessments carried out by management.
of impairment, both macro and BoCom specific, and reviewed
the results of the impairment assessments carried out by management.
Resolution planning
The Group is required to have in place a Group Recovery Plan that sets out recovery options to be initiated in the event of the Group coming under severe financial stress. During 2017, the GAC received updates on the structure of the Group Recovery Plan. The GAC considered the Group Recovery Plan and its integration with the Group’s Risk Management Framework.
Establishment of the ring-fenced bank
Progress on the establishment of HSBC UK, the ring-fenced bank, was monitored by the GAC during 2017. The GAC considered the accounting judgements in relation to the creation of HSBC UK.
Internal Audit
The GAC concluded that the Internal Audit function remained effective.
External auditor
During the year, the Committee assesses the effectiveness of PwC as the Group’s external auditor, using a questionnaire which focuses on the overall audit process, its effectiveness and the quality of output.
Changing regulatory landscape
The GAC received briefings on the significant forthcoming changes in the regulatory landscape. Plans around the implementation of IFRS 9
were reviewed.
|
174
|
HSBC Holdings plc
|
|
Significant accounting judgements considered during 2017 included:
|
|
|
Key area
|
Action taken
|
|
Expected impact of IFRS 9
|
Since 2014, the GAC has considered the progress of the project to implement IFRS 9 and the key judgements related to its implementation, including the expected impacts disclosed and the approach to transition disclosures. Topics addressed include: the approach to the incorporation of forward economic guidance for expected credit losses (ECL) and the economic scenarios to be applied at 1 January 2018, the operating model and approach to governance of ECL, impact assessments and dry runs including key learnings and how these issues are being addressed, expected commercial impacts of ECL and status updates on implementation challenges to systems and governance processes.
|
|
Bank of Communications Co., Limited (‘BoCom’) impairment testing
|
During the year, the GAC considered the regular impairment reviews of HSBC’s investment in BoCom. The GAC reviewed a number of aspects of management’s work in this area, including the sensitivity of the result of the impairment review to estimates and assumptions of projected future cash flows. The audit committee considered the model’s sensitivity to long-term assumptions including the continued appropriateness of the discount rate.
|
|
Appropriateness of provisioning for legal proceedings and regulatory matters
|
The GAC received reports from management on the recognition and amounts of provisions, as well as the existence of contingent liabilities for legal proceedings and regulatory matters. Specific matters addressed included accounting judgements in relation to provisions and contingent liabilities arising out of: (a) investigations by regulators and competition and law enforcement authorities around the world into trading on the foreign exchange markets; (b) investigations of HSBC’s Swiss Private Bank by a number of tax administration, regulatory and law enforcement authorities; and (c) investigations into historical sales of US mortgage securitisations by The United States Attorney for the District of Colorado for potential violations of The Financial Industry Reform, Recovery and Enforcement Act of 1989, 12 U.S.C. § 1833a.
|
|
Quarterly and annual reporting
|
The GAC considered key judgements in relation to quarterly and annual reporting. It reviewed draft presentations to external analysts and key financial metrics included in HSBC’s strategic actions.
|
|
Loan impairment,
allowances and charges
|
The GAC considered loan impairment allowances for personal and wholesale lending. For personal lending this included a review of the adequacy of and movement in collective impairment allowances, and consideration of portfolio-specific characteristics. For wholesale lending, the GAC considered management’s key judgements used to establish the appropriate level of individual allowances on material individually assessed cases and whether management overlays were appropriate on collective allowances. Specific attention was applied to credit risk in the UK and the implications of Brexit from a credit perspective.
|
|
Valuation of financial instruments
|
The GAC considered the key valuation metrics and judgements involved in the determination of the fair value of financial instruments. The GAC considered the valuation control framework, valuation metrics, significant year-end judgements and emerging valuation topics.
|
|
Viability statement
|
Under the obligations of the UK Corporate Governance Code the Directors have carried out a robust assessment of the principal risks for the Group and parent company. The GAC has considered the Directors‘ judgement in concluding that the Group and parent company will be able to continue in operation and meet liabilities as they fall due, and that it is appropriate that the viability statement covers a period of three years.
|
|
Goodwill impairment testing
|
The GAC noted that no impairment was identified as a result of the annual goodwill impairment test and subsequent review for any impairment indicators. Following the full impairment of GPB Europe goodwill in 2016 along with an improved performance outlook for RBWM Europe, there are no longer any CGUs considered sensitive to key assumptions.
|
|
Tax-related judgements
|
The GAC considered the recoverability of deferred tax assets, in particular in the US. The committee also considered management’s judgements relating to the tax indemnity agreed to by HSBC as part of the sale of its Brazilian operations in 2016. This includes consideration of the key inputs and assumptions used to estimate any obligation under the indemnity.
|
|
UK customer remediation
|
The GAC considered the provisions for redress for mis-selling of payment protection insurance (‘PPI’) policies in the UK and the associated redress on PPI commissions earned under certain criteria, including management’s judgements regarding the effect of the time-bar for claims ending August 2019. In addition, the GAC monitored progress on the remediation of operational processes and associated customer redress.
|
|
Group Risk Committee
|
Jackson Tai (appointed Chairman effective from 25 April 2017)
Joachim Faber (
stepped down as Chairman effective 25 April 2017 and resigned on 30 November 2017
)
John Lipsky
Heidi Miller
Rachel Lomax (resigned on 28 April 2017)
Role and responsibilities
The GRC has non-executive responsibility for the oversight of enterprise risk management, risk governance and internal control systems (other than internal financial control systems, which are overseen by the GAC). In forming a holistic view of risk, the GRC is supported by the FSVC and CVC, which are the Board committees responsible for overseeing risks relating to financial crime, cyber-crime and information security, anti-bribery and corruption, and for culture and conduct respectively. These two committees escalate and report second order risks to the GRC. Appropriate linkages and information flows between these three committees are further enhanced by cross membership and close engagement of the members and the committee attendees.
Governance
In carrying out its responsibilities, the GRC is closely supported by the Group Chief Risk Officer, Group Finance Director, Group Head of Internal Audit, Group Financial Controller, Global Head of Regulatory Compliance and Global Head of Risk Strategy, who all
regularly attend GRC meetings in order to contribute to discussions relating to their areas of expertise.
The GRC works closely with the GAC to ensure there are no gaps, that any areas of significant overlap are appropriately addressed and to improve inter-committee communication. The chairmen of both these committees engage on the agendas of each other’s committee meetings and attend as guests as appropriate. This further enhances the linkages and the flows of information between the GRC and GAC.
The GRC meets with the Group Chief Risk Officer and, separately, with the Group Head of Internal Audit and external auditors without management present at the majority of its meetings.
How the Committee discharges its responsibilities
At each meeting, the GRC reviews the Group Risk Profile report which identifies the key issues and common themes arising from the Group’s enterprise risk reports. This report includes a synthesised view of the Group’s risk appetite statement, top and emerging risks and the Group risk map. It clearly sets out which Board committee has accountability for the monitoring and oversight of each risk and issue and identifies any areas where management is required to assess vulnerabilities via stress testing.
Page
95
provides further information on the top and emerging risks, the risk map and the risk appetite for the Group. The GRC receives presentations on a range of topics, including stress testing and briefings on developments in its principal markets. In addition, the GRC requests reports and updates from management on risk-related issues for in-depth consideration and receives regular reports on matters discussed at the Risk Management Meeting of the Group Management Board.
|
HSBC Holdings plc
|
175
|
Report of the Directors
| Corporate Governance
The GRC reviews any revisions to the Group risk appetite statement (‘RAS’) bi-annually and any proposed changes are recommended to the Board. It reviews management’s assessment of risk and provides scrutiny of management’s proposed mitigating actions.
The GRC programmes forward-looking and thematic agendas which are supported by input from all three lines of defence within the global businesses and regions. The Committee also conducts deep dives on the risk implications of strategic matters, risks specific to regions, significant projects and key topical risks that are identified during the GRC’s deliberations and discussion. By extending invitations to the chairmen of principal subsidiary risk
committees to participate in GRC meetings and thematic reviews, receiving regional updates and conducting holistic deep dives and sharing GRC highlights with the subsidiaries, the GRC has further enhanced its connectivity and linkages with the principal subsidiary risk committees.
During 2017, the GRC has provided challenge and review to the Group’s regulatory submissions relating to capital management and liquidity adequacy assessments. It has continued to maintain oversight of the Group’s regulatory and internal stress testing programmes with specific review and challenge of the design, key assumptions and outcomes of the principal tests conducted.
|
Principal activities and significant issues considered during 2017
|
|
|
The Group risk appetite statement (‘RAS’) and monitoring of the Group risk profile against the RAS
|
Following its bi-annual reviews, the GRC did not recommend any material changes to the overall level of Risk Appetite in 2017. The GRC expanded its focus on non-financial risk and significant work was undertaken to define forward-looking exposure based on metrics taking into account the inherent level of risk as well as the performance of our control environment.
|
|
Capital and liquidity
|
The GRC has fully engaged management in evaluating and challenging the Group’s liquidity and funding risk appetite and the effectiveness of the liquidity and funding risk framework. The GRC continued to review the Group’s approach to capital planning to ensure it is comprehensive, rigorous and forward looking. The GRC reviewed and challenged both the Group Individual Liquidity Adequacy Assessment Process and Internal Capital Adequacy Assessment.
|
|
Stress testing
|
The GRC conducted a comprehensive review and challenge of the scenarios and approach to the PRA stress tests and reviewed the results of both the Annual Cyclical Scenario and Biennial Exploratory Scenario stress tests. The GRC continued to review and oversee the regulatory and internal global stress testing programmes throughout the year.
|
|
Execution risk
|
Regular reports were received from the Group Chief Operating Officer, who updated each meeting on the progress and status of the Group’s highest-priority change and transformation programmes and mitigating measures being introduced to manage the identified risks appropriately.
The GRC placed priority on monitoring and challenging management’s assessment of execution risk and corresponding mitigating actions, as evidenced by thematic reviews on the execution risks at launch of our required ringfencing in the UK, on the progress of remediating high residual risks in non-financial risks, and the implications of economic growth rates for our China strategy.
|
|
Internal control and risk management
|
The GRC reviewed the Group’s risk management framework and system of internal control (other than internal financial control systems, which were covered by the GAC) and the developments affecting them over the course of 2017, as part of the Board’s assessment of internal control.
|
|
Deep dive reviews
|
The GRC conducted in-depth reviews of the risk implications relating to the Group’s approach to model risk, to changes in economic growth rate assumptions for the Group’s China strategy as well as execution risks arising from required ringfencing in the UK. The GRC also examined the Group’s management of its non-financial risks, including its ability to remediate high residual risks.
|
|
Connectivity between the GRC and Subsidiary Risk Committees
|
The GRC has enhanced the connectivity and flow of information both to and from the Subsidiary Risk Committees during 2017. There has been more focused participation by the principal Subsidiary Risk Committee chairmen at GRC meetings. In addition, the GRC Chairman has attended risk committee meetings in Latin America, Europe, Middle East and Asia Pacific regions. The linkages with the Group and subsidiaries was further strengthened at the annual Non-Executive Director and Subsidiary Audit and Risk Committee Chairmen’s Forum held in Hong Kong.
|
|
Committee effectiveness
|
The GRC Chairman has addressed the actions agreed at the beginning of the year arising from an external independent effectiveness review conducted at the end of 2016.
|
|
Financial System Vulnerabilities Committee
|
Lord Evans of Weardale (Chairman)
Kathleen Casey
Jackson Tai
Michael Burgess (non-Director member) (appointed on
1 September 2017 and resigned on 11 December 2017)
1 September 2017 and resigned on 11 December 2017)
Nick Fishwick, CMG (non-Director member)
Dave Hartnett, CB (non-Director member)
Lord Hogan-Howe (non-Director member) (appointed on
1 September 2017)
1 September 2017)
William Hughes, CBE QPM (non-Director member) (resigned on
30 June 2017)
30 June 2017)
David Irvine (non-Director member)
Clovis Meath Baker (non-Director member) (appointed on
1 September 2017)
1 September 2017)
Nehchal Sandhu (non-Director member)
Leonard Schrank (non-Director member) (resigned on 30 June 2017)
Sir William Patey (non-Director member) (resigned on 30 June 2017)
John Raine (non-Director member) (appointed on 1 September 2017)
The Honourable Juan Zarate (non-Director member)
The eight non-Director members support the Committee’s work and between them have extensive experience in geopolitical risk, financial crime risk, international security, cybersecurity and law enforcement matters.
Role and responsibilities
The Committee has non-executive responsibility for the oversight of matters related to financial crime and system abuse, in particular anti-money laundering, sanctions, terrorist financing and proliferation financing, anti-bribery and corruption and cybersecurity. It is also responsible for monitoring, reviewing and advising the Board on the effectiveness of the policies and procedures established by management to ensure that HSBC meets its obligations to regulatory and law enforcement agencies.
|
176
|
HSBC Holdings plc
|
Principal activities and significant issues considered during 2017
Financial crime
The Committee monitored the Group’s progress on the implementation of its Glo
bal Standards programme, and reviewed and discussed findings from country visits conducted by the Monitor.
Anti-bribery and corruption
The Committee reviewed the activities underway to address key bribery and corruption risks and management’s progress with the implementation of a more robust anti-bribery and corruption compliance framework.
Engaging with the Monitor
The Committee was responsible for liaising with the Monitor to ensure his recommendations were acted on.
The information security environment and cybersecurity risk
The Committee reviewed HSBC’s progress towards improving the Group’s cybersecurity and the actions being taken to mitigate exposure to cyber-risk. It also monitored significant developments in the information security environment and progress delivering strategic financial crime risk management IT solutions.
|
Conduct & Values Committee
|
Pauline van der Meer Mohr (Chair)
Laura Cha
Lord Evans of Weardale
Rachel Lomax (resigned on 28 April 2017)
Jonathan Symonds
Role and responsibilities
The Committee has non-executive responsibility for oversight of culture and conduct risk. It is responsible for the Group’s policies, procedures and standards and ensuring that the Group conducts business responsibly and consistently adheres to the HSBC Values. The CVC is also responsible for Group policies and procedures for capturing and responding to whistleblowing reports. The CVC reports to the GAC where necessary in relation to allegations relating to accounting, internal controls over financial reporting or audit matters.
Principal activities and significant issues considered during 2017
Conduct
The Committee reviewed the Group’s conduct approach and
how effectively global programmes were being implemented throughout the organisation. Deep dives were undertaken on the Singapore, China and Middle East operations and the Global Businesses to determine how effectively the conduct programme was embedding.
how effectively global programmes were being implemented throughout the organisation. Deep dives were undertaken on the Singapore, China and Middle East operations and the Global Businesses to determine how effectively the conduct programme was embedding.
Sustainability
The Committee was responsible for reviewing how effectively the Group sought to satisfy itself that it was meeting its sustainability commitments.
Diversity
The Committee monitored the Group’s refreshed approach to Diversity and Inclusion and the updating of the Group Diversity and Inclusion Policy.
Further information, including the Group's Statements on Conduct, the Group Diversity and Inclusion Policy and the Statement on Modern Slavery and Human Trafficking can be found at
www.hsbc.com/our-approach/measuring-our-impact.
|
Group Remuneration Committee
|
Pauline van der Meer Mohr (Chair)
Henri de Castries (appointed on 26 May 2017)
Sam Laidlaw (resigned on 28 April 2017)
John Lipsky
David Nish (appointed on 26 May 2017)
Paul Walsh (resigned on 21 April 2017)
Role and responsibilities
The Committee is responsible for setting the overarching principles, parameters and governance framework of the Group’s remuneration policy, and the remuneration of executive Directors and other senior Group employees. The Committee regularly reviews the Group’s remuneration policy in the context of consistent and effective risk management, and the regulatory requirements of multiple jurisdictions. No Directors are involved in deciding their own remuneration.
A full report on the role and activities of the Committee is set out on pages
186
to
209
.
|
Nomination Committee
|
Mark Tucker (Chairman – appointed on 1 September 2017)
Laura Cha
Sam Laidlaw (resigned on 28 April 2017)
John Lipsky
Rachel Lomax (resigned on 28 April 2017)
Pauline van der Meer Mohr
Jonathan Symonds (appointed as interim Chair from 28 April 2017 to 1 September 2017)
Paul Walsh (resigned on 21 April 2017)
Role and responsibilities
The Committee leads the Board appointment process, agrees the criteria for any appointments and engages independent external search consultants, as required. At the conclusion of this process, the Committee will nominate potential candidates for appointment to the Board. It is also responsible for succession planning for both senior executive roles, as well as executive and non-executive Directors, and for determining the membership of Board committees.
In the exercise of its responsibilities, the Committee regularly reviews the Board’s structure, size and composition, including skills, knowledge, experience, independence and diversity.
Principal activities and significant issues considered during 2017
Succession planning
In 2016, a committee was established with specific responsibility for succession planning for the Group Chairman. The process was led by the Chairman of the Nomination Committee at the time, Sam Laidlaw, and the Senior Independent Director, Rachel Lomax. The committee, comprising all members of the Nomination Committee, including the chairs of the other principal Board committees, was assisted and advised by independent external search consultants. This process culminated on 12 March 2017 following a recommendation from the committee, and unanimous endorsement by the Board, with the announcement that Mark Tucker would be appointed as the new Group Chairman, with effect from 1 October 2017.
During 2017, the Nomination Committee led the succession process for the Group Chief Executive Officer. The Committee, chaired by Jonathan Symonds on an interim basis from April 2017
|
HSBC Holdings plc
|
177
|
Report of the Directors
| Corporate Governance
(pending the appointment of Mark Tucker as Chair of this Committee on 1 September) included Jonathan Evans, Jackson Tai, Heidi Miller, David Nish and Joachim Faber, and led the succession process for the Group Chief Executive Officer. The process involved the engagement of independent external search consultants to advise on, and support, the Committee. It culminated in a recommendation from the Committee and unanimous support from the Board with an announcement made on 12 October 2017 that John Flint would be appointed as successor to Stuart Gulliver, to take effect from 21 February 2018.
Diversity
The Committee took responsibility for the implementation of the Board’s diversity policy against two objectives: at least 30%
of candidates being women, and only using external search consultants signed up to the Voluntary Code of Conduct for Executive Search Firms.
|
Philanthropic & Community Investment
Oversight Committee
|
Laura Cha (Chair)
Lord Evans of Weardale
Sir Malcolm Grant (non-Director member)
Stephen Moss (non-Director member)
Lord Janvrin (non-Director member)
Role and responsibilities
The Committee has non-executive responsibility for HSBC’s philanthropic and community investment activities in support of the Group’s corporate sustainability objectives. The Committee oversees activity including both the Group’s monetary contributions and employee volunteering.
Principal activities and significant issues considered during 2017
Charitable giving
The Committee was responsible for reviewing the Group’s risk appetite for charitable donations, the budgets for future years and long-term committed funds.
Community investment
During the year, the Committee reviewed and endorsed the Group’s annual community investment budget and the proposed allocation of this budget across agreed sustainability themes.
|
Chairman’s Committee
|
|
Internal control
|
To meet this requirement and to discharge its obligations under the FCA Handbook and the PRA Handbook, procedures have been designed for safeguarding assets against unauthorised use or disposal; for maintaining proper accounting records; and for ensuring the reliability and usefulness of financial information used within the business or for publication.
These procedures can only provide reasonable assurance against material mis-statement, errors, losses or fraud. They are designed to provide effective internal control within the Group and accord
with the Financial Reporting Council‘s guidance for directors issued in 2014, internal control and related financial and business reporting. The procedures have been in place throughout the year and up to 20 February 2018, the date of approval of this
Annual Report and Accounts 2017
.
In 2014, the GAC endorsed the adoption of the COSO 2013 framework for the monitoring of risk management and internal control systems to satisfy the requirements of Section 404 of the Sarbanes-Oxley Act of 2002.
The key risk management and internal control procedures include the following:
|
•
|
The Group’s Global Standards Manual (‘GSM’) outlines the core principles within which the Group must operate wherever we conduct business. The GSM overlays all other policies and procedures throughout the Group. The requirements of the GSM are mandatory, apply to and must be observed by all businesses within the Group, regardless of the nature or location of their activities.
|
|
•
|
Delegation of authority within limits set by the Board: subject to certain matters reserved for the Board, the Group Chief Executive has been delegated authority limits and powers within which to manage the day-to-day affairs of the Group, including the right to sub-delegate those limits and powers. Each relevant group managing director or executive Director has delegated authority within which to manage the day-to-day affairs of the business or function for which he or she is accountable. Delegation of authority from the Board requires those individuals to maintain a clear and appropriate apportionment of significant responsibilities and to oversee the establishment and maintenance of systems of control that are appropriate to their business or function. Authorities to enter into credit and market risk exposures are delegated with limits to line management of Group companies. The concurrence of the appropriate global function is required, however, to credit proposals with specified higher risk characteristics. Credit and market risks are measured and reported at subsidiary company level and aggregated for risk concentration analysis on a Group-wide basis.
|
|
•
|
Risk identification and monitoring: systems and procedures are in place to identify, assess, control and monitor the material risk types facing HSBC. The Group‘s risk measurement and reporting systems are designed to help ensure that risks are comprehensively captured with all the attributes necessary to support well-founded decisions, that those attributes are accurately assessed and that information is delivered in a timely manner for those risks to be successfully managed and mitigated.
|
|
•
|
Changes in market conditions/practices: processes are in place to identify new risks arising from changes in market conditions/practices or customer behaviours, which could expose the Group to heightened risk of loss or reputational damage. The Group employs a top and emerging risks framework at all levels of the organisation, which enables it to identify current and forward-looking risks and to take action which either prevents them materialising or limits their impact.
|
|
•
|
Responsibility for risk management: all employees are responsible for identifying and managing risk within the scope of their role as part of the three lines of defence model, which is an activity-based model to delineate management accountabilities and responsibilities for risk management and the control environment. The second line of defence sets the policy and guidelines for managing specific risk areas, provides advice and guidance in relation to the risk, and challenges the first line of defence (the risk owners) on effective risk management.
|
|
•
|
Strategic plans: strategic plans are prepared for global businesses, global functions and geographical regions within the framework of the Group’s overall strategy. Annual Operating Plans, informed by detailed analysis of risk appetite describing the types and quantum of risk that the Group is prepared to take in executing its strategy, are prepared and
|
|
178
|
HSBC Holdings plc
|
adopted by all major Group operating companies and set out the key business initiatives and the likely financial effects of those initiatives.
|
•
|
IT operations: centralised control is exercised over all IT developments and operations. Common systems are employed for similar business processes wherever practicable.
|
|
•
|
Subsidiary certifications to the GRC: half-yearly confirmations are provided to the GRC from the risk committees of principal subsidiary companies confirming that the committees have challenged management on the quality of the information provided, reviewed the actions proposed by management to address any emerging issues or trends indicating material divergence from the Group’s risk appetite and that the risk management and internal control systems in place are operating effectively.
|
The key risk management and internal control procedures over financial reporting include the following:
|
•
|
Disclosure Committee: chaired by the Group Company Secretary, this Committee supports the discharge of the Group’s obligations under relevant legislation and regulation including the UK and Hong Kong Listing Rules, the Market Abuse Regulation and SEC rules. In so doing the Committee is empowered to determine whether a new event or circumstances should be disclosed, including the form and timing of such disclosure, and review all material disclosures made or to be made by the Group. The membership of the Disclosure Committee includes the Group Finance Director, Group Chief Risk Officer, Chief Legal Officer, Group Chief Accounting Officer, Group Head of Communications, Global Head of Investor Relations, Group Head of Strategy and Planning and Group Financial Controller. The integrity of disclosures is underpinned by structures and processes within the Global Finance and Global Risk functions that support rigorous analytical review of financial reporting and the maintenance of proper accounting records.
|
|
•
|
Financial reporting: the Group’s financial reporting process is controlled using documented accounting policies and reporting formats, supported by detailed instructions and guidance on reporting requirements, issued to all reporting entities within the Group in advance of each reporting period end. The submission of financial information from each reporting entity is subject to certification by the responsible financial officer, and analytical review procedures at reporting entity and Group levels.
|
|
•
|
Subsidiary certifications to the GAC: half-yearly confirmations are provided to the GAC from the audit committees of principal subsidiary companies regarding whether their financial statements have been prepared in accordance with Group policies, present fairly the state of affairs of the relevant principal subsidiary and are prepared on a going concern basis.
|
The internal control responsibilities of the GRC and GAC were complemented by the activities of the CVC and the FSVC which, respectively, oversaw conduct-related risk matters and financial crime compliance. Collectively, these controls are designed to provide effective internal control within the Group.
The GRC and the GAC have received confirmation that executive management has taken or is taking the necessary actions to remedy any failings or weaknesses identified through the operation of the Group's framework of controls. In 2017, deficiencies in the design and operational effectiveness of a number of controls were identified. Significant improvement in the control environment has been observed as a result of management’s progress on the execution of the remediation programme.
The Directors, through the GRC and the GAC, have conducted an annual review of the effectiveness of the Group's system of risk management and internal control covering all material controls, including financial, operational and compliance controls, risk management systems, the adequacy of resources, qualifications and experience of staff of the accounting and financial reporting function and the Global Risk function, and their training
programmes and budget. The annual review of the effectiveness of the Group’s system of risk management and internal control over financial reporting was conducted with reference to the COSO framework. The annual review of other controls was undertaken using the Group’s risk management framework, further details of which can be found on pages
106
to
109
. Based on the assessment performed, the Directors concluded that for the year ended 31 December 2017, the Group’s internal controls were effective.
|
Internal audit
|
|
Going concern
|
The Directors considered it appropriate to prepare the financial statements on the going concern basis.
In making the going concern assessment, the Directors have considered a wide range of detailed information relating to present and potential conditions, including projections for profitability, cash flows, capital requirements and capital resources.
In carrying out their assessment of the principal risks, the Directors considered a wide range of information including:
|
•
|
Details of the Group’s business and operating models, and strategy.
|
|
•
|
Details of the Group’s approach to managing risk and allocating capital.
|
|
•
|
A summary of the Group’s financial performance, and its capital position and annual operating plan.
|
|
•
|
Enterprise-wide risk management reports, including the Group’s risk appetite profile (see page
95
), top and emerging risks (see page
95
) and risk map (see page
109
).
|
|
•
|
Reports and updates regarding regulatory and internal stress testing exercises (see page
109
). In 2017, the published Bank of England ('BoE') stress test results for HSBC showed that our capital ratios after taking account of CRD IV restrictions and strategic management actions exceeded the BoE’s requirements. The results for HSBC assumed no dividend payments in the first two years of the severe stress projection period.
|
|
•
|
Reports and updates from management on risk-related issues selected for in-depth consideration.
|
|
•
|
Reports and updates on the Group’s compliance-related initiatives connected to the resolution of the investigations by US and UK regulatory and law enforcement authorities in December 2012.
|
|
•
|
Reports and updates on regulatory developments.
|
|
•
|
Legal reports.
|
|
Share capital and other disclosures
|
On 22 February 2017, HSBC Holdings commenced a share buy-back programme to purchase its ordinary shares of $0.50 each
up to a maximum consideration of $1.0bn. This programme concluded on 12 April 2017. 122,599,324 ordinary shares were purchased and cancelled. On 1 August 2017, HSBC Holdings
up to a maximum consideration of $1.0bn. This programme concluded on 12 April 2017. 122,599,324 ordinary shares were purchased and cancelled. On 1 August 2017, HSBC Holdings
|
HSBC Holdings plc
|
179
|
Report of the Directors
| Corporate Governance
announced a further share buy-back programme for the purchase of up to a maximum of $2.0bn of its ordinary shares of $0.50. This programme concluded on 20 November 2017 and 205,624,077 ordinary shares were purchased and cancelled. The purpose of both buy-back programmes was to reduce HSBC’s number of outstanding ordinary shares.
The nominal value of shares purchased during 2017 was $164,111,701 and the aggregate consideration paid by HSBC was £2,326,610,093.
The table that follows outlines details of the shares purchased on a monthly basis during 2017. At 31 December 2017, the total number of shares purchased was 328,223,401, representing 1.62% of the shares in issue and 1.64% of the shares in issue excluding treasury shares.
|
Month
|
Number
of shares
|
|
Highest price
paid per share
|
Lowest price
paid per share
|
Average price paid per share
|
Aggregate
price paid
|
|
£
|
£
|
£
|
£
|
|||
|
First share buy-back of 2017
|
||||||
|
Feb-17
|
20,682,000
|
|
6.8080
|
6.4500
|
6.5677
|
135,833,224
|
|
Mar-17
|
77,853,860
|
|
6.7800
|
6.4070
|
6.5977
|
513,656,572
|
|
Apr-17
|
24,063,464
|
|
6.6360
|
6.4610
|
6.5390
|
157,350,841
|
|
122,599,324
|
|
806,840,637
|
||||
|
Second share buy-back of 2017
|
||||||
|
Aug-17
|
49,649,445
|
|
7.7090
|
7.3010
|
7.4789
|
371,323,631
|
|
Sep-17
|
55,482,328
|
|
7.5260
|
7.0530
|
7.2806
|
403,943,040
|
|
Oct-17
|
53,192,769
|
|
7.6880
|
7.3400
|
7.4595
|
396,791,032
|
|
Nov-17
|
47,299,535
|
|
7.4650
|
7.2730
|
7.3513
|
347,711,753
|
|
205,624,077
|
|
1,519,769,456
|
||||
Dividends
Dividends for 2017
First, second and third interim dividends for 2017, each of $0.10 per ordinary share, were paid on 5 July 2017, 20 September 2017 and 22 November 2017, respectively. Note
8
on the Financial Statements gives more information on the dividends declared in 2017. On 20 February 2018, the Directors declared a fourth interim dividend for 2017 of $0.21 per ordinary share in lieu of a final dividend, which will be payable on 6 April 2018 in cash in US dollars, or in sterling or Hong Kong dollars at exchange rates to be determined on 26 March 2018, with a scrip dividend alternative. As the fourth interim dividend for 2017 was declared after
31 December 2017 it has not been included in the balance sheet of HSBC as a liability. The reserves available for distribution at
31 December 2017 were $38.0bn.
31 December 2017 it has not been included in the balance sheet of HSBC as a liability. The reserves available for distribution at
31 December 2017 were $38.0bn.
A quarterly dividend of $15.50 per 6.20% non-cumulative US dollar preference share, Series A (‘Series A dollar preference share’), (equivalent to a dividend of $0.3875 per Series A American Depositary Share (‘ADS’), each of which represents one-fortieth of a Series A dollar preference share), and £0.01 per Series A sterling preference share was paid on 15 March, 15 June, 15 September and 15 December 2017.
Dividends for 2018
Quarterly dividends of $15.50 per Series A dollar preference share (equivalent to a dividend of $0.3875 per Series A American Depositary Share, each of which represents one-fortieth of a Series A dollar preference share) and £0.01 per Series A sterling preference share was declared on 6 February 2018 for payment on 15 March 2018.
Share capital
Issued share capital
The nominal value of HSBC Holdings’ issued share capital paid up at 31 December 2017 was $10,160,372,629 divided into 20,320,716,258 ordinary shares of $0.50 each, 1,450,000 non-cumulative preference shares of $0.01 each and one non-cumulative preference share of £0.01, representing approximately 99.9999%, 0.0001%, and 0% respectively of the nominal value of HSBC Holdings’ total issued share capital paid up at 31 December 2017.
Rights, obligations and restrictions attaching to shares
The rights and obligations attaching to each class of ordinary and non-cumulative preference shares in our share capital are set out in full in our Articles of Association. The Articles of Association
may be amended by special resolution of the shareholders and can be found on our website at www.hsbc.com/about-hsbc/corporate-governance/board-responsibilities.
Ordinary shares
HSBC Holdings has one class of ordinary share, which carries no right to fixed income. There are no voting restrictions on the issued ordinary shares, all of which are fully paid. On a show of hands, each member present has the right to one vote at general meetings. On a poll, each member present or voting by proxy is entitled to one vote for every $0.50 nominal value of share capital held. There are no specific restrictions on transfers of ordinary shares, which are governed by the general provisions of the Articles of Association and prevailing legislation.
At the 2016 AGM, shareholders gave authority to the Directors to offer a scrip dividend alternative on any dividend (including interim dividends) declared up to the conclusion of the AGM in 2019.
Information on the policy adopted by the Board for paying interim dividends on the ordinary shares may be found on page
298
, under the heading ‘Shareholder Information’.
Dividend waivers
HSBC Holdings employee benefit trusts, holding shares in HSBC Holdings in connection with the operation of its share plans, have lodged standing instructions to waive dividends on shares held by them that have not been allocated to employees. The total amount of dividends waived during 2017 was $3.6m.
Preference shares
The preference shares, which have preferential rights to income and capital, do not, in general, confer a right to attend and vote at general meetings.
There are three classes of preference shares in the share capital of HSBC Holdings: non-cumulative preference shares of $0.01 each (‘dollar preference shares’); non-cumulative preference shares of £0.01 each (‘sterling preference shares’); and non-cumulative preference shares of €0.01 (‘euro preference shares’). The dollar preference shares in issue are Series A dollar preference shares and the sterling preference share in issue is a Series A sterling preference share. There are no euro preference shares in issue.
Information on dividends declared for 2017 and 2018 may be found on page
242
, under the heading ‘Dividends’ and in Note
8
on the Financial Statements.
Further details of the rights and obligations attaching to the HSBC Holdings’ issued share capital may be found in Note
31
on the Financial Statements.
|
180
|
HSBC Holdings plc
|
Share capital changes in 2017
The following events occurred during the year in relation to the ordinary share capital of HSBC Holdings:
|
Scrip dividends
|
|||||||
|
HSBC Holdings
ordinary shares issued
|
Aggregate
nominal value
|
|
Market value per share
|
||||
|
on
|
number
|
|
$
|
|
$
|
£
|
|
|
Issued in lieu of
|
|||||||
|
Fourth interim dividend for 2016
|
6 Apr 2017
|
241,151,585
|
|
120,575,793
|
|
8.0636
|
6.5160
|
|
First interim dividend for 2017
|
5 Jul 2017
|
95,501,245
|
|
47,750,623
|
|
8.6500
|
6.6610
|
|
Second interim dividend for 2017
|
20 Sep 2017
|
19,315,343
|
|
9,657,672
|
|
9.9680
|
7.6606
|
|
Third interim dividend for 2017
|
22 Nov 2017
|
24,684,023
|
|
12,342,012
|
|
9.8000
|
7.4434
|
|
All-employee share plans
|
|||||||||
|
Number
|
|
Aggregate
nominal
value
|
|
Exercise price
|
|||||
|
from
|
|
to
|
|
||||||
|
$
|
|
||||||||
|
HSBC Holdings savings-related share option plans
|
|||||||||
|
HSBC ordinary shares issued in £
|
8,935,312
|
|
4,467,656
|
|
£
|
4.0472
|
|
5.964
|
|
|
HSBC ordinary shares issued in HK$
|
377,804
|
|
188,902
|
|
HK$
|
55.4701
|
|
63.9864
|
|
|
HSBC ordinary shares issued in $
|
125,058
|
|
62,529
|
|
$
|
7.1456
|
|
8.2094
|
|
|
HSBC ordinary shares issued in €
|
64,712
|
|
32,356
|
|
€
|
5.3532
|
|
5.7974
|
|
|
Options over HSBC ordinary shares lapsed
|
6,301,579
|
|
3,150,790
|
|
|||||
|
Options over HSBC ordinary shares granted in response to approximately 14,932 applications from HSBC employees in the UK on 21
Sep 2017
|
10,447,272
|
|
|||||||
|
HSBC International Employee Share Purchase Plan
|
693,152
|
|
346,576
|
|
£
|
6.2620
|
|
7.6950
|
|
|
HSBC share plans
|
||||||||
|
HSBC Holdings
ordinary shares issued
|
|
Aggregate
nominal
value
|
|
Market value per share
|
||||
|
from
|
|
to
|
|
|||||
|
$
|
|
£
|
|
£
|
|
|||
|
Vesting of awards under the HSBC Share Plan and HSBC Share Plan 2011
|
66,505,211
|
|
33,252,606
|
|
6.4600
|
|
7.6880
|
|
Compliance with Hong Kong Listing Rule 13.25A(2)
HSBC Holdings has been granted a waiver from strict compliance with Rule 13.25A(2) of the Rules Governing the Listing of Securities on the Stock Exchange of Hong Kong.
Under this waiver, HSBC’s obligation to file a Next Day Return following the issue of new shares pursuant to the vesting of share awards granted under its share plans to persons who are not Directors, would only be triggered where it falls within one of the circumstances set out under Rule 13.25A(3).
Authorities to allot and to purchase shares and
pre-emption rights
pre-emption rights
At the AGM in 2017, shareholders renewed the general authority for the Directors to allot new shares up to 13,244,610,940 ordinary shares, 15,000,000 non-cumulative preference shares of £0.01 each, 15,000,000 non-cumulative preference shares of $0.01 each and 15,000,000 non-cumulative preference shares of €0.01 each. Shareholders also renewed the authority for the Directors to make market purchases of up to 1,986,691,641 ordinary shares. The Directors exercised this authority during the year and purchased 328,223,401 ordinary shares.
In addition, shareholders gave authority for the Directors to grant rights to subscribe for, or to convert any security into, no more than 3,973,383,282 ordinary shares in relation to any issue by HSBC Holdings or any member of the Group of contingent convertible securities that automatically convert into or are exchanged for ordinary shares in HSBC Holdings in prescribed circumstances. Further details about the issue of contingent convertible securities may be found in Note
31
on the Financial Statements.
Other than as disclosed in the tables above headed ‘Share capital changes in 2017’, the Directors did not allot any shares during 2017.
In 2017, following its capital plan, HSBC Holdings issued the equivalent of $16.8bn of debt securities in the public capital markets in a range of currencies and maturities, including $5.1bn of contingent convertible and $11.7bn of senior securities to ensure it meets the current and proposed regulatory rules, including those relating to the availability of adequate total loss-absorbing capacity. For additional information on capital instruments and bail-inable debt, refer to Notes
27
and
31
on pages
268
and
277
.
Treasury shares
In accordance with the terms of a waiver granted by the Hong Kong Stock Exchange on 19 December 2005, HSBC Holdings will comply with the applicable law and regulation in the UK in relation to the holding of any shares in treasury and with the conditions of the waiver in connection with any shares it may hold in treasury. Pursuant to Chapter 6 of the UK Companies Act 2006,
325,273,407
ordinary shares are currently held in treasury. This was the maximum number of shares held at any time during 2017; representing 1.60% of the shares in issue. The nominal value of shares held in treasury is $
162,636,704.
Notifiable interests in share capital
At 31 December 2017, HSBC Holdings had received the following notification of major holdings of voting rights pursuant to the requirements of Rule 5 of the Disclosure, Guidance and Transparency Rules:
|
•
|
BlackRock, Inc. gave notice on 18 October 2017 that on 16 October 2017 it had the following: an indirect interest in HSBC Holdings ordinary shares of 1,214,807,412; qualifying financial instruments with 52,830,499 voting rights that may be acquired if the instruments are exercised or converted; and financial instruments with a similar economic effect to qualifying financial instruments which refer to 6,978,758 voting rights, representing 6.06%, 0.26% and 0.03%, respectively, of
|
|
HSBC Holdings plc
|
181
|
Report of the Directors
| Corporate Governance
the total voting rights at that date.
|
•
|
Ping An Asset Management Co., Ltd. gave notice on 6 December 2017 that on 4 December 2017 it had an indirect interest in HSBC Holdings ordinary shares of 1,007,946,172, representing 5.04% of the total voting rights at that date.
|
At 31 December 2017, according to the register maintained by HSBC Holdings pursuant to section 336 of the Securities and Futures Ordinance of Hong Kong:
|
•
|
BlackRock, Inc. gave notice on 30 December 2017 that on 28 December 2017 it had the following interests in HSBC Holdings ordinary shares: a long position of 1,424,882,481 shares and a short position of 6,642,872 shares, representing 7.01% and 0.03%, respectively, of the ordinary shares in issue at that date. Since 31 December 2017 and following interim notifications on 6 January and 15 January, BlackRock Inc. gave notice on 2 February 2018 that on 30 January 2018 it had the following interests in HSBC Holdings ordinary shares: a long position of 1,434,324,764 shares and a short position of 5,356,892 shares, representing 7.06% and 0.03%, respectively, of the ordinary shares in issue at that date; and
|
|
•
|
Ping An Asset Management Co., Ltd. gave notice on 6 December 2017 that on 5 December 2017 it had a long position of 1,017,946,172 in HSBC Holdings ordinary shares, representing 5.01% of the ordinary shares in issue at that date. Since 31 December 2017, Ping An Asset Management Co., Ltd. gave notice on 13 February 2018 that on 9 February 2018 it had a long position of 1,253,254,972 in HSBC Holdings ordinary shares, representing 6.17% of the ordinary shares in issue at that date.
|
Sufficiency of float
In compliance with the Rules Governing the Listing of Securities on The Stock Exchange of Hong Kong Limited at least 25% of the total issued share capital has been held by the public at all times during 2017 and up to the date of this report.
Dealings in HSBC Holdings listed securities
HSBC Group has policies and procedures that, except where permitted by statute and regulation, prohibit specified transactions in respect of its securities listed on The Stock Exchange of Hong Kong Limited. Except for dealings as intermediaries or as trustees by subsidiaries of HSBC Holdings, neither HSBC Holdings nor any of its subsidiaries has purchased, sold or redeemed any of its securities listed on The Stock Exchange of Hong Kong Limited during the year ended 31 December 2017.
Directors’ interests
Pursuant to the requirements of the UK Listing Rules and according to the register of Directors’ interests maintained by HSBC Holdings pursuant to section 352 of the Securities and Futures Ordinance of Hong Kong, the Directors of HSBC Holdings at 31 December 2017 had certain interests, all beneficial unless otherwise stated, in the shares or debentures of HSBC Holdings and its associated corporations. Save as stated in the below table, no further interests were held by Directors, and no Directors or their connected persons were awarded or exercised any right to subscribe for any shares or debentures in any HSBC corporation during the year.
No Directors held any short position as defined in the Securities and Futures Ordinance of Hong Kong in the shares or debentures of HSBC Holdings and its associated corporations.
|
182
|
HSBC Holdings plc
|
|
Directors’ interests – shares and debentures
|
|||||||||||||
|
At 31 Dec 2017
|
|||||||||||||
|
Footnotes
|
At 1 Jan
2017
|
|
Beneficial
owner
|
|
Child
under 18
or spouse
|
|
Jointly with another person
|
|
Trustee
|
|
Total
interests
|
|
|
|
HSBC Holdings ordinary shares
|
|||||||||||||
|
Phillip Ameen
|
1
|
5,000
|
|
5,000
|
|
—
|
|
—
|
|
—
|
|
5,000
|
|
|
Kathleen Casey
|
1
|
8,620
|
|
9,125
|
|
—
|
|
—
|
|
—
|
|
9,125
|
|
|
Laura Cha
|
2
|
13,200
|
|
10,200
|
|
8,000
|
|
—
|
|
—
|
|
18,200
|
|
|
Henri de Castries
|
16,165
|
|
17,116
|
|
—
|
|
—
|
|
—
|
|
17,116
|
|
|
|
Lord Evans of Weardale
|
9,170
|
|
12,892
|
|
—
|
|
—
|
|
—
|
|
12,892
|
|
|
|
Joachim Faber
|
66,605
|
|
66,605
|
|
—
|
|
—
|
|
—
|
|
66,605
|
|
|
|
Stuart Gulliver
|
3
|
3,344,208
|
|
3,534,284
|
|
176,885
|
|
—
|
|
—
|
|
3,711,169
|
|
|
Irene Lee
|
10,000
|
|
10,588
|
|
—
|
|
—
|
|
—
|
|
10,588
|
|
|
|
John Lipsky
|
1
|
16,165
|
|
16,165
|
|
—
|
|
—
|
|
—
|
|
16,165
|
|
|
Iain Mackay
|
3
|
345,469
|
|
442,118
|
|
—
|
|
—
|
|
—
|
|
442,118
|
|
|
Heidi Miller
|
1
|
3,975
|
|
4,200
|
|
—
|
|
—
|
|
—
|
|
4,200
|
|
|
Marc Moses
|
3
|
824,241
|
|
1,207,068
|
|
—
|
|
—
|
|
—
|
|
1,207,068
|
|
|
David Nish
|
50,000
|
|
—
|
|
50,000
|
|
—
|
|
—
|
|
50,000
|
|
|
|
Jonathan Symonds
|
21,771
|
|
37,936
|
|
4,885
|
|
—
|
|
—
|
|
42,821
|
|
|
|
Jackson Tai
|
1, 4
|
31,605
|
|
12,900
|
|
10,350
|
|
21,575
|
|
—
|
|
44,825
|
|
|
Mark Tucker
|
—
|
|
276,000
|
|
—
|
|
—
|
|
—
|
|
276,000
|
|
|
|
Pauline van der Meer Mohr
|
15,000
|
|
15,000
|
|
—
|
|
—
|
|
—
|
|
15,000
|
|
|
|
1
|
Phillip Ameen has an interest in 1,000, Kathleen Casey has an interest in 1,825, John Lipsky has an interest in 3,233, Heidi Miller has an interest in 840 and Jackson Tai has an interest in 8,965 listed ADS, which are categorised as equity derivatives under Part XV of the Securities and Futures Ordinance of Hong Kong. Each ADS represents five HSBC Holdings ordinary shares.
|
|
2
|
HSBC Holdings was advised on 23 January 2018 that Laura Cha's spouse acquired 8,000 shares on 24 August 2015.
|
|
3
|
Executive Directors’ other interests in HSBC Holdings ordinary shares arising from the HSBC Holdings savings-related share option plans and the HSBC Share Plan 2011 are set out in the Scheme interests in the Directors’ Remuneration Report on page
186
. At 31 December 2017, the aggregate interests under the Securities and Futures Ordinance of Hong Kong in HSBC Holdings ordinary shares, including interests arising through employee share plans and the interests above were: Stuart Gulliver – 6,742,739; Iain Mackay – 2,140,600; and Marc Moses – 2,920,384. Each Director’s total interests represents less than 0.04% of the shares in issue and 0.04% of the shares in issue excluding treasury shares.
|
|
4
|
Jackson Tai has a non-beneficial interest in 10,350 shares of which he is custodian.
|
There have been no changes in the shares or debentures of the Directors from 31 December 2017 to the date of this report.
Listing Rule 9.8.4
The information to be disclosed in the
Annual Report and Accounts
pursuant to UK Listing Rule 9.8.4 is contained within the Corporate Governance Report.
|
Employees
|
We encourage employees to perform at their best, and create an environment to make that possible. We also encourage employees to speak up, and reflect our purpose and values in the decisions we make and how we make them, as these decisions shape the future of our customers and colleagues.
Employee relations
We consult with and, where appropriate, negotiate with employee representative bodies. It is our policy to maintain well-developed communications and consultation programmes with all employee representative bodies and there have been no material disruptions to our operations from labour disputes during the past five years.
Diversity and inclusion
We are committed to enabling a thriving environment where people are valued, respected and supported; where different ideas, backgrounds, styles and perspectives are actively sought out to create business value; and where career advancement is based on objective criteria. We are focusing on the diversity profile of our workforce to make it more reflective of the communities we operate in and the customers we serve.
Everyone has a role to play in building our inclusive workplace. Our Global Diversity and Inclusion Policy is clear that all employees and workers are responsible for treating colleagues with dignity and respect, and for creating an inclusive environment free from
discrimination, bullying, harassment or victimisation, irrespective of their age, colour, disability, ethnic or national origin, gender, gender expression, gender identity, marital status, pregnancy, race, religion or belief, or sexual orientation. Our employees are expected to demonstrate openness by listening and valuing different backgrounds, perspectives and cultures.
Diversity and Inclusion carries the highest level of executive support. It was governed by the Conduct and Values Committee in 2017, and will be governed by the Group People Committee from 2018.
|
Gender diversity statistics
|
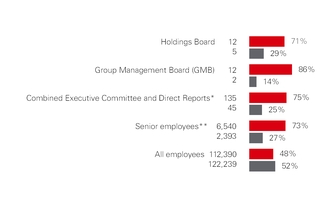
|
Male
|
Female
|
||
*Combined Executive Committee and Direct Reports was reported as at 30 June 2017 to the UK's Hampton Alexander Review and includes HSBC's Executive Directors, Group Managing Directors and their direct reports (excluding administrative staff).
**Senior employees refers to employees performing roles classified as 0, 1, 2 or 3 in our Global Career Band structure.
|
HSBC Holdings plc
|
183
|
Report of the Directors
| Corporate Governance
Employee development
The development of our employees is essential to the future strength of our business. We continue to develop employee capability. We identify, develop and deploy talented employees to ensure an appropriate supply of high calibre individuals with the values, skills and experience for current and future senior management positions.
In 2017, we introduced HSBC University, the new home of learning at HSBC. HSBC University brings new programmes, training facilities, and technologies with a particular focus on Leadership, Risk Management, Strategy and Performance, as well as business-specific technical training. Its new leadership programmes are designed to support our leaders at all levels, encouraging collaboration and future thinking across HSBC's businesses, functions and geographies. In 2018 HSBC University will bring colleagues together to learn, develop and connect through new dedicated classroom space at our offices in Dubai, Mexico City, and the new HSBC UK Head Office in Birmingham.
Employment of people with a disability
We believe in providing equal opportunities for all employees.
The employment of people with a disability is included in this commitment. The recruitment, training, career development and promotion of people with a disability are based on the aptitudes and abilities of the individual. Should employees become disabled during their employment with us, efforts are made to continue their employment and, if necessary, appropriate training and reasonable equipment and facilities are provided.
The employment of people with a disability is included in this commitment. The recruitment, training, career development and promotion of people with a disability are based on the aptitudes and abilities of the individual. Should employees become disabled during their employment with us, efforts are made to continue their employment and, if necessary, appropriate training and reasonable equipment and facilities are provided.
Health and safety
The Group is committed to providing a healthy and safe working environment for our employees, contractors, customers and visitors on HSBC premises and where impacted by our operations. We aim to be compliant with all applicable health and safety legal requirements, and to ensure that best practice health and safety management standards are implemented and maintained across the HSBC Group.
Everyone at HSBC has a responsibility for helping to create a healthy and safe working environment. Employees are expected to take ownership of their safety and are encouraged and empowered to report any concerns.
Chief Operating Officers have overall responsibility for ensuring that the correct policies, procedures and safeguards are put into practice. This includes making sure that everyone in HSBC has access to appropriate information, instruction, training and supervision.
Putting our commitment into practice, in 2017 the Group delivered a health and safety education and information training programme to every one of our employees, and the Group implemented a range of programmes to help us understand the risks we face and improve the buildings in which we operate:
|
•
|
We completed fire risk assessments in over 2,000 properties worldwide, and addressed areas of concern.
|
|
•
|
We completed a health and safety inspection and remediation programme in 97% of our premises across the globe.
|
|
•
|
The application of our health and safety policies and procedures continues to be integrated throughout our supply chain, particularly in developing markets, with audit and inspection programmes demonstrating continued improvements in health and safety performance.
|
|
•
|
We developed and implemented an improved risk assurance and oversight function to ensure our health and safety management system was performing appropriately, including conducting full reviews of health and safety management in
12 countries. |
|
Employee health and safety
|
||||||
|
Footnotes
|
2017
|
|
2016
|
|
2015
|
|
|
Number of workplace fatalities
|
1
|
2
|
|
1
|
|
0
|
|
Number of major injuries to employees
|
2
|
31
|
|
44
|
|
n/a
|
|
All injury rate per 100,000 employees
|
205
|
|
246
|
|
n/a
|
|
|
1
|
Customer death on branch premises; contractor involved in road traffic accident on bank business.
|
|
2
|
Fractures, dislocation, concussion.
|
|
n/a
|
Comparable data not available at global level for 2015 following change in reporting procedure for 2016.
|
Remuneration policy
The quality and commitment of our employees is fundamental to our success and accordingly the Board aims to attract, retain and motivate the very best people. As trust and relationships are vital in our business our goal is to recruit those who are committed to making a long-term career with the Group.
HSBC’s reward strategy supports this objective through balancing both short-term and sustainable performance. Our remuneration strategy is designed to reward competitively the achievement of long-term sustainable performance and attract and motivate the very best people who are committed to maintaining a long-term career with the Group while performing their role in the long-term interests of our stakeholders.
In order to ensure alignment between remuneration and our business strategy, individual remuneration is determined through assessment of performance delivered against both annual and long-term objectives summarised in performance scorecards, and adherence to the HSBC Values of being ’open, connected and dependable‘ and acting with ’courageous integrity’. Altogether, performance is judged, not only on what is achieved over the short and long term, but also on how it is achieved, as the latter contributes to the sustainability of the Group.
The financial and non-financial measures incorporated in the annual and long-term scorecards are carefully considered to ensure alignment with the long-term strategy of the Group.
Further information on the Group’s approach to remuneration is given on page
186
.
Employee share plans
Share options and discretionary awards of shares granted under HSBC share plans align the interests of employees with the creation of shareholder value. The following table sets out the particulars of outstanding options, including those held by employees working under employment contracts that are regarded as ‘continuous contracts’ for the purposes of the Hong Kong Employment Ordinance.
The options were granted at nil consideration. No options have been granted to substantial shareholders and suppliers of goods or services, nor in excess of the individual limit for each share plan. No options were cancelled by HSBC during the year.
A summary for each plan of the total number of the options which were granted, exercised or lapsed during 2017 is shown in the following table. Further details required to be disclosed pursuant to Chapter 17 of the Rules Governing the Listing of Securities on The Stock Exchange of Hong Kong Limited are available on our website at www.hsbc.com/about-hsbc/corporate-governance/employee-share-plans and on the website of The Stock Exchange of Hong Kong Limited at www.hkex.com.hk, or can be obtained upon request from the Group Company Secretary,
8 Canada Square, London E14 5HQ.
8 Canada Square, London E14 5HQ.
Particulars of options held by Directors of HSBC Holdings are set out on
page 198 .
page 198 .
Note
5
on the Financial Statements gives details of share-based payments, including discretionary awards of shares granted under HSBC share plans.
|
184
|
HSBC Holdings plc
|
All-employee share plans
HSBC operates all-employee share option plans under which options are granted over HSBC ordinary shares. Subject to leaver provisions, options are normally exercisable after three to five years.
During 2017, options were granted at the mid-market closing price for HSBC Holdings ordinary shares quoted on the London Stock Exchange which, as derived from the Daily Official List on
20 September
2017, the day before the options were granted, was £7.23.
The UK Sharesave will terminate on 23 May 2025 unless the Directors resolve to terminate the plans at an earlier date. There will be no further grants under the HSBC Holdings Savings-Related Share Option Plan: International.
The HSBC International Employee Share Purchase Plan was introduced in 2013 and now includes employees based in 27 jurisdictions.
|
HSBC Holdings All-employee Share Option Plans
|
||||||||||||||||||
|
HSBC Holdings ordinary shares
|
||||||||||||||||||
|
Dates of awards
|
Exercise price
|
Exercisable
|
At
|
|
Granted
|
|
Exercised
|
|
Lapsed
|
|
At
|
|
||||||
|
from
|
to
|
from
|
|
to
|
|
from
|
to
|
Footnotes
|
1 Jan 2017
|
|
during year
|
|
during year
|
|
during year
|
|
31 Dec 2017
|
|
|
Savings-Related Share Option Plan
|
1
|
|||||||||||||||||
|
21 Apr
2011
|
21 Sep
2017
|
(£)
|
|
(£)
|
|
1 Aug 2016
|
30 Apr 2023
|
|||||||||||
|
4.0472
|
|
5.9640
|
|
68,777,416
|
|
10,447,272
|
|
8,580,981
|
|
6,077,604
|
|
64,566,103
|
|
|||||
|
Savings-Related Share Option Plan: International
|
2
|
|||||||||||||||||
|
21 Apr
2011
|
24 Apr
2012
|
(£)
|
|
(£)
|
|
1 Aug 2016
|
31 Jan
2018
|
|||||||||||
|
4.4621
|
|
5.0971
|
|
440,309
|
|
—
|
|
354,331
|
|
47,149
|
|
38,829
|
|
|||||
|
21 Apr
2011
|
24 Apr
2012
|
($)
|
|
($)
|
|
1 Aug 2016
|
31 Jan
2018
|
|||||||||||
|
7.1456
|
|
8.2094
|
|
217,738
|
|
—
|
|
125,058
|
|
74,807
|
|
17,873
|
|
|||||
|
21 Apr
2011
|
24 Apr
2012
|
(€)
|
|
(€)
|
|
1 Aug 2016
|
31 Jan
2018
|
|||||||||||
|
5.3532
|
|
5.7974
|
|
86,916
|
|
—
|
|
64,712
|
|
11,665
|
|
10,539
|
|
|||||
|
21 Apr
2011
|
24 Apr
2012
|
(HK$)
|
|
(HK$)
|
|
1 Aug 2016
|
31 Jan
2018
|
|||||||||||
|
55.4701
|
|
63.9864
|
|
504,467
|
|
—
|
|
377,804
|
|
90,354
|
|
36,309
|
|
|||||
|
1
|
The weighted average closing price of the shares immediately before the dates on which options were exercised was £7.32.
|
|
2
|
The weighted average closing price of the shares immediately before the dates on which options were exercised was £7.48.
|
|
Statement of compliance
|
|
Relevant corporate governance codes
|
|
|
UK Corporate Governance Code
|
www.frc.org.uk
|
|
Hong Kong Corporate Governance Code (set out in Appendix 14 to the Rules Governing the Listing of Securities on the Stock Exchange of Hong Kong Limited)
|
www.hkex.com.hk
|
|
Descriptions of the roles and responsibilities of the:
– Group Chairman
– Group Chief Executive
– Senior Independent Director
|
www.hsbc.com/about-hsbc/corporate-governance/board-committees
|
|
Board and senior management
|
www.hsbc.com/about-hsbc/leadership
|
|
Roles and responsibilities of the Board and its committees
|
www.hsbc.com/about-hsbc/corporate-governance/board-committees
|
|
Board’s policies on:
– Diversity
– Shareholder communication
|
www.hsbc.com/investor-relations/governance/corporate-governance-codes
|
|
Global Internal Audit Charter
|
www.hsbc.com/investor-relations/governance/internal-control
|
HSBC is subject to corporate governance requirements in both the UK and Hong Kong. During 2017, HSBC complied with the applicable provisions of the UK Corporate Governance Code, and also the requirements of the Hong Kong Corporate Governance Code.
Under the Hong Kong Code the audit committee should be responsible for the oversight of all risk management and internal control systems. HSBC’s Group Risk Committee is responsible for oversight of internal control, other than internal control over financial reporting, and risk management systems. This is permitted under the UK Corporate Governance Code.
The Board has codified obligations for transactions in HSBC Group securities in accordance with the requirements of the Market Abuse Regulation and the rules governing the listing of securities on The Stock Exchange of Hong Kong Limited (‘HKEx’), save that the HKEx has granted waivers from strict compliance with the rules that take into account accepted practices in the UK, particularly in respect of employee share plans. HSBC is in discussion with the HKEx to update these waivers. Following specific enquiry, all Directors have confirmed that they have complied with their obligations in respect of transacting in Group securities during the year.

On behalf of the Board
Mark E Tucker
Group Chairman
HSBC Holdings plc
Registered number 617987
20 February 2018
|
HSBC Holdings plc
|
185
|
Directors’ Remuneration Report
|
Directors’ Remuneration Report
|
|
|
Page
|
|
|
Annual Statement from the Group Remuneration Committee Chair
|
186
|
|
Directors’ remuneration policy
|
188
|
|
Annual report on remuneration
|
189
|
|
Additional remuneration disclosures
|
201
|
|
Pillar 3 remuneration disclosures
|
203
|
All disclosures in the Directors’ Remuneration Report are unaudited unless otherwise stated.
Disclosures marked as audited should be considered audited in the context of financial statements taken as a whole.
|
Annual Statement from the Group
Remuneration Committee Chair
|
I am delighted to present our 2017 Directors’ Remuneration Report. I have been a member of the Committee since 1 January 2016 and took over the role of Chair from 28 April 2017.
2017 was the second year under our current remuneration policy, and I was pleased to note that at the last Annual General Meeting (‘AGM’) we received strong support for how the policy was implemented, with over 96% of shareholders voting in favour of the 2016 remuneration report.
I have set out below a summary of our 2017 performance, key decisions made during the year and the areas of focus envisaged for 2018.
Performance achieved during 2017
During 2017, the Group made good financial and strategic progress. The Group 2017 reported profit before tax was $17.2bn, up 141% from $7.1bn in 2016. On an adjusted basis, profit before tax was $21.0bn, up 11% from $18.9bn in 2016.
2017 was the final year to implement the Group's planned strategic actions and to achieve the targets we had set out to our investors in 2015. The scorecards of our executive Directors incorporated measures that were aligned to the delivery of these strategic actions.
We exceeded our risk-weighted assets (‘RWA’) reduction target, extracting a total of $338bn of RWA's from the business since the start of 2015, in excess of the $290bn target we had set out in our strategic actions. We achieved annualised run-rate savings of $6.1bn and delivered positive adjusted jaws for 2017.
We missed our targets for NAFTA profitability and RMB internationalisation although we made good progress on actions to deploy capital and deliver revenue growth. The set-up of the UK ring-fenced bank is nearly complete, with 91% of head office roles resourced, and we expect to have a fully functioning team by the end of the first quarter of 2018. Details of performance against each of the strategic actions is set out on page
13
of the Strategic Report.
In December we launched HSBC Qianhai Securities, the first securities joint venture in mainland China to be majority-owned by an international bank. We will be offering a range of services to our customers, including equity research and brokerage, equity and debt underwriting and cross-border M&A advisory, and emphasising our commitment in pivoting our business to Asia.
The Group announced a dividend of $0.51 per ordinary share and in 2017, we returned a total of $3bn to shareholders through share buy-backs. A total shareholder return of 24% was achieved in 2017, which outperformed the FTSE 100 index over the year. We remain a well-funded business with a strong capital generation and a diversified balance sheet. We received the ‘World’s Best Bank’ award at the
Euromoney
Awards for Excellence 2017 in July, showcasing our devotion to customers and our strong market position.
Over the past five years, we significantly strengthened our ability to combat financial crime through our Global Standards programme and the five-year deferred prosecution agreement ('AML DPA') with, among others, the US Department of Justice ('DoJ'), has expired.
In January 2018, HSBC Holdings entered into a three-year deferred prosecution agreement with the DoJ (‘FX DPA’), regarding fraudulent conduct in connection with two particular transactions in 2010 and 2011. This concluded the DoJ’s investigation into HSBC’s historical foreign exchange activities. Under the terms of the FX DPA, HSBC has a number of ongoing obligations, including continuing to cooperate with authorities and implementing enhancements to its internal controls and procedures in its Global Markets business which will be the subject of annual reports to the DoJ. In addition, HSBC agreed to pay a financial penalty and restitution.
This agreement acts as a reminder of the necessity of pursuing the highest standards of conduct in our business.
Group variable pay pool and risk adjustments
The Committee’s decision on the Group variable pay pool took into consideration our performance against metrics set out in the Group risk appetite statement and an assessment against our global conduct outcomes for our global businesses. The Committee also took into consideration the Group’s financial performance, and fines, penalties and customer redress costs.
The total variable pay pool for 2017 was
$3,303
m, representing a
8.8%
increase on the 2016 variable pay pool.
In setting the pool, the Committee used its discretion to apply the following reductions:
|
•
|
$84
m for the fines, penalties and cost of customer redress faced by the Group; and
|
|
•
|
$383
m for:
|
|
–
|
financial performance based on certain metrics, in particular, return on equity;
|
|
–
|
performance against certain metrics in our Group risk appetite profile; and
|
|
–
|
continued work required to address financial crime compliance issues.
|
The Committee also strongly believes that individual performance should be judged not only on what is achieved over the period but more importantly on how it is achieved, as we believe the latter contributes to the long-term sustainability of the business. To further reinforce this in our culture, we continue our workstream on incentivising compliance through:
|
•
|
the use of behaviour and performance ratings for all employees, which directly influence pay outcomes;
|
|
•
|
variable pay adjustments:
|
|
–
|
positive adjustments to variable pay outcomes for individuals who have exhibited positive behaviour and consistent adherence to the HSBC Values and go the extra mile to courageously do the right thing. During 2017, we made positive adjustments totalling
$14.9
m of variable pay awards; and
|
|
–
|
we reduced variable pay awards to certain individuals by
$2.9
m in ag
gregate to reflect individual conduct and behaviours; and
|
|
•
|
the global recognition programme where our employees can recognise peers and reward positive behaviours in a real-time, visible way.
|
Fixed pay for executive Directors
No fixed pay increases were made in 2017 for executive Directors and no increase in fixed pay is proposed for executive Directors for 2018. Across the UK employee population the average base salary increase in 2017 was
5%
.
|
186
|
HSBC Holdings plc
|
Executive Directors’ 2017 variable pay awards
The 2017 annual incentive scorecard outcome was
80.0%
for Stuart Gulliver,
89.5%
for Iain Mackay and
91.2%
for Marc Moses, reflecting the performance achieved against their individual scorecards. Details of the annual incentive scorecard outcome are provided on page
191
.
Iain Mackay and Marc Moses will be awarded a long-term incentive award (‘LTI’) in respect of 2017 performance. In granting these awards, the Committee took into consideration the performance achieved for the financial year ended 31 December 2017 and the achievements against the strategic actions announced in June 2015. These awards will also be subject to a three-year forward-looking performance period ending on
31 December 2020. Details of the performance measures are set out on page 196 . At the end of the three-year performance period, subject to the outcome of the performance conditions, awards will vest in five equal annual instalments commencing from the third anniversary of the award date. This gives a total deferral period of seven years and links a significant portion of our executive Directors’ pay to the achievement of long-term objectives, and the long-term interests of shareholders and other stakeholders.
31 December 2020. Details of the performance measures are set out on page 196 . At the end of the three-year performance period, subject to the outcome of the performance conditions, awards will vest in five equal annual instalments commencing from the third anniversary of the award date. This gives a total deferral period of seven years and links a significant portion of our executive Directors’ pay to the achievement of long-term objectives, and the long-term interests of shareholders and other stakeholders.
Following Stuart Gulliver’s announcement of his retirement, the Committee considered that it would not be appropriate for him to receive a LTI award for 2017. To meet regulatory deferral requirements for 2017, 60% of his 2017 annual incentive award will be deferred over a period of seven years, vesting in five equal annual tranches commencing from the third anniversary of the grant date.
In accordance with regulatory requirements, the post-vesting retention period for all shares awarded to executive Directors has been increased from six months to one year.
Director changes and implementation of policy
for 2018
for 2018
Mark Tucker joined the Board on 1 September 2017 as a non-executive Director and Group Chairman designate, and succeeded Douglas Flint as Group Chairman with effect from 1 October 2017. He will receive a fee of £1,500,000 per annum in respect of his chairmanship and was paid a one-time relocation benefit of £300,000.
In line with our remuneration policy, Douglas Flint was paid his salary and pension allowance and received contractual benefits in respect of his contractual notice period. Full details are provided on page
196
.
Stuart Gulliver will step down as executive Director and Group Chief Executive on 20 February 2018 and John Flint will succeed Stuart Gulliver as Group Chief Executive from 21 February 2018. Stuart Gulliver will remain as an employee until 11 October 2018, working on key strategic projects and supporting the smooth transition of the Group Chief Executive role to John Flint. Up until retirement, Stuart Gulliver will continue to receive his current
fixed pay and benefits. In accordance with the terms of our remuneration policy, the Committee has agreed that Stuart Gulliver will remain eligible to be considered for an annual incentive award for the period up to 11 October 2018, based on his contribution during 2018. Further details on Stuart Gulliver’s annual incentive opportunity and performance measures for 2018 can be found on page 201 .
fixed pay and benefits. In accordance with the terms of our remuneration policy, the Committee has agreed that Stuart Gulliver will remain eligible to be considered for an annual incentive award for the period up to 11 October 2018, based on his contribution during 2018. Further details on Stuart Gulliver’s annual incentive opportunity and performance measures for 2018 can be found on page 201 .
John Flint’s salary as Group Chief Executive is set at £1,200,000 and will be reviewed on an annual basis. He will also receive a fixed pay allowance of £1,700,000 per annum and a cash in lieu of pension at 30% of salary, consistent with the approved policy. His maximum annual incentive and LTI opportunity will be set at 215% and 320% of salary, respectively, as per our approved policy.
Employee remuneration policy
Our wider employee remuneration policy is driven by the Group reward strategy, which has evolved over time to reflect changes in our operating environment, including ongoing regulatory and governance changes. The Committee reviewed and agreed updates to the Group reward strategy during 2017 to ensure that it continues to support HSBC’s overall employment proposition to attract, retain and motivate the best people, who are aligned to HSBC’s values and committed to maintaining a long-term career within the Group.
Our 2017 employee survey feedback indicated that employees needed more support in understanding the objectives of the different components of total compensation. To address this, the Committee reviewed and supported management’s proposals to streamline the parameters and principles which managers are asked to consider and apply when making fixed and variable pay recommendations, with a view to ensuring employees have more visibility and clarity on the factors that influence their total remuneration. Details of the Group's remuneration policy for all employees are set out on page
203
.
Gender pay
Gender pay is an area of focus in the UK with the introduction of the Gender Pay Gap Reporting regulations. We will be complying with those regulations and reporting accordingly.
Our global pay strategy is designed to attract and motivate the very best people regardless of any factor unrelated to their performance or experience.
Pay recommendations consider internal and external market comparisons and reflect the employee’s performance during the year. Recommendations are reviewed during a robust annual process, involving business and function heads, senior management and Human Resources.
Review of our policy
The Group's remuneration policy is due to expire at the 2019 AGM. During the course of this year, we will be reviewing our current approach to Directors' remuneration and will consult with our large shareholders and proxy advisory bodies with the aim of introducing a policy in 2019.
Our annual report on remuneration
The next section provides an overview of our remuneration policy for executive Directors, which was approved by shareholders at the 2016 AGM. In the annual report section, we provide details of remuneration decisions made for executive Directors in 2017. In the additional remuneration disclosure section of this report, we provide additional remuneration-related disclosures, including an overview of the policy that applies to our employees.
As Chair of the Committee, I hope you will support the report.
Pauline van der Meer Mohr
Chair
Group Remuneration Committee
20 February 2018
|
HSBC Holdings plc
|
187
|
Directors’ Remuneration Report
|
Directors’ remuneration policy
|
years until the AGM in 2019. The full remuneration policy can be found on pages 288 to 299 of our
Annual Report and Accounts 2015
and in the
Directors‘ Remuneration Policy Supplement
, which is available under group results and reporting in the Investor Relations section of www.hsbc.com.
|
Remuneration policy summary – executive Directors
|
||
|
Elements
|
Operation
|
Implementation in 2018
1
|
|
Base salary
To attract and retain key talent by being market competitive and rewarding ongoing contribution to role.
|
•
Paid in cash on a monthly basis.
•
Base salary increases will not exceed 15% in total during the three-year term of the policy.
|
No change from 2017.
•
Stuart Gulliver: £1,250,000
•
John Flint: £1,200,000
•
Iain Mackay: £700,000
•
Marc Moses: £700,000
|
|
Fixed pay allowance
To deliver fixed pay required to reflect the role, skills and experience of the Directors and to maintain a competitive total remuneration package for retention of key talent.
|
•
Non-pensionable and paid in shares.
•
Released annually on a pro-rata basis over five years, starting from March following the end of the financial year in which the shares were granted.
•
Dividends paid on the vested shares held during the retention period.
|
No change from 2017.
•
Stuart Gulliver: £1,700,000
•
John Flint: £1,700,000
•
Iain Mackay: £950,000
•
Marc Moses: £950,000
|
|
Pension
To attract and retain key talent by being market competitive.
|
•
Directors receive cash in lieu of a pension equal to 30% of base salary.
|
No change from 2017.
|
|
Benefits
To provide benefits in accordance with local market practice.
|
•
Include, for example, medical insurance, income protection insurance, health assessment, life assurance, club membership, tax return assistance, car benefit and travel assistance, including any tax due on the benefit.
•
Additional benefits may also be provided where an executive Director is relocated or spends a substantial proportion of their time in more than one jurisdiction for business purposes.
|
No change from 2017.
|
|
Annual incentive
To drive and reward performance against annual financial and non-financial objectives which are consistent with the strategy and align to shareholder interests.
|
•
Maximum opportunity for annual incentive award is 215% of base salary.
•
Performance is measured against an annual scorecard, which varies by individual.
•
On vesting, shares are subject to a retention period of at least six months.
•
Number of shares to be awarded can be determined taking into consideration a share price discounted for expected dividend yield.
|
•
See page 201 for details of performance measures.
•
Shares issued are subject to a retention period of one year after vesting in accordance with new regulatory requirements.
|
|
Long-term incentive (‘LTI’)
To incentivise sustainable long-term alignment with shareholder interests.
|
•
Maximum opportunity for LTI award is 320% of base salary.
•
Award is subject to a three-year forward-looking performance period.
•
Performance is measured against a long-term scorecard. 60% is based on financial outcomes and 40% is based on non-financial outcomes, including risk and strategy-related measures.
•
Awards vest in five equal instalments with the first vesting on or around the third anniversary of the grant date, and the last vesting on or around the seventh anniversary of the grant date.
•
On vesting, shares are subject to a retention period of at least six months.
•
Awards are discretionary and subject to malus during the vesting period and clawback for a period of seven to 10 years from the date of award.
•
Number of shares to be awarded can be determined taking into consideration a share price discounted for expected dividend yield.
|
•
Details of the performance measures and targets for awards to be made in 2018 (in respect of 2017) are set out on page 196.
•
For awards to be made in respect of 2018, the measures and targets will be determined at the end of 2018 for the performance period commencing on
1 January 2019.
•
On vesting, awards are subject to a retention period of one year in accordance with new regulatory requirements.
•
Awards are not entitled to dividend equivalents during the performance and deferral period in accordance with new regulatory requirements.
|
|
Shareholding guideline
To ensure appropriate alignment with the interest of our shareholders.
|
The shareholding guidelines as a percentage of base salary are:
•
Group Chief Executive: 400%
•
Group Finance Director and Group Chief Risk Officer: 300%
|
No change from 2017.
|
|
1
|
John Flint will succeed Stuart Gulliver as executive Director and Group Chief Executive with effect from 21 February 2018. Stuart Gulliver will step down as executive Director and Group Chief Executive on 20 February 2018.
|
Executive Directors are also entitled to participate in all employee share plans, such as HSBC Sharesave, on the same basis as all other employees. The policy on payment for loss of office is detailed online in the Directors’ Remuneration Policy Supplement.
|
188
|
HSBC Holdings plc
|
Remuneration policy summary – non-executive Directors
Non-executive Directors are not employees and receive a fee for their services, as follows:
|
•
|
base fee; and
|
|
•
|
further fees for the role of Senior Independent Director (‘SID’) and additional Board duties such as chairmanship or membership of a committee.
|
Expenses incurred in performing their roles and any related tax due are also reimbursed.
All non-executive Directors have a shareholding guideline of 15,000 shares, which has to be achieved by 2019 or within five years of their appointment if later.
A travel allowance of £4,000 is provided to non-UK based non-executive Directors to reflect the additional time commitment required for travel.
|
2018 fees
|
||
|
£
|
||
|
Category
|
||
|
Non-executive Group Chairman
1
|
1,500,000
|
|
|
Base fee
|
110,000
|
|
|
SID
|
54,000
|
|
|
Audit, Risk, Remuneration, Financial System Vulnerabilities and Conduct & Values Committees
|
Chairman
|
60,000
|
|
Member
|
30,000
|
|
|
Nomination Committee
|
Chairman
|
40,000
|
|
Member
|
25,000
|
|
|
Philanthropic & Community Investment Oversight Committee
|
Chairman
|
25,000
|
|
Member
|
15,000
|
|
|
1
|
Group Chairman does not receive a base fee or any other fees in respect of chairmanship of any other committee. The Committee has exercised its discretion to provide Mark Tucker with life assurance and healthcare insurance with effect from 1 February 2018, taking into consideration that he is performing the role with a time commitment of not less than four days per week, and holds no other offices outside of HSBC Holdings plc.
|
Service contracts
Executive Directors
|
Douglas Flint
1
|
John
Flint
|
Stuart Gulliver
|
Iain
Mackay
|
Marc Moses
|
|
|
Contract date (rolling)
|
14 Feb 2011
|
21 Feb 2018
|
10 Feb 2011
|
4 Feb
2011
|
27 Nov 2014
|
|
Notice period
(Director & HSBC)
|
12 months
|
12 months
|
12 months
|
12 months
|
12 months
|
|
1
|
Douglas Flint stepped down from the Board on 30 September 2017.
|
Letters setting out the terms of appointment of each executive Director are available for inspection at HSBC Holdings’ registered office. Consistent with the best interests of the Group, the
Committee will seek to minimise termination payments. Directors may be eligible for a payment in relation to statutory rights.
The Directors’ biographies are set out on pages
167
to
170
, and include those directorships provided for under Capital Requirement Directive IV (‘CRD IV’).
Non-executive Directors
Non-executive Directors are appointed for fixed terms not exceeding three years, which may be renewed subject to their re-election by shareholders at AGMs. Non-executive Directors do not have service contracts, but are bound by letters of appointment issued for and on behalf of HSBC Holdings. There are no obligations in the non-executive Directors' letters of appointment that could give rise to remuneration payments or payments for loss of office.
Non-executive Directors’ current terms of appointment will expire as follows:
|
2018 AGM
|
2019 AGM
|
2020 AGM
|
2021 AGM
|
|
Phillip Ameen
|
Henri de Castries
|
Kathleen Casey
|
Mark Tucker
|
|
Joachim Faber
|
Irene Lee
|
Laura Cha
|
|
|
John Lipsky
|
Pauline van der Meer Mohr
|
David Nish
|
|
|
Heidi Miller
|
Jonathan Symonds
|
||
|
Jackson Tai
|
|||
|
Lord Evans of Weardale
|
|||
|
Annual report on remuneration
|
Remuneration Committee
Details of the roles, responsibilities and membership of the Committee are set out on page
177
. During 2017, members of
the Committee included Pauline van der Meer Mohr (Chair from
28 April 2017), Henri de Castries (appointed on 26 May 2017), John Lipsky, David Nish (appointed on 26 May 2017), Sam Laidlaw (Chairman and member until 28 April 2017) and Paul Walsh (until 21 April 2017).
28 April 2017), Henri de Castries (appointed on 26 May 2017), John Lipsky, David Nish (appointed on 26 May 2017), Sam Laidlaw (Chairman and member until 28 April 2017) and Paul Walsh (until 21 April 2017).
Activities
The Committee met seven times during 2017. The following is a summary of the Committee’s key activities during 2017. A copy of the Committee’s terms of reference can be found on our website at www.hsbc.com/about-hsbc/corporate-governance/board-committees.
|
HSBC Holdings plc
|
189
|
Directors’ Remuneration Report
|
Details of the Committee’s key activities
|
|
|
Executive Directors
|
All employees
|
|
•
Approved Directors' Remuneration Report and Strategic Report.
•
Considered executive Director remuneration policy matters for shareholder consultation.
•
Consulted with key shareholders and proxy advisory bodies on executive Director remuneration matters.
•
Reviewed and approved executive Director remuneration matters.
•
Reviewed and approved executive Directors’ scorecards and pay proposals.
|
•
Approved 2016/2017 performance year pay review matters and high-priority programmes progress.
•
Reviewed remuneration policy effectiveness.
•
Considered progress update on Monitor recommendations.
•
Received updates on notable events and regulatory and corporate governance matters.
•
Reviewed and approved 2017 Material Risk Taker ('MRT') identification approach and MRT list.
•
Approved 2017 regulatory submissions.
|
Advisers
The Committee received input and advice from different advisers on specific topics during 2017. Deloitte LLP (‘Deloitte’) was appointed by the Committee in 2015 as an objective, independent adviser to support the Committee on specific remuneration matters for executive Directors. The Committee made the appointment in 2015 after considering invited proposals from a number of consultancy firms. In 2017, the Committee agreed to extend Deloitte’s appointment for a further period of one year. Deloitte provided benchmarking data on remuneration policy matters and independent advice to the Committee. The Committee may request ad-hoc assistance from Deloitte.
Deloitte also provided tax compliance and other advisory services to the Group. To ensure the advice from Deloitte was objective, the Committee required the advice to be independent and distinct from any internal review and analysis on remuneration policy matters. The Committee was satisfied the advice provided by Deloitte was objective and independent in 2017. Deloitte is a founding member of the Remuneration Consultants Group, and voluntarily operates under the Code of Conduct in relation to executive remuneration consulting in the UK.
For 2017, total fees of £109,350 were incurred in relation to remuneration advice provided by Deloitte. This was based on pre-agreed fees and a time-and-materials basis.
During the year, the Group Chief Executive provided regular briefings to the Committee. No executive Directors are involved in deciding their own remuneration. In addition, the Committee engaged with and received updates from the following employees:
|
•
|
Iain Mackay, Group Finance Director;
|
|
•
|
Marc Moses, Group Chief Risk Officer;
|
|
•
|
Stuart Levey, Chief Legal Officer;
|
|
•
|
John Flint, Chief Executive, Retail Banking and Wealth Management;
|
|
•
|
Elaine Arden, Group Head of Human Resources (from June 2017);
|
|
•
|
Donna Wong, Acting Group Head of Human Resources (until May 2017);
|
|
•
|
Alexander Lowen, Group Head of Performance and Reward;
|
|
•
|
Colin Bell, Group Head of Financial Crime Risk;
|
|
•
|
Ralph Nash, Global Head of Financial Crime Compliance and Group Money Laundering Reporting Officer;
|
|
•
|
Andy Maguire, Group Chief Operating Officer; and
|
|
•
|
Ben Mathews, Group Company Secretary.
|
The Committee also received feedback and input from the Group Risk Committee, the Financial System Vulnerabilities Committee and the Conduct & Values Committee on risk, conduct and compliance-related matters relevant to remuneration. This included input from the Financial System Vulnerabilities Committee in relation to progress on enhancing the anti-money laundering (‘AML’) and sanctions compliance programmes, for the purposes of the Committee’s determination on any adjustments to be made under the downward override policy.
Single figure of remuneration
(Audited)
The following table shows the single figure total remuneration of each executive Director for 2017, together with comparative figures
for 2016.
for 2016.
|
Single figure of remuneration
|
|||||||||||||||||||||
|
Base
salary |
|
Fixed pay allowance
|
|
Cash in lieu of pension
|
|
Annual incentive
|
|
LTI
1
|
|
Sub-total
|
|
Taxable benefits
|
|
Non-taxable benefits
|
|
Notional returns
|
|
Total
|
|
||
|
(£000)
|
|
(£000)
|
|
(£000)
|
|
(£000)
|
|
(£000)
|
|
(£000)
|
|
(£000)
|
|
(£000)
|
|
(£000)
|
|
(£000)
|
|
||
|
Douglas Flint
2
|
2017
|
1,125
|
|
—
|
|
338
|
|
—
|
|
—
|
|
1,463
|
|
83
|
|
64
|
|
—
|
|
1,610
|
|
|
2016
|
1,500
|
|
—
|
|
450
|
|
—
|
|
—
|
|
1,950
|
|
100
|
|
86
|
|
—
|
|
2,136
|
|
|
|
Stuart Gulliver
3
|
2017
|
1,250
|
|
1,700
|
|
375
|
|
2,127
|
|
—
|
|
5,452
|
|
500
|
|
71
|
|
63
|
|
6,086
|
|
|
2016
|
1,250
|
|
1,700
|
|
375
|
|
1,695
|
|
—
|
|
5,020
|
|
557
|
|
71
|
|
27
|
|
5,675
|
|
|
|
Iain Mackay
|
2017
|
700
|
|
950
|
|
210
|
|
1,334
|
|
—
|
|
3,194
|
|
64
|
|
37
|
|
42
|
|
3,337
|
|
|
2016
|
700
|
|
950
|
|
210
|
|
987
|
|
—
|
|
2,847
|
|
52
|
|
37
|
|
17
|
|
2,953
|
|
|
|
Marc Moses
|
2017
|
700
|
|
950
|
|
210
|
|
1,358
|
|
—
|
|
3,218
|
|
16
|
|
38
|
|
42
|
|
3,314
|
|
|
2016
|
700
|
|
950
|
|
210
|
|
1,005
|
|
—
|
|
2,865
|
|
15
|
|
38
|
|
18
|
|
2,936
|
|
|
|
1
|
The first LTI award was made in February 2017, with a performance period ending in 2019. Vesting of the first LTI award will be included in the single figure table for the financial year ending on 31 December 2019.
|
|
2
|
Douglas Flint stepped down from the Board on 30 September 2017 and his remuneration reflects time served as an executive Director. Details on retirement arrangements are provided on page
196
.
|
|
3
|
To meet regulatory deferral requirements for 2017,
60%
of the annual incentive award of Stuart Gulliver has been deferred in shares and will vest in five equal instalments between the third and seventh anniversary of the grant date.
|
|
190
|
HSBC Holdings plc
|
Illustration of release profile
The following chart provides an illustrative release profile for executive Directors.
|
Illustration of release profile
|
||||||||||||||||||||||||||||||||||||||||||||
|
2017
|
2018
|
2019
|
2020
|
2021
|
2022
|
2023
|
2024
|
2025
|
2026
|
u
|
||||||||||||||||||||||||||||||||||
|
Fixed pay allowance
|
•
Released in five equal annual instalments starting from March 2018.
|
|||||||||||||||||||||||||||||||||||||||||||
|
u
|
u
|
u
|
u
|
u
|
||||||||||||||||||||||||||||||||||||||||
|
Annual incentive
|
•
Paid in immediately vested shares subject to a retention period of one year.
•
Subject to clawback provisions for seven years from grant, which may be extended to 10 years in the event of an ongoing internal/regulatory investigation.
1
|
|||||||||||||||||||||||||||||||||||||||||||
|
Perform-ance period
|
||||||||||||||||||||||||||||||||||||||||||||
|
u
|
u
|
u
|
u
|
|||||||||||||||||||||||||||||||||||||||||
|
Malus/Clawback provisions
1
|
||||||||||||||||||||||||||||||||||||||||||||
|
u
|
||||||||||||||||||||||||||||||||||||||||||||
|
Long-term incentive
|
•
Award subject to a three-year forward-looking performance period.
•
Subject to performance outcome, awards will vest in five equal annual instalments starting from the third anniversary of the grant date.
•
On vesting, shares are subject to a retention period of one year.
|
|||||||||||||||||||||||||||||||||||||||||||
|
Performance period
|
Vesting period
|
|||||||||||||||||||||||||||||||||||||||||||
|
u
|
u
|
u
|
u
|
u
|
u
|
u
|
||||||||||||||||||||||||||||||||||||||
|
Retention period
|
u
|
u
|
u
|
u
|
u
|
|||||||||||||||||||||||||||||||||||||||
|
1
|
Applies to both annual incentive and long-term incentive.
|
Notes to the single figure of remuneration
(Audited)
Benefits
In the single figure of remuneration table, ‘benefits’
refers to:
refers to:
|
•
|
all taxable benefits (gross value before payment of tax) including provision of medical insurance, accommodation and
|
car, club membership, including any tax gross-up; and non-taxable benefits including the provision of life assurance and other insurance coverage.
The values of the significant benefits in the single figure table are set out in the following table.
|
(Audited)
|
|||||||||
|
Car benefit
(UK and Hong Kong)
1
|
|
Hong Kong bank-owned
accommodation
2
|
|
Tax expense on car benefit and Hong Kong bank-owned accommodation
|
|
Insurance benefit
(non-taxable)
1
|
|
||
|
(£000)
|
|
(£000)
|
|
(£000)
|
|
(£000)
|
|
||
|
Douglas Flint
|
2017
|
—
|
|
—
|
|
—
|
|
56
|
|
|
2016
|
—
|
|
—
|
|
—
|
|
75
|
|
|
|
Stuart Gulliver
|
2017
|
—
|
|
282
|
|
164
|
|
63
|
|
|
2016
|
64
|
|
263
|
|
211
|
|
63
|
|
|
|
1
|
The car benefit, tax on car benefit and insurance benefits for Iain Mackay and Marc Moses are not included in the above table as they were not significant.
|
|
2
|
Taxable value determined based on the current market rental value of the bank-owned property in Hong Kong, as estimated by an external lease service provider, plus utility costs, rates, the taxable value of furniture and taking into account the business use of the property.
|
Notional returns
In the single figure of remuneration table above, ‘notional returns’ refers to the notional return on deferred cash for awards made prior to 2017.
The deferred cash portion of the annual incentive granted prior to 2017 includes a right to receive notional returns for the period between grant date and vesting date, which is determined by reference to the dividend yield on HSBC shares, calculated annually.
A payment of notional return is made annually in the same proportion as the vesting of the deferred awards on each vesting date. The amount is disclosed on a paid basis in the year in which the payment is made. No deferred cash awards have been made to executive Directors under the current policy that has been operated from the 2016 financial year.
Determining executive Directors’ annual performance
(Audited)
Executive Director’s awards reflected the Committee’s assessment of their performance against the personal and corporate objectives in their scorecards, which were agreed at the start of the year and reflect the Group’s strategic priorities and risk appetite. In accordance with the downward override policy, the Committee also consulted the Financial System Vulnerabilities Committee and took into consideration its feedback in relation to progress on enhancing AML and sanctions compliance, along with progress in meeting the Group’s obligations under the AML DPA and other relevant orders. The Committee also took into consideration the report of the independent Monitor in determining the scorecard outcomes.
In order for any annual incentive award to be made, each executive Director must achieve a required behaviour rating,
which is assessed by reference to the HSBC Values. For 2017,
all executive Directors achieved the required behaviour rating.
which is assessed by reference to the HSBC Values. For 2017,
all executive Directors achieved the required behaviour rating.
|
HSBC Holdings plc
|
191
|
Directors’ Remuneration Report
The performance achieved by executive Directors in the year is shown in the table below.
|
Annual assessment
|
|||||||||
|
Stuart Gulliver
|
Iain Mackay
|
Marc Moses
|
|||||||
|
Weighting (%)
|
Assessment (%)
|
Outcome (%)
|
Weighting (%)
|
Assessment (%)
|
Outcome (%)
|
Weighting (%)
|
Assessment (%)
|
Outcome (%)
|
|
|
Profit before tax
1
|
20.00
|
100.00
|
20.00
|
10.00
|
100.00
|
10.00
|
10.00
|
100.00
|
10.00
|
|
Capital management
|
—
|
—
|
—
|
25.00
|
100.00
|
25.00
|
—
|
—
|
—
|
|
Deliver cost savings
|
20.00
|
25.00
|
5.00
|
10.00
|
25.00
|
2.50
|
—
|
—
|
—
|
|
Reduce Group RWAs
|
10.00
|
100.00
|
10.00
|
10.00
|
100.00
|
10.00
|
15.00
|
100.00
|
15.00
|
|
Strategic growth
|
10.00
|
90.19
|
9.02
|
—
|
—
|
—
|
—
|
—
|
—
|
|
Global Standards including
risk and compliance
|
25.00
|
85.00
|
21.25
|
25.00
|
90.00
|
22.50
|
50.00
|
86.25
|
43.13
|
|
Personal objectives
|
15.00
|
97.92
|
14.69
|
20.00
|
97.70
|
19.54
|
25.00
|
92.18
|
23.04
|
|
Total
|
100.00
|
79.96
|
100.00
|
89.54
|
100.00
|
91.17
|
|||
|
Maximum annual incentive opportunity (£000)
|
£2,660
|
£1,490
|
£1,490
|
||||||
|
Annual incentive (£000)
|
£2,127
|
£1,334
|
£1,358
|
||||||
Financial performance
|
Annual assessment
|
|||||||||||
|
Minimum
(25% payout)
|
|
Maximum
(100% payout)
|
|
Performance
|
|
Assessment
|
|
||||
|
Measure
|
|||||||||||
|
Profit before tax
($bn)
1
|
|
$16.0
|
|
|
$19.0
|
|
|
$21.2
|
|
100.00
|
%
|
|
Deliver cost savings ($bn)
2
|
|
$30.2
|
|
|
$29.6
|
|
|
$30.2
|
|
25.00
|
%
|
|
Reduce Group RWAs ($bn)
|
|
$63.4
|
|
|
$70.5
|
|
|
$70.7
|
|
100.00
|
%
|
|
Strategic growth
3
|
Various
|
|
Various
|
|
Fully met targets for six measures and partly met targets for three measures.
|
|
90.19
|
%
|
|||
|
1
|
Profit before tax, as defined for Group annual bonus pool calculation. This definition excludes business disposal gains and losses, debt valuation adjustments, restructuring and write-off costs included in ‘Costs to Achieve' and variable pay expense. It does, however, take into account fines, penalties and costs of customer redress, which are excluded from the adjusted profit before tax. The adjusted profit before tax as per adjusted results is found on page
2
.
|
|
2
|
Measured by reference to the 2017 exit run-rate for adjusted costs compared with our 2014 cost base.
|
|
3
|
Strategic growth measures include optimising global network, rebuilding NAFTA region profitability, delivering growth above GDP from our international network, pivot to Asia and Renminbi internationalisation.
|
|
192
|
HSBC Holdings plc
|
Non-financial performance
The table below provides an overview of the non-financial performance achieved by each executive Director.
|
Stuart Gulliver
|
|||
|
Performance
|
Assessment
|
|
|
|
Global Standards including risk and compliance
•
Achieve and sustain compliance with global financial crime compliance policies and procedures, and/or have approved dispensations in place.
•
Implementation of the operational risk management framework.
•
Implementation of global conduct programme and maturity level achieved against the required conduct outcomes.
•
Effective risk management with AML, sanctions, anti-bribery and corruption policies and Global Standards.
|
•
The financial crime risk management agenda has continued to be pursued rigorously resulting in key compliance action plan deliverables being met and strong progress made on Global Standards programme. This has been reinforced by a strong tone from the top, active engagement at relevant governance forums and full commitment to the ongoing development of the Financial Crime Risk ('FCR') function. Risk management practices materially strengthened across regions and businesses. However, further improvement is needed before sustainable maturity is achieved.
•
Implemented the operational risk management framework with key milestones met.
•
The conduct programme consistently delivered against the committed plan, including high priority conduct gaps closed and action plans implemented in respect of remaining gaps as well as the production and embedding of conduct management information. Achieved consistent management, oversight and delivery of conduct outcomes across all global businesses and significant global functions, including the effective transition to business as usual activities.
•
The AML DPA expired on 11 December 2017, and at the DoJ's request, the charges deferred by the AML DPA have been dismissed by the US district court that oversaw the agreement.
|
85.0
|
%
|
|
Personal objectives
•
Ensure climate change is reflected across the Group‘s activities.
•
Optimise global network and reduce complexity.
•
Set up UK ring-fenced bank headquartered in Birmingham and move the business to be ready for UK departure from the EU.
•
Delivery of high-priority projects.
•
Improve customer satisfaction and employee diversity.
•
Complete succession and transition planning.
|
•
HSBC scored ‘A-’ (leadership level) in the Climate Disclosure Project 2017 climate change rankings. In 2017, HSBC developed and published its sustainability strategy and announced five commitments to support the transition to a low-carbon economy. These include a commitment to provide $100bn of sustainable finance, demonstrating HSBC’s ambition to be a leading global partner to the public and private sectors in the transition to a low carbon economy.
•
The Group’s geographic coverage has been reduced to 67 countries and territories and previously announced transactions/closures are being progressed.
•
Establishment of the UK ring-fenced bank is on track, with the provisional banking licence approved by the Prudential Regulation Authority (‘PRA’). 91% of Birmingham head office roles resourced, and the majority of technology deployments complete.
•
Implementation plan for a UK departure from the EU is on track.
•
The high-priority programmes, including digital transformation and cybersecurity have been assessed as fully met.
•
Achieved customer recommendation of 82% (target 75%) by retail customers. Good progress has been made in 2017, notably establishing the ‘Moments Of Truth’ survey in key markets.
•
Achieved target (26.3%) for female representation at senior management level.
•
Group succession plan is in place for key management personnel.
•
Stuart Gulliver was awarded ‘Order of the Aztec Eagle’, Mexico‘s highest distinction for foreign citizens and was the first banking executive ever to receive this award.
|
97.9
|
%
|
|
HSBC Holdings plc
|
193
|
Directors’ Remuneration Report
|
Iain Mackay
|
|||
|
Performance
|
Assessment
|
||
|
Capital management
•
Implement consistent capital management framework across the Group for internal and external reporting.
|
•
Capital management framework fully implemented with capital actions enabled and return on tangible equity introduced as the revised capital management measure in internal and external reporting.
|
100.0
|
%
|
|
Global Standards including risk and compliance
•
Effective management of material operational risks.
•
Implementation of the operational risk management framework.
•
Proactively review and challenge the first line of defence to assess the adequacy of risk management activities relating to accounting and tax.
•
Implementation of global conduct programme and maturity level achieved against the required conduct outcomes.
•
Successful delivery of regulatory and internal stress tests in 2017.
|
•
Significant effort undertaken during 2017 to strengthen the self-identification, recording and remediation of audit issues through the implementation, training and awareness of the enhanced control framework. There were a small number of residual risks, all of which are appropriately managed.
•
Largely implemented the operational risk transformation programme and operational risk management framework.
•
Strong progress made towards the implementation of risk steward responsibilities for accounting and tax risk. Oversight of these risks within business areas is being progressed through the controls optimisation project.
•
Completed implementation of the global conduct programme milestones including the production and embedding of conduct management information.
•
Successfully delivered stress test submissions; including Comprehensive Capital Analysis and Review (‘CCAR’), Annual Stress Testing and PRA stress tests. Largely completed delivery of IFRS 9 programme.
|
90.0
|
%
|
|
Personal objectives
•
Enhanced environmental, social and governance (‘ESG’) disclosures.
•
Deliver Global Finance transformation.
•
Set-up UK ring-fenced bank headquartered in Birmingham and move the business to be ready for a UK departure from the EU.
•
Improve employee diversity.
•
Complete succession and transition planning.
|
•
First ESG report published in April 2017. Updated ESG report published in November 2017.
•
Significant cost and headcount saves achieved through the Global Finance transformation together with substantial strengthening of the Global Finance centres. Progress achieved in enhancing efficiency through process re-engineering and technology deployment with improvements in timing and quality of delivery.
•
UK ring-fenced bank financial and regulatory reporting infrastructure on track to support employees and product systems migrations and to start trading as HSBC UK on 1 July 2018, subject to ring-fencing transfer scheme approval by court. 91% of Birmingham head office roles resourced.
•
Finance Steering Committee established for dealing with UK’s departure from the EU and implementation plan is on track.
•
Achieved 26.7% (target = 28.5%) for female representation at senior management in the Finance function.
•
Global people & talent programme established across the Global Finance function, focusing on the identification, development and leverage of talent at all levels to strengthen capability, quality and diversity of leadership succession across the function. Top 100 Programme launched in partnership with Duke Corporate Education.
•
Succession plans in place for key management personnel.
|
97.7
|
%
|
|
194
|
HSBC Holdings plc
|
|
Marc Moses
|
|||
|
Performance
|
Assessment
|
|
|
|
Global Standards including risk and compliance
•
Ensure the Global Risk function enables and supports the FCR function to achieve and sustain compliance with global financial crime compliance policies and procedures.
•
Implementation of the operational risk management framework.
•
Effective management of material operational risks.
•
Proactively review and challenge the first line of defence to assess the adequacy of risk management activities and fulfil risk steward responsibilities.
•
Manage credit and market risk, and oversee liquidity risk within the Board approved risk appetite.
•
Implementation of global conduct programme and maturity level achieved against the required conduct outcomes.
•
Successful delivery of regulatory and internal stress tests in 2017.
|
•
Enabled effective FCR management through the enterprise wide and operational risk management frameworks, provision of risk analytics support to FCR management and the completion of FCR model.
•
Implementation of operational risk management framework and the delivery of risk management system of record on time and within budget. Material operational risks are being actively managed and remediation actions relating to high and very high residual risks are being completed.
•
Completed the delivery of the US risk management measures to enable compliance with regulations; largely completed the delivery of IFRS 9 and Dodd-Frank programmes.
•
Successfully delivered the 2017 Annual Cyclical Scenario: Biennial Exploratory Scenario submissions to the PRA and the CCAR submissions to the Federal Reserve Board.
•
Credit, market and liquidity metrics effectively managed through the Group Risk Management Meeting and within Group risk appetite profile.
•
Successfully completed all 2017 conduct programme milestones including the production and embedding of conduct management information, and enabling compliance with conduct regulations. Maturity levels across conduct outcomes largely met expectations.
|
86.3
|
%
|
|
Personal objectives
•
Develop processes to measure exposure to carbon-intensive and low-carbon-intensive activities.
•
Define opportunities to develop risk management policies and procedures consistent with Group risk appetite to protect the Group from climate change risk, and enable business activities supporting a transition to a low-carbon economy.
•
Pivot to Asia and support growth of customer lending.
•
Deliver Global Risk function transformation.
•
Improve RWA effectiveness and efficiency.
•
Improve employee diversity.
•
Complete succession and transition planning.
|
•
Enabled the embedding of effective client and sustainability risk management; engaged constructively with non-governmental organisations and participated actively in the Global Climate Change Disclosure taskforce. Actively applied revised sustainability policies and frameworks to support the successful launch of Green and Social Bonds, the risk management of our environmentally-sensitive exposures such as incorporating new standards for the palm oil sector to protect high carbon stock forests and peat, and delivery of actions to reduce client sensitivity to risks associated with the transition from a high-carbon to low-carbon economy through the financing of green initiatives.
•
Pivot to Asia with ongoing RBWM expansion and launch of China Cards has driven higher returns and lending growth, particularly in Hong Kong and the Pearl River Delta. Regulatory approval obtained to establish HSBC Qianhai Securities Limited will increase access to China’s markets for domestic and international clients.
•
Effectively managed costs and headcount of the Global Risk function through rigorous monitoring of performance and implementation of transformation activities including process re-engineering, and location optimisation.
•
Strengthened RWA effectiveness and efficiency within CMB and GBM supporting overall reduction in Group RWAs.
•
Delivered Global Risk function people initiatives including succession plans and achieved 27.1% (target = 27.7%) for female representation at senior management in the Risk function.
|
92.2
|
%
|
|
HSBC Holdings plc
|
195
|
Directors’ Remuneration Report
Long-term incentive awards
(Audited)
For the 2017 performance year, the Committee determined to grant Iain Mackay and Marc Moses an LTI award equivalent to
319%
of base salary after taking into consideration performance achieved for the financial year ended 31 December 2017 and the achievements against the strategic actions announced in June 2015. The awards will be subject to a
three
-year performance period starting 1 January 2018. As the awards are not entitled to
dividend equivalents per regulatory requirements, the number of shares to be awarded to executive Directors will be adjusted to reflect the expected dividend yield of the shares over the vesting period. The measures that will be used to assess performance and payout are described below. To the extent performance conditions are satisfied at the end of the
three
-year performance period, the awards will vest in five equal annual instalments commencing from around the third anniversary of the grant date. On vesting, awards are subject to a retention period of
one
year.
|
Performance conditions for LTI awards in respect of 2017
|
||||
|
Measures
|
Minimum
(25% payout)
|
Target
(50% payout)
|
Maximum
(100% payout)
|
Weighting
%
|
|
Average return on equity (with CET1 underpin)
1
|
9.0%
|
10.0%
|
11.0%
|
20
|
|
Cost-efficiency ratio
|
60.0%
|
58.0%
|
55.5%
|
20
|
|
Relative total shareholder return
2
|
At median of the peer group.
|
Straight-line vesting between minimum and maximum.
|
At upper quartile of the peer group.
|
20
|
|
Risk and compliance
•
Achieve and sustain compliance with Global Financial Crime Compliance policies and procedures.
•
Achieve a sustainable adoption of Group operation risk management framework, along with its policies and practices.
•
Achieve and sustain delivery of global conduct outcomes and compliance with conduct of business regulatory obligations.
|
Performance will be assessed by the Committee based on a number of qualitative and quantitative inputs such as feedback from the Financial System Vulnerabilities Committee, Group Financial Crime Risk assessment against Financial Crime Compliance objectives, outcome of assurance and audit reviews, and achievement of the long-term Group objectives and priorities during the performance period.
|
25
|
||
|
Strategy
|
15
|
|||
|
•
Sustainable finance
3
|
$30bn
|
$34bn
|
$37bn
|
|
|
•
Employee confidence
4
|
65%
|
67%
|
70%
|
|
|
•
Customer
(Based on customer recommendation in top five markets by revenue)
|
Improvement in recommendation in three of top five markets for CMB, GBM and RBWM.
|
Improvement in recommendation in four of top five markets for CMB, GBM and RBWM.
|
Improvement in recommendation in all of top five markets for CMB, GBM and RBWM.
|
|
|
Total
|
100
|
|||
|
1
|
Significant items are excluded from the profit attributable to ordinary shareholders of the company for the purpose of computing adjusted return on equity. If the CET1 ratio at the end of performance period is below the CET1 risk tolerance level set in the RAS then, the assessment for this measure will be reduced to nil.
|
|
2
|
The peer group for the 2017 award is: Bank of America, Barclays, BNP Paribas, Citigroup, Credit Suisse Group, DBS Group Holdings, Deutsche Bank, JPMorgan Chase & Co., Lloyds Banking Group, Standard Chartered and UBS Group.
|
|
3
|
To be assessed based on cumulative financing and investment made to develop clean energy, lower-carbon technologies and projects that contribute to the delivery of the Paris Agreement and the UN sustainable development goals.
|
|
4
|
Assessed based on results of the latest employee snapshot survey question ‘I am seeing the positive impact of our strategy’.
|
Payments to past Directors
(Audited)
No
payments were made to or in respect of former Directors in the year in excess of the minimum threshold of
£50,000
set for this purpose.
Total pension entitlements
(Audited)
No
employees who served as executive Directors during the year have a right to amounts under any HSBC final salary pension scheme for their services as executive Directors or are entitled to additional benefits in the event of early retirement. There is no retirement age set for Directors, but the normal retirement age for employees is
65
.
External appointments
Douglas Flint received £31,500 in fees from Chairman Mentors International in the period to 30 September 2017.
During 2017, Stuart Gulliver received SGD10,000 in fees as a member of the Monetary Authority of Singapore International Advisory Panel, which was donated to charity.
Retirement arrangements for Douglas Flint
(Audited)
Douglas Flint retired from the Board on 30 September 2017. In line with the remuneration policy, he is not entitled to be considered for any variable pay awards in respect of 2017. In accordance with his contractual entitlements and the approved policy, he received the following payments and benefits until he ceased to be an employee on 31 December 2017.
|
•
|
Salary and cash in lieu of pension:
£487,500
; and
|
|
•
|
Contractual benefits valued at:
£24,068
.
|
In December 2017, Douglas Flint received a payment of
£377,500
in lieu of his salary and cash in lieu of pension for the period from 1 January 2018 to 11 March 2018 and a payment of
£180,000
in lieu of unused holiday entitlement. He received no compensation payment for ceasing to be an executive Director.
As disclosed in our approved remuneration policy, he is also eligible to receive medical coverage for a period of
seven
years from 1 January 2018.
Scheme interests awarded during 2017
(Audited)
The table below sets out the scheme interests awarded to Directors in 2017, for performance in 2016, as disclosed in the 2016 Directors’ Remuneration Report. No non-executive Directors received scheme interests during the financial year.
|
196
|
HSBC Holdings plc
|
|
Scheme awards in 2017
|
||||||||||
|
(Audited)
|
||||||||||
|
Type of interest awarded
|
Basis on which
award made |
Date of award
|
Face value awarded
1,2
£000
|
Percentage receivable for minimum performance
1,2
|
Number of
shares
awarded
|
Share price
on date
of grant
3
|
|
End of performance period
|
||
|
Stuart Gulliver
|
Deferred shares
|
Long-term incentive 2016
|
27 Feb 2017
|
3,990
|
25
|
613,562
|
|
£6.5030
|
|
31 Dec 2019
|
|
Iain Mackay
|
Deferred shares
|
Long-term incentive 2016
|
27 Feb 2017
|
2,232
|
25
|
343,226
|
|
£6.5030
|
|
31 Dec 2019
|
|
Marc Moses
|
Deferred shares
|
Long-term incentive 2016
|
27 Feb 2017
|
2,232
|
25
|
343,226
|
|
£6.5030
|
|
31 Dec 2019
|
|
1
|
For annual incentive, awards were determined based on performance achieved during the period to 31 December 2016 and were subject to a
six
-month retention period on vesting. These awards are also subject to clawback for a maximum period of
10
years from the date of the award. The overall award level could have been
0%
of the maximum opportunity if minimum performance was not achieved at the end of the performance period.
|
|
2
|
For LTI, awards are subject to a
three
-year forward-looking performance period and awards vest in
five
equal instalments subject to performance achieved. On vesting, awards will be subject to a
six
-month retention period. Awards are subject to malus during the vesting period and clawback for a maximum period of
10
years from the date of the award. Details of performance conditions applicable during the forward-looking performance period are set out below.
|
|
3
|
Share price used is the closing mid-market price on the last working day preceding the date of grant.
|
The above table does not include details of shares issued as part of the fixed pay allowances, as those shares vested immediately and are not subject to any service or performance conditions.
Details of the performance measures and targets for the LTI award in respect of 2016 are detailed below.
|
Performance conditions for LTI awards in respect of 2016
|
||||
|
Measures
|
Minimum
(25% payout)
|
Target
(50% payout)
|
Maximum
(100% payout)
|
Weighting
%
|
|
Average return on equity
1
|
7.0%
|
8.5%
|
10.0%
|
20
|
|
Cost efficiency (adjusted jaws)
|
Positive
|
1.5%
|
3.0%
|
20
|
|
Relative total shareholder return
2
|
At median of the peer group.
|
Straight-line vesting between minimum and maximum.
|
At upper quartile of the peer group.
|
20
|
|
Global Standards including risk and compliance
•
Status of AML DPA.
|
Not applicable
|
Not applicable
|
Met all commitments to achieve closure of the AML DPA and protect HSBC from further regulatory censure for financial crime compliance failings.
|
25
|
|
•
Achieve and sustain compliance with Global Financial Crime Compliance policies and procedures.
|
Performance will be assessed by the Committee based on a number of qualitative and quantitative inputs such as feedback from the Financial System Vulnerabilities Committee, Group Financial Crime Risk assessment against Financial Crime Compliance objectives, outcome of assurance and audit reviews, and achievement of the long-term Group objectives and priorities during the performance period.
|
|||
|
Strategy
•
International client revenues
(Share of revenues supported by international network)
|
50%
|
51%
|
52%
|
15
|
|
•
Revenue synergies
(Share of revenues supported by universal banking model)
|
22%
|
23%
|
24%
|
|
|
•
Employee
3
(Results of employee survey)
|
65%
|
67%
|
70%
|
|
|
•
Customer
(Based on customer recommendation in home country markets)
|
Rank within top three in at least two of the four RBWM and CMB customer segments in home country markets.
|
Rank within top three in three of the four RBWM and CMB customer segments in home country markets.
|
Rank within top three in all four RBWM and CMB customer segments in home country markets.
|
|
|
Total
|
100
|
|||
|
1
|
Significant items are excluded from the profit attributable to ordinary shareholders of the company for the purpose of computing adjusted return on equity.
|
|
2
|
The peer group for the 2016 award is: Australia and New Zealand Banking Group, Bank of America, Barclays, BNP Paribas, Citigroup, Credit Suisse Group, DBS Group Holdings, Deutsche Bank, JPMorgan Chase & Co., Lloyds Banking Group, Standard Chartered and UBS Group.
|
|
3
|
Assessed based on results of the latest employee snapshot survey question ‘I am seeing the positive impact of our strategy’.
|
|
HSBC Holdings plc
|
197
|
Directors’ Remuneration Report
Directors’ interests in shares
(Audited)
The shareholdings of all persons who were Directors in 2017, including the shareholdings of their connected persons, at 31 December 2017, or date of retirement from the Board, if earlier,
are set out below. The table below shows the comparison of shareholdings to the company shareholding guidelines. There
have been no changes in the shareholdings of the Directors from 31 December 2017 to the date of this report.
have been no changes in the shareholdings of the Directors from 31 December 2017 to the date of this report.
|
Shares
|
||||||||||||
|
(Audited)
|
||||||||||||
|
Shareholding guidelines
2
(% of salary)
|
|
Shareholding at
31 Dec 2017, or date of retirement from the Board, if earlier
3
(% of salary)
|
|
At 31 Dec 2017, or date of retirement from the Board, if earlier
|
||||||||
|
Scheme interests
|
||||||||||||
|
Share
interests
4
(number
of shares)
|
|
Share options
5
|
|
Shares awarded subject to deferral
1
|
||||||||
|
without performance conditions
4, 6
|
|
with
performance
conditions
7
|
|
|||||||||
|
Executive Directors
|
||||||||||||
|
Douglas Flint (retired from the Board on
30 September 2017) |
100
|
%
|
125
|
%
|
252,606
|
|
2,919
|
|
—
|
|
—
|
|
|
Stuart Gulliver
|
400
|
%
|
2,211
|
%
|
3,711,169
|
|
—
|
|
2,293,071
|
|
738,499
|
|
|
Iain Mackay
|
300
|
%
|
470
|
%
|
442,118
|
|
3,469
|
|
1,268,016
|
|
426,997
|
|
|
Marc Moses
|
300
|
%
|
1,284
|
%
|
1,207,068
|
|
—
|
|
1,288,389
|
|
424,927
|
|
|
Group Managing Directors
8
|
250,000 shares
|
|
n/a
|
|
n/a
|
|
n/a
|
|
n/a
|
|
n/a
|
|
|
1
|
The gross number of shares is disclosed. A portion of these shares will be sold at vesting to cover any income tax and social security which falls due at the time of vesting.
|
|
2
|
Unvested share-based incentives are note counted towards compliance with the shareholding guideline.
|
|
3
|
The value of the shareholding is calculated using an average of the daily closing share prices in the three months to 31 December 2017, (
£7.4468
).
|
|
4
|
For variable pay awards (annual incentive and LTI), in line with regulatory requirements, any deferred shares (net of tax) which the Director becomes entitled to are subject to a retention requirement, such that they must be held for a predefined period of time. To provide the executive Directors with appropriate flexibility, the Committee determined that, the requirement to hold these shares could be met either by retaining the shares that vested from the underlying award (net of tax) or by separately retaining a number of shares equivalent to those that vested under the award. The Committee consider that such an arrangement results in the employee holding the same number of shares as per the original intention of the retention period as set out in the remuneration policy approved by shareholders in 2014.
|
|
5
|
All share options are unvested and unexercised.
|
|
6
|
Includes Group Performance Share Plan ('GPSP') awards, which were made following an assessment of performance over the relevant period ending on 31 December before the grant date but are subject to a
five
-year vesting period.
|
|
7
|
Awards granted in March 2013 are subject to service conditions and satisfactory completion of the AML DPA, as determined by the Committee. The AML DPA condition ends on the fifth anniversary of the award date. LTI awards granted in February 2017 are subject to the performance conditions as set out on page
197
.
|
|
8
|
All Group Managing Directors are expected to meet their shareholding guideline by 2019 or within
five
years of the date of their appointment, whichever is later.
|
|
Share options
|
||||||||||
|
(Audited)
|
||||||||||
|
Date of award
|
Exercise price
|
Exercisable
|
At 1 Jan
|
|
Exercised
|
|
At 31 Dec 2017, or date of retirements from the Board, if earlier
|
|
||
|
£
|
from
1
|
until
|
2017
|
|
in year
|
|
||||
|
Douglas Flint
|
23 Sep 2014
|
5.1887
|
1 Jan 2018
|
30 June 2018
|
2,919
|
|
—
|
|
2,919
|
|
|
Iain Mackay
|
23 Sep 2014
|
5.1887
|
1 Nov 2017
|
30 April 2018
|
3,469
|
|
—
|
|
3,469
|
|
|
1
|
May be advanced to an earlier date in certain circumstances, such as retirement.
|
The above awards were made under HSBC UK Sharesave, an all-employee share plan under which eligible employees may be granted options to acquire HSBC Holdings ordinary shares. The exercise price is determined by reference to the average market value of HSBC Holdings ordinary shares on the five business days immediately preceding the invitation date, then applying a discount of
20%
. Employees may make contributions of up to
£500
each month over a period of
three
or
five
years.
The market value per ordinary share at 29 December 2017 was £
7.6650
.
Market value is the mid-market price derived from the London Stock Exchange Daily Official List on the relevant date. Under the Securities and Futures Ordinance of Hong Kong, the options are categorised as unlisted physically settled equity derivatives.
Summary of shareholder return and Group Chief Executive remuneration
The following graph shows the total shareholder return (‘TSR’) performance against the FTSE 100 Total Return Index for the nine-year period that ended on 31 December 2017. The FTSE 100 Total Return Index has been chosen as this is a recognised broad equity market index of which HSBC Holdings is a member. The single figure remuneration for the Group Chief Executive over the past nine years, together with the outcomes of the respective annual incentive and long-term incentive awards, is presented in the following table.
|
198
|
HSBC Holdings plc
|
|
HSBC TSR and FTSE 100 Total Return Index
|

|
2009
|
|
2010
|
|
2011
|
|
2012
|
|
2013
|
|
2014
|
|
2015
|
|
2016
|
|
2017
|
|
|
|
Group Chief
Executive
|
Michael Geoghegan
|
|
Michael Geoghegan
|
|
Stuart Gulliver
|
|
Stuart Gulliver
|
|
Stuart Gulliver
|
|
Stuart Gulliver
|
|
Stuart Gulliver
|
|
Stuart Gulliver
|
|
Stuart Gulliver
|
|
|
Total single figure
£000
|
7,580
|
7,932
|
8,047
|
7,532
|
8,033
|
7,619
|
7,340
|
5,675
|
6,086
|
|||||||||
|
Annual incentive
1
(% of maximum)
|
94
|
%
|
82
|
%
|
58
|
%
|
52
|
%
|
49
|
%
|
54
|
%
|
45
|
%
|
64
|
%
|
80
|
%
|
|
Long-term incentive
2,3
(% of maximum)
|
25
|
%
|
19
|
%
|
50
|
%
|
40
|
%
|
49
|
%
|
44
|
%
|
41
|
%
|
—
|
%
|
—
|
%
|
|
1
|
The 2012 annual incentive figure for Stuart Gulliver used for this table includes 60% of the annual incentive disclosed in the 2012 Directors’ Remuneration Report, which was deferred for five years and subject to service conditions and satisfactory completion of the AML DPA as determined by the Committee. The AML DPA condition ends on the fifth anniversary of the award date.
|
|
2
|
Long-term incentive awards are included in the single figure for the year in which the performance period is deemed to be substantially completed. For GPSP awards this is the end of the financial year preceding the date of grant (GPSP awards shown in 2011 to 2015 therefore relate to awards granted in 2012 to 2016). For performance share awards that were awarded before introduction of GPSP, the value of awards that vested subject to satisfaction of performance conditions attached to those awards are included at the end of the third financial year following the date of grant (for example, performance share awards shown in 2010 relates to awards granted in 2008).
|
|
3
|
The GPSP was replaced by the LTI in 2016 and the value for GPSP is nil for 2016 as no GPSP award was made for 2016. The first LTI award was made in February 2017, with a performance period ending in 2019. For year-on-year comparison purposes, if target performance is achieved over the three-year performance period, LTI payout would be 50% of grant value. In this case, the single figure total remuneration of the Group Chief Executive for year-on-year comparison would be (in £000) £7,670 for 2016. Stuart Gulliver was not eligible for an LTI award in respect of 2017 given his announced retirement.
|
Comparison of Group Chief Executive and all-employee pay
The following charts compare the changes in Group Chief Executive pay to changes in employee pay between 2016 and 2017, and provide a breakdown of total staff pay relative to the amount paid out in dividends.
|
Percentage change in remuneration between 2016 and 2017
|
||||
|
Group Chief Executive
|
|
Employee group
|
|
|
|
Base salary
1
|
—
|
%
|
5
|
%
|
|
Benefits
2, 3
|
(10
|
)%
|
3
|
%
|
|
Annual incentive
4
|
25
|
%
|
12
|
%
|
|
1
|
Employee group consists of local full-time UK employees as representative of employees from different businesses and functions across the Group. Group Chief Executive's total fixed pay has not increased since 1 January 2014.
|
|
2
|
There has been no change in the benefits provided to the Group Chief Executive. The change in the value of the benefit is due to the change in the taxable value of the benefit as reported in the single figure table.
|
|
3
|
For benefits, employee group consists of UK employees which was deemed the most appropriate comparison for the Group Chief Executive given varying local requirements.
|
|
4
|
For annual incentive, employee group consists of all employees globally. The change is based on annual incentive pool as disclosed on page
31
and staff numbers (full-time equivalents at the financial year-end). The percentage change in annual incentive award of the Group Chief Executive is primarily driven by the difference in the 2016 and 2017 scorecard outcome, reflecting performance achieved in those years, and change in policy. Details of the 2017 total single figure of remuneration for the Group Chief Executive are
on page
190
.
|
Relative importance of spend on pay
The chart below shows the change in:
|
•
|
total staff pay between 2016 and 2017; and
|
|
•
|
dividends paid out in respect of 2016 and 2017.
|
In 2017, we returned a total of $3bn to shareholders through share buy-backs.
|
Relative importance of spend on pay
|
|
ì
|
î
|
|
5%
|
4%
|

|
Return to shareholder
|
Employee compensation and benefits
|
||||
|
Dividends
|
|||||
|
Share buy-back
|
|||||
|
HSBC Holdings plc
|
199
|
Directors’ Remuneration Report
Non-executive Directors
(Audited)
The table below shows the total fees of non-executive Directors for 2017, together with comparative figures for 2016.
|
Fees and benefits
|
||||||||||
|
(Audited)
|
Fees
1
|
Benefits
2
|
Total
|
|||||||
|
(£000)
|
Footnotes
|
2017
|
2016
|
|
2017
|
2016
|
|
2017
|
2016
|
|
|
Phillip Ameen
|
3
|
474
|
440
|
|
12
|
38
|
|
486
|
478
|
|
|
Kathleen Casey
|
174
|
155
|
|
16
|
21
|
|
190
|
176
|
|
|
|
Henri de Castries
|
4
|
132
|
79
|
|
5
|
4
|
|
137
|
83
|
|
|
Laura Cha
|
5
|
269
|
247
|
|
22
|
20
|
|
291
|
267
|
|
|
Lord Evans of Weardale
|
215
|
190
|
|
8
|
5
|
|
223
|
195
|
|
|
|
Joachim Faber
|
6
|
162
|
152
|
|
9
|
10
|
|
171
|
162
|
|
|
Sam Laidlaw (Retired on 28 April 2017)
|
70
|
185
|
|
1
|
11
|
|
71
|
196
|
|
|
|
Irene Lee
|
7
|
300
|
268
|
|
8
|
9
|
|
308
|
277
|
|
|
John Lipsky
|
199
|
180
|
|
25
|
21
|
|
224
|
201
|
|
|
|
Rachel Lomax (Retired on 28 April 2017)
|
93
|
254
|
|
1
|
6
|
|
94
|
260
|
|
|
|
Heidi Miller
|
8
|
571
|
536
|
|
18
|
30
|
|
589
|
566
|
|
|
David Nish
|
9
|
158
|
83
|
|
18
|
19
|
|
176
|
102
|
|
|
Jonathan Symonds
|
10
|
639
|
520
|
|
2
|
6
|
|
641
|
526
|
|
|
Jackson Tai
|
11
|
194
|
48
|
|
43
|
4
|
|
237
|
52
|
|
|
Mark Tucker (Appointed on 1 September 2017)
|
12
|
500
|
—
|
|
318
|
—
|
|
818
|
—
|
|
|
Pauline van der Meer Mohr
|
13
|
239
|
172
|
|
16
|
9
|
|
255
|
181
|
|
|
Paul Walsh (Resigned on 21 April 2017)
|
55
|
142
|
|
2
|
5
|
|
57
|
147
|
|
|
|
Total
|
4,444
|
3,651
|
|
524
|
218
|
|
4,968
|
3,869
|
|
|
|
Total ($000)
|
5,720
|
4,926
|
|
674
|
294
|
|
6,395
|
5,220
|
|
|
|
1
|
Fees include a travel allowance of
£4,000
for non-UK based non-executive Directors.
|
|
2
|
Benefits include accommodation and travel-related expenses relating to attendance at Board and other meetings at HSBC Holdings' registered office. Amounts disclosed have been grossed up using a tax rate of
45%
, where relevant. The 2016 amounts have been restated to exclude National Insurance Contributions.
|
|
3
|
Includes fees of
£330,000
in 2017 (
£315,000
in 2016) as a Director, Chairman of the Audit Committee and member of the Risk Committee of HSBC North America Holdings Inc.
|
|
4
|
Appointed as a member of the Group Remuneration Committee on 26 May 2017.
|
|
5
|
Includes fees of
£75,000
in 2017 (
£72,000
in 2016) as a Director, Deputy Chairman and member of the Nomination Committee of The Hongkong and Shanghai Banking Corporation Limited.
|
|
6
|
Includes
£8,000
(inclusive of VAT) in respect of his membership of a verwaltungsrat (advisory body) to HSBC Trinkaus & Burkhardt AG. Stepped down as Chairman of the Group Risk Committee on 28 April 2017 and resigned from the Group Risk Committee on 30 November 2017.
|
|
7
|
Includes fees of
£187,000
in 2017 (
£173,000
in 2016) as a Director, and member of the Audit Committee and the Risk Committee of The Hongkong and Shanghai Banking Corporation Limited and as a Director, member of the Audit Committee and Chairman of the Risk Committee of Hang Seng Bank Limited.
|
|
8
|
Includes fees of
£427,000
in 2017 (
£411,000
in 2016) as Chairman of HSBC North America Holdings Inc.
|
|
9
|
Appointed as a member of the Group Remuneration Committee on 26 May 2017.
|
|
10
|
Appointed as Senior Independent Director on 28 April 2017. Includes fees of
£382,000
in 2017 (
£345,000
in 2016) as non-executive Chairman of HSBC Bank plc.
|
|
11
|
Appointed as Chairman of the Group Risk Committee on 28 April 2017.
|
|
12
|
Received a one time relocation benefit of
£300,000
.
|
|
13
|
Appointed as Chairman of the Conduct & Values Committee and the Group Remuneration Committee on 28 April 2017.
|
Non-executive Directors’ interests in shares
(Audited)
The shareholdings of persons who were non-executive Directors in 2017, including the shareholdings of their connected persons, at
31 December 2017, or date of cessation as a Director, if earlier, are set out below. The table below shows the comparison of shareholdings to the company shareholding guidelines.
31 December 2017, or date of cessation as a Director, if earlier, are set out below. The table below shows the comparison of shareholdings to the company shareholding guidelines.
|
Shares
|
||
|
Shareholding guidelines (number of shares)
|
Share interests
(number of shares)
|
|
|
Phillip Ameen
|
15,000
|
5,000
|
|
Kathleen Casey
|
15,000
|
9,125
|
|
Laura Cha
|
15,000
|
18,200
|
|
Henri de Castries
|
15,000
|
17,116
|
|
Lord Evans of Weardale
|
15,000
|
12,892
|
|
Joachim Faber
|
15,000
|
66,605
|
|
Sam Laidlaw (Retired on 28 April 2017)
|
15,000
|
41,887
|
|
Irene Lee
|
15,000
|
10,588
|
|
John Lipsky
|
15,000
|
16,165
|
|
Rachel Lomax (Retired on 28 April 2017)
|
15,000
|
18,900
|
|
Heidi Miller
|
15,000
|
4,200
|
|
David Nish
|
15,000
|
50,000
|
|
Jonathan Symonds
|
15,000
|
42,821
|
|
Jackson Tai
|
15,000
|
44,825
|
|
Mark Tucker (Appointed on 1 September 2017)
|
15,000
|
276,000
|
|
Pauline van der Meer Mohr
|
15,000
|
15,000
|
|
Paul Walsh (Resigned on 21 April 2017)
|
15,000
|
5,211
|
|
200
|
HSBC Holdings plc
|
Voting results from Annual General Meeting
The table below summarises the voting results at our AGM.
|
Annual General Meeting voting results
|
|||
|
For
1
|
Against
1
|
Withheld
|
|
|
Remuneration Report (2017 AGM)
|
96.47%
|
3.53%
|
–
|
|
8,885,701,458
|
324,969,999
|
30,526,965
|
|
|
Remuneration Policy (2016 AGM)
|
96.05%
|
3.95%
|
–
|
|
8,887,168,002
|
365,908,568
|
35,165,873
|
|
|
1
|
Votes cast.
|
Implementation of remuneration policy in 2018 for executive Directors
Implementation of fixed remuneration is disclosed on page
189
, along with the remuneration policy summary. Further details on performance measures and weightings for the 2018 annual incentive award are provided below.
John Flint's fixed remuneration on taking on the the role of Group Chief Executive is disclosed on page
189
. In line with the other executive Directors, he will be eligible for discretionary variable pay that consists of an
annual incentive award up to a maximum value of 215% of base salary, and a long-term incentive award up to a maximum of 320% of base salary.
Annual incentive scorecards
The weightings and performance measures for the 2018 annual incentive award for Stuart Gulliver, John Flint, Iain Mackay and Marc Moses are disclosed below. The performance targets for the annual incentive are commercially sensitive and it would be detrimental to the Group’s interests to disclose them at the start of the financial year. Subject to commercial sensitivity, we will disclose the targets for a given year in the
Annual Report and Accounts
for that year in the Directors‘ Remuneration Report.
2018 annual incentive scorecards
Executive Directors will be eligible for an annual incentive award of up to 215% of base salary.
|
2018 annual incentive scorecards measures and weightings
|
|||
|
John Flint and Stuart Gulliver
|
Iain Mackay
|
Marc Moses
|
|
|
Measures
|
%
|
%
|
%
|
|
Profit before tax
|
20
|
10
|
15
|
|
Positive JAWS
|
10
|
15
|
–
|
|
Revenue growth
|
10
|
–
|
–
|
|
Capital management
|
10
|
25
|
10
|
|
Strategic priorities
1
|
25
|
25
|
15
|
|
Risk and compliance
2
|
25
|
25
|
60
|
|
Total
|
100
|
100
|
100
|
|
1
|
Measures will include key objectives set out in the strategy to be agreed with the Board.
|
|
2
|
Measures will include objectives relating to financial crime risk, operational risk, conduct and other financial risks.
|
Stuart Gulliver will step down as Group Chief Executive on 20 February 2018, and John Flint will succeed as Group Chief Executive with effect from 21 February 2018. The scorecard outcome as determined in line with the table above will be applied to the maximum annual incentive award opportunity for Stuart Gulliver and John Flint on a pro-rata basis taking into account time spent by them in the Group Chief Executive role.
Stuart Gulliver will also be eligible to be considered for an annual incentive award and the Committee will consider his contribution as he continues to advise HSBC during the period between 21 February 2018 and his retirement date of 11 October 2018.
Long-term incentives
Details of the performance measures and targets for LTI awards to be made in 2018, in respect of 2017, are provided on page
196
.
The performance measures and targets for awards to be made in respect of 2018, granted in 2019, will be provided in the
Annual Report and Accounts 2018
.
Retirement arrangements for Stuart Gulliver
Stuart Gulliver will step down as executive Director and Group Chief Executive on 20 February 2018 and will then cease employment with the Group on 11 October 2018.
Under the terms of his service contract, Stuart Gulliver will continue to receive his current salary of £1,250,000 per annum, his fixed pay allowance of £1,700,000 per annum, his cash in lieu of pension allowance of £375,000 per annum and his contractual benefits until his retirement. He will also be eligible to be considered for a 2018 annual incentive award as set out above. He will not receive a 2017 or 2018 LTI award, for which he otherwise would have been eligible to be considered for
an amount which could have totalled up to
£3,990,000 per year.
Stuart Gulliver will also be granted Good Leaver status, in accordance with the plan rules, in respect of his unvested deferred awards that were awarded in performance years 2012 to 2017. These awards were published in the annual report in those respective years and approved by shareholders at the respective AGMs. These awards will vest on the scheduled vesting dates, subject to the relevant terms (including post-vest retention periods, malus and, where applicable, clawback) and the achievement of any required performance conditions. Vesting of his 2016 performance year LTI award will be pro-rated for the period he is employed by the Group.
As per the shareholder approved remuneration policy, Stuart Gulliver will be entitled to a payment in lieu of any accrued but untaken holiday entitlement at his retirement date of 11 October 2018, and certain post-departure benefits including medical cover for a period of up to seven years. He will receive no compensation or payment for the termination of his service contract.
Implementation of remuneration policy in 2018 for non-executive Directors
The Committee has reviewed the fee levels payable to the non-executive Directors and details can be found on page
188
.
|
Additional remuneration disclosures
|
|
HSBC Holdings plc
|
201
|
Directors’ Remuneration Report
Payments on loss of office
The table below sets out the basis on which payments on loss of office may be made. Other than as set out in the table, there are
no further obligations which could give rise to remuneration payments or payments for loss of office.
|
Component of remuneration
|
Approach taken
|
|
Fixed pay and benefits
|
Executive Directors may be entitled to payments in lieu of:
•
notice, which shall consist of base salary, pension entitlements and other contractual benefits, or an amount in lieu of; and/or
•
accrued but untaken holiday entitlement.
|
|
Annual incentives and
long-term incentives
|
In exceptional circumstances as determined by the Committee, an executive Director may be eligible for annual incentives and long-term incentives based on the time worked in the performance year and on the individual executive Director’s contribution.
|
|
Unvested deferred awards
|
All unvested awards will be forfeited when an executive Director ceases employment voluntarily and is not deemed a good leaver. An executive Director may be considered a good leaver at the discretion of the Committee, and the following will apply:
•
unvested awards will continue to vest in line with the applicable vesting dates, subject to the original performance conditions, the share plan rules, malus and clawback provisions; or
•
vested shares, subject to retention, will be released to the executive Director on cessation of employment. In the event of death, unvested awards will vest and will be released to the executive Director’s estate as soon as practicable.
In respect of outstanding unvested awards, for an individual to be considered as a good leaver, the Committee needs to be satisfied that the executive has no current or future intention at the date of leaving HSBC of being employed by any competitor financial services firm. The Committee determines the list of competitor firms and length of time this restriction applies. If the Committee becomes aware of any evidence to the contrary before vesting, the award will lapse.
If the executive Director is not deemed a good leaver for purposes of the GPSP, vested shares, subject to retention, will be released to the executive Director in three equal tranches on each of the first, second and third anniversary of cessation of employment.
|
|
Repatriation
|
Where an executive Director has been relocated as part of their employment, the Committee retains the discretion to pay the repatriation costs. These may include, but are not restricted to airfare, accommodation, shipment, storage, utilities, and any tax and social security that may be due in respect of such benefits.
|
|
Post-departure benefits
|
Applicable for the duration of the clawback period, up to a maximum of seven years from date of departure for those who depart under good leaver provisions under the HSBC Share Plan and subject to non-compete provisions, in accordance with the terms of the policy. Benefits may include medical coverage, tax return preparation assistance and legal expenses for the duration of the clawback period.
The Committee also has the discretion to extend the post-departure benefit of medical coverage to former executive Directors up to a maximum of seven years from their date of departure.
|
|
Legal claims
|
The Committee retains the discretion to make payments (including professional and outplacement fees) to mitigate against legal claims, subject to any such payments being made in accordance with the terms of an appropriate agreement waiving all claims against the Group.
|
|
Change of control
|
In the event of a change of control, outstanding awards will be treated in line with the provisions set out in the respective plan rules.
|
Employee compensation and benefits
Executive Directors
Set out below are details of compensation paid to executive Directors for the year ended 31 December 2017.
|
Emoluments
|
||||||||||||||||
|
Douglas Flint
|
Stuart Gulliver
|
Iain Mackay
|
Marc Moses
|
|||||||||||||
|
2017
|
|
2016
|
|
2017
|
|
2016
|
|
2017
|
|
2016
|
|
2017
|
|
2016
|
|
|
|
£000
|
|
£000
|
|
£000
|
|
£000
|
|
£000
|
|
£000
|
|
£000
|
|
£000
|
|
|
|
Basic salaries, allowances and benefits in kind
|
1,610
|
|
2,136
|
|
3,896
|
|
3,953
|
|
1,961
|
|
1,949
|
|
1,914
|
|
1,913
|
|
|
Pension contributions
|
—
|
|
—
|
|
—
|
|
—
|
|
—
|
|
—
|
|
—
|
|
—
|
|
|
Performance-related pay paid or receivable
1
|
—
|
|
—
|
|
2,127
|
|
5,685
|
|
3,566
|
|
3,219
|
|
3,590
|
|
3,237
|
|
|
Inducements to join paid or receivable
|
—
|
|
—
|
|
—
|
|
—
|
|
—
|
|
—
|
|
—
|
|
—
|
|
|
Compensation for loss of office
|
—
|
|
—
|
|
—
|
|
—
|
|
—
|
|
—
|
|
—
|
|
—
|
|
|
Notional return on deferred cash
|
—
|
|
—
|
|
63
|
|
27
|
|
42
|
|
17
|
|
42
|
|
18
|
|
|
Total
|
1,610
|
|
2,136
|
|
6,086
|
|
9,665
|
|
5,569
|
|
5,185
|
|
5,546
|
|
5,168
|
|
|
Total ($000)
|
2,072
|
|
2,882
|
|
7,834
|
|
13,039
|
|
7,168
|
|
6,995
|
|
7,139
|
|
6,972
|
|
|
1
|
Includes the value of the deferred and LTI awards at grant. The information for 2016 has been restated to include the value of LTI.
|
The aggregate amount of Directors' emoluments as defined above (including both executive Directors and non-executive Directors) for the year ended 31 December 2017 was $
30,608,444
. As per our policy, benefits in kind may include, but are not limited to, the provision of medical insurance, income protection insurance, health assessment, life assurance, club membership, tax assistance, Hong Kong accommodation, car benefit, travel assistance, and relocation costs (including any tax due on these benefits, where applicable). Medical insurance benefit of £4,181 ($5,382) was provided to former director, Alexander Flockhart, during the year ended 31 December 2017. Amounts are converted into US dollars based on the average year-to-date exchange rates for the respective year.
Emoluments of senior management and five highest paid employees
The following table sets out the details of emoluments paid to senior management (being here, executive Directors and Group Managing Directors of the Group) for the year ended 31 December 2017, or for the period of appointment in 2017 as a Director or Group Managing Director. Details of the remuneration paid to the five highest paid employees, comprising one executive Director and four Group Managing Directors of the Group, for the year ended 31 December 2017 are also presented.
|
202
|
HSBC Holdings plc
|
|
Emoluments
|
||||
|
Five highest paid employees
|
|
Senior management
|
|
|
|
£000
|
|
£000
|
|
|
|
Basic salaries, allowances and benefits in kind
|
18,729
|
|
41,143
|
|
|
Pension contributions
|
12
|
|
198
|
|
|
Performance-related pay paid or receivable
1
|
15,272
|
|
40,220
|
|
|
Inducements to join paid or receivable
|
2,465
|
|
2,465
|
|
|
Compensation for loss of office
|
—
|
|
—
|
|
|
Total
|
36,478
|
|
84,026
|
|
|
Total ($000)
|
46,955
|
|
108,159
|
|
|
1
|
Includes the value of deferred shares awards at grant.
|
|
Emoluments by bands
|
|||||
|
Hong Kong dollars
|
US dollars
|
Number of
highest paid employees
|
|
Number of
senior management
|
|
|
$16,000,001 – $16,500,000
|
$2,053,177 – $2,117,338
|
—
|
|
2
|
|
|
$24,500,001 – $25,000,000
|
$3,143,927 – $3,208,088
|
—
|
|
1
|
|
|
$25,500,001 – $26,000,000
|
$3,272,250 – $3,336,412
|
—
|
|
1
|
|
|
$33,500,001 – $34,000,000
|
$4,298,839 – $4,363,000
|
—
|
|
1
|
|
|
$34,000,001 – $34,500,000
|
$4,363,000 – $4,427,162
|
—
|
|
2
|
|
|
$36,000,001 – $36,500,000
|
$4,619,647 – $4,683,809
|
—
|
|
1
|
|
|
$43,500,001 – $44,000,000
|
$5,582,074 – $5,646,236
|
—
|
|
1
|
|
|
$47,500,001 – $48,000,000
|
$6,095,368 – $6,159,530
|
—
|
|
1
|
|
|
$52,500,001 – $53,000,000
|
$6,736,986 – $6,801,147
|
—
|
|
1
|
|
|
$55,000,001 – $55,500,000
|
$7,057,795 – $7,121,956
|
—
|
|
2
|
|
|
$60,000,001 – $60,500,000
|
$7,699,412 – $7,763,574
|
1
|
|
1
|
|
|
$61,500,001 – $62,000,000
|
$7,891,898 – $7,956,059
|
1
|
|
1
|
|
|
$64,500,001 – $65,000,000
|
$8,276,868 – $8,341,030
|
1
|
|
1
|
|
|
$65,000,001 – $65,500,000
|
$8,341,030 – $8,405,192
|
1
|
|
1
|
|
|
$89,000,001 – $89,500,000
|
$11,420,795 – $11,484,956
|
1
|
|
1
|
|
|
Pillar 3 remuneration disclosures
|
Remuneration policy overview and governance
Our remuneration strategy is designed to reward competitively the achievement of long-term sustainable performance, and attract and motivate the very best people who are committed to maintaining a long-term career with the Group while performing their role in the long-term interests of our stakeholders. We believe that remuneration is an important tool for instilling the right behaviours, and driving and encouraging actions that are aligned to organisational values and expectations.
Our remuneration strategy as approved by the Committee is based on the following principles:
|
•
|
An alignment to performance at all levels (individual, business and Group) taking into account both ‘what’ has been achieved and ‘how’ it has been achieved. The ‘how’ helps ensure that performance is sustainable in the longer term, consistent with HSBC’s values, conduct and risk and compliance standards.
|
|
•
|
Being informed, but not driven by, market position and practice. Market benchmarks are sourced through independent specialists and provide an indication of the range of pay levels and employee benefits provided by our competitors.
|
|
•
|
Targeting pay for employees across the full market range depending upon their individual performance and that of the Group. An individual’s position in this market range will also vary depending upon their performance in any given year.
|
|
•
|
Compliance with relevant regulation across all of our countries and territories.
|
Based on these principles, our approach to determining remuneration is based on the following objectives:
|
•
|
Offering our employee a competitive total reward package that includes a mix of fixed pay, variable pay and employee benefits.
|
|
•
|
Maintaining an appropriate balance between fixed pay, variable pay and employee benefits, taking into consideration an
|
employee’s seniority, role, individual performance and the market.
Fixed pay levels should be market competitive and allow our employees to meet their basic day-to-day living expenses.
|
•
|
Variable pay is awarded on a discretionary basis and dependent upon Group, business and individual performance.
|
|
•
|
Employee benefits offered should be valued by a diverse workforce, appropriate at the local market level and support HSBC’s commitment to employee well-being.
|
|
•
|
Promoting employee share ownership through variable pay deferral or voluntary enrolment in an all employee share plan.
|
|
•
|
Reward packages should be linked to performance and behaviour with no bias towards an individual’s ethnicity, gender, age, or any other characteristic.
|
The Group remuneration policy for all employees based on the above principles and objectives applies on a group-wide basis, subject to compliance with any applicable local laws and regulation.
Governance and role of relevant stakeholders
The Committee is responsible for setting the principles, parameters and governance framework for the Group‘s remuneration policy applicable to all Group employees. The Committee also oversees the application of the policy to the wider employee population, including employees in subsidiaries and branches, subject to local regulations.
All members of the Committee are independent non-executive Directors of HSBC Holdings plc. Details of the roles, responsibility and membership of the Committee, including other committees and senior management that the Committee engages with, are set out on page
177
. Activities and advisers used by the Committee are detailed on page
189
.
The Committee reviewed the Group's remuneration policy in
2017 and made no material changes to the policy and its implementation for 2017.
2017 and made no material changes to the policy and its implementation for 2017.
|
HSBC Holdings plc
|
203
|
Directors’ Remuneration Report
Link between risk, performance and reward
Our remuneration practices promote sound and effective risk management while supporting our business objectives.
The key features of our remuneration framework that (subject to compliance with local laws and regulations) enable us to achieve alignment between risk, performance and reward are detailed in the following table.
|
Alignment between risk and reward
|
|
|
Framework elements
|
Application
|
|
Variable pay pool and individual performance scorecard
|
The Group variable pay pool is expected to move in line with Group performance. We also use a countercyclical funding methodology, which is categorised by both a floor and a ceiling, and the payout ratio reduces as performance increases to avoid pro-cyclicality. The floor recognises that even in challenging times, remaining competitive is important. The ceiling recognises that at higher levels of performance it is not always necessary to continue to increase the variable pay pool, thereby limiting the risk of inappropriate behaviour to drive financial performance.
The main quantitative and qualitative performance and risk metrics used for assessment of performance include:
•
Group and business unit performance:
an evaluation of overall Group and business unit performance provided by Finance is considered by the Committee when determining the Group variable pay pool and, subsequently, the variable pay pool for each business unit. Where performance in a year is weak, as measured by profits, this will have a direct and proportionate impact on the pool. Judgement is exercised to ensure that the pool is adjusted for appropriate current and future risks taking into consideration performance against the RAS and global conduct outcomes. Fines, penalties and provisions for customer redress are automatically included in the Committee’s definition of profit.
•
Individual performance:
assessment of performance is made with reference to a balanced scorecard of clear and relevant objectives. Risk and compliance objectives are included in the performance scorecard of senior management and a mandatory global risk objective is included in the scorecard of all other employees. All employees receive a behaviour rating as well as a performance rating, which ensures performance is assessed not only on what is achieved but also on how it is achieved. Therefore, variable pay of individuals is expected to reflect Group performance, their individual behaviour rating and performance rating determined against their performance objectives for the year, which are aligned to the Group's strategic actions, risk objectives and adherence to the HSBC Values.
|
|
Remuneration for Control Function staff
|
•
The performance and remuneration of individuals in Control Functions, including risk and compliance employees, is assessed according to a balanced scorecard of objectives specific to the functional role they undertake, to ensure their remuneration is determined independent of the performance of the business areas they control.
•
The Committee is responsible for approving the remuneration recommendations for the Group Chief Risk Officer and senior management in Control Functions.
•
Group policy is for Control Functions staff to report into their respective function and remuneration decisions for senior functional roles are led by, and must carry the approval of, the global function head.
•
The variable pay pool for Control Functions is determined centrally, without influence from the relevant business areas. Furthermore, employees performing a Control Function role have a direct reporting line through the relevant global function rather than through the relevant business areas.
•
Remuneration is carefully benchmarked with the market and internally to ensure that it is set at an appropriate level.
|
|
Variable pay adjustments
|
•
Variable pay awards may be adjusted downwards in circumstances including:
– Detrimental conduct, including conduct which brings HSBC into disrepute.
– Involvement in events resulting in significant operational losses, or events which have caused or have the potential to cause significant harm to HSBC.
– Non-compliance with the HSBC Values and other mandatory requirements or policies.
•
Positive adjustments to variable pay awards can also be made where exceptional behaviours have been demonstrated which go beyond the normal course of an employee’s responsibilities, and those which set an outstanding example of our Values-aligned behaviours and conduct expectations.
•
The override policy was introduced in 2014, based on the recommendations received from the independent Monitor as appointed by the AML DPA. This is applicable for current-year variable pay awards for executive Directors and certain other senior management. In deciding the application and degree of any such downward override to reduce variable pay awards, the Committee considers feedback from the Financial System Vulnerabilities Committee, the Monitor in relation to cooperation with its review and our group legal function.
|
|
Malus
|
Malus can be made to unvested deferred awards granted in prior years. It may be applied in circumstances including:
•
Detrimental conduct, including conduct which brings the business into disrepute.
•
Past performance being materially worse than originally reported.
•
Restatement, correction or amendment of any financial statements.
•
Improper or inadequate risk management.
|
|
Clawback
|
Clawback can be applied to vested or paid awards granted to MRTs on or after 1 January 2015 for a period of seven years. From 2016 onwards, this period may be extended to 10 years for employees under the PRA‘s Senior Manager Regime in the event of ongoing internal/regulatory investigation at the end of the seven-year period. Clawback may be applied in circumstances including:
•
Participation in, or responsibility for, conduct which results in significant losses.
•
Failing to meet appropriate standards and propriety.
•
Reasonable evidence of misconduct or material error that would justify, or would have justified, summary termination of a contract of employment.
•
A material failure of risk management suffered by HSBC or a business unit in the context of Group risk-management standards, policies and procedures.
|
|
Sales incentives
|
•
We do not have commission-based sales plans globally.
|
|
204
|
HSBC Holdings plc
|
Remuneration structure
Total compensation (fixed pay and variable pay) is the key focus of our remuneration framework, with variable pay differentiated by performance and adherence to the HSBC Values. The key features
and design characteristic of our remuneration system that applies on a Group-wide basis, subject to compliance with local laws, is set out below:
|
Overview of remuneration structure for employees
|
|
|
Remuneration components and objectives
|
Application
|
|
Fixed pay
Attract and retain employees by paying market competitive pay for the role, skills and experience required for the business.
|
•
This may include salary, fixed pay allowance, cash in lieu of pension and other cash allowances in accordance with local market practices. They are categorised as fixed pay as all of these elements are based on predetermined criteria, non-discretionary, transparent and are not reduced based on performance.
•
Represent a higher proportion of total compensation for more junior employees.
•
All elements of fixed pay are fixed and may change to reflect an individual’s position, role or grade, cost of living in the country, individual skills, competencies, capabilities and experience, as may be evidenced by sustained strong performance of the individual.
•
Fixed pay is delivered in cash on a monthly basis, except for executive Directors, where the fixed pay allowance is delivered in shares.
|
|
Benefits
Ensure market competitiveness and provide benefits in accordance with local market practice.
|
•
This may include, but not be limited to, the provision of pensions, medical insurance, life insurance, health assessment and relocation allowances.
|
|
Annual incentive
Drive and reward performance based on annual financial and non-financial measures consistent with the medium- to long-term strategy, stakeholder interests and adherence to HSBC values.
|
•
All employees are eligible to be considered for a discretionary variable pay award. Individual awards are determined on the basis of individual performance against their performance objectives for the year, which are aligned to the Group’s strategic actions, a global risk objective and adherence to the HSBC Values and business principles.
•
In addition, there is a process to identify behavioural transgressions for all employees during the year to ensure compliance with Group policies and procedures, and other expected behaviours. Such transgressions are taken into consideration in determining ex-ante adjustments to variable pay.
•
Represent a higher proportion of total compensation for more senior employees and will be more closely aligned to Group and business performance as seniority increases.
•
Variable pay awards for all Group employees identified as MRTs under European Union Regulatory Technical Standard 604/2014 are limited to 200% of fixed pay.
1
•
All awards are subject to malus and awards granted to employees identified as MRTs are subject to clawback (see section on variable pay adjustment, malus and clawback).
•
Awards can be in the form of cash, shares and, where required by regulations, in units linked to asset management funds. A portion of the annual incentive award may be deferred and vests over a period of three years, five years or seven years.
|
|
Deferral
Alignment with the medium- to long-term strategy, stakeholder interests and adherence to the HSBC Values.
|
•
A Group-wide deferral approach is applicable to all employees across the Group. Awards above a specified threshold are subject to deferral based on a deferral table, as approved by the Group Remuneration Committee. The deferred variable pay is delivered over HSBC shares. Vesting of deferred awards will be annually over a three-year period with 33% vesting on the first anniversary of grant, 33% on the second anniversary and 34% on the third anniversary.
•
For MRTs identified in accordance with the PRA and Financial Conduct Authority (‘FCA’) remuneration rules, awards are generally subject to a minimum 40% deferral (60% for awards of £500,000 or more) over a minimum period of three years
2
. A longer deferral period is applied for certain MRTs as follows:
–
Five years for individuals identified in a risk-manager MRT role under the PRA and FCA remuneration rules. This reflects the deferral period prescribed by both the PRA and the European Banking Authority ('EBA') for individuals performing key senior roles with the Group.
–
Seven years for individuals in PRA designated senior management functions, being the deferral period mandated by the PRA as reflecting the typical business cycle period.
•
Individuals identified as MRTs under local regulations and not considered Group MRTs are subject to a three-year deferral period, except in Germany and Malta where individuals reporting into the local management Board and Executive Committee members, respectively, are subject to a five-year deferral. Local MRTs are also subject to a minimum deferral rate aligned to the Group MRT policy, except in China (where a minimum deferral rate of 50% is applied for the CEO in China), Oman (where a minimum deferral rate of 45% is applied) and Germany (where a minimum deferral rate of 60% is applied for local management board members).
•
All deferred awards are subject to malus provisions subject to compliance with local laws. Awards granted to MRTs on or after 1 January 2015 are also subject to clawback.
•
HSBC operates an anti-hedging policy for all employees who are required to certify each year that they have not entered into any personal hedging strategies in respect of HSBC securities.
|
|
Deferral instruments
Alignment with the medium- to long-term strategy, stakeholder interests and adherence to the HSBC Values.
|
•
For all employees, other than MRTs identified in accordance with the PRA and FCA remuneration rules or other similar local rules, the underlying instrument for all deferred awards is HSBC shares to ensure alignment between the long-term interest of our employees and the interest of shareholders.
•
For Group and local MRTs, excluding executive Directors where deferral is typically in the form of shares only, a minimum of 50% of the deferred awards is over HSBC shares and the balance is deferred into cash. In accordance with local regulatory requirements, for local MRTs in Oman 100% of the deferred amount is delivered in shares and for local MRTs in Poland 50% of the deferred awards are delivered in an instrument linked to the value of the local entity and the balance in deferred cash.
•
For some employees in our asset management business, where required by the regulations applicable to asset management entities within the Group, at least 50% of the deferred awards is linked to fund units reflective of funds managed by those entities, with the remaining portion of deferred awards being in the form of deferred cash awards.
|
|
HSBC Holdings plc
|
205
|
Directors’ Remuneration Report
|
Overview of remuneration structure for employees (continued)
|
|
|
Remuneration components and objectives
|
Application
|
|
Post-vesting retention period
To ensure appropriate alignment with shareholders.
|
•
Awards over HSBC shares or linked to relevant fund units granted to MRTs identified in accordance with the PRA and FCA remuneration rules and local MRTs (except those in Brazil, China, Germany, Oman and Russia) are generally subject to a one-year retention period post vesting. For local MRTs in Brazil, Russia and Germany, a six-month retention period is applied. No retention period is applied for local MRTs in China and Oman.
•
MRTs who are subject to a five-year deferral period, except senior management or individuals in PRA and FCA designated senior management functions, have a six-month retention period applied to their awards.
|
|
Long-term incentive awards (‘LTI’)
Alignment with the medium- to long-term strategy, stakeholder interests and adherence to the HSBC Values.
|
•
Only executive Directors are eligible to be considered for an LTI award. See details on page 196.
|
|
Shareholding requirement
Align interests of senior management with shareholders' interests.
|
•
All executive Directors, Group Managing Directors and Group General Managers of HSBC Holdings are subject to this requirement. Details of the minimum shareholding requirement for executive Directors and Group Managing Directors are set out on page 198. Group General Managers have a minimum shareholding requirement of 25,000 shares.
•
The minimum shareholding requirement must be achieved by 2019 or within five years of their appointment, whichever is later.
|
|
Buy-out awards
To support recruitment of talent.
|
•
Awards may be offered if an individual holds any outstanding unvested awards that are forfeited on resignation from the previous employer.
•
The terms of the buy-out awards will not be more generous than the terms attached to the awards forfeited on cessation of employment with the previous employer.
|
|
Guaranteed variable remuneration
To support recruitment of talent.
|
•
Guaranteed variable remuneration is awarded in exceptional circumstances for new hires, and is limited to the individual’s first year of employment only.
•
The exceptional circumstances where HSBC would offer a guaranteed variable remuneration would typically involve a critical new hire and would also depend on factors such as the seniority of the individual, whether the new hire candidate has any competing offers and the timing of the hire during the performance year.
|
|
Severance payments
To adhere to contractual agreements with involuntary leavers.
|
•
Where an individual’s employment is terminated involuntarily for gross misconduct then, subject to compliance with local laws, the Group’s policy is not to make any severance payment in such cases. For such individuals, all outstanding unvested awards are forfeited.
•
For other cases of involuntary termination of employment, any severance that may be determined to be paid to an individual will take into consideration the performance of the individual, contractual notice period, applicable local laws and circumstances of the case.
•
Where an individual’s employment is terminated involuntarily (except where an individual is dismissed for gross misconduct), all outstanding unvested awards will normally continue to vest in line with the applicable vesting dates and, where relevant, any performance conditions attached to the awards and malus and clawback provisions applicable to those awards.
•
Severance amounts awarded to MRTs are considered as fixed pay where such amounts include: (i) payments of fixed remuneration that would have been payable during the notice and/or consultation period; (ii) statutory severance payments; (iii) payments determined in accordance with any approach applicable in the relevant jurisdictions; and (iv) payments made to settle a potential or actual dispute.
|
|
1
|
Shareholders approved the increase in the maximum ratio between the fixed and variable components of total remuneration from 1:1 to 1:2 at the 2014 Annual General Meeting held on 23 May 2014 (98% in favour). The Group has also used the discount rate of 21.85% for individuals with seven-year deferral period and 13.85% for individuals with five-year deferral period. This discount rate was used for six MRTs in UK and one MRT Hong Kong.
|
|
2
|
HSBC does not dis-apply any remuneration rules on proportionality grounds. However, in accordance with the terms of the PRA and FCA remuneration rules, the deferral requirement for MRTs is not applied to individuals where their total compensation is £500,000 or less and variable pay is not more than 33% of total compensation. For these individuals, the Group standard deferral applies.
|
Material Risk Takers
Individuals are identified as MRTs based on the qualitative and quantitative criteria set out in the Regulatory Technical Standard (‘RTS’) EU 604/2014 and additional criteria determined by the Committee. The following key principles underpin HSBC’s identification process:
|
•
|
MRTs are identified at Group and HSBC Bank plc (consolidated) level.
|
|
•
|
MRTs are also identified at material solo regulated entity level in EU countries.
|
|
•
|
HSBC uses the Global Business dimension as the primary basis for identifying MRTs within its matrix management structure.
|
In addition to applying the qualitative and quantitative criteria specified in the RTS, HSBC also identifies additional MRTs based on its own internal criteria, which includes compensation thresholds and individuals in certain roles and grades outside the EU where such individuals are not strictly captured by the criteria prescribed in the RTS.
The list of MRTs, and any exclusions from it, is reviewed by the heads of the relevant global businesses and global functions, Chief Risk Officers, Chief Operating Officers and Heads of Human Resources of the relevant global functions and businesses. The overall results are reviewed by the Group Chief Risk Officer.
The Committee reviews the methodology, key decisions regarding identification, and approves the results of the identification exercise, including proposed MRT exclusions.
Management body and senior management
For the purpose of the Pillar 3 remunerations disclosures executive Directors and non-executive Directors are considered to be members of the management body. Members of the Group Management Board other than the executive Directors are considered as senior management. No guaranteed bonus, sign-on or severance payments were made to this population for the year ended 31 December 2017.
Remuneration disclosures
The tables below set out the remuneration disclosures for individuals identified as MRTs for HSBC Holdings plc. Remuneration information for individuals who are only identified as MRTs at HSBC Bank plc or other solo-regulated entity levels are included in those entities' relevant disclosures.
The 2017 variable pay information included in the tables below is based on the market value of awards granted to MRTs. For share awards, the market value is based on HSBC Holdings plc's share price at the date of grant (unless indicated otherwise). For cash awards, it is the value of awards expected to be paid to the individual over the deferral period.
|
206
|
HSBC Holdings plc
|
|
Remuneration – fixed and variable amounts
|
||||||||
|
Executive Directors
|
|
Non-executive Directors
|
|
Senior management
|
|
Total
|
|
|
|
Number of MRTs
|
4
|
|
17
|
|
15
|
|
36
|
|
|
$m
|
|
$m
|
|
$m
|
|
$m
|
|
|
|
Total fixed
|
11.5
|
|
4.4
|
|
33.1
|
|
49.0
|
|
|
Cash-based
1
|
6.9
|
|
4.4
|
|
33.1
|
|
44.4
|
|
|
– of which: deferred cash
|
—
|
|
—
|
|
—
|
|
—
|
|
|
Share-based
|
4.6
|
|
—
|
|
—
|
|
4.6
|
|
|
– of which: deferred shares
|
—
|
|
—
|
|
—
|
|
—
|
|
|
Total variable
2
|
14.0
|
|
—
|
|
44.1
|
|
58.1
|
|
|
Cash-based
|
—
|
|
—
|
|
20.7
|
|
20.7
|
|
|
– of which: deferred cash
|
—
|
|
—
|
|
12.5
|
|
12.5
|
|
|
Share-based
3
|
14.0
|
|
—
|
|
23.4
|
|
37.4
|
|
|
– of which: deferred shares
3
|
9.5
|
|
—
|
|
15.2
|
|
24.7
|
|
|
Other forms
3
|
—
|
|
—
|
|
—
|
|
—
|
|
|
– of which: deferred
3
|
—
|
|
—
|
|
—
|
|
—
|
|
|
Total remuneration
|
25.5
|
|
4.4
|
|
77.2
|
|
107.1
|
|
|
1
|
Cash-based fixed remuneration is paid immediately.
|
|
2
|
Variable pay awarded in respect of 2017. In accordance with shareholder approval received on 23 May 2014 (98% in favour), for each MRT the variable component of remuneration for any one year is limited to 200% of fixed component of the total remuneration of the MRT.
|
|
3
|
Share-based awards are made in HSBC shares. Vested shares are subject to a retention period of up to one year.
|
|
Deferred remuneration at 31 December
1
|
||||||||
|
Executive
Directors
|
|
Non-executive Directors
|
|
Senior
management
|
|
Total
|
|
|
|
$m
|
||||||||
|
Cash
|
||||||||
|
Total outstanding deferred remuneration
2
|
3.1
|
|
—
|
|
24.8
|
|
27.9
|
|
|
– of which:
|
||||||||
|
Unvested
|
3.1
|
|
—
|
|
24.8
|
|
27.9
|
|
|
Total amount of outstanding deferred and retained remuneration exposed to ex post explicit and/or implicit adjustment
|
3.1
|
|
—
|
|
24.8
|
|
27.9
|
|
|
Total amount of amendment during the year due to ex post implicit adjustment
|
—
|
|
—
|
|
—
|
|
—
|
|
|
Total amount of amendment during the year due to ex post explicit adjustment
3
|
—
|
|
—
|
|
—
|
|
—
|
|
|
Total amount of deferred remuneration paid out in the financial year
|
1.5
|
|
—
|
|
7.2
|
|
8.7
|
|
|
Shares
|
||||||||
|
Total outstanding deferred remuneration
2
|
66.7
|
|
—
|
|
68.7
|
|
135.4
|
|
|
– of which:
|
||||||||
|
Unvested
|
66.7
|
|
—
|
|
68.7
|
|
135.4
|
|
|
Total amount of outstanding deferred and retained remuneration exposed to ex post explicit and/or implicit adjustment
|
66.7
|
|
—
|
|
68.7
|
|
135.4
|
|
|
Total amount of amendment during the year due to ex post implicit adjustment
|
9.7
|
|
—
|
|
10.5
|
|
20.2
|
|
|
Total amount of amendment during the year due to ex post explicit adjustment
3
|
—
|
|
—
|
|
—
|
|
—
|
|
|
Total amount of deferred remuneration paid out in the financial year
4
|
20.0
|
|
—
|
|
25.1
|
|
45.1
|
|
|
Other forms
|
||||||||
|
Total outstanding deferred remuneration
2
|
—
|
|
—
|
|
—
|
|
—
|
|
|
– of which:
|
||||||||
|
Unvested
|
—
|
|
—
|
|
—
|
|
—
|
|
|
Total amount of outstanding deferred and retained remuneration exposed to ex post explicit and/or implicit adjustment
|
—
|
|
—
|
|
—
|
|
—
|
|
|
Total amount of amendment during the year due to ex post implicit adjustment
|
—
|
|
—
|
|
—
|
|
—
|
|
|
Total amount of amendment during the year due to ex post explicit adjustment
3
|
—
|
|
—
|
|
—
|
|
—
|
|
|
Total amount of deferred remuneration paid out in the financial year
4
|
—
|
|
—
|
|
—
|
|
—
|
|
|
1
|
This table provides details of balances and movements during performance year 2017. For details of variable pay awards granted for 2017, please refer to the remuneration tables above. Deferred remuneration is made in cash and/or shares. Share-based awards are made in HSBC shares.
|
|
2
|
Includes unvested deferred awards, and vested deferred awards subject to retention period as at 31 December 2017.
|
|
3
|
Includes any amendments due to malus or clawback. Page
205
provides details of in-year variable pay adjustments.
|
|
4
|
Shares are considered as paid when they vest. Vested shares are valued using the sale price or the closing share price on the business day immediately preceding the vesting day.
|
|
HSBC Holdings plc
|
207
|
Directors’ Remuneration Report
Other MRTs (non-senior management)
|
Remuneration – fixed and variable amounts
|
||||||||||||||
|
Investment banking
|
|
Retail
banking |
|
Asset management
|
|
Corporate functions
|
|
Independent control functions
|
|
All other
|
|
Total
|
|
|
|
Number of MRTs
|
677
|
|
124
|
|
30
|
|
115
|
|
156
|
|
96
|
|
1,198
|
|
|
$m
|
|
$m
|
|
$m
|
|
$m
|
|
$m
|
|
$m
|
|
$m
|
|
|
|
Total fixed
|
406.2
|
|
61.3
|
|
18.5
|
|
58
|
|
57.2
|
|
61.6
|
|
662.8
|
|
|
Cash-based
1
|
406.2
|
|
61.3
|
|
18.5
|
|
58.0
|
|
57.2
|
|
61.6
|
|
662.8
|
|
|
– of which: deferred cash
|
—
|
|
—
|
|
—
|
|
—
|
|
—
|
|
—
|
|
—
|
|
|
Share-based
|
—
|
|
—
|
|
—
|
|
—
|
|
—
|
|
—
|
|
—
|
|
|
– of which: deferred shares
|
—
|
|
—
|
|
—
|
|
—
|
|
—
|
|
—
|
|
—
|
|
|
Total variable
2
|
417.7
|
|
58.4
|
|
19.0
|
|
57.2
|
|
44.1
|
|
55.1
|
|
651.5
|
|
|
Cash-based
|
203.5
|
|
28.3
|
|
9.4
|
|
28.0
|
|
22.5
|
|
27.0
|
|
318.7
|
|
|
– of which: deferred cash
|
105.1
|
|
13.8
|
|
4.6
|
|
13.8
|
|
9.0
|
|
14.3
|
|
160.6
|
|
|
Share-based
3
|
214.2
|
|
30.1
|
|
5.1
|
|
29.2
|
|
21.5
|
|
28.1
|
|
328.2
|
|
|
– of which: deferred shares
3
|
117.0
|
|
15.9
|
|
2.8
|
|
15.8
|
|
10.8
|
|
15.7
|
|
178.0
|
|
|
Other forms
3
|
—
|
|
—
|
|
4.5
|
|
—
|
|
0.1
|
|
—
|
|
4.6
|
|
|
– of which: deferred shares
3
|
—
|
|
—
|
|
2.7
|
|
—
|
|
—
|
|
—
|
|
2.7
|
|
|
Total remuneration
|
823.9
|
|
119.7
|
|
37.5
|
|
115.2
|
|
101.3
|
|
116.7
|
|
1,314.3
|
|
|
1
|
Cash-based fixed remuneration is paid immediately.
|
|
2
|
Variable pay awarded in respect of 2017. In accordance with shareholder approval received on 23 May 2014 (98% in favour), for each MRT the variable component of remuneration for any one year is limited to 200% of the fixed component of the total remuneration of the MRT.
|
|
3
|
Share-based awards are made in HSBC shares and/or linked to notional fund units in the HSBC World Selection Balanced Portfolio. Vested shares are subject to a retention period of up to one year.
|
|
Guaranteed bonus, sign-on and severance payments
|
||||||||||||||
|
Investment banking
|
|
Retail banking
|
|
Asset management
|
|
Corporate functions
|
|
Independent control functions
|
|
All other
|
|
Total
|
|
|
|
Guaranteed bonus and sign-on payments
1
|
||||||||||||||
|
Made during year ($m)
|
11.4
|
|
0.4
|
|
—
|
|
1.7
|
|
0.8
|
|
0.7
|
|
15.0
|
|
|
Number of beneficiaries
|
17
|
|
1
|
|
—
|
|
3
|
|
3
|
|
1
|
|
25
|
|
|
Severance payments
2
|
||||||||||||||
|
Awarded during year ($m)
|
17.3
|
|
1.9
|
|
—
|
|
1.4
|
|
0.6
|
|
4.8
|
|
26.0
|
|
|
Number of beneficiaries
|
31
|
|
3
|
|
—
|
|
2
|
|
2
|
|
4
|
|
42
|
|
|
Highest such award to a single person ($m)
|
1.9
|
|
0.7
|
|
—
|
|
1.2
|
|
0.5
|
|
2.9
|
|
2.9
|
|
|
Made during year ($m)
|
17.1
|
|
1.5
|
|
—
|
|
1.4
|
|
0.6
|
|
4.8
|
|
25.4
|
|
|
Number of beneficiaries
|
31
|
|
2
|
|
—
|
|
2
|
|
2
|
|
4
|
|
41
|
|
|
1
|
No sign-on payments were made in 2017. A guaranteed bonus is awarded in exceptional circumstances for new hires, and in the first year only. The circumstances where HSBC would offer a guaranteed bonus would typically involve a critical new hire and would also depend on factors such as the seniority of the individual, whether the new hire candidate has any competing offers and the timing of the hire during the performance year.
|
|
2
|
Includes payments such as payment in lieu of notice, statutory severance, outplacement service, legal fees, ex-gratia payments and settlements (excludes pre-existing benefit entitlements triggered on terminations).
|
|
208
|
HSBC Holdings plc
|
|
Deferred remuneration at 31 December
1
|
||||||||||||||
|
Investment banking
|
|
Retail banking
|
|
Asset management
|
|
Corporate functions
|
|
Independent control functions
|
|
All other
|
|
Total
|
|
|
|
$m
|
||||||||||||||
|
Cash
|
||||||||||||||
|
Total outstanding deferred remuneration
2
|
162.9
|
|
19.2
|
|
8.3
|
|
19.9
|
|
12.4
|
|
24.4
|
|
247.1
|
|
|
– of which:
|
||||||||||||||
|
Unvested
|
162.9
|
|
19.2
|
|
8.3
|
|
19.9
|
|
12.4
|
|
24.4
|
|
247.1
|
|
|
Total amount of outstanding deferred and retained remuneration exposed to ex post explicit and/or implicit adjustment
|
162.9
|
|
19.2
|
|
8.3
|
|
19.9
|
|
12.4
|
|
24.4
|
|
247.1
|
|
|
Total amount of amendment during the year due to ex post implicit adjustment
|
—
|
|
—
|
|
—
|
|
—
|
|
—
|
|
—
|
|
—
|
|
|
Total amount of amendment during the year due to ex post explicit adjustment
3
|
—
|
|
—
|
|
—
|
|
—
|
|
—
|
|
—
|
|
—
|
|
|
Total amount of deferred remuneration paid out in the financial year
|
71.1
|
|
7.0
|
|
4.0
|
|
7.2
|
|
4.6
|
|
9.8
|
|
103.7
|
|
|
Shares
|
||||||||||||||
|
Total outstanding deferred remuneration
2
|
286.2
|
|
31.8
|
|
12.6
|
|
38.5
|
|
23.9
|
|
48.2
|
|
441.2
|
|
|
– of which:
|
||||||||||||||
|
Unvested
|
286.1
|
|
31.8
|
|
12.6
|
|
38.5
|
|
23.9
|
|
48.1
|
|
441.0
|
|
|
Total amount of outstanding deferred and retained remuneration exposed to ex post explicit and/or implicit adjustment
|
286.2
|
|
31.8
|
|
12.6
|
|
38.5
|
|
23.9
|
|
48.2
|
|
441.2
|
|
|
Total amount of amendment during the year due to ex post implicit adjustment
|
43.7
|
|
5.5
|
|
1.8
|
|
6.3
|
|
3.7
|
|
7.7
|
|
68.7
|
|
|
Total amount of amendment during the year due to ex post explicit adjustment
3
|
—
|
|
—
|
|
—
|
|
—
|
|
—
|
|
—
|
|
—
|
|
|
Total amount of deferred remuneration paid out in the financial year
4
|
231.1
|
|
30.5
|
|
11.0
|
|
29.2
|
|
20.2
|
|
32.1
|
|
354.1
|
|
|
Other forms
|
||||||||||||||
|
Total outstanding deferred remuneration
2
|
—
|
|
—
|
|
0.5
|
|
—
|
|
—
|
|
—
|
|
0.5
|
|
|
– of which:
|
||||||||||||||
|
Unvested
|
—
|
|
—
|
|
0.5
|
|
—
|
|
—
|
|
—
|
|
0.5
|
|
|
Total amount of outstanding deferred and retained remuneration exposed to ex post explicit and/or implicit adjustment
|
—
|
|
—
|
|
0.5
|
|
—
|
|
—
|
|
—
|
|
0.5
|
|
|
Total amount of amendment during the year due to ex post implicit adjustment
|
—
|
|
—
|
|
—
|
|
—
|
|
—
|
|
—
|
|
—
|
|
|
Total amount of amendment during the year due to ex post explicit adjustment
3
|
—
|
|
—
|
|
—
|
|
—
|
|
—
|
|
—
|
|
—
|
|
|
Total amount of deferred remuneration paid out in the financial year
4
|
—
|
|
—
|
|
0.4
|
|
—
|
|
—
|
|
—
|
|
0.4
|
|
|
1
|
This table provides details of movements during performance year 2017. For details of variable pay awards granted for 2017, please refer to both the remuneration tables above. Deferred remuneration is made in cash and/or shares. Share-based awards are made in HSBC shares and/or linked to notional fund units in the HSBC World Selection Balanced Portfolio.
|
|
2
|
Includes unvested deferred awards, and vested deferred awards subject to retention period as at 31 December 2017.
|
|
3
|
Includes any amendments due to malus or clawback. Page
205
provides details of in-year variable pay adjustments.
|
|
4
|
Shares are considered as paid when they vest. Vested shares are valued using the sale price or the closing share price on the business day immediately preceding the vesting day.
|
|
MRTs’ remuneration by band
1
|
||||||
|
Management body
|
|
All other
|
|
Total
|
|
|
|
€0 – 1,000,000
|
17
|
|
841
|
|
858
|
|
|
€1,000,000 – 1,500,000
|
—
|
|
208
|
|
208
|
|
|
€1,500,000 – 2,000,000
|
—
|
|
72
|
|
72
|
|
|
€2,000,000 – 2,500,000
|
1
|
|
34
|
|
35
|
|
|
€2,500,000 – 3,000,000
|
—
|
|
22
|
|
22
|
|
|
€3,000,000 – 3,500,000
|
—
|
|
12
|
|
12
|
|
|
€3,500,000 – 4,000,000
|
—
|
|
7
|
|
7
|
|
|
€4,000,000 – 4,500,000
|
—
|
|
6
|
|
6
|
|
|
€4,500,000 – 5,000,000
|
—
|
|
3
|
|
3
|
|
|
€5,000,000 – 6,000,000
|
—
|
|
2
|
|
2
|
|
|
€6,000,000 – 7,000,000
|
3
|
|
5
|
|
8
|
|
|
€7,000,000 – 8,000,000
|
—
|
|
—
|
|
—
|
|
|
€8,000,000 – 9,000,000
|
—
|
|
—
|
|
—
|
|
|
€9,000,000 – 10,000,000
|
—
|
|
—
|
|
—
|
|
|
€10,000,000 – 11,000,000
|
—
|
|
1
|
|
1
|
|
|
1
|
Table prepared in euros in accordance with Article 450 of the European Union Capital Requirements Regulation, using the exchange rates published by the European Commission for financial programming and budget for December of the reported year as published on its website.
|
|
HSBC Holdings plc
|
209
|
Report of the Independent Registered Public Accounting Firm to the Board of Directors and Shareholders of HSBC Holdings plc
|
Report of the Independent Registered Public Accounting Firm to the Board of Directors and
Shareholders of HSBC Holdings plc
|
Opinions on the Financial Statements and Internal Control over Financial Reporting
We have audited the accompanying consolidated balance sheets of HSBC Holdings plc and its subsidiaries as of 31 December 2017 and 31 December 2016, and the related consolidated income statements, consolidated statements of comprehensive income, consolidated statements of cash flows and consolidated statements of changes in equity for each of the three years in the period ended 31 December 2017, including the related notes (collectively referred to as the 'financial statements'). We also have audited the Company’s internal control over financial reporting as of 31 December 2017, based on criteria established in Internal Control - Integrated Framework (2013) issued by the Committee of Sponsoring Organizations of the Treadway Commission (COSO).
In our opinion, the financial statements referred to above present fairly, in all material respects, the financial position of the Company as of 31 December 2017 and 31 December 2016, and the results of their operations and their cash flows for each of the three years in the period ended 31 December 2017 in conformity with International Financial Reporting Standards as issued by the International Accounting Standards Board and in conformity with International Financial Reporting Standards as adopted by the European Union. Also in our opinion, the Company maintained, in all material respects, effective internal control over financial reporting as of 31 December 2017, based on criteria established in Internal Control - Integrated Framework (2013) issued by the COSO.
Basis for Opinions
The Company's management is responsible for these financial statements, for maintaining effective internal control over financial reporting, and for its assessment of the effectiveness of internal control over financial reporting, included in management’s assessment of internal controls over financial reporting on page
178
of the
Annual Report and Accounts 2017
. Our responsibility is to express opinions on the Company’s financial statements and on the Company's internal control over financial reporting based on our audits. We are a public accounting firm registered with the Public Company Accounting Oversight Board (United States) ("PCAOB") and are required to be independent with respect to the Company in accordance with the US federal securities laws and the applicable rules and regulations of the Securities and Exchange Commission and the PCAOB.
We conducted our audits in accordance with the standards of the PCAOB. Those standards require that we plan and perform the audits to obtain reasonable assurance about whether the financial statements are free of material misstatement, whether due to error or fraud, and whether effective internal control over financial reporting was maintained in all material respects.
Our audits of the financial statements included performing procedures to assess the risks of material misstatement of the financial statements, whether due to error or fraud, and performing procedures that respond to those risks. Such procedures included examining, on a test basis, evidence regarding the amounts and disclosures in the financial statements. Our audits also included evaluating the accounting principles used and significant estimates made by management, as well as evaluating the overall presentation of the financial statements. Our audit of internal control over financial reporting included obtaining an understanding of internal control over financial reporting, assessing the risk that a material weakness exists, and testing and evaluating the design and operating effectiveness of internal control based on the assessed risk. Our audits also included performing such other procedures as we considered necessary in the circumstances. We believe that our audits provide a reasonable basis for our opinions.
Definition and Limitations of Internal Control over Financial Reporting
A company’s internal control over financial reporting is a process designed to provide reasonable assurance regarding the reliability of financial reporting and the preparation of financial statements for external purposes in accordance with generally accepted accounting principles. A company’s internal control over financial reporting includes those policies and procedures that (i) pertain to the maintenance of records that, in reasonable detail, accurately and fairly reflect the transactions and dispositions of the assets of the company; (ii) provide reasonable assurance that transactions are recorded as necessary to permit preparation of financial statements in accordance with generally accepted accounting principles, and that receipts and expenditures of the company are being made only in accordance with authorisations of management and directors of the company; and (iii) provide reasonable assurance regarding prevention or timely detection of unauthorised acquisition, use, or disposition of the company’s assets that could have a material effect on the financial statements.
Because of its inherent limitations, internal control over financial reporting may not prevent or detect mis-statements. Also, projections of any evaluation of effectiveness to future periods are subject to the risk that controls may become inadequate because of changes in conditions, or that the degree of compliance with the policies or procedures may deteriorate.
We have served as the Company’s auditor since 2015.
PricewaterhouseCoopers LLP
London, United Kingdom
20 February 2018
|
210
|
HSBC Holdings plc
|
|
Financial Statements
|
||
|
Page
|
||
|
Consolidated income statement
|
||
|
Consolidated statement of comprehensive income
|
||
|
Consolidated balance sheet
|
||
|
Consolidated statement of cash flows
|
||
|
Consolidated statement of changes in equity
|
||
|
HSBC Holdings income statement
|
||
|
HSBC Holdings statement of comprehensive income
|
||
|
HSBC Holdings balance sheet
|
||
|
HSBC Holdings statement of cash flows
|
||
|
HSBC Holdings statement of changes in equity
|
||
|
Notes on the Financial
Statements
|
||
|
1
|
Basis of preparation and significant accounting policies
|
|
|
2
|
Net income/(expense) from financial instruments designated at fair value
|
|
|
3
|
Insurance business
|
|
|
4
|
Operating profit
|
|
|
5
|
Employee compensation and benefits
|
|
|
6
|
Auditors’ remuneration
|
|
|
7
|
Tax
|
|
|
8
|
Dividends
|
|
|
9
|
Earnings per share
|
|
|
10
|
Trading assets
|
|
|
11
|
Fair values of financial instruments carried at fair value
|
|
|
12
|
Fair values of financial instruments not carried at fair value
|
|
|
13
|
Financial assets designated at fair value
|
|
|
14
|
Derivatives
|
|
|
15
|
Financial investments
|
|
|
16
|
Assets pledged, collateral received and assets transferred
|
|
|
17
|
Interests in associates and joint ventures
|
|
|
18
|
Investments in subsidiaries
|
|
|
19
|
Structured entities
|
|
|
20
|
Goodwill and intangible assets
|
|
|
21
|
Prepayments, accrued income and other assets
|
|
|
22
|
Trading liabilities
|
|
|
23
|
Financial liabilities designated at fair value
|
|
|
24
|
Debt securities in issue
|
|
|
25
|
Accruals, deferred income and other liabilities
|
|
|
26
|
Provisions
|
|
|
27
|
Subordinated liabilities
|
|
|
28
|
Maturity analysis of assets, liabilities and off-balance sheet commitments
|
|
|
29
|
Offsetting of financial assets and financial liabilities
|
|
|
30
|
Non-controlling interests
|
|
|
31
|
Called up share capital and other equity instruments
|
|
|
32
|
Contingent liabilities, contractual commitments
and guarantees
|
|
|
33
|
Lease commitments
|
|
|
34
|
Legal proceedings and regulatory matters
|
|
|
35
|
Related party transactions
|
|
|
36
|
Events after the balance sheet date
|
|
|
37
|
HSBC Holdings’ subsidiaries, joint ventures and associates
|
|
|
38
|
Non-statutory accounts
|
|
|
HSBC Holdings plc
|
211
|
Financial Statements
|
Consolidated income statement
|
|||||||
|
for the year ended 31 December
|
|||||||
|
2017
|
|
2016
|
|
2015
|
|
||
|
Notes
|
$m
|
|
$m
|
|
$m
|
|
|
|
Net interest income
|
28,176
|
|
29,813
|
|
32,531
|
|
|
|
– interest income
|
40,995
|
|
42,414
|
|
47,189
|
|
|
|
– interest expense
|
(12,819
|
)
|
(12,601
|
)
|
(14,658
|
)
|
|
|
Net fee income
|
12,811
|
|
12,777
|
|
14,705
|
|
|
|
– fee income
|
15,853
|
|
15,669
|
|
18,016
|
|
|
|
– fee expense
|
(3,042
|
)
|
(2,892
|
)
|
(3,311
|
)
|
|
|
Net trading income
|
7,719
|
|
9,452
|
|
8,723
|
|
|
|
– trading income excluding net interest income
|
6,098
|
|
8,066
|
|
6,948
|
|
|
|
– net interest income on trading activities
|
1,621
|
|
1,386
|
|
1,775
|
|
|
|
Net income/(expense) from financial instruments designated at fair value
|
2
|
3,698
|
|
(2,666
|
)
|
1,532
|
|
|
– changes in fair value of long-term debt and related derivatives
|
672
|
|
(3,975
|
)
|
863
|
|
|
|
– net income from other financial instruments designated at fair value
|
3,026
|
|
1,309
|
|
669
|
|
|
|
Gains less losses from financial investments
|
1,150
|
|
1,385
|
|
2,068
|
|
|
|
Dividend income
|
106
|
|
95
|
|
123
|
|
|
|
Net insurance premium income
|
3
|
9,779
|
|
9,951
|
|
10,355
|
|
|
Other operating income/(expense)
|
337
|
|
(971
|
)
|
1,055
|
|
|
|
Total operating income
|
63,776
|
|
59,836
|
|
71,092
|
|
|
|
Net insurance claims and benefits paid and movement in liabilities to policyholders
|
3
|
(12,331
|
)
|
(11,870
|
)
|
(11,292
|
)
|
|
Net operating income before loan impairment charges and other credit risk provisions
|
51,445
|
|
47,966
|
|
59,800
|
|
|
|
Loan impairment charges and other credit risk provisions
|
4
|
(1,769
|
)
|
(3,400
|
)
|
(3,721
|
)
|
|
Net operating income
|
49,676
|
|
44,566
|
|
56,079
|
|
|
|
Employee compensation and benefits
|
5
|
(17,315
|
)
|
(18,089
|
)
|
(19,900
|
)
|
|
General and administrative expenses
|
(15,707
|
)
|
(16,473
|
)
|
(17,662
|
)
|
|
|
Depreciation and impairment of property, plant and equipment
|
(1,166
|
)
|
(1,229
|
)
|
(1,269
|
)
|
|
|
Amortisation and impairment of intangible assets
|
(696
|
)
|
(777
|
)
|
(937
|
)
|
|
|
Goodwill impairment of Global Private Banking – Europe
|
20
|
—
|
|
(3,240
|
)
|
—
|
|
|
Total operating expenses
|
(34,884
|
)
|
(39,808
|
)
|
(39,768
|
)
|
|
|
Operating profit
|
4
|
14,792
|
|
4,758
|
|
16,311
|
|
|
Share of profit in associates and joint ventures
|
17
|
2,375
|
|
2,354
|
|
2,556
|
|
|
Profit before tax
|
17,167
|
|
7,112
|
|
18,867
|
|
|
|
Tax expense
|
7
|
(5,288
|
)
|
(3,666
|
)
|
(3,771
|
)
|
|
Profit for the year
|
11,879
|
|
3,446
|
|
15,096
|
|
|
|
Attributable to:
|
|
|
|||||
|
– ordinary shareholders of the parent company
|
9,683
|
|
1,299
|
|
12,572
|
|
|
|
– preference shareholders of the parent company
|
90
|
|
90
|
|
90
|
|
|
|
– other equity holders
|
1,025
|
|
1,090
|
|
860
|
|
|
|
– non-controlling interests
|
1,081
|
|
967
|
|
1,574
|
|
|
|
Profit for the year
|
11,879
|
|
3,446
|
|
15,096
|
|
|
|
|
$
|
|
$
|
|
$
|
|
|
|
Basic earnings per ordinary share
|
9
|
0.48
|
|
0.07
|
|
0.65
|
|
|
Diluted earnings per ordinary share
|
9
|
0.48
|
|
0.07
|
|
0.64
|
|
|
212
|
HSBC Holdings plc
|
|
|
||||||
|
for the year ended 31 December
|
||||||
|
2017
|
|
2016
|
|
2015
|
|
|
|
$m
|
|
$m
|
|
$m
|
|
|
|
Profit for the year
|
11,879
|
|
3,446
|
|
15,096
|
|
|
Other comprehensive income/(expense)
|
||||||
|
Items that will be reclassified subsequently to profit or loss when specific conditions are met:
|
||||||
|
Available-for-sale investments
|
146
|
|
(299
|
)
|
(3,072
|
)
|
|
– fair value gains/(losses)
|
1,227
|
|
475
|
|
(1,231
|
)
|
|
– fair value gains reclassified to the income statement
|
(1,033
|
)
|
(895
|
)
|
(2,437
|
)
|
|
– amounts reclassified to the income statement in respect of impairment losses
|
93
|
|
71
|
|
127
|
|
|
– income taxes
|
(141
|
)
|
50
|
|
469
|
|
|
Cash flow hedges
|
(192
|
)
|
(68
|
)
|
(24
|
)
|
|
– fair value (losses)/gains
|
(1,046
|
)
|
(297
|
)
|
704
|
|
|
– fair value losses/(gains) reclassified to the income statement
|
833
|
|
195
|
|
(705
|
)
|
|
– income taxes
|
21
|
|
34
|
|
(23
|
)
|
|
Share of other comprehensive income/(expense) of associates and joint ventures
|
(43
|
)
|
54
|
|
(9
|
)
|
|
– share for the year
|
(43
|
)
|
54
|
|
(9
|
)
|
|
Exchange differences
|
9,077
|
|
(8,092
|
)
|
(10,945
|
)
|
|
– foreign exchange gains reclassified to income statement on disposal of a foreign operation
|
—
|
|
1,894
|
|
—
|
|
|
– other exchange differences
|
8,939
|
|
(9,791
|
)
|
(11,112
|
)
|
|
– income tax attributable to exchange differences
|
138
|
|
(195
|
)
|
167
|
|
|
Items that will not be reclassified subsequently to profit or loss:
|
||||||
|
Remeasurement of defined benefit asset/liability
|
2,419
|
|
7
|
|
101
|
|
|
– before income taxes
|
3,440
|
|
(84
|
)
|
130
|
|
|
– income taxes
|
(1,021
|
)
|
91
|
|
(29
|
)
|
|
Changes in fair value of financial liabilities designated at fair value due to movement in own credit risk
|
(2,024
|
)
|
—
|
|
—
|
|
|
– before income taxes
|
(2,409
|
)
|
—
|
|
—
|
|
|
– income taxes
|
385
|
|
—
|
|
—
|
|
|
Other comprehensive income/(expense) for the year,
net of tax
|
9,383
|
|
(8,398
|
)
|
(13,949
|
)
|
|
Total comprehensive income/(expense) fo
r the year
|
21,262
|
|
(4,952
|
)
|
1,147
|
|
|
Attributable to:
|
||||||
|
– ordinary shareholders of the parent company
|
18,914
|
|
(6,968
|
)
|
(490
|
)
|
|
– preference shareholders of the parent company
|
90
|
|
90
|
|
90
|
|
|
– other equity holders
|
1,025
|
|
1,090
|
|
860
|
|
|
– non-controlling interests
|
1,233
|
|
836
|
|
687
|
|
|
Total comprehensive income/(expense) fo
r the year
|
21,262
|
|
(4,952
|
)
|
1,147
|
|
|
HSBC Holdings plc
|
213
|
Financial Statements
|
Consolidated balance sheet
|
|||||
|
at 31 December
|
|||||
|
2017
|
|
2016
|
|
||
|
Notes
|
$m
|
|
$m
|
|
|
|
Assets
|
|||||
|
Cash and balances at central banks
|
180,624
|
|
128,009
|
|
|
|
Items in the course of collection from other banks
|
6,628
|
|
5,003
|
|
|
|
Hong Kong Government certificates of indebtedness
|
34,186
|
|
31,228
|
|
|
|
Trading assets
|
10
|
287,995
|
|
235,125
|
|
|
Financial assets designated at fair value
|
13
|
29,464
|
|
24,756
|
|
|
Derivatives
|
14
|
219,818
|
|
290,872
|
|
|
Loans and advances to banks
|
90,393
|
|
88,126
|
|
|
|
Loans and advances to customers
|
962,964
|
|
861,504
|
|
|
|
Reverse repurchase agreements – non-trading
|
201,553
|
|
160,974
|
|
|
|
Financial investments
|
15
|
389,076
|
|
436,797
|
|
|
Prepayments, accrued income and other assets
|
21
|
67,191
|
|
63,909
|
|
|
Current tax assets
|
1,006
|
|
1,145
|
|
|
|
Interests in associates and joint ventures
|
17
|
22,744
|
|
20,029
|
|
|
Goodwill and intangible assets
|
20
|
23,453
|
|
21,346
|
|
|
Deferred tax assets
|
7
|
4,676
|
|
6,163
|
|
|
Total assets at 31 Dec
|
2,521,771
|
|
2,374,986
|
|
|
|
Liabilities and equity
|
|||||
|
Liabilities
|
|||||
|
Hong Kong currency notes in circulation
|
34,186
|
|
31,228
|
|
|
|
Deposits by banks
|
69,922
|
|
59,939
|
|
|
|
Customer accounts
|
1,364,462
|
|
1,272,386
|
|
|
|
Repurchase agreements – non-trading
|
130,002
|
|
88,958
|
|
|
|
Items in the course of transmission to other banks
|
6,850
|
|
5,977
|
|
|
|
Trading liabilities
|
22
|
184,361
|
|
153,691
|
|
|
Financial liabilities designated at fair value
|
23
|
94,429
|
|
86,832
|
|
|
Derivatives
|
14
|
216,821
|
|
279,819
|
|
|
Debt securities in issue
|
24
|
64,546
|
|
65,915
|
|
|
Accruals, deferred income and other liabilities
|
25
|
45,907
|
|
44,291
|
|
|
Current tax liabilities
|
928
|
|
719
|
|
|
|
Liabilities under insurance contracts
|
3
|
85,667
|
|
75,273
|
|
|
Provisions
|
26
|
4,011
|
|
4,773
|
|
|
Deferred tax liabilities
|
7
|
1,982
|
|
1,623
|
|
|
Subordinated liabilities
|
27
|
19,826
|
|
20,984
|
|
|
Total liabilities at 31 Dec
|
2,323,900
|
|
2,192,408
|
|
|
|
Equity
|
|||||
|
Called up share capital
|
31
|
10,160
|
|
10,096
|
|
|
Share premium account
|
31
|
10,177
|
|
12,619
|
|
|
Other equity instruments
|
22,250
|
|
17,110
|
|
|
|
Other reserves
|
7,664
|
|
(1,234
|
)
|
|
|
Retained earnings
|
139,999
|
|
136,795
|
|
|
|
Total shareholders’ equity
|
190,250
|
|
175,386
|
|
|
|
Non-controlling interests
|
30
|
7,621
|
|
7,192
|
|
|
Total equity at 31 Dec
|
197,871
|
|
182,578
|
|
|
|
Total liabilities and equity at 31 Dec
|
2,521,771
|
|
2,374,986
|
|
|
The accompanying notes on pages
222
to
297
, the audited sections in ‘Global businesses and regions’ on pages
64
to
82
, ‘Risk’ on
pages 95 to 161 , ‘Capital’ on pages 162 to 165 and ‘Directors’ Remuneration Report’ on pages 186 to 202 form an integral part of
these financial statements.
pages 95 to 161 , ‘Capital’ on pages 162 to 165 and ‘Directors’ Remuneration Report’ on pages 186 to 202 form an integral part of
these financial statements.
These financial statements were approved by the Board of Directors on 20 February 2018 and signed on its behalf by:

|

|
|
|
Mark E Tucker
|
Iain Mackay
|
|
|
Group Chairman
|
Group Finance Director
|
|
|
214
|
HSBC Holdings plc
|
|
|
|||||||
|
for the year ended 31 December
|
|||||||
|
|
2017
|
|
2016
|
|
2015
|
|
|
|
|
Footnotes
|
$m
|
|
$m
|
|
$m
|
|
|
Profit before tax
|
17,167
|
|
7,112
|
|
18,867
|
|
|
|
Adjustments for non-cash items:
|
|
|
|
|
|||
|
Depreciation, amortisation and impairment
|
1,862
|
|
5,212
|
|
2,181
|
|
|
|
Net gain from investing activities
|
(1,152
|
)
|
(1,215
|
)
|
(1,935
|
)
|
|
|
Share of profits in associates and joint ventures
|
(2,375
|
)
|
(2,354
|
)
|
(2,556
|
)
|
|
|
(Gain)/Loss on disposal of subsidiaries, businesses, associates and joint ventures
|
(79
|
)
|
1,743
|
|
—
|
|
|
|
Loan impairment losses gross of recoveries and other credit risk provisions
|
2,603
|
|
4,090
|
|
4,546
|
|
|
|
Provisions including pensions
|
917
|
|
2,482
|
|
3,472
|
|
|
|
Share-based payment expense
|
500
|
|
534
|
|
757
|
|
|
|
Other non-cash items included in profit before tax
|
(381
|
)
|
(207
|
)
|
(191
|
)
|
|
|
Elimination of exchange differences
|
1
|
(21,289
|
)
|
15,364
|
|
18,308
|
|
|
Changes in operating assets and liabilities
|
|
|
|
|
|||
|
Change in net trading securities and derivatives
|
(10,901
|
)
|
4,395
|
|
24,384
|
|
|
|
Change in loans and advances to banks and customers
|
(108,984
|
)
|
52,868
|
|
32,971
|
|
|
|
Change in reverse repurchase agreements – non-trading
|
(37,281
|
)
|
(13,138
|
)
|
(3,011
|
)
|
|
|
Change in financial assets designated at fair value
|
(5,303
|
)
|
(1,235
|
)
|
2,394
|
|
|
|
Change in other assets
|
(6,570
|
)
|
(6,591
|
)
|
9,090
|
|
|
|
Change in deposits by banks and customer accounts
|
102,211
|
|
(8,918
|
)
|
(65,907
|
)
|
|
|
Change in repurchase agreements – non-trading
|
41,044
|
|
8,558
|
|
(26,481
|
)
|
|
|
Change in debt securities in issue
|
(1,369
|
)
|
(23,034
|
)
|
960
|
|
|
|
Change in financial liabilities designated at fair value
|
8,508
|
|
17,802
|
|
(10,785
|
)
|
|
|
Change in other liabilities
|
13,514
|
|
8,792
|
|
(4,549
|
)
|
|
|
Dividends received from associates
|
740
|
|
689
|
|
879
|
|
|
|
Contributions paid to defined benefit plans
|
(685
|
)
|
(726
|
)
|
(664
|
)
|
|
|
Tax paid
|
(3,175
|
)
|
(3,264
|
)
|
(3,852
|
)
|
|
|
Net cash from operating activities
|
(10,478
|
)
|
68,959
|
|
(1,122
|
)
|
|
|
Purchase of financial investments
|
(357,264
|
)
|
(457,084
|
)
|
(438,376
|
)
|
|
|
Proceeds from the sale and maturity of financial investments
|
418,352
|
|
430,085
|
|
399,636
|
|
|
|
Net cash flows from the purchase and sale of property, plant and equipment
|
(1,167
|
)
|
(1,151
|
)
|
(1,249
|
)
|
|
|
Net cash flows from disposal of customer and loan portfolios
|
6,756
|
|
9,194
|
|
2,023
|
|
|
|
Net investment in intangible assets
|
(1,285
|
)
|
(906
|
)
|
(954
|
)
|
|
|
Net cash flow on disposal of subsidiaries, businesses, associates and joint ventures
|
2
|
165
|
|
4,802
|
|
8
|
|
|
Net cash from investing activities
|
65,557
|
|
(15,060
|
)
|
(38,912
|
)
|
|
|
Issue of ordinary share capital and other equity instruments
|
5,196
|
|
2,024
|
|
3,727
|
|
|
|
Cancellation of shares
|
(3,000
|
)
|
—
|
|
—
|
|
|
|
Net sales/(purchases) of own shares for market-making and investment purposes
|
(67
|
)
|
523
|
|
331
|
|
|
|
Purchase of treasury shares
|
—
|
|
(2,510
|
)
|
—
|
|
|
|
Redemption of preference shares and other equity instruments
|
—
|
|
(1,825
|
)
|
(463
|
)
|
|
|
Subordinated loan capital issued
|
—
|
|
2,622
|
|
3,180
|
|
|
|
Subordinated loan capital repaid
|
4
|
(3,574
|
)
|
(595
|
)
|
(2,157
|
)
|
|
Dividends paid to shareholders of the parent company and non-controlling interests
|
(9,005
|
)
|
(9,157
|
)
|
(8,195
|
)
|
|
|
Net cash from financing activities
|
(10,450
|
)
|
(8,918
|
)
|
(3,577
|
)
|
|
|
Net increase/(decrease) in cash and cash equivalents
|
44,629
|
|
44,981
|
|
(43,611
|
)
|
|
|
Cash and cash equivalents at 1 Jan
|
274,550
|
|
243,863
|
|
301,301
|
|
|
|
Exchange differences in respect of cash and cash equivalents
|
18,233
|
|
(14,294
|
)
|
(13,827
|
)
|
|
|
Cash and cash equivalents at 31 Dec
|
337,412
|
|
274,550
|
|
243,863
|
|
|
|
Cash and cash equivalents comprise:
|
3
|
|
|
|
|||
|
– cash and balances at central banks
|
180,624
|
|
128,009
|
|
98,934
|
|
|
|
– items in the course of collection from other banks
|
6,628
|
|
5,003
|
|
5,768
|
|
|
|
– loans and advances to banks of one month or less
|
82,771
|
|
77,318
|
|
70,985
|
|
|
|
– reverse repurchase agreements with banks of one month or less
|
58,850
|
|
55,551
|
|
53,971
|
|
|
|
– treasury bills, other bills and certificates of deposit less than three months
|
15,389
|
|
14,646
|
|
19,843
|
|
|
|
– less: items in the course of transmission to other banks
|
(6,850
|
)
|
(5,977
|
)
|
(5,638
|
)
|
|
|
337,412
|
|
274,550
|
|
243,863
|
|
||
Interest received was $
41,676m
(2016:
$42,586m
; 2015:
$47,623m
), interest paid was $
10,962m
(2016:
$12,027m
; 2015:
$14,559m
) and dividends received were $
2,225m
(2016:
$475m
; 2015:
$914m
).
|
1
|
Adjustment to bring changes between opening and closing balance sheet amounts to average rates. This is not done on a line-by-line basis, as details cannot be determined without unreasonable expense.
|
|
2
|
In July 2016, we completed the disposal of the Brazilian operations resulting in net cash inflow of
$4.8b
n
.
|
|
3
|
At 31 December 2017 $
39,830m
(2016:
$35,501m
) was not available for use by HSBC, of which $
21,424m
(2016:
$21,108m
) related to mandatory deposits at central banks.
|
|
4
|
Subordinated liabilities changes during the year are attributable to repayments of
$(3.6)b
n (2016:
$(0.6)b
n) of securities. Non-cash changes during the year included foreign exchange loss/gain (
$0.6b
n) (2016:
$2.1b
n) and fair value losses of (
$1.2b
n) (2016: (
$0.3b
n)).
|
|
HSBC Holdings plc
|
215
|
Financial Statements
|
Consolidated statement of changes in equity
|
||||||||||||||||||||
|
for the year ended 31 December
|
||||||||||||||||||||
|
|
|
|
|
|
|
|
Other reserves
6
|
|
|
|
|
|
|
|||||||
|
Called up share capital and share premium
1
|
|
Other
equity instru-ments 2 |
|
Retained
earnings 3, 4, 5 |
|
Available- for-sale fair value
reserve |
|
Cash flow
hedging reserve |
|
Foreign
exchange reserve |
|
Merger
reserve 7 |
|
Total
share- holders’ equity |
|
Non-
controlling interests |
|
Total
equity |
|
|
|
$m
|
|
$m
|
|
$m
|
|
$m
|
|
$m
|
|
$m
|
|
$m
|
|
$m
|
|
$m
|
|
$m
|
|
|
|
At 1 Jan 2017
|
22,715
|
|
17,110
|
|
136,795
|
|
(477
|
)
|
(27
|
)
|
(28,038
|
)
|
27,308
|
|
175,386
|
|
7,192
|
|
182,578
|
|
|
Profit for the year
|
—
|
|
—
|
|
10,798
|
|
—
|
|
—
|
|
—
|
|
—
|
|
10,798
|
|
1,081
|
|
11,879
|
|
|
Other comprehensive income
(net of tax) |
—
|
|
—
|
|
328
|
|
131
|
|
(194
|
)
|
8,966
|
|
—
|
|
9,231
|
|
152
|
|
9,383
|
|
|
– available-for-sale investments
|
—
|
|
—
|
|
—
|
|
131
|
|
—
|
|
—
|
|
—
|
|
131
|
|
15
|
|
146
|
|
|
– cash flow hedges
|
—
|
|
—
|
|
—
|
|
—
|
|
(194
|
)
|
—
|
|
—
|
|
(194
|
)
|
2
|
|
(192
|
)
|
|
– changes in fair value of financial liabilities designated at fair value due to movement in own credit risk
|
—
|
|
—
|
|
(2,024
|
)
|
—
|
|
—
|
|
—
|
|
—
|
|
(2,024
|
)
|
—
|
|
(2,024
|
)
|
|
– remeasurement of defined benefit asset/liability
8
|
—
|
|
—
|
|
2,395
|
|
—
|
|
—
|
|
—
|
|
—
|
|
2,395
|
|
24
|
|
2,419
|
|
|
– share of other comprehensive income of associates and joint ventures
|
—
|
|
—
|
|
(43
|
)
|
—
|
|
—
|
|
—
|
|
—
|
|
(43
|
)
|
—
|
|
(43
|
)
|
|
– exchange differences
|
—
|
|
—
|
|
—
|
|
—
|
|
—
|
|
8,966
|
|
—
|
|
8,966
|
|
111
|
|
9,077
|
|
|
Total comprehensive income for the year
|
—
|
|
—
|
|
11,126
|
|
131
|
|
(194
|
)
|
8,966
|
|
—
|
|
20,029
|
|
1,233
|
|
21,262
|
|
|
Shares issued under employee remuneration and share plans
|
622
|
|
—
|
|
(566
|
)
|
—
|
|
—
|
|
—
|
|
—
|
|
56
|
|
—
|
|
56
|
|
|
Shares issued in lieu of dividends and amounts arising thereon
|
—
|
|
—
|
|
3,206
|
|
—
|
|
—
|
|
—
|
|
—
|
|
3,206
|
|
—
|
|
3,206
|
|
|
Capital securities issued
|
—
|
|
5,140
|
|
—
|
|
—
|
|
—
|
|
—
|
|
—
|
|
5,140
|
|
—
|
|
5,140
|
|
|
Dividends to shareholders
|
—
|
|
—
|
|
(11,551
|
)
|
—
|
|
—
|
|
—
|
|
—
|
|
(11,551
|
)
|
(660
|
)
|
(12,211
|
)
|
|
Cost of share-based payment arrangements
|
—
|
|
—
|
|
500
|
|
—
|
|
—
|
|
—
|
|
—
|
|
500
|
|
—
|
|
500
|
|
|
Cancellation of shares
|
(3,000
|
)
|
—
|
|
—
|
|
—
|
|
—
|
|
—
|
|
—
|
|
(3,000
|
)
|
—
|
|
(3,000
|
)
|
|
Other movements
|
—
|
|
—
|
|
489
|
|
(4
|
)
|
(1
|
)
|
—
|
|
—
|
|
484
|
|
(144
|
)
|
340
|
|
|
At 31 Dec 2017
|
20,337
|
|
22,250
|
|
139,999
|
|
(350
|
)
|
(222
|
)
|
(19,072
|
)
|
27,308
|
|
190,250
|
|
7,621
|
|
197,871
|
|
|
At 1 Jan 2016
|
22,263
|
|
15,112
|
|
143,976
|
|
(189
|
)
|
34
|
|
(20,044
|
)
|
27,308
|
|
188,460
|
|
9,058
|
|
197,518
|
|
|
Profit for the year
|
—
|
|
—
|
|
2,479
|
|
—
|
|
—
|
|
—
|
|
—
|
|
2,479
|
|
967
|
|
3,446
|
|
|
Other comprehensive income
(net of tax) |
—
|
|
—
|
|
59
|
|
(271
|
)
|
(61
|
)
|
(7,994
|
)
|
—
|
|
(8,267
|
)
|
(131
|
)
|
(8,398
|
)
|
|
– available-for-sale investments
|
—
|
|
—
|
|
—
|
|
(271
|
)
|
—
|
|
—
|
|
—
|
|
(271
|
)
|
(28
|
)
|
(299
|
)
|
|
– cash flow hedges
|
—
|
|
—
|
|
—
|
|
—
|
|
(61
|
)
|
—
|
|
—
|
|
(61
|
)
|
(7
|
)
|
(68
|
)
|
|
– remeasurement of defined benefit asset/liability
|
—
|
|
—
|
|
5
|
|
—
|
|
—
|
|
—
|
|
—
|
|
5
|
|
2
|
|
7
|
|
|
– share of other comprehensive income of associates and joint ventures
|
—
|
|
—
|
|
54
|
|
—
|
|
—
|
|
—
|
|
—
|
|
54
|
|
—
|
|
54
|
|
|
– foreign exchange reclassified to income statement on disposal of a foreign operation
|
—
|
|
—
|
|
—
|
|
—
|
|
—
|
|
1,894
|
|
—
|
|
1,894
|
|
—
|
|
1,894
|
|
|
– exchange differences
|
—
|
|
—
|
|
—
|
|
—
|
|
—
|
|
(9,888
|
)
|
—
|
|
(9,888
|
)
|
(98
|
)
|
(9,986
|
)
|
|
Total comprehensive income for the year
|
—
|
|
—
|
|
2,538
|
|
(271
|
)
|
(61
|
)
|
(7,994
|
)
|
—
|
|
(5,788
|
)
|
836
|
|
(4,952
|
)
|
|
Shares issued under employee remuneration and share plans
|
452
|
|
—
|
|
(425
|
)
|
—
|
|
—
|
|
—
|
|
—
|
|
27
|
|
—
|
|
27
|
|
|
Shares issued in lieu of dividends and amounts arising thereon
|
—
|
|
—
|
|
3,040
|
|
—
|
|
—
|
|
—
|
|
—
|
|
3,040
|
|
—
|
|
3,040
|
|
|
Net increase in treasury shares
|
—
|
|
—
|
|
(2,510
|
)
|
—
|
|
—
|
|
—
|
|
—
|
|
(2,510
|
)
|
—
|
|
(2,510
|
)
|
|
Capital securities issued
|
—
|
|
1,998
|
|
—
|
|
—
|
|
—
|
|
—
|
|
—
|
|
1,998
|
|
—
|
|
1,998
|
|
|
Dividends to shareholders
|
—
|
|
—
|
|
(11,279
|
)
|
—
|
|
—
|
|
—
|
|
—
|
|
(11,279
|
)
|
(919
|
)
|
(12,198
|
)
|
|
Cost of share-based payment arrangements
|
—
|
|
—
|
|
534
|
|
—
|
|
—
|
|
—
|
|
—
|
|
534
|
|
—
|
|
534
|
|
|
Other movements
|
—
|
|
—
|
|
921
|
|
(17
|
)
|
—
|
|
—
|
|
—
|
|
904
|
|
(1,783
|
)
|
(879
|
)
|
|
At 31 Dec 2016
|
22,715
|
|
17,110
|
|
136,795
|
|
(477
|
)
|
(27
|
)
|
(28,038
|
)
|
27,308
|
|
175,386
|
|
7,192
|
|
182,578
|
|
|
216
|
HSBC Holdings plc
|
|
Consolidated statement of changes in equity (continued)
|
||||||||||||||||||||
|
Other reserves
6
|
||||||||||||||||||||
|
Called up share capital and share premium
1
|
|
Other
equity
instru-ments
2
|
|
Retained
earnings
3, 4, 5
|
|
Available- for-sale fair value
reserve
|
|
Cash flow
hedging
reserve
|
|
Foreign
exchange
reserve
|
|
Merger
reserve
7
|
|
Total
share-
holders’
equity
|
|
Non-
controlling
interests
|
|
Total
equity
|
|
|
|
$m
|
|
$m
|
|
$m
|
|
$m
|
|
$m
|
|
$m
|
|
$m
|
|
$m
|
|
$m
|
|
$m
|
|
|
|
At 1 Jan 2015
|
21,527
|
|
11,532
|
|
137,144
|
|
2,143
|
|
58
|
|
(9,265
|
)
|
27,308
|
|
190,447
|
|
9,531
|
|
199,978
|
|
|
Profit for the year
|
—
|
|
—
|
|
13,522
|
|
—
|
|
—
|
|
—
|
|
—
|
|
13,522
|
|
1,574
|
|
15,096
|
|
|
Other comprehensive income
(net of tax) |
—
|
|
—
|
|
73
|
|
(2,332
|
)
|
(24
|
)
|
(10,779
|
)
|
—
|
|
(13,062
|
)
|
(887
|
)
|
(13,949
|
)
|
|
– available-for-sale investments
|
—
|
|
—
|
|
—
|
|
(2,332
|
)
|
—
|
|
—
|
|
—
|
|
(2,332
|
)
|
(740
|
)
|
(3,072
|
)
|
|
– cash flow hedges
|
—
|
|
—
|
|
—
|
|
—
|
|
(24
|
)
|
—
|
|
—
|
|
(24
|
)
|
—
|
|
(24
|
)
|
|
– remeasurement of defined benefit asset/liability
|
—
|
|
—
|
|
82
|
|
—
|
|
—
|
|
—
|
|
—
|
|
82
|
|
19
|
|
101
|
|
|
– share of other comprehensive income of associates and joint ventures
|
—
|
|
—
|
|
(9
|
)
|
—
|
|
—
|
|
—
|
|
—
|
|
(9
|
)
|
—
|
|
(9
|
)
|
|
– exchange differences
|
—
|
|
—
|
|
—
|
|
—
|
|
—
|
|
(10,779
|
)
|
—
|
|
(10,779
|
)
|
(166
|
)
|
(10,945
|
)
|
|
Total comprehensive income for
the year |
—
|
|
—
|
|
13,595
|
|
(2,332
|
)
|
(24
|
)
|
(10,779
|
)
|
—
|
|
460
|
|
687
|
|
1,147
|
|
|
Shares issued under employee remuneration and share plans
|
736
|
|
—
|
|
(589
|
)
|
—
|
|
—
|
|
—
|
|
—
|
|
147
|
|
—
|
|
147
|
|
|
Shares issued in lieu of dividends and amounts arising thereon
|
—
|
|
—
|
|
3,162
|
|
—
|
|
—
|
|
—
|
|
—
|
|
3,162
|
|
—
|
|
3,162
|
|
|
Capital securities issued
|
—
|
|
3,580
|
|
—
|
|
—
|
|
—
|
|
—
|
|
—
|
|
3,580
|
|
—
|
|
3,580
|
|
|
Dividends to shareholders
|
—
|
|
—
|
|
(10,660
|
)
|
—
|
|
—
|
|
—
|
|
—
|
|
(10,660
|
)
|
(697
|
)
|
(11,357
|
)
|
|
Cost of share-based payment arrangements
|
—
|
|
—
|
|
757
|
|
—
|
|
—
|
|
—
|
|
—
|
|
757
|
|
—
|
|
757
|
|
|
Other movements
|
—
|
|
—
|
|
567
|
|
—
|
|
—
|
|
—
|
|
—
|
|
567
|
|
(463
|
)
|
104
|
|
|
At 31 Dec 2015
|
22,263
|
|
15,112
|
|
143,976
|
|
(189
|
)
|
34
|
|
(20,044
|
)
|
27,308
|
|
188,460
|
|
9,058
|
|
197,518
|
|
|
1
|
For further details refer to Note
31
. In February 2017, HSBC announced a share buy-back of up to
$1.0b
n. Subsequently, HSBC completed a
$1.0b
n share buy-back in April 2017. In July 2017, HSBC announced a further share buy-back of up to
$2.0b
n. Subsequently, HSBC completed a
$2.0b
n share buy-back in November 2017.
|
|
2
|
During 2017, HSBC Holdings issued
$3,000m
, SGD
1,000m
and
€1,250m
of perpetual subordinated contingent convertible capital securities, on which there were
$14m
of external issuance costs,
$37m
of intra-group issuance costs and
$10m
of tax benefits. In 2016, HSBC Holdings issued
$2,000m
of perpetual subordinated contingent convertible capital securities, after issuance costs of
$6m
and tax benefits of
$4m
. In 2015, HSBC Holdings issued
$2,450m
and
€1,000m
of perpetual subordinated contingent convertible capital securities, on which there were
$12m
of external issuance costs,
$25m
of intra-group issuance costs and
$19m
of tax. Under IFRSs these issuance costs and tax benefits are classified as equity.
|
|
3
|
At 31 December 2017, retained earnings included
360,590,019
treasury shares (2016:
353,356,251
; 2015:
81,580,180
).
In addition, treasury shares are also held within HSBC’s Insurance business retirement funds for the benefit of policyholders or beneficiaries within employee trusts for the settlement of shares expected to be delivered under employee share schemes or bonus plans, and the market-making activities in Markets.
|
|
4
|
Cumulative goodwill amounting to
$5,138m
has been charged against reserves in respect of acquisitions of subsidiaries prior to 1 January 1998, including
$3,469m
charged against the merger reserve arising on the acquisition of HSBC Bank plc. The balance of
$1,669m
has been charged against retained earnings.
|
|
5
|
At 1 January 2017, the cumulative changes in fair value attributable to changes in own credit risk of financial liabilities designated at fair value was a loss of
$1,672m
.
|
|
6
|
At 31 December 2015, our operations in Brazil were classified as held for sale. The cumulative amount of other reserves attributable to these operations were as follows: available-for-sale fair value reserve debit of
$176m
, cash flow hedging reserve credit of
$34m
and foreign exchange reserve debit of
$2.6b
n.
|
|
7
|
Statutory share premium relief under Section 131 of the Companies Act 1985 (the ‘Act’) was taken in respect of the acquisition of HSBC Bank plc in 1992, HSBC France in 2000 and HSBC Finance Corporation in 2003, and the shares issued were recorded at their nominal value only. In HSBC’s consolidated financial statements the fair value differences of
$8,290m
in respect of HSBC France and
$12,768m
in respect of HSBC Finance Corporation were recognised in the merger reserve. The merger reserve created on the acquisition of HSBC Finance Corporation subsequently became attached to HSBC Overseas Holdings (UK) Limited (‘HOHU’), following a number of intra-group reorganisations. During 2009, pursuant to Section 131 of the Companies Act 1985, statutory share premium relief was taken in respect of the rights issue and
$15,796m
was recognised in the merger reserve. The merger reserve includes a deduction of
$614m
in respect of costs relating to the rights issue, of which
$149m
was subsequently transferred to the income statement. Of this
$149m
,
$121m
was a loss arising from accounting for the agreement with the underwriters as a contingent forward contract. The merger reserve excludes the loss of
$344m
on a forward foreign exchange contract associated with hedging the proceeds of the rights issue.
|
|
8
|
An actuarial gain of
$1,730m
has arisen as a result of the remeasurement of the defined benefit pension obligation of the HSBC Bank (UK) Pension Scheme. Refer to Note
5
for
further detail. |
|
HSBC Holdings plc
|
217
|
Financial Statements
|
HSBC Holdings income statement
|
|||||||
|
for the year ended 31 December
|
|||||||
|
2017
|
|
2016
|
|
2015
|
|
||
|
Notes
|
$m
|
|
$m
|
|
$m
|
|
|
|
Net interest expense
|
(383
|
)
|
(424
|
)
|
(438
|
)
|
|
|
– interest income
|
2,185
|
|
1,380
|
|
866
|
|
|
|
– interest expense
|
(2,568
|
)
|
(1,804
|
)
|
(1,304
|
)
|
|
|
Fee (expense)/income
|
2
|
|
(1
|
)
|
39
|
|
|
|
Net trading income/(expense)
|
(392
|
)
|
119
|
|
(349
|
)
|
|
|
Net (expense)/income from financial instruments designated at fair value
|
2
|
314
|
|
(49
|
)
|
276
|
|
|
– changes in fair value of long term debt and related derivatives
|
103
|
|
(49
|
)
|
276
|
|
|
|
– net income from other financial instruments designated at fair value
|
211
|
|
—
|
|
—
|
|
|
|
Gains less losses from financial investments
|
154
|
|
—
|
|
—
|
|
|
|
Dividend income from subsidiaries
|
10,039
|
|
10,436
|
|
8,469
|
|
|
|
Other operating income
|
769
|
|
696
|
|
654
|
|
|
|
Total operating income
|
10,503
|
|
10,777
|
|
8,651
|
|
|
|
Employee compensation and benefits
|
5
|
(54
|
)
|
(570
|
)
|
(908
|
)
|
|
General and administrative expenses
|
(4,911
|
)
|
(4,014
|
)
|
(3,434
|
)
|
|
|
Impairment of subsidiaries
|
(63
|
)
|
—
|
|
(26
|
)
|
|
|
Total operating expenses
|
(5,028
|
)
|
(4,584
|
)
|
(4,368
|
)
|
|
|
Profit before tax
|
5,475
|
|
6,193
|
|
4,283
|
|
|
|
Tax credit
|
64
|
|
402
|
|
570
|
|
|
|
Profit for the year
|
5,539
|
|
6,595
|
|
4,853
|
|
|
|
HSBC Holdings statement of comprehensive income
|
||||||
|
for the year ended 31 December
|
||||||
|
2017
|
|
2016
|
|
2015
|
|
|
|
$m
|
|
$m
|
|
$m
|
|
|
|
Profit for the year
|
5,539
|
|
6,595
|
|
4,853
|
|
|
Other comprehensive income/(expense)
|
|
|
|
|
|
|
|
Items that will be reclassified subsequently to profit or loss when specific conditions are met:
|
|
|
|
|
|
|
|
Financial investments in HSBC undertakings
|
(53
|
)
|
(72
|
)
|
(57
|
)
|
|
– fair value gains/(losses)
|
(70
|
)
|
(83
|
)
|
(77
|
)
|
|
– income taxes
|
17
|
|
11
|
|
20
|
|
|
Items that will not be reclassified subsequently to profit or loss:
|
|
|
|
|
|
|
|
Changes in fair value of financial liabilities designated at fair value due to movement in own credit risk
|
(828
|
)
|
(896
|
)
|
—
|
|
|
– before income taxes
|
(1,007
|
)
|
(1,030
|
)
|
—
|
|
|
– income taxes
|
179
|
|
134
|
|
—
|
|
|
Other comprehensive income for the year, net of tax
|
(881
|
)
|
(968
|
)
|
(57
|
)
|
|
Total comprehensive income for the year
|
4,658
|
|
5,627
|
|
4,796
|
|
|
218
|
HSBC Holdings plc
|
|
HSBC Holdings balance sheet
|
|||||
|
at 31 December
|
|||||
|
2017
|
|
2016
|
|
||
|
Notes
|
$m
|
|
$m
|
|
|
|
Assets
|
|||||
|
Cash and balances with HSBC undertakings
|
1,985
|
|
247
|
|
|
|
Loans and advances to HSBC undertakings designated at fair value
|
11,944
|
|
—
|
|
|
|
Derivatives
|
14
|
2,388
|
|
2,148
|
|
|
Loans and advances to HSBC undertakings
|
76,627
|
|
77,421
|
|
|
|
Financial investments in HSBC undertakings
|
4,264
|
|
3,590
|
|
|
|
Prepayments, accrued income and other assets
|
369
|
|
503
|
|
|
|
Current tax assets
|
379
|
|
631
|
|
|
|
Investments in subsidiaries
|
18
|
92,930
|
|
95,850
|
|
|
Intangible assets
|
293
|
|
176
|
|
|
|
Deferred tax assets
|
555
|
|
232
|
|
|
|
Total assets at 31 Dec
|
191,734
|
|
180,798
|
|
|
|
Liabilities and equity
|
|||||
|
Liabilities
|
|||||
|
Amounts owed to HSBC undertakings
|
2,571
|
|
2,157
|
|
|
|
Financial liabilities designated at fair value
|
23
|
30,890
|
|
30,113
|
|
|
Derivatives
|
14
|
3,082
|
|
5,025
|
|
|
Debt securities in issue
|
24
|
34,258
|
|
21,805
|
|
|
Accruals, deferred income and other liabilities
|
1,269
|
|
1,651
|
|
|
|
Subordinated liabilities
|
27
|
15,877
|
|
15,189
|
|
|
Total liabilities
|
87,947
|
|
75,940
|
|
|
|
Equity
|
|||||
|
Called up share capital
|
31
|
10,160
|
|
10,096
|
|
|
Share premium account
|
10,177
|
|
12,619
|
|
|
|
Other equity instruments
|
22,107
|
|
17,004
|
|
|
|
Other reserves
|
37,440
|
|
37,483
|
|
|
|
Retained earnings
|
23,903
|
|
27,656
|
|
|
|
Total equity
|
103,787
|
|
104,858
|
|
|
|
Total liabilities and equity at 31 Dec
|
191,734
|
|
180,798
|
|
|
The accompanying notes on pages
222
to
297
and the audited sections in ‘Global businesses and regions’ on pages
64
to
82
, ‘Risk’ on pages
95
to
161
, ‘Capital’ on pages
162
to
165
and ‘Directors’ Remuneration Report’ on pages
186
to
202
form an integral part of these financial statements.
These financial statements were approved by the Board of Directors on 20 February 2018 and signed on its behalf by:
|
|
|
|
|
Mark E Tucker
|
Iain Mackay
|
|
|
Group Chairman
|
Group Finance Director
|
|
|
HSBC Holdings plc
|
219
|
Financial Statements
|
HSBC Holdings statement of cash flows
|
||||||
|
for the year ended 31 December
|
||||||
|
2017
|
|
2016
|
|
2015
|
|
|
|
(Restated)
1
|
|
(Restated)
1
|
|
|||
|
$m
|
|
$m
|
|
$m
|
|
|
|
Profit before tax
|
5,475
|
|
6,193
|
|
4,283
|
|
|
Adjustments for non-cash items:
|
(17
|
)
|
48
|
|
114
|
|
|
– depreciation, amortisation and impairment
|
33
|
|
10
|
|
30
|
|
|
– (credit)/charge for share-based payment
|
(2
|
)
|
34
|
|
86
|
|
|
– other non-cash items included in profit before tax
|
(48
|
)
|
4
|
|
(2
|
)
|
|
Changes in operating assets and liabilities
|
|
|
|
|
|
|
|
Change in loans to HSBC undertakings
|
(1,122
|
)
|
(36,437
|
)
|
1,247
|
|
|
Change in loans and advances to HSBC undertakings designated at fair value
|
(11,944
|
)
|
—
|
|
—
|
|
|
Change in financial investments in HSBC undertakings
|
(1,775
|
)
|
612
|
|
(289
|
)
|
|
Change in net trading securities and net derivatives
|
(2,183
|
)
|
3,066
|
|
1,413
|
|
|
Change in other assets
|
134
|
|
(239
|
)
|
(141
|
)
|
|
Change in debt securities in issue
2
|
1,020
|
|
(1,633
|
)
|
(49
|
)
|
|
Change in financial liabilities designated at fair value
|
954
|
|
(1,229
|
)
|
(1,228
|
)
|
|
Change in other liabilities
|
721
|
|
(693
|
)
|
(1,065
|
)
|
|
Tax received
|
443
|
|
646
|
|
470
|
|
|
Net cash from operating activities
|
(8,294
|
)
|
(29,666
|
)
|
4,755
|
|
|
Purchase of financial investments in HSBC undertakings
|
—
|
|
—
|
|
(276
|
)
|
|
Proceeds from the sale and maturity of financial investments in HSBC undertakings
|
1,165
|
|
610
|
|
—
|
|
|
Net cash outflow from acquisition of or increase in stake of subsidiaries
|
(89
|
)
|
(2,073
|
)
|
(2,118
|
)
|
|
Repayment of capital from subsidiaries
|
4,070
|
|
3,920
|
|
790
|
|
|
Net investment in intangible assets
|
(150
|
)
|
(109
|
)
|
(79
|
)
|
|
Net cash from investing activities
|
4,996
|
|
2,348
|
|
(1,683
|
)
|
|
Issue of ordinary share capital and other equity instruments
|
5,647
|
|
2,381
|
|
4,216
|
|
|
Purchase of treasury shares
|
—
|
|
(2,510
|
)
|
—
|
|
|
Cancellation of shares
|
(3,000
|
)
|
—
|
|
—
|
|
|
Subordinated loan capital issued
|
—
|
|
2,636
|
|
3,180
|
|
|
Subordinated loan capital repaid
|
(1,184
|
)
|
(1,781
|
)
|
(1,565
|
)
|
|
Debt securities issued
|
11,433
|
|
32,080
|
|
—
|
|
|
Debt securities repaid
|
—
|
|
—
|
|
—
|
|
|
Dividends paid on ordinary shares
|
(6,987
|
)
|
(7,059
|
)
|
(6,548
|
)
|
|
Dividends paid to holders of other equity instruments
|
(1,359
|
)
|
(1,180
|
)
|
(950
|
)
|
|
Net cash from financing activities
|
4,550
|
|
24,567
|
|
(1,667
|
)
|
|
Net increase/(decrease) in cash and cash equivalents
|
1,252
|
|
(2,751
|
)
|
1,405
|
|
|
Cash and cash equivalents at 1 January
|
3,697
|
|
6,448
|
|
5,043
|
|
|
Cash and cash equivalents at 31 Dec
1
|
4,949
|
|
3,697
|
|
6,448
|
|
|
Cash and cash equivalents comprise:
|
|
|
|
|
|
|
|
– Cash at bank with HSBC undertakings
|
1,985
|
|
247
|
|
242
|
|
|
– Loans and advances to banks of one month or less
|
2,964
|
|
3,450
|
|
6,206
|
|
Interest received was
$2,103m
(2016:
$1,329m
; 2015:
$792m
), interest paid was
$2,443m
(2016:
$1,791m
; 2015:
$1,289m
) and dividends received were
$10,039m
(2016:
$10,412m
; 2015:
$8,469m
).
|
1.
|
In 2017 cash and cash equivalents include loans and advances to HSBC undertakings of one month or less duration. The comparative figures have also been amended.
|
|
2.
|
Subordinated liabilities changes during the year
$0.7b
n (2016:
$0.7b
n) are wholly attributable to non-cash changes. During the year fair value losses amounted to
$0.7b
n (2016: gain
$0.7b
n).
|
|
220
|
HSBC Holdings plc
|
|
HSBC Holdings statement of changes in equity
|
||||||||||||||||
|
for the year ended 31 December
|
||||||||||||||||
|
Other reserves
|
||||||||||||||||
|
Called up
share
capital
|
|
Share
premium
|
|
Other
equity
instruments
|
|
Retained earnings
1
|
|
Available-for-sale fair value reserve
|
|
Other
paid-in
capital
2
|
|
Merger
and other
reserves
|
|
Total
share-
holders’
equity
|
|
|
|
$m
|
|
$m
|
|
$m
|
|
$m
|
|
$m
|
|
$m
|
|
$m
|
|
$m
|
|
|
|
At 1 Jan 2017
|
10,096
|
|
12,619
|
|
17,004
|
|
27,656
|
|
112
|
|
2,244
|
|
35,127
|
|
104,858
|
|
|
Profit for the year
|
—
|
|
—
|
|
—
|
|
5,539
|
|
—
|
|
—
|
|
—
|
|
5,539
|
|
|
Other comprehensive income (net of tax)
|
—
|
|
—
|
|
—
|
|
(828
|
)
|
(53
|
)
|
—
|
|
—
|
|
(881
|
)
|
|
– available-for-sale investments
|
—
|
|
—
|
|
—
|
|
—
|
|
(53
|
)
|
—
|
|
—
|
|
(53
|
)
|
|
– changes in fair value of financial liabilities designated at fair value due to movement in own credit risk
|
—
|
|
—
|
|
—
|
|
(828
|
)
|
—
|
|
—
|
|
—
|
|
(828
|
)
|
|
Total comprehensive income for the year
|
—
|
|
—
|
|
—
|
|
4,711
|
|
(53
|
)
|
—
|
|
—
|
|
4,658
|
|
|
Shares issued under employee share plans
|
38
|
|
584
|
|
—
|
|
(52
|
)
|
—
|
|
—
|
|
—
|
|
570
|
|
|
Shares issued in lieu of dividends and amounts arising thereon
|
190
|
|
(190
|
)
|
—
|
|
3,205
|
|
—
|
|
—
|
|
—
|
|
3,205
|
|
|
Cancellation of shares
|
(164
|
)
|
(2,836
|
)
|
—
|
|
—
|
|
—
|
|
—
|
|
—
|
|
(3,000
|
)
|
|
Capital securities issued
|
—
|
|
|
|
5,103
|
|
—
|
|
—
|
|
—
|
|
—
|
|
5,103
|
|
|
Dividends to shareholders
|
—
|
|
—
|
|
—
|
|
(11,551
|
)
|
—
|
|
—
|
|
—
|
|
(11,551
|
)
|
|
Cost of share-based payment arrangements
|
—
|
|
—
|
|
—
|
|
(2
|
)
|
—
|
|
—
|
|
—
|
|
(2
|
)
|
|
Other movements
|
—
|
|
—
|
|
—
|
|
(64
|
)
|
—
|
|
10
|
|
—
|
|
(54
|
)
|
|
At 31 Dec 2017
|
10,160
|
|
10,177
|
|
22,107
|
|
23,903
|
|
59
|
|
2,254
|
|
35,127
|
|
103,787
|
|
|
At 1 Jan 2016
|
9,842
|
|
12,421
|
|
15,020
|
|
32,224
|
|
183
|
|
2,597
|
|
35,127
|
|
107,414
|
|
|
Profit for the year
|
—
|
|
—
|
|
—
|
|
6,595
|
|
—
|
|
—
|
|
—
|
|
6,595
|
|
|
Other comprehensive income (net of tax)
|
—
|
|
—
|
|
—
|
|
(896
|
)
|
(72
|
)
|
—
|
|
—
|
|
(968
|
)
|
|
– available-for-sale investments
|
—
|
|
—
|
|
—
|
|
—
|
|
(72
|
)
|
—
|
|
—
|
|
(72
|
)
|
|
– changes in fair value of financial liabilities designated at fair value due to movement in own credit risk
|
—
|
|
—
|
|
—
|
|
(896
|
)
|
—
|
|
—
|
|
—
|
|
(896
|
)
|
|
Total comprehensive income for the year
|
—
|
|
—
|
|
—
|
|
5,699
|
|
(72
|
)
|
—
|
|
—
|
|
5,627
|
|
|
Shares issued under employee share plans
|
35
|
|
417
|
|
—
|
|
(51
|
)
|
—
|
|
—
|
|
—
|
|
401
|
|
|
Shares issued in lieu of dividends and amounts arising thereon
|
219
|
|
(219
|
)
|
—
|
|
3,040
|
|
—
|
|
—
|
|
—
|
|
3,040
|
|
|
Net increase in treasury shares
|
—
|
|
—
|
|
—
|
|
(2,510
|
)
|
—
|
|
—
|
|
—
|
|
(2,510
|
)
|
|
Capital securities issued
|
—
|
|
|
|
1,984
|
|
—
|
|
—
|
|
—
|
|
—
|
|
1,984
|
|
|
Dividends to shareholders
|
—
|
|
—
|
|
—
|
|
(11,279
|
)
|
—
|
|
—
|
|
—
|
|
(11,279
|
)
|
|
Cost of share-based payment arrangements
|
—
|
|
—
|
|
—
|
|
34
|
|
—
|
|
—
|
|
—
|
|
34
|
|
|
Other movements
|
—
|
|
—
|
|
—
|
|
499
|
|
1
|
|
(353
|
)
|
—
|
|
147
|
|
|
At 31 Dec 2016
|
10,096
|
|
12,619
|
|
17,004
|
|
27,656
|
|
112
|
|
2,244
|
|
35,127
|
|
104,858
|
|
|
At 1 Jan 2015
|
9,609
|
|
11,918
|
|
11,476
|
|
34,986
|
|
240
|
|
2,089
|
|
35,127
|
|
105,445
|
|
|
Profit for the year
|
—
|
|
—
|
|
—
|
|
4,853
|
|
—
|
|
—
|
|
—
|
|
4,853
|
|
|
Other comprehensive income (net of tax)
|
—
|
|
—
|
|
—
|
|
—
|
|
(57
|
)
|
—
|
|
—
|
|
(57
|
)
|
|
– available-for-sale investments
|
—
|
|
—
|
|
—
|
|
—
|
|
(57
|
)
|
—
|
|
—
|
|
(57
|
)
|
|
Total comprehensive income for the year
|
—
|
|
—
|
|
—
|
|
4,853
|
|
(57
|
)
|
—
|
|
—
|
|
4,796
|
|
|
Shares issued under employee share plans
|
45
|
|
691
|
|
—
|
|
(59
|
)
|
—
|
|
—
|
|
—
|
|
677
|
|
|
Shares issued in lieu of dividends and amounts arising thereon
|
188
|
|
(188
|
)
|
—
|
|
3,162
|
|
—
|
|
—
|
|
—
|
|
3,162
|
|
|
Capital securities issued
|
—
|
|
—
|
|
3,544
|
|
—
|
|
—
|
|
—
|
|
—
|
|
3,544
|
|
|
Dividends to shareholders
|
—
|
|
—
|
|
—
|
|
(10,660
|
)
|
—
|
|
—
|
|
—
|
|
(10,660
|
)
|
|
Cost of share-based payment arrangements
|
—
|
|
—
|
|
—
|
|
86
|
|
—
|
|
—
|
|
—
|
|
86
|
|
|
Other movements
|
—
|
|
—
|
|
—
|
|
(144
|
)
|
—
|
|
508
|
|
—
|
|
364
|
|
|
At 31 Dec 2015
|
9,842
|
|
12,421
|
|
15,020
|
|
32,224
|
|
183
|
|
2,597
|
|
35,127
|
|
107,414
|
|
Dividends per ordinary share at 31 December 2017 were
$0.51
(2016:
$0.51
; 2015:
$0.50
).
|
1
|
At 31 December 2017, retained earnings included
326,843,840
(
$2,542m
) of treasury shares (2016:
325,499,152
(
$2,499m
); 2015:
67,881
(
$1m
)). The increase principally reflects the share buy-back initiative, with the purchase of
328.2
m ordinary shares (
$3,000m
) all of which were cancelled during the year and used to reduce outstanding ordinary shares. In addition, treasury shares are held to fund employee share plans.
|
|
2
|
Other paid-in capital arises from the exercise and lapse of share options granted to employees of HSBC Holdings subsidiaries.
|
|
HSBC Holdings plc
|
221
|
Notes on the Financial Statements
|
1
|
Basis of preparation and significant accounting policies
|
|
1.1
|
Basis of preparation
|
|
(a)
|
Compliance with International Financial Reporting Standards
|
The consolidated financial statements of HSBC and the separate financial statements of HSBC Holdings have been prepared in accordance with IFRSs as issued by the IASB, including interpretations issued by the IFRS Interpretations Committee, and as endorsed by the European Union (‘EU’).
At 31 December 2017, there were no unendorsed standards effective for the year ended 31 December 2017 affecting these consolidated and separate financial statements, and HSBC’s application of IFRSs results in no differences between IFRSs as issued by the IASB and IFRSs as endorsed by the EU
.
Standards adopted during the year ended 31 December 2017
HSBC has adopted the requirements of IFRS 9 ‘Financial Instruments’ relating to the presentation of gains and losses on financial liabilities designated at fair value from 1 January 2017 in the consolidated financial statements. As a result, the effects of changes in those liabilities’ credit risk is presented in other comprehensive income with the remaining effect presented in profit or loss. As permitted by the transitional requirements of IFRS 9, comparatives have not been restated. Adoption increased profit after tax by
$2,024m
and basic and diluted earnings per share by
$0.10
with the opposite effect on other comprehensive income and no effect on net assets. These requirements were adopted in the separate financial statements of HSBC Holdings in 2016.
There were no other new standards applied in 2017.
However, during 2017, HSBC adopted a number of interpretations and amendments to standards which had an insignificant effect on the consolidated financial statements of HSBC and the separate financial statements of HSBC Holdings.
|
(b)
|
Differences between IFRSs and Hong Kong Financial Reporting Standards
|
There are no significant differences between IFRSs and Hong Kong Financial Reporting Standards in terms of their application to HSBC, and consequently there would be no significant differences had the financial statements been prepared in accordance with Hong Kong Financial Reporting Standards. The Notes on the Financial Statements, taken together with the Report of the Directors, include the aggregate of all disclosures necessary to satisfy IFRSs and Hong Kong reporting requirements.
|
(c)
|
Future accounting developments
|
Minor amendments to IFRSs
The IASB has published a number of minor amendments to IFRSs which are effective from 1 January 2018 and 2019, some of which have been endorsed for use in the EU. HSBC expects they will have an insignificant effect, when adopted, on the consolidated financial statements of HSBC and the separate financial statements of HSBC Holdings. HSBC has not early adopted any of the amendments effective after 31 December 2017, except the requirements of IFRS 9 ‘Financial Instruments’ relating to the presentation of gains and losses on financial liabilities designated at fair value which was adopted from 1 January 2017.
Major new IFRSs
The IASB has published IFRS 9 ‘Financial Instruments’, IFRS 15 ‘Revenue from Contracts with Customers’, IFRS 16 ‘Leases’ and IFRS 17 ‘Insurance contracts’. IFRS 9 , IFRS 15 and IFRS 16 have been endorsed for use in the EU and IFRS 17 has not yet been endorsed.
IFRS 9 ‘Financial Instruments’
In July 2014, the IASB issued IFRS 9 ‘Financial Instruments’, which is the comprehensive standard to replace IAS 39 ‘Financial Instruments: Recognition and Measurement’, and includes requirements for classification and measurement of financial assets and liabilities, impairment of financial assets and hedge accounting.
Classification and measurement
The classification and measurement of financial assets will depend on how these are managed (the entity’s business model) and their contractual cash flow characteristics. These factors determine whether the financial assets are measured at amortised cost, fair value through other comprehensive income (‘FVOCI’) or fair value through profit or loss (‘FVPL’). The combined effect of the application of the business model and the contractual cash flow characteristics tests may result in some differences in the population of financial assets measured at amortised cost or fair value compared with IAS 39. In addition, on transition to IFRS 9 entities are required to revoke previous designations of financial assets and financial liabilities measured at fair value through profit or loss where the accounting mismatch no longer exists and are permitted to revoke such designations where accounting mismatches continue to exist.
Impairment
The impairment requirements apply to financial assets measured at amortised cost and FVOCI, lease receivables, and certain loan commitments and financial guarantee contracts. At initial recognition, an impairment allowance (or provision in the case of commitments and guarantees) is required for expected credit losses (‘ECL’) resulting from default events that are possible within the next 12 months (’12-month ECL’). In the event of a significant increase in credit risk, an allowance (or provision) is required for ECL resulting from all possible default events over the expected life of the financial instrument (‘lifetime ECL’). Financial assets where 12-month ECL is recognised are in ‘stage 1’; financial assets that are considered to have experienced a significant increase in credit risk are in ‘stage 2’; and financial assets for which there is objective evidence of impairment, so are considered to be in default or otherwise credit impaired, are in ‘stage 3’.
The assessment of credit risk and the estimation of ECL are required to be unbiased and probability-weighted, and should incorporate all available information relevant to the assessment, including information about past events, current conditions and reasonable and supportable forecasts of economic conditions at the reporting date. In addition, the estimation of ECL should take into account the time value of money. As a result, the recognition and measurement of impairment is intended to be more forward-looking than under IAS 39, and the resulting impairment charge may be more volatile. IFRS 9 may also result in an increase in the total level of impairment allowances, since all financial assets will be assessed for at least 12-month ECL and the population of financial assets to which lifetime ECL applies is likely to be larger than the population for which there is objective evidence of impairment in accordance with IAS 39.
|
222
|
HSBC Holdings plc
|
Hedge accounting
The general hedge accounting requirements aim to simplify hedge accounting, creating a stronger link with risk management strategy and permitting hedge accounting to be applied to a greater variety of hedging instruments and risks. However, they do not explicitly address macro hedge accounting strategies, which are particularly important for banks. As a result, IFRS 9 includes an accounting policy choice to remain with IAS 39 hedge accounting.
Transitional impact
With the exception of the provisions relating to the presentation of gains and losses on financial liabilities designated at fair value, which were adopted from 1 January 2017, the requirements of IFRS 9 ‘Financial Instruments’ will be adopted from 1 January 2018. IFRS 9 includes an accounting policy choice to continue IAS 39 hedge accounting, which HSBC has exercised, although it will implement the revised hedge accounting disclosures required by the related amendments to IFRS 7 ‘Financial Instruments: Disclosures’. The classification and measurement and impairment requirements are applied retrospectively by adjusting the opening balance sheet at the date of initial application, with no requirement to restate comparative periods. HSBC does not intend to restate comparatives. For the consolidated financial statements of HSBC, adoption is expected to reduce net assets at 1 January 2018 by
$1.0b
n, with the classification and measurement changes increasing net assets by
$0.9b
n and impairment reducing net assets by
$2.2b
n, net of deferred tax of
$0.3b
n. As a consequence, common equity tier 1 capital is expected to increase by
$1.2b
n, applying regulatory transitional arrangements, and by
$0.2bn
on a fully loaded basis. For the separate financial statements of HSBC Holdings, adoption is expected to increase net assets at 1 January 2018 by
$0.9bn
, net of deferred tax, as a result of classification and measurement changes. These estimates are based on accounting policies, assumptions, judgements and estimation techniques that remain subject to change until the Group finalises its financial statements for the year ending 31 December 2018.
IFRS 15 ‘Revenue from Contracts with Customers’
In May 2014, the IASB issued IFRS 15 ‘Revenue from Contracts with Customers’ and it is effective for annual periods beginning on or after 1 January 2018. IFRS 15 provides a principles-based approach for revenue recognition, and introduces the concept of recognising revenue for performance obligations as they are satisfied. HSBC will adopt the standard on its mandatory effective date, and the standard will be applied on a retrospective basis, recognising the cumulative effect, if any, of initially applying the standard as an adjustment to the opening balance of retained earnings. HSBC has assessed the impact of IFRS 15 and expects that the standard will have no significant effect, when applied, on the consolidated financial statements of HSBC and the separate financial statements of HSBC Holdings.
IFRS 16 ‘Leases’
In January 2016, the IASB issued IFRS 16 ‘Leases’ with an effective date for annual periods beginning on or after 1 January 2019. IFRS 16 results in lessees accounting for most leases within the scope of the standard in a manner similar to the way in which finance leases are currently accounted for under IAS 17 ‘Leases’. Lessees will recognise a ‘right of use’ asset and a corresponding financial liability on the balance sheet. The asset will be amortised over the length of the lease, and the financial liability measured at amortised cost. Lessor accounting remains substantially the same as under IAS 17. HSBC is currently assessing the impact of IFRS 16, and it is not practicable to quantify the effect at the date of the publication of these financial statements. Existing operating lease commitments are set out in Note
33
.
IFRS 17 ‘Insurance contracts’
IFRS 17 ‘Insurance contracts’ was issued in May 2017, and sets out the requirements that an entity should apply in accounting for insurance contracts it issues and reinsurance contracts it holds. IFRS 17 is effective from 1 January 2021, and HSBC is considering its impact.
|
(d)
|
Foreign currencies
|
HSBC’s consolidated financial statements are presented in US dollars because the US dollar and currencies linked to it form the major currency bloc in which HSBC transacts and funds its business. The US dollar is also HSBC Holdings’ functional currency because the US dollar and currencies linked to it are the most significant currencies relevant to the underlying transactions, events and conditions of its subsidiaries, as well as representing a significant proportion of its funds generated from financing activities.
Transactions in foreign currencies are recorded at the rate of exchange on the date of the transaction. Assets and liabilities denominated in foreign currencies are translated at the rate of exchange at the balance sheet date except non-monetary assets and liabilities measured at historical cost which are translated using the rate of exchange at the initial transaction date. Exchange differences are included in other comprehensive income or in the income statement depending on where the gain or loss on the underlying item is recognised.
In the consolidated financial statements, the assets, liabilities and results of foreign operations whose functional currency is not US dollars are translated into the Group’s presentation currency at the reporting date. Exchange differences arising are recognised in other comprehensive income. On disposal of a foreign operation, exchange differences previously recognised in other comprehensive income are reclassified to the income statement.
|
(e)
|
Presentation of information
|
Certain disclosures required by IFRSs have been included in the audited sections of this
Annual Report and Accounts
as follows:
|
•
|
segmental disclosures are included in the ‘Report of the Directors: Financial Review’ on pages
32
to
85
;
|
|
•
|
disclosures concerning the nature and extent of risks relating to insurance contracts and financial instruments are included in the ‘Report of the Directors: Risk’ on pages
95
to
161
;
|
|
•
|
capital disclosures are included in the ‘Report of the Directors: Capital’ on pages
162
to
165
; and
|
|
•
|
disclosures relating to HSBC’s securitisation activities and structured products are included in the ‘Report of the Directors: Risk’ on pages
95
to
161
.
|
In accordance with its policy to provide disclosures that help investors and other stakeholders understand the Group’s performance, financial position and changes to them, the information provided in the Notes on the Financial Statements and the Report of the Directors goes beyond the minimum levels required by accounting standards, statutory and regulatory requirements and listing rules. In addition, HSBC follows the UK Finance Disclosure Code (‘the UKF Disclosure Code’). The UKF Disclosure Code aims to increase the quality and comparability of UK banks’ disclosures and sets out five disclosure principles together with supporting guidance agreed in 2010. In line with the principles of the UKF Disclosure Code, HSBC assesses good practice recommendations issued from time to time by relevant
|
HSBC Holdings plc
|
223
|
Notes on the Financial Statements
regulators and standard setters, and will assess the applicability and relevance of such guidance, enhancing disclosures where appropriate.
|
(f)
|
Critical accounting estimates and judgements
|
The preparation of financial information requires the use of estimates and judgements about future conditions. In view of the inherent uncertainties and the high level of subjectivity involved in the recognition or measurement of items highlighted as the critical accounting estimates and judgements in section 1.2 below, it is possible that the outcomes in the next financial year could differ from those on which management’s estimates are based. This could result in materially different estimates and judgements from those reached by management for the purposes of these financial statements. Management’s selection of HSBC’s accounting policies which contain critical estimates and judgements reflects the materiality of the items to which the policies are applied and the high degree of judgement and estimation uncertainty involved.
|
(g)
|
Segmental analysis
|
HSBC’s chief operating decision-maker is the Group Chief Executive, supported by the rest of the Group Management Board (‘GMB’), which operates as a general management committee under the direct authority of the Board. Operating segments are reported in a manner consistent with the internal reporting provided to the Group Chief Executive and the GMB.
Measurement of segmental assets, liabilities, income and expenses is in accordance with the Group’s accounting policies. Segmental income and expenses include transfers between segments, and these transfers are conducted at arm’s length. Shared costs are included in segments on the basis of the actual recharges made.
|
(h)
|
Going concern
|
The financial statements are prepared on a going concern basis, as the Directors are satisfied that the Group and parent company have the resources to continue in business for the foreseeable future. In making this assessment, the Directors have considered a wide range of information relating to present and future conditions, including future projections of profitability, cash flows and capital resources.
|
1.2
|
Summary of significant accounting policies
|
|
(a)
|
Consolidation and related policies
|
Investments in subsidiaries
Where an entity is governed by voting rights, HSBC consolidates when it holds, directly or indirectly, the necessary voting rights to pass resolutions by the governing body. In all other cases, the assessment of control is more complex and requires judgement of other factors, including having exposure to variability of returns, power to direct relevant activities and whether power is held as agent or principal.
Business combinations are accounted for using the acquisition method. The amount of non-controlling interest is measured either at fair value or at the non-controlling interest’s proportionate share of the acquiree’s identifiable net assets. This election is made for each business combination.
HSBC Holdings’ investments in subsidiaries are stated at cost less impairment losses.
Goodwill
Goodwill is allocated to cash-generating units (‘CGUs’) for the purpose of impairment testing, which is undertaken at the lowest level at which goodwill is monitored for internal management purposes. HSBC’s CGUs are based on geographical regions subdivided by global business, except for Global Banking and Markets, for which goodwill is monitored on a global basis.
Impairment testing is performed at least once a year, or whenever there is an indication of impairment, by comparing the recoverable amount of a CGU with its carrying amount.
Goodwill is included in a disposal group if the disposal group is a CGU to which goodwill has been allocated or it is an operation within such a CGU. The amount of goodwill included in a disposal group is measured on the basis of the relative values of the operation disposed of and the portion of the CGU retained.
Critical accounting estimates and judgements
|
The review of goodwill for impairment reflects management’s best estimate of the future cash flows of the CGUs and the rates used to discount these cash flows, both of which are subject to uncertain factors as follows:
•
The future cash flows of the CGUs are sensitive to the cash flows projected for the periods for which detailed forecasts are available and to assumptions regarding the long-term pattern of sustainable cash flows thereafter. Forecasts are compared with actual performance and verifiable economic data, but they reflect management’s view of future business prospects at the time of the assessment.
•
The rates used to discount future expected cash flows can have a significant effect on their valuation, and are based on the costs of capital assigned to individual CGUs. The cost of capital percentage is generally derived from a capital asset pricing model, which incorporates inputs reflecting a number of financial and economic variables, including the risk-free interest rate in the country concerned and a premium for the risk of the business being evaluated. These variables are subject to fluctuations in external market rates and economic conditions beyond management’s control. They are therefore subject to uncertainty and require the exercise of significant judgement.
The accuracy of forecast cash flows is subject to a high degree of uncertainty in volatile market conditions. In such circumstances, management retests goodwill for impairment more frequently than once a year when indicators of impairment exist. This ensures that the assumptions on which the cash flow forecasts are based continue to reflect current market conditions and management’s best estimate of future business prospects.
|
HSBC sponsored structured entities
HSBC is considered to sponsor another entity if, in addition to ongoing involvement with the entity, it had a key role in establishing that entity or in bringing together relevant counterparties so the transaction that is the purpose of the entity could occur. HSBC is generally not considered a sponsor if the only involvement with the entity is merely administrative.
Interests in associates and joint arrangements
Joint arrangements are investments in which HSBC, together with one or more parties, has joint control. Depending on HSBC’s rights and obligations, the joint arrangement is classified as either a joint operation or a joint venture. HSBC classifies investments in entities over which it has significant influence, and that are neither subsidiaries nor joint arrangements, as associates.
HSBC recognises its share of the assets, liabilities and results in a joint operation. Investments in associates and interests in joint ventures are recognised using the equity method. The attributable share of the results and reserves of joint ventures and associates are
|
224
|
HSBC Holdings plc
|
included in the consolidated financial statements of HSBC based on either financial statements made up to 31 December or pro-rated amounts adjusted for any material transactions or events occurring between the date the financial statements are available and
31 December.
31 December.
Investments in associates and joint ventures are assessed at each reporting date and tested for impairment when there is an indication that the investment may be impaired. Goodwill on acquisitions of interests in joint ventures and associates is not tested separately for impairment, but is assessed as part of the carrying amount of the investment.
Critical accounting estimates and judgements
|
Impairment testing of investments in associates involves significant judgement in determining the value in use, and in particular estimating the present values of cash flows expected to arise from continuing to hold the investment. The most significant judgements relate to the impairment testing of our investment in Bank of Communications Co., Limited (‘BoCom’). Key assumptions used in estimating BoCom’s value in use, the sensitivity of the value in use calculation to different assumptions and a sensitivity analysis that shows the changes in key assumptions that would reduce the excess of value in use over the carrying amount (the ‘headroom’) to nil are described in Note 17.
|
|
(b)
|
Income and expense
|
Operating income
Interest income and expense
Interest income and expense for all financial instruments, excluding those classified as held for trading or designated at fair value are recognised in ‘Interest income’ and ‘Interest expense’ in the income statement using the effective interest method. However, as an exception to this, interest on debt securities issued by HSBC that are designated under the fair value option and derivatives managed in conjunction with those debt securities are included in interest expense.
Interest on impaired financial assets is recognised using the rate of interest used to discount the future cash flows for the purpose of measuring the impairment loss.
Non-interest income and expense
Fee income is earned from a diverse range of services provided by HSBC to its customers. Fee income is accounted for as follows:
|
•
|
Income earned on the execution of a significant act is recognised as revenue when the act is completed (for example, fees arising from negotiating a transaction, such as the acquisition of shares, for a third party); and
|
|
•
|
Income earned from the provision of services is recognised as revenue as the services are provided (for example, asset management services).
|
Net trading income comprises all gains and losses from changes in the fair value of financial assets and financial liabilities held for trading, together with the related interest income, expense and dividends.
Dividend income is recognised when the right to receive payment is established. This is the ex-dividend date for listed equity securities, and usually the date when shareholders approve the dividend for unlisted equity securities.
‘Net income/(expense) from financial instruments designated at fair value’ includes all gains and losses from changes in the fair value of financial assets and liabilities designated at fair value through profit or loss, including derivatives that are managed in conjunction with those financial assets and liabilities, and liabilities under investment contracts. Interest income, interest expense and dividend income in respect of those financial instruments are also included, except for interest arising from debt securities issued by HSBC and derivatives managed in conjunction with those debt securities, which is recognised in ‘Interest expense’.
The accounting policies for insurance premium income are disclosed in Note
1.2(f)
.
|
(c)
|
Valuation of financial instruments
|
All financial instruments are initially recognised at fair value. Fair value is the price that would be received to sell an asset or paid to transfer a liability in an orderly transaction between market participants at the measurement date. The fair value of a financial instrument on initial recognition is generally its transaction price (that is, the fair value of the consideration given or received). However, if there is a difference between the transaction price and the fair value of financial instruments whose fair value is based on a quoted price in an active market or a valuation technique that uses only data from observable markets, HSBC recognises the difference as a trading gain or loss at inception (a ‘day 1 gain or loss’). In all other cases, the entire day 1 gain or loss is deferred and recognised in the income statement over the life of the transaction either until the transaction matures or is closed out, the valuation inputs become observable or HSBC enters into an offsetting transaction.
The fair value of financial instruments is generally measured on an individual basis. However, in cases where HSBC manages a group of financial assets and liabilities according to its net market or credit risk exposure, the fair value of the group of financial instruments is measured on a net basis but the underlying financial assets and liabilities are presented separately in the financial statements, unless they satisfy the IFRS offsetting criteria.
Critical accounting estimates and judgements
|
The majority of valuation techniques employ only observable market data. However, certain financial instruments are valued on the basis of valuation techniques that feature one or more significant market inputs that are unobservable, and for them the measurement of fair value is more judgemental. An instrument in its entirety is classified as valued using significant unobservable inputs if, in the opinion of management, a significant proportion of the instrument’s inception profit or greater than 5% of the instrument’s valuation is driven by unobservable inputs. ‘Unobservable’ in this context means that there is little or no current market data available from which to determine the price at which an arm’s length transaction would be likely to occur. It generally does not mean that there is no data available at all upon which to base a determination of fair value (consensus pricing data may, for example,
be used). |
|
(d)
|
Financial instruments measured at amortised cost
|
Loans and advances to banks and customers, held-to-maturity investments and most financial liabilities are measured at amortised cost. The carrying value of these financial assets at initial recognition includes any directly attributable transactions costs. If the initial fair value is lower than the cash amount advanced, such as in the case of some leveraged finance and syndicated lending activities, the difference is deferred and recognised over the life of the loan (as described in sub-section (c) above) through the recognition of interest income, unless the loan becomes impaired.
|
HSBC Holdings plc
|
225
|
Notes on the Financial Statements
HSBC may commit to underwriting loans on fixed contractual terms for specified periods of time. When the loan arising from the lending commitment is expected to be held for trading, the commitment to lend is recorded as a derivative. When HSBC intends to hold the loan, a provision on the loan commitment is only recorded where it is probable that HSBC will incur a loss.
Impairment of loans and advances
Losses for impaired loans are recognised when there is objective evidence that impairment of a loan or portfolio of loans has occurred. Losses which may arise from future events are not recognised.
Individually assessed loans and advances
The factors considered in determining whether a loan is individually significant for the purposes of assessing impairment include the size of the loan, the number of loans in the portfolio, the importance of the individual loan relationship and how this is managed. Loans that are determined to be individually significant will be individually assessed for impairment, except when volumes of defaults and losses are sufficient to justify treatment under a collective methodology.
Loans considered as individually significant are typically to corporate and commercial customers, are for larger amounts and are managed on an individual basis. For these loans, HSBC considers on a case-by-case basis at each balance sheet date whether there is any objective evidence that a loan is impaired.
The determination of the realisable value of security is based on the most recently updated market value at the time the impairment assessment is performed. The value is not adjusted for expected future changes in market prices, though adjustments are made to reflect local conditions such as forced sale discounts.
Impairment losses are calculated by discounting the expected future cash flows of a loan, which include expected future receipts of contractual interest, at the loan’s original effective interest rate or an approximation thereof, and comparing the resultant present value with the loan’s current carrying amount.
Collectively assessed loans and advances
Impairment is assessed collectively to cover losses which have been incurred but have not yet been identified on loans subject to individual assessment or for homogeneous groups of loans that are not considered individually significant, which are generally retail lending portfolios.
Incurred but not yet identified impairment
Individually assessed loans for which no evidence of impairment has been specifically identified on an individual basis are grouped together according to their credit risk characteristics for a collective impairment assessment. This assessment captures impairment losses that HSBC has incurred as a result of events occurring before the balance sheet date that HSBC is not able to identify on an individual loan basis, and that can be reliably estimated. When information becomes available that identifies losses on individual loans within a group, those loans are removed from the group and assessed individually.
Homogeneous groups of loans and advances
Statistical methods are used to determine collective impairment losses for homogeneous groups of loans not considered individually significant. The methods used to calculate collective allowances are set out below:
|
•
|
When appropriate empirical information is available, HSBC utilises roll-rate methodology, which employs statistical analyses of historical data and experience of delinquency and default to reliably estimate the amount of the loans that will eventually be written off as a result of events occurring before the balance sheet date. Individual loans are grouped using ranges of past due days, and statistical estimates are made of the likelihood that loans in each range will progress through the various stages of delinquency and become irrecoverable. Additionally, individual loans are segmented based on their credit characteristics, such as industry sector, loan grade or product. In applying this methodology, adjustments are made to estimate the periods of time between a loss event occurring, for example because of a missed payment, and its confirmation through write-off (known as the loss identification period). Current economic conditions are also evaluated when calculating the appropriate level of allowance required to cover inherent loss. In certain highly developed markets, models also take into account behavioural and account management trends as revealed in, for example, bankruptcy and rescheduling statistics.
|
|
•
|
When the portfolio size is small or when information is insufficient or not reliable enough to adopt a roll-rate methodology, HSBC adopts a basic formulaic approach based on historical loss rate experience, or a discounted cash flow model. Where a basic formulaic approach is undertaken, the period between a loss event occurring and its identification is estimated by local management, and is typically between six and 12 months.
|
Write-off of loans and advances
Loans and the related impairment allowance accounts are normally written off, either partially or in full, when there is no realistic prospect of recovery. Where loans are secured, this is generally after receipt of any proceeds from the realisation of security. In circumstances where the net realisable value of any collateral has been determined and there is no reasonable expectation of further recovery, write-off may be earlier.
Reversals of impairment
If the amount of an impairment loss decreases in a subsequent period, and the decrease can be related objectively to an event occurring after the impairment was recognised, the excess is written back by reducing the loan impairment allowance account accordingly. The write-back is recognised in the income statement.
Assets acquired in exchange for loans
When non-financial assets acquired in exchange for loans as part of an orderly realisation are held for sale, these assets are recorded as ‘Assets held for sale.’
Renegotiated loans
Loans subject to collective impairment assessment whose terms have been renegotiated are no longer considered past due, but are treated as up-to-date loans for measurement purposes once a minimum number of required payments has been received. Where collectively assessed loan portfolios include significant levels of renegotiated loans, these loans are segregated from other parts of the loan portfolio for the purposes of collective impairment assessment to reflect their risk profile. Loans subject to individual impairment
|
226
|
HSBC Holdings plc
|
assessment, whose terms have been renegotiated, are subject to ongoing review to determine whether they remain impaired. The carrying amounts of loans that have been classified as renegotiated retain this classification until maturity or derecognition.
A loan that is renegotiated is derecognised if the existing agreement is cancelled and a new agreement made on substantially different terms or if the terms of an existing agreement are modified such that the renegotiated loan is substantially a different financial instrument. Any new loans that arise following derecognition events will continue to be disclosed as renegotiated loans and are assessed for impairment as above.
Critical accounting estimates and judgements
|
Loan impairment allowances represent management’s best estimate of losses incurred in the loan portfolios at the balance sheet date. Management is required to exercise judgement in making assumptions and estimates when calculating loan impairment allowances on both individually and collectively assessed loans and advances.
Collective impairment allowances are subject to estimation uncertainty, in part because it is not practicable to identify losses on an individual loan basis due to the large number of individually insignificant loans in the portfolio. The estimation methods include the use of statistical analyses of historical information, supplemented with significant management judgement, to assess whether current economic and credit conditions are such that the actual level of incurred losses is likely to be greater or less than historical experience. Where changes in economic, regulatory or behavioural conditions result in the most recent trends in portfolio risk factors being not fully reflected in the statistical models, risk factors are taken into account by adjusting the impairment allowances derived solely from historical loss experience.
Risk factors include loan portfolio growth, product mix, unemployment rates, bankruptcy trends, geographical concentrations, loan product features, economic conditions such as national and local trends in housing markets, the level of interest rates, portfolio seasoning, account management policies and practices, changes in laws and regulations, and other influences on customer payment patterns. Different factors are applied in different regions and countries to reflect local economic conditions, laws and regulations. The methodology and the assumptions used in calculating impairment losses are reviewed regularly in the light of differences between loss estimates and actual loss experience. For example, roll rates, loss rates and the expected timing of future recoveries are regularly benchmarked against actual outcomes to ensure they remain appropriate.
For individually assessed loans, judgement is required in determining whether there is objective evidence that a loss event has occurred and, if so, the measurement of the impairment allowance. In determining whether there is objective evidence that a loss event has occurred, judgement is exercised in evaluating all relevant information on indicators of impairment, including the consideration of whether payments are contractually past due and the consideration of other factors indicating deterioration in the financial condition and outlook of borrowers, affecting their ability to pay.
A higher level of judgement is required for loans to borrowers showing signs of financial difficulty in market sectors experiencing economic stress, particularly where the likelihood of repayment is affected by the prospects for refinancing or the sale of a specified asset. For those loans where objective evidence of impairment exists, management determines the size of the allowance required based on a range of factors such as the realisable value of security, the likely dividend available on liquidation or bankruptcy, the viability of the customer’s business model and the capacity to trade successfully out of financial difficulties and generate sufficient cash flow to service debt obligations.
HSBC might provide loan forbearance to borrowers experiencing financial difficulties by agreeing to modify the contractual payment terms of loans in order to improve the management of customer relationships, maximise collection opportunities or avoid default or repossession. Where forbearance activities are significant, higher levels of judgement and estimation uncertainty are involved in determining their effects on loan impairment allowances. Judgements are involved in differentiating the credit risk characteristics of forbearance cases, including those which return to performing status following renegotiation. Where collectively assessed loan portfolios include significant levels of loan forbearance, portfolios are segmented to reflect the different credit risk characteristics of forbearance cases, and estimates are made of the incurred losses inherent within each forbearance portfolio segment.
The exercise of judgement requires the use of assumptions which are highly subjective and very sensitive to the risk factors, in particular to changes in economic and credit conditions across a large number of geographical areas. Many of the factors have a high degree of interdependency and there is no single factor to which our loan impairment allowances as a whole are sensitive.
|
Non-trading reverse repurchase, repurchase and similar agreements
When debt securities are sold subject to a commitment to repurchase them at a predetermined price (‘repos’), they remain on the balance sheet and a liability is recorded in respect of the consideration received. Securities purchased under commitments to resell (‘reverse repos’) are not recognised on the balance sheet and an asset is recorded in respect of the initial consideration paid. Non-trading repos and reverse repos are measured at amortised cost. The difference between the sale and repurchase price or between the purchase and resale price is treated as interest and recognised in net interest income over the life of the agreement.
Contracts that are economically equivalent to reverse repurchase or repurchase agreements (such as sales or purchases of debt securities entered into together with total return swaps with the same counterparty) are accounted for similarly to, and presented together with, reverse repurchase or repurchase agreements.
|
(e)
|
Financial instruments measured at fair value
|
Available-for-sale financial assets
Available-for-sale financial assets are recognised on the trade date when HSBC enters into contractual arrangements to purchase them, and are normally derecognised when they are either sold or redeemed. They are subsequently remeasured at fair value, and changes therein are recognised in other comprehensive income until the assets are either sold or become impaired. Upon disposal, the cumulative gains or losses in other comprehensive income are recognised in the income statement as ‘Gains less losses from financial investments’.
Impairment of available-for-sale financial assets
Available-for-sale financial assets are assessed at each balance sheet date for objective evidence of impairment. Impairment losses are recognised in the income statement within ‘Loan impairment charges and other credit risk provisions’ for debt instruments and within ‘Gains less losses from financial investments’ for equities.
Available-for-sale debt securities
In assessing objective evidence of impairment at the reporting date, HSBC considers all available evidence, including observable data or information about events specifically relating to the securities which may result in a shortfall in the recovery of future cash flows. A subsequent decline in the fair value of the instrument is recognised in the income statement when there is objective evidence of impairment as a result of decreases in the estimated future cash flows. Where there is no further objective evidence of impairment, the decline in the fair value of the financial asset is recognised in other comprehensive income. If the fair value of a debt security increases in a subsequent period, and the increase can be objectively related to an event occurring after the impairment loss was recognised in the income statement, or the instrument is no longer impaired, the impairment loss is reversed through the income statement.
Available-for-sale equity securities
A significant or prolonged decline in the fair value of the equity below its cost is objective evidence of impairment. In assessing whether it is significant, the decline in fair value is evaluated against the original cost of the asset at initial recognition. In assessing whether it is
|
HSBC Holdings plc
|
227
|
Notes on the Financial Statements
prolonged, the decline is evaluated against the continuous period in which the fair value of the asset has been below its original cost at initial recognition.
All subsequent increases in the fair value of the instrument are treated as a revaluation and are recognised in other comprehensive income. Subsequent decreases in the fair value of the available-for-sale equity security are recognised in the income statement to the extent that further cumulative impairment losses have been incurred. Impairment losses recognised on the equity security are not reversed through the income statement.
Financial instruments designated at fair value
Financial instruments, other than those held for trading, are classified in this category if they meet one or more of the criteria set out below, and are so designated irrevocably at inception:
|
•
|
the use of the designation removes or significantly reduces an accounting mismatch;
|
|
•
|
when a group of financial assets, liabilities or both is managed and its performance is evaluated on a fair value basis, in accordance with a documented risk management or investment strategy; and
|
|
•
|
where financial instruments contain one or more non-closely related embedded derivatives.
|
Designated financial assets are recognised when HSBC enters into contracts with counterparties, which is generally on trade date, and are normally derecognised when the rights to the cash flows expire or are transferred. Designated financial liabilities are recognised when HSBC enters into contracts with counterparties, which is generally on settlement date, and are normally derecognised when extinguished. Subsequent changes in fair values are recognised in the income statement in ‘Net income/(expense) from financial instruments designated at fair value’.
Under this criterion, the main classes of financial instruments designated by HSBC are:
Long-term debt issues
The interest and/or foreign exchange exposure on certain fixed rate debt securities issued has been matched with the interest and/or foreign exchange exposure on certain swaps as part of a documented risk management strategy.
Financial assets and financial liabilities under unit-linked and non-linked investment contracts
A contract under which HSBC does not accept significant insurance risk from another party is not classified as an insurance contract, other than investment contracts with discretionary participation features (‘DPF’), but is accounted for as a financial liability. See Note
1.2(f)
for investment contracts with DPF and contracts where HSBC accepts significant insurance risk. Customer liabilities under linked and certain non-linked investment contracts issued by insurance subsidiaries and the corresponding financial assets are designated at fair value. Liabilities are at least equivalent to the surrender or transfer value which is calculated by reference to the value of the relevant underlying funds or indices. Premiums receivable and amounts withdrawn are accounted for as increases or decreases in the liability recorded in respect of investment contracts. The incremental costs directly related to the acquisition of new investment contracts or renewing existing investment contracts are deferred and amortised over the period during which the investment management services are provided.
Derivatives
Derivatives are financial instruments that derive their value from the price of underlying items such as equities, interest rates or other indices. Derivatives are recognised initially and are subsequently measured at fair value, with changes in fair value generally recorded in the income statement. Derivatives are classified as assets when their fair value is positive or as liabilities when their fair value is negative; this includes embedded derivatives which are bifurcated from the host contract when they meet the definition of a derivative on a stand-alone basis and are required by IFRSs to be accounted for separately from the host contract.
Gains and losses from changes in the fair value of derivatives that do not qualify for hedge accounting are reported in ‘Net trading income’. Gains and losses on derivatives managed in conjunction with financial instruments designated at fair value are reported in ‘Net income from financial instruments designated at fair value’ together with the gains and losses on the economically hedged items. Where the derivatives are managed with debt securities issued by HSBC that are designated at fair value, the contractual interest is shown in ‘Interest expense’ together with the interest payable on the issued debt.
Hedge accounting
When derivatives are not part of fair value designated relationships, if held for risk management purposes they are designated in hedge accounting relationships where the required criteria for documentation and hedge effectiveness are met. HSBC uses these derivatives or, where allowed, other non-derivative hedging instruments in fair value hedges, cash flow hedges or hedges of net investments in foreign operations as appropriate to the risk being hedged.
Fair value hedge
Fair value hedge accounting does not change the recording of gains and losses on derivatives and other hedging instruments, but results in recognising changes in the fair value of the hedged assets or liabilities attributable to the hedged risk that would not otherwise be recognised in the income statement. If a hedge relationship no longer meets the criteria for hedge accounting, hedge accounting is discontinued; the cumulative adjustment to the carrying amount of the hedged item is amortised to the income statement on a recalculated effective interest rate, unless the hedged item has been derecognised, in which case it is recognised in the income statement immediately.
Cash flow hedge
The effective portion of gains and losses on hedging instruments is recognised in other comprehensive income; the ineffective portion
of the change in fair value of derivative hedging instruments that are part of a cash flow hedge relationship is recognised immediately
in the income statement within ‘Net trading income’. The accumulated gains and losses recognised in other comprehensive income
are reclassified to the income statement in the same periods in which the hedged item affects profit or loss. In hedges of forecast transactions that result in recognition of a non-financial asset or liability, previous gains and losses recognised in other comprehensive income are included in the initial measurement of the asset or liability. When a hedge relationship is discontinued, or partially discontinued, any cumulative gain or loss recognised in other comprehensive income remains in equity until the forecast transaction is recognised in the income statement. When a forecast transaction is no longer expected to occur, the cumulative gain or loss previously recognised in other comprehensive income is immediately reclassified to the income statement.
|
228
|
HSBC Holdings plc
|
Net investment hedge
Hedges of net investments in foreign operations are accounted for in a similar way to cash flow hedges. The effective portion of gains and losses on the hedging instrument is recognised in other comprehensive income; other gains and losses are recognised immediately in the income statement. Gains and losses previously recognised in other comprehensive income are reclassified to the income statement on the disposal, or part disposal, of the foreign operation.
Derivatives that do not qualify for hedge accounting
Non-qualifying hedges are derivatives entered into as economic hedges of assets and liabilities for which hedge accounting was not applied.
|
(f)
|
Insurance contracts
|
A contract is classified as an insurance contract where HSBC accepts significant insurance risk from another party by agreeing to compensate that party on the occurrence of a specified uncertain future event. An insurance contract may also transfer financial risk, but is accounted for as an insurance contract if the insurance risk is significant. In addition, HSBC issues investment contracts with DPF which are also accounted for as insurance contracts as required by IFRS 4 ‘Insurance Contracts’.
Net insurance premium income
Premiums for life insurance contracts are accounted for when receivable, except in unit-linked insurance contracts where premiums are accounted for when liabilities are established.
Reinsurance premiums are accounted for in the same accounting period as the premiums for the direct insurance contracts to which they relate.
Net insurance claims and benefits paid and movements in liabilities to policyholders
Gross insurance claims for life insurance contracts reflect the total cost of claims arising during the year, including claim handling costs and any policyholder bonuses allocated in anticipation of a bonus declaration.
Maturity claims are recognised when due for payment. Surrenders are recognised when paid or at an earlier date on which, following notification, the policy ceases to be included within the calculation of the related insurance liabilities. Death claims are recognised when notified.
Reinsurance recoveries are accounted for in the same period as the related claim.
Liabilities under insurance contracts
Liabilities under non-linked life insurance contracts are calculated by each life insurance operation based on local actuarial principles. Liabilities under unit-linked life insurance contracts are at least equivalent to the surrender or transfer value, which is calculated by reference to the value of the relevant underlying funds or indices.
Future profit participation on insurance contracts with DPF
Where contracts provide discretionary profit participation benefits to policyholders, liabilities for these contracts include provisions for the future discretionary benefits to policyholders. These provisions reflect the actual performance of the investment portfolio to date and management’s expectation of the future performance of the assets backing the contracts, as well as other experience factors such as mortality, lapses and operational efficiency, where appropriate. The benefits to policyholders may be determined by the contractual terms, regulation, or past distribution policy.
Investment contracts with DPF
While investment contracts with DPF are financial instruments, they continue to be treated as insurance contracts as required by IFRS 4. The Group therefore recognises the premiums for these contracts as revenue and recognises as an expense the resulting increase in the carrying amount of the liability.
In the case of net unrealised investment gains on these contracts, whose discretionary benefits principally reflect the actual performance of the investment portfolio, the corresponding increase in the liabilities is recognised in either the income statement or other comprehensive income, following the treatment of the unrealised gains on the relevant assets. In the case of net unrealised losses, a deferred participating asset is recognised only to the extent that its recoverability is highly probable. Movements in the liabilities arising from realised gains and losses on relevant assets are recognised in the income statement.
Present value of in-force long-term insurance business
HSBC recognises the value placed on insurance contracts and investment contracts with DPF, which are classified as long-term and in-force at the balance sheet date, as an asset. The asset represents the present value of the equity holders’ interest in the issuing insurance companies’ profits expected to emerge from these contracts written at the balance sheet date. The present value of in-force business (‘PVIF’) is determined by discounting those expected future profits using appropriate assumptions in assessing factors such as future mortality, lapse rates and levels of expenses, and a risk discount rate that reflects the risk premium attributable to the respective contracts. The PVIF incorporates allowances for both non-market risk and the value of financial options and guarantees. The PVIF asset is presented gross of attributable tax in the balance sheet and movements in the PVIF asset are included in ‘Other operating income’ on a gross of tax basis.
|
(g)
|
Employee compensation and benefits
|
Share-based payments
HSBC enters into both equity-settled and cash-settled share-based payment arrangements with its employees as compensation for services provided by employees.
The vesting period for these schemes may commence before the grant date if the employees have started to render services in respect of the award before the grant date. Expenses are recognised when the employee starts to render service to which the award relates.
Cancellations result from the failure to meet a non-vesting condition during the vesting period, and are treated as an acceleration of vesting recognised immediately in the income statement. Failure to meet a vesting condition by the employee is not treated as a cancellation, and the amount of expense recognised for the award is adjusted to reflect the number of awards expected to vest.
|
HSBC Holdings plc
|
229
|
Notes on the Financial Statements
Post-employment benefit plans
HSBC operates a number of pension schemes including defined benefit and defined contribution, and post-employment benefit schemes.
Payments to defined contribution schemes are charged as an expense as the employees render service.
Defined benefit pension obligations are calculated using the projected unit credit method. The net charge to the income statement mainly comprises the service cost and the net interest on the net defined benefit asset or liability, and is presented in operating expenses.
Remeasurements of the net defined benefit asset or liability, which comprise actuarial gains and losses, return on plan assets excluding interest and the effect of the asset ceiling (if any, excluding interest), are recognised immediately in other comprehensive income. The net defined benefit asset or liability represents the present value of defined benefit obligations reduced by the fair value of plan assets, after applying the asset ceiling test, where the net defined benefit surplus is limited to the present value of available refunds and reductions in future contributions to the plan.
The cost of obligations arising from other post-employment plans are accounted for on the same basis as defined benefit pension plans.
|
(h)
|
Tax
|
Income tax comprises current tax and deferred tax. Income tax is recognised in the income statement except to the extent that it relates to items recognised in other comprehensive income or directly in equity, in which case the tax is recognised in the same statement as the related item appears.
Current tax is the tax expected to be payable on the taxable profit for the year and on any adjustment to tax payable in respect of previous years. HSBC provides for potential current tax liabilities that may arise on the basis of the amounts expected to be paid to the tax authorities.
Payments associated with any incremental Base Erosion and Anti-Abuse Tax are reflected in tax expense in the period incurred.
Deferred tax is recognised on temporary differences between the carrying amounts of assets and liabilities in the balance sheet, and the amounts attributed to such assets and liabilities for tax purposes. Deferred tax is calculated using the tax rates expected to apply in the periods in which the assets will be realised or the liabilities settled.
Current and deferred tax are calculated based on tax rates and laws enacted, or substantively enacted, by the balance sheet date.
Critical accounting estimates and judgements
|
The recognition of a deferred tax asset relies on an assessment of the probability and sufficiency of future taxable profits, future reversals of existing taxable temporary differences and ongoing tax planning strategies. In the absence of a history of taxable profits, the most significant judgements relate to expected future profitability and to the applicability of tax planning strategies, including corporate reorganisations.
|
|
(i)
|
Provisions, contingent liabilities and guarantees
|
Provisions
Provisions are recognised when it is probable that an outflow of economic benefits will be required to settle a present legal or constructive obligation that has arisen as a result of past events and for which a reliable estimate can be made.
Critical accounting estimates and judgements
|
Judgement is involved in determining whether a present obligation exists and in estimating the probability, timing and amount of any outflows. Professional expert advice is taken on the assessment of litigation, property (including onerous contracts) and similar obligations. Provisions for legal proceedings and regulatory matters typically require a higher degree of judgement than other types of provisions. When matters are at an early stage, accounting judgements can be difficult because of the high degree of uncertainty associated with determining whether a present obligation exists, and estimating the probability and amount of any outflows that may arise. As matters progress, management and legal advisers evaluate on an ongoing basis whether provisions should be recognised, revising previous judgements and estimates as appropriate. At more advanced stages, it is typically easier to make judgements and estimates around a better defined set of possible outcomes. However, the amount provisioned can remain very sensitive to the assumptions used. There could be a wide range of possible outcomes for any pending legal proceedings, investigations or inquiries. As a result, it is often not practicable to quantify a range of possible outcomes for individual matters. It is also not practicable to meaningfully quantify ranges of potential outcomes in aggregate for these types of provisions because of the diverse nature and circumstances of such matters and the wide range of uncertainties involved. Provisions for customer remediation also require significant levels of estimation and judgement. The amounts of provisions recognised depend on a number of different assumptions, such as the volume of inbound complaints, the projected period of inbound complaint volumes, the decay rate of complaint volumes, the population identified as systemically mis-sold and the number of policies per customer complaint.
|
Contingent liabilities, contractual commitments and guarantees
Contingent liabilities
Contingent liabilities, which include certain guarantees and letters of credit pledged as collateral security, and contingent liabilities related to legal proceedings or regulatory matters, are not recognised in the financial statements but are disclosed unless the probability of settlement is remote.
Financial guarantee contracts
Liabilities under financial guarantee contracts which are not classified as insurance contracts are recorded initially at their fair value, which is generally the fee received or present value of the fee receivable.
HSBC Holdings has issued financial guarantees and similar contracts to other Group entities. HSBC elects to account for certain guarantees as insurance contracts in HSBC Holdings’ financial statements, in which case they are measured and recognised as insurance liabilities. This election is made on a contract-by-contract basis, and is irrevocable.
|
230
|
HSBC Holdings plc
|
|
2
|
Net income/(expense) from financial instruments designated at fair value
|
|
2017
|
|
2016
|
|
2015
|
|
||
|
Footnote
|
$m
|
|
$m
|
|
$m
|
|
|
|
Net income/(expense) arising on:
|
|||||||
|
Financial assets
|
|||||||
|
Financial assets held to meet liabilities under insurance and investment contracts
|
3,211
|
|
1,480
|
|
531
|
|
|
|
Other financial assets designated at fair value
|
198
|
|
90
|
|
89
|
|
|
|
Derivatives managed with other financial assets designated at fair value
|
(9
|
)
|
(43
|
)
|
13
|
|
|
|
3,400
|
|
1,527
|
|
633
|
|
||
|
Financial liabilities
|
|
|
|||||
|
Liabilities to customers under investment contracts
|
(375
|
)
|
(218
|
)
|
34
|
|
|
|
HSBC’s long-term debt issued and related derivatives
|
672
|
|
(3,975
|
)
|
863
|
|
|
|
– changes in own credit spread on long-term debt
|
1
|
—
|
|
(1,792
|
)
|
1,002
|
|
|
– derivatives managed in conjunction with HSBC’s issued debt securities
|
(273
|
)
|
(1,367
|
)
|
(1,997
|
)
|
|
|
– other changes in fair value
|
945
|
|
(816
|
)
|
1,858
|
|
|
|
Other financial liabilities designated at fair value
|
1
|
|
(6
|
)
|
3
|
|
|
|
Derivatives managed with other financial liabilities designated at fair value
|
—
|
|
6
|
|
(1
|
)
|
|
|
298
|
|
(4,193
|
)
|
899
|
|
||
|
Year ended 31 Dec
|
3,698
|
|
(2,666
|
)
|
1,532
|
|
|
|
1
|
From 1 January 2017, HSBC Holdings plc adopted, in its consolidated financial statements, the requirements of IFRS 9 ‘Financial Instruments’ relating to the presentation of gains and losses on financial liabilities designated at fair value. As a result, changes in fair value attributable to changes in own credit risk are presented in other comprehensive income with the remaining effect presented in profit or loss.
|
HSBC Holdings
|
Net income/(expense) arising on HSBC Holdings’ long-term debt issued and related derivatives
|
|||||||
|
2017
|
|
2016
|
|
2015
|
|
||
|
Footnote
|
$m
|
|
$m
|
|
$m
|
|
|
|
Net income/(expense) arising on:
|
|||||||
|
Financial assets:
|
211
|
|
—
|
|
—
|
|
|
|
– other financial assets designated at fair value
|
161
|
|
—
|
|
—
|
|
|
|
– derivatives managed with other financial assets designated at fair value
|
50
|
|
—
|
|
—
|
|
|
|
Financial liabilities
|
103
|
|
(49
|
)
|
276
|
|
|
|
– changes in own credit spread on long-term debt
|
1
|
—
|
|
—
|
|
348
|
|
|
– derivatives managed in conjunction with HSBC Holdings issued debt securities
|
292
|
|
(642
|
)
|
(927
|
)
|
|
|
– other changes in fair value
|
(189
|
)
|
593
|
|
855
|
|
|
|
Year ended 31 Dec
|
314
|
|
(49
|
)
|
276
|
|
|
|
1
|
From 1 January 2016, HSBC Holdings plc adopted, in its separate financial statements, the requirements of IFRS 9 ‘Financial Instruments’ relating to the presentation of gains and losses on financial liabilities designated at fair value. As a result, changes in fair value attributable to changes in own credit risk are presented in other comprehensive income with the remaining effect presented in profit or loss.
|
|
3
|
Insurance business
|
|
Net insurance premium income
|
||||||||
|
Non-linked
insurance
|
|
Linked life
insurance
|
|
Investment contracts
with DPF
1
|
|
Total
|
|
|
|
$m
|
|
$m
|
|
$m
|
|
$m
|
|
|
|
Gross insurance premium income
|
8,424
|
|
351
|
|
2,027
|
|
10,802
|
|
|
Reinsurers’ share of gross insurance premium income
|
(1,016
|
)
|
(7
|
)
|
—
|
|
(1,023
|
)
|
|
Year ended 31 Dec 2017
|
7,408
|
|
344
|
|
2,027
|
|
9,779
|
|
|
Gross insurance premium income
|
8,036
|
|
675
|
|
1,877
|
|
10,588
|
|
|
Reinsurers’ share of gross insurance premium income
|
(629
|
)
|
(8
|
)
|
—
|
|
(637
|
)
|
|
Year ended 31 Dec 2016
|
7,407
|
|
667
|
|
1,877
|
|
9,951
|
|
|
Gross insurance premium income
|
7,506
|
|
1,409
|
|
2,097
|
|
11,012
|
|
|
Reinsurers’ share of gross insurance premium income
|
(648
|
)
|
(9
|
)
|
—
|
|
(657
|
)
|
|
Year ended 31 Dec 2015
|
6,858
|
|
1,400
|
|
2,097
|
|
10,355
|
|
|
1
|
Discretionary participation features.
|
|
HSBC Holdings plc
|
231
|
Notes on the Financial Statements
|
Net insurance claims and benefits paid and movement in liabilities to policyholders
|
||||||||
|
Non-linked
insurance
|
|
Linked life
insurance
|
|
Investment
contracts
with DPF
1
|
|
Total
|
|
|
|
$m
|
|
$m
|
|
$m
|
|
$m
|
|
|
|
Gross claims and benefits paid and movement in liabilities
|
8,894
|
|
1,413
|
|
2,901
|
|
13,208
|
|
|
– claims, benefits and surrenders paid
|
2,883
|
|
1,044
|
|
2,002
|
|
5,929
|
|
|
– movement in liabilities
|
6,011
|
|
369
|
|
899
|
|
7,279
|
|
|
Reinsurers’ share of claims and benefits paid and movement in liabilities
|
(942
|
)
|
65
|
|
—
|
|
(877
|
)
|
|
– claims, benefits and surrenders paid
|
(297
|
)
|
(223
|
)
|
—
|
|
(520
|
)
|
|
– movement in liabilities
|
(645
|
)
|
288
|
|
—
|
|
(357
|
)
|
|
Year ended 31 Dec 2017
|
7,952
|
|
1,478
|
|
2,901
|
|
12,331
|
|
|
Gross claims and benefits paid and movement in liabilities
|
8,778
|
|
1,321
|
|
2,409
|
|
12,508
|
|
|
– claims, benefits and surrenders paid
|
2,828
|
|
749
|
|
2,017
|
|
5,594
|
|
|
– movement in liabilities
|
5,950
|
|
572
|
|
392
|
|
6,914
|
|
|
Reinsurers’ share of claims and benefits paid and movement in liabilities
|
(560
|
)
|
(78
|
)
|
—
|
|
(638
|
)
|
|
– claims, benefits and surrenders paid
|
(112
|
)
|
(14
|
)
|
—
|
|
(126
|
)
|
|
– movement in liabilities
|
(448
|
)
|
(64
|
)
|
—
|
|
(512
|
)
|
|
Year ended 31 Dec 2016
|
8,218
|
|
1,243
|
|
2,409
|
|
11,870
|
|
|
Gross claims and benefits paid and movement in liabilities
|
7,746
|
|
1,398
|
|
2,728
|
|
11,872
|
|
|
– claims, benefits and surrenders paid
|
3,200
|
|
1,869
|
|
2,101
|
|
7,170
|
|
|
– movement in liabilities
|
4,546
|
|
(471
|
)
|
627
|
|
4,702
|
|
|
Reinsurers’ share of claims and benefits paid and movement in liabilities
|
(575
|
)
|
(5
|
)
|
—
|
|
(580
|
)
|
|
– claims, benefits and surrenders paid
|
(153
|
)
|
(64
|
)
|
—
|
|
(217
|
)
|
|
– movement in liabilities
|
(422
|
)
|
59
|
|
—
|
|
(363
|
)
|
|
Year ended 31 Dec 2015
|
7,171
|
|
1,393
|
|
2,728
|
|
11,292
|
|
|
1
|
Discretionary participation features.
|
|
Liabilities under insurance contracts
|
|||||||||
|
Non-linked
insurance
|
|
Linked life
insurance
|
|
Investment
contracts
with DPF
1
|
|
Total
|
|
||
|
Footnotes
|
$m
|
|
$m
|
|
$m
|
|
$m
|
|
|
|
Gross liabilities under insurance contracts at 1 Jan 2017
|
46,043
|
|
6,949
|
|
22,281
|
|
75,273
|
|
|
|
Claims and benefits paid
|
(2,883
|
)
|
(1,044
|
)
|
(2,002
|
)
|
(5,929
|
)
|
|
|
Increase in liabilities to policyholders
|
8,894
|
|
1,413
|
|
2,901
|
|
13,208
|
|
|
|
Exchange differences and other movements
|
2
|
58
|
|
230
|
|
2,827
|
|
3,115
|
|
|
Gross liabilities under insurance contracts at 31 Dec 2017
|
52,112
|
|
7,548
|
|
26,007
|
|
85,667
|
|
|
|
Reinsurers’ share of liabilities under insurance contracts
|
(2,203
|
)
|
(268
|
)
|
—
|
|
(2,471
|
)
|
|
|
Net liabilities under insurance contracts at 31 Dec 2017
|
49,909
|
|
7,280
|
|
26,007
|
|
83,196
|
|
|
|
Gross liabilities under insurance contracts at 1 Jan 2016
|
40,538
|
|
6,791
|
|
22,609
|
|
69,938
|
|
|
|
Claims and benefits paid
|
(2,828
|
)
|
(749
|
)
|
(2,017
|
)
|
(5,594
|
)
|
|
|
Increase in liabilities to policyholders
|
8,778
|
|
1,321
|
|
2,409
|
|
12,508
|
|
|
|
Exchange differences and other movements
|
2
|
(445
|
)
|
(414
|
)
|
(720
|
)
|
(1,579
|
)
|
|
Gross liabilities under insurance contracts at 31 Dec 2016
|
46,043
|
|
6,949
|
|
22,281
|
|
75,273
|
|
|
|
Reinsurers’ share of liabilities under insurance contracts
|
(1,500
|
)
|
(320
|
)
|
—
|
|
(1,820
|
)
|
|
|
Net liabilities under insurance contracts at 31 Dec 2016
|
44,543
|
|
6,629
|
|
22,281
|
|
73,453
|
|
|
|
1
|
Discretionary participation features.
|
|
2
|
‘Exchange differences and other movements’ includes movements in liabilities arising from net unrealised investment gains recognised in other comprehensive income.
|
The key factors contributing to the movement in liabilities to policyholders included death claims, surrenders, lapses, liabilities to policyholders created at the initial inception of the policies, the declaration of bonuses and other amounts attributable to policyholders.
|
232
|
HSBC Holdings plc
|
|
4
|
Operating profit
|
Operating profit is stated after the following items:
|
2017
|
|
2016
|
|
2015
|
|
|
|
$m
|
|
$m
|
|
$m
|
|
|
|
Income
|
|
|
||||
|
Interest recognised on impaired financial assets
|
261
|
|
574
|
|
934
|
|
|
Fees earned on financial assets that are not at fair value through profit or loss (other than amounts included in determining the effective interest rate)
|
7,577
|
|
7,732
|
|
8,736
|
|
|
Fees earned on trust and other fiduciary activities
|
2,691
|
|
2,543
|
|
3,052
|
|
|
Expense
|
|
|
|
|
|
|
|
Interest on financial instruments, excluding interest on financial liabilities held for trading or designated at
fair value |
(10,912
|
)
|
(11,858
|
)
|
(13,680
|
)
|
|
Fees payable on financial liabilities that are not at fair value through profit or loss (other than amounts included in determining the effective interest rate)
|
(1,475
|
)
|
(1,214
|
)
|
(1,251
|
)
|
|
Fees payable relating to trust and other fiduciary activities
|
(134
|
)
|
(129
|
)
|
(166
|
)
|
|
Payments under lease and sublease agreements
|
(936
|
)
|
(969
|
)
|
(1,190
|
)
|
|
– minimum lease payments
|
(911
|
)
|
(945
|
)
|
(1,058
|
)
|
|
– contingent rents and sublease payments
|
(25
|
)
|
(24
|
)
|
(132
|
)
|
|
UK bank levy
|
(916
|
)
|
(922
|
)
|
(1,421
|
)
|
|
Restructuring provisions
|
(204
|
)
|
(415
|
)
|
(430
|
)
|
|
Gains/(losses)
|
|
|
|
|
|
|
|
Impairment of available-for-sale equity securities
|
(98
|
)
|
(36
|
)
|
(111
|
)
|
|
Gains/(losses) recognised on assets held for sale
|
195
|
|
(206
|
)
|
(244
|
)
|
|
Gains on the partial sale of shareholding in Industrial Bank
|
—
|
|
—
|
|
1,372
|
|
|
Gain/(loss) on disposal of Brazilian operations
|
19
|
|
(1,743
|
)
|
—
|
|
|
Loan impairment charges and other credit risk provisions
|
(1,769
|
)
|
(3,400
|
)
|
(3,721
|
)
|
|
– net impairment charge on loans and advances
|
(1,992
|
)
|
(3,350
|
)
|
(3,592
|
)
|
|
– release of impairment on available-for-sale debt securities
|
190
|
|
63
|
|
17
|
|
|
– other credit risk provisions
|
33
|
|
(113
|
)
|
(146
|
)
|
External net operating income is attributed to countries on the basis of the location of the branch responsible for reporting the results or advancing the funds:
|
2017
|
|
2016
|
|
2015
|
|
||
|
Footnote
|
$m
|
|
$m
|
|
$m
|
|
|
|
External net operating income by country
|
1
|
51,445
|
|
47,966
|
|
59,800
|
|
|
– UK
|
|
11,057
|
|
9,495
|
|
14,132
|
|
|
– Hong Kong
|
|
14,992
|
|
12,864
|
|
14,447
|
|
|
– US
|
|
4,573
|
|
5,094
|
|
5,541
|
|
|
– France
|
|
2,203
|
|
2,571
|
|
2,706
|
|
|
– other countries
|
|
18,620
|
|
17,942
|
|
22,974
|
|
|
– of which: Brazil
|
|
60
|
|
(204
|
)
|
3,546
|
|
|
1
|
Net operating income before loan impairment charges and other credit risk provisions, also referred to as revenue.
|
|
5
|
Employee compensation and benefits
|
|
2017
|
|
2016
|
|
2015
|
|
|
|
$m
|
|
$m
|
|
$m
|
|
|
|
Wages and salaries
|
15,227
|
|
15,735
|
|
17,245
|
|
|
Social security costs
|
1,419
|
|
1,312
|
|
1,600
|
|
|
Post-employment benefits
|
669
|
|
1,042
|
|
1,055
|
|
|
Year ended 31 Dec
|
17,315
|
|
18,089
|
|
19,900
|
|
|
Average number of persons employed by HSBC during the year by global business
|
||||||
|
|
2017
|
|
2016
|
|
2015
|
|
|
Retail Banking and Wealth Management
|
134,021
|
|
137,234
|
|
155,859
|
|
|
Commercial Banking
|
46,716
|
|
45,912
|
|
51,007
|
|
|
Global Banking and Markets
|
49,100
|
|
47,623
|
|
49,912
|
|
|
Global Private Banking
|
7,817
|
|
8,322
|
|
8,934
|
|
|
Corporate Centre
|
7,134
|
|
7,842
|
|
2,721
|
|
|
Year ended 31 Dec
|
244,788
|
|
246,933
|
|
268,433
|
|
|
HSBC Holdings plc
|
233
|
Notes on the Financial Statements
|
Average number of persons employed by HSBC during the year by geographical region
|
||||||
|
2017
|
|
2016
|
|
2015
|
|
|
|
Europe
|
70,301
|
|
71,196
|
|
68,408
|
|
|
Asia
|
125,004
|
|
122,282
|
|
121,438
|
|
|
Middle East and North Africa
|
10,408
|
|
12,021
|
|
14,467
|
|
|
North America
|
18,610
|
|
20,353
|
|
21,506
|
|
|
Latin America
|
20,465
|
|
21,081
|
|
42,614
|
|
|
Year ended 31 Dec
|
244,788
|
|
246,933
|
|
268,433
|
|
|
Reconciliation of total incentive awards granted to income statement charge
|
||||||
|
|
2017
|
|
2016
|
|
2015
|
|
|
|
$m
|
|
$m
|
|
$m
|
|
|
Total incentive awards approved for the current year
|
3,303
|
|
3,035
|
|
3,462
|
|
|
Less: deferred bonuses awarded, expected to be recognised in future periods
|
(337
|
)
|
(323
|
)
|
(387
|
)
|
|
Total incentives awarded and recognised in the current year
|
2,966
|
|
2,712
|
|
3,075
|
|
|
Add: current year charges for deferred bonuses from previous years
|
336
|
|
371
|
|
483
|
|
|
Other
|
(78
|
)
|
(128
|
)
|
(40
|
)
|
|
Income statement charge for incentive awards
|
3,224
|
|
2,955
|
|
3,518
|
|
|
Year in which income statement is expected to reflect deferred bonuses
|
||||||||||
|
|
Charge recognised
|
Expected charge
|
||||||||
|
|
2017
|
|
2016
|
|
2015
|
|
2018
|
|
2019 and beyond
|
|
|
|
$m
|
|
$m
|
|
$m
|
|
$m
|
|
$m
|
|
|
Variable compensation from 2017 bonus pool
|
162
|
|
—
|
|
—
|
|
162
|
|
175
|
|
|
Variable compensation from 2016 bonus pool
|
126
|
|
152
|
|
—
|
|
109
|
|
84
|
|
|
Variable compensation from 2015 bonus pool and earlier
|
210
|
|
168
|
|
253
|
|
82
|
|
21
|
|
|
Total
|
498
|
|
320
|
|
253
|
|
353
|
|
280
|
|
|
Cash awards
|
184
|
|
114
|
|
67
|
|
117
|
|
99
|
|
|
Equity awards
|
314
|
|
206
|
|
186
|
|
236
|
|
181
|
|
Share-based payments
‘Wages and salaries’ includes the effect of share-based payments arrangements, of which
$500m
were equity settled (2016:
$534m
; 2015:
$757m
), as follows:
|
2017
|
2016
|
2015
|
|
|
$m
|
$m
|
$m
|
|
|
Restricted share awards
|
520
|
591
|
748
|
|
Savings-related and other share award option plans
|
26
|
33
|
43
|
|
Year ended 31 Dec
|
546
|
624
|
791
|
|
HSBC share awards
|
|
|
Award
|
Policy
|
|
Deferred share awards (including annual incentive awards, LTI awards delivered in shares) and GPSP
|
• An assessment of performance over the relevant period ending on 31 December is used to determine the amount of the award to be granted.
• Deferred awards generally require employees to remain in employment over the vesting period and are not subject to performance conditions after the grant date. • Deferred share awards generally vest over a period of three, five or seven years. • Vested shares may be subject to a retention requirement post-vesting. GPSP awards are retained until cessation of employment. • Awards granted from 2010 onwards are subject to a malus provision prior to vesting. • Awards granted to Material Risk Takers from 2015 onwards are subject to clawback post vesting. |
|
International Employee Share Purchase Plan (‘ShareMatch’)
|
• The plan was first introduced in Hong Kong in 2013 and now includes employees based in 27 jurisdictions.
• Shares are purchased in the market each quarter up to a maximum value of £750, or the equivalent in local currency. • Matching awards are added at a ratio of one free share for every three purchased. • Matching awards vest subject to continued employment and the retention of the purchased shares for a maximum period of two years and nine months. |
|
Movement on HSBC share awards
|
||||
|
2017
|
|
2016
|
|
|
|
Number
|
|
Number
|
|
|
|
(000s)
|
|
(000s)
|
|
|
|
Restricted share awards outstanding at 1 Jan
|
123,166
|
|
118,665
|
|
|
Additions during the year
|
62,044
|
|
94,981
|
|
|
Released in the year
|
(76,051
|
)
|
(76,552
|
)
|
|
Forfeited in the year
|
(4,634
|
)
|
(13,928
|
)
|
|
Restricted share awards outstanding at 31 Dec
|
104,525
|
|
123,166
|
|
|
Weighted average fair value of awards granted ($)
|
7.09
|
|
7.25
|
|
|
234
|
HSBC Holdings plc
|
|
HSBC share option plans
|
|
|
Main plans
|
Policy
|
|
Savings-related share option plans (‘Sharesave’)
|
• Two plans: the UK Plan and the International Plan. The last grant of options under the International Plan was in 2012.
• From 2014, eligible employees can save up to £500 per month with the option to use the savings to acquire shares. • Exercisable within six months following either the third or fifth anniversary of the commencement of a three-year or five-year contract, respectively. • The exercise price is set at a 20% (2016: 20%) discount to the market value immediately preceding the date of invitation. |
Calculation of fair values
The fair values of share options are calculated using a Black-Scholes model. The fair value of a share award is based on the share price at the date of the grant.
|
Movement on HSBC share option plans
|
|||||
|
Savings-related
share option plans |
|||||
|
Number
|
|
WAEP
1
|
|
||
|
Footnotes
|
(000s)
|
|
£
|
|
|
|
Outstanding at 1 Jan 2017
|
70,027
|
|
4.30
|
|
|
|
Granted during the year
|
2
|
10,447
|
|
5.96
|
|
|
Exercised during the year
|
3
|
(9,503
|
)
|
4.83
|
|
|
Expired during the year
|
(3,902
|
)
|
4.45
|
|
|
|
Forfeited during the year
|
(2,399
|
)
|
4.27
|
|
|
|
Outstanding at 31 Dec 2017
|
64,670
|
|
4.49
|
|
|
|
Of which exercisable
|
1,129
|
|
5.00
|
|
|
|
Weighted average remaining contractual life (years)
|
2.42
|
|
|||
|
Outstanding at 1 Jan 2016
|
74,775
|
|
4.36
|
|
|
|
Granted during the year
|
2
|
15,044
|
|
4.40
|
|
|
Exercised during the year
|
3
|
(4,354
|
)
|
5.02
|
|
|
Expired during the year
|
(13,243
|
)
|
4.49
|
|
|
|
Forfeited during the year
|
(2,195
|
)
|
4.34
|
|
|
|
Outstanding at 31 Dec 2016
|
70,027
|
|
4.30
|
|
|
|
Of which exercisable
|
1,086
|
|
5.25
|
|
|
|
Weighted average remaining contractual life (years)
|
2.91
|
|
|||
|
1
|
Weighted average exercise price.
|
|
2
|
The weighted average fair value of options granted during the year was
$1.29
(2016:
$1.28
).
|
|
3
|
The weighted average share price at the date the options were exercised was
$9.93
(2016:
$6.98
).
|
Post-employment benefit plans
The Group operates pension plans throughout the world for its employees. ‘Pension risk management’ on page
120
contains details of the policies and practices associated with these pension plans. Some are defined benefit plans, of which the largest is the HSBC Bank (UK) Pension Scheme (‘the principal plan’).
The principal plan
The principal plan has a defined benefit section and a defined contribution section. The defined benefit section was closed to future benefit accrual in 2015, with defined benefits earned by employees at that date continuing to be linked to their salary while they remain employed by HSBC Bank. The plan is overseen by an independent corporate trustee, who has a fiduciary responsibility for the operation of the plan. Its assets are held separately from the assets of the Group.
The investment strategy of the plan is to hold the majority of assets in bonds, with the remainder in a diverse range of investments. It also includes some interest rate swaps to reduce interest rate risk and inflation swaps to reduce inflation risk.
The latest funding valuation of the plan at 31 December 2014 was carried out by Colin G Singer, of Willis Towers Watson Limited, who is a Fellow of the UK Institute and Faculty of Actuaries, using the projected unit credit method. At that date, the market value of the plan’s assets was
£24.6b
n (
$30.3b
n) and this exceeded the value placed on its liabilities on an ongoing basis by
£520m
(
$641m
), giving a funding level of
102%
. The main differences between the assumptions used for assessing the liabilities for this funding valuation and those used for IAS 19 are more prudent assumptions for discount rate, inflation rate and life expectancy.
Although the plan was in surplus at the valuation date, HSBC agreed to make further contributions to the plan to support a lower-risk investment strategy over the longer term. The remaining contributions are
£64m
(
$79m
) in each of 2018 and 2019, and
£160m
(
$197m
) in each of 2020 and 2021.
To meet the requirements of the Banking Reform Act, it is currently planned that from 1 July 2018, the main employer of the plan will change from HSBC Bank plc to HSBC UK Bank plc, with additional support from HSBC Holdings plc. At the same time, non-ring fenced entities including HSBC Bank plc will exit the section of the plan for ring-fenced entities and join a newly created section for the future defined benefit and defined contribution pension benefits of their employees (approximately
0.2%
of the total plan). These changes are not expected to materially affect the funding position of the plan.
|
HSBC Holdings plc
|
235
|
Notes on the Financial Statements
The following chart shows the expected profile of future benefits payable from the plan.
|
Future benefit payments ($bn)
|

The actuary also assessed the value of the liabilities if the plan were to be stopped and an insurance company asked to secure all future pension payments. This is generally larger than the amount needed on the ongoing basis described above because an insurance company would use more prudent assumptions and include an explicit allowance for the future administrative expenses of the plan. Under this approach, the amount of assets needed was estimated to be
£31b
n (
$38b
n) at 31 December 2014.
|
Income statement charge
|
||||||
|
2017
|
|
2016
|
|
2015
|
|
|
|
$m
|
|
$m
|
|
$m
|
|
|
|
Defined benefit pension plans
|
100
|
|
218
|
|
256
|
|
|
Defined contribution pension plans
|
603
|
|
783
|
|
793
|
|
|
Pension plans
|
703
|
|
1,001
|
|
1,049
|
|
|
Defined benefit and contribution healthcare plans
|
(34
|
)
|
41
|
|
6
|
|
|
Year ended 31 Dec
|
669
|
|
1,042
|
|
1,055
|
|
|
Net assets/(liabilities) recognised on the balance sheet in respect of defined benefit plans
|
||||||||
|
Fair value of
plan assets |
|
Present value of defined benefit
obligations |
|
Effect of
limit on plan surpluses |
|
Total
|
|
|
|
$m
|
|
$m
|
|
$m
|
|
$m
|
|
|
|
Defined benefit pension plans
|
47,265
|
|
(40,089
|
)
|
(37
|
)
|
7,139
|
|
|
Defined benefit healthcare plans
|
124
|
|
(663
|
)
|
—
|
|
(539
|
)
|
|
At 31 Dec 2017
|
47,389
|
|
(40,752
|
)
|
(37
|
)
|
6,600
|
|
|
Total employee benefit liabilities (within ‘Accruals, deferred income and other liabilities’)
|
|
|
|
|
|
|
(2,152
|
)
|
|
Total employee benefit assets (within ‘Prepayments, accrued income and other assets’)
|
|
|
|
|
|
|
8,752
|
|
|
Defined benefit pension plans
|
42,397
|
|
(39,747
|
)
|
(24
|
)
|
2,626
|
|
|
Defined benefit healthcare plans
|
118
|
|
(711
|
)
|
—
|
|
(593
|
)
|
|
At 31 Dec 2016
|
42,515
|
|
(40,458
|
)
|
(24
|
)
|
2,033
|
|
|
Total employee benefit liabilities (within ‘Accruals, deferred income and other liabilities’)
|
(2,681
|
)
|
||||||
|
Total employee benefit assets (within ‘Prepayments, accrued income and other assets’)
|
4,714
|
|
||||||
HSBC Holdings
Employee compensation and benefit expense in respect of HSBC Holdings’ employees in 2017 amounted to
$54m
(2016:
$570m
). The average number of persons employed during 2017 was
55
(2016:
1,660
). Employees who are members of defined benefit pension plans are principally members of either the HSBC Bank (UK) Pension Scheme or the HSBC International Staff Retirement Benefits Scheme. HSBC Holdings pays contributions to such plans for its own employees in accordance with the schedules of contributions determined by the trustees of the plans and recognises these contributions as an expense as they fall due.
From 1 July 2016 employment costs of most employees are recognised by the ServCo group and the ServCo group started providing services to HSBC Holdings. HSBC Holdings recognised a management charge of
$2,240m
(2016 :
$406m
) for these services which is included under ‘General and administrative expenses’.
|
236
|
HSBC Holdings plc
|
Defined benefit pension plans
|
Net asset/(liability) under defined benefit pension plans
|
||||||||||||||||
|
Fair value of plan assets
|
Present value of defined benefit obligations
|
Effect of the asset ceiling
|
Net defined benefit asset/(liability)
|
|||||||||||||
|
Principal
plan
|
|
Other
plans
|
|
Principal
plan
|
|
Other
plans
|
|
Principal
plan
|
|
Other
plans
|
|
Principal
plan
|
|
Other
plans
|
|
|
|
$m
|
|
$m
|
|
$m
|
|
$m
|
|
$m
|
|
$m
|
|
$m
|
|
$m
|
|
|
|
At 1 Jan 2017
|
33,442
|
|
8,955
|
|
(29,279
|
)
|
(10,468
|
)
|
—
|
|
(24
|
)
|
4,163
|
|
(1,537
|
)
|
|
Current service cost
|
—
|
|
—
|
|
(65
|
)
|
(160
|
)
|
—
|
|
—
|
|
(65
|
)
|
(160
|
)
|
|
Past service cost and gains/(losses) from settlements
|
—
|
|
(833
|
)
|
(231
|
)
|
1,051
|
|
—
|
|
—
|
|
(231
|
)
|
218
|
|
|
Service cost
|
—
|
|
(833
|
)
|
(296
|
)
|
891
|
|
—
|
|
—
|
|
(296
|
)
|
58
|
|
|
Net interest income/(cost) on the net defined benefit asset/(liability)
|
864
|
|
272
|
|
(750
|
)
|
(300
|
)
|
—
|
|
(1
|
)
|
114
|
|
(29
|
)
|
|
Re-measurement effects recognised in other comprehensive income
|
1,410
|
|
784
|
|
1,730
|
|
(486
|
)
|
—
|
|
(9
|
)
|
3,140
|
|
289
|
|
|
– return on plan assets (excluding interest income)
|
1,410
|
|
784
|
|
—
|
|
—
|
|
—
|
|
—
|
|
1,410
|
|
784
|
|
|
– actuarial gains/(losses)
|
—
|
|
—
|
|
954
|
|
(491
|
)
|
—
|
|
(9
|
)
|
954
|
|
(500
|
)
|
|
– other changes
|
—
|
|
—
|
|
776
|
|
5
|
|
—
|
|
—
|
|
776
|
|
5
|
|
|
Exchange differences
|
3,292
|
|
239
|
|
(2,723
|
)
|
(306
|
)
|
—
|
|
(3
|
)
|
569
|
|
(70
|
)
|
|
Contributions by HSBC
|
449
|
|
236
|
|
—
|
|
—
|
|
—
|
|
—
|
|
449
|
|
236
|
|
|
– normal
|
58
|
|
215
|
|
—
|
|
—
|
|
—
|
|
—
|
|
58
|
|
215
|
|
|
– special
|
391
|
|
21
|
|
—
|
|
—
|
|
—
|
|
—
|
|
391
|
|
21
|
|
|
Contributions by employees
|
—
|
|
27
|
|
—
|
|
(27
|
)
|
—
|
|
—
|
|
—
|
|
—
|
|
|
Benefits paid
|
(1,143
|
)
|
(663
|
)
|
1,143
|
|
716
|
|
—
|
|
—
|
|
—
|
|
53
|
|
|
Administrative costs and taxes paid by plan
|
(49
|
)
|
(17
|
)
|
49
|
|
17
|
|
—
|
|
—
|
|
—
|
|
—
|
|
|
At 31 Dec 2017
|
38,265
|
|
9,000
|
|
(30,126
|
)
|
(9,963
|
)
|
—
|
|
(37
|
)
|
8,139
|
|
(1,000
|
)
|
|
Present value of defined benefit obligation relating to:
|
||||||||||||||||
|
– actives
|
|
|
|
|
(5,837
|
)
|
(5,084
|
)
|
|
|
|
|
|
|
|
|
|
– deferreds
|
|
|
|
|
(8,745
|
)
|
(1,663
|
)
|
|
|
|
|
|
|
|
|
|
– pensioners
|
|
|
|
|
(15,544
|
)
|
(3,216
|
)
|
|
|
|
|
|
|
|
|
|
At 1 Jan 2016
|
32,670
|
|
8,754
|
|
(27,675
|
)
|
(10,651
|
)
|
—
|
|
(14
|
)
|
4,995
|
|
(1,911
|
)
|
|
Current service cost
|
—
|
|
—
|
|
(70
|
)
|
(235
|
)
|
—
|
|
—
|
|
(70
|
)
|
(235
|
)
|
|
Past service cost and gains/(losses) from settlements
|
—
|
|
(1
|
)
|
—
|
|
(39
|
)
|
—
|
|
—
|
|
—
|
|
(40
|
)
|
|
Service cost
|
—
|
|
(1
|
)
|
(70
|
)
|
(274
|
)
|
—
|
|
—
|
|
(70
|
)
|
(275
|
)
|
|
Net interest income/(cost) on the net defined benefit asset/(liability)
|
1,085
|
|
294
|
|
(914
|
)
|
(337
|
)
|
—
|
|
(1
|
)
|
171
|
|
(44
|
)
|
|
Re-measurement effects recognised in other comprehensive income
|
6,449
|
|
671
|
|
(6,886
|
)
|
(299
|
)
|
—
|
|
(8
|
)
|
(437
|
)
|
364
|
|
|
– return on plan assets (excluding interest income)
|
6,449
|
|
671
|
|
—
|
|
—
|
|
—
|
|
—
|
|
6,449
|
|
671
|
|
|
– actuarial gains/(losses)
|
—
|
|
—
|
|
(7,029
|
)
|
(152
|
)
|
—
|
|
(8
|
)
|
(7,029
|
)
|
(160
|
)
|
|
– other changes
|
—
|
|
—
|
|
143
|
|
(147
|
)
|
—
|
|
—
|
|
143
|
|
(147
|
)
|
|
Exchange differences
|
(6,097
|
)
|
(534
|
)
|
5,254
|
|
410
|
|
—
|
|
(1
|
)
|
(843
|
)
|
(125
|
)
|
|
Contributions by HSBC
|
347
|
|
379
|
|
—
|
|
—
|
|
—
|
|
—
|
|
347
|
|
379
|
|
|
– normal
|
64
|
|
207
|
|
—
|
|
—
|
|
—
|
|
—
|
|
64
|
|
207
|
|
|
– special
|
283
|
|
172
|
|
—
|
|
—
|
|
—
|
|
—
|
|
283
|
|
172
|
|
|
Contributions by employees
|
—
|
|
30
|
|
—
|
|
(30
|
)
|
—
|
|
—
|
|
—
|
|
—
|
|
|
Benefits paid
|
(970
|
)
|
(623
|
)
|
970
|
|
698
|
|
—
|
|
—
|
|
—
|
|
75
|
|
|
Administrative costs and taxes paid by plan
|
(42
|
)
|
(15
|
)
|
42
|
|
15
|
|
—
|
|
—
|
|
—
|
|
—
|
|
|
At 31 Dec 2016
|
33,442
|
|
8,955
|
|
(29,279
|
)
|
(10,468
|
)
|
—
|
|
(24
|
)
|
4,163
|
|
(1,537
|
)
|
|
Present value of defined benefit obligation relating to:
|
||||||||||||||||
|
– actives
|
(7,066
|
)
|
(5,066
|
)
|
||||||||||||
|
– deferreds
|
(9,219
|
)
|
(2,306
|
)
|
||||||||||||
|
– pensioners
|
(12,994
|
)
|
(3,096
|
)
|
||||||||||||
HSBC expects to make
$278
m of contributions to defined benefit pension plans during 2018. Benefits expected to be paid from the plans to retirees over each of the next five years, and in aggregate for the five years thereafter, are as follows:
|
Benefits expected to be paid from plans
|
|||||||||||||
|
2018
|
|
2019
|
|
2020
|
|
2021
|
|
2022
|
|
2023-2027
|
|
||
|
Footnote
|
$m
|
|
$m
|
|
$m
|
|
$m
|
|
$m
|
|
$m
|
|
|
|
The principal plan
|
1
|
1,241
|
|
1,279
|
|
1,320
|
|
1,360
|
|
1,402
|
|
7,692
|
|
|
Other plans
|
1
|
443
|
|
508
|
|
511
|
|
527
|
|
520
|
|
2,307
|
|
|
1
|
The duration of the defined benefit obligation is
17.4
years for the principal plan under the disclosure assumptions adopted (2016:
19.0
years) and
12.9
years for all other plans combined (2016:
13.9
years).
|
|
HSBC Holdings plc
|
237
|
Notes on the Financial Statements
|
Fair value of plan assets by asset classes
|
||||||||||||||||
|
31 Dec 2017
|
31 Dec 2016
|
|||||||||||||||
|
Value
|
|
Quoted
market price in active market |
|
No quoted
market price in active market |
|
Thereof
HSBC 1 |
|
Value
|
|
Quoted
market price in active market |
|
No quoted
market price in active market |
|
Thereof
HSBC 1 |
|
|
|
$m
|
|
$m
|
|
$m
|
|
$m
|
|
$m
|
|
$m
|
|
$m
|
|
$m
|
|
|
|
The principal plan
|
||||||||||||||||
|
Fair value of plan assets
|
38,265
|
|
33,624
|
|
4,641
|
|
1,006
|
|
33,442
|
|
29,379
|
|
4,063
|
|
878
|
|
|
– equities
|
6,131
|
|
5,503
|
|
628
|
|
—
|
|
5,386
|
|
4,722
|
|
664
|
|
—
|
|
|
– bonds
|
26,591
|
|
26,591
|
|
—
|
|
—
|
|
23,426
|
|
23,426
|
|
—
|
|
—
|
|
|
– derivatives
|
2,398
|
|
—
|
|
2,398
|
|
1,006
|
|
2,107
|
|
—
|
|
2,107
|
|
878
|
|
|
– other
|
3,145
|
|
1,530
|
|
1,615
|
|
—
|
|
2,523
|
|
1,231
|
|
1,292
|
|
—
|
|
|
Other plans
|
|
|
|
|
|
|
|
|
||||||||
|
Fair value of plan assets
|
9,000
|
|
7,737
|
|
1,263
|
|
114
|
|
8,955
|
|
7,631
|
|
1,324
|
|
239
|
|
|
– equities
|
2,005
|
|
1,340
|
|
665
|
|
—
|
|
2,255
|
|
1,502
|
|
753
|
|
—
|
|
|
– bonds
|
5,871
|
|
5,714
|
|
157
|
|
7
|
|
5,811
|
|
5,592
|
|
219
|
|
5
|
|
|
– derivatives
|
—
|
|
39
|
|
(39
|
)
|
—
|
|
(89
|
)
|
44
|
|
(133
|
)
|
(85
|
)
|
|
– other
|
1,124
|
|
644
|
|
480
|
|
107
|
|
978
|
|
493
|
|
485
|
|
319
|
|
|
1
|
The fair value of plan assets includes derivatives entered into with HSBC Bank plc as detailed in Note
35
.
|
Post-employment defined benefit plans’ principal actuarial financial assumptions
HSBC determines the discount rates to be applied to its obligations in consultation with the plans’ local actuaries, on the basis of current average yields of high quality (AA-rated or equivalent) debt instruments with maturities consistent with those of the defined benefit obligations.
|
Key actuarial assumptions for the principal plan
|
||||
|
Discount rate
|
Inflation rate
|
Rate of increase for pensions
|
Rate of pay increase
|
|
|
%
|
%
|
%
|
%
|
|
|
UK
|
||||
|
At 31 Dec 2017
|
2.60
|
3.40
|
3.10
|
3.88
|
|
At 31 Dec 2016
|
2.50
|
3.50
|
3.20
|
4.00
|
|
At 31 Dec 2015
|
3.70
|
3.20
|
3.00
|
3.70
|
|
Mortality tables and average life expectancy at age 65 for the principal plan
|
|||||
|
Mortality
table
|
Life expectancy at age 65 for
a male member currently:
|
Life expectancy at age 65 for
a female member currently:
|
|||
|
Aged 65
|
Aged 45
|
Aged 65
|
Aged 45
|
||
|
UK
|
|||||
|
At 31 Dec 2017
|
SAPS S2
1
|
22.2
|
23.6
|
24.4
|
25.9
|
|
At 31 Dec 2016
|
SAPS S2
2
|
22.4
|
24.1
|
24.7
|
26.6
|
|
1
|
Self-administered pension scheme (‘SAPS’) S2 table (males: 'All Pensioners' version; females: 'Normal Pensions' version) with a multiplier of
0.98
for both male and female pensioners. Improvements are projected in accordance with the Continuous Mortality Investigation (‘CMI’) core projection model 2016 with a long-term rate of improvement of
1.25%
per annum. Separate tables assuming lighter mortality have been applied to higher paid pensioners.
|
|
2
|
Self-administered pension scheme (‘SAPS’) S2 table (males: 'All Pensioners' version; females: 'Normal Pensions' version) with a multiplier of
0.98
for both male and female pensioners. Improvements are projected in accordance with the Continuous Mortality Investigation (‘CMI’) core projection model 2015 with a long-term rate of improvement of
1.25%
per annum. Separate tables assuming lighter mortality have been applied to higher paid pensioners.
|
|
The effect of changes in key assumptions on the principal plan
|
||||||||
|
Impact on HSBC Bank (UK) Pension Scheme Obligation
|
||||||||
|
Financial impact of increase
|
Financial impact of decrease
|
|||||||
|
2017
|
|
2016
|
|
2017
|
|
2016
|
|
|
|
$m
|
|
$m
|
|
$m
|
|
$m
|
|
|
|
Discount rate – increase/decrease of 0.25%
|
(1,246
|
)
|
(1,322
|
)
|
1,333
|
|
1,419
|
|
|
Inflation rate – increase/decrease of 0.25%
|
850
|
|
735
|
|
(837
|
)
|
(1,048
|
)
|
|
Pension payments and deferred pensions – increase/decrease of 0.25%
|
1,077
|
|
1,305
|
|
(1,021
|
)
|
(1,255
|
)
|
|
Pay – increase/decrease of 0.25%
|
62
|
|
143
|
|
(61
|
)
|
(139
|
)
|
|
Change in mortality – increase of 1 year
|
1,332
|
|
1,326
|
|
n/a
|
|
n/a
|
|
Directors’ emoluments
Details of Directors’ emoluments, pensions and their interests are disclosed in the Directors’ Remuneration Report on page
186
.
|
238
|
HSBC Holdings plc
|
|
6
|
Auditors’ remuneration
|
|
2017
|
2016
|
2015
|
||
|
Footnote
|
$m
|
$m
|
$m
|
|
|
Audit fees payable to PwC
|
1
|
84.8
|
65.7
|
62.0
|
|
Other audit fees payable
|
1.2
|
1.6
|
1.2
|
|
|
Year ended 31 Dec
|
86.0
|
67.3
|
63.2
|
|
|
Fees payable by HSBC to PwC
|
|||||||
|
2017
|
|
2016
|
|
2015
|
|
||
|
Footnotes
|
$m
|
|
$m
|
|
$m
|
|
|
|
Fees for HSBC Holdings’ statutory audit
|
2
|
15.1
|
|
14.0
|
|
13.1
|
|
|
Fees for other services provided to HSBC
|
114.6
|
|
97.1
|
|
85.1
|
|
|
|
– audit of HSBC’s subsidiaries
|
3
|
69.7
|
|
51.7
|
|
48.9
|
|
|
– audit-related assurance services
|
4
|
22.5
|
|
20.6
|
|
16.6
|
|
|
– taxation compliance services
|
1.2
|
|
1.9
|
|
1.0
|
|
|
|
– taxation advisory services
|
—
|
|
0.4
|
|
0.9
|
|
|
|
– other assurance services
|
5
|
3.9
|
|
4.5
|
|
2.8
|
|
|
– other non-audit services
|
5
|
17.3
|
|
18.0
|
|
14.9
|
|
|
Year ended 31 Dec
|
129.7
|
|
111.1
|
|
98.2
|
|
|
No fees were payable by HSBC to PwC as principal auditor for the following types of services: internal audit services and services related to litigation, recruitment and remuneration.
|
Fees payable by HSBC’s associated pension schemes to PwC
|
|||||||
|
2017
|
|
2016
|
|
2015
|
|
||
|
$000
|
|
$000
|
|
$000
|
|
||
|
Audit of HSBC’s associated pension schemes
|
260
|
|
208
|
|
352
|
|
|
|
Audit related assurance services
|
4
|
|
4
|
|
5
|
|
|
|
Year ended 31 Dec
|
264
|
|
212
|
|
357
|
|
|
|
1
|
The 2016 audit fees payable amount includes
$4.2m
related to the prior year audit in respect of overruns.
|
|
2
|
Fees payable to PwC for the statutory audit of the consolidated financial statements of HSBC and the separate financial statements of HSBC Holdings. They include amounts payable for services relating to the consolidation returns of HSBC Holdings’ subsidiaries which are clearly identifiable as being in support of the Group audit opinion.
|
|
3
|
Fees payable for the statutory audit of the financial statements of HSBC’s subsidiaries, including the 2017 and 2016 changes in scope and additional procedures performed due to the technology systems and data access controls matter as described on page
210
.
|
|
4
|
Including services for assurance and other services that relate to statutory and regulatory filings, including comfort letters and interim reviews and work performed related to the implementation of IFRS 9.
|
|
5
|
Including other permitted services relating to advisory, corporate finance transactions, etc.
|
No fees were payable by HSBC’s associated pension schemes to PwC as principal auditor for the following types of services: internal audit services, other assurance services, services related to corporate finance transactions, valuation and actuarial services, litigation, recruitment and remuneration, and information technology.
In addition to the above, the estimated fees paid to PwC by third parties associated with HSBC amount to
$3.5m
(2016:
$4.3m
; 2015:
$2.4m
). In these cases, HSBC is connected with the contracting party and may therefore be involved in appointing PwC. These fees arise from services such as auditing mutual funds managed by HSBC and reviewing the financial position of corporate concerns which borrow from HSBC.
Fees payable for non-audit services for HSBC Holdings are not disclosed separately because such fees are disclosed on a consolidated basis for the HSBC Group.
|
7
|
Tax
|
|
Tax expense
|
|||||||
|
2017
|
|
2016
|
|
2015
|
|
||
|
Footnote
|
$m
|
|
$m
|
|
$m
|
|
|
|
Current tax
|
1
|
4,264
|
|
3,669
|
|
3,797
|
|
|
– for this year
|
4,115
|
|
3,525
|
|
3,882
|
|
|
|
– adjustments in respect of prior years
|
149
|
|
144
|
|
(85
|
)
|
|
|
Deferred tax
|
1,024
|
|
(3
|
)
|
(26
|
)
|
|
|
– origination and reversal of temporary differences
|
(228
|
)
|
(111
|
)
|
(153
|
)
|
|
|
– effect of changes in tax rates
|
1,337
|
|
(4
|
)
|
110
|
|
|
|
– adjustments in respect of prior years
|
(85
|
)
|
112
|
|
17
|
|
|
|
Year ended 31 Dec
|
5,288
|
|
3,666
|
|
3,771
|
|
|
|
1
|
Current tax included Hong Kong profits tax of
$1,350m
(2016:
$1,118m
; 2015:
$1,294m
). The Hong Kong tax rate applying to the profits of subsidiaries assessable in Hong Kong was
16.5%
(2016:
16.5%
; 2015:
16.5%
).
|
|
HSBC Holdings plc
|
239
|
Notes on the Financial Statements
Tax reconciliation
The tax charged to the income statement differs from the tax charge that would apply if all profits had been taxed at the UK corporation tax rate as follows:
|
|
2017
|
2016
|
2015
|
|||||||||
|
|
$m
|
|
%
|
|
$m
|
|
%
|
|
$m
|
|
%
|
|
|
Profit before tax
|
17,167
|
|
|
|
7,112
|
|
|
|
18,867
|
|
|
|
|
Tax expense
|
|
|
|
|
|
|
|
|
|
|
|
|
|
Taxation at UK corporation tax rate of 19.25% (2016: 20.0%;
2015: 20.25%) |
3,305
|
|
19.25
|
|
1,422
|
|
20.00
|
|
3,821
|
|
20.25
|
|
|
Impact of differently taxed overseas profits in overseas locations
|
407
|
|
2.3
|
|
43
|
|
0.6
|
|
71
|
|
0.4
|
|
|
Items increasing tax charge in 2017 not in 2016:
|
|
|
|
|
|
|
|
|
|
|
|
|
|
– deferred tax remeasurement due to US federal tax rate reduction
|
1,288
|
|
7.5
|
|
—
|
|
—
|
|
—
|
|
—
|
|
|
Other items increasing tax charge in 2017:
|
|
|
|
|
|
|
|
|
|
|
|
|
|
– local taxes and overseas withholding taxes
|
618
|
|
3.6
|
|
434
|
|
6.1
|
|
416
|
|
2.2
|
|
|
– other permanent disallowables
|
400
|
|
2.3
|
|
438
|
|
6.2
|
|
421
|
|
2.2
|
|
|
– bank levy
|
180
|
|
1.0
|
|
170
|
|
2.4
|
|
286
|
|
1.5
|
|
|
– non-deductible UK customer compensation
|
166
|
|
1.0
|
|
162
|
|
2.3
|
|
87
|
|
0.5
|
|
|
– UK banking surcharge
|
136
|
|
0.8
|
|
199
|
|
2.8
|
|
—
|
|
—
|
|
|
– UK tax losses not recognised
|
70
|
|
0.4
|
|
305
|
|
4.3
|
|
—
|
|
—
|
|
|
– adjustments in respect of prior period liabilities
|
64
|
|
0.4
|
|
256
|
|
3.6
|
|
(68
|
)
|
(0.4
|
)
|
|
– change in tax rates
|
49
|
|
0.3
|
|
(4
|
)
|
(0.1
|
)
|
110
|
|
0.6
|
|
|
– non-UK tax losses not recognised
|
33
|
|
0.2
|
|
147
|
|
2.1
|
|
—
|
|
—
|
|
|
– non-deductible goodwill write-down
|
—
|
|
—
|
|
648
|
|
9.1
|
|
—
|
|
—
|
|
|
– non-deductible loss and taxes suffered on Brazil disposal
|
—
|
|
—
|
|
464
|
|
6.5
|
|
—
|
|
—
|
|
|
Items reducing tax charge in 2017:
|
|
|
|
|
|
|
|
|
|
|
|
|
|
– non-taxable income and gains
|
(766
|
)
|
(4.4
|
)
|
(577
|
)
|
(8.1
|
)
|
(501
|
)
|
(2.7
|
)
|
|
– effect of profits in associates and joint ventures
|
(481
|
)
|
(2.8
|
)
|
(461
|
)
|
(6.5
|
)
|
(508
|
)
|
(2.7
|
)
|
|
– non-deductible regulatory settlements
|
(132
|
)
|
(0.8
|
)
|
20
|
|
0.3
|
|
184
|
|
1.0
|
|
|
– other deferred tax temporary differences previously not recognised
|
(49
|
)
|
(0.3
|
)
|
—
|
|
—
|
|
(21
|
)
|
(0.1
|
)
|
|
– non-taxable income and gains - Industrial Bank
|
—
|
|
—
|
|
—
|
|
—
|
|
(227
|
)
|
(1.2
|
)
|
|
– US deferred tax temporary differences previously not recognised
|
—
|
|
—
|
|
—
|
|
—
|
|
(184
|
)
|
(1.0
|
)
|
|
– other items
|
—
|
|
—
|
|
—
|
|
—
|
|
(116
|
)
|
(0.6
|
)
|
|
Year ended 31 Dec
|
5,288
|
|
30.8
|
|
3,666
|
|
51.6
|
|
3,771
|
|
20.0
|
|
The Group’s profits are taxed at different rates depending on the country in which the profits arise. The key applicable tax rates for 2017 include Hong Kong (
16.5%
), the USA (
35%
) and the UK (
19.25%
). If the Group’s profits were taxed at the statutory rates of the countries in which the profits arose then the tax rate for the year would have been
21.15%
(2016:
20.60%
). The effective tax rate for the year was
30.8%
(2016:
51.6%
) and includes a charge of
$1.3b
n relating to the remeasurement of US deferred tax balances to reflect the reduction in the US federal tax rate to 21% from 2018. The effective tax rate for 2017 was significantly lower than for 2016 as 2016 included the impact of a non-deductible goodwill write-down and loss on disposal of our operations in Brazil, tax losses not recognised and adjustments in respect of prior periods.
Accounting for taxes involves some estimation because the tax law is uncertain and its application requires a degree of judgement, which authorities may dispute. Liabilities are recognised based on best estimates of the probable outcome, taking into account external advice where appropriate. We do not expect significant liabilities to arise in excess of the amounts provided. HSBC only recognises current and deferred tax assets where recovery is probable.
|
240
|
HSBC Holdings plc
|
|
Movement of deferred tax assets and liabilities
|
|||||||||||||||
|
Loan
impairment provisions |
|
Unused tax
losses and tax credits |
|
Derivatives,
FVOD 1 and other investments |
|
Insurance
business |
|
Expense
provisions |
|
Other
|
|
Total
|
|
||
|
Footnote
|
$m
|
|
$m
|
|
$m
|
|
$m
|
|
$m
|
|
$m
|
|
$m
|
|
|
|
Assets
|
950
|
|
2,212
|
|
1,441
|
|
—
|
|
893
|
|
1,857
|
|
7,353
|
|
|
|
Liabilities
|
—
|
|
—
|
|
(274
|
)
|
(1,170
|
)
|
—
|
|
(1,369
|
)
|
(2,813
|
)
|
|
|
At 1 Jan 2017
|
950
|
|
2,212
|
|
1,167
|
|
(1,170
|
)
|
893
|
|
488
|
|
4,540
|
|
|
|
Income statement
|
(235
|
)
|
(873
|
)
|
(397
|
)
|
12
|
|
(269
|
)
|
738
|
|
(1,024
|
)
|
|
|
Other comprehensive income
|
3
|
|
(6
|
)
|
368
|
|
—
|
|
—
|
|
(1,255
|
)
|
(890
|
)
|
|
|
Equity
|
—
|
|
—
|
|
—
|
|
—
|
|
—
|
|
29
|
|
29
|
|
|
|
Foreign exchange and other adjustments
|
(5
|
)
|
40
|
|
51
|
|
(24
|
)
|
19
|
|
(42
|
)
|
39
|
|
|
|
At 31 Dec 2017
|
713
|
|
1,373
|
|
1,189
|
|
(1,182
|
)
|
643
|
|
(42
|
)
|
2,694
|
|
|
|
Assets
|
2
|
713
|
|
1,373
|
|
1,282
|
|
—
|
|
643
|
|
2,313
|
|
6,324
|
|
|
Liabilities
|
2
|
—
|
|
—
|
|
(93
|
)
|
(1,182
|
)
|
—
|
|
(2,355
|
)
|
(3,630
|
)
|
|
Assets
|
1,351
|
|
1,388
|
|
1,400
|
|
—
|
|
1,271
|
|
1,050
|
|
6,460
|
|
|
|
Liabilities
|
—
|
|
—
|
|
(230
|
)
|
(1,056
|
)
|
—
|
|
(883
|
)
|
(2,169
|
)
|
|
|
At 1 Jan 2016
|
1,351
|
|
1,388
|
|
1,170
|
|
(1,056
|
)
|
1,271
|
|
167
|
|
4,291
|
|
|
|
Income statement
|
(279
|
)
|
876
|
|
18
|
|
(123
|
)
|
(370
|
)
|
(314
|
)
|
(192
|
)
|
|
|
Other comprehensive income
|
—
|
|
—
|
|
28
|
|
—
|
|
—
|
|
259
|
|
287
|
|
|
|
Equity
|
—
|
|
—
|
|
—
|
|
—
|
|
—
|
|
20
|
|
20
|
|
|
|
Foreign exchange and other adjustments
|
(122
|
)
|
(52
|
)
|
(49
|
)
|
9
|
|
(8
|
)
|
356
|
|
134
|
|
|
|
At 31 Dec 2016
|
950
|
|
2,212
|
|
1,167
|
|
(1,170
|
)
|
893
|
|
488
|
|
4,540
|
|
|
|
Assets
|
2
|
950
|
|
2,212
|
|
1,441
|
|
—
|
|
893
|
|
1,857
|
|
7,353
|
|
|
Liabilities
|
2
|
—
|
|
—
|
|
(274
|
)
|
(1,170
|
)
|
—
|
|
(1,369
|
)
|
(2,813
|
)
|
|
1
|
Fair value of own debt.
|
|
2
|
After netting off balances within countries, the balances as disclosed in the accounts are as follows: deferred tax assets
$4,676m
(2016:
$6,163m
); and deferred tax liabilities
$1,982m
(2016:
$1,623m
).
|
In applying judgement in recognising deferred tax assets, management has critically assessed all available information, including future business profit projections and the track record of meeting forecasts.
The net deferred tax asset of
$2.7b
n (2016:
$4.5b
n) includes
$3.2b
n (2016:
$4.8b
n) of deferred tax assets relating to the US, of which
$1b
n relates to US tax losses that expire in
16
-
19
years. Management expects the US deferred tax asset to be substantially recovered in
six
to
seven
years, with the majority recovered in the first
five
years. The most recent financial forecasts approved by management covers a
five
-year period and the forecasts have been extrapolated beyond
five
years by assuming that performance remains constant after the fifth year.
The US reported a loss for the prior period, mainly due to the Household International class action litigation settlement, and a profit for the current period. Excluding the Household International class action settlement the US would have reported a profit for the prior period. Management does not expect the prior period loss to adversely impact future deferred tax asset recovery to a significant extent.
US tax reform enacted in late 2017 and effective from 2018 included a reduction in the federal rate of tax from 35%
to 21%
and the introduction of a base erosion anti-avoidance tax. The US deferred tax asset at 31 December 2017 is calculated using the rate of 21%. The remeasurement of the deferred tax asset due to the reduction in tax rate results in charges of
$1.3b
n to the income statement and
$0.3b
n to other comprehensive income. The impact of the base erosion anti-avoidance tax is currently uncertain and will depend on future regulatory guidance and actions management may take. It is not currently expected that the base erosion anti-avoidance tax will have a material impact on the Group’s future tax charges.
Unrecognised deferred tax
The amount of gross temporary differences, unused tax losses and tax credits for which no deferred tax asset is recognised in the balance sheet was
$18.1b
n (2016:
$18.2b
n). These amounts included unused state losses arising in the Group’s US operations of
$12.3b
n (2016:
$12.3b
n). Of the total amounts unrecognised,
$4.8b
n (2016:
$4.9b
n) had no expiry date,
$0.8b
n (2016:
$1.0b
n) was scheduled to expire within
10 years
and the remaining balance is expected to expire after
10 years
.
Deferred tax is not recognised in respect of the Group’s investments in subsidiaries and branches where HSBC is able to control the timing of remittance or other realisation and where remittance or realisation is not probable in the foreseeable future. The aggregate temporary differences relating to unrecognised deferred tax liabilities arising on investments in subsidiaries and branches is
$12.1b
n (2016:
$10.6b
n) and the corresponding unrecognised deferred tax liability is
$0.8b
n (2016:
$0.7b
n).
|
HSBC Holdings plc
|
241
|
Notes on the Financial Statements
|
8
|
Dividends
|
|
Dividends to shareholders of the parent company
|
||||||||||||||||||
|
2017
|
2016
|
2015
|
||||||||||||||||
|
Per
share |
|
Total
|
|
Settled
in scrip |
|
Per
share |
|
Total
|
|
Settled
in scrip |
|
Per
share |
|
Total
|
|
Settled
in scrip |
|
|
|
$
|
|
$m
|
|
$m
|
|
$
|
|
$m
|
|
$m
|
|
$
|
|
$m
|
|
$m
|
|
|
|
Dividends paid on ordinary shares
|
|
|
|
|
|
|
|
|
|
|
|
|
|
|
|
|
|
|
|
In respect of previous year:
|
|
|
|
|
|
|
|
|
|
|
|
|
|
|
|
|
|
|
|
– fourth interim dividend
|
0.21
|
|
4,169
|
|
1,945
|
|
0.21
|
|
4,137
|
|
408
|
|
0.20
|
|
3,845
|
|
2,011
|
|
|
In respect of current year:
|
|
|
|
|
|
|
|
|
|
|
|
|
|
|
|
|
|
|
|
– first interim dividend
|
0.10
|
|
2,005
|
|
826
|
|
0.10
|
|
1,981
|
|
703
|
|
0.10
|
|
1,951
|
|
231
|
|
|
– second interim dividend
|
0.10
|
|
2,014
|
|
193
|
|
0.10
|
|
1,991
|
|
994
|
|
0.10
|
|
1,956
|
|
160
|
|
|
– third interim dividend
|
0.10
|
|
2,005
|
|
242
|
|
0.10
|
|
1,990
|
|
935
|
|
0.10
|
|
1,958
|
|
760
|
|
|
Total
|
0.51
|
|
10,193
|
|
3,206
|
|
0.51
|
|
10,099
|
|
3,040
|
|
0.50
|
|
9,710
|
|
3,162
|
|
|
Total dividends on preference shares classified as equity (paid quarterly)
|
62.00
|
|
90
|
|
|
|
62.00
|
|
90
|
|
|
|
62.00
|
|
90
|
|
|
|
|
Total coupons on capital securities classified as equity
|
|||||||||||
|
2017
|
2016
|
|
2015
|
|
|||||||
|
Total
|
|
Total
|
|
Total
|
|
||||||
|
Footnotes
|
First call date
|
Per security
|
|
$m
|
|
$m
|
|
$m
|
|
||
|
Perpetual subordinated capital securities
|
1, 3
|
||||||||||
|
– $2,200m issued at 8.125%
|
Apr 2013
|
|
$2.032
|
|
179
|
|
179
|
|
179
|
|
|
|
– $3,800m issued at 8.000%
|
Dec 2015
|
|
$2.000
|
|
304
|
|
304
|
|
304
|
|
|
|
Perpetual subordinated contingent convertible securities
|
2, 3
|
||||||||||
|
– $1,500m issued at 5.625%
|
Jan 2020
|
|
$56.250
|
|
84
|
|
84
|
|
70
|
|
|
|
– $2,000m issued at 6.875%
|
Jun 2021
|
|
$68.750
|
|
138
|
|
69
|
|
—
|
|
|
|
– $2,250m issued at 6.375%
|
Sep 2024
|
|
$63.750
|
|
143
|
|
143
|
|
143
|
|
|
|
– $2,450m issued at 6.375%
|
Mar 2025
|
|
$63.750
|
|
156
|
|
156
|
|
78
|
|
|
|
– $3,000m issued at 6.000%
|
May 2027
|
|
$60.000
|
|
90
|
|
—
|
|
—
|
|
|
|
– €1,500m issued at 5.250%
|
Sep 2022
|
|
€52.500
|
|
89
|
|
88
|
|
86
|
|
|
|
– €1,000m issued at 6.000%
|
Sep 2023
|
|
€60.000
|
|
68
|
|
67
|
|
—
|
|
|
|
– SGD1,000m issued at 4.700%
|
Jun 2022
|
SGD47.000
|
|
17
|
|
—
|
|
—
|
|
||
|
Total
|
1,268
|
|
1,090
|
|
860
|
|
|||||
|
1
|
Discretionary coupons are paid quarterly on the perpetual subordinated capital securities, in denominations of
$25
per security.
|
|
2
|
Discretionary coupons are paid semi-annually on the perpetual subordinated contingent convertible securities, in denominations of each security’s issuance currency
1,000
per security.
|
|
3
|
Further details of these securities can be found in Note
31
.
|
After the end of the year, the Directors declared a fourth interim dividend in respect of the financial year ended 31 December 2017 of
$0.21
per ordinary share, a distribution of approximately
$4,199
m. The fourth interim dividend will be payable on 6 April 2018 to holders on the Principal Register in the UK, the Hong Kong Overseas Branch Register or the Bermuda Overseas Branch Register on 23 February 2018.
No
liability was recorded in the financial statements in respect of the fourth interim dividend for 2017.
On 4 January 2018, HSBC paid a coupon on its
€1,250m
subordinated capital securities, representing a total distribution of
€30m
(
$36.3m
)
. On 17 January 2018, HSBC paid a coupon on its
$2,200m
subordinated capital securities of
$0.508
per security, a distribution of
$45m
. On 17 January 2018, HSBC paid a coupon on its
$1,500m
subordinated contingent convertible securities issued at 5.625% of
$28.125
per security, a distribution of
$42m
. No liability was recorded in the balance sheet at 31 December 2017 in respect of these coupon payments.
|
9
|
Earnings per share
|
Basic earnings per ordinary share is calculated by dividing the profit attributable to ordinary shareholders of the parent company by the weighted average number of ordinary shares outstanding, excluding own shares held. Diluted earnings per ordinary share is calculated by dividing the basic earnings, which require no adjustment for the effects of dilutive potential ordinary shares, by the weighted average number of ordinary shares outstanding, excluding own shares held, plus the weighted average number of ordinary shares that would be issued on conversion of dilutive potential ordinary shares.
|
Profit attributable to the ordinary shareholders of the parent company
|
||||||
|
2017
|
|
2016
|
|
2015
|
|
|
|
$m
|
|
$m
|
|
$m
|
|
|
|
Profit attributable to shareholders of the parent company
|
10,798
|
|
2,479
|
|
13,522
|
|
|
Dividend payable on preference shares classified as equity
|
(90
|
)
|
(90
|
)
|
(90
|
)
|
|
Coupon payable on capital securities classified as equity
|
(1,025
|
)
|
(1,090
|
)
|
(860
|
)
|
|
Year ended 31 Dec
|
9,683
|
|
1,299
|
|
12,572
|
|
|
242
|
HSBC Holdings plc
|
|
Basic and diluted earnings per share
|
|||||||||||||||||||
|
2017
|
2016
|
2015
|
|||||||||||||||||
|
Profit
|
|
Number
of shares |
|
Per
share |
|
Profit
|
|
Number
of shares
|
|
Per
share
|
|
Profit
|
|
Number
of shares
|
|
Per
share
|
|
||
|
Footnote
|
$m
|
|
(millions)
|
|
$
|
|
$m
|
|
(millions)
|
|
$
|
|
$m
|
|
(millions)
|
|
$
|
|
|
|
Basic
|
1
|
9,683
|
|
19,972
|
|
0.48
|
|
1,299
|
|
19,753
|
|
0.07
|
|
12,572
|
|
19,380
|
|
0.65
|
|
|
Effect of dilutive potential ordinary shares
|
|
|
100
|
|
|
|
92
|
|
137
|
|
|||||||||
|
Diluted
|
1
|
9,683
|
|
20,072
|
|
0.48
|
|
1,299
|
|
19,845
|
|
0.07
|
|
12,572
|
|
19,517
|
|
0.64
|
|
|
1
|
Weighted average number of ordinary shares outstanding (basic) or assuming dilution (diluted).
|
The number of anti-dilutive employee share options excluded from the weighted average number of dilutive potential ordinary shares is nil (2016:
10m
; 2015:
7m
).
|
10
|
Trading assets
|
|
2017
|
|
2016
|
|
||
|
Footnote
|
$m
|
|
$m
|
|
|
|
Treasury and other eligible bills
|
17,532
|
|
14,451
|
|
|
|
Debt securities
|
107,486
|
|
94,054
|
|
|
|
Equity securities
|
99,260
|
|
63,604
|
|
|
|
Trading securities
|
224,278
|
|
172,109
|
|
|
|
Loans and advances to banks
|
1
|
26,057
|
|
24,769
|
|
|
Loans and advances to customers
|
1
|
37,660
|
|
38,247
|
|
|
At 31 Dec
|
287,995
|
|
235,125
|
|
|
|
1
|
Loans and advances to banks and customers include settlement accounts, stock borrowing, reverse repos, cash collateral and margin accounts relating to trading activities.
|
|
Trading Securities
1
|
|||||
|
2017
|
|
2016
|
|
||
|
Footnotes
|
$m
|
|
$m
|
|
|
|
US Treasury and US Government agencies
|
2
|
15,995
|
|
17,010
|
|
|
UK Government
|
9,540
|
|
9,493
|
|
|
|
Hong Kong Government
|
10,070
|
|
7,970
|
|
|
|
Other governments
|
58,858
|
|
49,229
|
|
|
|
Asset-backed securities
|
3
|
2,986
|
|
2,668
|
|
|
Corporate debt and other securities
|
27,569
|
|
22,135
|
|
|
|
Equity securities
|
99,260
|
|
63,604
|
|
|
|
At 31 Dec
|
224,278
|
|
172,109
|
|
|
|
1
|
Included within these figures are debt securities issued by banks and other financial institutions of
$18,585m
(2016:
$14,630m
), of which
$906m
(2016:
$789m
) are guaranteed by various governments.
|
|
2
|
Includes securities that are supported by an explicit guarantee issued by the US Government.
|
|
3
|
Excludes asset-backed securities included under US Treasury and US Government agencies.
|
|
11
|
Fair values of financial instruments carried at fair value
|
Control framework
Fair values are subject to a control framework designed to ensure that they are either determined or validated by a function independent of the risk taker.
Where fair values are determined by reference to externally quoted prices or observable pricing inputs to models, independent price determination or validation is used. For inactive markets, HSBC sources alternative market information, with greater weight given to information that is considered to be more relevant and reliable. Examples of the factors considered are price observability, instrument comparability, consistency of data sources, underlying data accuracy and timing of prices.
For fair values determined using valuation models, the control framework includes development or validation by independent support functions of the model logic, inputs, model outputs and adjustments. Valuation models are subject to a process of due diligence before becoming operational and are calibrated against external market data on an ongoing basis.
Changes in fair value are generally subject to a profit and loss analysis process and are disaggregated into high-level categories including portfolio changes, market movements and other fair value adjustments.
The majority of financial instruments measured at fair value are in GB&M. GB&M’s fair value governance structure comprises its Finance function, Valuation Committees and a Valuation Committee Review Group. Finance is responsible for establishing procedures governing valuation and ensuring fair values are in compliance with accounting standards. The fair values are reviewed by the Valuation Committees, which consist of independent support functions. These Committees are overseen by the Valuation Committee Review Group, which considers all material subjective valuations.
|
HSBC Holdings plc
|
243
|
Notes on the Financial Statements
Financial liabilities measured at fair value
In certain circumstances, HSBC records its own debt in issue at fair value, based on quoted prices in an active market for the specific instrument. When quoted market prices are unavailable, the own debt in issue is valued using valuation techniques, the inputs for which are either based on quoted prices in an inactive market for the instrument or are estimated by comparison with quoted prices in an active market for similar instruments. In both cases, the fair value includes the effect of applying the credit spread which is appropriate to HSBC’s liabilities. The change in fair value of issued debt securities attributable to the Group’s own credit spread is computed as follows: for each security at each reporting date, an externally verifiable price is obtained or a price is derived using credit spreads for similar securities for the same issuer. Then, using discounted cash flow, each security is valued using a Libor-based discount curve. The difference in the valuations is attributable to the Group’s own credit spread. This methodology is applied consistently across all securities.
Structured notes issued and certain other hybrid instruments are included within trading liabilities and are measured at fair value. The credit spread applied to these instruments is derived from the spreads at which HSBC issues structured notes.
Gains and losses arising from changes in the credit spread of liabilities issued by HSBC reverse over the contractual life of the debt, provided that the debt is not repaid at a premium or a discount.
Fair value hierarchy
Fair values of financial assets and liabilities are determined according to the following hierarchy:
|
•
|
Level 1 – valuation technique using quoted market price: financial instruments with quoted prices for identical instruments in active markets that HSBC can access at the measurement date.
|
|
•
|
Level 2 – valuation technique using observable inputs: financial instruments with quoted prices for similar instruments in active markets or quoted prices for identical or similar instruments in inactive markets and financial instruments valued using models where all significant inputs are observable.
|
|
•
|
Level 3 – valuation technique with significant unobservable inputs: financial instruments valued using valuation techniques where one or more significant inputs are unobservable.
|
|
Financial instruments carried at fair value and bases of valuation
|
||||||||||||||||
|
2017
|
2016
|
|||||||||||||||
|
Level 1
|
|
Level 2
|
|
Level 3
|
|
Total
|
|
Level 1
|
|
Level 2
|
|
Level 3
|
|
Total
|
|
|
|
$m
|
|
$m
|
|
$m
|
|
$m
|
|
$m
|
|
$m
|
|
$m
|
|
$m
|
|
|
|
Recurring fair value measurements
at 31 Dec |
||||||||||||||||
|
Assets
|
||||||||||||||||
|
Trading assets
|
181,168
|
|
101,775
|
|
5,052
|
|
287,995
|
|
133,744
|
|
94,892
|
|
6,489
|
|
235,125
|
|
|
Financial assets designated at fair value
|
24,622
|
|
3,382
|
|
1,460
|
|
29,464
|
|
19,882
|
|
4,144
|
|
730
|
|
24,756
|
|
|
Derivatives
|
1,017
|
|
216,357
|
|
2,444
|
|
219,818
|
|
1,076
|
|
287,044
|
|
2,752
|
|
290,872
|
|
|
Financial investments: available for sale
|
227,943
|
|
104,692
|
|
3,432
|
|
336,067
|
|
274,655
|
|
111,743
|
|
3,476
|
|
389,874
|
|
|
Liabilities
|
||||||||||||||||
|
Trading liabilities
|
62,710
|
|
117,451
|
|
4,200
|
|
184,361
|
|
45,171
|
|
104,938
|
|
3,582
|
|
153,691
|
|
|
Financial liabilities designated at fair value
|
4,164
|
|
90,265
|
|
—
|
|
94,429
|
|
4,248
|
|
82,547
|
|
37
|
|
86,832
|
|
|
Derivatives
|
1,635
|
|
213,242
|
|
1,944
|
|
216,821
|
|
1,554
|
|
275,965
|
|
2,300
|
|
279,819
|
|
|
Transfers between Level 1 and Level 2 fair values
|
||||||||||||||
|
Assets
|
Liabilities
|
|||||||||||||
|
Available
for sale |
|
Held for trading
|
|
Designated
at fair value |
|
Derivatives
|
|
Held for trading
|
|
Designated
at fair value |
|
Derivatives
|
|
|
|
$m
|
|
$m
|
|
$m
|
|
$m
|
|
$m
|
|
$m
|
|
$m
|
|
|
|
At 31 Dec 2017
|
||||||||||||||
|
Transfers from Level 1 to Level 2
|
2,231
|
|
1,507
|
|
—
|
|
—
|
|
35
|
|
—
|
|
—
|
|
|
Transfers from Level 2 to Level 1
|
11,173
|
|
1,384
|
|
—
|
|
—
|
|
683
|
|
—
|
|
—
|
|
|
At 31 Dec 2016
|
||||||||||||||
|
Transfers from Level 1 to Level 2
|
162
|
|
1,614
|
|
122
|
|
465
|
|
2,699
|
|
—
|
|
209
|
|
|
Transfers from Level 2 to Level 1
|
1,314
|
|
—
|
|
—
|
|
—
|
|
341
|
|
—
|
|
—
|
|
Transfers between levels of the fair value hierarchy are deemed to occur at the end of each semi-annual reporting period. Transfers into and out of levels of the fair value hierarchy are primarily attributable to observability of valuation inputs and price transparency.
Fair value adjustments
Fair value adjustments are adopted when HSBC determines there are additional factors considered by market participants that are not incorporated within the valuation model.
Movements in the level of fair value adjustments do not necessarily result in the recognition of profits or losses within the income statement, such as when models are enhanced and therefore fair value adjustments may no longer be required
|
244
|
HSBC Holdings plc
|
|
Global Banking & Markets (‘GB&M’) and Corporate Centre fair value adjustments
|
||||||||
|
2017
|
2016
|
|||||||
|
GB&M
|
|
Corporate Centre
|
|
GB&M
|
|
Corporate Centre
|
|
|
|
$m
|
|
$m
|
|
$m
|
|
$m
|
|
|
|
Type of adjustment
|
||||||||
|
Risk-related
|
1,078
|
|
79
|
|
1,131
|
|
5
|
|
|
– bid-offer
|
413
|
|
5
|
|
416
|
|
5
|
|
|
– uncertainty
|
91
|
|
8
|
|
87
|
|
—
|
|
|
– credit valuation adjustment (‘CVA’)
|
420
|
|
59
|
|
633
|
|
—
|
|
|
– debit valuation adjustment (‘DVA’)
|
(82
|
)
|
—
|
|
(437
|
)
|
—
|
|
|
– funding fair value adjustment (‘FFVA’)
|
233
|
|
7
|
|
429
|
|
—
|
|
|
– other
|
3
|
|
—
|
|
3
|
|
—
|
|
|
Model-related
|
92
|
|
13
|
|
14
|
|
1
|
|
|
– model limitation
|
92
|
|
6
|
|
14
|
|
1
|
|
|
– other
|
—
|
|
7
|
|
—
|
|
—
|
|
|
Inception profit (Day 1 P&L reserves) (Note 14)
|
106
|
|
—
|
|
99
|
|
—
|
|
|
At 31 Dec
|
1,276
|
|
92
|
|
1,244
|
|
6
|
|
Fair value adjustments increased by
$118m
during the year. Movements in CVA, DVA, FFVA and model limitations were driven by tightening credit spreads and refinements to model methodology.
Fair value adjustments under Corporate Centre in 2017 include the transfer of balances on legacy positions no longer managed in GB&M.
Bid-offer
IFRS 13 ‘Fair value measurement’ requires use of the price within the bid-offer spread that is most representative of fair value. Valuation models will typically generate mid-market values. The bid-offer adjustment reflects the extent to which bid-offer costs would be incurred if substantially all residual net portfolio market risks were closed using available hedging instruments or by disposing of or unwinding the position.
Uncertainty
Certain model inputs may be less readily determinable from market data, and/or the choice of model itself may be more subjective. In these circumstances an adjustment may be necessary to reflect the likelihood that market participants would adopt more conservative values for uncertain parameters and/or model assumptions than those used in HSBC’s valuation model.
Credit and debit valuation adjustments
The CVA is an adjustment to the valuation of over-the-counter (‘OTC’) derivative contracts to reflect the possibility that the counterparty may default and that HSBC may not receive the full market value of the transactions.
The DVA is an adjustment to the valuation of OTC derivative contracts to reflect the possibility that HSBC may default, and that it may not pay the full market value of the transactions.
HSBC calculates a separate CVA and DVA for each legal entity, and for each counterparty to which the entity has exposure. With the exception of central clearing parties, all third-party counterparties are included in the CVA and DVA calculations, and these adjustments are not netted across Group entities.
HSBC calculates the CVA by applying the probability of default (‘PD’) of the counterparty, conditional on the non-default of HSBC, to HSBC’s expected positive exposure to the counterparty and multiplying the result by the loss expected in the event of default. Conversely, HSBC calculates the DVA by applying the PD of HSBC, conditional on the non-default of the counterparty, to the expected positive exposure of the counterparty to HSBC and multiplying the result by the loss expected in the event of default. Both calculations are performed over the life of the potential exposure.
For most products HSBC uses a simulation methodology, which incorporates a range of potential exposures over the life of the portfolio, to calculate the expected positive exposure to a counterparty. The simulation methodology includes credit mitigants, such as counterparty netting agreements and collateral agreements with the counterparty.
The methodologies do not, in general, account for ‘wrong-way risk’. Wrong-way risk is an adverse correlation between the counterparty’s probability of default and the mark-to-market value of the underlying transaction. The risk can either be general, perhaps related to the currency of the issuer country, or specific to the transaction concerned. When there is significant wrong-way risk, a trade-specific approach is applied to reflect this risk in the valuation.
Funding fair value adjustment
The FFVA is calculated by applying future market funding spreads to the expected future funding exposure of any uncollateralised component of the OTC derivative portfolio. The expected future funding exposure is calculated by a simulation methodology, where available, and is adjusted for events that may terminate the exposure, such as the default of HSBC or the counterparty. The FFVA and DVA are calculated independently.
Model limitation
Models used for portfolio valuation purposes may be based upon a simplified set of assumptions that do not capture all current and future material market characteristics. In these circumstances, model limitation adjustments are adopted.
Inception profit (Day 1 P&L reserves)
Inception profit adjustments are adopted when the fair value estimated by a valuation model is based on one or more significant unobservable inputs. The accounting for inception profit adjustments is discussed in Note
1
.
|
HSBC Holdings plc
|
245
|
Notes on the Financial Statements
Fair value valuation bases
|
Financial instruments measured at fair value using a valuation technique with significant unobservable inputs – Level 3
|
||||||||||||||||||
|
Assets
|
Liabilities
|
|||||||||||||||||
|
Available
for sale
|
|
Held for trading
|
|
Designated at fair value
|
|
Derivatives
|
|
Total
|
|
Held for trading
|
|
Designated at fair value
|
|
Derivatives
|
|
Total
|
|
|
|
$m
|
|
$m
|
|
$m
|
|
$m
|
|
$m
|
|
$m
|
|
$m
|
|
$m
|
|
$m
|
|
|
|
Private equity including strategic investments
|
2,012
|
|
38
|
|
1,458
|
|
—
|
|
3,508
|
|
20
|
|
—
|
|
—
|
|
20
|
|
|
Asset-backed securities
|
1,300
|
|
1,277
|
|
—
|
|
—
|
|
2,577
|
|
—
|
|
—
|
|
—
|
|
—
|
|
|
Loans held for securitisation
|
—
|
|
24
|
|
—
|
|
—
|
|
24
|
|
—
|
|
—
|
|
—
|
|
—
|
|
|
Structured notes
|
—
|
|
3
|
|
—
|
|
—
|
|
3
|
|
4,180
|
|
—
|
|
—
|
|
4,180
|
|
|
Derivatives with monolines
|
—
|
|
—
|
|
—
|
|
113
|
|
113
|
|
—
|
|
—
|
|
—
|
|
—
|
|
|
Other derivatives
|
—
|
|
—
|
|
—
|
|
2,331
|
|
2,331
|
|
—
|
|
—
|
|
1,944
|
|
1,944
|
|
|
Other portfolios
|
120
|
|
3,710
|
|
2
|
|
—
|
|
3,832
|
|
—
|
|
—
|
|
—
|
|
—
|
|
|
At 31 Dec 2017
|
3,432
|
|
5,052
|
|
1,460
|
|
2,444
|
|
12,388
|
|
4,200
|
|
—
|
|
1,944
|
|
6,144
|
|
|
Private equity including strategic investments
|
2,435
|
|
49
|
|
712
|
|
—
|
|
3,196
|
|
25
|
|
—
|
|
—
|
|
25
|
|
|
Asset-backed securities
|
761
|
|
789
|
|
—
|
|
—
|
|
1,550
|
|
—
|
|
—
|
|
—
|
|
—
|
|
|
Loans held for securitisation
|
—
|
|
28
|
|
—
|
|
—
|
|
28
|
|
—
|
|
—
|
|
—
|
|
—
|
|
|
Structured notes
|
—
|
|
2
|
|
—
|
|
—
|
|
2
|
|
3,557
|
|
—
|
|
—
|
|
3,557
|
|
|
Derivatives with monolines
|
—
|
|
—
|
|
—
|
|
175
|
|
175
|
|
—
|
|
—
|
|
—
|
|
—
|
|
|
Other derivatives
|
—
|
|
—
|
|
—
|
|
2,577
|
|
2,577
|
|
—
|
|
—
|
|
2,300
|
|
2,300
|
|
|
Other portfolios
|
280
|
|
5,621
|
|
18
|
|
—
|
|
5,919
|
|
—
|
|
37
|
|
—
|
|
37
|
|
|
At 31 Dec 2016
|
3,476
|
|
6,489
|
|
730
|
|
2,752
|
|
13,447
|
|
3,582
|
|
37
|
|
2,300
|
|
5,919
|
|
Level 3 instruments are present in both ongoing and legacy businesses. Loans held for securitisation, derivatives with monolines, certain ‘other derivatives’ and predominantly all Level 3 ABSs are legacy positions. HSBC has the capability to hold these positions.
Private equity including strategic investments
The investment’s fair value is estimated: on the basis of an analysis of the investee’s financial position and results, risk profile, prospects and other factors; by reference to market valuations for similar entities quoted in an active market; or the price at which similar companies have changed ownership.
Asset-backed securities
While quoted market prices are generally used to determine the fair value of these securities, valuation models are used to substantiate the reliability of the limited market data available and to identify whether any adjustments to quoted market prices are required. For certain ABSs such as residential mortgage-backed securities, the valuation uses an industry standard model with assumptions relating to prepayment speeds, default rates and loss severity based on collateral type, and performance, as appropriate. The valuations output is benchmarked for consistency against observable data for securities of a similar nature.
Structured notes
The fair value of Level 3 structured notes is derived from the fair value of the underlying debt security, and the fair value of the embedded derivative is determined as described in the paragraph below on derivatives. These structured notes comprise principally equity-linked notes issued by HSBC which provide the counterparty with a return linked to the performance of equity securities and other portfolios. Examples of the unobservable parameters include long-dated equity volatilities and correlations between equity prices, and interest and foreign exchange rates.
Derivatives
OTC derivative valuation models calculate the present value of expected future cash flows, based upon ‘no-arbitrage’ principles. For many vanilla derivative products, the modelling approaches used are standard across the industry. For more complex derivative products, there may be some differences in market practice. Inputs to valuation models are determined from observable market data wherever possible, including prices available from exchanges, dealers, brokers or providers of consensus pricing. Certain inputs may not be observable in the market directly, but can be determined from observable prices via model calibration procedures or estimated from historical data or other sources.
|
246
|
HSBC Holdings plc
|
Reconciliation of fair value measurements in Level 3 of the fair value hierarchy
|
Movement in Level 3 financial instruments
|
|||||||||||||||
|
Assets
|
Liabilities
|
||||||||||||||
|
Available
for sale |
|
Held for trading
|
|
Designated
at fair value |
|
Derivatives
|
|
Held for trading
|
|
Designated
at fair value |
|
Derivatives
|
|
||
|
Footnote
|
$m
|
|
$m
|
|
$m
|
|
$m
|
|
$m
|
|
$m
|
|
$m
|
|
|
|
At 1 Jan 2017
|
3,476
|
|
6,489
|
|
730
|
|
2,752
|
|
3,582
|
|
37
|
|
2,300
|
|
|
|
Total gains/(losses) recognised in profit or loss
|
351
|
|
(188
|
)
|
(107
|
)
|
152
|
|
154
|
|
(5
|
)
|
400
|
|
|
|
– trading income/(expense) excluding net interest income
|
—
|
|
(188
|
)
|
—
|
|
152
|
|
154
|
|
—
|
|
400
|
|
|
|
– net income/(expense) from other financial instruments designated at fair value
|
—
|
|
—
|
|
(107
|
)
|
—
|
|
—
|
|
(5
|
)
|
—
|
|
|
|
– gains less losses from financial investments
|
313
|
|
—
|
|
—
|
|
—
|
|
—
|
|
—
|
|
—
|
|
|
|
– loan impairment charges and other credit risk provisions (‘LICs’)
|
38
|
|
—
|
|
—
|
|
—
|
|
—
|
|
—
|
|
—
|
|
|
|
Total gains/(losses) recognised in other comprehensive income (‘OCI’)
|
1
|
71
|
|
106
|
|
7
|
|
188
|
|
169
|
|
1
|
|
120
|
|
|
– available-for-sale investments: fair value gains/(losses)
|
(30
|
)
|
—
|
|
—
|
|
—
|
|
—
|
|
—
|
|
—
|
|
|
|
– cash flow hedges: fair value gains/(losses)
|
—
|
|
(1
|
)
|
3
|
|
(23
|
)
|
—
|
|
—
|
|
(35
|
)
|
|
|
– exchange differences
|
101
|
|
107
|
|
4
|
|
211
|
|
169
|
|
1
|
|
155
|
|
|
|
Purchases
|
200
|
|
1,503
|
|
1,127
|
|
2
|
|
5
|
|
—
|
|
23
|
|
|
|
New issuances
|
—
|
|
—
|
|
—
|
|
1
|
|
1,915
|
|
—
|
|
—
|
|
|
|
Sales
|
(939
|
)
|
(3,221
|
)
|
(130
|
)
|
(8
|
)
|
(12
|
)
|
—
|
|
(12
|
)
|
|
|
Settlements
|
(69
|
)
|
(331
|
)
|
(166
|
)
|
(60
|
)
|
(998
|
)
|
—
|
|
(123
|
)
|
|
|
Transfers out
|
(565
|
)
|
(149
|
)
|
(3
|
)
|
(885
|
)
|
(678
|
)
|
(33
|
)
|
(1,030
|
)
|
|
|
Transfers in
|
907
|
|
843
|
|
2
|
|
302
|
|
63
|
|
—
|
|
266
|
|
|
|
At 31 Dec 2017
|
3,432
|
|
5,052
|
|
1,460
|
|
2,444
|
|
4,200
|
|
—
|
|
1,944
|
|
|
|
Unrealised gains/(losses) recognised in profit or loss relating to assets and liabilities held at 31 Dec 2016
|
16
|
|
(110
|
)
|
(146
|
)
|
218
|
|
(117
|
)
|
—
|
|
(397
|
)
|
|
|
– trading income/(expense) excluding net interest income
|
—
|
|
(110
|
)
|
—
|
|
218
|
|
(117
|
)
|
—
|
|
(397
|
)
|
|
|
– net income/(expense) from other financial instruments designated at fair value
|
—
|
|
—
|
|
(146
|
)
|
—
|
|
—
|
|
—
|
|
—
|
|
|
|
– loan impairment charges and other credit risk provisions
|
16
|
|
—
|
|
—
|
|
—
|
|
—
|
|
—
|
|
—
|
|
|
|
At 1 Jan 2016
|
4,727
|
|
6,856
|
|
474
|
|
2,262
|
|
4,285
|
|
3
|
|
1,210
|
|
|
|
Total gains/(losses) recognised in profit or loss
|
178
|
|
31
|
|
25
|
|
1,107
|
|
337
|
|
(1
|
)
|
1,428
|
|
|
|
– trading income/(expense) excluding net interest income
|
—
|
|
31
|
|
—
|
|
1,107
|
|
337
|
|
—
|
|
1,428
|
|
|
|
– net income from other financial instruments designated at fair value
|
—
|
|
—
|
|
25
|
|
—
|
|
—
|
|
(1
|
)
|
—
|
|
|
|
– gains less losses from financial investments
|
91
|
|
—
|
|
—
|
|
—
|
|
—
|
|
—
|
|
—
|
|
|
|
– loan impairment charges and other credit risk provisions (‘LICs’)
|
87
|
|
—
|
|
—
|
|
—
|
|
—
|
|
—
|
|
—
|
|
|
|
Total gains/(losses) recognised in other comprehensive income (‘OCI’)
|
1
|
(162
|
)
|
(610
|
)
|
(8
|
)
|
(335
|
)
|
(130
|
)
|
(1
|
)
|
(240
|
)
|
|
– available-for-sale investments: fair value gains/(losses)
|
123
|
|
—
|
|
—
|
|
—
|
|
—
|
|
—
|
|
—
|
|
|
|
– cash flow hedges: fair value gains/(losses)
|
—
|
|
—
|
|
—
|
|
—
|
|
—
|
|
—
|
|
12
|
|
|
|
– exchange differences
|
(285
|
)
|
(610
|
)
|
(8
|
)
|
(335
|
)
|
(130
|
)
|
(1
|
)
|
(252
|
)
|
|
|
Purchases
|
350
|
|
823
|
|
359
|
|
—
|
|
20
|
|
6
|
|
—
|
|
|
|
New issuances
|
—
|
|
—
|
|
—
|
|
—
|
|
1,882
|
|
—
|
|
—
|
|
|
|
Sales
|
(1,212
|
)
|
(1,760
|
)
|
(7
|
)
|
—
|
|
(40
|
)
|
(2
|
)
|
—
|
|
|
|
Settlements
|
(177
|
)
|
(311
|
)
|
(113
|
)
|
(107
|
)
|
(1,907
|
)
|
—
|
|
(239
|
)
|
|
|
Transfers out
|
(947
|
)
|
(199
|
)
|
(2
|
)
|
(187
|
)
|
(920
|
)
|
—
|
|
(229
|
)
|
|
|
Transfers in
|
719
|
|
1,659
|
|
2
|
|
12
|
|
55
|
|
32
|
|
370
|
|
|
|
At 31 Dec 2016
|
3,476
|
|
6,489
|
|
730
|
|
2,752
|
|
3,582
|
|
37
|
|
2,300
|
|
|
|
Unrealised gains/(losses) recognised in profit or loss relating to assets and liabilities held at 31 Dec 2015
|
87
|
|
(170
|
)
|
21
|
|
364
|
|
(143
|
)
|
1
|
|
(335
|
)
|
|
|
– trading income/(expense) excluding net interest income
|
—
|
|
(170
|
)
|
—
|
|
364
|
|
(143
|
)
|
—
|
|
(335
|
)
|
|
|
– net income from other financial instruments designated at fair value
|
—
|
|
—
|
|
21
|
|
—
|
|
—
|
|
1
|
|
—
|
|
|
|
– loan impairment charges and other credit risk provisions
|
87
|
|
—
|
|
—
|
|
—
|
|
—
|
|
—
|
|
—
|
|
|
|
1
|
Included in ‘Available-for-sale investments: fair value gains/(losses)’ and ‘Exchange differences’ in the consolidated statement of comprehensive income.
|
Transfers between levels of the fair value hierarchy are deemed to occur at the end of each semi-annual reporting period. Transfers into and out of Levels of the fair value hierarchy are primarily attributable to observability of valuation inputs and price transparency.
|
HSBC Holdings plc
|
247
|
Notes on the Financial Statements
Effect of changes in significant unobservable assumptions to reasonably possible alternatives
|
Sensitivity of Level 3 fair values to reasonably possible alternative assumptions
|
|||||||||||||||||
|
2017
|
2016
|
||||||||||||||||
|
Reflected in profit or loss
|
Reflected in OCI
|
Reflected in profit or loss
|
Reflected in OCI
|
||||||||||||||
|
Favourable
changes |
|
Un-
favourable changes |
|
Favourable
changes |
|
Un-
favourable changes |
|
Favourable
changes |
|
Un-
favourable changes |
|
Favourable
changes |
|
Un-
favourable changes |
|
||
|
Footnote
|
$m
|
|
$m
|
|
$m
|
|
$m
|
|
$m
|
|
$m
|
|
$m
|
|
$m
|
|
|
|
Derivatives, trading assets and trading liabilities
|
1
|
372
|
|
(253
|
)
|
—
|
|
—
|
|
238
|
|
(177
|
)
|
—
|
|
—
|
|
|
Financial assets and liabilities designated at fair value
|
89
|
|
(74
|
)
|
—
|
|
—
|
|
48
|
|
(38
|
)
|
—
|
|
—
|
|
|
|
Financial investments: available for sale
|
53
|
|
(30
|
)
|
128
|
|
(149
|
)
|
72
|
|
(36
|
)
|
170
|
|
(149
|
)
|
|
|
At 31 Dec
|
514
|
|
(357
|
)
|
128
|
|
(149
|
)
|
358
|
|
(251
|
)
|
170
|
|
(149
|
)
|
|
|
1
|
Derivatives, trading assets and trading liabilities are presented as one category to reflect the manner in which these instruments are risk managed.
|
|
Sensitivity of Level 3 fair values to reasonably possible alternative assumptions by instrument type
|
||||||||||||||||
|
2017
|
2016
|
|||||||||||||||
|
Reflected in profit or loss
|
Reflected in OCI
|
Reflected in profit or loss
|
Reflected in OCI
|
|||||||||||||
|
Favourable
changes |
|
Un-
favourable changes |
|
Favourable
changes |
|
Un-
favourable changes |
|
Favourable
changes |
|
Un-
favourable changes |
|
Favourable
changes |
|
Un-
favourable changes |
|
|
|
$m
|
|
$m
|
|
$m
|
|
$m
|
|
$m
|
|
$m
|
|
$m
|
|
$m
|
|
|
|
Private equity including strategic investments
|
142
|
|
(105
|
)
|
117
|
|
(102
|
)
|
112
|
|
(73
|
)
|
121
|
|
(106
|
)
|
|
Asset-backed securities
|
66
|
|
(39
|
)
|
3
|
|
(39
|
)
|
43
|
|
(15
|
)
|
33
|
|
(27
|
)
|
|
Loans held for securitisation
|
1
|
|
(1
|
)
|
—
|
|
—
|
|
1
|
|
(1
|
)
|
—
|
|
—
|
|
|
Structured notes
|
12
|
|
(9
|
)
|
—
|
|
—
|
|
10
|
|
(7
|
)
|
—
|
|
—
|
|
|
Derivatives with monolines
|
—
|
|
—
|
|
—
|
|
—
|
|
3
|
|
(3
|
)
|
—
|
|
—
|
|
|
Other derivatives
|
249
|
|
(150
|
)
|
—
|
|
—
|
|
141
|
|
(94
|
)
|
—
|
|
—
|
|
|
Other portfolios
|
44
|
|
(53
|
)
|
8
|
|
(8
|
)
|
48
|
|
(58
|
)
|
16
|
|
(16
|
)
|
|
At 31 Dec
|
514
|
|
(357
|
)
|
128
|
|
(149
|
)
|
358
|
|
(251
|
)
|
170
|
|
(149
|
)
|
The sensitivity analysis aims to measure a range of fair values consistent with the application of a 95% confidence interval. Methodologies take account of the nature of the valuation technique employed, as well as the availability and reliability of observable proxy and historical data.
When the fair value of a financial instrument is affected by more than one unobservable assumption, the above table reflects the most favourable or the most unfavourable change from varying the assumptions individually.
|
248
|
HSBC Holdings plc
|
Key unobservable inputs to Level 3 financial instruments
|
Quantitative information about significant unobservable inputs in Level 3 valuations
|
|||||||||||||||||||
|
Fair value
|
2017
|
2016
|
|||||||||||||||||
|
Assets
|
|
Liabilities
|
|
Valuation
techniques |
Key unobservable
inputs |
Full range
of inputs |
Core range
of inputs 1 |
Full range
of inputs |
Core range
of inputs 1 |
||||||||||
|
Footnotes
|
$m
|
|
$m
|
|
Lower
|
|
Higher
|
|
Lower
|
|
Higher
|
|
Lower
|
Higher
|
Lower
|
Higher
|
|||
|
Private equity including
strategic investments |
3,508
|
|
20
|
|
See page 255
|
See page 255
|
n/a
|
|
n/a
|
|
n/a
|
|
n/a
|
|
n/a
|
n/a
|
n/a
|
n/a
|
|
|
Asset-backed securities
|
2
|
2,577
|
|
|
|
||||||||||||||
|
– CLO/CDO
|
520
|
|
|
|
Market proxy
|
Prepayment rate
|
2
|
%
|
7
|
%
|
2
|
%
|
7
|
%
|
2%
|
7%
|
2%
|
7%
|
|
|
Market proxy
|
Bid quotes
|
0
|
|
101
|
|
6
|
|
53
|
|
0
|
101
|
42
|
94
|
||||||
|
– other ABSs
|
2,057
|
|
|
|
Market proxy
|
Bid quotes
|
0
|
|
103
|
|
34
|
|
98
|
|
0
|
96
|
57
|
90
|
|
|
Loans held for securitisation
|
24
|
|
—
|
|
|||||||||||||||
|
Structured notes
|
3
|
|
4,180
|
|
|||||||||||||||
|
– equity-linked notes
|
—
|
|
4,077
|
|
Model –
Option model |
Equity volatility
|
7%
|
|
47%
|
|
14%
|
|
30%
|
|
11%
|
96%
|
16%
|
36%
|
|
|
|
|
|
Model – Option model
|
Equity correlation
|
33%
|
|
95%
|
|
45%
|
|
72%
|
|
33%
|
94%
|
46%
|
81%
|
|||
|
– fund-linked notes
|
—
|
|
7
|
|
Model – Option model
|
Fund volatility
|
6%
|
|
15%
|
|
6%
|
|
15%
|
|
6%
|
11%
|
6%
|
11%
|
|
|
– FX-linked notes
|
—
|
|
76
|
|
Model – Option model
|
FX volatility
|
3%
|
|
20%
|
|
4%
|
|
13%
|
|
3%
|
29%
|
5%
|
18%
|
|
|
– other
|
3
|
|
20
|
|
|||||||||||||||
|
Derivatives with monolines
|
113
|
|
—
|
|
Model – Discounted
cash flow |
Credit spread
|
0.4%
|
|
3%
|
|
1%
|
|
3%
|
|
2%
|
2%
|
2%
|
2%
|
|
|
Other derivatives
|
2,331
|
|
1,944
|
|
|
|
|
|
|
|
|
|
|
|
|
|
|
|
|
|
– Interest rate derivatives:
|
|
|
|
|
|
|
|
|
|
|
|
|
|
|
|
|
|
|
|
|
securitisation swaps
|
285
|
|
806
|
|
Model – Discounted
cash flow |
Prepayment
rate |
20%
|
|
90%
|
|
20%
|
|
90%
|
|
0%
|
90%
|
8%
|
27%
|
|
|
long-dated swaptions
|
1,244
|
|
66
|
|
Model – Option model
|
IR volatility
|
8%
|
|
41%
|
|
15%
|
|
31%
|
|
8%
|
101%
|
21%
|
39%
|
|
|
other
|
302
|
|
145
|
|
|||||||||||||||
|
– FX derivatives:
|
|
|
|
|
|||||||||||||||
|
FX options
|
86
|
|
83
|
|
Model – Option model
|
FX volatility
|
0.7%
|
|
50%
|
|
5%
|
|
11%
|
|
0.6%
|
25%
|
7%
|
12%
|
|
|
other
|
135
|
|
129
|
|
|||||||||||||||
|
– Equity derivatives:
|
|
|
|
|
|||||||||||||||
|
long-dated single stock options
|
158
|
|
359
|
|
Model – Option model
|
Equity volatility
|
7%
|
|
84%
|
|
15%
|
|
44%
|
|
11%
|
83%
|
16%
|
36%
|
|
|
other
|
96
|
|
329
|
|
|||||||||||||||
|
– Credit derivatives:
|
|
|
|
|
|||||||||||||||
|
other
|
25
|
|
27
|
|
|||||||||||||||
|
Other portfolios
|
3,832
|
|
—
|
|
|||||||||||||||
|
– structured certificates
|
3,014
|
|
—
|
|
Model – Discounted cash flow
|
Credit volatility
|
2%
|
|
4%
|
|
2%
|
|
4%
|
|
3%
|
4%
|
3%
|
4%
|
|
|
– EM corporate debt
|
85
|
|
—
|
|
Market proxy
|
Bid quotes
|
100
|
|
100
|
|
100
|
|
100
|
|
96
|
144
|
113
|
113
|
|
|
– other
|
3
|
733
|
|
—
|
|
||||||||||||||
|
At 31 Dec 2017
|
12,388
|
|
6,144
|
|
|||||||||||||||
|
1
|
The core range of inputs is the estimated range within which
90%
of the inputs fall.
|
|
2
|
Collateralised loan obligation/collateralised debt obligation.
|
|
3
|
‘Other’ includes a range of smaller asset holdings.
|
Private equity including strategic investments
Given the bespoke nature of the analysis in respect of each holding, it is not practical to quote a range of key unobservable inputs.
Prepayment rates
Prepayment rates are a measure of the anticipated future speed at which a loan portfolio will be repaid in advance of the due date. They vary according to the nature of the loan portfolio and expectations of future market conditions, and may be estimated using a variety of evidence, such as prepayment rates implied from proxy observable security prices, current or historical prepayment rates and macroeconomic modelling.
Market proxy
Market proxy pricing may be used for an instrument when specific market pricing is not available but there is evidence from instruments with common characteristics. In some cases it might be possible to identify a specific proxy, but more generally evidence across a wider range of instruments will be used to understand the factors that influence current market pricing and the manner of that influence.
|
HSBC Holdings plc
|
249
|
Notes on the Financial Statements
Volatility
Volatility is a measure of the anticipated future variability of a market price. It varies by underlying reference market price, and by strike and maturity of the option.
Certain volatilities, typically those of a longer-dated nature, are unobservable and are estimated from observable data. The range of unobservable volatilities reflects the wide variation in volatility inputs by reference market price. The core range is significantly narrower than the full range because these examples with extreme volatilities occur relatively rarely within the HSBC portfolio.
Correlation
Correlation is a measure of the inter-relationship between two market prices and is expressed as a number between minus one and one. It is used to value more complex instruments where the payout is dependent upon more than one market price. There is a wide range of instruments for which correlation is an input, and consequently a wide range of both same-asset correlations and cross-asset correlations is used. In general, the range of same-asset correlations will be narrower than the range of cross-asset correlations.
Unobservable correlations may be estimated based upon a range of evidence, including consensus pricing services, HSBC trade prices, proxy correlations and examination of historical price relationships. The range of unobservable correlations quoted in the table reflects the wide variation in correlation inputs by market price pair.
Credit spread
Credit spread is the premium over a benchmark interest rate required by the market to accept lower credit quality. In a discounted cash flow model, the credit spread increases the discount factors applied to future cash flows, thereby reducing the value of an asset. Credit spreads may be implied from market prices and may not be observable in more illiquid markets.
Inter-relationships between key unobservable inputs
Key unobservable inputs to Level 3 financial instruments may not be independent of each other. As described above, market variables may be correlated. This correlation typically reflects the manner in which different markets tend to react to macroeconomic or other events. Furthermore, the effect of changing market variables on the HSBC portfolio will depend on HSBC’s net risk position in respect of each variable.
HSBC Holdings
|
Basis of valuing HSBC Holdings’ financial assets and liabilities measured at fair value
|
||||
|
2017
|
|
2016
|
|
|
|
$m
|
|
$m
|
|
|
|
Valuation technique using observable inputs: Level 2
|
||||
|
Assets at 31 Dec
|
||||
|
– derivatives
|
2,388
|
|
2,148
|
|
|
– financial investments in HSBC undertakings
|
4,264
|
|
3,590
|
|
|
– loans and advances to HSBC undertakings designated at fair value
|
11,944
|
|
—
|
|
|
Liabilities at 31 Dec
|
|
|
|
|
|
– designated at fair value
|
30,890
|
|
30,113
|
|
|
– derivatives
|
3,082
|
|
5,025
|
|
|
250
|
HSBC Holdings plc
|
|
12
|
Fair values of financial instruments not carried at fair value
|
|
Fair values of financial instruments not carried at fair value and bases of valuation
|
||||||||||
|
Fair value
|
||||||||||
|
Carrying
amount |
|
Quoted market
price Level 1 |
|
Observable
inputs Level 2 |
|
Significant
unobservable inputs Level 3 |
|
Total
|
|
|
|
$m
|
|
$m
|
|
$m
|
|
$m
|
|
$m
|
|
|
|
At 31 Dec 2017
|
||||||||||
|
Assets
|
||||||||||
|
Loans and advances to banks
|
90,393
|
|
—
|
|
87,384
|
|
3,007
|
|
90,391
|
|
|
Loans and advances to customers
|
962,964
|
|
—
|
|
20,029
|
|
944,176
|
|
964,205
|
|
|
Reverse repurchase agreements – non-trading
|
201,553
|
|
—
|
|
200,012
|
|
1,526
|
|
201,538
|
|
|
Financial investments – debt securities
|
52,919
|
|
1,363
|
|
52,707
|
|
17
|
|
54,087
|
|
|
Liabilities
|
|
|
|
|
|
|
|
|
|
|
|
Deposits by banks
|
69,922
|
|
—
|
|
69,862
|
|
30
|
|
69,892
|
|
|
Customer accounts
|
1,364,462
|
|
—
|
|
1,353,017
|
|
11,608
|
|
1,364,625
|
|
|
Repurchase agreements – non-trading
|
130,002
|
|
1
|
|
129,995
|
|
—
|
|
129,996
|
|
|
Debt securities in issue
|
64,546
|
|
—
|
|
65,138
|
|
—
|
|
65,138
|
|
|
Subordinated liabilities
|
19,826
|
|
—
|
|
23,740
|
|
355
|
|
24,095
|
|
|
At 31 Dec 2016
|
||||||||||
|
Assets
|
|
|
|
|
|
|
|
|
|
|
|
Loans and advances to banks
|
88,126
|
|
—
|
|
85,568
|
|
2,572
|
|
88,140
|
|
|
Loans and advances to customers
|
861,504
|
|
—
|
|
15,670
|
|
845,894
|
|
861,564
|
|
|
Reverse repurchase agreements – non-trading
|
160,974
|
|
—
|
|
159,504
|
|
1,527
|
|
161,031
|
|
|
Financial investments – debt securities
|
46,923
|
|
1,190
|
|
46,014
|
|
19
|
|
47,223
|
|
|
Liabilities
|
|
|
|
|
|
|
|
|
|
|
|
Deposits by banks
|
59,939
|
|
—
|
|
59,883
|
|
42
|
|
59,925
|
|
|
Customer accounts
|
1,272,386
|
|
—
|
|
1,262,540
|
|
10,136
|
|
1,272,676
|
|
|
Repurchase agreements – non-trading
|
88,958
|
|
—
|
|
88,939
|
|
—
|
|
88,939
|
|
|
Debt securities in issue
|
65,915
|
|
—
|
|
66,386
|
|
—
|
|
66,386
|
|
|
Subordinated liabilities
|
20,984
|
|
—
|
|
23,264
|
|
292
|
|
23,556
|
|
Other financial instruments not carried at fair value are typically short-term in nature and reprice to current market rates frequently. Accordingly, their carrying amount is a reasonable approximation of fair value. They include cash and balances at central banks, items in the course of collection from and transmission to other banks, Hong Kong Government certificates of indebtedness and Hong Kong currency notes in circulation, all of which are measured at amortised cost.
|
Carrying amount and fair value of loans and advances to customers by industry sector
|
||||||||||||
|
Carrying amount
|
Fair value
|
|||||||||||
|
Not Impaired
|
|
Impaired
|
|
Total
|
|
Not Impaired
|
|
Impaired
|
|
Total
|
|
|
|
$m
|
|
$m
|
|
$m
|
|
$m
|
|
$m
|
|
$m
|
|
|
|
Loans and advances to customers
|
||||||||||||
|
– personal
|
370,842
|
|
3,920
|
|
374,762
|
|
371,131
|
|
3,257
|
|
374,388
|
|
|
– corporate and commercial
|
510,784
|
|
5,970
|
|
516,754
|
|
512,597
|
|
5,769
|
|
518,366
|
|
|
– financial
|
71,377
|
|
71
|
|
71,448
|
|
71,351
|
|
100
|
|
71,451
|
|
|
At 31 Dec 2017
|
953,003
|
|
9,961
|
|
962,964
|
|
955,079
|
|
9,126
|
|
964,205
|
|
|
Loans and advances to customers
|
||||||||||||
|
– personal
|
332,574
|
|
5,252
|
|
337,826
|
|
330,167
|
|
4,597
|
|
334,764
|
|
|
– corporate and commercial
|
453,151
|
|
7,058
|
|
460,209
|
|
456,816
|
|
6,393
|
|
463,209
|
|
|
– financial
|
63,316
|
|
153
|
|
63,469
|
|
63,411
|
|
180
|
|
63,591
|
|
|
At 31 Dec 2016
|
849,041
|
|
12,463
|
|
861,504
|
|
850,394
|
|
11,170
|
|
861,564
|
|
Loans and advances to customers are classified as not impaired or impaired in accordance with the criteria described on page
126
.
Valuation
Fair value is an estimate of the price that would be received to sell an asset or paid to transfer a liability in an orderly transaction between market participants at the measurement date. It does not reflect the economic benefits and costs that HSBC expects to flow from an instrument’s cash flow over its expected future life. Our valuation methodologies and assumptions in determining fair values for which no observable market prices are available may differ from those of other companies.
Loans and advances to banks and customers
To determine the fair value of loans and advances to banks and customers, loans are segregated, as far as possible, into portfolios of similar characteristics. Fair values are based on observable market transactions, when available. When they are unavailable, fair values are estimated using valuation models incorporating a range of input assumptions. These assumptions may include: value estimates from third-party brokers reflecting over-the-counter trading activity; forward-looking discounted cash flow models, taking account of expected customer prepayment rates, using assumptions that HSBC believes are consistent with those that would be used by market participants in valuing such loans; new business rates estimates for similar loans; and trading inputs from other market participants including
|
HSBC Holdings plc
|
251
|
Notes on the Financial Statements
observed primary and secondary trades. From time to time, we may engage a third-party valuation specialist to measure the fair value of a pool of loans.
The fair value of loans reflects impairments at the balance sheet date and estimates of market participants’ expectations of credit losses over the life of the loans, and the fair value effect of repricing between origination and the balance sheet date. For impaired loans, fair value is estimated by discounting the future cash flows over the time period they are expected to be recovered.
Financial investments
The fair values of listed financial investments are determined using bid market prices. The fair values of unlisted financial investments are determined using valuation techniques that incorporate the prices and future earnings streams of equivalent quoted securities.
Deposits by banks and customer accounts
The fair values of on-demand deposits are approximated by their carrying value. For deposits with longer-term maturities, fair values are estimated using discounted cash flows, applying current rates offered for deposits of similar remaining maturities.
Debt securities in issue and subordinated liabilities
Fair values are determined using quoted market prices at the balance sheet date where available, or by reference to quoted market prices for similar instruments.
Repurchase and reverse repurchase agreements – non-trading
Fair values approximate carrying amounts as balances are generally short dated.
HSBC Holdings
The methods used by HSBC Holdings to determine fair values of financial instruments for the purposes of measurement and disclosure are described above.
|
Fair values of HSBC Holdings’ financial instruments not carried at fair value on the balance sheet
|
|||||||||
|
2017
|
2016
|
||||||||
|
Carrying
amount |
|
Fair
value 1 |
|
Carrying
amount |
|
Fair
value 1 |
|
||
|
$m
|
|
$m
|
|
$m
|
|
$m
|
|
||
|
Assets at 31 Dec
|
|||||||||
|
Loans and advances to HSBC undertakings
|
76,627
|
|
78,534
|
|
77,421
|
|
79,985
|
|
|
|
Liabilities at 31 Dec
|
|||||||||
|
Amounts owed to HSBC undertakings
|
2,571
|
|
2,571
|
|
2,157
|
|
2,156
|
|
|
|
Debt securities in issue
|
34,258
|
|
36,611
|
|
21,805
|
|
23,147
|
|
|
|
Subordinated liabilities
|
15,877
|
|
19,596
|
|
15,189
|
|
17,715
|
|
|
|
1
|
Fair values were determined using valuation techniques with observable inputs (Level 2).
|
|
13
|
Financial assets designated at fair value
|
|
2017
|
|
2016
|
|
||
|
$m
|
|
$m
|
|
||
|
Securities
|
29,456
|
|
24,677
|
|
|
|
– treasury and other eligible bills
|
606
|
|
204
|
|
|
|
– debt securities
|
4,090
|
|
4,189
|
|
|
|
– equity securities
|
24,760
|
|
20,284
|
|
|
|
Loans and advances to banks and customers
|
8
|
|
79
|
|
|
|
At 31 Dec
|
29,464
|
|
24,756
|
|
|
|
Securities
1
|
|||||
|
2017
|
|
2016
|
|
||
|
Footnotes
|
$m
|
|
$m
|
|
|
|
US Treasury and US Government agencies
|
2
|
—
|
|
104
|
|
|
UK Government
|
17
|
|
41
|
|
|
|
Hong Kong Government
|
64
|
|
16
|
|
|
|
Other governments
|
1,247
|
|
747
|
|
|
|
Asset-backed securities
|
3
|
2
|
|
20
|
|
|
Corporate debt and other securities
|
3,366
|
|
3,465
|
|
|
|
Equities
|
24,760
|
|
20,284
|
|
|
|
At 31 Dec
|
29,456
|
|
24,677
|
|
|
|
1
|
Included within these figures are debt securities issued by banks and other financial institutions of $
1,621
m (
2016
: $
1,766
m), of which $
0.4
m (
2016
: $
19
m) are guaranteed by various governments.
|
|
2
|
Includes securities that are supported by an explicit guarantee issued by the US Government.
|
|
3
|
Excludes asset-backed securities included under US Treasury and US Government agencies.
|
|
252
|
HSBC Holdings plc
|
|
14
|
Derivatives
|
|
Notional contract amounts and fair values of derivatives by product contract type held by HSBC
|
||||||||||||||||
|
Notional contract amount
|
Fair value – Assets
|
Fair value – Liabilities
|
||||||||||||||
|
Trading
|
|
Hedging
|
|
Trading
|
|
Hedging
|
|
Total
|
|
Trading
|
|
Hedging
|
|
Total
|
|
|
|
$m
|
|
$m
|
|
$m
|
|
$m
|
|
$m
|
|
$m
|
|
$m
|
|
$m
|
|
|
|
Foreign exchange
|
6,215,518
|
|
28,768
|
|
78,089
|
|
428
|
|
78,517
|
|
74,915
|
|
853
|
|
75,768
|
|
|
Interest rate
|
19,751,577
|
|
178,289
|
|
235,430
|
|
1,365
|
|
236,795
|
|
229,989
|
|
3,042
|
|
233,031
|
|
|
Equities
|
590,156
|
|
—
|
|
9,353
|
|
—
|
|
9,353
|
|
11,845
|
|
—
|
|
11,845
|
|
|
Credit
|
391,798
|
|
—
|
|
4,692
|
|
—
|
|
4,692
|
|
5,369
|
|
—
|
|
5,369
|
|
|
Commodity and other
|
59,716
|
|
—
|
|
886
|
|
—
|
|
886
|
|
1,233
|
|
—
|
|
1,233
|
|
|
Gross total fair values
|
27,008,765
|
|
207,057
|
|
328,450
|
|
1,793
|
|
330,243
|
|
323,351
|
|
3,895
|
|
327,246
|
|
|
Offset (Note 29)
|
|
|
|
|
|
|
|
|
(110,425
|
)
|
|
|
|
|
(110,425
|
)
|
|
At 31 Dec 2017
|
27,008,765
|
|
207,057
|
|
328,450
|
|
1,793
|
|
219,818
|
|
323,351
|
|
3,895
|
|
216,821
|
|
|
Foreign exchange
|
5,819,814
|
|
26,281
|
|
126,185
|
|
1,228
|
|
127,413
|
|
118,813
|
|
968
|
|
119,781
|
|
|
Interest rate
|
13,729,757
|
|
215,006
|
|
253,398
|
|
1,987
|
|
255,385
|
|
245,941
|
|
4,081
|
|
250,022
|
|
|
Equities
|
472,169
|
|
—
|
|
7,410
|
|
—
|
|
7,410
|
|
9,240
|
|
—
|
|
9,240
|
|
|
Credit
|
448,220
|
|
—
|
|
5,199
|
|
—
|
|
5,199
|
|
5,767
|
|
—
|
|
5,767
|
|
|
Commodity and other
|
62,009
|
|
—
|
|
2,020
|
|
—
|
|
2,020
|
|
1,564
|
|
—
|
|
1,564
|
|
|
Gross total fair values
|
20,531,969
|
|
241,287
|
|
394,212
|
|
3,215
|
|
397,427
|
|
381,325
|
|
5,049
|
|
386,374
|
|
|
Offset (Note 29)
|
(106,555
|
)
|
(106,555
|
)
|
||||||||||||
|
At 31 Dec 2016
|
20,531,969
|
|
241,287
|
|
394,212
|
|
3,215
|
|
290,872
|
|
381,325
|
|
5,049
|
|
279,819
|
|
The notional contract amounts of derivatives held for trading purposes and derivatives designated in hedge accounting relationships indicate the nominal value of transactions outstanding at the balance sheet date; they do not represent amounts at risk.
Derivative assets and liabilities decreased during 2017, reflecting changes in yield curve movements and changes in foreign exchange rates.
|
Notional contract amounts and fair values of derivatives by product contract type held by HSBC Holdings with subsidiaries
|
||||||||||||||||
|
Notional contract amount
|
Fair value – Assets
|
Fair value – Liabilities
|
||||||||||||||
|
Trading
|
|
Hedging
|
|
Trading
|
|
Hedging
|
|
Total
|
|
Trading
|
|
Hedging
|
|
Total
|
|
|
|
$m
|
|
$m
|
|
$m
|
|
$m
|
|
$m
|
|
$m
|
|
$m
|
|
$m
|
|
|
|
Foreign exchange
|
20,484
|
|
1,120
|
|
588
|
|
—
|
|
588
|
|
1,330
|
|
110
|
|
1,440
|
|
|
Interest rate
|
41,061
|
|
25,294
|
|
1,364
|
|
436
|
|
1,800
|
|
678
|
|
964
|
|
1,642
|
|
|
At 31 Dec 2017
|
61,545
|
|
26,414
|
|
1,952
|
|
436
|
|
2,388
|
|
2,008
|
|
1,074
|
|
3,082
|
|
|
Foreign exchange
|
23,442
|
|
1,120
|
|
223
|
|
—
|
|
223
|
|
3,201
|
|
239
|
|
3,440
|
|
|
Interest rate
|
26,858
|
|
24,356
|
|
1,478
|
|
447
|
|
1,925
|
|
639
|
|
946
|
|
1,585
|
|
|
At 31 Dec 2016
|
50,300
|
|
25,476
|
|
1,701
|
|
447
|
|
2,148
|
|
3,840
|
|
1,185
|
|
5,025
|
|
Use of derivatives
For details regarding use of derivatives, see page
152
under ‘Market Risk’.
Trading derivatives
Most of HSBC’s derivative transactions relate to sales and trading activities. Sales activities include the structuring and marketing of derivative products to customers to enable them to take, transfer, modify or reduce current or expected risks. Trading activities include market-making and risk management. Market-making entails quoting bid and offer prices to other market participants for the purpose of generating revenues based on spread and volume. Risk management activity is undertaken to manage the risk arising from client transactions, with the principal purpose of retaining client margin. Other derivatives classified as held for trading include non-qualifying hedging derivatives.
Substantially all of HSBC Holdings’ derivatives entered into with subsidiaries are managed in conjunction with financial liabilities designated at fair value.
Derivatives valued using models with unobservable inputs
The difference between the fair value at initial recognition (the transaction price) and the value that would have been derived had valuation techniques used for subsequent measurement been applied at initial recognition, less subsequent releases, is as follows:
|
HSBC Holdings plc
|
253
|
Notes on the Financial Statements
|
Unamortised balance of derivatives valued using models with significant unobservable inputs
|
|||||
|
2017
|
|
2016
|
|
||
|
Footnote
|
$m
|
|
$m
|
|
|
|
Unamortised balance at 1 Jan
|
99
|
|
97
|
|
|
|
Deferral on new transactions
|
191
|
|
156
|
|
|
|
Recognised in the income statement during the year:
|
(187
|
)
|
(140
|
)
|
|
|
– amortisation
|
(85
|
)
|
(70
|
)
|
|
|
– subsequent to unobservable inputs becoming observable
|
(2
|
)
|
(5
|
)
|
|
|
– maturity, termination or offsetting derivative
|
(100
|
)
|
(65
|
)
|
|
|
Exchange differences
|
10
|
|
(13
|
)
|
|
|
Other
|
(7
|
)
|
(1
|
)
|
|
|
Unamortised balance at 31 Dec
|
1
|
106
|
|
99
|
|
|
1
|
This amount is yet to be recognised in the consolidated income statement.
|
Hedge accounting derivatives
Fair value hedges
HSBC’s fair value hedges principally consist of interest rate swaps that are used to protect against changes in the fair value of fixed-rate long-term financial instruments due to movements in market interest rates.
|
Notional contract amounts and fair values of derivatives designated as fair value hedges by product type
|
||||||||||||
|
2017
|
2016
|
|||||||||||
|
Notional
|
|
Fair Value
Assets |
|
Fair Value
Liabilities |
|
Notional
|
|
Fair Value
Assets
|
|
Fair Value
Liabilities
|
|
|
|
$m
|
|
$m
|
|
$m
|
|
$m
|
|
$m
|
|
$m
|
|
|
|
HSBC
|
||||||||||||
|
Foreign exchange
|
1,027
|
|
—
|
|
23
|
|
618
|
|
10
|
|
22
|
|
|
Interest rate
|
112,714
|
|
1,020
|
|
2,744
|
|
124,361
|
|
1,078
|
|
3,726
|
|
|
At 31 Dec
|
113,741
|
|
1,020
|
|
2,767
|
|
124,979
|
|
1,088
|
|
3,748
|
|
|
HSBC Holdings
|
||||||||||||
|
Foreign exchange
|
1,120
|
|
—
|
|
110
|
|
1,120
|
|
—
|
|
239
|
|
|
Interest rate
|
25,294
|
|
436
|
|
964
|
|
24,356
|
|
447
|
|
946
|
|
|
At 31 Dec
|
26,414
|
|
436
|
|
1,074
|
|
25,476
|
|
447
|
|
1,185
|
|
|
Gains or losses arising from fair value hedges
|
||||||
|
2017
|
|
2016
|
|
2015
|
|
|
|
$m
|
|
$m
|
|
$m
|
|
|
|
HSBC
|
||||||
|
Gains/(losses):
|
||||||
|
– on hedging instruments
|
621
|
|
(439
|
)
|
40
|
|
|
– on the hedged items attributable to the hedged risk
|
(617
|
)
|
462
|
|
(51
|
)
|
|
Year ended 31 Dec
|
4
|
|
23
|
|
(11
|
)
|
|
HSBC Holdings
|
||||||
|
Gains/(losses):
|
||||||
|
– on hedging instruments
|
(57
|
)
|
(909
|
)
|
(4
|
)
|
|
– on the hedged items attributable to the hedged risk
|
23
|
|
926
|
|
6
|
|
|
Year ended 31 Dec
|
(34
|
)
|
17
|
|
2
|
|
Cash flow hedges
HSBC’s cash flow hedges consist principally of interest rate swaps, futures and cross-currency swaps that are used to protect against exposures to variability in future interest cash flows on non-trading assets and liabilities which bear interest at variable rates or which are expected to be re-funded or reinvested in the future. The amounts and timing of future cash flows, representing both principal and interest flows, are projected for each portfolio of financial assets and liabilities on the basis of their contractual terms and other relevant factors, including estimates of prepayments and defaults. The aggregate principal balances and interest cash flows across all portfolios over time form the basis for identifying gains and losses on the effective portions of derivatives designated as cash flow hedges of forecast transactions.
|
Notional contract amounts and fair values of derivatives designated as cash flow hedges by product held by HSBC
|
||||||||||||
|
2017
|
2016
|
|||||||||||
|
Notional
|
|
Assets
|
|
Liabilities
|
|
Notional
|
|
Assets
|
|
Liabilities
|
|
|
|
$m
|
|
$m
|
|
$m
|
|
$m
|
|
$m
|
|
$m
|
|
|
|
Foreign Exchange
|
22,741
|
|
424
|
|
759
|
|
25,663
|
|
1,081
|
|
939
|
|
|
Interest rate
|
65,575
|
|
345
|
|
298
|
|
90,645
|
|
909
|
|
355
|
|
|
At 31 Dec
|
88,316
|
|
769
|
|
1,057
|
|
116,308
|
|
1,990
|
|
1,294
|
|
|
254
|
HSBC Holdings plc
|
|
Forecast principal balances on which interest cash flows are expected to arise
|
||||||||
|
3 months
or less
|
|
More than 3 months
but less than 1 year
|
|
5 years or less
but more than 1 year
|
|
More than 5 years
|
|
|
|
$m
|
|
$m
|
|
$m
|
|
$m
|
|
|
|
Net cash inflows/(outflows) exposure
|
||||||||
|
Assets
|
70,769
|
|
65,771
|
|
44,347
|
|
956
|
|
|
Liabilities
|
(7,729
|
)
|
(7,017
|
)
|
(4,992
|
)
|
(536
|
)
|
|
At 31 Dec 2017
|
63,040
|
|
58,754
|
|
39,355
|
|
420
|
|
|
Net cash inflows/(outflows) exposure
|
||||||||
|
Assets
|
83,472
|
|
79,749
|
|
57,553
|
|
2,750
|
|
|
Liabilities
|
(13,169
|
)
|
(12,977
|
)
|
(11,761
|
)
|
(1,502
|
)
|
|
At 31 Dec 2016
|
70,303
|
|
66,772
|
|
45,792
|
|
1,248
|
|
This table reflects the interest rate repricing profile of the underlying hedged items. During the year to 31 December
2017
, a loss of
$5m ( 2016 : $5m loss; 2015 : $15m gain) was recognised due to hedge ineffectiveness.
$5m ( 2016 : $5m loss; 2015 : $15m gain) was recognised due to hedge ineffectiveness.
Hedges of net investments in foreign operations
The Group applies hedge accounting in respect of certain consolidated net investments. Hedging is undertaken using forward foreign exchange contracts or by financing with foreign currency borrowings. At 31 December
2017
, the fair values of outstanding financial instruments designated as hedges of net investments in foreign operations were assets of
$4m
(
2016
:
$137m
), liabilities of
$71m
(
2016
:
$7m
) and notional contract values of
$5,000m
(
2016
:
$3,544m
). Ineffectiveness recognised in ‘Net trading income’ in the year ended
31 December 2017 was nil ( 2016 : nil ; 2015 : nil ).
31 December 2017 was nil ( 2016 : nil ; 2015 : nil ).
|
15
|
Financial investments
|
|
Carrying amount of financial investments
|
|||||
|
2017
|
|
2016
|
|
||
|
Footnote
|
$m
|
|
$m
|
|
|
|
Available for sale securities at fair value
|
336,157
|
|
389,874
|
|
|
|
– treasury and other eligible bills
|
78,851
|
|
99,226
|
|
|
|
– debt securities
|
253,389
|
|
285,981
|
|
|
|
– equity securities
|
3,917
|
|
4,667
|
|
|
|
Held to maturity securities at amortised cost
|
52,919
|
|
46,923
|
|
|
|
– debt securities
|
1
|
52,919
|
|
46,923
|
|
|
At 31 Dec
|
389,076
|
|
436,797
|
|
|
|
1
|
Fair value
$54.1
bn (
2016
:
$47.2
bn).
|
|
Financial investments at amortised cost and fair value
|
|||||||||
|
2017
|
2016
|
||||||||
|
Amortised cost
|
|
Fair value
1
|
|
Amortised cost
|
|
Fair value
1
|
|
||
|
Footnotes
|
$m
|
|
$m
|
|
$m
|
|
$m
|
|
|
|
US Treasury
|
|
41,427
|
|
41,274
|
|
57,135
|
|
56,625
|
|
|
US Government agencies
|
2
|
18,691
|
|
18,494
|
|
15,790
|
|
15,682
|
|
|
US Government sponsored entities
|
2
|
10,998
|
|
11,033
|
|
14,397
|
|
14,442
|
|
|
UK Government
|
|
17,817
|
|
18,538
|
|
27,506
|
|
28,480
|
|
|
Hong Kong Government
|
|
52,269
|
|
52,252
|
|
62,500
|
|
62,475
|
|
|
Other governments
|
|
134,766
|
|
136,414
|
|
140,943
|
|
142,594
|
|
|
Asset-backed securities
|
3
|
6,187
|
|
5,781
|
|
10,246
|
|
9,392
|
|
|
Corporate debt and other securities
|
|
99,136
|
|
102,540
|
|
100,180
|
|
102,741
|
|
|
Equities
|
|
2,989
|
|
3,917
|
|
3,042
|
|
4,667
|
|
|
At 31 Dec
|
|
384,280
|
|
390,243
|
|
431,739
|
|
437,098
|
|
|
1
|
Included within ‘fair value’ figures are debt securities issued by banks and other financial institutions of $
67
bn (
2016
:
$69
bn), of which $
15
bn (
2016
:
$20
bn) are guaranteed by various governments.
|
|
2
|
Includes securities that are supported by an explicit guarantee issued by the US Government.
|
|
3
|
Excludes asset-backed securities included under US Government agencies and sponsored entities.
|
|
Maturities of investments in debt securities at their carrying amount
|
||||||||||
|
1 year or less
|
|
5 years or less
but over
1 year
|
|
10 years or less
but over
5 years
|
|
Over 10 years
|
|
Total
|
|
|
|
$m
|
|
$m
|
|
$m
|
|
$m
|
|
$m
|
|
|
|
Available for sale
|
63,896
|
|
122,113
|
|
37,292
|
|
30,088
|
|
253,389
|
|
|
Held to maturity
|
3,731
|
|
9,406
|
|
13,482
|
|
26,300
|
|
52,919
|
|
|
At 31 Dec 2017
|
67,627
|
|
131,519
|
|
50,774
|
|
56,388
|
|
306,308
|
|
|
Available for sale
|
64,155
|
|
142,700
|
|
45,385
|
|
33,741
|
|
285,981
|
|
|
Held to maturity
|
2,502
|
|
10,210
|
|
10,348
|
|
23,863
|
|
46,923
|
|
|
At 31 Dec 2016
|
66,657
|
|
152,910
|
|
55,733
|
|
57,604
|
|
332,904
|
|
|
HSBC Holdings plc
|
255
|
Notes on the Financial Statements
|
Contractual maturities and weighted average yields of investment debt securities
|
||||||||||||
|
1 year or less
|
5 years or less
but over
1 year
|
10 years or less
but over
5 years
|
Over 10 years
|
|||||||||
|
Amount
|
|
Yield
|
Amount
|
|
Yield
|
Amount
|
|
Yield
|
Amount
|
|
Yield
|
|
|
$m
|
|
%
|
$m
|
|
%
|
$m
|
|
%
|
$m
|
|
%
|
|
|
Available for sale
|
|
|
|
|
|
|
|
|
|
|
|
|
|
US Treasury
|
3,981
|
|
1.1
|
16,213
|
|
1.9
|
15,806
|
|
2.0
|
3,318
|
|
3.1
|
|
US Government agencies
|
50
|
|
1.9
|
129
|
|
2.2
|
19
|
|
3.8
|
7,924
|
|
2.6
|
|
US Government-sponsored agencies
|
148
|
|
3.5
|
2,759
|
|
3.0
|
1,965
|
|
2.6
|
2,733
|
|
2.7
|
|
UK Government
|
636
|
|
0.2
|
6,970
|
|
0.9
|
6,552
|
|
0.8
|
—
|
|
—
|
|
Hong Kong Government
|
216
|
|
0.8
|
1,014
|
|
1.3
|
—
|
|
—
|
—
|
|
—
|
|
Other governments
|
45,337
|
|
1.8
|
57,441
|
|
2.7
|
7,429
|
|
3.0
|
1,678
|
|
3.4
|
|
Asset-backed securities
|
26
|
|
7.8
|
28
|
|
5.5
|
271
|
|
1.7
|
5,858
|
|
2.9
|
|
Corporate debt and other securities
|
13,613
|
|
1.7
|
35,598
|
|
1.9
|
4,043
|
|
2.6
|
7,779
|
|
3.9
|
|
Total amortised cost at 31 Dec 2017
|
64,007
|
|
|
120,152
|
|
|
36,085
|
|
|
29,290
|
|
|
|
Total carrying value
|
63,896
|
|
|
122,113
|
|
|
37,292
|
|
|
30,088
|
|
|
|
Held to maturity
|
|
|
|
|
|
|
|
|
|
|
|
|
|
US Treasury
|
41
|
|
5.0
|
22
|
|
4.7
|
49
|
|
4.9
|
130
|
|
4.2
|
|
US Government agencies
|
—
|
|
—
|
21
|
|
4.0
|
27
|
|
2.5
|
10,519
|
|
2.4
|
|
US Government-sponsored agencies
|
—
|
|
—
|
322
|
|
2.4
|
325
|
|
2.8
|
2,747
|
|
2.9
|
|
Hong Kong Government
|
227
|
|
0.5
|
28
|
|
2.6
|
13
|
|
1.2
|
7
|
|
1.4
|
|
Other governments
|
108
|
|
4.7
|
240
|
|
4.0
|
198
|
|
3.7
|
847
|
|
4.3
|
|
Asset-backed securities
|
—
|
|
—
|
—
|
|
—
|
—
|
|
—
|
4
|
|
6.7
|
|
Corporate debt and other securities
|
3,355
|
|
3.7
|
8,773
|
|
3.4
|
12,870
|
|
3.3
|
12,046
|
|
3.9
|
|
Total amortised cost at 31 Dec 2017
|
3,731
|
|
|
9,406
|
|
|
13,482
|
|
|
26,300
|
|
|
|
Total carrying value
|
3,731
|
|
|
9,406
|
|
|
13,482
|
|
|
26,300
|
|
|
The maturity distributions of ABSs are presented in the above table on the basis of contractual maturity dates. The weighted average yield for each range of maturities is calculated by dividing the annualised interest income for the year ended 31 December
2017
by the book amount of available-for-sale debt securities at that date. The yields do not include the effect of related derivatives.
|
16
|
Assets pledged, collateral received and assets transferred
|
Assets pledged
|
Financial assets pledged as collateral
|
||||
|
|
2017
|
|
2016
|
|
|
|
$m
|
|
$m
|
|
|
Treasury bills and other eligible securities
|
10,183
|
|
7,151
|
|
|
Loans and advances to banks
|
14,518
|
|
17,444
|
|
|
Loans and advances to customers
|
68,336
|
|
74,109
|
|
|
Debt securities
|
96,245
|
|
80,063
|
|
|
Equity securities
|
33,209
|
|
2,655
|
|
|
Other
|
2,743
|
|
1,838
|
|
|
Assets pledged at 31 Dec
|
225,234
|
|
183,260
|
|
Assets pledged as collateral include all assets categorised as encumbered in the disclosure on page
67
of the
Pillar 3 Disclosures at 31 December 2017
.
The amount of assets pledged to secure liabilities may be greater than the book value of assets utilised as collateral. For example, in the case of securitisations and covered bonds, the amount of liabilities issued plus mandatory over-collateralisation is less than the book value of the pool of assets available for use as collateral. This is also the case where assets are placed with a custodian or a settlement agent which has a floating charge over all the assets placed to secure any liabilities under settlement accounts.
These transactions are conducted under terms that are usual and customary to collateralised transactions including, where relevant, standard securities lending and borrowing, repurchase agreements and derivative margining. HSBC places both cash and non-cash collateral in relation to derivative transactions.
|
Financial assets pledged as collateral which the counterparty has the right to sell or repledge
|
||||
|
|
2017
|
|
2016
|
|
|
|
$m
|
|
$m
|
|
|
Trading assets
|
70,117
|
|
37,141
|
|
|
Financial investments
|
13,581
|
|
4,044
|
|
|
At 31 Dec
|
83,698
|
|
41,185
|
|
Collateral received
The fair value of assets accepted as collateral, relating primarily to standard securities lending, reverse repurchase agreements, swaps of securities and derivative margining, that HSBC is permitted to sell or repledge in the absence of default was $
387,678
m (
2016
: $
250,919
m). The fair value of any such collateral sold or repledged was $
243,531
m (
2016
: $
149,185
m).
HSBC is obliged to return equivalent securities. These transactions are conducted under terms that are usual and customary to standard securities lending, reverse repurchase agreements and derivative margining.
|
256
|
HSBC Holdings plc
|
Assets transferred
The assets pledged include transfers to third parties that do not qualify for derecognition, notably secured borrowings such as debt securities held by counterparties as collateral under repurchase agreements and equity securities lent under securities lending agreements, as well as swaps of equity and debt securities. For secured borrowings, the transferred asset collateral continues to be recognised in full and a related liability, reflecting the Group’s obligation to repurchase the assets for a fixed price at a future date is also recognised on the balance sheet. Where securities are swapped, the transferred asset continues to be recognised in full. There is no associated liability as the non-cash collateral received is not recognised on the balance sheet. The Group is unable to use, sell or pledge the transferred assets for the duration of the transaction, and remains exposed to interest rate risk and credit risk on these pledged assets. With the exception of ‘Other sales’ in the table below, the counterparty’s recourse is not limited to the transferred assets.
|
Transferred financial assets not qualifying for full derecognition and associated financial liabilities
|
||||||||||
|
|
Carrying amount of:
|
Fair value of:
|
|
|||||||
|
|
Transferred assets
|
|
Associated liabilities
|
|
Transferred assets
|
|
Associated liabilities
|
|
Net
position |
|
|
|
$m
|
|
$m
|
|
$m
|
|
$m
|
|
$m
|
|
|
At 31 Dec 2017
|
|
|
|
|
|
|
|
|
|
|
|
Repurchase agreements
|
55,510
|
|
52,093
|
|
|
|
|
|
|
|
|
Securities lending agreements
|
33,878
|
|
3,324
|
|
|
|
|
|
|
|
|
Other sales (recourse to transferred assets only)
|
2,387
|
|
2,388
|
|
2,377
|
|
2,378
|
|
(1
|
)
|
|
At 31 Dec 2016
|
||||||||||
|
Repurchase agreements
|
40,364
|
|
39,568
|
|
||||||
|
Securities lending agreements
|
3,324
|
|
2,655
|
|
||||||
|
Other sales (recourse to transferred assets only)
|
2,441
|
|
2,466
|
|
2,455
|
|
2,458
|
|
(3
|
)
|
|
17
|
Interests in associates and joint ventures
|
Associates
At 31 December 2017, the carrying amount of HSBC’s interests in associates was
$22,577m
(2016:
$19,874m
).
|
Principal associates of HSBC
|
|||||||||
|
2017
|
2016
|
||||||||
|
Carrying
amount |
|
Fair
value 1 |
|
Carrying
amount |
|
Fair
value 1 |
|
||
|
$m
|
|
$m
|
|
$m
|
|
$m
|
|
||
|
Bank of Communications Co., Limited
|
18,057
|
|
10,491
|
|
15,765
|
|
10,207
|
|
|
|
The Saudi British Bank
|
3,618
|
|
4,320
|
|
3,280
|
|
3,999
|
|
|
|
1
|
Principal associates are listed on recognised stock exchanges. The fair values are based on the quoted market prices of the shares held (Level 1 in the fair value hierarchy).
|
|
At 31 Dec 2017
|
||||
|
Footnote
|
Country of
incorporation and
principal place of business
|
Principal
activity
|
HSBC’s
interest
%
|
|
|
Bank of Communications Co., Limited
|
1
|
PRC
|
Banking services
|
19.03
|
|
The Saudi British Bank
|
Saudi Arabia
|
Banking services
|
40.00
|
|
|
1
|
People’s Republic of China.
|
A list of all associates and joint ventures is set out on page
294
.
Bank of Communications Co., Limited
The Group’s significant influence in Bank of Communications Co., Limited (‘BoCom’) was established via representation on BoCom’s board of directors and a technical cooperation and exchange programme. Under this programme, a number of HSBC staff have been seconded to assist in the maintenance of BoCom’s financial and operating policies.
Impairment testing
At 31 December 2017, the fair value of HSBC’s investment in BoCom had been below the carrying amount for approximately
68
months. As a result, the Group performed an impairment test on the carrying amount of the investment in BoCom, which confirmed there was
no
impairment at 31 December 2017.
|
At 31 Dec 2017
|
At 31 Dec 2016
|
|||||||||||
|
VIU
|
|
Carrying value
|
|
Fair
value |
|
VIU
|
|
Carrying value
|
|
Fair
value |
|
|
|
$bn
|
|
$bn
|
|
$bn
|
|
$bn
|
|
$bn
|
|
$bn
|
|
|
|
Bank of Communications Co., Limited
|
18.3
|
|
18.1
|
|
10.5
|
|
16.1
|
|
15.8
|
|
10.2
|
|
|
HSBC Holdings plc
|
257
|
Notes on the Financial Statements
Basis of recoverable amount
The impairment test was performed by comparing the recoverable amount of BoCom, determined by a value in use (‘VIU’) calculation, with its carrying amount. The VIU calculation uses discounted cash flow projections based on management’s estimates of earnings. Cash flows beyond the short to medium term are extrapolated in perpetuity using a long-term growth rate to derive a terminal value, which comprises the majority of VIU. An imputed capital maintenance charge (‘CMC’) is calculated to reflect expected regulatory capital requirements, and is deducted from forecast cash flows. The principal inputs to the CMC calculation include estimates of asset growth, the ratio of risk-weighted assets to total assets, and the expected minimum regulatory capital requirements. An increase in the CMC as a result of a change to these principal inputs would reduce VIU. Additionally, management considers other factors (including qualitative factors) to ensure that the inputs to the VIU calculation remain appropriate. Significant management judgement is required in estimating the future cash flows of BoCom.
Key assumptions in value in use calculation
We used a number of assumptions in our VIU calculation:
|
•
|
Long-term profit growth rate of
3%
(2016:
5%
) for periods after 2020, which does not exceed forecast GDP growth in mainland China and is within the range forecast by external analysts.
|
|
•
|
Long-term asset growth rate of
3%
(2016:
4%
) for periods after 2020, which is the rate that assets are expected to grow to achieve long-term profit growth of
3%
.
|
|
•
|
Discount rate of
11.85%
(2016:
13.0%
), which is based on a capital asset pricing model (‘CAPM’) calculation for BoCom, using market data. Management also compares rates derived from the CAPM with discount rates from external sources. The discount rate used was within the range of
10.2%
to
13.4%
(2016:
10.2%
to
15.0%
) indicated by external sources.
|
|
•
|
Loan impairment charge as a percentage of customer advances: a range from
0.66%
to
0.82%
(2016:
0.72%
to
0.87%
) in the short to medium term, largely based on forecasts disclosed by external analysts. For periods after 2020, the ratio is
0.70%
(2016:
0.70%
), slightly higher than the historical average.
|
|
•
|
Risk-weighted assets as a percentage of total assets:
62%
(2016:
62%
) for all forecast periods. This is consistent with the forecasts disclosed by external analysts.
|
|
•
|
Cost-income ratio: ranges from
37.1%
to
38.0%
(2016:
40.0%
) in the short to medium term. This is slightly higher than the forecasts
disclosed by external analysts.
|
The long-term profit growth rate, long-term asset growth rate and discount rate assumptions were updated in 2017 to better align with market practice when setting long-term assumptions in VIU calculations. The long-term profit growth rate was set at the lower end of the range forecast by external analysts and there was a corresponding change to the long-term asset growth rate. These changes reduced management’s uncertainty in respect of estimated future cash flows and accordingly the discount rate was set based on CAPM with no adjustment for uncertainty in future cash flows.
The following table shows the change to each key assumption in the VIU calculation that on its own would reduce the headroom to nil.
|
Key assumption
|
Changes to key assumption to reduce headroom to nil
|
|
•
Long-term profit growth rate
|
•
Decrease by 11 basis points
|
|
•
Long-term asset growth rate
|
•
Increase by 10 basis points
|
|
•
Discount rate
|
•
Increase by 13 basis points
|
|
•
Loan impairment charge as a percentage of customer advances
|
•
Increase by 2 basis points
|
|
•
Risk-weighted assets as a percentage of total assets
|
•
Increase by 63 basis points
|
|
•
Cost-income ratio
|
•
Increase by 46 basis points
|
The following table illustrates the effect on VIU of reasonably possible changes to key assumptions. This reflects the sensitivity of the VIU to each key assumption on its own, and it is possible that more than one favourable and/or unfavourable change will occur at the same time. The selected rates of reasonably possible changes to key assumptions is largely based on external analysts’ forecasts which can change period to period.
|
Sensitivity of VIU to reasonably possible changes in key assumptions
|
||||||||||||
|
Favourable change
|
Unfavourable change
|
|||||||||||
|
|
|
Increase
in VIU |
|
VIU
|
|
|
|
Decrease
In VIU |
|
VIU
|
|
|
|
bps
|
|
$bn
|
|
$bn
|
|
bps
|
|
$bn
|
|
$bn
|
|
|
|
At 31 Dec 2017
|
|
|
|
|
|
|
|
|
|
|
|
|
|
Long-term profit growth rate
|
200
|
|
6.6
|
|
24.9
|
|
—
|
|
—
|
|
18.3
|
|
|
Long-term asset growth rate
|
(20
|
)
|
0.5
|
|
18.9
|
|
200
|
|
(7.1
|
)
|
11.2
|
|
|
Discount rate
|
(35
|
)
|
0.7
|
|
19.1
|
|
65
|
|
(1.2
|
)
|
17.1
|
|
|
Loan impairment charge as a percentage of customer advances
|
2017-20: 0.71%
2021 onwards: 0.70% |
|
0.1
|
|
18.5
|
|
2017-20: 0.90%
2021 onwards: 0.77% |
|
(1.3
|
)
|
17.0
|
|
|
Risk-weighted assets as a percentage of total assets
|
(60
|
)
|
0.2
|
|
18.6
|
|
30
|
|
(0.1
|
)
|
18.2
|
|
|
Cost-income ratio
|
(173
|
)
|
1.5
|
|
19.8
|
|
—
|
|
—
|
|
18.3
|
|
|
At 31 Dec 2016
|
|
|
|
|
|
|
|
|
|
|
|
|
|
Long-term profit growth rate
|
—
|
|
—
|
|
16.1
|
|
(150
|
)
|
(3.3
|
)
|
12.8
|
|
|
Long-term asset growth rate
|
(80
|
)
|
1.8
|
|
17.8
|
|
—
|
|
—
|
|
16.1
|
|
|
Discount rate
|
(100
|
)
|
2.3
|
|
18.4
|
|
—
|
|
—
|
|
16.1
|
|
|
Loan impairment charge as a percentage of customer advances
|
—
|
|
—
|
|
16.1
|
|
2016-19: 0.93%
2020 onwards: 0.80% |
|
(1.1
|
)
|
15.0
|
|
|
Risk-weighted assets as a percentage of total assets
|
(30
|
)
|
0.1
|
|
16.2
|
|
170
|
|
(0.6
|
)
|
15.5
|
|
|
Cost income ratio
|
(170
|
)
|
0.9
|
|
17.0
|
|
250
|
|
(1.4
|
)
|
14.7
|
|
|
258
|
HSBC Holdings plc
|
Considering the interrelationship of the changes set out in the table above, management estimates that the reasonably possible range of VIU is
$14.7b
n to
$21.1
bn (2016:
$10.8b
n to
$19.0b
n).
Selected financial information of BoCom
The statutory accounting reference date of BoCom is 31 December. For the year ended 31 December 2017, HSBC included the associate’s results on the basis of financial statements for the 12 months ended 30 September 2017, taking into account changes in the subsequent period from 1 October 2017 to 31 December 2017 that would have materially affected the results.
|
Selected balance sheet information of BoCom
|
||||
|
At 30 Sep
|
||||
|
2017
|
|
2016
|
|
|
|
$m
|
|
$m
|
|
|
|
Cash and balances at central banks
|
146,029
|
|
137,844
|
|
|
Loans and advances to banks and other financial institutions
|
120,403
|
|
101,436
|
|
|
Loans and advances to customers
|
662,706
|
|
566,126
|
|
|
Other financial assets
|
386,067
|
|
311,207
|
|
|
Other assets
|
58,202
|
|
48,922
|
|
|
Total assets
|
1,373,407
|
|
1,165,535
|
|
|
Deposits by banks and other financial institutions
|
366,993
|
|
297,442
|
|
|
Customer accounts
|
747,882
|
|
680,915
|
|
|
Other financial liabilities
|
123,751
|
|
69,954
|
|
|
Other liabilities
|
32,568
|
|
27,860
|
|
|
Total liabilities
|
1,271,194
|
|
1,076,171
|
|
|
Total equity
|
102,213
|
|
89,364
|
|
|
Reconciliation of BoCom’s total shareholders’ equity to the carrying amount in HSBC’s consolidated financial statements
|
||||
|
At 30 Sep
|
||||
|
2017
|
|
2016
|
|
|
|
$m
|
|
$m
|
|
|
|
HSBC’s share of total shareholders’ equity
|
17,551
|
|
15,285
|
|
|
Goodwill and other intangible assets
|
506
|
|
480
|
|
|
Carrying amount
|
18,057
|
|
15,765
|
|
|
Selected income statement information of BoCom
|
||||
|
For the 12 months ended 30 Sep
|
||||
|
2017
|
|
2016
|
|
|
|
$m
|
|
$m
|
|
|
|
Net interest income
|
19,080
|
|
20,614
|
|
|
Net fee and commission income
|
5,698
|
|
5,493
|
|
|
Loan impairment charges
|
(4,286
|
)
|
(4,284
|
)
|
|
Depreciation and amortisation
|
(1,342
|
)
|
(1,216
|
)
|
|
Tax expense
|
(2,234
|
)
|
(2,800
|
)
|
|
Profit for the year
|
10,288
|
|
10,151
|
|
|
Other comprehensive income
|
(624
|
)
|
875
|
|
|
Total comprehensive income
|
9,664
|
|
11,026
|
|
|
Dividends received from BoCom
|
565
|
|
580
|
|
|
Summarised aggregate financial information for all associates excluding BoCom
|
||||
|
2017
|
|
2016
|
|
|
|
$m
|
|
$m
|
|
|
|
Carrying amount
|
4,520
|
|
4,109
|
|
|
HSBC’s share of:
|
|
|
|
|
|
– total assets
|
20,625
|
|
20,757
|
|
|
– total liabilities
|
16,119
|
|
16,661
|
|
|
– revenues
|
1,051
|
|
923
|
|
|
– profit or loss from continuing operations
|
487
|
|
454
|
|
Joint ventures
At 31 December 2017, the carrying amount of HSBC’s interests in joint ventures was
$167m
(2016:
$155m
).
Associates and joint ventures
For the year ended 31 December 2017, HSBC’s share of associates’ and joint ventures’ tax on profit was
$440m
(2016:
$542m
). This is included within ‘Share of profit in associates and joint ventures’ in the ‘Consolidated income statement’.
|
HSBC Holdings plc
|
259
|
Notes on the Financial Statements
|
Movements in interests in associates and joint ventures
|
|||||
|
2017
|
|
2016
|
|
||
|
Footnote
|
$m
|
|
$m
|
|
|
|
At 1 Jan
|
20,029
|
|
19,139
|
|
|
|
Additions
|
60
|
|
76
|
|
|
|
Disposals
|
(67
|
)
|
(25
|
)
|
|
|
Share of results
|
2,375
|
|
2,354
|
|
|
|
Dividends
|
(740
|
)
|
(751
|
)
|
|
|
Exchange differences
|
1,144
|
|
(1,115
|
)
|
|
|
Share of other comprehensive income of associates and joint ventures
|
(43
|
)
|
54
|
|
|
|
Other movements
|
(14
|
)
|
297
|
|
|
|
At 31 Dec
|
1
|
22,744
|
|
20,029
|
|
|
1
|
Includes goodwill of
$521m
(2016:
$488m
).
|
|
18
|
Investments in subsidiaries
|
|
Principal subsidiaries of HSBC Holdings
|
|||
|
|
At 31 Dec 2017
|
||
|
|
Country of incorporation or registration
|
HSBC’s interest %
|
|
|
|
Share class
|
||
|
Europe
|
|
|
|
|
HSBC Bank plc
|
England and Wales
|
100
|
£1 Ordinary and Preferred Ordinary, $0.01 Non-cumulative third Dollar Preference Shares
|
|
HSBC France
|
France
|
99.99
|
€5 Actions
|
|
HSBC Assurances Vie (France)
|
France
|
99.99
|
287.50 EUR Ordinary shares
|
|
HSBC Private Banking Holdings (Suisse) SA
|
Switzerland
|
100
|
CHF1,000 Ordinary
|
|
HSBC Trinkaus & Burkhardt AG
|
Germany
|
80.67
|
Stückaktien no par value
|
|
Asia
|
|
|
|
|
Hang Seng Bank Limited
|
Hong Kong
|
62.14
|
HK$5 Ordinary
|
|
HSBC Bank Australia Limited
|
Australia
|
100
|
Ordinary no par value
|
|
HSBC Bank (China) Company Limited
|
PRC
4
|
100
|
CNY1 Ordinary
|
|
HSBC Bank Malaysia Berhad
|
Malaysia
|
100
|
RM0.50 Ordinary
|
|
HSBC Bank (Taiwan) Limited
|
Taiwan
|
100
|
TWD10 Ordinary
|
|
HSBC Life (International) Limited
|
Bermuda
|
100
|
HK$1 Ordinary
|
|
The Hongkong and Shanghai Banking Corporation Limited
|
Hong Kong
|
100
|
Ordinary no par value, CIP
1
and NIP
2
|
|
HSBC Bank (Singapore) Limited
|
Singapore
|
100
|
SGD100 Ordinary
|
|
Middle East and North Africa
|
|
|
|
|
HSBC Bank Middle East Limited
|
United Arab Emirates
|
100
|
$1 Ordinary and $1 CRP
3
|
|
HSBC Bank Egypt S.A.E.
|
Egypt
|
94.54
|
EGP84 Ordinary
|
|
North America
|
|
|
|
|
HSBC Bank Canada
|
Canada
|
100
|
Common no par value and Preference no par value
|
|
HSBC Bank USA, N.A.
|
USA
|
100
|
$100 Common and $0.01 Preference
|
|
HSBC Securities (USA) Inc.
|
USA
|
100
|
$0.05 Common
|
|
Latin America
|
|
|
|
|
HSBC Mexico, S.A., Institución de Banca Múltiple,
Grupo Financiero HSBC |
Mexico
|
99.99
|
MXN2 Ordinary
|
|
1
|
Cumulative Irredeemable Preference shares.
|
|
2
|
Non-cumulative Irredeemable Preference shares.
|
|
3
|
Cumulative Redeemable Preference shares.
|
|
4
|
People’s Republic of China.
|
Details of the debt, subordinated debt and preference shares issued by the principal subsidiaries to parties external to the Group are included in Notes
24
‘Debt securities in issue’,
27
‘Subordinated liabilities’ and
30
‘Non-controlling interests’, respectively.
A list of all related undertakings is set out on pages
288
to
297
. The principal countries of operation are the same as the countries of incorporation except for HSBC Life (International) Limited, which operates mainly in Hong Kong.
HSBC is structured as a network of regional banks and locally incorporated regulated banking entities. Each bank is separately capitalised in accordance with applicable prudential requirements and maintains a capital buffer consistent with the Group’s risk appetite for the relevant country or region. HSBC’s capital management process is incorporated in the Annual Operating Plan, which is approved by the Board.
HSBC Holdings is the primary provider of equity capital to its subsidiaries and also provides them with non-equity capital where necessary. These investments are substantially funded by HSBC Holdings’ issuance of equity and non-equity capital, and by profit retention.
The reduction in HSBC Holdings investments in subsidiaries of
$2,920m
during the year (2016:
$1,920m
) is driven by
$4,070m
return of capital from subsidiaries (2016:
$3,898m
),
$242m
intra-group disposals (2016:
$0m
),
$352m
of other movements including provisions (2016:
$95m
) partially offset by
$1,744m
of new capital injections (2016:
$2,073m
).
|
260
|
HSBC Holdings plc
|
As part of its capital management process, HSBC Holdings seeks to maintain a balance between the composition of its capital and its investment in subsidiaries. Subject to this, there is no current or foreseen impediment to HSBC Holdings’ ability to provide funding for such investments. During 2017, consistent with the Group’s capital plan, the Group’s subsidiaries did not experience any significant restrictions on paying dividends or repaying loans and advances. Also, there are no foreseen restrictions envisaged with regard to planned dividends or payments. However, the ability of subsidiaries to pay dividends or advance monies to HSBC Holdings depends on, among other things, their respective local regulatory capital and banking requirements, exchange controls, statutory reserves, and financial and operating performance.
The amount of guarantees by HSBC Holdings in favour of other Group entities is set out in Note
32
.
Information on structured entities consolidated by HSBC where HSBC owns less than 50% of the voting rights is included in Note
19
‘Structured entities’. In each of these cases, HSBC controls and consolidates an entity when it is exposed, or has rights, to variable returns from its involvement with the entity and has the ability to affect those returns through its power over the entity.
|
Subsidiaries with significant non-controlling interests
|
||||
|
|
2017
|
|
2016
|
|
|
Hang Seng Bank Limited
|
|
|
|
|
|
Proportion of ownership interests and voting rights held by non-controlling interests
|
37.86%
|
|
37.86%
|
|
|
Place of business
|
Hong Kong
|
|
Hong Kong
|
|
|
|
$m
|
|
$m
|
|
|
Profit attributable to non-controlling interests
|
997
|
|
814
|
|
|
Accumulated non-controlling interests of the subsidiary
|
6,233
|
|
5,792
|
|
|
Dividends paid to non-controlling interests
|
594
|
|
811
|
|
|
Summarised financial information:
|
|
|
|
|
|
– total assets
|
186,638
|
|
175,242
|
|
|
– total liabilities
|
169,275
|
|
159,035
|
|
|
– net operating income before loan impairment
|
4,556
|
|
3,937
|
|
|
– profit for the year
|
2,632
|
|
2,148
|
|
|
– total comprehensive income for the year
|
2,895
|
|
2,044
|
|
|
19
|
Structured entities
|
HSBC is mainly involved with both consolidated and unconsolidated structured entities through the securitisation of financial assets, conduits and investment funds, established either by HSBC or a third party.
Consolidated structured entities
|
Total assets of HSBC’s consolidated structured entities, split by entity type
|
||||||||||
|
|
Conduits
|
|
Securitisations
|
|
HSBC
managed funds |
|
Other
|
|
Total
|
|
|
|
$bn
|
|
$bn
|
|
$bn
|
|
$bn
|
|
$bn
|
|
|
At 31 Dec 2017
|
12.9
|
|
4.8
|
|
7.0
|
|
3.2
|
|
27.9
|
|
|
At 31 Dec 2016
|
15.8
|
|
5.7
|
|
4.8
|
|
3.7
|
|
30.0
|
|
Conduits
HSBC has established and manages two types of conduits: securities investment conduits (‘SICs’) and multi-seller conduits.
Securities investment conduits
The SICs purchase highly rated ABSs to facilitate tailored investment opportunities.
|
•
|
Solitaire – At 31 December
2017
, Solitaire, HSBC’s principal SIC held
$3.2b
n of ABSs (
2016
:
$4.7b
n). These are included within the disclosures of ABSs on page
140
. It is currently funded entirely by commercial paper (‘CP’) issued to HSBC. Although HSBC continues to provide a liquidity facility, Solitaire has no need to draw on it as long as HSBC purchases its issued CP, which HSBC intends to do for the foreseeable future. At 31 December
2017
, HSBC held
$4.6b
n of CP (
2016
:
$6.1b
n).
|
|
•
|
Mazarin, Barion and Malachite – All three SICs are now funded by medium-term notes, and are no longer funded by repurchase agreements. HSBC’s primary exposure to Mazarin, Barion and Malachite is represented by the amortised cost of the debt required to support the non-cash assets of the vehicles. At 31 December
2017
, this amounted to
$0.9b
n (
2016
:
$1.3b
n). For all three SICs first loss protection is provided through the capital notes issued by these vehicles, which are held substantially by third parties.
|
Multi-seller conduit
HSBC’s multi-seller conduit was established to provide access to flexible market-based sources of finance for its clients. Currently, HSBC bears risk equal to the transaction-specific facility offered to the multi-seller conduit, amounting to
$15.7b
n at 31 December
2017
(
2016
:
$15.2b
n (restated)). First loss protection is provided by the originator of the assets, and not by HSBC, through transaction-specific credit enhancements. A layer of secondary loss protection is provided by HSBC in the form of programme-wide enhancement facilities.
Securitisations
HSBC uses structured entities to securitise customer loans and advances it originates in order to diversify its sources of funding for asset origination and capital efficiency purposes. The loans and advances are transferred by HSBC to the structured entities for cash or synthetically through credit default swaps, and the structured entities issue debt securities to investors.
HSBC managed funds
HSBC has established a number of money market and non-money market funds. Where it is deemed to be acting as principal rather than agent in its role as investment manager, HSBC controls these funds.
|
HSBC Holdings plc
|
261
|
Notes on the Financial Statements
Other
HSBC has also entered into a number of transactions in the normal course of business which include asset and structured finance transactions where it has control of the structured entity. In addition, HSBC is deemed to control a number of third-party managed funds through its involvement as a principal in the funds.
Unconsolidated structured entities
The term ‘unconsolidated structured entities’ refers to all structured entities not controlled by HSBC. The Group enters into transactions with unconsolidated structured entities in the normal course of business to facilitate customer transactions and for specific investment opportunities.
|
Nature and risks associated with HSBC interests in unconsolidated structured entities
|
||||||||||
|
|
Securitisations
|
|
HSBC
managed funds |
|
Non-HSBC
managed funds |
|
Other
|
|
Total
|
|
|
Total asset values of the entities ($m)
|
||||||||||
|
0 – 500
|
78
|
|
321
|
|
930
|
|
210
|
|
1,539
|
|
|
500 – 2,000
|
6
|
|
56
|
|
578
|
|
3
|
|
643
|
|
|
2,000 – 5,000
|
—
|
|
17
|
|
235
|
|
—
|
|
252
|
|
|
5,000 – 25,000
|
2
|
|
10
|
|
104
|
|
1
|
|
117
|
|
|
25,000+
|
—
|
|
2
|
|
11
|
|
—
|
|
13
|
|
|
Number of entities at 31 Dec 2017
|
86
|
|
406
|
|
1,858
|
|
214
|
|
2,564
|
|
|
$bn
|
|
$bn
|
|
$bn
|
|
$bn
|
|
$bn
|
|
|
|
Total assets in relation to HSBC’s interests in the unconsolidated structured entities
|
4.0
|
|
9.1
|
|
9.3
|
|
4.1
|
|
26.5
|
|
|
– trading assets
|
—
|
|
0.2
|
|
0.2
|
|
2.4
|
|
2.8
|
|
|
– financial assets designated at fair value
|
—
|
|
8.0
|
|
8.3
|
|
—
|
|
16.3
|
|
|
– loans and advances to banks
|
—
|
|
—
|
|
—
|
|
0.1
|
|
0.1
|
|
|
– loans and advances to customers
|
4.0
|
|
—
|
|
—
|
|
1.1
|
|
5.1
|
|
|
– financial investments
|
—
|
|
0.9
|
|
0.8
|
|
0.1
|
|
1.8
|
|
|
– other assets
|
—
|
|
—
|
|
—
|
|
0.4
|
|
0.4
|
|
|
Total liabilities in relation to HSBC’s interests in the unconsolidated structured entities
|
—
|
|
—
|
|
—
|
|
0.3
|
|
0.3
|
|
|
– other liabilities
|
—
|
|
—
|
|
—
|
|
0.3
|
|
0.3
|
|
|
Other off balance sheet commitments
|
—
|
|
0.1
|
|
2.2
|
|
0.3
|
|
2.6
|
|
|
HSBC’s maximum exposure at 31 Dec 2017
|
4.0
|
|
9.2
|
|
11.5
|
|
4.4
|
|
29.1
|
|
|
Total asset values of the entities ($m)
|
||||||||||
|
0 – 500
|
93
|
|
374
|
|
1,104
|
|
95
|
|
1,666
|
|
|
500 – 2,000
|
10
|
|
43
|
|
498
|
|
5
|
|
556
|
|
|
2,000 – 5,000
|
—
|
|
22
|
|
187
|
|
2
|
|
211
|
|
|
5,000 – 25,000
|
—
|
|
8
|
|
72
|
|
2
|
|
82
|
|
|
25,000+
|
—
|
|
1
|
|
4
|
|
1
|
|
6
|
|
|
Number of entities at 31 Dec 2016
|
103
|
|
448
|
|
1,865
|
|
105
|
|
2,521
|
|
|
$bn
|
|
$bn
|
|
$bn
|
|
$bn
|
|
$bn
|
|
|
|
Total assets in relation to HSBC’s interests in the unconsolidated structured entities
|
2.4
|
|
7.1
|
|
8.3
|
|
6.2
|
|
24.0
|
|
|
– trading assets
|
—
|
|
0.4
|
|
0.1
|
|
2.1
|
|
2.6
|
|
|
– financial assets designated at fair value
|
—
|
|
5.9
|
|
7.5
|
|
—
|
|
13.4
|
|
|
– loans and advances to banks
|
—
|
|
—
|
|
—
|
|
0.4
|
|
0.4
|
|
|
– loans and advances to customers
|
2.4
|
|
—
|
|
—
|
|
3.2
|
|
5.6
|
|
|
– financial investments
|
—
|
|
0.8
|
|
0.7
|
|
0.2
|
|
1.7
|
|
|
– other assets
|
—
|
|
—
|
|
—
|
|
0.3
|
|
0.3
|
|
|
Total liabilities in relation to HSBC’s interests in the unconsolidated structured entities
|
—
|
|
—
|
|
—
|
|
0.2
|
|
0.2
|
|
|
– other liabilities
|
—
|
|
—
|
|
—
|
|
0.2
|
|
0.2
|
|
|
Other off balance sheet commitments
|
—
|
|
—
|
|
2.7
|
|
0.1
|
|
2.8
|
|
|
HSBC’s maximum exposure at 31 Dec 2016
|
2.4
|
|
7.1
|
|
11.0
|
|
6.3
|
|
26.8
|
|
The maximum exposure to loss from HSBC’s interests in unconsolidated structured entities represents the maximum loss it could incur as a result of its involvement with these entities regardless of the probability of the loss being incurred.
|
•
|
For commitments, guarantees and written credit default swaps, the maximum exposure to loss is the notional amount of potential future losses.
|
|
•
|
For retained and purchased investments in and loans to unconsolidated structured entities, the maximum exposure to loss is the carrying value of these interests at the balance sheet reporting date.
|
The maximum exposure to loss is stated gross of the effects of hedging and collateral arrangements entered into to mitigate HSBC’s exposure to loss.
Securitisations
HSBC has interests in unconsolidated securitisation vehicles through holding notes issued by these entities. In addition, HSBC has investments in ABSs issued by third-party structured entities as set out on page
140
.
|
262
|
HSBC Holdings plc
|
HSBC managed funds
HSBC establishes and manages money market funds and non-money market investment funds to provide customers with investment opportunities. Further information on funds under management is provided on page
83
.
HSBC, as fund manager, may be entitled to receive management and performance fees based on the assets under management. HSBC may also retain units in these funds.
Non-HSBC managed funds
HSBC purchases and holds units of third-party managed funds in order to facilitate business and meet customer needs. In addition to entities, asset and liability classes disclosed above HSBC enters into derivative contracts with Non-HSBC managed funds. These interests arise in the normal course of business for the facilitation of third-party transactions and risk management solutions. Note
14
provides information on derivatives entered into by HSBC.
Other
HSBC has established structured entities in the normal course of business, such as structured credit transactions for customers, to provide finance to public and private sector infrastructure projects, and for asset and structured finance transactions. In addition to entities, asset and liability classes disclosed above HSBC enters into derivative contracts with Other Structured Entities. These interests arise in the normal course of business for the facilitation of third-party transactions and risk management solutions. Note
14
provides information on derivatives entered into by HSBC.
HSBC sponsored structured entities
The amount of assets transferred to and income received from such sponsored entities during
2017
and
2016
were not significant.
|
20
|
Goodwill and intangible assets
|
|
|
|
2017
|
|
2016
|
|
|
|
Footnote
|
$m
|
|
$m
|
|
|
Goodwill
|
|
13,588
|
|
12,330
|
|
|
Present value of in-force long-term insurance business
|
|
6,610
|
|
6,502
|
|
|
Other intangible assets
|
1
|
3,255
|
|
2,514
|
|
|
At 31 Dec
|
|
23,453
|
|
21,346
|
|
|
1
|
Included within other intangible assets is internally generated software with a net carrying value of $
2,641m
(2016: $
1,982m
).
|
|
Movement analysis of goodwill
|
||||
|
|
2017
|
|
2016
|
|
|
|
$m
|
|
$m
|
|
|
Gross amount
|
|
|
|
|
|
At 1 Jan
|
21,445
|
|
22,187
|
|
|
Exchange differences
|
1,490
|
|
(562
|
)
|
|
Reclassified to held for sale
|
—
|
|
(183
|
)
|
|
Other
|
(33
|
)
|
3
|
|
|
At 31 Dec
|
22,902
|
|
21,445
|
|
|
Accumulated impairment losses
|
|
|
|
|
|
At 1 Jan
|
(9,115
|
)
|
(5,893
|
)
|
|
Impairment losses
|
—
|
|
(3,240
|
)
|
|
Exchange differences
|
(327
|
)
|
—
|
|
|
Other
|
128
|
|
18
|
|
|
At 31 Dec
|
(9,314
|
)
|
(9,115
|
)
|
|
Net carrying amount at 31 Dec
|
13,588
|
|
12,330
|
|
Impairment testing
The Group’s impairment test in respect of goodwill allocated to each cash generating unit (‘CGU’) is performed as at 1 July each year. A review for indicators of impairment is undertaken at each subsequent quarter-end and as at 31 December 2017. No indicators of impairment were identified as part of these reviews.
Basis of the recoverable amount
The recoverable amount of all CGUs to which goodwill has been allocated was equal to its value in use (‘VIU’) at each respective testing date for 2016 and 2017. For each CGU, the VIU is calculated by discounting management’s cash flow projections for the CGU. The key assumptions used in the VIU calculation for each significant CGU are discussed below.
|
HSBC Holdings plc
|
263
|
Notes on the Financial Statements
|
Key assumptions in VIU calculation
|
|||||||||
|
|
|
Goodwill at
1 Jul 2017 |
|
Discount
rate |
Nominal growth rate beyond initial cash flow projections
|
Goodwill at
1 Jul 2016 |
|
Discount
rate
|
Nominal
growth rate beyond initial cash flow projections
|
|
|
Footnote
|
$m
|
|
%
|
%
|
$m
|
|
%
|
%
|
|
Cash-generating unit
|
|
|
|
|
|
|
|
||
|
Europe
|
|
|
|
|
|
|
|
||
|
RBWM
|
|
3,508
|
|
8.9
|
3.7
|
3,446
|
|
8.9
|
3.6
|
|
CMB
|
|
2,570
|
|
9.9
|
3.6
|
2,517
|
|
9.7
|
3.8
|
|
Global
|
|
|
|
|
|
|
|
||
|
GB&M
|
1
|
4,000
|
|
10.6
|
5.8
|
n/a
|
|
n/a
|
n/a
|
|
1
|
Subsequent to the 1 July 2016 annual test the CGU for Global Banking and Markets was amended from a regional to a global basis. The first formal impairment test for this CGU was performed as at 1 July 2017.
|
At 1 July 2017, aggregate goodwill of
$3,059m
(1 July 2016:
$3,025m
) had been allocated to CGUs that were not considered individually significant. The Group’s CGUs do not carry on their balance sheets any significant intangible assets with indefinite useful lives, other than goodwill.
Management’s judgement in estimating the cash flows of a CGU
The cash flow projections for each CGU are based on plans approved by the GMB. For the goodwill impairment test conducted at 1 July 2017, management’s cash flow projections until the end of 2021 were used.
Discount rate
The rate used to discount the cash flows is based on the cost of capital assigned to each CGU, which is derived using a capital asset pricing model (‘CAPM’). CAPM depends on a number of inputs reflecting financial and economic variables, including the risk-free rate and a premium to reflect the inherent risk of the business being evaluated. These variables are based on the market’s assessment of the economic variables and management’s judgement. The discount rates for each CGU are refined to reflect the rates of inflation for the countries within which the CGU operate. In addition, for the purposes of testing goodwill for impairment, management supplements this process by comparing the discount rates derived using the internally generated CAPM, with cost of capital rates produced by external sources for businesses operating in similar markets.
Nominal long-term growth rate
The long-term growth rate is used to extrapolate the cash flows in perpetuity because of the long-term perspective within the Group of business units making up the CGUs. These growth rates reflect GDP and inflation for the countries within which the CGU operates or derives revenue from.
Sensitivities of key assumptions in calculating VIU
At 1 July 2017, none of the CGUs were sensitive to reasonably possible adverse changes in key assumptions supporting the recoverable amount. In making an estimate of reasonably possible changes to assumptions, management considers the available evidence in respect of each input to the model such as the external range of discount rates observable, historical performance against forecast and risks attaching to the key assumptions underlying cash flow projections.
Present value of in-force long-term insurance business
When calculating the present value of in-force insurance business (‘PVIF’), expected cash flows are projected after adjusting for a variety of assumptions made by each insurance operation to reflect local market conditions and management’s judgement of future trends, and uncertainty in the underlying assumptions is reflected by applying margins (as opposed to a cost of capital methodology). Variations in actual experience and changes to assumptions can contribute to volatility in the results of the insurance business.
Actuarial Control Committees of each key insurance entity meet on a quarterly basis to review and approve PVIF assumptions. All changes to non-economic assumptions, economic assumptions that are not observable and model methodology must be approved by the Actuarial Control Committee.
|
Movements in PVIF
|
|||||
|
|
|
2017
|
|
2016
|
|
|
|
Footnotes
|
$m
|
|
$m
|
|
|
PVIF at 1 Jan
|
|
6,502
|
|
5,685
|
|
|
Change in PVIF of long-term insurance business
|
|
24
|
|
902
|
|
|
– value of new business written during the year
|
|
919
|
|
900
|
|
|
– expected return
|
1
|
(599
|
)
|
(532
|
)
|
|
– assumption changes and experience variances (see below)
|
|
(280
|
)
|
513
|
|
|
– other adjustments
|
|
(16
|
)
|
21
|
|
|
Transfer of assets classified as held for sale
|
2
|
—
|
|
(45
|
)
|
|
Exchange differences and other
|
|
84
|
|
(40
|
)
|
|
PVIF at 31 Dec
|
|
6,610
|
|
6,502
|
|
|
1
|
‘Expected return’ represents the unwinding of the discount rate and reversal of expected cash flows for the period.
|
|
2
|
Relates to the Brazilian insurance operations which were classified as held for sale in 2015.
|
|
264
|
HSBC Holdings plc
|
Assumption changes and experience variances
Included within this line item are:
|
•
|
$(98)m
(2016:
$279m
), directly offsetting regulatory-driven changes to the valuation of liabilities under insurance contracts.
|
|
•
|
$(141)m
(2016:
$301m
), reflecting the future expected sharing of returns with policyholders on contracts with discretionary participation features (‘DPF’), to the extent this sharing is not already included in liabilities under insurance contracts.
|
|
•
|
$(41)m
(2016:
$(67)m
), driven by other assumptions changes and experience variances.
|
Key assumptions used in the computation of PVIF for main life insurance operations
Economic assumptions are set in a way that is consistent with observable market values. The valuation of PVIF is sensitive to observed market movements and the impact of such changes is included in the sensitivities presented below.
|
|
2017
|
2016
|
||
|
|
Hong Kong
|
France
1
|
Hong Kong
|
France
1
|
|
|
%
|
%
|
%
|
%
|
|
Weighted average risk-free rate
|
2.02
|
1.50
|
2.09
|
0.99
|
|
Weighted average risk discount rate
|
6.20
|
2.20
|
6.34
|
1.84
|
|
Expense inflation
|
3.00
|
1.48
|
3.00
|
1.66
|
|
1
|
For 2017, the calculation of France’s PVIF assumes a risk discount rate of
2.20%
(2016:
1.84%
) plus a risk margin of
$80m
(2016:
$101m
).
|
Sensitivity to changes in economic assumptions
The Group sets the risk discount rate applied to the PVIF calculation by starting from a risk-free rate curve and adding explicit allowances for risks not reflected in the best estimate cash flow modelling. Where the insurance operations provide options and guarantees to policyholders the cost of these options and guarantees is an explicit reduction to PVIF, unless it is already allowed for as an explicit addition to the technical provisions required by regulators. See page
160
for further details of these guarantees and the impact of changes in economic assumptions on our insurance manufacturing subsidiaries.
Sensitivity to changes in non-economic assumptions
Policyholder liabilities and PVIF are determined by reference to non-economic assumptions including mortality and/or morbidity, lapse rates and expense rates. See page
161
for further details on the impact of changes in non-economic assumptions on our insurance manufacturing operations.
|
21
|
Prepayments, accrued income and other assets
|
|
|
2017
|
|
2016
|
|
|
|
$m
|
|
$m
|
|
|
Prepayments and accrued income
|
7,929
|
|
7,335
|
|
|
Assets held for sale
|
781
|
|
4,389
|
|
|
Bullion
|
13,128
|
|
15,406
|
|
|
Endorsements and acceptances
|
9,750
|
|
8,574
|
|
|
Reinsurers’ share of liabilities under insurance contracts (Note 3)
|
2,471
|
|
1,820
|
|
|
Employee benefit assets (Note 5)
|
8,752
|
|
4,714
|
|
|
Other accounts
|
14,353
|
|
12,298
|
|
|
Property, plant and equipment
|
10,027
|
|
9,373
|
|
|
At 31 Dec
|
67,191
|
|
63,909
|
|
Prepayments, accrued income and other assets include
$30,431m
(2016:
$26,927m
) of financial assets, the majority of which are measured at amortised cost.
|
22
|
Trading liabilities
|
|
2017
|
|
2016
|
|
||
|
Footnotes
|
$m
|
|
$m
|
|
|
|
Deposits by banks
|
1
|
23,297
|
|
24,827
|
|
|
Customer accounts
|
1, 2
|
52,595
|
|
45,085
|
|
|
Other debt securities in issue (Note 24)
|
3
|
40,734
|
|
32,656
|
|
|
Other liabilities – net short positions in securities
|
67,735
|
|
51,123
|
|
|
|
At 31 Dec
|
184,361
|
|
153,691
|
|
|
|
1
|
‘Deposits by banks’ and ‘Customer accounts’ include repos, settlement accounts, stock lending, cash collateral and margin accounts relating to trading activities.
|
|
2
|
Structured deposits placed at HSBC Bank USA and HSBC Trust Company (Delaware) National Association are insured by the Federal Deposit Insurance Corporation, a US government agency, up to $250,000 per depositor.
|
|
3
|
‘Other debt securities in issue’ comprises structured notes issued by HSBC for which market risks are actively managed as part of trading portfolios.
|
At 31 December 2017, the cumulative amount of change in fair value attributable to changes in HSBC’s credit risk was a loss of
$543
m (2016: gain of
$2
m).
|
HSBC Holdings plc
|
265
|
Notes on the Financial Statements
|
23
|
Financial liabilities designated at fair value
|
|
HSBC
|
||||
|
|
2017
|
|
2016
|
|
|
|
$m
|
|
$m
|
|
|
Deposits by banks and customer accounts
|
145
|
|
135
|
|
|
Liabilities to customers under investment contracts
|
5,635
|
|
6,002
|
|
|
Debt securities in issue (Note 24)
|
64,359
|
|
57,112
|
|
|
Subordinated liabilities (Note 27)
|
23,831
|
|
23,172
|
|
|
Preferred securities (Note 27)
|
459
|
|
411
|
|
|
At 31 Dec
|
94,429
|
|
86,832
|
|
The carrying amount of financial liabilities designated at fair value was
$5,343
m more than the contractual amount at maturity (
2016
:
$4,413
m more). The cumulative own credit
loss
recognised was
$4,107
m (
2016
: loss of
$1,672
m).
|
HSBC Holdings
|
||||
|
|
2017
|
|
2016
|
|
|
|
$m
|
|
$m
|
|
|
Debt securities in issue (Note 24)
|
17,496
|
|
16,766
|
|
|
Subordinated liabilities (Note 27)
|
13,394
|
|
13,347
|
|
|
At 31 Dec
|
30,890
|
|
30,113
|
|
The carrying amount of financial liabilities designated at fair value was $
3,370m
more than the contractual amount at maturity
(2016: $ 2,681m more). The cumulative amount of change in fair value attributable to changes in credit risk was a loss of
$ 2,209m (2016: loss of $ 1,202m ).
(2016: $ 2,681m more). The cumulative amount of change in fair value attributable to changes in credit risk was a loss of
$ 2,209m (2016: loss of $ 1,202m ).
|
24
|
Debt securities in issue
|
|
HSBC
|
||||
|
|
2017
|
|
2016
|
|
|
|
$m
|
|
$m
|
|
|
Bonds and medium-term notes
|
146,539
|
|
133,721
|
|
|
Other debt securities in issue
|
23,100
|
|
21,962
|
|
|
Total debt securities in issue
|
169,639
|
|
155,683
|
|
|
Included within:
|
|
|
|
|
|
– trading liabilities (Note 22)
|
(40,734
|
)
|
(32,656
|
)
|
|
– financial liabilities designated at fair value (Note 23)
|
(64,359
|
)
|
(57,112
|
)
|
|
At 31 Dec
|
64,546
|
|
65,915
|
|
|
HSBC Holdings
|
||||
|
2017
|
|
2016
|
|
|
|
$m
|
|
$m
|
|
|
|
Debt securities
|
51,754
|
|
38,571
|
|
|
Included within:
|
|
|
|
|
|
– financial liabilities designated at fair value (Note 23)
|
(17,496
|
)
|
(16,766
|
)
|
|
At 31 Dec
|
34,258
|
|
21,805
|
|
|
25
|
Accruals, deferred income and other liabilities
|
|
|
2017
|
|
2016
|
|
|
|
$m
|
|
$m
|
|
|
Accruals and deferred income
|
11,521
|
|
10,770
|
|
|
Endorsements and acceptances
|
9,746
|
|
8,567
|
|
|
Employee benefit liabilities (Note 5)
|
2,152
|
|
2,681
|
|
|
Liabilities of disposal groups held for sale
|
1,286
|
|
2,790
|
|
|
Other liabilities
|
21,202
|
|
19,483
|
|
|
At 31 Dec
|
45,907
|
|
44,291
|
|
Accruals, deferred income and other liabilities include $
34,048m
(2016: $
30,932m
) of financial liabilities, the majority of which are measured at amortised cost.
|
266
|
HSBC Holdings plc
|
|
26
|
Provisions
|
|
Restructuring
costs |
|
Contractual
commitments |
|
Legal proceedings
and regulatory matters |
|
Customer
remediation |
|
Other
provisions |
|
Total
|
|
|
|
$m
|
|
$m
|
|
$m
|
|
$m
|
|
$m
|
|
$m
|
|
|
|
At 1 Jan 2017
|
551
|
|
298
|
|
2,436
|
|
1,124
|
|
364
|
|
4,773
|
|
|
Additions
|
204
|
|
87
|
|
829
|
|
820
|
|
280
|
|
2,220
|
|
|
Amounts utilised
|
(353
|
)
|
(3
|
)
|
(850
|
)
|
(543
|
)
|
(133
|
)
|
(1,882
|
)
|
|
Unused amounts reversed
|
(103
|
)
|
(135
|
)
|
(980
|
)
|
(52
|
)
|
(107
|
)
|
(1,377
|
)
|
|
Unwinding of discounts
|
—
|
|
(1
|
)
|
—
|
|
—
|
|
9
|
|
8
|
|
|
Exchange and other movements
|
35
|
|
7
|
|
66
|
|
105
|
|
56
|
|
269
|
|
|
At 31 Dec 2017
|
334
|
|
253
|
|
1,501
|
|
1,454
|
|
469
|
|
4,011
|
|
|
At 1 Jan 2016
|
463
|
|
240
|
|
3,174
|
|
1,340
|
|
335
|
|
5,552
|
|
|
Additions
|
415
|
|
141
|
|
1,258
|
|
762
|
|
208
|
|
2,784
|
|
|
Amounts utilised
|
(168
|
)
|
(1
|
)
|
(1,831
|
)
|
(680
|
)
|
(118
|
)
|
(2,798
|
)
|
|
Unused amounts reversed
|
(115
|
)
|
(97
|
)
|
(165
|
)
|
(94
|
)
|
(96
|
)
|
(567
|
)
|
|
Unwinding of discounts
|
—
|
|
—
|
|
—
|
|
—
|
|
6
|
|
6
|
|
|
Exchange and other movements
|
(44
|
)
|
15
|
|
—
|
|
(204
|
)
|
29
|
|
(204
|
)
|
|
At 31 Dec 2016
|
551
|
|
298
|
|
2,436
|
|
1,124
|
|
364
|
|
4,773
|
|
Further details of ‘Legal proceedings and regulatory matters’ are set out in Note
34
. Legal proceedings include civil court, arbitration or tribunal proceedings brought against HSBC companies (whether by way of claim or counterclaim); or civil disputes that may, if not settled, result in court, arbitration or tribunal proceedings. Regulatory matters refers to investigations, reviews and other actions carried out by, or in response to the actions of, regulators or law enforcement agencies in connection with alleged wrongdoing by HSBC.
Customer remediation refers to HSBC’s activities to compensate customers for losses or damages associated with a failure to comply with regulations or to treat customers fairly. Customer remediation is often initiated by HSBC in response to customer complaints and/or industry developments in sales practices, and is not necessarily initiated by regulatory action. Further details of customer remediation are set out in this note.
Payment protection insurance
$1,174m
(2016: $
919m
) relating to the estimated liability for redress in respect of the possible mis-selling of Payment Protection Insurance (‘PPI’) policies in previous years. Cumulative provisions made since the Judicial Review ruling in the first half of 2011 amount to $
5.1bn
, of which
$3.9bn
had been paid at 31 December 2017.
An increase in provisions of
$637m
was recognised during the year, primarily reflecting an adjustment to expected future complaint volumes; in light of additional detail becoming available around the likely impact and profile of regulatory media campaigns during the remainder of the period during which complaints could be received.
The estimated liability for redress is calculated on the basis of the total premiums paid by the customer plus simple interest of
8%
per annum (or the rate inherent in the related loan product where higher). The basis for calculating the redress liability is the same for single premium and regular premium policies. Future estimated redress levels are based on the historically observed redress per policy.
A total of
5.4 million
PPI policies have been sold since 2000, generating estimated revenues of
$3.3bn
at 2017. The gross written premiums on these policies was approximately
$4.4bn
.
At 31 December 2017, the estimated total complaints expected to be received were
2.2 million
, representing
41%
of total policies sold. It is estimated that contact will be made with regard to
2.6 million
policies, representing
48%
of total policies sold. This estimate includes inbound complaints as well as the group’s proactive contact exercise on certain policies (‘outbound contact’).
The following table details the cumulative number of complaints received at 31 December 2017 and the number of claims expected in the future:
|
Cumulative PPI complaints received to 31 December 2017 and future claims expected
|
|||||
|
Footnotes
|
Cumulative actual to
31 Dec 2017
|
|
Future
expected
|
|
|
|
Inbound complaints (000s of policies)
|
1
|
1,555
|
|
363
|
|
|
Outbound contact (000s of policies)
|
685
|
|
—
|
|
|
|
Response rate to outbound contact
|
44%
|
|
n/a
|
|
|
|
Average uphold rate per claim
|
2
|
76%
|
|
84%
|
|
|
Average redress per claim ($)
|
2,564
|
|
3,029
|
|
|
|
Complaints to Financial Ombudsman Service (000s of policies)
|
144
|
|
26
|
|
|
|
Average uphold rate per Financial Ombudsman Service claim
|
40%
|
|
47%
|
|
|
|
1
|
Excludes invalid claims for which no PPI policy exists.
|
|
2
|
Claims include inbound and responses to outbound contact.
|
A 100,000 increase/decrease in the total inbound complaints would increase/decrease the redress provision by approximately
$194m
at 2017 average exchange rates.
|
HSBC Holdings plc
|
267
|
Notes on the Financial Statements
|
27
|
Subordinated liabilities
|
|
HSBC’s subordinated liabilities
|
||||
|
2017
|
|
2016
|
|
|
|
$m
|
|
$m
|
|
|
|
At amortised cost
|
19,826
|
|
20,984
|
|
|
– subordinated liabilities
|
17,988
|
|
19,230
|
|
|
– preferred securities
|
1,838
|
|
1,754
|
|
|
Designated at fair value
(Note 23)
|
24,290
|
|
23,583
|
|
|
– subordinated liabilities
|
23,831
|
|
23,172
|
|
|
– preferred securities
|
459
|
|
411
|
|
|
At 31 Dec
|
44,116
|
|
44,567
|
|
|
Issued by HSBC subsidiaries
|
15,470
|
|
16,860
|
|
|
Issued by HSBC Holdings
|
28,646
|
|
27,707
|
|
Subordinated liabilities rank behind senior obligations and generally count towards the capital base of HSBC. Capital securities may be called and redeemed by HSBC subject to prior notification to the PRA and, where relevant, the consent of the local banking regulator. If not redeemed at the first call date, coupons payable may step up or become floating rate based on interbank rates. On capital securities other than floating rate notes, interest is payable at fixed rates of up to
10.176%
.
The balance sheet amounts disclosed below are presented on an IFRS basis and do not reflect the amount that the instruments contribute to regulatory capital principally due to regulatory amortisation and regulatory eligibility limits.
|
268
|
HSBC Holdings plc
|
|
HSBC’s subordinated liabilities in issue
|
|||||||||
|
2017
|
|
2016
|
|
||||||
|
Footnotes
|
First call date
|
|
Maturity date
|
$m
|
|
$m
|
|
||
|
Additional tier 1 capital securities guaranteed by HSBC Holdings plc
|
1
|
||||||||
|
$900m
|
10.176% non-cumulative step-up perpetual preferred securities, series 2
|
Jun 2030
|
|
892
|
|
891
|
|
||
|
892
|
|
891
|
|
||||||
|
Additional tier 1 capital securities guaranteed by HSBC Bank plc
|
1
|
||||||||
|
£300m
|
5.862% non-cumulative step-up perpetual preferred securities
|
Apr 2020
|
|
459
|
|
411
|
|
||
|
£700m
|
5.844% non-cumulative step-up perpetual preferred securities
|
Nov 2031
|
|
946
|
|
863
|
|
||
|
1,405
|
|
1,274
|
|
||||||
|
Tier 2 securities issued by HSBC Bank plc
|
|||||||||
|
$750m
|
Undated floating rate primary capital notes
|
Jun 1990
|
|
750
|
|
750
|
|
||
|
$500m
|
Undated floating rate primary capital notes
|
Sep 1990
|
|
500
|
|
500
|
|
||
|
$300m
|
Undated floating rate primary capital notes, series 3
|
Jun 1992
|
|
300
|
|
300
|
|
||
|
$300m
|
7.65% subordinated notes
|
—
|
|
May 2025
|
375
|
|
372
|
|
|
|
£350m
|
5.00% callable subordinated notes
|
2
|
Mar 2018
|
|
Mar 2023
|
496
|
|
466
|
|
|
£300m
|
6.50% subordinated notes
|
—
|
|
Jul 2023
|
405
|
|
369
|
|
|
|
£350m
|
5.375% callable subordinated step-up notes
|
3
|
Nov 2025
|
|
Nov 2030
|
584
|
|
489
|
|
|
£500m
|
5.375% subordinated notes
|
—
|
|
Aug 2033
|
912
|
|
750
|
|
|
|
£225m
|
6.25% subordinated notes
|
—
|
|
Jan 2041
|
303
|
|
276
|
|
|
|
£600m
|
4.75% subordinated notes
|
—
|
|
Mar 2046
|
802
|
|
731
|
|
|
|
5,427
|
|
5,003
|
|
||||||
|
Tier 2 securities issued by The Hongkong and Shanghai Banking Corporation Ltd
|
|||||||||
|
$400m
|
Primary capital undated floating rate notes (third series)
|
Jul 1991
|
|
400
|
|
400
|
|
||
|
400
|
|
400
|
|
||||||
|
Tier 2 securities issued by HSBC Bank Malaysia Berhad
|
|||||||||
|
MYR500m
|
4.35% subordinated bonds
|
4
|
Jun 2017
|
|
Jun 2022
|
—
|
|
112
|
|
|
MYR500m
|
5.05% subordinated bonds
|
Nov 2022
|
|
Nov 2027
|
123
|
|
112
|
|
|
|
123
|
|
224
|
|
||||||
|
Tier 2 securities issued by HSBC USA Inc.
|
|||||||||
|
$750m
|
5.00% subordinated notes
|
—
|
|
Sep 2020
|
748
|
|
748
|
|
|
|
$250m
|
7.20% subordinated debentures
|
—
|
|
Jul 2097
|
221
|
|
220
|
|
|
|
Other subordinated liabilities each less than $150m
|
5
|
277
|
|
284
|
|
||||
|
1,246
|
|
1,252
|
|
||||||
|
Tier 2 securities issued by HSBC Bank USA, N.A.
|
|||||||||
|
$500m
|
6.00% subordinated notes
|
—
|
|
Aug 2017
|
—
|
|
498
|
|
|
|
$1,250m
|
4.875% subordinated notes
|
—
|
|
Aug 2020
|
1,236
|
|
1,257
|
|
|
|
$1,000m
|
5.875% subordinated notes
|
—
|
|
Nov 2034
|
1,272
|
|
1,137
|
|
|
|
$750m
|
5.625% subordinated notes
|
—
|
|
Aug 2035
|
955
|
|
862
|
|
|
|
$700m
|
7.00% subordinated notes
|
—
|
|
Jan 2039
|
700
|
|
701
|
|
|
|
4,163
|
|
4,455
|
|
||||||
|
Tier 2 securities issued by HSBC Finance Corporation
|
|||||||||
|
$2,939m
|
6.676% senior subordinated notes
|
6
|
—
|
|
Jan 2021
|
1,092
|
|
2,192
|
|
|
Tier 2 securities issued by HSBC Bank Canada
|
|||||||||
|
CAD400m
|
4.80% subordinated debentures
|
4
|
Apr 2017
|
|
Apr 2022
|
—
|
|
299
|
|
|
Other subordinated liabilities each less than $150m
|
Oct 1996
|
|
Nov 2083
|
31
|
|
29
|
|
||
|
31
|
|
328
|
|
||||||
|
Securities issued by HSBC Mexico, S.A.
|
|||||||||
|
$300m
|
Non-convertible subordinated obligations
|
7, 8
|
Jun 2014
|
|
Jun 2019
|
240
|
|
240
|
|
|
Other subordinated liability less than $150m
|
7, 9
|
115
|
|
198
|
|
||||
|
355
|
|
438
|
|
||||||
|
Securities issued by other HSBC subsidiaries
|
|||||||||
|
Other subordinated liabilities each less than $200m
|
5
|
336
|
|
403
|
|
||||
|
Subordinated liabilities issued by HSBC subsidiaries at 31 Dec
|
15,470
|
|
16,860
|
|
|||||
|
1
|
See paragraph below, ‘Guaranteed by HSBC Holdings or HSBC Bank plc’.
|
|
2
|
In January 2018, HSBC gave notice it will redeem these securities.
|
|
3
|
The interest rate payable after November 2025 is the sum of the three-month sterling Libor plus
1.50%
percentage points.
|
|
4
|
In 2017 HSBC redeemed these securities.
|
|
5
|
Some securities included here are ineligible for inclusion in the capital base of HSBC.
|
|
6
|
HSBC tendered for these securities in 2017. In January 2018 a further tender was conducted. The principal balance is now
$509m
.
|
|
7
|
These securities are ineligible for inclusion in the capital base of HSBC.
|
|
8
|
Approximately
$60m
of these securities are held by HSBC Holdings.
|
|
9
|
In February 2018, HSBC gave notice it will redeem these securities.
|
|
HSBC Holdings plc
|
269
|
Notes on the Financial Statements
|
HSBC Holdings
|
||||
|
2017
|
|
2016
|
|
|
|
$m
|
|
$m
|
|
|
|
At amortised cost
|
15,877
|
|
15,189
|
|
|
Designated at fair value (Note 23)
|
13,394
|
|
13,347
|
|
|
At 31 Dec
|
29,271
|
|
28,536
|
|
|
HSBC Holdings’ subordinated liabilities
|
|||||||||
|
First call
|
|
Maturity
|
2017
|
|
2016
|
|
|||
|
Footnotes
|
date
|
|
date
|
$m
|
|
$m
|
|
||
|
Tier 2 securities issued by HSBC Holdings plc
|
|||||||||
|
Amounts owed to third parties
|
|||||||||
|
$2,000m
|
4.25% subordinated notes
|
2,4
|
—
|
|
Mar 2024
|
2,038
|
|
2,060
|
|
|
$1,500m
|
4.25% subordinated notes
|
2
|
—
|
|
Jun 2025
|
1,586
|
|
1,539
|
|
|
$1,500m
|
4.375% subordinated notes
|
2
|
—
|
|
Nov 2026
|
1,580
|
|
1,520
|
|
|
$488m
|
7.625% subordinated notes
|
1
|
—
|
|
May 2032
|
553
|
|
528
|
|
|
$222m
|
7.35% subordinated notes
|
1
|
—
|
|
Nov 2032
|
248
|
|
278
|
|
|
$2,000m
|
6.5% subordinated notes
|
1
|
—
|
|
May 2036
|
2,042
|
|
2,029
|
|
|
$2,500m
|
6.5% subordinated notes
|
1
|
—
|
|
Sep 2037
|
3,365
|
|
3,170
|
|
|
$1,500m
|
6.8% subordinated notes
|
1
|
—
|
|
Jun 2038
|
1,489
|
|
1,487
|
|
|
$1,500m
|
5.25% subordinated notes
|
2,4
|
—
|
|
Mar 2044
|
1,755
|
|
1,747
|
|
|
£900m
|
6.375% subordinated notes
|
1,3
|
Oct 2017
|
|
Oct 2022
|
—
|
|
1,163
|
|
|
£650m
|
5.75% subordinated notes
|
2
|
—
|
|
Dec 2027
|
1,114
|
|
932
|
|
|
£650m
|
6.75% subordinated notes
|
2
|
—
|
|
Sep 2028
|
873
|
|
793
|
|
|
£750m
|
7.0% subordinated notes
|
2
|
—
|
|
Apr 2038
|
1,043
|
|
971
|
|
|
£900m
|
6.0% subordinated notes
|
2
|
—
|
|
Mar 2040
|
1,199
|
|
1,086
|
|
|
€1,600m
|
6.25% subordinated notes
|
2
|
—
|
|
Mar 2018
|
1,918
|
|
1,693
|
|
|
€1,750m
|
6.0% subordinated notes
|
2
|
—
|
|
Jun 2019
|
2,349
|
|
2,168
|
|
|
€1,500m
|
3.375% subordinated notes
|
2,4
|
Jan 2019
|
|
Jan 2024
|
1,827
|
|
1,626
|
|
|
€1,500m
|
3.0% subordinated notes
|
2
|
—
|
|
Jun 2025
|
2,037
|
|
1,716
|
|
|
€1,000m
|
3.125% subordinated notes
|
2
|
—
|
|
Jun 2028
|
1,363
|
|
1,139
|
|
|
|
|
|
|
|
|
28,379
|
|
27,645
|
|
|
Amounts owed to HSBC undertakings
|
|
|
|
|
|
|
|
|
|
|
$900m
|
10.176% subordinated step-up cumulative notes
|
|
Jun 2030
|
|
Jun 2040
|
892
|
|
891
|
|
|
|
|
|
|
|
|
892
|
|
891
|
|
|
At 31 Dec
|
|
|
|
|
29,271
|
|
28,536
|
|
|
|
1
|
Amounts owed to third parties represent securities included in the capital base of HSBC as tier 2 securities in accordance with the grandfathering provisions under CRD IV rules.
|
|
2
|
These securities are included in the capital base of HSBC as fully CRD IV compliant tier 2 securities on an end point basis.
|
|
3
|
In 2017, HSBC redeemed these securities.
|
|
4
|
These subordinated notes are measured at amortised cost in HSBC Holdings, where the interest rate risk is hedged using a fair value hedge, while they are measured at fair value in the Group.
|
Additional tier 1 capital securities
Additional tier 1 capital securities are perpetual subordinated securities on which coupon payments may be deferred or cancelled at the discretion of HSBC. The securities presented in this Note are accounted for as liabilities because HSBC has an obligation to pay dividends in perpetuity. See Note
31
for additional tier 1 capital securities accounted for as equity.
The additional tier 1 securities presented in this section do not meet the identifying criteria in full for recognition as tier 1 capital under CRD IV but are eligible as regulatory capital subject to grandfathering limits and progressive phase-out.
Guaranteed by HSBC Holdings or HSBC Bank plc
These capital securities were issued by the Jersey limited partnerships and proceeds lent to the respective guarantors by the limited partnerships in the form of subordinated notes. They qualify as additional tier 1 capital for HSBC under CRD IV by virtue of the application of grandfathering provisions, and the two capital securities guaranteed by HSBC Bank plc (‘HSBC Bank’) also qualify as additional tier 1 capital for HSBC Bank (on a solo and a consolidated basis) under CRD IV by virtue of the same grandfathering process.
These preferred securities, together with the guarantee, are intended to provide investors with economic rights equivalent to the rights that they would have had if they had purchased non-cumulative perpetual preference shares of the relevant issuer. There are limitations on the payment of distributions if such payments are prohibited under UK banking regulations or other requirements, if a payment would cause a breach of HSBC’s capital adequacy requirements or if HSBC Holdings or HSBC Bank has insufficient distributable reserves (as defined).
HSBC Holdings and HSBC Bank have individually covenanted that if prevented under certain circumstances from paying distributions on the preferred securities in full, they will not pay dividends or other distributions in respect of their ordinary shares, or repurchase or redeem their ordinary shares, until the distribution on the preferred securities has been paid in full.
Preference shares of HSBC Holdings that have economic terms equal in all material respects to the preferred securities and their guarantee together will be substituted for the preferred securities guaranteed by HSBC Holdings if the total capital ratio of HSBC Holdings falls below the regulatory minimum required, or the Directors expect it to in the near term.
Preference shares of HSBC Bank that have economic terms equal in all material respects to the preferred securities and their guarantee together will be substituted for the preferred securities guaranteed by HSBC Bank if any of the two issues of preferred securities are
|
270
|
HSBC Holdings plc
|
outstanding in April 2049 or November 2048, respectively; or the total capital ratio of HSBC Bank on a solo and consolidated basis falls below the regulatory minimum required, or the Directors expect it to in the near term.
Tier 2 capital securities
These capital securities are included within HSBC’s regulatory capital base as tier 2 capital under CRD IV by virtue of the application of grandfathering provisions (with the exception of identified securities that are compliant with CRD IV end point rules). Tier 2 capital securities are either perpetual or dated subordinated securities on which there is an obligation to pay coupons. In accordance with CRD IV, the capital contribution of all tier 2 securities is amortised for regulatory purposes in their final five years before maturity.
|
28
|
Maturity analysis of assets, liabilities and off-balance sheet commitments
|
The table on page
272
provides an analysis of consolidated total assets, liabilities and off-balance sheet commitments by residual contractual maturity at the balance sheet date. These balances are included in the maturity analysis as follows:
|
•
|
Trading assets and liabilities (including trading derivatives but excluding reverse repos, repos and debt securities in issue) are included in the ‘Due not more than 1 month’ time bucket, because trading balances are typically held for short periods of time.
|
|
•
|
Financial assets and liabilities with no contractual maturity (such as equity securities) are included in the ‘Due over 5 years’ time bucket. Undated or perpetual instruments are classified based on the contractual notice period which the counterparty of the instrument is entitled to give. Where there is no contractual notice period, undated or perpetual contracts are included in the ‘Due over 5 years’ time bucket.
|
|
•
|
Non-financial assets and liabilities with no contractual maturity are included in the ‘Due over 5 years’ time bucket.
|
|
•
|
Financial instruments included within assets and liabilities of disposal groups held for sale are classified on the basis of the contractual maturity of the underlying instruments and not on the basis of the disposal transaction.
|
|
•
|
Liabilities under insurance contracts are included in the ‘Due over 5 years’ time bucket. Liabilities under investment contracts are classified in accordance with their contractual maturity. Undated investment contracts are included in the ‘Due over 5 years’ time bucket, however, such contracts are subject to surrender and transfer options by the policyholders.
|
|
•
|
Loan and other credit-related commitments are classified on the basis of the earliest date they can be drawn down. Application of this policy throughout the Group was improved in 2017, and therefore comparative information has been represented.
|
|
HSBC Holdings plc
|
271
|
Notes on the Financial Statements
HSBC
|
Maturity analysis of assets, liabilities and off-balance sheet commitments
|
||||||||||||||||||
|
Due not
more than
1 month
|
|
Due over
1 month
but not
more than
3 months
|
|
Due over
3 months
but not
more than
6 months
|
|
Due over
6 months
but not
more than
9 months
|
|
Due over
9 months
but not
more than
1 year
|
|
Due over
1 year
but not
more than
2 years
|
|
Due over
2 years
but not
more than
5 years
|
|
Due over
5 years
|
|
Total
|
|
|
|
$m
|
|
$m
|
|
$m
|
|
$m
|
|
$m
|
|
$m
|
|
$m
|
|
$m
|
|
$m
|
|
|
|
Financial assets
|
||||||||||||||||||
|
Cash and balances at central banks
|
180,624
|
|
—
|
|
—
|
|
—
|
|
—
|
|
—
|
|
—
|
|
—
|
|
180,624
|
|
|
Items in the course of collection from other banks
|
6,628
|
|
—
|
|
—
|
|
—
|
|
—
|
|
—
|
|
—
|
|
—
|
|
6,628
|
|
|
Hong Kong Government certificates of indebtedness
|
34,186
|
|
—
|
|
—
|
|
—
|
|
—
|
|
—
|
|
—
|
|
—
|
|
34,186
|
|
|
Trading assets
|
284,781
|
|
1,432
|
|
642
|
|
—
|
|
1,140
|
|
—
|
|
—
|
|
—
|
|
287,995
|
|
|
Financial assets designated at fair value
|
612
|
|
93
|
|
230
|
|
162
|
|
197
|
|
556
|
|
2,068
|
|
25,546
|
|
29,464
|
|
|
Derivatives
|
218,103
|
|
162
|
|
97
|
|
124
|
|
42
|
|
234
|
|
592
|
|
464
|
|
219,818
|
|
|
Loans and advances to banks
|
61,968
|
|
10,665
|
|
4,212
|
|
2,344
|
|
1,502
|
|
5,799
|
|
2,491
|
|
1,412
|
|
90,393
|
|
|
Loans and advances to customers
|
195,577
|
|
65,469
|
|
49,860
|
|
34,107
|
|
37,176
|
|
93,065
|
|
218,784
|
|
268,926
|
|
962,964
|
|
|
– personal
|
42,593
|
|
9,126
|
|
8,483
|
|
7,441
|
|
7,492
|
|
23,552
|
|
61,238
|
|
214,837
|
|
374,762
|
|
|
– corporate and commercial
|
124,669
|
|
50,532
|
|
36,046
|
|
22,932
|
|
26,577
|
|
61,785
|
|
144,451
|
|
49,762
|
|
516,754
|
|
|
– financial
|
28,315
|
|
5,811
|
|
5,331
|
|
3,734
|
|
3,107
|
|
7,728
|
|
13,095
|
|
4,327
|
|
71,448
|
|
|
Reverse repurchase agreements
– non-trading |
144,244
|
|
30,289
|
|
7,951
|
|
2,194
|
|
3,960
|
|
1,072
|
|
4,598
|
|
7,245
|
|
201,553
|
|
|
Financial investments
|
31,981
|
|
51,487
|
|
31,634
|
|
13,446
|
|
17,647
|
|
40,582
|
|
90,366
|
|
111,933
|
|
389,076
|
|
|
Accrued income and other financial assets
|
19,259
|
|
5,795
|
|
2,050
|
|
358
|
|
411
|
|
652
|
|
513
|
|
2,046
|
|
31,084
|
|
|
Financial assets at 31 Dec 2017
|
1,177,963
|
|
165,392
|
|
96,676
|
|
52,735
|
|
62,075
|
|
141,960
|
|
319,412
|
|
417,572
|
|
2,433,785
|
|
|
Non-financial assets
|
—
|
|
—
|
|
—
|
|
—
|
|
—
|
|
—
|
|
—
|
|
87,986
|
|
87,986
|
|
|
Total assets at 31 Dec 2017
|
1,177,963
|
|
165,392
|
|
96,676
|
|
52,735
|
|
62,075
|
|
141,960
|
|
319,412
|
|
505,558
|
|
2,521,771
|
|
|
Off-balance sheet commitments received
|
|
|
||||||||||||||||
|
Loan and other credit-related commitments
|
2,431
|
|
—
|
|
3,335
|
|
—
|
|
—
|
|
133
|
|
—
|
|
—
|
|
5,899
|
|
|
Financial liabilities
|
|
|||||||||||||||||
|
Hong Kong currency notes in circulation
|
34,186
|
|
—
|
|
—
|
|
—
|
|
—
|
|
—
|
|
—
|
|
—
|
|
34,186
|
|
|
Deposits by banks
|
56,829
|
|
1,961
|
|
1,097
|
|
616
|
|
157
|
|
361
|
|
7,393
|
|
1,508
|
|
69,922
|
|
|
Customer accounts
1
|
1,269,003
|
|
44,129
|
|
21,596
|
|
11,570
|
|
10,757
|
|
4,527
|
|
2,257
|
|
623
|
|
1,364,462
|
|
|
– personal
|
648,040
|
|
22,938
|
|
13,489
|
|
6,810
|
|
5,727
|
|
2,753
|
|
1,557
|
|
119
|
|
701,433
|
|
|
– corporate and commercial
|
458,937
|
|
16,496
|
|
6,983
|
|
3,712
|
|
3,970
|
|
1,705
|
|
641
|
|
451
|
|
492,895
|
|
|
– financial
|
162,026
|
|
4,695
|
|
1,124
|
|
1,048
|
|
1,060
|
|
69
|
|
59
|
|
53
|
|
170,134
|
|
|
Repurchase agreements
– non-trading |
113,208
|
|
14,042
|
|
1,592
|
|
160
|
|
—
|
|
—
|
|
1,000
|
|
—
|
|
130,002
|
|
|
Items in the course of transmission to other banks
|
6,850
|
|
—
|
|
—
|
|
—
|
|
—
|
|
—
|
|
—
|
|
—
|
|
6,850
|
|
|
Trading liabilities
|
145,028
|
|
2,026
|
|
2,177
|
|
2,130
|
|
3,077
|
|
5,038
|
|
12,814
|
|
12,071
|
|
184,361
|
|
|
Financial liabilities designated at
fair value |
80
|
|
281
|
|
2,094
|
|
271
|
|
2,798
|
|
4,215
|
|
22,468
|
|
62,222
|
|
94,429
|
|
|
– debt securities in issue: covered bonds
|
—
|
|
—
|
|
—
|
|
209
|
|
—
|
|
212
|
|
2,494
|
|
1,654
|
|
4,569
|
|
|
– debt securities in issue: unsecured
|
55
|
|
95
|
|
2,087
|
|
62
|
|
2,797
|
|
1,654
|
|
19,505
|
|
33,535
|
|
59,790
|
|
|
– subordinated liabilities and preferred securities
|
—
|
|
—
|
|
—
|
|
—
|
|
—
|
|
2,349
|
|
459
|
|
21,482
|
|
24,290
|
|
|
– other
|
25
|
|
186
|
|
7
|
|
—
|
|
1
|
|
—
|
|
10
|
|
5,551
|
|
5,780
|
|
|
Derivatives
|
213,011
|
|
79
|
|
141
|
|
140
|
|
202
|
|
504
|
|
1,107
|
|
1,637
|
|
216,821
|
|
|
Debt securities in issue
|
6,081
|
|
6,295
|
|
5,228
|
|
5,795
|
|
9,240
|
|
6,725
|
|
22,767
|
|
2,415
|
|
64,546
|
|
|
– covered bonds
|
—
|
|
—
|
|
—
|
|
—
|
|
1
|
|
3
|
|
10
|
|
34
|
|
48
|
|
|
– otherwise secured
|
3,479
|
|
4
|
|
—
|
|
—
|
|
1,000
|
|
1,100
|
|
914
|
|
1,193
|
|
7,690
|
|
|
– unsecured
|
2,602
|
|
6,291
|
|
5,228
|
|
5,795
|
|
8,239
|
|
5,622
|
|
21,843
|
|
1,188
|
|
56,808
|
|
|
Accruals and other financial liabilities
|
18,009
|
|
9,547
|
|
2,798
|
|
749
|
|
717
|
|
1,007
|
|
1,569
|
|
938
|
|
35,334
|
|
|
Subordinated liabilities
|
—
|
|
1,918
|
|
73
|
|
36
|
|
132
|
|
273
|
|
3,595
|
|
13,799
|
|
19,826
|
|
|
Total financial liabilities at
31 Dec 2017
|
1,862,285
|
|
80,278
|
|
36,796
|
|
21,467
|
|
27,080
|
|
22,650
|
|
74,970
|
|
95,213
|
|
2,220,739
|
|
|
Non-financial liabilities
|
—
|
|
—
|
|
—
|
|
—
|
|
—
|
|
—
|
|
—
|
|
103,161
|
|
103,161
|
|
|
Total liabilities at 31 Dec 2017
|
1,862,285
|
|
80,278
|
|
36,796
|
|
21,467
|
|
27,080
|
|
22,650
|
|
74,970
|
|
198,374
|
|
2,323,900
|
|
|
Off-balance sheet commitments given
|
|
|
||||||||||||||||
|
Loan and other credit-related commitments
|
628,070
|
|
38,736
|
|
3,310
|
|
1,777
|
|
4,087
|
|
3,436
|
|
3,824
|
|
2,349
|
|
685,589
|
|
|
– personal
|
187,545
|
|
2,001
|
|
340
|
|
343
|
|
1,583
|
|
1,033
|
|
952
|
|
513
|
|
194,310
|
|
|
– corporate and commercial
|
388,778
|
|
32,011
|
|
2,782
|
|
1,322
|
|
2,309
|
|
2,403
|
|
2,804
|
|
1,716
|
|
434,125
|
|
|
– financial
|
51,747
|
|
4,724
|
|
188
|
|
112
|
|
195
|
|
—
|
|
68
|
|
120
|
|
57,154
|
|
|
272
|
HSBC Holdings plc
|
|
Maturity analysis of assets, liabilities and off-balance sheet commitments (continued)
|
||||||||||||||||||
|
Due not
more than
1 month
|
|
Due over
1 month
but not
more than
3 months
|
|
Due over
3 months
but not
more than
6 months
|
|
Due over
6 months
but not
more than
9 months
|
|
Due over
9 months
but not
more than
1 year
|
|
Due over
1 year
but not
more than
2 years
|
|
Due over
2 years
but not
more than
5 years
|
|
Due over
5 years
|
|
Total
|
|
|
|
$m
|
|
$m
|
|
$m
|
|
$m
|
|
$m
|
|
$m
|
|
$m
|
|
$m
|
|
$m
|
|
|
|
Financial assets
|
||||||||||||||||||
|
Cash and balances at central banks
|
128,009
|
|
—
|
|
—
|
|
—
|
|
—
|
|
—
|
|
—
|
|
—
|
|
128,009
|
|
|
Items in the course of collection from other banks
|
5,003
|
|
—
|
|
—
|
|
—
|
|
—
|
|
—
|
|
—
|
|
—
|
|
5,003
|
|
|
Hong Kong Government certificates of indebtedness
|
31,228
|
|
—
|
|
—
|
|
—
|
|
—
|
|
—
|
|
—
|
|
—
|
|
31,228
|
|
|
Trading assets
|
232,550
|
|
758
|
|
230
|
|
415
|
|
1,172
|
|
—
|
|
—
|
|
—
|
|
235,125
|
|
|
Financial assets designated at fair value
|
176
|
|
182
|
|
75
|
|
178
|
|
363
|
|
749
|
|
2,486
|
|
20,547
|
|
24,756
|
|
|
Derivatives
|
287,749
|
|
149
|
|
207
|
|
96
|
|
110
|
|
704
|
|
1,056
|
|
801
|
|
290,872
|
|
|
Loans and advances to banks
|
59,636
|
|
13,404
|
|
4,494
|
|
2,375
|
|
1,765
|
|
2,879
|
|
2,298
|
|
1,275
|
|
88,126
|
|
|
Loans and advances to customers
|
167,531
|
|
61,693
|
|
47,664
|
|
30,115
|
|
30,362
|
|
85,144
|
|
192,787
|
|
246,208
|
|
861,504
|
|
|
– personal
|
39,295
|
|
7,812
|
|
6,723
|
|
5,928
|
|
6,799
|
|
22,664
|
|
53,620
|
|
194,985
|
|
337,826
|
|
|
– corporate and commercial
|
108,906
|
|
48,333
|
|
35,180
|
|
21,317
|
|
19,573
|
|
54,739
|
|
126,890
|
|
45,271
|
|
460,209
|
|
|
– financial
|
19,330
|
|
5,548
|
|
5,761
|
|
2,870
|
|
3,990
|
|
7,741
|
|
12,277
|
|
5,952
|
|
63,469
|
|
|
Reverse repurchase agreements
– non-trading
|
115,942
|
|
25,525
|
|
10,378
|
|
5,220
|
|
2,350
|
|
479
|
|
1,080
|
|
—
|
|
160,974
|
|
|
Financial investments
|
36,932
|
|
59,826
|
|
30,403
|
|
16,800
|
|
19,564
|
|
50,255
|
|
104,933
|
|
118,084
|
|
436,797
|
|
|
Accrued income and other financial assets
|
16,885
|
|
8,050
|
|
1,737
|
|
407
|
|
462
|
|
421
|
|
1,033
|
|
1,907
|
|
30,902
|
|
|
Financial assets at 31 Dec 2016
|
1,081,641
|
|
169,587
|
|
95,188
|
|
55,606
|
|
56,148
|
|
140,631
|
|
305,673
|
|
388,822
|
|
2,293,296
|
|
|
Non-financial assets
|
—
|
|
—
|
|
—
|
|
—
|
|
—
|
|
—
|
|
—
|
|
81,690
|
|
81,690
|
|
|
Total assets at 31 Dec 2016
|
1,081,641
|
|
169,587
|
|
95,188
|
|
55,606
|
|
56,148
|
|
140,631
|
|
305,673
|
|
470,512
|
|
2,374,986
|
|
|
Off-balance sheet commitments received
|
||||||||||||||||||
|
Loan and other credit-related commitments
|
2,813
|
|
—
|
|
2,050
|
|
—
|
|
—
|
|
110
|
|
—
|
|
—
|
|
4,973
|
|
|
Financial liabilities
|
||||||||||||||||||
|
Hong Kong currency notes in circulation
|
31,228
|
|
—
|
|
—
|
|
—
|
|
—
|
|
—
|
|
—
|
|
—
|
|
31,228
|
|
|
Deposits by banks
|
46,306
|
|
4,075
|
|
2,085
|
|
665
|
|
489
|
|
422
|
|
4,842
|
|
1,055
|
|
59,939
|
|
|
Customer accounts
1
|
1,180,641
|
|
45,245
|
|
19,187
|
|
10,277
|
|
8,325
|
|
4,709
|
|
3,500
|
|
502
|
|
1,272,386
|
|
|
– personal
|
590,654
|
|
22,222
|
|
12,024
|
|
5,823
|
|
4,786
|
|
3,484
|
|
2,483
|
|
121
|
|
641,597
|
|
|
– corporate and commercial
|
436,666
|
|
17,460
|
|
6,178
|
|
3,951
|
|
3,082
|
|
1,200
|
|
967
|
|
360
|
|
469,864
|
|
|
– financial
|
153,321
|
|
5,563
|
|
985
|
|
503
|
|
457
|
|
25
|
|
50
|
|
21
|
|
160,925
|
|
|
Repurchase agreements – non-trading
|
82,330
|
|
2,707
|
|
2,871
|
|
50
|
|
—
|
|
—
|
|
1,000
|
|
—
|
|
88,958
|
|
|
Items in the course of transmission to other banks
|
5,977
|
|
—
|
|
—
|
|
—
|
|
—
|
|
—
|
|
—
|
|
—
|
|
5,977
|
|
|
Trading liabilities
|
121,707
|
|
2,053
|
|
1,423
|
|
1,845
|
|
3,013
|
|
6,219
|
|
9,010
|
|
8,421
|
|
153,691
|
|
|
Financial liabilities designated at
fair value
|
1,659
|
|
958
|
|
1,396
|
|
3
|
|
1,701
|
|
5,046
|
|
17,989
|
|
58,080
|
|
86,832
|
|
|
– debt securities in issue: covered bonds
|
1,587
|
|
—
|
|
303
|
|
—
|
|
—
|
|
207
|
|
1,348
|
|
2,558
|
|
6,003
|
|
|
– debt securities in issue: unsecured
|
25
|
|
15
|
|
1,091
|
|
3
|
|
1,700
|
|
4,839
|
|
14,056
|
|
29,380
|
|
51,109
|
|
|
– subordinated liabilities and preferred securities
|
—
|
|
—
|
|
—
|
|
—
|
|
—
|
|
—
|
|
2,578
|
|
21,005
|
|
23,583
|
|
|
– other
|
47
|
|
943
|
|
2
|
|
—
|
|
1
|
|
—
|
|
7
|
|
5,137
|
|
6,137
|
|
|
Derivatives
|
274,965
|
|
39
|
|
39
|
|
112
|
|
273
|
|
506
|
|
1,471
|
|
2,414
|
|
279,819
|
|
|
Debt securities in issue
|
4,708
|
|
8,598
|
|
8,280
|
|
5,996
|
|
4,610
|
|
10,953
|
|
19,432
|
|
3,338
|
|
65,915
|
|
|
– covered bonds
|
—
|
|
—
|
|
1
|
|
71
|
|
1
|
|
3
|
|
24
|
|
26
|
|
126
|
|
|
– otherwise secured
|
3,207
|
|
823
|
|
893
|
|
114
|
|
329
|
|
1,882
|
|
2,680
|
|
1,181
|
|
11,109
|
|
|
– unsecured
|
1,501
|
|
7,775
|
|
7,386
|
|
5,811
|
|
4,280
|
|
9,068
|
|
16,728
|
|
2,131
|
|
54,680
|
|
|
Accruals and other financial liabilities
|
19,052
|
|
8,172
|
|
2,392
|
|
833
|
|
519
|
|
885
|
|
1,299
|
|
568
|
|
33,720
|
|
|
Subordinated liabilities
|
12
|
|
—
|
|
143
|
|
61
|
|
497
|
|
1,788
|
|
5,056
|
|
13,427
|
|
20,984
|
|
|
Total financial liabilities at 31 Dec 2016
|
1,768,585
|
|
71,847
|
|
37,816
|
|
19,842
|
|
19,427
|
|
30,528
|
|
63,599
|
|
87,805
|
|
2,099,449
|
|
|
Non-financial liabilities
|
—
|
|
—
|
|
—
|
|
—
|
|
—
|
|
—
|
|
—
|
|
92,959
|
|
92,959
|
|
|
Total liabilities at 31 Dec 2016
|
1,768,585
|
|
71,847
|
|
37,816
|
|
19,842
|
|
19,427
|
|
30,528
|
|
63,599
|
|
180,764
|
|
2,192,408
|
|
|
Off-balance sheet commitments given
|
||||||||||||||||||
|
Loan and other credit-related commitments
|
609,923
|
|
29,752
|
|
3,010
|
|
1,897
|
|
3,253
|
|
2,514
|
|
4,280
|
|
1,214
|
|
655,843
|
|
|
– personal
|
177,462
|
|
1,835
|
|
89
|
|
262
|
|
1,896
|
|
1,114
|
|
747
|
|
405
|
|
183,810
|
|
|
– corporate and commercial
|
366,573
|
|
26,650
|
|
2,839
|
|
1,350
|
|
904
|
|
996
|
|
3,410
|
|
754
|
|
403,476
|
|
|
– financial
|
65,888
|
|
1,267
|
|
82
|
|
285
|
|
453
|
|
404
|
|
123
|
|
55
|
|
68,557
|
|
|
1
|
‘Customer accounts’ includes $
386,417m
(2016:
$343,782m
) insured by guarantee schemes.
|
|
HSBC Holdings plc
|
273
|
Notes on the Financial Statements
HSBC Holdings
|
Maturity analysis of assets, liabilities and off-balance sheet commitments
|
||||||||||||||||||
|
Due not
more than
1 month
|
|
Due over
1 month
but not
more than
3 months
|
|
Due over
3 months
but not
more than
6 months
|
|
Due over
6 months
but not
more than
9 months
|
|
Due over
9 months
but not
more than
1 year
|
|
Due over
1 year
but not
more than
2 years
|
|
Due over
2 years
but not
more than
5 years
|
|
Due over
5 years
|
|
Total
|
|
|
|
$m
|
|
$m
|
|
$m
|
|
$m
|
|
$m
|
|
$m
|
|
$m
|
|
$m
|
|
$m
|
|
|
|
Financial assets
|
||||||||||||||||||
|
Cash at bank and in hand:
|
||||||||||||||||||
|
– balances with HSBC undertakings
|
1,985
|
|
—
|
|
—
|
|
—
|
|
—
|
|
—
|
|
—
|
|
—
|
|
1,985
|
|
|
Derivatives
|
1,952
|
|
—
|
|
—
|
|
—
|
|
—
|
|
80
|
|
—
|
|
356
|
|
2,388
|
|
|
Loans and advances to HSBC undertakings
|
4,861
|
|
13,039
|
|
3,145
|
|
5
|
|
2
|
|
1,134
|
|
29,560
|
|
24,881
|
|
76,627
|
|
|
Loans and advances to HSBC undertakings designated at fair value
|
|
|
—
|
|
—
|
|
—
|
|
—
|
|
—
|
|
2,411
|
|
9,533
|
|
11,944
|
|
|
Financial investments in HSBC undertakings
|
17
|
|
3
|
|
—
|
|
—
|
|
—
|
|
—
|
|
1,798
|
|
2,446
|
|
4,264
|
|
|
Accrued income and other financial assets
|
—
|
|
4
|
|
—
|
|
—
|
|
—
|
|
—
|
|
—
|
|
123
|
|
127
|
|
|
Total financial assets at
31 Dec 2017
|
8,815
|
|
13,046
|
|
3,145
|
|
5
|
|
2
|
|
1,214
|
|
33,769
|
|
37,339
|
|
97,335
|
|
|
Non-financial assets
|
—
|
|
—
|
|
—
|
|
—
|
|
—
|
|
—
|
|
—
|
|
94,399
|
|
94,399
|
|
|
Total assets at 31 Dec 2017
|
8,815
|
|
13,046
|
|
3,145
|
|
5
|
|
2
|
|
1,214
|
|
33,769
|
|
131,738
|
|
191,734
|
|
|
Financial liabilities
|
|
|
|
|
|
|
|
|
|
|
|
|
|
|
|
|
|
|
|
Amounts owed to HSBC undertakings
|
120
|
|
2,405
|
|
46
|
|
—
|
|
—
|
|
—
|
|
—
|
|
—
|
|
2,571
|
|
|
Financial liabilities designated at fair value
|
—
|
|
—
|
|
—
|
|
—
|
|
—
|
|
2,349
|
|
11,491
|
|
17,050
|
|
30,890
|
|
|
– debt securities in issue
|
—
|
|
—
|
|
—
|
|
—
|
|
—
|
|
—
|
|
11,491
|
|
6,005
|
|
17,496
|
|
|
– subordinated liabilities and preferred securities
|
—
|
|
—
|
|
—
|
|
—
|
|
—
|
|
2,349
|
|
—
|
|
11,045
|
|
13,394
|
|
|
Derivatives
|
2,008
|
|
—
|
|
—
|
|
—
|
|
—
|
|
110
|
|
183
|
|
781
|
|
3,082
|
|
|
Debt securities in issue
|
—
|
|
—
|
|
—
|
|
—
|
|
1,081
|
|
—
|
|
10,354
|
|
22,823
|
|
34,258
|
|
|
Accruals and other financial liabilities
|
439
|
|
395
|
|
157
|
|
39
|
|
7
|
|
3
|
|
1
|
|
11
|
|
1,052
|
|
|
Subordinated liabilities
|
—
|
|
1,918
|
|
—
|
|
—
|
|
—
|
|
—
|
|
—
|
|
13,959
|
|
15,877
|
|
|
Total financial liabilities at
31 Dec 2017
|
2,567
|
|
4,718
|
|
203
|
|
39
|
|
1,088
|
|
2,462
|
|
22,029
|
|
54,624
|
|
87,730
|
|
|
Non-financial liabilities
|
—
|
|
—
|
|
—
|
|
—
|
|
—
|
|
—
|
|
—
|
|
217
|
|
217
|
|
|
Total liabilities at 31 Dec 2017
|
2,567
|
|
4,718
|
|
203
|
|
39
|
|
1,088
|
|
2,462
|
|
22,029
|
|
54,841
|
|
87,947
|
|
|
Off-balance sheet commitments given
|
|
|
|
|
|
|
|
|
|
|
|
|
|
|
|
|
|
|
|
Undrawn formal standby facilities, credit lines and other commitments to lend
|
—
|
|
—
|
|
—
|
|
—
|
|
—
|
|
—
|
|
—
|
|
—
|
|
—
|
|
|
274
|
HSBC Holdings plc
|
|
Maturity analysis of assets, liabilities and off-balance sheet commitments (continued)
|
||||||||||||||||||
|
Due not
more than
1 month
|
|
Due over
1 month
but not
more than
3 months
|
|
Due over
3 months
but not
more than
6 months
|
|
Due over
6 months
but not
more than
9 months
|
|
Due over
9 months
but not
more than
1 year
|
|
Due over
1 year
but not
more than
2 years
|
|
Due over
2 years
but not
more than
5 years
|
|
Due over
5 years
|
|
Total
|
|
|
|
$m
|
|
$m
|
|
$m
|
|
$m
|
|
$m
|
|
$m
|
|
$m
|
|
$m
|
|
$m
|
|
|
|
Financial assets
|
||||||||||||||||||
|
Cash at bank and in hand:
|
||||||||||||||||||
|
– balances with HSBC undertakings
|
247
|
|
—
|
|
—
|
|
—
|
|
—
|
|
—
|
|
—
|
|
—
|
|
247
|
|
|
Derivatives
|
1,702
|
|
—
|
|
—
|
|
—
|
|
—
|
|
—
|
|
93
|
|
353
|
|
2,148
|
|
|
Loans and advances to HSBC undertakings
|
16,372
|
|
—
|
|
—
|
|
—
|
|
—
|
|
167
|
|
14,204
|
|
46,678
|
|
77,421
|
|
|
Financial investments in HSBC undertakings
|
40
|
|
2
|
|
—
|
|
—
|
|
—
|
|
—
|
|
838
|
|
2,710
|
|
3,590
|
|
|
Accrued income and other financial assets
|
12
|
|
—
|
|
—
|
|
—
|
|
—
|
|
—
|
|
—
|
|
107
|
|
119
|
|
|
Total financial assets at 31 Dec 2016
|
18,373
|
|
2
|
|
—
|
|
—
|
|
—
|
|
167
|
|
15,135
|
|
49,848
|
|
83,525
|
|
|
Non-financial assets
|
—
|
|
—
|
|
—
|
|
—
|
|
—
|
|
—
|
|
—
|
|
97,273
|
|
97,273
|
|
|
Total assets at 31 Dec 2016
|
18,373
|
|
2
|
|
—
|
|
—
|
|
—
|
|
167
|
|
15,135
|
|
147,121
|
|
180,798
|
|
|
Financial liabilities
|
|
|
|
|
|
|
|
|
|
|||||||||
|
Amounts owed to HSBC undertakings
|
2,052
|
|
—
|
|
—
|
|
—
|
|
—
|
|
—
|
|
105
|
|
—
|
|
2,157
|
|
|
Financial liabilities designated at fair value
|
—
|
|
—
|
|
—
|
|
—
|
|
—
|
|
2,167
|
|
5,845
|
|
22,101
|
|
30,113
|
|
|
– debt securities in issue
|
—
|
|
—
|
|
—
|
|
—
|
|
—
|
|
—
|
|
5,845
|
|
10,921
|
|
16,766
|
|
|
– subordinated liabilities and preferred securities
|
—
|
|
—
|
|
—
|
|
—
|
|
—
|
|
2,167
|
|
—
|
|
11,180
|
|
13,347
|
|
|
Derivatives
|
3,841
|
|
—
|
|
—
|
|
—
|
|
—
|
|
—
|
|
592
|
|
592
|
|
5,025
|
|
|
Debt securities in issue
|
—
|
|
—
|
|
—
|
|
—
|
|
—
|
|
953
|
|
4,822
|
|
16,030
|
|
21,805
|
|
|
Accruals and other financial liabilities
|
75
|
|
1,268
|
|
142
|
|
22
|
|
—
|
|
—
|
|
—
|
|
—
|
|
1,507
|
|
|
Subordinated liabilities
|
—
|
|
—
|
|
—
|
|
—
|
|
—
|
|
1,693
|
|
—
|
|
13,496
|
|
15,189
|
|
|
Total financial liabilities at 31 Dec 2016
|
5,968
|
|
1,268
|
|
142
|
|
22
|
|
—
|
|
4,813
|
|
11,364
|
|
52,219
|
|
75,796
|
|
|
Non-financial liabilities
|
—
|
|
—
|
|
—
|
|
—
|
|
—
|
|
—
|
|
—
|
|
144
|
|
144
|
|
|
Total liabilities at 31 Dec 2016
|
5,968
|
|
1,268
|
|
142
|
|
22
|
|
—
|
|
4,813
|
|
11,364
|
|
52,363
|
|
75,940
|
|
|
Off-balance sheet commitments given
|
|
|
|
|
|
|
|
|
|
|||||||||
|
Undrawn formal standby facilities, credit lines and other commitments
to lend
|
—
|
|
—
|
|
—
|
|
—
|
|
—
|
|
—
|
|
—
|
|
—
|
|
—
|
|
|
29
|
Offsetting of financial assets and financial liabilities
|
The ‘Amounts not set off in the balance sheet’ include transactions where:
|
•
|
the counterparty has an offsetting exposure with HSBC and a master netting or similar arrangement is in place with a right to set off only in the event of default, insolvency or bankruptcy, or the offset criteria are otherwise not satisfied; and
|
|
•
|
in the case of derivatives and reverse repurchase/repurchase, stock borrowing/lending and similar agreements, cash and non-cash collateral has been received/pledged.
|
For risk management purposes, the net amounts of loans and advances to customers are subject to limits, which are monitored and the relevant customer agreements are subject to review and updated, as necessary, to ensure that the legal right to set off remains appropriate.
|
HSBC Holdings plc
|
275
|
Notes on the Financial Statements
|
Offsetting of financial assets and financial liabilities
|
|||||||||||||||||||
|
|
|
Amounts subject to enforceable netting arrangements
|
Amounts not
subject to
enforceable
netting
arrangements
5
|
|
Total
|
|
|||||||||||||
|
|
|
|
|
|
|
|
|
Amounts not set off in the
balance sheet
|
|
|
|||||||||
|
|
|
Gross
amounts
|
|
Amounts
offset
|
|
Net amounts
in the balance sheet
|
|
Financial
instruments
|
|
Non-cash
collateral
|
|
Cash
collateral
|
|
Net
amount
|
|
||||
|
|
Footnotes
|
$m
|
|
$m
|
|
$m
|
|
$m
|
|
$m
|
|
$m
|
|
$m
|
|
$m
|
|
$m
|
|
|
Financial assets
|
|
|
|
|
|
|
|
|
|
|
|
|
|
|
|
|
|
|
|
|
Derivatives (Note 14)
|
1
|
322,422
|
|
(110,425
|
)
|
211,997
|
|
(156,088
|
)
|
(11,092
|
)
|
(37,302
|
)
|
7,515
|
|
7,821
|
|
219,818
|
|
|
Reverse repos, stock borrowing and similar agreements classified as:
|
2
|
|
|
|
|
|
|
|
|
|
|
|
|
|
|
|
|
|
|
|
– trading assets
|
|
15,893
|
|
—
|
|
15,893
|
|
(430
|
)
|
(15,462
|
)
|
—
|
|
1
|
|
1,227
|
|
17,120
|
|
|
– non-trading assets
|
|
265,666
|
|
(105,776
|
)
|
159,890
|
|
(3,714
|
)
|
(155,973
|
)
|
(49
|
)
|
154
|
|
41,663
|
|
201,553
|
|
|
Loans and advances to customers
|
3
|
42,091
|
|
(10,424
|
)
|
31,667
|
|
(26,390
|
)
|
—
|
|
(181
|
)
|
5,096
|
|
619
|
|
32,286
|
|
|
At 31 Dec 2017
|
|
646,072
|
|
(226,625
|
)
|
419,447
|
|
(186,622
|
)
|
(182,527
|
)
|
(37,532
|
)
|
12,766
|
|
51,330
|
|
470,777
|
|
|
|
|
|
|
|
|
|
|
|
|
|
|
|
|
|
|
|
|
|
|
|
Derivatives (Note 14)
|
1
|
387,999
|
|
(106,555
|
)
|
281,444
|
|
(210,067
|
)
|
(11,647
|
)
|
(40,188
|
)
|
19,542
|
|
9,428
|
|
290,872
|
|
|
Reverse repos, stock borrowing and similar agreements classified as:
|
2
|
|
|
|
|
|
|
|
|
|
|
|
|
|
|
|
|
|
|
|
– trading assets
|
|
9,859
|
|
—
|
|
9,859
|
|
(475
|
)
|
(9,383
|
)
|
—
|
|
1
|
|
348
|
|
10,207
|
|
|
– non-trading assets
|
|
222,485
|
|
(87,929
|
)
|
134,556
|
|
(4,779
|
)
|
(129,373
|
)
|
(215
|
)
|
189
|
|
26,418
|
|
160,974
|
|
|
Loans and advances to customers
|
3
|
46,296
|
|
(14,602
|
)
|
31,694
|
|
(24,459
|
)
|
—
|
|
(248
|
)
|
6,987
|
|
743
|
|
32,437
|
|
|
At 31 Dec 2016
|
|
666,639
|
|
(209,086
|
)
|
457,553
|
|
(239,780
|
)
|
(150,403
|
)
|
(40,651
|
)
|
26,719
|
|
36,937
|
|
494,490
|
|
|
|
|
|
|
|
|
|
|
|
|
|
|
|
|
|
|
|
|
|
|
|
Financial liabilities
|
|
|
|
|
|
|
|
|
|
|
|
|
|
|
|
|
|
|
|
|
Derivatives (Note 14)
|
1
|
321,932
|
|
(110,425
|
)
|
211,507
|
|
(156,072
|
)
|
(14,342
|
)
|
(28,666
|
)
|
12,427
|
|
5,314
|
|
216,821
|
|
|
Repos, stock lending and similar agreements
classified as:
|
2
|
|
|
|
|
|
|
|
|
|
|
|
|
|
|
|
|
|
|
|
– trading liabilities
|
|
10,555
|
|
—
|
|
10,555
|
|
(430
|
)
|
(9,615
|
)
|
—
|
|
510
|
|
63
|
|
10,618
|
|
|
– non-trading liabilities
|
|
187,268
|
|
(105,776
|
)
|
81,492
|
|
(7,165
|
)
|
(74,048
|
)
|
(240
|
)
|
39
|
|
48,510
|
|
130,002
|
|
|
Customer accounts
|
4
|
42,533
|
|
(10,424
|
)
|
32,109
|
|
(26,390
|
)
|
—
|
|
(188
|
)
|
5,531
|
|
158
|
|
32,267
|
|
|
At 31 Dec 2017
|
|
562,288
|
|
(226,625
|
)
|
335,663
|
|
(190,057
|
)
|
(98,005
|
)
|
(29,094
|
)
|
18,507
|
|
54,045
|
|
389,708
|
|
|
|
|
|
|
|
|
|
|
|
|
|
|||||||||
|
Derivatives (Note 14)
|
1
|
378,571
|
|
(106,555
|
)
|
272,016
|
|
(210,035
|
)
|
(15,512
|
)
|
(33,754
|
)
|
12,715
|
|
7,803
|
|
279,819
|
|
|
Repos, stock lending and similar agreements
classified as:
|
2
|
|
|
|
|
|
|
|
|
|
|||||||||
|
– trading liabilities
|
|
5,034
|
|
—
|
|
5,034
|
|
(475
|
)
|
(4,515
|
)
|
—
|
|
44
|
|
37
|
|
5,071
|
|
|
– non-trading liabilities
|
|
148,443
|
|
(87,929
|
)
|
60,514
|
|
(6,202
|
)
|
(54,126
|
)
|
(146
|
)
|
40
|
|
28,444
|
|
88,958
|
|
|
Customer accounts
|
4
|
45,422
|
|
(14,602
|
)
|
30,820
|
|
(24,459
|
)
|
—
|
|
(248
|
)
|
6,113
|
|
228
|
|
31,048
|
|
|
At 31 Dec 2016
|
|
577,470
|
|
(209,086
|
)
|
368,384
|
|
(241,171
|
)
|
(74,153
|
)
|
(34,148
|
)
|
18,912
|
|
36,512
|
|
404,896
|
|
|
1
|
At 31 December 2017, the amount of cash margin received that had been offset against the gross derivatives assets was
$6,324m
(2016:
$3,720m
). The amount of cash margin paid that had been offset against the gross derivatives liabilities was
$5,196m
(2016:
$5,862m
).
|
|
2
|
For the amount of repos, reverse repos, stock lending, stock borrowing and similar agreements recognised on the balance sheet within ‘Trading assets’ $
17,120m
(2016: $
10,207m
) and ‘Trading liabilities’ $
10,618m
(2016: $
5,071m
), see the ‘Funding sources and uses’ table on page
147
.
|
|
3
|
At 31 December 2017, the total amount of ‘Loans and advances to customers’ was $
962,964m
(2016: $
861,504m
) of which $
31,667m
(2016: $
31,694m
) was subject to offsetting.
|
|
4
|
At 31 December 2017, the total amount of ‘Customer accounts’ was $
1,364,462m
(2016: $
1,272,386m
) of which $
32,109m
(2016: $
30,820m
) was subject to offsetting.
|
|
5
|
These exposures continue to be secured by financial collateral, but we may not have sought or been able to obtain a legal opinion evidencing enforceability of the right of offset.
|
|
30
|
Non-controlling interests
|
|
2017
|
|
2016
|
|
|
|
$m
|
|
$m
|
|
|
|
Non-controlling interests attributable to holders of ordinary shares in subsidiaries
|
7,621
|
|
6,932
|
|
|
Preferred securities issued by subsidiaries
|
—
|
|
260
|
|
|
At 31 Dec
|
7,621
|
|
7,192
|
|
Hang Seng Bank Limited is the only subsidiary in the Group that gives rise to significant non-controlling interest. For summarised financial information of Hang Seng Bank Limited see Note
18
.
Preferred securities issued by subsidiaries
Preferred securities are securities for which there is no obligation to pay a dividend and, if the dividend is not paid, it may not be cumulative. Such securities do not generally carry voting rights but rank higher than ordinary shares for dividend payments and in the event of a winding-up. These securities have no stated maturity date but may be called and redeemed by the issuer, subject to prior notification to the PRA and, where relevant, the consent of the local banking regulator.
|
276
|
HSBC Holdings plc
|
All non-cumulative preferred securities are classified as additional tier 1 capital.
|
Preferred securities issued by HSBC’s subsidiaries
|
|||||||
|
Footnote
|
First call
date
|
2017
|
|
2016
|
|
||
|
$m
|
|
$m
|
|
||||
|
HSBC Bank Canada
|
|||||||
|
CA$175m
|
Non-cumulative redeemable class 1 preferred shares, series C
|
1
|
Jun 2010
|
—
|
|
130
|
|
|
CA$175m
|
Non-cumulative redeemable class 1 preferred shares, series D
|
1
|
Dec 2010
|
—
|
|
130
|
|
|
At 31 Dec
|
|
—
|
|
260
|
|
||
|
1
|
In 2017 HSBC redeemed these securities.
|
|
31
|
Called up share capital and other equity instruments
|
Called up share capital and share premium
|
HSBC Holdings ordinary shares of $0.50 each, issued and fully paid
|
|||||||||
|
2017
|
2016
|
||||||||
|
Footnote
|
Number
|
|
$m
|
|
Number
|
|
$m
|
|
|
|
At 1 Jan
|
20,191,586,214
|
|
10,096
|
|
19,685,096,934
|
|
9,842
|
|
|
|
Shares issued under HSBC employee share plans
|
76,701,249
|
|
38
|
|
69,187,052
|
|
35
|
|
|
|
Shares issued in lieu of dividends
|
380,652,196
|
|
190
|
|
437,302,228
|
|
219
|
|
|
|
Less: Shares repurchased and cancelled
|
(328,223,401
|
)
|
(164
|
)
|
—
|
|
—
|
|
|
|
At 31 Dec
|
1
|
20,320,716,258
|
|
10,160
|
|
20,191,586,214
|
|
10,096
|
|
|
HSBC Holdings non-cumulative preference shares of $0.01 each
|
|||||||||
|
2017
|
2016
|
||||||||
|
Footnote
|
Number
|
|
$m
|
|
Number
|
|
$m
|
|
|
|
At 1 Jan and 31 Dec
|
2
|
1,450,000
|
|
—
|
|
1,450,000
|
|
—
|
|
|
HSBC Holdings share premium
|
||||
|
2017
|
|
2016
|
|
|
|
$m
|
|
$m
|
|
|
|
At 31 Dec
|
10,177
|
|
12,619
|
|
|
Total called up share capital and share premium
|
||||
|
2017
|
|
2016
|
|
|
|
$m
|
|
$m
|
|
|
|
At 31 Dec
|
20,337
|
|
22,715
|
|
|
1
|
All HSBC Holdings ordinary shares in issue, excluding
325,273,407
shares held in treasury, confer identical rights, including in respect of capital, dividends and voting.
|
|
2
|
Included in the capital base of HSBC as additional tier 1 capital in accordance with the CRD IV rules, by virtue of the application of grandfathering provisions.
|
HSBC Holdings non-cumulative preference shares of
$0.01
HSBC Holdings pays dividends on non-cumulative preference shares of
$0.01
each (‘dollar preference shares’) quarterly, at the sole and absolute discretion of the Board. The Board will not declare a dividend on them if this would stop the company from meeting the PRA’s capital adequacy requirements, or if profit available for distribution as dividends is insufficient to also pay dividends on other shares that are equally entitled and scheduled on the same date.
HSBC Holdings may not declare or pay dividends on shares ranking lower in the right to dividends than dollar preference shares, or redeem or purchase any of its other shares ranking equal or lower than dollar preference shares, unless it has fully paid, or set aside an amount to fully pay, the dividends on the dollar preference shares for the then current dividend period.
The dollar preference shares carry no rights to conversion into ordinary shares. Holders of dollar preference shares are only entitled to attend and vote at shareholder meetings if dividends on these shares have not been paid in full on four consecutive dividend payment dates. In such circumstances, holders of these shares are entitled to vote at shareholder meetings until HSBC Holdings has paid a full dividend on them. These securities can be redeemed by HSBC at any time, subject to prior approval by the PRA.
HSBC Holdings non-cumulative preference share of
£0.01
The one non-cumulative sterling preference share of
£0.01
(‘sterling preference share’) has been in issue since 29 December 2010 and is held by a subsidiary of HSBC Holdings. Dividends are paid quarterly at the sole and absolute discretion of the Board. The sterling preference share carries no rights of conversion into ordinary shares of HSBC Holdings and no right to attend or vote at shareholder meetings of HSBC Holdings. These securities can be redeemed by HSBC at any time, subject to prior approval by the PRA.
Other equity instruments
HSBC Holdings includes three types of additional tier 1 capital securities in its tier 1 capital. Two are presented in this Note and are accounted for as equity because HSBC does not have an obligation to transfer cash or a variable number of its own ordinary shares to holders under any circumstances outside its control. See Note
27
for additional tier 1 securities accounted for as liabilities.
|
HSBC Holdings plc
|
277
|
Notes on the Financial Statements
Additional tier 1 capital securities
Additional tier 1 capital securities are perpetual subordinated securities on which coupon payments may be deferred at HSBC Holdings’ discretion. While any coupon payments are unpaid or deferred, HSBC Holdings will not declare or pay dividends or make distributions or similar periodic payments in respect of any securities of lower or equal rank, or repurchase or redeem them. Such securities do not generally carry voting rights but rank higher than ordinary shares for coupon payments, and in the event of a winding-up. They do not meet the identifying criteria in full for recognition as tier 1 capital under CRD IV but are eligible as regulatory capital subject to grandfathering limits and progressive phase-out.
At HSBC Holdings’ discretion, and subject to certain conditions being satisfied, the capital securities may be exchanged on any coupon payment date for non-cumulative preference shares to be issued by HSBC Holdings and ranking pari passu with the dollar and sterling preference shares in issue. The preference shares would be issued at a nominal value of
$0.01
per share and a premium of
$24.99
per share, with both amounts being subscribed and fully paid. These securities can be redeemed by HSBC at any time, subject to prior approval by the PRA.
|
HSBC’s additional tier 1 capital securities in issue which are accounted for in equity
|
||||||
|
First call
date |
2017
|
|
2016
|
|
||
|
$m
|
|
$m
|
|
|||
|
$2,200m
|
8.125% perpetual subordinated capital securities
|
Apr 2013
|
2,133
|
|
2,133
|
|
|
$3,800m
|
8.000% perpetual subordinated capital securities, Series 2
|
Dec 2015
|
3,718
|
|
3,718
|
|
|
At 31 Dec
|
5,851
|
|
5,851
|
|
||
Additional tier 1 capital – contingent convertible securities
During 2017, HSBC continued to issue contingent convertible securities that are included in its capital base as fully CRD IV compliant additional tier 1 capital securities on an end point basis. The net proceeds of the issuances are used for general corporate purposes and to further strengthen its capital base to meet requirements under CRD IV. These securities bear a fixed rate of interest until their initial call dates. After the initial call dates, if they are not redeemed, the securities will bear interest at rates fixed periodically in advance for
5
-year periods based on prevailing market rates. Interest on the contingent convertible securities will be due and payable only at the sole discretion of HSBC, and HSBC has sole and absolute discretion at all times to cancel for any reason (in whole or in part) any interest payment that would otherwise be payable on any payment date. Distributions will not be paid if they are prohibited under UK banking regulations or if the company has insufficient reserves or fails to meet the solvency conditions defined in the securities’ terms.
The contingent convertible securities are undated and are repayable, at the option of HSBC, in whole at the initial call date, or on any fifth anniversary after this date. In addition, the securities are repayable at the option of HSBC in whole for certain regulatory or tax reasons. Any repayments require the prior consent of the PRA. These securities rank
pari passu
with HSBC’s dollar and sterling preference shares and are therefore ahead of ordinary shares. The contingent convertible securities will be converted into fully paid ordinary shares of HSBC at a predetermined price, should HSBC’s consolidated end point CET1 ratio fall below
7.0%
. Therefore, in accordance with the terms of the securities, if the end point CET1 ratio breaches the
7.0%
trigger, the securities will convert into ordinary shares at fixed contractual conversion prices in the issuance currencies of the relevant securities, equivalent to
£2.70
at the prevailing rate of exchange on the issuance date, subject to certain anti-dilution adjustments.
|
HSBC’s additional tier 1 capital – contingent convertible securities in issue which are accounted for in equity
|
||||||
|
First call
date |
2017
|
|
2016
|
|
||
|
$m
|
|
$m
|
|
|||
|
$1,500m
|
5.625% perpetual subordinated contingent convertible securities
|
Jan 2020
|
1,494
|
|
1,494
|
|
|
$2,000m
|
6.875% perpetual subordinated contingent convertible securities
|
Jun 2021
|
1,998
|
|
1,998
|
|
|
$2,250m
|
6.375% perpetual subordinated contingent convertible securities
|
Sep 2024
|
2,244
|
|
2,244
|
|
|
$2,450m
|
6.375% perpetual subordinated contingent convertible securities
|
Mar 2025
|
2,460
|
|
2,460
|
|
|
$3,000m
|
6.000% perpetual subordinated contingent convertible securities
|
May 2027
|
2,997
|
|
—
|
|
|
€1,500m
|
5.250% perpetual subordinated contingent convertible securities
|
Sep 2022
|
1,943
|
|
1,943
|
|
|
€1,000m
|
6.000% perpetual subordinated contingent convertible securities
|
Sep 2023
|
1,120
|
|
1,120
|
|
|
€1,250m
|
4.750% perpetual subordinated contingent convertible securities
|
Jul 2029
|
1,420
|
|
—
|
|
|
SGD1,000m
|
4.700% perpetual subordinated contingent convertible securities
|
Jun 2022
|
723
|
|
—
|
|
|
At 31 Dec
|
16,399
|
|
11,259
|
|
||
Shares under option
For details of the options outstanding to subscribe for HSBC Holdings ordinary shares under the HSBC Holdings savings-related share option plans, see Note
5
.
|
Aggregate options outstanding under these plans
|
|||||||
|
31 Dec 2017
|
31 Dec 2016
|
||||||
|
Number of
HSBC Holdings
ordinary shares
|
|
Period of exercise
|
Exercise price
|
Number of
HSBC Holdings
ordinary shares
|
|
Period of exercise
|
Exercise price
|
|
64,604,932
|
|
2017 to 2023
|
£4.0472-5.9640
|
69,217,725
|
|
2016 to 2022
|
£4.0472–5.4738
|
|
36,309
|
|
2017 to 2018
|
HK$55.4701
|
504,467
|
|
2016 to 2018
|
HK$55.4701–63.9864
|
|
10,539
|
|
2017 to 2018
|
€5.3532
|
86,916
|
|
2016 to 2018
|
€5.3532–6.0657
|
|
17,873
|
|
2017 to 2018
|
$7.1456
|
217,738
|
|
2016 to 2018
|
$7.1456–8.2094
|
|
278
|
HSBC Holdings plc
|
Maximum obligation to deliver HSBC Holdings ordinary shares
At 31 December 2017, the maximum obligation to deliver HSBC Holdings ordinary shares under all of the above option arrangements and the HSBC International Employee Share Purchase Plan, together with GPSP awards, long-term incentive awards and deferred share awards granted under the HSBC Share Plan and/or the HSBC Share Plan 2011, was
169,615,437
(2016:
198,483,750
). The total number of shares at 31 December 2017 held by employee benefit trusts that may be used to satisfy such obligations to deliver HSBC Holdings ordinary shares was
5,883,444
(2016:
3,997,619
).
|
32
|
Contingent liabilities, contractual commitments and guarantees
|
|
HSBC
|
HSBC Holdings
1
|
|||||||
|
|
2017
|
|
2016
|
|
2017
|
|
2016
|
|
|
|
$m
|
|
$m
|
|
$m
|
|
$m
|
|
|
Guarantees and other contingent liabilities:
|
|
|
||||||
|
– financial guarantees and similar contracts
|
38,328
|
|
37,072
|
|
7,778
|
|
7,619
|
|
|
– other guarantees
|
51,434
|
|
44,394
|
|
—
|
|
—
|
|
|
– other contingent liabilities
|
616
|
|
553
|
|
—
|
|
—
|
|
|
At 31 Dec
|
90,378
|
|
82,019
|
|
7,778
|
|
7,619
|
|
|
Commitments:
|
|
|
|
|
|
|
||
|
– documentary credits and short-term trade-related transactions
|
8,776
|
|
9,190
|
|
—
|
|
—
|
|
|
– forward asset purchases and forward deposits placed
|
4,295
|
|
5,386
|
|
—
|
|
—
|
|
|
– standby facilities, credit lines and other commitments to lend
|
672,518
|
|
641,267
|
|
—
|
|
—
|
|
|
At 31 Dec
|
685,589
|
|
655,843
|
|
—
|
|
—
|
|
|
1
|
Guarantees by HSBC Holdings are all in favour of other Group entities.
|
The above table discloses the nominal principal amounts, which represents the maximum amounts at risk should the contracts be fully drawn upon and clients default. As a significant portion of guarantees and commitments is expected to expire without being drawn upon, the total of the nominal principal amounts is not indicative of future liquidity requirements.
Approximately half the guarantees have a term of less than one year, while guarantees with terms of more than one year are subject to HSBC’s annual credit review process.
Contingent liabilities arising from legal proceedings, regulatory and other matters against Group companies are disclosed in Notes
26
and 34 .
and 34 .
Financial Services Compensation Scheme
The Financial Services Compensation Scheme (‘FSCS’) has provided compensation to consumers following the collapse of a number of deposit takers. The compensation paid out to consumers is currently funded through loans from HM Treasury, which at 31 December 2017 stood at approximately
$6.3b
n (
£4.7b
n).
The Group could be liable to pay a proportion of the outstanding amount that the FSCS has borrowed from HM Treasury. The ultimate FSCS levy to the industry as a result of the collapses cannot currently be estimated reliably, as it is dependent on various uncertain factors, including the potential recoveries of assets by the FSCS and changes in the level of protected deposits and the population of FSCS members at the time.
Associates
HSBC’s share of associates’ contingent liabilities amounted to
$38.8b
n
at 31 December 2017 (2016:
$
35.3
bn). No matters arose where HSBC was severally liable.
|
33
|
Lease commitments
|
Operating lease commitments
At 31 December 2017, future minimum lease payments under non-cancellable operating leases for land, buildings and equipment were
$3,950 m (2016: $3,893 m).
$3,950 m (2016: $3,893 m).
Finance lease receivables
HSBC leases a variety of assets to third parties under finance leases, including transport assets (such as aircraft), property and general plant and machinery. At the end of lease terms, assets may be sold to third parties or leased for further terms. Rentals are calculated to recover the cost of assets less their residual value, and earn finance income.
|
|
2017
|
2016
|
||||||||||
|
|
Total future
minimum payments |
|
Unearned
finance income |
|
Present
value |
|
Total future
minimum payments |
|
Unearned
finance income |
|
Present
value |
|
|
|
$m
|
|
$m
|
|
$m
|
|
$m
|
|
$m
|
|
$m
|
|
|
Lease receivables:
|
|
|
|
|
|
|
||||||
|
No later than one year
|
3,523
|
|
(326
|
)
|
3,197
|
|
3,248
|
|
(330
|
)
|
2,918
|
|
|
Later than one year and no later than five years
|
7,033
|
|
(696
|
)
|
6,337
|
|
6,563
|
|
(702
|
)
|
5,861
|
|
|
Later than five years
|
4,784
|
|
(669
|
)
|
4,115
|
|
4,548
|
|
(633
|
)
|
3,915
|
|
|
At 31 Dec
|
15,340
|
|
(1,691
|
)
|
13,649
|
|
14,359
|
|
(1,665
|
)
|
12,694
|
|
|
HSBC Holdings plc
|
279
|
Notes on the Financial Statements
|
34
|
Legal proceedings and regulatory matters
|
HSBC is party to legal proceedings and regulatory matters in a number of jurisdictions arising out of its normal business operations. Apart from the matters described below, HSBC considers that none of these matters are material. The recognition of provisions is determined in accordance with the accounting policies set out in Note 1. While the outcome of legal proceedings and regulatory matters is inherently uncertain, management believes that, based on the information available to it, appropriate provisions have been made in respect of these matters at 31 December 2017 (see Note 26). Where an individual provision is material, the fact that a provision has been made is stated and quantified, except to the extent doing so would be seriously prejudicial. Any provision recognised does not constitute an admission of wrongdoing or legal liability. It is not practicable to provide an aggregate estimate of potential liability for our legal proceedings and regulatory matters as a class of contingent liabilities.
Bernard L. Madoff Investment Securities LLC
Bernard L. Madoff (‘Madoff’) was arrested in December 2008 and later pleaded guilty to running a Ponzi scheme. His firm, Bernard L. Madoff Investment Securities LLC (‘Madoff Securities’), is being liquidated in the US by a trustee (the ‘Trustee’).
Various non-US HSBC companies provided custodial, administration and similar services to a number of funds incorporated outside the US whose assets were invested with Madoff Securities. Based on information provided by Madoff Securities, at 30 November 2008, the purported aggregate value of these funds was
$8.4
bn, including fictitious profits reported by Madoff.
Based on information available to HSBC, the funds’ actual transfers to Madoff Securities minus their actual withdrawals from Madoff Securities during the time HSBC serviced the funds are estimated to have totalled approximately
$4
bn. Various HSBC companies have been named as defendants in lawsuits arising out of Madoff Securities’ fraud.
US/UK litigation:
The Trustee has brought lawsuits against various HSBC companies in the US Bankruptcy Court and in the English High Court, seeking recovery of transfers from Madoff Securities to HSBC in an amount not yet pleaded or determined. HSBC and other parties to the action have moved to dismiss the Trustee’s US actions. The US Bankruptcy Court granted HSBC’s motion to dismiss with respect to certain of the Trustee’s claims in November 2016. In September 2017, the US Court of Appeals for the Second Circuit (the ‘Second Circuit Court of Appeals’) agreed to hear the Trustee’s appeal of the US Bankruptcy Court’s decision, where this matter is pending.
The deadline by which the Trustee must serve HSBC with his English action has been extended to September 2018 for UK-based defendants and November 2018 for all other defendants.
Fairfield Sentry Limited, Fairfield Sigma Limited and Fairfield Lambda Limited (together, ‘Fairfield’) (in liquidation since July 2009) have brought lawsuits in the US and the British Virgin Islands (‘BVI’) against fund shareholders, including HSBC companies that acted as nominees for clients, seeking restitution of redemption payments. In October 2016, the liquidators for Fairfield (the ‘Fairfield Liquidators') filed a motion seeking leave to amend their complaints in the US Bankruptcy Court. In January 2017, the defendants moved to dismiss and oppose the Fairfield Liquidators’ motion. These motions are pending.
In December 2014,
three
additional actions were filed in the US. A purported class of direct investors in Madoff Securities asserted common law claims against various HSBC companies in the US District Court for the Southern District of New York (the ‘New York District Court’). In September 2016, the New York District Court granted HSBC’s motion to dismiss this action and the plaintiffs’ failure to appeal renders the court’s ruling final.
Two
investors in Hermes International Fund Limited (‘Hermes’) also asserted common law claims against various HSBC companies in the New York District Court. In March 2017, the court granted HSBC's motion to dismiss, which dismissal was upheld by the Second Circuit Court of Appeals in November 2017. In addition, SPV Optimal SUS Ltd (‘SPV OSUS’), the purported assignee of the Madoff-invested company, Optimal Strategic US Equity Ltd (‘Optimal’), filed a lawsuit in New York state court against various HSBC companies and others, seeking damages on various alleged grounds, including breach of fiduciary duty and breach of trust. This action has been stayed pending the issuance of a potentially dispositive decision in an action initiated by Optimal regarding the validity of the assignment of its claims to SPV OSUS.
Bermuda litigation:
In January 2009, Kingate Global Fund Limited and Kingate Euro Fund Limited (together, ‘Kingate’) brought an action against HSBC Bank Bermuda Limited (‘HBBM’) for recovery of funds held in Kingate’s accounts, fees and dividends. This action is pending, but is not expected to move forward until the resolution of the Trustee’s US actions against Kingate and HBBM.
Thema Fund Limited and Hermes each brought
three
actions in 2009. The first set of actions seeks recovery of funds in frozen accounts held at HSBC Institutional Trust Services (Bermuda) Limited. The second set of actions asserts liability against HSBC Institutional Trust Services (Bermuda) Limited in relation to claims for mistake, recovery of fees and damages for breach of contract. The third set of actions seeks return of fees from HBBM and HSBC Securities Services (Bermuda) Limited. The parties have agreed to a standstill in respect of all
three
sets of actions.
Cayman Islands litigation:
In February 2013, Primeo Fund Limited (‘Primeo’) (in liquidation since April 2009) brought an action against HSBC Securities Services Luxembourg (‘HSSL’) and Bank of Bermuda (Cayman) Limited, alleging breach of contract and breach of fiduciary duty, and claiming damages and equitable compensation. The trial concluded in February 2017, and in August 2017, the court dismissed all claims against the defendants. In September 2017, Primeo appealed to the Court of Appeal of the Cayman Islands, where the matter is pending.
Luxembourg litigation:
In April 2009, Herald Fund SPC (‘Herald’) (in liquidation since July 2013) brought an action against HSSL before the Luxembourg District Court, seeking restitution of cash and securities Herald purportedly lost because of Madoff Securities’ fraud, or money damages. The Luxembourg District Court dismissed Herald’s securities restitution claim, but reserved Herald’s cash restitution claim and its claim for money damages. Herald has appealed this judgment to the Court of Appeal, where this matter is pending.
In March 2010, Herald (Lux) SICAV (‘Herald (Lux)’) (in liquidation since April 2009) brought an action against HSSL before the Luxembourg District Court seeking restitution of securities, or the cash equivalent, or money damages. Herald (Lux) has also requested the restitution of fees paid to HSSL. In 2017, the parties agreed a settlement, which was approved by the Luxembourg court in November 2017. The settlement was concluded in January 2018.
In October 2009, Alpha Prime and, in December 2014, Senator, each brought an action against HSSL before the Luxembourg District Court, seeking the restitution of securities, or the cash equivalent, or money damages. Both actions have been temporarily suspended at the plaintiffs’ request. In April 2015, Senator commenced an action against the Luxembourg branch of HSBC Bank plc asserting identical claims before the Luxembourg District Court. HSSL has also been named as a defendant in various actions by shareholders in Primeo Select Fund, Herald, Herald (Lux), and Hermes. Most of these actions have been dismissed, suspended or postponed.
|
280
|
HSBC Holdings plc
|
Ireland litigation:
In November 2013, Defender Limited brought an action against HSBC Institutional Trust Services (Ireland) Limited (‘HTIE’) and others, alleging breach of contract and claiming damages and indemnification for fund losses. A provisional trial date has been scheduled for October 2018.
SPV OSUS’s action against HTIE and HSBC Securities Services (Ireland) Limited alleging breach of contract and claiming damages and indemnification for fund losses was dismissed by the Irish High Court in October 2015. In March 2017, the Irish Court of Appeal affirmed the dismissal. In April 2017, SPV OSUS filed an application seeking leave to appeal the dismissal to the Irish Supreme Court. The application was heard by the Irish Supreme Court in February 2018 and judgment is pending.
There are many factors that may affect the range of possible outcomes, and the resulting financial impact, of the various Madoff-related proceedings described above, including but not limited to the multiple jurisdictions in which the proceedings have been brought. Based upon the information currently available, management’s estimate of the possible aggregate damages that might arise as a result of all claims in the various Madoff-related proceedings is up to or exceeding $500m, excluding costs and interest. Due to uncertainties and limitations of this estimate, the ultimate damages could differ significantly from this amount.
US mortgage-related investigations
In April 2011, HSBC Bank USA N.A. (‘HSBC Bank USA’) entered into a consent order (the ‘OCC Servicing Consent Order’) with the Office of the Comptroller of the Currency (‘OCC’), and HSBC Finance Corporation (‘HSBC Finance’) and HSBC North America Holdings Inc. (‘HNAH’) entered into a similar consent order (the ’FRB Servicing Consent Order’) with the Federal Reserve Board (‘FRB’) (together with the OCC Servicing Consent Order, the ‘Servicing Consent Orders’). The Servicing Consent Orders required prescribed actions to address certain foreclosure practice deficiencies.
In January 2017, the OCC terminated the OCC Servicing Consent Order after determining that HSBC Bank USA had satisfied the requirements thereunder. In connection with the termination of the OCC Servicing Consent Order, the OCC also assessed a civil money penalty against HSBC Bank USA, finding that HSBC Bank USA failed to correct deficiencies identified under the OCC Servicing Consent Order in a timely fashion. The civil money penalty has been paid. In January 2018, the FRB terminated the FRB Servicing Consent Order after having determined that HNAH and HBIO are in compliance with its terms.
In February 2016, HSBC Bank USA, HSBC Finance, HSBC Mortgage Services Inc. and HNAH entered into an agreement with the US Department of Justice (the ‘DoJ’), the US Department of Housing and Urban Development, the Consumer Financial Protection Bureau, other federal agencies (the ‘Federal Parties’) and the Attorneys General of 49 states and the District of Columbia (the ‘State Parties’) to resolve civil claims related to past residential mortgage loan origination and servicing practices (the ‘National Mortgage Settlement Agreement’ or ‘NMS’). The cash payments required under the NMS were made in 2016. In March 2017, the NMS independent monitor validated that the consumer relief obligations were satisfied; and in June 2017, the NMS independent monitor validated that all remaining obligations under the NMS were satisfied.
The Servicing Consent Orders and the National Mortgage Settlement Agreement do not completely preclude other enforcement actions by regulatory, governmental or law enforcement agencies related to foreclosure and other mortgage servicing practices, including, but not limited to, matters relating to the securitisation of mortgages for investors, which could include the imposition of civil money penalties, criminal fines or other sanctions. In addition, these practices have in the past resulted in private litigation, and may result in further private litigation.
US mortgage securitisation activity and litigation
HSBC Bank USA was a sponsor or seller of loans used to facilitate whole loan securitisations underwritten by HSBC Securities (USA) Inc. (‘HSI’). From 2005 to 2007, HSBC Bank USA purchased and sold approximately
$24
bn of such loans to HSI, which were subsequently securitised and sold by HSI to third parties. The outstanding principal balance was approximately
$4.1b
n at 31 December 2017. HSBC notes that the scale of its mortgage securitisation activities was more limited in relation to a number of other banks in the industry. In addition, HSI served as an underwriter on securitisations issued by HSBC Finance or third parties, and HSBC Bank USA served as trustee on behalf of various mortgage securitisation trusts.
Mortgage foreclosure and trustee matters:
As the industry’s residential mortgage foreclosure issues continue, HSBC Bank USA has taken title to a number of foreclosed homes as trustee on behalf of various mortgage securitisation trusts. As nominal record owner of these properties, HSBC Bank USA has been sued by municipalities and tenants alleging various violations of law, including laws relating to property upkeep and tenants’ rights. While HSBC believes and continues to maintain that these obligations and any related liabilities are those of the servicer of each trust, HSBC continues to receive significant adverse publicity in connection with these and similar matters, including foreclosures that are serviced by others in the name of ‘HSBC, as trustee’.
Beginning in June 2014, a number of lawsuits were filed in state and federal courts in New York and Virginia against HSBC Bank USA as trustee of more than
280
mortgage securitisation trusts. These lawsuits are brought on behalf of the trusts by a putative class of investors including, among others, BlackRock and PIMCO funds. The complaints allege that the trusts have sustained losses in collateral value of approximately
$38
bn. The lawsuits seek unspecified damages resulting from alleged breaches of the US Trust Indenture Act, breach of fiduciary duty, negligence, breach of contract and breach of the common law duty of trust. HSBC’s motions to dismiss in several of these lawsuits were, for the most part, denied.
It is not practicable to estimate the possible financial impact of these matters, as there are many factors that may affect the range of possible outcomes; however, the resulting financial impact could be significant.
Loan repurchase matters:
HSBC Bank USA, HSBC Finance and Decision One Mortgage Company LLC (‘Decision One’), an indirect subsidiary of HSBC Finance, have been named as defendants in various mortgage loan repurchase actions brought by trustees of mortgage securitisation trusts. In the aggregate, these actions seek to have the HSBC defendants repurchase mortgage loans, or pay compensatory damages, totalling at least
$1
bn. In August 2016, HSBC reached an agreement in principle to settle one of the matters. In September 2017, the court approved the settlement, concluding the matter. Another matter against HSBC Bank USA was dismissed on appeal in December 2017.
HSBC Mortgage Corporation (USA) Inc. and Decision One have also been named as defendants in
two
separate actions filed by Residential Funding Company LLC (‘RFC’), a mortgage loan purchase counterparty, seeking unspecified damages in connection with approximately
25,000
mortgage loans.
It is not practicable to estimate the possible financial impact of these matters, as there are many factors that may affect the range of possible outcomes; however, the resulting financial impact could be significant.
|
HSBC Holdings plc
|
281
|
Notes on the Financial Statements
FIRREA:
Since 2010, various HSBC entities have received subpoenas and requests for information from the DoJ and the Massachusetts state Attorney General seeking the production of documents and information regarding HSBC’s involvement in certain RMBS transactions as an issuer, sponsor, underwriter, depositor, trustee, custodian or servicer. In November 2014, HNAH, on behalf of itself and various subsidiaries including, but not limited to, HSBC Bank USA, HSI Asset Securitization Corp., HSI, HSBC Mortgage Corporation (USA), HSBC Finance and Decision One, received a subpoena from the US Attorney’s Office for the District of Colorado, pursuant to the Financial Industry Reform, Recovery and Enforcement Act (‘FIRREA’), concerning the origination, financing, purchase, securitisation and servicing of sub-prime and non-sub-prime residential mortgages. HSBC continues to cooperate with these investigations, which are at or nearing completion.
In December 2016, HSBC had an initial discussion with the DoJ, wherein the DoJ stated its preliminary view that HSBC is subject to liability under FIRREA in connection with certain securitisations from 2005 to 2007 with respect to which HSBC Bank USA served as sponsor or seller of loans and HSI served as underwriter. In March 2017, HSBC provided its response to the DoJ, which, among other things, outlined why the Bank disagrees with the DoJ’s preliminary view. Since then, the Bank has been in active discussions with the DoJ regarding a potential resolution; however, the Bank has also indicated a willingness to defend itself in the event that formal legal proceedings are commenced. There can be no assurance as to how or when this matter will be resolved, or whether this matter will be resolved prior to the commencement of formal legal proceedings by the DoJ. Moreover, it is possible that any such resolution could result in significant penalties and other costs. To date, at least
one
bank has been sued by the DoJ and at least
eight
other banks have reported settlements of mortgage-backed securities-related matters pursuant to FIRREA. The prior DoJ settlements provide no clear guidance as to how those individual settlement amounts were calculated, and due to the high degree of uncertainty involved, it is not practicable to estimate any possible financial impact of this matter, which could be significant.
HSBC expects the focus on mortgage securitisations to continue and that it may be subject to additional claims, litigation and governmental or regulatory scrutiny relating to its participation in the US mortgage securitisation market.
Anti-money laundering and sanctions-related matters
In October 2010, HSBC Bank USA entered into a consent cease and desist order with the OCC, and HNAH entered into a consent cease and desist order with the FRB. In 2012, HSBC Bank USA further entered into an enterprise-wide compliance consent order (each an ‘Order’ and together, the ‘Orders’). These Orders required improvements to establish an effective compliance risk management programme across HSBC’s US businesses, including risk management related to the Bank Secrecy Act (‘BSA’) and AML compliance. While these Orders remain open, HSBC Bank USA and HNAH believe that they have taken appropriate steps to bring themselves into compliance with the requirements of the Orders.
In December 2012, HSBC Holdings, HNAH and HSBC Bank USA entered into agreements with US and UK government and regulatory agencies regarding past inadequate compliance with the BSA, AML and sanctions laws. Among those agreements, HSBC Holdings and HSBC Bank USA entered into a
five
-year deferred prosecution agreement with, among others, the DoJ (the ‘AML DPA’); and HSBC Holdings consented to a cease and desist order, and HSBC Holdings and HNAH consented to a civil money penalty order with the FRB. HSBC Holdings also entered into an agreement with the Office of Foreign Assets Control (‘OFAC’) regarding historical transactions involving parties subject to OFAC sanctions, as well as an undertaking with the UK FCA to comply with certain forward-looking AML and sanctions-related obligations. In addition, HSBC Bank USA entered into civil money penalty orders with the Financial Crimes Enforcement Network of the US Treasury Department (‘FinCEN’) and the OCC.
Under these agreements, HSBC Holdings and HSBC Bank USA made payments totalling
$1.9
bn to US authorities and undertook various further obligations, including, among others, to retain an independent compliance monitor (who is, for FCA purposes, a ‘skilled person’ under section 166 of the Financial Services and Markets Act) to produce annual assessments of the Group’s AML and sanctions compliance programme (the ‘Monitor’). Under the cease and desist order issued by the FRB in 2012, the Monitor also serves as an independent consultant to conduct annual assessments. In February 2018, the Monitor delivered his fourth annual follow-up review report.
Through his country-level reviews, the Monitor identified potential anti-money laundering and sanctions compliance issues that HSBC is reviewing further with the DoJ, FRB and/or FCA. In particular, the DoJ is investigating HSBC’s handling of a corporate customer’s accounts. In addition, FinCEN as well as the Civil Division of the US Attorney’s Office for the Southern District of New York are investigating the collection and transmittal of third-party originator information in certain payments instructed over HSBC’s proprietary payment systems. The FCA is also conducting an investigation into HSBC Bank plc’s compliance with UK money laundering regulations and financial crime systems and controls requirements. HSBC is cooperating with all of these investigations.
In December 2017, the AML DPA expired and the charges deferred by the AML DPA were dismissed. The Monitor will continue working in his capacity as a skilled person and independent consultant for a period of time at the FCA’s and FRB’s discretion. The role of the Monitor and his fourth annual follow-up review report, as well as the AML DPA and related agreements and consent orders are discussed on pages
97
and
118
.
Concurrent with entry into the AML DPA, HSBC Bank USA also entered into
two
consent orders with the OCC. The first, discussed above, required HSBC Bank USA to adopt an enterprise-wide compliance programme. The second required HSBC Bank USA to correct the circumstances noted in the OCC’s report and imposed restrictions on HSBC Bank USA acquiring control of, or holding an interest in, any new financial subsidiary, or commencing a new activity in its existing financial subsidiary, without the OCC’s prior approval.
These settlements with US and UK authorities have led to private litigation, and do not preclude further private litigation related to HSBC’s compliance with applicable BSA, AML and sanctions laws or other regulatory or law enforcement actions for BSA, AML, sanctions or other matters not covered by the various agreements.
In May 2014, a shareholder derivative action was filed by a shareholder of HSBC Holdings purportedly on behalf of HSBC Holdings, HSBC Bank USA, HNAH and HSBC USA Inc. (the ‘Nominal Corporate Defendants’) in New York state court against certain current and former directors and officers of those HSBC companies (the ‘Individual Defendants’). The complaint alleges that the Individual Defendants breached their fiduciary duties to the Nominal Corporate Defendants and caused a waste of corporate assets by allegedly permitting and/or causing the conduct underlying the AML DPA. In November 2015, the New York state court granted the Nominal Corporate Defendants’ motion to dismiss. The plaintiff has appealed that decision.
In July 2014, a claim was filed in the Ontario Superior Court of Justice against HSBC Holdings and a former employee purportedly on behalf of a class of persons who purchased HSBC common shares and American Depositary Shares between July 2006 and July 2012. The complaint, which seeks monetary damages of up to CA
$20
bn, alleges that the defendants made statutory and common law misrepresentations in documents released by HSBC Holdings and its wholly owned indirect subsidiary, HSBC Bank Canada, relating to
|
282
|
HSBC Holdings plc
|
HSBC’s compliance with BSA, AML, sanctions and other laws. In September 2017, the Ontario Superior Court of Justice dismissed the statutory claims against HSBC Holdings and the former employee for lack of jurisdiction, and stayed the common law misrepresentation claim against HSBC Holdings on the basis of forum non-conveniens. In October 2017, the plaintiff appealed to the Court of Appeal for Ontario, where the matter is pending.
Since November 2014, five lawsuits have been filed in federal court in New York, Illinois and Texas, against various HSBC companies and others, on behalf of plaintiffs who are, or are related to, victims of terrorist attacks in Iraq and Jordan or of cartel violence in Mexico. In each case, it is alleged that the defendants aided and abetted the unlawful conduct of various sanctioned parties in violation of the US Anti-Terrorism Act. One action was voluntarily dismissed in October 2017. The remaining actions are pending in federal court in New York and are at an early stage.
Based on the facts currently known, it is not practicable at this time for HSBC to predict the resolution of these matters, including the timing or any possible impact on HSBC, which could be significant.
Tax-related investigations
Various tax administration, regulatory and law enforcement authorities around the world, including in the US, Belgium, Argentina, India and Spain are conducting investigations and reviews of HSBC Private Bank (Suisse) SA (‘HSBC Swiss Private Bank’) and other HSBC companies, in connection with allegations of tax evasion or tax fraud, money laundering and unlawful cross-border banking solicitation.
HSBC continues to cooperate in ongoing investigations by the DoJ and the US Internal Revenue Service regarding whether certain HSBC companies and employees, including those associated with HSBC Swiss Private Bank and an HSBC company in India, acted appropriately in relation to certain customers who may have had US tax reporting obligations. In connection with these investigations, HSBC Swiss Private Bank, with due regard for Swiss law, has produced records and other documents to the DoJ. In August 2013, the DoJ informed HSBC Swiss Private Bank that it was not eligible for the ‘Program for Non-Prosecution Agreements or Non-Target Letters for Swiss Banks’ since a formal investigation had previously been authorised.
In November 2014, HSBC Swiss Private Bank was placed under formal criminal examination in France for alleged tax-related offences in 2006 and 2007 and, in April 2015, HSBC Holdings was informed that it had been placed under formal criminal examination in France in connection with the conduct of HSBC Swiss Private Bank. In November 2017, HSBC Swiss Private Bank reached an agreement with the French public prosecutor to resolve its investigation. Under the terms of the settlement, HSBC Swiss Private Bank agreed to pay
€300 million in fines and damages. The investigation into HSBC Holdings was dismissed without further proceedings.
€300 million in fines and damages. The investigation into HSBC Holdings was dismissed without further proceedings.
In November 2014, HSBC Swiss Private Bank was also placed under formal criminal examination in Belgium for alleged tax-related offences. In June 2017, Belgian authorities placed HSBC Holdings and HSBC Private Bank Holdings (Suisse) SA, a Swiss holding company, under formal criminal examination.
In November 2014, the Argentine tax authority initiated a criminal action against various individuals, including current and former HSBC employees. The criminal action includes allegations of tax evasion, conspiracy to launder undeclared funds and an unlawful association among HSBC Swiss Private Bank, HSBC Bank Argentina, HSBC Bank USA and certain HSBC employees, which allegedly enabled numerous HSBC customers to evade their Argentine tax obligations.
In February 2015, the Indian tax authority issued a summons and request for information to an HSBC company in India. In August 2015 and November 2015, HSBC companies received notices issued by
two
offices of the Indian tax authority, alleging that the Indian tax authority had sufficient evidence to initiate prosecution against HSBC Swiss Private Bank and an HSBC company in Dubai for allegedly abetting tax evasion of
four
different Indian individuals and/or families and requesting that the HSBC companies show why such prosecution should not be initiated. HSBC Swiss Private Bank and the HSBC company in Dubai have responded to the show cause notices. HSBC is cooperating with the relevant authorities.
At 31 December 2017, HSBC has recognised a provision for these various matters in the amount of
$604m
. There are many factors that may affect the range of outcomes, and the resulting financial impact, of these investigations and reviews. Based on the information currently available, management’s estimate of the possible aggregate penalties that might arise as a result of the matters in respect of which it is practicable to form estimates is up to or exceeding
$1.5b
n, including amounts for which a provision has been recognised. Due to uncertainties and limitations of these estimates, the ultimate penalties could differ significantly from this amount.
In light of the media attention regarding these matters, it is possible that other tax administration, regulatory or law enforcement authorities will also initiate or enlarge similar investigations or regulatory proceedings.
Mossack Fonseca & Co.
HSBC has received requests for information from various regulatory and law enforcement authorities around the world concerning persons and entities believed to be linked to Mossack Fonseca & Co., a service provider of personal investment companies. HSBC is cooperating with the relevant authorities.
Based on the facts currently known, it is not practicable at this time for HSBC to predict the resolution of this matter, including the timing or any possible impact on HSBC, which could be significant.
London interbank offered rates, European interbank offered rates and other benchmark interest rate investigations and litigation
Various regulators and competition and law enforcement authorities around the world, including in the UK, the US, the EU and Switzerland, are conducting investigations and reviews related to certain past submissions made by panel banks and the processes for making submissions in connection with the setting of Libor, Euribor and other benchmark interest rates and screens used to price certain derivative products. HSBC has been the subject of regulatory demands for information and is cooperating with those investigations and reviews.
In December 2016, the European Commission (the ‘Commission’) issued a decision finding that HSBC, among other banks, engaged in anti-competitive practices in connection with the pricing of euro interest rate derivatives in early 2007. The Commission imposed a fine on HSBC based on a
one
-month infringement. HSBC has appealed the decision.
US dollar Libor:
Beginning in 2011, HSBC and other panel banks have been named as defendants in a number of private lawsuits filed in the US with respect to the setting of US dollar Libor. The complaints assert claims under various US laws, including US antitrust and racketeering laws, the US Commodity Exchange Act (‘US CEA’), and state law. The lawsuits include individual and putative class actions, most of which have been transferred and/or consolidated for pre-trial purposes before the New York District Court.
|
HSBC Holdings plc
|
283
|
Notes on the Financial Statements
The New York District Court has issued decisions dismissing certain of the claims in response to motions filed by the defendants. Those decisions resulted in the dismissal of the plaintiffs’ federal and state antitrust claims, racketeering claims and unjust enrichment claims. The dismissal of the antitrust claims was appealed to the US Court of Appeals for the Second Circuit, which reversed the decisions in May 2016. In July 2016, the defendants filed a joint motion to dismiss the antitrust claims on additional grounds not previously addressed by the court and, in December 2016, the New York District Court granted in part and denied in part the motion, leaving only certain antitrust claims to be litigated. Certain plaintiffs have appealed the December 2016 order to the US Court of Appeals for the Second Circuit. Separately, in October 2016, the New York District Court granted a motion to dismiss claims brought by certain individual plaintiffs for lack of personal jurisdiction, which is also on appeal to the Second Circuit. Finally, in January 2017, the District Court granted the defendants’ motion to dismiss certain of the remaining antitrust claims against defendants that did not serve on the US dollar Libor submission panel. In the New York District Court, the cases with remaining claims against HSBC have been stayed while the court considers motions to certify classes in several putative class actions that are pending against HSBC’s co-defendants.
In 2017, HSBC reached agreements with plaintiffs to resolve three putative class actions brought on behalf of persons who purchased US dollar Libor-indexed bonds, persons who purchased US Libor-indexed-exchange-traded instruments and US based lending institutions that made or purchased US dollar Libor-indexed loans. In February 2018, HSBC reached an agreement with plaintiffs to resolve a putative class action brought on behalf of persons who purchased US dollar Libor-indexed interest rate swaps and other instruments directly from the defendant banks and their affiliates. These settlements are subject to court approval.
Euribor:
In November 2013, HSBC and other panel banks were named as defendants in a putative class action filed in the New York District Court on behalf of persons who transacted in euro futures contracts and other financial instruments allegedly related to Euribor. The complaint alleges, among other things, misconduct related to Euribor in violation of US antitrust laws, the US CEA and state law. In December 2016, HSBC reached an agreement with plaintiffs to resolve this action, subject to court approval. The court issued an order granting preliminary approval in January 2017, and has scheduled the final approval hearing in May 2018.
Singapore Interbank Offered Rate (‘SIBOR’), Singapore Swap Offer Rate (‘SOR’) and Australia Bank Bill Swap Rate (‘BBSW’):
I
n July 2016 and August 2016, HSBC and other panel banks were named as defendants in
two
putative class actions filed in the New York District Court on behalf of persons who transacted in products related to the SIBOR, SOR and BBSW benchmark rates. The complaints allege, among other things, misconduct related to these benchmark rates in violation of US antitrust, commodities and racketeering laws, and state law. In August 2017, the defendants moved to dismiss the SIBOR and SOR case, and this motion remains pending. The defendants moved to dismiss the BBSW case in February 2017 and this motion also remains pending.
US dollar International Swaps and Derivatives Association fix (‘ISDAfix’):
In September 2014, HSBC and other panel banks were named as defendants in a number of putative class actions consolidated in the New York District Court on behalf of persons who transacted in interest rate derivatives or purchased or sold financial instruments that were either tied to ISDAfix rates or were executed shortly before, during, or after the time of the daily ISDAfix setting window. The consolidated complaint alleges, among other things, misconduct related to these activities in violation of US antitrust laws, the US CEA and state law. HSBC’s motion to dismiss the complaint was denied in March 2016. In June 2017, HSBC reached an agreement with plaintiffs to resolve this consolidated action, subject to court approval. The court issued an order granting preliminary approval in July 2017, but has not yet set a date for the final approval hearing.
Canadian Dealer Offered Rate:
In January 2018, various HSBC entities and other banks were named as defendants in a putative class action filed in the New York District Court in relation to the Canadian Dealer Offered Rate. The claim, which is at an early stage, asserts various breaches of US laws, including US antitrust and racketeering laws, the US CEA, and common law.
There are many factors that may affect the range of outcomes, and the resulting financial impact, of these matters, which could be significant.
Supranational, sovereign and agency bonds
In April 2017, various HSBC companies, among other banks, were added as defendants in a putative class action alleging a conspiracy to manipulate the market for US dollar-denominated supranational, sovereign and agency bonds between 2005 and 2015 in violation of US antitrust laws. In November 2017, plaintiffs filed an amended consolidated complaint which omitted certain HSBC defendants. The remaining HSBC defendants moved to dismiss the amended consolidated complaint, and this motion remains pending.
In November 2017, various HSBC companies and other financial institutions were named as defendants in a putative class action issued in Canada making similar allegations under Canadian law. The claim has not yet been served.
Based on the facts currently known, it is not practicable at this time for HSBC to predict the resolution of these matters, including the timing or any possible impact on HSBC, which could be significant.
Foreign exchange rate investigations and litigation
Various regulators and competition and law enforcement authorities around the world, including in the US, the EU, Switzerland, Brazil, South Korea and South Africa, are conducting civil and criminal investigations and reviews into trading by HSBC and others on the foreign exchange markets. HSBC is cooperating with these investigations and reviews.
In August 2016, the DoJ indicted
two
now-former HSBC employees and charged them with wire fraud and conspiracy relating to a 2011 foreign exchange transaction. In October 2017, one of the former employees was found guilty after trial. In January 2018, HSBC Holdings entered into a
three
-year deferred prosecution agreement with the Criminal Division of the DoJ (the ‘FX DPA’), regarding fraudulent conduct in connection with two particular transactions in 2010 and 2011. This concluded the DoJ’s investigation into HSBC’s historical foreign exchange activities. Under the terms of the FX DPA, HSBC has a number of ongoing obligations, including continuing to cooperate with authorities and implementing enhancements to its internal controls and procedures in its Global Markets business, which will be the subject of annual reports to the DoJ. In addition, HSBC agreed to pay a financial penalty and restitution.
In September 2017, HSBC Holdings and HNAH consented to a civil money penalty order with the FRB in connection with its investigation into HSBC’s foreign exchange activities. Under the terms of the order, HSBC Holdings and HNAH agreed to undertake certain remedial steps and to pay a civil money penalty to the FRB.
In December 2016, HSBC Bank plc entered into a settlement with Brazil’s Administrative Council of Economic Defense (‘CADE’) in connection with its investigation into
15
banks, including HSBC Bank plc, as well as
30
individuals, relating to practices in the offshore foreign exchange market. Under the terms of the settlement, HSBC Bank plc agreed to pay a financial penalty to CADE. CADE has also publicly announced that it is initiating a separate investigation into the onshore foreign exchange market and has identified a number of banks, including HSBC, as subjects of its investigation.
|
284
|
HSBC Holdings plc
|
In February 2017, the Competition Commission of South Africa referred a complaint for proceedings before the South African Competition Tribunal against
18
financial institutions, including HSBC Bank plc, for alleged misconduct related to the foreign exchange market in violation of South African antitrust laws. In April 2017, HSBC filed an exception to the complaint, based on a lack of jurisdiction and statute of limitations.
In January 2018, the
South African Competition
Tribunal approved the provisional referral of additional financial institutions, including HSBC Bank USA, to the proceedings.
These proceedings are at an early stage.
In late 2013 and early 2014, HSBC and other banks were named as defendants in various putative class actions consolidated in the New York District Court. The consolidated complaint alleged, among other things, that the defendants conspired to manipulate the WM/Reuters foreign exchange benchmark rates. In September 2015, HSBC reached an agreement with plaintiffs to resolve the consolidated action, subject to court approval. In December 2015, the court granted preliminary approval of the settlement, and HSBC made payment of the agreed settlement amount into an escrow account. The settlement remains subject to final approval by the court.
In June 2015, a putative class action was filed in the New York District Court making similar allegations on behalf of Employee Retirement Income Security Act of 1974 (‘ERISA’) plan participants. The court dismissed the claims in the ERISA action, and the plaintiffs have appealed to the US Court of Appeals for the Second Circuit. In May 2015, another complaint was filed in the US District Court for the Northern District of California making similar allegations on behalf of retail customers. HSBC filed a motion to transfer that action from California to New York, which was granted in November 2015. In March 2017, the New York District Court dismissed the retail customers’ complaint in response to the defendants’ joint motion to dismiss. In August 2017, the retail customer plaintiffs filed an amended complaint and the defendants moved to dismiss. The motion remains pending. In April and June 2017, putative class actions making similar allegations on behalf of purported ‘indirect’ purchasers of foreign exchange products were filed in New York. Those plaintiffs subsequently filed a consolidated amended complaint. HSBC’s motion to dismiss the consolidated amended complaint was filed in August 2017 and remains pending.
In September 2015,
two
additional putative class actions making similar allegations under Canadian law were issued in Canada against various HSBC companies and other financial institutions. In June 2017, HSBC reached an agreement with the plaintiffs to resolve these actions. The settlement received final court approval in October 2017.
At 31 December 2017, HSBC has recognised a provision for these and similar matters in the amount of $511m. There are many factors that may affect the range of outcomes, and the resulting financial impact, of these matters. Due to uncertainties and limitations of these estimates, the ultimate penalties could differ significantly from the amount provided.
Precious metals fix-related investigations and litigation
Various regulators and competition and law enforcement authorities, including in the US and the EU, are conducting investigations and reviews relating to HSBC’s precious metals operations and trading. HSBC is cooperating with these investigations and reviews. In November 2014, the Antitrust Division and Criminal Fraud Section of the DoJ issued a document request to HSBC Holdings, seeking the voluntary production of certain documents in connection with a criminal investigation that the DoJ is conducting of alleged anti-competitive and manipulative conduct in precious metals trading. In January 2016, the Antitrust Division of the DoJ informed HSBC that it was closing its investigation.
In January 2018, HSI reached an agreement with the US Commodity Futures Trading Commission (‘CFTC’) to resolve its investigation of HSBC’s precious metals activities. Under the terms of the settlement, HSBC Securities (USA) Inc. agreed to pay a financial penalty to the CFTC.
Gold:
Beginning in March 2014, numerous putative class actions were filed in the New York District Court and the US District Courts for the District of New Jersey and the Northern District of California, naming HSBC and other members of The London Gold Market
Fixing Limited as defendants. The complaints allege that, from January 2004 to June 2013, defendants conspired to manipulate the price of gold and gold derivatives for their collective benefit in violation of US antitrust laws, the US CEA and New York state law. The actions were consolidated in the New York District Court. The defendants’ motion to dismiss the consolidated action was granted in part and denied in part in October 2016. In June 2017, the court granted plaintiffs leave to file a third amended complaint, which names a new defendant. The court has denied the pre-existing defendants’ request for leave to file a joint motion to dismiss. HSBC and the other pre-existing defendants have requested a stay of discovery.
Beginning in December 2015, numerous putative class actions under Canadian law were filed in the Ontario and Quebec Superior Courts of Justice against various HSBC companies and other financial institutions. The plaintiffs allege that, among other things, from January 2004 to March 2014, defendants conspired to manipulate the price of gold and gold derivatives in violation of the Canadian Competition Act and common law. These actions are at an early stage.
Silver:
Beginning in July 2014, numerous putative class actions were filed in the US District Courts for the Southern and Eastern Districts of New York, naming HSBC and other members of The London Silver Market Fixing Ltd as defendants. The complaints allege that, from January 2007 to December 2013, the defendants conspired to manipulate the price of silver and silver derivatives for their collective benefit in violation of US antitrust laws, the US CEA and New York state law. The actions were consolidated in the New York District Court. The defendants’ motion to dismiss the consolidated action was granted in part and denied in part in October 2016. In June 2017, the court granted plaintiffs leave to file a third amended complaint, which names several new defendants. The court has denied the pre-existing defendants’ request for leave to file a joint motion to dismiss. HSBC and the other pre-existing defendants have requested a stay of discovery.
In April 2016,
two
putative class actions under Canadian law were filed in the Ontario and Quebec Superior Courts of Justice against various HSBC companies and other financial institutions. Plaintiffs in both actions allege that, from January 1999 to August 2014, the defendants conspired to manipulate the price of silver and silver derivatives in violation of the Canadian Competition Act and common law. The Ontario action is at an early stage. The Quebec action has been temporarily stayed.
Platinum and palladium:
Between late 2014 and early 2015, numerous putative class actions were filed in the New York District Court, naming HSBC and other members of The London Platinum and Palladium Fixing Company Limited as defendants. The complaints allege that, from January 2008 to November 2014, the defendants conspired to manipulate the price of platinum group metals (‘PGM’) and PGM-based financial products for their collective benefit in violation of US antitrust laws and the US CEA. In March 2017, the defendants’ motion to dismiss the second amended consolidated complaint was granted in part and denied in part. In June 2017, plaintiffs filed a third amended complaint. The defendants filed a joint motion to dismiss, which remains pending.
There are many factors that may affect the range of outcomes, and the resulting financial impact, of these matters, which could be significant.
|
HSBC Holdings plc
|
285
|
Notes on the Financial Statements
Treasury auctions
Beginning in July 2015, HSI, among other financial institutions, was named as a defendant in several putative class actions filed in the New York District Court. The complaints generally allege that the defendants violated US antitrust laws and the US CEA by colluding
to manipulate prices of US Treasury securities sold at auction. The cases have been consolidated in the New York District Court. In November 2017, the plaintiffs filed an amended consolidated complaint that focused on a sub-group of primary dealer defendants, and dropped several of the financial institutions named in the original consolidated complaint, including HSBC. In December 2017 the court dismissed the consolidated class claims against those defendants, including HSBC, not named in the consolidated amended complaint.
to manipulate prices of US Treasury securities sold at auction. The cases have been consolidated in the New York District Court. In November 2017, the plaintiffs filed an amended consolidated complaint that focused on a sub-group of primary dealer defendants, and dropped several of the financial institutions named in the original consolidated complaint, including HSBC. In December 2017 the court dismissed the consolidated class claims against those defendants, including HSBC, not named in the consolidated amended complaint.
The DoJ has also requested information from HSBC and reportedly other banks regarding US Treasury securities trading practices. HSBC is cooperating with this ongoing investigation.
Based on the facts currently known, it is not practicable at this time for HSBC to predict the resolution of these matters, including the timing or any possible impact on HSBC, which could be significant.
Interest rate swap and credit default swap litigation
In February 2016, various HSBC companies, among others, were added as defendants in a putative class action filed in the New York District Court. The complaint alleged that the defendants violated US antitrust laws by, among other things, conspiring to boycott and eliminate various entities and practices that would have brought exchange trading to buy-side investors in the interest rate swaps marketplace. In June 2016, this action along with other complaints filed in the New York District Court and the Illinois District Court were consolidated in the New York District Court and, in January 2017, the defendants filed a motion to dismiss. In July 2017, the court granted HSBC’s motion to dismiss.
In June 2017, certain plaintiffs in the consolidated action brought a separate individual action in the New York District Court against most of the same defendants, alleging similar violations of federal and state antitrust laws and breaches of common law in relation to the credit default swap market.
Based on the facts currently known, it is not practicable at this time for HSBC to predict the resolution of these matters, including the timing or any possible impact on HSBC, which could be significant.
Fédération Internationale de Football Association (‘FIFA’) related investigations
HSBC has received enquiries from the DoJ regarding its banking relationships with certain individuals and entities that are or may be associated with FIFA. The DoJ is investigating whether multiple financial institutions, including HSBC, permitted the processing of suspicious or otherwise improper transactions, or failed to observe applicable AML laws and regulations. HSBC is cooperating with the DoJ’s investigation.
Based on the facts currently known, it is not practicable at this time for HSBC to predict the resolution of this matter, including the timing or any possible impact on HSBC, which could be significant.
Hiring practices investigation
The US Securities and Exchange Commission (the ‘SEC’) is investigating multiple financial institutions, including HSBC, in relation to hiring practices of candidates referred by or related to government officials or employees of state-owned enterprises in Asia-Pacific. HSBC has received various requests for information and is cooperating with the SEC’s investigation.
Based on the facts currently known, it is not practicable at this time for HSBC to predict the resolution of this matter, including the timing or any possible impact on HSBC, which could be significant.
Stanford litigation
In January 2018, HSBC Bank plc received a letter of claim from the Antiguan Joint Liquidators of Stanford International Bank Ltd (‘SIB’) asserting various claims in connection with HSBC Bank plc’s role as a correspondent bank to SIB from 2003 to 2009. HSBC Bank plc denies the allegations and is preparing its response.
HSBC Bank plc continues to defend putative class action lawsuits in the US District Court for the Northern District of Texas against HSBC Bank plc and other bank and individual defendants. The complaints, filed by the Official Stanford Investors Committee and a putative class of persons who held monies on deposit and/or certificates of deposit issued by SIB, allege various fraudulent transfer, statutory and tort claims. In November 2017, the court denied the class plaintiffs' motion for class certification. Permission to appeal that ruling has been requested by the class plaintiffs.
Based on the facts currently known, it is not practicable at this time for HSBC to predict the resolution of these matters, including the timing or any possible impact on HSBC, which could be significant.
|
35
|
Related party transactions
|
Related parties of the Group and HSBC Holdings include subsidiaries, associates, joint ventures, post-employment benefit plans for HSBC employees, Key Management Personnel (‘KMP’) as defined by IAS 24, close family members of KMP and entities which are controlled or jointly controlled by KMP or their close family members. KMP are defined as those persons having authority and responsibility for planning, directing and controlling the activities of HSBC Holdings. These individuals also constitute ‘senior management’ for the purposes of the Hong Kong Listing Rules. Following a review of the application of IAS 24, it was determined that the roles of Chief Legal Officer, Group Head of Internal Audit and Group Head of Human Resources did not meet the criteria for KMP as provided for in the standard.
Particulars of transactions with related parties are tabulated below. The disclosure of the year-end balance and the highest amounts outstanding during the year is considered to be the most meaningful information to represent the amount of the transactions and outstanding balances during the year.
Key Management Personnel
Details of Directors’ remuneration and interest in shares are disclosed in the Directors’ Remuneration Report on pages
186
to
202
. IAS 24 ‘Related party disclosures’ requires the following additional information for key management compensation.
|
286
|
HSBC Holdings plc
|
|
Compensation of Key Management Personnel
|
||||||
|
|
2017
|
|
2016
|
|
2015
|
|
|
|
$m
|
|
$m
|
|
$m
|
|
|
Short-term employee benefits
|
43
|
|
41
|
|
40
|
|
|
Post-employment benefits
|
—
|
|
—
|
|
1
|
|
|
Other long-term employee benefits
|
5
|
|
5
|
|
9
|
|
|
Share-based payments
|
35
|
|
37
|
|
51
|
|
|
Year ended 31 Dec
|
83
|
|
83
|
|
101
|
|
|
Shareholdings, options and other securities of Key Management Personnel
|
||||
|
|
2017
|
|
2016
|
|
|
|
(000s)
|
|
(000s)
|
|
|
Number of options held over HSBC Holdings ordinary shares under employee share plans
|
15
|
|
18
|
|
|
Number of HSBC Holdings ordinary shares held beneficially and non-beneficially
|
22,609
|
|
22,283
|
|
|
At 31 Dec
|
22.624
|
|
22,301
|
|
|
Transactions and balances during the year with Key Management Personnel
|
|||||||
|
|
|
2017
|
2016
|
||||
|
|
|
Balance at 31 Dec
|
Highest amounts outstanding
during year |
Balance
at 31 Dec |
|
Highest amounts outstanding
during year |
|
|
|
Footnotes
|
$m
|
$m
|
$m
|
|
$m
|
|
|
Key Management Personnel
|
1
|
|
|
|
|
|
|
|
Advances and credits
|
2
|
329
|
334
|
215
|
|
220
|
|
|
Guarantees
|
|
6
|
52
|
55
|
|
63
|
|
|
Deposits
|
|
300
|
893
|
229
|
|
677
|
|
|
1
|
Includes Key Management Personnel, close family members of Key Management Personnel and entities which are controlled or jointly controlled by Key Management Personnel or their close family members.
|
|
2
|
Advances and credits entered into by subsidiaries of HSBC Holdings during
2017
with Directors, disclosed pursuant to Section 413 of the Companies Act 2006, totalled
$2m
(
2016
:
$2m
).
|
Some of the transactions were connected transactions as defined by the Rules Governing The Listing of Securities on The Stock Exchange of Hong Kong Limited, but were exempt from any disclosure requirements under the provisions of those rules. The above transactions were made in the ordinary course of business and on substantially the same terms, including interest rates and security,
as for comparable transactions with persons of a similar standing or, where applicable, with other employees. The transactions did not involve more than the normal risk of repayment or present other unfavourable features.
Associates and joint ventures
The Group provides certain banking and financial services to associates and joint ventures including loans, overdrafts, interest and non-interest bearing deposits and current accounts. Details of the interests in associates and joint ventures are given in Note
17
.
|
Transactions and balances during the year with associates and joint ventures
|
||||||||
|
|
2017
|
2016
|
||||||
|
|
Highest balance
during the year |
|
Balance at
31 Dec |
|
Highest balance
during the year |
|
Balance at
31 Dec |
|
|
|
$m
|
|
$m
|
|
$m
|
|
$m
|
|
|
Unsubordinated amounts due from joint ventures
|
138
|
|
119
|
|
126
|
|
113
|
|
|
Unsubordinated amounts due from associates
|
3,104
|
|
2,537
|
|
3,136
|
|
2,881
|
|
|
Subordinated amounts due from associates
|
411
|
|
411
|
|
—
|
|
—
|
|
|
Amounts due to associates
|
2,617
|
|
1,232
|
|
1,112
|
|
576
|
|
|
Guarantees and commitments
|
654
|
|
665
|
|
776
|
|
594
|
|
The above outstanding balances arose in the ordinary course of business and on substantially the same terms, including interest rates and security, as for comparable transactions with third-party counterparties.
Post-employment benefit plans
At 31 December
2017
, $
5.3bn
(
2016
: $
4.4bn
) of HSBC post-employment benefit plan assets were under management by
HSBC companies, earning management fees of $ 8m in 2017 ( 2016 : $ 6m ). At 31 December 2017 , HSBC’s post-employment
benefit plans had placed deposits of $ 875m ( 2016 : $ 710m ) with its banking subsidiaries, earning interest payable to the schemes
of nil ( 2016 : $ 1m ). The above outstanding balances arose from the ordinary course of business and on substantially the same terms, including interest rates and security, as for comparable transactions with third-party counterparties.
The HSBC Bank (UK) Pension Scheme and International Staff Retirement Benefit Scheme enter into swap transactions with HSBC to manage inflation and interest rate sensitivity of its liabilities and selected assets. At 31 December
2017
, the gross notional value of the swaps with HSBC Bank (UK) Pension Scheme was
$11.3bn
(
2016
:
$10.5bn
); these swaps had a positive fair value to the scheme of
$1.0bn
(
2016
:
$0.9bn
); and HSBC had delivered collateral of
$1.0bn
(
2016
:
$0.9bn
) to the scheme in respect of these arrangements.
At 31 December
2017
, the International Staff Retirement Benefit Scheme no longer held any swaps. In the prior year, it held swaps (gross notional value in
2016
:
$1.2bn
) which had a net negative fair value to the scheme (
2016
:
$85m
negative). All swaps were executed at prevailing market rates and within standard market bid/offer spreads.
|
HSBC Holdings plc
|
287
|
Notes on the Financial Statements
HSBC Holdings
Details of HSBC Holdings’ subsidiaries are shown in Note
37
.
|
Transactions and balances during the year with subsidiaries
|
||||||||
|
|
2017
|
2016
|
||||||
|
|
Highest balance
during the year |
|
Balance at
31 Dec |
|
Highest balance
during the year |
|
Balance at
31 Dec |
|
|
|
$m
|
|
$m
|
|
$m
|
|
$m
|
|
|
Assets
|
|
|
|
|
||||
|
Cash and balances with HSBC undertakings
|
1,985
|
|
1,985
|
|
997
|
|
247
|
|
|
Loans and advances to HSBC undertakings designated at fair value
|
11,944
|
|
11,944
|
|
—
|
|
—
|
|
|
Derivatives
|
2,796
|
|
2,388
|
|
4,494
|
|
2,148
|
|
|
Loans and advances to HSBC undertakings
|
89,810
|
|
76,627
|
|
77,732
|
|
77,421
|
|
|
Financial investments in HSBC undertakings
|
4,264
|
|
4,264
|
|
4,314
|
|
3,590
|
|
|
Investments in subsidiaries
|
95,850
|
|
92,930
|
|
97,827
|
|
95,850
|
|
|
Total related party assets at 31 Dec
|
206,649
|
|
190,138
|
|
185,364
|
|
179,256
|
|
|
Liabilities
|
|
|
|
|
|
|
|
|
|
Amounts owed to HSBC undertakings
|
2,906
|
|
2,571
|
|
3,823
|
|
2,157
|
|
|
Derivatives
|
4,904
|
|
3,082
|
|
5,025
|
|
5,025
|
|
|
Subordinated liabilities
|
892
|
|
892
|
|
1,749
|
|
891
|
|
|
Total related party liabilities at 31 Dec
|
8,702
|
|
6,545
|
|
10,597
|
|
8,073
|
|
|
Guarantees and commitments
|
9,692
|
|
7,778
|
|
63,719
|
|
7,619
|
|
The above outstanding balances arose in the ordinary course of business and on substantially the same terms, including interest rates and security, as for comparable transactions with third-party counterparties.
Some employees of HSBC Holdings are members of the HSBC Bank (UK) Pension Scheme, which is sponsored by a separate Group company. HSBC Holdings incurs a charge for these employees equal to the contributions paid into the scheme on their behalf. Disclosure in relation to the scheme is made in Note
5
.
|
36
|
Events after the balance sheet date
|
A fourth interim dividend for 2017 of $
0.21
per ordinary share (a distribution of approximately
$4,199m
) was declared by the Directors after 31 December 2017.
These accounts were approved by the Board of Directors on 20 February 2018 and authorised for issue.
|
37
|
HSBC Holdings’ subsidiaries, joint ventures and associates
|
In accordance with section 409 of the Companies Act 2006 a list of HSBC Holdings plc subsidiaries, joint ventures and associates, the registered office address and the effective percentage of equity owned at 31 December 2017 is disclosed below.
Unless otherwise stated, the share capital comprises ordinary or common shares which are held by Group subsidiaries. The ownership percentage is provided for each undertaking. The undertakings below are consolidated by HSBC unless otherwise indicated.
|
288
|
HSBC Holdings plc
|
Subsidiaries
|
Subsidiaries
|
% of share class held by immediate parent company (or by the Group where this varies)
|
Footnotes
|
|
|
|
ACN 087 652 113 Pty Limited
|
100.00
|
|
15
|
|
|
Almacenadora Banpacifico S.A. (in liquidation)
|
99.99
|
|
9, 16
|
|
|
Assetfinance December (F) Limited
|
100.00
|
|
17
|
|
|
Assetfinance December (H) Limited
|
100.00
|
|
17
|
|
|
Assetfinance December (M) Limited
|
100.00
|
|
17
|
|
|
Assetfinance December (P) Limited
|
100.00
|
|
17
|
|
|
Assetfinance December (R) Limited
|
100.00
|
|
17
|
|
|
Assetfinance June (A) Limited
|
100.00
|
|
17
|
|
|
Assetfinance June (D) Limited
|
100.00
|
|
17
|
|
|
Assetfinance Limited
|
100.00
|
|
17
|
|
|
Assetfinance March (B) Limited
|
100.00
|
|
18
|
|
|
Assetfinance March (D) Limited
|
100.00
|
|
17
|
|
|
Assetfinance March (F) Limited
|
100.00
|
|
17
|
|
|
Assetfinance September (F) Limited
|
100.00
|
|
17
|
|
|
Assetfinance September (G) Limited
|
100.00
|
|
17
|
|
|
B&Q Financial Services Limited
|
100.00
|
|
19
|
|
|
Banco Nominees (Guernsey) Limited
|
100.00
|
|
9, 20
|
|
|
Banco Nominees 2 (Guernsey) Limited
|
100.00
|
|
20
|
|
|
Banco Nominees Limited
|
100.00
|
|
21
|
|
|
Bank of Bermuda (Cayman) Limited
|
100.00
|
|
22
|
|
|
Beau Soleil Limited Partnership
|
n/a
|
7, 9, 23
|
|
|
|
Beijing Miyun HSBC Rural Bank Company Limited
|
100.00
|
|
12, 24
|
|
|
Beneficial Company LLC
|
100.00
|
|
25
|
|
|
Beneficial Consumer Discount Company
|
100.00
|
|
26
|
|
|
Beneficial Financial I Inc.
|
100.00
|
|
27
|
|
|
Beneficial Florida Inc.
|
100.00
|
|
25
|
|
|
Beneficial Homeowner Service Corporation
|
100.00
|
|
25
|
|
|
Beneficial Kentucky Inc.
|
100.00
|
|
25
|
|
|
Beneficial Loan & Thrift Co.
|
100.00
|
|
25
|
|
|
Beneficial Louisiana Inc.
|
100.00
|
|
25
|
|
|
Beneficial Maine Inc.
|
100.00
|
|
25
|
|
|
Beneficial Massachusetts Inc.
|
100.00
|
|
25
|
|
|
Beneficial Michigan Inc.
|
100.00
|
|
25
|
|
|
Beneficial New Hampshire Inc.
|
100.00
|
|
25
|
|
|
Beneficial Oregon Inc.
|
100.00
|
|
25
|
|
|
Beneficial Rhode Island Inc.
|
100.00
|
|
25
|
|
|
Beneficial South Dakota Inc.
|
100.00
|
|
25
|
|
|
Beneficial Tennessee Inc.
|
100.00
|
|
28
|
|
|
Beneficial West Virginia, Inc.
|
100.00
|
|
29
|
|
|
Beneficial Wyoming Inc.
|
100.00
|
|
30
|
|
|
BFC Insurance Agency of Nevada
|
100.00
|
|
223
|
|
|
Billingsgate Nominees Limited
|
100.00
|
|
17
|
|
|
Cal-Pacific Services, Inc.
|
100.00
|
|
27
|
|
|
Canada Crescent Nominees (UK) Limited
|
100.00
|
|
17
|
|
|
Canada Square Nominees (UK) Limited
|
100.00
|
|
17
|
|
|
Canada Square Property Participations Limited
|
100.00
|
|
17
|
|
|
Canada Water Nominees (UK) Limited
|
100.00
|
|
17
|
|
|
Capco/Cove, Inc.
|
100.00
|
|
31
|
|
|
Card-Flo #1, Inc.
|
100.00
|
|
32
|
|
|
Card-Flo #3, Inc.
|
100.00
|
|
25
|
|
|
Cayman International Finance Limited
|
100.00
|
|
33
|
|
|
CC&H Holdings LLC
|
100.00
|
|
34
|
|
|
CCF Charterhouse GmbH & Co Asset Leasing KG (In Liquidation)
|
100.00
|
(99.99)
|
35
|
|
|
CCF Charterhouse GmbH (in Liquidation)
|
100.00
|
(99.99)
|
4, 35
|
|
|
CCF Holding (LIBAN) S.A.L. (in liquidation)
|
74.99
|
|
1, 36
|
|
|
CCF & Partners Asset Management Limited
|
99.99
|
|
17
|
|
|
Charterhouse Administrators ( D.T.) Limited
|
100.00
|
(99.99)
|
9, 17
|
|
|
Charterhouse Development Limited
|
100.00
|
|
17
|
|
|
Charterhouse Management Services Limited
|
100.00
|
(99.99)
|
9, 17
|
|
|
Charterhouse Pensions Limited
|
100.00
|
|
17
|
|
|
Subsidiaries
|
% of share class held by immediate parent company (or by the Group where this varies)
|
Footnotes
|
|
|
Chongqing Dazu HSBC Rural Bank Company Limited
|
(100.00)
|
12, 37
|
|
|
Chongqing Fengdu HSBC Rural Bank Company Limited
|
100.00
|
|
12, 38
|
|
Chongqing Rongchang HSBC Rural Bank Company Limited
|
100.00
|
|
12, 39
|
|
CL Residential Limited (in liquidation)
|
100.00
|
|
40
|
|
COIF Nominees Limited
|
100.00
|
|
17
|
|
Cordico Management AG
|
100.00
|
|
41
|
|
Corhold Limited (in liquidation)
|
100.00
|
|
42
|
|
Dalian Pulandian HSBC Rural Bank Company Limited
|
100.00
|
|
12, 43
|
|
Decision One Mortgage Company, LLC
|
100.00
|
|
44
|
|
Dem 5
|
100.00
|
(99.99)
|
4, 9, 45
|
|
Dem 9
|
100.00
|
(99.99)
|
4, 9, 45
|
|
Dempar 1
|
100.00
|
(99.99)
|
4, 9, 46
|
|
Dempar 4
|
100.00
|
(99.99)
|
9, 46
|
|
Desarrollo Turistico, S.A. de C.V.
|
99.99
|
|
9, 16
|
|
Ellenville Holdings, Inc.
|
100.00
|
|
31
|
|
Elysees GmbH (in Liquidation)
|
100.00
|
(99.99)
|
35
|
|
Elysées Immo Invest
|
100.00
|
(99.99)
|
4, 47
|
|
EMTT Limited (in liquidation)
|
100.00
|
|
17
|
|
Equator Holdings Limited (in liquidation)
|
100.00
|
|
17
|
|
Eton Corporate Services Limited
|
100.00
|
|
20
|
|
Far East Leasing SA
|
100.00
|
|
48
|
|
Fdm 5 SAS
|
100.00
|
(99.99)
|
4, 9, 45
|
|
FEPC Leasing Ltd.
|
100.00
|
|
49
|
|
Finanpar 2
|
100.00
|
(99.99)
|
4, 9, 47
|
|
Finanpar 7
|
100.00
|
(99.99)
|
4, 9, 47
|
|
Flandres Contentieux S.A.
|
100.00
|
(99.99)
|
1, 4, 9, 50
|
|
Foncière Elysées
|
100.00
|
(99.99)
|
4, 9, 46
|
|
Forward Trust Rail Services Limited
|
100.00
|
|
17
|
|
Fujian Yongan HSBC Rural Bank Company Limited
|
100.00
|
|
12, 51
|
|
Fulcher Enterprises Company Limited
|
100.00
|
(62.14)
|
52
|
|
Fundacion HSBC, A.C.
|
99.99
|
|
1, 9, 11, 16
|
|
Gesellschaft fur Industrielle Beteiligungen und Finanzierung mbH
|
100.00
|
(80.67)
|
9, 53
|
|
Gesico International SA (in liquidation)
|
100.00
|
|
54
|
|
Giller Ltd.
|
100.00
|
31
|
|
|
GPIF Co-Investment, LLC
|
80.00
|
|
25
|
|
GPIF-I Equity Co., Ltd.
|
100.00
|
|
8, 22
|
|
GPIF-I Finance Co., Ltd
|
100.00
|
8, 22
|
|
|
Griffin International Limited
|
100.00
|
17
|
|
|
Grupo Financiero HSBC, S. A. de C. V.
|
99.99
|
|
9, 16
|
|
Guangdong Enping HSBC Rural Bank Company Limited
|
100.00
|
|
12, 55
|
|
GZ Guyerzeller Corporation (in liquidation)
|
100.00
|
129
|
|
|
Hang Seng (Nominee) Limited
|
100.00
|
(62.14)
|
52
|
|
Hang Seng Bank (China) Limited
|
100.00
|
(62.14)
|
12, 57
|
|
Hang Seng Bank (Trustee) Limited
|
100.00
|
(62.14)
|
52
|
|
Hang Seng Bank Limited
|
62.14
|
|
52
|
|
Hang Seng Bullion Company Limited
|
100.00
|
(62.14)
|
52
|
|
Hang Seng Credit Limited
|
100.00
|
(62.14)
|
52
|
|
Hang Seng Data Services Limited
|
100.00
|
(62.14)
|
52
|
|
Hang Seng Finance Limited
|
100.00
|
(62.14)
|
52
|
|
Hang Seng Financial Information Limited
|
100.00
|
(62.14)
|
52
|
|
Hang Seng Futures Limited
|
100.00
|
(62.14)
|
52
|
|
Hang Seng Indexes Company Limited
|
100.00
|
(62.14)
|
52
|
|
Hang Seng Insurance Company Limited
|
100.00
|
(62.14)
|
52
|
|
Hang Seng Investment Management Limited
|
100.00
|
(62.14)
|
52
|
|
Hang Seng Investment Services Limited
|
100.00
|
|
52
|
|
Hang Seng Life Limited
|
100.00
|
52
|
|
|
Hang Seng Real Estate Management Limited
|
100.00
|
52
|
|
|
Hang Seng Securities Limited
|
100.00
|
52
|
|
|
HSBC Holdings plc
|
289
|
Notes on the Financial Statements
|
Subsidiaries
|
% of share class held by immediate parent company (or by the Group where this varies)
|
Footnotes
|
|
|
Hang Seng Security Management Limited
|
100.00
|
52
|
|
|
Haseba Investment Company Limited
|
100.00
|
52
|
|
|
HFC Bank Limited (in liquidation)
|
100.00
|
|
40
|
|
HFC Company LLC
|
100.00
|
|
25
|
|
High Time Investments Limited
|
100.00
|
(62.14)
|
52
|
|
HITG Administration GmbH
|
100.00
|
58
|
|
|
Honey Green Enterprises Ltd.
|
100.00
|
59
|
|
|
Hongkong International Trade Finance (Holdings) Limited (in liquidation)
|
100.00
|
17
|
|
|
Household Capital Markets LLC
|
100.00
|
25
|
|
|
Household Commercial Financial Services, Inc.
|
100.00
|
26
|
|
|
Household Finance Consumer Discount Company
|
100.00
|
25
|
|
|
Household Finance Corporation II
|
100.00
|
25
|
|
|
Household Finance Corporation III
|
100.00
|
|
25
|
|
Household Finance Corporation of Alabama
|
100.00
|
224
|
|
|
Household Finance Corporation of California
|
100.00
|
25
|
|
|
Household Finance Industrial Loan Company of Iowa
|
100.00
|
225
|
|
|
Household Finance Realty Corporation of Nevada
|
100.00
|
25
|
|
|
Household Finance Realty Corporation of New York
|
100.00
|
25
|
|
|
Household Financial Center Inc.
|
100.00
|
25
|
|
|
Household Industrial Finance Company
|
100.00
|
226
|
|
|
Household Insurance Group Holding Company
|
100.00
|
227
|
|
|
Household International Europe Limited (in liquidation)
|
100.00
|
3, 40
|
|
|
Household Pooling Corporation
|
100.00
|
60
|
|
|
Household Realty Corporation
|
100.00
|
25
|
|
|
HRMG Nominees Limited
|
100.00
|
20
|
|
|
HSBC (BGF) Investments Limited
|
100.00
|
17
|
|
|
HSBC (BVI) Limited (in liquidation)
|
100.00
|
56
|
|
|
HSBC (General Partner) Limited
|
100.00
|
2, 61
|
|
|
HSBC (Guernsey) GP PCC Limited
|
100.00
|
1, 20
|
|
|
HSBC (Kuala Lumpur) Nominees Sdn Bhd
|
100.00
|
62
|
|
|
HSBC (Malaysia) Trustee Berhad
|
100.00
|
63
|
|
|
HSBC (Singapore) Nominees Pte Ltd
|
100.00
|
|
64
|
|
HSBC Administradora de Inversiones S.A.
|
100.00
|
(99.65)
|
65
|
|
HSBC Agency (India) Private Limited
|
100.00
|
66
|
|
|
HSBC Alpha Funding (UK) Holdings LP (in liquidation)
|
n/a
|
7, 67
|
|
|
HSBC Alternative Investments Limited
|
100.00
|
|
17
|
|
HSBC Amanah Malaysia Berhad
|
100.00
|
62
|
|
|
HSBC Amanah Takaful (Malaysia) Berhad
|
49.00
|
|
56, 62
|
|
HSBC Americas Corporation (Delaware)
|
100.00
|
|
25
|
|
HSBC Argentina Holdings S.A.
|
100.00
|
68
|
|
|
HSBC Asia Holdings (UK) Limited
|
100.00
|
17
|
|
|
HSBC Asia Holdings B.V.
|
100.00
|
3, 17
|
|
|
HSBC Asia Holdings Limited
|
100.00
|
2, 69
|
|
|
HSBC Asia Pacific Holdings (UK) Limited
|
100.00
|
17
|
|
|
HSBC Asset Finance (UK) Limited
|
100.00
|
17
|
|
|
HSBC Asset Finance Holdings Limited
|
100.00
|
17
|
|
|
HSBC Asset Finance M.O.G. Holdings (UK) Limited
|
100.00
|
|
17
|
|
HSBC Asset Management (India) Private Limited
|
100.00
|
(99.99)
|
3, 9, 70
|
|
HSBC Assurances Vie (France)
|
100.00
|
(99.99)
|
4, 9, 50
|
|
HSBC Australia Holdings Pty Limited
|
100.00
|
|
15
|
|
HSBC Bank (Chile)
|
100.00
|
(99.99)
|
9, 71
|
|
HSBC Bank (China) Company Limited
|
100.00
|
12, 72
|
|
|
HSBC Bank (General Partner) Limited
|
100.00
|
61
|
|
|
HSBC Bank (Mauritius) Limited
|
72.95
|
|
73
|
|
HSBC Bank (RR) (Limited Liability Company)
|
100.00
|
|
13, 74
|
|
HSBC Bank (Singapore) Limited
|
100.00
|
64
|
|
|
HSBC Bank (Taiwan) Limited
|
100.00
|
75
|
|
|
Subsidiaries
|
% of share class held by immediate parent company (or by the Group where this varies)
|
Footnotes
|
|
|
HSBC Bank (Uruguay) S.A.
|
100.00
|
76
|
|
|
HSBC Bank (Vietnam) Ltd.
|
100.00
|
77
|
|
|
HSBC Bank A.S.
|
100.00
|
78
|
|
|
HSBC Bank Argentina S.A.
|
100.00
|
(99.99)
|
79
|
|
HSBC Bank Armenia cjsc
|
70.00
|
|
80
|
|
HSBC Bank Australia Limited
|
100.00
|
|
15
|
|
HSBC Bank Bermuda Limited
|
100.00
|
21
|
|
|
HSBC Bank Canada
|
100.00
|
81
|
|
|
HSBC Bank Capital Funding (Sterling 1) LP
|
100.00
|
7, 61
|
|
|
HSBC Bank Capital Funding (Sterling 2) LP
|
100.00
|
7, 61
|
|
|
HSBC Bank Egypt S.A.E
|
94.54
|
|
82
|
|
HSBC Bank International Limited
|
100.00
|
|
83
|
|
HSBC Bank Malaysia Berhad
|
100.00
|
|
62
|
|
HSBC Bank Malta p.l.c.
|
70.03
|
|
84
|
|
HSBC Bank Middle East Limited
|
100.00
|
|
5, 85
|
|
HSBC Bank Middle East Limited, Representative Office Morocco SARL
|
100.00
|
|
86
|
|
HSBC Bank Nominee (Jersey) Limited
|
100.00
|
|
83
|
|
HSBC Bank Oman S.A.O.G.
|
51.00
|
|
87
|
|
HSBC Bank Pension Trust (UK) Limited
|
100.00
|
|
17
|
|
HSBC Bank plc
|
100.00
|
|
2, 17
|
|
HSBC Bank Polska S.A.
|
100.00
|
|
3, 88
|
|
HSBC Bank USA, National Association
|
100.00
|
|
3, 89
|
|
HSBC Branch Nominee (UK) Limited
|
100.00
|
|
17
|
|
HSBC Brasil Holding S.A.
|
100.00
|
|
90
|
|
HSBC Brasil S.A. Banco De Investimento
|
100.00
|
|
90
|
|
HSBC Broking Forex (Asia) Limited
|
100.00
|
|
69
|
|
HSBC Broking Futures (Asia) Limited
|
100.00
|
|
69
|
|
HSBC Broking Futures (Hong Kong) Limited
|
100.00
|
|
69
|
|
HSBC Broking Nominees (Asia) Limited
|
100.00
|
|
69
|
|
HSBC Broking Securities (Asia) Limited
|
100.00
|
|
69
|
|
HSBC Broking Securities (Hong Kong) Limited
|
100.00
|
|
69
|
|
HSBC Broking Services (Asia) Limited
|
100.00
|
|
69
|
|
HSBC Canada Holdings (UK) Limited
|
100.00
|
|
17
|
|
HSBC Canadian Covered Bond (Legislative) GP Inc
|
100.00
|
|
199
|
|
HSBC Capital (Canada) Inc.
|
100.00
|
|
91
|
|
HSBC Capital (USA), Inc.
|
100.00
|
|
25
|
|
HSBC Capital Funding (Dollar 1) L.P.
|
100.00
|
|
61
|
|
HSBC Capital Limited
|
100.00
|
|
69
|
|
HSBC Card Services Inc.
|
100.00
|
|
25
|
|
HSBC Casa de Bolsa, S.A. de C.V., Grupo Financiero HSBC
|
99.99
|
|
9, 16
|
|
HSBC Cayman Services Limited
|
100.00
|
|
33
|
|
HSBC City Funding Holdings
|
100.00
|
|
17
|
|
HSBC Client Holdings Nominee (UK) Limited
|
100.00
|
|
17
|
|
HSBC Client Share Offer Nominee (UK) Limited
|
100.00
|
|
17
|
|
HSBC Columbia Funding, LLC
|
100.00
|
|
25
|
|
HSBC Corporate Advisory (Malaysia) Sdn Bhd
|
100.00
|
|
62
|
|
HSBC Corporate Finance (Hong Kong) Limited
|
100.00
|
|
69
|
|
HSBC Corporate Trustee Company (UK) Limited
|
100.00
|
|
17
|
|
HSBC Credit Center, Inc.
|
100.00
|
|
25
|
|
HSBC Custody Nominees (Australia) Limited
|
100.00
|
|
15
|
|
HSBC Custody Services (Guernsey) Limited
|
100.00
|
|
20
|
|
HSBC Daisy Investments (Mauritius) Limited
|
100.00
|
|
92
|
|
HSBC Diversified Loan Fund General Partner Sarl
|
100.00
|
|
93
|
|
HSBC Electronic Data Processing (Guangdong) Limited
|
100.00
|
|
12, 94
|
|
HSBC Electronic Data Processing (Malaysia) Sdn Bhd
|
100.00
|
|
95
|
|
HSBC Electronic Data Processing (Philippines), Inc.
|
100.00
|
|
96
|
|
HSBC Electronic Data Processing India Private Limited
|
100.00
|
|
97
|
|
290
|
HSBC Holdings plc
|
|
Subsidiaries
|
% of share class held by immediate parent company (or by the Group where this varies)
|
Footnotes
|
|
|
HSBC Electronic Data Processing Lanka (Private) Limited
|
100.00
|
|
98
|
|
HSBC Electronic Data Service Delivery (Egypt) S.A.E.
|
100.00
|
|
99
|
|
HSBC Enterprise Investment Company (UK) Limited
|
100.00
|
|
17
|
|
HSBC Epargne Entreprise (France)
|
100.00
|
(99.99)
|
4, 9, 50
|
|
HSBC Equator (UK) Limited (in liquidation)
|
100.00
|
|
17
|
|
HSBC Equipment Finance (UK) Limited
|
100.00
|
|
17
|
|
HSBC Equities (Luxembourg) S.a r.l. (in liquidation)
|
100.00
|
|
1, 100
|
|
HSBC Equity (UK) Limited
|
100.00
|
|
17
|
|
HSBC Europe B.V.
|
100.00
|
|
17
|
|
HSBC European Clients Depositary Receipts Nominee (UK) Limited (in liquidation)
|
100.00
|
|
17
|
|
HSBC Executor & Trustee Company (UK) Limited
|
100.00
|
|
17
|
|
HSBC Factoring (France)
|
100.00
|
(99.99)
|
4, 9, 46
|
|
HSBC Finance (Brunei) Berhad
|
100.00
|
|
101
|
|
HSBC Finance (Netherlands)
|
100.00
|
|
2, 17
|
|
HSBC Finance Corporation
|
100.00
|
|
25
|
|
HSBC Finance Limited
|
100.00
|
|
17
|
|
HSBC Finance Mortgages Inc.
|
100.00
|
|
102
|
|
HSBC Finance Transformation (UK) Limited
|
100.00
|
|
2, 17
|
|
HSBC Financial Services (Lebanon) s.a.l.
|
99.70
|
|
103
|
|
HSBC Financial Services (Middle East) Limited (In Liquidation)
|
100.00
|
|
104
|
|
HSBC Financial Services (Uruguay) S.A. (in liquidation)
|
100.00
|
|
105
|
|
HSBC France
|
99.99
|
|
4, 46
|
|
HSBC Fund Services (Korea) Limited
|
92.95
|
|
1, 106
|
|
HSBC Funding (UK) Holdings
|
100.00
|
|
17
|
|
HSBC Germany Holdings GmbH
|
100.00
|
|
53
|
|
HSBC Gestion (Monaco) SA
|
99.80
|
|
107
|
|
HSBC Global Asset Management (Bermuda) Limited
|
100.00
|
|
21
|
|
HSBC Global Asset Management (Canada) Limited
|
100.00
|
|
108
|
|
HSBC Global Asset Management (Deutschland) GmbH
|
100.00
|
(80.67)
|
9, 53
|
|
HSBC Global Asset Management (France)
|
100.00
|
(99.99)
|
4, 9, 109
|
|
HSBC Global Asset Management
|
|||
|
(Hong Kong) Limited
|
100.00
|
|
23
|
|
HSBC Global Asset Management (International) Limited
|
100.00
|
|
110
|
|
HSBC Global Asset Management
|
|
||
|
(Japan) K. K.
|
100.00
|
|
111
|
|
HSBC Global Asset Management (Malta) Limited
|
100.00
|
(70.02)
|
112
|
|
HSBC Global Asset Management (México), S.A. de C.V., Sociedad Operadora de Fondos de Inversión, Grupo Financiero HSBC
|
99.99
|
|
9, 16
|
|
HSBC Global Asset Management (Oesterreich) GmbH
|
100.00
|
(80.67)
|
6, 9, 222
|
|
HSBC Global Asset Management (Singapore) Limited
|
100.00
|
|
64
|
|
HSBC Global Asset Management (Switzerland) AG
|
100.00
|
(90.33)
|
4, 9, 113
|
|
HSBC Global Asset Management (Taiwan) Limited
|
100.00
|
|
114
|
|
HSBC Global Asset Management (UK) Limited
|
100.00
|
|
17
|
|
HSBC Global Asset Management (USA) Inc.
|
100.00
|
|
115
|
|
HSBC Global Asset Management Holdings (Bahamas) Limited
|
100.00
|
|
116
|
|
HSBC Global Asset Management Limited
|
100.00
|
|
17
|
|
HSBC Global Custody Nominee (UK) Limited
|
100.00
|
|
17
|
|
HSBC Global Custody Proprietary Nominee (UK) Limited
|
100.00
|
|
17
|
|
HSBC Global Services (Hong Kong) Limited
|
100.00
|
|
69
|
|
Subsidiaries
|
% of share class held by immediate parent company (or by the Group where this varies)
|
Footnotes
|
|
|
HSBC Global Services (UK) Limited
|
100.00
|
|
17
|
|
HSBC Global Services Limited
|
100.00
|
|
2, 17
|
|
HSBC Global Shared Services (India) Private Limited (in liquidation)
|
100.00
|
(99.99)
|
9, 66
|
|
HSBC Group Management Services Limited
|
100.00
|
|
17
|
|
HSBC Group Nominees UK Limited
|
100.00
|
|
1, 2, 17
|
|
HSBC Holdings B.V.
|
100.00
|
|
17
|
|
HSBC Home Equity Loan Corporation II
|
100.00
|
|
25
|
|
HSBC IM Pension Trust Limited
|
100.00
|
|
1, 17
|
|
HSBC Infrastructure Limited
|
100.00
|
|
17
|
|
HSBC INKA Investment-AG TGV
|
100.00
|
(80.67)
|
9, 14, 117
|
|
HSBC Inmobiliaria (Mexico), S.A. de C.V.
|
99.99
|
|
9, 16
|
|
HSBC Institutional Trust Services (Asia) Limited
|
100.00
|
|
69
|
|
HSBC Institutional Trust Services (Bermuda) Limited
|
100.00
|
|
118
|
|
HSBC Institutional Trust Services (Ireland) DAC
|
100.00
|
|
119
|
|
HSBC Institutional Trust Services (Mauritius) Limited
|
100.00
|
|
120
|
|
HSBC Institutional Trust Services (Singapore) Limited
|
100.00
|
|
64
|
|
HSBC Insurance (Asia) Limited
|
100.00
|
|
121
|
|
HSBC Insurance (Asia-Pacific) Holdings Limited
|
100.00
|
|
122
|
|
HSBC Insurance (Bermuda) Limited
|
100.00
|
|
21
|
|
HSBC Insurance (Singapore) Pte. Limited
|
100.00
|
|
64
|
|
HSBC Insurance Agency (USA) Inc.
|
100.00
|
|
123
|
|
HSBC Insurance Brokers (Philippines) Inc
|
100.00
|
(99.99)
|
9, 124
|
|
HSBC Insurance Brokers (Taiwan) Limited
|
100.00
|
|
125
|
|
HSBC Insurance Holdings Limited
|
100.00
|
|
2, 17
|
|
HSBC Insurance Management Services Limited (in liquidation)
|
100.00
|
|
126
|
|
HSBC Insurance Services (Lebanon) S.A.L. (in liquidation)
|
97.70
|
|
9, 127
|
|
HSBC Insurance Services Holdings Limited
|
100.00
|
|
17
|
|
HSBC International Finance Corporation (Delaware)
|
100.00
|
|
128
|
|
HSBC International Financial Services (UK) Limited (in liquidation)
|
100.00
|
|
17
|
|
HSBC International Holdings (Jersey) Limited
|
100.00
|
|
83
|
|
HSBC International Nominees Limited
|
100.00
|
|
1, 129
|
|
HSBC International Trade Finance Limited (in liquidation)
|
100.00
|
|
40
|
|
HSBC International Trustee (BVI) Limited
|
100.00
|
|
10, 130
|
|
HSBC International Trustee (Holdings) Pte. Limited
|
100.00
|
|
64
|
|
HSBC International Trustee Limited
|
100.00
|
|
129
|
|
HSBC Inversiones S.A.
|
99.99
|
|
9, 71
|
|
HSBC Inversiones y Servicios Financieros Limitada
|
100.00
|
(99.99)
|
9, 71
|
|
HSBC InvestDirect (India) Limited
|
99.99
|
(99.54)
|
131
|
|
HSBC InvestDirect Financial Services (India) Limited
|
100.00
|
(99.54)
|
9, 131
|
|
HSBC InvestDirect Sales & Marketing (India) Limited
|
99.99
|
(98.54)
|
9, 66
|
|
HSBC InvestDirect Securities (India) Private Limited
|
99.99
|
(99.61)
|
9, 131
|
|
HSBC Investment Bank Holdings B.V.
|
100.00
|
|
17
|
|
HSBC Investment Bank Holdings Limited
|
100.00
|
|
17
|
|
HSBC Investment Funds (Canada) Inc.
|
100.00
|
|
108
|
|
HSBC Investment Funds (Hong Kong) Limited
|
100.00
|
|
23
|
|
HSBC Investment Funds (Luxembourg) SA
|
100.00
|
|
100
|
|
HSBC Investments (Bahamas) Limited (in liquidation)
|
100.00
|
|
133
|
|
HSBC Invoice Finance (UK) Limited
|
100.00
|
|
134
|
|
HSBC Iris Investments (Mauritius) Ltd
|
100.00
|
|
92
|
|
HSBC Issuer Services Common Depositary Nominee (UK) Limited
|
100.00
|
|
17
|
|
HSBC Holdings plc
|
291
|
Notes on the Financial Statements
|
Subsidiaries
|
% of share class held by immediate parent company (or by the Group where this varies)
|
Footnotes
|
|
|
HSBC Issuer Services Depositary Nominee (UK) Limited
|
100.00
|
|
17
|
|
HSBC Land Title Agency (USA) LLC
|
100.00
|
(55.00)
|
135
|
|
HSBC Latin America B.V.
|
100.00
|
|
17
|
|
HSBC Latin America Holdings (UK) Limited
|
100.00
|
2, 17
|
|
|
HSBC Leasing (Asia) Limited
|
100.00
|
|
69
|
|
HSBC Leasing (France)
|
100.00
|
(99.99)
|
4, 9, 45
|
|
HSBC Life (International) Limited
|
100.00
|
118
|
|
|
HSBC Life (UK) Limited
|
100.00
|
17
|
|
|
HSBC Life Assurance (Malta) Limited
|
100.00
|
(70.02)
|
112
|
|
HSBC Lodge Funding (UK) Holdings
|
100.00
|
|
17
|
|
HSBC LU Nominees Limited
|
100.00
|
17
|
|
|
HSBC Management (Guernsey) Limited
|
100.00
|
20
|
|
|
HSBC Markets (USA) Inc.
|
100.00
|
25
|
|
|
HSBC Marking Name Nominee (UK) Limited
|
100.00
|
17
|
|
|
HSBC Mexico, S.A., Institucion de Banca Multiple, Grupo Financiero HSBC
|
99.99
|
|
16
|
|
HSBC Middle East Finance Company Limited
|
100.00
|
(80.00)
|
136
|
|
HSBC Middle East Holdings B.V.
|
100.00
|
|
2, 17
|
|
HSBC Middle East Leasing Partnership
|
n/a
|
7, 9, 137
|
|
|
HSBC Middle East Securities L.L.C
|
49.00
|
|
56, 138
|
|
HSBC Mortgage Corporation (Canada)
|
100.00
|
|
81
|
|
HSBC Mortgage Corporation (USA)
|
100.00
|
|
25
|
|
HSBC Mortgage Services Inc.
|
100.00
|
|
25
|
|
HSBC Nominees (Asing) Sdn Bhd
|
100.00
|
|
62
|
|
HSBC Nominees (Hong Kong) Limited
|
100.00
|
|
69
|
|
HSBC Nominees (New Zealand) Limited
|
100.00
|
|
139
|
|
HSBC Nominees (Tempatan) Sdn Bhd
|
100.00
|
|
62
|
|
HSBC North America Holdings Inc.
|
100.00
|
|
25
|
|
HSBC Odeme Sistemleri Bilgisayar Teknolojileri Basin Yayin Ve Musteri Hizmetleri
|
100.00
|
(99.99)
|
140
|
|
HSBC Overseas Holdings (UK) Limited
|
100.00
|
|
2, 17
|
|
HSBC Overseas Investments Corporation (New York)
|
100.00
|
141
|
|
|
HSBC Overseas Nominee (UK) Limited
|
100.00
|
|
17
|
|
HSBC Participaciones (Argentina) S.A.
|
100.00
|
(99.99)
|
9, 68
|
|
HSBC PB Corporate Services 1 Limited
|
100.00
|
142
|
|
|
HSBC PB Services (Suisse) SA
|
100.00
|
143
|
|
|
HSBC Pension Trust (Ireland) DAC
|
100.00
|
119
|
|
|
HSBC Pensiones, S.A.
|
99.99
|
|
9, 144
|
|
HSBC PI Holdings (Mauritius) Limited
|
100.00
|
|
120
|
|
HSBC Portfoy Yonetimi A.S.
|
100.00
|
(99.98)
|
9, 145
|
|
HSBC Preferential LP (UK)
|
100.00
|
|
17
|
|
HSBC Private Bank (C.I.) Limited
|
100.00
|
|
20
|
|
HSBC Private Bank (Luxembourg) S.A.
|
100.00
|
|
100
|
|
HSBC Private Bank (Monaco) SA
|
100.00
|
|
4, 107
|
|
HSBC Private Bank (Suisse) SA
|
100.00
|
|
143
|
|
HSBC Private Bank (UK) Limited
|
100.00
|
|
17
|
|
HSBC Private Bank International
|
100.00
|
|
132
|
|
HSBC Private Banking Holdings (Suisse) SA
|
100.00
|
|
143
|
|
HSBC Private Banking Nominee 3 (Jersey) Limited
|
100.00
|
|
142
|
|
HSBC Private Equity Advisors LLC
|
100.00
|
|
25
|
|
HSBC Private Equity Investments (UK) Limited
|
100.00
|
|
17
|
|
HSBC Private Trustee (Hong Kong) Limited
|
100.00
|
|
69
|
|
HSBC Private Wealth Services (Canada) Inc.
|
100.00
|
|
108
|
|
HSBC Professional Services (India) Private Limited
|
100.00
|
|
66
|
|
HSBC Property (UK) Limited
|
100.00
|
|
17
|
|
HSBC Property Funds (Holding) Limited
|
100.00
|
|
17
|
|
HSBC Property Funds Investment Limited (in liquidation)
|
100.00
|
|
40
|
|
HSBC Provident Fund Trustee (Hong Kong) Limited
|
100.00
|
|
69
|
|
HSBC Qianhai Securities Limited
|
100.00
|
(51.00)
|
1, 12, 146
|
|
HSBC Rail (UK) Limited
|
100.00
|
|
17
|
|
HSBC Real Estate Leasing (France)
|
99.00
|
|
4, 9, 50
|
|
HSBC Realty Credit Corporation (USA)
|
100.00
|
|
25
|
|
Subsidiaries
|
% of share class held by immediate parent company (or by the Group where this varies)
|
Footnotes
|
|
|
HSBC REIM (France)
|
100.00
|
(99.99)
|
4, 9, 50
|
|
HSBC Representative Office (Nigeria) Limited
|
100.00
|
|
147
|
|
HSBC Retail Services Inc.
|
100.00
|
|
25
|
|
HSBC Retirement Benefits Trustee (UK) Limited
|
100.00
|
|
1, 2, 17
|
|
HSBC Savings Bank (Philippines) Inc.
|
99.99
|
|
148
|
|
HSBC Securities (Asia) Limited
|
100.00
|
|
69
|
|
HSBC Securities (B) Berhad
|
100.00
|
|
1, 101
|
|
HSBC Securities (Canada) Inc.
|
100.00
|
|
149
|
|
HSBC Securities (Egypt) S.A.E.
|
100.00
|
(94.65)
|
82
|
|
HSBC Securities (Japan) Limited
|
100.00
|
|
17
|
|
HSBC Securities (Philippines) Inc.
|
99.99
|
|
1, 9, 150
|
|
HSBC Securities (Singapore) Pte Limited
|
100.00
|
|
64
|
|
HSBC Securities (South Africa) (Pty) Limited
|
100.00
|
|
151
|
|
HSBC Securities (Taiwan) Corporation Limited
|
100.00
|
|
75
|
|
HSBC Securities (USA) Inc.
|
100.00
|
|
25
|
|
HSBC Securities and Capital Markets (India) Private Limited
|
99.99
|
|
9, 66
|
|
HSBC Securities Asia International Nominees Limited
|
100.00
|
|
152
|
|
HSBC Securities Asia Nominees Limited
|
100.00
|
|
69
|
|
HSBC Securities Brokers (Asia) Limited
|
100.00
|
|
69
|
|
HSBC Securities Investments (Asia) Limited
|
100.00
|
|
69
|
|
HSBC Securities Services (Bermuda) Limited
|
100.00
|
|
118
|
|
HSBC Securities Services (Guernsey) Limited
|
100.00
|
|
20
|
|
HSBC Securities Services (Ireland) DAC
|
100.00
|
|
119
|
|
HSBC Securities Services (Luxembourg) S.A.
|
100.00
|
|
100
|
|
HSBC Securities Services (USA) Inc.
|
100.00
|
|
153
|
|
HSBC Securities Services Holding Limited
|
100.00
|
|
129
|
|
HSBC Securities Services Holdings (Ireland) DAC
|
100.00
|
|
119
|
|
HSBC Seguros de Retiro (Argentina) S.A.
|
100.00
|
(99.99)
|
9, 68
|
|
HSBC Seguros de Vida (Argentina) S.A.
|
100.00
|
(99.99)
|
9, 68
|
|
HSBC Seguros, S.A de C.V., Grupo Financiero HSBC
|
99.99
|
|
3, 9, 144
|
|
HSBC Service Delivery (Polska) Sp. z o.o.
|
100.00
|
|
154
|
|
HSBC Services (France)
|
100.00
|
(99.99)
|
4, 9, 46
|
|
HSBC Services Japan Limited
|
100.00
|
|
133
|
|
HSBC Servicios Financieros, S.A. de C.V.
|
99.99
|
|
9, 16
|
|
HSBC Servicios, S.A. DE C.V., Grupo Financiero HSBC
|
99.99
|
|
9, 16
|
|
HSBC SFH (France)
|
100.00
|
(99.99)
|
4, 9, 50
|
|
HSBC Software Development (Canada) Inc
|
100.00
|
|
155
|
|
HSBC Software Development (Guangdong) Limited
|
100.00
|
|
12, 156
|
|
HSBC Software Development (India) Private Limited
|
100.00
|
|
157
|
|
HSBC Software Development (Malaysia) Sdn Bhd
|
100.00
|
|
95
|
|
HSBC Specialist Investments Limited
|
100.00
|
|
17
|
|
HSBC Stockbroker Services (Client Assets) Nominees Limited
|
100.00
|
|
17
|
|
HSBC Stockbrokers Nominee (UK) Limited
|
100.00
|
|
17
|
|
HSBC Taxpayer Financial Services Inc.
|
100.00
|
|
25
|
|
HSBC Technology & Services (China) Limited
|
100.00
|
|
12, 158
|
|
HSBC Technology & Services (USA) Inc.
|
100.00
|
|
25
|
|
HSBC TFS I 2005 LLC
|
100.00
|
|
32
|
|
HSBC Transaction Services GmbH
|
100.00
|
|
6, 159
|
|
HSBC Trinkaus & Burkhardt (International) S.A.
|
100.00
|
(80.67)
|
100
|
|
HSBC Trinkaus & Burkhardt AG
|
100.00
|
(80.67)
|
14, 53
|
|
HSBC Trinkaus & Burkhardt Gesellschaft fur Bankbeteiligungen mbH
|
100.00
|
(80.67)
|
53
|
|
HSBC Trinkaus Europa Immobilien-Fonds Nr. 5 GmbH
|
100.00
|
(80.67)
|
53
|
|
HSBC Trinkaus Family Office GmbH
|
100.00
|
(80.67)
|
6, 53
|
|
HSBC Trinkaus Immobilien Beteiligungs KG
|
100.00
|
(80.67)
|
53
|
|
HSBC Trinkaus Real Estate GmbH
|
100.00
|
(80.67)
|
6, 53
|
|
HSBC Trust Company (Canada)
|
100.00
|
|
81
|
|
292
|
HSBC Holdings plc
|
|
Subsidiaries
|
% of share class held by immediate parent company (or by the Group where this varies)
|
Footnotes
|
|
|
HSBC Trust Company (Delaware), National Association
|
100.00
|
1, 160
|
|
|
HSBC Trust Company (UK) Limited
|
100.00
|
|
17
|
|
HSBC Trust Company AG
|
100.00
|
|
41
|
|
HSBC Trustee (C.I.) Limited
|
100.00
|
|
142
|
|
HSBC Trustee (Cayman) Limited
|
100.00
|
|
161
|
|
HSBC Trustee (Guernsey) Limited
|
100.00
|
|
20
|
|
HSBC Trustee (Hong Kong) Limited
|
100.00
|
|
69
|
|
HSBC Trustee (Mauritius) Limited (in liquidation)
|
100.00
|
|
162
|
|
HSBC Trustee (Singapore) Limited
|
100.00
|
|
64
|
|
HSBC UK Bank plc
|
100.00
|
|
17
|
|
HSBC UK Holdings Limited
|
100.00
|
|
2, 17
|
|
HSBC USA Inc.
|
100.00
|
|
141
|
|
HSBC Valores S.A.
|
100.00
|
(99.99)
|
9, 163
|
|
HSBC Violet Investments (Mauritius) Limited
|
100.00
|
92
|
|
|
HSBC Wealth Client Nominee Limited
|
100.00
|
|
17
|
|
HSBC Yatirim Menkul Degerler A.S.
|
99.99
|
(99.98)
|
9, 145
|
|
HSI Asset Securitization Corporation
|
100.00
|
|
25
|
|
HSI International Limited
|
100.00
|
(62.14)
|
52
|
|
HSIL Investments Limited
|
100.00
|
|
17
|
|
Hubei Macheng HSBC Rural Bank Company Limited
|
100.00
|
12, 164
|
|
|
Hubei Suizhou Cengdu HSBC Rural Bank Company Limited
|
100.00
|
12, 165
|
|
|
Hubei Tianmen HSBC Rural Bank Company Limited
|
100.00
|
12, 166
|
|
|
Hunan Pingjiang HSBC Rural Bank Company Limited
|
100.00
|
12, 167
|
|
|
Imenson Limited
|
100.00
|
(62.14)
|
52
|
|
INKA Internationale Kapitalanlagegesellschaft mbH
|
100.00
|
(80.67)
|
159
|
|
Inmobiliaria Banci, S.A. de C.V.
|
100.00
|
(98.91)
|
3, 16
|
|
Inmobiliaria Bisa, S.A. de C.V.
|
100.00
|
(99.99)
|
9, 16
|
|
Inmobiliaria Grufin, S.A. de C.V.
|
100.00
|
(99.99)
|
9, 16
|
|
Inmobiliaria Guatusi, S.A. de C.V.
|
100.00
|
(99.99)
|
3, 9, 16
|
|
IRERE Property Investments (French Offices) Sarl
|
100.00
|
|
168
|
|
James Capel & Co. Limited
|
100.00
|
|
17
|
|
James Capel (Channel Islands) Nominees Limited
|
100.00
|
|
110
|
|
James Capel (Nominees) Limited
|
100.00
|
|
17
|
|
James Capel (Second Nominees) Limited (in liquidation)
|
100.00
|
|
17
|
|
James Capel (Taiwan) Nominees Limited
|
100.00
|
|
17
|
|
John Lewis Financial Services Limited
|
100.00
|
|
17
|
|
Keyser Ullmann Limited
|
100.00
|
(99.99)
|
9, 17
|
|
Kings Meadow Nominees Limited
|
100.00
|
|
169
|
|
Legend Estates Limited
|
100.00
|
17
|
|
|
Lion Corporate Services Limited
|
100.00
|
69
|
|
|
Lion International Corporate Services Limited
|
100.00
|
129
|
|
|
Lion International Management Limited
|
100.00
|
129
|
|
|
Lion Management (Hong Kong) Limited
|
100.00
|
69
|
|
|
Lyndholme Limited
|
100.00
|
69
|
|
|
Marks and Spencer Financial Services plc
|
100.00
|
169
|
|
|
Marks and Spencer Retail Financial Services Holdings Limited
|
100.00
|
169
|
|
|
Marks and Spencer Savings and Investments Limited
|
100.00
|
169
|
|
|
Marks and Spencer Unit Trust Management Limited
|
100.00
|
|
169
|
|
Maxima S.A. AFJP (in liquidation)
|
100.00
|
(99.98)
|
68
|
|
Mercantile Company Limited
|
100.00
|
17
|
|
|
Mexicana de Fomento, S.A. de C.V.
|
99.80
|
|
16
|
|
Midcorp Limited
|
100.00
|
|
17
|
|
Midland Bank (Branch Nominees) Limited
|
100.00
|
17
|
|
|
Midland Nominees Limited
|
100.00
|
17
|
|
|
MIL (Cayman) Limited
|
100.00
|
33
|
|
|
MW Gestion SA
|
100.00
|
|
68
|
|
Subsidiaries
|
% of share class held by immediate parent company (or by the Group where this varies)
|
Footnotes
|
|
|
Promocion en Bienes Raices, S.A. de C.V.
|
100.00
|
(99.19)
|
3, 9, 16
|
|
Prudential Client HSBC GIS Nominee (UK) Limited
|
100.00
|
|
17
|
|
PT Bank HSBC Indonesia
|
100.00
|
(98.93)
|
170
|
|
PT HSBC Sekuritas Indonesia
|
100.00
|
(85.00)
|
171
|
|
R/CLIP Corp.
|
100.00
|
|
25
|
|
Republic Nominees Limited
|
100.00
|
|
20
|
|
Republic Overseas Capital Corporation
|
100.00
|
123
|
|
|
RLUKREF Nominees (UK) One Limited
|
100.00
|
17
|
|
|
RLUKREF Nominees (UK) Two Limited
|
100.00
|
|
17
|
|
S.A.P.C. - Ufipro Recouvrement
|
100.00
|
(99.97)
|
11, 45
|
|
Saf Baiyun
|
100.00
|
(99.99)
|
4, 9, 47
|
|
Saf Chang Jiang
|
100.00
|
(99.99)
|
4, 9, 47
|
|
Saf Chang Jiang Shi Liu
|
100.00
|
(99.99)
|
4, 9, 47
|
|
Saf Chang Jiang Shi Wu
|
100.00
|
(99.99)
|
1, 4, 9, 47
|
|
Saf Guangzhou
|
100.00
|
(99.99)
|
4, 9, 47
|
|
Saf Zhu Jiang
|
100.00
|
(99.99)
|
4, 9, 47
|
|
Saf Zhu Jiang Yi
|
100.00
|
(99.99)
|
4, 9, 47
|
|
Saf Zhu Jiang Ba
|
100.00
|
(99.99)
|
4, 9, 47
|
|
Saf Zhu Jiang Er
|
100.00
|
(99.99)
|
4, 9, 47
|
|
Saf Zhu Jiang Jiu
|
100.00
|
(99.99)
|
4, 9, 47
|
|
Saf Zhu Jiang Liu
|
100.00
|
(99.99)
|
4, 9, 47
|
|
Saf Zhu Jiang Qi
|
100.00
|
(99.99)
|
4, 9, 47
|
|
Saf Zhu Jiang San
|
100.00
|
(99.99)
|
4, 9, 47
|
|
Saf Zhu Jiang Shi
|
100.00
|
(99.99)
|
4, 9, 47
|
|
Saf Zhu Jiang Shi Ba
|
100.00
|
(99.99)
|
4, 9, 47
|
|
Saf Zhu Jiang Shi Er
|
100.00
|
(99.99)
|
4, 9, 47
|
|
Saf Zhu Jiang Shi Jiu
|
100.00
|
(99.99)
|
4, 9, 47
|
|
Saf Zhu Jiang Shi Liu
|
100.00
|
(99.99)
|
4, 9, 47
|
|
Saf Zhu Jiang Shi Qi
|
100.00
|
(99.99)
|
4, 9, 47
|
|
Saf Zhu Jiang Shi Wu
|
100.00
|
(99.99)
|
4, 9, 47
|
|
Saf Zhu Jiang Shiyi
|
100.00
|
(99.99)
|
4, 9, 47
|
|
Saf Zhu Jiang Wu
|
100.00
|
(99.99)
|
4, 9, 47
|
|
Samada Limited
|
100.00
|
142
|
|
|
SAS Bosquet-Audrain
|
100.00
|
(94.90)
|
1, 4, 221
|
|
SAS Cyatheas Pasteur
|
100.00
|
(94.93)
|
1, 4, 45
|
|
SAS Orona
|
100.00
|
(94.92)
|
1, 4, 220
|
|
SCI HSBC Assurances Immo
|
100.00
|
(99.99)
|
1, 9, 11, 50
|
|
Secondary Club Deal I GP Limited
|
100.00
|
|
20
|
|
Secondary Club Deal II GP Limited
|
100.00
|
|
20
|
|
SFSS Nominees (Pty) Limited
|
100.00
|
|
151
|
|
Shandong Rongcheng HSBC Rural Bank Company Limited
|
100.00
|
|
12, 172
|
|
Sico Limited
|
100.00
|
|
173
|
|
SNC Dorique
|
100.00
|
(99.99)
|
1,9,11,174
|
|
SNC Kerouan
|
100.00
|
(99.99)
|
1, 9, 11, 47
|
|
SNC Les Mercuriales
|
100.00
|
(99.99)
|
1, 9, 11, 47
|
|
SNC Les Oliviers D'Antibes
|
59.99
|
|
11, 50
|
|
SNC Makala
|
100.00
|
(99.99)
|
1,9,11,47
|
|
SNC Nuku-Hiva Bail
|
100.00
|
(99.99)
|
1,9,11,47
|
|
SNCB/M6 - 2008 A
|
100.00
|
(99.99)
|
1, 4, 9, 47
|
|
SNCB/M6-2007 A
|
100.00
|
(99.99)
|
1, 4, 9, 47
|
|
SNCB/M6-2007 B
|
100.00
|
(99.99)
|
1, 4, 9, 47
|
|
Societe CCF Finance Moyen-Orient S.A.L.
|
96.64
|
(99.99)
|
4, 9, 36
|
|
Société Financière et Mobilière
|
100.00
|
(99.99)
|
4, 9, 46
|
|
Société Française et Suisse
|
100.00
|
(99.99)
|
4, 9, 47
|
|
Societe Immobiliere Atlas S.A.
|
100.00
|
|
143
|
|
Somers Dublin DAC
|
100.00
|
|
119
|
|
Somers Nominees (Far East) Limited
|
100.00
|
118
|
|
|
Sopingest
|
100.00
|
(99.99)
|
4, 9, 47
|
|
South Yorkshire Light Rail Limited
|
100.00
|
|
17
|
|
SPE 1 2005 Manager Inc.
|
100.00
|
32
|
|
|
St Cross Trustees Limited
|
100.00
|
17
|
|
|
Sun Hung Kai Development (Lujiazui III) Limited
|
100.00
|
12, 175
|
|
|
Swan National Leasing (Commercials) Limited
|
100.00
|
17
|
|
|
Swan National Limited
|
100.00
|
17
|
|
|
HSBC Holdings plc
|
293
|
Notes on the Financial Statements
|
Subsidiaries
|
% of share class held by immediate parent company (or by the Group where this varies)
|
Footnotes
|
|
|
Tasfiye Halinde HSBC Internet ve Telekomunikasyon Hizmetleri Anonim Sirketi (in liquidation)
|
100.00
|
(99.99)
|
176
|
|
Tempus Management AG (in liquidation)
|
100.00
|
|
41
|
|
Thasosfin
|
100.00
|
(99.99)
|
4, 9, 50
|
|
The Hongkong and Shanghai Banking Corporation Limited
|
100.00
|
|
69
|
|
The Venture Catalysts Limited
|
100.00
|
17
|
|
|
Timberlink Settlement Services (USA) Inc.
|
100.00
|
25
|
|
|
TKM International Limited (in liquidation)
|
100.00
|
17
|
|
|
Tooley Street View Limited
|
100.00
|
1, 2, 17
|
|
|
Tower Investment Management
|
100.00
|
|
177
|
|
Trinkaus Australien Immobilien Fonds Nr. 1 Brisbane GmbH & Co. KG
|
100.00
|
(80.67)
|
53
|
|
Trinkaus Australien Immobilien-Fonds Nr. 1 Treuhand-GmbH
|
100.00
|
(80.67)
|
6, 53
|
|
Trinkaus Canada Immobilien-Fonds Nr. 1 Verwaltungs-GmbH
|
100.00
|
(80.67)
|
53
|
|
Trinkaus Europa Immobilien-Fonds Nr.3 Objekt Utrecht Verwaltungs-GmbH
|
100.00
|
(80.67)
|
53
|
|
Trinkaus Immobilien-Fonds Geschaeftsfuehrungs-GmbH
|
100.00
|
(80.67)
|
6, 53
|
|
Trinkaus Immobilien-Fonds Verwaltungs-GmbH
|
100.00
|
(80.67)
|
6, 53
|
|
Trinkaus Private Equity Management GmbH
|
100.00
|
(80.67)
|
53
|
|
Trinkaus Private Equity Verwaltungs GmbH
|
100.00
|
(80.67)
|
6, 53
|
|
Tropical Nominees Limited
|
100.00
|
|
33
|
|
Turnsonic (Nominees) Limited
|
100.00
|
17
|
|
|
Vadep Holding AG (in liquidation)
|
100.00
|
178
|
|
|
Valeurs Mobilières Elysées
|
100.00
|
(99.99)
|
4, 9, 179
|
|
Vintage 2016 HV GP Limited (in liquidation)
|
100.00
|
|
20
|
|
Vintage 2016 KKR GP Limited (in liquidation)
|
100.00
|
20
|
|
|
Vintage 2017 Athyrium GP Limited (in liquidation)
|
100.00
|
20
|
|
|
Vintage I Secondary GP Limited (in liquidation)
|
100.00
|
20
|
|
|
Vintage III Special Situations GP Limited (in liquidation)
|
100.00
|
20
|
|
|
Wardley Limited
|
100.00
|
69
|
|
|
Wayfoong Credit Limited
|
100.00
|
69
|
|
|
Wayfoong Finance Limited
|
100.00
|
69
|
|
|
Wayfoong Nominees Limited
|
100.00
|
69
|
|
|
Wayhong (Bahamas) Limited (in liquidation)
|
100.00
|
116
|
|
|
Westminster House, LLC
|
100.00
|
25
|
|
|
Woodex Limited
|
100.00
|
21
|
|
|
Yan Nin Development Company Limited
|
62.14
|
|
52
|
Joint Ventures
The undertakings below are Joint Ventures and equity accounted.
|
Joint Ventures
|
% of share class held by immediate
parent company
(or by the Group
where this varies)
|
Footnotes
|
|
|
HCM Holdings Limited
|
50.99
|
|
40
|
|
House Network Sdn Bhd
|
25.00
|
|
180
|
|
HSBC Jintrust Fund Management Company Limited
|
49.00
|
|
12, 181
|
|
HSBC Kingdom Africa Investments (Cayman) Limited
|
50.00
|
|
182
|
|
HSBC Life Insurance Company Limited
|
50.00
|
|
183
|
|
ProServe Bermuda Limited
|
50.00
|
|
184
|
|
Vaultex UK Limited
|
50.00
|
|
186
|
|
HSBC Saudi Arabia
|
49.40
|
(69.40)
|
201
|
Associates
The undertakings below are associates and equity accounted.
|
Associates
|
% of share class held by immediate
parent company
(or by the Group
where this varies)
|
Footnotes
|
|
|
Bank of Communications Co., Ltd.
|
19.03
|
|
56, 188
|
|
Barrowgate Limited
|
24.64
|
|
189
|
|
BGF Group Limited
|
24.38
|
|
190
|
|
Canara HSBC Oriental Bank of Commerce Life Insurance Company Limited
|
26.00
|
|
191
|
|
CFAC Payment Scheme Limited
|
33.33
|
|
192
|
|
Chemi and Cotex Industries Limited
|
33.99
|
|
195
|
|
Corsair IV Financial Services Capital Partners
|
n/a
|
|
7, 219
|
|
Electronic Payment Services Company (Hong Kong) Limited
|
19.33
|
|
56, 69
|
|
EPS Company (Hong Kong) Limited
|
40.58
|
|
69
|
|
Guangzhou GuangZheng Hang Seng Securities Advisory Co. Ltd.
|
33.00
|
|
217
|
|
GZHS Research Co Ltd
|
20.50
|
|
197
|
|
Hang Seng Qianhai Fund Management Company Limited
|
43.50
|
|
9, 12, 198
|
|
HSBC Mortgage LLP
|
n/a
|
|
7, 200
|
|
HSBC TFS II 2005 LLC
|
20.00
|
|
32
|
|
InfraRed NF China Real Estate Investments LP
|
n/a
|
|
7, 214
|
|
Jeppe Star Limited
|
33.99
|
|
187
|
|
MENA Infrastructure Fund (GP) Ltd
|
33.33
|
|
203
|
|
Northstar Trade Finance Inc.
|
20.88
|
|
205
|
|
Novo Star Limited
|
33.99
|
|
206
|
|
PEF 2005 (A) & (D) Limited Partnership
|
n/a
|
|
7, 216
|
|
PEF 2010 (A) Limited Partnership
|
n/a
|
|
7, 216
|
|
Peregrine Capital Services Ltd
|
33.46
|
|
218
|
|
Quantexa Limited
|
10.00
|
|
56, 212
|
|
Services Epargne Entreprise SAS
|
14.35
|
|
56, 215
|
|
The London Gold Market Fixing Limited
|
25.00
|
|
210
|
|
The Saudi British Bank
|
40.00
|
|
211
|
|
Vizolution Limited
|
17.95
|
|
56, 213
|
|
294
|
HSBC Holdings plc
|
|
Footnotes for Note 37
|
|
|
1
|
Management has determined that these undertakings are excluded from consolidation in the Group accounts as these entities do not meet the definition of subsidiaries in accordance with IFRS. HSBC’s consolidation policy is described in Note 1.2(a).
|
|
2
|
Directly held by HSBC Holdings plc
|
|
3
|
Preference Shares
|
|
Description of Shares
|
|
|
4
|
Actions
|
|
5
|
Redeemable Preference Shares
|
|
6
|
GmbH Anteil
|
|
7
|
This undertaking is a partnership and does not have share capital
|
|
8
|
Liquidating Share Class
|
|
9
|
In the prior period the Group disclosed the immediate parent company’s interest in this undertaking
|
|
10
|
Non-Participating Voting Shares
|
|
11
|
Parts
|
|
12
|
Registered Capital Shares
|
|
13
|
Russian Limited Liability Company Shares
|
|
14
|
Stückaktien
|
|
Registered Offices
|
|
|
15
|
Level 36 Tower 1 International Towers Sydney, 100 Barangaroo Avenue, Sydney, New South Wales, Australia, 2000
|
|
16
|
Paseo de la Reforma 347, Col. Cuauhtemoc, Mexico, 06500
|
|
17
|
8 Canada Square, London, United Kingdom, E14 5HQ
|
|
18
|
5 Donegal Square South, Belfast, Northern Ireland, BT1 5JP
|
|
19
|
Camden House West The Parade, Birmingham, United Kingdom, B1 3PY
|
|
20
|
Arnold House St Julians Avenue, St Peter Port, Guernsey, GY1 3NF
|
|
21
|
37 Front Street, Hamilton, Bermuda, HM 11
|
|
22
|
PO Box 513 HSBC House, 68 West Bay Road, George Town, Grand Cayman, Cayman Islands, KY1-1106
|
|
23
|
HSBC Main Building 1 Queen's Road Central, Hong Kong
|
|
24
|
First Floor, Xinhua Bookstore Xindong Road (SE of roundabout), Miyun District, Beijing, China
|
|
25
|
c/o The Corporation Trust Company 1209 Orange Street, Wilmington, Delaware, United States, 19801
|
|
26
|
CT Corporation System 1515 Market Street, Registered Office, Philadelphia, Pennsylvania, United States, 19102
|
|
27
|
CT Corporation System 800 S. Figueroa, Los Angeles, California, United States, 90017
|
|
28
|
CT Corporation System 530 Gay Street, Knoxville, Tennessee, United States, 37902
|
|
29
|
CT Corporation System Secretary of State, 707 Virginia Street East, Charleston, West Virginia, United States, 25301
|
|
30
|
CT Corporation System 1720 Carey Avenue, Cheyenne, Wyoming, United States, 82001
|
|
31
|
95 Washington Street, Buffalo, New York, United States, 14203
|
|
32
|
1209 Orange Street, Wilmington, Delaware, United States, 19801
|
|
33
|
PO Box 1109 HSBC House, 68 West Bay Road, George Town, Grand Cayman, Cayman Islands, KY1-1102
|
|
34
|
Corporation Service Company 251 Little Falls Drive, Wilmington, Delaware, United States, 19808
|
|
35
|
Unsoeldstrasse 2, Munich, Germany, 80538
|
|
36
|
Solidere - Rue Saad Zaghloul Immeuble - 170 Marfaa, PO Box 17 5476 Mar Michael 11042040, Beyrouth, Lebanon
|
|
37
|
No 1, Bei Huan East Road Dazu County, Chongqing, China
|
|
38
|
No 107, Ping Du Avenue (E), Sanhe Town, Fengdu County, Chongqing, China
|
|
39
|
No. 3, 5, 7, Haitang Erzhi Road Changyuan, Rongchang, Chongqing, China, 402460
|
|
40
|
Hill House 1 Little New Street, London, United Kingdom, EC4A 3TR
|
|
41
|
Bederstrasse 49, Zurich, Switzerland, CH-8002
|
|
42
|
Rawlinson and Hunter Limited Woodbourne Hall, PO Box 3162, Road Town, Tortola, British Virgin Islands, VG1110
|
|
43
|
15 Rue GFirst & Second Floor, No.3 Nanshan Road, Pulandian, Dalian, Liaoning, China uynemer BP 412 Noumea 98845 Nouvelle Calédonie
|
|
44
|
CT Corporation System 225 Hillsborough Street, Raleigh, North Carolina, United States, 27603
|
|
45
|
39 rue de Bassano, Paris, France, 75008
|
|
46
|
103 avenue des Champs-Elysées, Paris, France, 75008
|
|
47
|
64 rue Galilée, Paris, France, 75008
|
|
Registered Offices
|
|
|
48
|
MMG Tower, 23 floor Ave. Paseo del Mar Urbanizacion Costa del Este, Panama
|
|
49
|
Walkers Corporate Services Limited, Walker House, 87 Mary Street, George Town, Grand Cayman KY1-9005, Cayman Islands
|
|
50
|
15 rue Vernet, Paris, France, 75008
|
|
51
|
No. 1 1211 Yanjiang Zhong Road, Yongan, Fujian, China
|
|
52
|
83 Des Voeux Road Central, Hong Kong
|
|
53
|
Königsallee 21/23, Düsseldorf, Germany, 40212
|
|
54
|
Bufete Tapia, PO Box 7412, Panama, Panama, 5
|
|
55
|
No. 44, Xin Ping Road Central, Encheng, Enping, Guangdong, China, 529400
|
|
56
|
HSBC Holdings plc exercises control or significant influence over this undertaking notwithstanding its equity interest
|
|
57
|
34/F and 36/F, Hang Seng Bank Tower, 1000 Lujiazui Ring Road 27/F, Shanghai Stock Exchange Bldg, 528 Pudong South Road, Shanghai, Shanghai, China, 200120
|
|
58
|
11-17 Ludwig-Erhard-Str., Hamburg, Germany, 20459
|
|
59
|
Akara Bldg. 24 De Castro Street, Wickhams Cay I, Road Town, Tortola, British Virgin Islands
|
|
60
|
The Corporation Trust Company of Nevada 311 S. Division Street, Carson City, Nevada, United States, 89703
|
|
61
|
HSBC House Esplanade, St. Helier, Jersey, JE4 8UB
|
|
62
|
10th Floor, North Tower 2 Leboh Ampang, Kuala Lumpur, Malaysia, 50100
|
|
63
|
13th Floor, South Tower 2 Leboh Ampang, Kuala Lumpur, Malaysia, 50100
|
|
64
|
21 Collyer Quay #13-02 HSBC Building, Singapore, 049320
|
|
65
|
Bouchard 557, Piso 18°, Cdad. Autónoma de Buenos Aires, Argentina, 1106
|
|
66
|
52/60 M G Road, Fort, Mumbai, India, 400 001
|
|
67
|
PO Box 513 HSBC House, 68 West Bay Road, George Town, Grand Cayman, Cayman Islands, KY1-1102
|
|
68
|
Florida 229, 10°, Ciudad de Buenos Aires, Argentina, C1005AAE
|
|
69
|
1 Queen's Road Central, Hong Kong
|
|
70
|
3rd Floor, Merchantile Bank Chamber 16, Veer Nariman Road, Fort, Mumbai, India, 400001
|
|
71
|
Isidora Goyenechea 2800, 23rd floor, Las Condes, Santiago, Chile, 7550647
|
|
72
|
HSBC Building Shanghai ifc, 8 Century Avenue, Pudong, Shanghai, China, 200120
|
|
73
|
6th floor, HSBC Centre, 18, Cybercity, Ebene, Mauritius
|
|
74
|
2 Paveletskaya square, building 2, Moscow, Russian Federation, 115054
|
|
75
|
13F-14F, 333 Keelung Road, Sec.1, Taipei, 110
|
|
76
|
Rincon 391, Montevideo, Uruguay, 11000
|
|
77
|
The Metropolitan 235 Dong Khoi Street, District 1, Ho Chi Minh City, Vietnam
|
|
78
|
Esentepe mah. Büyükdere Caddesi No.128 Istanbul 34394, Turkey
|
|
79
|
Florida 201, 10°, Ciudad de Buenos Aires, Argentina, C1005AAE
|
|
80
|
66 Teryan street, Yerevan, Armenia, 0009
|
|
81
|
885 West Georgia Street Suite 300, Vancouver, British Columbia, Canada, V6C 3E9
|
|
82
|
306 Corniche El Nil, Maadi, Egypt, 11728
|
|
83
|
HSBC House Esplanade, St. Helier, Jersey, JE1 1HS
|
|
84
|
116 Archbishop Street, Valletta, Malta
|
|
85
|
Level 1, Building No. 8, Gate Village Dubai International Financial Centre, PO Box 502601, United Arab Emirates
|
|
86
|
Tour Crystal 1 10EME Etage BD Al Mohades, Casablanca, Morocco
|
|
87
|
Al Khuwair Office PO Box 1727 PC111 CPO Seeb, Muscat, Oman
|
|
88
|
Rondo ONZ 1, Warsaw, Poland, 00-124
|
|
89
|
1800 Tysons Boulevard Suite 50, McLean, Virginia, United States, 22102
|
|
90
|
Rua Funchal, nº 160, SP Corporate Towers, Torre Norte, 19° andar, cj 191A - Parte, São Paulo, Brazil, 04551-060
|
|
91
|
300, 885 West Georgia Street, Vancouver, British Columbia, Canada, V6C 3E9
|
|
92
|
c/o Kross Border Trust Services Limited St. Louis Business Centre, Cnr Desroches & St Louis Streets, Port Louis, Mauritius
|
|
93
|
49 avenue J.F. Kennedy, Luxembourg, Luxembourg, 1855
|
|
94
|
4-17/F, Office Tower 2 TaiKoo Hui, No. 381 Tian He Road, Tian He District, Guangzhou, Guangdong, China
|
|
95
|
Suite 1005, 10th Floor, Wisma Hamzah Kwong Hing No. 1, Leboh Ampang, Kuala Lumpur, Malaysia, 50100
|
|
96
|
HSBC, Filinvest One Bldg, Northgate Cyberzone, Filinvest Corporate City, Alabang, Muntinlupa City, Philippines
|
|
97
|
HSBC House Plot No.8, Survey No.64 (Part), Hightec City Layout Madhapur, Hyderabad, India, 500081
|
|
98
|
439, Sri Jayawardenapura Mawatha Welikada, Rajagiriya, Colombo, Sri Lanka
|
|
HSBC Holdings plc
|
295
|
Notes on the Financial Statements
|
Registered Offices
|
|
|
99
|
Smart Village 28th Km Cairo- Alexandria Desert Road Building, Cairo, Egypt
|
|
100
|
16 Boulevard d'Avranches, Luxembourg, L-1160
|
|
101
|
HSBC Chambers, Corner of Jalan Sultan / Jalan Pemancha , Bandar Seri Begawan, Brunei Darussalam, BS8811
|
|
102
|
Suite 300, 3381 Steeles Avenue East, Toronto, Ontario, Canada, M2H 3S7
|
|
103
|
Centre Ville 1341 Building - 4th Floor Patriarche Howayek Street (facing Beirut Souks), PO Box Riad El Solh, Lebanon, 9597
|
|
104
|
3rd Floor, HSBC Bank Middle East Limited Building Al Souq Road, Bur Dubai, PO Box 4604, Dubai, United Arab Emirates
|
|
105
|
World Trade Center Montevideo Avenida Luis Alberto de Herrera 1248, Torre 1, Piso 15, Oficina 1502, Montevideo, Uruguay, CP 11300
|
|
106
|
Level 12, HSBC Building 37, Chilpae-ro, Jung-gu, Seoul, Korea, Republic of
|
|
107
|
17 avenue d'Ostende, Monaco, 98000
|
|
108
|
2910 Virtual Way, Vancouver, British Columbia, Canada, V5M 0B2
|
|
109
|
Immeuble Coeur Défense 110, Esplanade du Général de Gaulle- La défense 4, Courbevoie, France, 92400
|
|
110
|
HSBC House Esplanade, St. Helier, Jersey, JE4 8WP
|
|
111
|
HSBC Building 11-1, Nihonbashi 3-chome, Chuo-ku, Tokyo, Japan, 103-0027
|
|
112
|
80 Mill Street, Qormi, Malta, QRM 3101
|
|
113
|
Gartenstrasse 26, Zurich, Switzerland
|
|
114
|
24th Fl., 99, Sec.2, Tunhwa S. Rd., Taipei, Taiwan, Province of China
|
|
115
|
452 Fifth Avenue 7th floor, New York NY10018, United States
|
|
116
|
Mareva House 4 George Street, Nassau, Bahamas
|
|
117
|
Breite Str. 29/31, Düsseldorf, Germany, 40213
|
|
118
|
37 Front Street, Hamilton, Bermuda, HM 11
|
|
119
|
1 Grand Canal Square Grand Canal Harbour, Dublin 2, D02 P820, Ireland
|
|
120
|
HSBC Centre Eighteen, Cybercity, Ebene, Mauritius
|
|
121
|
18th Floor, Tower 1 HSBC Centre, 1 Sham Mong Road, Kowloon, Hong Kong
|
|
122
|
Level 32, HSBC Main Building 1 Queen's Road Central, Hong Kong
|
|
123
|
452 Fifth Avenue, New York NY10018, United States
|
|
124
|
9th Floor, HSBC Centre 3058 Fifth Avenue West, Bonifacio Global City, Taguig City, Philippines
|
|
125
|
16F 369 Zhongxiao East Road, Section 7 , Nangang District , Taipei, Taiwan, Province of China, 115
|
|
126
|
1 More London Place, London, United Kingdom, SE1 2AF
|
|
127
|
HSBC Building Minet El Hosn, Riad el Solh, Beirut 1107-2080, PO Box 11-1380, Lebanon
|
|
128
|
300 Delaware Avenue Suite 1400, Wilmington, Delaware, United States, 19801
|
|
129
|
Craigmuir Chambers, PO Box 71, Road Town, Tortola, British Virgin Islands
|
|
130
|
Woodbourne Hall, Road Town PO Box 916, Tortola, British Virgin Islands
|
|
131
|
9-11 Floors, NESCO IT Park Building No. 3 Western Express Highway, Goregaon (East), Mumbai, India, 400063
|
|
132
|
1441 Brickell Avenue, Miami, Florida, United States 33131
|
|
133
|
MB&H Corporate Services Ltd Mareva House, 4 George Street, Nassau, Bahamas
|
|
134
|
21 Farncombe Road, Worthing, United Kingdom, BN11 2BW
|
|
135
|
3303 Express Drive North, Islandia, New York, United States, 11749
|
|
136
|
Shop 4 & 5 Ground Floor & Mezzanine, Bldg. of Hilal Salim Bin Tarraf, Al Wasel Area, Sheikh Zayed Road, PO Box 1956 Dubai, United Arab Emirates
|
|
137
|
Precinct Building 4, Level 3 Dubai International Financial Centre, Dubai, United Arab Emirates, PO BOX 506553
|
|
138
|
HSBC Bank Middle East Building - level 5, building 5, Emaar, Dubai, United Arab Emirates, 502601
|
|
139
|
HSBC House Level 9, One Queen Street, Auckland, New Zealand, 1010
|
|
140
|
Büyükdere Cad. No.122 D Blok Esentepe Sisli Istanbul, Turkey
|
|
141
|
c/o The Corporation Trust Incorporated 351 West Camden Street, Baltimore, Maryland, United States, 21201
|
|
142
|
HSBC House Esplanade, St. Helier, Jersey, JE1 1GT
|
|
143
|
Quai des Bergues 9-17, Geneva, Switzerland, 1201
|
|
144
|
Paseo de la Reforma 359, 6th Floor, Mexico, 06500
|
|
145
|
Büyükdere Cad. No.128 D Blok Esentepe Sisli Istanbul, Turkey
|
|
146
|
Block 27 A&B, Qianhai Enterprise Dream Park No. 63 Qianwan Yi Road, Shenzhen-Hong Kong Cooperation Zone, Shenzhen, China, 518052
|
|
147
|
St Nicholas House, 10th Floor Catholic Mission St Lagos, Nigeria
|
|
148
|
Unit 1 GF The Commercial Complex Madrigal Avenue Ayala Alabang Village, Muntinlupa City, Philippines, 1770
|
|
149
|
70 York Street 7th Floor, Toronto, Ontario, Canada, M5J 1S9
|
|
150
|
7/F The Enterprise Centre - Tower I, 6766 Ayala Avenue corner Paseo De Roxas, Makati City, Philippines
|
|
151
|
2 Exchange Square 85 Maude Street, Sandown, Sandton, South Africa, 2196
|
|
Registered Offices
|
|
|
152
|
Palm Grove House PO Box 438, Road Town, Tortola, British Virgin Islands
|
|
153
|
The Corporation Trust Company 820 Bear Tavern Road, West Trenton, New Jersey, United States, 08628
|
|
154
|
Kapelanka 42A, Krakow, Poland, 30-347
|
|
155
|
Suite 2400, 745 Thurlow Street, Vancouver, Canada, BC V6E 0C5
|
|
156
|
L22, Office Tower 2, Taikoo Hui, 381 Tianhe Road, Tianhe District, Guangzhou, Guangdong, China
|
|
157
|
HSBC Centre River Side, West Avenue, 25B Raheja woods, Kalyaninagar, Pune, India, 411006
|
|
158
|
Level 19, HSBC Building, Shanghai ifc 8 Century Avenue Pudong, Shanghai, China
|
|
159
|
Yorckstraße 21 - 23 40476, Duesseldorf, Germany
|
|
160
|
300 Delaware Avenue Suite 1401, Wilmington, Delaware, United States, 19801
|
|
161
|
PO Box 484, Ground Floor, HSBC House 68 West Bay Road, Grand Cayman, KY1-1106, Cayman Islands
|
|
162
|
c/o HSBC Bank (Mauritius) Limited 6th Floor, HSBC Centre, 18 Cyber City, Ebene, Mauritius
|
|
163
|
Bouchard 680, 11°, Ciudad de Buenos Aires, Argentina, 1106
|
|
164
|
No. 56, Yu Rong Street, Macheng, China, 438300
|
|
165
|
No. 205, Lie Shan Road Suizhou, Hubei, China
|
|
166
|
Building 3, Yin Zuo Di Jing Wan Tianmen New City,Tianmen, Hubei Province, China
|
|
167
|
RM101, 102 & 106 Sunshine Fairview, Sunshine Garden, Pedestrian Walkway, Pingjiang, China
|
|
168
|
6 rue Adolphe, Luxembourg, L-1116
|
|
169
|
Kings Meadow Chester Business Park, Chester, United Kingdom, CH99 9FB
|
|
170
|
World Trade Center 1, Floor 8-9 Jalan Jenderal Sudirman Kavling 29-31, Jakarta, Indonesia, 12920
|
|
171
|
4th Floor, World Trade Center, J1, Jend. Sudirman Kav. 29-31, Jakarta, Indonesia, 12920
|
|
172
|
No.198-2, Chengshan Avenue (E), Rongcheng, China, 264300
|
|
173
|
Woodbourne Hall, Road Town PO Box 3162, Tortola, British Virgin Islands
|
|
174
|
43 rue de Paris, Saint Denis, 97400
|
|
175
|
RM 2112, HSBC Building, Shanghai ifc No. 8 Century Road, Pudong, Shanghai, China, 200120
|
|
176
|
Büyükdere Cad. No 124 kat 9 Oda 2 Esentepe ªiºli Istanbul, Turkey
|
|
177
|
11 Dr. Roy’s Drive PO Box 694GT, Grand Cayman, Cayman Islands, KY1-1107
|
|
178
|
Philippe Kaiser Baarerstrasse 8, Zug, Switzerland, 6300
|
|
179
|
109 avenue des Champs-Elysees, Paris, France, 75008
|
|
180
|
Suite 8-3A, Menara RA, No. 18, Jalan Dataran SD2,, Dataran SD, PJU 9, Bandar Sri Damansara, 52200, Malaysia
|
|
181
|
17F, HSBC Building, Shanghai ifc 8 Century Avenue, Pudong, Shanghai, China
|
|
182
|
Maples Corporate Services Limited PO Box 309, Ugland House, South Church Street, George Town, Cayman Islands, KY1-1104
|
|
183
|
18/F, HSBC Building, 8 Century Avenue China (Shanghai) Pilot Free Trade Zone, China, 200120
|
|
184
|
c/o MUFG Fund Services (Bermuda) Limited The Belvedere Building, 69 Pitts Bay Road, Pembroke, Bermuda, HM08
|
|
186
|
21 Garlick Hill, London, United Kingdom, EC4V 2AU
|
|
187
|
c/o Trident Trust Company Trident Chambers, PO Box 146, Tortola, British Virgin Islands
|
|
188
|
No.188, Yin Cheng Zhong Road China (Shanghai) Pilot Free Trade Zone, Shanghai, China
|
|
189
|
49/F, The Lee Gardens, 33 Hysan Avenue, Hong Kong
|
|
190
|
13-15 York Buildings, London, United Kingdom, WC2N 6JU
|
|
191
|
Unit No. 208, 2nd Floor, Kanchenjunga Building 18 Barakhamba Road, New Delhi - 110001, India
|
|
192
|
6th Floor 65 Gresham Street, London EC2V 7NQ
|
|
195
|
Plot No. 89-90 Mbezi Industrial Area Box 347, Dar es Salaam City
|
|
196
|
37 avenue Henri Lafleur, Nouméa, New Caledonia, BP K3 98849
|
|
197
|
1101-J46, 11/F, Nansha Financial Building 171 Haibin Road, Nansha District, Guangzhou, China
|
|
198
|
2-3/F, Unit 21A, Qianhai Enterprise Dream Park, No. 63 Qian Wan Yi Road,, Qianhai Shenzhen-Hongkong Cooperation Zone, Shenzhen, China
|
|
199
|
66 Wellington Street West, Suite 5300, Toronto, Ontario, Canada, M5K 1E6
|
|
200
|
35 Great St Helens, London, United Kingdom, EC3A 6AP
|
|
201
|
HSBC Building 7267 Olaya - Al Murrooj, Riyadh, Kingdom of Saudi Arabia, 12283 - 2255
|
|
203
|
Level 3 Building 4, Gate District, Dubai International Financial Centre, Dubai, United Arab Emirates
|
|
296
|
HSBC Holdings plc
|
|
Registered Offices
|
|
|
204
|
13th Floor, Lulu Center Building Salam Street, PO Box 44505, United Arab Emirates
|
|
205
|
833 Three Bentall Centre 595 Burrard Street, Vancouver, British Columbia, Canada, V7X 1C4
|
|
206
|
Jayla Place Wickhams Cay I, PO Box 3190, Road Town, British Virgin Islands
|
|
210
|
c/o Hackwood Secretaries Limited One Silk Street, London, United Kingdom, EC2Y 8HQ
|
|
211
|
Prince Abdulaziz Ibn Mossaad Ibn Jalawi Street, Riyadh, Kingdom of Saudi Arabia
|
|
212
|
75 Park Lane, Croydon, Surrey, United Kingdom, CR9 1XS
|
|
213
|
Ground Floor, Office Block A Bay Studio Business Park, Fabian Way, Swansea, Wales, United Kingdom, SA1 8QB
|
|
214
|
Ground Floor, Dorey Court, Admiral Park, St Peter Port Guernsey GY1 2HT
|
|
215
|
32 Rue du Champ de Tir, 44300 NANTES
|
|
216
|
1020-885 West Georgia Street, Vancouver BC, V6C3E8
|
|
217
|
11/F, J46 of Room1101,Nansha Financial Mansion, No.171 Haibin Road, Nansha Area, Guangzhou, China
|
|
218
|
Rahejas, 4th Floor, Corner of Main Avenue & V.P Road, Santacruz (West) Mumbai - 400 054
|
|
219
|
717 Fifth Avenue, New York, NY 10022
|
|
220
|
10 rue Jean Jaurès BP Q5 Noumea 98845 Nouvelle Calédonie
|
|
221
|
15 rue Guynemer BP 412 Noumea 98845 Nouvelle Calédonie
|
|
222
|
Herrengasse 1-3, 1010 Wien, Austria
|
|
223
|
2156 Horse Prairie Drive, Henderson NV 89052 United States
|
|
224
|
2 North Jackson Street, Suite 605, Montgomery AL, 36104 United States
|
|
225
|
2222 Grand Avenue, Des Moines IA 50312 United States
|
|
226
|
c/o The Corporation Trust Company, 100 S. 5th Street-Suite 1075 Minneapolis MN 55401, United States
|
|
227
|
545 Washington Blvd., 11th Floor Jersey City NJ 07310 United States
|
|
38
|
Non-statutory accounts
|
|
HSBC Holdings plc
|
297
|
Shareholder information
|
Shareholder information
|
|
|
Page
|
|
|
Fourth interim dividend for 2017
|
|
|
Interim dividends for 2017
|
|
|
2017 Annual General Meeting
|
|
|
Earnings Releases and Interim Results
|
|
|
Shareholder enquiries and communications
|
|
|
Stock symbols
|
|
|
Investor relations
|
|
|
Where more information about HSBC is available
|
|
|
Taxation of shares and dividends
|
|
|
Information about the enforceability of judgements made in the US
|
|
|
Exchange controls and other limitations affecting equity security
holders
|
302
|
|
Dividends on the ordinary shares of HSBC Holdings
|
302
|
|
American Depositary Shares
|
303
|
|
Nature of trading market
|
303
|
|
Memorandum and Articles of Association
|
304
|
|
History and development of HSBC
|
304
|
|
Differences in HSBC Holdings/New York Stock Exchange corporate
governance practices
|
304
|
|
Glossary of accounting terms and US equivalents
|
|
|
2017 HSBC 20-F reconciliation table
|
|
|
Abbreviations
|
309
|
A glossary of terms used in this
Annual Report and Accounts
can be found in
the Investor Relations section of www.hsbc.com.
the Investor Relations section of www.hsbc.com.
|
Fourth interim dividend for 2017
|
|
Footnote
|
||
|
Announcement
|
20 February 2018
|
|
|
Shares quoted ex-dividend in London, Hong Kong, Paris and Bermuda and American Depositary Shares (‘ADS’) quoted ex-dividend
in New York |
22 February 2018
|
|
|
Record date – London, Hong Kong, New York, Paris, Bermuda
|
1
|
23 February 2018
|
|
Mailing of
Annual Report and Accounts 2017
and/or
Strategic Report 2017
and dividend documentation
|
7 March 2018
|
|
|
Final date for receipt by registrars of forms of election, Investor Centre electronic instructions and revocations of standing instructions for scrip dividends
|
22 March 2018
|
|
|
Exchange rate determined for payment of dividends in sterling and Hong Kong dollars
|
26 March 2018
|
|
|
Payment date: dividend warrants, new share certificates or transaction advices and notional tax vouchers mailed and shares credited to stock accounts in CREST
|
6 April 2018
|
|
|
1
|
Removals to and from the Overseas Branch register of shareholders in Hong Kong will not be permitted on this date.
|
|
Interim dividends for 2018
|
Dividends are declared in US dollars and, at the election of the shareholder, paid in cash in one of, or in a combination of, US dollars, pounds sterling and Hong Kong dollars, or, subject to the Board’s determination that a scrip dividend is to be offered in respect of that dividend, may be satisfied in whole or in part by the issue of new shares in lieu of a cash dividend.
|
2017 Annual General Meeting
|
|
Earnings Releases and Interim Results
|
|
298
|
HSBC Holdings plc
|
|
Shareholder enquiries and communications
|
Any enquiries relating to shareholdings on the share register (for example, transfers of shares, changes of name or address, lost share certificates or dividend cheques) should be sent to the Registrars at the address given below. The Registrars offer an online facility, Investor Centre, which enables shareholders to manage their shareholding electronically.
|
Principal Register:
|
Hong Kong Overseas Branch Register:
|
Bermuda Overseas Branch Register:
|
||
|
Computershare Investor Services PLC
|
Computershare Hong Kong Investor
|
Investors Relations Team
|
||
|
The Pavilions
|
Services Limited
|
HSBC Bank Bermuda Limited
|
||
|
Bridgwater Road
|
Rooms 1712-1716, 17th
Floor
|
6 Front Street
|
||
|
Bristol BS99 6ZZ
|
Hopewell Centre
|
Hamilton HM 11
|
||
|
United Kingdom
|
183 Queen’s Road East
|
Bermuda
|
||
|
Telephone: +44 (0) 370 702 0137
|
Hong Kong
|
Telephone: +1 441 299 6737
|
||
|
Email via website:
|
Telephone: +852 2862 8555
|
Email: hbbm.shareholder.services@hsbc.bm
|
||
|
www.investorcentre.co.uk/contactus
|
Email: hsbc.ecom@computershare.com.hk
|
|||
|
Investor Centre:
|
Investor Centre:
|
Investor Centre:
|
||
|
www.investorcentre.co.uk
|
www.investorcentre.com/hk
|
www.investorcentre.com/bm
|
||
Any enquiries relating to ADSs should be sent to the depositary:
|
The Bank of New York Mellon
|
|
Shareowner Services
|
|
PO Box 505000
|
|
Louisville, KY 40233-5000
|
|
USA
|
|
Telephone (US): +1 877 283 5786
|
|
Telephone (International): +1 201 680 6825
|
|
Email: shrrelations@cpushareownerservices.com
|
|
Website: www.mybnymdr.com
|
Any enquiries relating to shares held through Euroclear France, the settlement and central depositary system for NYSE Euronext Paris, should be sent to the paying agent:
|
CACEIS Corporate Trust
|
|
14, rue Rouget de Lisle
|
|
92130 Issy-Les-Moulineaux
|
|
France
|
|
Telephone: +33 1 57 78 34 28
|
|
Email: ct-service-ost@caceis.com
|
|
Website: www.caceis.com
|
If you have elected to receive general shareholder communications directly from HSBC Holdings, it is important to remember that your main contact for all matters relating to your investment remains the registered shareholder, or custodian or broker, who administers the investment on your behalf. Therefore any changes or queries relating to your personal details and holding (including any administration of it) must continue to be directed to your existing contact at your investment manager or custodian or broker. HSBC Holdings cannot guarantee dealing with matters directed to it in error.
Further copies of this
Annual Report and Accounts 2017
may be obtained by writing to the following departments:
|
For those in Europe, the Middle East and Africa:
|
For those in Asia:
|
For those in the Americas:
|
|
Global Communications
|
Communications (Asia)
|
US Communications
|
|
HSBC Holdings plc
|
The Hongkong and Shanghai Banking
|
HSBC Bank USA, N.A.
|
|
8 Canada Square
|
Corporation Limited
|
1 West 39th Street, 9th Floor
|
|
London E14 5HQ
|
1 Queen’s Road Central
|
New York, NY 10018
|
|
United Kingdom
|
Hong Kong
|
USA
|
Electronic communications
Shareholders may at any time choose to receive corporate communications in printed form or to receive notifications of their availability on HSBC’s website. To receive notifications of the availability of a corporate communication on HSBC’s website by email, or revoke or amend an instruction to receive such notifications by email, go to www.hsbc.com/ecomms. If you provide an email address to receive electronic communications from HSBC, we will also send notifications of your dividend entitlements by email. If you received a notification of the availability of this document on HSBC’s website and would like to receive a printed copy, or if you would like to receive future corporate communications in printed form, please write or send an email (quoting your shareholder reference number) to the appropriate Registrars at the address given above. Printed copies will be provided without charge.
|
HSBC Holdings plc
|
299
|
Shareholder information
Chinese translation
A Chinese translation of this
Annual Report and Accounts 2017
will be available upon request after 7 March 2018 from the Registrars:
|
Computershare Hong Kong Investor Services Limited
|
Computershare Investor Services PLC
|
|
|
Rooms 1712-1716, 17th Floor
|
The Pavilions
|
|
|
Hopewell Centre
|
Bridgwater Road
|
|
|
183 Queen’s Road East
|
Bristol BS99 6ZZ
|
|
|
Hong Kong
|
United Kingdom
|
|
Please also contact the Registrars if you wish to receive Chinese translations of future documents, or if you have received a Chinese translation of this document and do not wish to receive them in future.

|
Stock symbols
|
|
London Stock Exchange
|
HSBA
|
Euronext Paris
|
HSB
|
|
Hong Kong Stock Exchange
|
5
|
Bermuda Stock Exchange
|
HSBC.BH
|
|
New York Stock Exchange (ADS)
|
HSBC
|
||
|
Investor relations
|
|
Richard O’Connor, Global Head of Investor Relations
|
Hugh Pye, Head of Investor Relations, Asia-Pacific
|
|
HSBC Holdings plc
|
The Hongkong and Shanghai Banking
|
|
8 Canada Square
|
Corporation Limited
|
|
London E14 5HQ
|
1 Queen’s Road Central
|
|
United Kingdom
|
Hong Kong
|
|
Telephone: +44 (0) 20 7991 6590
|
Telephone: 852 2822 4908
|
|
Email: investorrelations@hsbc.com
|
|
|
Where more information about HSBC is available
|
Reports, statements and information that HSBC Holdings files with the Securities and Exchange Commission are available at www.sec.gov. Investors can also request hard copies of these documents upon payment of a duplicating fee by writing to the SEC at the Office of Investor Education and Advocacy, 100 F Street N.E., Washington, DC 20549-0213 or by emailing PublicInfo@sec.gov. Investors should call the Commission at (1) 202 551 8090 if they require further assistance. Investors may also obtain the reports and other information that HSBC Holdings files at www.nyse.com (telephone number (1) 212 656 3000).
HM Treasury has transposed the requirements set out under CRD IV and issued the Capital Requirements Country-by-Country Reporting Regulations 2013. The legislation requires HSBC Holdings to publish additional information in respect of the year ended 31 December 2017 by 31 December 2018. This information will be available on HSBC’s website: www.hsbc.com/tax.
|
300
|
HSBC Holdings plc
|
|
Taxation of shares and dividends
|
The following is a summary, under current law, of certain UK tax considerations that are likely to be material to the ownership and disposition of HSBC Holdings ordinary shares. The summary does not purport to be a comprehensive description of all the tax considerations that may be relevant to a holder of shares. In particular, the summary deals with shareholders who are resident solely in the UK for UK tax purposes and only with holders who hold the shares as investments and who are the beneficial owners of the shares, and does not address the tax treatment of certain classes of holders such as dealers in securities. Holders and prospective purchasers should consult their own advisers regarding the tax consequences of an investment in shares in light of their particular circumstances, including the effect of any national, state or local laws.
Taxation of dividends
Currently, no tax is withheld from dividends paid by HSBC Holdings.
UK resident individuals
UK resident individuals are generally entitled to a tax-free annual allowance in respect of dividends received. The amount of the allowance is currently £5,000, but will be reduced to £2,000 from 6 April 2018. To the extent that dividend income received
by an individual in the relevant tax year does not exceed the allowance, a nil tax rate will apply. Dividend income in excess of this allowance will be taxed at 7.5% for basic rate taxpayers, 32.5% for higher rate taxpayers and 38.1% for additional rate taxpayers.
by an individual in the relevant tax year does not exceed the allowance, a nil tax rate will apply. Dividend income in excess of this allowance will be taxed at 7.5% for basic rate taxpayers, 32.5% for higher rate taxpayers and 38.1% for additional rate taxpayers.
UK resident companies
Shareholders that are within the charge to UK corporation tax should generally be entitled to an exemption from UK corporation tax on any dividends received from HSBC Holdings. However, the exemptions are not comprehensive and are subject to anti-avoidance rules.
If the conditions for exemption are not met or cease to be satisfied, or a shareholder within the charge to UK corporation tax elects for an otherwise exempt dividend to be taxable, the shareholder will be subject to UK corporation tax on dividends received from HSBC Holdings at the rate of corporation tax applicable to that shareholder.
Scrip dividends
Information on the taxation consequences of the HSBC Holdings scrip dividends offered in lieu of the 2016 fourth interim dividend and the first, second and third interim dividends for 2017 was set out in the Secretary’s letters to shareholders of 8 March, 2 June, 17 August and 25 October 2017. In no case was the difference between the cash dividend forgone and the market value of the scrip dividend in excess of 15% of the market value. Accordingly, for individual shareholders, the amount of the dividend income chargeable to tax, and the acquisition price of the HSBC Holdings ordinary shares for UK capital gains tax purposes, was the cash dividend forgone.
Taxation of capital gains
The computation of the capital gains tax liability arising on disposals of shares in HSBC Holdings by shareholders subject to UK tax on capital gains can be complex, partly depending on whether, for example, the shares were purchased since April 1991, acquired in 1991 in exchange for shares in The Hongkong and Shanghai Banking Corporation Limited, or acquired subsequent to 1991 in exchange for shares in other companies.
For capital gains tax purposes, the acquisition cost for ordinary shares is adjusted to take account of subsequent rights and capitalisation issues. Capital gains arising on a disposal by a UK company may also be adjusted to take account of indexation allowance. For assets acquired on or before 1 January 2018, legislation proposed in Finance Bill 2017-18 freezes the level of
indexation allowance that is given in calculating a company’s chargeable gains at the value that would apply to the disposal of an asset in December 2017. For assets acquired from 1 January 2018 onwards, legislation proposed in Finance Bill 2017-18 removes any indexation allowance on disposal. If in doubt, shareholders are recommended to consult their professional advisers.
Stamp duty and stamp duty reserve tax
Transfers of shares by a written instrument of transfer generally will be subject to UK stamp duty at the rate of 0.5% of the consideration paid for the transfer (rounded up to the next £5), and such stamp duty is generally payable by the transferee. An agreement to transfer shares, or any interest therein, normally will give rise to a charge to stamp duty reserve tax at the rate of 0.5% of the consideration. However, provided an instrument of transfer of the shares is executed pursuant to the agreement and duly stamped before the date on which the stamp duty reserve tax becomes payable, under the current published practice of UK HM Revenue and Customs (‘HMRC’) it will not be necessary to pay the stamp duty reserve tax, nor to apply for such tax to be cancelled. Stamp duty reserve tax is generally payable by the transferee.
Paperless transfers of shares within CREST, the UK’s paperless share transfer system, are liable to stamp duty reserve tax at the rate of 0.5% of the consideration. In CREST transactions, the tax is calculated and payment made automatically. Deposits of shares into CREST generally will not be subject to stamp duty reserve tax, unless the transfer into CREST is itself for consideration. Following the case HSBC pursued before the European Court of Justice (Case C-569/07 HSBC Holdings plc and Vidacos Nominees Ltd v The Commissioners for HM Revenue & Customs) and a subsequent case in relation to depositary receipts, HMRC accepts that the charge to stamp duty reserve tax at 1.5% on the issue of shares (and transfers integral to capital raising) to a depositary receipt issuer or a clearance service is incompatible with European Union law, and will not be imposed.
Taxation – US residents
The following is a summary, under current law, of the principal UK tax and US federal income tax considerations that are likely to be material to the ownership and disposition of shares or American Depositary Shares (‘ADSs’) by a holder that is a US holder, as defined below, and who is not resident in the UK for UK tax purposes.
The summary does not purport to be a comprehensive description of all of the tax considerations that may be relevant to a holder of shares or ADSs. In particular, the summary deals only with US holders that hold shares or ADSs as capital assets, and does not address the tax treatment of holders that are subject to special tax rules, such as banks, tax-exempt entities, insurance companies, dealers in securities or currencies, persons that hold shares or ADSs as part of an integrated investment (including a ‘straddle’ or ‘hedge’) comprised of a share or ADS and one or more other positions, and persons that own, directly or indirectly, 10% or more of the voting stock of HSBC Holdings. This discussion is based on laws, treaties, judicial decisions and regulatory interpretations in effect on the date hereof, all of which are subject to change.
For the purposes of this discussion, a ‘US holder’ is a beneficial holder that is a citizen or resident of the United States, a US domestic corporation or otherwise is subject to US federal income taxes on a net income basis in respect thereof.
Holders and prospective purchasers should consult their own advisers regarding the tax consequences of an investment in shares or ADSs in light of their particular circumstances, including the effect of any national, state or local laws.
Any US federal tax advice included in this
Annual Report and Accounts 2017
is for informational purposes only; it was not intended or written to be used, and cannot be used, for the purpose of avoiding US federal tax penalties.
|
HSBC Holdings plc
|
301
|
Shareholder information
Taxation of dividends
Currently, no tax is withheld from dividends paid by HSBC Holdings. For US tax purposes, a US holder must include cash dividends paid on the shares or ADSs in ordinary income on the date that such holder or the ADS depositary receives them, translating dividends paid in UK pounds sterling into US dollars using the exchange rate in effect on the date of receipt. A US holder that elects to receive shares in lieu of a cash dividend must include in ordinary income the fair market value of such shares on the dividend payment date, and the tax basis of those shares will equal such fair market value.
Subject to certain exceptions for positions that are held for less than 61 days, and subject to a foreign corporation being considered a ‘qualified foreign corporation’ (which includes not being classified for US federal income tax purposes as a passive foreign investment company), certain dividends (‘qualified dividends’) received by an individual US holder generally will be subject to US taxation at preferential rates. Based on the company’s audited financial statements and relevant market and shareholder data, HSBC Holdings was not and does not anticipate being classified as a passive foreign investment company. Accordingly, dividends paid on the shares or ADSs generally should be treated as qualified dividends.
Taxation of capital gains
Gains realised by a US holder on the sale or other disposition of shares or ADSs normally will not be subject to UK taxation unless at the time of the sale or other disposition the holder carries on a trade, profession or vocation in the UK through a branch or agency or permanent establishment and the shares or ADSs are or have been used, held or acquired for the purposes of such trade, profession, vocation, branch or agency or permanent establishment. Such gains will be included in income for US tax purposes, and will be long-term capital gains if the shares or ADSs were held for more than one year. A long-term capital gain realised by an individual US holder generally will be subject to US tax at preferential rates.
Inheritance tax
Shares or ADSs held by an individual whose domicile is determined to be the US for the purposes of the United States-United Kingdom Double Taxation Convention relating to estate and gift taxes (the ‘Estate Tax Treaty’) and who is not for such purposes a national of the UK will not, provided any US federal estate or gift tax chargeable has been paid, be subject to UK inheritance tax on the individual’s death or on a lifetime transfer of shares or ADSs except in certain cases where the shares or ADSs (i) are comprised in a settlement (unless, at the time of the settlement, the settlor was domiciled in the US and was not a national of the UK), (ii) are part of the business property of a UK permanent establishment of an enterprise, or (iii) pertain to a UK fixed base of an individual used for the performance of independent personal services. In such cases, the Estate Tax Treaty generally provides a credit against US federal tax liability for the amount of any tax paid in the UK in a case where the shares or ADSs are subject to both UK inheritance tax and to US federal estate or gift tax.
Stamp duty and stamp duty reserve tax – ADSs
If shares are transferred to a clearance service or American Depositary Receipt (‘ADR’) issuer (which will include a transfer of shares to the Depositary) under the current published HMRC practice, UK stamp duty and/or stamp duty reserve tax will be payable. The stamp duty or stamp duty reserve tax is generally payable on the consideration for the transfer and is payable at the aggregate rate of 1.5%.
The amount of stamp duty reserve tax payable on such a transfer will be reduced by any stamp duty paid in connection with the same transfer.
No stamp duty will be payable on the transfer of, or agreement to transfer, an ADS, provided that the ADR and any separate instrument of transfer or written agreement to transfer remain at all times outside the UK, and provided further that any such transfer or written agreement to transfer is not executed in the UK. No stamp duty reserve tax will be payable on a transfer of, or agreement to transfer, an ADS effected by the transfer of an ADR.
US backup withholding tax and information reporting
Distributions made on shares or ADSs and proceeds from the sale of shares or ADSs that are paid within the US, or through certain financial intermediaries to US holders, are subject to information reporting and may be subject to a US ‘backup’ withholding tax unless, in general, the US holder complies with certain certification procedures or is a corporation or other person exempt from such withholding. Holders that are not US taxpayers generally are not subject to information reporting or backup withholding tax, but may be required to comply with applicable certification procedures to establish that they are not US taxpayers in order to avoid the application of such information reporting requirements or backup withholding tax to payments received within the US or through certain financial intermediaries.
|
Information about the enforceability of
judgments made in the US
|
|
•
|
civil liabilities under US securities laws in original actions; or
|
|
•
|
judgments of US courts based upon these civil liability provisions.
|
In addition, awards of punitive damages in actions brought in the US or elsewhere may be unenforceable in the UK. The enforceability of any judgment in the UK will depend on the particular facts of the case as well as the laws and treaties in effect at the time.
|
Exchange controls and other limitations
affecting equity security holders
|
|
Dividends on the ordinary shares of
HSBC Holdings
|
|
302
|
HSBC Holdings plc
|
|
First
interim
|
|
Second
interim
|
|
Third
interim
|
|
Fourth
interim
1
|
|
Total
2
|
|
||
|
2017
|
$
|
0.10
|
|
0.10
|
|
0.10
|
|
||||
|
£
|
0.079
|
|
0.076
|
|
0.076
|
|
|||||
|
HK$
|
0.780
|
|
0.781
|
|
0.780
|
|
|||||
|
2016
|
$
|
0.100
|
|
0.100
|
|
0.100
|
|
0.210
|
|
0.510
|
|
|
£
|
0.075
|
|
0.077
|
|
0.080
|
|
0.171
|
|
0.403
|
|
|
|
HK$
|
0.776
|
|
0.776
|
|
0.776
|
|
1.628
|
|
3.956
|
|
|
|
2015
|
$
|
0.100
|
|
0.100
|
|
0.100
|
|
0.210
|
|
0.510
|
|
|
£
|
0.064
|
|
0.064
|
|
0.066
|
|
0.142
|
|
0.336
|
|
|
|
HK$
|
0.775
|
|
0.775
|
|
0.775
|
|
1.628
|
|
3.953
|
|
|
|
2014
|
$
|
0.100
|
|
0.100
|
|
0.100
|
|
0.200
|
|
0.500
|
|
|
£
|
0.059
|
|
0.062
|
|
0.064
|
|
0.128
|
|
0.313
|
|
|
|
HK$
|
0.775
|
|
0.777
|
|
0.776
|
|
1.551
|
|
3.879
|
|
|
|
2013
|
$
|
0.100
|
|
0.100
|
|
0.100
|
|
0.190
|
|
0.490
|
|
|
£
|
0.066
|
|
0.064
|
|
0.062
|
|
0.114
|
|
0.306
|
|
|
|
HK$
|
0.776
|
|
0.775
|
|
0.775
|
|
1.473
|
|
3.799
|
|
|
|
1
|
The fourth interim dividends have been translated into pounds sterling and Hong Kong dollars at the closing rate on 31 December. The fourth interim dividend for 2017 of $0.21 per ordinary share will be paid on 6 April 2018.
|
|
2
|
The above dividends declared are accounted for as disclosed in Note
8
on the Financial Statements.
|
|
American Depositary Shares
|
recovered in several ways: by deduction from amounts distributed; by selling a portion of distributable property; by deduction from dividend distributions; by directly invoicing the holder; or by charging the intermediaries who act for them. Fees for the holders of the HSBC ADSs include:
|
For:
|
HSBC ADS holders must pay:
|
|
Each issuance of HSBC ADSs, including as a result of a distribution of shares (including through a stock dividend, stock split or distribution of rights or other property)
|
$5.00 (or less) per 100 HSBC ADSs or portion thereof
|
|
Each cancellation of HSBC ADSs, including if the deposit agreement terminates
|
$5.00 (or less) per 100 HSBC ADSs or portion thereof
|
|
Transfer and registration of shares on our share register to/from the holder’s name to/from the name of The Bank of New York Mellon or its agent when the holder deposits or withdraws shares
|
Registration or transfer fees (of which there currently are none)
|
|
Conversion of non-US currency to US dollars
|
Charges and expenses incurred by The Bank of New York Mellon with respect to the conversion
|
|
Each cash distribution to HSBC ADS holders
|
$0.02 or less per ADS
|
|
Transfers of HSBC ordinary shares to the depositary in exchange for HSBC ADSs
|
Any applicable taxes and/or other governmental charges
|
|
Distribution of securities by the depository to HSBC ADS holders
|
A fee equivalent to the fee that would be payable if securities distributed to you had been shares and those shares had been deposited for issuance of ADSs
|
|
Any other charges incurred by the depositary or its agents for servicing shares or other securities deposited
|
As applicable
|
The depositary may generally refuse to provide fee-attracting services until its fees for those services are paid.
The depositary has agreed to reimburse us for expenses we incur, and to pay certain out-of-pocket expenses and waive certain fees, in connection with the administration, servicing and maintenance of our ADS programme. There are limits on the amount of expenses for which the depositary will reimburse us. The amount of reimbursement available is not tied to the amount of fees the depositary collects from holders of ADSs. During the year ended 31 December 2017, the depositary reimbursed, paid and/or waived fees and expenses totalling $106,980 in connection with the administration, servicing and maintenance of the programme.
HSBC Holdings ordinary shares are listed or admitted to trading on the London Stock Exchange (‘LSE’), the Hong Kong Stock Exchange (‘HKSE’), Euronext Paris, the Bermuda Stock Exchange, and on the New York Stock Exchange (‘NYSE’) in the form of ADSs. HSBC Holdings maintains its principal share register in England and overseas branch share registers in Hong Kong and Bermuda (collectively, the ‘share register’).
|
Nature of trading market
|
As at 31 December 2017, there were a total of 200,751 holders of record of HSBC Holdings ordinary shares on the share register.
As at 31 December 2017, a total of 24,173,525 of the HSBC Holdings ordinary shares were registered in the HSBC Holdings’ share register in the name of 14,007 holders of record with addresses in the US. These shares represented 0.12% of the total HSBC Holdings ordinary shares in issue.
As at 31 December 2017, there were 6,157 holders of record of ADSs holding approximately 161.3m ADSs, representing approximately 806.7m HSBC Holdings ordinary shares, 6,045 of these holders had addresses in the US, holding approximately 161.3m ADSs, representing 806.6m HSBC Holdings ordinary shares. At 31 December 2017, approximately 4.0% of the HSBC Holdings ordinary shares were represented by ADSs held by holders of record with addresses in the US.
The following table shows, for the years, calendar quarters and months indicated, the highest and lowest prices for the HSBC Holdings ordinary shares and ADSs. These are based on mid-market closing prices at close of business on the LSE, HKSE, Euronext Paris, NYSE and the Bermuda Stock Exchange. Past share price performance should not be regarded as a guide to future performance.
|
HSBC Holdings plc
|
303
|
Shareholder information
|
High and low mid-market closing prices
|
||||||||||||||||||||
|
London
|
Hong Kong
|
New York
|
Paris
|
Bermuda
|
||||||||||||||||
|
$0.50 shares
|
$0.50 shares
|
ADSs
1
|
$0.50 shares
|
$0.50 shares
|
||||||||||||||||
|
High
|
|
Low
|
|
High
|
|
Low
|
|
High
|
|
Low
|
|
High
|
|
Low
|
|
High
|
|
Low
|
|
|
|
pence
|
|
pence
|
|
HK$
|
|
HK$
|
|
$
|
|
$
|
|
euro
|
|
euro
|
|
$
|
|
$
|
|
|
|
2017
|
770
|
|
621
|
|
80.0
|
|
62.1
|
|
51.7
|
|
39.7
|
|
8.7
|
|
7.4
|
|
10.3
|
|
7.9
|
|
|
2016
|
680
|
|
416
|
|
65.8
|
|
45.8
|
|
43.0
|
|
29.3
|
|
8.0
|
|
5.1
|
|
8.1
|
|
5.8
|
|
|
2015
|
649
|
|
486
|
|
77.5
|
|
57.1
|
|
50.2
|
|
37.0
|
|
9.1
|
|
6.6
|
|
9.6
|
|
7.6
|
|
|
2014
|
681
|
|
589
|
|
86.1
|
|
72.2
|
|
56.0
|
|
46.5
|
|
8.4
|
|
7.1
|
|
11.0
|
|
9.4
|
|
|
2013
|
770
|
|
647
|
|
90.4
|
|
79.3
|
|
58.6
|
|
50.7
|
|
9.1
|
|
7.7
|
|
11.4
|
|
10.5
|
|
|
2017
|
||||||||||||||||||||
|
4th Quarter
|
769
|
|
725
|
|
80.0
|
|
75.1
|
|
51.7
|
|
48.1
|
|
8.7
|
|
8.2
|
|
10.3
|
|
9.6
|
|
|
3rd Quarter
|
770
|
|
708
|
|
79.4
|
|
72.7
|
|
50.8
|
|
46.4
|
|
8.6
|
|
7.9
|
|
9.9
|
|
8.7
|
|
|
2nd Quarter
|
716
|
|
621
|
|
72.8
|
|
62.1
|
|
46.5
|
|
39.7
|
|
8.1
|
|
7.4
|
|
8.8
|
|
7.9
|
|
|
1st Quarter
|
712
|
|
646
|
|
69.0
|
|
62.3
|
|
44.1
|
|
40.2
|
|
8.4
|
|
7.5
|
|
8.6
|
|
7.9
|
|
|
2016
|
||||||||||||||||||||
|
4th Quarter
|
680
|
|
588
|
|
65.8
|
|
57.5
|
|
43.0
|
|
37.0
|
|
8.0
|
|
6.7
|
|
8.1
|
|
7.5
|
|
|
3rd Quarter
|
589
|
|
462
|
|
60.0
|
|
46.8
|
|
38.7
|
|
30.0
|
|
6.9
|
|
5.4
|
|
7.6
|
|
6.0
|
|
|
2nd Quarter
|
472
|
|
416
|
|
52.9
|
|
45.8
|
|
34.4
|
|
29.3
|
|
6.0
|
|
5.1
|
|
6.7
|
|
5.8
|
|
|
1st Quarter
|
523
|
|
420
|
|
60.4
|
|
47.8
|
|
38.6
|
|
30.7
|
|
7.2
|
|
5.4
|
|
7.6
|
|
5.9
|
|
|
2018
|
||||||||||||||||||||
|
January
|
796
|
|
751
|
|
85.8
|
|
79.9
|
|
55.6
|
|
51.6
|
|
8.9
|
|
8.5
|
|
10.8
|
|
10.3
|
|
|
2017
|
||||||||||||||||||||
|
December
|
769
|
|
725
|
|
80.0
|
|
76.1
|
|
51.7
|
|
48.5
|
|
8.7
|
|
8.2
|
|
10.3
|
|
9.6
|
|
|
November
|
745
|
|
730
|
|
78.0
|
|
75.1
|
|
49.8
|
|
48.1
|
|
8.5
|
|
8.2
|
|
9.9
|
|
9.6
|
|
|
October
|
763
|
|
734
|
|
78.6
|
|
76.0
|
|
50.6
|
|
48.7
|
|
8.5
|
|
8.3
|
|
9.9
|
|
9.8
|
|
|
September
|
750
|
|
708
|
|
76.7
|
|
74.2
|
|
49.4
|
|
47.5
|
|
8.4
|
|
7.9
|
|
9.9
|
|
9.5
|
|
|
August
|
770
|
|
734
|
|
79.4
|
|
73.8
|
|
50.8
|
|
47.2
|
|
8.6
|
|
8.0
|
|
9.9
|
|
9.5
|
|
|
July
|
757
|
|
712
|
|
78.5
|
|
72.7
|
|
50.1
|
|
46.4
|
|
8.5
|
|
8.1
|
|
9.8
|
|
8.7
|
|
In New York each ADS represents five underlying ordinary shares.
|
Memorandum and Articles of Association
|
|
History and development of HSBC
|
|
2017
|
We became the first foreign bank to win permission for a majority-owned securities joint venture in mainland China.
|
|
2017
|
We returned a total of $3bn to shareholders through share buy-backs.
|
|
2017
|
We completed the wind-down of our US consumer and mortgage lending (‘CML’) run-off portfolio with asset sales of $7.0bn in 2017.
|
|
2017
|
Our five-year Deferred Prosecution Agreement with the US Department of Justice expired in December.
|
|
Differences in HSBC Holdings/New York Stock
Exchange corporate governance practices
|
US companies listed on the NYSE are required to adopt and disclose corporate governance guidelines. The Listing Rules of the FCA require each listed company incorporated in the UK to include in its Annual Report and Accounts a statement of how it has applied the principles of The UK Corporate Governance Code issued by the Financial Reporting Council and a statement as to whether or not it has complied with the code provisions of The UK Corporate Governance Code throughout the accounting period
covered by the Annual Report and Accounts. A company that has not complied with the code provisions, or complied with only some of the code provisions or (in the case of provisions whose requirements are of a continuing nature) complied for only part of an accounting period covered by the report, must specify the code provisions with which it has not complied, and (where relevant) for what part of the reporting period such non-compliance continued, and give reasons for any non-compliance. As stated above, HSBC Holdings complied throughout 2017 with the applicable code provisions of The UK Corporate Governance Code. The UK Corporate Governance Code does not require HSBC Holdings to disclose the full range of corporate governance guidelines with which it complies.
Under NYSE standards, companies are required to have a nominating/corporate governance committee composed entirely of directors determined to be independent in accordance with the NYSE’s corporate governance rules. All of the members of the Nomination Committee during 2017 were independent non-executive Directors, as determined in accordance with the UK Corporate Governance Code. The terms of reference of our Nomination Committee, which comply with the UK Corporate Governance Code, require a majority of members to be independent non-executive Directors. In addition to identifying individuals qualified to become Board members, a nominating/corporate governance committee must develop and recommend to the Board a set of corporate governance principles. The Nomination Committee’s terms of reference do not require it to develop and recommend corporate governance principles for HSBC Holdings, as HSBC Holdings is subject to the corporate governance principles of The UK Corporate Governance Code. The Board of Directors is responsible under its terms of reference for the development and review of Group policies and practices on corporate governance.
Under the NYSE standards, companies are required to have a compensation committee composed entirely of directors determined to be independent in accordance with the NYSE’s corporate governance rules. All of the members of the Group Remuneration Committee during 2017 were independent non-executive Directors, as determined in accordance with the UK Corporate Governance Code. The terms of reference of our Group Remuneration Committee, which comply with the UK Corporate
|
304
|
HSBC Holdings plc
|
Governance Code, require at least three members to be independent non-executive Directors. A compensation committee must review and approve corporate goals and objectives relevant to chief executive officer compensation and evaluate a chief executive officer’s performance in light of these goals and objectives. The Group Remuneration Committee’s terms of reference require it to review and approve performance-based remuneration of the executive Directors by reference to corporate goals and objectives that are set by the Board of Directors.
Pursuant to NYSE listing standards, non-management directors must meet on a regular basis without management present and independent directors must meet separately at least once per year.
The Group Chairman meets with the independent non-executive Directors without the executive Directors in attendance after each Board meeting and otherwise, as necessary. HSBC Holdings’ practice, in this regard, complies with The UK Corporate Governance Code.
In accordance with the requirements of The UK Corporate Governance Code, HSBC Holdings discloses in its Annual Report and Accounts how the Board, its committees and the Directors are evaluated (on page
185
) and provides extensive information regarding Directors’ compensation in the Directors’ Remuneration Report (on page
186
). The terms of reference of HSBC Holdings’ Group Audit, Group Nomination, Group Remuneration and Group Risk Committees are available at www.hsbc.com/investor-relations/governance/board-committees.
NYSE listing standards require US companies to adopt a code of business conduct and ethics for directors, officers and employees, and promptly disclose any waivers of the code for directors or executive officers.
In 2009, the Board endorsed three HSBC Values statements underpinned by the continued use of our Business Principles, in replacement of the Group Business Principles and Values. In addition to the HSBC Values statements and Business Principles (and previously the Group Business Principles and Values), which apply to the employees of all our companies, pursuant to the requirements of the Sarbanes-Oxley Act the Board of HSBC Holdings has adopted a Code of Ethics applicable to the Group Chairman and the Group Chief Executive, as the principal executive officers, and to the Group Finance Director and Group Chief Accounting Officer. HSBC Holdings’ Code of Ethics is available on www.hsbc.com/about-hsbc/corporate-governance/
obligations-of-senior-financial-officers or from the Group Company Secretary at 8 Canada Square, London E14 5HQ. If the Board amends or waives the provisions of the Code of Ethics, details of the amendment or waiver will appear at the same website address. During 2017, HSBC Holdings made no amendments to its Code of Ethics and granted no waivers from its provisions. The references to the standards to be followed by all employees reflect the Board’s endorsement of HSBC Values statements underpinned by the continued use of our Business Principles. The HSBC Values statements and Business Principles are available on www.hsbc.com/our-approach/our-values.
Under NYSE listing rules applicable to US companies, independent directors must comprise a majority of the board of directors. Currently, more than three-quarters of HSBC Holdings’ Directors are independent.
Under The UK Corporate Governance Code the HSBC Holdings Board determines whether a Director is independent in character and judgement and whether there are relationships or circumstances that are likely to affect, or could appear to affect, the Director’s judgement. Under the NYSE rules a director cannot qualify as independent unless the board affirmatively determines that the director has no material relationship with the listed company; in addition the NYSE rules prescribe a list of circumstances in which a director cannot be independent. The UK Corporate Governance Code requires a company’s board to assess director independence by affirmatively concluding that the director is independent of management and free from any business or other relationship that could materially interfere with the exercise of independent judgement. Lastly, a chief executive officer of a US company listed on the NYSE must annually certify that he or she is not aware of any violation by the company of NYSE corporate governance standards. In accordance with NYSE listing rules applicable to foreign private issuers, HSBC Holdings’ Group Chief Executive is not required to provide the NYSE with this annual compliance certification. However, in accordance with rules applicable to both US companies and foreign private issuers, the Group Chief Executive is required promptly to notify the NYSE in writing after any executive officer becomes aware of any material non-compliance with the NYSE corporate governance standards applicable to HSBC Holdings.
HSBC Holdings is required to submit annual and interim written affirmations of compliance with applicable NYSE corporate governance standards, similar to the affirmations required of NYSE-listed US companies.
|
HSBC Holdings plc
|
305
|
Shareholder information
|
Glossary of accounting terms and US equivalents
|
|
Accounting term
|
US equivalent or brief description
|
|
Accounts
|
Financial Statements
|
|
Articles of Association
|
Articles of incorporation
|
|
Called up share capital
|
Shares issued and fully paid
|
|
Creditors
|
Payables
|
|
Debtors
|
Receivables
|
|
Deferred tax
|
Deferred income tax
|
|
Finance lease
|
Capital lease
|
|
Freehold
|
Ownership with absolute rights in perpetuity
|
|
Interests in associates and joint ventures
|
Interests in entities over which we have significant influence or joint control, which are accounted for using the equity method
|
|
Loans and advances
|
Loans
|
|
Loan capital
|
Long-term debt
|
|
Nominal value
|
Par value
|
|
One-off
|
Non-recurring
|
|
Ordinary shares
|
Common stock
|
|
Overdraft
|
A line of credit, contractually repayable on demand unless a fixed-term has been agreed, established through a customer’s current account
|
|
Preference shares
|
Preferred stock
|
|
Premises
|
Property
|
|
Provisions
|
Liabilities of uncertain timing or amount
|
|
Share premium account
|
Additional paid-in capital
|
|
Shares in issue
|
Shares outstanding
|
|
Write-offs
|
Charge-offs
|
|
306
|
HSBC Holdings plc
|
|
Reconciliations
|
|||
|
Form 20-F Item Number and Caption
|
Location
|
Page
|
|
|
|
|||
|
1. Identity of Directors, Senior Management and Advisers
|
Not required for Annual Report
|
—
|
|
|
2. Offer Statistics and Expected Timetable
|
Not required for Annual Report
|
—
|
|
|
3. Key Information
|
|||
|
A. Selected Financial Data
|
Report of the Directors:Consolidated income statement, Consolidated balance sheet
|
33, 47
|
|
|
Shareholder Information
|
298
|
|
|
|
|
242
|
|
|
|
|
242-243
|
|
|
|
B. Capitalisation and Indebtedness
|
Not required for Annual Report
|
—
|
|
|
C. Reasons for the Offer and use of Proceeds
|
Not required for Annual Report
|
—
|
|
|
D. Risk Factors
|
Report of the Directors: Risk
|
98-106
|
|
|
4. Information on the Company
|
|||
|
A. History and Development of the Company
|
Shareholder information
|
298
|
|
|
Strategic Report
|
2-32
|
|
|
|
Report of the Directors: Financial Review
|
32-166
|
|
|
|
B. Business Overview
|
Strategic Report
|
2-32
|
|
|
Report of the Directors: Financial Review - Regulation and Supervision
|
86-93
|
|
|
|
Report of the Directors: Financial Review - Global businesses and geographical regions
|
18-22
|
|
|
|
Report of the Directors: Financial Review
|
32-166
|
|
|
|
C. Organisational Structure
|
Strategic Report
|
2-32
|
|
|
|
260-261
|
|
|
|
D. Property, Plants and Equipment
|
Not Applicable
|
—
|
|
|
4 A. Unresolved Staff Comments
|
Not Applicable
|
—
|
|
|
5. Operating and Financial Review and Prospects
|
|||
|
A. Operating Results
|
Report of the Directors: Financial Review
|
32-166
|
|
|
B. Liquidity and Capital Resources
|
Report of the Directors: Financial Review–Risk–Liquidity and Funding Risk Profile
Report of the Directors: Financial Review– Risk–Insurance Manufacturing Operations Risk Profile
|
113-117
118-120
|
|
|
|
271-275
|
|
|
|
Note 32 on the Financial Statements – Contingent liabilities, contractual commitments and guarantees
|
279
|
|
|
|
C. Research and Development, Patents and Licences, etc.
|
Not Applicable
|
—
|
|
|
D. Trend Information
|
Strategic Report
|
2-32
|
|
|
Report of the Directors: Financial Review
|
32-166
|
|
|
|
Report of the Directors: Financial Review–Risk–Top and emerging risks, Areas of special interest
|
95-98, 106
|
|
|
|
E. Off-Balance Sheet Arrangements
|
|
271-275
|
|
|
|
275-276
|
|
|
|
|
279
|
|
|
|
F. Tabular disclosure of Contractual Obligations
|
Report of the Directors: Financial Review - Contractual obligations
|
54
|
|
|
6. Directors, Senior Management and Employees
|
|||
|
A. Directors and Senior Management
|
Report of the Directors: Corporate Governance Report
|
166-185
|
|
|
B. Compensation
|
Report of the Directors: Directors’ Remuneration Report
|
186-209
|
|
|
C. Board Practices
|
Report of the Directors: Corporate Governance Report
|
166-185
|
|
|
Report of the Directors: Directors’ Remuneration Report
|
186-209
|
|
|
|
D. Employees
|
Report of the Directors: Corporate Governance Report
|
183
|
|
|
Note 5 on the Financial Statements – Employee compensation and benefits
|
233-238
|
|
|
|
E. Share Ownership
|
Report of the Directors: Corporate Governance Report
|
179-182
|
|
|
Report of the Directors: Directors’ Remuneration Report
|
198
233-238
277-278
|
|
|
|
7. Major Shareholders and Related Party Transactions
|
|||
|
A. Major Shareholders
|
Report of the Directors: Corporate Governance Report
|
181-182
|
|
|
B. Related Party Transactions
|
|
286-288
|
|
|
C. Interests of Experts and Counsel
|
Not required for Annual Report
|
—
|
|
|
8. Financial Information
|
|||
|
A. Consolidated Statements and Other Financial Information
|
Financial Statements
|
211-297
|
|
|
Report of the Independent Registered Public Accounting Firm to the Board of Directors and Shareholders of HSBC Holdings plc
|
210
|
|
|
|
Shareholder Information
|
298
|
|
|
|
HSBC Holdings plc
|
307
|
Shareholder information
|
Form 20-F Item Number and Caption
|
Location
|
Page
|
|
|
B. Significant Changes
|
|
298
|
|
|
9. The Offer and Listing
|
|||
|
A. Offer and Listing Details
|
Shareholder Information
|
300
|
|
|
B. Plan of Distribution
|
Not required for Annual Report
|
—
|
|
|
C. Markets
|
Shareholder Information
|
300
|
|
|
D. Selling Shareholders
|
Not required for Annual Report
|
—
|
|
|
E. Dilution
|
Not required for Annual Report
|
—
|
|
|
F. Expenses of the Issue
|
Not required for Annual Report
|
—
|
|
|
A. Share Capital
|
Not required for Annual Report
|
—
|
|
|
B. Memorandum and Articles of Association
|
Shareholder Information
|
304
|
|
|
C. Material Contracts
|
Report of the Directors: Directors’ Remuneration Report
|
189
|
|
|
D. Exchange Controls
|
Shareholder Information
|
302
|
|
|
E. Taxation
|
Shareholder Information
|
301
|
|
|
F. Dividends and Paying Agents
|
Not required for Annual Report
|
—
|
|
|
G. Statements by Experts
|
Not required for Annual Report
|
—
|
|
|
H. Documents on Display
|
Shareholder Information
|
300
|
|
|
I. Subsidiary Information
|
Not Applicable
|
—
|
|
|
11. Quantitative and Qualitative Disclosures About Market Risk
|
Report of the Directors: Financial Review–Risk–Market risk profile
|
150-156
|
|
|
|
253-255
|
|
|
|
|
255-256
|
|
|
|
12. Description of Securities Other than Equity Securities
|
|||
|
A. Debt Securities
|
Not required for Annual Report
|
—
|
|
|
B. Warrants and Rights
|
Not required for Annual Report
|
—
|
|
|
C. Other Securities
|
Not required for Annual Report
|
—
|
|
|
D. American Depositary Shares
|
Shareholder Information
|
303
|
|
|
|
|||
|
13. Defaults, Dividends Arrearages and Delinquencies
|
Not Applicable
|
—
|
|
|
14. Material Modifications to the Rights of Securities Holders and Use of Proceeds
|
Not Applicable
|
—
|
|
|
15. Controls and Procedures
|
Report of Independent Registered Public Accounting Firm to the Board of Directors and Shareholders of HSBC Holdings plc
|
210
|
|
|
Report of the Directors: Other information
|
79
|
|
|
|
16A. Audit Committee Financial Expert
|
Report of the Directors: Corporate Governance
|
174
|
|
|
16B. Code of Ethics
|
Shareholder Information
|
—
|
|
|
16C. Principal Accountant Fees and Services
|
|
239
|
|
|
16D. Exemptions from the Listing Standards for Audit Committees
|
Not Applicable
|
—
|
|
|
16E. Purchases of Equity Securities by the Issuer and Affiliated Purchasers
|
Report of the Directors: Corporate Governance
|
181
|
|
|
16F. Change in Registrant’s Certifying Accountant
|
Not Applicable
|
—
|
|
|
16G. Corporate Governance
|
Shareholder Information
|
304
|
|
|
|
|||
|
17. Financial Statements
|
Not Applicable
|
—
|
|
|
18. Financial Statements
|
Financial Statements
|
211-297
|
|
|
19. Exhibits (including Certifications)
|
*
|
|
|
|
308
|
HSBC Holdings plc
|
Other Information
|
Abbreviations
|
|
Currencies
|
|
|
CA$
|
Canadian dollar
|
|
EGP
|
Egyptian pound
|
|
€
|
Euro
|
|
HK$
|
Hong Kong dollar
|
|
MXN
|
Mexican peso
|
|
RMB
|
Chinese renminbi
|
|
SGD
|
Singapore dollar
|
|
$
|
United States dollar
|
|
A
|
|
|
ABS¹
|
Asset-backed security
|
|
ADR
|
American Depositary Receipt
|
|
ADS
|
American Depositary Share
|
|
AFS
|
Available for sale
|
|
AGM
|
Annual General Meeting
|
|
AIEA
|
Average interest-earning assets
|
|
ALCM
|
Asset, Liability and Capital Management
|
|
ALCO
|
Asset and Liability Management Committee
|
|
AML
|
Anti-money laundering
|
|
AML DPA
|
Five-year deferred prosecution agreement with the US Department of Justice, entered into in December 2012
|
|
APE
|
Annual Premium Equivalent
|
|
ASEAN
|
Association of Southeast Asian Nations
|
|
AT1
|
Additional tier 1
|
|
B
|
|
|
Barion
|
Barion Funding Limited, a term-funding vehicle
|
|
Basel Committee
|
Basel Committee on Banking Supervision
|
|
Basel II¹
|
2006 Basel Capital Accord
|
|
Basel III¹
|
Basel Committee’s reforms to strengthen global capital and liquidity rules
|
|
BBA
|
British Bankers’ Association
|
|
BEPS
|
The OECD Base Erosion and Profit Shifting initiative
|
|
BoCom
|
Bank of Communications Co., Limited, one of China’s largest banks
|
|
BoE
|
Bank of England
|
|
Bps¹
|
Basis points. One basis point is equal to one-hundredth of a percentage point
|
|
BRRD
|
Bank Recovery and Resolution Directive (EU)
|
|
BSA
|
Bank Secrecy Act (US)
|
|
BSM
|
Balance Sheet Management
|
|
BVI
|
British Virgin Islands
|
|
C
|
|
|
C&L
|
Credit and Lending
|
|
CCA
|
Consumer Credit Act (UK)
|
|
CAPM
|
Capital asset pricing model
|
|
CCAR
|
Federal Reserve Comprehensive Capital Analysis and Review
|
|
CCP
|
Central Counterparty
|
|
CDOs
|
Collateralised debt obligations
|
|
CDS¹
|
Credit default swap
|
|
CEA
|
Commodity Exchange Act (US)
|
|
CET1¹
|
Common equity tier 1
|
|
CFPB
|
Consumer Financial Protection Bureau
|
|
CGUs
|
Cash-generating units
|
|
CIUs
|
Collective investment undertakings
|
|
CMA
|
UK Competition and Markets Authority
|
|
CMB
|
Commercial Banking, a global business
|
|
CMC
|
Capital maintenance charge
|
|
CML¹
|
Consumer and Mortgage Lending (US)
|
|
CODM
|
Chief Operating Decision Maker
|
|
COSO
|
2013 Committee of the Sponsors of the Treadway Commission (US)
|
|
CP¹
|
Commercial paper
|
|
CRD¹
|
Capital Requirements Directive
|
|
CRR¹
|
Customer risk rating
|
|
CRR/CRD IV
|
Capital Requirements Regulation and Directive
|
|
CSA
|
Credit Support Annex
|
|
CSA
|
Credit Support Annex
|
|
CVA¹
|
Credit valuation adjustment
|
|
CVC
|
Conduct & Values Committee
|
|
D
|
|
|
Deferred Shares
|
Awards of deferred shares define the number of HSBC Holdings ordinary shares to which the employee will become entitled, generally between one and three years from the date of the award, and normally subject to the individual remaining in employment
|
|
DFAST
|
Dodd-Frank Act Stress Testing
|
|
Dodd-Frank
|
Dodd-Frank Wall Street Reform and Consumer Protection Act (US)
|
|
DoJ
|
US Department of Justice
|
|
DPF
|
Discretionary participation feature of insurance and investment contracts
|
|
DVA¹
|
Debit valuation adjustment
|
|
E
|
|
|
EAD¹
|
Exposure at default
|
|
EBA
|
European Banking Authority
|
|
EC
|
European Commission
|
|
ECB
|
European Central Bank
|
|
ECL
|
Expected credit losses
|
|
EL¹
|
Expected loss
|
|
ERISA
|
Employee Retirement Income Security Act of 1974 (US)
|
|
ESG
|
Environmental, Social and Governance
|
|
EU
|
European Union
|
|
Euribor
|
Euro interbank offered rate
|
|
EVE
|
Economic value of equity
|
|
F
|
|
|
FCA
|
Financial Conduct Authority (UK)
|
|
FCA Direction
|
Undertaking originally with the Financial Services Authority (subsequently with the Financial Conduct Authority) to comply with certain forward-looking obligations with respect to AML and sanctions requirements
|
|
FCR
|
Financial Crime Risk function
|
|
FDIA
|
Federal Deposit Insurance Act
|
|
FDIC
|
Federal Deposit Insurance Corporation
|
|
FFVA
|
Funding fair value adjustment estimation methodology on derivative contracts
|
|
Fintech
|
Financial technology
|
|
FPC
|
Financial Policy Committee (UK)
|
|
FRB
|
Federal Reserve Board (US)
|
|
FSB
|
Financial Stability Board
|
|
FSCS
|
Financial Services Compensation Scheme
|
|
FSMA
|
Financial Services and Markets Act 2000
|
|
FSVC
|
Financial System Vulnerabilities Committee
|
|
FTE
|
Full-time equivalent staff
|
|
FTSE
|
Financial Times – Stock Exchange index
|
|
FuM
|
Funds under management
|
|
FVOCI¹
|
Fair value through other comprehensive income
|
|
FVPL¹
|
Fair value through profit or loss
|
|
FX DPA
|
Three-year deferred prosecution agreement with the US Department of Justice, entered into in January 2018
|
|
G
|
|
|
GAAP
|
Generally accepted accounting principles
|
|
GAC
|
Group Audit Committee
|
|
GB&M
|
Global Banking and Markets, a global business
|
|
GCC
|
The Group Change Committee
|
|
GDP
|
Gross domestic product
|
|
GLB Act
|
Gramm-Leach-Bliley Act
|
|
GLCM
|
Global Liquidity and Cash Management
|
|
Global Markets
|
HSBC’s capital markets services in Global Banking and Markets
|
|
GMB
|
Group Management Board
|
|
GPB
|
Global Private Banking, a global business
|
|
309
|
HSBC Holdings plc
|
|
GPSP
|
Group Performance Share Plan
|
|
GRC
|
Group Risk Committee
|
|
Group
|
HSBC Holdings together with its subsidiary undertakings
|
|
GRRC
|
Group Reputational Risk Committee
|
|
G-SIB¹
|
Global systemically important bank
|
|
GSM
|
The Group’s Global Standards Manual
|
|
GTRF
|
Global Trade and Receivables Finance
|
|
H
|
|
|
Hang Seng Bank
|
Hang Seng Bank Limited, one of Hong Kong’s largest banks
|
|
HKEx
|
The Stock Exchange of Hong Kong Limited
|
|
HKMA
|
Hong Kong Monetary Authority
|
|
HMRC
|
HM Revenue and Customs
|
|
HNAH
|
HSBC North America Holdings Inc.
|
|
Holdings ALCO
|
HSBC Holdings Asset and Liability Management Committee
|
|
Hong Kong
|
Hong Kong Special Administrative Region of the People’s Republic of China
|
|
HQLA
|
High-quality liquid assets
|
|
HSBC
|
HSBC Holdings together with its subsidiary undertakings
|
|
HSBC Bank
|
HSBC Bank plc
|
|
HSBC Bank
Middle East |
HSBC Bank Middle East Limited
|
|
HSBC Bank USA
|
HSBC Bank USA, N.A., HSBC’s retail bank
in the US
|
|
HSBC Canada
|
The sub-group, HSBC Bank Canada, HSBC Trust Company Canada, HSBC Mortgage Corporation Canada and HSBC Securities Canada, consolidated for liquidity purposes
|
|
HSBC Colombia
|
HSBC Bank (Colombia) S.A.
|
|
HSBC Finance
|
HSBC Finance Corporation, the US consumer finance company (formerly Household International, Inc.)
|
|
HSBC France
|
HSBC’s French banking subsidiary, formerly CCF S.A.
|
|
HSBC Holdings
|
HSBC Holdings plc, the parent company of HSBC
|
|
HSBC Private Bank (Suisse)
|
HSBC Private Bank (Suisse) SA, HSBC’s private bank in Switzerland
|
|
HSBC USA
|
The sub-group, HSBC USA Inc (the holding company of HSBC Bank USA) and HSBC Bank USA, consolidated for liquidity purposes
|
|
HSI
|
HSBC Securities (USA) Inc.
|
|
HSSL
|
HSBC Securities Services (Luxembourg)
|
|
HTIE
|
HSBC International Trust Services (Ireland) Limited
|
|
HTM
|
Held to maturity
|
|
I
|
|
|
IA
|
Insurance Authority
|
|
IAS
|
International Accounting Standards
|
|
IASB
|
International Accounting Standards Board
|
|
ICAAP
|
Internal capital adequacy assessment process
|
|
IFRSs
|
International Financial Reporting Standards
|
|
IHC
|
Intermediate holding company
|
|
ILAAP
|
Individual liquidity adequacy assessment process
|
|
ILR
|
Inherent liquidity risk
|
|
Industrial Bank
|
Industrial Bank Co. Limited, a national joint-stock bank in mainland China in which Hang Seng Bank Limited has a shareholding
|
|
Investor Update
|
The Investor Update in June 2015
|
|
IRB¹
|
Internal ratings-based
|
|
IRRBB
|
Interest rate risk in the banking book
|
|
ISDA
|
International Swaps and Derivatives Association
|
|
K
|
|
|
KPMG
|
KPMG Audit Plc and its affiliates
|
|
L
|
|
|
LCR
|
Liquidity coverage ratio
|
|
LFRF
|
Liquidity and funding risk management framework
|
|
LGBT+
|
Lesbian, gay, bisexual and transgender. The plus sign denotes other non-mainstream groups on the spectrums of sexual orientation and gender identity
|
|
LGD¹
|
Loss given default
|
|
Libor
|
London interbank offered rate
|
|
LICs
|
Loan impairment charges and other credit risk provisions
|
|
LTI
|
Long-term incentive
|
|
LTV¹
|
Loan-to-value ratio
|
|
M
|
|
|
Madoff Securities
|
Bernard L. Madoff Investment Securities LLC
|
|
Mainland China
|
People’s Republic of China excluding Hong Kong
|
|
Malachite
|
Malachite Funding Limited, a term-funding vehicle
|
|
Mazarin
|
Mazarin Funding Limited, an asset-backed CP conduit
|
|
MBS
|
US mortgage-backed security
|
|
MENA
|
Middle East and North Africa
|
|
MOCs
|
Model Oversight Committees
|
|
Monoline
|
Monoline insurance company
|
|
MRT¹
|
Material risk taker
|
|
N
|
|
|
NGO
|
Non-governmental organisation
|
|
NII
|
Net interest income
|
|
NSFR
|
Net stable funding ratio
|
|
NYSE
|
New York Stock Exchange
|
|
O
|
|
|
OCC
|
Office of the Comptroller of the Currency (US)
|
|
OCI
|
Other comprehensive income
|
|
ORMF
|
Operational risk management framework
|
|
OTC¹
|
Over-the-counter
|
|
P
|
|
|
PD¹
|
Probability of default
|
|
Performance shares¹
|
Awards of HSBC Holdings ordinary shares under employee share plans that are subject to corporate performance conditions
|
|
Ping An
|
Ping An Insurance (Group) Company of China, Ltd, the second-largest life insurer in the PRC
|
|
POCI
|
Purchased or originated credit impaired financial assets
|
|
PPI
|
Payment protection insurance
|
|
PRA
|
Prudential Regulation Authority (UK)
|
|
PRC
|
People’s Republic of China
|
|
Principal plan
|
HSBC Bank (UK) Pension Scheme
|
|
PVIF
|
Present value of in-force long-term insurance business and long-term investment contracts with DPF
|
|
PwC
|
The member firms of the PwC network, including PricewaterhouseCoopers LLP
|
|
R
|
|
|
RAS
|
Risk appetite statement
|
|
RBWM
|
Retail Banking and Wealth Management, a global business
|
|
RC
|
The Regulatory Compliance sub-function
|
|
Repo¹
|
Sale and repurchase transaction
|
|
RRCS
|
Reputational Risk and Client Selection team
|
|
Reverse repo
|
Security purchased under commitments to sell
|
|
RMM
|
Risk Management Meeting of the Group Management Board
|
|
RNIV
|
Risk not in VaR
|
|
RoE
|
Return on equity
|
|
RoRWA
|
Return on risk-weighted assets
|
|
RoTE
|
Return on Tangible Equity
|
|
RQFII
|
Renminbi qualified foreign institutional investor
|
|
RRCS
|
Reputational Risk and Client Selection team
|
|
RWA¹
|
Risk-weighted asset
|
|
S
|
|
|
SBS
|
Security-based swap
|
|
SE¹
|
Structured entity
|
|
SEC
|
Securities and Exchange Commission (US)
|
|
ServCo group
|
Separately incorporated group of service companies planned in response to UK ring-fencing proposals
|
|
Sibor
|
Singapore Interbank Offered Rate
|
|
SIC
|
Securities investment conduit
|
|
SID
|
Senior Independent Director
|
|
SME
|
Small- and medium-sized enterprise
|
|
Solitaire
|
Solitaire Funding Limited, a special purpose entity managed by HSBC
|
|
SPE¹
|
Special purpose entity
|
|
SRR
|
A special resolution regime created by the Banking Act 2009, as amended
|
|
SSM
|
The EU’s Single Supervisory Mechanism
|
|
HSBC Holdings plc
|
310
|
Other Information
|
T
|
|
|
T1
|
Tier 1
|
|
T2
|
Tier 2
|
|
TCFD¹
|
Task Force on Climate-related Financial Disclosures
|
|
TLAC¹
|
Total loss-absorbing capacity
|
|
TSR¹
|
Total shareholder return
|
|
U
|
|
|
UAE
|
United Arab Emirates
|
|
UK
|
United Kingdom
|
|
US
|
United States of America
|
|
US run-off portfolio
|
Includes our CML, vehicle finance and Taxpayer Financial Services businesses and insurance, commercial, corporate and treasury activities in HSBC Finance on an IFRSs management basis
|
|
V
|
|
|
VaR¹
|
Value at risk
|
|
VIU
|
Value in use
|
|
1
|
A full definition is included in the glossary to
the Annual Report and Accounts 2017
which is available at www.hsbc.com/investor-relations.
|
|
HSBC Holdings plc
|
|
Incorporated in England on 1 January 1959 with
|
|
limited liability under the UK Companies Act
|
|
Registered in England: number 617987
|
|
Registered Office and Group Head Office
|
|
8 Canada Square
|
|
London E14 5HQ
|
|
United Kingdom
|
|
Telephone: 44 020 7991 8888
|
|
Facsimile: 44 020 7992 4880
|
|
Web: www.hsbc.com
|
|
Registrars
|
|
Principal Register
|
|
Computershare Investor Services PLC
|
|
The Pavilions
|
|
Bridgwater Road
|
|
Bristol BS99 6ZZ
|
|
United Kingdom
|
|
Telephone: 44 0370 702 0137
|
|
Email: via website
|
|
Web: www.investorcentre.co.uk/contactus
|
|
Hong Kong Overseas Branch Register
|
|
Computershare Hong Kong Investor Services
|
|
Limited
|
|
Rooms 1712-1716, 17th floor
|
|
Hopewell Centre
|
|
183 Queen’s Road East
|
|
Hong Kong
|
|
Telephone: 852 2862 8555
|
|
Email: hsbc.ecom@computershare.com.hk
|
|
Web: www.investorcentre.com/hk
|
|
Bermuda Overseas Branch Register
|
|
Investor Relations Team
|
|
HSBC Bank Bermuda Limited
|
|
6 Front Street
|
|
Hamilton HM11
|
|
Bermuda
|
|
Telephone: 1 441 299 6737
|
|
Email: hbbm.shareholder.services@hsbc.bm
|
|
Web: www.investorcentre.com/bm
|
|
ADR Depositary
|
|
The Bank of New York Mellon
|
|
Shareowner Services
|
|
PO Box 505000
|
|
Louisville, KY 40233-5000
|
|
USA
|
|
Telephone (US): 1 877 283 5786
|
|
Telephone (International): 1 201 680 6825
|
|
Email: shrrelations@cpushareownerservices.com
|
|
Web: www.mybnymdr.com
|
|
Paying Agent (France)
|
|
CACEIS Corporate Trust
|
|
14, rue Rouget de Lisle
|
|
92130 Issy-Les-Moulineaux
|
|
France
|
|
Telephone: 33 1 57 78 34 28
|
|
Email: ct-service-ost@caceis.com
|
|
Web: www.caceis.com
|
|
311
|
HSBC Holdings plc
|
Shareholder information
|
Stockbrokers
|
|
Goldman Sachs International
|
|
Peterborough Court
|
|
133 Fleet Street
|
|
London EC4A 2BB
|
|
United Kingdom
|
|
Credit Suisse Securities (Europe) Limited
|
|
1 Cabot Square
|
|
London E14 4QT
|
|
United Kingdom
|
|
HSBC Bank plc
|
|
8 Canada Square
|
|
London E14 5HQ
|
|
United Kingdom
|
© Copyright HSBC Holdings plc 2018
All rights reserved
No part of this publication may be reproduced, stored in a retrieval system, or transmitted, in any form or by any means, electronic, mechanical, photocopying, recording, or otherwise, without the prior written permission of HSBC Holdings plc.
Published by Global Finance, HSBC Holdings plc, London
Designed by Superunion (formerly Addison Group), London (Strategic Report) and by Global Finance with Superunion (rest of Annual Report and Accounts)
Photography
Cover, inside front cover-page 1, page
27
: Getty Images
Pages
2
-
3
: Terry Tam, The Hongkong and Shanghai Banking Corporation Limited, Hong Kong
Pages
4
(Group Chairman),
7
(Group Chief Executive): Charles Best
Pages
10
-
13
: David George, HSBC Bank Egypt S.A.E., Cairo, Egypt
Pages
18
-
21
: Ramit Soni, The Hongkong and Shanghai Banking Corporation Limited, Mumbai, India
Pages
22
-
23
: Arunabha Hajra,
The Hongkong and Shanghai Banking Corporation Limited, Mumbai, India
Pages
28
-
29
: Global Communications, HSBC Holdings plc
Pages
167
-
170
: Directors and Group Company Secretary by Charles Best; Group Chief Executive Designate by Global Communications, HSBC Holdings plc
Inside back cover: Laurie Mae Gucilatar, HSBC Electronic Data Processing (Philippines), Inc., Quezon City, Philippines
|
312
|
HSBC Holdings plc
|
Documents files as exhibits to this Form 20-F:
Exhibit Number
Description
2.1
The total amount of long-term debt securities of HSBC Holdings plc authorized under any instrument does not exceed 10 percent of the total assets of the Group on a consolidated basis. HSBC Holdings plc hereby agrees to furnish to the Commission, upon its request, a copy of any instrument defining the rights of holders of long-term debt of HSBC Holdings plc or of its subsidiaries for which consolidated or unconsolidated financial statements are required to be filed.
8.1
Subsidiaries of HSBC Holdings plc (set forth in Note 37 to the consolidated financial statements included in this Form 20-F).
|
HSBC Holdings plc
|
313
|
Shareholder information
SIGNATURES
The registrant hereby certifies that it meets all of the requirements for filing on Form 20-F and that it has duly caused and authorized the undersigned to sign this annual report on its behalf.
|
HSBC Holdings plc
|
||||
|
By:
|
/s/ Iain J Mackay
|
|||
|
Name:
|
Iain J Mackay
|
|||
|
Title:
|
Group Finance Director
|
|||
Dated: 20 February 2018
|
314
|
HSBC Holdings plc
|
TABLE OF CONTENTS
Part INote 8 on The Financial Statements - Dividends 242Note 8 on The Financial Statements - DividendsNote 9 on The Financial Statements Earnings Per Share 242-243Note 9 on The Financial Statements Earnings Per ShareNote 18 on The Financial Statements Investments in Subsidiaries 260-261Note 18 on The Financial Statements Investments in SubsidiariesNote 28 on The Financial Statements Maturity Analysis Of Assets, Liabilities and Off-balance Commitments 271-275Note 28 on The Financial Statements Maturity Analysis Of Assets, Liabilities and Off-balance CommitmentsNote 32 on The Financial Statements Contingent Liabilities, Contractual Commitments and Guarantees 279Note 32 on The Financial Statements Contingent Liabilities, Contractual Commitments and GuaranteesNote 28 on The Financial Statements Maturity Analysis Of Assets, Liabilities and Offbalance Sheet CommitmentNote 29 Notes on The Financial Statements Offsetting Of Financial Assets and Financial Liabilities 275-276Note 29 Notes on The Financial Statements Offsetting Of Financial Assets and Financial LiabilitiesNote 5 on The Financial Statements Employee Compensation and Benefits 233-238Note 5 on The Financial Statements Employee Compensation and BenefitsNote 31 on The Financial Statements Called Up Share Capital and Other Equity InstrumentsNote 35 on The Financial Statements: Related Party TransactionsNote 36 on The Financial Statements Events After The Balance Sheet DateNote 14 on The Financial Statements - Derivatives 253-255Note 14 on The Financial Statements - DerivativesNote 15 on The Financial Statements Financial Investment 255-256Note 15 on The Financial Statements Financial InvestmentPart IINote 6 on The Financial Statements - Auditors RemunerationPart IIIItem 19. Exhibits