HERSHEY CO
10-Ks and 10-Qs
|
|
|
|
|
|
|
|
|
|
|
|
|
|
|
|
|
|
|
|
|
|
|
|
|
|
|
|
|
|
|
|
|
|
|
|
|
|
|
|
|
|
|
|
|
|
|
|
|
|
|
|
|
|
|
|
UNITED STATES
SECURITIES AND EXCHANGE COMMISSION
WASHINGTON, D.C. 20549
FORM 10-K
x
Annual Report Pursuant to Section 13 or 15(d) of the Securities Exchange Act of 1934
For the fiscal year ended December 31, 2012
OR
|
¨
|
Transition Report Pursuant to Section 13 or 15(d) of the Securities Exchange Act of 1934
|
For the transition period from to
Commission File Number 1-183
THE HERSHEY COMPANY
(Exact name of registrant as specified in its charter)
|
Delaware
|
23-0691590
|
|
(State or other jurisdiction of
incorporation or organization) |
(I.R.S. Employer Identification No.)
|
|
100 Crystal A Drive, Hershey, PA
|
17033
|
|
(Address of principal executive offices)
|
(Zip Code)
|
|
Registrant’s telephone number, including area code: (717) 534-4200
|
|
|
Securities registered pursuant to Section 12(b) of the Act:
|
|
|
Title of each class
|
Name of each exchange on which registered
|
|
Common Stock, one dollar par value
|
New York Stock Exchange
|
|
Securities registered pursuant to Section 12(g) of the Act:
|
|
|
Title of class
|
|
|
Class B Common Stock, one dollar par value
|
|
Indicate by check mark if the registrant is a well-known seasoned issuer, as defined in Rule 405 of the Securities Act. Yes
x
No
¨
Indicate by check mark if the registrant is not required to file reports pursuant to Section 13 or Section 15(d) of the Act. Yes
¨
No
x
Indicate by check mark whether the registrant (1) has filed all reports required to be filed by Section 13 or 15(d) of the Securities Exchange Act of 1934 during the preceding 12 months (or for such shorter period that the registrant was required to file such reports), and (2) has been subject to such filing requirements for the past 90 days. Yes
x
No
¨
Indicate by check mark whether the registrant has submitted electronically and posted on its corporate Web site, if any, every Interactive Data File required to be submitted and posted pursuant to Rule 405 of Regulation S-T (§232.405 of this chapter) during the preceding 12 months (or for such shorter period that the registrant was required to submit and post such files). Yes
x
No
¨
Indicate by check mark if disclosure of delinquent filers pursuant to Item 405 of Regulation S-K (§229.405 of this chapter) is not contained herein, and will not be contained, to the best of registrant’s knowledge, in definitive proxy or information statements incorporated by reference in Part III of this Form 10-K or any amendment to this Form 10-K.
¨
Indicate by check mark whether the registrant is a large accelerated filer, an accelerated filer, a non-accelerated filer, or a smaller reporting company. See the definitions of “large accelerated filer,” “accelerated filer” and “smaller reporting company” in Rule 12b-2 of the Exchange Act. (Check one)
Large accelerated filer
x
Accelerated filer
¨
Non-accelerated filer
¨
Smaller reporting company
¨
(Do not check if a smaller reporting company)
Indicate by check mark whether the registrant is a shell company (as defined in Rule 12b-2 of the Exchange Act). Yes
¨
No
x
State the aggregate market value of the voting and non-voting common equity held by non-affiliates computed by reference to the price at which the common equity was last sold, or the average bid and asked price of such common equity, as of the last business day of the registrant’s most recently completed second fiscal quarter.
Common Stock, one dollar par value—$10,983,764,663 as of June 29, 2012.
Class B Common Stock, one dollar par value—$1,289,697 as of June 29, 2012. While the Class B Common Stock is not listed for public trading on any exchange or market system, shares of that class are convertible into shares of Common Stock at any time on a share-for-share basis. The market value indicated is calculated based on the closing price of the Common Stock on the New York Stock Exchange on June 29, 2012.
Indicate the number of shares outstanding of each of the registrant’s classes of common stock as of the latest practicable date.
Common Stock, one dollar par value—163,458,859 shares, as of February 6, 2013.
Class B Common Stock, one dollar par value—60,628,737 shares, as of February 6, 2013.
DOCUMENTS INCORPORATED BY REFERENCE
Portions of the Company’s Proxy Statement for the Company’s 2013 Annual Meeting of Stockholders are incorporated by reference into Part III of this report.
|
Item 1.
|
BUSINESS
|
The Hershey Company was incorporated under the laws of the State of Delaware on October 24, 1927 as a successor to a business founded in 1894 by Milton S. Hershey. In this report, the terms “Company,” “we,” “us,” or “our” mean The Hershey Company and its wholly-owned subsidiaries and entities in which it has a controlling financial interest, unless the context indicates otherwise.
We are the largest producer of quality chocolate in North America and a global leader in chocolate and sugar confectionery. Our principal product groups include chocolate and sugar confectionery products; pantry items, such as baking ingredients, toppings and beverages; and gum and mint refreshment products.
Reportable Segment
We operate as a single reportable segment in manufacturing, marketing, selling and distributing our products under more than 80 brand names. Our three operating segments comprise geographic regions including the United States, the Americas, and Asia, Europe, the Middle East and Africa (“AEMEA”). We market our products in approximately 70 countries worldwide.
For segment reporting purposes, we aggregate our operations in the United States and in the Americas, which includes Canada, Mexico, Brazil, Central and South America, Puerto Rico and our exports business in this region. We base this aggregation on similar economic characteristics; products and services; production processes; types or classes of customers; distribution methods; and the similar nature of the regulatory environment in each location. We aggregate our AEMEA operations with the United States and the Americas to form one reportable segment. Our AEMEA operations share most of the aggregation criteria and represent less than 10% of our consolidated revenues, operating profits and assets.
Organization
We operate under a matrix reporting structure designed to ensure continued focus on North America and on continuing our transformation into a more global company. Our business is organized around geographic regions and strategic business units. It is designed to enable us to build processes for repeatable success in our global markets.
Our geographic regions are accountable for delivering our annual financial plans. The key regions are:
|
Ÿ
|
The United States;
|
|
Ÿ
|
The Americas, including Canada, Mexico, Brazil, Central and South America, Puerto Rico and exports to this region; and
|
|
Ÿ
|
AEMEA, including Asia, Europe, the Middle East, Africa and exports to these geographical areas.
|
In addition, The Hershey Experience manages our retail operations globally, including Hershey’s Chocolate World Stores in Hershey, Pennsylvania, New York City, San Francisco, Chicago, Shanghai, Niagara Falls (Ontario), Dubai, and Singapore.
Our two strategic business units are the chocolate business unit and the sweets and refreshment business unit. These strategic business units focus on certain components of our product line and are responsible for building and leveraging the Company’s global brands, and disseminating best demonstrated practices around the world.
Business Acquisition
In January 2012, we acquired all of the outstanding stock of Brookside Foods Ltd. (“Brookside”), a privately held confectionery company based in Abbottsford, British Columbia, Canada. As part of this transaction, we acquired two production facilities located in British Columbia and Quebec. The Brookside product line is primarily sold in the U.S. and Canada in a take home re-sealable pack type. At the time of the acquisition, annual net sales of the business were approximately $90 million. The business complements our position in North America and we are making investments in manufacturing capabilities and conducting market research that will enable future growth.
1
Products
United States
The primary products we sell in the United States include the following:
|
Under the
HERSHEY’S
brand franchise:
|
|||
|
HERSHEY’S
milk chocolate bar
|
HERSHEY’S BLISS
chocolates
|
||
|
HERSHEY’S
milk chocolate with almonds bar
|
HERSHEY’S COOKIES ‘N’ CRÈME
candy bar
|
||
|
HERSHEY’S
Extra Dark pure dark chocolate
|
HERSHEY’S COOKIES ‘N’ CRÈME DROPS
candy
|
||
|
HERSHEY’S NUGGETS
chocolates
|
HERSHEY’S POT OF GOLD
boxed chocolates
|
||
|
HERSHEY’S DROPS
chocolates
|
HERSHEY’S
sugar free chocolate candy
|
||
|
HERSHEY’S AIR DELIGHT
aerated
milk
chocolate
|
HERSHEY’S HUGS
candies
|
||
|
HERSHEY’S MINIATURES
chocolate candy
|
HERSHEY'S SIMPLE PLEASURES
candy
|
||
|
Under the
REESE’S
brand franchise:
|
|
|
REESE’S
peanut butter cups
|
REESE’S
sugar free peanut butter cups
|
|
REESE’S
peanut butter cups minis
|
REESE’S
crispy and crunchy bar
|
|
REESE’S
PIECES
candy
|
REESE’S WHIPPS
candy bar
|
|
REESE’S
BIG
CUP
peanut butter cups
|
REESESTICKS
wafer bars
|
|
REESE’S
NUTRAGEOUS
candy bar
|
REESE’S FAST BREAK
candy bar
|
|
Under the
KISSES
brand franchise:
|
|
HERSHEY’S KISSES
brand milk chocolates
|
|
HERSHEY’S KISSES
brand milk chocolates with almonds
|
|
HERSHEY’S KISSES
brand milk chocolates with cherry cordial crème
|
|
HERSHEY’S KISSES
brand chocolate meltaway milk chocolates
|
|
HERSHEY’S KISSES
brand milk chocolates filled with caramel
|
|
HERSHEY’S KISSES
brand
SPECIAL DARK
mildly sweet chocolates
|
2
Our other products we sell in the United States include the following:
|
5
th
AVENUE
candy bar
|
ROLO
minis
|
|
ALMOND JOY
candy bar
|
SKOR
toffee bar
|
|
ALMOND JOY PIECES
candy
|
SPECIAL DARK
mildly sweet chocolate bar
|
|
BROOKSIDE
chocolate covered real fruit juice pieces
|
SPECIAL DARK PIECES
candy
|
|
CADBURY
chocolates
|
SYMPHONY
milk chocolate bar
|
|
CARAMELLO
candy bar
|
SYMPHONY
milk chocolate bar with almonds and toffee
|
|
GOOD & PLENTY
candy
|
TAKE5
candy bar
|
|
HEATH
toffee bar
|
THINGAMAJIG
candy bar
|
|
JOLLY RANCHER
candy
|
TWIZZLERS
candy
|
|
JOLLY RANCHER CRUNCH 'N CHEW
candy
|
TWIZZLERS
sugar free candy
|
|
JOLLY RANCHER
sugar free candy
|
WHATCHAMACALLIT
candy bar
|
|
KIT KAT
wafer bar
|
WHOPPERS
malted milk balls
|
|
MAUNA LOA
macadamia snack nuts
|
YORK
peppermint pattie
|
|
MILK DUDS
candy
|
YORK
sugar free peppermint pattie
|
|
MOUNDS
candy bar
|
YORK PIECES
candy
|
|
MR. GOODBAR
chocolate bar
|
ZAGNUT
candy bar
|
|
PAYDAY
peanut caramel bar
|
ZERO
candy bar
|
|
ROLO
caramels in milk chocolate
|
|
We also sell products in the United States under the following product lines:
Premium products
Artisan Confections Company, a wholly-owned subsidiary of The Hershey Company, markets
SCHARFFEN BERGER
high-cacao dark chocolate products, and
DAGOBA
natural and organic chocolate products. Our
SCHARFFEN BERGER
products include chocolate bars, tasting squares and home baking products.
DAGOBA
products include chocolate bars, drinking chocolate and baking products.
Refreshment products
Our line of refreshment products includes
ICE BREAKERS
mints and chewing gum,
ICE BREAKERS ICE CUBES
chewing gum,
BREATH SAVERS
mints, and
BUBBLE YUM
bubble gum.
Pantry items
Pantry items include
HERSHEY’S, REESE’S, HEATH
, and
SCHARFFEN BERGER
baking products. Our toppings and sundae syrups include
REESE’S
,
HEATH
and
HERSHEY’S
. We sell hot cocoa mix under the
HERSHEY’S BLISS
brand name.
Americas
The primary products we sell in the Americas include the following:
Canada
In Canada we sell
HERSHEY’S
milk chocolate bars and milk chocolate with almonds bars;
OH HENRY!
candy bars;
REESE PEANUT BUTTER CUPS
candy;
HERSHEY’S KISSES
brand milk chocolates;
TWIZZLERS
candy;
GLOSETTE
chocolate-covered raisins, peanuts and almonds;
JOLLY RANCHER
candy;
WHOPPERS
malted milk balls;
SKOR
toffee bars;
EAT MORE
candy bars;
POT OF GOLD
boxed chocolates;
BROOKSIDE
chocolate-covered fruit, real fruit juice pieces and nuts; and
CHIPITS
chocolate chips.
Mexico
We manufacture, import, market, sell and distribute chocolate, sweets, refreshment and beverage products in Mexico, under the
HERSHEY’S
,
KISSES
,
JOLLY RANCHER
and
PELÓN PELO RICO
brands.
3
Brazil
We manufacture, import and market chocolate, sweets and refreshment products in Brazil, including
HERSHEY’S
chocolate and confectionery items and
IO-IO
items
.
Exports
We also import, market, sell and distribute chocolate, sweets and refreshment products in Central America and Puerto Rico, and export products to other countries in the Americas.
Asia, Europe, Middle East and Africa
We manufacture, market, sell and distribute sugar confectionery, beverage and cooking oil products in India, including
NUTRINE
and
MAHA LACTO
confectionery products and
JUMPIN
and
SOFIT
beverage products. We market, sell and distribute chocolate products in China, primarily under the
HERSHEY’S
and
KISSES
brands. We market, sell and distribute chocolate products in the Middle East, primarily under the
HERSHEY’S, REESE’S
and
KISSES
brands. We license the
VAN HOUTEN
brand name and related trademarks to sell chocolate products, cocoa, and baking products in Asia and the Middle East for the retail and duty-free distribution channels. We also export products to countries in the Asia, Europe, Middle East and Africa regions.
Customers
Full-time sales representatives and food brokers sell our products to our customers. Our customers are mainly wholesale distributors, chain grocery stores, mass merchandisers, chain drug stores, vending companies, wholesale clubs, convenience stores, dollar stores, concessionaires and department stores. Our customers then resell our products to end-consumers in retail outlets in North America and other locations worldwide. In 2012, sales to McLane Company, Inc., one of the largest wholesale distributors in the United States to convenience stores, drug stores, wholesale clubs and mass merchandisers, amounted to approximately 22.2% of our total net sales. McLane Company, Inc. is the primary distributor of our products to Wal-Mart Stores, Inc.
Marketing Strategy and Seasonality
The foundation of our marketing strategy is our strong brand equities, product innovation and the consistently superior quality of our products. We devote considerable resources to the identification, development, testing, manufacturing and marketing of new products. We have a variety of promotional programs for our customers as well as advertising and promotional programs for consumers of our products. We use our promotional programs to stimulate sales of certain products at various times throughout the year. Our sales are typically higher during the third and fourth quarters of the year, representing seasonal and holiday-related sales patterns.
Product Distribution
In conjunction with our sales and marketing efforts, our efficient product distribution network helps us maintain sales growth and provide superior customer service. We plan optimum stock levels and work with our customers to set reasonable delivery times. Our distribution network provides for the efficient shipment of our products from our manufacturing plants to strategically located distribution centers. We primarily use common carriers to deliver our products from these distribution points to our customers.
Price Changes
We change prices and weights of our products when necessary to accommodate changes in costs, the competitive environment and profit objectives, while at the same time maintaining consumer value. Price increases and weight changes help to offset increases in our input costs, including raw and packaging materials, fuel, utilities, transportation, and employee benefits.
Usually there is a time lag between the effective date of list price increases and the impact of the price increases on net sales. The impact of price increases is often delayed because we honor previous commitments to planned consumer and customer promotions and merchandising events subsequent to the effective date of the price increases. In addition, promotional allowances may be increased subsequent to the effective date, delaying or partially offsetting the impact of price increases on net sales.
4
In March 2011, we announced a weighted-average increase in wholesale prices of approximately 9.7% across the majority of our U.S., Puerto Rico and export portfolio, effective immediately. The price increase applied to our instant consumable, multi-pack, packaged candy and grocery lines. Direct buying customers were able to purchase transitional amounts of product into May, and seasonal net price realization did not occur until Easter 2012.
Raw Materials
Cocoa products are the most significant raw materials we use to produce our chocolate products. Cocoa products, including cocoa liquor, cocoa butter and cocoa powder processed from cocoa beans, are used to meet manufacturing requirements. Cocoa products are purchased directly from third-party suppliers. These third-party suppliers source cocoa beans which are grown principally in Far Eastern, West African and South American equatorial regions to produce the cocoa products which we purchase. West Africa accounts for approximately 70% of the world’s supply of cocoa beans.
Historically, there have been instances of adverse weather, crop disease, political unrest, and other problems in cocoa-producing countries that have caused price fluctuations, but have never resulted in total loss of a particular producing country’s cocoa crop and/or exports. In the event that such a disruption would occur in any given country, we believe cocoa from other producing countries and from current physical cocoa stocks in consuming countries would provide a significant supply buffer.
During 2012, the average cocoa futures contract prices decreased compared with 2011, and traded in a range between $1.17 and $1.00 per pound, based on the IntercontinentalExchange futures contract. After trading at 37-year highs in early 2011, cocoa prices moderated in 2012. The table below shows annual average cocoa futures prices, and the highest and lowest monthly averages for each of the calendar years indicated. The prices are the monthly averages of the quotations at noon of the three active futures trading contracts closest to maturity on the IntercontinentalExchange.
|
Cocoa Futures Contract Prices
(dollars per pound)
|
||||||||||||||||||||
|
2012
|
2011
|
2010
|
2009
|
2008
|
||||||||||||||||
|
Annual Average
|
$
|
1.07
|
|
$
|
1.34
|
|
$
|
1.36
|
|
$
|
1.28
|
|
$
|
1.19
|
|
|||||
|
High
|
1.17
|
|
1.55
|
|
1.53
|
|
1.52
|
|
1.50
|
|
||||||||||
|
Low
|
1.00
|
|
0.99
|
|
1.26
|
|
1.10
|
|
0.86
|
|
||||||||||
Source: International Cocoa Organization Quarterly Bulletin of Cocoa Statistics
Our costs will not necessarily reflect market price fluctuations because of our forward purchasing and hedging practices, premiums and discounts reflective of varying delivery times, and supply and demand for our specific varieties and grades of cocoa liquor, cocoa butter and cocoa powder. As a result, the average futures contract prices are not necessarily indicative of our average costs.
The Food, Conservation and Energy Act of 2008, impacts the prices of sugar, corn, peanuts and dairy products because it sets price support levels for these commodities.
During 2012, prices for fluid dairy milk ranged from a low of $0.14 to a high of $0.19 per pound, on a class II fluid milk basis. Higher feed prices resulting from the historic drought in the U.S. caused dairy prices to rise starting in July, but not to the price levels experienced during 2011. Our costs for certain dairy products may not necessarily reflect market price fluctuations because of our forward purchasing practices.
The price of sugar is subject to price supports under U.S. farm legislation. This legislation establishes import quotas and duties to support the price of sugar. As a result, sugar prices paid by users in the U.S. are currently substantially higher than prices on the world sugar market. In early 2012, sugar supplies in the U.S. were negatively impacted by government import restrictions; however, ideal weather in the North American sugar-growing regions caused prices to trade lower in the Fall of 2012. As a result, refined sugar prices decreased in 2012 compared with 2011, trading lower in a range from $0.54 to $0.37 per pound. Our costs for sugar will not necessarily reflect market price fluctuations primarily because of our forward purchasing and hedging practices.
Peanut prices in the U.S. began the year around $1.25 per pound and decreased during the year to $0.52 per pound. Price decreases were driven by a record crop of 3.4 million tons, up 85% from 2011. Almond prices began the year at $2.20 per pound and increased to $2.90 per pound during the year driven by a decrease in almond production of
5
approximately 8% versus 2011. Our costs for peanuts and almonds will not necessarily reflect market price fluctuations because of our forward purchasing practices.
We attempt to minimize the effect of future price fluctuations related to the purchase of major raw materials and certain energy requirements primarily through forward purchasing to cover our future requirements, generally for periods from 3 to 24 months. We enter into futures contracts and other commodity derivative instruments to manage price risks for cocoa products, sugar, corn sweeteners, natural gas, certain dairy products and transportation costs. However, the dairy futures markets are not as developed as many of the other commodities futures markets and, therefore, generally it is difficult to hedge our costs for dairy products by entering into futures contracts and other derivative instruments to extend coverage for long periods of time. Currently, active futures contracts are not available for use in pricing our other major raw material requirements, primarily peanuts and almonds. For more information on price risks associated with our major raw material requirements, see Commodities
-
Price Risk Management and Futures Contracts on page 38.
Product Sourcing
We manufacture or contract to our specifications for the manufacture of the products we sell. In addition, we contract with third-party suppliers to source certain ingredients. We enter into manufacturing contracts with third parties to improve our strategic competitive position and achieve cost effective production and sourcing of our products.
Competition
Many of our brands enjoy wide consumer acceptance and are among the leading brands sold in the marketplace in North America. We sell our brands in highly competitive markets with many other global multinational, national, regional and local firms. Some of our competitors are much larger firms that have greater resources and more substantial international operations.
Trademarks, Service Marks and License Agreements
We own various registered and unregistered trademarks and service marks, and have rights under licenses to use various trademarks that are of material importance to our business. We also grant trademark licenses to third parties to produce and sell pantry items, flavored milks and various other products primarily under the
HERSHEY’S
and
REESE’S
brand names.
We have license agreements with several companies to manufacture and/or sell and distribute certain products. Our rights under these agreements are extendible on a long-term basis at our option. Our most significant licensing agreements are as follows:
|
Company
|
Brand
|
Location
|
Requirements
|
||||
|
Cadbury Ireland Limited
|
|
YORK
PETER PAUL ALMOND
JOY
PETER PAUL MOUNDS
|
|
Worldwide
|
None
|
||
|
Cadbury UK Limited
|
|
CADBURY
CARAMELLO
|
|
United States
|
Minimum sales requirement exceeded in 2012
|
||
|
Société des
Produits Nestlé SA |
|
KIT KAT
ROLO
|
|
United States
|
Minimum unit volume sales exceeded in 2012
|
||
|
Huhtamäki Oy affiliate
|
|
GOOD & PLENTY
HEATH
JOLLY RANCHER
MILK DUDS
PAYDAY
WHOPPERS
|
|
Worldwide
|
None
|
||
6
Backlog of Orders
We manufacture primarily for stock and fill customer orders from finished goods inventories. While at any given time there may be some backlog of orders, this backlog is not material in respect to our total annual sales, nor are the changes, from time to time, significant.
Research and Development
We engage in a variety of research and development activities in a number of countries, including the United States, Mexico, Brazil, India and China. We develop new products, improve the quality of existing products, improve and modernize production processes, and develop and implement new technologies to enhance the quality and value of both current and proposed product lines. Information concerning our research and development expense is contained in the Notes to the Consolidated Financial Statements
,
Note 1, Summary of Significant Accounting Policies
.
Food Quality and Safety Regulation
The manufacture and sale of consumer food products is highly regulated. In the United States, our activities are subject to regulation by various government agencies, including the Food and Drug Administration, the Department of Agriculture, the Federal Trade Commission, the Department of Commerce and the Environmental Protection Agency, as well as various state and local agencies. Similar agencies also regulate our businesses outside of the United States.
Our Product Excellence Program provides us with an effective product quality and safety program. This program assures that all products we purchase, manufacture and distribute are safe, are of high quality and comply with all applicable laws and regulations.
Through our Product Excellence Program, we evaluate the supply chain including ingredients, packaging, processes, products, distribution and the environment to determine where product quality and safety controls are necessary. We identify risks and establish controls to assure product quality and safety. Various government agencies, third-party firms and our quality assurance staff conduct audits of all facilities that manufacture our products to assure effectiveness and compliance with our program and all applicable laws and regulations.
Environmental Considerations
We made routine operating and capital expenditures during 2012 to comply with environmental laws and regulations. These expenditures were not material with respect to our results of operations, capital expenditures, earnings or competitive position.
Employees
As of December 31, 2012, we employed approximately 12,100 full-time and 2,100 part-time employees worldwide. Collective bargaining agreements covered approximately 4,800 employees. During 2013, agreements will be negotiated for certain employees at four facilities outside of the United States, comprising approximately 58% of total employees under collective bargaining agreements. We believe that our employee relations are good.
Financial Information by Geographic Area
Our principal operations and markets are located in the United States. The percentage of total consolidated net sales for our businesses outside of the United States was 16.1% for 2012, 15.6% for 2011 and 14.6% for 2010. The percentage of total consolidated assets outside of the United States as of December 31, 2012 was 20.5% and as of December 31, 2011 was 14.5%.
Corporate Social Responsibility
Our founder, Milton S. Hershey, established an enduring model of responsible citizenship while creating a successful business. Driving sustainable business practices, making a difference in our communities, and operating with the highest integrity are vital parts of our heritage. Milton Hershey School, established by Milton and Catherine Hershey, lies at the center of our unique heritage. Mr. Hershey donated and bequeathed almost his entire fortune to Milton Hershey School, which remains our primary beneficiary and provides a world-class education and nurturing home to nearly 2,000 children in need annually. We continue Milton Hershey's legacy of commitment to consumers, community and children by providing high-quality Hershey products while conducting our business in a socially responsible and environmentally
7
sustainable manner.
In 2012, we published our second corporate social responsibility (“CSR”) report, which provided an update on the progress we've made in advancing the priorities that were established in our first CSR report. The report outlines how we performed against the identified performance indicators within our four CSR pillars: environment, community, workplace and marketplace.
The safety and health of our employees, and the safety and quality of our products are consistently at the core of our operations and are areas of ongoing focus for Hershey in the workplace. Our over-arching safety goal is to consistently achieve best in class safety performance, and Hershey has achieved continuous improvement in employee safety in the workplace since 2007. We continue to invest in our quality management systems to ensure product quality and food safety remain top priorities. We carefully monitor and rigorously enforce our high standards of excellence for superior quality, consistency and taste, and absolute food safety.
For the first time, in 2012, Hershey was recognized for its environmental, social and governance performance by being named to the Dow Jones Sustainability Index (“DJSI”) - North America. The DJSI evaluates and selects the top 20% of companies, as determined by their financial and sustainability efforts, and Hershey was one of only seven companies in the Food and Beverage super-sector that were recognized in the DJSI.
Hershey has committed to minimizing the environmental impacts of our operations. Our environmental stewardship programs produced meaningful gains in 2011. Over our 2008 baseline, Hershey decreased waste generation by 23%, water usage by 12%, and green house gas emissions by 15%, while improving our company-wide recycling rate to 80%. Additionally, in 2012, we improved our Carbon Disclosure Score by 20%, and we moved up 172 spots in the Newsweek Green Rankings. Hershey now has three manufacturing facilities that have attained Zero-Waste-to-Landfill status with several others working to achieve this goal. We have installed more than 1,200 solar panels in Hershey, Pennsylvania, expected to generate an estimated 318 megawatt-hours of electricity per year. This project also included the installation of the region's first public electric vehicle charging stations, and we are piloting several 100% electric vehicles in our corporate fleet.
In the marketplace, Hershey focuses on promoting fair and ethical business dealings. A condition of doing business with us is compliance with our Supplier Code of Conduct, which outlines our expectations with regard to our suppliers' commitment to legal compliance and business integrity, social and working conditions, environment and food safety. We continue our leadership role in improving the lives of cocoa farming families through a variety of initiatives. In October 2012, we announced that it is our goal to source 100% certified cocoa for our global chocolate product lines by 2020, assuming adequate supply. Also, earlier in the year we pledged $10 million over 5 years to directly benefit 750,000 farmers through programs such as Hershey's Learn to Grow Farm and Family Center in Ghana. Our active engagement and financial support also continues for the World Cocoa Foundation, the International Cocoa Initiative, and CocoaLink, a first-of-its kind approach that uses mobile technology to deliver practical information on agricultural and social programs to rural cocoa farmers.
Our employees share their time and resources generously in their communities. Both directly and through the United Way, we contribute to hundreds of agencies that deliver much needed services and resources. In 2011, Hershey donated more than $9 million in cash and product to worthy causes, our employees volunteered more than 10,000 hours in their communities and we believe our results in 2012 have been even better. Our focus on “Kids and Kids at Risk” is supported through contributions to the Children's Miracle Network; Project Fellowship, where employees partner with student homes at the Milton Hershey School; an orphanage for special needs children in the Philippines; and a children's burn center in Guadalajara, Mexico, to name a few. In 2012, Hershey was recognized by The National Conference on Citizenship and Points of Light, the nation's definitive experts on civic engagement, in partnership with Bloomberg LP, as one of the 50 most community minded companies in America
.
Our commitment to CSR is yielding powerful results. As we move into new markets and expand our leadership in North America, we are convinced that our values and heritage will be fundamental to our continuing success.
Available Information
We are subject to the reporting requirements of the Securities Exchange Act of 1934, as amended. We file or furnish annual, quarterly and current reports, proxy statements and other information with the United States Securities and Exchange Commission (“SEC”). You may obtain a copy of any of these reports, free of charge, from the Investors section of our website,
www.thehersheycompany.com,
shortly after we file or furnish the information to the SEC.
8
You may obtain a copy of any of these reports directly from the SEC’s Public Reference Room. Contact the SEC by calling them at 1-800-SEC-0330 or by submitting a written request to U.S. Securities and Exchange Commission, Office of Investor Education and Advocacy, 100 F Street N.E., Washington, D.C. 20549. The SEC maintains an Internet site that contains reports, proxy and information statements, and other information regarding issuers that file electronically with the SEC at
www.sec.gov
. You can obtain additional information on how to request public documents from the SEC on their website. The electronic mailbox address of the SEC is publicinfo@sec.gov.
We have a Code of Ethical Business Conduct that applies to our Board of Directors, all company officers and employees, including, without limitation, our Chief Executive Officer and “senior financial officers” (including the Chief Financial Officer, Chief Accounting Officer and persons performing similar functions). You can obtain a copy of our Code of Ethical Business Conduct from the Investors section of our website,
www.thehersheycompany.com
. If we change or waive any portion of the Code of Ethical Business Conduct that applies to any of our directors, executive officers or senior financial officers, we will post that information on our website within four business days. In the case of a waiver, such information will include the name of the person to whom the waiver applied, along with the date and type of waiver.
We also post our Corporate Governance Guidelines and charters for each of the Board’s standing committees in the Investors section of our website,
www.thehersheycompany.com.
The Board of Directors adopted these Guidelines and charters.
We will provide to any stockholder a copy of one or more of the Exhibits listed in Part IV of this report, upon request. We charge a small copying fee for these exhibits to cover our costs. To request a copy of any of these documents, you can contact us at The Hershey Company, Attn: Investor Relations Department, 100 Crystal A Drive, Hershey, Pennsylvania 17033-0810.
|
Item 1A.
|
RISK FACTORS
|
We are subject to changing economic, competitive, regulatory and technological risks and uncertainties because of the nature of our operations. In connection with the “safe harbor” provisions of the Private Securities Litigation Reform Act of 1995, we note the following factors that, among others, could cause future results to differ materially from the forward-looking statements, expectations and assumptions expressed or implied in this report. Many of the forward-looking statements contained in this document may be identified by the use of words such as “intend,” “believe,” “expect,” “anticipate,” “should,” “planned,” “projected,” “estimated” and “potential,” among others. Among the factors that could cause our actual results to differ materially from the results projected in our forward-looking statements are the risk factors described below.
Issues or concerns related to the quality and safety of our products, ingredients or packaging could cause a product recall and/or result in harm to the Company’s reputation, negatively impacting our operating results.
In order to sell our iconic, branded products, we need to maintain a good reputation with our customers and consumers. Issues related to quality and safety of our products, ingredients or packaging, could jeopardize our Company’s image and reputation. Negative publicity related to these types of concerns, or related to product contamination or product tampering, whether valid or not, might negatively impact demand for our products, or cause production and delivery disruptions. We may need to recall products if any of our products become unfit for consumption. In addition, we could potentially be subject to litigation or government actions, which could result in payments of fines or damages. Costs associated with these potential actions could negatively affect our operating results.
Increases in raw material and energy costs along with the availability of adequate supplies of raw materials could affect future financial results.
We use many different commodities for our business, including cocoa products, sugar, dairy products, peanuts, almonds, corn sweeteners, natural gas and fuel oil.
9
Commodities are subject to price volatility and changes in supply caused by numerous factors, including:
|
Ÿ
|
Commodity market fluctuations;
|
|
Ÿ
|
Currency exchange rates;
|
|
Ÿ
|
Imbalances between supply and demand;
|
|
Ÿ
|
The effect of weather on crop yield;
|
|
Ÿ
|
Speculative influences;
|
|
Ÿ
|
Trade agreements among producing and consuming nations;
|
|
Ÿ
|
Supplier compliance with commitments;
|
|
Ÿ
|
Political unrest in producing countries; and
|
|
Ÿ
|
Changes in governmental agricultural programs and energy policies.
|
Although we use forward contracts and commodity futures and options contracts, where possible, to hedge commodity prices, commodity price increases ultimately result in corresponding increases in our raw material and energy costs. If we are unable to offset cost increases for major raw materials and energy, there could be a negative impact on our results of operations and financial condition.
Price increases may not be sufficient to offset cost increases and maintain profitability or may result in sales volume declines associated with pricing elasticity.
We may be able to pass some or all raw material, energy and other input cost increases to customers by increasing the selling prices of our products or decreasing the size of our products; however, higher product prices or decreased product sizes may also result in a reduction in sales volume and/or consumption. If we are not able to increase our selling prices or reduce product sizes sufficiently to offset increased raw material, energy or other input costs, including packaging, direct labor, overhead and employee benefits, or if our sales volume decreases significantly, there could be a negative impact on our results of operations and financial condition.
Market demand for new and existing products could decline.
We operate in highly competitive markets and rely on continued demand for our products. To generate revenues and profits, we must sell products that appeal to our customers and to consumers. Our continued success is impacted by many factors, including the following:
|
Ÿ
|
Effective retail execution;
|
|
Ÿ
|
Appropriate advertising campaigns and marketing programs;
|
|
Ÿ
|
Our ability to secure adequate shelf space at retail locations;
|
|
Ÿ
|
Product innovation, including maintaining a strong pipeline of new products;
|
|
Ÿ
|
Changes in product category consumption;
|
|
Ÿ
|
Our response to consumer demographics and trends; and
|
|
Ÿ
|
Consumer health concerns, including obesity and the consumption of certain ingredients.
|
In these markets, there continue to be competitive product and pricing pressures, as well as challenges in maintaining profit margins. We must maintain mutually beneficial relationships with our key customers, including retailers and distributors, to compete effectively. Our largest customer, McLane Company, Inc., accounted for approximately 22.2% of our total net sales in 2012. McLane Company, Inc. is one of the largest wholesale distributors in the United States to convenience stores, drug stores, wholesale clubs and mass merchandisers, including Wal-Mart Stores, Inc.
Increased marketplace competition could hurt our business.
The global confectionery packaged goods industry is intensely competitive and consolidation in this industry continues. Some of our competitors are much larger firms that have greater resources and more substantial international operations. In order to protect our existing market share or capture increased market share in this highly competitive retail environment, we may be required to increase expenditures for promotions and advertising, and continue to introduce and establish new products. Due to inherent risks in the marketplace associated with advertising and new product
10
introductions, including uncertainties about trade and consumer acceptance, increased expenditures may not prove successful in maintaining or enhancing our market share and could result in lower sales and profits. In addition, we may incur increased credit and other business risks because we operate in a highly competitive retail environment.
Disruption to our supply chain could impair our ability to produce or deliver our finished products, resulting in a negative impact on our operating results.
Disruption to our manufacturing operations or our supply chain could result from, but are not limited to, the following:
|
Ÿ
|
Natural disaster;
|
|
Ÿ
|
Pandemic outbreak of disease;
|
|
Ÿ
|
Weather;
|
|
Ÿ
|
Fire or explosion;
|
|
Ÿ
|
Terrorism or other acts of violence;
|
|
Ÿ
|
Labor strikes or other labor activities;
|
|
Ÿ
|
Unavailability of raw or packaging materials; and
|
|
Ÿ
|
Operational and/or financial instability of key suppliers, and other vendors or service providers.
|
We take adequate precautions to mitigate the impact of possible disruptions. We have strategies and plans in place to manage such events if they were to occur, including our global supply chain strategies and our principle-based global labor relations strategy. If we are unable, or if it is not financially feasible, to effectively mitigate the likelihood or potential impact of such disruptive events, our results of operations and financial condition could be negatively impacted.
Our financial results may be adversely impacted by the failure to successfully execute or integrate acquisitions, divestitures and joint ventures.
From time to time, we may evaluate potential acquisitions, divestitures or joint ventures that align with our strategic objectives. The success of such activity depends, in part, upon our ability to identify suitable buyers, sellers or business partners; perform effective assessments prior to contract execution; negotiate contract terms; and, if applicable, obtain government approval. These activities may present certain financial, managerial, staffing and talent, and operational risks, including diversion of management’s attention from existing core businesses; difficulties integrating or separating businesses from existing operations; and challenges presented by acquisitions or joint ventures which may not achieve sales levels and profitability that justify the investments made. If the acquisitions, divestitures or joint ventures are not successfully implemented or completed, there could be a negative impact on our results of operations, financial condition and cash flows.
Changes in governmental laws and regulations could increase our costs and liabilities or impact demand for our products.
Changes in laws and regulations and the manner in which they are interpreted or applied may alter our business environment. These negative impacts could result from changes in food and drug laws, laws related to advertising and marketing practices, accounting standards, taxation requirements, competition laws, employment laws and environmental laws, among others. It is possible that we could become subject to additional liabilities in the future resulting from changes in laws and regulations that could result in an adverse effect on our results of operations and financial condition.
Political, economic, and/or financial market conditions could negatively impact our financial results.
Our operations are impacted by consumer spending levels and impulse purchases which are affected by general macroeconomic conditions, consumer confidence, employment levels, availability of consumer credit and interest rates on that credit, consumer debt levels, energy costs and other factors. Volatility in food and energy costs, sustained global recessions, rising unemployment and declines in personal spending could adversely impact our revenues, profitability and financial condition.
Changes in financial market conditions may make it difficult to access credit markets on commercially acceptable terms which may reduce liquidity or increase borrowing costs for our Company, our customers and our suppliers. A significant reduction in liquidity could increase counterparty risk associated with certain suppliers and service providers,
11
resulting in disruption to our supply chain and/or higher costs, and could impact our customers, resulting in a reduction in our revenue, or a possible increase in bad debt expense.
International operations could fluctuate unexpectedly and adversely impact our business.
In 2012, we derived approximately 16.1% of our net sales from customers located outside of the United States. Additionally, 20.5% of our total consolidated assets were located outside of the United States as of December 31, 2012. As part of our global growth strategy, we are increasing our investments outside of the United States, particularly in Mexico, Brazil, India and China. As a result, we are subject to numerous risks and uncertainties relating to international sales and operations, including:
|
Ÿ
|
Unforeseen global economic and environmental changes resulting in business interruption, supply constraints, inflation, deflation or decreased demand;
|
|
Ÿ
|
Difficulties and costs associated with compliance and enforcement of remedies under a wide variety of complex laws, treaties and regulations;
|
|
Ÿ
|
Unexpected changes in regulatory environments;
|
|
Ÿ
|
Political and economic instability, including the possibility of civil unrest, terrorism, mass violence or armed conflict;
|
|
Ÿ
|
Nationalization of our properties by foreign governments;
|
|
Ÿ
|
Tax rates that may exceed those in the United States and earnings that may be subject to withholding requirements and incremental taxes upon repatriation;
|
|
Ÿ
|
Potentially negative consequences from changes in tax laws;
|
|
Ÿ
|
The imposition of tariffs, quotas, trade barriers, other trade protection measures and import or export licensing requirements;
|
|
Ÿ
|
Increased costs, disruptions in shipping or reduced availability of freight transportation;
|
|
Ÿ
|
The impact of currency exchange rate fluctuations between the U.S. dollar and foreign currencies;
|
|
Ÿ
|
Failure to gain sufficient profitable scale in certain international markets resulting in losses from impairment or sale of assets; and
|
|
Ÿ
|
Failure to recruit, retain and build an engaged global workforce.
|
Disruptions, failures or security breaches of our information technology infrastructure could have a negative impact on our operations.
Information technology is a critically important part of our business operations. We use information technology to manage all business processes including manufacturing, financial, logistics, sales, marketing and administrative functions. These processes collect, interpret and distribute business data and communicate internally and externally with employees, suppliers, customers and others.
We invest in industry standard security technology to protect the Company’s data and business processes against risk of data security breach and cyber attack. Our data security management program includes identity, trust, vulnerability and threat management business processes as well as adoption of standard data protection policies. We measure our data security effectiveness through industry accepted methods and remediate significant findings. Additionally, we certify our major technology suppliers and any outsourced services through accepted security certification standards. We maintain and routinely test backup systems and disaster recovery, along with external network security penetration testing by an independent third party as part of our business continuity preparedness. We also have processes in place to prevent disruptions resulting from the implementation of new software and systems of the latest technology.
While we believe that our security technology and processes are adequate in preventing security breaches and in reducing cybersecurity risks, disruptions or failure of information technology systems is possible and could have a negative impact on our operations or business reputation. Failure of our systems, including failures due to cyber attacks that would prevent the ability of systems to function as intended, could cause transaction errors, loss of customers and sales, and could have negative consequences to our Company, our employees, and those with whom we do business.
12
Future developments related to the investigation by government regulators of alleged pricing practices by members of the confectionery industry and civil antitrust lawsuits in the United States could negatively impact our reputation and our operating results.
In 2007, the Competition Bureau of Canada began an inquiry into alleged violations of the Canadian
Competition Act
in the sale and supply of chocolate products sold in Canada between 2002 and 2008 by members of the confectionery industry, including Hershey Canada, Inc. The U.S. Department of Justice also notified the Company in 2007 that it had opened an inquiry, but has not requested any information or documents. We also are party to a number of civil antitrust lawsuits in the United States, including individual, class, and putative class actions. Additional information about these proceedings is contained in Item 3. Legal Proceedings of this Form 10-K. Competition and antitrust law investigations can be lengthy and violations are subject to civil and/or criminal fines and other sanctions. Class action civil antitrust lawsuits are expensive to defend and could result in significant judgments, including in some cases, payment of treble damages
and/or attorneys' fees to the successful plaintiff. Additionally, negative publicity involving these proceedings could affect our Company's brands and reputation, possibly resulting in decreased demand for our products. These possible consequences, in our opinion, should not materially impact our financial position or liquidity but could materially impact our results of operations and cash flows in the period in which they are accrued or paid, respectively.
Pension costs or funding requirements could increase at a higher than anticipated rate.
We sponsor a number of defined benefit pension plans. Changes in interest rates or in the market value of plan assets could affect the funded status of our pension plans. This could cause volatility in our benefits costs and increase future funding requirements for our pension plans. Additionally, we could incur pension settlement losses if a significant number of employees who have retired or have left the Company decide to withdraw substantial lump sums from their pension accounts. A significant increase in pension expense, in pension settlement losses or in future funding requirements could have a negative impact on our results of operations, financial condition and cash flows. For more information, refer to page 41.
|
Item 1B.
|
UNRESOLVED STAFF COMMENTS
|
None.
|
Item 2.
|
PROPERTIES
|
Our principal properties include the following:
|
Country
|
Location
|
Type
|
Status
(Own/Lease)
|
|||
|
United States
|
Hershey, Pennsylvania
(2 principal plants)
|
Manufacturing—confectionery products and pantry items
|
Own
|
|||
|
Lancaster, Pennsylvania
|
Manufacturing—confectionery products
|
Own
|
||||
|
Robinson, Illinois
|
Manufacturing—confectionery products, and pantry items
|
Own
|
||||
|
Stuarts Draft, Virginia
|
Manufacturing—confectionery products and pantry items
|
Own
|
||||
|
Edwardsville, Illinois
|
Distribution
|
Own
|
||||
|
Palmyra, Pennsylvania
|
Distribution
|
Own
|
||||
|
Ogden, Utah
|
Distribution
|
Own
|
||||
|
Canada
|
Mississauga, Ontario
(1)
|
Distribution
|
Lease
|
|||
|
Mexico
|
Monterrey, Mexico
|
Manufacturing—confectionery products
|
Own
|
|||
(1) The lease of the distribution center located in Mississauga, Ontario, Canada expires in 2013. We have entered into an agreement with the Ferrero Group for the construction and use of a warehouse and distribution facility located in Brantford, Ontario, Canada beginning in 2013.
In addition to the locations indicated above, we also own or lease several other properties and buildings worldwide which we use for manufacturing, sales, distribution and administrative functions. Our facilities are well maintained and generally have adequate capacity to accommodate seasonal demands, changing product mixes and certain additional
13
growth. The largest facilities are located in Hershey and Lancaster, Pennsylvania; Monterrey, Mexico; and Stuarts Draft, Virginia. Many additions and improvements have been made to these facilities over the years and they include equipment of the latest type and technology.
|
Item 3.
|
LEGAL PROCEEDINGS
|
In 2007, the Competition Bureau of Canada began an inquiry into alleged violations of the Canadian
Competition Act
in the sale and supply of chocolate products sold in Canada between 2002 and 2008 by members of the confectionery industry, including Hershey Canada, Inc. The U.S. Department of Justice also notified the Company in 2007 that it had opened an inquiry, but has not requested any information or documents.
Subsequently, 13 civil lawsuits were filed in Canada and 91 civil lawsuits were filed in the United States against the Company. The lawsuits were instituted on behalf of direct purchasers of our products as well as indirect purchasers that purchase our products for use or for resale. Several other chocolate and confectionery companies were named as defendants in these lawsuits as they also were the subject of investigations and/or inquiries by the government entities referenced above. The cases seek recovery for losses suffered as a result of alleged conspiracies in restraint of trade in connection with the pricing practices of the defendants. The Canadian civil cases were settled in 2012. The Canadian Competition Bureau investigation remains pending. However, Hershey Canada, Inc. has reached a tentative settlement agreement with the Canadian government with regard to its investigation and the Company has accrued a liability related thereto. We do not believe the terms of the tentative settlement agreement should have a material impact on the Company's results of operations, financial position or liquidity.
With regard to the U.S. lawsuits, the Judicial Panel on Multidistrict Litigation assigned the cases to the U.S. District Court for the Middle District of Pennsylvania. Plaintiffs are seeking actual and treble damages against the Company and other defendants based on an alleged overcharge for certain, or in some cases all chocolate products sold in the U.S. between 2003 and 2008. The lawsuits have been proceeding on different scheduling tracks for different groups of plaintiffs.
Defendants have briefed summary judgment against the plaintiffs that have not sought class certification (the “Opt-Out Plaintiffs”). The plaintiffs that purchased products from defendants directly (the “Direct Purchaser Plaintiffs”) were granted class certification in December 2012. Defendants will conduct expert discovery on liability and damages and brief summary judgment against the Direct Purchaser Plaintiffs through the third quarter of 2013. The hearing on summary judgment for the Direct Purchaser Plaintiffs is scheduled for September 2013, combined with the summary judgment hearing for the Opt-Out Plaintiffs. Putative class plaintiffs that purchased product indirectly for resale (the “Indirect Purchasers for Resale”) have a May 1, 2013 deadline to file for class certification. Putative class plaintiffs that purchased product indirectly for use (the “Indirect End Users”) may seek class certification after summary judgment against the Direct Purchaser Plaintiffs and the Opt-Out Plaintiffs has been resolved. No trial date has been set for any group of plaintiffs. The Company will continue to vigorously defend against these lawsuits.
At this stage, we are unable to predict the range of any potential liability that is reasonably possible as a result of the proceedings outlined above. Competition and antitrust law investigations can be lengthy and violations are subject to civil and/or criminal fines and other sanctions. Class action civil antitrust lawsuits are expensive to defend and could result in significant judgments, including in some cases, payment of treble damages and/or attorneys' fees to the successful plaintiff. Additionally, negative publicity involving these proceedings could affect our Company's brands and reputation, possibly resulting in decreased demand for our products. These possible consequences, in our opinion, should not materially impact our financial position or liquidity, but could materially impact our results of operations and cash flows in the period in which they are accrued or paid, respectively. Please refer to Item 1A. Risk Factors, beginning on page 9, for additional information concerning the key risks to achieving the Company's future performance goals.
We have no other material pending legal proceedings, other than ordinary routine litigation incidental to our business.
Pursuant to the disclosure requirements of the U.S. Internal Revenue Service (“IRS”) Revenue Procedure 2005-51, in the second quarter of 2012, the IRS assessed an accuracy-related penalty of $222,975 on a reportable transaction understatement for the 2008 tax year and that this penalty was paid in full in 2012. The penalty was imposed by §6662A(a) of the Internal Revenue Code at the 30% rate determined under §6662A(c) of the Internal Revenue Code. The penalty was imposed for a reportable transaction understatement with respect to which the relevant facts affecting the tax treatment of the sale by the Company in 2008 of a 49% interest in its wholly-owned subsidiary, Hershey do Brasil LTDA, were not adequately disclosed under §6011 of the Internal Revenue Code in the Company's 2008 federal income tax return.
14
|
Item 4.
|
MINE SAFETY DISCLOSURES
|
Not applicable.
15
|
Item 5.
|
MARKET FOR THE REGISTRANT’S COMMON EQUITY, RELATED STOCKHOLDER MATTERS AND ISSUER PURCHASES OF EQUITY SECURITIES
|
We paid $341.2 million in cash dividends on our Common Stock and Class B Common Stock (“Class B Stock”) in 2012 and $304.1 million in 2011. The annual dividend rate on our Common Stock in 2012 was $1.56 per share.
On January 29, 2013, our Board of Directors declared a quarterly dividend of $0.42 per share of Common Stock payable on March 15, 2013, to stockholders of record as of February 25, 2013. It is the Company’s 333rd consecutive Common Stock dividend. A quarterly dividend of $0.38 per share of Class B Stock also was declared.
Our Common Stock is listed and traded principally on the New York Stock Exchange (“NYSE”) under the ticker symbol “HSY.” Approximately 260.2 million shares of our Common Stock were traded during 2012. The Class B Stock is not publicly traded.
The closing price of our Common Stock on December 31, 2012, was $72.22. There were 36,964 stockholders of record of our Common Stock and our Class B Stock as of December 31, 2012.
The following table shows the dividends paid per share of Common Stock and Class B Stock and the price range of the Common Stock for each quarter of the past 2 years:
|
Dividends Paid Per
Share |
Common Stock
Price Range* |
||||||||||||
|
Common
Stock |
Class B
Stock |
High
|
Low
|
||||||||||
|
2012
|
|||||||||||||
|
1st Quarter
|
$
|
0.380
|
|
$
|
0.344
|
|
$61.94
|
$59.49
|
|||||
|
2nd Quarter
|
0.380
|
|
0.344
|
|
72.03
|
|
59.81
|
|
|||||
|
3rd Quarter
|
0.380
|
|
0.344
|
|
73.16
|
|
70.09
|
|
|||||
|
4th Quarter
|
0.420
|
|
0.380
|
|
74.64
|
|
68.85
|
|
|||||
|
Total
|
$
|
1.560
|
|
$
|
1.412
|
|
|||||||
|
Dividends Paid Per
Share |
Common Stock
Price Range* |
||||||||||||
|
Common
Stock |
Class B
Stock |
High
|
Low
|
||||||||||
|
2011
|
|||||||||||||
|
1st Quarter
|
$
|
0.345
|
|
$
|
0.3125
|
|
$55.05
|
$46.24
|
|||||
|
2nd Quarter
|
0.345
|
|
0.3125
|
|
58.20
|
|
53.77
|
|
|||||
|
3rd Quarter
|
0.345
|
|
0.3125
|
|
60.96
|
|
53.83
|
|
|||||
|
4th Quarter
|
0.345
|
|
0.3125
|
|
62.26
|
|
55.32
|
|
|||||
|
Total
|
$
|
1.380
|
|
$
|
1.2500
|
|
|||||||
* NYSE-Composite Quotations for Common Stock by calendar quarter.
Unregistered Sales of Equity Securities and Use of Proceeds
None.
16
Issuer Purchases of Equity Securities
Purchases of equity securities during the fourth quarter of the fiscal year ended December 31, 2012:
|
Period
|
(a) Total
Number of
Shares
Purchased
|
(b) Average
Price Paid per
Share
|
(c) Total Number of
Shares Purchased
as Part of Publicly
Announced Plans or
Programs
|
(d) Approximate Dollar
Value of Shares that
May Yet Be Purchased
Under the Plans or
Programs
(1)
|
||||||
|
(in thousands of dollars)
|
||||||||||
|
October 1 through
October 28, 2012
|
—
|
|
—
|
|
—
|
$125,069
|
||||
|
October 29 through
November 25, 2012
|
187,570
|
|
$69.68
|
—
|
$125,069
|
|||||
|
November 26 through
December 31, 2012
|
—
|
|
—
|
|
—
|
$125,069
|
||||
|
Total
|
187,570
|
|
$69.68
|
—
|
||||||
|
(1)
|
In April 2011, our Board of Directors approved a $250 million share repurchase program. This authorization is in addition to the Company’s policy of repurchasing shares in the open market to replace Treasury Stock shares issued in connection with stock option exercises or other equity-based compensation programs.
|
Performance Graph
The following graph compares our cumulative total stockholder return (Common Stock price appreciation plus dividends, on a reinvested basis) over the last five fiscal years with the Standard & Poor’s 500 Index and the Standard & Poor’s Packaged Foods Index.
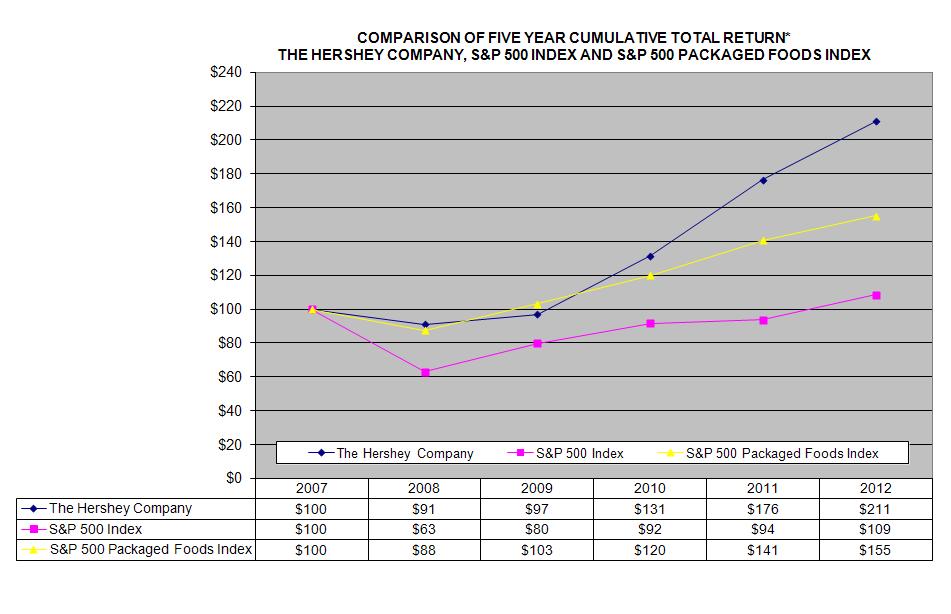
*Hypothetical $100 invested on December 31, 2007 in Hershey Common Stock, S&P 500 Index and S&P 500 Packaged Foods Index, assuming reinvestment of dividends.
17
Item 6.
SELECTED FINANCIAL DATA
SIX-YEAR CONSOLIDATED FINANCIAL SUMMARY
All dollar and share amounts in thousands except market price
and per share statistics
|
5-Year
Compound
Growth Rate
|
2012
|
2011
|
2010
|
2009
|
2008
|
2007
|
|||||||||||||||
|
Summary of Operations
|
|||||||||||||||||||||
|
Net Sales
|
6.1
|
%
|
$
|
6,644,252
|
|
6,080,788
|
|
5,671,009
|
|
5,298,668
|
|
5,132,768
|
|
4,946,716
|
|
||||||
|
Cost of Sales
|
2.7
|
%
|
$
|
3,784,370
|
|
3,548,896
|
|
3,255,801
|
|
3,245,531
|
|
3,375,050
|
|
3,315,147
|
|
||||||
|
Selling, Marketing and Administrative
|
13.7
|
%
|
$
|
1,703,796
|
|
1,477,750
|
|
1,426,477
|
|
1,208,672
|
|
1,073,019
|
|
895,874
|
|
||||||
|
Business Realignment and Impairment Charges (Credits), Net
|
(30.5
|
)%
|
$
|
44,938
|
|
(886
|
)
|
83,433
|
|
82,875
|
|
94,801
|
|
276,868
|
|
||||||
|
Interest Expense, Net
|
(4.2
|
)%
|
$
|
95,569
|
|
92,183
|
|
96,434
|
|
90,459
|
|
97,876
|
|
118,585
|
|
||||||
|
Provision for Income Taxes
|
23.0
|
%
|
$
|
354,648
|
|
333,883
|
|
299,065
|
|
235,137
|
|
180,617
|
|
126,088
|
|
||||||
|
Net Income
|
25.3
|
%
|
$
|
660,931
|
|
628,962
|
|
509,799
|
|
435,994
|
|
311,405
|
|
214,154
|
|
||||||
|
Net Income Per Share:
|
|||||||||||||||||||||
|
—Basic—Class B Stock
|
25.7
|
%
|
$
|
2.73
|
|
2.58
|
|
2.08
|
|
1.77
|
|
1.27
|
|
0.87
|
|
||||||
|
—Diluted—Class B Stock
|
25.5
|
%
|
$
|
2.71
|
|
2.56
|
|
2.07
|
|
1.77
|
|
1.27
|
|
0.87
|
|
||||||
|
—Basic—Common Stock
|
25.7
|
%
|
$
|
3.01
|
|
2.85
|
|
2.29
|
|
1.97
|
|
1.41
|
|
0.96
|
|
||||||
|
—Diluted—Common Stock
|
25.5
|
%
|
$
|
2.89
|
|
2.74
|
|
2.21
|
|
1.90
|
|
1.36
|
|
0.93
|
|
||||||
|
Weighted-Average Shares Outstanding:
|
|||||||||||||||||||||
|
—Basic—Common Stock
|
|
|
164,406
|
|
165,929
|
|
167,032
|
|
167,136
|
|
166,709
|
|
168,050
|
|
|||||||
|
—Basic—Class B Stock
|
|
|
60,630
|
|
60,645
|
|
60,708
|
|
60,709
|
|
60,777
|
|
60,813
|
|
|||||||
|
—Diluted
|
|
|
228,337
|
|
229,919
|
|
230,313
|
|
228,995
|
|
228,697
|
|
231,449
|
|
|||||||
|
Dividends Paid on Common Stock
|
6.1
|
%
|
$
|
255,596
|
|
228,269
|
|
213,013
|
|
198,371
|
|
197,839
|
|
190,199
|
|
||||||
|
Per Share
|
6.5
|
%
|
$
|
1.56
|
|
1.38
|
|
1.28
|
|
1.19
|
|
1.19
|
|
1.14
|
|
||||||
|
Dividends Paid on Class B Stock
|
6.6
|
%
|
$
|
85,610
|
|
75,814
|
|
70,421
|
|
65,032
|
|
65,110
|
|
62,064
|
|
||||||
|
Per Share
|
6.7
|
%
|
$
|
1.41
|
|
1.25
|
|
1.16
|
|
1.07
|
|
1.07
|
|
1.02
|
|
||||||
|
Depreciation
|
(9.8
|
)%
|
$
|
174,788
|
|
188,491
|
|
169,677
|
|
157,996
|
|
227,183
|
|
292,658
|
|
||||||
|
Advertising
|
30.3
|
%
|
$
|
480,016
|
|
414,171
|
|
391,145
|
|
241,184
|
|
161,133
|
|
127,896
|
|
||||||
|
Payroll
|
1.9
|
%
|
$
|
709,621
|
|
676,482
|
|
641,756
|
|
613,568
|
|
645,456
|
|
645,083
|
|
||||||
|
Year-end Position and Statistics
|
|||||||||||||||||||||
|
Capital Additions
|
6.4
|
%
|
$
|
258,727
|
|
323,961
|
|
179,538
|
|
126,324
|
|
262,643
|
|
189,698
|
|
||||||
|
Capitalized Software Additions
|
6.3
|
%
|
$
|
19,239
|
|
23,606
|
|
21,949
|
|
19,146
|
|
20,336
|
|
14,194
|
|
||||||
|
Total Assets
|
2.3
|
%
|
$
|
4,754,839
|
|
4,407,094
|
|
4,267,627
|
|
3,669,926
|
|
3,629,614
|
|
4,242,008
|
|
||||||
|
Short-term Debt and Current Portion of Long-term Debt
|
(15.2
|
)%
|
$
|
375,898
|
|
139,673
|
|
285,480
|
|
39,313
|
|
501,504
|
|
856,392
|
|
||||||
|
Long-term Portion of Debt
|
3.6
|
%
|
$
|
1,530,967
|
|
1,748,500
|
|
1,541,825
|
|
1,502,730
|
|
1,505,954
|
|
1,279,965
|
|
||||||
|
Stockholders’ Equity
|
10.7
|
%
|
$
|
1,048,373
|
|
880,943
|
|
945,896
|
|
768,634
|
|
358,239
|
|
631,815
|
|
||||||
|
Full-time Employees
|
12,100
|
|
11,800
|
|
11,300
|
|
12,100
|
|
12,800
|
|
12,400
|
|
|||||||||
|
Stockholders’ Data
|
|||||||||||||||||||||
|
Outstanding Shares of Common Stock and Class B Stock at Year-end
|
223,786
|
|
225,206
|
|
227,030
|
|
227,998
|
|
227,035
|
|
227,050
|
|
|||||||||
|
Market Price of Common Stock at
Year-end |
12.9
|
%
|
$
|
72.22
|
|
61.78
|
|
47.15
|
|
35.79
|
|
34.74
|
|
39.40
|
|
||||||
|
Price Range During Year (high)
|
$
|
74.64
|
|
62.26
|
|
52.10
|
|
42.25
|
|
44.32
|
|
56.75
|
|
||||||||
|
Price Range During Year (low)
|
$
|
59.49
|
|
46.24
|
|
35.76
|
|
30.27
|
|
32.10
|
|
38.21
|
|
||||||||
18
|
Item 7.
|
MANAGEMENT’S DISCUSSION AND ANALYSIS OF FINANCIAL CONDITION AND RESULTS OF OPERATIONS
|
EXECUTIVE OVERVIEW
Results for the year ended December 31, 2012 were strong with increases in net sales, earnings per share and profitability despite continued macroeconomic challenges. Net sales increased 9.3% compared with 2011 due to net price realization and volume increases in the United States and key international markets as we continued our focus on core brands and innovation. Advertising expense increased 15.9% for the year supporting core brands along with new product launches. Net income and earnings per share-diluted also increased at greater rates than our long-term growth targets. The investments we have made in both productivity and cost savings resulted in a business model that is more efficient and effective, enabling us to deliver predictable, consistent and achievable marketplace and financial performance. We continue to generate strong cash flow from operations and our financial position remains solid.
Adjusted Non-GAAP Financial Measures
Our “Management’s Discussion and Analysis of Financial Condition and Results of Operations” section includes certain measures of financial performance that are not defined by U.S. generally accepted accounting principles (“GAAP”). For each of these non-GAAP financial measures, we are providing below (1) the most directly comparable GAAP measure; (2) a reconciliation of the differences between the non-GAAP measure and the most directly comparable GAAP measure; (3) an explanation of why our management believes these non-GAAP measures provide useful information to investors; and (4) additional purposes for which we use these non-GAAP measures.
We believe that the disclosure of these non-GAAP measures provides investors with a better comparison of our year-to-year operating results. We exclude the effects of certain items from Income before Interest and Income Taxes (“EBIT”), Net Income and Income per Share-Diluted-Common Stock (“EPS”) when we evaluate key measures of our performance internally, and in assessing the impact of known trends and uncertainties on our business. We also believe that excluding the effects of these items provides a more balanced view of the underlying dynamics of our business.
Adjusted non-GAAP financial measures exclude the impacts of charges or credits recorded during the last four years associated with our business realignment initiatives and impairment charges related to goodwill and certain trademarks. Non-service-related pension expenses are also excluded for each of the last four years, along with acquisition closing and integration costs, primarily associated with the acquisition of Brookside in 2012, and a gain on the sale of certain non-core trademark licensing rights in 2011.
Non-service-related pension expenses include interest costs, the expected return on pension plan assets, the amortization of actuarial gains and losses, and certain curtailment and settlement losses or credits. Non-service-related pension expenses may be very volatile from year-to-year as a result of changes in interest rates and market returns on pension plan assets. Therefore, we have excluded non-service-related pension expense from our results in accordance with GAAP. We believe that non-GAAP financial results excluding non-service-related pension expenses will provide investors with a better understanding of the underlying profitability of our ongoing business. We believe that the service cost component of our total pension benefit costs closely reflects the operating costs of our business and provides for a better comparison of our operating results from year-to-year. Our most significant defined benefit pension plans were closed to most new participants after 2007, resulting in ongoing service costs that are stable and predictable.
19
|
For the years ended December 31,
|
2012
|
2011
|
||||||||||||||||||||||
|
EBIT
|
Net
Income |
EPS
|
EBIT
|
Net
Income |
EPS
|
|||||||||||||||||||
|
In millions of dollars except per share amounts
|
||||||||||||||||||||||||
|
Results in accordance with GAAP
|
$
|
1,111.1
|
|
$
|
660.9
|
|
$
|
2.89
|
|
$
|
1,055.0
|
|
$
|
628.9
|
|
$
|
2.74
|
|
||||||
|
Adjustments:
|
||||||||||||||||||||||||
|
Business realignment charges included in cost of sales (“COS”)
|
36.4
|
|
23.7
|
|
0.10
|
|
45.1
|
|
28.4
|
|
0.12
|
|
||||||||||||
|
Non-service-related pension expense included in COS
|
8.6
|
|
5.3
|
|
0.03
|
|
—
|
|
—
|
|
—
|
|
||||||||||||
|
Acquisition integration costs included in COS
|
4.1
|
|
3.0
|
|
0.01
|
|
—
|
|
—
|
|
—
|
|
||||||||||||
|
Business realignment charges included in selling, marketing and administrative (“SM&A”)
|
2.4
|
|
1.6
|
|
0.01
|
|
5.0
|
|
3.0
|
|
0.01
|
|
||||||||||||
|
Non-service-related pension expense included in SM&A
|
12.0
|
|
7.4
|
|
0.03
|
|
2.8
|
|
2.0
|
|
0.01
|
|
||||||||||||
|
Acquisition integration costs included in SM&A
|
9.3
|
|
6.2
|
|
0.03
|
|
—
|
|
—
|
|
—
|
|
||||||||||||
|
Gain on sale of trademark licensing rights included in SM&A
|
—
|
|
—
|
|
—
|
|
(17.0
|
)
|
(11.1
|
)
|
(0.05
|
)
|
||||||||||||
|
Business realignment and impairment charges(credits) , net
|
45.0
|
|
31.9
|
|
0.14
|
|
(0.9
|
)
|
(0.5
|
)
|
—
|
|
||||||||||||
|
Adjusted non-GAAP results
|
$
|
1,228.9
|
|
$
|
740.0
|
|
$
|
3.24
|
|
$
|
1,090.0
|
|
$
|
650.7
|
|
$
|
2.83
|
|
||||||
|
For the years ended December 31,
|
2010
|
2009
|
||||||||||||||||||||||
|
EBIT
|
Net
Income |
EPS
|
EBIT
|
Net
Income |
EPS
|
|||||||||||||||||||
|
In millions of dollars except per share amounts
|
||||||||||||||||||||||||
|
Results in accordance with GAAP
|
$
|
905.3
|
|
$
|
509.8
|
|
$
|
2.21
|
|
$
|
761.6
|
|
$
|
436.0
|
|
$
|
1.90
|
|
||||||
|
Adjustments:
|
||||||||||||||||||||||||
|
Business realignment charges included in COS
|
13.7
|
|
8.4
|
|
0.04
|
|
10.1
|
|
6.3
|
|
0.03
|
|
||||||||||||
|
Non-service-related pension expense included in COS
|
0.9
|
|
0.6
|
|
—
|
|
14.7
|
|
9.1
|
|
0.04
|
|
||||||||||||
|
Business realignment charges included in SM&A
|
1.5
|
|
0.9
|
|
—
|
|
6.1
|
|
3.8
|
|
0.02
|
|
||||||||||||
|
Non-service-related pension expense included in SM&A
|
5.0
|
|
3.2
|
|
0.02
|
|
6.8
|
|
4.2
|
|
0.02
|
|
||||||||||||
|
Business realignment and impairment charges, net
|
83.4
|
|
68.6
|
|
0.30
|
|
82.9
|
|
50.7
|
|
0.22
|
|
||||||||||||
|
Adjusted non-GAAP results
|
$
|
1,009.8
|
|
$
|
591.5
|
|
$
|
2.57
|
|
$
|
882.2
|
|
$
|
510.1
|
|
$
|
2.23
|
|
||||||
|
Adjusted Non-GAAP Results
|
|||||||||
|
Key Annual Performance Measures
|
2012
|
2011
|
2010
|
||||||
|
Increase in Net Sales
|
9.3
|
%
|
7.2
|
%
|
7.0
|
%
|
|||
|
Increase in adjusted EBIT
|
12.7
|
%
|
7.9
|
%
|
14.5
|
%
|
|||
|
Improvement in adjusted EBIT Margin in basis points (“bps”)
|
60bps
|
|
10bps
|
|
110bps
|
|
|||
|
Increase in adjusted EPS
|
14.5
|
%
|
10.1
|
%
|
15.2
|
%
|
|||
20
SUMMARY OF OPERATING RESULTS
|
Percent Change
|
||||||||||||||||||
|
Increase (Decrease)
|
||||||||||||||||||
|
For the years ended December 31,
|
2012
|
2011
|
2010
|
2012-2011
|
|
2011-2010
|
||||||||||||
|
In millions of dollars except per share amounts
|
||||||||||||||||||
|
Net Sales
|
$
|
6,644.3
|
|
$
|
6,080.8
|
|
$
|
5,671.0
|
|
9.3
|
%
|
7.2
|
%
|
|||||
|
Cost of Sales
|
3,784.4
|
|
3,548.9
|
|
3,255.8
|
|
6.6
|
|
9.0
|
|
||||||||
|
Gross Profit
|
2,859.9
|
|
2,531.9
|
|
2,415.2
|
|
13.0
|
|
4.8
|
|
||||||||
|
Gross Margin
|
43.0
|
%
|
41.6
|
%
|
42.6
|
%
|
||||||||||||
|
SM&A Expense
|
1,703.8
|
|
1,477.8
|
|
1,426.5
|
|
15.3
|
|
3.6
|
|
||||||||
|
SM&A Expense as a percent of sales
|
25.6
|
%
|
24.3
|
%
|
25.2
|
%
|
||||||||||||
|
Business Realignment and Impairment
Charges (Credits), Net
|
45.0
|
|
(0.9
|
)
|
83.4
|
|
N/A
|
|
(101.1
|
)
|
||||||||
|
EBIT
|
1,111.1
|
|
1,055.0
|
|
905.3
|
|
5.3
|
|
16.5
|
|
||||||||
|
EBIT Margin
|
16.7
|
%
|
17.4
|
%
|
16.0
|
%
|
||||||||||||
|
Interest Expense, Net
|
95.6
|
|
92.2
|
|
96.4
|
|
3.7
|
|
(4.4
|
)
|
||||||||
|
Provision for Income Taxes
|
354.6
|
|
333.9
|
|
299.1
|
|
6.2
|
|
11.6
|
|
||||||||
|
Effective Income Tax Rate
|
34.9
|
%
|
34.7
|
%
|
37.0
|
%
|
||||||||||||
|
Net Income
|
$
|
660.9
|
|
$
|
628.9
|
|
$
|
509.8
|
|
5.1
|
|
23.4
|
|
|||||
|
Net Income Per Share—Diluted
|
$
|
2.89
|
|
$
|
2.74
|
|
$
|
2.21
|
|
5.5
|
|
24.0
|
|
|||||
Net Sales
2012 compared with 2011
Net sales increased 9.3% in 2012 compared with 2011 due to net price realization and sales volume increases in the U.S. and for our international businesses. Net price realization contributed approximately 5.7% to the net sales increase. Sales volume increased net sales by approximately 2.2% due primarily to sales of new products in the U.S. The Brookside acquisition contributed approximately 1.9% to the net sales increase. These increases were partially offset by the unfavorable impact of foreign currency exchange rates which reduced net sales by approximately 0.5%.
Excluding incremental sales from the Brookside acquisition, net sales in the U.S. increased approximately 7.1% compared with 2011, primarily reflecting net price realization, along with sales volume increases from the introduction of new products. Net sales in U.S. dollars for our businesses outside of the U.S. increased approximately 9.1% in 2012 compared with 2011, reflecting sales volume increases and net price realization. Net sales increases for our international businesses were offset somewhat by the impact of unfavorable foreign currency exchange rates.
2011 compared with 2010
Net sales increased 7.2% in 2011 compared with 2010 due to net price realization and sales volume increases in the U.S. and for our international businesses. Net price realization contributed approximately 3.5% to the net sales increase primarily due to the impact of list price increases, offset somewhat by higher promotional rates. Sales volume increased net sales by approximately 3.4% due primarily to sales of new products in the U.S. The favorable impact of foreign currency exchange rates increased net sales by approximately 0.3%.
Net sales in the U.S. increased approximately 5.9% compared with 2010, with essentially equal contribution from net price realization and sales volume gains. Net sales for our businesses outside of the U.S. increased approximately 14.5% in 2011 compared with 2010, reflecting sales volume increases and net price realization, particularly for our focus markets in Mexico, Brazil, China and India.
21
Key U.S. Marketplace Metrics
|
For the 52 weeks ended December 31,
|
2012
|
2011
|
2010
|
||||||
|
Consumer Takeaway Increase
|
5.7
|
%
|
7.8
|
%
|
5.3
|
%
|
|||
|
Market Share Increase
|
0.6
|
|
0.8
|
|
0.3
|
|
|||
Consumer takeaway and the change in market share for 2012 are provided for measured channels of distribution accounting for approximately 90% of our U.S. confectionery retail business. These channels of distribution primarily include food, drug, mass merchandisers, including Wal-Mart Stores, Inc., and convenience stores.
Consumer takeaway for 2011 and 2010 is provided for channels of distribution accounting for approximately 80% of our U.S. confectionery retail business. These channels of distribution include food, drug, mass merchandisers, including Wal-Mart Stores, Inc., and convenience stores. The change in market share for 2011 and 2010 is provided for channels measured by syndicated data which include sales in the food, drug, convenience store and mass merchandiser classes of trade, excluding sales of Wal-Mart Stores, Inc.
Cost of Sales and Gross Margin
2012 compared with 2011
The cost of sales increase of 6.6% in 2012 compared with 2011 was primarily due to higher input costs, the impact of sales volume increases and higher supply chain costs which together increased cost of sales by approximately 7.1%. An increase in cost of sales of 2.0% resulted from the Brookside acquisition. Supply chain productivity improvements reduced cost of sales by approximately 2.5%. Business realignment and impairment charges of $36.4 million were included in cost of sales in 2012, compared with $45.1 million in the prior year.
Gross margin increased by 1.4 percentage points in 2012 compared with 2011, primarily as a result of price realization and supply chain productivity improvements which together improved gross margin by 4.1 percentage points. These improvements were substantially offset by higher input and supply chain costs which reduced gross margin by a total of 2.9 percentage points. The impact of lower business realignment and impairment charges recorded in 2012 compared with 2011 increased gross margin by 0.2 percentage points.
2011 compared with 2010
The cost of sales increase of 9.0% in 2011 compared with 2010 was primarily associated with higher sales volume and significantly higher commodity costs which together increased cost of sales by approximately 8.0%, each contributing about half of the increase. Increases in other supply chain costs were essentially offset by productivity improvements. Business realignment and impairment charges of $45.1 million were included in cost of sales in 2011, compared with $13.7 million in the prior year, contributing approximately 1.0% of the cost of sales increase.
Gross margin decreased by 1.0 percentage point in 2011 compared with 2010. Higher commodity and other supply chain costs reduced gross margin by about 3.2 percentage points, substantially offset by productivity improvements and price realization of approximately 2.8 percentage points. Supply chain productivity and net price realization each contributed approximately half of this gross margin improvement. The impact of higher business realignment and impairment charges recorded in 2011 compared with 2010 reduced gross margin by 0.6 percentage points.
Selling, Marketing and Administrative
2012 compared with 2011
Selling, marketing and administrative expenses increased $226.0 million or 15.3% in 2012. The increase was primarily a result of increased advertising, marketing research and consumer promotion expenses, higher employee-related expenses, increased incentive compensation costs and expenses associated with the Brookside acquisition. In addition, selling, marketing and administrative costs were reduced in 2011 by a $17.0 million gain on the sale of non-core trademark licensing rights. Advertising expense increased approximately 15.9% compared with 2011. Business realignment charges of $2.5 million were included in selling, marketing and administrative expenses in 2012 compared with $5.0 million in 2011.
2011 compared with 2010
Selling, marketing and administrative expenses increased $51.3 million or 3.6% in 2011. The increase was primarily a result of higher marketing and employee-related expenses, offset somewhat by the $17.0 million gain on the sale of non-core
22
trademark licensing rights as well as lower costs related to the consideration of potential acquisitions and divestitures in 2011. Advertising expense increased approximately 5.9% compared with 2010. Selling and administrative expenses increased approximately 6.6%, reflecting investments in enhancing and executing our global go-to-market strategies, including increases in selling, marketing and certain administrative staff levels. Business realignment charges of $5.0 million were included in selling, marketing and administrative expenses in 2011 compared with $1.5 million in 2010.
Business Realignment and Impairment Charges
In June 2010, we announced Project Next Century (the “Next Century program”) as part of our ongoing efforts to create an advantaged supply chain and competitive cost structure. As part of the program, production was to transition from the Company's century-old facility at 19 East Chocolate Avenue in Hershey, Pennsylvania, to an expanded West Hershey facility, which was built in 1992. Production from the 19 East Chocolate Avenue plant, as well as a portion of the workforce, was fully transitioned to the West Hershey facility during 2012.
We estimate that the Next Century program will incur pre-tax charges and non-recurring project implementation costs of $190 million to $200 million. This estimate includes $170 million to $180 million in pre-tax business realignment and impairment charges and approximately $20 million in project implementation and start-up costs, in addition to pension settlement losses of $15.8 million which were recorded in 2012. As of December 31, 2012, total costs of $173.6 million have been recorded over the last three years for the Next Century program. Total costs of $76.3 million were recorded during 2012. Total costs of $43.4 million were recorded in 2011 and total costs of $53.9 million were recorded in 2010.
In September 2011, we entered into a sale and leasing agreement for the 19 East Chocolate Avenue manufacturing facility with Chocolate Realty DST, a Delaware Statutory Trust. Chocolate Realty DST is not affiliated with the Milton Hershey School Trust. We are leasing a portion of the building for administrative office space under the agreement. As a result of our continuing involvement and use of the property, we are deemed to be the owner of the property for accounting purposes. We received net proceeds of $47.6 million and recorded a lease financing obligation of $50.0 million under the leasing agreement in 2011. The initial term of the agreement expires in 2041.
In December 2012, the Board of Directors of Tri-US, Inc. decided to immediately cease operations and dissolve the company as a result of operational difficulties, quality issues and competitive constraints. In December 2012, the Company recorded non-cash asset impairment charges of approximately $7.5 million, primarily associated with the write off of goodwill and other intangible assets, including a reduction to reflect the share of the charges associated with the noncontrolling interests.
During the second quarter of 2010 we completed an impairment evaluation of goodwill and other intangible assets associated with Godrej Hershey Ltd. Based on this evaluation, we recorded a non-cash goodwill impairment charge of $44.7 million, including a reduction to reflect the share of the charge associated with the noncontrolling interests.
During 2009, we completed our comprehensive, three-year supply chain transformation program (the “global supply chain transformation program”).
23
Charges (credits) associated with business realignment initiatives and impairment recorded during 2012, 2011 and 2010 were as follows:
|
For the years ended December 31,
|
2012
|
2011
|
2010
|
|||||||||
|
In thousands of dollars
|
||||||||||||
|
Cost of sales
|
||||||||||||
|
Next Century program
|
$
|
36,383
|
|
$
|
39,280
|
|
$
|
13,644
|
|
|||
|
Global supply chain transformation program
|
—
|
|
5,816
|
|
—
|
|
||||||
|
Total cost of sales
|
36,383
|
|
45,096
|
|
13,644
|
|
||||||
|
Selling, marketing and administrative - Next Century program
|
2,446
|
|
4,961
|
|
1,493
|
|
||||||
|
Business realignment and impairment charges, net
|
||||||||||||
|
Next Century program:
|
||||||||||||
|
Pension settlement loss
|
15,787
|
|
—
|
|
—
|
|
||||||
|
Plant closure expenses and fixed asset impairment
|
20,780
|
|
8,620
|
|
5,516
|
|
||||||
|
Employee separation costs (credits)
|
914
|
|
(9,506
|
)
|
33,225
|
|
||||||
|
Tri-US, Inc. asset impairment charges
|
7,457
|
|
—
|
|
—
|
|
||||||
|
Godrej Hershey Ltd. goodwill impairment
|
—
|
|
—
|
|
44,692
|
|
||||||
|
Total business realignment and impairment charges (credits), net
|
44,938
|
|
(886
|
)
|
83,433
|
|
||||||
|
Total net charges associated with business realignment initiatives and impairment
|
$
|
83,767
|
|
$
|
49,171
|
|
$
|
98,570
|
|
|||
Next Century Program
The charge of $36.4 million recorded in cost of sales during 2012 related primarily to start-up costs and accelerated depreciation of fixed assets over a reduced estimated remaining useful life associated with the Next Century program. A charge of $2.4 million was recorded in selling, marketing and administrative expenses during 2012 for project administration related to the Next Century program. The level of lump sum withdrawals during 2012 from one of the Company's pension plans by employees retiring or leaving the Company, primarily under the Next Century program, resulted in a non-cash pension settlement loss of $15.8 million. Expenses of $20.8 million were recorded in 2012 primarily related to costs associated with the closure of a manufacturing facility and the relocation of production lines.
The charge of $39.3 million recorded in cost of sales during 2011 related primarily to accelerated depreciation of fixed assets over a reduced estimated remaining useful life associated with the Next Century program. A charge of $5.0 million was recorded in selling, marketing and administrative expenses during 2011 for project administration related to the Next Century program. Plant closure expenses of $8.6 million were recorded in 2011 primarily related to costs associated with the relocation of production lines. Employee separation costs were reduced by $9.5 million during 2011, which consisted of an $11.2 million credit reflecting lower expected costs related to voluntary and involuntary terminations at the two manufacturing facilities and a net benefits curtailment loss of $1.7 million also related to the employee terminations.
The charge of $13.6 million recorded in cost of sales during 2010 related primarily to accelerated depreciation of fixed assets over a reduced estimated remaining useful life associated with the Next Century program. A charge of $1.5 million was recorded in selling, marketing and administrative expenses during 2010 for project administration. Fixed asset impairment charges of $5.5 million were recorded during 2010. In determining the costs related to fixed asset impairments, fair value was estimated based on the expected sales proceeds. Employee separation costs of $33.2 million during 2010 were related to expected voluntary and involuntary terminations at the two manufacturing facilities.
Global Supply Chain Transformation Program
The charge of $5.8 million recorded in 2011 was due to a decline in the estimated net realizable value of two properties being held for sale.
24
Tri-US, Inc. Impairment Charges
In February 2011, we acquired a 49% interest in Tri-US, Inc. of Boulder, Colorado, a company that manufactures, markets and sells nutritional beverages under the “
mix1
” brand name. We invested $5.8 million and accounted for this investment using the equity method until January 2012. In January 2012, we made an additional investment of $6.0 million in Tri-US, Inc., resulting in a controlling ownership interest of approximately 69%. In December 2012, the Board of Directors of Tri-US, Inc. decided to immediately cease operations and dissolve the company as a result of operational difficulties, quality issues and competitive constraints. It was determined that investments necessary to continue the business would not generate a sufficient return. Accordingly, in December 2012, the Company recorded non-cash asset impairment charges of approximately $7.5 million, primarily associated with the write off of goodwill and other intangible assets. These charges excluded the portion of the losses attributable to the noncontrolling interests.
Godrej Hershey Ltd. Goodwill Impairment
As a result of operating performance that was below expectations, we completed an impairment evaluation of goodwill and other intangible assets of Godrej Hershey Ltd. during the second quarter of 2010. As a result of reduced expectations for future cash flows from lower than expected profitability, we determined that the carrying amount of Godrej Hershey Ltd. exceeded its fair value. As a result, we recorded a non-cash goodwill impairment charge of $44.7 million to reduce the carrying value of Godrej Hershey Ltd. to its fair value, including a reduction to reflect the share of the charge associated with the noncontrolling interests. There was no tax benefit associated with this charge. For more information on our accounting policies for goodwill and other intangible assets see pages 44 and 45.
Liabilities Associated with Business Realignment Initiatives
As of December 31, 2012, the liability balance relating to the Next Century program was $7.6 million primarily for estimated employee separation costs which were recorded in 2011 and 2010. We made payments against the liabilities recorded for the Next Century program of $12.8 million in 2012 and $2.2 million in 2011 related to employee separation and project administration costs and the remainder will be paid in 2013.
Income Before Interest and Income Taxes and EBIT Margin
2012 compared with 2011
EBIT increased in 2012 compared with 2011 as a result of higher gross profit, substantially offset by higher selling, marketing and administrative expenses, and business realignment and impairment charges. Pre-tax net business realignment and impairment charges of $83.8 million were recorded in 2012 compared with $49.2 million recorded in 2011.
EBIT margin decreased from 17.4% in 2011 to 16.7% in 2012 primarily as a result of higher selling, marketing and administrative expenses as a percentage of sales and the impact of higher business realignment and impairment costs which more than offset the increase in gross margin. EBIT margin in 2012 was reduced by 0.3 percentage points compared with 2011 as a result of the gain on the sale of trademark licensing rights recorded in 2011. The net impact of business realignment, impairment and acquisition charges recorded in 2012 reduced EBIT margin by 1.3 percentage points. Net business realignment and impairment charges recorded in 2011 reduced EBIT margin by 0.8 percentage points.
2011 compared with 2010
EBIT increased in 2011 compared with 2010 as a result of higher gross profit and lower business realignment and impairment charges. Higher selling, marketing and administrative expenses were offset somewhat by the pre-tax gain of $17.0 million on the sale of trademark licensing rights. Pre-tax net business realignment and impairment charges of $49.2 million were recorded in 2011 compared with $98.6 million recorded in 2010.
EBIT margin increased from 16.0% in 2010 to 17.4% in 2011 primarily as a result of the impact of lower business realignment and impairment charges and lower selling, marketing and administrative expenses as a percentage of sales. The gain on the sale of trademark licensing rights increased EBIT margin by 0.3 percentage points in 2011. The net impact of business realignment and impairment charges recorded in 2011 reduced EBIT margin by 0.8 percentage points. Net business realignment and impairment charges recorded in 2010 reduced EBIT margin by 1.7 percentage points.
Interest Expense, Net
2012 compared with 2011
Net interest expense in 2012 was higher than in 2011 primarily as a result of higher short-term borrowings and a decrease in capitalized interest, partially offset by lower interest expense on long-term debt.
2011 compared with 2010
Net interest expense in 2011 was lower than in 2010 as a result of increased capitalized interest and a reduction of
25
$5.9 million associated with the tender offer and repurchase of $57.5 million of 6.95% Notes recorded in December 2010. These reductions were partially offset by increased interest expense resulting from higher average outstanding short-term debt.
Income Taxes and Effective Tax Rate
2012 compared with 2011
Our effective income tax rate was 34.9% for 2012 compared with 34.7% for 2011. The effective income tax rate was slightly higher in 2012 primarily reflecting the impact of tax rates associated with business realignment and impairment charges recorded in 2012 compared with 2011 and the mix of the Company's income among various tax jurisdictions.
2011 compared with 2010
Our effective income tax rate was 34.7% for 2011 compared with 37.0% for 2010. The effective income tax rate was reduced by 0.1 percentage points in 2011 as a result of the effective tax rates associated with the gain on the sale of trademark licensing rights and business realignment and impairment charges. In 2010, the effective income tax rate was increased by 1.8 percentage points as a result of the tax rates associated with business realignment and impairment charges recorded during the period. Excluding the impact of tax rates associated with the gain on sale of the trademark licensing rights and business realignment and impairment charges, our effective tax rate decreased in 2011 as a result of discrete tax benefits recognized in 2011.
Net Income and Net Income Per Share
2012 compared with 2011
Earnings per share-diluted increased $0.15, or 5.5% in 2012 compared with 2011. Net income in 2012 was reduced by $57.2 million, or $0.25 per share-diluted, as a result of net business realignment and impairment charges. Net income was reduced by $9.2 million, or $0.04 per share-diluted, in 2012 as a result of closing and integration costs for the Brookside acquisition and by $12.7 million or $0.06 per share-diluted related to non-service-related pension expenses in 2012. In 2011, net income was increased by $11.1 million, or $0.05 per share-diluted, as a result of the gain on sale of trademark licensing rights and reduced by $30.9 million, or $0.13 per share-diluted, as a result of net business realignment and impairment charges. Non-service-related pension expenses reduced net income by $2.0 million, or $0.01 per share-diluted in 2011. Excluding the impact of business realignment and impairment charges and non-service-related pension expenses from both periods, the acquisition closing and integration costs in 2012 and the gain on the sale of trademark licensing rights in 2011, adjusted earnings per share-diluted increased $0.41 per share, or 14.5% in 2012 compared with 2011.
2011 compared with 2010
Earnings per share-diluted increased $0.53, or 24.0% in 2011 compared with 2010. Net income in 2011 was increased by $11.1 million, or $0.05 per share-diluted, as a result of the gain on sale of trademark licensing rights and was reduced by $30.9 million, or $0.13 per share-diluted, as a result of net business realignment and impairment charges. In 2010, net income was reduced by $77.9 million or $0.34 per share-diluted as a result of business realignment and impairment charges. Net income was reduced by $2.0 million, or $0.01 per share-diluted, in 2011 and by $3.8 million, or $0.02 per share-diluted, in 2010 as a result of non-service-related pension expenses. Excluding the gain on the sale of trademark licensing rights and the impact of business realignment and impairment charges and non-service-related pension expenses, adjusted earnings per share-diluted increased $0.26 per share, or 10.1% in 2011 compared with 2010.
FINANCIAL CONDITION
Our financial condition remained strong during 2012 reflecting strong cash flow from operations.
Business Acquisitions
Acquisitions of businesses are accounted for as purchases and, accordingly, their results of operations have been included in the consolidated financial statements since the respective dates of the acquisitions. The purchase price for each of the acquisitions is allocated to the assets acquired and liabilities assumed.
In January 2012, we acquired all of the outstanding stock of Brookside Foods Ltd. (“Brookside”), a privately held confectionery company based in Abbottsford, British Columbia, Canada. As part of this transaction, we acquired two production facilities located in British Columbia and Quebec. The Brookside product line is primarily sold in the U.S. and Canada in a take home re-sealable pack type. At the time of the acquisition, annual net sales of the business were approximately $90 million. The business complements our position in North America and we are making investments in manufacturing capabilities and conducting market research that will enable future growth.
26
Our financial statements reflect the final accounting for the Brookside acquisition. The purchase price for the acquisition was approximately $172.9 million. The purchase price allocation of the Brookside acquisition is as follows:
|
In thousands of dollars
|
Purchase Price Allocation
|
Estimated Useful Life in Years
|
|||||
|
Goodwill
|
$
|
67,974
|
|
Indefinite
|
|||
|
Trademarks
|
60,253
|
|
25
|
||||
|
Other intangibles
(1)
|
51,057
|
|
6
|
to
|
17
|
||
|
Other assets, net of liabilities assumed of $18.7 million
|
21,673
|
|
|||||
|
Non-current deferred tax liabilities
|
(28,101
|
)
|
|||||
|
Purchase Price
|
$
|
172,856
|
|
||||
|
(1)
|
Includes customer relationships, patents and covenants not to compete.
|
The excess purchase price over the estimated value of the net tangible and identifiable intangible assets was recorded to goodwill. The goodwill is not expected to be deductible for tax purposes.
In February 2011, we acquired a 49% interest in Tri-US, Inc. of Boulder, Colorado, a company that manufactures, markets and sells nutritional beverages under the “
mix1
” brand name. We invested $5.8 million and accounted for this investment using the equity method until January 2012. In January 2012, we made an additional investment of $6.0 million in Tri-US, Inc., resulting in a controlling ownership interest of approximately 69%. In December 2012, the Board of Directors of Tri-US, Inc. decided to immediately cease operations and dissolve the company as a result of operational difficulties, quality issues and competitive constraints. It was determined that investments necessary to continue the business would not generate a sufficient return. Accordingly, in December 2012, the Company recorded non-cash impairment charges of approximately $7.5 million, primarily associated with the write off of goodwill and other intangible assets. These charges excluded the portion attributable to the noncontrolling interests in Tri-US, Inc.
We included results subsequent to the acquisition dates in the consolidated financial statements. If we had included the results of the acquisitions in the consolidated financial statements for each of the periods presented, the effect would not have been material.
Assets
A summary of our assets is as follows:
|
December 31,
|
2012
|
2011
|
||||||
|
In thousands of dollars
|
||||||||
|
Current assets
|
$
|
2,113,485
|
|
$
|
2,046,558
|
|
||
|
Property, plant and equipment, net
|
1,674,071
|
|
1,559,717
|
|
||||
|
Goodwill and other intangibles
|
802,716
|
|
628,658
|
|
||||
|
Deferred income taxes
|
12,448
|
|
33,439
|
|
||||
|
Other assets
|
152,119
|
|
138,722
|
|
||||
|
Total assets
|
$
|
4,754,839
|
|
$
|
4,407,094
|
|
||
|
l
|
The change in current assets from 2011 to 2012 was primarily due to the following:
|
|
|
Ÿ
|
Higher cash and cash equivalents in 2012 reflecting strong cash flow from operations and short-term borrowings which exceeded our cash requirements for the year;
|
|
|
Ÿ
|
An increase in accounts receivable reflecting higher sales in December 2012 compared with December 2011, in addition to incremental accounts receivable associated with the Brookside acquisition;
|
|
27
|
Ÿ
|
Raw materials and finished goods inventories were higher due to increased costs and the Brookside acquisition in 2012, however, these increases were partially offset by a decline in raw material inventories associated with manufacturing requirements and lower finished goods inventories which were higher at the end of 2011 in anticipation of the transition of production to our West Hershey manufacturing facility in 2012. In addition, the impact of inventory cost increases in 2012 was offset by adjustments associated with inventories valued under the last-in, first-out method, resulting in lower total inventories as of December 31, 2012; and
|
|
|
Ÿ
|
A decrease in deferred income taxes principally related to the effect of hedging transactions.
|
|
|
l
|
Property, plant and equipment was higher in 2012, reflecting capital additions of $258.7 million, partly offset by depreciation expense of $174.8 million. Depreciation expense included accelerated depreciation of fixed assets of $15.3 million at a manufacturing facility that was closed during 2012, as well as certain asset retirements resulting primarily from the Next Century program.
|
|
|
l
|
Goodwill and other intangibles increased primarily due to the Brookside acquisition.
|
|
|
l
|
Other assets increased primarily due to the loan to our affiliate in China to finance the expansion of manufacturing capacity.
|
|
Liabilities
A summary of our liabilities is as follows:
|
December 31,
|
2012
|
2011
|
||||||
|
In thousands of dollars
|
||||||||
|
Current liabilities
|
$
|
1,471,110
|
|
$
|
1,173,775
|
|
||
|
Long-term debt
|
1,530,967
|
|
1,748,500
|
|
||||
|
Other long-term liabilities
|
668,732
|
|
603,876
|
|
||||
|
Deferred income taxes
|
35,657
|
|
—
|
|
||||
|
Total liabilities
|
$
|
3,706,466
|
|
$
|
3,526,151
|
|
||
|
l
|
Changes in current liabilities from 2011 to 2012 were primarily the result of the following:
|
|
|
Ÿ
|
Higher accounts payable reflecting the timing of payments associated with inventory deliveries to support manufacturing requirements and an increase in amounts payable for marketing programs, partially offset by lower amounts payable for capital expenditures;
|
|
|
Ÿ
|
Higher accrued liabilities related to promotions, incentive compensation and interest rate swap agreements, partially offset by lower liabilities associated with the Next Century program and employee benefits;
|
|
|
Ÿ
|
An increase in short-term debt primarily associated with the financing of the Brookside acquisition in January 2012, along with higher short-term borrowings for certain international businesses, partially offset by the repayment of short-term debt of Godrej Hershey Ltd. after we acquired the remaining 49% interest in September 2012; and
|
|
|
Ÿ
|
An increase in the current portion of long-term debt reflecting the reclassification of $250 million of 5.0% Notes due in 2013 from long-term debt, partially offset by the repayment of 6.95% Notes in 2012.
|
|
|
l
|
A decrease in long-term debt reflecting the reclassification of $250 million of 5.0% Notes due in November 2013, partially offset by obligations under an agreement with the Ferrero Group (“Ferrero”), an international packaged goods company, for the construction of a warehouse and distribution facility.
|
|
|
l
|
An increase in other long-term liabilities reflecting the change in the funded status of our pension plans as of December 31, 2012.
|
|
|
l
|
Deferred income tax liabilities as of December 31, 2012, resulting from temporary differences related to certain intangible assets associated with the Brookside acquisition.
|
|
28
Capital Structure
We have two classes of stock outstanding, Common Stock and Class B Stock. Holders of the Common Stock and the Class B Stock generally vote together without regard to class on matters submitted to stockholders, including the election of directors. Holders of the Common Stock have one vote per share. Holders of the Class B Stock have 10 votes per share. Holders of the Common Stock, voting separately as a class, are entitled to elect one-sixth of our Board of Directors. With respect to dividend rights, holders of the Common Stock are entitled to cash dividends 10% higher than those declared and paid on the Class B Stock.
Hershey Trust Company, as trustee for the benefit of Milton Hershey School maintains voting control over The Hershey Company. In this section, we refer to Hershey Trust Company, in its capacity as trustee for the benefit of Milton Hershey School, as the “Milton Hershey School Trust” or the “Trust.” In addition, the Milton Hershey School Trust currently has three representatives who are members of the Board of Directors of the Company, one of whom is the Chairman of the Board. These representatives, from time to time in performing their responsibilities on the Company’s Board, may exercise influence with regard to the ongoing business decisions of our Board of Directors or management. The Trust has indicated that, in its role as controlling stockholder of the Company, it intends to retain its controlling interest in The Hershey Company and the Company Board, and not the Trust Board, is solely responsible and accountable for the Company’s management and performance.
As previously reported, Pennsylvania enacted legislation that requires that the Office of Attorney General be provided advance notice of any transaction that would result in the Milton Hershey School Trust no longer having voting control of the Company. The law provides specific statutory authority for the Attorney General to intercede and petition the Court having jurisdiction over the Milton Hershey School Trust to stop such a transaction if the Attorney General can prove that the transaction is unnecessary for the future economic viability of the Company and is inconsistent with investment and management considerations under fiduciary obligations. This legislation could have the effect of making it more difficult for a third party to acquire a majority of our outstanding voting stock and thereby delay or prevent a change in control of the Company.
Noncontrolling Interests in Subsidiaries
In May 2007, we entered into an agreement with Godrej Beverages and Foods, Ltd., a consumer goods, confectionery and food company, to manufacture and distribute confectionery products, snacks and beverages across India. Under the agreement, we owned a 51% controlling interest in Godrej Hershey Ltd. In June 2010, the Company and the noncontrolling interests executed a rights agreement with Godrej Hershey Ltd. in the form of unsecured compulsorily and fully convertible debentures. The Company contributed cash of approximately $11.1 million and the noncontrolling interests contributed $9.3 million associated with the rights agreement. The ownership interest percentages in Godrej Hershey Ltd. did not change significantly as a result of these contributions. The noncontrolling interests in Godrej Hershey Ltd. were included in the equity section of the Consolidated Balance Sheets. In September 2012, we acquired the remaining 49% interest in Godrej Hershey Ltd. for approximately $15.8 million. Since the Company had a controlling interest in Godrej Hershey Ltd., the difference between the amount paid and the carrying amount of the noncontrolling interest of $10.3 million was recorded as a reduction to additional paid-in capital and the noncontrolling interest in Godrej Hershey Ltd. was eliminated as of September 30, 2012.
We own a 51% controlling interest in Hershey do Brasil under a cooperative agreement with Pandurata Netherlands B.V. (“Bauducco”), a leading manufacturer of baked goods in Brazil whose primary brand is Bauducco. During 2012, the Company contributed cash of approximately $3.1 million to Hershey do Brasil and Bauducco contributed approximately $2.9 million. During 2012, we also loaned $7.0 million to Hershey do Brasil to finance manufacturing capacity expansion. In September 2010, the Company contributed cash of approximately $1.0 million to Hershey do Brasil and Bauducco contributed approximately $0.9 million. The noncontrolling interest in Hershey do Brasil is included in the equity section of the Consolidated Balance Sheets.
The decrease in noncontrolling interests in subsidiaries from $23.6 million as of December 31, 2011 to $11.6 million as of December 31, 2012 reflected the impact of the acquisition of the remaining 49% interest in Godrej Hershey Ltd. in September 2012 and the noncontrolling interests’ share of losses of these entities, as well as the impact of currency translation adjustments. These decreases were partially offset by the impact of the cash contributed by Bauducco. The share of losses pertaining to the noncontrolling interests in subsidiaries was $9.6 million for the year ended December 31, 2012, $7.4 million for the year ended December 31, 2011 and $8.2 million for the year ended December 31, 2010. This was reflected in selling, marketing and administrative expenses.
29
LIQUIDITY AND CAPITAL RESOURCES
Our principal source of liquidity is operating cash flows. Our net income and, consequently, our cash provided from operations are impacted by: sales volume, seasonal sales patterns, timing of new product introductions, profit margins and price changes. Sales are typically higher during the third and fourth quarters of the year due to seasonal and holiday-related sales patterns. Generally, working capital needs peak during the summer months. We meet these needs primarily by utilizing cash on hand or by issuing commercial paper.
Cash Flows from Operating Activities
Our cash flows provided from (used by) operating activities were as follows:
|
For the years ended December 31,
|
2012
|
2011
|
2010
|
|||||||||
|
In thousands of dollars
|
||||||||||||
|
Net income
|
$
|
660,931
|
|
$
|
628,962
|
|
$
|
509,799
|
|
|||
|
Depreciation and amortization
|
210,037
|
|
215,763
|
|
197,116
|
|
||||||
|
Stock-based compensation and excess tax benefits
|
16,606
|
|
29,471
|
|
48,083
|
|
||||||
|
Deferred income taxes
|
13,785
|
|
33,611
|
|
(18,654
|
)
|
||||||
|
Gain on sale of trademark licensing rights, net of tax
|
—
|
|
(11,072
|
)
|
—
|
|
||||||
|
Non-cash business realignment and impairment
charges
|
38,144
|
|
34,660
|
|
62,104
|
|
||||||
|
Contributions to pension and other benefit plans
|
(44,208
|
)
|
(31,671
|
)
|
(27,723
|
)
|
||||||
|
Working capital
|
(2,133
|
)
|
(116,909
|
)
|
96,853
|
|
||||||
|
Changes in other assets and liabilities
|
201,665
|
|
(194,948
|
)
|
33,845
|
|
||||||
|
Net cash provided from operating activities
|
$
|
1,094,827
|
|
$
|
587,867
|
|
$
|
901,423
|
|
|||
|
l
|
Over the past three years, total cash provided from operating activities was approximately $2.6 billion.
|
|
l
|
Depreciation and amortization expenses decreased in 2012, as compared with 2011, principally as the result of lower accelerated depreciation charges related to the Next Century program somewhat offset by higher depreciation and amortization charges related to the Brookside acquisition. Depreciation and amortization expenses increased in 2011, in comparison with 2010, primarily due to higher accelerated depreciation charges related to the Next Century program. Accelerated depreciation recorded in 2012 was approximately $15.3 million compared with approximately $33.0 million recorded in 2011 and $12.4 million recorded in 2010. Depreciation and amortization expenses represent non-cash items that impacted net income and are reflected in the consolidated statements of cash flows to reconcile cash flows from operating activities.
|
|
l
|
The deferred income tax provision was lower in 2012 than in 2011 primarily as a result of the lower tax impact associated with bonus depreciation resulting from reduced capital expenditures in 2012 for the Next Century program. The deferred tax provision in 2011 primarily reflected the tax impact associated with bonus depreciation related to capital expenditures and other charges recorded in 2011 for the Next Century program. The deferred income tax benefit in 2010 primarily resulted from the tax impact of deferred taxes associated with charges recorded in 2010 for the Next Century program. Deferred income taxes represent non-cash items that impacted net income and are reflected in the consolidated statements of cash flows to reconcile cash flows from operating activities.
|
|
l
|
During the third quarter of 2011, we recorded an $11.1 million gain, net of tax, on the sale of certain non-core trademark licensing rights.
|
|
l
|
We contributed $103.6 million to our pension and other benefit plans over the past three years primarily to pay benefits under the non-funded pension plans and our other benefit plans.
|
30
|
l
|
Over the three-year period, cash provided from working capital tended to fluctuate due to the timing of sales and cash collections during December of each year and working capital management practices, including initiatives implemented to reduce working capital. The increase in cash used by accounts receivable in 2012 was associated with higher sales in December 2012 compared with December 2011. Cash provided from changes in inventories in 2012 resulted from lower inventory levels which were higher at the end of 2011 in anticipation of the transition of production under the Next Century program. The increase in cash provided from changes in accounts payable in 2012 were associated with the timing of payments for inventory deliveries and marketing programs. Changes in cash used by inventories in 2011 was primarily associated with increases in inventory levels in anticipation of the transition of production under the Next Century program, along with higher inventories to support seasonal sales. Changes in cash provided by accounts payable in 2010 principally related to the timing of inventory deliveries to meet manufacturing requirements and, in 2010, also reflected increases in accounts payable associated with the timing of expenditures for advertising.
|
|
l
|
During the three-year period, cash provided from or used by changes in other assets and liabilities reflected the effect of hedging transactions and the impact of business realignment initiatives, along with the related tax effects. Cash provided from changes in other assets and liabilities in 2012 compared with cash used by changes in other assets and liabilities in 2011 primarily reflected the effect of hedging transactions of $304.2 million, the effect of changes in deferred and accrued income taxes of $44.1 million and business realignment initiatives of $46.8 million. Cash used by changes in other assets and liabilities in 2011 compared with cash provided by changes in other assets and liabilities in 2010 was primarily associated with the effect of hedging transactions of $158.5 million and the effect of changes in deferred and accrued income taxes of $35.4 million and business realignment initiatives of $26.7 million, partially offset by an increase in cash provided by the timing of payments associated with selling and marketing programs of $23.2 million.
|
|
l
|
Taxable income and related tax payments in 2012 and 2011 were reduced primarily by bonus depreciation tax deductions driven by capital expenditures associated with the Next Century program. This was offset somewhat by increases in income taxes paid associated with higher net income.
|
Cash Flows from Investing Activities
Our cash flows provided from (used by) investing activities were as follows:
|
For the years ended December 31,
|
2012
|
2011
|
2010
|
|||||||||
|
In thousands of dollars
|
||||||||||||
|
Capital additions
|
$
|
(258,727
|
)
|
$
|
(323,961
|
)
|
$
|
(179,538
|
)
|
|||
|
Capitalized software additions
|
(19,239
|
)
|
(23,606
|
)
|
(21,949
|
)
|
||||||
|
Proceeds from sales of property, plant and equipment
|
453
|
|
312
|
|
2,201
|
|
||||||
|
Proceeds from sale of trademark licensing rights
|
—
|
|
20,000
|
|
—
|
|
||||||
|
Loan to affiliate
|
(23,000
|
)
|
(7,000
|
)
|
—
|
|
||||||
|
Business acquisitions
|
(172,856
|
)
|
(5,750
|
)
|
—
|
|
||||||
|
Net cash used by investing activities
|
$
|
(473,369
|
)
|
$
|
(340,005
|
)
|
$
|
(199,286
|
)
|
|||
|
l
|
Capital additions associated with our Next Century program in 2012 were $74.7 million, in 2011 were $179.4 million and in 2010 were $34.0 million. Other capital additions were primarily related to modernization of existing facilities and purchases of manufacturing equipment for new products.
|
|
l
|
Capitalized software additions were primarily for ongoing enhancement of our information systems.
|
|
l
|
We anticipate total capital expenditures, including capitalized software, of approximately $300 million in 2013.
|
|
l
|
The loans to affiliate in 2012 and 2011 were associated with financing the expansion of capacity under our manufacturing agreement in China with Lotte Confectionery Company LTD.
|
|
l
|
In January 2012, the Company acquired Brookside for approximately $172.9 million.
|
31
Cash Flows from Financing Activities
Our cash flows provided from (used by) financing activities were as follows:
|
For the years ended December 31,
|
2012
|
2011
|
2010
|
|||||||||
|
In thousands of dollars
|
||||||||||||
|
Net change in short-term borrowings
|
$
|
77,698
|
|
$
|
10,834
|
|
$
|
1,156
|
|
|||
|
Long-term borrowings
|
4,025
|
|
249,126
|
|
348,208
|
|
||||||
|
Repayment of long-term debt
|
(99,381
|
)
|
(256,189
|
)
|
(71,548
|
)
|
||||||
|
Proceeds from lease financing agreement
|
—
|
|
47,601
|
|
—
|
|
||||||
|
Cash dividends paid
|
(341,206
|
)
|
(304,083
|
)
|
(283,434
|
)
|
||||||
|
Exercise of stock options and excess tax benefits
|
295,473
|
|
198,408
|
|
93,418
|
|
||||||
|
Net (payments to) contributions from noncontrolling interests
|
(12,851
|
)
|
—
|
|
10,199
|
|
||||||
|
Repurchase of Common Stock
|
(510,630
|
)
|
(384,515
|
)
|
(169,099
|
)
|
||||||
|
Net cash used by financing activities
|
$
|
(586,872
|
)
|
$
|
(438,818
|
)
|
$
|
(71,100
|
)
|
|||
|
l
|
In addition to utilizing cash on hand, we use short-term borrowings (commercial paper and bank borrowings) to fund seasonal working capital requirements and ongoing business needs. The increase in short-term borrowings in 2012 was primarily associated with the Brookside acquisition and our international businesses, partially offset by repayments of Godrej Hershey debt. Additional information on short-term borrowings is included under Borrowing Arrangements below.
|
|
l
|
In November 2011, we issued $250 million of 1.5% Notes due in 2016 and in December 2010, we issued $350 million of 4.125% Notes due in 2020. The long-term borrowings in 2011 and 2010 were issued under a shelf registration statement on Form S-3 filed in May 2009 described under Registration Statements below.
|
|
l
|
In August 2012, we repaid $92.5 million of 6.95% Notes due in 2012. Additionally, in September 2011 we repaid $250.0 million of 5.3% Notes due in 2011.
|
|
l
|
In December 2010, we paid $63.4 million to repurchase $57.5 million of our 6.95% Notes due in 2012 as part of a cash tender offer. As a result of the repurchase, we recorded interest expense of $5.9 million, which reflected the premium paid on the tender offer. We used a portion of the proceeds from the $350 million of 4.125% Notes issued in December 2010 to fund the repurchase.
|
|
l
|
In September 2011, we entered into a sale and leasing agreement for the 19 East Chocolate Avenue manufacturing facility. Based on the leasing agreement, we are deemed to be the owner of the property for accounting purposes. We received net proceeds of $47.6 million and recorded a lease financing obligation of $50.0 million under the leasing agreement.
|
|
l
|
In May 2007, we entered into an agreement with Godrej Beverages and Foods, Ltd., a consumer goods, confectionery and food company, to manufacture and distribute confectionery products, snacks and beverages across India. Under the agreement, we owned a 51% controlling interest in Godrej Hershey Ltd. In September 2012, we acquired the remaining 49% interest in Godrej Hershey Ltd. for approximately $15.8 million. Payments to noncontrolling interests associated with Godrej Hershey Ltd. were partially offset by equity contributions of $2.9 million by the noncontrolling interests in Hershey do Brasil, in addition to the contribution from the noncontrolling interests in Hershey do Brasil received in 2010.
|
|
l
|
We paid cash dividends of $255.6 million on our Common Stock and $85.6 million on our Class B Stock in 2012.
|
|
l
|
Cash used for the repurchase of Common Stock was partially offset by cash received from the exercise of stock options and the impact of excess tax benefits from stock-based compensation.
|
32
Repurchases and Issuances of Common Stock
|
For the years ended December 31,
|
2012
|
2011
|
2010
|
||||||||||||||||||
|
In thousands
|
Shares
|
Dollars
|
Shares
|
Dollars
|
Shares
|
Dollars
|
|||||||||||||||
|
Shares repurchased under authorized programs:
|
|||||||||||||||||||||
|
Open market repurchases
|
2,054
|
|
$
|
124,931
|
|
1,903
|
|
$
|
100,015
|
|
—
|
|
$
|
—
|
|
||||||
|
Shares repurchased to replace reissued shares
|
5,599
|
|
385,699
|
|
5,179
|
|
284,500
|
|
3,932
|
|
169,099
|
|
|||||||||
|
Total share repurchases
|
7,653
|
|
510,630
|
|
7,082
|
|
384,515
|
|
3,932
|
|
169,099
|
|
|||||||||
|
Shares issued for stock-based compensation programs
|
(6,233
|
)
|
(210,924
|
)
|
(5,258
|
)
|
(177,654
|
)
|
(2,964
|
)
|
(96,627
|
)
|
|||||||||
|
Net change
|
1,420
|
|
$
|
299,706
|
|
1,824
|
|
$
|
206,861
|
|
968
|
|
$
|
72,472
|
|
||||||
|
l
|
We intend to repurchase shares of Common Stock in order to replace Treasury Stock shares issued for exercised stock options and other stock-based compensation. The value of shares purchased in a given period will vary based on stock options exercised over time and market conditions.
|
|
l
|
In April 2011, our Board of Directors approved a new $250 million authorization to repurchase shares of our Common Stock. As of December 31, 2012, $125.1 million remained available for repurchases of our Common Stock.
|
Cumulative Share Repurchases and Issuances
A summary of cumulative share repurchases and issuances is as follows:
|
Shares
|
|
Dollars
|
|||||
|
In thousands
|
|||||||
|
Shares repurchased under authorized programs:
|
|||||||
|
Open market repurchases
|
61,393
|
|
$
|
2,209,377
|
|
||
|
Repurchases from the Milton Hershey School Trust
|
11,918
|
|
245,550
|
|
|||
|
Shares retired
|
(1,056
|
)
|
(12,820
|
)
|
|||
|
Total repurchases under authorized programs
|
72,255
|
|
2,442,107
|
|
|||
|
Privately negotiated purchases from the Milton Hershey School Trust
|
67,282
|
|
1,501,373
|
|
|||
|
Shares repurchased to replace reissued shares
|
41,339
|
|
1,902,552
|
|
|||
|
Shares issued for stock-based compensation programs and employee benefits
|
(44,760
|
)
|
(1,287,364
|
)
|
|||
|
Total held as Treasury Stock as of December 31, 2012
|
136,116
|
|
$
|
4,558,668
|
|
||
33
Borrowing Arrangements
We maintain debt levels we consider prudent based on our cash flow, interest coverage ratio and percentage of debt to capital. We use debt financing to lower our overall cost of capital which increases our return on stockholders’ equity.
|
l
|
In October 2011, we entered into a new five-year agreement establishing an unsecured revolving credit facility to borrow up to $1.1 billion, with an option to increase borrowings by an additional $400 million with the consent of the lenders. As of December 31, 2012, $1.1 billion was available to borrow under the agreement. The unsecured revolving credit agreement contains certain financial and other covenants, customary representations, warranties and events of default. As of December 31, 2012, we complied with all of these covenants. We may use these funds for general corporate purposes, including commercial paper backstop and business acquisitions.
|
|
l
|
In addition to the revolving credit facility, we maintain lines of credit with domestic and international commercial banks. As of December 31, 2012, we could borrow up to approximately $176.7 million in various currencies under the lines of credit and as of December 31, 2011, we could borrow up to $76.9 million.
|
Registration Statements
|
l
|
In May 2009, we filed a shelf registration statement on Form S-3 that registered an indeterminate amount of debt securities. This registration statement was effective immediately upon filing under Securities and Exchange Commission regulations governing “well-known seasoned issuers” (the “2009 WKSI Registration Statement”).
|
|
l
|
In November 2011, we issued $250 million of 1.50% Notes due November 1, 2016 and, in December 2010, we issued $350 million of 4.125% Notes due December 1, 2020. The Notes were issued under the 2009 WKSI Registration Statement.
|
|
l
|
The 2009 WKSI Registration Statement expired in May 2012. Accordingly, in May 2012, we filed a new registration statement on Form S-3 to replace the 2009 WKSI Registration Statement. The registration statement filed in May 2012 registered an undeterminate amount of debt securities effective immediately.
|
|
l
|
Proceeds from the debt issuances and any other offerings under the registration statement filed in 2012 may be used for general corporate requirements. These may include reducing existing borrowings; financing capital additions; and funding contributions to our pension plans, future business acquisitions and working capital requirements.
|
OFF-BALANCE SHEET ARRANGEMENTS, CONTRACTUAL OBLIGATIONS AND CONTINGENT LIABILITIES AND COMMITMENTS
As of December 31, 2012, our contractual cash obligations by year were as follows:
|
Payments Due by Year
|
||||||||||||||||||||||||||||
|
In thousands of dollars
|
||||||||||||||||||||||||||||
|
Contractual Obligations
|
2013
|
2014
|
2015
|
2016
|
2017
|
Thereafter
|
Total
|
|||||||||||||||||||||
|
Unconditional Purchase Obligations
|
$
|
1,216,200
|
|
$
|
497,600
|
|
$
|
298,700
|
|
$
|
155,500
|
|
$
|
—
|
|
$
|
—
|
|
$
|
2,168,000
|
|
|||||||
|
Lease Obligations
|
13,688
|
|
11,782
|
|
10,904
|
|
9,881
|
|
8,005
|
|
5,544
|
|
59,804
|
|
||||||||||||||
|
Minimum Pension Plan Funding Obligations
|
2,780
|
|
5,280
|
|
5,650
|
|
5,750
|
|
9,652
|
|
48,335
|
|
77,447
|
|
||||||||||||||
|
Long-term Debt
|
257,734
|
|
854
|
|
250,854
|
|
500,708
|
|
422
|
|
778,129
|
|
1,788,701
|
|
||||||||||||||
|
Total Obligations
|
$
|
1,490,402
|
|
$
|
515,516
|
|
$
|
566,108
|
|
$
|
671,839
|
|
$
|
18,079
|
|
$
|
832,008
|
|
$
|
4,093,952
|
|
|||||||
In entering into contractual obligations, we have assumed the risk that might arise from the possible inability of counterparties to meet the terms of their contracts. We mitigate this risk by performing financial assessments prior to contract execution, conducting periodic evaluations of counterparty performance and maintaining a diverse portfolio of qualified counterparties. As of December 31, 2012, we did not have any material obligations with European financial institutions. Our risk is limited to replacing the contracts at prevailing market rates. We do not expect any significant losses resulting from counterparty defaults.
34
Purchase Obligations
We enter into certain obligations for the purchase of raw materials. These obligations were primarily in the form of forward contracts for the purchase of raw materials from third-party brokers and dealers. These contracts minimize the effect of future price fluctuations by fixing the price of part or all of these purchase obligations. Total obligations for each year presented above consisted of fixed price contracts for the purchase of commodities and unpriced contracts that were valued using market prices as of December 31, 2012.
The cost of commodities associated with the unpriced contracts is variable as market prices change over future periods. We mitigate the variability of these costs to the extent we have entered into commodities futures contracts or other commodity derivative instruments to hedge our costs for those periods. Increases or decreases in market prices are offset by gains or losses on commodities futures contracts or other commodity derivative instruments. This applies to the extent that we have hedged the unpriced contracts as of December 31, 2012 and in future periods by entering into commodities futures contracts. Taking delivery of and making payments for the specific commodities for use in the manufacture of finished goods satisfies our obligations under the forward purchase contracts. For each of the three years in the period ended December 31, 2012, we satisfied these obligations by taking delivery of and making payment for the specific commodities.
Lease Obligations
Lease obligations include the minimum rental commitments under non-cancelable operating leases primarily for offices, retail stores, warehouse and distribution facilities, and certain equipment.
Minimum Pension Plan Funding Obligations
Our policy is to fund domestic pension liabilities in accordance with the minimum and maximum limits imposed by the Employee Retirement Income Security Act of 1974 (“ERISA”) and federal income tax laws. Effective January 1, 2008, we complied with the funding requirements of the Pension Protection Act of 2006. We fund non-domestic pension liabilities in accordance with laws and regulations applicable to those plans. Minimum pension plan funding obligations include our current assumptions and estimates of the minimum required contributions to our defined benefit pension plans through 2018. For more information, see
Note 14, Pension and Other Post-Retirement Benefit Plans
.
Long-term debt primarily includes obligations associated with the issuance of long-term debt instruments.
In February 2012, we entered into agreements with Ferrero, forming an alliance to mutually benefit from various warehousing, co-packing, transportation and procurement services in North America. The initial terms of the agreements are 10 years, with three renewal periods, each with a term of 10 years. The agreements include the construction of a warehouse and distribution facility in Brantford, Ontario, Canada for the mutual use of the Company and Ferrero. Ferrero is responsible for construction of the warehouse and we are responsible for development and implementation of related information systems. Over the term of the agreements, costs associated with the warehouse construction and the information systems will essentially be shared equally.
During 2012, Ferrero made payments of approximately $36.0 million and we made payments of approximately $5.1 million for construction of the facility. Because we were involved with the design of the facility and made payments during the construction period, the Company has been deemed to be the owner of the warehouse and distribution facility for accounting purposes. As a result, we recorded a total of $41.1 million in construction in progress as of December 31, 2012, including the payments made by Ferrero, the legal owner of the facility. A corresponding financing obligation of $36.0 million was recorded as of December 31, 2012, reflecting the amount paid by Ferrero. Of the total financing obligation, $6.2 million was recorded in the current portion of long-term debt reflecting our expected payments in 2013 and the remainder of $29.8 million was recorded in long-term debt.
Asset Retirement Obligations
We have a number of facilities that contain varying amounts of asbestos in certain locations within the facilities. Our asbestos management program is compliant with current applicable regulations. Current regulations require that we handle or dispose of asbestos in a special manner if such facilities undergo major renovations or are demolished. Costs associated with the removal of asbestos related to the closure of a manufacturing facility under the Next Century program were recorded in 2012 and included in business realignment and impairment charges. The costs associated with the removal of asbestos from the facility were not material. With regard to other facilities, we believe we do not have sufficient information to estimate the fair value of any asset retirement obligations related to these facilities. We cannot specify the settlement date or range of potential settlement dates and, therefore, sufficient information is not available to apply an expected present value technique.
35
We expect to maintain the facilities with repairs and maintenance activities that would not involve or require the removal of asbestos.
As of December 31, 2012, certain real estate associated with the closure of facilities under the global supply chain transformation program was being held for sale. Obligations related to the environmental remediation of this real estate have been reflected in our current estimates.
Income Tax Obligations
We base our deferred income taxes, accrued income taxes and provision for income taxes upon income, statutory tax rates, the legal structure of our Company and interpretation of tax laws. We are regularly audited by federal, state and foreign tax authorities. From time to time, these audits result in assessments of additional tax. We maintain reserves for such assessments. We adjust the reserves based upon changing facts and circumstances, such as receiving audit assessments or clearing of an item for which a reserve has been established. Assessments of additional tax require cash payments. We are not aware of any significant income tax assessments. The amount of tax obligations is not included in the table of contractual cash obligations by year on page 34 because we are unable to reasonably predict the ultimate amount or timing of settlement of our reserves for income taxes.
ACCOUNTING POLICIES AND MARKET RISKS ASSOCIATED WITH DERIVATIVE INSTRUMENTS
We use certain derivative instruments, from time to time, to manage risks. These include interest rate swaps to manage interest rate risk; foreign currency forward exchange contracts and options to manage foreign currency exchange rate risk; and commodities futures and options contracts to manage commodity market price risk exposures.
We enter into interest rate swap agreements and foreign exchange forward contracts and options for periods consistent with related underlying exposures. These derivative instruments do not constitute positions independent of those exposures.
We enter into commodities futures and options contracts and other derivative instruments for varying periods. These commodity derivative instruments are intended to be, and are effective as hedges of market price risks associated with anticipated raw material purchases, energy requirements and transportation costs. We do not hold or issue derivative instruments for trading purposes and are not a party to any instruments with leverage or prepayment features.
In entering into these contracts, we have assumed the risk that might arise from the possible inability of counterparties to meet the terms of their contracts. We mitigate this risk by performing financial assessments prior to contract execution, conducting periodic evaluations of counterparty performance and maintaining a diverse portfolio of qualified counterparties. We do not expect any significant losses from counterparty defaults.
Accounting Policies Associated with Derivative Instruments
We report the effective portion of the gain or loss on a derivative instrument designated and qualifying as a cash flow hedging instrument as a component of other comprehensive income. We reclassify the effective portion of the gain or loss on these derivative instruments into income in the same period or periods during which the hedged transaction affects earnings. The remaining gain or loss on the derivative instrument resulting from hedge ineffectiveness, if any, must be recognized currently in earnings.
Fair value hedges pertain to derivative instruments that qualify as a hedge of exposures to changes in the fair value of a firm commitment or assets and liabilities recognized on the balance sheet. For fair value hedges, our policy is to record the gain or loss on the derivative instrument in earnings in the period of change together with the offsetting loss or gain on the hedged item. The effect of that accounting is to reflect in earnings the extent to which the hedge is not effective in achieving offsetting changes in fair value.
As of December 31, 2012, we designated and accounted for all derivative instruments, including interest rate swap agreements, foreign exchange forward contracts and options, commodities futures and options contracts, and other commodity derivative instruments as cash flow hedges. Additional information regarding accounting policies associated with derivative instruments is contained in
Note 6, Derivative Instruments and Hedging Activities
.
The information below summarizes our market risks associated with long-term debt and derivative instruments outstanding as of December 31, 2012. Note 1, Note 6 and Note 7 to the Consolidated Financial Statements provide additional information.
36
Long-term Debt
The table below presents the principal cash flows and related interest rates by maturity date for long-term debt, including the current portion, as of December 31, 2012. We determined the fair value of long-term debt based upon quoted market prices for the same or similar debt issues.
|
Maturity Date
|
||||||||||||||||||||||
|
2013
|
2014
|
2015
|
2016
|
2017
|
Thereafter
|
Total
|
Fair Value
|
|||||||||||||||
|
In thousands of dollars except for rates
|
||||||||||||||||||||||
|
Long-term Debt
|
$257,734
|
$854
|
$250,854
|
$500,708
|
$422
|
$778,129
|
$1,788,701
|
$2,060,836
|
||||||||||||||
|
Interest Rate
|
5.0
|
%
|
7.4
|
%
|
4.9
|
%
|
3.5
|
%
|
7.3
|
%
|
5.9
|
%
|
4.9
|
%
|
||||||||
We calculated the interest rates on variable rate obligations using the rates in effect as of December 31, 2012.
Interest Rate Swaps
In order to manage interest rate exposure, the Company, from time to time, enters into interest rate swap agreements. In April 2012, the Company entered into forward starting interest rate swap agreements to hedge interest rate exposure related to the anticipated $250 million of term financing expected to be executed during 2013 to repay $250 million of 5.0% Notes maturing in April 2013. The weighted-average fixed rate on these forward starting swap agreements was 2.4%. In May 2012, the Company entered into forward starting interest rate swap agreements to hedge interest rate exposure related to the anticipated $250 million of term financing expected to be executed during 2015 to repay $250 million of 4.85% Notes maturing in August 2015. The weighted-average fixed rate on these forward starting swap agreements was 2.7%.
The fair value of interest rate swap agreements was a liability of $13.4 million as of December 31, 2012. Our risk related to interest rate swap agreements is limited to the cost of replacing such agreements at prevailing market rates. As of December 31, 2012, the potential net loss associated with interest rate swap agreements resulting from a hypothetical near-term adverse change in interest rates of ten percent was approximately $11.0 million.
In March 2009, we entered into forward starting interest rate swap agreements to hedge interest rate exposure related to the anticipated $250 million of term financing expected to be executed during 2011. In September 2011, the forward starting interest rate swap agreements which were entered into in March 2009 matured, resulting in cash payments by the Company of approximately $26.8 million. Also in September 2011, we entered into forward starting swap agreements to continue to hedge interest rate exposure related to the term financing. These swap agreements were terminated upon the issuance of the 1.5% Notes due November 1, 2016, resulting in cash payments by the Company of $2.3 million. The losses on the swap agreements are being amortized as an increase to interest expense over the term of the Notes.
In December 2010, we terminated forward starting swap agreements which were entered into in August 2010 to hedge the anticipated execution of term financing. The swap agreements were terminated upon the issuance of the 4.125% Notes due December 1, 2020, resulting in cash receipts of $13.5 million. The gain on the swap agreements is being amortized as a reduction to interest expense over the term of the Notes.
For more information see
Note 6, Derivative Instruments and Hedging Activities
.
Foreign Exchange Forward Contracts and Options
We enter into foreign exchange forward contracts and options to hedge transactions denominated in foreign currencies. These transactions are primarily purchase commitments or forecasted purchases of equipment, raw materials and finished goods. We also may hedge payment of forecasted intercompany transactions with our subsidiaries outside of the United States. These contracts reduce currency risk from exchange rate movements. We generally hedge foreign currency price risks for periods from 3 to 24 months.
Foreign exchange forward contracts are effective as hedges of identifiable foreign currency commitments or forecasted transactions. We designate our foreign exchange forward contracts as cash flow hedging derivatives. The fair value of these contracts is classified as either an asset or liability on the Consolidated Balance Sheets. We record gains and losses on these contracts as a component of other comprehensive income and reclassify them into earnings in the same period during which the hedged transaction affects earnings.
37
A summary of foreign exchange forward contracts and the corresponding amounts at contracted forward rates is as follows:
|
December 31,
|
2012
|
2011
|
||||||||||
|
Contract
Amount
|
Primary
Currencies
|
Contract
Amount
|
Primary
Currencies
|
|||||||||
|
In millions of dollars
|
||||||||||||
|
Foreign exchange forward contracts to purchase foreign currencies
|
$
|
17.1
|
|
Euros
British pound sterling
|
$
|
50.4
|
|
Euros
British pound sterling
|
||||
|
Foreign exchange forward contracts to sell foreign currencies
|
$
|
57.8
|
|
Canadian dollars
|
$
|
99.6
|
|
Canadian dollars
|
||||
The fair value of foreign exchange forward contracts is the amount of the difference between the contracted and current market foreign currency exchange rates at the end of the period. We estimate the fair value of foreign exchange forward contracts on a quarterly basis by obtaining market quotes of spot and forward rates for contracts with similar terms, adjusted where necessary for maturity differences.
A summary of the fair value and market risk associated with foreign exchange forward contracts is as follows:
|
December 31,
|
2012
|
2011
|
||||
|
In millions of dollars
|
||||||
|
Fair value of foreign exchange forward contracts, net — asset (liability)
|
$
|
1.2
|
|
$
|
(1.4
|
)
|
|
Potential net loss associated with foreign exchange forward contracts resulting from a hypothetical near-term adverse change in market rates of ten percent
|
$
|
7.9
|
|
$
|
19.4
|
|
Our risk related to foreign exchange forward contracts is limited to the cost of replacing the contracts at prevailing market rates.
Commodities—Price Risk Management and Futures Contracts
Our most significant raw material requirements include cocoa products, sugar, dairy products, peanuts and almonds. For more information on our major raw material requirements, see
Raw Materials
on page 5. The cost of cocoa products and prices for related futures contracts and costs for certain other raw materials historically have been subject to wide fluctuations attributable to a variety of factors. These factors include:
|
l
|
Commodity market fluctuations;
|
|
l
|
Currency exchange rates;
|
|
l
|
Imbalances between supply and demand;
|
|
l
|
The effect of weather on crop yield;
|
|
l
|
Speculative influences;
|
|
l
|
Trade agreements among producing and consuming nations;
|
|
l
|
Political unrest in producing countries; and
|
|
l
|
Changes in governmental agricultural programs and energy policies.
|
We use futures and options contracts and other commodity derivative instruments in combination with forward purchasing of cocoa products, sugar, corn sweeteners, natural gas and certain dairy products primarily to reduce the risk of future price increases and provide visibility to future costs. Currently, active futures contracts are not available for use in pricing our other major raw material requirements, primarily peanuts and almonds. We attempt to minimize the effect of future price fluctuations related to the purchase of raw materials by using forward purchasing to cover future manufacturing requirements generally for 3 to 24 months. However, the dairy futures markets are not as developed as many of the other commodities futures markets and, therefore, it is difficult to hedge our costs for dairy products by entering into futures contracts or other derivative instruments to extend coverage for long periods of time. We use diesel swap futures contracts to minimize price fluctuations associated with our transportation costs. Our commodity procurement practices are intended to reduce the risk of future price increases and provide visibility to future costs, but also may potentially limit our ability to benefit from possible price decreases.
38
During 2012, the average cocoa futures contract prices decreased compared with 2011, and traded in a range between $1.17 and $1.00 per pound, based on the IntercontinentalExchange futures contract. After trading at 37-year highs in early 2011, cocoa prices moderated in 2012. Our costs for cocoa products will not necessarily reflect market price fluctuations primarily because of our forward purchasing and hedging practices.
During 2012, prices for fluid dairy milk ranged from a low of $0.14 to a high of $0.19 per pound, on a class II fluid milk basis. Higher feed prices resulting from the historic drought in the U.S. caused dairy prices to rise starting in July, but not to the price levels experienced during 2011. Our costs for certain dairy products may not necessarily reflect market price fluctuations because of our forward purchasing practices.
In early 2012, sugar supplies in the U.S. were negatively impacted by government import restrictions; however, ideal weather in the North American sugar-growing regions caused prices to trade lower in the Fall of 2012. As a result, refined sugar prices have decreased compared to 2011, trading lower in a range from $0.54 to $0.37 per pound. Our costs for sugar will not necessarily reflect market price fluctuations primarily because of our forward purchasing and hedging practices.
Peanut prices in the U.S. began the year around $1.25 per pound and decreased during the year to $0.52 per pound. Price decreases were driven by a record crop of 3.4 million tons, up 85% from 2011. Almond prices began the year at $2.20 per pound and increased to $2.90 per pound during the year driven by a decrease in almond production of approximately 8% versus 2011. Our costs for peanuts and almonds will not necessarily reflect market price fluctuations because of our forward purchasing practices.
We make or receive cash transfers to or from commodity futures brokers on a daily basis reflecting changes in the value of futures contracts on the IntercontinentalExchange or various other exchanges. These changes in value represent unrealized gains and losses. We report these cash transfers as a component of other comprehensive income. The cash transfers offset higher or lower cash requirements for the payment of future invoice prices of raw materials, energy requirements and transportation costs.
Commodity Position Sensitivity Analysis
The following sensitivity analysis reflects our market risk to a hypothetical adverse market price movement of 10%, based on our net commodity positions at four dates spaced equally throughout the year. Our net commodity positions consist of the amount of futures contracts we hold over or under the amount of futures contracts we need to price unpriced physical forward contracts for the same commodities. Inventories, fixed-price forward contracts and anticipated purchases not yet under contract were not included in the sensitivity analysis calculations. We define a loss, for purposes of determining market risk, as the potential decrease in fair value or the opportunity cost resulting from the hypothetical adverse price movement. The fair values of net commodity positions reflect quoted market prices or estimated future prices, including estimated carrying costs corresponding with the future delivery period.
|
For the years ended December 31,
|
2012
|
2011
|
||||||||||
|
Fair
Value
|
Market Risk
(Hypothetical
10% Change)
|
Fair
Value
|
Market Risk
(Hypothetical
10% Change)
|
|||||||||
|
In millions of dollars
|
||||||||||||
|
Highest long position
|
$
|
35.8
|
|
$
|
3.6
|
|
$
|
(204.8
|
)
|
$
|
20.5
|
|
|
Lowest long position
|
(167.2
|
)
|
16.7
|
|
(505.9
|
)
|
50.6
|
|
||||
|
Average position (long)
|
(44.0
|
)
|
4.4
|
|
(413.1
|
)
|
41.3
|
|
||||
Decreases or increases in fair values from 2011 to 2012 primarily reflected changes in net commodity positions. The negative positions primarily resulted as unpriced physical forward contract futures requirements exceeded the amount of commodities futures that we held at certain points in time during the years.
39
USE OF ESTIMATES AND OTHER CRITICAL ACCOUNTING POLICIES
Our consolidated financial statements are prepared in accordance with GAAP. In various instances, GAAP requires management to make estimates, judgments and assumptions that affect the amounts reported in the consolidated financial statements and accompanying notes. We believe that our most critical accounting policies and estimates relate to the following:
|
l
|
Accrued Liabilities
|
|
l
|
Pension and Other Post-Retirement Benefits Plans
|
|
l
|
Goodwill and Other Intangible Assets
|
|
l
|
Commodities Futures and Options Contracts
|
|
l
|
Income Taxes
|
Management has discussed the development, selection and disclosure of critical accounting policies and estimates with the Audit Committee of our Board of Directors. While we base estimates and assumptions on our knowledge of current events and actions we may undertake in the future, actual results may ultimately differ from these estimates and assumptions. We discuss our significant accounting policies in
Note 1, Summary of Significant Accounting Policies
.
Accrued Liabilities
Accrued liabilities requiring the most difficult or subjective judgments include liabilities associated with marketing promotion programs and potentially unsaleable products.
Liabilities associated with marketing promotion programs
We recognize the costs of marketing promotion programs as a reduction to net sales along with a corresponding accrued liability based on estimates at the time of revenue recognition.
Information on our promotional costs and assumptions is as follows:
|
For the years ended December 31,
|
2012
|
2011
|
2010
|
|||||||||
|
In millions of dollars
|
||||||||||||
|
Promotional costs
|
$
|
949.3
|
|
$
|
945.9
|
|
$
|
767.6
|
|
|||
|
l
|
We determine the amount of the accrued liability by:
|
|
|
Ÿ
|
Analysis of programs offered;
|
|
|
Ÿ
|
Historical trends;
|
|
|
Ÿ
|
Expectations regarding customer and consumer participation;
|
|
|
Ÿ
|
Sales and payment trends; and
|
|
|
Ÿ
|
Experience with payment patterns associated with similar, previously offered programs.
|
|
|
l
|
The estimated costs of these programs are reasonably likely to change in the future due to changes in trends with regard to customer and consumer participation, particularly for new programs and for programs related to the introduction of new products.
|
|
|
l
|
Reasonably possible near-term changes in the most material assumptions regarding the cost of promotional programs could result in changes within the following range:
|
|
|
Ÿ
|
A reduction in costs of approximately $9.5 million; and
|
|
|
Ÿ
|
An increase in costs of approximately $4.3 million.
|
|
|
l
|
Changes in these assumptions would affect net sales and income before income taxes.
|
|
|
l
|
Over the three-year period ended December 31, 2012, actual promotion costs have not deviated from the estimated amounts by more than approximately 3%.
|
|
|
l
|
Reasonably possible near-term changes in estimates related to the cost of promotional programs would not have a material impact on our liquidity or capital resources.
|
|
40
Liabilities associated with potentially unsaleable products
|
l
|
At the time of sale, we estimate a cost for the possibility that products will become aged or unsaleable in the future. The estimated cost is included as a reduction to net sales.
|
|
l
|
A related accrued liability is determined using statistical analysis that incorporates historical sales trends, seasonal timing and sales patterns, and product movement at retail.
|
|
l
|
Estimates for costs associated with unsaleable products may change as a result of inventory levels in the distribution channel, current economic trends, changes in consumer demand, the introduction of new products and changes in trends of seasonal sales in response to promotional programs.
|
|
l
|
Over the three-year period ended December 31, 2012, costs associated with aged or unsaleable products have amounted to approximately 2% of gross sales.
|
|
l
|
Reasonably possible near-term changes in the most material assumptions regarding the estimates of such costs would have increased or decreased net sales and income before income taxes in a range from $0.7 million to $1.3 million.
|
|
l
|
Over the three-year period ended December 31, 2012, actual costs have not deviated from our estimates by more than approximately 4%.
|
|
l
|
Reasonably possible near-term changes in the estimates of costs associated with unsaleable products would not have a material impact on our liquidity or capital resources.
|
Pension and Other Post-Retirement Benefits Plans
Overview
We sponsor a number of defined benefit pension plans. The primary plans are The Hershey Company Retirement Plan and The Hershey Company Retirement Plan for Hourly Employees. These are cash balance plans that provide pension benefits for most domestic employees hired prior to January 1, 2007. We also sponsor two primary post-retirement benefit plans. The health care plan is contributory, with participants’ contributions adjusted annually, and the life insurance plan is non-contributory.
We fund domestic pension liabilities in accordance with the limits imposed by the Employee Retirement Income Security Act of 1974 and federal income tax laws. Beginning January 1, 2008, we complied with the funding requirements of the Pension Protection Act of 2006. We fund non-domestic pension liabilities in accordance with laws and regulations applicable to those plans. We broadly diversify our pension plan assets, consisting primarily of domestic and international common stocks and fixed income securities. Short-term and long-term liabilities associated with benefit plans are primarily determined based on actuarial calculations. These calculations consider payroll and employee data, including age and years of service, along with actuarial assumptions at the date of the financial statements. We take into consideration long-term projections with regard to economic conditions, including interest rates, return on assets and the rate of increase in compensation levels. With regard to liabilities associated with post-retirement benefit plans that provide health care and life insurance, we take into consideration the long-term annual rate of increase in the per capita cost of the covered benefits. We review the discount rate assumptions and revise them annually. The expected long-term rate of return on assets assumption (“asset return assumption”) for funded plans is of a longer duration and revised only when long-term asset return projections demonstrate that need.
An employer that is a business entity and sponsors one or more single-employer defined benefit plans is required to:
|
l
|
Recognize the funded status of a benefit plan—measured as the difference between plan assets at fair value and the benefit obligation—in its statement of financial position. For a pension plan, the benefit obligation is the projected benefit obligation; for any other post-retirement benefit plan, such as a retiree health care plan, the benefit obligation is the accumulated post-retirement benefit obligation.
|
|
l
|
Recognize as a component of other comprehensive income, net of tax, the gains or losses and prior service costs or credits that arise during the period but are not recognized as components of net periodic benefit cost.
|
|
l
|
Measure defined benefit plan assets and obligations as of the date of the employer’s fiscal year-end statement of financial position.
|
|
l
|
Disclose in the notes to financial statements additional information about certain effects on net periodic benefit costs for the next fiscal year that arise from delayed recognition of the gains or losses, prior service costs or credits, and transition assets or obligations.
|
41
Pension Plans
Our pension plan costs and related assumptions were as follows:
|
For the years ended December 31
|
2012
|
2011
|
2010
|
|||||||||
|
In millions of dollars
|
||||||||||||
|
Service cost and amortization of prior service cost
|
$
|
31.6
|
|
$
|
31.1
|
|
$
|
29.4
|
|
|||
|
Interest cost, expected return on plan assets and amortization of net loss
|
16.7
|
|
2.8
|
|
5.9
|
|
||||||
|
Administrative expenses
|
0.5
|
|
0.6
|
|
0.4
|
|
||||||
|
Net periodic pension benefit cost
|
$
|
48.8
|
|
$
|
34.5
|
|
$
|
35.7
|
|
|||
|
Assumptions:
|
||||||||||||
|
Average discount rate assumptions—net periodic benefit cost calculation
|
4.5
|
%
|
5.2
|
%
|
5.7
|
%
|
||||||
|
Average discount rate assumptions—benefit obligation calculation
|
3.7
|
%
|
4.5
|
%
|
5.2
|
%
|
||||||
|
Asset return assumptions
|
8.0
|
%
|
8.0
|
%
|
8.5
|
%
|
||||||
Net Periodic Pension Benefit Costs
We believe that the service cost and amortization of prior service cost components of net periodic pension benefit cost reflect the ongoing operating cost of our pension plans, particularly since our most significant plans were closed to most new entrants after 2007.
The increase in net periodic pension benefit cost from 2011 to 2012 was primarily due to the higher amortization of actuarial losses in the current year. In addition to the increase in net periodic pension benefit cost in 2012, the level of lump sum withdrawals during 2012 from two of the Company's pension plans by employees retiring or leaving the Company resulted in a pension settlement loss of $19.7 million. Our service cost and prior service cost amortization is expected to be approximately $0.7 million higher in 2013. Interest cost, expected return on plan assets and amortization of net loss is expected to decrease in 2013 by $5.3 million due primarily to the lower discount rate in 2012, in addition to expected pension settlement costs of $1.8 million in 2013. For more information, see
Note 14, Pension and Other Post-Retirement Benefit Plans
.
Actuarial gains and losses may arise when actual experience differs from assumed experience or when we revise the actuarial assumptions used to value the plans’ obligations. We only amortize the unrecognized net actuarial gains and losses in excess of 10% of a respective plan’s projected benefit obligation, or the fair market value of assets, if greater. The estimated recognized net actuarial loss component of net periodic pension benefit expense for 2013 is $40.6 million. The 2012 recognized net actuarial loss component of net periodic pension benefit expense was $39.7 million. Projections beyond 2013 are dependent on a variety of factors such as changes to the discount rate and the actual return on pension plan assets.
Average Discount Rate Assumption—Net Periodic Benefit Cost
The discount rate represents the estimated rate at which we could effectively settle our pension benefit obligations. In order to estimate this rate for 2010 to 2012, a single effective rate of discount was determined by our actuaries after discounting the pension obligation’s cash flows using the spot rate of matching duration from the Towers Watson RATE:Link 40/90 discount curve.
The use of a different discount rate assumption can significantly affect net periodic benefit cost:
|
l
|
A one-percentage point decrease in the discount rate assumption would have increased 2012 net periodic pension benefit expense by $5.2 million.
|
|
l
|
A one-percentage point increase in the discount rate assumption would have decreased 2012 net periodic pension benefit expense by $5.2 million.
|
Average Discount Rate Assumption—Benefit Obligations
The discount rate assumption to be used in calculating the amount of benefit obligations is determined in the same manner as the average discount rate assumption used to calculate net periodic benefit cost as described above. We reduced our 2012 discount rate assumption due to the declining interest rate environment consistent with the duration of our pension plan liabilities.
42
The use of a different discount rate assumption can significantly affect the amount of benefit obligations:
|
l
|
A one-percentage point decrease in the discount rate assumption would have increased the December 31, 2012 pension benefits obligations by $131.3 million.
|
|
l
|
A one-percentage point increase in the discount rate assumption would have decreased the December 31, 2012 pension benefits obligations by $110.7 million.
|
Asset Return Assumptions
For 2013, we reduced the expected return on plan assets assumption to 7.75% from the 8.0% assumption used during 2012, reflecting lower expected future returns on plan assets. We based the expected return on plan assets component of net periodic pension benefit cost on the fair market value of pension plan assets. To determine the expected return on plan assets, we consider the current asset allocations, as well as historical and expected returns on the categories of plan assets. The historical geometric average return over the 25 years prior to December 31, 2012 was approximately 8.4%. The actual return on assets was as follows:
|
For the years ended December 31,
|
2012
|
2011
|
2010
|
|||
|
Actual return on assets
|
13.2
|
%
|
0.8
|
%
|
13.3
|
%
|
The use of a different asset return assumption can significantly affect net periodic benefit cost:
|
l
|
A one-percentage point decrease in the asset return assumption would have increased 2012 net periodic pension benefit expense by $9.1 million.
|
|
l
|
A one-percentage point increase in the asset return assumption would have decreased 2012 net periodic pension benefit expense by $9.1 million.
|
Our investment policies specify ranges of allocation percentages for each asset class. The ranges for the domestic pension plans were as follows:
|
Asset Class
|
Allocation Range
|
|
|
Equity securities
|
58% – 85%
|
|
|
Debt securities
|
15% – 42%
|
|
|
Cash and certain other investments
|
0% – 5%
|
|
As of December 31, 2012, actual allocations were within the specified ranges. We expect the level of volatility in pension plan asset returns to be in line with the overall volatility of the markets and weightings within the asset classes. As of December 31, 2012 and 2011, the benefit plan fixed income assets were invested primarily in conventional instruments benchmarked to the Barclays Capital U.S. Aggregate Bond Index.
For 2012 and 2011, minimum funding requirements for the plans were not material. However, we made contributions of $21.4 million in 2012 and $8.9 million in 2011 primarily to pay benefits under our non-qualified pension plans. These contributions were fully tax deductible. A one-percentage point change in the funding discount rate would not have changed the 2012 minimum funding requirements significantly for the domestic plans. For 2013, minimum funding requirements of our pension plans are approximately $2.8 million.
43
Post-Retirement Benefit Plans
Other post-retirement benefit plan costs and related assumptions were as follows:
|
For the years ended December 31,
|
2012
|
2011
|
2010
|
|||||||||
|
In millions of dollars
|
||||||||||||
|
Net periodic other post-retirement benefit cost
|
$
|
15.1
|
|
$
|
16.2
|
|
$
|
17.5
|
|
|||
|
Assumptions:
|
||||||||||||
|
Average discount rate assumption
|
4.5
|
%
|
5.2
|
%
|
5.7
|
%
|
||||||
The use of a different discount rate assumption can significantly affect net periodic other post-retirement benefit cost:
|
l
|
A one-percentage point decrease in the discount rate assumption would have decreased 2012 net periodic other post-retirement benefit cost by $1.4 million.
|
|
l
|
A one-percentage point increase in the discount rate assumption would have increased 2012 net periodic other post-retirement benefit cost by $0.8 million.
|
For the post-retirement benefit plans, a decrease in the discount rate assumption would result in a decrease in benefit cost because of the lower interest cost which would more than offset the impact of the lower discount rate assumption on the post-retirement benefit obligation.
Other post-retirement benefit obligations and assumptions were as follows:
|
December 31,
|
2012
|
2011
|
||||||
|
In millions of dollars
|
||||||||
|
Other post-retirement benefit obligation
|
$
|
318.4
|
|
$
|
318.5
|
|
||
|
Assumptions:
|
||||||||
|
Benefit obligations discount rate assumption
|
3.7
|
%
|
4.5
|
%
|
||||
|
l
|
A one-percentage point decrease in the discount rate assumption would have increased the December 31, 2012 other post-retirement benefits obligations by $37.4 million.
|
|
l
|
A one-percentage point increase in the discount rate assumption would have decreased the December 31, 2012 other post-retirement benefits obligations by $30.4 million.
|
Goodwill and Other Intangible Assets
We classify intangible assets into 3 categories: (1) intangible assets with finite lives subject to amortization; (2) intangible assets with indefinite lives not subject to amortization; and (3) goodwill.
Our intangible assets with finite lives consist primarily of certain trademarks, customer-related intangible assets and patents obtained through business acquisitions. We are amortizing trademarks with finite lives over their estimated useful lives of approximately 25 years. We are amortizing customer-related intangible assets over their estimated useful lives of approximately 15 years. We are amortizing patents over their remaining legal lives of approximately 6 years. We conduct impairment tests when events or changes in circumstances indicate that the carrying value of these assets may not be recoverable. Undiscounted cash flow analyses are used to determine if an impairment exists. If an impairment is determined to exist, the loss is calculated based on the estimated fair value of the assets.
Our intangible assets with indefinite lives consist of trademarks obtained through business acquisitions. We do not amortize existing trademarks whose useful lives were determined to be indefinite. We conduct impairment tests for other intangible assets with indefinite lives and goodwill at the beginning of the fourth quarter of each year, or when circumstances arise that indicate a possible impairment might exist.
We evaluate our trademarks with indefinite lives for impairment by comparing their carrying amount to their estimated fair value. The fair value of trademarks is calculated using a “relief from royalty payments” methodology. This approach
44
involves a two-step process. In the first step, we estimate reasonable royalty rates for each trademark. In the second step, we apply these royalty rates to a net sales stream and discount the resulting cash flows to determine fair value. This fair value is then compared with the carrying value of each trademark. If the estimated fair value is less than the carrying amount, we record an impairment charge to reduce the asset to its estimated fair value. The estimates of future cash flows are generally based on past performance of the brands and reflect net sales projections and assumptions for the brands that we use in current operating plans. We also consider assumptions that market participants may use. Such assumptions are subject to change due to changing economic and competitive conditions.
We use a two-step process to evaluate goodwill for impairment. In the first step, we compare the fair value of each reporting unit with the carrying amount of the reporting unit, including goodwill. We estimate the fair value of the reporting unit based on discounted future cash flows. If the estimated fair value of the reporting unit is less than the carrying amount of the reporting unit, we complete a second step to determine the amount of the goodwill impairment that we should record. In the second step, we determine an implied fair value of the reporting unit’s goodwill by allocating the reporting unit’s fair value to all of its assets and liabilities other than goodwill (including any unrecognized intangible assets). We compare the resulting implied fair value of the goodwill to the carrying amount and record an impairment charge for the difference.
The assumptions we use to estimate fair value are based on the past performance of each reporting unit and reflect the projections and assumptions that we use in current operating plans. We also adjust the assumptions, if necessary, to estimates that we believe market participants would use. Such assumptions are subject to change due to changing economic and competitive conditions.
Based on our annual impairment evaluations, we determined that no goodwill or other intangible assets were impaired as of December 31, 2012 and December 31, 2011. As a result of operating performance that was below expectations, we completed an impairment evaluation of goodwill and other intangible assets of Godrej Hershey Ltd. during the second quarter of 2010. As a result of reduced expectations for future cash flows from lower than expected profitability, we determined that the carrying amount of Godrej Hershey Ltd. exceeded its fair value. We recorded a non-cash goodwill impairment charge of $44.7 million in the second quarter of 2010 to reduce the carrying value of Godrej Hershey Ltd. to its fair value, including a reduction to reflect the share of the charge associated with the noncontrolling interests. There was no tax benefit associated with this charge.
Commodities Futures and Options Contracts
We use futures and options contracts and other commodity derivative instruments in combination with forward purchasing of cocoa products and other commodities primarily to reduce the effect of future price increases and provide visibility to future costs. Additional information with regard to accounting policies associated with commodities futures and options contracts and other derivative instruments is contained in
Note 6, Derivative Instruments and Hedging Activities
.
Our gains (losses) on cash flow hedging derivatives were as follows:
|
For the years ended December 31,
|
2012
|
2011
|
2010
|
|||||||||
|
In millions of dollars
|
||||||||||||
|
Net after-tax (losses) gains on cash flow hedging derivatives
|
$
|
(0.9
|
)
|
$
|
(107.7
|
)
|
$
|
1.0
|
|
|||
|
Reclassification adjustments from accumulated other comprehensive loss to income
|
60.0
|
|
(12.5
|
)
|
(32.5
|
)
|
||||||
|
Hedge ineffectiveness gains (losses) recognized in income, before tax
|
0.7
|
|
(2.0
|
)
|
0.8
|
|
||||||
|
l
|
We reflected reclassification adjustments related to gains or losses on commodities futures and options contracts and other commodity derivative instruments in cost of sales.
|
|
l
|
No gains or losses on commodities futures and options contracts resulted because we discontinued a hedge due to the probability that the forecasted hedged transaction would not occur.
|
|
l
|
We recognized no components of gains or losses on commodities futures and options contracts in income due to excluding such components from the hedge effectiveness assessment.
|
The amount of net losses on cash flow hedging derivatives, including interest rate swap agreements, foreign exchange forward contracts and options, commodities futures and options contracts and other commodity derivative instruments, expected to be reclassified into earnings in the next 12 months was approximately $12.8 million after tax as of December 31, 2012. This amount was primarily associated with commodities futures contracts.
45
Income Taxes
We base our deferred income taxes, accrued income taxes and provision for income taxes upon income, statutory tax rates, the legal structure of our Company and interpretation of tax laws. We are regularly audited by federal, state and foreign tax authorities. From time to time, these audits result in assessments of additional tax. We maintain reserves for such assessments. We adjust the reserves based upon changing facts and circumstances, such as receiving audit assessments or clearing of an item for which a reserve has been established. Assessments of additional tax require cash payments. We are not aware of any significant income tax assessments.
We apply a more-likely-than-not threshold to the recognition and derecognition of uncertain tax positions. Accordingly, we recognize the amount of tax benefit that has a greater than 50% likelihood of being ultimately realized upon settlement. We believe it is more likely than not that the results of future operations will generate sufficient taxable income to realize the deferred tax assets. Valuation allowances are recorded for deferred income taxes when it is more likely than not that a tax benefit will not be realized. Valuation allowances are primarily associated with tax loss carryforwards from operations in various foreign tax jurisdictions. Future changes in judgment and estimates related to the expected ultimate resolution of uncertain tax positions will affect income in the quarter of such change.
We file income tax returns in the U.S. federal jurisdiction and various state and foreign jurisdictions. A number of years may elapse before an uncertain tax position, for which we have unrecognized tax benefits, is audited and finally resolved. While it is often difficult to predict the final outcome or the timing of resolution of any particular uncertain tax position, we believe that our unrecognized tax benefits reflect the most likely outcome. Accrued interest and penalties related to unrecognized tax benefits are included in income tax expense. We adjust these unrecognized tax benefits, as well as the related interest, in light of changing facts and circumstances. Settlement of any particular position could require the use of cash. Favorable resolution would be recognized as a reduction to our effective income tax rate in the period of resolution.
The number of years with open tax audits varies depending on the tax jurisdiction. Our major taxing jurisdictions include the United States (federal and state), Canada and Mexico. During the second quarter of 2012, the IRS completed its audit of our U.S. income tax returns for 2007 and 2008 with no significant adjustments. Tax examinations by various state taxing authorities could be conducted for years beginning in 2008. We are no longer subject to Canadian federal income tax examinations by the Canada Revenue Agency (“CRA”) and Mexican federal income tax examinations by Servicio de Administracion Tributaria (“SAT”) for years before 2004. During the third quarter of 2010, the CRA commenced its audit of our Canadian income tax returns for 2006 through 2009. U.S., Canadian and Mexican federal audit issues typically involve the timing of deductions and transfer pricing adjustments. We work with the IRS, the CRA and the SAT to resolve proposed audit adjustments and to minimize the amount of adjustments. We do not anticipate that any potential tax adjustments will have a significant impact on our financial position or results of operations.
We reasonably expect reductions in the liability for unrecognized tax benefits of approximately $8.3 million within the next 12 months because of the expiration of statutes of limitations and settlements of tax audits.
OUTLOOK
The outlook section contains a number of forward-looking statements, all of which are based on current expectations. Actual results may differ materially. Refer to Risk Factors beginning on page 9 for information concerning the key risks to achieving our future performance goals.
Our results for 2012 were strong, with solid financial and marketplace results. We remain focused on building brands in both the U.S. and key international markets and will make incremental investments in our brands and business capabilities during 2013. While the macroeconomic environment remains challenging, we are well positioned to succeed in the marketplace and deliver on our commitments in 2013.
We expect 2013 net sales growth of 5% to 7%, including the impact of foreign currency exchange rates. Net sales will be driven primarily by core brand volume growth, the U.S. launch of the
Brookside
product line in the food, drug and mass channels, as well as the introduction of new products such as
Kit Kat
minis,
Twizzlers Bites
and
Jolly Rancher Bites
. In key international markets such as China, we will extend our portfolio of products with the introduction of
Hershey's Kisses Deluxe
and build our sales of
Hershey's
chocolate products in instant consumable and take home pack types, which were introduced in the fourth quarter of 2012. In Brazil, manufacturing capacity was increased to support geographic expansion of
Hershey's Mais
, a chocolate-covered wafer product.
We have good visibility into our cost structure and we expect gross margin to increase in 2013, driven by productivity, cost savings initiatives and lower costs for certain major raw materials. Therefore, we expect 2013 gross margin on a reported basis to increase 250 to 270 basis points, with expansion of adjusted gross margin expected to be 180 to 200 basis points.
46
Considering this financial flexibility, we expect to accelerate our investments in 2013 for advertising, go-to-market capabilities and expansion of our Insights Driven Performance initiatives. Advertising is expected to increase approximately 20% versus last year. Advertising spending on core U.S. brands is expected to increase by approximately the same percentage as in 2012. Incremental advertising in 2013 will support the expanded distribution of
Brookside
products and innovation in both the U.S. and international markets, including increased advertising for the
Hershey's
brand in China.
We expect to continue investments in 2013 to build on the go-to-market capabilities established over the last few years, as well as the consumer insights work underway in key international markets for our five global brands,
Hershey's
,
Reese's
,
Hershey's Kisses
,
Jolly Rancher
and
Ice Breakers
, that we believe can gain strong consumer acceptance around the world. Additionally, we will continue to invest in international selling and marketing functions and support new product introductions with increased levels of consumer promotion and sampling to drive trial and repeat purchases. As a result, we anticipate that earnings per share-diluted in accordance with GAAP will increase 20% to 23% in 2013 compared with 2012. Growth in adjusted earnings per share-diluted is expected to be in the 10% to 12% range, as reflected in the reconciliation of reported to adjusted earnings per share-diluted projections provided below.
NOTE
: In the Outlook above, the Company has provided income measures excluding certain items, in addition to net income determined in accordance with GAAP. These non-GAAP financial measures are used in evaluating results of operations for internal purposes. These non-GAAP measures are not intended to replace the presentation of financial results in accordance with GAAP. Rather, the Company believes exclusion of such items provides additional information to investors to facilitate the comparison of past and present operations.
In 2012, the Company recorded pre-tax acquisition closing and integration costs of $13.4 million, or $0.04 per share-diluted, related to the Brookside acquisition. In 2012, the Company recorded GAAP charges of $76.3 million, or $0.22 per share-diluted, attributable to the Next Century program and $7.5 million, or $0.03 per share-diluted, of non-cash impairment charges associated with Tri-US, Inc. Non-service related pension expense of $20.6 million, or $0.06 per share-diluted, was recorded in 2012.
In 2013, the Company expects to record GAAP charges of about $10 million to $15 million, or $0.03 to $0.05 per share-diluted, attributable to the Next Century program. Non-service related pension expenses are expected to be approximately $13.2 million, or $0.04 per share-diluted, in 2013.
Below is a reconciliation of 2011 and 2012 and projected 2013 earnings per share-diluted in accordance with GAAP to non-GAAP 2011 and 2012 adjusted earnings per share-diluted and projected adjusted earnings per share-diluted for 2013:
|
2011
|
2012
|
2013 (Projected)
|
||||||
|
Reported EPS-Diluted
|
$2.74
|
$2.89
|
$3.47 - $3.56
|
|||||
|
Acquisition closing and integration charges
|
—
|
|
0.04
|
|
—
|
|||
|
Gain on sale of trademark licensing rights
|
(0.05
|
)
|
—
|
|
—
|
|||
|
Total Business Realignment and Impairment Charges
|
0.13
|
|
0.25
|
|
0.03 - 0.05
|
|||
|
Non-service related pension expenses
|
0.01
|
|
0.06
|
|
0.04
|
|||
|
Adjusted EPS-Diluted
|
$2.83
|
$3.24
|
$3.56 - $3.63
|
|||||
Outlook for Project Next Century
In June 2010, we announced the Next Century program as part of our ongoing efforts to create an advantaged supply chain and competitive cost structure. We expect total pre-tax charges and non-recurring project implementation costs for the Next Century program of $190 million to $200 million. During 2013, we expect to record $10 million to $15 million in program charges associated with the demolition of a former manufacturing facility and preparations for the sale of the property on which the facility was located. The Next Century program is expected to provide annual cost savings from efficiency improvements of $65 million to $80 million.
|
Item 7A.
|
QUANTITATIVE AND QUALITATIVE DISCLOSURES ABOUT MARKET RISK
|
Required information about market risk is included in the section entitled “Accounting Policies and Market Risks Associated with Derivative Instruments,” found on pages 36 through 39.
47
|
Item 8.
|
FINANCIAL STATEMENTS AND SUPPLEMENTARY DATA
|
|
PAGE
|
||
|
INDEX TO CONSOLIDATED FINANCIAL STATEMENTS
|
||
|
Responsibility for Financial Statements
|
49
|
|
|
Report of Independent Registered Public Accounting Firm
|
50
|
|
|
Consolidated Statements of Income for the years ended December 31, 2012, 2011 and 2010
|
51
|
|
|
Consolidated Statements of Comprehensive Income for the years ended December 31, 2012, 2011 and 2010
|
52
|
|
|
Consolidated Balance Sheets as of December 31, 2012 and 2011
|
53
|
|
|
Consolidated Statements of Cash Flows for the years ended December 31, 2012, 2011 and 2010
|
54
|
|
|
Consolidated Statements of Stockholders’ Equity for the years ended December 31, 2012, 2011 and 2010
|
55
|
|
|
Notes to Consolidated Financial Statements
|
56
|
|
48
RESPONSIBILITY FOR FINANCIAL STATEMENTS
The Hershey Company is responsible for the financial statements and other financial information contained in this report. We believe that the financial statements have been prepared in conformity with U.S. generally accepted accounting principles appropriate under the circumstances to reflect in all material respects the substance of applicable events and transactions. In preparing the financial statements, it is necessary that management make informed estimates and judgments. The other financial information in this annual report is consistent with the financial statements.
We maintain a system of internal accounting controls designed to provide reasonable assurance that financial records are reliable for purposes of preparing financial statements and that assets are properly accounted for and safeguarded. The concept of reasonable assurance is based on the recognition that the cost of the system must be related to the benefits to be derived. We believe our system provides an appropriate balance in this regard. We maintain an Internal Audit Department which reviews the adequacy and tests the application of internal accounting controls.
The 2012, 2011 and 2010 financial statements have been audited by KPMG LLP, an independent registered public accounting firm. KPMG LLP's report on our financial statements is included on page 50.
The Audit Committee of the Board of Directors of the Company, consisting solely of independent, non-management directors, meets regularly with the independent auditors, internal auditors and management to discuss, among other things, the audit scopes and results. KPMG LLP and the internal auditors both have full and free access to the Audit Committee, with and without the presence of management.

|

|
|
|
John P. Bilbrey
Chief Executive Officer
|
Humberto P. Alfonso
Chief Financial Officer
|
|
49
REPORT OF INDEPENDENT REGISTERED PUBLIC ACCOUNTING FIRM
The Board of Directors and Stockholders
The Hershey Company:
We have audited the accompanying consolidated balance sheets of The Hershey Company and subsidiaries (the “Company”) as of December 31, 2012 and 2011, and the related consolidated statements of income, comprehensive income, cash flows and stockholders’ equity for each of the years in the three-year period ended December 31, 2012. In connection with our audits of the consolidated financial statements, we also have audited the related consolidated financial statement schedule. We also have audited the Company’s internal control over financial reporting as of December 31, 2012, based on criteria established in
Internal Control – Integrated Framework
issued by the Committee of Sponsoring Organizations of the Treadway Commission (COSO). The Company’s management is responsible for these consolidated financial statements and financial statement schedule, for maintaining effective internal control over financial reporting, and for its assessment of the effectiveness of internal control over financial reporting, included in the accompanying Management Report on Internal Control over Financial Reporting. Our responsibility is to express an opinion on these consolidated financial statements and financial statement schedule, and an opinion on the Company’s internal control over financial reporting based on our audits.
We conducted our audits in accordance with the standards of the Public Company Accounting Oversight Board (United States). Those standards require that we plan and perform the audits to obtain reasonable assurance about whether the financial statements are free of material misstatement and whether effective internal control over financial reporting was maintained in all material respects. Our audits of the consolidated financial statements included examining, on a test basis, evidence supporting the amounts and disclosures in the financial statements, assessing the accounting principles used and significant estimates made by management, and evaluating the overall financial statement presentation. Our audit of internal control over financial reporting included obtaining an understanding of internal control over financial reporting, assessing the risk that a material weakness exists, and testing and evaluating the design and operating effectiveness of internal control based on the assessed risk. Our audits also included performing such other procedures as we considered necessary in the circumstances. We believe that our audits provide a reasonable basis for our opinions.
A company’s internal control over financial reporting is a process designed to provide reasonable assurance regarding the reliability of financial reporting and the preparation of financial statements for external purposes in accordance with generally accepted accounting principles. A company’s internal control over financial reporting includes those policies and procedures that (1) pertain to the maintenance of records that, in reasonable detail, accurately and fairly reflect the transactions and dispositions of the assets of the company; (2) provide reasonable assurance that transactions are recorded as necessary to permit preparation of financial statements in accordance with generally accepted accounting principles, and that receipts and expenditures of the company are being made only in accordance with authorizations of management and directors of the company; and (3) provide reasonable assurance regarding prevention or timely detection of unauthorized acquisition, use, or disposition of the company’s assets that could have a material effect on the financial statements.
Because of its inherent limitations, internal control over financial reporting may not prevent or detect misstatements. Also, projections of any evaluation of effectiveness to future periods are subject to the risk that controls may become inadequate because of changes in conditions, or that the degree of compliance with the policies or procedures may deteriorate.
In our opinion, the consolidated financial statements referred to above present fairly, in all material respects, the financial position of The Hershey Company and subsidiaries as of December 31, 2012 and 2011, and the results of their operations and their cash flows for each of the years in the three-year period ended December 31, 2012, in conformity with U.S. generally accepted accounting principles. Also, in our opinion, the related consolidated financial statement schedule, when considered in relation to the basic consolidated financial statements taken as a whole, presents fairly, in all material respects, the information set forth therein.
Also in our opinion, The Hershey Company and subsidiaries maintained, in all material respects, effective internal control over financial reporting as of December 31, 2012, based on criteria established in
Internal Control – Integrated Framework
issued by the Committee of Sponsoring Organizations of the Treadway Commission.
|
New York, New York
|

|
|||
|
February 22, 2013
|
||||
50
THE HERSHEY COMPANY
CONSOLIDATED STATEMENTS OF INCOME
|
For the years ended December 31,
|
2012
|
2011
|
2010
|
|||||||||
|
In thousands of dollars except per share amounts
|
||||||||||||
|
Net Sales
|
$
|
6,644,252
|
|
$
|
6,080,788
|
|
$
|
5,671,009
|
|
|||
|
Costs and Expenses:
|
||||||||||||
|
Cost of sales
|
3,784,370
|
|
3,548,896
|
|
3,255,801
|
|
||||||
|
Selling, marketing and administrative
|
1,703,796
|
|
1,477,750
|
|
1,426,477
|
|
||||||
|
Business realignment and impairment charges (credits), net
|
44,938
|
|
(886
|
)
|
83,433
|
|
||||||
|
Total costs and expenses
|
5,533,104
|
|
5,025,760
|
|
4,765,711
|
|
||||||
|
Income before Interest and Income Taxes
|
1,111,148
|
|
1,055,028
|
|
905,298
|
|
||||||
|
Interest expense, net
|
95,569
|
|
92,183
|
|
96,434
|
|
||||||
|
Income before Income Taxes
|
1,015,579
|
|
962,845
|
|
808,864
|
|
||||||
|
Provision for income taxes
|
354,648
|
|
333,883
|
|
299,065
|
|
||||||
|
Net Income
|
$
|
660,931
|
|
$
|
628,962
|
|
$
|
509,799
|
|
|||
|
Net Income Per Share—Basic—Class B Common Stock
|
$
|
2.73
|
|
$
|
2.58
|
|
$
|
2.08
|
|
|||
|
Net Income Per Share—Diluted—Class B Common Stock
|
$
|
2.71
|
|
$
|
2.56
|
|
$
|
2.07
|
|
|||
|
Net Income Per Share—Basic—Common Stock
|
$
|
3.01
|
|
$
|
2.85
|
|
$
|
2.29
|
|
|||
|
Net Income Per Share—Diluted—Common Stock
|
$
|
2.89
|
|
$
|
2.74
|
|
$
|
2.21
|
|
|||
|
Cash Dividends Paid Per Share:
|
||||||||||||
|
Common Stock
|
$
|
1.560
|
|
$
|
1.38
|
|
$
|
1.28
|
|
|||
|
Class B Common Stock
|
1.412
|
|
1.25
|
|
1.16
|
|
||||||
The notes to consolidated financial statements are an integral part of these statements.
51
THE HERSHEY COMPANY
CONSOLIDATED STATEMENTS OF COMPREHENSIVE INCOME
|
For the years ended December 31,
|
2012
|
2011
|
2010
|
|||||||||
|
In thousands of dollars
|
||||||||||||
|
Net Income
|
$
|
660,931
|
|
$
|
628,962
|
|
$
|
509,799
|
|
|||
|
Other comprehensive income (loss), net of tax:
|
||||||||||||
|
Foreign currency translation adjustments
|
7,714
|
|
(21,213
|
)
|
14,123
|
|
||||||
|
Pension and post-retirement benefit plans
|
(9,634
|
)
|
(85,823
|
)
|
5,130
|
|
||||||
|
Cash flow hedges:
|
||||||||||||
|
(Losses) gains on cash flow hedging derivatives
|
(868
|
)
|
(107,713
|
)
|
1,001
|
|
||||||
|
Reclassification adjustments
|
60,043
|
|
(12,515
|
)
|
(32,477
|
)
|
||||||
|
Total other comprehensive income (loss), net of tax
|
57,255
|
|
(227,264
|
)
|
(12,223
|
)
|
||||||
|
Comprehensive income
|
$
|
718,186
|
|
$
|
401,698
|
|
$
|
497,576
|
|
|||
The accompanying notes are an integral part of these consolidated financial statements.
52
THE HERSHEY COMPANY
|
December 31,
|
2012
|
2011
|
||||||
|
In thousands of dollars
|
||||||||
|
ASSETS
|
||||||||
|
Current Assets:
|
||||||||
|
Cash and cash equivalents
|
$
|
728,272
|
|
$
|
693,686
|
|
||
|
Accounts receivable—trade
|
461,383
|
|
399,499
|
|
||||
|
Inventories
|
633,262
|
|
648,953
|
|
||||
|
Deferred income taxes
|
122,224
|
|
136,861
|
|
||||
|
Prepaid expenses and other
|
168,344
|
|
167,559
|
|
||||
|
Total current assets
|
2,113,485
|
|
2,046,558
|
|
||||
|
Property, Plant and Equipment, Net
|
1,674,071
|
|
1,559,717
|
|
||||
|
Goodwill
|
588,003
|
|
516,745
|
|
||||
|
Other Intangibles
|
214,713
|
|
111,913
|
|
||||
|
Deferred Income Taxes
|
12,448
|
|
33,439
|
|
||||
|
Other Assets
|
152,119
|
|
138,722
|
|
||||
|
Total assets
|
$
|
4,754,839
|
|
$
|
4,407,094
|
|
||
|
LIABILITIES AND STOCKHOLDERS’ EQUITY
|
||||||||
|
Current Liabilities:
|
||||||||
|
Accounts payable
|
$
|
441,977
|
|
$
|
420,017
|
|
||
|
Accrued liabilities
|
650,906
|
|
612,186
|
|
||||
|
Accrued income taxes
|
2,329
|
|
1,899
|
|
||||
|
Short-term debt
|
118,164
|
|
42,080
|
|
||||
|
Current portion of long-term debt
|
257,734
|
|
97,593
|
|
||||
|
Total current liabilities
|
1,471,110
|
|
1,173,775
|
|
||||
|
Long-term Debt
|
1,530,967
|
|
1,748,500
|
|
||||
|
Other Long-term Liabilities
|
668,732
|
|
603,876
|
|
||||
|
Deferred Income Taxes
|
35,657
|
|
—
|
|
||||
|
Total liabilities
|
3,706,466
|
|
3,526,151
|
|
||||
|
Commitments and Contingencies
|
—
|
|
—
|
|
||||
|
Stockholders’ Equity:
|
||||||||
|
The Hershey Company Stockholders’ Equity
|
||||||||
|
Preferred Stock, shares issued: none in 2012 and 2011
|
—
|
|
—
|
|
||||
|
Common Stock, shares issued: 299,272,927 in 2012 and 299,269,702 in 2011
|
299,272
|
|
299,269
|
|
||||
|
Class B Common Stock, shares issued: 60,628,817 in 2012 and 60,632,042 in 2011
|
60,629
|
|
60,632
|
|
||||
|
Additional paid-in capital
|
592,975
|
|
490,817
|
|
||||
|
Retained earnings
|
5,027,617
|
|
4,707,892
|
|
||||
|
Treasury—Common Stock shares, at cost: 136,115,714 in 2012 and 134,695,826 in 2011
|
(4,558,668
|
)
|
(4,258,962
|
)
|
||||
|
Accumulated other comprehensive loss
|
(385,076
|
)
|
(442,331
|
)
|
||||
|
The Hershey Company stockholders’ equity
|
1,036,749
|
|
857,317
|
|
||||
|
Noncontrolling interests in subsidiaries
|
11,624
|
|
23,626
|
|
||||
|
Total stockholders’ equity
|
1,048,373
|
|
880,943
|
|
||||
|
Total liabilities and stockholders’ equity
|
$
|
4,754,839
|
|
$
|
4,407,094
|
|
||
The notes to consolidated financial statements are an integral part of these balance sheets.
53
THE HERSHEY COMPANY
|
For the years ended December 31,
|
2012
|
2011
|
2010
|
|||||||||
|
In thousands of dollars
|
||||||||||||
|
Cash Flows Provided from (Used by) Operating Activities
|
||||||||||||
|
Net income
|
$
|
660,931
|
|
$
|
628,962
|
|
$
|
509,799
|
|
|||
|
Adjustments to reconcile net income to net cash provided from operations:
|
||||||||||||
|
Depreciation and amortization
|
210,037
|
|
215,763
|
|
197,116
|
|
||||||
|
Stock-based compensation expense
|
50,482
|
|
43,468
|
|
49,468
|
|
||||||
|
Excess tax benefits from stock-based compensation
|
(33,876
|
)
|
(13,997
|
)
|
(1,385
|
)
|
||||||
|
Deferred income taxes
|
13,785
|
|
33,611
|
|
(18,654
|
)
|
||||||
|
Gain on sale of trademark licensing rights, net of tax of $5,962
|
—
|
|
(11,072
|
)
|
—
|
|
||||||
|
Non-cash business realignment and impairment charges
|
38,144
|
|
34,660
|
|
62,104
|
|
||||||
|
Contributions to pension and other benefits plans
|
(44,208
|
)
|
(31,671
|
)
|
(27,723
|
)
|
||||||
|
Changes in assets and liabilities, net of effects from business acquisitions and divestitures:
|
||||||||||||
|
Accounts receivable—trade
|
(50,470
|
)
|
(9,438
|
)
|
20,329
|
|
||||||
|
Inventories
|
26,598
|
|
(115,331
|
)
|
(13,910
|
)
|
||||||
|
Accounts payable
|
21,739
|
|
7,860
|
|
90,434
|
|
||||||
|
Other assets and liabilities
|
201,665
|
|
(194,948
|
)
|
33,845
|
|
||||||
|
Net Cash Provided from Operating Activities
|
1,094,827
|
|
587,867
|
|
901,423
|
|
||||||
|
Cash Flows Provided from (Used by) Investing Activities
|
||||||||||||
|
Capital additions
|
(258,727
|
)
|
(323,961
|
)
|
(179,538
|
)
|
||||||
|
Capitalized software additions
|
(19,239
|
)
|
(23,606
|
)
|
(21,949
|
)
|
||||||
|
Proceeds from sales of property, plant and equipment
|
453
|
|
312
|
|
2,201
|
|
||||||
|
Proceeds from sale of trademark licensing rights
|
—
|
|
20,000
|
|
—
|
|
||||||
|
Loan to affiliate
|
(23,000
|
)
|
(7,000
|
)
|
—
|
|
||||||
|
Business acquisitions
|
(172,856
|
)
|
(5,750
|
)
|
—
|
|
||||||
|
Net Cash (Used by) Investing Activities
|
(473,369
|
)
|
(340,005
|
)
|
(199,286
|
)
|
||||||
|
Cash Flows Provided from (Used by) Financing Activities
|
||||||||||||
|
Net increase in short-term debt
|
77,698
|
|
10,834
|
|
1,156
|
|
||||||
|
Long-term borrowings
|
4,025
|
|
249,126
|
|
348,208
|
|
||||||
|
Repayment of long-term debt
|
(99,381
|
)
|
(256,189
|
)
|
(71,548
|
)
|
||||||
|
Proceeds from lease financing agreement
|
—
|
|
47,601
|
|
—
|
|
||||||
|
Cash dividends paid
|
(341,206
|
)
|
(304,083
|
)
|
(283,434
|
)
|
||||||
|
Exercise of stock options
|
261,597
|
|
184,411
|
|
92,033
|
|
||||||
|
Excess tax benefits from stock-based compensation
|
33,876
|
|
13,997
|
|
1,385
|
|
||||||
|
Payments to noncontrolling interests
|
(15,791
|
)
|
—
|
|
—
|
|
||||||
|
Contributions from noncontrolling interests
|
2,940
|
|
—
|
|
10,199
|
|
||||||
|
Repurchase of Common Stock
|
(510,630
|
)
|
(384,515
|
)
|
(169,099
|
)
|
||||||
|
Net Cash (Used by) Financing Activities
|
(586,872
|
)
|
(438,818
|
)
|
(71,100
|
)
|
||||||
|
Increase (Decrease) in Cash and Cash Equivalents
|
34,586
|
|
(190,956
|
)
|
631,037
|
|
||||||
|
Cash and Cash Equivalents as of January 1
|
693,686
|
|
884,642
|
|
253,605
|
|
||||||
|
Cash and Cash Equivalents as of December 31
|
$
|
728,272
|
|
$
|
693,686
|
|
$
|
884,642
|
|
|||
|
Interest Paid
|
$
|
100,269
|
|
$
|
97,892
|
|
$
|
97,932
|
|
|||
|
Income Taxes Paid
|
327,230
|
|
292,315
|
|
350,948
|
|
||||||
The notes to consolidated financial statements are an integral part of these statements.
54
THE HERSHEY COMPANY
CONSOLIDATED STATEMENTS OF STOCKHOLDERS’ EQUITY
|
In thousands of dollars
|
Preferred
Stock |
Common
Stock |
Class B
Common Stock |
Additional
Paid-in Capital |
Retained
Earnings |
Treasury
Common Stock |
Accumulated
Other Comprehensive Income (Loss) |
Noncontrolling
Interests in Subsidiaries |
Total
Stockholders’ Equity |
|||||||||||||||||||||||||||
|
Balance as of January 1, 2010
|
$
|
—
|
|
$
|
299,192
|
|
$
|
60,709
|
|
$
|
394,678
|
|
$
|
4,156,648
|
|
$
|
(3,979,629
|
)
|
$
|
(202,844
|
)
|
$
|
39,880
|
|
$
|
768,634
|
|
|||||||||
|
Net income
|
|
|
|
|
509,799
|
|
|
|
|
509,799
|
|
|||||||||||||||||||||||||
|
Other comprehensive loss
|
|
|
|
|
|
|
(12,223
|
)
|
|
(12,223
|
)
|
|||||||||||||||||||||||||
|
Dividends:
|
|
|
|
|
|
|
|
|
|
|
||||||||||||||||||||||||||
|
Common Stock, $1.28 per share
|
|
|
|
|
(213,013
|
)
|
|
|
|
(213,013
|
)
|
|||||||||||||||||||||||||
|
Class B Common Stock, $1.16 per share
|
|
|
|
|
(70,421
|
)
|
|
|
|
(70,421
|
)
|
|||||||||||||||||||||||||
|
Conversion of Class B Common Stock into Common Stock
|
|
3
|
|
(3
|
)
|
|
|
|
|
|
—
|
|
||||||||||||||||||||||||
|
Incentive plan transactions
|
|
|
|
(7,453
|
)
|
|
10,239
|
|
|
|
2,786
|
|
||||||||||||||||||||||||
|
Stock-based compensation
|
|
|
|
40,630
|
|
|
|
|
|
40,630
|
|
|||||||||||||||||||||||||
|
Exercise of stock options
|
|
|
|
7,010
|
|
|
86,388
|
|
|
|
93,398
|
|
||||||||||||||||||||||||
|
Repurchase of Common Stock
|
|
|
|
|
|
(169,099
|
)
|
|
|
(169,099
|
)
|
|||||||||||||||||||||||||
|
Noncontrolling interests in subsidiaries
|
|
|
|
|
|
|
|
|
|
|
|
|
|
|
(4,595
|
)
|
(4,595
|
)
|
||||||||||||||||||
|
Balance as of December 31, 2010
|
—
|
|
299,195
|
|
60,706
|
|
434,865
|
|
4,383,013
|
|
(4,052,101
|
)
|
(215,067
|
)
|
35,285
|
|
945,896
|
|
||||||||||||||||||
|
Net income
|
|
|
|
|
628,962
|
|
|
|
|
628,962
|
|
|||||||||||||||||||||||||
|
Other comprehensive loss
|
|
|
|
|
|
|
(227,264
|
)
|
|
(227,264
|
)
|
|||||||||||||||||||||||||
|
Dividends:
|
|
|
|
|
|
|
|
|
|
|
||||||||||||||||||||||||||
|
Common Stock, $1.38 per share
|
|
|
|
|
(228,269
|
)
|
|
|
|
(228,269
|
)
|
|||||||||||||||||||||||||
|
Class B Common Stock, $1.25 per share
|
|
|
|
|
(75,814
|
)
|
|
|
|
(75,814
|
)
|
|||||||||||||||||||||||||
|
Conversion of Class B Common Stock into Common Stock
|
|
74
|
|
(74
|
)
|
|
|
|
|
|
—
|
|
||||||||||||||||||||||||
|
Incentive plan transactions
|
|
|
|
(15,844
|
)
|
|
14,306
|
|
|
|
(1,538
|
)
|
||||||||||||||||||||||||
|
Stock-based compensation
|
|
|
|
40,439
|
|
|
|
|
|
40,439
|
|
|||||||||||||||||||||||||
|
Exercise of stock options
|
|
|
|
31,357
|
|
|
163,348
|
|
|
|
194,705
|
|
||||||||||||||||||||||||
|
Repurchase of Common Stock
|
|
|
|
|
|
(384,515
|
)
|
|
|
(384,515
|
)
|
|||||||||||||||||||||||||
|
Noncontrolling interests in subsidiaries
|
|
|
|
|
|
|
|
|
|
|
|
|
|
|
(11,659
|
)
|
(11,659
|
)
|
||||||||||||||||||
|
Balance as of December 31, 2011
|
—
|
|
299,269
|
|
60,632
|
|
490,817
|
|
4,707,892
|
|
(4,258,962
|
)
|
(442,331
|
)
|
23,626
|
|
880,943
|
|
||||||||||||||||||
|
Net income
|
|
|
|
|
660,931
|
|
|
|
|
660,931
|
|
|||||||||||||||||||||||||
|
Other comprehensive income
|
|
|
|
|
|
|
57,255
|
|
|
57,255
|
|
|||||||||||||||||||||||||
|
Dividends:
|
|
|
|
|
|
|
|
|
|
|
||||||||||||||||||||||||||
|
Common Stock, $1.56 per share
|
|
|
|
|
(255,596
|
)
|
|
|
|
(255,596
|
)
|
|||||||||||||||||||||||||
|
Class B Common Stock, $1.412 per share
|
|
|
|
|
(85,610
|
)
|
|
|
|
(85,610
|
)
|
|||||||||||||||||||||||||
|
Conversion of Class B Common Stock into Common Stock
|
|
3
|
|
(3
|
)
|
|
|
|
|
|
—
|
|
||||||||||||||||||||||||
|
Incentive plan transactions
|
|
|
|
(24,230
|
)
|
|
12,379
|
|
|
|
(11,851
|
)
|
||||||||||||||||||||||||
|
Stock-based compensation
|
|
|
|
49,175
|
|
|
|
|
|
49,175
|
|
|||||||||||||||||||||||||
|
Exercise of stock options
|
|
|
|
88,258
|
|
|
198,545
|
|
|
|
286,803
|
|
||||||||||||||||||||||||
|
Repurchase of Common Stock
|
|
|
|
|
|
(510,630
|
)
|
|
|
(510,630
|
)
|
|||||||||||||||||||||||||
|
Purchase of noncontrolling interest in subsidiary
|
(11,045
|
)
|
(4,746
|
)
|
(15,791
|
)
|
||||||||||||||||||||||||||||||
|
Noncontrolling interests in subsidiaries
|
|
|
|
|
|
|
|
|
|
|
|
|
|
|
(7,256
|
)
|
(7,256
|
)
|
||||||||||||||||||
|
Balance as of December 31, 2012
|
$
|
—
|
|
$
|
299,272
|
|
$
|
60,629
|
|
$
|
592,975
|
|
$
|
5,027,617
|
|
$
|
(4,558,668
|
)
|
$
|
(385,076
|
)
|
$
|
11,624
|
|
$
|
1,048,373
|
|
|||||||||
The notes to consolidated financial statements are an integral part of these statements.
55
THE HERSHEY COMPANY
NOTES TO CONSOLIDATED FINANCIAL STATEMENTS
1. SUMMARY OF SIGNIFICANT ACCOUNTING POLICIES
Our significant accounting policies are discussed below and in other notes to the consolidated financial statements.
Principles of Consolidation
Our consolidated financial statements include the accounts of the Company and our majority-owned subsidiaries and entities in which we have a controlling financial interest after the elimination of intercompany accounts and transactions. We have a controlling financial interest if we own a majority of the outstanding voting common stock and minority shareholders do not have substantive participating rights or we have significant control over an entity through contractual or economic interests in which we are the primary beneficiary.
In May 2007, we entered into an agreement with Godrej Beverages and Foods, Ltd., to manufacture and distribute confectionery products, snacks and beverages across India. Under the agreement, we owned a
51%
controlling interest in Godrej Hershey Ltd. This business acquisition is included in our consolidated results, including the noncontrolling interest prior to September 2012. In September 2012, we acquired the remaining
49%
interest in Godrej Hershey Ltd. for approximately
$15.8 million
. Since the Company had a controlling interest in Godrej Hershey Ltd., the difference between the amount paid and the carrying amount of the noncontrolling interest of
$10.3 million
was recorded as a reduction of additional paid-in capital and the noncontrolling interest in Godrej Hershey Ltd. was eliminated as of
September 30, 2012
.
In January 2008, our Brazilian subsidiary, Hershey do Brasil, entered into a cooperative agreement with Pandurata Netherlands B.V. (“Bauducco”), a leading manufacturer of baked goods in Brazil whose primary brand is Bauducco. Under this agreement we manufacture and market, and they sell and distribute our products. The agreement conveyed a
49%
interest in Hershey do Brasil to Bauducco. We maintain a
51%
controlling interest in Hershey do Brasil and, therefore, the results of this subsidiary are included in the consolidated financial statements of the Company.
Equity Investments
We use the equity method of accounting when we have a
20%
to
50%
interest in other companies and exercise significant influence. Under the equity method, original investments are recorded at cost and adjusted by our share of undistributed earnings or losses of these companies. Total equity investments were
$39.2 million
as of
December 31, 2012
, and
$40.7 million
as of
December 31, 2011
. Equity investments are included in other assets in the Consolidated Balance Sheets. Equity investments are reviewed for impairment whenever events or changes in circumstances indicate that the carrying amount of the investments may not be recoverable. In May 2007, we entered into a manufacturing agreement in China with Lotte Confectionery Company, LTD. to produce Hershey products and certain Lotte products for the markets in Asia, particularly China. We own a
44%
interest in this entity. We made loans to this affiliate of the Company of
$23.0 million
in 2012 and
$7.0 million
in 2011 to finance the expansion of manufacturing capacity.
Use of Estimates
The preparation of financial statements in conformity with U.S. generally accepted accounting principles (“GAAP”) requires management to make estimates and assumptions that affect the reported amounts of assets and liabilities at the date of the financial statements, and revenues and expenses during the reporting period. Critical accounting estimates involved in applying our accounting policies are those that require management to make assumptions about matters that are highly uncertain at the time the accounting estimate was made and those for which different estimates reasonably could have been used for the current period. Critical accounting estimates are also those which are reasonably likely to change from period to period and would have a material impact on the presentation of our financial condition, changes in financial condition or results of operations. Our most critical accounting estimates pertain to accounting policies for accrued liabilities, pension and other post-retirement benefit plans, goodwill and other intangible assets, commodities futures and options contracts, and income taxes.
These estimates and assumptions are based on management’s best judgment. Management evaluates its estimates and assumptions on an ongoing basis using historical experience and other factors, including the current economic environment,
56
THE HERSHEY COMPANY
NOTES TO CONSOLIDATED FINANCIAL STATEMENTS—(Continued)
which management believes to be reasonable under the circumstances. We adjust such estimates and assumptions when facts and circumstances dictate. Volatile credit, equity, foreign currency, commodity and energy markets, and changing macroeconomic conditions have combined to increase the uncertainty inherent in such estimates and assumptions. As future events and their effects cannot be determined with precision, actual results could differ significantly from these estimates. Changes in these estimates resulting from continuing changes in the economic environment will be reflected in the financial statements in future periods.
Revenue Recognition
We record sales when all of the following criteria have been met:
|
l
|
A valid customer order with a fixed price has been received;
|
|
l
|
The product has been delivered to the customer;
|
|
l
|
There is no further significant obligation to assist in the resale of the product; and
|
|
l
|
Collectability is reasonably assured.
|
Net sales include revenue from the sale of finished goods and royalty income, net of allowances for trade promotions, consumer coupon programs and other sales incentives, and allowances and discounts associated with aged or potentially unsaleable products. Trade promotions and sales incentives primarily include reduced price features, merchandising displays, sales growth incentives, new item allowances and cooperative advertising.
Cost of Sales
Cost of sales represents costs directly related to the manufacture and distribution of our products. Primary costs include raw materials, packaging, direct labor, overhead, shipping and handling, warehousing and the depreciation of manufacturing, warehousing and distribution facilities. Manufacturing overhead and related expenses include salaries, wages, employee benefits, utilities, maintenance and property taxes.
Selling, Marketing and Administrative
Selling, marketing and administrative expenses represent costs incurred in generating revenues and in managing our business. Such costs include advertising and other marketing expenses, salaries, employee benefits, incentive compensation, research and development, travel, office expenses, amortization of capitalized software and depreciation of administrative facilities.
Cash Equivalents
Cash equivalents consist of highly liquid debt instruments, time deposits and money market funds with original maturities of 3 months or less. The fair value of cash and cash equivalents approximates the carrying amount.
Commodities Futures and Options Contracts
We enter into commodities futures and options contracts and other commodity derivative instruments to reduce the effect of price fluctuations associated with the purchase of raw materials, energy requirements and transportation services. We report the effective portion of the gain or loss on a derivative instrument designated and qualifying as a cash flow hedging instrument as a component of other comprehensive income and reclassify such gains or losses into earnings in the same period or periods during which the hedged transactions affect earnings. The remaining gain or loss on the derivative instrument, if any, must be recognized currently in earnings.
For a derivative designated as hedging the exposure to changes in the fair value of a recognized asset or liability or a firm commitment (referred to as a fair value hedge), the gain or loss must be recognized in earnings in the period of change together with the offsetting loss or gain on the hedged item attributable to the risk being hedged. The effect of that accounting is to reflect in earnings the extent to which the hedge is not effective in achieving offsetting changes in fair value.
All derivative instruments which we are currently utilizing, including commodities futures and options contracts and other commodity derivative instruments, are designated and accounted for as cash flow hedges. Additional information with regard to accounting policies associated with derivative instruments is contained in
Note 6, Derivative Instruments and Hedging Activities.
57
THE HERSHEY COMPANY
NOTES TO CONSOLIDATED FINANCIAL STATEMENTS—(Continued)
Property, Plant and Equipment
Property, plant and equipment are stated at cost and depreciated on a straight-line basis over the estimated useful lives of the assets, as follows:
3
to
15 years
for machinery and equipment; and
25
to
40 years
for buildings and related improvements. Maintenance and repairs are expensed as incurred. We capitalize applicable interest charges incurred during the construction of new facilities and production lines and amortize these costs over the assets’ estimated useful lives.
We review long-lived assets for impairment whenever events or changes in circumstances indicate that the carrying amount of such assets may not be recoverable. We measure the recoverability of assets to be held and used by a comparison of the carrying amount of long-lived assets to future undiscounted net cash flows expected to be generated. If these assets are considered to be impaired, we measure impairment as the amount by which the carrying amount of the assets exceeds the fair value of the assets. We report assets held for sale or disposal at the lower of the carrying amount or fair value less cost to sell.
Asset Retirement Obligations
Asset retirement obligations generally apply to legal obligations associated with the retirement of a tangible long-lived asset that result from the acquisition, construction or development and normal operation of a long-lived asset. We assess asset retirement obligations on a periodic basis. We recognize the fair value of a liability for an asset retirement obligation in the period in which it is incurred if a reasonable estimate of fair value can be made. We capitalize associated asset retirement costs as part of the carrying amount of the long-lived asset.
Goodwill and Other Intangible Assets
We classify intangible assets into 3 categories: (1) intangible assets with finite lives subject to amortization; (2) intangible assets with indefinite lives not subject to amortization; and (3) goodwill.
Our intangible assets with finite lives consist primarily of certain trademarks, customer-related intangible assets and patents obtained through business acquisitions. We are amortizing trademarks with finite lives over their estimated useful lives of approximately
25 years
. We are amortizing customer-related intangible assets over their estimated useful lives of approximately
15 years
. We are amortizing patents over their remaining legal lives of approximately
6 years
. We conduct impairment tests when events or changes in circumstances indicate that the carrying value of these assets may not be recoverable. Undiscounted cash flow analyses are used to determine if an impairment exists. If an impairment is determined to exist, the loss is calculated based on the estimated fair value of the assets.
Our intangible assets with indefinite lives consist of trademarks obtained through business acquisitions. We do not amortize existing trademarks whose useful lives were determined to be indefinite. We conduct impairment tests for other intangible assets with indefinite lives and goodwill at the beginning of the fourth quarter of each year, or when circumstances arise that indicate a possible impairment might exist.
We evaluate our trademarks with indefinite lives for impairment by comparing their carrying amount to their estimated fair value. The fair value of trademarks is calculated using a “relief from royalty payments” methodology. This approach involves a two-step process. In the first step, we estimate reasonable royalty rates for each trademark. In the second step, we apply these royalty rates to a net sales stream and discount the resulting cash flows to determine fair value. This fair value is then compared with the carrying value of each trademark. If the estimated fair value is less than the carrying amount, we record an impairment charge to reduce the asset to its estimated fair value. The estimates of future cash flows are generally based on past performance of the brands and reflect net sales projections and assumptions for the brands that we use in current operating plans. We also consider assumptions that market participants may use. Such assumptions are subject to change due to changing economic and competitive conditions.
We use a two-step process to evaluate goodwill for impairment. In the first step, we compare the fair value of each reporting unit with the carrying amount of the reporting unit, including goodwill. We estimate the fair value of the reporting unit based on discounted future cash flows. If the estimated fair value of the reporting unit is less than the carrying amount of the reporting unit, we complete a second step to determine the amount of the goodwill impairment that we should record. In the second step, we determine an implied fair value of the reporting unit’s goodwill by allocating the reporting unit’s fair value to all of its assets and liabilities other than goodwill (including any unrecognized intangible assets). We compare the resulting implied fair value of the goodwill to the carrying amount and record an impairment charge for the difference.
The assumptions we use to estimate fair value are based on the past performance of each reporting unit and reflect the projections and assumptions that we use in current operating plans. We also adjust the assumptions, if necessary, to estimates
58
THE HERSHEY COMPANY
NOTES TO CONSOLIDATED FINANCIAL STATEMENTS—(Continued)
that we believe market participants would use. Such assumptions are subject to change due to changing economic and competitive conditions.
As a result of operating performance that was below expectations, we completed an impairment evaluation of goodwill and other intangible assets of Godrej Hershey Ltd. during the second quarter of 2010. As a result of reduced expectations for future cash flows from lower than expected profitability, we determined that the carrying amount of Godrej Hershey Ltd. exceeded its fair value. We recorded a non-cash goodwill impairment charge of
$44.7 million
in the second quarter of 2010 to reduce the carrying value of Godrej Hershey Ltd. to its fair value, including a reduction to reflect the share of the charge associated with the noncontrolling interests. There was no tax benefit associated with this charge.
We provide more information on intangible assets in
Note 18, Supplemental Balance Sheet Information.
Comprehensive Income
We report comprehensive income (loss) on the Consolidated Statements of Comprehensive Income and accumulated other comprehensive income (loss) on the Consolidated Balance Sheets. Additional information regarding comprehensive income is contained in
Note 9, Comprehensive Income
.
We translate results of operations for foreign entities using the average exchange rates during the period. For foreign entities, assets and liabilities are translated to U.S. dollars using the exchange rates in effect at the balance sheet date. Resulting translation adjustments are recorded as a component of other comprehensive income (loss), “Foreign Currency Translation Adjustments.”
Changes to the balances of the unrecognized prior service cost and the unrecognized net actuarial loss, net of income taxes, associated with our pension and post-retirement benefit plans are recorded as a component of other comprehensive income (loss), “Pension and Post-retirement Benefit Plans.” Additional information regarding accounting policies associated with benefit plans is contained in
Note 14, Pension and Other Post-Retirement Benefit Plans
.
Gains and losses on cash flow hedging derivatives, to the extent effective, are included in other comprehensive income (loss), net of related tax effects. Reclassification adjustments reflecting such gains and losses are ratably recorded in income in the same period during which the hedged transactions affect earnings. Additional information with regard to accounting policies associated with derivative instruments is contained in
Note 6, Derivative Instruments and Hedging Activities
.
Foreign Exchange Forward Contracts and Options
We enter into foreign exchange forward contracts and options to hedge transactions denominated in foreign currencies. These transactions are primarily related to firm commitments or forecasted purchases of equipment, certain raw materials and finished goods. We also hedge payment of forecasted intercompany transactions with our subsidiaries outside of the United States. These contracts reduce currency risk from exchange rate movements.
Foreign exchange forward contracts and options are intended to be and are effective as hedges of identifiable foreign currency commitments and forecasted transactions. Foreign exchange forward contracts and options are designated as cash flow hedging derivatives and the fair value of such contracts is recorded on the Consolidated Balance Sheets as either an asset or liability. Gains and losses on these contracts are recorded as a component of other comprehensive income and are reclassified into earnings in the same period during which the hedged transactions affect earnings. Additional information with regard to accounting policies for derivative instruments, including foreign exchange forward contracts and options, is contained in
Note 6, Derivative Instruments and Hedging Activities
.
License Agreements
We own various registered and unregistered trademarks and service marks, and have rights under licenses to use various trademarks that are of material importance to our business. We also grant trademark licenses to third parties to produce and sell pantry items, flavored milks and various other products primarily under the
HERSHEY’S
and
REESE’S
brand names.
59
THE HERSHEY COMPANY
NOTES TO CONSOLIDATED FINANCIAL STATEMENTS—(Continued)
Research and Development
We expense research and development costs as incurred. Research and development expense was
$39.0 million
in
2012
,
$33.2 million
in
2011
and
$31.1 million
in
2010
. Research and development expense is included in selling, marketing and administrative expenses.
Advertising
We expense advertising costs as incurred. Advertising expense, which is included in selling, marketing and administrative expenses, was
$480.0 million
in
2012
,
$414.2 million
in
2011
and
$391.1 million
in
2010
. Prepaid advertising expense as of
December 31, 2012
was
$9.5 million
and as of
December 31, 2011
was
$3.2 million
.
Computer Software
We capitalize costs associated with software developed or obtained for internal use when both the preliminary project stage is completed and it is probable that computer software being developed will be completed and placed in service. Capitalized costs include only (i) external direct costs of materials and services consumed in developing or obtaining internal-use software, (ii) payroll and other related costs for employees who are directly associated with and who devote time to the internal-use software project and (iii) interest costs incurred, when material, while developing internal-use software. We cease capitalization of such costs no later than the point at which the project is substantially complete and ready for its intended purpose.
The unamortized amount of capitalized software was
$50.5 million
as of
December 31, 2012
and was
$49.4 million
as of
December 31, 2011
. We amortize software costs using the straight-line method over the expected life of the software, generally
3
to
5 years
. Accumulated amortization of capitalized software was
$256.1 million
as of
December 31, 2012
and
$232.8 million
as of
December 31, 2011
.
We review the carrying value of software and development costs for impairment in accordance with our policy pertaining to the impairment of long-lived assets. Generally, we measure impairment under the following circumstances:
|
l
|
When internal-use computer software is not expected to provide substantive service potential;
|
|
l
|
A significant change occurs in the extent or manner in which the software is used or is expected to be used;
|
|
l
|
A significant change is made or will be made to the software program; and
|
|
l
|
Costs of developing or modifying internal-use computer software significantly exceed the amount originally expected to develop or modify the software.
|
Reclassifications and Prior Period Adjustments
We have made certain reclassifications to prior year amounts to conform to the
2012
presentation. Additionally, the Company elected to adjust certain accrued liabilities associated with insurance programs that had been historically overstated. Accordingly, an adjustment of
$13.4 million
was recorded to reduce other long-term liabilities, with a corresponding reduction of non-current deferred tax assets of
$5.1 million
, resulting in an adjustment to increase opening retained earnings by
$8.3 million
. Adjustments were made to the Consolidated Balance Sheets, the Consolidated Statements of Stockholders' Equity and Notes to Consolidated Financial Statements for all periods presented.
An adjustment was made to the Consolidated Statement of Cash Flows for the year ended
December 31, 2011
, to reflect a loan to affiliate of
$7.0 million
in Cash Provided From (Used by) Investing Activities. This adjustment resulted in a corresponding reduction of cash used by other assets and liabilities and an increase in Net Cash Provided from Operating Activities for the year.
The impact of these corrections is not considered material to the consolidated financial statements for any of the periods presented.
60
THE HERSHEY COMPANY
NOTES TO CONSOLIDATED FINANCIAL STATEMENTS—(Continued)
2. BUSINESS ACQUISITIONS
Acquisitions of businesses are accounted for as purchases and, accordingly, their results of operations have been included in the consolidated financial statements since the respective dates of the acquisitions. The purchase price for each of the acquisitions is allocated to the assets acquired and liabilities assumed.
In January 2012, we acquired all of the outstanding stock of Brookside Foods Ltd. (“Brookside”), a privately held confectionery company based in Abbottsford, British Columbia, Canada. As part of this transaction, we acquired two production facilities located in British Columbia and Quebec. The Brookside product line is primarily sold in the U.S. and Canada in a take home re-sealable pack type.
Our financial statements reflect the final accounting for the Brookside acquisition. The purchase price for the acquisition was approximately
$172.9 million
. The purchase price allocation of the Brookside acquisition is as follows:
|
In thousands of dollars
|
Purchase Price
Allocation
|
Estimated
Useful Life in Years |
|||||
|
Goodwill
|
$
|
67,974
|
|
Indefinite
|
|||
|
Trademarks
|
60,253
|
|
25
|
||||
|
Other intangibles
(1)
|
51,057
|
|
6
|
to
|
17
|
||
|
Other assets, net of liabilities assumed of $18.7 million
|
21,673
|
|
|||||
|
Non-current deferred tax liabilities
|
(28,101
|
)
|
|||||
|
Purchase price
|
$
|
172,856
|
|
||||
(1) Includes customer relationships, patents and covenants not to compete.
The excess purchase price over the estimated value of the net tangible and identifiable intangible assets was recorded to goodwill. The goodwill is not expected to be deductible for tax purposes.
In February 2011, we acquired a
49%
interest in Tri-US, Inc. of Boulder, Colorado, a company that manufactures, markets and sells nutritional beverages under the “
mix1
” brand name. We invested
$5.8 million
and accounted for this investment using the equity method until January 2012. In January 2012, we made an additional investment of
$6.0 million
in Tri-US, Inc., resulting in a controlling ownership interest of approximately
69%
.
We included results of these businesses subsequent to the acquisition dates in the consolidated financial statements. If we had included the results of these businesses in the consolidated financial statements for each of the periods presented, the effect would not have been material.
3. BUSINESS REALIGNMENT AND IMPAIRMENT CHARGES
In June 2010, we announced Project Next Century (the “Next Century program”) as part of our ongoing efforts to create an advantaged supply chain and competitive cost structure. As part of the program, production was to transition from the Company's century-old facility at 19 East Chocolate Avenue in Hershey, Pennsylvania, to an expanded West Hershey facility, which was built in 1992. Production from the 19 East Chocolate Avenue plant, as well as a portion of the workforce, was fully transitioned to the West Hershey facility during 2012.
We estimate that the Next Century program will incur pre-tax charges and non-recurring project implementation costs of
$190 million
to
$200 million
. This estimate includes
$170 million
to
$180 million
in pre-tax business realignment and impairment charges and approximately
$20 million
in project implementation and start-up costs, in addition to pension settlement losses of
$15.8 million
which were recorded in
2012
. As of
December 31, 2012
, total costs of
$173.6 million
have been recorded over the last three years for the Next Century program. Total costs of
$76.3 million
were recorded during
2012
. Total costs of
$43.4 million
were recorded in
2011
and total costs of
$53.9 million
were recorded in
2010
.
In September 2011, we entered into a sale and leasing agreement for the 19 East Chocolate Avenue manufacturing facility with Chocolate Realty DST, a Delaware Statutory Trust. Chocolate Realty DST is not affiliated with the Milton Hershey School Trust. We are leasing a portion of the building for administrative office space under the agreement. As a result of our continuing involvement and use of the property, we are deemed to be the owner of the property for accounting
61
THE HERSHEY COMPANY
NOTES TO CONSOLIDATED FINANCIAL STATEMENTS—(Continued)
purposes. We received net proceeds of
$47.6 million
and recorded a lease financing obligation of
$50.0 million
under the leasing agreement in
2011
. The initial term of the agreement expires in
2041
.
In December 2012, the Board of Directors of Tri-US, Inc. decided to immediately cease operations and dissolve the company as a result of operational difficulties, quality issues and competitive constraints. In December 2012, the Company recorded non-cash asset impairment charges of approximately
$7.5 million
, primarily associated with the write off of goodwill and other intangible assets, including a reduction to reflect the share of the charges associated with the noncontrolling interests.
During the second quarter of 2010 we completed an impairment evaluation of goodwill and other intangible assets associated with Godrej Hershey Ltd. Based on this evaluation, we recorded a non-cash goodwill impairment charge of
$44.7 million
, including a reduction to reflect the share of the charge associated with the noncontrolling interests.
During 2009, we completed our comprehensive, three-year supply chain transformation program (the “global supply chain transformation program”).
Charges (credits) associated with business realignment initiatives and impairment recorded during
2012
,
2011
and
2010
were as follows:
|
For the years ended December 31,
|
2012
|
2011
|
2010
|
|||||||||
|
In thousands of dollars
|
||||||||||||
|
Cost of sales
|
||||||||||||
|
Next Century program
|
$
|
36,383
|
|
$
|
39,280
|
|
$
|
13,644
|
|
|||
|
Global supply chain transformation program
|
—
|
|
5,816
|
|
—
|
|
||||||
|
Total cost of sales
|
36,383
|
|
45,096
|
|
13,644
|
|
||||||
|
Selling, marketing and administrative - Next Century program
|
2,446
|
|
4,961
|
|
1,493
|
|
||||||
|
Business realignment and impairment charges, net
|
||||||||||||
|
Next Century program:
|
||||||||||||
|
Pension settlement loss
|
15,787
|
|
—
|
|
—
|
|
||||||
|
Plant closure expenses and fixed asset impairment
|
20,780
|
|
8,620
|
|
5,516
|
|
||||||
|
Employee separation costs (credits)
|
914
|
|
(9,506
|
)
|
33,225
|
|
||||||
|
Tri-US, Inc. asset impairment charges
|
7,457
|
|
—
|
|
—
|
|
||||||
|
Godrej Hershey Ltd. goodwill impairment
|
—
|
|
—
|
|
44,692
|
|
||||||
|
Total business realignment and impairment charges (credits), net
|
44,938
|
|
(886
|
)
|
83,433
|
|
||||||
|
Total net charges associated with business realignment initiatives and impairment
|
$
|
83,767
|
|
$
|
49,171
|
|
$
|
98,570
|
|
|||
Next Century Program
The charge of
$36.4 million
recorded in cost of sales during
2012
related primarily to start-up costs and accelerated depreciation of fixed assets over a reduced estimated remaining useful life associated with the Next Century program. A charge of
$2.4 million
was recorded in selling, marketing and administrative expenses during
2012
for project administration related to the Next Century program. The level of lump sum withdrawals during
2012
from one of the Company's pension plans by employees retiring or leaving the Company, primarily under the Next Century program, resulted in a non-cash pension settlement loss of
$15.8 million
. Expenses of
$20.8 million
were recorded in
2012
primarily related to costs associated with the closure of a manufacturing facility and the relocation of production lines.
The charge of
$39.3 million
recorded in cost of sales during
2011
related primarily to accelerated depreciation of fixed assets over a reduced estimated remaining useful life associated with the Next Century program. A charge of
$5.0 million
was recorded in selling, marketing and administrative expenses during
2011
for project administration related to the Next Century program. Plant closure expenses of
$8.6 million
were recorded in
2011
primarily related to costs associated with the relocation of production lines. Employee separation costs were reduced by
$9.5 million
during
2011
, which consisted of an
$11.2 million
credit reflecting lower expected costs related to voluntary and involuntary terminations at the two manufacturing facilities and a net benefits curtailment loss of
$1.7 million
also related to the employee terminations.
62
THE HERSHEY COMPANY
NOTES TO CONSOLIDATED FINANCIAL STATEMENTS—(Continued)
The charge of
$13.6 million
recorded in cost of sales during
2010
related primarily to accelerated depreciation of fixed assets over a reduced estimated remaining useful life associated with the Next Century program. A charge of
$1.5 million
was recorded in selling, marketing and administrative expenses during
2010
for project administration. Fixed asset impairment charges of
$5.5 million
were recorded during
2010
. In determining the costs related to fixed asset impairments, fair value was estimated based on the expected sales proceeds. Employee separation costs of
$33.2 million
during
2010
were related to expected voluntary and involuntary terminations at the two manufacturing facilities.
Global Supply Chain Transformation Program
The charge of
$5.8 million
recorded in
2011
was due to a decline in the estimated net realizable value of two properties being held for sale.
Tri-US, Inc. Impairment Charges
In February 2011, we acquired a
49%
interest in Tri-US, Inc. of Boulder, Colorado, a company that manufactures, markets and sells nutritional beverages under the “
mix1
” brand name. We invested
$5.8 million
and accounted for this investment using the equity method until January 2012. In January 2012, we made an additional investment of
$6.0 million
in Tri-US, Inc., resulting in a controlling ownership interest of approximately
69%
. In December 2012, the Board of Directors of Tri-US, Inc. decided to immediately cease operations and dissolve the company as a result of operational difficulties, quality issues and competitive constraints. It was determined that investments necessary to continue the business would not generate a sufficient return. Accordingly, in December 2012, the Company recorded non-cash asset impairment charges of approximately
$7.5 million
, primarily associated with the write off of goodwill and other intangible assets. These charges excluded the portion of the losses attributable to the noncontrolling interests.
Godrej Hershey Ltd. Goodwill Impairment
As a result of operating performance that was below expectations, we completed an impairment evaluation of goodwill and other intangible assets of Godrej Hershey Ltd. during the second quarter of
2010
. As a result of reduced expectations for future cash flows from lower than expected profitability, we determined that the carrying amount of Godrej Hershey Ltd. exceeded its fair value. As a result, we recorded a non-cash goodwill impairment charge of
$44.7 million
to reduce the carrying value of Godrej Hershey Ltd. to its fair value, including a reduction to reflect the share of the charge associated with the noncontrolling interests. There was no tax benefit associated with this charge. For more information on our accounting policies for goodwill and other intangible assets see pages 44 and 45.
Liabilities Associated with Business Realignment Initiatives
As of
December 31, 2012
, the liability balance relating to the Next Century program was
$7.6 million
primarily for estimated employee separation costs which were recorded in
2011
and
2010
. We made payments against the liabilities recorded for the Next Century program of
$12.8 million
in
2012
and
$2.2 million
in
2011
related to employee separation and project administration costs and the remainder will be paid in
2013
.
4. NONCONTROLLING INTERESTS IN SUBSIDIARIES
In
May 2007
, we entered into an agreement with Godrej Beverages and Foods, Ltd., a consumer goods, confectionery and food company, to manufacture and distribute confectionery products, snacks and beverages across India. Under the agreement, we owned a
51%
controlling interest in Godrej Hershey Ltd. In
June 2010
, the Company and the noncontrolling interests executed a rights agreement with Godrej Hershey Ltd. in the form of unsecured compulsorily and fully convertible debentures. The Company contributed cash of approximately
$11.1 million
and the noncontrolling interests contributed
$9.3 million
associated with the rights agreement. The ownership interest percentages in Godrej Hershey Ltd. did not change significantly as a result of these contributions. The noncontrolling interests in Godrej Hershey Ltd. were included in the equity section of the Consolidated Balance Sheets. In
September 2012
, we acquired the remaining
49%
interest in Godrej Hershey Ltd. for approximately
$15.8 million
. Since the Company had a controlling interest in Godrej Hershey Ltd., the difference between the amount paid and the carrying amount of the noncontrolling interest of
$10.3 million
was recorded as a reduction to additional paid-in capital and the noncontrolling interest in Godrej Hershey Ltd. was eliminated as of
September 30, 2012
.
We own a
51%
controlling interest in Hershey do Brasil under a cooperative agreement with Pandurata Netherlands B.V. (“Bauducco”), a leading manufacturer of baked goods in Brazil whose primary brand is Bauducco. During 2012, the Company contributed cash of approximately
$3.1 million
to Hershey do Brasil and Bauducco contributed approximately
$2.9 million
. During 2012, we also loaned
$7.0 million
to Hershey do Brasil to finance manufacturing capacity expansion. In
September 2010
, the Company contributed cash of approximately
$1.0 million
to Hershey do Brasil and Bauducco
63
THE HERSHEY COMPANY
NOTES TO CONSOLIDATED FINANCIAL STATEMENTS—(Continued)
contributed approximately
$0.9 million
. The noncontrolling interest in Hershey do Brasil is included in the equity section of the Consolidated Balance Sheets.
The decrease in noncontrolling interests in subsidiaries from
$23.6 million
as of
December 31, 2011
to
$11.6 million
as of
December 31, 2012
reflected the impact of the acquisition of the remaining
49%
interest in Godrej Hershey Ltd. in
September 2012
and the noncontrolling interests’ share of losses of these entities, as well as the impact of currency translation adjustments. These decreases were partially offset by the impact of the cash contributed by Bauducco. The share of losses pertaining to the noncontrolling interests in subsidiaries was
$9.6 million
for the year ended
December 31, 2012
,
$7.4 million
for the year ended
December 31, 2011
and
$8.2 million
for the year ended
December 31, 2010
. This was reflected in selling, marketing and administrative expenses.
5. COMMITMENTS AND CONTINGENCIES
We enter into certain obligations for the purchase of raw materials. These obligations are primarily in the form of forward contracts for the purchase of raw materials from third-party brokers and dealers. These contracts minimize the effect of future price fluctuations by fixing the price of part or all of these purchase obligations. Total obligations for each year consisted of fixed price contracts for the purchase of commodities and unpriced contracts that were valued using market prices as of
December 31, 2012
.
The cost of commodities associated with the unpriced contracts is variable as market prices change over future periods. We mitigate the variability of these costs to the extent that we have entered into commodities futures contracts or other commodity derivative instruments to hedge our costs for those periods. Increases or decreases in market prices are offset by gains or losses on commodities futures contracts or other commodity derivative instruments. Taking delivery of and making payments for the specific commodities for use in the manufacture of finished goods satisfies our obligations under the forward purchase contracts. For each of the three years in the period ended
December 31, 2012
, we satisfied these obligations by taking delivery of and making payment for the specific commodities.
As of
December 31, 2012
, we had entered into purchase agreements with various suppliers. Subject to meeting our quality standards, the purchase obligations covered by these agreements were as follows as of
December 31, 2012
:
|
Obligations
|
2013
|
2014
|
2015
|
2016
|
||||||||
|
In millions of dollars
|
||||||||||||
|
Purchase obligations
|
$
|
1,216.2
|
|
$
|
497.6
|
|
$
|
298.7
|
|
$
|
155.5
|
|
We have commitments under various lease obligations. Future minimum payments under lease obligations with a remaining term in excess of one year were as follows as of
December 31, 2012
:
|
Lease Obligations
|
2013
|
2014
|
2015
|
2016
|
2017
|
Thereafter
|
||||||||||||
|
In millions of dollars
|
||||||||||||||||||
|
Future minimum rental payments
|
$
|
13.7
|
|
$
|
11.8
|
|
$
|
10.9
|
|
$
|
9.9
|
|
$
|
8.0
|
|
$
|
5.5
|
|
Future minimum rental payments reflect commitments under non-cancelable operating leases primarily for offices, retail stores, warehouse and distribution facilities, and certain equipment.
We have a number of facilities that contain varying amounts of asbestos in certain locations within the facilities. Our asbestos management program is compliant with current applicable regulations. Current regulations require that we handle or dispose of asbestos in a special manner if such facilities undergo major renovations or are demolished. Costs associated with the removal of asbestos related to the closure of a manufacturing facility under the Next Century program were recorded in 2012 and included in business realignment and impairment charges. The costs associated with the removal of asbestos from the facility were not material. With regard to other facilities, we believe we do not have sufficient information to estimate the fair value of any asset retirement obligations related to these facilities. We cannot specify the settlement date or range of potential settlement dates and, therefore, sufficient information is not available to apply an expected present value technique. We expect to maintain the facilities with repairs and maintenance activities that would not involve or require the removal of asbestos.
64
THE HERSHEY COMPANY
NOTES TO CONSOLIDATED FINANCIAL STATEMENTS—(Continued)
As of
December 31, 2012
, certain real estate associated with the closure of facilities under the global supply chain transformation program was being held for sale. Obligations related to the environmental remediation of this real estate have been reflected in our current estimates.
In 2007, the Competition Bureau of Canada began an inquiry into alleged violations of the Canadian
Competition Act
in the sale and supply of chocolate products sold in Canada between 2002 and 2008 by members of the confectionery industry, including Hershey Canada, Inc. The U.S. Department of Justice also notified the Company in 2007 that it had opened an inquiry, but has not requested any information or documents.
Subsequently,
13
civil lawsuits were filed in Canada and
91
civil lawsuits were filed in the United States against the Company. The lawsuits were instituted on behalf of direct purchasers of our products as well as indirect purchasers that purchase our products for use or for resale. Several other chocolate and confectionery companies were named as defendants in these lawsuits as they also were the subject of investigations and/or inquiries by the government entities referenced above. The cases seek recovery for losses suffered as a result of alleged conspiracies in restraint of trade in connection with the pricing practices of the defendants. The Canadian civil cases were settled in 2012. The Canadian Competition Bureau investigation remains pending. However, Hershey Canada, Inc. has reached a tentative settlement agreement with the Canadian government with regard to its investigation and the Company has accrued a liability related thereto. We do not believe the terms of the tentative settlement agreement should have a material impact on the Company's results of operations, financial position or liquidity.
With regard to the U.S. lawsuits, the Judicial Panel on Multidistrict Litigation assigned the cases to the U.S. District Court for the Middle District of Pennsylvania. Plaintiffs are seeking actual and treble damages against the Company and other defendants based on an alleged overcharge for certain, or in some cases all chocolate products sold in the U.S. between 2003 and 2008. The lawsuits have been proceeding on different scheduling tracks for different groups of plaintiffs.
Defendants have briefed summary judgment against the plaintiffs that have not sought class certification (the “Opt-Out Plaintiffs”). The plaintiffs that purchased products from defendants directly (the “Direct Purchaser Plaintiffs”) were granted class certification in December 2012. Defendants will conduct expert discovery on liability and damages and brief summary judgment against the Direct Purchaser Plaintiffs through the third quarter of 2013. The hearing on summary judgment for the Direct Purchaser Plaintiffs is scheduled for September 2013, combined with the summary judgment hearing for the Opt-Out Plaintiffs. Putative class plaintiffs that purchased product indirectly for resale (the “Indirect Purchasers for Resale”) have a May 1, 2013 deadline to file for class certification. Putative class plaintiffs that purchased product indirectly for use (the “Indirect End Users”) may seek class certification after summary judgment against the Direct Purchaser Plaintiffs and the Opt-Out Plaintiffs has been resolved. No trial date has been set for any group of plaintiffs. The Company will continue to vigorously defend against these lawsuits.
At this stage, we are unable to predict the range of any potential liability that is reasonably possible as a result of the proceedings outlined above. Competition and antitrust law investigations can be lengthy and violations are subject to civil and/or criminal fines and other sanctions. Class action civil antitrust lawsuits are expensive to defend and could result in significant judgments, including in some cases, payment of treble damages and/or attorneys' fees to the successful plaintiff. Additionally, negative publicity involving these proceedings could affect our Company's brands and reputation, possibly resulting in decreased demand for our products. These possible consequences, in our opinion, should not materially impact our financial position or liquidity, but could materially impact our results of operations and cash flows in the period in which they are accrued or paid, respectively. Please refer to Item 1A. Risk Factors, beginning on page 9, for additional information concerning the key risks to achieving the Company's future performance goals.
We have no other material pending legal proceedings, other than ordinary routine litigation incidental to our business.
65
THE HERSHEY COMPANY
NOTES TO CONSOLIDATED FINANCIAL STATEMENTS—(Continued)
6. DERIVATIVE INSTRUMENTS AND HEDGING ACTIVITIES
We classify derivatives as assets or liabilities on the balance sheet. Accounting for the change in fair value of the derivative depends on:
|
l
|
Whether the instrument qualifies for, and has been designated as, a hedging relationship; and
|
|
l
|
The type of hedging relationship.
|
|
There are three types of hedging relationships:
|
|
|
l
|
Cash flow hedge;
|
|
l
|
Fair value hedge; and
|
|
l
|
Hedge of foreign currency exposure of a net investment in a foreign operation.
|
As of
December 31, 2012
and
2011
, all of our derivative instruments were classified as cash flow hedges.
The amount of net losses on cash flow hedging derivatives, including interest rate swap agreements, foreign exchange forward contracts and options, commodities futures and options contracts, and other commodity derivative instruments expected to be reclassified into earnings in the next 12 months was approximately
$12.8 million
after tax as of
December 31, 2012
. This amount was primarily associated with commodities futures contracts.
Objectives, Strategies and Accounting Policies Associated with Derivative Instruments
We use certain derivative instruments, from time to time, to manage risks. These include interest rate swaps to manage interest rate risk; foreign currency forward exchange contracts and options to manage foreign currency exchange rate risk; and commodities futures and options contracts to manage commodity market price risk exposures.
We enter into interest rate swap agreements and foreign exchange forward contracts and options for periods consistent with related underlying exposures. These derivative instruments do not constitute positions independent of those exposures.
We enter into commodities futures and options contracts and other derivative instruments for varying periods. These commodity derivative instruments are intended to be, and are effective as hedges of market price risks associated with anticipated raw material purchases, energy requirements and transportation costs. We do not hold or issue derivative instruments for trading purposes and are not a party to any instruments with leverage or prepayment features.
In entering into these contracts, we have assumed the risk that might arise from the possible inability of counterparties to meet the terms of their contracts. We mitigate this risk by performing financial assessments prior to contract execution, conducting periodic evaluations of counterparty performance and maintaining a diverse portfolio of qualified counterparties. We do not expect any significant losses from counterparty defaults.
Interest Rate Swaps
In order to manage interest rate exposure, from time to time, we enter into interest rate swap agreements. We include gains and losses on interest rate swap agreements in other comprehensive income. We recognize the gains and losses on interest rate swap agreements as an adjustment to interest expense in the same period as the hedged interest payments affect earnings. We classify cash flows from interest rate swap agreements as net cash provided from operating activities on the Consolidated Statements of Cash Flows. Our risk related to the swap agreements is limited to the cost of replacing the agreements at prevailing market rates.
Foreign Exchange Forward Contracts and Options
We enter into foreign exchange forward contracts and options to hedge transactions primarily related to commitments and forecasted purchases of equipment, raw materials and finished goods denominated in foreign currencies. We may also hedge payment of forecasted intercompany transactions with our subsidiaries outside of the United States. These contracts reduce currency risk from exchange rate movements. We generally hedge foreign currency price risks for periods from
3
to
24 months
. In entering into these contracts, we have assumed the risk that might arise from the possible inability of counterparties to meet the terms of their contracts. As of
December 31, 2012
, we did not have any material exposure associated with foreign exchange forward contracts and options entered into with European financial institutions. We do not expect any significant losses from counterparty defaults.
66
THE HERSHEY COMPANY
NOTES TO CONSOLIDATED FINANCIAL STATEMENTS—(Continued)
Foreign exchange forward contracts and options are effective as hedges of identifiable foreign currency commitments or forecasted transactions. Since there is a direct relationship between the foreign currency derivatives and the foreign currency denomination of the transactions, the derivatives are highly effective in hedging cash flows related to transactions denominated in the corresponding foreign currencies. We designate our foreign exchange forward contracts and options as cash flow hedging derivatives.
These contracts meet the criteria for cash flow hedge accounting treatment. We classify the fair value of foreign exchange forward contracts as prepaid expenses and other current assets, other non-current assets, accrued liabilities or other long-term liabilities on the Consolidated Balance Sheets. We report the offset to the foreign exchange forward contracts and options contracts in accumulated other comprehensive loss, net of income taxes. We record gains and losses on these contracts as a component of other comprehensive income and reclassify them into earnings in the same period during which the hedged transactions affect earnings. For hedges associated with the purchase of equipment, we designate the related cash flows as net cash flows (used by) provided from investing activities on the Consolidated Statements of Cash Flows. We classify cash flows from other foreign exchange forward contracts and options as net cash provided from operating activities.
As of
December 31, 2012
, the fair value of foreign exchange forward contracts and options with gains totaled
$2.1 million
and the fair value of foreign exchange forward contracts and options with losses totaled
$0.9 million
. Over the last three years the volume of activity for foreign exchange forward contracts to purchase foreign currencies ranged from a contract amount of
$17.1 million
to
$93.2 million
. Over the same period, the volume of activity for foreign exchange forward contracts to sell foreign currencies ranged from a contract amount of
$31.8 million
to
$192.8 million
.
Commodities Futures and Options Contracts
We enter into commodities futures and options contracts and other commodity derivative instruments to reduce the effect of future price fluctuations associated with the purchase of raw materials, energy requirements and transportation services. We generally hedge commodity price risks for
3
to
24
month periods. Commodities futures and options contracts and other commodity derivative instruments are highly effective in hedging price risks for our raw material requirements, energy requirements and transportation costs. Because our commodities futures and options contracts and other commodity derivative instruments meet hedge accounting requirements, we account for them as cash flow hedges. Accordingly, we include gains and losses on hedging instruments in other comprehensive income. We recognize gains and losses ratably in cost of sales in the same period that we record the hedged raw material requirements in cost of sales.
We use exchange traded futures contracts to hedge price fluctuations of unpriced physical forward purchase contracts, as well as forecasted purchases for which we have not entered into unpriced physical forward purchase contracts. Fixed-price physical forward purchase contracts are accounted for as “normal purchases and sales” contracts and, therefore, are not accounted for as derivative instruments. On a daily basis, we receive or make cash transfers reflecting changes in the value of exchange-traded futures contracts (unrealized gains and losses). As mentioned above, such gains and losses are included as a component of other comprehensive income. The cash transfers offset higher or lower cash requirements for payment of future invoice prices for raw materials, energy requirements and transportation costs.
Over the last three years our total annual volume of futures and options traded in conjunction with commodities hedging strategies ranged from approximately
50,000
to
60,000
contracts. We use futures and options contracts and other non-exchange traded commodity derivative instruments in combination with forward purchasing of cocoa products, sugar, corn sweeteners, natural gas and certain dairy products, primarily to reduce the risk of future price increases and provide visibility to future costs. Our commodity procurement practices are intended to reduce the risk of future price increases and provide visibility to future costs, but also may potentially limit our ability to benefit from possible price decreases.
Hedge Effectiveness—Commodities
We perform an assessment of hedge effectiveness for commodities futures and options contracts and other commodity derivative instruments on a quarterly basis. Because of the rollover strategy used for commodities futures contracts, as required by futures market conditions, some ineffectiveness may result in hedging forecasted manufacturing requirements. This occurs as we switch futures contracts from nearby contract positions to contract positions that are required to fix the price of anticipated manufacturing requirements. Hedge ineffectiveness may also result from variability in basis differentials associated with the purchase of raw materials for manufacturing requirements. We record the ineffective portion of gains or losses on commodities futures and options contracts currently in cost of sales.
The prices of commodities futures contracts reflect delivery to the same locations where we take delivery of the
67
THE HERSHEY COMPANY
NOTES TO CONSOLIDATED FINANCIAL STATEMENTS—(Continued)
physical commodities. Therefore, there is no ineffectiveness resulting from differences in location between the derivative and the hedged item.
Financial Statement Location and Amounts Pertaining to Derivative Instruments
The fair value of derivative instruments in the Consolidated Balance Sheet as of
December 31, 2012
was as follows:
|
Balance Sheet Caption
|
Interest Rate Swap
Agreements |
Foreign
Exchange
Forward Contracts and Options |
Commodities Futures and Options Contracts
|
|||||||||
|
In thousands of dollars
|
||||||||||||
|
Prepaid expense and other current assets
|
$
|
—
|
|
$
|
2,119
|
|
$
|
—
|
|
|||
|
Other assets
|
$
|
—
|
|
$
|
—
|
|
$
|
—
|
|
|||
|
Accrued liabilities
|
$
|
12,502
|
|
$
|
917
|
|
$
|
2,010
|
|
|||
|
Other long-term liabilities
|
$
|
922
|
|
$
|
—
|
|
$
|
—
|
|
|||
The fair value of derivative instruments in the Consolidated Balance Sheet as of
December 31, 2011
was as follows:
|
Balance Sheet Caption
|
Foreign
Exchange
Forward Contracts and Options |
Commodities Futures and Options Contracts
|
||||||
|
In thousands of dollars
|
||||||||
|
Prepaid expense and other current assets
|
$
|
3,954
|
|
$
|
3,929
|
|
||
|
Other assets
|
$
|
—
|
|
$
|
—
|
|
||
|
Accrued liabilities
|
$
|
5,297
|
|
$
|
2,103
|
|
||
|
Other long-term liabilities
|
$
|
12
|
|
$
|
—
|
|
||
The fair value of the interest rate swap agreements represents the difference in the present values of cash flows calculated at the contracted interest rates and at current market interest rates at the end of the period. We calculate the fair value of interest rate swap agreements quarterly based on the quoted market prices for similar financial instruments.
The fair value of foreign exchange forward contracts and options is the amount of the difference between the contracted and current market foreign currency exchange rates at the end of the period. We estimate the fair value of foreign exchange forward contracts and options on a quarterly basis by obtaining market quotes of spot and forward rates for contracts with similar terms, adjusted where necessary for maturity differences.
As of
December 31, 2012
, accrued liabilities associated with commodities futures and options contracts were primarily related to net cash transfers payable on commodities futures contracts reflecting the change in quoted market prices on the last trading day for the period. As of
December 31, 2011
, prepaid expense and other current assets associated with commodities futures and options contracts were primarily related to net cash transfers receivable on commodities futures contracts reflecting the change in quoted market prices on the last trading day for the period. Accrued liabilities associated with commodities futures and options contracts were related to the fair value of non-exchange traded commodity derivative instruments. We make or receive cash transfers to or from commodity futures brokers on a daily basis reflecting changes in the value of futures contracts on the IntercontinentalExchange or various other exchanges. These changes in value represent unrealized gains and losses.
68
THE HERSHEY COMPANY
NOTES TO CONSOLIDATED FINANCIAL STATEMENTS—(Continued)
The effect of derivative instruments on the Consolidated Statements of Income for the year ended
December 31, 2012
was as follows:
|
Cash Flow Hedging Derivatives
|
Interest Rate
Swap Agreements |
Foreign Exchange
Forward Contracts and Options |
Commodities
Futures and Options Contracts |
|||||||||
|
In thousands of dollars
|
||||||||||||
|
Gains (losses) recognized in other comprehensive income (“OCI”) (effective portion)
|
$
|
(13,424
|
)
|
$
|
47
|
|
$
|
12,834
|
|
|||
|
Gains (losses) reclassified from accumulated OCI into income (effective portion) (a)
|
$
|
(3,605
|
)
|
$
|
(2,488
|
)
|
$
|
(90,900
|
)
|
|||
|
Gains recognized in income (ineffective portion) (b)
|
$
|
—
|
|
$
|
—
|
|
$
|
670
|
|
|||
The effect of derivative instruments on the Consolidated Statements of Income for the year ended
December 31, 2011
was as follows:
|
Cash Flow Hedging Derivatives
|
Interest Rate
Swap Agreements |
Foreign Exchange
Forward Contracts and Options |
Commodities
Futures and Options Contracts |
|||||||||
|
In thousands of dollars
|
||||||||||||
|
Gains (losses) recognized in other comprehensive income (“OCI”) (effective portion)
|
$
|
(19,221
|
)
|
$
|
(1,655
|
)
|
$
|
(154,135
|
)
|
|||
|
Gains (losses) reclassified from accumulated OCI into income (effective portion) (a)
|
$
|
1,263
|
|
$
|
1,619
|
|
$
|
17,400
|
|
|||
|
Losses recognized in income (ineffective portion) (b)
|
$
|
(996
|
)
|
$
|
—
|
|
$
|
(982
|
)
|
|||
|
(a)
|
Gains (losses) reclassified from accumulated OCI into income were included in cost of sales for commodities futures and options contracts and other commodity derivative instruments and for foreign exchange forward contracts and options designated as hedges of purchases of inventory. Other gains and losses for foreign exchange forward contracts and options were included in selling, marketing and administrative expenses. Other gains and losses for interest rate swap agreements were included in interest expense.
|
|
(b)
|
Gains (losses) recognized in income were included in cost of sales for commodities futures and options contracts and interest expense for interest rate swap agreements.
|
All gains (losses) recognized currently in income were related to the ineffective portion of the hedging relationship. We recognized no components of gains and losses on cash flow hedging derivatives in income due to excluding such components from the hedge effectiveness assessment.
7. FINANCIAL INSTRUMENTS
The carrying amounts of financial instruments including cash and cash equivalents, accounts receivable, accounts payable and short-term debt approximated fair value as of
December 31, 2012
and
December 31, 2011
, because of the relatively short maturity of these instruments.
The carrying value of long-term debt, including the current portion, was
$1,788.7 million
as of
December 31, 2012
, compared with a fair value of
$2,060.8 million
based on quoted market prices for the same or similar debt issues. The carrying value of long-term debt, including the current portion, was
$1,846.1 million
as of
December 31, 2011
compared with a fair value of
$2,121.0 million
.
Interest Rate Swaps
In order to manage interest rate exposure, the Company, from time to time, enters into interest rate swap agreements. In
April 2012
, the Company entered into forward starting interest rate swap agreements to hedge interest rate exposure related to the anticipated
$250 million
of term financing expected to be executed during 2013 to repay
$250 million
of
5.0%
Notes maturing in
April 2013
. The weighted-average fixed rate on these forward starting swap agreements was
2.4%
. In
May
69
THE HERSHEY COMPANY
NOTES TO CONSOLIDATED FINANCIAL STATEMENTS—(Continued)
2012
, the Company entered into forward starting interest rate swap agreements to hedge interest rate exposure related to the anticipated
$250 million
of term financing expected to be executed during 2015 to repay
$250 million
of
4.85%
Notes maturing in
August 2015
. The weighted-average fixed rate on these forward starting swap agreements was
2.7%
.
The fair value of interest rate swap agreements was a liability of
$13.4 million
as of
December 31, 2012
. The Company's risk related to interest rate swap agreements is limited to the cost of replacing such agreements at prevailing market rates.
In
March 2009
, we entered into forward starting interest rate swap agreements to hedge interest rate exposure related to the anticipated
$250 million
of term financing expected to be executed during
2011
. In
September 2011
, the forward starting interest rate swap agreements which were entered into in
March 2009
matured, resulting in cash payments by the Company of approximately
$26.8 million
. Also in
September 2011
, we entered into forward starting swap agreements to continue to hedge interest rate exposure related to the term financing. These swap agreements were terminated upon the issuance of the
1.5%
Notes due
November 1, 2016
, resulting in cash payments by the Company of
$2.3 million
in November 2011. The losses on the swap agreements are being amortized as an increase to interest expense over the term of the Notes.
In December 2010, we terminated forward starting swap agreements which were entered into in August 2010 to hedge the anticipated execution of term financing. The swap agreements were terminated upon the issuance of the
4.125%
Notes due
December 1, 2020
, resulting in cash receipts of
$13.5 million
in December 2010. The gain on the swap agreements is being amortized as a reduction to interest expense over the term of the Notes.
For more information see
Note 6, Derivative Instruments and Hedging Activities
.
Foreign Exchange Forward Contracts
For information on the objectives, strategies and accounting polices related to our use of foreign exchange forward contracts, see
Note 6, Derivative Instruments and Hedging Activities
.
The following table summarizes our foreign exchange activity:
|
December 31,
|
2012
|
2011
|
||||||||||
|
Contract
Amount
|
Primary
Currencies
|
Contract
Amount
|
Primary
Currencies
|
|||||||||
|
In millions of dollars
|
||||||||||||
|
Foreign exchange forward contracts to purchase foreign currencies
|
$
|
17.1
|
|
Euros
British pound sterling
|
$
|
50.4
|
|
Euros
British pound sterling
|
||||
|
Foreign exchange forward contracts to sell foreign currencies
|
$
|
57.8
|
|
Canadian dollars
|
$
|
99.6
|
|
Canadian dollars
|
||||
The fair value of foreign exchange forward contracts is included in prepaid expenses and other current assets, other non-current assets, accrued liabilities or other long-term liabilities, as appropriate.
The combined fair value of our foreign exchange forward contracts included in prepaid expenses and other current assets, other non-current assets, accrued liabilities or other long-term liabilities on the Consolidated Balance Sheets was as follows:
|
December 31,
|
2012
|
2011
|
||||||
|
In millions of dollars
|
||||||||
|
Fair value of foreign exchange forward contracts, net — asset (liability)
|
$
|
1.2
|
|
$
|
(1.4
|
)
|
||
70
THE HERSHEY COMPANY
NOTES TO CONSOLIDATED FINANCIAL STATEMENTS—(Continued)
8. FAIR VALUE ACCOUNTING
We follow a fair value measurement hierarchy to price certain assets or liabilities. The fair value is determined based on inputs or assumptions that market participants would use in pricing the asset or liability. These assumptions consist of (1) observable inputs - market data obtained from independent sources, or (2) unobservable inputs - market data determined using the Company’s own assumptions about valuation.
We prioritize the inputs to valuation techniques, with the highest priority being given to Level 1 inputs and the lowest priority to Level 3 inputs, as defined below:
|
l
|
Level 1 Inputs – quoted prices in active markets for identical assets or liabilities;
|
|
l
|
Level 2 Inputs – quoted prices for similar assets or liabilities in active markets; quoted prices for identical or similar instruments in markets that are not active; inputs other than quoted prices that are observable; and inputs that are derived from or corroborated by observable market data by correlation; and
|
|
l
|
Level 3 Inputs – unobservable inputs used to the extent that observable inputs are not available. These reflect the entity’s own assumptions about the assumptions that market participants would use in pricing the asset or liability.
|
We use certain derivative instruments, from time to time, to manage interest rate, foreign currency exchange rate and commodity market price risk exposures, all of which are recorded at fair value based on quoted market prices or rates.
A summary of our cash flow hedging derivative assets and liabilities measured at fair value on a recurring basis as of
December 31, 2012
, is as follows:
|
Description
|
Fair Value as of December 31, 2012
|
Quoted Prices in
Active Markets
of Identical
Assets (Level 1)
|
Significant
Other
Observable
Inputs (Level 2)
|
Significant Unobservable Inputs
(Level 3)
|
||||||||||||
|
In thousands of dollars
|
||||||||||||||||
|
Assets
|
||||||||||||||||
|
Cash flow hedging derivatives
|
$
|
39,175
|
|
$
|
37,056
|
|
$
|
2,119
|
|
$
|
—
|
|
||||
|
Liabilities
|
||||||||||||||||
|
Cash flow hedging derivatives
|
$
|
53,407
|
|
$
|
39,066
|
|
$
|
14,341
|
|
$
|
—
|
|
||||
As of
December 31, 2012
, cash flow hedging derivative Level 1 assets were primarily related to cash transfers receivable on commodities futures contracts with gains resulting from the change in quoted market prices on the last trading day for the period. As of December 31, 2012, cash flow hedging derivative Level 1 liabilities were primarily related to cash transfers payable on commodities futures contracts with losses resulting from the change in quoted market prices on the last trading day for the period. We make or receive cash transfers to or from commodity futures brokers on a daily basis reflecting changes in the value of futures contracts on the IntercontinentalExchange or various other exchanges. These changes in value represent unrealized gains and losses.
As of
December 31, 2012
, cash flow hedging derivative Level 2 assets were related to the fair value of foreign exchange forward contracts and options with gains. Cash flow hedging Level 2 liabilities were related to the fair value of interest swap agreements and foreign exchange forward contracts and options with losses. The fair value of the interest rate swap agreements represents the difference in the present values of cash flows calculated at the contracted interest rates and at current market interest rates at the end of the period. We calculate the fair value of interest rate swap agreements quarterly based on the quoted market prices for similar financial instruments. The fair value of foreign exchange forward contracts and options is the amount of the difference between the contracted and current market foreign currency exchange rates at the end of the period. We estimate the fair value of foreign exchange forward contracts and options on a quarterly basis by obtaining market quotes of spot and forward rates for contracts with similar terms, adjusted where necessary for maturity differences.
71
THE HERSHEY COMPANY
NOTES TO CONSOLIDATED FINANCIAL STATEMENTS—(Continued)
A summary of our cash flow hedging derivative assets and liabilities measured at fair value on a recurring basis as of
December 31, 2011
, is as follows:
|
Description
|
Fair Value as of December 31, 2011
|
Quoted Prices in
Active Markets
of Identical
Assets (Level 1)
|
Significant
Other
Observable
Inputs (Level 2)
|
Significant Unobservable Inputs
(Level 3)
|
||||||||||||
|
In thousands of dollars
|
||||||||||||||||
|
Assets
|
||||||||||||||||
|
Cash flow hedging derivatives
|
$
|
7,883
|
|
$
|
3,929
|
|
$
|
3,954
|
|
$
|
—
|
|
||||
|
Liabilities
|
||||||||||||||||
|
Cash flow hedging derivatives
|
$
|
7,412
|
|
$
|
2,103
|
|
$
|
5,309
|
|
$
|
—
|
|
||||
As of
December 31, 2011
, cash flow hedging derivative Level 1 assets were primarily related to net cash transfers receivable on commodities futures contracts reflecting the change in quoted market prices on the last trading day for the period. As of
December 31, 2011
, cash flow hedging derivative Level 1 liabilities were related to the fair value of commodity derivative instruments.
As of
December 31, 2011
, cash flow hedging derivative Level 2 assets were related to the fair value of foreign exchange forward contracts and options with gains. Cash flow hedging Level 2 liabilities were related to foreign exchange forward contracts and options with losses.
9. COMPREHENSIVE INCOME
A summary of the components of comprehensive income is as follows:
|
For the year ended December 31, 2012
|
Pre-Tax
Amount |
Tax
(Expense) Benefit |
After-Tax
Amount |
|||||||||
|
In thousands of dollars
|
||||||||||||
|
Net income
|
$
|
660,931
|
|
|||||||||
|
Other comprehensive income (loss):
|
||||||||||||
|
Foreign currency translation adjustments
|
$
|
7,714
|
|
$
|
—
|
|
7,714
|
|
||||
|
Pension and post-retirement benefit plans
|
(15,159
|
)
|
5,525
|
|
(9,634
|
)
|
||||||
|
Cash flow hedges:
|
||||||||||||
|
Losses on cash flow hedging derivatives
|
(543
|
)
|
(325
|
)
|
(868
|
)
|
||||||
|
Reclassification adjustments
|
96,993
|
|
(36,950
|
)
|
60,043
|
|
||||||
|
Total other comprehensive income
|
$
|
89,005
|
|
$
|
(31,750
|
)
|
57,255
|
|
||||
|
Comprehensive income
|
$
|
718,186
|
|
|||||||||
72
THE HERSHEY COMPANY
NOTES TO CONSOLIDATED FINANCIAL STATEMENTS—(Continued)
|
For the year ended December 31, 2011
|
Pre-Tax
Amount |
Tax
(Expense) Benefit |
After-Tax
Amount |
|||||||||
|
In thousands of dollars
|
||||||||||||
|
Net income
|
$
|
628,962
|
|
|||||||||
|
Other comprehensive income (loss):
|
||||||||||||
|
Foreign currency translation adjustments
|
$
|
(21,213
|
)
|
$
|
—
|
|
(21,213
|
)
|
||||
|
Pension and post-retirement benefit plans
|
(137,918
|
)
|
52,095
|
|
(85,823
|
)
|
||||||
|
Cash flow hedges:
|
||||||||||||
|
Losses on cash flow hedging derivatives
|
(175,011
|
)
|
67,298
|
|
(107,713
|
)
|
||||||
|
Reclassification adjustments
|
(20,282
|
)
|
7,767
|
|
(12,515
|
)
|
||||||
|
Total other comprehensive loss
|
$
|
(354,424
|
)
|
$
|
127,160
|
|
(227,264
|
)
|
||||
|
Comprehensive income
|
$
|
401,698
|
|
|||||||||
|
For the year ended December 31, 2010
|
Pre-Tax
Amount |
Tax
(Expense) Benefit |
After-Tax
Amount |
|||||||||
|
In thousands of dollars
|
||||||||||||
|
Net income
|
$
|
509,799
|
|
|||||||||
|
Other comprehensive income (loss):
|
||||||||||||
|
Foreign currency translation adjustments
|
$
|
14,123
|
|
$
|
—
|
|
14,123
|
|
||||
|
Pension and post-retirement benefit plans
|
10,529
|
|
(5,399
|
)
|
5,130
|
|
||||||
|
Cash flow hedges:
|
||||||||||||
|
Gains on cash flow hedging derivatives
|
3,260
|
|
(2,259
|
)
|
1,001
|
|
||||||
|
Reclassification adjustments
|
(52,634
|
)
|
20,157
|
|
(32,477
|
)
|
||||||
|
Total other comprehensive loss
|
$
|
(24,722
|
)
|
$
|
12,499
|
|
(12,223
|
)
|
||||
|
Comprehensive income
|
$
|
497,576
|
|
|||||||||
The components of accumulated other comprehensive loss, as shown on the Consolidated Balance Sheets, are as follows:
|
December 31,
|
2012
|
2011
|
||||||
|
In thousands of dollars
|
||||||||
|
Foreign currency translation adjustments
|
$
|
9,173
|
|
$
|
1,459
|
|
||
|
Pension and post-retirement benefit plans, net of tax
|
(366,037
|
)
|
(356,403
|
)
|
||||
|
Cash flow hedges, net of tax
|
(28,212
|
)
|
(87,387
|
)
|
||||
|
Total accumulated other comprehensive loss
|
$
|
(385,076
|
)
|
$
|
(442,331
|
)
|
||
73
THE HERSHEY COMPANY
NOTES TO CONSOLIDATED FINANCIAL STATEMENTS—(Continued)
10. INTEREST EXPENSE
Net interest expense consisted of the following:
|
For the years ended December 31,
|
2012
|
2011
|
2010
|
|||||||||
|
In thousands of dollars
|
||||||||||||
|
Long-term debt and lease obligations
|
$
|
81,203
|
|
$
|
85,543
|
|
$
|
91,144
|
|
|||
|
Short-term debt
|
23,084
|
|
17,051
|
|
8,676
|
|
||||||
|
Capitalized interest
|
(5,778
|
)
|
(7,814
|
)
|
(2,116
|
)
|
||||||
|
Interest expense, gross
|
98,509
|
|
94,780
|
|
97,704
|
|
||||||
|
Interest income
|
(2,940
|
)
|
(2,597
|
)
|
(1,270
|
)
|
||||||
|
Interest expense, net
|
$
|
95,569
|
|
$
|
92,183
|
|
$
|
96,434
|
|
|||
In
December 2010
, we paid
$63.4 million
to repurchase
$57.5 million
of our
6.95%
Notes due in
2012
as part of a cash tender offer. As a result of the repurchase, we recorded interest expense on long-term debt of
$5.9 million
, which represented the premium paid for the tender offer.
11. SHORT-TERM DEBT
As a source of short-term financing, we utilize cash on hand and commercial paper or bank loans with an original maturity of
3
months or less. In
October 2011
, we entered into a new
five-year
agreement establishing an unsecured revolving credit facility to borrow up to
$1.1 billion
, with an option to increase borrowings by an additional
$400 million
with the consent of the lenders.
The unsecured committed revolving credit agreement contains a financial covenant whereby the ratio of (a) pre-tax income from operations from the most recent four fiscal quarters to (b) consolidated interest expense for the most recent four fiscal quarters may not be less than
2.0
to
1.0
at the end of each fiscal quarter. The credit agreement contains customary representations and warranties and events of default. Payment of outstanding advances may be accelerated, at the option of the lenders, should we default in our obligation under the credit agreement. As of
December 31, 2012
, we complied with all customary affirmative and negative covenants and the financial covenant pertaining to our credit agreement. There were no significant compensating balance agreements that legally restricted these funds.
In addition to the revolving credit facility, we maintain lines of credit with domestic and international commercial banks. Our credit limit in various currencies was
$176.7 million
in
2012
and
$76.9 million
in
2011
. These lines permit us to borrow at the banks’ prime commercial interest rates, or lower. We had short-term foreign bank loans against these lines of credit for
$118.2 million
in
2012
and
$42.1 million
in
2011
.
The maximum amount of our short-term borrowings during 2012 was
$168.6 million
. The weighted-average interest rate on short-term borrowings outstanding was
3.5%
as of
December 31, 2012
and
9.2%
as of
December 31, 2011
. The lower rate as of
December 31, 2012
, primarily reflected the rate associated with borrowings of our Canadian business compared with the higher rate as of
December 31, 2011
, which was primarily associated with short-term borrowings of our international businesses, particularly in India.
We pay commitment fees to maintain our lines of credit. The average fee during
2012
was
less than 0.1%
per annum of the commitment.
We maintain a consolidated cash management system that includes overdraft positions in certain accounts at several banks. We have the contractual right of offset for the accounts with overdrafts. These offsets reduced cash and cash equivalents by
$2.8 million
as of
December 31, 2012
and
$0.6 million
as of
December 31, 2011
.
74
THE HERSHEY COMPANY
NOTES TO CONSOLIDATED FINANCIAL STATEMENTS—(Continued)
12. LONG-TERM DEBT
Long-term debt consisted of the following:
|
December 31,
|
2012
|
2011
|
||||||
|
In thousands of dollars
|
||||||||
|
6.95% Notes due 2012
|
$
|
—
|
|
$
|
92,533
|
|
||
|
5.00% Notes due 2013
|
250,000
|
|
250,000
|
|
||||
|
4.85% Notes due 2015
|
250,000
|
|
250,000
|
|
||||
|
5.45% Notes due 2016
|
250,000
|
|
250,000
|
|
||||
|
1.50% Notes due 2016
|
250,000
|
|
250,000
|
|
||||
|
4.125% Notes due 2020
|
350,000
|
|
350,000
|
|
||||
|
8.8% Debentures due 2021
|
100,000
|
|
100,000
|
|
||||
|
7.2% Debentures due 2027
|
250,000
|
|
250,000
|
|
||||
|
Other obligations, net of unamortized debt discount
|
88,701
|
|
53,560
|
|
||||
|
Total long-term debt
|
1,788,701
|
|
1,846,093
|
|
||||
|
Less—current portion
|
257,734
|
|
97,593
|
|
||||
|
Long-term portion
|
$
|
1,530,967
|
|
$
|
1,748,500
|
|
||
In
December 2010
, we paid
$63.4 million
to repurchase
$57.5 million
of our
6.95%
Notes due in
2012
as part of a cash tender offer. As a result of the repurchase, we recorded interest expense of
$5.9 million
, which represented the premium paid for the tender offer. We used a portion of the proceeds from the
$350 million
of
4.125%
Notes issued in
December 2010
to fund the repurchase.
In
September 2011
, we repaid
$250.0 million
of
5.3%
Notes due in 2011. In
November 2011
, we issued
$250.0 million
of
1.5%
Notes due in 2016. The Notes were issued under a shelf registration statement on Form S-3 filed in May 2009 that registered an indeterminate amount of debt securities. The May 2009 WKSI Registration Statement expired in May 2012. Accordingly, we filed a new registration statement on Form S-3 to replace the May 2009 WKSI Registration Statement. The May 2012 WKSI Registration Statement registered an indeterminate amount of debt securities and was effective immediately.
The increase in other obligations was primarily associated with a financing obligation of
$36.0 million
under the agreement with Ferrero for the construction of a warehouse and distribution facility. The initial term of the agreement is 10 years, with three renewal periods, each with a term of 10 years.
Aggregate annual maturities during the next five years are as follows:
|
l
|
2013
|
—
|
$257.7 million
|
|
l
|
2014
|
—
|
$0.9 million
|
|
l
|
2015
|
—
|
$250.9 million
|
|
l
|
2016
|
—
|
$500.7 million
|
|
l
|
2017
|
—
|
$0.4 million
|
Our debt is principally unsecured and of equal priority. None of our debt is convertible into our Common Stock.
75
THE HERSHEY COMPANY
NOTES TO CONSOLIDATED FINANCIAL STATEMENTS—(Continued)
13. INCOME TAXES
Our income (loss) before income taxes was as follows:
|
For the years ended December 31,
|
2012
|
2011
|
2010
|
|||||||||
|
In thousands of dollars
|
||||||||||||
|
Domestic
|
$
|
980,176
|
|
$
|
904,418
|
|
$
|
839,012
|
|
|||
|
Foreign
|
35,403
|
|
58,427
|
|
(30,148
|
)
|
||||||
|
Income before income taxes
|
$
|
1,015,579
|
|
$
|
962,845
|
|
$
|
808,864
|
|
|||
The foreign income before income taxes in 2011 included the
$17.0 million
gain on the sale of non-core trademark licensing rights. The foreign losses before income taxes in 2010 were due primarily to the business realignment and impairment charges recorded during that year.
Our provision for income taxes was as follows:
|
For the years ended December 31,
|
2012
|
2011
|
2010
|
|||||||||
|
In thousands of dollars
|
||||||||||||
|
Current:
|
||||||||||||
|
Federal
|
$
|
299,122
|
|
$
|
254,732
|
|
$
|
283,449
|
|
|||
|
State
|
36,187
|
|
32,174
|
|
28,423
|
|
||||||
|
Foreign
|
5,554
|
|
13,366
|
|
5,847
|
|
||||||
|
Current provision for income taxes
|
340,863
|
|
300,272
|
|
317,719
|
|
||||||
|
Deferred:
|
||||||||||||
|
Federal
|
5,174
|
|
37,160
|
|
(19,590
|
)
|
||||||
|
State
|
1,897
|
|
(1,005
|
)
|
(2,056
|
)
|
||||||
|
Foreign
|
6,714
|
|
(2,544
|
)
|
2,992
|
|
||||||
|
Deferred income tax provision (benefit)
|
13,785
|
|
33,611
|
|
(18,654
|
)
|
||||||
|
Total provision for income taxes
|
$
|
354,648
|
|
$
|
333,883
|
|
$
|
299,065
|
|
|||
The income tax benefit associated with stock-based compensation reduced accrued income taxes on the Consolidated Balance Sheets by
$30.2 million
as of
December 31, 2012
and by
$14.0 million
as of
December 31, 2011
. We credited additional paid-in capital to reflect these excess income tax benefits. The deferred income tax provision in
2012
and
2011
primarily reflected the tax effect of bonus depreciation, although to a lesser extent in 2012, partially reduced by the tax effect of charges for the Next Century program.
76
THE HERSHEY COMPANY
NOTES TO CONSOLIDATED FINANCIAL STATEMENTS—(Continued)
Deferred taxes reflect temporary differences between the tax basis and financial statement carrying value of assets and liabilities. The tax effects of the significant temporary differences that comprised the deferred tax assets and liabilities were as follows:
|
December 31,
|
2012
|
2011
|
||||||
|
In thousands of dollars
|
||||||||
|
Deferred tax assets:
|
||||||||
|
Post-retirement benefit obligations
|
$
|
119,140
|
|
$
|
120,174
|
|
||
|
Accrued expenses and other reserves
|
112,760
|
|
112,834
|
|
||||
|
Stock-based compensation
|
51,388
|
|
62,666
|
|
||||
|
Derivative instruments
|
23,822
|
|
62,117
|
|
||||
|
Pension
|
72,374
|
|
48,884
|
|
||||
|
Lease financing obligation
|
19,035
|
|
19,159
|
|
||||
|
Accrued trade promotion reserves
|
30,594
|
|
11,209
|
|
||||
|
Net operating loss carryforwards
|
48,455
|
|
51,948
|
|
||||
|
Other
|
3,643
|
|
9,016
|
|
||||
|
Gross deferred tax assets
|
481,211
|
|
498,007
|
|
||||
|
Valuation allowance
|
(74,021
|
)
|
(64,551
|
)
|
||||
|
Total deferred tax assets
|
407,190
|
|
433,456
|
|
||||
|
Deferred tax liabilities:
|
||||||||
|
Property, plant and equipment, net
|
210,406
|
|
188,092
|
|
||||
|
Acquired intangibles
|
63,585
|
|
34,912
|
|
||||
|
Inventories
|
23,335
|
|
32,775
|
|
||||
|
Other
|
10,849
|
|
7,377
|
|
||||
|
Total deferred tax liabilities
|
308,175
|
|
263,156
|
|
||||
|
Net deferred tax assets
|
$
|
99,015
|
|
$
|
170,300
|
|
||
|
Included in:
|
||||||||
|
Current deferred tax assets, net
|
$
|
122,224
|
|
$
|
136,861
|
|
||
|
Non-current deferred tax assets, net
|
12,448
|
|
33,439
|
|
||||
|
Non-current deferred tax liabilities, net
|
(35,657
|
)
|
—
|
|
||||
|
Net deferred tax assets
|
$
|
99,015
|
|
$
|
170,300
|
|
||
We believe that it is more likely than not that the results of future operations will generate sufficient taxable income to realize the deferred tax assets. The valuation allowances as of
December 31, 2012
and
2011
were primarily related to tax loss carryforwards from operations in various foreign tax jurisdictions. Additional information on income tax benefits and expenses related to components of accumulated other comprehensive loss is provided in
Note 9, Comprehensive Income
.
77
THE HERSHEY COMPANY
NOTES TO CONSOLIDATED FINANCIAL STATEMENTS—(Continued)
The following table reconciles the Federal statutory income tax rate with our effective income tax rate:
|
For the years ended December 31,
|
2012
|
2011
|
2010
|
||||||
|
Federal statutory income tax rate
|
35.0
|
%
|
35.0
|
%
|
35.0
|
%
|
|||
|
Increase (reduction) resulting from:
|
|||||||||
|
State income taxes, net of Federal income tax benefits
|
3.2
|
|
2.4
|
|
2.8
|
|
|||
|
Qualified production income deduction
|
(2.5
|
)
|
(2.2
|
)
|
(2.4
|
)
|
|||
|
Business realignment and impairment charges and gain on sale of trademark licensing rights
|
0.2
|
|
(0.1
|
)
|
1.8
|
|
|||
|
International operations
|
(0.1
|
)
|
(0.6
|
)
|
0.4
|
|
|||
|
Other, net
|
(0.9
|
)
|
0.2
|
|
(0.6
|
)
|
|||
|
Effective income tax rate
|
34.9
|
%
|
34.7
|
%
|
37.0
|
%
|
|||
Tax rates associated with business realignment and impairment charges increased the effective income tax rate from the Federal statutory income tax rate by
0.2
percentage point for
2012
. Tax rates associated with business realignment and impairment charges and gain on sale of trademark licensing rights reduced the effective income tax rate from the Federal statutory income tax rate by
0.1
percentage point for
2011
. Tax rates associated with business realignment and impairment charges increased the effective income tax rate from the Federal statutory income tax rate by
1.8
percentage points for
2010
. The effect of international operations varied based on the taxable income (loss) of our entities outside of the United States.
A reconciliation of the beginning and ending amount of unrecognized tax benefits is as follows:
|
December 31,
|
2012
|
2011
|
||||||
|
In thousands of dollars
|
||||||||
|
Balance at beginning of year
|
$
|
53,553
|
|
$
|
58,004
|
|
||
|
Additions for tax positions taken during prior years
|
11,335
|
|
4,207
|
|
||||
|
Reductions for tax positions taken during prior years
|
(5,478
|
)
|
(210
|
)
|
||||
|
Additions for tax positions taken during the current year
|
5,750
|
|
5,157
|
|
||||
|
Settlements
|
(5,234
|
)
|
(1,551
|
)
|
||||
|
Expiration of statutes of limitations
|
(8,406
|
)
|
(12,054
|
)
|
||||
|
Balance at end of year
|
$
|
51,520
|
|
$
|
53,553
|
|
||
The total amount of unrecognized tax benefits that, if recognized, would affect the effective tax rate was
$30.8 million
as of
December 31, 2012
and
$40.4 million
as of
December 31, 2011
.
We report accrued interest and penalties related to unrecognized tax benefits in income tax expense. We recognized a tax benefit of
$5.3 million
in
2012
,
$0.3 million
in
2011
and
$3.4 million
in
2010
for interest and penalties. Accrued interest and penalties were
$8.4 million
as of
December 31, 2012
, and
$17.1 million
as of
December 31, 2011
.
We file income tax returns in the U.S. federal jurisdiction and various state and foreign jurisdictions. A number of years may elapse before an uncertain tax position, for which we have unrecognized tax benefits, is audited and finally resolved. While it is often difficult to predict the final outcome or the timing of resolution of any particular uncertain tax position, we believe that our unrecognized tax benefits reflect the most likely outcome. We adjust these unrecognized tax benefits, as well as the related interest, in light of changing facts and circumstances. Settlement of any particular position could require the use of cash. Favorable resolution would be recognized as a reduction to our effective income tax rate in the period of resolution.
78
THE HERSHEY COMPANY
NOTES TO CONSOLIDATED FINANCIAL STATEMENTS—(Continued)
The number of years with open tax audits varies depending on the tax jurisdiction. Our major taxing jurisdictions include the United States (federal and state), Canada and Mexico. During the second quarter of 2012, the U.S. Internal Revenue Service (“IRS”) completed its audit of our U.S. income tax returns for
2007
and
2008
resulting in the resolution of tax contingencies for those years. Tax examinations by various state taxing authorities could generally be conducted for years beginning in
2008
. We are no longer subject to Canadian federal income tax examinations by the Canada Revenue Agency (“CRA”) and Mexican federal income tax examinations by Servicio de Administracion Tributaria (“SAT”) for years before
2004
. During the third quarter of
2010
, the CRA commenced its audit of our Canadian income tax returns for
2006
through
2009
. U.S., Canadian and Mexican federal audit issues typically involve the timing of deductions and transfer pricing adjustments. We work with the IRS, the CRA and the SAT to resolve proposed audit adjustments and to minimize the amount of adjustments. We do not anticipate that any potential tax adjustments will have a significant impact on our financial position or results of operations.
We reasonably expect reductions in the liability for unrecognized tax benefits of approximately
$8.3 million
within the next 12 months because of the expiration of statutes of limitations and settlements of tax audits.
As of December 31, 2012, we had approximately
$122.1 million
of undistributed earnings of our international subsidiaries. We intend to continue to reinvest earnings outside the U.S. for the foreseeable future and, therefore, have not recognized any U.S. tax expense on these earnings.
14. PENSION AND OTHER POST-RETIREMENT BENEFIT PLANS
We sponsor a number of defined benefit pension plans. Our policy is to fund domestic pension liabilities in accordance with the minimum and maximum limits imposed by the Employee Retirement Income Security Act of 1974 (“ERISA”) and federal income tax laws. Beginning January 1, 2008, we complied with the funding requirements of the Pension Protection Act of 2006. We fund non-domestic pension liabilities in accordance with laws and regulations applicable to those plans.
We have two post-retirement benefit plans: health care and life insurance. The health care plan is contributory, with participants’ contributions adjusted annually. The life insurance plan is non-contributory.
79
THE HERSHEY COMPANY
NOTES TO CONSOLIDATED FINANCIAL STATEMENTS—(Continued)
Obligations and Funded Status
A summary of the changes in benefit obligations and plan assets is as follows:
|
Pension Benefits
|
Other Benefits
|
|||||||||||||||
|
December 31,
|
2012
|
2011
|
2012
|
2011
|
||||||||||||
|
In thousands of dollars
|
||||||||||||||||
|
Change in benefit obligation
|
||||||||||||||||
|
Projected benefits obligation at beginning of year
|
$
|
1,156,756
|
|
$
|
1,049,766
|
|
$
|
318,536
|
|
$
|
306,300
|
|
||||
|
Service cost
|
30,823
|
|
30,059
|
|
1,172
|
|
1,333
|
|
||||||||
|
Interest cost
|
49,909
|
|
52,960
|
|
13,258
|
|
14,967
|
|
||||||||
|
Plan amendments
|
2
|
|
181
|
|
—
|
|
7,191
|
|
||||||||
|
Actuarial loss
|
112,700
|
|
75,790
|
|
7,916
|
|
8,115
|
|
||||||||
|
Curtailment
|
—
|
|
1,351
|
|
—
|
|
2,961
|
|
||||||||
|
Settlement
|
(49,876
|
)
|
(120
|
)
|
—
|
|
—
|
|
||||||||
|
Currency translation and other
|
1,903
|
|
(2,052
|
)
|
370
|
|
479
|
|
||||||||
|
Benefits paid
|
(64,439
|
)
|
(51,179
|
)
|
(22,837
|
)
|
(22,810
|
)
|
||||||||
|
Projected benefits obligation at end of year
|
1,237,778
|
|
1,156,756
|
|
318,415
|
|
318,536
|
|
||||||||
|
Change in plan assets
|
||||||||||||||||
|
Fair value of plan assets at beginning of year
|
961,421
|
|
1,000,318
|
|
—
|
|
—
|
|
||||||||
|
Actual return on plan assets
|
118,073
|
|
5,101
|
|
—
|
|
—
|
|
||||||||
|
Employer contribution
|
21,371
|
|
8,861
|
|
22,837
|
|
22,810
|
|
||||||||
|
Settlement
|
(49,876
|
)
|
(120
|
)
|
—
|
|
—
|
|
||||||||
|
Currency translation and other
|
1,617
|
|
(1,560
|
)
|
—
|
|
—
|
|
||||||||
|
Benefits paid
|
(64,439
|
)
|
(51,179
|
)
|
(22,837
|
)
|
(22,810
|
)
|
||||||||
|
Fair value of plan assets at end of year
|
988,167
|
|
961,421
|
|
—
|
|
—
|
|
||||||||
|
Funded status at end of year
|
$
|
(249,611
|
)
|
$
|
(195,335
|
)
|
$
|
(318,415
|
)
|
$
|
(318,536
|
)
|
||||
The accumulated benefit obligation for all defined benefit pension plans was
$1.2 billion
as of
December 31, 2012
and
$1.1 billion
as of
December 31, 2011
.
We made total contributions to the pension plans of
$21.4 million
during
2012
. In
2011
, we made total contributions of
$8.9 million
to the pension plans. For
2013
, minimum funding requirements of our pension plans are approximately
$2.8 million
.
Amounts recognized in the Consolidated Balance Sheets consisted of the following:
|
Pension Benefits
|
Other Benefits
|
|||||||||||||||
|
December 31,
|
2012
|
2011
|
2012
|
2011
|
||||||||||||
|
In thousands of dollars
|
||||||||||||||||
|
Accrued liabilities
|
$
|
(9,396
|
)
|
$
|
(21,742
|
)
|
$
|
(26,181
|
)
|
$
|
(28,800
|
)
|
||||
|
Other long-term liabilities
|
(240,215
|
)
|
(173,593
|
)
|
(292,234
|
)
|
(289,736
|
)
|
||||||||
|
Total
|
$
|
(249,611
|
)
|
$
|
(195,335
|
)
|
$
|
(318,415
|
)
|
$
|
(318,536
|
)
|
||||
80
THE HERSHEY COMPANY
NOTES TO CONSOLIDATED FINANCIAL STATEMENTS—(Continued)
Amounts recognized in accumulated other comprehensive loss, net of tax, consisted of the following:
|
Pension Benefits
|
Other Benefits
|
|||||||||||||||
|
December 31,
|
2012
|
2011
|
2012
|
2011
|
||||||||||||
|
In thousands of dollars
|
||||||||||||||||
|
Actuarial net (loss)
|
$
|
(362,039
|
)
|
$
|
(356,379
|
)
|
$
|
(6,320
|
)
|
$
|
(1,545
|
)
|
||||
|
Net prior service credit (cost)
|
5,539
|
|
5,101
|
|
(3,217
|
)
|
(3,580
|
)
|
||||||||
|
Total
|
$
|
(356,500
|
)
|
$
|
(351,278
|
)
|
$
|
(9,537
|
)
|
$
|
(5,125
|
)
|
||||
Plans with accumulated benefit obligations in excess of plan assets were as follows:
|
December 31,
|
2012
|
2011
|
||||||
|
In thousands of dollars
|
||||||||
|
Projected benefit obligation
|
$
|
1,237,238
|
|
$
|
1,087,388
|
|
||
|
Accumulated benefit obligation
|
1,185,214
|
|
1,048,997
|
|
||||
|
Fair value of plan assets
|
987,643
|
|
898,852
|
|
||||
Components of Net Periodic Benefit Cost and Other Amounts Recognized in Other Comprehensive Income
Net periodic benefit cost for our pension and other post-retirement plans consisted of the following:
|
Pension Benefits
|
Other Benefits
|
|||||||||||||||||||||||
|
For the years ended December 31,
|
2012
|
2011
|
2010
|
2012
|
2011
|
2010
|
||||||||||||||||||
|
In thousands of dollars
|
||||||||||||||||||||||||
|
Service cost
|
$
|
30,823
|
|
$
|
30,059
|
|
$
|
28,287
|
|
$
|
1,172
|
|
$
|
1,333
|
|
$
|
1,385
|
|
||||||
|
Interest cost
|
49,909
|
|
52,960
|
|
53,500
|
|
13,258
|
|
14,967
|
|
16,254
|
|
||||||||||||
|
Expected return on plan assets
|
(72,949
|
)
|
(78,161
|
)
|
(76,121
|
)
|
—
|
|
—
|
|
—
|
|
||||||||||||
|
Amortization of prior service cost (credit)
|
731
|
|
1,002
|
|
1,142
|
|
619
|
|
(255
|
)
|
(278
|
)
|
||||||||||||
|
Amortization of net loss (gain)
|
39,723
|
|
28,004
|
|
28,522
|
|
(101
|
)
|
(71
|
)
|
(135
|
)
|
||||||||||||
|
Administrative expenses
|
545
|
|
653
|
|
412
|
|
120
|
|
244
|
|
261
|
|
||||||||||||
|
Net periodic benefit cost
|
48,782
|
|
34,517
|
|
35,742
|
|
15,068
|
|
16,218
|
|
17,487
|
|
||||||||||||
|
Curtailment loss (credit)
|
—
|
|
1,826
|
|
—
|
|
—
|
|
(174
|
)
|
—
|
|
||||||||||||
|
Settlement loss
|
19,676
|
|
46
|
|
16
|
|
—
|
|
—
|
|
—
|
|
||||||||||||
|
Total amount reflected in earnings
|
$
|
68,458
|
|
$
|
36,389
|
|
$
|
35,758
|
|
$
|
15,068
|
|
$
|
16,044
|
|
$
|
17,487
|
|
||||||
A portion of the pension settlement loss recorded in
2012
, totaling approximately
$15.8 million
, and the curtailment loss (credit) recorded in
2011
were associated with the Next Century program. The settlement losses recorded in
2011
and
2010
were associated with one of our international businesses. We discuss the Next Century program in
Note 3, Business Realignment and Impairment Charges
.
81
THE HERSHEY COMPANY
NOTES TO CONSOLIDATED FINANCIAL STATEMENTS—(Continued)
Amounts recognized in other comprehensive loss (income) and net periodic benefit cost before tax for our pension and other post-retirement plans consisted of the following:
|
Pension Benefits
|
Other Benefits
|
|||||||||||||||||||||||
|
For the years ended December 31,
|
2012
|
2011
|
2010
|
2012
|
2011
|
2010
|
||||||||||||||||||
|
In thousands of dollars
|
||||||||||||||||||||||||
|
Actuarial net loss (gain)
|
$
|
8,536
|
|
$
|
120,401
|
|
$
|
5,308
|
|
$
|
7,952
|
|
$
|
11,216
|
|
$
|
(15,044
|
)
|
||||||
|
Prior service (credit) cost
|
(716
|
)
|
(1,313
|
)
|
(1,086
|
)
|
(613
|
)
|
7,614
|
|
293
|
|
||||||||||||
|
Total recognized in other comprehensive loss (income)
|
$
|
7,820
|
|
$
|
119,088
|
|
$
|
4,222
|
|
$
|
7,339
|
|
$
|
18,830
|
|
$
|
(14,751
|
)
|
||||||
|
Total recognized in net periodic benefit cost and other comprehensive loss (income)
|
$
|
56,602
|
|
$
|
153,605
|
|
$
|
39,964
|
|
$
|
22,407
|
|
$
|
35,048
|
|
$
|
2,736
|
|
||||||
The estimated amounts for the defined benefit pension plans and the post-retirement benefit plans that will be amortized from accumulated other comprehensive income (loss) into net periodic benefit cost over the next fiscal year are as follows (in thousands):
|
Pension Plans
|
Post-Retirement
Benefit Plans
|
||||||
|
Amortization of net actuarial loss (gain)
|
$
|
40,632
|
|
$
|
(18
|
)
|
|
|
Amortization of prior service cost
|
$
|
424
|
|
$
|
619
|
|
|
Assumptions
Certain weighted-average assumptions used in computing the benefit obligations as of
December 31, 2012
and
2011
were as follows:
|
Pension Benefits
|
Other Benefits
|
|||||||||||
|
2012
|
2011
|
2012
|
2011
|
|||||||||
|
Discount rate
|
3.7
|
%
|
4.5
|
%
|
3.7
|
%
|
4.5
|
%
|
||||
|
Rate of increase in compensation levels
|
4.0
|
%
|
4.1
|
%
|
N/A
|
|
N/A
|
|
||||
For measurement purposes as of
December 31, 2012
, we assumed a
9.1%
annual rate of increase in the per capita cost of covered health care benefits for
2013
, grading down to
5.0%
by
2019
.
For measurement purposes as of
December 31, 2011
, we assumed a
10.0%
annual rate of increase in the per capita cost of covered health care benefits for
2012
, grading down to
5.0%
by
2019
.
Certain weighted-average assumptions used in computing net periodic benefit cost are as follows:
|
Pension Benefits
|
Other Benefits
|
|||||||||||||||||
|
For the years ended December 31,
|
2012
|
2011
|
2010
|
2012
|
2011
|
2010
|
||||||||||||
|
Discount rate
|
4.5
|
%
|
5.2
|
%
|
5.7
|
%
|
4.5
|
%
|
5.2
|
%
|
5.7
|
%
|
||||||
|
Expected long-term return on plan assets
|
8.0
|
%
|
8.0
|
%
|
8.5
|
%
|
N/A
|
|
N/A
|
|
N/A
|
|
||||||
|
Rate of compensation increase
|
4.1
|
%
|
4.1
|
%
|
4.1
|
%
|
N/A
|
|
N/A
|
|
N/A
|
|
||||||
We based the asset return assumption of
8.0%
for
2012
,
8.0%
for
2011
and
8.5%
for
2010
on current and expected asset allocations, as well as historical and expected returns on the plan asset categories. For 2013, we reduced the expected
82
THE HERSHEY COMPANY
NOTES TO CONSOLIDATED FINANCIAL STATEMENTS—(Continued)
return on plan assets assumption to
7.75%
from the
8.0%
assumption used during 2012, reflecting lower expected future returns on plan assets. The historical geometric average return over the 25 years prior to
December 31, 2012
, was approximately
8.4%
.
Assumed health care cost trend rates have a significant effect on the amounts reported for the post-retirement health care plans. A one-percentage point change in assumed health care cost trend rates would have the following effects:
|
Impact of assumed health care cost trend rates
|
One-Percentage
Point Increase |
One-Percentage
Point (Decrease) |
||||||
|
In thousands of dollars
|
||||||||
|
Effect on total service and interest cost components
|
$
|
216
|
|
$
|
(192
|
)
|
||
|
Effect on post-retirement benefit obligation
|
5,208
|
|
(4,620
|
)
|
||||
Plan Assets
We broadly diversify our pension plan assets across domestic and international common stock and fixed income asset classes. Our asset investment policies specify ranges of asset allocation percentages for each asset class. The ranges for the domestic pension plans were as follows:
|
Asset Class
|
Target Allocation 2012
|
||||
|
Equity securities
|
58
|
%
|
-
|
85%
|
|
|
Debt securities
|
15
|
%
|
-
|
42%
|
|
|
Cash and certain other investments
|
0
|
%
|
-
|
5%
|
|
As of
December 31, 2012
, actual allocations were within the specified ranges. We expect the level of volatility in pension plan asset returns to be in line with the overall volatility of the markets within each asset class.
The following table sets forth by level, within the fair value hierarchy, pension plan assets at their fair value as of
December 31, 2012
:
|
In thousands of dollars
|
Quoted prices in active markets of identical assets
(Level 1) |
Significant other observable inputs
(Level 2) |
Significant other unobservable
inputs (Level 3) |
Total assets measured at fair value as of
December 31, 2012 |
|||||||||||
|
Cash and cash equivalents
|
$
|
933
|
|
$
|
34,027
|
|
$
|
—
|
|
$
|
34,960
|
|
|||
|
Equity securities:
|
|||||||||||||||
|
U.S. all-cap (a)
|
50,596
|
|
104,102
|
|
—
|
|
154,698
|
|
|||||||
|
U.S. large-cap (b)
|
107,934
|
|
—
|
|
—
|
|
107,934
|
|
|||||||
|
U.S. small/mid-cap
|
24,816
|
|
—
|
|
—
|
|
24,816
|
|
|||||||
|
International all-cap (c)
|
111,834
|
|
2,938
|
|
—
|
|
114,772
|
|
|||||||
|
Global all-cap (d)
|
229,044
|
|
—
|
|
—
|
|
229,044
|
|
|||||||
|
Domestic real estate
|
24,892
|
|
—
|
|
—
|
|
24,892
|
|
|||||||
|
Fixed income securities:
|
|||||||||||||||
|
U.S. government/agency
|
76,009
|
|
27,984
|
|
—
|
|
103,993
|
|
|||||||
|
Corporate bonds (e)
|
38,001
|
|
19,691
|
|
—
|
|
57,692
|
|
|||||||
|
Collateralized obligations (f)
|
61,853
|
|
27,012
|
|
—
|
|
88,865
|
|
|||||||
|
International government/corporate bonds (g)
|
13,432
|
|
33,069
|
|
—
|
|
46,501
|
|
|||||||
|
Total Investments
|
$
|
739,344
|
|
$
|
248,823
|
|
$
|
—
|
|
$
|
988,167
|
|
|||
83
THE HERSHEY COMPANY
NOTES TO CONSOLIDATED FINANCIAL STATEMENTS—(Continued)
The following table sets forth by level, within the fair value hierarchy, pension plan assets at their fair value as of
December 31, 2011
:
|
In thousands of dollars
|
Quoted prices in active markets of identical assets
(Level 1) |
Significant other observable inputs(Level 2)
|
Significant other unobservable
inputs (Level 3) |
Total assets measured at fair value as of
December 31, 2011 |
|||||||||||
|
Cash and cash equivalents
|
$
|
4,266
|
|
$
|
15,875
|
|
$
|
—
|
|
$
|
20,141
|
|
|||
|
Equity securities:
|
|||||||||||||||
|
U.S. all-cap (a)
|
79,164
|
|
133,580
|
|
—
|
|
212,744
|
|
|||||||
|
U.S. large-cap (b)
|
114,463
|
|
—
|
|
—
|
|
114,463
|
|
|||||||
|
U.S. small/mid-cap
|
21,008
|
|
—
|
|
—
|
|
21,008
|
|
|||||||
|
International all-cap (c)
|
117,415
|
|
2,962
|
|
—
|
|
120,377
|
|
|||||||
|
Global all-cap (d)
|
212,891
|
|
8,903
|
|
—
|
|
221,794
|
|
|||||||
|
Domestic real estate
|
22,250
|
|
—
|
|
—
|
|
22,250
|
|
|||||||
|
Fixed income securities:
|
|||||||||||||||
|
U.S. government/agency
|
90,403
|
|
2,319
|
|
—
|
|
92,722
|
|
|||||||
|
Corporate bonds (e)
|
44,932
|
|
3,433
|
|
—
|
|
48,365
|
|
|||||||
|
Collateralized obligations (f)
|
29,507
|
|
6,631
|
|
—
|
|
36,138
|
|
|||||||
|
International government/corporate bonds (g)
|
20,997
|
|
30,422
|
|
—
|
|
51,419
|
|
|||||||
|
Total Investments
|
$
|
757,296
|
|
$
|
204,125
|
|
$
|
—
|
|
$
|
961,421
|
|
|||
|
(a)
|
This category comprises equity funds that track the Russell 3000 index.
|
|
(b)
|
This category comprises equity funds that track the S&P 500 and/or Russell 1000 indices.
|
|
(c)
|
This category comprises equity funds that track the MSCI World Ex-US index.
|
|
(d)
|
This category comprises equity funds that track the MSCI World index.
|
|
(e)
|
This category comprises fixed income funds primarily invested in investment grade bonds.
|
|
(f)
|
This category comprises fixed income funds primarily invested in high quality mortgage-backed securities and other asset-backed obligations.
|
|
(g)
|
This category comprises fixed income funds invested in Canadian and other international bonds.
|
The fair value of the Level 1 assets was based on quoted market prices in active markets for the identical assets. The fair value of the Level 2 assets was determined by management based on an assessment of valuations provided by asset management entities and was calculated by aggregating market prices for all underlying securities.
Investment objectives for our domestic plan assets are:
|
l
|
To optimize the long-term return on plan assets at an acceptable level of risk;
|
|
l
|
To maintain a broad diversification across asset classes;
|
|
l
|
To maintain careful control of the risk level within each asset class; and
|
|
l
|
To focus on a long-term return objective.
|
We believe that there are no significant concentrations of risk within our plan assets as of
December 31, 2012
. We comply with ERISA rules and regulations and we prohibit investments and investment strategies not allowed by ERISA. We do not permit direct purchases of our Company’s securities or the use of derivatives for the purpose of speculation. We invest the assets of non-domestic plans in compliance with laws and regulations applicable to those plans.
84
THE HERSHEY COMPANY
NOTES TO CONSOLIDATED FINANCIAL STATEMENTS—(Continued)
Cash Flows
Information about the expected cash flows for our pension and other post-retirement benefit plans is as follows:
|
Expected Benefit Payments
|
|||||||||||||||||||||||
|
2013
|
2014
|
2015
|
2016
|
2017
|
2018-2022
|
||||||||||||||||||
|
In thousands of dollars
|
|||||||||||||||||||||||
|
Pension Benefits
|
$
|
61,840
|
|
$
|
60,458
|
|
$
|
63,731
|
|
$
|
71,315
|
|
$
|
107,895
|
|
$
|
494,946
|
|
|||||
|
Other Benefits
|
26,169
|
|
25,687
|
|
25,092
|
|
24,334
|
|
23,037
|
|
93,966
|
|
|||||||||||
Multiemployer Pension Plan
With the acquisition of Brookside Foods Ltd. in January 2012, we began participation in the Bakery and Confectionery Union and Industry Canadian Pension Fund, a trustee-managed multiemployer defined benefit pension plan. We currently have approximately
67
employees participating in the plan and contributions were not significant in
2012
. Our obligation during the term of the collective bargaining agreement is limited to remitting the required contributions to the plan.
15. SAVINGS PLANS
The Company sponsors several defined contribution plans to provide retirement benefits to employees. Contributions to The Hershey Company 401(k) Plan and similar plans for non-domestic employees are based on a portion of eligible pay up to a defined maximum. All matching contributions were made in cash. Expense associated with the defined contribution plans was
$39.8 million
in
2012
,
$35.8 million
in
2011
and
$34.0 million
in
2010
.
16. CAPITAL STOCK AND NET INCOME PER SHARE
We had
1,055,000,000
authorized shares of capital stock as of
December 31, 2012
. Of this total,
900,000,000
shares were designated as Common Stock,
150,000,000
shares as Class B Common Stock (“Class B Stock”) and
5,000,000
shares as Preferred Stock. Each class has a par value of one dollar per share. As of
December 31, 2012
, a combined total of
359,901,744
shares of both classes of common stock had been issued of which
223,786,030
shares were outstanding. No shares of the Preferred Stock were issued or outstanding during the 3-year period ended
December 31, 2012
.
Holders of the Common Stock and the Class B Stock generally vote together without regard to class on matters submitted to stockholders, including the election of directors. The holders of Common Stock have 1 vote per share and the holders of Class B Stock have 10 votes per share. However, the Common Stock holders, voting separately as a class, are entitled to elect one-sixth of the Board of Directors. With respect to dividend rights, the Common Stock holders are entitled to cash dividends 10% higher than those declared and paid on the Class B Stock.
Class B Stock can be converted into Common Stock on a share-for-share basis at any time. During
2012
,
3,225
shares of Class B Stock were converted into Common Stock. During
2011
,
74,377
shares were converted and during
2010
,
2,489
shares were converted.
85
THE HERSHEY COMPANY
NOTES TO CONSOLIDATED FINANCIAL STATEMENTS—(Continued)
Changes in outstanding Common Stock for the past 3 years were as follows:
|
For the years ended December 31,
|
2012
|
2011
|
2010
|
||||||
|
Shares issued
|
359,901,744
|
|
359,901,744
|
|
359,901,744
|
|
|||
|
Treasury shares at beginning of year
|
(134,695,826
|
)
|
(132,871,512
|
)
|
(131,903,468
|
)
|
|||
|
Stock repurchases:
|
|||||||||
|
Repurchase programs
|
(2,054,354
|
)
|
(1,902,753
|
)
|
—
|
|
|||
|
Stock-based compensation programs
|
(5,598,537
|
)
|
(5,179,028
|
)
|
(3,932,373
|
)
|
|||
|
Stock issuances:
|
|||||||||
|
Stock-based compensation programs
|
6,233,003
|
|
5,257,467
|
|
2,964,329
|
|
|||
|
Treasury shares at end of year
|
(136,115,714
|
)
|
(134,695,826
|
)
|
(132,871,512
|
)
|
|||
|
Net shares outstanding at end of year
|
223,786,030
|
|
225,205,918
|
|
227,030,232
|
|
|||
Basic and Diluted Earnings Per Share were computed based on the weighted-average number of shares of the Common Stock and the Class B Stock outstanding as follows:
|
For the years ended December 31,
|
2012
|
2011
|
2010
|
|||||||||
|
In thousands except per share amounts
|
||||||||||||
|
Net income
|
$
|
660,931
|
|
$
|
628,962
|
|
$
|
509,799
|
|
|||
|
Weighted-average shares—Basic
|
||||||||||||
|
Common Stock
|
164,406
|
|
165,929
|
|
167,032
|
|
||||||
|
Class B Stock
|
60,630
|
|
60,645
|
|
60,708
|
|
||||||
|
Total weighted-average shares—Basic
|
225,036
|
|
226,574
|
|
227,740
|
|
||||||
|
Effect of dilutive securities:
|
||||||||||||
|
Employee stock options
|
2,608
|
|
2,565
|
|
1,852
|
|
||||||
|
Performance and restricted stock units
|
693
|
|
780
|
|
721
|
|
||||||
|
Weighted-average shares—Diluted
|
228,337
|
|
229,919
|
|
230,313
|
|
||||||
|
Earnings Per Share—Basic
|
||||||||||||
|
Common Stock
|
$3.01
|
$2.85
|
$2.29
|
|||||||||
|
Class B Stock
|
$2.73
|
$2.58
|
$2.08
|
|||||||||
|
Earnings Per Share—Diluted
|
||||||||||||
|
Common Stock
|
$2.89
|
$2.74
|
$2.21
|
|||||||||
|
Class B Stock
|
$2.71
|
$2.56
|
$2.07
|
|||||||||
For the year ended
December 31, 2012
, approximately
3.5 million
stock options were not included in the diluted earnings per share calculation because the exercise price was higher than the average market price of the Common Stock for
86
THE HERSHEY COMPANY
NOTES TO CONSOLIDATED FINANCIAL STATEMENTS—(Continued)
the year. Therefore, the effect would have been antidilutive. In
2011
,
6.9 million
stock options were not included and, in
2010
,
8.7 million
stock options were not included in the diluted earnings per share calculation because the effect would have been antidilutive.
Milton Hershey School Trust
Hershey Trust Company, as Trustee for the benefit of Milton Hershey School and as direct owner of investment shares, held
12,902,621
shares of our Common Stock as of
December 31, 2012
. As Trustee for the benefit of Milton Hershey School, Hershey Trust Company held
60,612,012
shares of the Class B Stock as of
December 31, 2012
, and was entitled to cast approximately
80%
of the total votes of both classes of our common stock. Hershey Trust Company, as Trustee for the benefit of Milton Hershey School, or any successor trustee, or Milton Hershey School, as appropriate, must approve the issuance of shares of Common Stock or any other action that would result in it not continuing to have voting control of our Company.
17. STOCK COMPENSATION PLANS
The Equity and Incentive Compensation Plan (“EICP”) is the plan under which grants using shares for compensation and incentive purposes are made. The EICP provides for grants of one or more of the following stock-based compensation awards to employees, non-employee directors and certain service providers upon whom the successful conduct of our business is dependent:
|
l
|
Non-qualified stock options (“stock options”);
|
|
l
|
Performance stock units (“PSUs”) and performance stock;
|
|
l
|
Stock appreciation rights;
|
|
l
|
Restricted stock units (“RSUs”) and restricted stock; and
|
|
l
|
Other stock-based awards.
|
The EICP also provides for the deferral of stock-based compensation awards by participants if approved by the Compensation and Executive Organization Committee of our Board and if in accordance with an applicable deferred compensation plan of the Company. Currently, the Compensation and Executive Organization Committee has authorized the deferral of performance stock unit and restricted stock unit awards by certain eligible employees under the Company’s Deferred Compensation Plan. Our Board has authorized our non-employee directors to defer any portion of their cash retainer, committee chair fees and restricted stock units awarded after 2007 that they elect to convert into deferred stock units under our Directors’ Compensation Plan. As of
December 31, 2012
,
68.5 million
shares were authorized and approved by our stockholders for grants under the EICP.
In July 2004, we announced a worldwide stock option grant under the Broad Based Stock Option Plan. This grant provided over
13,000
eligible employees with
100
non-qualified stock options. The stock options were granted at a price of
$46.44
per share, have a term of
10 years
and vested on
July 19, 2009
.
The following table summarizes our compensation costs:
|
For the years ended December 31,
|
2012
|
2011
|
2010
|
|||||||||
|
In millions of dollars
|
||||||||||||
|
Total compensation amount charged against income for stock compensation plans, including stock options, performance stock units and restricted stock units
|
$
|
50.5
|
|
$
|
43.5
|
|
$
|
49.5
|
|
|||
|
Total income tax benefit recognized in Consolidated Statements of Income for share-based compensation
|
$
|
17.5
|
|
$
|
15.1
|
|
$
|
17.4
|
|
|||
Compensation costs for stock compensation plans are primarily included in selling, marketing and administrative expense.
The increase in share-based compensation expense from
2011
to
2012
and the decrease in share-based compensation expense from
2010
to
2011
resulted primarily from certain adjustments associated with accounting for PSUs and the impact of the forfeiture of unvested awards due to participant changes during
2011
and
2012
.
87
THE HERSHEY COMPANY
NOTES TO CONSOLIDATED FINANCIAL STATEMENTS—(Continued)
Stock Options
The exercise price of each option awarded under the EICP equals the closing price of our Common Stock on the New York Stock Exchange on the date of grant. Prior to the initial approval by our stockholders of the EICP on
April 17, 2007
, the exercise price of stock options granted under the former Key Employee Incentive Plan was determined as the closing price of our Common Stock on the New York Stock Exchange on the trading day immediately preceding the date the stock options were granted. Each option has a maximum term of 10 years. Grants of stock options provide for pro-rated vesting primarily over four years. We recognize expense for stock options based on the straight-line method as of the grant date fair value.
The following table summarizes our compensation costs for stock options:
|
For the years ended December 31,
|
2012
|
2011
|
2010
|
|||||||||
|
In millions of dollars
|
||||||||||||
|
Compensation amount charged against income for stock options
|
$
|
19.3
|
|
$
|
22.5
|
|
$
|
20.3
|
|
|||
The decrease in compensation cost from
2011
to
2012
was primarily driven by the impact of the forfeitures of unvested awards due to participant changes during
2012
and 2011. The increase in compensation cost from
2010
to
2011
was driven by an increase in the compensation amount upon which the number of stock options granted in
2011
was based.
A summary of the status of our Company’s stock options and changes during the years ending on those dates follows:
|
2012
|
2011
|
2010
|
||||||||||||||||
|
Stock Options
|
Shares
|
Weighted-
Average Exercise Price |
Shares
|
Weighted-
Average Exercise Price |
Shares
|
Weighted-
Average Exercise Price |
||||||||||||
|
Outstanding at beginning of year
|
14,540,442
|
|
$44.86
|
17,997,082
|
|
$42.21
|
18,230,439
|
|
$41.63
|
|||||||||
|
Granted
|
2,110,945
|
|
$60.89
|
2,191,627
|
|
$51.62
|
2,828,800
|
|
$39.61
|
|||||||||
|
Exercised
|
(5,870,607
|
)
|
$44.55
|
(4,875,122
|
)
|
$38.30
|
(2,646,860
|
)
|
$34.74
|
|||||||||
|
Forfeited
|
(226,866
|
)
|
$52.02
|
(773,145
|
)
|
$43.90
|
(415,297
|
)
|
$46.26
|
|||||||||
|
Outstanding at end of year
|
10,553,914
|
|
$48.08
|
14,540,442
|
|
$44.86
|
17,997,082
|
|
$42.21
|
|||||||||
|
Options exercisable at year-end
|
5,320,775
|
|
$45.74
|
8,453,362
|
|
$46.95
|
10,507,127
|
|
$45.13
|
|||||||||
|
Weighted-average fair value of options granted during the year (per share)
|
$
|
10.60
|
|
$
|
9.97
|
|
$
|
6.86
|
|
|||||||||
The following table sets forth information about the weighted-average fair value of options granted to employees during each year using the Black-Scholes option-pricing model and the weighted-average assumptions used for such grants:
|
For the years ended December 31,
|
2012
|
2011
|
2010
|
||||||
|
Dividend yields
|
2.4
|
%
|
2.7
|
%
|
3.2
|
%
|
|||
|
Expected volatility
|
22.4
|
%
|
22.5
|
%
|
21.7
|
%
|
|||
|
Risk-free interest rates
|
1.5
|
%
|
2.8
|
%
|
3.1
|
%
|
|||
|
Expected lives in years
|
6.6
|
|
6.5
|
|
6.5
|
|
|||
88
THE HERSHEY COMPANY
NOTES TO CONSOLIDATED FINANCIAL STATEMENTS—(Continued)
|
l
|
“Dividend yields” means the sum of dividends declared for the four most recent quarterly periods, divided by the average price of our Common Stock for the comparable periods;
|
|
l
|
“Expected volatility” means the historical volatility of our Common Stock over the expected term of each grant;
|
|
l
|
“Risk-free interest rates” means the U.S. Treasury yield curve rate in effect at the time of grant for periods within the contractual life of the option; and
|
|
l
|
“Expected lives” means the period of time that options granted are expected to be outstanding based primarily on historical data.
|
The following table summarizes the intrinsic value of our stock options:
|
For the years ended December 31,
|
2012
|
2011
|
2010
|
|||||||||
|
In millions of dollars
|
||||||||||||
|
Intrinsic value of options exercised
|
$
|
130.2
|
|
$
|
81.3
|
|
$
|
30.2
|
|
|||
The aggregate intrinsic value of options outstanding as of
December 31, 2012
was
$261.8 million
. The aggregate intrinsic value of exercisable options as of
December 31, 2012
was
$144.4 million
.
As of
December 31, 2012
, there was
$19.7 million
of total unrecognized compensation cost related to non-vested stock option compensation arrangements granted under the EICP. We expect to recognize that cost over a weighted-average period of
2.3
years.
The following table summarizes information about stock options outstanding as of
December 31, 2012
:
|
Options Outstanding
|
Options Exercisable
|
|||||||||||||||
|
Range of Exercise Prices
|
Number
Outstanding as of 12/31/12 |
Weighted-
Average Remaining Contractual Life in Years |
Weighted-
Average Exercise Price |
Number
Exercisable as of 12/31/12 |
Weighted-
Average Exercise Price |
|||||||||||
|
$32.25 - $39.26
|
4,320,844
|
|
5.7
|
$
|
37.00
|
|
2,567,294
|
|
$
|
36.55
|
|
|||||
|
$39.57 - $54.68
|
3,434,325
|
|
5.6
|
$
|
51.65
|
|
2,034,149
|
|
$
|
51.90
|
|
|||||
|
$54.97 - $72.44
|
2,798,745
|
|
7.3
|
$
|
60.81
|
|
719,332
|
|
$
|
61.15
|
|
|||||
|
$32.25 - $72.44
|
10,553,914
|
|
6.1
|
$
|
48.08
|
|
5,320,775
|
|
$
|
45.74
|
|
|||||
Performance Stock Units and Restricted Stock Units
Under the EICP, we grant PSUs to selected executives and other key employees. Vesting is contingent upon the achievement of certain performance objectives. We grant PSUs over 3-year performance cycles. If we meet targets for financial measures at the end of the applicable 3-year performance cycle, we award the full number of shares to the participants. For each PSU granted from
2010
through
2012
,
50%
of the target award was a market-based total shareholder return component and 50% of the target award was comprised of performance-based components. The performance scores for
2010
through
2012
grants of PSUs can range from
0%
to
250%
of the targeted amounts.
We recognize the compensation cost associated with PSUs ratably over the 3-year term. Compensation cost is based on the grant date fair value because the grants can only be settled in shares of our Common Stock. The grant date fair value of PSUs is determined based on the Monte Carlo simulation model for the market-based total shareholder return component and the closing market price of the Company’s shares on the date of grant for performance-based components.
In
2012
,
2011
and
2010
, we awarded RSUs to certain executive officers and other key employees under the EICP. We also awarded restricted stock units quarterly to non-employee directors.
We recognize the compensation cost associated with employee RSUs over a specified restriction period based on the grant date fair value or year-end market value of the stock. We recognize expense for employee RSUs based on the straight-line method. We recognize the compensation cost associated with non-employee director RSUs ratably over the vesting period.
89
THE HERSHEY COMPANY
NOTES TO CONSOLIDATED FINANCIAL STATEMENTS—(Continued)
|
For the years ended December 31,
|
2012
|
2011
|
2010
|
|||||||||
|
In millions of dollars
|
||||||||||||
|
Compensation amount charged against income for performance and restricted stock units
|
$
|
31.2
|
|
$
|
21.0
|
|
$
|
29.2
|
|
|||
Compensation expense for performance and restricted stock units was lower in
2011
resulting primarily from certain adjustments associated with the accounting for PSUs. In addition, the decrease in compensation expense in
2011
resulted from the impact of the forfeiture of unvested awards due to participant changes during
2011
.
The following table sets forth information about the fair value of the PSUs and RSUs granted for potential future distribution to employees and directors during the year. In addition, the table provides assumptions used to determine fair value of the market-based total shareholder return component using the Monte Carlo simulation model on the date of grant.
|
For the years ended December 31,
|
2012
|
2011
|
2010
|
|||||||||
|
Units granted
|
503,761
|
|
543,596
|
|
640,363
|
|
||||||
|
Weighted-average fair value at date of grant
|
$
|
64.99
|
|
$
|
58.28
|
|
$
|
43.84
|
|
|||
|
Monte Carlo simulation assumptions:
|
||||||||||||
|
Estimated values
|
$
|
35.62
|
|
$
|
37.79
|
|
$
|
28.62
|
|
|||
|
Dividend yields
|
2.5
|
%
|
2.7
|
%
|
3.2
|
%
|
||||||
|
Expected volatility
|
20.0
|
%
|
28.8
|
%
|
29.5
|
%
|
||||||
|
l
|
“Estimated values” means the fair value for the market-based total shareholder return component of each performance stock unit at the date of grant using a Monte Carlo simulation model;
|
|
l
|
“Dividend yields” means the sum of dividends declared for the four most recent quarterly periods, divided by the average price of our Common Stock for the comparable periods;
|
|
l
|
“Expected volatility” means the historical volatility of our Common Stock over the expected term of each grant.
|
A summary of the status of our Company’s performance stock units and restricted stock units as of
December 31, 2012
and the change during
2012
follows:
|
Performance Stock Units and Restricted Stock Units
|
2012
|
Weighted-average grant date fair value
for equity awards or market value for
liability awards
|
|||
|
Outstanding at beginning of year
|
1,740,479
|
|
$48.70
|
||
|
Granted
|
503,761
|
|
$64.99
|
||
|
Performance assumption change
|
191,608
|
|
$59.08
|
||
|
Vested
|
(605,208
|
)
|
$43.14
|
||
|
Forfeited
|
(110,063
|
)
|
$58.13
|
||
|
Outstanding at end of year
|
1,720,577
|
|
$56.71
|
||
The table above excludes PSU awards for
40,812
units as of
December 31, 2012
and
71,676
units as of
December 31, 2011
for which the measurement date has not yet occurred for accounting purposes.
As of
December 31, 2012
, there was
$38.1 million
of unrecognized compensation cost relating to non-vested PSUs and RSUs. We expect to recognize that cost over a weighted-average period of
2.1 years
.
|
For the years ended December 31,
|
2012
|
2011
|
2010
|
|||||||||
|
In millions of dollars
|
||||||||||||
|
Intrinsic value of share-based liabilities paid, combined with the fair value of shares vested
|
$
|
37.3
|
|
$
|
36.6
|
|
$
|
16.5
|
|
|||
90
THE HERSHEY COMPANY
NOTES TO CONSOLIDATED FINANCIAL STATEMENTS—(Continued)
The higher amounts in
2012
and
2011
were primarily due to the higher performance attainment percentage associated with the PSU awards vesting in
2012
and
2011
as compared with
2010
.
Deferred PSUs, deferred RSUs, deferred directors’ fees and accumulated dividend amounts totaled
612,075
units as of
December 31, 2012
.
We did not have any stock appreciation rights that were outstanding as of
December 31, 2012
.
18. SUPPLEMENTAL BALANCE SHEET INFORMATION
Accounts Receivable—Trade
In the normal course of business, we extend credit to customers that satisfy pre-defined credit criteria, based upon the results of our recurring financial account reviews and our evaluation of current and projected economic conditions. Our primary concentrations of credit risk are associated with Wal-Mart Stores, Inc. and McLane Company, Inc. McLane Company, Inc. is one of the largest wholesale distributors in the United States to convenience stores, drug stores, wholesale clubs and mass merchandisers. Wal-Mart Stores, Inc. accounted for approximately
19.6%
of our total accounts receivable as of
December 31, 2012
. As of
December 31, 2012
, McLane Company, Inc. accounted for approximately
17.9%
of our total accounts receivable. No other customer accounted for more than
10%
of our year-end accounts receivable. We believe that we have little concentration of credit risk associated with the remainder of our customer base. Accounts Receivable-Trade, as shown on the Consolidated Balance Sheets, were net of allowances and anticipated discounts of
$15.2 million
as of
December 31, 2012
and
$19.5 million
as of
December 31, 2011
.
Inventories
We value the majority of our inventories under the last-in, first-out (“LIFO”) method and the remaining inventories at the lower of first-in, first-out (“FIFO”) cost or market. Inventories include material, labor and overhead. LIFO cost of inventories valued using the LIFO method was
$331.7 million
as of
December 31, 2012
and
$361.4 million
as of
December 31, 2011
. The net impact of LIFO acquisitions during 2012 was not material. The net impact of LIFO liquidations during 2012 was
$5.4 million
. We stated inventories at amounts that did not exceed realizable values. Total inventories were as follows:
|
December 31,
|
2012
|
2011
|
||||||
|
In thousands of dollars
|
||||||||
|
Raw materials
|
$
|
256,969
|
|
$
|
241,812
|
|
||
|
Goods in process
|
78,292
|
|
91,956
|
|
||||
|
Finished goods
|
496,981
|
|
482,095
|
|
||||
|
Inventories at FIFO
|
832,242
|
|
815,863
|
|
||||
|
Adjustment to LIFO
|
(198,980
|
)
|
(166,910
|
)
|
||||
|
Total inventories
|
$
|
633,262
|
|
$
|
648,953
|
|
||
91
THE HERSHEY COMPANY
NOTES TO CONSOLIDATED FINANCIAL STATEMENTS—(Continued)
Property, Plant and Equipment
The property, plant and equipment balance included construction in progress of
$217.5 million
as of
December 31, 2012
and
$239.9 million
as of
December 31, 2011
. As of
December 31, 2012
, construction in progress included
$41.1 million
associated with payments made by Ferrero under an agreement for the construction of a warehouse and distribution facility of which the Company has been deemed to be the owner for accounting purposes. Major classes of property, plant and equipment were as follows:
|
December 31,
|
2012
|
2011
|
||||||
|
In thousands of dollars
|
||||||||
|
Land
|
$
|
92,916
|
|
$
|
92,495
|
|
||
|
Buildings
|
878,527
|
|
895,859
|
|
||||
|
Machinery and equipment
|
2,589,183
|
|
2,600,204
|
|
||||
|
Property, plant and equipment, gross
|
3,560,626
|
|
3,588,558
|
|
||||
|
Accumulated depreciation
|
(1,886,555
|
)
|
(2,028,841
|
)
|
||||
|
Property, plant and equipment, net
|
$
|
1,674,071
|
|
$
|
1,559,717
|
|
||
During
2012
, we recorded accelerated depreciation of property, plant and equipment of
$15.3 million
associated with the Next Century program.
Goodwill and Other Intangible Assets
Goodwill and intangible assets were as follows:
|
December 31,
|
2012
|
2011
|
||||||
|
In thousands of dollars
|
||||||||
|
Unamortized intangible assets:
|
||||||||
|
Goodwill balance at beginning of year
|
$
|
516,745
|
|
$
|
524,134
|
|
||
|
Effect of foreign currency translation
|
3,284
|
|
(7,389
|
)
|
||||
|
Acquisitions
|
67,974
|
|
—
|
|
||||
|
Goodwill balance at end of year
|
$
|
588,003
|
|
$
|
516,745
|
|
||
|
Trademarks with indefinite lives
|
$
|
81,465
|
|
$
|
81,465
|
|
||
|
Amortized intangible assets, gross:
|
||||||||
|
Trademarks
|
68,490
|
|
7,048
|
|
||||
|
Customer-related
|
74,790
|
|
33,926
|
|
||||
|
Intangible asset associated with cooperative agreement with Bauducco
|
13,683
|
|
13,683
|
|
||||
|
Patents
|
20,018
|
|
8,817
|
|
||||
|
Effect of foreign currency translation
|
(6,470
|
)
|
(5,568
|
)
|
||||
|
Total other intangible assets, gross
|
251,976
|
|
139,371
|
|
||||
|
Accumulated amortization:
|
||||||||
|
Trademarks
|
(2,250
|
)
|
—
|
|
||||
|
Customer-related
|
(22,990
|
)
|
(17,840
|
)
|
||||
|
Intangible asset associated with cooperative agreement with Bauducco
|
(6,294
|
)
|
(5,091
|
)
|
||||
|
Patents
|
(7,411
|
)
|
(5,230
|
)
|
||||
|
Effect of foreign currency translation
|
1,682
|
|
703
|
|
||||
|
Total accumulated amortization
|
(37,263
|
)
|
(27,458
|
)
|
||||
|
Other intangibles
|
$
|
214,713
|
|
$
|
111,913
|
|
||
92
THE HERSHEY COMPANY
NOTES TO CONSOLIDATED FINANCIAL STATEMENTS—(Continued)
In January 2012, we acquired all of the outstanding stock of Brookside, a privately held confectionery company based in Abbotsford, British Columbia, Canada. Our financial statements reflect the final accounting for the Brookside acquisition. The purchase price for the acquisition was approximately
$172.9 million
. The excess purchase price over the estimated value of the net tangible and identifiable intangible assets was recorded to goodwill. The goodwill is not expected to be deductible for tax purposes. The increases in goodwill and other intangibles, including trademarks, customer-related intangibles and patents were primarily due to the Brookside acquisition. For more information, see
Note 2, Business Acquisitions.
Accumulated impairment losses associated with goodwill were
$70.1 million
as of
December 31, 2012
, and
$65.2 million
as of
December 31, 2011
. Accumulated impairment losses associated with trademarks were
$46.7 million
as of
December 31, 2012
, and
$45.7 million
as of
December 31, 2011
.
The useful lives of certain trademarks were determined to be indefinite and, therefore, we are not amortizing these assets. We amortize customer-related intangible assets over their estimated useful lives of approximately
15 years
. We amortize trademarks with finite lives over their estimated useful lives of
25 years
. We amortize patents over their remaining legal lives of approximately
6 years
. Total amortization expense for other intangible assets was
$10.6 million
in
2012
,
$4.6 million
in
2011
and
$4.5 million
in
2010
.
Estimated annual amortization expense for other intangible assets over the next five years is as follows:
|
Annual Amortization Expense
|
2013
|
2014
|
2015
|
2016
|
2017
|
|||||||||||||||
|
In thousands of dollars
|
||||||||||||||||||||
|
Estimated amortization expense
|
$
|
10,414
|
|
$
|
10,414
|
|
$
|
9,800
|
|
$
|
9,780
|
|
$
|
9,680
|
|
|||||
Accrued Liabilities
Accrued liabilities were as follows:
|
December 31,
|
2012
|
2011
|
||||||
|
In thousands of dollars
|
||||||||
|
Payroll, compensation and benefits
|
$
|
236,598
|
|
$
|
233,547
|
|
||
|
Advertising and promotion
|
289,221
|
|
253,534
|
|
||||
|
Other
|
125,087
|
|
125,105
|
|
||||
|
Total accrued liabilities
|
$
|
650,906
|
|
$
|
612,186
|
|
||
Other Long-term Liabilities
Other long-term liabilities were as follows:
|
December 31,
|
2012
|
2011
|
||||||
|
In thousands of dollars
|
||||||||
|
Post-retirement benefits liabilities
|
$
|
292,234
|
|
$
|
289,736
|
|
||
|
Pension benefits liabilities
|
240,215
|
|
173,593
|
|
||||
|
Other
|
136,283
|
|
140,547
|
|
||||
|
Total other long-term liabilities
|
$
|
668,732
|
|
$
|
603,876
|
|
||
19. SEGMENT INFORMATION
We operate as a single reportable segment in manufacturing, marketing, selling and distributing our products under more than
80
brand names. Our three operating segments comprise geographic regions including the United States; the Americas; and Asia, Europe, the Middle East and Africa (“AEMEA”). We market our products in approximately
70
countries worldwide.
For segment reporting purposes, we aggregate our operations in the United States and in the Americas, which includes Canada, Mexico, Brazil, Central and South America, Puerto Rico and our exports business in this region. We base this
93
THE HERSHEY COMPANY
NOTES TO CONSOLIDATED FINANCIAL STATEMENTS—(Continued)
aggregation on similar economic characteristics, products and services; production processes; types or classes of customers; distribution methods; and the similar nature of the regulatory environment in each location. We aggregate our AEMEA operations with the United States and the Americas to form one reportable segment. Our AEMEA operations share most of the aggregation criteria and represent
less than 10%
of our consolidated revenues, operating profits and assets.
The percentage of total consolidated net sales for businesses outside of the United States was
16.1%
for
2012
,
15.6%
for
2011
and
14.6%
for
2010
. The percentage of total consolidated assets outside of the United States as of
December 31, 2012
was
20.5%
, and
14.5%
as of
December 31, 2011
.
Sales to McLane Company, Inc., one of the largest wholesale distributors in the United States to convenience stores, drug stores, wholesale clubs and mass merchandisers,
exceeded 10%
of total net sales in each of the last three years, totaling
$1.5 billion
in
2012
,
$1.4 billion
in
2011
and
$1.3 billion
in
2010
. McLane Company, Inc. is the primary distributor of our products to Wal-Mart Stores, Inc.
20. QUARTERLY DATA (Unaudited)
Summary quarterly results were as follows:
|
YearYear 2012
|
First
|
Second
|
Third
|
Fourth
|
||||||||||||
|
In thousands of dollars except per share amounts
|
||||||||||||||||
|
Net sales
|
$
|
1,732,064
|
|
$
|
1,414,444
|
|
$
|
1,746,709
|
|
$
|
1,751,035
|
|
||||
|
Gross profit
|
743,396
|
|
618,521
|
|
742,757
|
|
755,208
|
|
||||||||
|
Net income
|
198,651
|
|
135,685
|
|
176,716
|
|
149,879
|
|
||||||||
|
Per share—Basic—Class B Common Stock
|
0.82
|
|
0.56
|
|
0.73
|
|
0.62
|
|
||||||||
|
Per share—Diluted—Class B Common Stock
|
0.81
|
|
0.55
|
|
0.73
|
|
0.62
|
|
||||||||
|
Per share—Basic—Common Stock
(a)
|
0.91
|
|
0.62
|
|
0.80
|
|
0.69
|
|
||||||||
|
Per share—Diluted—Common Stock
|
0.87
|
|
0.59
|
|
0.77
|
|
0.66
|
|
||||||||
|
(a)
|
Quarterly income per share amounts do not total to the annual amount due to changes in weighted-average shares outstanding during the year.
|
|
Year 2011
|
First
|
Second
|
Third
|
Fourth
|
||||||||||||
|
In thousands of dollars except per share amounts
|
||||||||||||||||
|
Net sales
|
$
|
1,564,223
|
|
$
|
1,325,171
|
|
$
|
1,624,249
|
|
$
|
1,567,145
|
|
||||
|
Gross profit
|
656,185
|
|
564,320
|
|
680,181
|
|
631,206
|
|
||||||||
|
Net income
|
160,115
|
|
130,019
|
|
196,695
|
|
142,133
|
|
||||||||
|
Per share—Basic—Class B Common Stock
|
0.65
|
|
0.53
|
|
0.81
|
|
0.59
|
|
||||||||
|
Per share—Diluted—Class B Common Stock
|
0.65
|
|
0.53
|
|
0.80
|
|
0.58
|
|
||||||||
|
Per share—Basic—Common Stock
|
0.72
|
|
0.59
|
|
0.89
|
|
0.65
|
|
||||||||
|
Per share—Diluted—Common Stock
|
0.70
|
|
0.56
|
|
0.86
|
|
0.62
|
|
||||||||
Item 9.
CHANGES IN AND DISAGREEMENTS WITH ACCOUNTANTS ON ACCOUNTING AND FINANCIAL DISCLOSURE
None.
94
Item 9A.
CONTROLS AND PROCEDURES
As required by Rule 13a-15 under the Securities Exchange Act of 1934 (the “Exchange Act”), the Company conducted an evaluation of the effectiveness of the design and operation of the Company’s disclosure controls and procedures as of December 31, 2012. This evaluation was carried out under the supervision and with the participation of the Company’s management, including the Company’s Chief Executive Officer and Chief Financial Officer. Based upon that evaluation, the Chief Executive Officer and Chief Financial Officer concluded that the Company’s disclosure controls and procedures are effective. There has been no change during the most recent fiscal quarter in the Company’s internal control over financial reporting identified in connection with the evaluation that has materially affected, or is likely to materially affect, the Company’s internal control over financial reporting.
Disclosure controls and procedures are controls and other procedures that are designed to ensure that information required to be disclosed in the Company’s reports filed or submitted under the Exchange Act is recorded, processed, summarized and reported within the time periods specified in the Securities and Exchange Commission’s rules and forms. Disclosure controls and procedures include, without limitation, controls and procedures designed to ensure that information required to be disclosed in the Company’s reports filed under the Exchange Act is accumulated and communicated to management, including the Company’s Chief Executive Officer and Chief Financial Officer, as appropriate, to allow timely decisions regarding required disclosure.
The Company’s Common Stock is listed on the New York Stock Exchange (“NYSE”) under the ticker symbol “HSY.”
95
MANAGEMENT REPORT ON INTERNAL CONTROL OVER FINANCIAL REPORTING
The management of The Hershey Company is responsible for establishing and maintaining adequate internal control over financial reporting, as such term is defined in Exchange Act Rule 13a-15(f). The Company’s internal control system was designed to provide reasonable assurance to the Company’s management and Board of Directors regarding the preparation and fair presentation of published financial statements.
All internal control systems, no matter how well designed, have inherent limitations. Therefore, even those systems determined to be effective can provide only reasonable assurance with respect to financial statement preparation and presentation.
The Company’s management, including the Company’s Chief Executive Officer and Chief Financial Officer, assessed the effectiveness of the Company’s internal control over financial reporting as of December 31, 2012. In making this assessment, the Company’s management used the criteria set forth by the Committee of Sponsoring Organizations of the Treadway Commission (COSO) in
Internal Control–Integrated Framework
. Based on this assessment, management believes that, as of December 31, 2012, the Company’s internal control over financial reporting was effective based on those criteria.
|
|
|
||||
|
John P. Bilbrey
Chief Executive Officer
|
Humberto P. Alfonso
Chief Financial Officer
|
||||
96
Item 9B.
OTHER INFORMATION
None.
97
Item 10.
DIRECTORS, EXECUTIVE OFFICERS AND CORPORATE GOVERNANCE
The names, ages, positions held with our Company, periods of service as a director, principal occupations, business experience and other directorships of directors and nominees for director of our Company, together with a discussion of the specific experience, qualifications, attributes and skills that led the Board to conclude that the director or nominee should serve as a director at this time, are located in the Proxy Statement in the section entitled “Proposal No. 1—Election of Directors,” following the question “Who are the nominees?,” which information is incorporated herein by reference.
Our Executive Officers as of February 6, 2013
|
Name
|
Age
|
Positions Held During the Last Five Years
|
||
|
John P. Bilbrey
|
56
|
President and Chief Executive Officer (June 2011); Executive Vice President, Chief Operating Officer (November 2010); Senior Vice President, President Hershey North America (December 2007)
|
||
|
Humberto P. Alfonso
|
55
|
Executive Vice President, Chief Financial Officer and Chief Administrative Officer (September 2011); Senior Vice President, Chief Financial Officer (July 2007)
|
||
|
Michele G. Buck
|
51
|
Senior Vice President, Chief Growth Officer (September 2011); Senior Vice President, Global Chief Marketing Officer (December 2007)
|
||
|
Terence L. O’Day
(1)
|
63
|
Senior Vice President, Global Operations (December 2008)
|
||
|
Leslie M. Turner
(2)
|
55
|
Senior Vice President, General Counsel and Secretary (July 2012)
|
||
|
Kevin R. Walling
(3)
|
47
|
Senior Vice President, Chief Human Resources Officer (November 2011); Senior Vice President, Chief People Officer (June 2011)
|
||
|
D. Michael Wege
|
50
|
Senior Vice President, Chief Commercial Officer (September 2011); Senior Vice President, Chocolate Strategic Business Unit (December 2010);Vice President, U.S. Chocolate (April 2008); Vice President, Portfolio Brands and Marketing Excellence (July 2007)
|
||
|
Richard M. McConville
|
59
|
Vice President, Chief Accounting Officer (July 2012); Corporate Controller (June 2011); Director, International Controller, International Commercial Group (April 2007)
|
||
There are no family relationships among any of the above-named officers of our Company.
|
(1)
|
Mr. O’Day was elected Senior Vice President, Global Operations effective December 2, 2008. Prior to joining our Company he was Executive Vice President and Chief Operating Officer of Mannatech, Inc. (June 2006).
|
|
(2)
|
Ms. Turner was elected Senior Vice President, General Counsel and Secretary effective July 9, 2012. Prior to joining our Company she was Chief Legal Officer of Coca-Cola North America (June 2008), and Associate General Counsel, Coca-Cola Company Bottling Investments Group (January 2006).
|
|
(3)
|
Mr. Walling was elected Senior Vice President, Chief People Officer effective June 1, 2011. Prior to joining our Company he was Vice President and Chief Human Resource Officer of Kennametal Inc. (November 2005).
|
Our Executive Officers are generally elected each year at the organization meeting of the Board in April.
Information regarding the identification of the Audit Committee as a separately-designated standing committee of the Board and information regarding the status of one or more members of the Audit Committee being an “audit committee financial expert” is located in the Proxy Statement in the section entitled “Governance of the Company,” following the question “What are the committees of the Board and what are their functions?,” which information is incorporated herein by reference.
Reporting of any inadvertent late filings under Section 16(a) of the Securities Exchange Act of 1934, as amended, is located in the section of the Proxy Statement entitled “Section 16(a) Beneficial Ownership Reporting Compliance.” This information is incorporated herein by reference.
Information regarding our Code of Ethical Business Conduct applicable to our directors, officers and employees is located in Part I of this Annual Report on Form 10-K, under the heading “Available Information.”
98
Item 11.
EXECUTIVE COMPENSATION
Information regarding compensation of each of the named executive officers, including our Chief Executive Officer, and the Compensation Committee Report are set forth in the section of the Proxy Statement entitled “Executive Compensation,” which information is incorporated herein by reference. Information regarding compensation of our directors is located in the section of the Proxy Statement entitled “Director Compensation,” which information is incorporated herein by reference.
Item 12.
SECURITY OWNERSHIP OF CERTAIN BENEFICIAL OWNERS AND MANAGEMENT AND RELATED STOCKHOLDER MATTERS
(a) Information concerning ownership of our voting securities by certain beneficial owners, individual nominees for director, the named executive officers, including persons serving as our Chief Executive Officer and Chief Financial Officer, and directors and executive officers as a group, is set forth in the section entitled “Ownership of the Company’s Securities” in the Proxy Statement, which information is incorporated herein by reference.
(b) The following table provides information about all of the Company's equity compensation plans as of December 31, 2012:
Equity Compensation Plan Information
|
Plan Category
|
(a)
Number of securities to be issued upon exercise of outstanding options, warrants and rights
|
(b)
Weighted-average exercise price of outstanding options, warrants and rights
|
(c)
Number of securities remaining available for future issuance under equity compensation plans (excluding securities reflected in column (a))
|
||||||||
|
Equity compensation plans approved by security holders
(1)
|
|||||||||||
|
Stock Options
|
10,290,414
|
|
$
|
48.12
|
|
||||||
|
Performance Stock Units and Restricted Stock Units
|
1,720,577
|
|
N/A
|
|
|||||||
|
Subtotal
|
12,010,991
|
|
17,988,137
|
|
|||||||
|
Equity compensation plans not approved by security holders
(2)
|
|||||||||||
|
Stock Options
|
263,500
|
|
$
|
46.44
|
|
—
|
|
||||
|
Total
|
12,274,491
|
|
$
|
48.08
|
|
(3)
|
17,988,137
|
|
|||
|
(1)
|
Column (a) includes stock options, performance stock units and restricted stock units granted under the stockholder-approved EICP. Of the securities available for future issuances under the EICP in column (c), 11,351,921 are available for awards of stock options and 6,636,216 are available for full-value awards such as performance stock units, performance stock, restricted stock units, restricted stock and other stock-based awards. Securities available for future issuance of full-value awards may also be used for stock option awards. As of December 31, 2012, 40,812 performance stock units were excluded from the number of securities remaining available for issuance in column (c) because the measurement date had not yet occurred for accounting purposes. For more information, see
|
|
(2)
|
Column (a) includes 263,500 stock options outstanding that were granted under the Broad Based Stock Option Plan. In July 2004, we announced a worldwide stock option grant under the Broad Based Stock Option Plan, which provided over 13,000 eligible employees with a grant of 100 non-qualified stock options each. The stock options were granted at a price of $46.44 per share which equates to 100% of the fair market value of our Common Stock on the date of grant (determined as the closing price on the New York Stock Exchange on the trading day immediately preceding the date the stock options were granted) and vested on July 19, 2009. No additional awards may be made under the Broad Based Stock Option Plan or Directors' Compensation Plan.
|
|
(3)
|
Weighted-average exercise price of outstanding stock options only.
|
99
Item 13.
CERTAIN RELATIONSHIPS AND RELATED TRANSACTIONS, AND DIRECTOR INDEPENDENCE
Information regarding transactions with related persons is located in the section of the Proxy Statement entitled “Certain Transactions and Relationships” and information regarding director independence is located in the section of the Proxy Statement entitled “Governance of the Company” following the question, “Which directors are independent, and how does the Board make that determination?,” which information is incorporated herein by reference.
Item 14.
PRINCIPAL ACCOUNTANT FEES AND SERVICES
Information regarding “Principal Accountant Fees and Services,” including the policy regarding pre-approval of audit and non-audit services performed by our Company’s independent auditors, is located in the section entitled “Information About our Independent Auditors” in the Proxy Statement, which information is incorporated herein by reference.
100
Item 15.
EXHIBITS AND FINANCIAL STATEMENT SCHEDULES
The audited consolidated financial statements of the Company and its subsidiaries and the Report of the Independent Registered Public Accounting Firm thereon, as required to be filed with this report, are located under Item 8 of this report.
Schedule II—Valuation and Qualifying Accounts (see Page 106) for our Company and its subsidiaries for the years ended December 31, 2012, 2011 and 2010 is filed as required by Item 15(c).
We omitted other schedules which were not applicable or not required, or because we provided the required information in the consolidated financial statements or the notes to consolidated financial statements.
We omitted the financial statements of our parent company because we are primarily an operating company and there are no significant restricted net assets of consolidated and unconsolidated subsidiaries.
The following items are attached or incorporated by reference in response to Item 15(c):
Articles of Incorporation and By-laws
|
3.1
|
The Company’s Restated Certificate of Incorporation, as amended, is incorporated by reference from Exhibit 3 to the Company’s Quarterly Report on Form 10-Q for the quarter ended April 3, 2005. The By-laws, as amended and restated as of February 21, 2012, are incorporated by reference from Exhibit 3.1 to the Company’s Current Report on Form 8-K, filed February 24, 2012.
|
|
Instruments defining the rights of security holders, including indentures
|
|
|
4.1
|
The Company has issued certain long-term debt instruments, no one class of which creates indebtedness exceeding 10% of the total assets of the Company and its subsidiaries on a consolidated basis. These classes consist of the following:
|
|
1) 5.00% Notes due 2013
|
|
|
2) 4.850% Notes due 2015
|
|
|
3) 5.450% Notes due 2016
|
|
|
4) 1.500% Notes due 2016
|
|
|
5) 4.125% Notes due 2020
|
|
|
6) 8.8% Debentures due 2021
|
|
|
7) 7.2% Debentures due 2027
|
|
|
8) Other Obligations
|
|
We will furnish copies of the above debt instruments to the Commission upon request.
101
Material contracts
|
10.1
|
Kit Kat and Rolo License Agreement (the “License Agreement”) between the Company and Rowntree Mackintosh Confectionery Limited is incorporated by reference from Exhibit 10(a) to the Company’s Annual Report on Form 10-K for the fiscal year ended December 31, 1980. The License Agreement was amended in 1988 and the Amendment Agreement is incorporated by reference from Exhibit 19 to the Company’s Quarterly Report on Form 10-Q for the quarter ended July 3, 1988. The License Agreement was assigned by Rowntree Mackintosh Confectionery Limited to Société des Produits Nestlé SA as of January 1, 1990. The Assignment Agreement is incorporated by reference from Exhibit 19 to the Company’s Annual Report on Form 10-K for the fiscal year ended December 31, 1990.
|
|
|
10.2
|
Peter Paul/York Domestic Trademark & Technology License Agreement between the Company and Cadbury Schweppes Inc. (now Cadbury Ireland Limited) dated August 25, 1988, is incorporated by reference from Exhibit 2(a) to the Company’s Current Report on Form 8-K dated September 8, 1988. This agreement was assigned by the Company to its wholly-owned subsidiary, Hershey Chocolate & Confectionery Corporation.
|
|
|
10.3
|
Cadbury Trademark & Technology License Agreement between the Company and Cadbury Limited (now Cadbury UK Limited) dated August 25, 1988, is incorporated by reference from Exhibit 2(a) to the Company’s Current Report on Form 8-K dated September 8, 1988. This agreement was assigned by the Company to its wholly-owned subsidiary, Hershey Chocolate & Confectionery Corporation.
|
|
|
10.4
|
Trademark and Technology License Agreement between Huhtamäki and the Company dated December 30, 1996, is incorporated by reference from Exhibit 10 to the Company’s Current Report on Form 8-K dated February 26, 1997. This agreement was assigned by the Company to its wholly-owned subsidiary, Hershey Chocolate & Confectionery Corporation. The agreement was amended and restated in 1999 and the Amended and Restated Trademark and Technology License Agreement is incorporated by reference from Exhibit 10.2 to the Company’s Annual Report on Form 10-K for the fiscal year ended December 31, 1999.
|
|
|
10.5
|
Five Year Credit Agreement dated as of October 14, 2011, among the Company and the banks, financial institutions and other institutional lenders listed on the respective signature pages thereof (“Lenders”), Bank of America, N.A., as administrative agent for the Lenders, JPMorgan Chase Bank, N.A., as syndication agent, Citibank, N.A. and PNC Bank, National Association, as documentation agents, and Bank of America Merrill Lynch, J.P. Morgan Securities LLC, Citigroup Global Markets, Inc. and PNC Capital Markets LLC, as joint lead arrangers and joint book managers is incorporated by reference from Exhibit 10.1 to the Company’s Current Report on Form 8-K, filed October 20, 2011.
|
|
|
10.6
|
Master Innovation and Supply Agreement between the Company and Barry Callebaut, AG, dated July 13, 2007, is incorporated by reference from Exhibit 10.1 to the Company’s Current Report on Form 8-K, filed
July 19, 2007.
|
|
|
10.7
|
First Amendment to Master Innovation and Supply Agreement between the Company and Barry Callebaut, AG, dated April 14, 2011, is incorporated by reference from Exhibit 10.4 to the Company’s Quarterly Report on Form 10-Q for the quarter ended July 3, 2011.
|
|
|
10.8
|
Supply Agreement for Monterrey, Mexico, between the Company and Barry Callebaut, AG, dated July 13, 2007, is incorporated by reference from Exhibit 10.2 to the Company’s Current Report on Form 8-K, filed
July 19, 2007.
|
|
|
Executive Compensation Plans and Management Contracts
|
||
|
10.9
|
The Company’s Equity and Incentive Compensation Plan, amended and restated February 22, 2011, and approved by our stockholders on April 28, 2011, is incorporated by reference from Appendix B to the Company’s proxy statement filed March 15, 2011.
|
|
|
10.10
|
Terms and Conditions of Nonqualified Stock Option Awards under the Equity and Incentive Compensation Plan is incorporated by reference from Exhibit 10.2 to the Company’s Current Report on Form 8-K filed February 24, 2012.
|
|
|
10.11
|
The Company’s Executive Benefits Protection Plan (Group 3A), Amended and Restated as of June 27, 2012, is incorporated by reference from Exhibit 10.2 to the Company’s Quarterly Report on Form 10-Q for the quarter ended July 1, 2012.
|
|
102
|
10.12
|
The Company’s Deferred Compensation Plan, Amended and Restated as of June 27, 2012, is incorporated by reference from Exhibit 10.3 to the Company’s Quarterly Report on Form 10-Q for the quarter ended July 1, 2012.
|
|
|
10.13
|
Executive Confidentiality and Restrictive Covenant Agreement, adopted as of February 16, 2009, is incorporated by reference from Exhibit 10.4 to the Company’s Annual Report on Form 10-K for the fiscal year ended December 31, 2008.
|
|
|
10.14
|
The Company’s Supplemental Executive Retirement Plan, Amended and Restated as of October 2, 2007, is incorporated by reference from Exhibit 10.6 to the Company’s Annual Report on Form 10-K for the fiscal year ended December 31, 2007.
|
|
|
10.15
|
First Amendment to the Company’s Supplemental Executive Retirement Plan, Amended and Restated as of October 2, 2007, is incorporated by reference from Exhibit 10.5 to the Company’s Annual Report on
Form 10-K for the fiscal year ended December 31, 2008.
|
|
|
10.16
|
The Company’s Compensation Limit Replacement Plan, Amended and Restated as of January 1, 2009, is incorporated by reference from Exhibit 10.6 to the Company’s Annual Report on Form 10-K for the fiscal year ended December 31, 2008.
|
|
|
10.17
|
The Company’s Directors’ Compensation Plan, Amended and Restated as of December 2, 2008, is incorporated by reference from Exhibit 10.8 to the Company’s Annual Report on Form 10-K for the fiscal year ended December 31, 2008.
|
|
|
10.18
|
Form of Notice of Special Award of Restricted Stock Units is incorporated by reference from Exhibit 10.2 to the Company’s Current Report on Form 8-K, filed June 16, 2011.
|
|
|
10.19
|
Executive Employment Agreement with John P. Bilbrey, dated as of August 7, 2012, is incorporated by reference from Exhibit 10.1 to the Company's Quarterly Report on Form 10-Q for the quarter ended July 1, 2012.
|
|
|
10.20
|
Form of Notice of Award of Performance Stock Units is incorporated by reference from Exhibit 10.1 to the Company's Current Report on Form 8-K, filed February 24, 2012.
|
|
|
10.21
|
The Long-Term Incentive Program Participation Agreement is incorporated by reference from Exhibit 10.2 to the Company's Current Report on Form 8-K filed February 18, 2005.
|
|
|
Broad Based Equity Compensation Plans
|
||
|
10.22
|
The Company’s Broad Based Stock Option Plan, as amended, is incorporated by reference from Exhibit 10.4 to the Company’s Annual Report on Form 10-K for the fiscal year ended December 31, 2002.
|
|
|
Other Exhibits
|
||
|
12.1
|
Computation of ratio of earnings to fixed charges statement
|
|
|
A computation of ratio of earnings to fixed charges for the fiscal years ended December 31, 2012, 2011, 2010, 2009 and 2008 is attached hereto and filed as Exhibit 12.1.
|
||
|
21.1
|
Subsidiaries of the Registrant
|
|
|
A list setting forth subsidiaries of the Company is attached hereto and filed as Exhibit 21.1.
|
||
|
23.1
|
Independent Auditors' Consent
|
|
|
The consent dated February 22, 2013 to the incorporation of reports of the Company’s Independent Auditors is attached hereto and filed as Exhibit 23.1.
|
||
|
31.1
|
Certification of John P. Bilbrey, Chief Executive Officer, pursuant to Section 302 of the Sarbanes-Oxley Act of 2002, is attached hereto and filed as Exhibit 31.1.
|
|
|
31.2
|
Certification of Humberto P. Alfonso, Chief Financial Officer, pursuant to Section 302 of the Sarbanes-Oxley Act of 2002, is attached hereto and filed as Exhibit 31.2.
|
|
103
|
32.1
|
Certification of John P. Bilbrey, Chief Executive Officer, and Humberto P. Alfonso, Chief Financial Officer, pursuant to Section 906 of the Sarbanes-Oxley Act of 2002, is attached hereto and furnished as Exhibit 32.1.
|
|
|
101.INS
|
XBRL Instance Document
|
|
|
101.SCH
|
XBRL Taxonomy Extension Schema
|
|
|
101.CAL
|
XBRL Taxonomy Extension Calculation Linkbase
|
|
|
101.LAB
|
XBRL Taxonomy Extension Label Linkbase
|
|
|
101.PRE
|
XBRL Taxonomy Extension Presentation Linkbase
|
|
|
101.DEF
|
XBRL Taxonomy Extension Defintion Linkbase
|
|
104
SIGNATURES
Pursuant to the requirements of Section 13 or 15(d) of the Securities Exchange Act of 1934, the Company has duly caused this report to be signed on its behalf by the undersigned, thereunto duly authorized, this 22nd day of February, 2013.
|
THE HERSHEY COMPANY
|
||
|
(Regisrant)
|
||
|
By:
|
/S/ HUMBERTO P. ALFONSO
|
|
|
Humberto P. Alfonso
|
||
|
Chief Financial Officer
|
||
Pursuant to the requirements of the Securities Exchange Act of 1934, this report has been signed below by the following persons on behalf of the Company and in the capacities and on the date indicated.
|
Signature
|
Title
|
Date
|
||
|
/S/ JOHN P. BILBREY
|
Chief Executive Officer and Director
|
February 22, 2013
|
||
|
(John P. Bilbrey)
|
||||
|
/S/ HUMBERTO P. ALFONSO
|
Chief Financial Officer
|
February 22, 2013
|
||
|
(Humberto P. Alfonso)
|
||||
|
/S/ RICHARD M. MCCONVILLE
|
Chief Accounting Officer
|
February 22, 2013
|
||
|
(Richard M. McConville)
|
||||
|
/S/ PAMELA M. ARWAY
|
Director
|
February 22, 2013
|
||
|
(Pamela M. Arway)
|
||||
|
/S/ ROBERT F. CAVANAUGH
|
Director
|
February 22, 2013
|
||
|
(Robert F. Cavanaugh)
|
||||
|
/S/ CHARLES A. DAVIS
|
Director
|
February 22, 2013
|
||
|
(Charles A. Davis)
|
||||
|
/S/ ROBERT M. MALCOLM
|
Director
|
February 22, 2013
|
||
|
(Robert M. Malcolm)
|
||||
|
/S/ JAMES M. MEAD
|
Director
|
February 22, 2013
|
||
|
(James M. Mead)
|
||||
|
/S/ JAMES E. NEVELS
|
Director
|
February 22, 2013
|
||
|
(James E. Nevels)
|
||||
|
/S/ ANTHONY J. PALMER
|
Director
|
February 22, 2013
|
||
|
(Anthony J. Palmer)
|
||||
|
/S/ THOMAS J. RIDGE
|
Director
|
February 22, 2013
|
||
|
(Thomas J. Ridge)
|
||||
|
/S/ DAVID L. SHEDLARZ
|
Director
|
February 22, 2013
|
||
|
(David L. Shedlarz)
|
||||
105
Schedule II
THE HERSHEY COMPANY AND SUBSIDIARIES
SCHEDULE II—VALUATION AND QUALIFYING ACCOUNTS
For the Years Ended December 31, 2012, 2011 and 2010
|
Additions
|
||||||||||||||||||||
|
Description
|
Balance at
Beginning
of Period
|
Charged to
Costs and
Expenses
|
Charged
to Other Accounts |
Deductions
from Reserves |
Balance
at End
of Period
|
|||||||||||||||
|
In thousands of dollars
|
||||||||||||||||||||
|
Year Ended December 31, 2012:
Reserves deducted in the consolidated balance sheet from the assets to which they apply (a) |
||||||||||||||||||||
|
Accounts Receivable—Trade
|
$
|
14,977
|
|
$
|
134,972
|
|
$
|
—
|
|
$
|
(139,514
|
)
|
$
|
10,435
|
|
|||||
|
Year Ended December 31, 2011:
Reserves deducted in the consolidated balance sheet from the assets to which they apply (a) |
||||||||||||||||||||
|
Accounts Receivable—Trade
|
$
|
15,190
|
|
$
|
135,147
|
|
$
|
—
|
|
$
|
(135,360
|
)
|
$
|
14,977
|
|
|||||
|
Year Ended December 31, 2010:
Reserves deducted in the consolidated balance sheet from the assets to which they apply (a) |
||||||||||||||||||||
|
Accounts Receivable—Trade
|
$
|
15,721
|
|
$
|
128,377
|
|
$
|
—
|
|
$
|
(128,908
|
)
|
$
|
15,190
|
|
|||||
(a) Includes allowances for doubtful accounts and anticipated discounts.
106
CERTIFICATION
I, John P. Bilbrey, certify that:
|
1.
|
I have reviewed this Annual Report on Form 10-K of The Hershey Company;
|
|
2.
|
Based on my knowledge, this report does not contain any untrue statement of a material fact or omit to state a material fact necessary to make the statements made, in light of the circumstances under which such statements were made, not misleading with respect to the period covered by this report;
|
|
3.
|
Based on my knowledge, the financial statements, and other financial information included in this report, fairly present in all material respects the financial condition, results of operations and cash flows of the registrant as of, and for, the periods presented in this report;
|
|
4.
|
The registrant’s other certifying officer(s) and I are responsible for establishing and maintaining disclosure controls and procedures (as defined in Exchange Act Rules 13a-15(e) and 15d-15(e)) and internal control over financial reporting (as defined in Exchange Act Rules 13a-15(f) and 15d-15(f)) for the registrant and have:
|
|
(a)
|
Designed such disclosure controls and procedures, or caused such disclosure controls and procedures to be designed under our supervision, to ensure that material information relating to the registrant, including its consolidated subsidiaries, is made known to us by others within those entities, particularly during the period in which this report is being prepared;
|
|
(b)
|
Designed such internal control over financial reporting, or caused such internal control over financial reporting to be designed under our supervision, to provide reasonable assurance regarding the reliability of financial reporting and the preparation of financial statements for external purposes in accordance with generally accepted accounting principles;
|
|
(c)
|
Evaluated the effectiveness of the registrant’s disclosure controls and procedures and presented in this report our conclusions about the effectiveness of the disclosure controls and procedures, as of the end of the period covered by this report based on such evaluation; and
|
|
(d)
|
Disclosed in this report any change in the registrant’s internal control over financial reporting that occurred during the registrant’s most recent fiscal quarter (the registrant’s fourth fiscal quarter in the case of an annual report) that has materially affected, or is reasonably likely to materially affect, the registrant’s internal control over financial reporting; and
|
|
5.
|
The registrant’s other certifying officer(s) and I have disclosed, based on our most recent evaluation of internal control over financial reporting, to the registrant’s auditors and the audit committee of the registrant’s board of directors (or persons performing the equivalent functions):
|
|
(a)
|
All significant deficiencies and material weaknesses in the design or operation of internal control over financial reporting which are reasonably likely to adversely affect the registrant’s ability to record, process, summarize and report financial information; and
|
|
(b)
|
Any fraud, whether or not material, that involves management or other employees who have a significant role in the registrant’s internal control over financial reporting.
|
|
|
|
John P. Bilbrey
Chief Executive Officer
February 22, 2013
|
107
CERTIFICATION
I, Humberto P. Alfonso, certify that:
|
1.
|
I have reviewed this Annual Report on Form 10-K of The Hershey Company;
|
|
2.
|
Based on my knowledge, this report does not contain any untrue statement of a material fact or omit to state a material fact necessary to make the statements made, in light of the circumstances under which such statements were made, not misleading with respect to the period covered by this report;
|
|
3.
|
Based on my knowledge, the financial statements, and other financial information included in this report, fairly present in all material respects the financial condition, results of operations and cash flows of the registrant as of, and for, the periods presented in this report;
|
|
4.
|
The registrant’s other certifying officer(s) and I are responsible for establishing and maintaining disclosure controls and procedures (as defined in Exchange Act Rules 13a-15(e) and 15d-15(e)) and internal control over financial reporting (as defined in Exchange Act Rules 13a-15(f) and 15d-15(f)) for the registrant and have:
|
|
(a)
|
Designed such disclosure controls and procedures, or caused such disclosure controls and procedures to be designed under our supervision, to ensure that material information relating to the registrant, including its consolidated subsidiaries, is made known to us by others within those entities, particularly during the period in which this report is being prepared;
|
|
(b)
|
Designed such internal control over financial reporting, or caused such internal control over financial reporting to be designed under our supervision, to provide reasonable assurance regarding the reliability of financial reporting and the preparation of financial statements for external purposes in accordance with generally accepted accounting principles;
|
|
(c)
|
Evaluated the effectiveness of the registrant’s disclosure controls and procedures and presented in this report our conclusions about the effectiveness of the disclosure controls and procedures, as of the end of the period covered by this report based on such evaluation; and
|
|
(d)
|
Disclosed in this report any change in the registrant’s internal control over financial reporting that occurred during the registrant’s most recent fiscal quarter (the registrant’s fourth fiscal quarter in the case of an annual report) that has materially affected, or is reasonably likely to materially affect, the registrant’s internal control over financial reporting; and
|
|
5.
|
The registrant’s other certifying officer(s) and I have disclosed, based on our most recent evaluation of internal control over financial reporting, to the registrant’s auditors and the audit committee of the registrant’s board of directors (or persons performing the equivalent functions):
|
|
(a)
|
All significant deficiencies and material weaknesses in the design or operation of internal control over financial reporting which are reasonably likely to adversely affect the registrant’s ability to record, process, summarize and report financial information; and
|
|
(b)
|
Any fraud, whether or not material, that involves management or other employees who have a significant role in the registrant’s internal control over financial reporting.
|
|
|
|
Humberto P. Alfonso
Chief Financial Officer
February 22, 2013
|
108
TABLE OF CONTENTS
Part IItem 1. BusinessNote 1, Summary Of Significant Accounting PoliciesItem 1A. Risk FactorsItem 1B. Unresolved Staff CommentsItem 2. PropertiesItem 3. Legal ProceedingsItem 4. Mine Safety DisclosuresPart IIItem 5. Market For The Registrant S Common Equity, Related Stockholder Matters and Issuer Purchases Of Equity SecuritiesItem 6. Selected Financial DataItem 7. Management S Discussion and Analysis Of Financial Condition and Results Of OperationsNote 14, Pension and Other Post-retirement Benefit PlansNote 6, Derivative Instruments and Hedging ActivitiesItem 7A. Quantitative and Qualitative Disclosures About Market RiskItem 8. Financial Statements and Supplementary DataNote 18, Supplemental Balance Sheet InformationNote 9, Comprehensive IncomeNote 3, Business Realignment and Impairment ChargesNote 2, Business AcquisitionsItem 9. Changes in and Disagreements with Accountants on Accounting and Financial DisclosureItem 9A. Controls and ProceduresItem 9B. Other InformationPart IIIItem 10. Directors, Executive Officers and Corporate GovernanceItem 11. Executive CompensationItem 12. Security Ownership Of Certain Beneficial Owners and Management and Related Stockholder MattersNote 17, Stock Compensation PlansItem 13. Certain Relationships and Related Transactions, and Director IndependenceItem 14. Principal Accountant Fees and ServicesPart IVItem 15. Exhibits and Financial Statement SchedulesItem 15(a)(1): Financial StatementsItem 15(a)(2): Financial Statement ScheduleItem 15(a)(3): Exhibits