HERTZ GLOBAL HOLDINGS, INC
10-Ks and 10-Qs
|
|
|
|
|
|
|
|
|
|
|
|
|
|
|
|
|
|
|
|
|
|
|
|
|
|
|
|
|
|
|
|
|
|
|
|
|
|
|
|
|
|
|
|
|
|
|
|
|
|
|
|
|
|
|
|
|
|
|
|
|
|
|
|
|
|
|
|
|
|
|
|
|
|
|
|
|
|
|
|
|
|
|
|
|
|
|
|
|
|
|
|
|
|
|
|
|
|
|
|
|
|
|
|
|
|
|
|
|
|
|
|
|
|
|
|
|
|
|
|
|
|
|
|
|
|
|
|
|
|
|
|
|
|
|
|
|
|
|
|
|
|
|
|
|
UNITED STATES
SECURITIES AND EXCHANGE COMMISSION
WASHINGTON, D.C. 20549
_______________________________________________________________________________
FORM 10-K
|
x
|
ANNUAL REPORT PURSUANT TO SECTION 13 OR 15(d) OF THE SECURITIES EXCHANGE ACT OF 1934
|
|
For the fiscal year ended December 31, 2018
|
|
|
OR
|
|
|
o
|
TRANSITION REPORT PURSUANT TO SECTION 13 OR 15(d) OF THE SECURITIES EXCHANGE ACT OF 1934
|
HERTZ GLOBAL HOLDINGS, INC.
THE HERTZ CORPORATION
(Exact name of registrant as specified in its charter)
|
DELAWARE
|
001-37665
|
61-1770902
|
||
|
DELAWARE
|
001-07541
|
13-1938568
|
||
|
(State or other jurisdiction of
incorporation or organization)
|
(Commission File Number)
|
(I.R.S. Employer Identification No.)
|
||
|
8501 Williams Road
|
||||
|
Estero, Florida 33928
|
||||
|
(239) 301-7000
|
||||
|
(Address, including Zip Code, and telephone number, including area code, of registrant's principal executive offices)
|
||||
|
Securities registered pursuant to Section 12(b) of the Act:
|
||||
|
Title of each class
|
Name of each exchange on which registered
|
|||
|
Hertz Global Holdings, Inc.
|
Common Stock, Par Value $0.01 per share
|
New York Stock Exchange
|
||
|
The Hertz Corporation
|
None
|
None
|
||
|
Securities registered pursuant to Section 12(g) of the Act:
|
||||
|
Hertz Global Holdings, Inc.
|
None
|
None
|
||
|
The Hertz Corporation
|
None
|
None
|
||
Indicate by check mark if the registrant is a well-known seasoned issuer, as defined in Rule 405 of the Securities Act.
Hertz Global Holdings, Inc. Yes
o
No
x
The Hertz Corporation Yes
o
No
x
Indicate by check mark if the registrant is not required to file reports pursuant to Section 13 or Section 15(d) of the Act.
Hertz Global Holdings, Inc. Yes
o
No
x
The Hertz Corporation Yes
o
No
x
Indicate by check mark whether the registrant (1) has filed all reports required to be filed by Section 13 or 15(d) of the Securities Exchange Act of 1934 during the preceding 12 months (or for such shorter period that the Registrant was required to file such reports), and (2) has been subject to such filing requirements for the past 90 days.
Hertz Global Holdings, Inc. Yes
x
No
o
The Hertz Corporation Yes
x
No
o
Indicate by check mark whether the registrant has submitted electronically every Interactive Data File required to be submitted pursuant to Rule 405 of Regulation S-T (§232.405 of this chapter) during the preceding 12 months (or for such shorter period that the registrant was required to submit such files).
Hertz Global Holdings, Inc. Yes
x
No
o
The Hertz Corporation Yes
x
No
o
Indicate by check mark if disclosure of delinquent filers pursuant to Item 405 of Regulation S-K (§ 229.405 of this chapter) is not contained herein, and will not be contained, to the best of registrant’s knowledge, in definitive proxy or information statements incorporated by reference in Part III of this Form 10-K or any amendment to this Form 10-K.
Hertz Global Holdings, Inc.
o
The Hertz Corporation
o
Indicate by check mark whether the registrant is a large accelerated filer, an accelerated filer, a non-accelerated filer, a smaller reporting company, or an emerging growth company. See the definitions of "large accelerated filer," "accelerated filer", "smaller reporting company" and "emerging growth company" in Rule 12b-2 of the Exchange Act.
|
Hertz Global Holdings, Inc.
|
Large accelerated filer
|
x
|
Accelerated filer
|
o
|
Non-accelerated filer
|
o
|
|
Smaller reporting company
|
o
|
Emerging growth company
|
o
|
|||
|
If an emerging growth company, indicate by checkmark if the registrant has not elected not to use the extended transition period for complying with any new or revised financial accounting standards provided pursuant to Section 13(a) of the Exchange Act.
|
o
|
|||||
|
The Hertz Corporation
|
Large accelerated filer
|
o
|
Accelerated filer
|
o
|
Non-accelerated filer
|
x
|
|
Smaller reporting company
|
o
|
Emerging growth company
|
o
|
|||
|
If an emerging growth company, indicate by checkmark if the registrant has elected not to use the extended transition period for complying with any new or revised financial accounting standards provided pursuant to Section 13(a) of the Exchange Act.
|
o
|
|||||
Indicate by check mark whether the registrant is a shell company (as defined in Rule 12b-2 of the Exchange Act).
Hertz Global Holdings, Inc. Yes
o
No
x
The Hertz Corporation Yes
o
No
x
The aggregate market value of the voting and non-voting common equity held by non-affiliates of Hertz Global Holdings, Inc. as of
June 29, 2018
, the last business day of the most recently completed second fiscal quarter, based on the closing price of the stock on the New York Stock Exchange on such date was
$838 million
. There is no market for The Hertz Corporation stock.
Indicate the number of shares outstanding as of the latest practicable date.
|
Class
|
Shares Outstanding as of
|
February 18, 2019
|
|||
|
Hertz Global Holdings, Inc.
|
Common Stock, par value $0.01 per share
|
83,923,665
|
|||
|
The Hertz Corporation
|
Common Stock, par value $0.01 per share
|
100 (100% owned by
Rental Car Intermediate Holdings, LLC)
|
|||
OMISSION OF CERTAIN INFORMATION
The Hertz Corporation meets the conditions as set forth in General Instructions I.(1)(a) and (b) of Form 10-K and is therefore filing this Form with the reduced disclosure format as permitted.
DOCUMENTS INCORPORATED BY REFERENCE
|
Hertz Global Holdings, Inc.
|
Information required by Items 10, 11, 12 and 13 of Part III of this Form 10-K are incorporated by reference for Hertz Global Holdings, Inc. from its definitive proxy statement for its 2019 Annual Meeting of Stockholders.
|
|
|
The Hertz Corporation
|
None
|
|
HERTZ GLOBAL HOLDINGS, INC. AND SUBSIDIARIES
THE HERTZ CORPORATION AND SUBSIDIARIES
TABLE OF CONTENTS
|
Page
|
||
|
ITEM 1.
|
||
|
ITEM 1A.
|
||
|
ITEM 1B.
|
||
|
ITEM 2.
|
||
|
ITEM 3.
|
||
|
ITEM 5.
|
||
|
ITEM 6.
|
||
|
ITEM 7.
|
||
|
ITEM 7A.
|
||
|
ITEM 8.
|
||
|
ITEM 9.
|
||
|
ITEM 9A.
|
||
|
ITEM 9B.
|
||
|
ITEM 10.
|
||
|
ITEM 11.
|
||
|
ITEM 12.
|
||
|
ITEM 13.
|
||
|
ITEM 14.
|
||
|
ITEM 15.
|
||
HERTZ GLOBAL HOLDINGS, INC. AND SUBSIDIARIES
THE HERTZ CORPORATION AND SUBSIDIARIES
GLOSSARY OF TERMS
Unless the context otherwise requires in this Annual Report on Form 10-K for the year ended
December 31, 2018
we use the following defined terms:
|
(i)
|
"
2018
Annual Report" or "Combined Form 10-K" means this Annual Report on Form 10-K for the year ended
December 31, 2018
, which combines the annual reports for Hertz Global Holdings, Inc. and The Hertz Corporation into a single filing;
|
|
(ii)
|
"All Other Operations" means the reportable segment comprised primarily of the Company's Donlen business and the Company's other business activities which comprise less than 1% of revenues and expenses of the segment;
|
|
(iii)
|
"the Code" means the Internal Revenue Code of 1986, as amended;
|
|
(iv)
|
"the Company", "we", "our" and "us" mean Hertz Global and Hertz interchangeably;
|
|
(v)
|
"company-operated" or "company-owned" rental locations are those through which we, or an agent of ours, rent vehicles that we own or lease;
|
|
(vi)
|
"concessions" mean licensing or permitting agreements or arrangements granting us the right to conduct our vehicle rental business at airports;
|
|
(vii)
|
"Corporate" means corporate operations, which include general corporate assets and expenses and certain interest expense (including net interest on non-vehicle debt);
|
|
(viii)
|
"Dollar Thrifty" means Dollar Thrifty Automotive Group, Inc., a consolidated subsidiary of the Company;
|
|
(ix)
|
"Donlen" means Donlen Corporation, a consolidated subsidiary of the Company. Donlen conducts our vehicle leasing and fleet management services;
|
|
(x)
|
"Hertz Gold Plus Rewards" means our customer loyalty program and our global expedited rental program;
|
|
(xi)
|
"Hertz" means The Hertz Corporation, its consolidated subsidiaries and variable interest entities, our primary operating company and a direct wholly-owned subsidiary of Rental Car Intermediate Holdings, LLC, which is wholly-owned by Hertz Holdings;
|
|
(xii)
|
"Hertz Global" means Hertz Global Holdings, Inc., our top-level holding company (and the accounting successor to Old Hertz Holdings), its consolidated subsidiaries and variable interest entities, including The Hertz Corporation;
|
|
(xiii)
|
"Hertz Ultimate Choice" is an offering at select airport locations in the U.S. that allows customers to choose their vehicle from a range of makes, models and colors available within the zone indicated on their reservation;
|
|
(xiv)
|
"Hertz Holdings" refers to Hertz Global Holdings, Inc. excluding its subsidiaries;
|
|
(xv)
|
"International RAC" means the international rental car reportable segment;
|
|
(xvi)
|
"Letter of Credit Facility" means the standalone $400 million letter of credit facility that the Company entered into in 2017 as further described in
Note 7
, "
Debt
," to the Notes to our consolidated financial statements under the caption Item 8, "Financial Statements and Supplementary Data” included in this
2018
Annual Report;
|
|
(xvii)
|
"New Hertz" means Hertz Global Holdings, Inc., subsequent to the June 30, 2016 Spin-Off;
|
i
HERTZ GLOBAL HOLDINGS, INC. AND SUBSIDIARIES
THE HERTZ CORPORATION AND SUBSIDIARIES
|
(xviii)
|
“non-program vehicles” means vehicles not purchased under repurchase or guaranteed depreciation programs for which we are exposed to residual risk;
|
|
(xix)
|
"Old Hertz Holdings" for periods on or prior to June 30, 2016, and "Herc Holdings" for periods after June 30, 2016, refer to the former Hertz Global Holdings, Inc.;
|
|
(xx)
|
"program vehicles" means vehicles purchased under repurchase or guaranteed depreciation programs with vehicle manufacturers;
|
|
(xxi)
|
"replacement renters" means renters who need vehicles while their vehicle is being repaired or is temporarily unavailable for other reasons;
|
|
(xxii)
|
"SEC" means the United States Securities and Exchange Commission;
|
|
(xxiii)
|
"Senior Facilities" means the Company's senior secured term facility and senior secured revolving credit facility as further described in
Note 7
, "
Debt
," to the Notes to our consolidated financial statements under the caption Item 8, "Financial Statements and Supplementary Data” included in this
2018
Annual Report;
|
|
(xxiv)
|
"Spin-Off" means the spin-off by Old Hertz Holdings of its global vehicle rental business through a dividend to stockholders of record of Old Hertz Holdings as of the close of business on June 22, 2016, the record date for the distribution, of all of the issued and outstanding shares of common stock of Hertz Rental Car Holding Company, Inc., which was re-named Hertz Global Holdings, Inc. in connection with the Spin-Off, on a one-to-five basis. As a result of the Spin-Off, each of Hertz Holdings and Herc Holdings are independent public companies trading on the New York Stock Exchange, with Hertz Holdings trading under the symbol "HTZ" and Herc Holdings, which changed its name to Herc Holdings Inc. on June 30, 2016, trading under the symbol “HRI”;
|
|
(xxv)
|
"Tax Reform" means legislation signed into law on December 22, 2017 which amends the U.S. Internal Revenue Code to reduce tax rates and modify policies, credits, and deductions for individuals and businesses, commonly known as the "Tax Cuts and Jobs Act";
|
|
(xxvi)
|
"TNC" means transportation network companies that provide ride-hailing services that pair passengers with drivers via websites and mobile applications;
|
|
(xxvii)
|
"TNC Partners" means certain transportation network companies where we provide rental vehicles to their drivers under agreements that specify the relevant terms;
|
|
(xxviii)
|
"U.S." means the United States of America;
|
|
(xxix)
|
"U.S. RAC" means the U.S. rental car reportable segment;
|
|
(xxx)
|
"Vehicle Utilization" means the portion of our vehicles that are being utilized to generate revenue; and
|
|
(xxxi)
|
"vehicles” means cars, vans, crossovers and light trucks.
|
We have proprietary rights to a number of trademarks used in this
2018
Annual Report that are important to our business, including, without limitation, Hertz, Dollar, Thrifty, Donlen, Carfirmations, Hertz Gold Plus Rewards, Hertz Ultimate Choice and Hertz 24/7. Solely for convenience, we have omitted the ® and ™ trademark designations for such trademarks named in this
2018
Annual Report, but such references should not be construed as any indicator that their respective owners will not assert, to the fullest extent under applicable law, their rights thereto.
ii
HERTZ GLOBAL HOLDINGS, INC. AND SUBSIDIARIES
THE HERTZ CORPORATION AND SUBSIDIARIES
EXPLANATORY NOTE
COMBINED FORM 10-K
This
2018
Annual Report combines the annual reports on Form 10-K for the year ended
December 31, 2018
of Hertz Global and Hertz.
Hertz Global owns all shares of the common stock of Hertz through its wholly-owned subsidiary, Rental Car Intermediate Holdings, LLC.
Below are diagrams depicting the basic organizational structure of Hertz Global Holdings, Inc. and The Hertz Corporation before and subsequent to the Spin-Off:
Prior to the internal reorganization and the Spin-Off
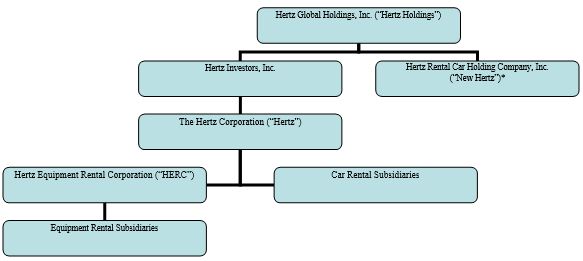
*Prior to the internal reorganization and the Spin-Off, New Hertz conducted no operations.
Following the internal reorganization and the Spin-Off
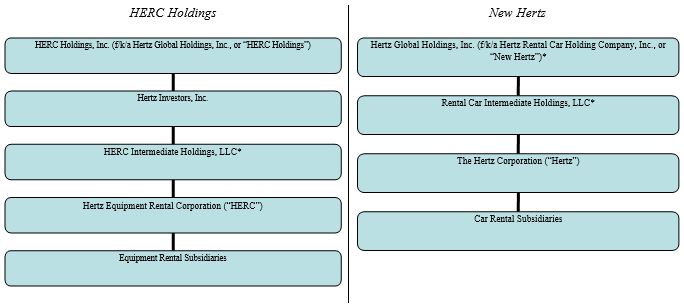
*Entities formed for purposes of effecting the internal reorganization and the Spin-Off completed on June 30, 2016.
iii
HERTZ GLOBAL HOLDINGS, INC. AND SUBSIDIARIES
THE HERTZ CORPORATION AND SUBSIDIARIES
EXPLANATORY NOTE (Continued)
Management operates Hertz Global and Hertz as one enterprise. The management of Hertz Global consists of the same members as the management of Hertz. These individuals are officers of Hertz Global and Hertz and employees of Hertz. The individuals that comprise Hertz Global's board of directors are also the same individuals that make up Hertz's board of directors.
We believe combining the annual reports on Form 10-K of Hertz Global and Hertz into this single report results in the following benefits:
|
•
|
enhancing investors' understanding of Hertz Global and Hertz by enabling investors to view the business as a whole in the same manner as management views and operates the business;
|
|
•
|
eliminating duplicative disclosure and providing a more streamlined and readable presentation since a substantial portion of the disclosures apply to both Hertz Global and Hertz; and
|
|
•
|
creating time and cost efficiencies through the preparation of one combined annual report instead of two separate annual reports.
|
Hertz holds all of the revenue earning vehicles, property, plant and equipment and all other assets, including the ownership interests in consolidated and unconsolidated joint ventures. Hertz conducts the operations of the business and is structured as a corporation with no publicly traded equity. Except for net proceeds from public equity issuances by Hertz Global, which are contributed to Hertz, Hertz generates required capital through its operations or through its incurrence of indebtedness.
Hertz Global does not conduct business itself, other than issuing public equity or debt obligations from time to time, and incurring expenses required to operate as a public company. Hertz Global and Hertz have entered into a master loan agreement whereby Hertz Global may borrow from Hertz up to
$425 million
. Transactions recorded under the master loan agreement are eliminated upon consolidation at the Hertz Global level but not upon consolidation at the Hertz level. Differences between the financial statements of Hertz Global and Hertz are limited to the activity described above and the remaining assets, liabilities, revenues and expenses of Hertz Global and Hertz are the same on their respective financial statements.
Although Hertz is generally the entity that enters into contracts and holds assets and debt, Hertz Global consolidates Hertz for financial statement purposes, therefore, disclosures that relate to activities of Hertz also apply to Hertz Global. In the sections that combine disclosures of Hertz Global and Hertz, this report refers to actions as being actions of the Company, or Hertz Global, which is appropriate because the business is one enterprise and Hertz Global operates the business through Hertz. When appropriate, Hertz Global and Hertz are named specifically for their individual disclosures and any significant differences between the operations and results of Hertz Global and Hertz are separately disclosed and explained.
This report also includes separate Exhibit 31 and 32 certifications for each of Hertz Global and Hertz in order to establish that the Chief Executive Officer and the Chief Financial Officer of each entity have made the requisite certifications and that Hertz Global and Hertz are compliant with Rule 13a-15 or Rule 15d-15 of the Securities Exchange Act of 1934 and 18 U.S.C. §1350.
This Combined Form 10-K is separately filed by Hertz Global Holdings, Inc. and The Hertz Corporation. Each registrant hereto is filing on its own behalf all of the information contained in this
2018
Annual Report that relates to such registrant. Each registrant hereto is not filing any information that does not relate to such registrant, and therefore makes no representation as to any such information.
DISCONTINUED OPERATIONS
On June 30, 2016, Old Hertz Holdings completed the Spin-Off. Despite the fact that this was a reverse spin off and Hertz Global was spun off from Old Hertz Holdings and was the legal spinnee in the transaction, for accounting purposes, due to the relative significance of New Hertz to Old Hertz Holdings, Hertz Global is considered the spinnor or divesting entity and Herc Holdings is considered the spinnee or divested entity. As a result, New Hertz, or Hertz Global, is the
iv
HERTZ GLOBAL HOLDINGS, INC. AND SUBSIDIARIES
THE HERTZ CORPORATION AND SUBSIDIARIES
EXPLANATORY NOTE (Continued)
“accounting successor” to Old Hertz Holdings. As such, the historical financial information of Hertz prior to the Spin-Off reflects the equipment rental business as a discontinued operation and the historical financial information of Hertz Global reflects the equipment rental business and certain parent legal entities as discontinued operations. See
Note 3
, "
Discontinued Operations
," to the Notes to our consolidated financial statements under the caption Item 8, "Financial Statements and Supplementary Data.”
Unless noted otherwise, information disclosed for 2016 in this
2018
Annual Report pertain to Hertz Global's and Hertz's continuing operations.
v
HERTZ GLOBAL HOLDINGS, INC. AND SUBSIDIARIES
THE HERTZ CORPORATION AND SUBSIDIARIES
CAUTIONARY NOTE REGARDING FORWARD-LOOKING STATEMENTS
Certain statements contained or incorporated by reference in this
2018
Annual Report and in reports we subsequently file with the SEC on Forms 10-K and 10-Q and file or furnish on Form 8-K, and in related comments by our management, include "forward-looking statements." Forward-looking statements include information concerning our liquidity and our possible or assumed future results of operations, including descriptions of our business strategies. These statements often include words such as "believe," "expect," "project," "potential," "anticipate," "intend," "plan," "estimate," "seek," "will," "may," "would," "should," "could," "forecasts" or similar expressions. These statements are based on certain assumptions that we have made in light of our experience in the industry as well as our perceptions of historical trends, current conditions, expected future developments and other factors we believe are appropriate in these circumstances. We believe these judgments are reasonable, but you should understand that these statements are not guarantees of performance or results, and our actual results could differ materially from those expressed in the forward-looking statements due to a variety of important factors, both positive and negative, that may be revised or supplemented in subsequent reports on Forms 10-K, 10-Q and 8-K.
Important factors that could affect our actual results and cause them to differ materially from those expressed in forward-looking statements include, among others, those that may be disclosed from time to time in subsequent reports filed with the SEC, those described under “Risk Factors” set forth in Item 1A of this
2018
Annual Report, and the following, which were derived in part from the risks set forth in Item 1A of this
2018
Annual Report:
|
•
|
levels of travel demand, particularly with respect to airline passenger traffic in the United States and in global markets;
|
|
•
|
the effect of our separation of our vehicle and equipment rental businesses, any failure by Herc Holdings Inc. to comply with the agreements entered into in connection with the separation and our ability to obtain the expected benefits of the separation;
|
|
•
|
significant changes in the competitive environment and the effect of competition in our markets on rental volume and pricing, including on our pricing policies or use of incentives;
|
|
•
|
occurrences that disrupt rental activity during our peak periods;
|
|
•
|
our ability to accurately estimate future levels of rental activity and adjust the number and mix of vehicles used in our rental operations accordingly;
|
|
•
|
increased vehicle costs due to declines in the value of our non-program vehicles;
|
|
•
|
our ability to maintain sufficient liquidity and the availability to us of additional or continued sources of financing for our revenue earning vehicles and to refinance our existing indebtedness;
|
|
•
|
our ability to purchase adequate supplies of competitively priced vehicles and risks relating to increases in the cost of the vehicles we purchase;
|
|
•
|
our ability to adequately respond to changes in technology and customer demands;
|
|
•
|
our ability to retain customer loyalty and market share;
|
|
•
|
our recognition of previously deferred tax gains on the disposition of revenue earning vehicles;
|
|
•
|
an increase in our vehicle costs or disruption to our rental activity, particularly during our peak periods, due to safety recalls by the manufacturers of our vehicles;
|
|
•
|
our access to third-party distribution channels and related prices, commission structures and transaction volumes;
|
|
•
|
our ability to execute a business continuity plan;
|
|
•
|
a major disruption in our communication or centralized information networks;
|
|
•
|
a failure to maintain, upgrade and consolidate our information technology networks;
|
|
•
|
financial instability of the manufacturers of our vehicles;
|
vi
HERTZ GLOBAL HOLDINGS, INC. AND SUBSIDIARIES
THE HERTZ CORPORATION AND SUBSIDIARIES
CAUTIONARY NOTE REGARDING FORWARD LOOKING STATEMENTS (Continued)
|
•
|
any impact on us from the actions of our franchisees, dealers and independent contractors;
|
|
•
|
our ability to sustain operations during adverse economic cycles and unfavorable external events (including war, terrorist acts, natural disasters and epidemic disease);
|
|
•
|
shortages of fuel and increases or volatility in fuel costs;
|
|
•
|
our ability to maintain favorable brand recognition and a coordinated branding and portfolio strategy;
|
|
•
|
our ability to maintain an effective employee retention and talent management strategy and resulting changes in personnel and employee relations;
|
|
•
|
costs and risks associated with litigation and investigations;
|
|
•
|
risks related to our indebtedness, including our substantial amount of debt, our ability to incur substantially more debt, the fact that substantially all of our consolidated assets secure certain of our outstanding indebtedness and increases in interest rates or in our borrowing margins;
|
|
•
|
our ability to meet the financial and other covenants contained in our senior credit facilities and letter of credit facility, our outstanding unsecured senior notes, our outstanding senior second priority secured notes and certain asset-backed and asset-based arrangements;
|
|
•
|
changes in accounting principles, or their application or interpretation, and our ability to make accurate estimates and the assumptions underlying the estimates, which could have an effect on operating results;
|
|
•
|
risks associated with operating in many different countries, including the risk of a violation or alleged violation of applicable anticorruption or antibribery laws and our ability to repatriate cash from non-U.S. affiliates without adverse tax consequences;
|
|
•
|
our ability to prevent the misuse or theft of information we possess, including as a result of cyber security breaches and other security threats;
|
|
•
|
changes in the existing, or the adoption of new laws, regulations, policies or other activities of governments, agencies and similar organizations, such as the adoption of new regulations under the Tax Cuts and Jobs Act, where such actions may affect our operations, the cost thereof or applicable tax rates;
|
|
•
|
risks relating to our deferred tax assets, including the risk of an "ownership change" under the Code;
|
|
•
|
our exposure to uninsured claims in excess of historical levels;
|
|
•
|
fluctuations in interest rates and commodity prices;
|
|
•
|
our exposure to fluctuations in foreign currency exchange rates; and
|
|
•
|
other risks and uncertainties described from time to time in periodic and current reports that we file with the SEC.
|
You should not place undue reliance on forward-looking statements. All forward-looking statements attributable to us or persons acting on our behalf are expressly qualified in their entirety by the foregoing cautionary statements. All such statements speak only as of the date made, and we undertake no obligation to update or revise publicly any forward-looking statements, whether as a result of new information, future events or otherwise.
vii
HERTZ GLOBAL HOLDINGS, INC. AND SUBSIDIARIES
THE HERTZ CORPORATION AND SUBSIDIARIES
PART I
ITEM 1. BUSINESS
OUR COMPANY
Hertz Holdings was incorporated in Delaware in 2015 to serve as the top-level holding company for Rental Car Intermediate Holdings, LLC, which wholly owns Hertz, our primary operating company. Hertz was incorporated in Delaware in 1967 and is a successor to corporations that have been engaged in the vehicle rental and leasing business since 1918.
We operate our vehicle rental business globally primarily through the Hertz, Dollar and Thrifty brands from approximately
10,200
corporate and franchisee locations in North America, Europe, Latin America, Africa, Asia, Australia, the Caribbean, the Middle East and New Zealand. We are one of the largest worldwide vehicle rental companies and our Hertz brand name is one of the most recognized globally, signifying leadership in quality rental services and products. We have an extensive network of airport and off airport rental locations in the U.S. and in all major European markets. We are also a provider of integrated vehicle leasing and fleet management solutions through our Donlen subsidiary.
OUR BUSINESS SEGMENTS
We have identified three reportable segments, which are organized based on the products and services provided by our operating segments and the geographic areas in which our operating segments conduct business, as follows:
|
•
|
U.S. RAC - Rental of vehicles, as well as sales of value-added services, in the U.S. We maintain a substantial network of company-operated rental locations in the U.S., enabling us to provide consistent quality and service. We also have franchisees and partners that operate rental locations under our brands throughout the U.S;
|
|
•
|
International RAC - Rental and leasing of vehicles, as well as sales of value-added services, internationally. We maintain a substantial network of company-operated rental locations internationally, a majority of which are in Europe. Our franchisees and partners also operate rental locations in approximately
150
countries and jurisdictions, including many of the countries in which we also have company-operated rental locations; and
|
|
•
|
All Other Operations - Primarily comprised of our Donlen business, which provides integrated vehicle leasing and fleet management solutions in the U.S. and Canada. Donlen is a provider of these services for commercial fleets and Donlen's fleet management programs provide solutions to reduce fleet operating costs and improve driver productivity and safety. These programs include administration of preventive vehicle maintenance, advisory services and fuel and accident management along with other complementary services. Additionally, Donlen provides specialized consulting and technology expertise that allows us and our customers to model, measure and manage fleet performance more effectively and efficiently. Also included are our other business activities which comprise less than 1% of revenues and expenses of the segment.
|
In addition to the above reportable segments, we have Corporate operations. We assess performance and allocate resources based upon the financial information for our operating segments.
For further financial information on our segments, see (i) Item 7, "Management's Discussion and Analysis of Financial Condition and Results of Operations—Results of Operations and Selected Operating Data by Segment" and (ii)
Note 19
, "
Segment Information
," to the Notes to our consolidated financial statements under the caption Item 8, "Financial Statements and Supplementary Data” included in this
2018
Annual Report.
1
HERTZ GLOBAL HOLDINGS, INC. AND SUBSIDIARIES
THE HERTZ CORPORATION AND SUBSIDIARIES
ITEM 1. BUSINESS (Continued)
U.S. and International Rental Car Segments
Brands

Our U.S. and International vehicle rental businesses are primarily operated through three brands - Hertz, Dollar, and Thrifty. We offer multiple brands in order to provide customers a full range of rental services at different price points, levels of service, offerings and products. Each of our brands generally maintains separate airport counters, reservations, marketing and other customer contact activities. We achieve synergies across our brands by, among other things, utilizing a single fleet and fleet management team and combined vehicle maintenance, vehicle cleaning and back office functions, where applicable.
Our top tier brand, Hertz, is one of the most recognized brands in the world, offering premium services that define the industry. This is consistent with numerous published best-in-class vehicle rental awards that we have won, both in the U.S. and internationally, over many years. We go to market under the tagline of “Hertz. We’re here to get you there” which is true to our promise and reputation for quality and customer service. We have a number of innovative offerings, such as Hertz Gold Plus Rewards, Hertz Ultimate Choice and unique vehicles offered through our specialty collections. We continue to maintain our position as a premier provider of vehicle rental services through an intense focus on service, loyalty, quality and product innovation.
Our smart value brand, Dollar, is the choice for financially-focused travelers looking for a dependable car at a price they can afford. The Dollar brand’s main focus is serving the airport vehicle rental market, comprised of family, leisure and small business travelers. Dollar’s tagline of “We never forget whose dollar it is” indicates the brand’s mission to provide a reliable rental experience at a price that works. Dollar operates primarily through company-owned locations in the U.S. and Canada. We also globally license to independent franchisees which operate as a part of the Dollar brand system and have company-owned Dollar locations in certain countries.
Our deep value brand, Thrifty, is the brand for savvy travelers who enjoy the “thrill of the hunt” to find a good deal. The Thrifty brand’s main focus is serving the airport vehicle rental market, comprised of leisure travelers. Thrifty’s tagline “As Thrifty As You Are” indicates the brand’s focus on being the rental company that puts you in control of where you splurge and where you save. Thrifty operates primarily through company-owned locations in the U.S. and Canada. We also globally license to independent franchisees which operate as part of the Thrifty brand system and have company-owned Thrifty locations in certain countries.
Internationally, we also offer our Firefly brand which is a deep value brand for price conscious leisure travelers. We have Firefly locations servicing local area airports in select international leisure markets where other deep value brands have a significant presence.
Operations
Locations
We operate both airport and off airport locations which utilize common vehicle fleets, are supervised by common country, regional and local area management, use many common systems and rely on common vehicle maintenance and administrative centers. Additionally, our airport and off airport locations utilize common marketing activities and have many of the same customers. We regard both types of locations as aspects of a single, unitary, vehicle rental business. Off airport revenues comprised approximately 34% of our worldwide vehicle rental revenues in
2018
and approximately 33% in
2017
.
2
HERTZ GLOBAL HOLDINGS, INC. AND SUBSIDIARIES
THE HERTZ CORPORATION AND SUBSIDIARIES
ITEM 1. BUSINESS (Continued)
Airport
We have approximately
1,600
airport rental locations in the U.S. and approximately
1,500
airport rental locations internationally. Our international vehicle rental operations have company-operated locations in Australia, Belgium, Canada, the Czech Republic, France, Germany, Italy, Luxembourg, the Netherlands, New Zealand, Puerto Rico, Slovakia, Spain, the United Kingdom and the U.S. Virgin Islands. We believe that our extensive U.S. and international network of company-operated locations contributes to the consistency of our service, cost control, Vehicle Utilization, yield management, competitive pricing and our ability to offer one-way rentals.
For our airport company-operated rental locations, we have obtained concessions or similar leasing agreements or arrangements, granting us the right to conduct a vehicle rental business at the respective airport. Our concessions were obtained from the airports' operators, which are typically governmental bodies or authorities, following either negotiation or bidding for the right to operate a vehicle rental business. The terms of an airport concession typically require us to pay the airport's operator concession fees based upon a specified percentage of the revenues we generate at the airport, subject to a minimum annual guarantee. Under most concessions, we must also pay fixed rent for terminal counters or other leased properties and facilities. Most concessions are for a fixed length of time, while others create operating rights and payment obligations that are terminable at any time.
The terms of our concessions typically do not forbid us from seeking, and in a few instances actually require us to seek, reimbursement from customers for concession fees we pay; however, in certain jurisdictions the law limits or forbids our doing so. Where we are required or permitted to seek such reimbursement, it is our general practice to do so. Certain of our concession agreements may require the consent of the airport's operator in connection with material changes in our ownership. A growing number of larger airports are building consolidated airport vehicle rental facilities to alleviate congestion at the airport. These consolidated rental facilities provide a more common customer experience and may eliminate certain competitive advantages among the brands as competitors operate out of one centralized facility for both customer rental and return operations, share consolidated busing operations and maintain image standards mandated by the airports. See Item 1A, "Risk Factors” in this
2018
Annual Report.
Off Airport
We have approximately
2,600
off airport locations in the U.S. and approximately
4,500
off airport rental locations internationally. Our off airport rental customers include people who prefer to rent vehicles closer to their home or place of work for business or leisure purposes, as well as those needing to travel to or from airports. Our off airport customers also include people who have been referred by, or whose rental costs are being wholly or partially reimbursed by, insurance companies following accidents in which their vehicles were damaged, those expecting to lease vehicles that are not yet available from their leasing companies and replacement renters. In addition, our off airport customers include drivers for our TNC partners, which is further described in “TNC Rentals” below.
When compared to our airport rental locations, an off airport rental location typically uses smaller rental facilities with fewer employees, conducts pick-up and delivery services and serves replacement renters using specialized systems and processes. On average, off airport locations generate fewer transactions per period than airport locations.
Our off airport locations offer us the following benefits:
|
•
|
Provide customers a more convenient and geographically extensive network of rental locations, thereby creating revenue opportunities from replacement renters, non-airline travel renters and airline travelers with local rental needs;
|
|
•
|
Provide a more balanced revenue mix by reducing our reliance on air travel and therefore reducing our exposure to external events that may disrupt airline travel trends;
|
|
•
|
Contribute to higher Vehicle Utilization as a result of the longer average rental periods associated with off airport business, compared to those of airport rentals;
|
3
HERTZ GLOBAL HOLDINGS, INC. AND SUBSIDIARIES
THE HERTZ CORPORATION AND SUBSIDIARIES
ITEM 1. BUSINESS (Continued)
|
•
|
Insurance replacement rental volume is less seasonal than that of other business and leisure rentals, which permits efficiencies in both vehicle and labor planning; and
|
|
•
|
Cross-selling opportunities exist for us to promote off airport rentals among frequent airport Hertz Gold Plus Rewards program renters and, conversely, to promote airport rentals to off airport renters.
|
Customers and Business Mix
We conduct active sales and marketing programs to attract and retain customers. Our sales force calls on companies and other organizations whose employees and associates need to rent vehicles for business purposes. In addition, our sales force works with membership associations, tour operators, travel companies and other groups whose members, participants and customers rent vehicles for either business or leisure purposes. Our specialized sales force calls on companies with replacement rental needs, including insurance and leasing companies, automobile repair companies and vehicle dealers. We also advertise our vehicle rental offerings through a variety of traditional media channels, such as partner publications, direct mail and digital marketing. In addition to advertising, we conduct a variety of other forms of marketing and promotion, including travel industry business partnerships and press and public relations activities.
We categorize our vehicle rental business based on the purpose and type of location from which customers rent from us. The following charts set forth the percentages of rental revenues and rental transactions in our U.S. and international operations based on these categories.
VEHICLE RENTALS BY CUSTOMER
Year Ended December 31, 2018
U.S.


|
Business
|
||
|
Leisure
|
||
4
HERTZ GLOBAL HOLDINGS, INC. AND SUBSIDIARIES
THE HERTZ CORPORATION AND SUBSIDIARIES
ITEM 1. BUSINESS (Continued)
VEHICLE RENTALS BY CUSTOMER (Continued)
Year Ended December 31, 2018
International


|
Business
|
||
|
Leisure
|
||
Customers who rent from us for “business” purposes include those who require vehicles in connection with commercial activities, including drivers for our TNC Partners, the activities of governments and other organizations or for temporary vehicle replacement purposes. Most business customers rent vehicles from us on terms that we have negotiated with their employers or other entities with which they are associated, and those terms can differ substantially from the terms on which we rent vehicles to the general public. We have negotiated arrangements relating to vehicle rental with many businesses, governments and other organizations, including most Fortune 500 companies.
Customers who rent from us for “leisure” purposes include not only individual travelers booking vacation travel rentals with us but also people renting to meet other personal needs. Leisure rentals, generally, are longer in duration and generate more revenue per transaction than business rentals. Leisure rentals also include rentals by customers of U.S. and international tour operators, which are usually a part of tour packages that can include air travel and hotel accommodations.
VEHICLE RENTALS BY LOCATION
Year Ended December 31, 2018
U.S.


|
Airport
|
||
|
Off airport
|
||
5
HERTZ GLOBAL HOLDINGS, INC. AND SUBSIDIARIES
THE HERTZ CORPORATION AND SUBSIDIARIES
ITEM 1. BUSINESS (Continued)
VEHICLE RENTALS BY LOCATION (Continued)
Year Ended December 31, 2018
International


|
Airport
|
||
|
Off airport
|
||
Demand for airport rentals is correlated with airline travel patterns, and transaction volumes generally follow airline passenger traffic ("enplanement") and Gross Domestic Product ("GDP") trends on a global basis. Customers often make reservations for airport rentals when they book their flight plans, which make our strong relationships with travel agents, associations and other partners (e.g., airlines) a key competitive strategy in generating consistent and recurring revenue streams.
Off airport rentals include insurance replacements, therefore, we have established agreements with the referring insurers establishing the relevant rental terms, including the arrangements made for billing and payment. We have identified 188 insurance companies, ranging from local or regional vehicle carriers to large, national companies, as our target insurance replacement market. As of
December 31, 2018
, we were a preferred or recognized supplier for 124 of these insurance companies and a co-primary for 39 of them.
Customer Service Offerings
At our major airport rental locations, as well as at some smaller airport and off airport locations, customers participating in our Hertz Gold Plus Rewards program are able to rent vehicles in an expedited manner. Participants in our Hertz Gold Plus Rewards program often bypass the rental counter entirely and proceed directly to their vehicle upon arrival at our facility. Participants in our Hertz Gold Plus Rewards program are also eligible to earn Hertz Gold Plus Rewards points that may be redeemed for free rental days or converted to awards of other companies' loyalty programs. Hertz's Gold Plus Rewards program offers two elite membership tiers which provide more frequent renters the opportunity to earn additional rewards points and vehicle upgrades. For the year ended
December 31, 2018
, rentals by Hertz Gold Plus Rewards members accounted for approximately 35% of our worldwide rental transactions. We believe the Hertz Gold Plus Rewards program provides a significant competitive advantage to us, particularly among frequent travelers, and we have targeted such travelers for participation in the program. We offer electronic rental agreements and returns for our Hertz, Dollar and Thrifty customers in the U.S. Simplifying the rental transaction saves customers time and provides greater convenience through access to digitally available rental contracts.
Our Hertz Ultimate Choice program allows customers to choose their vehicle from a range of makes, models and colors available within the zone indicated on their reservation, or they may upgrade at pick-up for a fee by choosing a vehicle from the Premium Upgrade zone. Also, when Hertz Gold Plus Rewards members make a reservation for a midsize car or above, they have access to exclusive vehicles based on their membership tier. The Hertz Ultimate Choice program is offered at 59 U.S. airport locations as of
December 31, 2018
.
We also offer a Mobile Gold Alerts service, known as Carfirmations, through which an SMS text message and/or email is sent with the vehicle information and location, with the option to choose another vehicle from their smart phone prior to arrival. It is available to participating Hertz Gold Plus Rewards customers approximately 30 minutes prior to their
6
HERTZ GLOBAL HOLDINGS, INC. AND SUBSIDIARIES
THE HERTZ CORPORATION AND SUBSIDIARIES
ITEM 1. BUSINESS (Continued)
arrival. We also offer Hertz e-Return, which allows customers to drop off their vehicle and go at the time of rental return. Additionally, in select locations customers can bypass the rental line through our ExpressRent Kiosks, and customers can use cashless toll lanes with our PlatePass offering where the license plate acts as a transponder.
TNC Rentals
We have partnered with certain companies in the TNC market in the U.S. to offer vehicle rentals to their drivers. Our participation in this market has more than doubled in 2018 and we now offer rentals to TNC drivers in approximately 90 locations in select U.S. cities across 18 states. During
2018
, we dedicated approximately 30,000 average vehicles for use by our TNC Partners. TNC rentals provide for an additional selection of higher mileage, and thus more economical used vehicles in our retail sales outlets. Drivers for our TNC Partners reserve vehicles online through TNC Partner websites and pick up vehicles from select locations. TNC drivers can extend the vehicle rental on a weekly basis.
Hertz 24/7
We offer a car and van-sharing membership service, referred to as Hertz 24/7, which rents vehicles by the hour and/or by the day, at various locations internationally, primarily in Europe and in Australia under the Flexicar brand. Members reserve vehicles online, then pick up the vehicles at convenient locations using keyless entry, without the need to visit a Hertz rental office. Members are charged an hourly or daily vehicle-rental fee which includes fuel, insurance, 24/7 roadside assistance and in-vehicle customer service. Hertz 24/7 specializes in Business-to-Business-to-Consumer (B2B2C) services working with retail partners to provide vans at their locations, and with corporations providing pool fleets for use by their employees.
Rates
We rent a wide variety of makes and models of vehicles. We rent vehicles on an hourly (in select International markets), daily, weekend, weekly, monthly or multi-month basis, with rental charges computed on a limited or unlimited mileage rate, or on a time rate plus a mileage charge. Our rates vary by brand and at different locations depending on local market conditions and other competitive and cost factors. While vehicles are usually returned to the locations from which they are rented, we also allow one-way rentals from and to certain locations. In addition to vehicle rentals and franchise fees, we generate revenues from reimbursements by customers of airport concession fees, unless the law limits or forbids us from doing so, and vehicle licensing costs, fueling charges, and charges for value-added services such as supplemental equipment (e.g., child seats and ski racks), loss or collision damage waiver, theft protection, liability and personal accident/effects insurance coverage, premium emergency roadside service and satellite radio.
Reservations
We price and accept reservations for our vehicles on a brand-by-brand basis. Reservations are generally for a class of vehicles, although Hertz accepts reservations for specific makes and models of vehicles in our Premium, Prestige and specialty collections.
We distribute pricing and content and accept reservations via multiple channels. Direct reservations are accepted at Hertz.com, which has global and local versions in multiple languages. Hertz.com offers a range of products, prices and additional services as well as Hertz Gold Plus Rewards benefits, serving both company-operated and franchise locations. In addition to our website, direct reservations are enabled via our smartphone app, which includes additional connected products and services.
Customers may also seek reservations via travel agents or third-party travel websites. In many of those cases, the travel agent or website will utilize an Application Programming Interface (“API”) connection to Hertz or a third-party operated computerized reservation system, also known as a Global Distribution System (“GDS”) to contact us and make the reservation.
In major countries, including the U.S. and all other countries with company-operated locations, customers may also reserve vehicles for rental from us and our franchisees worldwide through local, national or toll-free telephone calls to
7
HERTZ GLOBAL HOLDINGS, INC. AND SUBSIDIARIES
THE HERTZ CORPORATION AND SUBSIDIARIES
ITEM 1. BUSINESS (Continued)
our reservations center, directly through our rental locations or, in the case of replacement rentals, through proprietary automated systems serving the insurance industry.
Franchisees
In certain U.S. and international markets, we have found it efficient to issue licenses under franchise arrangements to independent franchisees who are engaged in the vehicle rental business, to rent vehicles that they own or lease to customers, primarily under our Hertz, Dollar or Thrifty brand. In certain markets and under certain circumstances, franchisees are given the opportunity to acquire franchises for multiple brands.
Franchisees generally pay fees based on a percentage of their revenues and in return are provided the use of the applicable brand name, certain operational support and training, reservations through our reservation channels, and other services. Franchisee arrangements enable us to offer expanded national and international service and a broader one-way rental program. In addition to vehicle rental, certain international franchisees engage in vehicle leasing, and the rental of chauffeur-driven vehicles, camper vans and motorcycles.
Franchisees ordinarily are limited as to transferability without our consent and are generally terminable by us only for cause or after a fixed term. Many of these agreements also include a right of first refusal on the part of the Company should a franchisee receive a bona fide offer to sell. Franchisees in the U.S. typically may terminate on prior notice, generally between 90 and 180 days. In Europe and certain other international jurisdictions, franchisees typically do not have early termination rights. Initial license fees or the price for the sale to a franchisee of a company-owned location may be payable over a term of several years. We continue to issue new licenses and, from time to time, purchase franchised businesses.
Franchise operations, including the purchase and ownership of vehicles, are generally financed independently by the franchisees, and we do not have an investment interest in the franchisees. Fees from franchisees, including initial franchise fees, are used to, among other things, generally support the cost of our brand awareness programs, reservations system, sales and marketing efforts and certain other services and are approximately 2% of our worldwide vehicle rental revenues each period.
Seasonality
Our vehicle rental operations are a seasonal business, with decreased levels of business in the winter months and heightened activity during spring and summer peak ("our peak season") for the majority of countries where we generate our revenues. To accommodate increased demand, we increase our available fleet and staff during the second and third quarters of the year. As business demand declines, vehicles and staff are decreased accordingly. Certain operating expenses, including real estate taxes, rent, insurance, utilities, facility-related expenses, the costs of operating our information technology systems and minimum staffing costs, remain fixed and cannot be adjusted for seasonal demand.
The following chart sets forth this seasonal effect of our vehicle rental operations by presenting quarterly revenues for each of the years ended
December 31, 2018, 2017 and 2016
.

8
HERTZ GLOBAL HOLDINGS, INC. AND SUBSIDIARIES
THE HERTZ CORPORATION AND SUBSIDIARIES
ITEM 1. BUSINESS (Continued)
Fleet
During the year ended
December 31, 2018
, we operated a peak rental fleet in the U.S. and International segments of approximately 535,100 vehicles and 207,100 vehicles, respectively. Purchases of vehicles are financed by active and ongoing global borrowing programs and through cash from operations. The vehicles we purchase are either program vehicles or non-program vehicles. We periodically review the efficiencies of an optimal mix between program and non-program vehicles in our fleet and adjust the ratio of program and non-program vehicles as needed based on contract negotiations, vehicle economics and availability. During the year ended
December 31, 2018
, our approximate average holding period for a rental vehicle was 17 months in the U.S. and 14 months in our international operations.
Our fleet composition is as follows:
Fleet Composition by Vehicle Manufacturer
As of December 31, 2018

U.S.
International*


*Vehicle manufacturers Groupe PSA (Peugeot and Citroen), Volvo, Volkswagen Group (Volkswagen, Skoda, Audi and Seat), Daimler AG (Mercedes Benz) and BMW together comprise another 25% of the international fleet and are included as "Other" in the overall and international charts above.
9
HERTZ GLOBAL HOLDINGS, INC. AND SUBSIDIARIES
THE HERTZ CORPORATION AND SUBSIDIARIES
ITEM 1. BUSINESS (Continued)
We maintain vehicle maintenance centers at or near certain airports and in certain urban and off airport areas, which provide maintenance for our fleet. Many of these facilities include sophisticated vehicle diagnostic and repair equipment and are accepted by automobile manufacturers as eligible to perform and receive reimbursement for warranty work. Collision damage and major repairs are generally performed by independent contractors.
Repurchase Programs
For program vehicles, the manufacturers agree to repurchase vehicles at a specified price or guarantee the depreciation rate on the vehicles during established repurchase or auction periods, subject to, among other things, certain vehicle condition, mileage and holding period requirements. Repurchase prices under repurchase programs are based on the original cost less a set daily depreciation amount. Guaranteed depreciation programs guarantee on an aggregate basis the residual value of the vehicles covered by the programs upon sale according to certain parameters which include the holding period, mileage and condition of the vehicles. These repurchase and guaranteed depreciation programs limit our residual risk with respect to vehicles purchased under the programs and allow us to reduce the variability of depreciation expense for each vehicle, however, typically the acquisition cost is higher. Program vehicles generally provide us with flexibility to increase or reduce the size of our fleet based on market demand. When we increase the percentage of program vehicles, the average age of our fleet decreases since the average holding period for program vehicles is shorter than for non-program vehicles.
Program vehicles as a percentage of all vehicles purchased within each of our U.S. and International vehicle rental segments were as follows:

Hertz Car Sales and Rent2Buy
Hertz Car Sales consists of a network of 80 company-operated vehicle sales locations throughout the U.S. dedicated to the sale of used vehicles from our rental fleet consisting of non-program vehicles, as well as program vehicles that become ineligible for manufacturer repurchase or guaranteed depreciation programs. Vehicles disposed of through our retail outlets allow us the opportunity for ancillary vehicle sales revenue, such as warranty and financing and title fees.
10
HERTZ GLOBAL HOLDINGS, INC. AND SUBSIDIARIES
THE HERTZ CORPORATION AND SUBSIDIARIES
ITEM 1. BUSINESS (Continued)
We also offer Rent2Buy in 35 states and several European countries, an innovative program designed to sell used rental vehicles. Customers have an opportunity to rent a vehicle from our rental fleet and if the customer purchases the vehicle, he or she is credited with a portion of their rental charges. The purchase transaction is completed through the internet and by mail in those states where permitted.
We also dispose of vehicles through non-retail disposition channels such as auctions, brokered sales, sales to wholesalers and sales to dealers.
During the year ended
December 31, 2018
, of the vehicles sold in our U.S. vehicle rental operations that were not repurchased by manufacturers, we sold approximately 24% at auction, 40% through dealer direct and 36% at retail locations or through our Rent2Buy program. During the year ended
December 31, 2018
, of the vehicles sold in our international vehicle rental operations that were not repurchased by manufacturers, we sold approximately 8% at auction, 83% through dealer direct and 9% at retail locations or through our Rent2Buy program.
Markets and Competition
Competition among vehicle rental industry participants is intense and is primarily based on price, vehicle availability and quality, service, reliability, rental locations, product innovation and competition from online travel agents and vehicle rental brokers. We believe that the prominence and service reputation of the Hertz, Dollar and Thrifty brands, our extensive worldwide ownership of vehicle rental operations and our commitment to innovation and service provide us with a strong competitive advantage.
U.S.
The U.S. represents approximately $30 billion in estimated annual industry revenues for
2018
. The average number of vehicles in the U.S. vehicle rental industry increased 1% in
2018
to about 2.2 million vehicles. U.S. industry Revenue Per Unit Per Month was approximately $1,131 which was an improvement of 3.7% over 2017. Rentals by airline travelers at or near airports (‘‘airport rentals’’) are influenced by developments in the travel industry and particularly in enplanements as well as the GDP. Off airport rental volume is primarily driven by local business use, such as vehicle repair shops, leisure travel and insurance replacements.
Our principal vehicle rental industry competitors in the U.S. are Avis Budget Group, Inc. (“ABG”) which currently operates the Avis, Budget, ZipCar and Payless brands, and Enterprise Holdings, which operates the Enterprise Rent-A-Car Company ("Enterprise"), National Car Rental and Alamo Rent A Car brands. There are also local and regional vehicle rental companies and transportation network companies which provide ride-hailing services that have some overlap in customer use cases, largely with respect to short length trips in urban areas.
Europe
Europe represents approximately $18 billion in annual industry revenues. Europe has generally demonstrated a lower historical reliance on air travel. The European off airport vehicle rental market has been significantly more developed than it is in the U.S. Within Europe, the largest markets in which we do business are France, Germany, Italy, Spain, and the United Kingdom. Throughout Europe, we do business through company-operated rental locations as well as through our partners or franchisees to whom we have licensed use of our brands.
Our principal pan-European competitors in the vehicle rental industry are Europcar Mobility Services, operating the Europcar, Interrent, Goldcar and Ubeeqo brands; ABG operating the Avis, Budget, Payless and Zipcar brands, and the Maggiore brand in Italy; Sixt SE; and, Enterprise Holdings, operating the Enterprise, Alamo and National brands, and the Dooley brand in Ireland. Each European country includes numerous other regional and local operators serving both leisure and commercial customers.
Asia Pacific
Asia Pacific, which includes Australia and New Zealand, represents approximately $17 billion in annual industry revenues. Within this region, the largest markets in which we do business are Australia, China, Japan and South Korea.
11
HERTZ GLOBAL HOLDINGS, INC. AND SUBSIDIARIES
THE HERTZ CORPORATION AND SUBSIDIARIES
ITEM 1. BUSINESS (Continued)
In each of these markets we have company-operated rental locations or do business through our partners or franchisees to whom we have licensed use of our brands.
Our principal vehicle rental industry competitors in the Asia Pacific market place are ABG, operating the Avis, Budget, Apex and Zipcar brands, Europcar, and Enterprise Holdings, operating the Enterprise, National and Alamo brands and the Redspot brand in Australia and New Zealand.
Middle East and Africa
The Middle East and Africa represent approximately $4 billion in annual industry revenues. Within these regions, the largest markets in which we do business are Saudi Arabia, South Africa and the United Arab Emirates. In each of these markets we do business through our franchisees to whom we have licensed use of our brands.
Our principal vehicle rental industry competitors in the Middle East market are ABG, operating the Avis, Budget, Payless and Zipcar brands, Europcar, Enterprise Holdings, operating the Enterprise, National and Alamo brands, and Sixt SE, operating the Sixt brand.
Latin America
The Latin America markets represent approximately $4 billion in annual industry revenues. Within Latin America the largest markets in which we do business are Argentina, Brazil, Chile and Mexico. In each of these markets our Hertz, Dollar and Thrifty brands are present through our partners or franchisees to whom we have licensed use of the respective brand.
In Latin America, the principal vehicle rental industry competitors are ABG, operating the Avis, Budget and Payless brands, and Enterprise Holdings, which operates the Enterprise, National and Alamo brands. Other key players in the region are Localiza, JSL, operating the Movida brand, and Soluçônes Automôvel Globais, operating the Unidas brand.
In 2017, we completed the sale of Car Rental Systems do Brasil Locação de Veiculos Ltd., our wholly owned subsidiary located in Brazil (the "Brazil Operations"), to Localiza Fleet S.A. (“Localiza”). As part of the sale, both companies entered into referral and brand cooperation agreements to govern their ongoing relationship which have an initial term of twenty years with an option to extend for another twenty years. The alliance also involves the exchange of knowledge in areas of technology, customer service and operational excellence.
All Other Operations
Through our Donlen subsidiary, we provide integrated fleet leasing and fleet management solutions for commercial fleets. Our All Other Operations segment generated
$748 million
in revenues during the year ended
December 31, 2018
, substantially all of which was attributable to Donlen.
Donlen

Donlen provides an array of vehicle leasing, financing, telematics, and fleet management services to commercial fleets in the U.S. and Canada. Products offered by Donlen include:
|
•
|
Vehicle financing, acquisition and remarketing;
|
|
•
|
License, title and registration;
|
|
•
|
Vehicle maintenance consultation;
|
|
•
|
Fuel management;
|
|
•
|
Accident management;
|
12
HERTZ GLOBAL HOLDINGS, INC. AND SUBSIDIARIES
THE HERTZ CORPORATION AND SUBSIDIARIES
ITEM 1. BUSINESS (Continued)
|
•
|
Toll management;
|
|
•
|
Telematics-based location, driver performance and scorecard reporting; and
|
|
•
|
Lease financing.
|
Donlen’s leased fleet consists primarily of passenger vehicles, cargo vans and light trucks. Vehicles are acquired directly from domestic and foreign manufacturers, as well as dealers. As of
December 31, 2018
, approximately half of Donlen’s leased fleet is
2017
model year or newer.
Donlen’s primary product for vehicle and light to medium truck fleets is an open-ended terminal rental adjustment clause ("TRAC") lease. For most customers, the vehicle must be leased for a minimum of twelve months, after which the lease converts to a month-to-month lease allowing the vehicle to be surrendered any time thereafter. Our sale of the vehicle following the termination of the lease may result in a TRAC adjustment, through which the customer is credited or charged with the surplus or loss on the vehicle. Approximately 80% of Donlen’s lease portfolio consists of floating-rate leases which allow lease charges to be adjusted based on benchmark indices.
Donlen offers financing solutions for heavier-duty trucks and equipment. Lease financing is provided through syndication arrangements with lending institutions. Donlen originates the leases, acquires the assets, and services the lease throughout the term.
Donlen provides services to leased and non-leased fleets consisting of fuel purchasing and management, preventive vehicle maintenance, repair consultation, toll management and accident management. Additionally, Donlen manages license and title, vehicle registration, and regulatory compliance. Donlen’s telematics products provide enhanced visibility and reporting over driver and vehicle performance.
The commercial fleet market is one of the largest segments of the U.S. automotive industry, primarily consisting of vehicles utilized in a sales, service, or delivery application. The fleet management industry has experienced significant consolidation over the years and today our principal fleet management competitors in the U.S. and Canada are Enterprise, Automotive Resources International, Element Financial Corporation, Wheels, Inc. and LeasePlan Corporation N.V.
EMPLOYEES
As of
December 31, 2018
, we employed approximately
38,000
persons, consisting of approximately
29,000
persons in our U.S. operations and approximately
9,000
persons in our international operations. International employees are covered by a wide variety of union contracts and governmental regulations affecting, among other things, compensation, job retention rights and pensions. Labor contracts covering the terms of employment of approximately
26%
of our workforce in the U.S. (including those in the U.S. territories) are presently in effect under active contracts with local unions, affiliated primarily with the International Brotherhood of Teamsters and the International Association of Machinists. Labor contracts covering almost 20% of these employees will expire during
2019
. We have had no material work stoppage as a result of labor problems during the last ten years, and we believe our labor relations to be good. Nevertheless, we may be unable to negotiate new labor contracts on terms advantageous to us, or without labor interruption.
In addition to the employees referred to above, we engage outside services, as is customary in the industry, principally for the non-revenue movement of rental vehicles between rental locations.
CORPORATE RESPONSIBILITY
We believe that managing our businesses ethically and responsibly is critical to our success as well as the right thing to do. As such, we are committed to continuous improvement that encourages sustainable innovation and enhances our business performance in three key areas: People, Planet and Product.
13
HERTZ GLOBAL HOLDINGS, INC. AND SUBSIDIARIES
THE HERTZ CORPORATION AND SUBSIDIARIES
ITEM 1. BUSINESS (Continued)
Our People and Customers
Our employees help drive our progress, innovation and success. As a global company, we have a responsibility to ensure our people are taken care of and thrive in their environment. We are growing our business in a way that is inclusive and supportive to all. Attracting and retaining top talent is more than a measure of our business success; it’s a measure of who we are and what we value.
Diversity
We foster a diverse and inclusive work environment. Maintaining this diversity begins with a firm commitment to equal opportunity, non-discrimination and anti-harassment. In addition, we adhere to all relevant laws and mandatory reporting requirements.
Employee Benefits
We offer competitive pay and a comprehensive benefits package to permanent employees, including medical and dental plans, paid leave, retirement plans with company contributions and life insurance coverage. In addition, we provide free health screenings and wellness coaching. Our employees also enjoy discounts on car rentals and used car purchases.
Communities
We believe community involvement is critical to operating as a responsible business and we have a long-standing commitment to our communities. That’s why we are committed to creating stronger, healthier places to live and work, whether through corporate philanthropy, employee giving or volunteerism.
The Environment
We are committed to reducing the impact our operations have on the environment and the communities we operate in through sustainable business practices, strategic decision-making, community partnerships and smart investments in future technologies.
Waste Reduction and Recycling
We work to integrate environmental sustainability across our operations, from our car washes to the way we build our rental locations. Resource conservation and waste reduction is at the forefront of that integration. We are committed to waste reduction across our global footprint. Recycling efforts include, but are not limited to, recycling used oils and solvents, tires, batteries, IT equipment, and general mixed materials.
Green Construction
We incorporate sustainable design and construction practices across the company, based on Leadership in Energy and Environmental Design ("LEED") standards. LEED is a green building rating system administered by the U.S. Green Building Council. Following LEED standards ensures our rental and corporate locations are built in an environmentally sustainable manner, including our world headquarters in Estero, Florida, which is LEED Gold
®
. These standards also aim to enhance the health and comfort of building occupants, improve overall building performance and deliver cost savings.
Fuel Efficient Fleet
We partner with our corporate customers to create personalized green travel programs aimed at reducing carbon emissions and fuel costs associated with their vehicle rentals. Additionally, we offer customization of green fleet goals to help our corporate customers reduce fuel costs and expand their employees’ use of alternative-fuel vehicles. We work to make sustainable mobility a viable, global reality by providing customers and communities with access to fuel-efficient, low-emission and alternative-fuel travel solutions.
14
HERTZ GLOBAL HOLDINGS, INC. AND SUBSIDIARIES
THE HERTZ CORPORATION AND SUBSIDIARIES
ITEM 1. BUSINESS (Continued)
Our Business
Ethics
We are committed to operating in compliance with all applicable laws and maintaining the highest standards of ethical conduct. Our expectations may be high, but they are clear. Integrity is essential to every aspect of our business, both in policy and practice. Our Standards of Business Conduct informs when we should ask for further direction to support a policy or procedure and provides information, guidance and references covering a range of topics.
Supplier Diversity
Our objective is to provide certified small, disadvantaged, minority, and women-owned business enterprises with the opportunity to compete to deliver products and services that support our brands. We are a member of the National Minority Supplier Development Council and many of its local affiliate councils throughout the U.S. In support of our extensive presence at airports, we are also members of the Airport Minority Advisory Council.
Data Protection
Hertz is committed to operating in compliance with all applicable privacy and data security laws. We have standards and policies in place to ensure the proper handling, use and storage of customer and employee information, including privacy protection, maintenance of data integrity and security. In addition, our employees participate in mandatory training and ongoing engagement that ensures our entire team is on the same page regarding compliance with our policies and practices.
Our most recent Corporate Responsibility Report is available on our internet website (www.hertz.com).
INSURANCE AND RISK MANAGEMENT
There are three types of generally insurable risks that arise in our operations:
|
•
|
legal liability arising from the operation of our vehicles (i.e., vehicle liability);
|
|
•
|
legal liability to members of the public and employees from other causes (i.e., general liability/workers' compensation); and
|
|
•
|
risk of property damage and/or business interruption and/or increased cost of operating as a consequence of property damage.
|
In addition, we offer optional liability insurance and other products providing insurance coverage, which create additional risk exposures for us. Our risk of property damage is also increased when we waive the provisions in our rental contracts that hold a renter responsible for damage or loss under an optional loss or damage waiver that we offer. We bear these and other risks, except to the extent the risks are transferred through insurance or contractual arrangements.
In many cases we self-insure our risks or insure risks through wholly-owned insurance subsidiaries. We mitigate our exposure to large liability losses by maintaining excess insurance coverage, subject to deductibles and caps, through unaffiliated carriers. For our international operations outside of Europe, and for our long-term vehicle leasing operations, we maintain some liability insurance coverage with unaffiliated carriers.
Third-Party Liability
In our U.S. operations, we are required by applicable financial responsibility laws to maintain insurance against legal liability for bodily injury (including death) or property damage to third parties arising from the operation of our vehicles and on-road equipment, sometimes called “vehicle liability,” in stipulated amounts. In most jurisdictions, we satisfy those requirements by qualifying as a self-insurer, a process that typically involves governmental filings and demonstration of financial responsibility, which sometimes requires the posting of a bond or other security. In the remaining jurisdictions, we obtain an insurance policy from an unaffiliated insurance carrier and indemnify the carrier for any amounts paid under the policy. As a result of such arrangements, we bear economic responsibility for U.S.
15
HERTZ GLOBAL HOLDINGS, INC. AND SUBSIDIARIES
THE HERTZ CORPORATION AND SUBSIDIARIES
ITEM 1. BUSINESS (Continued)
vehicle liability, except to the extent we successfully transfer such liability to others through insurance or contractual arrangements.
For our vehicle rental operations in Europe, we have established a wholly-owned insurance subsidiary, Probus Insurance Company Europe Limited (“Probus”), a direct writer of insurance domiciled in Ireland. In European countries with company-operated locations, we have purchased from Probus the vehicle liability insurance required by law, and Probus reinsures the risks under such insurance with HIRE Bermuda Limited, a wholly-owned reinsurance company domiciled in Bermuda. This coverage is purchased from unaffiliated carriers for Spain and Italy. Accordingly, as with our U.S. operations, we bear economic responsibility for vehicle liability in our European vehicle rental operations, except to the extent that we transfer such liability to others through insurance or contractual arrangements. For our international operations outside of Europe, we maintain some form of vehicle liability insurance coverage with unaffiliated carriers. The nature of such coverage, and our economic responsibility for covered losses, varies considerably. Nonetheless, we believe the amounts and nature of the coverage we obtain is adequate in light of the respective potential hazards.
In our U.S. and international operations, from time to time in the course of our business, we become legally responsible to members of the public for bodily injury (including death) or property damage arising from causes other than the operation of our vehicles, sometimes known as “general liability.” As with vehicle liability, we bear economic responsibility for general liability losses, except to the extent we transfer such losses to others through insurance or contractual arrangements. In addition, to mitigate these exposures, we maintain excess liability insurance coverage with unaffiliated insurance carriers.
In our U.S. vehicle rental operations, we offer an optional liability insurance product, Liability Insurance Supplement (“LIS”) that provides vehicle liability insurance coverage substantially higher than state minimum levels to the renter and other authorized operators of a rented vehicle. LIS coverage is primarily provided under excess liability insurance policies issued by an unaffiliated insurance carrier, the risks under which are reinsured with a wholly-owned subsidiary, HIRE Bermuda Limited.
In our U.S. vehicle rental operations and our company-operated international vehicle rental operations in many countries, we offer optional products providing Personal Accident Insurance / Personal Effects Coverage (“PAI/PEC”) and Emergency Sickness Protection ("ESP") insurance coverage to the renter and the renter's immediate family members traveling with the renter for accidental death or accidental medical expenses arising during the rental period or for damage or loss of their property during the rental period. PAI/PEC and ESP coverage is provided under insurance policies issued by unaffiliated carriers or, in Europe, by Probus, and the risks under such policies either are reinsured with HIRE Bermuda Limited or are the subject of indemnification arrangements between us and the carriers.
Our offering of LIS, PAI/PEC and ESP coverage in our U.S. vehicle rental operations is conducted pursuant to limited licenses or exemptions under state laws governing the licensing of insurance producers.
Provisions on our books for self-insured public liability and property damage vehicle liability losses are made by charges to expense based upon evaluations of estimated ultimate liabilities on reported and unreported claims.
Damage to Our Property
We bear the risk of damage to our property, unless such risk is transferred through insurance or contractual arrangements.
To mitigate our risk of large, single-site property damage losses globally, we maintain property insurance with unaffiliated insurance carriers in such amounts as we deem adequate in light of the respective hazards, where such insurance is available on commercially reasonable terms.
Our rental contracts typically provide that the renter is responsible for damage to or loss (including loss through theft) of rented vehicles. We generally offer an optional rental product, known in various countries as “loss damage waiver,” “collision damage waiver” or “theft protection,” under which we waive or limit our right to make a claim for such damage or loss.
16
HERTZ GLOBAL HOLDINGS, INC. AND SUBSIDIARIES
THE HERTZ CORPORATION AND SUBSIDIARIES
ITEM 1. BUSINESS (Continued)
Collision damage costs and the costs of stolen or unaccounted-for vehicles, along with other damage to our property, are charged to expense as incurred, net of reimbursements.
Other Risks
To manage other risks associated with our businesses, or to comply with applicable law, we purchase other types of insurance carried by business organizations, such as worker's compensation and employer's liability, commercial crime and fidelity, performance bonds, directors' and officers' liability insurance and cyber security coverage from unaffiliated insurance companies in amounts deemed by us to be adequate in light of the respective hazards, where such coverage is obtainable on commercially reasonable terms.
GOVERNMENT REGULATION AND ENVIRONMENTAL MATTERS
Throughout the world, we are subject to numerous types of governmental controls, including those relating to prices and advertising, privacy and data protection, currency controls, labor matters, credit and charge card operations, insurance, environmental protection, used vehicle sales and licensing.
Environmental
We are subject to extensive federal, state, local, and foreign environmental and safety laws, regulations, directives, rules and ordinances concerning, among other things, the operation and maintenance of vehicles; the ownership and operation of tanks for the storage of petroleum products, including gasoline, diesel fuel and oil; and the generation, storage, transportation and disposal of waste materials, including oil, vehicle wash sludge and waste water.
When applicable, we estimate and accrue for costs, among other things, to study potential environmental issues at sites deemed to require investigation or clean-up activities, and for costs to implement remediation actions, including ongoing maintenance, as required. Based on information currently available, we believe that the ultimate resolution of existing environmental remediation actions and our compliance in general with environmental laws and regulations will not have a material effect on our operating results or financial condition. However, it is difficult to predict with certainty the potential impact of future compliance efforts and environmental remedial actions and thus future costs associated with such matters may exceed the amount of the estimated accrued amount.
Dealings with Renters
In the U.S., vehicle rental transactions are generally subject to Article 2A of the Uniform Commercial Code, which governs “leases” of tangible personal property. Vehicle rental is also specifically regulated in more than half of the states of the U.S. and many other international jurisdictions. The subjects of these regulations include the methods by which we advertise, quote and charge prices, the consequences of failing to honor reservations, the terms on which we deal with vehicle loss or damage (including the protections we provide to renters purchasing loss or damage waivers) and the terms and method of sale of the optional insurance coverage that we offer. Some states (including California, Nevada and New York) regulate the price at which we may sell loss or damage waivers, and many state insurance regulators have authority over the prices and terms of the optional insurance coverage we offer. See “Insurance and Risk Management-Damage to Our Property” above for further discussion regarding the loss or damage waivers and optional insurance coverages that we offer renters. In addition, various consumer protection laws and regulations may generally apply to our business operations. Internationally, regulatory regimes vary greatly by jurisdiction, but they do not generally prevent us from dealing with customers in a manner similar to that employed in the U.S.
Both in the U.S. and internationally, we are subject to increasing regulation relating to customer privacy and data protection. In general, we are limited in the uses to which we may put data that we collect about renters, including the circumstances in which we may communicate with them. In addition, we are generally obligated to take reasonable steps to protect customer data while it is in our possession. Our failure to do so could subject us to substantial legal liability, require us to bear significant remediation costs, or seriously damage our reputation.
17
HERTZ GLOBAL HOLDINGS, INC. AND SUBSIDIARIES
THE HERTZ CORPORATION AND SUBSIDIARIES
ITEM 1. BUSINESS (Continued)
Changes in Regulation
Changes in government regulation of our businesses have the potential to materially alter our business practices, or our profitability. Depending on the jurisdiction, those changes may come about through new legislation, the issuance of new laws and regulations or changes in the interpretation of existing laws, regulations and treaties by a court, regulatory body or governmental official. Those changes may have prospective and/or retroactive effect, particularly when a change is made through reinterpretation of laws or regulations that have been in effect for some time. Moreover, changes in regulation that may seem neutral on their face may have a more significant effect on us than on our competitors, depending on the circumstances. Several U.S. State Attorneys General have taken the position that vehicle rental companies either may not pass through costs and fees to customers, by means of separate charges, expenses such as vehicle licensing and concession fees or may do so only in certain limited circumstances. Recent or potential changes in law or regulation that affect us relate to insurance intermediaries, customer privacy, like-kind exchange programs, data security and rate regulation and our retail vehicle sales operations.
In addition, our operations, as well as those of our competitors, could also be affected by any limitation in the fuel supply or by any imposition of mandatory allocation or rationing regulations. We are not aware of any current proposal to impose such a regime in the U.S. or internationally. Such a regime could, however, be quickly imposed if there was a serious disruption in supply for any reason, including an act of war, terrorist incident or other problem affecting petroleum supply, refining, distribution or pricing.
AVAILABLE INFORMATION
You may access, free of charge, Hertz Global and Hertz's reports filed with the SEC (including the Annual Report on Form 10-K, Quarterly Reports on Form 10-Q and Current Reports on Form 8-K and any amendments to those forms) directly through the SEC or indirectly through our internet website (www.hertz.com). Reports filed with or furnished to the SEC will be available as soon as reasonably practicable after they are filed with or furnished to the SEC. The information found on our website is not part of this or any other report filed with or furnished to the SEC.
ITEM 1A. RISK FACTORS
Our business is subject to a number of significant risks and uncertainties, some of which are described below and should be carefully considered along with all of the information in this
2018
Annual Report. These risks and uncertainties, however, are not the only risks and uncertainties that we face in our operations. Additional risks and uncertainties not currently known to us or that we currently deem to be immaterial may also materially and adversely affect our business, results of operations, financial condition, liquidity and cash flows. In such a case, you may lose all or part of your investment in Hertz Global's common stock or The Hertz Corporation's debt securities. You should carefully consider each of the following risks and uncertainties. Any of the following risks and uncertainties could materially and adversely affect our business, financial condition, operating results or cash flow and we believe that the following information identifies the material risks and uncertainties affecting Hertz Global and Hertz; however, the following risks and uncertainties are not the only risks and uncertainties facing us and it is possible that other risks and uncertainties might significantly impact us.
RISKS RELATED TO OUR BUSINESS AND INDUSTRY
Our vehicle rental business is particularly sensitive to reductions in the levels of airline passenger travel, and reductions in air travel could materially adversely affect our results of operations, financial condition, liquidity and cash flows.
The vehicle rental industry is particularly affected by reductions in business and leisure travel, especially with respect to levels of airline passenger traffic. Reductions in levels of air travel, whether caused by general economic conditions, airfare increases (e.g., capacity reductions or increases in fuel costs borne by commercial airlines) or other events (e.g., work stoppages, military conflicts, terrorist incidents, natural disasters, epidemic diseases, or the response of governments to any of these events) could materially adversely affect us. In particular, we derive a substantial proportion of our revenues from key leisure destinations, including Florida, Hawaii, California, New York and Texas in the U.S. and Europe internationally and the level of travel to these destinations is dependent upon the ability and willingness
18
HERTZ GLOBAL HOLDINGS, INC. AND SUBSIDIARIES
THE HERTZ CORPORATION AND SUBSIDIARIES
ITEM 1A. RISK FACTORS (Continued)
of consumers to travel on vacation and the effect of economic cycles on consumers’ discretionary travel. To the extent travel to these destinations is adversely affected, our results of operations, financial condition, liquidity and cash flows could be materially adversely affected.
We face intense competition that may lead to downward pricing or an inability to increase prices.
We believe that price is one of the primary competitive factors in the vehicle rental market and that technology has enabled cost-conscious customers, including business travelers, to more easily compare rates available from rental companies. We utilize a revenue and pricing optimization strategy that is designed to leverage analytical techniques to maximize total contribution margin across our pricing and fleet decisions, continuously evaluate whether the pricing models are yielding the desired outcomes and provide the right balance between strategic growth goals and achieving desired margins. If we try to increase our pricing, our competitors, some of whom may have greater resources and better access to capital than us, may seek to compete aggressively on the basis of pricing. In addition, our competitors may reduce prices in order to, among other things, attempt to gain a competitive advantage, capture market share or compensate for declines in rental activity. To the extent we do not react appropriately to our competition, our revenues and results of operations, financial condition, liquidity and cash flows could be materially adversely affected. See Item 1, “Business - U.S. and International Rental Car Segments - Markets and Competition” in this
2018
Annual Report.
Our business is highly seasonal and any occurrence that disrupts rental activity during our peak periods could materially adversely affect our results of operations, financial condition, liquidity and cash flows.
Certain significant components of our expenses are fixed in the short-term, including minimum concession fees, real estate taxes, rent, insurance, utilities, facility-related expenses, the costs of operating our information technology systems and minimum staffing costs. Seasonal changes in our revenues do not affect those fixed expenses, typically resulting in higher profitability in periods when our revenues are higher. The second and third quarters of the year have historically been the strongest quarters for our vehicle rental business due to increased levels of leisure travel. We control certain of our costs, including fleet arrangements and availability, to manage seasonal variations in demand. Any circumstance, occurrence or situation that disrupts rental activity during these critical periods could have a material adverse effect on our results of operations, financial condition, liquidity and cash flows due to a significant change in revenue.
If our management is unable to accurately estimate future levels of rental activity and adjust the number, location and mix of vehicles used in our rental operations accordingly, our results of operations, financial condition, liquidity and cash flows could suffer.
Vehicle costs typically represent our largest expense and vehicle purchases are typically made weeks or months in advance of the expected use of the vehicle. Accordingly, our business is dependent upon the ability of our management to accurately estimate future levels of rental activity and consumer preferences with respect to the mix of vehicles used in our rental operations and the location of those vehicles. To the extent we do not purchase a sufficient number of vehicles, or the right types of vehicles, to meet consumer demand, we may lose revenue or market share to our competitors. If we purchase too many vehicles, our Vehicle Utilization could be adversely affected and we may not be able to dispose of excess vehicles in a timely and cost-effective manner. Our failure to utilize a flexible and systematic process for fleet management that accurately estimates future levels of rental activity and determines the appropriate mix of vehicles used in our rental operations may result in obsolescence and excessive aging of fleet, the inability to sell fleet at adequate prices, inefficient fleet utilization, increased fleet costs, lower customer satisfaction, and other unfavorable consequences which may materially affect our results of operations, financial condition, liquidity and cash flows.
Increased vehicle cost due to declines in the value of the non-program vehicles in our operations could materially adversely affect our results of operations, financial condition, liquidity and cash flows.
Manufacturers agree to repurchase program vehicles at a specified price or guarantee the depreciation rate on the vehicles during a specified time period. For non-program vehicles in our rental operations, we have an increased risk that the net amount realized upon the disposition of the vehicle will be less than its estimated residual value at such time. Any decrease in residual values of our non-program vehicles could result in a substantial loss on the sale of such
19
HERTZ GLOBAL HOLDINGS, INC. AND SUBSIDIARIES
THE HERTZ CORPORATION AND SUBSIDIARIES
ITEM 1A. RISK FACTORS (Continued)
vehicles or accelerated depreciation while we own the vehicles, which can materially adversely affect our results of operations, financial condition, liquidity and cash flows.
While program vehicles cost more than comparable non-program vehicles, the use of program vehicles enables us to forecast our depreciation expense with more precision, which is useful because depreciation is a significant cost in our operations. Using program vehicles is also useful in managing our seasonal peak demand for vehicles, because in certain cases we can sell certain program vehicles shortly after having acquired them at a higher value than what we could for a similar non-program vehicle at that time. If there were fewer program vehicles in our rental operations, these benefits would diminish and we would bear increased risk related to residual value. In addition, the related depreciation on our vehicles and our flexibility to reduce the number of vehicles used in our rental operations by returning vehicles sooner than originally expected without the risk of loss in the event of an economic downturn or to respond to changes in rental demand would be reduced.
We may fail to respond adequately to changes in technology and customer demands.
Our industry has recently been characterized by rapid changes in technology and customer demands. For example, industry participants have taken advantage of new technologies to improve Vehicle Utilization, decrease customer wait times and improve customer satisfaction. Our industry has also seen the entry of new competitors, including TNCs, whose businesses are based on emerging mobile platforms and efforts to introduce various types of autonomous vehicles. Our ability to continually improve our current processes and products in response to changes in technology is essential in maintaining our competitive position and current levels of customer satisfaction. We may experience technical or other difficulties that could delay or prevent the development, introduction or marketing of new products or enhanced product offerings. A failure to have a systematic and comprehensive process related to emerging or disruptive competitors or technology may result in loss of competitive differentiation, margin erosion, departure of key partners, declining market share, inability to achieve growth targets, and other unfavorable consequences which may materially adversely affect our results of operations, financial condition, liquidity and cash flows.
If we are unable to purchase adequate supplies of competitively priced vehicles and the cost of the vehicles we purchase increases, our results of operations, financial condition, liquidity and cash flows may be materially adversely affected.
Our vehicle purchase strategies can be affected by commercial, economic, market and other conditions. For example, certain vehicle manufacturers have from time to time utilized strategies to reduce sales to the vehicle rental industry, which can negatively affect our ability to obtain vehicles on competitive terms and conditions. Consequently, there is no guarantee that we can purchase a sufficient number of vehicles at competitive prices and on competitive terms and conditions. If we are unable to obtain a sufficient supply of vehicles, or if we obtain less favorable pricing and other terms during the acquisition of vehicles and are unable to recover from the increased costs, then our results of operations, financial condition, liquidity and cash flows may be materially adversely affected.
The recognition of previously-deferred tax gains on the disposition of revenue earning vehicles may not be fully offset by full expensing of newly-purchased revenue earning vehicles.
The recognition of previously-deferred tax gains on the disposition of revenue earning vehicles may not be fully offset by full expensing of newly-purchased revenue earning vehicles. A material and extended reduction in vehicle purchases by our U.S. vehicle rental business and Donlen, for any reason, could require us to make material cash payments for U.S. federal and state income tax liabilities. We cannot offer assurance that allowances for the full expensing of purchased revenue earning vehicles in the future will exceed previously deferred tax gains realized upon the disposition of revenue earning vehicles maintained under the like-kind exchange ("LKE") program.
Beginning in 2018, the U.S. Tax Cuts and Jobs Act ("TCJA") eliminated the deferral of tax gains on the disposition of revenue earning vehicles maintained under our LKE program. While we expect that additional deductions provided by the TCJA for 100% expensing of vehicles purchased after September 27, 2017 and placed in service before December 31, 2022 could offset the previously-deferred tax gains realized upon the disposition of revenue earning vehicles maintained under the LKE program, we can offer no assurance that these deductions will fully offset tax gains realized upon the disposition of revenue earning vehicles.
20
HERTZ GLOBAL HOLDINGS, INC. AND SUBSIDIARIES
THE HERTZ CORPORATION AND SUBSIDIARIES
ITEM 1A. RISK FACTORS (Continued)
In addition, the TCJA lowers the 100% expensing by 20% per year beginning in 2023, fully eliminating the expensing by 2027. This change could result in the Company being required to make future material cash tax payments on the sales of revenue earning vehicles. We cannot predict if or when legislation would be enacted in the future to allow full or partial expensing of purchased revenue earning vehicles or to allow deferral of tax gains on the dispositions of revenue earning vehicles. If such legislation is not adopted, then our results of operations, financial condition, liquidity and cash flows may be materially adversely affected.
The failure of a manufacturer of our program vehicles to fulfill its obligations under a repurchase or guaranteed depreciation program could expose us to losses on those program vehicles.
If any manufacturer of our program vehicles does not fulfill its obligations under its repurchase or guaranteed depreciation agreement with us, whether due to default, reorganization, bankruptcy or otherwise, then we would have to dispose of those program vehicles without receiving the benefits of the associated repurchase programs. In addition, we could be left with a substantial unpaid claim against the manufacturer with respect to program vehicles that were sold and returned to the manufacturer but not paid for, or that were sold for less than their agreed repurchase price or guaranteed value.
The failure by a manufacturer to pay such amounts could cause a credit enhancement deficiency under our asset-backed and asset-based financing arrangements, requiring us to either reduce the outstanding principal amount of debt or provide more collateral (in the form of cash, vehicles and/or certain other contractual rights) to the creditors under any such affected arrangement.
If one or more manufacturers were to adversely modify or eliminate repurchase or guaranteed depreciation programs in the future, our access to and the terms of asset-backed and asset-based debt financing could be adversely affected, which could in turn have a material adverse effect on our results of operations, financial condition, liquidity and cash flows.
Manufacturer safety recalls could create risks to our business.
The Raechel and Jacqueline Houck Safe Rental Car Act of 2015 prohibits us from renting vehicles with open federal safety recalls and requires us to repair or address these recalls prior to renting or selling the vehicle. Any federal safety recall would require us to cease renting recalled vehicles until we can react to the recall. If a large number of vehicles are the subject of a recall or if needed replacement parts are not in adequate supply, we may not be able to rent recalled vehicles for a significant period of time. These types of disruptions could jeopardize our ability to fulfill existing contractual commitments or satisfy demand for our vehicles, and could also result in the loss of business to our competitors. Depending on the severity of any recall, it could materially adversely affect, among other things, our revenues, create customer service problems, present liability claims, reduce the residual value of the recalled vehicles and harm our general reputation.
A business continuity plan is necessary for our global business.
We have a business continuity plan designed to (i) identify key assets, operations and underlying threats, (ii) define and assess relevant threats (e.g., natural disasters, pandemics, terrorism, etc.) on business operations, (iii) develop and categorize action plans to minimize the impact of the identified threats and (iv) test the adequacy of our action plans. If our business continuity plan fails to operate as intended, we may experience significant business disruptions, increased litigation and liabilities, product and service quality failures, irreparable harm to customer relationships and other unfavorable consequences which may affect our results of operations, financial condition, liquidity and cash flows.
We rely on third-party distribution channels for a significant amount of our revenues.
Third-party distribution channels account for a significant amount of our vehicle rental reservations. These third-party distribution channels include traditional and online travel agencies, third-party internet sites, airlines and hotel companies, marketing partners such as credit card companies and membership organizations and global distribution
21
HERTZ GLOBAL HOLDINGS, INC. AND SUBSIDIARIES
THE HERTZ CORPORATION AND SUBSIDIARIES
ITEM 1A. RISK FACTORS (Continued)
systems that allow travel agents, travel service providers and customers to connect directly to our reservations systems. Loss of access to any of these channels, changes in pricing or commission structures or a reduction in transaction volume could have an adverse impact on our financial condition or results of operations, liquidity and cash flows, particularly if our customers are unable to access our reservation systems through alternate channels.
If our customers develop loyalty to travel intermediaries rather than our brands, our financial results may suffer.
Certain internet travel intermediaries use generic indicators of the type of vehicle (such as “standard” or “compact”) at the expense of brand identification and some intermediaries have launched their own loyalty programs to develop loyalties to their reservation system rather than to our brands. If the volume of sales made through internet travel intermediaries increases significantly and consumers develop stronger loyalties to these intermediaries rather than to our brands, our business and revenues could be affected. Additionally, if our market share suffers due to lower levels of customer loyalty, our results of operations, financial condition, liquidity and cash flows could be adversely affected.
Our foreign operations expose us to risks that may materially adversely affect our results of operations, financial condition, liquidity and cash flows.
A significant portion of our annual revenues are generated outside the U.S. Operating in many different countries exposes us to varying risks, which include: (i) multiple, and sometimes conflicting, foreign regulatory requirements and laws that are subject to change and are often much different than the domestic laws in the U.S., including laws relating to taxes, automobile-related liability, insurance rates, insurance products, consumer privacy, data security, employment matters, cost and fee recovery, and the protection of our trademarks and other intellectual property; (ii) the effect of foreign currency translation risk, as well as limitations on our ability to repatriate income; (iii) varying tax regimes, including consequences from changes in applicable tax laws and our ability to repatriate cash from non-U.S. affiliates without adverse tax consequences; (iv) local ownership or investment requirements, as well as difficulties in obtaining financing in foreign countries for local operations; and (v) political and economic instability, natural calamities, war, and terrorism. The effects of these risks may, individually or in the aggregate, materially adversely affect our results of operations, financial condition, liquidity and cash flows.
Our international operations are based in Uxbridge, England and we have significant vehicle rental operations in the United Kingdom and the Eurozone. The United Kingdom held a referendum on June 23, 2016 in which a majority voted for the United Kingdom’s withdrawal from the European Union (the “Brexit”). In order to facilitate the Brexit, a process of negotiation will determine the future terms of the United Kingdom’s relationship with the European Union. Depending on the terms of Brexit, if any, the United Kingdom could lose access to the single European Union market and to the global trade deals negotiated by the European Union on behalf of its members. The effects of the Brexit vote and the perceptions as to the impact of the withdrawal of the United Kingdom from the European Union may adversely affect business activity and economic and market conditions in the United Kingdom, the Eurozone and globally, could make it more difficult for us to manage our international operations out of the United Kingdom and could contribute to instability in global financial and foreign exchange markets. In addition, Brexit could lead to additional political, legal and economic instability in the European Union.
Our global business requires a compliance program to promote organizational adherence to applicable laws and regulations.
We have a compliance program designed to (i) identify applicable anti-bribery requirements (e.g., laws limiting commercial bribery and corruption), (ii) identify applicable anti-trust requirements (e.g., laws to prevent price fixing, contract rigging, market or customer allocations, etc.), (iii) interpret the application of such requirements
,
(iv) educate target audiences and (v) provide independent, ongoing compliance monitoring.
Additionally, our operations in many different countries increases the risk of a violation, or alleged violation, of the United States Foreign Corrupt Practices Act, the United Kingdom Bribery Act, other applicable anti-corruption laws and regulations, the economic sanction programs administered by the U.S. Treasury Department’s Office of Foreign Assets Control and the anti-boycott regulations administered by the U.S. Department of Commerce's Office of Anti-Boycott Compliance. The failure of our program to operate as designed, can result in a failure to comply with applicable laws,
22
HERTZ GLOBAL HOLDINGS, INC. AND SUBSIDIARIES
THE HERTZ CORPORATION AND SUBSIDIARIES
ITEM 1A. RISK FACTORS (Continued)
which could result in significant penalties or otherwise harm the Company’s reputation and business. There can be no assurance that all of our employees, contractors and agents will comply with the Company’s policies that mandate compliance with these laws. Violations of these laws could result in legal and regulatory sanctions, increased litigation and fines and legal expense, prolonged negative publicity, diminished investor confidence, declining employee morale and other unfavorable consequences, which could have a material adverse effect on our business, results of operations, financial condition, liquidity and cash flows.
Our business is heavily reliant upon communications networks and centralized information technology systems and the concentration of our systems creates risks for us.
We rely heavily on communication networks and information technology systems to, among other things, accept reservations, process rental and sales transactions, manage our pricing, manage our revenue earning vehicles, manage our financing arrangements, account for our activities and otherwise conduct our business. Our reliance on these networks and systems exposes us to various risks that could cause a loss of reservations, interfere with our ability to manage our vehicles, delay or disrupt rental and sales processes, adversely affect our ability to comply with our financing arrangements and otherwise materially adversely affect our ability to manage our business effectively. Our major information technology systems, reservations and accounting functions are centralized in a few locations worldwide. Any disruption, termination or substandard provision of these services, whether as the result of localized conditions (such as a fire, explosion or hacking), failure of our systems to function as designed, or as the result of events or circumstances of broader geographic impact (such as an earthquake, storm, flood, epidemic, strike, act of war, civil unrest or terrorist act), could materially adversely affect our business by disrupting normal reservations, customer service, accounting and information technology functions or by eliminating access to financing arrangements. Any disruption or poor performance of our systems could lead to lower revenues, increased costs or other material adverse effects on our results of operations, financial condition, liquidity and cash flows.
Failure to maintain, upgrade and consolidate our information technology networks could adversely affect us.
We are continuously evaluating, upgrading and consolidating our systems, including making changes to legacy systems, replacing legacy systems with successor systems with new functionality and acquiring new systems with new functionality. In addition, we outsource a significant portion of our information technology services. These types of activities subject us to additional costs and inherent risks associated with outsourcing, replacing and changing these systems, including impairment of our ability to manage our business, potential disruption of our internal control structure, substantial capital expenditures, additional administration and operating expenses, retention of sufficiently skilled personnel to implement and operate the new systems, demands on management time, potential delays or disruptions from upgrading and consolidating our systems and other risks and costs of delays or difficulties in transitioning to outsourcing alternatives, new systems or integrating new systems into our current systems. We are also considering alternatives regarding one of our two U.S.-based data centers as part of the upgrade to our information technology network in response to the expiration of the applicable lease. One alternative may be locating substantially all of our data center operations in a single location, where any loss or damage to that facility could result in operation disruption and data loss. Further, failure to have a comprehensive technology plan and effective process may result in an inability to support business growth expectations and successfully execute information technology business programs and initiatives, cost overruns and excessive write-offs, missed business objectives, program delays and business disruptions, service quality issues, regulatory violations, potential litigation, loss of key talent and other unfavorable consequences. In addition, the implementation of our technology initiatives and systems may cause disruptions in our business operations by severely degrading performance or a complete loss of service and have an adverse effect on our business and operations, if not anticipated and appropriately mitigated and our competitive position may be adversely affected if we are unable to maintain systems that allow us to manage our business in a competitive manner.
The misuse or theft of information we possess, including as a result of cyber security breaches, could harm our brand, reputation or competitive position and give rise to material liabilities.
We regularly possess, process, store and handle non-public information about millions of individuals and businesses, including both credit and debit card information and other sensitive and confidential personal information in the normal course of our business. In addition, our customers regularly transmit sensitive and confidential information to us via the internet and through other electronic means. Despite the security measures and compliance programs we currently
23
HERTZ GLOBAL HOLDINGS, INC. AND SUBSIDIARIES
THE HERTZ CORPORATION AND SUBSIDIARIES
ITEM 1A. RISK FACTORS (Continued)
maintain and continuously monitor, our facilities and systems and those of our third-party service providers may contain defects in design or manufacture or other problems that could unexpectedly compromise information security. Unauthorized parties may also attempt to gain access to our facilities or systems, or those of third parties with whom we do business, through fraud, misrepresentation, or other forms of deception of our employees or contractors. Many of the techniques used to obtain unauthorized access, including viruses, worms and other malicious software programs, are difficult to anticipate until launched against a target and we may be unable to implement adequate preventative measures. The failure of our information facilities and systems to perform as designed, or the failure to maintain and protect the security of data, whether as the result of our own error or the malfeasance or errors of others, could substantially harm our reputation, diminish customer confidence, loss of key customers, interrupt our operations, result in governmental investigations and give rise to civil or criminal liabilities. For example, in recent years many companies have been subject to high-profile security breaches that involved sophisticated and targeted attacks on the company’s infrastructure and the compromise of non-public sensitive and confidential information. These attacks were often not recognized or detected until after the disclosure of sensitive information notwithstanding the preventive and anticipative measures the companies had maintained. To date, cyber security attacks directed at us have not had a material impact on our financial results.
Cyber security threats in our business environment expose us to risks.
Due to our continuous exposure to cyber-attacks and other security threats, we regularly, and at least quarterly, assess and review our information infrastructure and cyber security framework to assess security threats that could compromise the integrity of our information technology assets and supported business operations. We also regularly define information security objectives and standards and define and monitor identity management and access control. Although we have implemented policies, procedures and controls to protect against, detect and mitigate these threats, we face advanced and persistent attacks on our information infrastructure and attempts by others to gain unauthorized access to our information technology assets are becoming more sophisticated. We actively monitor compliance, including with the European Union's Global Data Protection Regulations, and respond to security breaches and violations by utilizing procedures that provide for controls on detecting and preventing cyber breaches and communicating information to senior personnel and security representatives that we retain. We also address cyber security threats at third-parties that possess, process, store and handle Hertz data and information to mitigate the risk to us. However, because of the evolving nature and sophistication of these security threats, which can be difficult to detect, there can be no assurance that our policies, procedures and controls have or will detect or prevent all of these threats and we cannot predict the full impact of any such past or future incident. Any such failure by us to effectively address, enforce and maintain our information infrastructure and cyber security framework may result in substantial harm to our business, including major disruptions to business operations, loss of intellectual property, release of confidential information, malicious corruption of date, regulatory intervention and sanctions or fines and possible prolonged negative publicity.
Our leases and vehicle rental concessions expose us to risks.
We maintain a substantial network of vehicle rental locations at airports in the U.S. and internationally. Many of these locations are leased and subject to vehicle rental concessions where vehicle rental companies are frequently required to bid periodically for the available locations. If we are unable to continue operating these facilities at their current locations due to the termination of leases or vehicle rental concessions at airports, which comprise a majority of our revenues, our operating results could be adversely affected. In addition, if the costs of these leases increase and we are unable to increase our prices to offset the increased costs, our financial results could suffer.
Maintaining favorable brand recognition is essential to our success, and failure to do so could materially adversely affect our results of operations, financial condition, liquidity and cash flows.
Our business is heavily dependent upon the favorable brand recognition that our “Hertz”, “Dollar” and “Thrifty” brand names have in the markets in which they participate. Factors affecting brand recognition are often outside our control, and our efforts to maintain or enhance favorable brand recognition, such as marketing and advertising campaigns, may not have their desired effects. In addition, although our licensing partners are subject to contractual requirements to protect our brands, it may be difficult to monitor or enforce such requirements, particularly in foreign jurisdictions and various laws may limit our ability to enforce the terms of these agreements or to terminate the agreements. Any
24
HERTZ GLOBAL HOLDINGS, INC. AND SUBSIDIARIES
THE HERTZ CORPORATION AND SUBSIDIARIES
ITEM 1A. RISK FACTORS (Continued)
decline in perceived favorable recognition of our brands could materially adversely affect our results of operations, financial condition, liquidity and cash flows.
Maintaining effective employee retention and talent management is critical to our success.
We develop and maintain a talent management strategy that defines current and future talent requirements (e.g., skills, location needs, timing, etc.) based on our strategic direction, outlines coordinated recruiting and development plans across businesses and regions and considers employee mobility, centers of excellence and shared service concepts to optimize resource plans and leverage labor arbitrage. The consequences that may result from a failure of our employee retention and talent management can include an inability to sustain growth strategies due to the lack of required talent, non-competitive cost structures, an inability to encourage innovation and sustain competitive differentiation, declining employee morale and increased attrition.
We may face issues with our union employees.
Labor contracts covering the terms of employment for the Company's union employees in the U.S. (including those in the U.S. territories) are presently in effect under active contracts with local unions, affiliated primarily with the International Brotherhood of Teamsters and the International Association of Machinists. These contracts are renegotiated periodically. Failure to negotiate a new labor agreement when required could result in a work stoppage. Although we believe that our labor relations have generally been good, it is possible that we could become subject to additional work rules imposed by agreements with labor unions, or that work stoppages or other labor disturbances could occur in the future. In addition, our non-union workforce has been subject to unionization efforts in the past, and we could be subject to future unionization, which could lead to increases in our operating costs and/or constraints on our operating flexibility.
If there is a determination that any of the Spin-Off or the internal spin-off transactions completed in connection with the Spin-Off (collectively with the Spin-Off, the “Spin-Offs”) is taxable for U.S. federal income tax purposes because the facts, assumptions, representations or undertakings underlying the IRS private letter ruling or tax opinions are incorrect or for any other reason, then Herc Holdings and its stockholders could incur significant U.S. federal income tax liabilities and Hertz Global could incur significant liabilities.
In connection with the Spin-Offs, Herc Holdings received a private letter ruling from the Internal Revenue Service ("IRS") to the effect that, subject to the accuracy of and compliance with certain representations, assumptions and covenants, (i) the Spin-Off will qualify as a tax-free transaction under Sections 355 and 368(a)(1)(D) of the Code, and (ii) the internal spin-off transactions will qualify as tax free under Section 355 of the Code. A private letter ruling from the IRS generally is binding on the IRS. However, the IRS ruling did not rule that the Spin-Offs satisfied every requirement for a tax-free spin-off, and Herc Holdings and Hertz Global relied solely on opinions of professional advisors to determine that such additional requirements were satisfied. The ruling and the opinions relied on certain facts, assumptions, representations and undertakings from Herc Holdings and Hertz Holdings regarding the past and future conduct of the companies’ respective businesses and other matters. If any of these facts, assumptions, representations or undertakings were incorrect or not otherwise satisfied, Herc Holdings and Hertz Global, and their affiliates may not be able to rely on the ruling or the opinions of tax advisors and could be subject to significant tax liabilities. Notwithstanding the private letter ruling and opinions of tax advisors, the IRS could determine on audit that the Spin-Offs and related transactions are taxable if it determines that any of these facts, assumptions, representations or undertakings are not correct or have been violated or if it disagrees with the conclusions in the opinions that are not covered by the private letter ruling, or for any other reason, including as a result of certain significant changes in the stock ownership of Herc Holdings or Hertz Global after the Spin-Off. If the Spin-Offs or related transactions are determined to be taxable for U.S. federal income tax purposes, Herc Holdings and Hertz Global and, in certain cases, their stockholders (at the time of the Spin-Off) could incur significant U.S. federal income tax liabilities, including taxation on the value of the Hertz Global stock distributed in the Spin-Off and the value of other companies distributed in the internal Spin-Off transactions, and Hertz Global could incur significant liabilities, either directly to the tax authorities or under a Tax Matters Agreement entered into with Herc Holdings.
25
HERTZ GLOBAL HOLDINGS, INC. AND SUBSIDIARIES
THE HERTZ CORPORATION AND SUBSIDIARIES
ITEM 1A. RISK FACTORS (Continued)
Some or all of our deferred tax assets could expire if we experience an “ownership change” as defined in Section 382 of the Code.
An “ownership change” could limit our ability to utilize tax attributes, including net operating losses, capital loss carryovers, excess foreign tax carry forwards, and credit carryforwards, to offset future taxable income. Our ability to use such tax attributes to offset future taxable income and tax liabilities may be significantly limited if we experience an “ownership change” as defined in Section 382(g) of the Code. In general, an ownership change will occur when the percentage of Hertz Global's ownership of one or more “five-percent shareholders” (as defined in the Code) has increased by more than 50 percentage points over the lowest percentage of stock owned by such shareholders at any time during the prior three years (calculated on a rolling basis). An entity that experiences an ownership change generally should be subject to an annual limitation on its pre-ownership change tax loss carryforward equal to the equity value of the corporation immediately before the ownership change, multiplied by the long-term, tax-exempt rate posted monthly by the IRS (subject to certain adjustments). The annual limitation accumulates each year to the extent that there is any unused limitation from a prior year. The limitation on our ability to utilize tax losses and credit carryforwards arising from an ownership change under Section 382 depends on the value of our equity at the time of any ownership change. If we were to experience an “ownership change”, it is possible that a significant portion of our tax attributes could expire before we would be able to use them to offset future taxable income. Many states adopt the federal section 382 rules and therefore have similar limitations with respect to state tax attributes.
We face risks related to liabilities and insurance.
Our businesses expose us to claims for personal injury, death and property damage resulting from the use of the vehicles rented or sold by us, and for employment-related injury claims by our employees. The Company is currently a defendant in numerous actions and has received numerous claims on which actions have not yet been commenced for public liability and property damage arising from the operation of motor vehicles rented from the Company. We
self-insure up to $10 million per occurrence globally, except $5 million Self Insured Retention for Europe Automobile Liability. In addition, the Company has $200 million insurance coverage excess of retentions
.
We cannot assure you that we will not be exposed to uninsured liability at levels in excess of our historical levels resulting from multiple payouts or otherwise, that liabilities in respect of existing or future claims will not exceed the level of our insurance, that we will have sufficient capital available to pay any uninsured claims or that insurance with unaffiliated carriers will continue to be available to us on economically reasonable terms or at all. See Item 1, “Business - Insurance and Risk Management” and
Note 16
, "
Contingencies and Off-Balance Sheet Commitments
," to the Notes to our consolidated financial statements included in this
2018
Annual Report under the caption Item 8, ‘‘Financial Statements and Supplementary Data.”
We could face a significant withdrawal liability if we withdraw from participation in multiemployer pension plans or in the event other employers in such plans become insolvent and certain multiemployer plans in which we participate are reported to have underfunded liabilities, any of which could have a material adverse effect on our results of operations, financial condition, liquidity or cash flows.
We could face a significant withdrawal liability if we withdraw from participation in one or more multiemployer pension plans or in the event other employers in such plans become insolvent, any of which could have a material adverse effect on our results of operations. financial condition, liquidity or cash flows.
We participate in various “multiemployer” pension plans. In the event that we withdraw from participation in one of these plans, then applicable law could require us to make an additional lump-sum contribution to the plan, and we would have to reflect that as an expense in our consolidated statement of operations and as a liability on our consolidated balance sheet. Our withdrawal liability for any multiemployer plan would depend on the extent of the plan’s funding of vested benefits. Our multiemployer plans could have significant underfunded liabilities. Such underfunding may increase in the event other employers become insolvent or withdraw from the applicable plan or upon the inability or failure of withdrawing employers to pay their withdrawal liability. In addition, such underfunding may increase as a result of lower than expected returns on pension fund assets or other funding deficiencies. The occurrence of any of these events could have a material adverse effect on our consolidated financial condition, results of operations, liquidity and cash flows. See
Note 9
, "
Employee Retirement Benefits
," to the Notes to our consolidated financial statements included in this
2018
Annual Report under the caption Item 8, ‘‘Financial Statements and Supplementary Data."
26
HERTZ GLOBAL HOLDINGS, INC. AND SUBSIDIARIES
THE HERTZ CORPORATION AND SUBSIDIARIES
ITEM 1A. RISK FACTORS (Continued)
Environmental laws and regulations and the costs of complying with them, or any liability or obligation imposed under them, could materially adversely affect our results of operations, financial condition, liquidity and cash flows.
We are subject to federal, state, local and foreign environmental laws and regulations in connection with our operations, including with respect to the ownership and operation of tanks for the storage of petroleum products, such as gasoline, diesel fuel and motor and waste oils. We cannot assure you that our tanks will at all times remain free from leaks or that the use of these tanks will not result in significant spills or leakage. If leakage or a spill occurs, it is possible that the resulting costs of cleanup, investigation and remediation, as well as any resulting fines, could be significant. We cannot assure you that compliance with existing or future environmental laws and regulations will not require material expenditures by us or otherwise have a material adverse effect on our consolidated financial condition, results of operations, liquidity or cash flows. See Item 1, ‘‘Business—Governmental Regulation and Environmental Matters’’ in this
2018
Annual Report.
The U.S. Congress and other legislative and regulatory authorities in the U.S. and internationally have considered, and will likely continue to consider, numerous measures related to climate change and greenhouse gas emissions. Should rules establishing limitations on greenhouse gas emissions or rules imposing fees on entities deemed to be responsible for greenhouse gas emissions become effective, demand for our services could be affected, our vehicle, and/or other, costs could increase, and our business could be adversely affected.
Changes in the U.S. legal and regulatory environment that affect our operations, including laws and regulations relating to taxes, automobile related liability, insurance rates, insurance products, consumer privacy, data security, employment matters, licensing and franchising, used-car sales (including retail sales), cost and fee recovery and the banking and financing industry could disrupt our business, increase our expenses or otherwise have a material adverse effect on our results of operations, financial condition, liquidity and cash flows.
We are subject to a wide variety of U.S. laws and regulations and changes in the level of government regulation of our business have the potential to materially alter our business practices and materially adversely affect our results of operations, financial condition, liquidity and cash flows, including our profitability. Those changes may occur through new laws and regulations or changes in the interpretation of existing laws and regulations.
Any new, or change in existing, U.S. law and regulation with respect to optional insurance products or policies could increase our costs of compliance or make it uneconomical to offer such products, which would lead to a reduction in revenue and profitability. For further discussion regarding how changes in the regulation of insurance intermediaries may affect us, see Item 1, ‘‘Business—Insurance and Risk Management’’ in this
2018
Annual Report. If customers decline to purchase supplemental liability insurance products from us as a result of any changes in these laws or otherwise, our results of operations, financial condition, liquidity and cash flows could be materially adversely affected.
Changes in the U.S. legal and regulatory environments in the areas of customer and employee privacy, data security, and cross-border data flows could have a material adverse effect on our business, primarily through the impairment of our marketing and transaction processing activities, and the resulting costs of complying with such legal and regulatory requirements. It is also possible that we could encounter significant liability for failing to comply with any such requirements.
We derive revenue through rental activities of the Hertz, Dollar and Thrifty brands under franchise and license arrangements. These arrangements are subject to various international, federal and state laws and regulations that impose limitations on our interactions with counterparties. In addition, the used-vehicle sale industry, including our network of company-operated retail vehicle sales locations, is subject to a wide range of federal, state and local laws and regulations, such as those relating to motor vehicle sales, retail installment sales and related finance and insurance matters, advertising, licensing, consumer protection and consumer privacy. Changes in these laws and regulations that impact our franchising and licensing agreements or our used-vehicle sales could adversely affect our results.
In most jurisdictions where we operate, we pass-through various expenses, including the recovery of vehicle licensing
27
HERTZ GLOBAL HOLDINGS, INC. AND SUBSIDIARIES
THE HERTZ CORPORATION AND SUBSIDIARIES
ITEM 1A. RISK FACTORS (Continued)
costs and airport concession fees, to our rental customers as separate charges. We believe that our expense pass-throughs, where imposed, are properly disclosed and are lawful. However, in the event of incorrect calculations or disclosures with respect to expense pass-throughs, or a successful challenge to the methodology we have used for determining our expense pass-through treatment, we could be subject to fines or other liabilities. In addition, we may in the future be subject to potential legislative, regulatory or administrative changes or actions which could limit, restrict or prohibit our ability to separately state, charge and recover vehicle licensing costs and airport concession fees, which could result in a material adverse effect on our results of operations, financial condition, liquidity and cash flows.
Certain proposed or enacted laws and regulations with respect to the banking and finance industries, including the Dodd-Frank Wall Street Reform and Consumer Protection Act (including risk retention requirements) and amendments to the SEC's rules relating to asset-backed securities, could restrict our access to certain financing arrangements and increase our financing costs, which could have a material adverse effect on our results of operations, financial condition, liquidity and cash flows.
RISKS RELATED TO OUR SUBSTANTIAL INDEBTEDNESS
Our substantial level of indebtedness could materially adversely affect our results of operations, financial condition, liquidity, cash flows and ability to compete in our industry.
Our substantial indebtedness could materially adversely affect our business by, among other situations: (i) making it more difficult for us to satisfy our obligations to the holders of our outstanding debt securities and to the lenders under our various credit facilities, resulting in possible defaults on, and acceleration or early amortization of, such indebtedness; (ii) being difficult to refinance or borrow additional funds in the future; (iii) requiring us to dedicate a substantial portion of our cash flows from operations and investing activities to make payments on our debt, which would reduce our ability to fund working capital, capital expenditures or other general corporate purposes; (iv) increasing our vulnerability to general adverse economic and industry conditions (such as credit-related disruptions), including interest rate fluctuations, because a portion of our borrowings are at floating rates of interest and are not hedged against rising interest rates, and the risk that one or more of the financial institutions providing commitments under our revolving credit facilities fails to fund an extension of credit under any such facility, due to insolvency or otherwise, leaving us with less liquidity than expected; (v) placing us at a competitive disadvantage to our competitors that have proportionately less debt or comparable debt at more favorable interest rates or on better terms; and (vi) limiting our ability to react to competitive pressures, or make it difficult for us to carry out capital program spending that is necessary or important to our growth strategy and our efforts to improve operating margins. While the terms of the agreements and instruments governing our outstanding indebtedness contain certain restrictions upon our ability to incur additional indebtedness, they do not fully prohibit us from incurring substantial additional indebtedness and do not prevent us from incurring obligations that do not constitute indebtedness. If new debt or other obligations are added to our current liability levels without a corresponding refinancing or redemption of our existing indebtedness and obligations, these risks would increase. For a description of the amounts we have available under certain of our debt facilities, see Item 7, "Management's Discussion and Analysis of Financial Condition and Results of Operations-Liquidity and Capital Resources—Borrowing Capacity and Availability” included in this
2018
Annual Report and
Note 7
, "
Debt
," to the Notes to our consolidated financial statements included in this
2018
Annual Report under the caption Item 8, "Financial Statements and Supplementary Data."
Our ability to manage these risks depends on financial market conditions as well as our financial and operating performance, which, in turn, is subject to a wide range of risks, including those described under “Risks Related to Our Business and Industry.”
Our Senior Facilities and our Letter of Credit Facility contain customary events of default, subject to customary cure periods for certain defaults, that include, among others, non-payment defaults, covenant defaults, material judgment defaults, bankruptcy and insolvency defaults, cross-acceleration of certain other material indebtedness, and inaccuracy of representations and warranties. Upon an event of default thereunder, if not waived by our lenders, our lenders may declare all amounts outstanding as due and payable, which may cause further defaults and/or amortization events under our other debt obligations. The credit agreement governing our Senior Facilities and the credit agreement governing our Letter of Credit Facility require us upon a change of control, as defined therein, to make an offer to repay in full all amounts outstanding thereunder upon such a change of control. Our failure to make such an offer would result
28
HERTZ GLOBAL HOLDINGS, INC. AND SUBSIDIARIES
THE HERTZ CORPORATION AND SUBSIDIARIES
ITEM 1A. RISK FACTORS (Continued)
in an event of default thereunder. In addition, the indentures governing our Senior Notes and our Senior Second Priority Secured Notes require us upon a change of control, as defined therein, to make an offer to repurchase all of such outstanding Senior Notes and Senior Second Priority Secured Notes at a price equal to 101% of the principal amount, together with any accrued and unpaid interest. If we failed to repurchase the Senior Notes and Senior Second Priority Secured Notes, we would be in default under the related indenture. Certain of our other indebtedness also could result in defaults and/or amortization events upon the occurrence of certain change of control events, as defined therein. If our current lenders accelerate the maturity of their related indebtedness, we may not have sufficient capital available at that time to pay the amounts due to our lenders on a timely basis, and there is no guarantee that we would be able to repay, refinance, or restructure the payments on such debt.
If our capital resources (including borrowings under our revolving credit facilities and access to other refinancing indebtedness) and operating cash flows are not sufficient to pay our obligations as they mature or to fund our liquidity requirements, we may be forced to do, among other things, one or more of the following: (i) sell certain of our assets; (ii) reduce the number of our revenue earning vehicles; (iii) reduce or delay capital expenditures; (iv) obtain additional equity capital; (v) forgo business opportunities, including acquisitions and joint ventures; or (vi) restructure or refinance all or a portion of our debt on or before maturity.
We cannot assure you that we would be able to accomplish any of these alternatives on a timely basis or on satisfactory terms, if at all. Furthermore, we cannot assure you that we will maintain financing activities and cash flows sufficient to permit us to pay the principal, premium, if any, and interest on our indebtedness. If we cannot refinance or otherwise pay our obligations as they mature and fund our liquidity requirements, our business, results of operations, financial condition, liquidity, cash flows, ability to obtain financing and ability to compete in our industry could be materially adversely affected.
Our reliance on asset-backed and asset-based financing arrangements to purchase vehicles subjects us to a number of risks, many of which are beyond our control.
We rely significantly on asset-backed and asset-based financing to purchase vehicles. If we are unable to refinance or replace our existing asset-backed and asset-based financing or continue to finance new vehicle acquisitions through asset-backed or asset-based financing on favorable terms, on a timely basis, or at all, then our costs of financing could increase significantly and have a material adverse effect on our liquidity, interest costs, financial condition, cash flows and results of operations.
Our asset-backed and asset-based financing capacity could be decreased, our financing costs and interest rates could be increased, or our future access to the financial markets could be limited, as a result of risks and contingencies, many of which are beyond our control, including: (i) the acceptance by credit markets of the structures and structural risks associated with our asset-backed and asset-based financing arrangements; (ii) the credit ratings provided by credit rating agencies for our asset-backed indebtedness; (iii) third parties requiring changes in the terms and structure of our asset-backed or asset-based financing arrangements, including increased credit enhancement or required cash collateral and/or other liquid reserves; (iv) the insolvency or deterioration of the financial condition of one or more of our principal vehicle manufacturers; or (v) changes in laws or regulations, including judicial review of issues of first impression, that negatively affect any of our asset-backed or asset-based financing arrangements.
Any reduction in the value of certain revenue earning vehicles could effectively increase our vehicle costs, adversely affect our profitability and potentially lead to decreased borrowing base availability in our asset-backed and certain asset-based vehicle financing facilities due to the credit enhancement requirements for such facilities, which could increase if market values for vehicles decrease below net book values for those vehicles. In addition, if disposal of vehicles in the used vehicle marketplace were to become severely limited at a time when required collateral levels were rising and as a result we failed to meet the minimum required collateral levels, the principal under our asset-backed and certain asset-based financing arrangements may be required to be repaid sooner than anticipated with vehicle disposition proceeds and lease payments we make to our special purpose financing subsidiaries. If that were to occur, the holders of our asset-backed and certain asset-based debt may have the ability to exercise their right to direct the trustee or other secured party to foreclose on and sell vehicles to generate proceeds sufficient to repay such debt.
29
HERTZ GLOBAL HOLDINGS, INC. AND SUBSIDIARIES
THE HERTZ CORPORATION AND SUBSIDIARIES
ITEM 1A. RISK FACTORS (Continued)
The occurrence of certain events, including those described above, could result in the occurrence of an amortization event pursuant to which the proceeds of sales of vehicles that collateralize the affected asset-backed financing arrangement would be required to be applied to the payment of principal and interest on the affected facility or series, rather than being reinvested in our revenue earning vehicles. In the case of our asset-backed financing arrangements, certain other events, including defaults by us and our affiliates in the performance of covenants set forth in the agreements governing certain vehicle debt, could result in the occurrence of a liquidation event with the passing of time or immediately pursuant to which the trustee or holders of the affected asset-backed financing arrangement would be permitted to require the sale of the assets collateralizing that series. Failure by us to have proper financing and debt management processes may result in cash shortfalls and liquidity problems, emergency financing at high interest rates, violations of debt covenants, an inability to execute strategic initiatives, which may affect our liquidity and our ability to maintain sufficient levels of revenue earning vehicles to meet customer demands and could trigger cross-defaults under certain of our other financing arrangements.
Substantially all of our consolidated assets secure certain of our outstanding indebtedness, which could materially adversely affect our debt and equity holders and our business.
Substantially all of our consolidated assets, including our revenue earning vehicles and Donlen’s lease portfolio, are subject to security interests or are otherwise encumbered for the lenders under our senior credit facilities, asset-backed and asset-based financing arrangements. As a result, the lenders under those facilities would have a prior claim on such assets in the event of our bankruptcy, insolvency, liquidation or reorganization, and we may not have sufficient funds to pay in full, or at all, all of our creditors or make any amount available to holders of our equity. The same is true with respect to structurally senior obligations: in general, all liabilities and other obligations of a subsidiary must be satisfied before the assets of such subsidiary can be made available to the creditors (or equity holders) of the parent entity.
Because substantially all of our assets are encumbered under financing arrangements, our ability to incur additional secured indebtedness or to sell or dispose of assets to raise capital may be impaired, which could have a material adverse effect on our financial flexibility and force us to attempt to incur additional unsecured indebtedness, which may not be available to us.
Restrictive covenants in certain of the agreements and instruments governing our indebtedness may materially adversely affect our financial flexibility or may have other material adverse effects on our business, results of operations, financial condition, liquidity and cash flows.
Certain of our credit facilities, our indentures and other asset-based and asset-backed financing arrangements contain covenants that, among other things, restrict Hertz and its subsidiaries’ ability to: (i) dispose of assets; (ii) incur additional indebtedness; (iii) incur guarantee obligations; (iv) prepay other indebtedness or amend other financing arrangements; (v) pay dividends; (vi) create liens on assets; (vii) sell assets; (viii) make investments, loans, advances or capital expenditures; (ix) make acquisitions; (x) engage in mergers or consolidations; (xi) change the business conducted by us; and (xii) engage in certain transactions with affiliates.
Our Senior RCF and our Letter of Credit Facility subject us to a financial maintenance covenant. Our ability to comply with this covenant will depend on our ongoing financial and operating performance, which in turn are subject to, among other things, the risks identified in “Risks Related to Our Business.”
The agreements governing our financing arrangements contain numerous covenants. The breach of any of these covenants or restrictions could result in a default under the relevant agreement, which could, in turn, cause cross-defaults under our other financing arrangements. In such event, we may be unable to borrow under the Senior RCF and certain of our other financing arrangements and may not be able to repay the amounts due under such arrangements, which could have a material adverse effect on our business, results of operations, financial condition, liquidity and cash flows.
30
HERTZ GLOBAL HOLDINGS, INC. AND SUBSIDIARIES
THE HERTZ CORPORATION AND SUBSIDIARIES
ITEM 1A. RISK FACTORS (Continued)
An increase in interest rates or in our borrowing margin would increase the cost of servicing our debt and could reduce our profitability.
A significant portion of our outstanding debt bears interest at floating rates. As a result, to the extent we have not hedged against rising interest rates, an increase in the applicable benchmark interest rates would increase our cost of servicing our debt and could materially adversely affect our results of operations, financial condition, liquidity and cash flows.
In addition, we regularly refinance our indebtedness. If interest rates or our borrowing margins increase between the time an existing financing arrangement was consummated and the time such financing arrangement is refinanced, the cost of servicing our debt would increase and our results of operations, financial condition, liquidity and cash flows could be materially adversely affected.
The interest rates of certain of our financing instruments are priced using a spread over LIBOR.
The London interbank offered rate (“LIBOR”), is the basic rate of interest used in lending between banks on the London interbank market and is widely used as a reference for setting the interest rate on loans globally. We typically use LIBOR as a reference rate in various of our financing transactions such that the interest due to the creditors pursuant to such financing transactions is calculated using LIBOR. Our term loan agreement also contains a stated minimum floor value for LIBOR.
On July 27, 2017, the United Kingdom’s Financial Conduct Authority, which regulates LIBOR, announced that it intends to phase out LIBOR by the end of 2021. It is unclear if at that time whether or not LIBOR will cease to exist or if new methods of calculating LIBOR will be established such that it continues to exist after 2021. The U.S. Federal Reserve, in conjunction with the Alternative Reference Rates Committee, a steering committee comprised of large U.S. financial institutions, is considering replacing U.S. dollar LIBOR with a new index calculated by short-term repurchase agreements, backed by Treasury securities (“SOFR”). SOFR is observed and backward-looking, which stands in contrast with LIBOR under the current methodology, which is an estimated forward-looking rate and relies, to some degree, on the expert judgment of submitting panel members. Given that SOFR is a secured rate backed by government securities, it will be a rate that does not take into account bank credit risk (as is the case with LIBOR). Whether or not SOFR attains market traction as a LIBOR replacement tool remains in question. As such, the future of LIBOR at this time is uncertain. At this time, due to a lack of consensus as to what rate or rates may become accepted alternatives to LIBOR, it is impossible to predict the effect of any such alternatives on our liquidity. However, if LIBOR ceases to exist, we may need to renegotiate certain of our financing agreements that utilize LIBOR as a factor in determining the interest rate to replace LIBOR with the new standard that is established. Additionally, these changes may have an impact on the value of any LIBOR-based marketable securities, fleet leases, loans and derivatives that are included in our financial assets and liabilities.
RISKS RELATING TO HERTZ GLOBAL HOLDINGS, INC. COMMON STOCK
Hertz Holdings is a holding company with no operations of its own and depends on its subsidiaries for cash.
The operations of Hertz Holdings are conducted nearly entirely through its subsidiaries and its ability to generate cash to meet its debt service obligations or to pay dividends on its common stock is dependent on the earnings and the receipt of funds from its subsidiaries via dividends or intercompany loans. However, none of the subsidiaries of Hertz Holdings are obligated to make funds available to Hertz Holdings for the payment of dividends or the service of its debt. In addition, certain states' laws and the terms of certain of our debt agreements significantly restrict, or prohibit, the ability of Hertz and its subsidiaries to pay dividends, make loans or otherwise transfer assets to Hertz Holdings, including state laws that require dividends to be paid only from surplus. If Hertz Holdings does not receive cash from its subsidiaries, then Hertz Holdings' financial condition could be materially adversely affected.
Hertz Holdings' share price may decline if it issues a large number of new shares or if a holder of a substantial number of shares sells their stock.
Hertz Holdings has a significant number of authorized but unissued shares, including shares available for issuance pursuant to various equity plans. In addition, in recent years, several shareholders, most notably affiliates of Carl Icahn,
31
HERTZ GLOBAL HOLDINGS, INC. AND SUBSIDIARIES
THE HERTZ CORPORATION AND SUBSIDIARIES
ITEM 1A. RISK FACTORS (Continued)
have accumulated significant amounts of Hertz Holdings common stock and may have the ability to exert substantial influence over actions to be taken or approved by our stockholders, including the election of directors. A sale of a substantial number of shares or other equity-related securities in the public market pursuant to new issuances or by these significant shareholders could depress the market price of Hertz Holdings' stock and impair its ability to raise capital through the sale of additional equity securities. Any such sale or issuance would dilute the ownership interests of the then-existing stockholders and could have material adverse effect on the market price of Hertz Holdings' common stock. In addition, in the normal course of business, the Company purchases goods and services and leases property from entities controlled by Carl Icahn and his affiliates, including The Pep Boys - Manny, Moe & Jack. It is possible that these entities could cancel, choose not to renew or renegotiate the terms of their arrangements with the Company following the sale of shares by affiliates of Carl Icahn, which could adversely impact our business. See
Note 17
, "
Related Party Transactions
," to the Notes to our consolidated financial statements included in this
2018
Annual Report under the caption Item 8, "Financial Statements and Supplementary Data".
ITEM 1B. UNRESOLVED STAFF COMMENTS
None.
ITEM 2. PROPERTIES
We operate vehicle rental locations at or near airports and in central business districts and suburban areas of major cities in the U.S. (including Puerto Rico and the U.S. Virgin Islands), Australia, Belgium, Canada, the Czech Republic, France, Germany, Italy, Luxembourg, the Netherlands, New Zealand, Slovakia, Spain and the United Kingdom, as well as retail used vehicle sales locations primarily in the U.S. We also operate headquarters, sales offices and service facilities in the foregoing countries in support of our vehicle rental operations, as well as small vehicle rental sales offices and service facilities in a select number of other countries in Europe and Asia.
We own less than 5% of the locations from which we operate our vehicle rental businesses and, in some cases own real property that we lease to franchisees or other third parties. The remaining locations from which we operate our vehicle rental businesses are leased or operated under concessions from governmental authorities and private entities. Those leases and concession agreements typically require minimum lease payments or minimum concession fees and often require us to pay or reimburse operating expenses, pay additional lease payments above guaranteed minimums, which are based on a percentage of revenues or sales at the relevant premises, or to do both. See
Note 11
, "
Leases
," to the Notes to our consolidated financial statements included in this 2018 Annual Report under the caption Item 8, "Financial Statements and Supplementary Data."
Donlen's headquarters is in a leased facility in Bannockburn, Illinois. Donlen also has leased sales offices located throughout the U.S. and Canada.
We own our worldwide headquarters facility in Estero, Florida. We also own two facilities and lease one facility near Oklahoma City, Oklahoma at which reservations for our vehicle rental operations are processed, global information technology systems are serviced and finance and accounting functions are performed. Additionally, we own a reservation and financial center near Dublin, Ireland, at which we have centralized our European vehicle rental reservation, customer relations, accounting and human resource functions and lease a European headquarters office in Uxbridge, England.
ITEM 3. LEGAL PROCEEDINGS
For information regarding legal proceedings, see
Note 16
, "
Contingencies and Off-Balance Sheet Commitments
," to the Notes to our consolidated financial statements included in this
2018
Annual Report under the caption Item 8, "Financial Statements and Supplementary Data."
32
HERTZ GLOBAL HOLDINGS, INC. AND SUBSIDIARIES
THE HERTZ CORPORATION AND SUBSIDIARIES
EXECUTIVE OFFICERS OF THE REGISTRANTS (Continued)
EXECUTIVE OFFICERS OF THE REGISTRANTS
Set forth below are the names, ages, number of years employed by the Company as of
February 18, 2019
and positions of our executive officers.
|
Name
|
Age
|
Number of Years Employed
|
Position
|
|||
|
Kathryn V. Marinello
|
62
|
2
|
President and Chief Executive Officer
|
|||
|
Jamere Jackson
|
49
|
—
|
Executive Vice President and Chief Financial Officer
|
|||
|
Murali Kuppuswamy
|
57
|
1
|
Executive Vice President and Chief Human Resources Officer
|
|||
|
Jodi J. Allen
|
53
|
1
|
Executive Vice President and Chief Marketing Officer
|
|||
|
Richard J. Frecker
|
50
|
10
|
Executive Vice President, General Counsel and Secretary
|
|||
|
Opal G. Perry
|
47
|
—
|
Executive Vice President and Chief Information Officer
|
|||
|
Paul E. Stone
|
48
|
—
|
Executive Vice President and Chief Retail Operations Officer
|
|||
|
Richard E. Esper
|
38
|
—
|
Senior Vice President and Chief Accounting Officer
|
|||
Ms. Marinello
has served as the President and Chief Executive Officer and a director of the Company since January 2017. Ms. Marinello previously served as a Senior Advisor of Ares Management LLC, a global alternative investment manager, from March 2014 to December 2016, and as Chair, President and Chief Executive Officer of Stream Global Services, Inc., a business process outsourcing service provider, from 2010 to March 2014. Ms. Marinello served as Chair, Chief Executive Officer and President of Ceridian Corporation, a provider of human resources software and services, from 2006 to 2010 (promoted to Chair in 2007). She served in a broad range of senior roles from 1997 to 2006 at General Electric Co. ("GE"), an international industrial and technology company, including leading global, multi-billion dollar financial and services businesses and subsidiaries. During that period, she served as Chief Executive Officer and President of GE Fleet Services at GE Commercial Finance from October 2002 to October 2006 and GE Insurance Solutions from 1999 to 2002. She served as President and Chief Executive Officer of GE Financial Assurance Partnership Marketing Group, a diverse organization that includes GE’s affinity marketing business, Auto & Home Insurance business and Auto Warranty Service business, from December 2000 to October 2002. Prior to GE, Ms. Marinello served as President of the Electronic Payments Group at First Data Corporation, which provides electronic banking and commerce, debit and commercial processing to the financial services industry. She has also served in senior leadership positions at several financial institutions, including US Bank (previously First Bank Systems), Chemical Bank, Citibank and Barclays. Ms. Marinello has served as a director of Volvo Group, a multinational manufacturing company, since April 2014. Ms. Marinello served as a member of the Supervisory Board at The Nielsen Company B.V., a global information and measurement company, from July 2009 to May 2017, as a director of General Motors, a global automotive company, from July 2009 to December 2016, and as a director of RealPage, Inc., a provider of property management software and solutions, from 2015 to March 2017.
Mr. Jackson
has served as the Chief Financial Officer of the Company since September 2018. From March 2014 to August 2018, Mr. Jackson served as Chief Financial Officer of Nielsen Holdings plc, an information, data and measurement company. From 2004 to February 2014, Mr. Jackson held a variety of leadership roles at General Electric Company,
an international industrial and technology company
, most recently as Vice President and Chief Financial Officer of a division of GE Oil & Gas, an equipment supplier for the global oil and gas industry. Mr. Jackson has served on the board of directors for Eli
Lilly
& Co, a global pharmaceutical company, since October 2016 where he serves on the audit and finance committees.
Mr. Kuppuswamy
has been Chief Human Resources Officer and Executive Vice President of the Company since September 2017. Mr. Kuppuswamy served as the Chief Human Resources Officer at Baker Hughes, LLC, an industrial service company, from May 27, 2016 to September 2017. He has more than 30 years of human resources management experience, serving in Vice President roles for Baker Hughes, LLC since 2011 in Europe, Africa and Russia. From 1993 to 2011, he worked at General Electric Co., an international industrial and technology company, where he held various human resources leadership positions including at GE Global Research, GE Capital and GE Lighting divisions in the U.S and India.
33
HERTZ GLOBAL HOLDINGS, INC. AND SUBSIDIARIES
THE HERTZ CORPORATION AND SUBSIDIARIES
EXECUTIVE OFFICERS OF THE REGISTRANTS (Continued)
Ms. Allen
has been an Executive Vice President and Chief Marketing Officer of the Company since October 2017. Ms. Allen has more than 30 years of consumer experience in various leadership roles at The Procter & Gamble Company ("Proctor & Gamble"), a consumer products company. She served as Vice President and General Manager of North America Hair Care at Procter & Gamble, where she managed a cross-functional team responsible for developing portfolio strategy across six brands. Prior to that, Ms. Allen spent eight years in Baby Care and General Management and 19 years in various other key positions at Procter & Gamble.
Mr. Frecker
has served as Executive Vice President, General Counsel and Secretary of the Company since July 2016. Mr. Frecker previously served as Senior Vice President and Acting General Counsel from April 2016 to July 2016, Vice President, Deputy General Counsel from March 2013 to April 2016, Associate General Counsel from March 2011 to March 2013 and Assistant General Counsel from July 2008 to March 2011. Prior to joining the Company, Mr. Frecker was Corporate Counsel at The Children’s Place, Inc., a NASDAQ-listed children’s apparel company from February 2006 to July 2008. Previous to The Children’s Place, Mr. Frecker was in private practice at the law firm of Dorsey and Whitney LLP.
Ms. Perry
has served as the Chief Information Officer of the Company since August 2018. Ms. Perry has over 20 years of expertise in building and growing global technology organizations, leading change initiatives and managing integration activities. Prior to joining the Company, Ms. Perry served in various leadership positions at Allstate Corporation, a major insurance provider, from November 2011 to July 2018, including as Vice President of Technology and Strategic Ventures and Divisional Chief Information Officer, Claims Division, from 2016 to 2018, Interim Managing Director of Allstate Northern Ireland from 2015 to 2016, Chief Operating Officer of Allstate Technology and Strategic Ventures International from 2014 to 2016 and Vice President of Testing and Release Management from 2011 to 2014. Prior to joining Allstate, Ms. Perry served at Wells Fargo and Company, a multinational financial services company, as Vice President and Technology Area Manager of the Internet Services Group from March 2008 to November 2011 and as Technology Manager for the Home and Consumer Finance Group from February 2004 to March 2008.
Mr. Stone
has been Executive Vice President and Chief Retail Operations Officer North America of the Company since March 2018. Mr. Stone most recently served as the Chief Retail Officer at Cabela’s Inc., an outdoor outfitter retail company, from November 2015 to December 2017. Prior to joining Cabela’s Inc., Mr. Stone spent 28 years growing his career with Sam’s Club, a retail warehouse subsidiary of Walmart Inc., a multinational retail corporation, most-recently as Senior Vice President - West Division from 2007 to 2015, where he led operations upwards of 200 locations with more than 30,000 employees.
Mr. Esper
has been Senior Vice President and Chief Accounting Officer of the Company since November 2018. He previously served as Vice President and Controller of the Company beginning March 2018. From July 2010 to March 2018, Mr. Esper held a variety of financial leadership roles with Norwegian Cruise Line Holdings Ltd., a worldwide cruise line company, most recently as Vice President, Brand Finance & Strategy, and Vice President and Controller.
34
HERTZ GLOBAL HOLDINGS, INC. AND SUBSIDIARIES
THE HERTZ CORPORATION AND SUBSIDIARIES
PART II
ITEM 5. MARKET FOR REGISTRANT'S COMMON EQUITY, RELATED STOCKHOLDER MATTERS AND ISSUER PURCHASES OF EQUITY SECURITIES
HERTZ GLOBAL
Hertz Holdings' common stock trades on the New York Stock Exchange ("NYSE") under the symbol "HTZ". As of
February 18, 2019
, there were 1,432 registered holders of Hertz Holdings common stock.
Hertz Holdings paid no cash dividends on its common stock in
2018
or
2017
, and it does not expect to pay dividends on its common stock for the foreseeable future.
Hertz Holdings has a Board-approved share repurchase program that authorizes it to repurchase shares of its common stock through a variety of methods, including in the open market or through privately negotiated transactions, in accordance with applicable securities laws. It does not obligate Hertz Holdings to make any repurchases at any specific time or situation. There were no shares repurchased under this program in
2018
or
2017
. As of
December 31, 2018
, there was
$295 million
available for use for repurchases under this program.
Since Hertz Holdings does not conduct business itself, it primarily funds dividends on, and repurchases of, its common stock using dividends from Hertz or amounts borrowed under the master loan agreement. The credit agreements governing Hertz's Senior Facilities and Letter of Credit Facility restrict Hertz's ability to make dividends and certain payments, including payments to Hertz Holdings for dividends on Hertz Holdings' common stock or for share repurchases.
Recent Performance
The graph that follows compares the cumulative total stockholder return on Hertz Holdings common stock with the Russell 1000 Index and the Morningstar Rental & Leasing Services Industry Group. The periods depicted in the chart below prior to the Spin-Off reflect the performance of Old Hertz Holdings common stock and the periods subsequent to the Spin-Off depict the Hertz Holdings common stock performance. The Russell 1000 Index is included because it is comprised of the 1,000 largest publicly traded issuers. The Morningstar Rental & Leasing Services Industry Group is a published, market capitalization-weighted index representing stocks of companies that rent or lease various durable goods to the commercial and consumer market including vehicles and trucks, medical and industrial equipment, appliances, tools and other miscellaneous goods, including Hertz Holdings. The results are based on an assumed $100 invested on December 31, 2013, at the market close, through
December 31, 2018
.
35
HERTZ GLOBAL HOLDINGS, INC. AND SUBSIDIARIES
THE HERTZ CORPORATION AND SUBSIDIARIES
ITEM 5. MARKET FOR REGISTRANT'S COMMON EQUITY, RELATED STOCKHOLDER MATTERS AND ISSUER PURCHASES OF EQUITY SECURITIES (Continued)
COMPARISON OF CUMULATIVE TOTAL RETURN AMONG HERTZ GLOBAL HOLDINGS, INC.,
RUSSELL 1000 INDEX AND MORNINGSTAR RENTAL & LEASING SERVICES
INDUSTRY GROUP
ASSUMES DIVIDEND REINVESTMENT

Equity Compensation Information
The following table summarizes the securities authorized for issuance pursuant to our equity compensation plans as of
December 31, 2018
:
|
Equity compensation plans approved by security holders
|
Number of securities to
be issued upon exercise
of outstanding options,
warrants and rights
(a)
|
Weighted average exercise price of outstanding options and RSU's / PSU's
(b)
|
Number of securities
remaining available for
future issuance under
equity compensation
plans (excluding
securities reflected in
column (a))
(c)
|
|||||||
|
Stock Options
|
1,170,318
|
|
$
|
30.44
|
|
4,068,027
|
|
|||
|
Performance Stock Shares/Units
|
1,567,126
|
|
N/A
|
|
—
|
|
||||
|
Restricted Stock Shares/Units
|
1,122,233
|
|
N/A
|
|
—
|
|
||||
|
Total
|
3,859,677
|
|
4,068,027
|
|
||||||
HERTZ
There is no established public trading market for the common stock of Hertz. Rental Car Intermediate Holdings, LLC, which is wholly-owned by Hertz Holdings, owns all of the outstanding common stock of Hertz.
Hertz did not pay dividends to Hertz Holdings in
2018
or
2017
. The credit agreements governing Hertz's Senior Facilities and Letter of Credit Facility restrict Hertz's ability to make dividends and certain payments to Hertz Holdings.
36
HERTZ GLOBAL HOLDINGS, INC. AND SUBSIDIARIES
ITEM 6. SELECTED FINANCIAL DATA
HERTZ GLOBAL
The selected statement of operations data for the years ended
December 31, 2018, 2017 and 2016
and the selected balance sheet data as of
December 31, 2018 and 2017
were derived from the audited consolidated financial statements of Hertz Global included in this
2018
Annual Report under the caption Item 8, "Financial Statements and Supplementary Data.” The selected statement of operations data for the years ended December 31, 2015 and 2014 and the selected balance sheet data as of December 31, 2016, 2015 and 2014 were derived from audited consolidated financial statements of Hertz Global and Old Hertz Holdings, not included in this
2018
Annual Report, as updated to reflect the equipment rental business and certain parent legal entities as discontinued operations.
The information set forth below is not necessarily indicative of results of future operations, and should be read in conjunction with Item 7, “Management’s Discussion and Analysis of Financial Condition and Results of Operations” and the audited consolidated financial statements and related notes thereto of Hertz Global included in this
2018
Annual Report under the caption Item 8, "Financial Statements and Supplementary Data,” to fully understand factors that may affect the comparability of the information presented below. The selected consolidated financial data in this section is not intended to replace the audited consolidated financial statements of Hertz Global.
|
(In millions, except per share data)
|
Years Ended December 31,
|
||||||||||||||||||
|
Statement of Operations Data
|
2018
|
2017
|
2016
|
2015
|
2014
|
||||||||||||||
|
Revenues:
|
|||||||||||||||||||
|
Worldwide vehicle rental
(a)
|
$
|
8,756
|
|
$
|
8,163
|
|
$
|
8,211
|
|
$
|
8,434
|
|
$
|
8,907
|
|
||||
|
All other operations
|
748
|
|
640
|
|
592
|
|
583
|
|
568
|
|
|||||||||
|
Total revenues
|
9,504
|
|
8,803
|
|
8,803
|
|
9,017
|
|
9,475
|
|
|||||||||
|
Expenses:
|
|||||||||||||||||||
|
Direct vehicle and operating
|
5,355
|
|
4,958
|
|
4,932
|
|
5,055
|
|
5,458
|
|
|||||||||
|
Depreciation of revenue earning vehicles and lease charges, net
|
2,690
|
|
2,798
|
|
2,601
|
|
2,433
|
|
2,705
|
|
|||||||||
|
Selling, general and administrative
|
1,017
|
|
880
|
|
899
|
|
873
|
|
936
|
|
|||||||||
|
Interest expense, net:
|
|||||||||||||||||||
|
Vehicle
|
448
|
|
331
|
|
280
|
|
253
|
|
277
|
|
|||||||||
|
Non-vehicle
|
291
|
|
306
|
|
344
|
|
346
|
|
340
|
|
|||||||||
|
Total interest expense, net
|
739
|
|
637
|
|
624
|
|
599
|
|
617
|
|
|||||||||
|
Goodwill and intangible asset impairments
|
—
|
|
86
|
|
292
|
|
40
|
|
—
|
|
|||||||||
|
Other (income) expense, net
|
(40
|
)
|
19
|
|
(75
|
)
|
(115
|
)
|
(10
|
)
|
|||||||||
|
Total expenses
|
9,761
|
|
9,378
|
|
9,273
|
|
8,885
|
|
9,706
|
|
|||||||||
|
Income (loss) from continuing operations before income taxes
|
(257
|
)
|
(575
|
)
|
(470
|
)
|
|
132
|
|
(231
|
)
|
||||||||
|
Income tax (provision) benefit
(b)
|
30
|
|
902
|
|
(4
|
)
|
(17
|
)
|
17
|
|
|||||||||
|
Net income (loss) from continuing operations
|
(227
|
)
|
327
|
|
(474
|
)
|
115
|
|
(214
|
)
|
|||||||||
|
Net income (loss) from discontinued operations
|
—
|
|
—
|
|
(17
|
)
|
158
|
|
132
|
|
|||||||||
|
Net income (loss)
|
(227
|
)
|
327
|
|
(491
|
)
|
273
|
|
(82
|
)
|
|||||||||
|
Net (income) loss attributable to noncontrolling interests
|
2
|
|
—
|
|
—
|
|
—
|
|
—
|
|
|||||||||
|
Net income (loss) attributable to Hertz Global
|
$
|
(225
|
)
|
$
|
327
|
|
$
|
(491
|
)
|
$
|
273
|
|
$
|
(82
|
)
|
||||
|
Weighted average shares outstanding:
(c)
|
|||||||||||||||||||
|
Basic
|
84
|
|
83
|
|
84
|
|
90
|
|
91
|
|
|||||||||
|
Diluted
|
84
|
|
83
|
|
84
|
|
91
|
|
91
|
|
|||||||||
|
Earnings (loss) per share:
|
|
|
|||||||||||||||||
|
Basic earnings (loss) per share
|
$
|
(2.68
|
)
|
$
|
3.94
|
|
$
|
(5.85
|
)
|
$
|
3.03
|
|
$
|
(0.90
|
)
|
||||
|
Diluted earnings (loss) per share
|
$
|
(2.68
|
)
|
$
|
3.94
|
|
$
|
(5.85
|
)
|
$
|
3.00
|
|
$
|
(0.90
|
)
|
||||
37
HERTZ GLOBAL HOLDINGS, INC. AND SUBSIDIARIES
ITEM 6. SELECTED FINANCIAL DATA (Continued)
|
(In millions)
|
As of December 31,
|
||||||||||||||||||
|
Balance Sheet Data
|
2018
|
2017
|
2016
|
2015
|
2014
(e)
|
||||||||||||||
|
Cash and cash equivalents
|
$
|
1,127
|
|
$
|
1,072
|
|
$
|
816
|
|
$
|
474
|
|
$
|
474
|
|
||||
|
Total assets
(d)
|
21,382
|
|
20,058
|
|
19,155
|
|
23,514
|
|
23,904
|
|
|||||||||
|
Total debt
|
16,324
|
|
14,865
|
|
13,541
|
|
15,770
|
|
15,720
|
|
|||||||||
|
Total equity attributable to Hertz Global
(f)
|
1,061
|
|
1,520
|
|
1,075
|
|
2,019
|
|
2,464
|
|
|||||||||
|
(a)
|
Includes U.S. Rental Car and International Rental Car segments.
|
|
(b)
|
Income tax (provision) benefit for 2018 and 2017 includes the effects of the TCJA, which contained wide-ranging changes to the U.S. tax structure, as further disclosed in
Note 13
, "
Income Tax (Provision) Benefit
," to the Notes to our consolidated financial statements included in this 2018 Annual Report under the caption Item 8, "Financial Statements and Supplementary Data."
|
|
(c)
|
Weighted average shares outstanding used to calculate basic and diluted earnings (loss) per share has been adjusted for the one-to-five distribution ratio in connection with the Spin-Off for the period in 2016 prior to the Spin-Off and for the years ended December 31,
2015
, and
2014
. See
Note 18
, "
Equity and Earnings (Loss) Per Share - Hertz Global
," to the Notes to our consolidated financial statements included in this 2018 Annual Report under the caption Item 8, "Financial Statements and Supplementary Data" for additional information.
|
|
(d)
|
The balance of total assets as of December 31,
2015
, and
2014
include the assets of the equipment rental operations and certain parent legal entities that were spun-off on June 30, 2016.
|
|
(e)
|
Balance sheet data in this table for 2014 includes the reclassification of certain debt issuance costs from assets to liabilities in conformity with other periods presented.
|
|
(f)
|
Total equity as of December 31, 2018 includes the net adjustment recorded to accumulated deficit of
$178 million
upon adoption of guidance impacting revenue recognition and reporting comprehensive income as further disclosed in
Note 2
, "
Significant Accounting Policies
" to the Notes to our consolidated financial statements included in this 2018 Annual Report under the caption Item 8, "Financial Statements and Supplementary Data."
|
HERTZ
The selected statement of operations data for the years ended
December 31, 2018, 2017 and 2016
and the selected balance sheet data as of
December 31, 2018 and 2017
were derived from the audited consolidated financial statements of Hertz included in this
2018
Annual Report under the caption Item 8, "Financial Statements and Supplementary Data.” The selected statement of operations data for the years ended December 31, 2015 and 2014 and the selected balance sheet data as of December 31, 2016, 2015 and 2014 were derived from audited consolidated financial statements of Hertz, not included in this
2018
Annual Report, as updated to reflect the equipment rental business as discontinued operations.
The information set forth below is not necessarily indicative of results of future operations, and should be read in conjunction with Item 7, “Management’s Discussion and Analysis of Financial Condition and Results of Operations” and the audited consolidated financial statements and related notes thereto of Hertz included in this
2018
Annual Report under the caption Item 8, "Financial Statements and Supplementary Data,” to fully understand factors that may affect the comparability of the information presented below. The selected consolidated financial data in this section is not intended to replace the audited consolidated financial statements of Hertz.
38
THE HERTZ CORPORATION AND SUBSIDIARIES
ITEM 6. SELECTED FINANCIAL DATA (Continued)
|
(In millions)
|
Years Ended December 31,
|
||||||||||||||||||
|
Statement of Operations Data
|
2018
|
2017
|
2016
|
2015
|
2014
|
||||||||||||||
|
Revenues:
|
|||||||||||||||||||
|
Worldwide vehicle rental
(a)
|
$
|
8,756
|
|
$
|
8,163
|
|
$
|
8,211
|
|
$
|
8,434
|
|
$
|
8,907
|
|
||||
|
All other operations
|
748
|
|
640
|
|
592
|
|
583
|
|
568
|
|
|||||||||
|
Total revenues
|
9,504
|
|
8,803
|
|
8,803
|
|
9,017
|
|
9,475
|
|
|||||||||
|
Expenses:
|
|
|
|||||||||||||||||
|
Direct vehicle and operating
|
5,355
|
|
4,958
|
|
4,932
|
|
5,055
|
|
5,458
|
|
|||||||||
|
Depreciation of revenue earning vehicles and lease charges, net
|
2,690
|
|
2,798
|
|
2,601
|
|
2,433
|
|
2,705
|
|
|||||||||
|
Selling, general and administrative
|
1,017
|
|
880
|
|
899
|
|
873
|
|
936
|
|
|||||||||
|
Interest expense, net:
|
|||||||||||||||||||
|
Vehicle
|
448
|
|
331
|
|
280
|
|
253
|
|
277
|
|
|||||||||
|
Non-vehicle
|
284
|
|
301
|
|
343
|
|
346
|
|
340
|
|
|||||||||
|
Total interest expense, net
|
732
|
|
632
|
|
623
|
|
599
|
|
617
|
|
|||||||||
|
Goodwill and intangible asset impairments
|
—
|
|
86
|
|
292
|
|
40
|
|
—
|
|
|||||||||
|
Other (income) expense, net
|
(40
|
)
|
19
|
|
(75
|
)
|
(115
|
)
|
(10
|
)
|
|||||||||
|
Total expenses
|
9,754
|
|
9,373
|
|
9,272
|
|
8,885
|
|
9,706
|
|
|||||||||
|
Income (loss) from continuing operations before income taxes
|
(250
|
)
|
(570
|
)
|
(469
|
)
|
132
|
|
(231
|
)
|
|||||||||
|
Income tax (provision) benefit
(b)
|
28
|
|
902
|
|
(4
|
)
|
(17
|
)
|
17
|
|
|||||||||
|
Net income (loss) from continuing operations
|
(222
|
)
|
332
|
|
(473
|
)
|
115
|
|
(214
|
)
|
|||||||||
|
Net income (loss) from discontinued operations
|
—
|
|
—
|
|
(15
|
)
|
161
|
|
136
|
|
|||||||||
|
Net income (loss)
|
(222
|
)
|
332
|
|
(488
|
)
|
276
|
|
(78
|
)
|
|||||||||
|
Net (income) loss attributable to noncontrolling interests
|
2
|
|
—
|
|
—
|
|
—
|
|
—
|
|
|||||||||
|
Net income (loss) attributable to Hertz
|
$
|
(220
|
)
|
$
|
332
|
|
$
|
(488
|
)
|
$
|
276
|
|
$
|
(78
|
)
|
||||
|
(In millions)
|
As of December 31,
|
||||||||||||||||||
|
Balance Sheet Data
|
2018
|
2017
|
2016
|
2015
|
2014
(d)
|
||||||||||||||
|
Cash and cash equivalents
|
$
|
1,127
|
|
$
|
1,072
|
|
$
|
816
|
|
$
|
474
|
|
$
|
474
|
|
||||
|
Total assets
(c)
|
21,382
|
|
20,058
|
|
19,155
|
|
23,509
|
|
23,999
|
|
|||||||||
|
Total debt
|
16,324
|
|
14,865
|
|
13,541
|
|
15,770
|
|
15,720
|
|
|||||||||
|
Total equity attributable to Hertz
(f)
|
1,059
|
|
1,520
|
|
1,075
|
|
1,948
|
|
2,495
|
|
|||||||||
|
(a)
|
Includes U.S. Rental Car and International Rental Car segments.
|
|
(b)
|
Income tax (provision) benefit for 2018 and 2017 includes the effects of the TCJA, which contained wide-ranging changes to the U.S. tax structure, as further disclosed in
Note 13
, "
Income Tax (Provision) Benefit
," to the Notes to our consolidated financial statements included in this 2018 Annual Report under the caption Item 8, "Financial Statements and Supplementary Data."
|
|
(c)
|
The balance of total assets as of December 31,
2015
, and
2014
include the assets of the equipment rental operations that were spun-off on June 30, 2016.
|
|
(d)
|
Balance sheet data in this table for 2014 includes the reclassification of certain debt issuance costs from assets to liabilities in conformity with other periods presented.
|
|
(f)
|
Total equity as of December 31, 2018 includes the net adjustment recorded to accumulated deficit of
$178 million
upon adoption of guidance impacting revenue recognition and reporting comprehensive income as further disclosed in
Note 2
, "
Significant Accounting Policies
" to the Notes to our consolidated financial statements included in this 2018 Annual Report under the caption Item 8, "Financial Statements and Supplementary Data."
|
39
HERTZ GLOBAL HOLDINGS, INC. AND SUBSIDIARIES
THE HERTZ CORPORATION AND SUBSIDIARIES
|
ITEM 7.
|
MANAGEMENT'S DISCUSSION AND ANALYSIS OF FINANCIAL CONDITION AND RESULTS OF OPERATIONS
|
Hertz Global Holdings, Inc. (together with its consolidated subsidiaries and variable interest entities, “Hertz Global”) is a holding company and its principal, wholly-owned subsidiary is The Hertz Corporation (together with its consolidated subsidiaries and variable interest entities, "Hertz"). Hertz Global consolidates Hertz for financial statement purposes, and Hertz comprises approximately the entire balance of Hertz Global’s assets, liabilities and operating cash flows. In addition, Hertz’s operating revenues and operating expenses comprise nearly 100% of Hertz Global’s revenues and operating expenses. As such, Management's Discussion and Analysis of Financial Condition and Results of Operations ("MD&A") that follows herein is for Hertz and also applies to Hertz Global in all material respects, unless noted. Differences between the operations and results of Hertz and Hertz Global are separately disclosed and explained. We sometimes use the words “we,” “our,” “us,” and the “Company” in this MD&A for disclosures that relate to all of Hertz and Hertz Global.
The statements in MD&A regarding industry outlook, our expectations regarding the performance of our business and the other non-historical statements are forward-looking statements. These forward-looking statements are subject to numerous risks and uncertainties, including, but not limited to, the risks and uncertainties described in Item 1A, "Risk Factors.” The following MD&A provides information that we believe to be relevant to an understanding of our consolidated financial condition and results of operations. Our actual results may differ materially from those contained in or implied by any forward-looking statements. You should read the following MD&A together with the sections entitled “Cautionary Note Regarding Forward-Looking Statements,” Item 1A, "Risk Factors,” Item 6, "Selected Financial Data” and our consolidated financial statements and related notes included in this
2018
Annual Report under the caption Item 8, "Financial Statements and Supplementary Data.”
In this MD&A we refer to certain key metrics and non-GAAP measures, including the following:
|
•
|
Adjusted Pre-tax Income (Loss) - important to management because it allows management to assess the operational performance of our business, exclusive of certain items and allows management to assess the performance of the entire business on the same basis as the segment measure of profitability. Management believes that it is important to investors for the same reasons it is important to management and because it allows them to assess our operational performance on the same basis that management uses internally.
|
|
•
|
Net Depreciation Per Unit Per Month - important to management and investors as depreciation of revenue earning vehicles and lease charges is one of our largest expenses for the vehicle rental business and is driven by the number of vehicles, expected residual values at the expected time of disposal and expected hold period of the vehicles. Net Depreciation Per Unit Per Month is reflective of how we are managing the costs of our vehicles and facilitates a comparison with other participants in the vehicle rental industry.
|
|
•
|
Total Revenue Per Transaction Day ("Total RPD," also referred to as "pricing") - important to management and investors as it represents a measurement of the changes in underlying pricing in the vehicle rental business and encompasses the elements in vehicle rental pricing that management has the ability to control.
|
|
•
|
Total Revenue Per Unit Per Month ("Total RPU") - important to management and investors as it provides a measure of revenue productivity relative to the total number of vehicles in our fleet whether owned or leased ("Average Vehicles" or "fleet capacity").
|
|
•
|
Transaction Days - important to management and investors as it represents the number of revenue generating days ("volume"). It is used as a component to measure Total RPD and Vehicle Utilization. Transaction Days represent the total number of 24-hour periods, with any partial period counted as one Transaction Day, that vehicles were on rent (the period between when a rental contract is opened and closed) in a given period. Thus, it is possible for a vehicle to attain more than one Transaction Day in a 24-hour period.
|
|
•
|
Vehicle Utilization - important to management and investors because it is the measurement of the proportion of our vehicles that are being used to generate revenues relative to fleet capacity. Higher Vehicle Utilization means more vehicles are being utilized to generate revenue.
|
Key metrics and non-GAAP measures should not be considered in isolation and should not be considered superior to, or a substitute for, financial measures calculated in accordance with U.S. GAAP. The above key metrics and non-GAAP
40
HERTZ GLOBAL HOLDINGS, INC. AND SUBSIDIARIES
THE HERTZ CORPORATION AND SUBSIDIARIES
|
ITEM 7.
|
MANAGEMENT'S DISCUSSION AND ANALYSIS OF FINANCIAL CONDITION AND RESULTS OF OPERATIONS (Continued)
|
measures are defined, and the non-GAAP measures are reconciled to their most comparable U.S. GAAP measure, in the "Footnotes to the Results of Operations and Selected Operating Data by Segment Tables" section of this MD&A.
OVERVIEW OF OUR BUSINESS AND OPERATING ENVIRONMENT
We are engaged principally in the business of renting vehicles primarily through our Hertz, Dollar and Thrifty brands. In addition to vehicle rental, we provide integrated vehicle leasing and fleet management solutions through our Donlen subsidiary. We have a diversified revenue base and a highly variable cost structure and are able to adjust fleet capacity, the most significant determinant of our costs, over time to meet expectations of market demand. Our profitability is primarily a function of the volume, mix and pricing of rental transactions and the utilization of vehicles, the related ownership cost of vehicles and other operating costs. Significant changes in the purchase price or residual values of vehicles or interest rates can have a significant effect on our profitability depending on our ability to adjust pricing for these changes. We continue to balance our mix of non-program and program vehicles based on market conditions, including residual values. Our business requires significant expenditures for vehicles, and consequently we require substantial liquidity to finance such expenditures. See "Liquidity and Capital Resources" below.
Our strategy includes optimization of our vehicle rental operations, disciplined performance management and evaluation of all locations and the pursuit of same-store sales growth.
Our total revenues primarily are derived from rental and related charges and consist of:
|
•
|
Worldwide vehicle rental revenues - revenues from all company-operated vehicle rental operations, including charges to customers for the reimbursement of costs incurred relating to airport concession fees and vehicle license fees, the fueling of vehicles and revenues associated with value-added services, including the sale of loss or collision damage waivers, liability insurance coverage, parking and other products and fees. Also included are ancillary revenues associated with retail vehicle sales and certain royalty fees from our franchisees (such fees are less than 2% of total revenues each period); and
|
|
•
|
All other operations revenues - revenues from vehicle leasing and fleet management services by our Donlen business and other business activities.
|
Our expenses primarily consist of:
|
•
|
Direct vehicle and operating expense ("DOE") (primarily wages and related benefits; commissions and concession fees paid to airport authorities, travel agents and others; facility, self-insurance and reservation costs; and other costs relating to the operation and rental of revenue earning vehicles, such as damage, maintenance and fuel costs);
|
|
•
|
Depreciation expense and lease charges, net relating to revenue earning vehicles (including net gains or losses on the disposal of such vehicles);
|
|
•
|
Selling, general and administrative expense ("SG&A") which includes costs for information technology and finance transformation programs; and
|
|
•
|
Interest expense, net.
|
Generally, between 70% and 75% of our annual operating costs represent variable costs, while the remaining costs are fixed or semi-fixed. To accommodate increased demand, we increase our available fleet and staff. As demand declines, fleet and staff are decreased accordingly. A number of our other major operating costs, including airport concession fees, commissions and vehicle liability expenses, are directly related to revenues or transaction volumes. In addition, our management expects to utilize enhanced process improvements, including utilization initiatives and the use of our information technology systems, to help manage our variable costs. We also maintain a flexible workforce, with a significant number of part-time and seasonal workers. Certain operating expenses, including real estate taxes, rent, insurance, utilities, facility-related expenses, the costs of operating our information technology systems and minimum staffing costs, remain fixed and cannot be adjusted for demand.
41
HERTZ GLOBAL HOLDINGS, INC. AND SUBSIDIARIES
THE HERTZ CORPORATION AND SUBSIDIARIES
|
ITEM 7.
|
MANAGEMENT'S DISCUSSION AND ANALYSIS OF FINANCIAL CONDITION AND RESULTS OF OPERATIONS (Continued)
|
In addition to our typical expenses, we have been incurring costs associated with our multi-year initiatives to upgrade and modernize our information technology and finance systems and processes which have been a tailwind for the Company. These investments will enable new product and service offerings and drive future productivity of the Company. We intend to continue these investments through 2019 as we near the end of our transformation.
Our Business Segments
We have identified three reportable segments, which are organized based on the products and services provided by our operating segments and the geographic areas in which our operating segments conduct business, as follows:
|
•
|
U.S. RAC - Rental of vehicles, as well as sales of value-added services, in the U.S.;
|
|
•
|
International RAC - Rental and leasing of vehicles, as well as sales of value-added services, internationally; and
|
|
•
|
All Other Operations - Comprised primarily of our Donlen business, which provides vehicle leasing and fleet management services, and other business activities.
|
In addition to the above reportable segments, we have Corporate operations. We assess performance and allocate resources based upon the financial information for our operating segments.
Fleet
We periodically review and adjust the mix between program and non-program vehicles in our fleet in an effort to optimize the mix of vehicles. Program vehicles generally provide us with flexibility to increase or reduce the size of our fleet based on market demand. When we increase the percentage of program vehicles, the average age of our fleet decreases since the average holding period for program vehicles is shorter than for non-program vehicles. We dispose of our non-program vehicles via auction, dealer-direct and our retail locations. Non-program vehicles disposed of through our retail outlets allow us the opportunity for ancillary retail vehicle sales revenue, such as warranty, financing and title fees. We adjust the ratio of program and non-program vehicles in our fleet as needed based on contract negotiations and the economic environment pertaining to our industry.
2018
Operating Overview
The following provides an overview of our business and financial performance and key factors influencing our results for the year ended December 31, 2018 versus 2017.
|
•
|
U.S. RAC
|
◦
Total revenues
increase
d
$486 million
, or
8%
|
◦
|
Total RPD
increase
d
1%
, and Total RPU
increase
d
3%
|
|
◦
|
Transaction Days
increase
d
6%
|
|
◦
|
Depreciation of revenue earning vehicles and lease charges, net
decrease
d
12%
to
$1.7 billion
|
|
◦
|
Net Depreciation Per Unit Per Month
decrease
d
16%
to
$276
|
|
◦
|
Vehicle Utilization
increase
d
140
basis points ("bps") (
81%
versus
79%
)
|
|
◦
|
DOE as a percentage of total revenues
increase
d
100
bps (
62%
versus
61%
)
|
|
◦
|
SG&A as a percentage of total revenues was flat at
7%
|
42
HERTZ GLOBAL HOLDINGS, INC. AND SUBSIDIARIES
THE HERTZ CORPORATION AND SUBSIDIARIES
|
ITEM 7.
|
MANAGEMENT'S DISCUSSION AND ANALYSIS OF FINANCIAL CONDITION AND RESULTS OF OPERATIONS (Continued)
|
•
International RAC
|
◦
|
Total revenues
increase
d
$107 million
, or
5%
, and
increase
d
$58 million
, or
3%
, excluding the impact of foreign currency exchange at average rates ("fx")
|
|
◦
|
Total RPD
increase
d
3%
, and Total RPU
increase
d
2%
|
|
◦
|
Transaction Days were flat
|
|
◦
|
Depreciation of revenue earning vehicles and lease charges, net
increase
d
8%
to
$448 million
, and
increase
d
$20 million
, or
5%
, excluding fx
|
|
◦
|
Net Depreciation Per Unit Per Month
increase
d
3%
to
$209
|
|
◦
|
Vehicle Utilization was
77%
,
a
decrease
of
80
bps
|
|
◦
|
DOE as a percentage of total revenues
decrease
d
130
bps (
57%
versus
59%
)
|
|
◦
|
SG&A as a percentage of total revenues
increase
d
60
bps (
11%
versus
10%
)
|
|
•
|
Recorded
$98 million
in expenses during
2018
associated with our information technology and finance transformation programs compared to
$68 million
during
2017
.
|
For more information on the above, see the discussion of our results on a consolidated basis and by segment that follows herein.
Adoption of the new Revenue Standard
Effective January 1, 2018, we adopted the new revenue standard, Topic 606, which resulted in a net increase to beginning accumulated deficit in the amount of $189 million related to the cumulative effect of our loyalty program. The adoption of Topic 606 did not have a significant impact to our results of operations for the year ended December 31, 2018. See the
Revenue from Contracts with Customers
section in the Notes to our consolidated financial statements included in this
2018
Annual Report under the caption Item 8, "Financial Statements and Supplementary Data"
Note 2
,
"
Significant Accounting Policies
" for further information.
Tax Reform
As discussed in our Annual Report on Form 10-K for the fiscal year ended December 31, 2017, we recognized the income tax effects of the TCJA in our 2017 financial statements and recorded a provisional estimate of a discrete net tax benefit of
$679 million
. As of December 31, 2018, we have finalized our accounting for the tax effects of the TCJA and, as a result, recorded net tax expense of
$22 million
in 2018. We have elected a policy to account for taxes on global intangible low-taxed income ("GILTI") as incurred and continue to assert indefinite reinvestment on certain of our foreign earnings.
See
Note 13
, "
Income Tax (Provision) Benefit
," to the Notes to our consolidated financial statements included in this
2018
Annual Report under the caption Item 8, "Financial Statements and Supplementary Data" for more information.
43
HERTZ GLOBAL HOLDINGS, INC. AND SUBSIDIARIES
THE HERTZ CORPORATION AND SUBSIDIARIES
|
ITEM 7.
|
MANAGEMENT'S DISCUSSION AND ANALYSIS OF FINANCIAL CONDITION AND RESULTS OF OPERATIONS (Continued)
|
CONSOLIDATED RESULTS OF OPERATIONS - HERTZ
|
Years Ended December 31,
|
Percent Increase/(Decrease)
|
||||||||||||||||
|
($ In millions)
|
2018
|
2017
|
2016
|
2018 vs. 2017
|
2017 vs. 2016
|
||||||||||||
|
Total revenues
|
$
|
9,504
|
|
$
|
8,803
|
|
$
|
8,803
|
|
8
|
%
|
—
|
%
|
||||
|
Direct vehicle and operating expenses
|
5,355
|
|
4,958
|
|
4,932
|
|
8
|
|
1
|
|
|||||||
|
Depreciation of revenue earning vehicles and lease charges, net
|
2,690
|
|
2,798
|
|
2,601
|
|
(4
|
)
|
8
|
|
|||||||
|
Selling, general and administrative expenses
|
1,017
|
|
880
|
|
899
|
|
16
|
|
(2
|
)
|
|||||||
|
Interest expense, net:
|
|||||||||||||||||
|
Vehicle
|
448
|
|
331
|
|
280
|
|
35
|
|
18
|
|
|||||||
|
Non-vehicle
|
284
|
|
301
|
|
343
|
|
(6
|
)
|
(12
|
)
|
|||||||
|
Interest expense, net
|
732
|
|
632
|
|
623
|
|
16
|
|
1
|
|
|||||||
|
Goodwill and intangible asset impairments
|
—
|
|
86
|
|
292
|
|
(100
|
)
|
(71
|
)
|
|||||||
|
Other (income) expense, net
|
(40
|
)
|
19
|
|
(75
|
)
|
NM
|
|
NM
|
|
|||||||
|
Income (loss) from continuing operations, before income taxes
|
(250
|
)
|
(570
|
)
|
(469
|
)
|
(56
|
)
|
22
|
|
|||||||
|
Income tax (provision) benefit
|
28
|
|
902
|
|
(4
|
)
|
(97
|
)
|
NM
|
|
|||||||
|
Net income (loss) from continuing operations
|
(222
|
)
|
332
|
|
(473
|
)
|
NM
|
|
NM
|
|
|||||||
|
Net income (loss) from discontinued operations
|
—
|
|
—
|
|
(15
|
)
|
—
|
|
NM
|
|
|||||||
|
Net income (loss)
|
(222
|
)
|
332
|
|
(488
|
)
|
NM
|
|
NM
|
|
|||||||
|
Net (income) loss attributable to noncontrolling interests
|
2
|
|
—
|
|
—
|
|
NM
|
|
NM
|
|
|||||||
|
Net income (loss) attributable to Hertz
|
$
|
(220
|
)
|
$
|
332
|
|
$
|
(488
|
)
|
NM
|
|
NM
|
|
||||
|
Adjusted Pre-tax Income
(Loss)
(a)
|
$
|
(12
|
)
|
$
|
(205
|
)
|
$
|
66
|
|
(94
|
)
|
NM
|
|
||||
Footnotes to the table above are shown at the end of the Results of Operations and Selected Operating Data by Segment section of this MD&A.
NM - Not meaningful
Year Ended
December 31, 2018
Compared with Year Ended
December 31, 2017
Total revenues
increase
d $
701 million
, or
8%
, due to an increase of $
486 million
, $
108 million
and $
107 million
in our U.S. RAC, All Other Operations and International RAC segments, respectively. U.S. RAC revenues
increase
d due to a
6%
increase in volume and a
1%
increase
in Total RPD. Total revenues in our All Other Operations segment was largely driven by an increase in the number of vehicles leased under
sales-type leases.
International RAC revenues increased due to a
3%
increase
in Total RPD and a
$49 million
fx impact.
DOE
increase
d $
397 million
, or
8%
, primarily due to increases of $
363 million
and $
33 million
in our U.S. and International RAC segments, respectively. The
increase
in our U.S. RAC segment was primarily due to increased core rental volumes (those excluding TNC rentals) and TNC rental volumes and investments in additional personnel related to our transformation initiatives. DOE for International RAC increased due to a
$31 million
fx impact.
Depreciation of revenue earning vehicles and lease charges, net
decrease
d $
108 million
, or
4%
, primarily due to a $
226 million
decrease
in our U.S. RAC segment resulting from stronger residual values and an increase in dispositions through higher-yielding dealer direct and retail sales channels. The
decrease
was partially offset by an increase of
$86 million
and $
32 million
in our All Other Operations and International RAC segments, respectively. The increase in All Other Operations was largely driven by an increase in the number of vehicles leased under
sales-type leases
. Excluding a $
12 million
fx impact, depreciation of revenue earning vehicles and lease charges, net for our International RAC
44
HERTZ GLOBAL HOLDINGS, INC. AND SUBSIDIARIES
THE HERTZ CORPORATION AND SUBSIDIARIES
|
ITEM 7.
|
MANAGEMENT'S DISCUSSION AND ANALYSIS OF FINANCIAL CONDITION AND RESULTS OF OPERATIONS (Continued)
|
segment
increase
d $
20 million
driven by declining residual values on diesel vehicles in Europe and an increase in average vehicles.
SG&A
increase
d $
137 million
, or
16%
, in 2018 compared to 2017, due to increases of
$74 million
and
$36 million
in our U.S. RAC segment and our Corporate operations, respectively. The increase in our U.S. RAC segment was primarily due to incremental marketing investments, additional advertising charges and increased marketing personnel,
partially offset by decreased charges for labor-related matters. The increase in our Corporate operations was primarily due to information technology and finance transformation program costs, litigation charges and incentive compensation, partially offset by decreased legal fees.
Vehicle interest expense, net
increase
d $
117 million
, or
35%
, in 2018 compared to 2017 primarily due to higher market interest rates, an increase in margins on bank funded facilities, an increase in debt levels due to higher average fleet and an increase in loss on extinguishment of debt.
Non-vehicle interest expense, net
decrease
d $
17 million
, or
6%
, in 2018 compared to 2017, primarily due to decreased outstanding non-vehicle debt balances during 2018 and a decrease in loss on extinguishment of debt, partially offset by the impact of higher interest rates largely attributable to a higher LIBOR and the issuance of our Senior Second Priority Secured Notes in June 2017.
We recorded goodwill and intangible asset impairment charges of $
86 million
related to the Dollar Thrifty tradename in 2017 with no comparable charges recorded in 2018.
Other income of
$40 million
in 2018 was primarily comprised of a $
20 million
gain on marketable securities, $10 million of net pension benefit income and a $6 million legal settlement related to an oil spill in the Gulf of Mexico in 2010. Other expense of
$19 million
in 2017 was primarily comprised of a $30 million impairment of an equity method investment, partially offset by a $6 million gain on the sale of our Brazil Operations.
There was loss before income taxes of
$250 million
in
2018
compared to
$570 million
in
2017
. The
$320 million
year over year favorable variance was primarily due to the impact of increased revenues, decreased depreciation expense on our revenue earning vehicles, the impact of an
$86 million
impairment charge recorded in 2017 and the increase in other income. The favorable variance was partially offset by increases in DOE, SG&A and interest expense, net.
The effective tax rate in 2018 was
11%
compared to
158%
in 2017. We recorded a tax benefit of $
28 million
in 2018 compared to $
902 million
in 2017. The effective income tax rate and related tax benefit in 2018 are less than 2017 due to deferred tax liabilities being remeasured from a federal rate of
35%
to
21%
in 2017, and the impact in 2018 of the lower federal tax rate.
Adjusted Pre-tax Loss was $
12 million
in 2018 compared to
$205 million
in 2017. See footnote (a) in the "Footnotes to the Results of Operations and Selected Operating Data by Segment Tables" for a summary and description of reconciling adjustments on a consolidated basis.
Year Ended
December 31, 2017
Compared with Year Ended
December 31, 2016
Total revenues were flat year over year. U.S. RAC revenues
decrease
d
$120 million
, which was offset by a
$72 million
increase
in our International RAC segment and a
$48 million
increase
in our All Other Operations segment. Volume and Total RPD for U.S. RAC each
decrease
d
1%
. Excluding a
$33 million
fx impact, International RAC revenues
increase
d
$39 million
, or
2%
, driven by a
3%
increase
in Transaction Days offset by a
1%
decrease
in pricing for the segment. Total revenues in our All Other Operations segment increased primarily due to an increase in Donlen's leasing and services volume.
DOE
increase
d
$26 million
year over year, or
1%
. DOE in our All Other Operations segment and our International RAC segment increased
$18 million
and
$17 million
, respectively, while DOE in U.S. RAC was comparable year over year. The
increase
in our All Other Operations segment was due to charges associated with leases that commenced in 2017. Excluding the
$17 million
fx impact, DOE for our International RAC segment was virtually flat due to a
$18 million
45
HERTZ GLOBAL HOLDINGS, INC. AND SUBSIDIARIES
THE HERTZ CORPORATION AND SUBSIDIARIES
|
ITEM 7.
|
MANAGEMENT'S DISCUSSION AND ANALYSIS OF FINANCIAL CONDITION AND RESULTS OF OPERATIONS (Continued)
|
decrease
in public liability and property damage ("PLPD") expense, offset by an
increase
of
$22 million
in transaction variable expenses.
Depreciation of revenue earning vehicles and lease charges, net
increase
d
$197 million
, or
8%
, primarily due to a
$151 million
increase
in our U.S. RAC segment resulting from higher per vehicle depreciation rates due in part to a richer vehicle mix and lower residual values and a
$27 million
increase
in our International RAC segment. Excluding the
$6 million
fx impact, depreciation of revenue earning vehicles and lease charges, net
increase
d
$21 million
, or
5%
, primarily due to an
increase
in Average Vehicles and higher per vehicle depreciation rates. There was a
$19 million
increase
in our All Other Operations segment due to
charges related to leases that commenced in 2017
.
SG&A
decrease
d
$19 million
, or
2%
, in 2017 compared to 2016, primarily due to a decrease of approximately $81 million in restructuring related expenses, litigation charges and other expenses, partially offset by a $47 million increase in advertising and other expenses and a $15 million increase in information technology and finance transformation program costs.
Vehicle interest expense, net
increase
d
$51 million
, or
18%
, in 2017 compared to 2016 primarily due to a combination of higher market interest rates, higher margins on bank funded facilities, and higher rates associated with increasing the mix of medium term funding as well as interest related to the European Vehicle Notes that were issued in the second half of 2016. The above were partially offset by a decrease of
$6 million
year over year in loss on extinguishment of debt.
Non-vehicle interest expense, net
decrease
d
$42 million
, or
12%
, in 2017 compared to 2016, primarily due to the termination of the $2.1 billion of Senior Credit Facilities in 2016, the 2016 refinancings of certain Senior Notes with the lower rate Senior Term Loan, and lower losses on the extinguishment of debt in 2017 versus 2016, partially offset by the issuance of the Senior Second Priority Secured Notes in 2017.
We recorded goodwill and intangible asset impairment charges of
$86 million
in 2017, compared to charges of
$292 million
in 2016. The 2017 impairment charges were comprised of the impairment of the Dollar Thrifty tradename in U.S. RAC. The 2016 impairment charges were comprised of a
$172 million
impairment of goodwill related to our European vehicle rental operations and a
$120 million
impairment of the Dollar Thrifty tradename in U.S. RAC.
Other expense of
$19 million
for 2017 was primarily comprised of a
$30 million
impairment of an equity method investment, partially offset by a
$6 million
gain on the sale of our Brazil Operations. Other income of
$75 million
for 2016 was primarily comprised of an
$84 million
gain on the sale of common stock of CAR Inc. and a
$9 million
settlement gain from an eminent domain case at one of our U.S. airport locations, partially offset by an
$18 million
impairment of the net assets held for sale related to our Brazil Operations.
There was loss before income taxes of
$570 million
in 2017 compared to
$469 million
in 2016. The
$101 million
year over year unfavorable variance was primarily due to the impact of increased depreciation expense on our revenue earning vehicles, the decrease in other income and increases in DOE. The unfavorable variance was partially offset by decreased goodwill and intangible asset impairment charges and decreases in SG&A.
The effective tax rate in 2017 was
158%
compared to
(1.0)%
in 2016. The Company recorded a tax benefit of
$902 million
in 2017 and a provision of
$4 million
in 2016. The change is largely due to the benefit from the TCJA of
$679 million
in 2017 and the provision of goodwill impairment in 2016. In addition, contributing factors to the reduced tax expense include a decrease in pretax operating results, the composition of operating results by jurisdiction, a change in the state statutory effective tax rates, and an increase in the valuation allowance relating to losses in certain U.S. and non-U.S. jurisdictions.
The results for discontinued operations are associated with the activities of the Old Hertz Holdings equipment rental business which was spun-off on June 30, 2016.
Adjusted Pre-tax Loss was
$205 million
in 2017 compared to Adjusted Pre-tax Income of
$66 million
in 2016. See footnote (a) in the "Footnotes to the Results of Operations and Selected Operating Data by Segment Tables" for a summary and description of reconciling adjustments on a consolidated basis.
46
HERTZ GLOBAL HOLDINGS, INC. AND SUBSIDIARIES
THE HERTZ CORPORATION AND SUBSIDIARIES
|
ITEM 7.
|
MANAGEMENT'S DISCUSSION AND ANALYSIS OF FINANCIAL CONDITION AND RESULTS OF OPERATIONS (Continued)
|
CONSOLIDATED RESULTS OF OPERATIONS - HERTZ GLOBAL
The above discussion for Hertz also applies to Hertz Global.
Hertz Global had
$7 million
,
$5 million
and $1 million of interest expense, net, during 2018, 2017 and 2016, respectively, that was incremental to the amounts shown for Hertz. These amounts represent interest associated with amounts outstanding under a master loan agreement between the companies. Hertz includes this amount as interest income in its statement of operations but this amount is eliminated in consolidation for purposes of Hertz Global. Hertz Global had $2 million of income tax benefit for 2018 that was incremental to the amounts shown for Hertz.
Hertz Global had a net loss from discontinued operations of
$2 million
in 2016 that was incremental to the amount shown for Hertz. This amount represents the net loss of the parent legal entities of Old Hertz Holdings which are deemed discontinued operations of Hertz Global but not Hertz.
RESULTS OF OPERATIONS AND SELECTED OPERATING DATA BY SEGMENT
U.S. Rental Car
As of
December 31, 2018
, our U.S. Rental Car operations had a total of approximately
4,200
corporate and franchisee locations, comprised of
1,600
airport and
2,600
off airport locations.
Depreciation rates are reviewed on a quarterly basis based on management's routine review of present and estimated future market conditions and their effect on residual values at the expected time of disposal. Depreciation rates being used to compute the provision for depreciation of revenue earning vehicles are adjusted on certain vehicles in our vehicle rental operations to reflect changes in the estimated residual values to be realized when revenue earning vehicles are sold based on the expected hold period of the vehicles. The changes in estimate, based on the reviews completed for U.S. RAC during 2018, resulted in a reduction to depreciation expense of
$60 million
. The 2018 rate changes reflected favorable residual values, particularly on mid and full-size sedans, partially offset by the impact of unfavorable residual values on large sport utility vehicles. The changes in estimate, based on the reviews completed for U.S. RAC during 2017 and 2016, resulted in net increases of
$77 million
and
$141 million
, respectively. The 2017 rate changes reflected shortened hold periods on certain non-program vehicles as we rebalanced the fleet and declining residual values primarily experienced in the first half of the year. The 2016 rate changes reflected declining residual values and a reduction in the planned hold period of the vehicles as compared to our initial estimates.
U.S. Rental Car operations sold approximately
263,000
,
280,000
and
232,000
non-program vehicles during the years ended
December 31, 2018, 2017 and 2016
, respectively. In 2018, the decrease in units sold was due to fewer non-program vehicle acquisitions during the year. In 2016, our fleet rotation was at more normalized levels, however, we did accelerate the disposal of a portion of the compact vehicle category that we acquired as part of an earlier fleet refresh in order to reduce their percentage of the fleet mix.
47
HERTZ GLOBAL HOLDINGS, INC. AND SUBSIDIARIES
THE HERTZ CORPORATION AND SUBSIDIARIES
|
ITEM 7.
|
MANAGEMENT'S DISCUSSION AND ANALYSIS OF FINANCIAL CONDITION AND RESULTS OF OPERATIONS (Continued)
|
Results of operations and our discussion and analysis for our U.S. RAC segment are as follows:
|
|
Years Ended December 31,
|
Percent Increase/(Decrease)
|
|||||||||||||||||
|
($ In millions, except as noted)
|
2018
|
2017
|
2016
|
2018 vs. 2017
|
2017 vs. 2016
|
||||||||||||||
|
Total revenues
|
$
|
6,480
|
|
$
|
5,994
|
|
$
|
6,114
|
|
8
|
%
|
(2
|
)%
|
||||||
|
Depreciation of revenue earning vehicles and lease charges, net
|
$
|
1,678
|
|
$
|
1,904
|
|
$
|
1,753
|
|
(12
|
)
|
9
|
|
||||||
|
Direct vehicle and operating expenses
|
$
|
4,014
|
|
$
|
3,651
|
|
$
|
3,646
|
|
10
|
|
—
|
|
||||||
|
Selling, general and administrative expenses
|
$
|
466
|
|
$
|
392
|
|
$
|
397
|
|
19
|
|
(1
|
)
|
||||||
|
Income (loss) from continuing operations, before income taxes
|
$
|
185
|
|
$
|
(171
|
)
|
$
|
56
|
|
NM
|
|
NM
|
|
||||||
|
Adjusted Pre-tax Income (Loss)
(a)
|
$
|
262
|
|
$
|
13
|
|
$
|
298
|
|
NM
|
|
(96
|
)
|
||||||
|
Transaction Days (in thousands)
(b)
|
149,463
|
|
140,382
|
|
142,268
|
|
6
|
|
(1
|
)
|
|||||||||
|
Average Vehicles
(c)
|
506,900
|
|
484,700
|
|
484,800
|
|
5
|
|
—
|
|
|||||||||
|
Vehicle Utilization
(c)
|
81
|
%
|
79
|
%
|
80
|
%
|
140
|
|
bps
|
(80
|
)
|
bps
|
|||||||
|
Total RPD (in whole dollars)
(d)
|
$
|
42.67
|
|
$
|
42.06
|
|
$
|
42.44
|
|
1
|
|
(1
|
)
|
||||||
|
Total RPU (in whole dollars)
(e)
|
$
|
1,049
|
|
$
|
1,015
|
|
$
|
1,038
|
|
3
|
|
(2
|
)
|
||||||
|
Net Depreciation Per Unit Per Month (in whole dollars)
(f)
|
$
|
276
|
|
$
|
327
|
|
$
|
301
|
|
(16
|
)
|
9
|
|
||||||
|
Percentage of program vehicles as of period end
|
9
|
%
|
7
|
%
|
6
|
%
|
200
|
|
bps
|
10
|
|
bps
|
|||||||
Footnotes to the table above are shown at the end of the Results of Operations and Selected Operating Data by Segment section of this MD&A.
NM - Not meaningful
Year Ended December 31, 2018
Compared with
Year Ended December 31, 2017
Total U.S. RAC revenues
increase
d
$486 million
, or
8%
, from 2017 due to higher volume and pricing. Off airport revenues comprised
31%
of total revenues for the segment in 2018 as compared to
29%
for 2017. Off airport volume increased
14%
largely driven by demand in TNC and insurance replacement rentals and airport volume was
2%
higher on increased corporate demand and volume growth in our most profitable leisure rental categories. TNC and retail rentals led the
1%
increase
in Total RPD.
Depreciation of revenue earning vehicles and lease charges, net for U.S. RAC
decrease
d by
$226 million
, or
12%
, in
2018
compared to
2017
. The
decrease
year over year was primarily the result of improved residual values and an increase in dispositions through higher-yielding dealer direct and retail sales channels. Net Depreciation Per Unit Per Month
decrease
d to
$276
in
2018
compared to
$327
in
2017
.
DOE for U.S. RAC
increase
d
$363 million
, or
10%
, of which $118 million was driven by core rental volume, $65 million was driven by growth in TNC rentals and $63 million was driven by incremental investments in additional personnel related to our transformation initiatives. Also contributing to the
increase
were the following:
|
•
|
Increased transportation expense of $31 million driven by higher rates from third-party transportation providers, increased usage and additional trucking for fleet optimization.
|
|
•
|
Increased facility expenses of $20 million primarily driven by increased rent and facility services.
|
|
•
|
Increased other vehicle expense of $16 million primarily driven by increased licensing fees in certain states.
|
|
•
|
Increased fuel expense of $16 million due to higher market fuel prices compared to 2017.
|
48
HERTZ GLOBAL HOLDINGS, INC. AND SUBSIDIARIES
THE HERTZ CORPORATION AND SUBSIDIARIES
|
ITEM 7.
|
MANAGEMENT'S DISCUSSION AND ANALYSIS OF FINANCIAL CONDITION AND RESULTS OF OPERATIONS (Continued)
|
SG&A
increase
d
$74 million
primarily due to incremental marketing investments, additional advertising charges and increased marketing personnel, partially offset by decreased charges for labor-related matters.
DOE as a percentage of total revenues for U.S. RAC was
62%
for 2018 compared to
61%
for 2017, an
increase
of
100
bps. SG&A as a percentage of total revenues for U.S. RAC was
7%
for both 2018 and 2017.
There was income before income taxes for U.S. RAC of
$185 million
in
2018
compared to loss before income taxes of
$171 million
in
2017
. The
$356 million
year over year favorable variance was primarily due to the impact of increased revenues, decreased depreciation expense on our revenue earning vehicles and the impact of an
$86 million
impairment charge recorded in 2017. The favorable variance was partially offset by increases in DOE and SG&A.
Adjusted Pre-tax Income for U.S. RAC was
$262 million
in
2018
compared to
$13 million
in
2017
. See footnote (a) in the "Footnotes to the Results of Operations and Selected Operating Data by Segment Tables" for a summary and description of reconciling adjustments on a consolidated basis.
Year Ended December 31, 2017
Compared with
Year Ended December 31, 2016
Total U.S. RAC revenues were
$6.0 billion
in 2017, a
decrease
of
$120 million
, or
2%
, from 2016. Transaction Days
decrease
d
1%
driven by a
3%
decline in our airport business offset by a
2%
increase in our off airport business. Airport Transaction Days were down due to fewer retail customer rentals and due to our decision to focus on customer mix to improve the quality of our revenue. The increase in our off airport volume primarily reflects the growth in our TNC vehicle rentals. Total RPD
decrease
d
1%
primarily due to a decline in value-added revenues and customer mix, driven by a change from higher yielding corporate contracted rentals to lower yielding TNC vehicle rentals. Off airport revenues comprised
29%
of total revenues for the segment in 2017 as compared to
27%
for 2016.
Depreciation of revenue earning vehicles and lease charges, net for U.S. RAC
increase
d by
$151 million
, or
9%
, in 2017 compared to 2016. The
increase
year over year was primarily the result of higher per vehicle depreciation rates due in part to declining residual values, a richer vehicle mix and the shortened hold periods on certain non-program vehicles as we rebalanced the fleet in 2017, partially offset by a slightly smaller average fleet. Net Depreciation Per Unit Per Month
increase
d to
$327
in 2017 compared to
$301
in 2016.
DOE for U.S. RAC was comparable in 2017
and 2016 primarily due to the following:
|
•
|
Vehicle related expenses increased $27 million year over year primarily due to:
|
|
•
|
Increased transportation expense of $21 million primarily due to repositioning the fleet in response to the hurricanes and other weather events in 2017.
|
|
•
|
Increased maintenance and other vehicle operating expense of $25 million primarily for the reconditioning of certain vehicles dedicated for use by our TNC partners.
|
|
•
|
Decreased damage and short term maintenance expense of $19 million resulting from an $18 million improvement in customer collections for damage claims resulting from process improvements and a $6 million decrease in the costs to prepare program vehicles for turn-back due to a reduction in the number of program vehicles returned to the manufacturer year over year. The improvements were partially offset by $6 million of damage charges related to the hurricanes in 2017.
|
|
•
|
Personnel related expenses increased $45 million compared to 2016, primarily due to a $43 million increase in field wages, overtime and outsourced labor due in part to new customer-oriented initiatives and an $8 million increase in benefits expense, primarily resulting from an increase in the workers compensation reserve, partially offset by a $6 million decrease in variable incentive compensation.
|
|
•
|
Transaction variable expenses decreased $39 million primarily due to decreases in optional insurance liability expense of $38 million due to favorable adjustments based on historical experience and the decrease in Transaction Days and decreased concessions of $8 million due in part to lower revenues, partially offset by higher fuel expense of $9 million due to higher market fuel prices compared to 2016.
|
49
HERTZ GLOBAL HOLDINGS, INC. AND SUBSIDIARIES
THE HERTZ CORPORATION AND SUBSIDIARIES
|
ITEM 7.
|
MANAGEMENT'S DISCUSSION AND ANALYSIS OF FINANCIAL CONDITION AND RESULTS OF OPERATIONS (Continued)
|
|
•
|
Other DOE decreased $28 million year over year primarily due to a decrease of $31 million of restructuring charges mostly comprised of an impairment of certain assets recorded in 2016 and a $12 million decrease in facility costs due in part to lower accelerated depreciation in 2017 compared to 2016 at certain of our airport locations as a result of the Hertz Ultimate Choice program rollout. The above were partially offset by $8 million of increased commissions primarily due to growth in certain airline channels and a $9 million increase in other DOE primarily due to charges associated with site improvement initiatives.
|
DOE as a percentage of total revenues for U.S. RAC was
61%
for 2017 compared to
60%
for 2016, an increase of
130
bps. SG&A as a percentage of total revenues for U.S. RAC was
7%
for 2017 compared to
6%
for 2016, an increase of
10
bps.
There was a loss before income taxes for U.S. RAC of
$171 million
in 2017 compared to income before income taxes of
$56 million
in 2016. The
$227 million
change year over year was primarily due to the impact of increased depreciation expense on our revenue earning vehicles and lower revenues, partially offset by a
$34 million
reduction in impairment charges recorded in 2017 compared to 2016 and a
decrease
of
$22 million
in interest expense, net. Additionally, in 2016 we had other income of
$12 million
primarily related to a
$9 million
settlement gain from an eminent domain case at one of our airport locations with no comparable income in 2017.
Adjusted Pre-tax Income for U.S. RAC was
$13 million
in 2017 compared to
$298 million
in 2016. See footnote (a) in the "Footnotes to the Results of Operations and Selected Operating Data by Segment Tables" for a summary and description of reconciling adjustments on a consolidated basis.
International Rental Car
As of December 31, 2018, our international vehicle rental operations had approximately
6,000
corporate and franchisee locations, comprised of
1,500
airport and
4,500
off airport locations in approximately
150
countries and regions including Australia, Canada, New Zealand and in the regions of Africa, Asia, the Caribbean, Europe, Latin America, and the Middle East.
Results of operations and our discussion and analysis for our International RAC segment are as follows:
|
Years Ended December 31,
|
Percent Increase/(Decrease)
|
||||||||||||||||||
|
($ In millions, except as noted)
|
2018
|
2017
|
2016
|
2018 vs. 2017
|
2017 vs. 2016
|
||||||||||||||
|
Total revenues
|
$
|
2,276
|
|
$
|
2,169
|
|
$
|
2,097
|
|
5
|
%
|
3
|
%
|
||||||
|
Depreciation of revenue earning vehicles and lease charges, net
|
$
|
448
|
|
$
|
416
|
|
$
|
389
|
|
8
|
|
7
|
|
||||||
|
Direct vehicle and operating expenses
|
$
|
1,306
|
|
$
|
1,273
|
|
$
|
1,256
|
|
3
|
|
1
|
|
||||||
|
Selling, general and administrative expenses
|
$
|
248
|
|
$
|
223
|
|
$
|
215
|
|
11
|
|
4
|
|
||||||
|
Income (loss) from continuing operations, before income taxes
|
$
|
166
|
|
$
|
185
|
|
$
|
(20
|
)
|
(10
|
)
|
NM
|
|
||||||
|
Adjusted Pre-tax Income (Loss)
(a)
|
$
|
204
|
|
$
|
203
|
|
$
|
194
|
|
—
|
|
5
|
|
||||||
|
Transaction Days (in thousands)
(b)
|
50,417
|
|
50,301
|
|
48,627
|
|
—
|
|
3
|
|
|||||||||
|
Average Vehicles
(c)
|
180,400
|
|
178,100
|
|
173,400
|
|
1
|
|
3
|
|
|||||||||
|
Vehicle Utilization
(c)
|
77
|
%
|
77
|
%
|
77
|
%
|
(80
|
)
|
bps
|
80
|
|
bps
|
|||||||
|
Total RPD (in whole dollars)
(d)
|
$
|
45.76
|
|
$
|
44.63
|
|
$
|
45.28
|
|
3
|
|
(1
|
)
|
||||||
|
Total RPU (in whole dollars)
(e)
|
$
|
1,066
|
|
$
|
1,050
|
|
$
|
1,058
|
|
2
|
|
(1
|
)
|
||||||
|
Net Depreciation Per Unit Per Month (in whole dollars)
(f)
|
$
|
209
|
|
$
|
202
|
|
$
|
196
|
|
3
|
|
3
|
|
||||||
|
Percentage of program vehicles as of period end
|
37
|
%
|
34
|
%
|
31
|
%
|
290
|
|
bps
|
310
|
|
bps
|
|||||||
50
HERTZ GLOBAL HOLDINGS, INC. AND SUBSIDIARIES
THE HERTZ CORPORATION AND SUBSIDIARIES
|
ITEM 7.
|
MANAGEMENT'S DISCUSSION AND ANALYSIS OF FINANCIAL CONDITION AND RESULTS OF OPERATIONS (Continued)
|
NM - Not meaningful
Year Ended
December 31, 2018
Compared with Year Ended
December 31, 2017
Total revenues for International RAC
increase
d $
107 million
, or
5%
, in 2018 compared to 2017. Excluding a $
49 million
fx impact, revenues
increase
d $
58 million
, or
3%
, driven by an increase in pricing. Total RPD for International RAC
increase
d
3%
due to improved pricing in our leisure markets and the sale of our lower RPD operations in Brazil in the third quarter of 2017. Transaction Days were flat mostly due to the sale of our Brazil Operations. Excluding the impact of the sale of our Brazil Operations, total revenues for International RAC increased $140 million, or 7%, Total RPD increased 1%, and Transaction Days increased 4%.
Depreciation of revenue earning vehicles and lease charges, net for International RAC
increase
d $
32 million
, or
8%
, in 2018 compared to 2017. Excluding a $
12 million
fx impact, depreciation of revenue earning vehicles and lease charges, net
increase
d $
20 million
or
5%
primarily due to declining residual values on diesel vehicles in Europe and an increase in average vehicles. Net Depreciation Per Unit Per Month for International RAC
increase
d
3%
to $
209
from
$202
for 2018 versus 2017.
DOE for International RAC
increase
d $
33 million
in 2018 compared to 2017. Excluding a $
31 million
fx impact, DOE was nearly flat driven by a $
35 million
decrease
in public liability and property damage expense due to favorable case development and fewer large claims. The decrease was partially offset by an
increase
of $15 million in vehicle damage charges and $
13 million
in field compensation, due in part to higher average vehicles in 2018 compared to 2017.
SG&A
increase
d $
25 million
primarily due to an increase in litigation charges in 2018 and the
$7 million
impact of fx.
DOE as a percentage of total revenues for International RAC was
57%
for 2018 compared to
59%
for 2017, a
decrease
of
130
bps, and SG&A as a percentage of total revenues for International RAC was
11%
for 2018 compared to
10%
for 2017, an
increase
of
60
bps.
Income before income taxes for International RAC was $
166 million
in 2018 compared to $
185 million
in 2017. The $
19 million
unfavorable variance year over year was primarily due to increases in DOE, SG&A and depreciation expense on our revenue earning vehicles. Additionally, there was an
increase
of $
33 million
in interest expense, net primarily due to a $
20 million
loss on extinguishment of debt associated with the redemption of the
4.375%
European Vehicle
Notes due January 2019
, higher interest rates and greater borrowings on vehicle debt. The above were partially offset by
increase
d revenues.
Adjusted Pre-tax Income for International RAC was $
204 million
in 2018 compared to
$203 million
in 2017. See footnote (a) in the "Footnotes to the Results of Operations and Selected Operating Data by Segment Tables" for a summary and description of reconciling adjustments on a consolidated basis.
Year Ended
December 31, 2017
Compared with
Year Ended December 31, 2016
Total revenues for International RAC
increase
d
$72 million
, or
3%
, in 2017 compared to 2016. Excluding the
$33 million
fx impact, revenues
increase
d
$39 million
or
2%
, driven by a
3%
increase
in Transaction Days for the segment, due to volume growth in our value brands, partially offset by a
1%
decrease
in Total RPD.
Depreciation of revenue earning vehicles and lease charges, net for International RAC
increase
d
$27 million
, or
7%
, in 2017 compared to 2016. Excluding the
$6 million
fx impact, depreciation of revenue earning vehicles and lease charges, net
increase
d
$21 million
, or
5%
, primarily due to a
3%
increase
in Average Vehicles in 2017 compared to 2016 and higher per vehicle depreciation rates. Net Depreciation Per Unit Per Month
increase
d
3%
to
$202
from
$196
for 2017 compared to 2016.
DOE for International RAC
increase
d
$17 million
in 2017 compared to 2016. Excluding the
$17 million
fx impact, DOE was flat versus the prior year primarily due to a
$18 million
decrease
in PLPD expense, offset by an
increase
of
$22 million
in transaction variable expenses, such as field compensation and concessions, due to higher rental volume in 2017 versus 2016. The
decrease
in PLPD expense primarily represents higher charges in 2016 resulting from adverse
51
HERTZ GLOBAL HOLDINGS, INC. AND SUBSIDIARIES
THE HERTZ CORPORATION AND SUBSIDIARIES
|
ITEM 7.
|
MANAGEMENT'S DISCUSSION AND ANALYSIS OF FINANCIAL CONDITION AND RESULTS OF OPERATIONS (Continued)
|
experience and case development and lower charges in 2017 as a result of utilizing a third party insurance carrier in a certain country.
SG&A for International RAC increased
$8 million
in 2017 compared to 2016 primarily resulting from enhanced advertising efforts, partially offset by a reduction in litigation charges.
DOE as a percentage of total revenues for International RAC was
59%
for 2017 compared to
60%
for 2016, a
decrease
of
120
bps, and SG&A as a percentage of total revenues for International RAC was
10%
for both 2017 and 2016.
Income before income taxes for International RAC was
$185 million
in 2017 compared to a loss before income taxes of
$20 million
in 2016. The
$205 million
change year over year is primarily due to a
$172 million
goodwill impairment charge recorded in 2016 related to our operations in Europe with no comparable charges in 2017, and an increase in revenues discussed above. Also, we had other income in 2017 of
$8 million
primarily due to the gain on the sale of our Brazil Operations, compared to other expense in 2016 of
$19 million
primarily related to an impairment of the net assets held for sale related to our Brazil Operations. The increases year over year were partially offset by an increase in depreciation expense on our revenue earning vehicles discussed above, a
$14 million
increase
in interest expense, net primarily related to the European Vehicle Notes which were issued in the second half of 2016, and an increase in SG&A.
Adjusted Pre-tax Income for International RAC was
$203 million
in 2017 compared to
$194 million
in 2016. See footnote (a) in the "Footnotes to the Results of Operations and Selected Operating Data by Segment Tables" for a summary and description of reconciling adjustments on a consolidated basis.
All Other Operations
The All Other Operations segment is primarily comprised of our Donlen business, as such, our discussion is limited to Donlen.
Results of operations for this segment are as follows:
|
Years Ended December 31,
|
Percent Increase/(Decrease)
|
||||||||||||||||
|
($ In millions)
|
2018
|
2017
|
2016
|
2018 vs. 2017
|
2017 vs. 2016
|
||||||||||||
|
Total revenues
|
$
|
748
|
|
$
|
640
|
|
$
|
592
|
|
17
|
%
|
8
|
%
|
||||
|
Depreciation of revenue earning vehicles and lease charges, net
|
$
|
564
|
|
$
|
478
|
|
$
|
459
|
|
18
|
|
4
|
|
||||
|
Direct vehicle and operating expenses
|
$
|
37
|
|
$
|
40
|
|
$
|
22
|
|
(8
|
)
|
82
|
|
||||
|
Selling, general and administrative expenses
|
$
|
37
|
|
$
|
35
|
|
$
|
40
|
|
6
|
|
(13
|
)
|
||||
|
Income (loss) from continuing operations, before income taxes
|
$
|
83
|
|
$
|
68
|
|
$
|
57
|
|
22
|
|
19
|
|
||||
|
Adjusted Pre-tax Income (Loss)
(a)
|
$
|
94
|
|
$
|
80
|
|
$
|
72
|
|
18
|
|
11
|
|
||||
|
Average Vehicles - Donlen
|
188,100
|
|
204,300
|
|
174,900
|
|
(8
|
)
|
17
|
|
|||||||
Footnotes to the table above are shown at the end of the Results of Operations and Selected Operating Data by Segment section of this MD&A.
Total revenues and depreciation of revenue earning vehicles and lease charges, net include a
$53 million impact of vehicles leased under a GAAP accounting designation as sales-type leases, which are presented on a gross basis. Excluding the impact of sales-type leases, revenue increased 9% and depreciation of revenue earning vehicles increased 7%
driven by a 4% growth in units and a richer mix of vehicles under operating leases. The decrease in overall Average Vehicles in 2018 compared to 2017 was due to a reduction in non-lease units in our maintenance management programs which drive a lower Revenue Per Unit when compared to lease units under these programs.
Donlen revenues were higher in 2017 compared to 2016 primarily due to an increase in its leasing and services volume driven by new business origination and existing customer growth. Increases in DOE were due to
charges related to leases that commenced in 2017
and increases in vehicle depreciation were due to the growth of leased fleet.
52
HERTZ GLOBAL HOLDINGS, INC. AND SUBSIDIARIES
THE HERTZ CORPORATION AND SUBSIDIARIES
|
ITEM 7.
|
MANAGEMENT'S DISCUSSION AND ANALYSIS OF FINANCIAL CONDITION AND RESULTS OF OPERATIONS (Continued)
|
Footnotes to the Results of Operations and Selected Operating Data by Segment Tables
|
(a)
|
Adjusted Pre-tax Income (Loss) is calculated as income (loss) from continuing operations before income taxes plus non-cash acquisition accounting charges, debt-related charges relating to the amortization and write-off of debt financing costs and debt discounts and premiums, goodwill, intangible and tangible asset impairments and write-downs, information technology and finance transformation costs, net income or loss attributable to noncontrolling interests, and certain other miscellaneous or non-recurring items. Adjusted Pre-tax Income (Loss) is important because it allows management to assess operational performance of our business, exclusive of the items mentioned above. It also allows management to assess the performance of the entire business on the same basis as the segment measure of profitability. Management believes that it is important to investors for the same reasons it is important to management and because it allows them to assess our operational performance on the same basis that management uses internally. When evaluating our operating performance, investors should not consider Adjusted Pre-tax Income (Loss) in isolation of, or as a substitute for, measures of our financial performance, such as net income (loss) from continuing operations or income (loss) from continuing operations before income taxes. The contribution of our reportable segments to Adjusted Pre-tax Income (Loss) and reconciliation to the most comparable consolidated U.S. GAAP measure are presented below:
|
HERTZ
|
Years Ended December 31,
|
|||||||||||
|
(In millions)
|
2018
|
2017
|
2016
|
||||||||
|
Adjusted Pre-tax Income (Loss):
|
|
||||||||||
|
U.S. Rental Car
|
$
|
262
|
|
$
|
13
|
|
$
|
298
|
|
||
|
International Rental Car
|
204
|
|
203
|
|
194
|
|
|||||
|
All Other Operations
|
94
|
|
80
|
|
72
|
|
|||||
|
Total reportable segments
|
560
|
|
296
|
|
564
|
|
|||||
|
Corporate
(1)
|
(572
|
)
|
(501
|
)
|
(498
|
)
|
|||||
|
Adjusted Pre-tax Income (Loss)
|
(12
|
)
|
(205
|
)
|
66
|
|
|||||
|
Adjustments:
|
|||||||||||
|
Acquisition accounting
(2)
|
(62
|
)
|
(62
|
)
|
(65
|
)
|
|||||
|
Debt-related charges
(3)
|
(50
|
)
|
(47
|
)
|
(48
|
)
|
|||||
|
Loss on extinguishment of debt
(4)
|
(22
|
)
|
(13
|
)
|
(55
|
)
|
|||||
|
Restructuring and restructuring related charges
(5)
|
(32
|
)
|
(22
|
)
|
(53
|
)
|
|||||
|
Sale of CAR Inc. common stock
(6)
|
—
|
|
3
|
|
84
|
|
|||||
|
Impairment charges and asset write-downs
(7)
|
—
|
|
(118
|
)
|
(340
|
)
|
|||||
|
Information technology and finance transformation costs
(8)
|
(98
|
)
|
(68
|
)
|
(53
|
)
|
|||||
|
Other
(9)
|
26
|
|
(38
|
)
|
(5
|
)
|
|||||
|
Income (loss) from continuing operations before income taxes
|
$
|
(250
|
)
|
$
|
(570
|
)
|
$
|
(469
|
)
|
||
53
HERTZ GLOBAL HOLDINGS, INC. AND SUBSIDIARIES
THE HERTZ CORPORATION AND SUBSIDIARIES
|
ITEM 7.
|
MANAGEMENT'S DISCUSSION AND ANALYSIS OF FINANCIAL CONDITION AND RESULTS OF OPERATIONS (Continued)
|
HERTZ GLOBAL
|
Years Ended December 31,
|
|||||||||||
|
(In millions)
|
2018
|
2017
|
2016
|
||||||||
|
Adjusted Pre-tax Income (Loss):
|
|
||||||||||
|
U.S. Rental Car
|
$
|
262
|
|
$
|
13
|
|
$
|
298
|
|
||
|
International Rental Car
|
204
|
|
203
|
|
194
|
|
|||||
|
All Other Operations
|
94
|
|
80
|
|
72
|
|
|||||
|
Total reportable segments
|
560
|
|
296
|
|
564
|
|
|||||
|
Corporate
(1)
|
(579
|
)
|
(506
|
)
|
(499
|
)
|
|||||
|
Adjusted Pre-tax Income (Loss)
|
(19
|
)
|
(210
|
)
|
65
|
|
|||||
|
Adjustments:
|
|||||||||||
|
Acquisition accounting
(2)
|
(62
|
)
|
(62
|
)
|
(65
|
)
|
|||||
|
Debt-related charges
(3)
|
(50
|
)
|
(47
|
)
|
(48
|
)
|
|||||
|
Loss on extinguishment of debt
(4)
|
(22
|
)
|
(13
|
)
|
(55
|
)
|
|||||
|
Restructuring and restructuring related charges
(5)
|
(32
|
)
|
(22
|
)
|
(53
|
)
|
|||||
|
Sale of CAR Inc. common stock
(6)
|
—
|
|
3
|
|
84
|
|
|||||
|
Impairment charges and asset write-downs
(7)
|
—
|
|
(118
|
)
|
(340
|
)
|
|||||
|
Information technology and finance transformation costs
(8)
|
(98
|
)
|
(68
|
)
|
(53
|
)
|
|||||
|
Other
(9)
|
26
|
|
(38
|
)
|
(5
|
)
|
|||||
|
Income (loss) from continuing operations before income taxes
|
$
|
(257
|
)
|
$
|
(575
|
)
|
$
|
(470
|
)
|
||
|
(1)
|
Represents general corporate expenses, non-vehicle interest expense, as well as other business activities.
|
|
(2)
|
Represents incremental expense associated with amortization of other intangible assets, and depreciation of property and equipment relating to acquisition accounting.
|
|
(3)
|
Represents debt-related charges relating to the amortization of deferred financing costs and debt discounts and premiums.
|
|
(4)
|
In 2018, primarily comprised of
$20 million
of early redemption premium and write-off of deferred financing costs associated with the redemption of the outstanding
4.375%
European Vehicle
Notes due January 2019
. In 2017, comprised of
$6 million
of early redemption premium and write-off of deferred financing costs associated with the redemption of the outstanding 4.25% Senior Notes due April 2018 and
$7 million
write-off of deferred financing costs associated with the termination of commitments under the Senior RCF. In 2016, amount represents
$6 million
of deferred financing costs written off as a result of terminating and refinancing various vehicle debt,
$27 million
in early redemption premiums associated with the redemption of all of the outstanding 7.50% Senior Notes due October 2018 and a portion of the outstanding 6.75% Senior Notes due April 2019 and
$22 million
of deferred financing costs and debt discount written off as a result of paying off such Senior Notes and our Senior Credit Facilities.
|
|
(5)
|
Represents charges incurred under restructuring actions as defined in U.S. GAAP, excluding impairments and asset write-downs, which are shown separately in the table. Also includes restructuring related charges such as incremental costs incurred directly supporting business transformation initiatives. Such costs include transition costs incurred in connection with business process outsourcing arrangements and incremental costs incurred to facilitate business process re-engineering initiatives that involve significant organization redesign and extensive operational process changes. Also includes consulting costs, legal fees, a net loss contingency of
$13.6 million
and other expenses related to the previously disclosed accounting review and investigation.
|
|
(6)
|
Represents the pre-tax gain on the sale of CAR Inc. common stock.
|
|
(7)
|
In 2017, primarily represents an
$86 million
impairment of the Dollar Thrifty tradename and an impairment of
$30 million
related to an equity method investment. In 2016, primarily comprised of a
$172 million
impairment of goodwill associated with our vehicle rental operations in Europe, a
$120 million
impairment of the Dollar Thrifty tradename, a
$25 million
impairment of certain tangible assets used in the U.S. RAC segment in conjunction with a restructuring program and an
$18 million
impairment of the net assets held for sale related to our Brazil Operations.
|
|
(8)
|
Represents costs associated with the Company's information technology and finance transformation programs, both of which are multi-year initiatives to upgrade and modernize the Company's systems and processes.
|
|
(9)
|
Represents miscellaneous or non-recurring items, and includes amounts attributable to noncontrolling interests. In 2018, also includes a
$20 million
gain on marketable securities and a
$6 million
legal settlement received in the second quarter related to an oil spill in the Gulf of Mexico in 2010. In 2017, also includes net expenses of
$16 million
resulting from hurricanes and charges of
$8 million
associated with strategic financings, partially offset by a
$6 million
gain on the sale of our Brazil Operations and a
$4 million
return of capital from an equity method investment, and charges of
$5 million
relating to PLPD as a result of a terrorist event. In 2016, also includes a
$9 million
settlement gain from an eminent domain case related to one of our airport locations.
|
|
(b)
|
Transaction Days represent the total number of 24-hour periods, with any partial period counted as one Transaction Day, that vehicles were on rent (the period between when a rental contract is opened and closed) in a given period. Thus, it is possible for a vehicle to attain more than one Transaction Day in a 24-hour period.
|
54
HERTZ GLOBAL HOLDINGS, INC. AND SUBSIDIARIES
THE HERTZ CORPORATION AND SUBSIDIARIES
|
ITEM 7.
|
MANAGEMENT'S DISCUSSION AND ANALYSIS OF FINANCIAL CONDITION AND RESULTS OF OPERATIONS (Continued)
|
|
(c)
|
Average Vehicles are determined using a simple average of the number of vehicles at the beginning and end of a given period. Among other things, Average Vehicles is used to calculate our Vehicle Utilization which represents the portion of our vehicles that are being utilized to generate revenue. Vehicle Utilization is calculated by dividing total Transaction Days by Available Car Days. The calculation of Vehicle Utilization is shown in the table below.
|
|
U.S. Rental Car
|
International Rental Car
|
||||||||||||||||
|
Years Ended December 31,
|
|||||||||||||||||
|
2018
|
2017
|
2016
|
2018
|
2017
|
2016
|
||||||||||||
|
Transaction Days (in thousands)
|
149,463
|
|
140,382
|
|
142,268
|
|
50,417
|
|
50,301
|
|
48,627
|
|
|||||
|
Average Vehicles
|
506,900
|
|
484,700
|
|
484,800
|
|
180,400
|
|
178,100
|
|
173,400
|
|
|||||
|
Number of days in period
|
365
|
|
365
|
|
366
|
|
365
|
|
365
|
|
366
|
|
|||||
|
Available Car Days (in thousands)
|
185,019
|
|
176,916
|
|
177,437
|
|
65,846
|
|
65,007
|
|
63,464
|
|
|||||
|
Vehicle Utilization
|
81
|
%
|
79
|
%
|
80
|
%
|
77
|
%
|
77
|
%
|
77
|
%
|
|||||
|
(d)
|
Total RPD is calculated as total revenue less ancillary retail vehicle sales revenue, with all periods adjusted to eliminate the effect of fluctuations in foreign currency exchange rates ("Total Rental Revenue"), divided by the total number of Transaction Days. Our management believes eliminating the effect of fluctuations in foreign currency exchange rates is useful in analyzing underlying trends. The calculation of Total RPD is shown below.
|
|
U.S. Rental Car
|
International Rental Car
|
||||||||||||||||||||||
|
Years Ended December 31,
|
|||||||||||||||||||||||
|
($ in millions, except as noted)
|
2018
|
2017
|
2016
|
2018
|
2017
|
2016
|
|||||||||||||||||
|
Revenues
|
6,480
|
|
$
|
5,994
|
|
$
|
6,114
|
|
2,276
|
|
$
|
2,169
|
|
$
|
2,097
|
|
|||||||
|
Ancillary retail vehicle sales revenue
|
(102
|
)
|
(90
|
)
|
(76
|
)
|
(1
|
)
|
—
|
|
—
|
|
|||||||||||
|
Foreign currency adjustment
(1)
|
—
|
|
—
|
|
—
|
|
32
|
|
76
|
|
105
|
|
|||||||||||
|
Total Rental Revenue
|
$
|
6,378
|
|
$
|
5,904
|
|
$
|
6,038
|
|
$
|
2,307
|
|
$
|
2,245
|
|
$
|
2,202
|
|
|||||
|
Transaction Days (in thousands)
|
149,463
|
|
140,382
|
|
142,268
|
|
50,417
|
|
50,301
|
|
48,627
|
|
|||||||||||
|
Total RPD (in whole dollars)
|
$
|
42.67
|
|
$
|
42.06
|
|
$
|
42.44
|
|
$
|
45.76
|
|
$
|
44.63
|
|
$
|
45.28
|
|
|||||
|
(1)
|
Based on December 31, 2017 foreign currency exchange rates for all periods presented.
|
|
(e)
|
Total RPU is calculated as Total Rental Revenue divided by the Average Vehicles in each period and then divided by the number of months in the period reported. The calculation of Total RPU is shown below.
|
|
U.S. Rental Car
|
International Rental Car
|
||||||||||||||||||||||
|
Years Ended December 31,
|
|||||||||||||||||||||||
|
($ in millions, except as noted)
|
2018
|
2017
|
2016
|
2018
|
2017
|
2016
|
|||||||||||||||||
|
Total Rental Revenue
|
$
|
6,378
|
|
$
|
5,904
|
|
$
|
6,038
|
|
$
|
2,307
|
|
$
|
2,245
|
|
$
|
2,202
|
|
|||||
|
Average Vehicles
|
506,900
|
|
484,700
|
|
484,800
|
|
180,400
|
|
178,100
|
|
173,400
|
|
|||||||||||
|
Total revenue per unit (in whole dollars)
|
$
|
12,582
|
|
$
|
12,181
|
|
$
|
12,455
|
|
$
|
12,788
|
|
$
|
12,605
|
|
$
|
12,699
|
|
|||||
|
Number of months in period
|
12
|
|
12
|
|
12
|
|
12
|
|
12
|
|
12
|
|
|||||||||||
|
Total RPU Per Month (in whole dollars)
|
$
|
1,049
|
|
$
|
1,015
|
|
$
|
1,038
|
|
$
|
1,066
|
|
$
|
1,050
|
|
$
|
1,058
|
|
|||||
55
HERTZ GLOBAL HOLDINGS, INC. AND SUBSIDIARIES
THE HERTZ CORPORATION AND SUBSIDIARIES
|
ITEM 7.
|
MANAGEMENT'S DISCUSSION AND ANALYSIS OF FINANCIAL CONDITION AND RESULTS OF OPERATIONS (Continued)
|
|
(f)
|
Net Depreciation Per Unit Per Month represents the amount of average depreciation expense and lease charges, net per vehicle per month and is calculated as depreciation of revenue earning vehicles and lease charges, net, with all periods adjusted to eliminate the effect of fluctuations in foreign currency exchange rates, divided by the Average Vehicles in each period and then dividing by the number of months in the period reported. Our management believes eliminating the effect of fluctuations in foreign currency exchange rates is useful in analyzing underlying trends. The calculation of Net Depreciation Per Unit Per Month is shown below.
|
|
U.S. Rental Car
|
International Rental Car
|
||||||||||||||||||||||
|
Years Ended December 31,
|
|||||||||||||||||||||||
|
($ in millions, except as noted)
|
2018
|
2017
|
2016
|
2018
|
2017
|
2016
|
|||||||||||||||||
|
Depreciation of revenue earning vehicles and lease charges, net
|
$
|
1,678
|
|
$
|
1,904
|
|
$
|
1,753
|
|
$
|
448
|
|
$
|
416
|
|
$
|
389
|
|
|||||
|
Foreign currency adjustment
(1)
|
—
|
|
—
|
|
—
|
|
5
|
|
16
|
|
19
|
|
|||||||||||
|
Adjusted depreciation of revenue earning vehicles and lease charges, net
|
$
|
1,678
|
|
$
|
1,904
|
|
$
|
1,753
|
|
$
|
453
|
|
$
|
432
|
|
$
|
408
|
|
|||||
|
Average Vehicles
|
506,900
|
|
484,700
|
|
484,800
|
|
180,400
|
|
178,100
|
|
173,400
|
|
|||||||||||
|
Adjusted depreciation of revenue earning vehicles and lease charges, net divided by Average Vehicles (in whole dollars)
|
$
|
3,310
|
|
$
|
3,928
|
|
$
|
3,616
|
|
$
|
2,511
|
|
$
|
2,426
|
|
$
|
2,353
|
|
|||||
|
Number of months in period
|
12
|
12
|
12
|
12
|
12
|
12
|
|||||||||||||||||
|
Net Depreciation Per Unit Per Month (in whole dollars)
|
$
|
276
|
|
$
|
327
|
|
$
|
301
|
|
$
|
209
|
|
$
|
202
|
|
$
|
196
|
|
|||||
|
(1)
|
Based on December 31, 2017 foreign currency exchange rates for all periods presented.
|
LIQUIDITY AND CAPITAL RESOURCES
Our U.S. and international operations are funded by cash provided by operating activities and by extensive financing arrangements maintained by us in the U.S. and internationally.
As of
December 31, 2018
, we had
$1.1 billion
of cash and cash equivalents and
$283 million
of restricted cash. Of these amounts as of
December 31, 2018
,
$375 million
of cash and cash equivalents and
$41 million
of restricted cash was held by our subsidiaries outside of the U.S. If not in the form of loan repayments, repatriation of some of these funds under current regulatory and tax law for use in domestic operations could expose us to additional taxes.
We believe that cash and cash equivalents generated by our operations and cash received on the disposal of vehicles, together with amounts available under various liquidity facilities and refinancing options available to us in the capital markets, will be sufficient to fund operating requirements for the next twelve months.
Cash Flows - Hertz
As of
December 31, 2018
, Hertz had cash, cash equivalents, restricted cash and restricted cash equivalents of
$1.4 billion
as compared to
$1.5 billion
as of
December 31, 2017
. The following table summarizes the net change in cash, cash equivalents, restricted cash and restricted cash equivalents for the periods shown:
|
Years Ended December 31,
|
2018 vs. 2017
|
2017 vs. 2016
|
|||||||||||||||||
|
(In millions)
|
2018
|
2017
|
2016
|
$ Change
|
$ Change
|
||||||||||||||
|
Cash provided by (used in):
|
|
||||||||||||||||||
|
Operating activities
|
$
|
2,563
|
|
$
|
2,399
|
|
$
|
2,530
|
|
$
|
164
|
|
$
|
(131
|
)
|
||||
|
Investing activities
|
(4,197
|
)
|
(3,000
|
)
|
(2,048
|
)
|
(1,197
|
)
|
(952
|
)
|
|||||||||
|
Financing activities
|
1,554
|
|
983
|
|
(184
|
)
|
571
|
|
1,167
|
|
|||||||||
|
Effect of exchange rate changes
|
(14
|
)
|
28
|
|
(11
|
)
|
(42
|
)
|
39
|
|
|||||||||
|
Net change in cash, cash equivalents, restricted cash and restricted cash equivalents
|
$
|
(94
|
)
|
$
|
410
|
|
$
|
287
|
|
$
|
(504
|
)
|
$
|
123
|
|
||||
56
HERTZ GLOBAL HOLDINGS, INC. AND SUBSIDIARIES
THE HERTZ CORPORATION AND SUBSIDIARIES
|
ITEM 7.
|
MANAGEMENT'S DISCUSSION AND ANALYSIS OF FINANCIAL CONDITION AND RESULTS OF OPERATIONS (Continued)
|
Year ended December 31, 2018 compared with year ended December 31, 2017
In
2018
, there was a
$169 million
decrease in cash outflows from working capital accounts period over period and an increase of cash inflows of
$5 million
from net income (loss), excluding non-cash and non-operating items. The change from working capital accounts was due to a
$231 million
increase in cash primarily driven by additional accruals for operational expenses and an increase in accounts payable due to timing of payments, partially offset by a
$62 million
decrease in cash from additional customer receivables, resulting from increased rental volume during 2018.
Our primary investing activities relate to the acquisition and disposal of revenue earning vehicles. We expended an additional
$1.9 billion
on revenue earning vehicles in 2018, primarily in our U.S. RAC operations, to increase the average fleet size and enrich the fleet mix. The additional use of cash in 2018 was partially offset by a
$799 million
increase in proceeds from the sale of revenue earnings vehicles due primarily to an increase in U.S. RAC dispositions through higher-yielding dealer direct and retail sales channels.
Net financing cash inflows were
$1.6 billion
in 2018 compared to
$983 million
in 2017. The variance was primarily driven by an increase of
$1.1 billion
in net cash inflows in 2018 for vehicle debt related to our richer fleet mix and larger fleet size. Comparatively, in 2017, excluding draws and repayments under the Senior RCF, we issued non-vehicle debt of $1.25 billion and repaid $700 million of Senior Notes.
Year ended December 31, 2017 compared with year ended December 31, 2016
There was a reduction of cash inflows of
$86 million
from net income excluding non-cash items and a
$45 million
increase in cash outflows from working capital accounts year over year. The change from working capital accounts was primarily due to a
$153 million
decrease in cash due in part to lower PLPD expenses during the 2017 period and lower liabilities for certain litigation matters. The above was partially offset by a
$108 million
increase in cash due in part to lower receivables due to timing.
There was a
$952 million
increase in the use of cash for investing activities year over year primarily due to the following:
|
•
|
a decrease in proceeds from the sale of revenue earning vehicles of
$1.0 billion
due to fewer program vehicles returned to the manufacturer year over year;
|
|
•
|
a decrease in proceeds of $258 million from the sales of marketable securities;
|
|
•
|
an increase in cash outflows for capital assets of
$39 million
primarily due to expenditures for information technology; and
|
|
•
|
a decrease in proceeds from the sale of property and other equipment of
$38 million
due in part to the sale of our previous corporate headquarters building in 2016.
|
The above were partially offset by the following sources of cash from investing activities:
|
•
|
a decrease in cash outflows of
$276 million
for the purchase of revenue earning vehicles as the Company focused on managing its fleet size; and
|
|
•
|
net proceeds of
$94 million
received from the sale of our Brazil Operations in 2017.
|
There were net cash inflows of $983 million from financing activities in 2017, versus net cash outflows of $184 million in the prior year, primarily due to uses of cash in 2016 related to the repayment and termination of the Senior Term Facility and the Senior ABL Facility in connection with the Spin-Off. Additionally, there was a
$2.1 billion
transfer from discontinued operations in the prior year also in connection with the Spin-Off.
57
HERTZ GLOBAL HOLDINGS, INC. AND SUBSIDIARIES
THE HERTZ CORPORATION AND SUBSIDIARIES
|
ITEM 7.
|
MANAGEMENT'S DISCUSSION AND ANALYSIS OF FINANCIAL CONDITION AND RESULTS OF OPERATIONS (Continued)
|
Cash Flows - Hertz Global
The following table summarizes the net change in cash, cash equivalents, restricted cash and restricted cash equivalents for Hertz Global for the periods shown:
|
Years Ended December 31,
|
2018 vs. 2017
|
2017 vs. 2016
|
|||||||||||||||||
|
(In millions)
|
2018
|
2017
|
2016
|
$ Change
|
$ Change
|
||||||||||||||
|
Cash provided by (used in):
|
|
|
|||||||||||||||||
|
Operating activities
|
$
|
2,556
|
|
$
|
2,394
|
|
$
|
2,529
|
|
$
|
162
|
|
$
|
(135
|
)
|
||||
|
Investing activities
|
(4,197
|
)
|
(3,000
|
)
|
(2,048
|
)
|
(1,197
|
)
|
(952
|
)
|
|||||||||
|
Financing activities
|
1,561
|
|
988
|
|
(183
|
)
|
573
|
|
1,171
|
|
|||||||||
|
Effect of exchange rate changes
|
(14
|
)
|
28
|
|
(11
|
)
|
(42
|
)
|
39
|
|
|||||||||
|
Net change in cash, cash equivalents, restricted cash and restricted cash equivalents
|
$
|
(94
|
)
|
$
|
410
|
|
$
|
287
|
|
$
|
(504
|
)
|
$
|
123
|
|
||||
Fluctuations in operating, investing and financing cash flows from period to period are due to the same factors as those disclosed for Hertz above, with the exception of any cash inflows or outflows related to the master loan agreement between Hertz and Hertz Global, and cash outflows by Hertz Global for the purchase of treasury shares. There were no purchases of treasury shares by Hertz Global during 2018 or 2017. Cash used in financing activities by Hertz Global for the purchase of treasury shares was
$100 million
for the year ended December 31, 2016.
Financing
For complete disclosures and definitions related to our debt obligations, see
Note 7
, "
Debt
," to the Notes to our consolidated financial statements included in this
2018
Annual Report under the caption Item 8, "Financial Statements and Supplementary Data." Cash paid for interest during
2018
was
$286 million
for interest on non-vehicle debt and
$379 million
for interest on vehicle debt.
We are highly leveraged, and a substantial portion of our liquidity requirements arise from servicing our indebtedness, funding our operations, including purchases of revenue earning vehicles, and funding non-vehicle capital expenditures. For a discussion of the risks associated with our high leverage, see Item 1A, "Risk Factors" in this
2018
Annual Report.
Our practice is to maintain sufficient liquidity through cash from operations, credit facilities and other financing arrangements, to mitigate any adverse effect on operations resulting from adverse financial market conditions.
Our corporate liquidity, which excludes unused commitments under our vehicle debt, was as follows:
|
(In millions)
|
As of
December 31, 2018
|
As of
December 31, 2017
|
|||||
|
Cash and cash equivalents
|
$
|
1,127
|
|
$
|
1,072
|
|
|
|
Availability under the Senior RCF
|
496
|
|
552
|
|
|||
|
Corporate liquidity
|
$
|
1,623
|
|
$
|
1,624
|
|
|
Significant financing activities during the year ended December 31, 2018 for our non-vehicle and vehicle debt were as follows:
Non-vehicle Debt
During 2018, Hertz terminated letters of credit issued under the Senior RCF with a stated amount of approximately
$305 million
and reissued such letters of credit under the Letter of Credit Facility. As a result, the commitments under the Senior RCF were permanently reduced on a dollar-for-dollar basis.
58
HERTZ GLOBAL HOLDINGS, INC. AND SUBSIDIARIES
THE HERTZ CORPORATION AND SUBSIDIARIES
|
ITEM 7.
|
MANAGEMENT'S DISCUSSION AND ANALYSIS OF FINANCIAL CONDITION AND RESULTS OF OPERATIONS (Continued)
|
Vehicle Debt
We group our discussion of vehicle debt financing facilities below by reportable segment.
U.S. RAC
|
•
|
The aggregate principal amount of medium term notes outstanding increased from
$4.8 billion
to
$5.3 billion
; and
|
|
•
|
Remaining capacity under various U.S. RAC revolving vehicle debt financing facilities decreased from
$1.8 billion
to
$725 million
.
|
In February 2019, we issued
$700 million
of HVF II Series 2019-1 Notes to third parties, utilizing the proceeds to decrease amounts outstanding under our revolving HVF II Series 2013-A Notes. Also, in February 2019, we extended the maturities of $3.4 billion of existing commitments under the HVF II Series 2013-A Notes from March 2020 to March 2021 and added
$400 million
in new commitments. Additionally, in February 2019 we issued
$500 million
of HVF II Series 2019-A Variable Funding Rental Car Asset Backed Notes with a maturity date of October 2019 and terminated the commitments under the HVF II Series 2013-B Notes.
International RAC
|
•
|
Remaining capacity under various International RAC revolving vehicle debt financing facilities increased from
$437 million
to
$674 million
.
|
All Other Operations - Donlen
|
•
|
The aggregate principal amount of HFLF medium term notes outstanding increased from
$963 million
to
$1.2 billion
; and
|
|
•
|
Remaining capacity under revolving vehicle debt facilities associated with the Donlen business increased from
$120 million
to
$180 million
.
|
In February 2019, we amended the HFLF Series 2013-2 Notes to extend the end of the revolving period from March 2020 to March 2021.
Substantially all of our revenue earning vehicles and certain related assets are owned by special purpose entities, or are encumbered in favor of our lenders under our various credit facilities, other secured financings and asset-backed securities programs. None of such assets are available to satisfy the claims of our general creditors.
Approximately
$16 million
of non-vehicle debt and
$1.6 billion
of vehicle debt will mature during the twelve months following the issuance of this
2018
Annual Report ("the next twelve months") and we will need to refinance a portion of these obligations. We have reviewed the maturing debt obligations and determined that it is probable that we will be able, and have the intent, to repay or refinance these facilities at such times as we deem appropriate prior to their maturities.
Covenants
The indentures for the Senior Notes and the Senior Second Priority Secured Notes contain covenants that, among other things, limit or restrict the ability of the Hertz credit group to incur additional indebtedness, incur guarantee obligations, prepay certain indebtedness, make certain restricted payments (including paying dividends, redeeming stock or making other distributions to parent entities of Hertz and other persons outside of the Hertz credit group), make investments, create liens, transfer or sell assets, merge or consolidate, and enter into certain transactions with Hertz's affiliates that are not members of the Hertz credit group.
Certain of our other debt instruments and credit facilities (including the Senior Facilities and the Letter of Credit Facility) contain a number of covenants that, among other things, limit or restrict the ability of the borrowers and the guarantors
59
HERTZ GLOBAL HOLDINGS, INC. AND SUBSIDIARIES
THE HERTZ CORPORATION AND SUBSIDIARIES
|
ITEM 7.
|
MANAGEMENT'S DISCUSSION AND ANALYSIS OF FINANCIAL CONDITION AND RESULTS OF OPERATIONS (Continued)
|
to dispose of assets, incur additional indebtedness, incur guarantee obligations, prepay certain indebtedness, make certain restricted payments (including paying dividends, share repurchases or making other distributions), create liens, make investments, make acquisitions, engage in mergers, fundamentally change the nature of their business, make capital expenditures, or engage in certain transactions with certain affiliates.
The Senior RCF and the Letter of Credit Facility contain a financial maintenance covenant applicable to such facilities. Such covenant provides that Hertz’s consolidated first lien net leverage ratio, as defined in the credit agreements governing such facilities (together, the "Senior Credit Agreement"), as of the last day of any fiscal quarter may not exceed a ratio of 3.00 to 1.00 ("the Covenant Leverage Ratio").
At December 31,
2018
, Hertz was in compliance with the Covenant Leverage Ratio with a ratio of 1.39 to 1.00, as calculated in accordance with the Senior Credit Agreement. Consolidated EBITDA, as defined in the Senior Credit Agreement, is a component of the calculation of the Covenant Leverage Ratio and is a non-GAAP financial measure that is not a measure of operating results, but instead is a measure used to determine compliance with the Covenant Leverage Ratio under the Senior Credit Agreement. Consolidated EBITDA is generally defined in the Senior Credit Agreement as consolidated net income plus the sum of income taxes, non-vehicle interest expense, non-vehicle depreciation and amortization expense, and non-cash charges or losses, as further adjusted for certain other items permitted in calculating covenant compliance under the Senior RCF and the Letter of Credit Facility, including add-backs for non-recurring, unusual or extraordinary charges, business optimization expenses or other restructuring charges or reserves.
Based on available liquidity from our expected operating results, the Senior RCF and other financing arrangements,
Hertz expects to continue to be in compliance with the Covenant Leverage Ratio for at least the next twelve months.
Guarantees
Hertz's obligations under the indentures for the Senior Notes and the Senior Second Priority Secured Notes are guaranteed by each of its direct and indirect U.S. subsidiaries that is a guarantor under the Senior Facilities. The guarantees of all of the subsidiary guarantors may be released to the extent such subsidiaries no longer guarantee our Senior Facilities in the United States. In December 2018, the Company dissolved Hertz Claim Management Corporation and HCM Marketing Corporation, both of which had been guarantors under certain of its debt instruments and credit facilities, including the Senior Facilities.
Vehicle Financing Risks
Our program vehicles are subject to repurchase by vehicle manufacturers under contractual repurchase or guaranteed depreciation programs. Under these programs, vehicle manufacturers agree to repurchase vehicles at a specified price or guarantee the depreciation rate on the vehicles during a specified time period, typically subject to certain vehicle condition and mileage requirements. We use values derived from this specified price or guaranteed depreciation rate to calculate financing capacity under certain asset-backed and asset-based financing arrangements.
In the event of a bankruptcy of a vehicle manufacturer, our liquidity could be impacted by several factors including reductions in fleet residual values and the risk that we would be unable to collect outstanding receivables due to us from such bankrupt manufacturer. In addition, the program vehicles manufactured by any such company would need to be removed from our financing facilities or re-designated as non-program vehicles, which would require us to furnish additional credit enhancement associated with these program vehicles. For a discussion of the risks associated with a manufacturer's bankruptcy or our reliance on asset-backed and asset-based financing, see Item 1A, "Risk Factors" included in this
2018
Annual Report.
We rely significantly on asset-backed and asset-based financing arrangements to purchase vehicles for our U.S. and international vehicle rental fleet. The amount of financing available to us pursuant to these programs depends on a number of factors, many of which are outside our control, including proposed and adopted SEC (and other federal agency) rules and regulations, other legislative and administrative developments, as well as rating agencies' methodologies. In this regard, there continues to be uncertainty regarding the potential impact of various SEC rules and regulations governing asset-backed securities and additional requirements contained in the Dodd-Frank Wall
60
HERTZ GLOBAL HOLDINGS, INC. AND SUBSIDIARIES
THE HERTZ CORPORATION AND SUBSIDIARIES
|
ITEM 7.
|
MANAGEMENT'S DISCUSSION AND ANALYSIS OF FINANCIAL CONDITION AND RESULTS OF OPERATIONS (Continued)
|
Street Reform and Consumer Protection Act (including risk retention requirements) and the Basel III regulatory capital rules, a global regulatory standard on bank capital adequacy, stress testing and market liquidity risk. While we will continue to monitor these developments and their impact on our ABS program, such rules and regulations may impact our ability and/or desire to engage in asset-backed financings in the future. For further information concerning our asset-backed financing programs and our indebtedness, see
Note 7
. For a discussion of the risks associated with our reliance on asset-backed and asset-based financing and the significant amount of indebtedness, see Item 1A, "Risk Factors" in this
2018
Annual Report.
Capital Expenditures
Revenue Earning Vehicles Expenditures
The table below sets forth our revenue earning vehicles expenditures and related disposal proceeds for the annual periods shown:
|
Cash inflow (cash outflow)
|
Revenue Earning Vehicles
|
||||||||||
|
(In millions)
|
Capital
Expenditures |
Disposal
Proceeds |
Net Capital
Expenditures |
||||||||
|
2018
|
$
|
(12,493
|
)
|
$
|
8,452
|
|
$
|
(4,041
|
)
|
||
|
2017
|
(10,596
|
)
|
7,653
|
|
(2,943
|
)
|
|||||
|
2016
|
(10,872
|
)
|
8,679
|
|
(2,193
|
)
|
|||||
The table below sets forth expenditures for revenue earning vehicles, net of proceeds from disposal, by segment:
|
Cash inflow (cash outflow)
|
Years Ended December 31,
|
2018 vs. 2017
|
2017 vs. 2016
|
||||||||||||||||||||||
|
($ in millions)
|
2018
|
2017
|
2016
|
$ Change
|
% Change
|
$ Change
|
% Change
|
||||||||||||||||||
|
U.S. Rental Car
|
$
|
(2,992
|
)
|
$
|
(1,877
|
)
|
$
|
(1,335
|
)
|
$
|
(1,115
|
)
|
59
|
%
|
$
|
(542
|
)
|
41
|
%
|
||||||
|
International Rental Car
|
(422
|
)
|
(518
|
)
|
(346
|
)
|
96
|
|
(19
|
)
|
(172
|
)
|
50
|
|
|||||||||||
|
All Other Operations
|
(627
|
)
|
(548
|
)
|
(512
|
)
|
(79
|
)
|
14
|
|
(36
|
)
|
7
|
|
|||||||||||
|
Total
|
$
|
(4,041
|
)
|
$
|
(2,943
|
)
|
$
|
(2,193
|
)
|
$
|
(1,098
|
)
|
37
|
|
$
|
(750
|
)
|
34
|
|
||||||
Year ended December 31, 2018 compared with year ended December 31, 2017
In 2018, net expenditures on revenue earning vehicles increased by
$1.1 billion
, primarily in our U.S. RAC segment, to increase the average fleet size and enrich the fleet mix, partially offset by improved vehicle dispositions as we benefited from an increase in higher-yielding dealer direct and retail sales channels.
Year ended December 31, 2017 compared with year ended December 31, 2016
In 2017, net expenditures on revenue earning vehicles increased by
$750 million
, primarily due to a lower number of disposals of program vehicles in our U.S. RAC segment, partially offset by a lower quantity of vehicles purchased in 2017 as the Company focused on managing its fleet size.
61
HERTZ GLOBAL HOLDINGS, INC. AND SUBSIDIARIES
THE HERTZ CORPORATION AND SUBSIDIARIES
|
ITEM 7.
|
MANAGEMENT'S DISCUSSION AND ANALYSIS OF FINANCIAL CONDITION AND RESULTS OF OPERATIONS (Continued)
|
Capital Assets, Non-Vehicle
The table below sets forth our capital asset expenditures, non-vehicle, and related disposal proceeds from property and other equipment disposed of or to be disposed of for the annual periods shown:
|
Cash inflow (cash outflow)
|
Capital Assets, Non-Vehicle
|
||||||||||
|
(In millions)
|
Capital
Expenditures |
Disposal
Proceeds |
Net Capital
Expenditures |
||||||||
|
2018
|
$
|
(177
|
)
|
$
|
51
|
|
$
|
(126
|
)
|
||
|
2017
|
(173
|
)
|
21
|
|
(152
|
)
|
|||||
|
2016
|
(134
|
)
|
59
|
|
(75
|
)
|
|||||
The table below sets forth capital asset expenditures, non-vehicle, net of disposal proceeds, by segment:
|
Cash inflow (cash outflow)
|
Years Ended December 31,
|
2018 vs. 2017
|
2017 vs. 2016
|
||||||||||||||||||||||
|
($ in millions)
|
2018
|
2017
|
2016
|
$ Change
|
% Change
|
$ Change
|
% Change
|
||||||||||||||||||
|
U.S. Rental Car
|
$
|
(35
|
)
|
$
|
(78
|
)
|
$
|
(31
|
)
|
$
|
43
|
|
(55
|
)%
|
$
|
(47
|
)
|
152
|
%
|
||||||
|
International Rental Car
|
(14
|
)
|
(20
|
)
|
(18
|
)
|
6
|
|
(30
|
)
|
(2
|
)
|
11
|
|
|||||||||||
|
All Other Operations
|
(4
|
)
|
(5
|
)
|
(8
|
)
|
1
|
|
(20
|
)
|
3
|
|
(38
|
)
|
|||||||||||
|
Corporate
|
(73
|
)
|
(49
|
)
|
(18
|
)
|
(24
|
)
|
49
|
|
(31
|
)
|
172
|
|
|||||||||||
|
Total
|
$
|
(126
|
)
|
$
|
(152
|
)
|
$
|
(75
|
)
|
$
|
26
|
|
(17
|
)
|
$
|
(77
|
)
|
103
|
|
||||||
Share Repurchase Program - Hertz Global
During 2016, Hertz Holdings repurchased
two million
shares of its common stock for an aggregate purchase price of
$100 million
under its share repurchase program. No shares were repurchased by Hertz Holdings under the program during 2018 or 2017. As of
December 31, 2018
, approximately
$295 million
of shares remain available for purchase. Hertz Holdings primarily funds repurchases of its common stock through dividends from Hertz or amounts borrowed under the master loan agreement. Credit agreements governing Hertz's Senior Facilities and Letter of Credit Facility restrict Hertz's ability to make dividends and certain payments, including payments to Hertz Holdings for share repurchases.
CONTRACTUAL OBLIGATIONS
The following table details our contractual cash obligations as of
December 31, 2018
except where noted:
|
Payments Due by Period
|
|||||||||||||||||||
|
(In millions)
|
Total
|
2019
|
2020 to 2021
|
2022 to 2023
|
After 2023
|
||||||||||||||
|
Vehicles:
|
|||||||||||||||||||
|
Debt obligation
|
$
|
11,945
|
|
$
|
1,597
|
|
$
|
8,225
|
|
$
|
2,123
|
|
$
|
—
|
|
||||
|
Interest on debt
(a)
|
874
|
|
424
|
|
375
|
|
75
|
|
—
|
|
|||||||||
|
Non-Vehicle:
|
|||||||||||||||||||
|
Debt obligation
|
4,455
|
|
16
|
|
1,229
|
|
2,383
|
|
827
|
|
|||||||||
|
Interest on debt
(a)
|
1,044
|
|
292
|
|
498
|
|
211
|
|
43
|
|
|||||||||
|
Minimum fixed obligations for operating leases
|
2,180
|
|
413
|
|
568
|
|
333
|
|
866
|
|
|||||||||
|
Variable concession obligations for operating leases
|
715
|
|
135
|
|
201
|
|
148
|
|
231
|
|
|||||||||
|
Commitments to purchase vehicles
(b)
|
7,820
|
|
7,820
|
|
—
|
|
—
|
|
—
|
|
|||||||||
|
Purchase obligations and other
(c)
|
545
|
|
255
|
|
188
|
|
77
|
|
25
|
|
|||||||||
|
Total
|
$
|
29,578
|
|
$
|
10,952
|
|
$
|
11,284
|
|
$
|
5,350
|
|
$
|
1,992
|
|
||||
62
HERTZ GLOBAL HOLDINGS, INC. AND SUBSIDIARIES
THE HERTZ CORPORATION AND SUBSIDIARIES
|
ITEM 7.
|
MANAGEMENT'S DISCUSSION AND ANALYSIS OF FINANCIAL CONDITION AND RESULTS OF OPERATIONS (Continued)
|
|
(a)
|
Amounts represent the estimated commitment fees and interest payments based on the principal amounts, minimum non-cancelable maturity dates and interest rates on the debt as of December 31, 2018.
|
|
(b)
|
Represents fleet purchases where contracts have been signed or are pending with committed orders under the terms of such arrangements.
|
|
(c)
|
Represents agreements to purchase goods or services that are legally binding on us and that specify all significant terms, including fixed or minimum quantities; fixed, minimum or variable price provisions; and the approximate timing of the transaction, as well as liabilities for uncertain tax positions and other liabilities, and excludes any obligations to employees. Only the minimum non-cancelable portion of purchase agreements and related cancellation penalties are included as obligations. In the case of contracts that state minimum quantities of goods or services, amounts reflect only the stipulated minimums; all other contracts reflect estimated amounts. Purchase obligations include
$21 million
representing our tax liability for uncertain tax positions and related net accrued interest and penalties.
|
The table excludes our pension and other postretirement benefit obligations as disclosed in
Note 9
, "
Employee Retirement Benefits
," to the Notes to our consolidated financial statements included in this
2018
Annual Report under the caption Item 8, "Financial Statements and Supplementary Data."
OFF BALANCE SHEET COMMITMENTS AND ARRANGEMENTS
Indemnification Obligations
In the ordinary course of business, we execute contracts involving indemnification obligations customary in the relevant industry and indemnifications specific to a transaction such as the sale of a business. These indemnification obligations might include claims relating to the following: environmental matters; intellectual property rights; governmental regulations and employment-related matters; customer, supplier and other commercial contractual relationships; and financial matters. Performance under these indemnification obligations would generally be triggered by a breach of terms of the contract or by a third-party claim. We regularly evaluate the probability of having to incur costs associated with these indemnification obligations and have accrued for expected losses that are probable and estimable. The types of indemnification obligations for which payments are possible include the following:
As described in
Note 3
, "
Discontinued Operations
" to the Notes to our consolidated financial statements included in this
2018
Annual Report under the caption Item 8, "Financial Statements and Supplementary Data", the Separation and Distribution Agreement with Herc Holdings in connection with the Spin-Off contains mutual indemnification clauses and a customary indemnification provision with respect to liability arising out of or resulting from assumed legal matters.
Certain former Stockholders; Directors
We have entered into indemnification agreements with each of our directors and certain of our officers. Hertz entered into customary indemnification agreements with Hertz Holdings pursuant to which Hertz Holdings and Hertz will indemnify those entities and certain of our former stockholders and their affiliates and their respective affiliates, directors, officers, partners, members, employees, agents, representatives and controlling persons, against certain liabilities arising out of performance of a consulting agreement with Hertz Holdings and each of such entities and certain other claims and liabilities, including liabilities arising out of financing arrangements or securities offerings. We do not believe that these indemnifications are reasonably likely to have a material impact on us.
Environmental
We have indemnified various parties for the costs associated with remediating numerous hazardous substance storage, recycling or disposal sites in many states and, in some instances, for natural resource damages. The amount of any such expenses or related natural resource damages for which we may be held responsible could be substantial. The probable expenses that we expect to incur for such matters have been accrued, and those expenses are reflected in our consolidated financial statements within accrued liabilities.
Amounts accrued
represent the estimated cost to study potential environmental issues at sites deemed to require investigation or clean-up activities, and the estimated cost to implement remediation actions, including on-going maintenance, as required. Initial cost estimates are based on historical experience at similar sites and are refined over time on the basis of in-depth studies of the sites. For many
63
HERTZ GLOBAL HOLDINGS, INC. AND SUBSIDIARIES
THE HERTZ CORPORATION AND SUBSIDIARIES
|
ITEM 7.
|
MANAGEMENT'S DISCUSSION AND ANALYSIS OF FINANCIAL CONDITION AND RESULTS OF OPERATIONS (Continued)
|
sites, the remediation costs and other damages for which we ultimately may be responsible cannot be reasonably estimated because of uncertainties with respect to factors such as our connection to the site, the materials there, the involvement of other potentially responsible parties, the application of laws and other standards or regulations, site conditions, and the nature and scope of investigations, studies, and remediation to be undertaken (including the technologies to be required and the extent, duration, and success of remediation).
EMPLOYEE RETIREMENT BENEFITS
Pension
We sponsor defined benefit pension plans worldwide. Pension obligations give rise to expenses that are dependent on assumptions discussed in
Note 9
, "
Employee Retirement Benefits
," to the Notes to our consolidated financial statements included in this
2018
Annual Report under the caption Item 8, "Financial Statements and Supplementary Data."
Our
2018
worldwide pre-tax pension benefit is
$6 million
, which represents an increase in benefit of
$5 million
from
2017
. In general, the pension benefit increased in
2018
compared to
2017
primarily due to an increase in expected return on plan assets year over year.
The funded status (i.e., the dollar amount by which the projected benefit obligations exceeded the market value of pension plan assets) of the Hertz Retirement Plan, in which most domestic employees participate, decreased in
December 31, 2018
, compared with
December 31, 2017
primarily due to a decrease in plan assets year over year. We did not contribute to the Hertz Retirement Plan during
2018
. We do not anticipate contributing to the Hertz Retirement Plan during
2019
. For the international plans, we anticipate contributing
$3 million
during
2019
. The level of
2019
and future contributions will vary, and is dependent on a number of factors including investment returns, interest rate fluctuations, plan demographics, funding regulations and the results of the final actuarial valuation.
We participate in several "multiemployer" pension plans. In the event that we withdraw from participation in one of these plans, then applicable law could require us to make an additional lump-sum contribution to the plan, and we would have to reflect that as an expense in our consolidated statement of operations and as a liability on our consolidated balance sheet. Our withdrawal liability for any multiemployer plan would depend on the extent of the plan's funding of vested benefits. Our multiemployer plans could have significant underfunded liabilities. Such underfunding may increase in the event other employers become insolvent or withdraw from the applicable plan or upon the inability or failure of withdrawing employers to pay their withdrawal liability. In addition, such underfunding may increase as a result of lower than expected returns on pension fund assets or other funding deficiencies. The occurrence of any of these events could have a material adverse effect on our consolidated financial position, results of operations or cash flows. For a discussion of the risks associated with our pension plans, see Item 1A, "Risk Factors” in this
2018
Annual Report.
CRITICAL ACCOUNTING POLICIES AND ESTIMATES
Our discussion and analysis of financial condition and results of operations are based upon our consolidated financial statements, which have been prepared in accordance with accounting principles generally accepted in the United States of America. The preparation of the consolidated financial statements requires management to make estimates and judgments that affect the reported amounts in our consolidated financial statements and accompanying notes.
The following accounting policies involve a higher degree of judgment and complexity in their application, and therefore, represent the critical accounting policies used in the preparation of our financial statements. If different assumptions or conditions were to prevail, the results could be materially different from our reported results. For additional discussion of our critical accounting policies, as well as our significant accounting policies, see
Note 2
, "
Significant Accounting Policies
," to the Notes to our consolidated financial statements included in this
2018
Annual Report under the caption Item 8, "Financial Statements and Supplementary Data."
64
HERTZ GLOBAL HOLDINGS, INC. AND SUBSIDIARIES
THE HERTZ CORPORATION AND SUBSIDIARIES
|
ITEM 7.
|
MANAGEMENT'S DISCUSSION AND ANALYSIS OF FINANCIAL CONDITION AND RESULTS OF OPERATIONS (Continued)
|
Revenue Earning Vehicles
Our principal assets are revenue earning vehicles, which represented approximately
58%
of our total assets as of
December 31, 2018
. Revenue earning vehicles consists of vehicles utilized in our vehicle rental operations and our Donlen business. For the year ended
December 31, 2018
,
38%
of the vehicles purchased for our combined U.S. and International vehicle rental fleets were vehicles purchased under repurchase or guaranteed depreciation programs with vehicle manufacturers, or program vehicles.
Under our vehicle repurchase programs, the manufacturers agree to repurchase vehicles at a specified price or guarantee the depreciation rate on the vehicles during established repurchase or auction periods, subject to, among other things, certain vehicle condition, mileage and holding period requirements. Guaranteed depreciation programs guarantee on an aggregate basis the residual value of the vehicles covered by the programs upon sale according to certain parameters which include the holding period, mileage and condition of the vehicles. We record a provision for excess mileage and vehicle condition, as necessary, during the holding period. These repurchase and guaranteed depreciation programs limit our residual risk with respect to vehicles purchased under the programs and allow us to reduce the variability of depreciation expense for such vehicles, however, typically the acquisition cost is higher. Incentives received from the manufacturers for purchases of vehicles reduce the cost.
For all other vehicles, we use historical experience, industry residual value guidebooks and the monitoring of market conditions, to set depreciation rates. Generally, when revenue earning vehicles are acquired outside of a vehicle repurchase program, or non-program vehicles, we estimate the period that we will hold the asset, primarily based on historical measures of the amount of rental activity (e.g., automobile mileage) and the targeted age of vehicles at the time of disposal. We also estimate the residual value of the applicable revenue earning vehicles at the expected time of disposal. The residual values for rental vehicles are affected by many factors, including make, model and options, age, physical condition, mileage, sale location, time of the year and channel of disposition (e.g., auction, retail, dealer direct). Depreciation is recorded over the estimated holding period. Depreciation rates are reviewed on a quarterly basis based on management's ongoing assessment of present and estimated future market conditions, their effect on residual values at the expected time of disposal and the estimated holding periods. Market conditions for used vehicle sales can also be affected by external factors such as the economy, natural disasters, fuel prices, used vehicle supply levels, and incentives offered by manufacturers of new vehicles. These key factors are considered when estimating future residual values. Depreciation rates are adjusted prospectively through the remaining expected life. As a result of this ongoing assessment, we make periodic adjustments to depreciation rates of revenue earning vehicles in response to changing market conditions. Upon disposal of revenue earning vehicles, depreciation expense is adjusted for any difference between the net proceeds received and the remaining net book value and a corresponding gain or loss is recorded.
Within Donlen, revenue earning vehicles are leased under longer term agreements with our customers. These leases contain provisions whereby we have a contracted residual value guaranteed to us by the lessee, such that we rarely experience any economic gains or losses on the disposal of these vehicles. Donlen accounts for its lease contracts using the appropriate lease classifications.
See
Note 5
, "
Revenue Earning Vehicles, Net
," to the Notes to our consolidated financial statements included in this
2018
Annual Report under the caption Item 8, "Financial Statements and Supplementary Data."
Self-insured Liabilities
Self-insured liabilities on our consolidated balance sheets include public liability, property damage, liability insurance supplement, personal accident insurance, and workers compensation. These represent an estimate for both reported accident claims not yet paid, and claims incurred but not yet reported and are recorded on a non-discounted basis. Reserve requirements are based on rental volume and actuarial evaluations of historical accident claim experience and trends, as well as future projections of ultimate losses, expenses, premiums and administrative costs. The adequacy of the liability is regularly monitored based on evolving accident claim history and insurance related state legislation changes. If our estimates change or if actual results differ from these assumptions, the amount of the recorded liability is adjusted to reflect these results.
65
HERTZ GLOBAL HOLDINGS, INC. AND SUBSIDIARIES
THE HERTZ CORPORATION AND SUBSIDIARIES
|
ITEM 7.
|
MANAGEMENT'S DISCUSSION AND ANALYSIS OF FINANCIAL CONDITION AND RESULTS OF OPERATIONS (Continued)
|
Recoverability of Goodwill and Indefinite-lived Intangible Assets
On an annual basis as of October 1, and at interim periods when circumstances require as a result of a triggering event, we test the recoverability of our goodwill and indefinite-lived intangible assets by performing an impairment analysis. An impairment is deemed to exist if the carrying value of goodwill or indefinite-lived intangible assets exceed their fair value as determined using level 3 inputs under the GAAP fair value hierarchy. The reviews of fair value involve judgment and estimates, including projected revenues, royalty rates and discount rates. We believe our valuation techniques and assumptions are reasonable for this purpose. On January 1, 2017, we prospectively adopted guidance that eliminates the second step of the two-step goodwill impairment test, otherwise, we have not materially changed our methodology for valuing goodwill and indefinite-lived intangible assets.
For goodwill, we determine the fair value using an income approach based on the discounted cash flows of each reporting unit. A reporting unit is an operating segment or a business one level below that operating segment (the component level) if discrete financial information is prepared and regularly reviewed by segment management. Components are aggregated into a single reporting unit when they have similar economic characteristics. The Company has four reporting units: U.S. Rental Car, Europe Rental Car, Other International Rental Car and Donlen. Key assumptions used in the discounted cash flow valuation model include discount rates, growth rates, cash flow projections, tax rates and terminal value rates. Discount rates are set by using the Weighted Average Cost of Capital (“WACC”) methodology. The WACC methodology considers market and industry data as well as Company specific risk factors for each reporting unit in determining the appropriate discount rates to be used. The discount rate utilized for each reporting unit is indicative of the return an investor would expect to receive for investing in such a business. Our cash flow projections represent management's most recent planning assumptions, which are based on a combination of industry outlooks, views on general economic conditions, our expected pricing plans and expected future savings. Terminal value rates are determined using a common methodology of capturing the present value of perpetual cash flow estimates beyond the last projected period assuming a constant WACC and long-term growth rates.
Our indefinite-lived intangible assets primarily consist of the Hertz and Dollar Thrifty tradenames. For tradenames, we determine the fair value using a relief from royalty approach, which utilizes our revenue projections for each asset along with assumptions for royalty rates, tax rates and the WACC.
A significant decline in either projected revenues, projected cash flows or increased discount rates (the WACC) used to determine fair value could result in an impairment charge.
In performing its annual test as of October 1, 2016, the Company concluded there was an impairment of goodwill in its International Rental Car segment associated with its vehicle rental operations in Europe and recorded a charge of
$172 million
. The Company also concluded there was an impairment of the Dollar Thrifty tradename and recorded a charge of
$120 million
in its U.S. Rental Car segment.
In 2017, as a result of declines in revenue and profitability of the Company and a decline in the share price of Hertz Global's common stock, the Company tested the recoverability of its goodwill and indefinite-lived intangible assets as of June 30, and concluded that there was an impairment of the Dollar Thrifty tradename in its U.S. Rental Car segment and recorded a charge of
$86 million
. The impairment was largely due to a decrease in long-term revenue projections coupled with an increase in the weighted average cost of capital. Subsequent to recording the impairment charge, the carrying value of the Dollar Thrifty tradename was approximately
$934 million
, representing its estimated fair value. A change of one percentage point to the weighted average cost of capital assumption used in the impairment analysis would have impacted the impairment charge by approximately
$80 million
.
The Company also tested the recoverability of its goodwill and indefinite-lived intangible assets as of its annual test dates of October 1, 2017 and 2018, the results of which indicated that the estimated fair value of each reporting unit and tradenames was in excess of its carrying value by more than 20% in all instances, therefore, the Company concluded there was no impairment.
66
HERTZ GLOBAL HOLDINGS, INC. AND SUBSIDIARIES
THE HERTZ CORPORATION AND SUBSIDIARIES
|
ITEM 7.
|
MANAGEMENT'S DISCUSSION AND ANALYSIS OF FINANCIAL CONDITION AND RESULTS OF OPERATIONS (Continued)
|
Subrogation Receivables
Subrogation receivables represent recoveries that the Company is contractually entitled to receive for vehicle damage caused while a vehicle is on rent with a customer. The amount of subrogation receivables recorded by the Company reflects our best estimate of both billed and unbilled recoveries from customers and/or third parties and represents the amount of damage the Company expects to recover. We estimate recoveries based on the relationship between historical collection data from subrogation claims and total damage expense, as well as other inputs, such as historical recovery periods, average recovery rates, average recovery dollars and other qualitative facts and circumstances.
Income Taxes
Our income tax expense or benefit, deferred tax assets and liabilities and liabilities for unrecognized tax benefits reflect management's best assessment of estimated current and future taxes to be paid. Deferred tax asset valuation allowances and our liabilities for unrecognized tax benefits require significant management judgment regarding applicable statutes and their related interpretation, the status of various income tax audits and our particular facts and circumstances.
Deferred tax assets and liabilities are recognized for the future tax consequences attributable to differences between the financial statement carrying amounts of existing assets and liabilities and their respective tax bases. Deferred tax assets and liabilities are measured using enacted tax rates expected to apply to taxable income in the years in which those temporary differences are expected to be recovered or settled. Valuation allowances are estimated and recorded to reduce deferred tax assets when it is more likely than not that a tax benefit will not be realized. In evaluating our ability to recover our deferred tax assets within the jurisdiction from which they arise, we consider all available positive and negative evidence, including scheduled reversals of deferred tax liabilities, projected future taxable income, tax planning strategies, and results of operations. In projecting future taxable income, we consider historical results and incorporate assumptions about the amount of future state, federal and foreign pretax operating income adjusted for items that do not have tax consequences. Our assumptions regarding future taxable income are consistent with the plans and estimates we use to manage our underlying businesses. Subsequent changes to enacted tax rates and changes to the global mix of operating results will result in changes to the tax rates used to calculate deferred taxes and any related valuation allowances. We record deferred tax assets for net operating loss carry forwards in various tax jurisdictions when applicable. Upon utilization of those carry forwards, the taxing authorities may examine the positions that led to the generation of those net operating losses and determine that some of those losses are disallowed, which could result in additional income tax payable to the Company.
We evaluate our exposures associated with our various tax filing positions and recognize a tax benefit only if it is more likely than not that the tax position will be sustained upon examination by the relevant taxing authorities, including resolutions of any related appeals or litigation processes, based on the technical merits of our position. For uncertain tax positions that do not meet this threshold, we record a related liability. We adjust our unrecognized tax benefit liability and income tax expense in the period in which the uncertain tax position is effectively settled, the statute of limitations expires for the relevant taxing authority to examine the tax position or when new information becomes available. There is a reasonable possibility that our unrecognized tax benefit liability will be adjusted within twelve months due to the expiration of a statute limitations and/or resolution of examinations with taxing authorities.
We have generated income in certain foreign jurisdictions that may be subject to additional income or withholding taxes. We have historically asserted our intent to reinvest these earnings for the foreseeable future and continue to evaluate our plans for reinvestment or repatriation of unremitted foreign earnings and thus have not adjusted our previous indefinite reinvestment assertions for the effects of the TCJA. While we do not expect to repatriate cash to the U.S. to satisfy domestic liquidity needs, if these amounts were distributed to the U.S., in the form of dividends or otherwise, we may be subject to additional income or withholding taxes, which could be material.
Our income tax returns are periodically audited by domestic and foreign tax authorities. These audits include review of our tax filing positions, including the timing and amount of deductions taken and the allocation of income between tax jurisdictions.
67
HERTZ GLOBAL HOLDINGS, INC. AND SUBSIDIARIES
THE HERTZ CORPORATION AND SUBSIDIARIES
|
ITEM 7.
|
MANAGEMENT'S DISCUSSION AND ANALYSIS OF FINANCIAL CONDITION AND RESULTS OF OPERATIONS (Continued)
|
Recent Accounting Pronouncements
For a discussion of recent accounting pronouncements, see
Note 2
, "
Significant Accounting Policies
," — "Recently Issued Accounting Pronouncements," to the Notes to our consolidated financial statements included in this
2018
Annual Report under the caption Item 8, "Financial Statements and Supplementary Data."
ITEM 7A. QUANTITATIVE AND QUALITATIVE DISCLOSURES ABOUT MARKET RISK
RISK MANAGEMENT
For a discussion of additional risks arising from our operations, including vehicle liability, general liability and property damage insurable risks, see “Item 1—Business—Risk Management” in this
2018
Annual Report.
Market Risks
We are exposed to a variety of market risks, including the effects of changes in interest rates (including credit spreads), foreign currency exchange rates and fluctuations in fuel prices. We manage our exposure to these market risks through our regular operating and financing activities and, when deemed appropriate, through the use of derivative financial instruments. Derivative financial instruments are viewed as risk management tools and have not been used for speculative or trading purposes. In addition, derivative financial instruments are entered into with a diversified group of major financial institutions in order to manage our exposure to counterparty nonperformance on such instruments.
Interest Rate Risk
We have a significant amount of debt with a mix of fixed and variable rates of interest. Floating rate debt carries interest based generally on LIBOR, Euro inter-bank offered rate (“EURIBOR”) or their equivalents for local currencies or bank conduit commercial paper rates plus an applicable margin. Increases in interest rates could therefore significantly increase the associated interest payments that we are required to make on this debt. See
Note 7
, "
Debt
," to the Notes to our consolidated financial statements included in this
2018
Annual Report under the caption Item 8, "Financial Statements and Supplementary Data.”
We have assessed our exposure to changes in interest rates by analyzing the sensitivity to our operating results assuming various changes in market interest rates. Assuming a hypothetical increase of
one percentage
point in interest rates on our debt portfolio and cash equivalents and investments as of
December 31, 2018
, our pre-tax operating results would decrease by an estimated
$52 million
over a twelve-month period.
From time to time, we may enter into interest rate swap agreements and/or interest rate cap/floor agreements to manage interest rate risk and our mix of fixed and floating rate debt. As of
December 31, 2018
, we do not have material exposures resulting from our interest rate swap agreements or interest rate cap/floor agreements.
Consistent with the terms of certain agreements governing the respective debt obligations, we may be required to hedge a portion of the floating rate interest exposure under the various debt facilities to provide protection in respect of such exposure.
Foreign Currency Exchange Rate Risk
We have exposure to foreign currency exchange rate fluctuations worldwide and primarily with respect to the Euro, Canadian dollar, Australian dollar and British pound.
We manage our foreign currency exchange rate risk primarily by incurring, to the extent practicable, operating and financing expenses in the local currency in the countries in which we operate, including making fleet purchases and borrowing locally. Also, we have purchased foreign currency exchange rate options to manage exposure to fluctuations in foreign currency exchange rates for selected cross currency marketing programs. Our risks with respect to foreign currency exchange rate options are limited to the premium paid for the right to exercise the option and the future performance of the option's counterparty.
68
HERTZ GLOBAL HOLDINGS, INC. AND SUBSIDIARIES
THE HERTZ CORPORATION AND SUBSIDIARIES
ITEM 7A. QUANTITATIVE AND QUALITATIVE DISCLOSURES ABOUT MARKET RISK (Continued)
We also manage exposure to fluctuations in currency risk on cross currency intercompany loans we make to certain of our subsidiaries by entering into foreign currency forward contracts at the time the loans are entered which are intended to offset the impact of foreign currency movements on the underlying intercompany loan obligations. As of
December 31, 2018
, we do not have material exposures resulting from foreign currency forward contracts.
We do not hedge our operating results against currency movement as they are primarily translational in nature. Using foreign currency forward rates as of
December 31, 2018
, we expect revenue to be positively impacted by approximately
1%
over a twelve-month period. Additionally, each
one percentage
point change in foreign currency movements is estimated to impact our Adjusted Pre-tax Income by an estimated
$1 million
over a twelve-month period.
Fuel Risks
We purchase unleaded gasoline and diesel fuel at prevailing market rates. We are subject to price exposure related to the fluctuations in the price of fuel. We anticipate that fuel risk will remain a market risk for the foreseeable future. We have determined that a 10% hypothetical change in the price of fuel will not have a material impact on our operating results.
Inflation
The increased cost of vehicles is the primary inflationary factor affecting us. Many of our other operating expenses are also expected to increase with inflation, including health care costs and gasoline. Management does not expect that the effect of inflation on our overall operating costs will be greater for us than for our competitors.
Other Income Tax Related Matters
Prior to the TCJA, we operated a like-kind exchange (“LKE”) program for our U.S. vehicle rental business. The program resulted in deferral of federal and state income taxes for fiscal years 2006 through 2009 and 2013 through 2017, and part of 2010 and 2012. The TCJA repealed the LKE deferral rules as applicable to personal property, including rental vehicles. To offset the detriment of LKE repeal for personal property, we will utilize the increases to existing first-year depreciation from 50 percent to 100 percent (“bonus depreciation”) under the TCJA. Generally, the bonus depreciation percentage is increased for property acquired and placed in service after September 27, 2017, and before January 1, 2023. At that point, a progressive step-down in bonus depreciation begins, with 80 percent permitted in 2023, 60 percent in 2024, 40 percent in 2025, and 20 percent in 2026.
Given the repeal of LKE and changes to bonus depreciation, we could incur material cash tax payments in the future.
In connection with the Spin-Off in 2016, Herc Holdings received a private letter ruling from the IRS to the effect that, subject to the accuracy of and compliance with certain representations, assumptions and covenants, (i) the Spin-Off will qualify as a tax-free transaction under Sections 355 and 368(a)(1)(D) of the Code, and (ii) the internal spin-off transactions will qualify as tax-free under Section 355 of the Code. A private letter ruling from the IRS generally is binding on the IRS. However, the IRS ruling did not rule that the Spin-Offs satisfied every requirement for a tax-free spin-off, and Herc Holdings and Hertz Global relied solely on opinions of professional advisors to determine that such additional requirements were satisfied. The ruling and the opinions relied on certain facts, assumptions, representations and undertakings from Herc Holdings and Hertz Holdings regarding the past and future conduct of the companies’ respective businesses and other matters. If any of these facts, assumptions, representations or undertakings were incorrect or not otherwise satisfied, Herc Holdings and Hertz Global, and their affiliates may not be able to rely on the ruling or the opinions of tax advisors and could be subject to significant tax liabilities. Notwithstanding the private letter ruling and opinions of tax advisors, the IRS could determine on audit that the Spin-Offs and related transactions are taxable if it determines that any of these facts, assumptions, representations or undertakings are not correct or have been violated or if it disagrees with the conclusions in the opinions that are not covered by the private letter ruling, or for any other reason, including as a result of certain significant changes in the stock ownership of Herc Holdings or Hertz Global after the Spin-Off. If the Spin-Offs or related transactions are determined to be taxable for U.S. federal income tax purposes, Herc Holdings and Hertz Global and, in certain cases, their stockholders (at the time of the Spin-Off) could incur significant U.S. federal income tax liabilities, including taxation on the value of the Hertz Global stock
69
HERTZ GLOBAL HOLDINGS, INC. AND SUBSIDIARIES
THE HERTZ CORPORATION AND SUBSIDIARIES
ITEM 7A. QUANTITATIVE AND QUALITATIVE DISCLOSURES ABOUT MARKET RISK (Continued)
distributed in the Spin-Off and the value of other companies distributed in the internal Spin-Off transactions, and Hertz Global could incur significant liabilities, either directly to the tax authorities or under a Tax Matters Agreement entered into with Herc Holdings.
The IRS completed its audit of our 2007 to 2009 and surveyed 2010 and 2011 tax returns and had no changes to the previously-filed tax returns. Currently, our 2014 and 2015 tax years are under audit by the IRS. We also have been notified that the IRS intends to begin auditing tax year 2016.
70
HERTZ GLOBAL HOLDINGS, INC. AND SUBSIDIARIES
THE HERTZ CORPORATION AND SUBSIDIARIES
ITEM 8. FINANCIAL STATEMENTS AND SUPPLEMENTARY DATA
Index
|
Page
|
||
|
Hertz Global Holdings, Inc. and Subsidiaries
|
||
|
The Hertz Corporation and Subsidiaries
|
||
|
Notes to the Consolidated Financial Statements
|
||
|
Schedule I
|
||
|
Schedule II
|
||
71
HERTZ GLOBAL HOLDINGS, INC. AND SUBSIDIARIES
REPORT OF INDEPENDENT REGISTERED PUBLIC ACCOUNTING FIRM
To the Board of Directors
and Stockholders of
Hertz Global Holdings, Inc.
Opinions on the Financial Statements and Internal Control over Financial Reporting
We have audited the accompanying consolidated balance sheets of Hertz Global Holdings, Inc. and its subsidiaries (the “Company”) as of December 31, 2018 and 2017,
and the related consolidated statements of operations, comprehensive income (loss), changes in equity and cash flow
s
for each of the three years in the period ended
December 31, 2018, including the related notes and schedules of (i) condensed financial information of Hertz Global Holdings, Inc. as of December 31, 2018 and 2017 and for each of the three years in the period ended December 31, 2018 and (ii) valuation and qualifying accounts for each of the three years in the period ended December 31, 2018 appearing under Item 8 (collectively referred to as the “consolidated financial statements”).
We also have audited the Company's internal control over financial reporting as of December 31, 2018, based on criteria established in
Internal Control - Integrated Framework
(2013) issued by the Committee of Sponsoring Organizations of the Treadway Commission (COSO).
In our opinion, the consolidated
financial statements referred to above present fairly, in all material respects, the financial position of the Company as of December 31, 2018 and 2017
,
and the results of its operations and its cash flows for each of the three years in the period ended December 31, 2018
in conformity with accounting principles generally accepted in the United States of America. Also in our opinion, the Company maintained, in all material respects, effective internal control over financial reporting as of December 31, 2018, based on criteria established in
Internal Control - Integrated Framework
(2013) issued by the COSO.
Change in Accounting Principles
As discussed in Note 2 to the consolidated financial statements, the Company changed the manner in which it accounts for revenues and the manner in which it presents restricted cash in 2018.
Basis for Opinions
The Company's management is responsible for these consolidated financial statements, for maintaining effective internal control over financial reporting, and for its assessment of the effectiveness of internal control over financial reporting, included in Management’s Report on Internal Control over Financial Reporting appearing under Item 9A. Our responsibility is to express opinions on the Company’s consolidated
financial statements and on the Company's internal control over financial reporting based on our audits. We are a public accounting firm registered with the Public Company Accounting Oversight Board (United States) (PCAOB) and are required to be independent with respect to the Company in accordance with the U.S. federal securities laws and the applicable rules and regulations of the Securities and Exchange Commission and the PCAOB.
We conducted our audits in accordance with the standards of the PCAOB. Those standards require that we plan and perform the audits to obtain reasonable assurance about whether the consolidated
financial statements are free of material misstatement, whether due to error or fraud, and whether effective internal control over financial reporting was maintained in all material respects.
Our audits of the consolidated
financial statements included performing procedures to assess the risks of material misstatement of the consolidated
financial statements, whether due to error or fraud, and performing procedures that respond to those risks. Such procedures included examining, on a test basis, evidence regarding the amounts and disclosures in the consolidated
financial statements. Our audits also included evaluating the accounting principles used and significant estimates made by management, as well as evaluating the overall presentation of the consolidated
financial statements. Our audit of internal control over financial reporting included obtaining an understanding of internal control over financial reporting, assessing the risk that a material weakness exists, and testing and evaluating the design and operating effectiveness of internal control based on the assessed risk. Our audits also included performing
72
HERTZ GLOBAL HOLDINGS, INC. AND SUBSIDIARIES
such other procedures as we considered necessary in the circumstances. We believe that our audits provide a reasonable basis for our opinions.
Definition and Limitations of Internal Control over Financial Reporting
A company’s internal control over financial reporting is a process designed to provide reasonable assurance regarding the reliability of financial reporting and the preparation of financial statements for external purposes in accordance with generally accepted accounting principles. A company’s internal control over financial reporting includes those policies and procedures that (i) pertain to the maintenance of records that, in reasonable detail, accurately and fairly reflect the transactions and dispositions of the assets of the company; (ii) provide reasonable assurance that transactions are recorded as necessary to permit preparation of financial statements in accordance with generally accepted accounting principles, and that receipts and expenditures of the company are being made only in accordance with authorizations of management and directors of the company; and (iii) provide reasonable assurance regarding prevention or timely detection of unauthorized acquisition, use, or disposition of the company’s assets that could have a material effect on the financial statements.
Because of its inherent limitations, internal control over financial reporting may not prevent or detect misstatements. Also, projections of any evaluation of effectiveness to future periods are subject to the risk that controls may become inadequate because of changes in conditions, or that the degree of compliance with the policies or procedures may deteriorate.
/s/ PricewaterhouseCoopers LLP
Fort Lauderdale, Florida
February 25, 2019
We have served as the Company’s or its predecessor’s auditor since 1994.
73
REPORT OF INDEPENDENT REGISTERED PUBLIC ACCOUNTING FIRM
To the Board of Directors
and Stockholder of
The Hertz Corporation
Opinions on the Financial Statements and Internal Control over Financial Reporting
We have audited the accompanying consolidated balance sheets of The Hertz Corporation and its subsidiaries
(the “Company”) as of December 31, 2018 and
2017,
and the related consolidated statements of operations, comprehensive income (loss), changes in equity and cash flows for each of the three years in the period ended
December 31, 2018, including the related notes and schedule of valuation and qualifying accounts for each of the three years in the period ended December 31, 2018 appearing under Item 8 (collectively referred to as the “consolidated financial statements”).
We also have audited the Company's internal control over financial reporting as of December 31, 2018, based on criteria established in
Internal Control - Integrated Framework
(2013)
issued by the Committee of Sponsoring Organizations of the Treadway Commission (COSO).
In our opinion, the consolidated
financial statements referred to above present fairly, in all material respects, the financial position of the Company as of December 31, 2018
and 2017
,
and the results of its
operations and its
cash flows for each of the three years in the period ended
December 31, 2018
in conformity with accounting principles generally accepted in the United States of America. Also in our opinion, the Company maintained, in all material respects, effective internal control over financial reporting as of December 31, 2018, based on criteria established in
Internal Control - Integrated Framework
(2013)
issued by the COSO.
Change in Accounting Principles
As discussed in Note 2 to the consolidated financial statements, the Company changed the manner in which it accounts for revenues and the manner in which it presents restricted cash in 2018.
Basis for Opinions
The Company's management is responsible for these consolidated financial statements, for maintaining effective internal control over financial reporting, and for its assessment of the effectiveness of internal control over financial reporting, included in Management's Report on Internal Control over Financial Reporting appearing under Item 9A.
Our responsibility is to express opinions on the Company’s consolidated
financial statements and on the Company's internal control over financial reporting based on our audits. We are a public accounting firm registered with the Public Company Accounting Oversight Board (United States) (PCAOB) and are required to be independent with respect to the Company in accordance with the U.S. federal securities laws and the applicable rules and regulations of the Securities and Exchange Commission and the PCAOB.
We conducted our audits in accordance with the standards of the PCAOB and in accordance with auditing standards generally accepted in the United States of America. Those standards require that we plan and perform the audits to obtain reasonable assurance about whether the consolidated
financial statements are free of material misstatement, whether due to error or fraud, and whether effective internal control over financial reporting was maintained in all material respects.
Our audits of the consolidated
financial statements included performing procedures to assess the risks of material misstatement of the consolidated
financial statements, whether due to error or fraud, and performing procedures that respond to those risks. Such procedures included examining, on a test basis, evidence regarding the amounts and disclosures in the consolidated
financial statements. Our audits also included evaluating the accounting principles used and significant estimates made by management, as well as evaluating the overall presentation of the consolidated
financial statements. Our audit of internal control over financial reporting included obtaining an understanding of internal control over financial reporting, assessing the risk that a material weakness exists, and testing and evaluating the design and operating effectiveness of internal control based on the assessed risk. Our audits also included performing
74
such other procedures as we considered necessary in the circumstances. We believe that our audits provide a reasonable basis for our opinions.
Definition and Limitations of Internal Control over Financial Reporting
A company’s internal control over financial reporting is a process designed to provide reasonable assurance regarding the reliability of financial reporting and the preparation of financial statements for external purposes in accordance with generally accepted accounting principles. A company’s internal control over financial reporting includes those policies and procedures that (i) pertain to the maintenance of records that, in reasonable detail, accurately and fairly reflect the transactions and dispositions of the assets of the company; (ii) provide reasonable assurance that transactions are recorded as necessary to permit preparation of financial statements in accordance with generally accepted accounting principles, and that receipts and expenditures of the company are being made only in accordance with authorizations of management and directors of the company; and (iii) provide reasonable assurance regarding prevention or timely detection of unauthorized acquisition, use, or disposition of the company’s assets that could have a material effect on the financial statements.
Because of its inherent limitations, internal control over financial reporting may not prevent or detect misstatements. Also, projections of any evaluation of effectiveness to future periods are subject to the risk that controls may become inadequate because of changes in conditions, or that the degree of compliance with the policies or procedures may deteriorate.
/s/ PricewaterhouseCoopers LLP
Fort Lauderdale, Florida
February 25, 2019
We have served as the Company’s auditor since 1994.
75
HERTZ GLOBAL HOLDINGS, INC. AND SUBSIDIARIES
CONSOLIDATED BALANCE SHEETS
(In millions, except par value)
|
December 31, 2018
|
December 31, 2017
|
||||||
|
ASSETS
|
|||||||
|
Cash and cash equivalents
|
$
|
1,127
|
|
$
|
1,072
|
|
|
|
Restricted cash and cash equivalents:
|
|||||||
|
Vehicle
|
257
|
|
386
|
|
|||
|
Non-vehicle
|
26
|
|
46
|
|
|||
|
Total restricted cash and cash equivalents
|
283
|
|
432
|
|
|||
|
Total cash, cash equivalents, restricted cash and restricted cash equivalents
|
1,410
|
|
1,504
|
|
|||
|
Receivables:
|
|||||||
|
Vehicle
|
625
|
|
531
|
|
|||
|
Non-vehicle, net of allowance of $27 and $33, respectively
|
962
|
|
834
|
|
|||
|
Total receivables, net
|
1,587
|
|
1,365
|
|
|||
|
Prepaid expenses and other assets
|
902
|
|
687
|
|
|||
|
Revenue earning vehicles:
|
|||||||
|
Vehicles
|
15,703
|
|
14,574
|
|
|||
|
Less: accumulated depreciation
|
(3,284
|
)
|
(3,238
|
)
|
|||
|
Total revenue earning vehicles, net
|
12,419
|
|
11,336
|
|
|||
|
Property and equipment, net
|
778
|
|
840
|
|
|||
|
Intangible assets, net
|
3,203
|
|
3,242
|
|
|||
|
Goodwill
|
1,083
|
|
1,084
|
|
|||
|
Total assets
(a)
|
$
|
21,382
|
|
$
|
20,058
|
|
|
|
LIABILITIES AND STOCKHOLDERS' EQUITY
|
|||||||
|
Accounts payable:
|
|||||||
|
Vehicle
|
$
|
284
|
|
$
|
294
|
|
|
|
Non-vehicle
|
704
|
|
652
|
|
|||
|
Total accounts payable
|
988
|
|
946
|
|
|||
|
Accrued liabilities
|
1,304
|
|
920
|
|
|||
|
Accrued taxes, net
|
136
|
|
160
|
|
|||
|
Debt:
|
|||||||
|
Vehicle
|
11,902
|
|
10,431
|
|
|||
|
Non-vehicle
|
4,422
|
|
4,434
|
|
|||
|
Total debt
|
16,324
|
|
14,865
|
|
|||
|
Public liability and property damage
|
418
|
|
427
|
|
|||
|
Deferred income taxes, net
|
1,092
|
|
1,220
|
|
|||
|
Total liabilities
(a)
|
20,262
|
|
18,538
|
|
|||
|
Commitments and contingencies
|
|
|
|
|
|||
|
Stockholders' equity:
|
|||||||
|
Preferred stock, $0.01 par value, no shares issued and outstanding
|
—
|
|
—
|
|
|||
|
Common stock, $0.01 par value, 86 and 86 shares issued, respectively and 84 and 84 shares outstanding, respectively
|
1
|
|
1
|
|
|||
|
Additional paid-in capital
|
2,261
|
|
2,243
|
|
|||
|
Accumulated deficit
|
(909
|
)
|
(506
|
)
|
|||
|
Accumulated other comprehensive income (loss)
|
(192
|
)
|
(118
|
)
|
|||
|
Treasury stock, at cost, 2 shares and 2 shares, respectively
|
(100
|
)
|
(100
|
)
|
|||
|
Stockholders' equity attributable to Hertz Global
|
1,061
|
|
1,520
|
|
|||
|
Noncontrolling interests
|
59
|
|
—
|
|
|||
|
Total stockholders' equity
|
1,120
|
|
1,520
|
|
|||
|
Total liabilities and stockholders' equity
|
$
|
21,382
|
|
$
|
20,058
|
|
|
(a) Hertz Global Holdings, Inc.'s consolidated total assets as of December 31, 2018 and December 31, 2017 include total assets of variable interest entities (“VIEs”) of
$1.0 billion
and
$524 million
, respectively, which can only be used to settle obligations of the VIEs. Hertz Global Holdings, Inc.'s consolidated total liabilities as of December 31, 2018 and December 31, 2017 include total liabilities of VIEs of
$947 million
and
$524 million
, respectively, for which the creditors of the VIEs have no recourse to Hertz Global Holdings, Inc. See "Special Purpose Entities" in
Note 7
, "
Debt
" and "Other Relationships" in
Note 17
, "
Related Party Transactions
" for further information.
The accompanying notes are an integral part of these financial statements.
76
HERTZ GLOBAL HOLDINGS, INC. AND SUBSIDIARIES
CONSOLIDATED STATEMENTS OF OPERATIONS
(In millions, except per share data)
|
Years Ended December 31,
|
|||||||||||
|
|
2018
|
2017
|
2016
|
||||||||
|
Revenues:
|
|||||||||||
|
Worldwide vehicle rental
|
$
|
8,756
|
|
$
|
8,163
|
|
$
|
8,211
|
|
||
|
All other operations
|
748
|
|
640
|
|
592
|
|
|||||
|
Total revenues
|
9,504
|
|
8,803
|
|
8,803
|
|
|||||
|
Expenses:
|
|||||||||||
|
Direct vehicle and operating
|
5,355
|
|
4,958
|
|
4,932
|
|
|||||
|
Depreciation of revenue earning vehicles and lease charges, net
|
2,690
|
|
2,798
|
|
2,601
|
|
|||||
|
Selling, general and administrative
|
1,017
|
|
880
|
|
899
|
|
|||||
|
Interest expense, net:
|
|||||||||||
|
Vehicle
|
448
|
|
331
|
|
280
|
|
|||||
|
Non-vehicle
|
291
|
|
306
|
|
344
|
|
|||||
|
Total interest expense, net
|
739
|
|
637
|
|
624
|
|
|||||
|
Goodwill and intangible asset impairments
|
—
|
|
86
|
|
292
|
|
|||||
|
Other (income) expense, net
|
(40
|
)
|
19
|
|
(75
|
)
|
|||||
|
Total expenses
|
9,761
|
|
9,378
|
|
9,273
|
|
|||||
|
Income (loss) from continuing operations before income taxes
|
(257
|
)
|
(575
|
)
|
(470
|
)
|
|||||
|
Income tax (provision) benefit
|
30
|
|
902
|
|
(4
|
)
|
|||||
|
Net income (loss) from continuing operations
|
(227
|
)
|
327
|
|
(474
|
)
|
|||||
|
Net income (loss) from discontinued operations
|
—
|
|
—
|
|
(17
|
)
|
|||||
|
Net income (loss)
|
(227
|
)
|
327
|
|
(491
|
)
|
|||||
|
Net (income) loss attributable to noncontrolling interests
|
2
|
|
—
|
|
—
|
|
|||||
|
Net income (loss) attributable to Hertz Global
|
$
|
(225
|
)
|
$
|
327
|
|
$
|
(491
|
)
|
||
|
Weighted average shares outstanding:
|
|||||||||||
|
Basic
|
84
|
|
83
|
|
84
|
|
|||||
|
Diluted
|
84
|
|
83
|
|
84
|
|
|||||
|
Earnings (loss) per share:
|
|||||||||||
|
Basic earnings (loss) per share from continuing operations
|
$
|
(2.68
|
)
|
$
|
3.94
|
|
$
|
(5.65
|
)
|
||
|
Diluted earnings (loss) per share from continuing operations
|
$
|
(2.68
|
)
|
$
|
3.94
|
|
$
|
(5.65
|
)
|
||
|
Basic earnings (loss) per share
|
$
|
(2.68
|
)
|
$
|
3.94
|
|
$
|
(5.85
|
)
|
||
|
Diluted earnings (loss) per share
|
$
|
(2.68
|
)
|
$
|
3.94
|
|
$
|
(5.85
|
)
|
||
The accompanying notes are an integral part of these financial statements.
77
HERTZ GLOBAL HOLDINGS, INC. AND SUBSIDIARIES
CONSOLIDATED STATEMENTS OF COMPREHENSIVE INCOME (LOSS)
(In millions)
|
Years Ended December 31,
|
|||||||||||
|
2018
|
2017
|
2016
|
|||||||||
|
Net income (loss)
|
(227
|
)
|
$
|
327
|
|
$
|
(491
|
)
|
|||
|
Other comprehensive income (loss):
|
|
|
|||||||||
|
Foreign currency translation adjustments
|
(34
|
)
|
14
|
|
(16
|
)
|
|||||
|
Unrealized holding gains (losses) on securities
|
—
|
|
—
|
|
12
|
|
|||||
|
Reclassification of realized gain on securities to other (income) expense
|
—
|
|
(3
|
)
|
(9
|
)
|
|||||
|
Reclassification of foreign currency items to other (income) expense, net
|
(1
|
)
|
8
|
|
—
|
|
|||||
|
Net gain (loss) on defined benefit pension plans
|
(44
|
)
|
40
|
|
(30
|
)
|
|||||
|
Reclassification from other comprehensive income (loss) to selling, general and administrative expense for amortization of actuarial (gains) losses on defined benefit pension plans
|
—
|
|
6
|
|
11
|
|
|||||
|
Reclassification from other comprehensive income (loss) to other (income) expense for amortization of actuarial (gains) losses on defined benefit pension plans
|
5
|
|
—
|
|
—
|
|
|||||
|
Total other comprehensive income (loss) before income taxes
|
(74
|
)
|
65
|
|
(32
|
)
|
|||||
|
Income tax (provision) benefit related to net gains and losses on defined benefit pension plans
|
12
|
|
(10
|
)
|
7
|
|
|||||
|
Income tax (provision) benefit related to reclassified amounts of net periodic costs on defined benefit pension plans
|
(1
|
)
|
(2
|
)
|
(4
|
)
|
|||||
|
Total other comprehensive income (loss)
|
(63
|
)
|
53
|
|
(29
|
)
|
|||||
|
Total comprehensive income (loss)
|
(290
|
)
|
380
|
|
(520
|
)
|
|||||
|
Comprehensive (income) loss attributable to noncontrolling interests
|
2
|
|
—
|
|
—
|
|
|||||
|
Comprehensive income (loss) attributable to Hertz Global
|
$
|
(288
|
)
|
$
|
380
|
|
$
|
(520
|
)
|
||
The accompanying notes are an integral part of these financial statements.
78
HERTZ GLOBAL HOLDINGS, INC. AND SUBSIDIARIES
CONSOLIDATED STATEMENTS OF CHANGES IN EQUITY
(In millions)
|
|
Preferred Stock
|
Common Stock Shares
|
Common Stock Amount
|
Additional
Paid-In Capital |
Accumulated
Deficit |
Accumulated
Other Comprehensive Income (Loss) |
Treasury Stock Shares
|
Treasury Stock Amount
|
Stockholders' Equity Attributable to Hertz Global
|
Non-
controlling Interests |
Total Stockholders' Equity
|
||||||||||||||||||||||||||||||
|
Balance as of:
|
|||||||||||||||||||||||||||||||||||||||||
|
December 31, 2015
|
—
|
|
423
|
|
$
|
4
|
|
$
|
3,343
|
|
$
|
(391
|
)
|
$
|
(245
|
)
|
41
|
|
$
|
(692
|
)
|
$
|
2,019
|
|
$
|
—
|
|
$
|
2,019
|
|
|||||||||||
|
Net income (loss)
|
—
|
|
—
|
|
—
|
|
—
|
|
(491
|
)
|
—
|
|
—
|
|
—
|
|
(491
|
)
|
—
|
|
(491
|
)
|
|||||||||||||||||||
|
Other comprehensive income (loss)
|
—
|
|
—
|
|
—
|
|
—
|
|
—
|
|
(29
|
)
|
—
|
|
—
|
|
(29
|
)
|
—
|
|
(29
|
)
|
|||||||||||||||||||
|
Net settlement on vesting of restricted stock
|
—
|
|
—
|
|
—
|
|
(2
|
)
|
—
|
|
—
|
|
—
|
|
—
|
|
(2
|
)
|
—
|
|
(2
|
)
|
|||||||||||||||||||
|
Share repurchase
|
—
|
|
(2
|
)
|
—
|
|
—
|
|
—
|
|
—
|
|
2
|
|
(100
|
)
|
(100
|
)
|
—
|
|
(100
|
)
|
|||||||||||||||||||
|
Stock-based compensation charges
|
—
|
|
—
|
|
—
|
|
14
|
|
—
|
|
—
|
|
—
|
|
—
|
|
14
|
|
—
|
|
14
|
|
|||||||||||||||||||
|
Exercise of stock options
|
—
|
|
1
|
|
—
|
|
10
|
|
—
|
|
—
|
|
—
|
|
—
|
|
10
|
|
—
|
|
10
|
|
|||||||||||||||||||
|
Common shares issued to directors
|
—
|
|
—
|
|
—
|
|
1
|
|
—
|
|
—
|
|
—
|
|
—
|
|
1
|
|
—
|
|
1
|
|
|||||||||||||||||||
|
Capital effect of Spin-Off
|
—
|
|
(339
|
)
|
(3
|
)
|
(689
|
)
|
—
|
|
—
|
|
(41
|
)
|
692
|
|
—
|
|
—
|
|
—
|
|
|||||||||||||||||||
|
Distribution of Herc Holdings, Inc.
|
—
|
|
—
|
|
—
|
|
(450
|
)
|
—
|
|
103
|
|
—
|
|
—
|
|
(347
|
)
|
—
|
|
(347
|
)
|
|||||||||||||||||||
|
December 31, 2016
|
—
|
|
83
|
|
1
|
|
2,227
|
|
(882
|
)
|
(171
|
)
|
2
|
|
(100
|
)
|
1,075
|
|
—
|
|
1,075
|
|
|||||||||||||||||||
|
Change in accounting principle
|
—
|
|
—
|
|
—
|
|
—
|
|
—
|
|
49
|
|
—
|
|
—
|
|
—
|
|
49
|
|
—
|
|
49
|
|
|||||||||||||||||
|
January 1, 2017 (as adjusted)
|
—
|
|
83
|
|
1
|
|
2,227
|
|
(833
|
)
|
(171
|
)
|
2
|
|
(100
|
)
|
1,124
|
|
—
|
|
1,124
|
|
|||||||||||||||||||
|
Net income (loss)
|
—
|
|
—
|
|
—
|
|
—
|
|
327
|
|
—
|
|
—
|
|
—
|
|
327
|
|
—
|
|
327
|
|
|||||||||||||||||||
|
Other comprehensive income (loss)
|
—
|
|
—
|
|
—
|
|
—
|
|
—
|
|
53
|
|
—
|
|
—
|
|
53
|
|
—
|
|
53
|
|
|||||||||||||||||||
|
Issuance of restricted stock
|
—
|
|
1
|
|
—
|
|
—
|
|
—
|
|
—
|
|
—
|
|
—
|
|
—
|
|
—
|
|
—
|
|
|||||||||||||||||||
|
Stock-based compensation charges
|
—
|
|
—
|
|
—
|
|
13
|
|
—
|
|
—
|
|
—
|
|
—
|
|
13
|
|
—
|
|
13
|
|
|||||||||||||||||||
|
Other
|
—
|
|
—
|
|
—
|
|
3
|
|
—
|
|
—
|
|
—
|
|
—
|
|
3
|
|
—
|
|
3
|
|
|||||||||||||||||||
|
December 31, 2017
|
—
|
|
84
|
|
1
|
|
2,243
|
|
(506
|
)
|
(118
|
)
|
2
|
|
(100
|
)
|
1,520
|
|
—
|
|
1,520
|
|
|||||||||||||||||||
|
Change in accounting principle
|
—
|
|
—
|
|
—
|
|
—
|
|
(189
|
)
|
—
|
|
—
|
|
—
|
|
(189
|
)
|
—
|
|
(189
|
)
|
|||||||||||||||||||
|
January 1, 2018 (as adjusted)
|
—
|
|
84
|
|
1
|
|
2,243
|
|
(695
|
)
|
(118
|
)
|
2
|
|
(100
|
)
|
1,331
|
|
—
|
|
1,331
|
|
|||||||||||||||||||
|
Net income (loss)
|
—
|
|
—
|
|
—
|
|
—
|
|
(225
|
)
|
—
|
|
—
|
|
—
|
|
(225
|
)
|
(2
|
)
|
(227
|
)
|
|||||||||||||||||||
|
Other comprehensive income (loss)
|
—
|
|
—
|
|
—
|
|
—
|
|
—
|
|
(63
|
)
|
—
|
|
—
|
|
(63
|
)
|
—
|
|
(63
|
)
|
|||||||||||||||||||
|
Issuance of restricted stock
|
—
|
|
—
|
|
—
|
|
(3
|
)
|
—
|
|
—
|
|
—
|
|
—
|
|
(3
|
)
|
—
|
|
(3
|
)
|
|||||||||||||||||||
|
Stock-based compensation charges
|
—
|
|
—
|
|
—
|
|
21
|
|
—
|
|
—
|
|
—
|
|
—
|
|
21
|
|
—
|
|
21
|
|
|||||||||||||||||||
|
Reclassification of income tax effects resulting from the Tax Cuts and Jobs Act
|
—
|
|
—
|
|
—
|
|
—
|
|
11
|
|
(11
|
)
|
—
|
|
—
|
|
—
|
|
—
|
|
—
|
|
|||||||||||||||||||
|
Contributions from noncontrolling interests
|
—
|
|
—
|
|
—
|
|
—
|
|
—
|
|
—
|
|
—
|
|
—
|
|
—
|
|
61
|
|
61
|
|
|||||||||||||||||||
|
December 31, 2018
|
—
|
|
84
|
|
$
|
1
|
|
$
|
2,261
|
|
$
|
(909
|
)
|
$
|
(192
|
)
|
2
|
|
$
|
(100
|
)
|
$
|
1,061
|
|
$
|
59
|
|
$
|
1,120
|
|
|||||||||||
The accompanying notes are an integral part of these financial statements.
79
HERTZ GLOBAL HOLDINGS, INC. AND SUBSIDIARIES
CONSOLIDATED STATEMENTS OF CASH FLOWS
(In millions)
|
Years Ended December 31,
|
|||||||||||
|
2018
|
2017
|
2016
|
|||||||||
|
Cash flows from operating activities:
|
|||||||||||
|
Net income (loss)
|
$
|
(227
|
)
|
$
|
327
|
|
$
|
(491
|
)
|
||
|
Less: Net income (loss) from discontinued operations
|
—
|
|
—
|
|
(17
|
)
|
|||||
|
Net income (loss) from continuing operations
|
(227
|
)
|
327
|
|
(474
|
)
|
|||||
|
Adjustments to reconcile net income (loss) to net cash provided by (used in) operating activities:
|
|||||||||||
|
Depreciation of revenue earning vehicles, net
|
2,546
|
|
2,722
|
|
2,531
|
|
|||||
|
Depreciation and amortization, non-vehicle
|
218
|
|
240
|
|
265
|
|
|||||
|
Amortization of deferred financing costs and debt discount (premium)
|
50
|
|
46
|
|
48
|
|
|||||
|
Loss on extinguishment of debt
|
22
|
|
13
|
|
55
|
|
|||||
|
Stock-based compensation charges
|
14
|
|
19
|
|
13
|
|
|||||
|
Provision for receivables allowance
|
35
|
|
33
|
|
51
|
|
|||||
|
Deferred income taxes, net
|
(66
|
)
|
(922
|
)
|
(78
|
)
|
|||||
|
Impairment charges and asset write-downs
|
—
|
|
116
|
|
340
|
|
|||||
|
(Gain) loss on marketable securities
|
(20
|
)
|
(3
|
)
|
(84
|
)
|
|||||
|
Other
|
6
|
|
(7
|
)
|
8
|
|
|||||
|
Changes in assets and liabilities:
|
|||||||||||
|
Non-vehicle receivables
|
(136
|
)
|
(75
|
)
|
(174
|
)
|
|||||
|
Prepaid expenses and other assets
|
(23
|
)
|
(22
|
)
|
(31
|
)
|
|||||
|
Non-vehicle accounts payable
|
70
|
|
20
|
|
31
|
|
|||||
|
Accrued liabilities
|
75
|
|
(86
|
)
|
(40
|
)
|
|||||
|
Accrued taxes, net
|
(8
|
)
|
(23
|
)
|
38
|
|
|||||
|
Public liability and property damage
|
—
|
|
(4
|
)
|
30
|
|
|||||
|
Net cash provided by (used in) operating activities
|
2,556
|
|
2,394
|
|
2,529
|
|
|||||
|
Cash flows from investing activities:
|
|||||||||||
|
Revenue earning vehicles expenditures
|
(12,493
|
)
|
(10,596
|
)
|
(10,872
|
)
|
|||||
|
Proceeds from disposal of revenue earning vehicles
|
8,452
|
|
7,653
|
|
8,679
|
|
|||||
|
Capital asset expenditures, non-vehicle
|
(177
|
)
|
(173
|
)
|
(134
|
)
|
|||||
|
Proceeds from property and other equipment disposed of or to be disposed of
|
51
|
|
21
|
|
59
|
|
|||||
|
Proceeds from sale of Brazil Operations, net of retained cash
|
—
|
|
94
|
|
—
|
|
|||||
|
Acquisitions, net of cash acquired
|
(2
|
)
|
(15
|
)
|
(2
|
)
|
|||||
|
Purchases of marketable securities
|
(60
|
)
|
—
|
|
—
|
|
|||||
|
Sales of marketable securities
|
36
|
|
9
|
|
267
|
|
|||||
|
Return of (investment in) equity investment
|
—
|
|
7
|
|
(45
|
)
|
|||||
|
Other
|
(4
|
)
|
—
|
|
—
|
|
|||||
|
Net cash provided by (used in) investing activities
|
(4,197
|
)
|
(3,000
|
)
|
(2,048
|
)
|
|||||
80
HERTZ GLOBAL HOLDINGS, INC. AND SUBSIDIARIES
CONSOLIDATED STATEMENTS OF CASH FLOWS (Continued)
(In millions)
|
Years Ended December 31,
|
|||||||||||
|
2018
|
2017
|
2016
|
|||||||||
|
Cash flows from financing activities:
|
|||||||||||
|
Proceeds from issuance of vehicle debt
|
14,009
|
|
10,756
|
|
9,692
|
|
|||||
|
Repayments of vehicle debt
|
(12,426
|
)
|
(10,244
|
)
|
(9,748
|
)
|
|||||
|
Proceeds from issuance of non-vehicle debt
|
557
|
|
2,100
|
|
2,592
|
|
|||||
|
Repayments of non-vehicle debt
|
(571
|
)
|
(1,560
|
)
|
(4,651
|
)
|
|||||
|
Purchase of treasury shares
|
—
|
|
—
|
|
(100
|
)
|
|||||
|
Payment of financing costs
|
(47
|
)
|
(59
|
)
|
(75
|
)
|
|||||
|
Early redemption premium payment
|
(19
|
)
|
(5
|
)
|
(27
|
)
|
|||||
|
Transfers from discontinued entities
|
—
|
|
—
|
|
2,122
|
|
|||||
|
Contributions from noncontrolling interests
|
60
|
|
—
|
|
—
|
|
|||||
|
Other
|
(2
|
)
|
—
|
|
12
|
|
|||||
|
Net cash provided by (used in) financing activities
|
1,561
|
|
988
|
|
(183
|
)
|
|||||
|
Effect of foreign currency exchange rate changes on cash, cash equivalents, restricted cash and restricted cash equivalents from continuing operations
|
(14
|
)
|
28
|
|
(11
|
)
|
|||||
|
Net increase (decrease) in cash, cash equivalents, restricted cash and restricted cash equivalents during the period from continuing operations
|
(94
|
)
|
410
|
|
287
|
|
|||||
|
Cash, cash equivalents, restricted cash and restricted cash equivalents at beginning of period
|
1,504
|
|
1,094
|
|
807
|
|
|||||
|
Cash, cash equivalents, restricted cash and restricted cash equivalents at end of period
|
$
|
1,410
|
|
$
|
1,504
|
|
$
|
1,094
|
|
||
|
Cash flows from discontinued operations:
|
|||||||||||
|
Cash flows provided by (used in) operating activities
|
$
|
—
|
|
$
|
—
|
|
$
|
205
|
|
||
|
Cash flows provided by (used in) investing activities
|
—
|
|
—
|
|
(77
|
)
|
|||||
|
Cash flows provided by (used in) financing activities
|
—
|
|
—
|
|
(97
|
)
|
|||||
|
Net increase (decrease) in cash, cash equivalents, restricted cash and restricted cash equivalents during the period from discontinued operations
|
$
|
—
|
|
$
|
—
|
|
$
|
31
|
|
||
|
Supplemental disclosures of cash flow information for continuing operations:
|
|||||||||||
|
Cash paid during the period for:
|
|
|
|||||||||
|
Interest, net of amounts capitalized:
|
|||||||||||
|
Vehicle
|
$
|
379
|
|
$
|
291
|
|
$
|
235
|
|
||
|
Non-vehicle
|
286
|
|
291
|
|
292
|
|
|||||
|
Income taxes, net of refunds
|
26
|
|
54
|
|
57
|
|
|||||
|
Supplemental disclosures of non-cash information for continuing operations:
|
|||||||||||
|
Purchases of revenue earning vehicles included in accounts payable and accrued liabilities, net of incentives
|
$
|
169
|
|
$
|
194
|
|
$
|
185
|
|
||
|
Sales of revenue earning vehicles included in receivables
|
510
|
|
431
|
|
473
|
|
|||||
|
Sales-type capital lease of revenue earning vehicles included in other receivables
|
75
|
|
—
|
|
—
|
|
|||||
|
Purchases of non-vehicle capital assets included in accounts payable
|
42
|
|
65
|
|
20
|
|
|||||
|
Revenue earning vehicles and non-vehicle capital assets acquired through capital lease
|
21
|
|
35
|
|
22
|
|
|||||
|
Receivable on sale of Brazil Operations
|
—
|
|
13
|
|
—
|
|
|||||
The accompanying notes are an integral part of these financial statements.
81
THE HERTZ CORPORATION AND SUBSIDIARIES
CONSOLIDATED BALANCE SHEETS
(In millions, except par value and share data)
|
December 31, 2018
|
December 31, 2017
|
||||||
|
ASSETS
|
|||||||
|
Cash and cash equivalents
|
$
|
1,127
|
|
$
|
1,072
|
|
|
|
Restricted cash and cash equivalents:
|
|||||||
|
Vehicle
|
257
|
|
386
|
|
|||
|
Non-vehicle
|
26
|
|
46
|
|
|||
|
Total restricted cash and cash equivalents
|
283
|
|
432
|
|
|||
|
Total cash, cash equivalents, restricted cash and restricted cash equivalents
|
1,410
|
|
1,504
|
|
|||
|
Receivables:
|
|||||||
|
Vehicle
|
625
|
|
531
|
|
|||
|
Non-vehicle, net of allowance of $27 and $33, respectively
|
962
|
|
834
|
|
|||
|
Total receivables, net
|
1,587
|
|
1,365
|
|
|||
|
Prepaid expenses and other assets
|
902
|
|
687
|
|
|||
|
Revenue earning vehicles:
|
|||||||
|
Vehicles
|
15,703
|
|
14,574
|
|
|||
|
Less: accumulated depreciation
|
(3,284
|
)
|
(3,238
|
)
|
|||
|
Total revenue earning vehicles, net
|
12,419
|
|
11,336
|
|
|||
|
Property and equipment, net
|
778
|
|
840
|
|
|||
|
Intangible assets, net
|
3,203
|
|
3,242
|
|
|||
|
Goodwill
|
1,083
|
|
1,084
|
|
|||
|
Total assets
(a)
|
$
|
21,382
|
|
$
|
20,058
|
|
|
|
LIABILITIES AND STOCKHOLDER'S EQUITY
|
|||||||
|
Accounts payable:
|
|||||||
|
Vehicle
|
$
|
284
|
|
$
|
294
|
|
|
|
Non-vehicle
|
704
|
|
652
|
|
|||
|
Total accounts payable
|
988
|
|
946
|
|
|||
|
Accrued liabilities
|
1,304
|
|
920
|
|
|||
|
Accrued taxes, net
|
136
|
|
160
|
|
|||
|
Debt:
|
|||||||
|
Vehicle
|
11,902
|
|
10,431
|
|
|||
|
Non-vehicle
|
4,422
|
|
4,434
|
|
|||
|
Total debt
|
16,324
|
|
14,865
|
|
|||
|
Public liability and property damage
|
418
|
|
427
|
|
|||
|
Deferred income taxes, net
|
1,094
|
|
1,220
|
|
|||
|
Total liabilities
(a)
|
20,264
|
|
18,538
|
|
|||
|
Commitments and contingencies
|
|
|
|
|
|||
|
Stockholder's equity:
|
|||||||
|
Common stock, $0.01 par value, 3,000 shares authorized, 100 and 100 shares issued and outstanding, respectively
|
—
|
|
—
|
|
|||
|
Additional paid-in capital
|
3,187
|
|
3,166
|
|
|||
|
Due from affiliate
|
(52
|
)
|
(42
|
)
|
|||
|
Accumulated deficit
|
(1,884
|
)
|
(1,486
|
)
|
|||
|
Accumulated other comprehensive income (loss)
|
(192
|
)
|
(118
|
)
|
|||
|
Stockholder's equity attributable to Hertz
|
1,059
|
|
1,520
|
|
|||
|
Noncontrolling interests
|
59
|
|
—
|
|
|||
|
Total stockholder's equity
|
1,118
|
|
1,520
|
|
|||
|
Total liabilities and stockholder's equity
|
$
|
21,382
|
|
$
|
20,058
|
|
|
(a) The Hertz Corporation's consolidated total assets as of December 31, 2018 and December 31, 2017 include total assets of variable interest entities (“VIEs”) of
$1.0 billion
and
$524 million
, respectively, which can only be used to settle obligations of the VIEs. The Hertz Corporation's consolidated total liabilities as of December 31, 2018 and December 31, 2017 include total liabilities of VIEs of
$947 million
and
$524 million
, respectively, for which the creditors of the VIEs have no recourse to Hertz Global Holdings, Inc. See "Special Purpose Entities" in
Note 7
, "
Debt
" and "Other Relationships" in
Note 17
, "
Related Party Transactions
" for further information.
The accompanying notes are an integral part of these financial statements.
82
THE HERTZ CORPORATION AND SUBSIDIARIES
CONSOLIDATED STATEMENTS OF OPERATIONS
(In millions)
|
|
Years Ended December 31,
|
||||||||||
|
2018
|
2017
|
2016
|
|||||||||
|
Revenues:
|
|||||||||||
|
Worldwide vehicle rental
|
$
|
8,756
|
|
$
|
8,163
|
|
$
|
8,211
|
|
||
|
All other operations
|
748
|
|
640
|
|
592
|
|
|||||
|
Total revenues
|
9,504
|
|
8,803
|
|
8,803
|
|
|||||
|
Expenses:
|
|||||||||||
|
Direct vehicle and operating
|
5,355
|
|
4,958
|
|
4,932
|
|
|||||
|
Depreciation of revenue earning vehicles and lease charges, net
|
2,690
|
|
2,798
|
|
2,601
|
|
|||||
|
Selling, general and administrative
|
1,017
|
|
880
|
|
899
|
|
|||||
|
Interest expense, net:
|
|||||||||||
|
Vehicle
|
448
|
|
331
|
|
280
|
|
|||||
|
Non-vehicle
|
284
|
|
301
|
|
343
|
|
|||||
|
Total interest expense, net
|
732
|
|
632
|
|
623
|
|
|||||
|
Goodwill and intangible asset impairments
|
—
|
|
86
|
|
292
|
|
|||||
|
Other (income) expense, net
|
(40
|
)
|
19
|
|
(75
|
)
|
|||||
|
Total expenses
|
9,754
|
|
9,373
|
|
9,272
|
|
|||||
|
Income (loss) from continuing operations before income taxes
|
(250
|
)
|
(570
|
)
|
(469
|
)
|
|||||
|
Income tax (provision) benefit
|
28
|
|
902
|
|
(4
|
)
|
|||||
|
Net income (loss) from continuing operations
|
(222
|
)
|
332
|
|
(473
|
)
|
|||||
|
Net income (loss) from discontinued operations
|
—
|
|
—
|
|
(15
|
)
|
|||||
|
Net income (loss)
|
(222
|
)
|
332
|
|
(488
|
)
|
|||||
|
Net (income) loss attributable to noncontrolling interests
|
2
|
|
—
|
|
—
|
|
|||||
|
Net income (loss) attributable to Hertz
|
$
|
(220
|
)
|
$
|
332
|
|
$
|
(488
|
)
|
||
The accompanying notes are an integral part of these financial statements.
83
THE HERTZ CORPORATION AND SUBSIDIARIES
CONSOLIDATED STATEMENTS OF COMPREHENSIVE INCOME (LOSS)
(In millions)
|
Years Ended December 31,
|
|||||||||||
|
2018
|
2017
|
2016
|
|||||||||
|
Net income (loss)
|
$
|
(222
|
)
|
$
|
332
|
|
$
|
(488
|
)
|
||
|
Other comprehensive income (loss):
|
|||||||||||
|
Foreign currency translation adjustments
|
(34
|
)
|
14
|
|
(16
|
)
|
|||||
|
Unrealized holding gains (losses) on securities
|
—
|
|
—
|
|
12
|
|
|||||
|
Reclassification of realized gain on securities to other (income) expense
|
—
|
|
(3
|
)
|
(9
|
)
|
|||||
|
Reclassification of foreign currency items to other (income) expense, net
|
(1
|
)
|
8
|
|
—
|
|
|||||
|
Net gain (loss) on defined benefit pension plans
|
(44
|
)
|
40
|
|
(30
|
)
|
|||||
|
Reclassification from other comprehensive income (loss) to selling, general and administrative expense for amortization of actuarial (gains) losses on defined benefit pension plans
|
—
|
|
6
|
|
11
|
|
|||||
|
Reclassification from other comprehensive income (loss) to other (income) expense for amortization of actuarial (gains) losses on defined benefit pension plans
|
5
|
|
—
|
|
—
|
|
|||||
|
Total other comprehensive income (loss) before income taxes
|
(74
|
)
|
65
|
|
(32
|
)
|
|||||
|
Income tax (provision) benefit related to net gains and losses on defined benefit pension plans
|
12
|
|
(10
|
)
|
7
|
|
|||||
|
Income tax (provision) benefit related to reclassified amounts of net periodic costs on defined benefit pension plans
|
(1
|
)
|
(2
|
)
|
(4
|
)
|
|||||
|
Total other comprehensive income (loss)
|
(63
|
)
|
53
|
|
(29
|
)
|
|||||
|
Total comprehensive income (loss)
|
(285
|
)
|
385
|
|
(517
|
)
|
|||||
|
Comprehensive (income) loss attributable to noncontrolling interests
|
2
|
|
—
|
|
—
|
|
|||||
|
Comprehensive income (loss) attributable to Hertz
|
(283
|
)
|
$
|
385
|
|
$
|
(517
|
)
|
|||
The accompanying notes are an integral part of these financial statements.
84
THE HERTZ CORPORATION AND SUBSIDIARIES
CONSOLIDATED STATEMENTS OF CHANGES IN EQUITY
(In millions)
|
Common Stock Shares
|
Common Stock Amount
|
Additional
Paid-In Capital |
Due From Affiliate
|
Accumulated
Deficit |
Accumulated
Other Comprehensive Income (Loss) |
Stockholder's Equity Attributable to Hertz
|
Noncontrolling Interests
|
Total Stockholder's Equity
|
||||||||||||||||||||||||||
|
Balance as of:
|
||||||||||||||||||||||||||||||||||
|
December 31, 2015
|
100
|
|
$
|
—
|
|
$
|
3,583
|
|
$
|
(345
|
)
|
$
|
(1,045
|
)
|
$
|
(245
|
)
|
$
|
1,948
|
|
$
|
—
|
|
$
|
1,948
|
|
||||||||
|
Net income (loss)
|
—
|
|
—
|
|
—
|
|
—
|
|
(488
|
)
|
—
|
|
(488
|
)
|
—
|
|
(488
|
)
|
||||||||||||||||
|
Due from affiliate
|
—
|
|
—
|
|
—
|
|
(26
|
)
|
—
|
|
—
|
|
(26
|
)
|
—
|
|
(26
|
)
|
||||||||||||||||
|
Dividends paid to Old Hertz Holdings
|
—
|
|
—
|
|
—
|
|
334
|
|
(334
|
)
|
—
|
|
—
|
|
—
|
|
—
|
|
||||||||||||||||
|
Other comprehensive income (loss)
|
—
|
|
—
|
|
—
|
|
—
|
|
—
|
|
(29
|
)
|
(29
|
)
|
—
|
|
(29
|
)
|
||||||||||||||||
|
Stock-based compensation charges
|
—
|
|
—
|
|
14
|
|
—
|
|
—
|
|
—
|
|
14
|
|
—
|
|
14
|
|
||||||||||||||||
|
Old Hertz Holdings common shares issued to Directors
|
—
|
|
—
|
|
1
|
|
—
|
|
—
|
|
—
|
|
1
|
|
—
|
|
1
|
|
||||||||||||||||
|
Distribution of Herc Holdings, Inc.
|
—
|
|
—
|
|
(448
|
)
|
—
|
|
—
|
|
103
|
|
(345
|
)
|
—
|
|
(345
|
)
|
||||||||||||||||
|
December 31, 2016
|
100
|
|
—
|
|
3,150
|
|
(37
|
)
|
(1,867
|
)
|
(171
|
)
|
1,075
|
|
—
|
|
1,075
|
|
||||||||||||||||
|
Change in accounting principle
|
—
|
|
—
|
|
—
|
|
—
|
|
49
|
|
—
|
|
49
|
|
—
|
|
49
|
|
||||||||||||||||
|
January 1, 2017 (as adjusted)
|
100
|
|
—
|
|
3,150
|
|
(37
|
)
|
(1,818
|
)
|
(171
|
)
|
1,124
|
|
—
|
|
1,124
|
|
||||||||||||||||
|
Net income (loss)
|
—
|
|
—
|
|
—
|
|
—
|
|
332
|
|
—
|
|
332
|
|
—
|
|
332
|
|
||||||||||||||||
|
Due from affiliate
|
—
|
|
—
|
|
—
|
|
(5
|
)
|
—
|
|
—
|
|
(5
|
)
|
—
|
|
(5
|
)
|
||||||||||||||||
|
Other comprehensive income (loss)
|
—
|
|
—
|
|
—
|
|
—
|
|
—
|
|
53
|
|
53
|
|
—
|
|
53
|
|
||||||||||||||||
|
Stock-based compensation charges
|
—
|
|
—
|
|
13
|
|
—
|
|
—
|
|
—
|
|
13
|
|
—
|
|
13
|
|
||||||||||||||||
|
Other
|
—
|
|
—
|
|
3
|
|
—
|
|
—
|
|
—
|
|
3
|
|
—
|
|
3
|
|
||||||||||||||||
|
December 31, 2017
|
100
|
|
—
|
|
3,166
|
|
(42
|
)
|
(1,486
|
)
|
(118
|
)
|
1,520
|
|
—
|
|
1,520
|
|
||||||||||||||||
|
Change in accounting principle
|
—
|
|
—
|
|
—
|
|
—
|
|
(189
|
)
|
—
|
|
(189
|
)
|
—
|
|
(189
|
)
|
||||||||||||||||
|
January 1, 2018 (as adjusted)
|
100
|
|
—
|
|
3,166
|
|
(42
|
)
|
(1,675
|
)
|
(118
|
)
|
1,331
|
|
—
|
|
1,331
|
|
||||||||||||||||
|
Net income (loss)
|
—
|
|
—
|
|
—
|
|
—
|
|
(220
|
)
|
—
|
|
(220
|
)
|
(2
|
)
|
(222
|
)
|
||||||||||||||||
|
Due from affiliate
|
—
|
|
—
|
|
—
|
|
(10
|
)
|
—
|
|
—
|
|
(10
|
)
|
—
|
|
(10
|
)
|
||||||||||||||||
|
Other comprehensive income (loss)
|
—
|
|
—
|
|
—
|
|
—
|
|
—
|
|
(63
|
)
|
(63
|
)
|
—
|
|
(63
|
)
|
||||||||||||||||
|
Stock-based compensation charges
|
—
|
|
—
|
|
21
|
|
—
|
|
—
|
|
—
|
|
21
|
|
—
|
|
21
|
|
||||||||||||||||
|
Reclassification of income tax effects resulting from the Tax Cuts and Jobs Act
|
—
|
|
—
|
|
—
|
|
—
|
|
11
|
|
(11
|
)
|
—
|
|
—
|
|
—
|
|
||||||||||||||||
|
Contributions from noncontrolling interests
|
—
|
|
—
|
|
—
|
|
—
|
|
—
|
|
—
|
|
—
|
|
61
|
|
61
|
|
||||||||||||||||
|
December 31, 2018
|
100
|
|
$
|
—
|
|
$
|
3,187
|
|
$
|
(52
|
)
|
$
|
(1,884
|
)
|
$
|
(192
|
)
|
$
|
1,059
|
|
$
|
59
|
|
$
|
1,118
|
|
||||||||
The accompanying notes are an integral part of these financial statements.
85
THE HERTZ CORPORATION AND SUBSIDIARIES
CONSOLIDATED STATEMENTS OF CASH FLOWS
(In millions)
|
Years Ended December 31,
|
|||||||||||
|
2018
|
2017
|
2016
|
|||||||||
|
Cash flows from operating activities:
|
|
||||||||||
|
Net income (loss)
|
$
|
(222
|
)
|
$
|
332
|
|
$
|
(488
|
)
|
||
|
Less: Net income (loss) from discontinued operations
|
—
|
|
—
|
|
(15
|
)
|
|||||
|
Net income (loss) from continuing operations
|
(222
|
)
|
332
|
|
(473
|
)
|
|||||
|
Adjustments to reconcile net income (loss) to net cash provided by (used in) operating activities:
|
|||||||||||
|
Depreciation of revenue earning vehicles, net
|
2,546
|
|
2,722
|
|
2,531
|
|
|||||
|
Depreciation and amortization, non-vehicle
|
218
|
|
240
|
|
265
|
|
|||||
|
Amortization of deferred financing costs and debt discount (premium)
|
50
|
|
46
|
|
48
|
|
|||||
|
Loss on extinguishment of debt
|
22
|
|
13
|
|
55
|
|
|||||
|
Stock-based compensation charges
|
14
|
|
19
|
|
13
|
|
|||||
|
Provision for receivables allowance
|
35
|
|
33
|
|
51
|
|
|||||
|
Deferred income taxes, net
|
(64
|
)
|
(922
|
)
|
(78
|
)
|
|||||
|
Impairment charges and asset write-downs
|
—
|
|
116
|
|
340
|
|
|||||
|
(Gain) loss on marketable securities
|
(20
|
)
|
(3
|
)
|
(84
|
)
|
|||||
|
Other
|
6
|
|
(6
|
)
|
8
|
|
|||||
|
Changes in assets and liabilities:
|
|||||||||||
|
Non-vehicle receivables
|
(136
|
)
|
(75
|
)
|
(174
|
)
|
|||||
|
Prepaid expenses and other assets
|
(23
|
)
|
(22
|
)
|
(31
|
)
|
|||||
|
Non-vehicle accounts payable
|
70
|
|
20
|
|
31
|
|
|||||
|
Accrued liabilities
|
75
|
|
(86
|
)
|
(40
|
)
|
|||||
|
Accrued taxes, net
|
(8
|
)
|
(24
|
)
|
38
|
|
|||||
|
Public liability and property damage
|
—
|
|
(4
|
)
|
30
|
|
|||||
|
Net cash provided by (used in) operating activities
|
2,563
|
|
2,399
|
|
2,530
|
|
|||||
|
Cash flows from investing activities:
|
|
||||||||||
|
Revenue earning vehicles expenditures
|
(12,493
|
)
|
(10,596
|
)
|
(10,872
|
)
|
|||||
|
Proceeds from disposal of revenue earning vehicles
|
8,452
|
|
7,653
|
|
8,679
|
|
|||||
|
Capital asset expenditures, non-vehicle
|
(177
|
)
|
(173
|
)
|
(134
|
)
|
|||||
|
Proceeds from property and other equipment disposed of or to be disposed of
|
51
|
|
21
|
|
59
|
|
|||||
|
Proceeds from sale of Brazil Operations, net of retained cash
|
—
|
|
94
|
|
—
|
|
|||||
|
Acquisitions, net of cash acquired
|
(2
|
)
|
(15
|
)
|
(2
|
)
|
|||||
|
Purchases of marketable securities
|
(60
|
)
|
—
|
|
—
|
|
|||||
|
Sales of marketable securities
|
36
|
|
9
|
|
267
|
|
|||||
|
Return of (investment in) equity investment
|
—
|
|
7
|
|
(45
|
)
|
|||||
|
Other
|
(4
|
)
|
—
|
|
—
|
|
|||||
|
Net cash provided by (used in) investing activities
|
(4,197
|
)
|
(3,000
|
)
|
(2,048
|
)
|
|||||
86
THE HERTZ CORPORATION AND SUBSIDIARIES
CONSOLIDATED STATEMENTS OF CASH FLOWS (Continued)
(In millions)
|
Years Ended December 31,
|
|||||||||||
|
2018
|
2017
|
2016
|
|||||||||
|
Cash flows from financing activities:
|
|
||||||||||
|
Proceeds from issuance of vehicle debt
|
14,009
|
|
10,756
|
|
9,692
|
|
|||||
|
Repayments of vehicle debt
|
(12,426
|
)
|
(10,244
|
)
|
(9,748
|
)
|
|||||
|
Proceeds from issuance of non-vehicle debt
|
557
|
|
2,100
|
|
2,592
|
|
|||||
|
Repayments of non-vehicle debt
|
(571
|
)
|
(1,560
|
)
|
(4,651
|
)
|
|||||
|
Payment of financing costs
|
(47
|
)
|
(59
|
)
|
(75
|
)
|
|||||
|
Early redemption premium payment
|
(19
|
)
|
(5
|
)
|
(27
|
)
|
|||||
|
Transfers from discontinued entities
|
—
|
|
—
|
|
2,122
|
|
|||||
|
Advances to Hertz Holdings
|
(9
|
)
|
(6
|
)
|
(102
|
)
|
|||||
|
Contributions from noncontrolling interests
|
60
|
|
—
|
|
—
|
|
|||||
|
Other
|
—
|
|
1
|
|
13
|
|
|||||
|
Net cash provided by (used in) financing activities
|
1,554
|
|
983
|
|
(184
|
)
|
|||||
|
Effect of foreign currency exchange rate changes on cash, cash equivalents, restricted cash and restricted cash equivalents from continuing operations
|
(14
|
)
|
28
|
|
(11
|
)
|
|||||
|
Net increase (decrease) in cash, cash equivalents, restricted cash and restricted cash equivalents during the period from continuing operations
|
(94
|
)
|
410
|
|
287
|
|
|||||
|
Cash, cash equivalents, restricted cash and restricted cash equivalents at beginning of period
|
1,504
|
|
1,094
|
|
807
|
|
|||||
|
Cash, cash equivalents, restricted cash and restricted cash equivalents at end of period
|
$
|
1,410
|
|
$
|
1,504
|
|
$
|
1,094
|
|
||
|
Cash flows from discontinued operations:
|
|||||||||||
|
Cash flows provided by (used in) operating activities
|
$
|
—
|
|
$
|
—
|
|
$
|
207
|
|
||
|
Cash flows provided by (used in) investing activities
|
—
|
|
—
|
|
(77
|
)
|
|||||
|
Cash flows provided by (used in) financing activities
|
—
|
|
—
|
|
(94
|
)
|
|||||
|
Net increase (decrease) in cash, cash equivalents, restricted cash and restricted cash equivalents during the period from discontinued operations
|
$
|
—
|
|
$
|
—
|
|
$
|
36
|
|
||
|
Supplemental disclosures of cash flow information for continuing operations:
|
|||||||||||
|
Cash paid during the period for:
|
|||||||||||
|
Interest, net of amounts capitalized:
|
|||||||||||
|
Vehicle
|
$
|
379
|
|
$
|
291
|
|
$
|
235
|
|
||
|
Non-vehicle
|
286
|
|
291
|
|
292
|
|
|||||
|
Income taxes, net of refunds
|
26
|
|
54
|
|
57
|
|
|||||
|
Supplemental disclosures of non-cash information for continuing operations:
|
|||||||||||
|
Purchases of revenue earning vehicles included in accounts payable and accrued liabilities, net of incentives
|
$
|
169
|
|
$
|
194
|
|
$
|
185
|
|
||
|
Sales of revenue earning vehicles included in receivables
|
510
|
|
431
|
|
473
|
|
|||||
|
Sales-type capital lease of revenue earning vehicles included in other receivables
|
75
|
|
—
|
|
—
|
|
|||||
|
Purchases of non-vehicle capital assets included in accounts payable
|
42
|
|
65
|
|
20
|
|
|||||
|
Revenue earning vehicles and non-vehicle capital assets acquired through capital lease
|
21
|
|
35
|
|
22
|
|
|||||
|
Receivable on sale of Brazil Operations
|
—
|
|
13
|
|
—
|
|
|||||
|
Non-cash dividend paid to affiliate
|
—
|
|
—
|
|
334
|
|
|||||
The accompanying notes are an integral part of these financial statements.
87
HERTZ GLOBAL HOLDINGS, INC. AND SUBSIDIARIES
THE HERTZ CORPORATION AND SUBSIDIARIES
NOTES TO CONSOLIDATED FINANCIAL STATEMENTS
Note 1
—
Background
Hertz Global Holdings, Inc. ("Hertz Global" when including its subsidiaries and VIEs and "Hertz Holdings" excluding its subsidiaries and VIEs) was incorporated in Delaware in 2015 to serve as the top-level holding company for Rental Car Intermediate Holdings, LLC, which wholly owns The Hertz Corporation ("Hertz" and interchangeably with Hertz Global, the "Company"), Hertz Global's primary operating company. Hertz was incorporated in Delaware in 1967 and is a successor to corporations that have been engaged in the vehicle rental and leasing business since 1918. Hertz operates its vehicle rental business globally primarily through the Hertz, Dollar and Thrifty brands from company-owned, licensee and franchisee locations in the U.S., Africa, Asia, Australia, Canada, the Caribbean, Europe, Latin America, the Middle East and New Zealand. Through its Donlen subsidiary, Hertz provides vehicle leasing and fleet management services.
On June 30, 2016, former Hertz Global Holdings, Inc. (for periods on or prior to June 30, 2016, “Old Hertz Holdings” and for periods after June 30, 2016, “Herc Holdings”) completed a spin-off (the “Spin-Off”) of its global vehicle rental business through a dividend to stockholders of record of Old Hertz Holdings as of the close of business on June 22, 2016, the record date for the distribution, of all of the issued and outstanding common stock of Hertz Rental Car Holding Company, Inc. (“New Hertz”), which was re-named Hertz Global Holdings, Inc. in connection with the Spin-Off, on a one-to-five basis. Hertz Global is an independent public company and trades on the New York Stock Exchange under the symbol "HTZ".
Despite the fact that this was a reverse spin off and Hertz Global was spun off from Old Hertz Holdings and was the legal spinnee in the transaction, for accounting purposes, due to the relative significance of New Hertz to Old Hertz Holdings, Hertz Global is considered the spinnor or divesting entity and Herc Holdings is considered the spinnee or divested entity. As a result, New Hertz, or Hertz Global, is the “accounting successor” to Old Hertz Holdings. As such, the 2016 financial information of Hertz reflects the equipment rental business as a discontinued operation and the 2016 financial information of Hertz Global reflects the equipment rental business and certain parent legal entities as discontinued operations. See
Note 3
, "
Discontinued Operations
," for additional information. Unless noted otherwise, information disclosed for 2016 in these notes to the consolidated financial statements pertain to the continuing operations of Hertz and Hertz Global.
Note 2
—
Significant Accounting Policies
Accounting Principles
The Company’s consolidated financial statements have been prepared in accordance with accounting principles generally accepted in the United States of America (“U.S. GAAP”).
Reclassifications
Certain prior period amounts have been reclassified to conform with current period presentation.
Principles of Consolidation
The consolidated financial statements of Hertz Global include the accounts of Hertz Global, its wholly owned and majority owned U.S. and international subsidiaries, and its VIEs, as applicable. The consolidated financial statements of Hertz include the accounts of Hertz, its wholly owned and majority owned U.S. and international subsidiaries, and its VIEs, as applicable. The Company consolidates a VIE when it is deemed the primary beneficiary. The Company accounts for its investment in joint ventures using the equity method when it has significant influence but not control and is not the primary beneficiary. All significant intercompany transactions have been eliminated in consolidation.
88
HERTZ GLOBAL HOLDINGS, INC. AND SUBSIDIARIES
THE HERTZ CORPORATION AND SUBSIDIARIES
NOTES TO CONSOLIDATED FINANCIAL STATEMENTS (Continued)
Use of Estimates and Assumptions
The preparation of financial statements in conformity with U.S. GAAP requires management to make estimates and assumptions that affect the amounts reported in the financial statements and footnotes. Actual results could differ materially from those estimates.
Significant estimates inherent in the preparation of the consolidated financial statements include depreciation of revenue earning vehicles, reserves for litigation and other contingencies, accounting for income taxes and related uncertain tax positions, pension and postretirement benefit costs, the recoverability of long-lived assets, useful lives and impairment of long-lived tangible and intangible assets including goodwill, valuation of stock-based compensation, public liability and property damage reserves, allowance for doubtful accounts, the retail value of loyalty points, and fair value of financial instruments, among others
.
Revenue Earning Vehicles
Revenue earning vehicles are stated at cost, net of related discounts and incentives from manufacturers. Holding periods typically range from
six to thirty-six months
. Generally, when revenue earning vehicles are acquired outside of a vehicle repurchase program, the Company estimates the period that the Company will hold the asset, primarily based on historical measures of the amount of rental activity (e.g.,
automobile mileage). The Company also estimates the residual value of the applicable revenue earning vehicles at the expected time of disposal, taking into consideration factors such as make, model and options, age, physical condition, mileage, sale location, time of the year and channel of disposition (e.g.,
auction, retail, dealer direct) and market conditions. Depreciation is recorded over the estimated holding period. Depreciation rates are reviewed on a quarterly basis based on management's ongoing assessment of present and estimated future market conditions, their effect on residual values at the expected time of disposal and the estimated holding periods. Gains and losses on the sale of vehicles, including the costs associated with disposals, are included in depreciation expense.
For vehicles acquired under the Company's vehicle repurchase programs ("program vehicles"), the manufacturers agree to repurchase program vehicles at a specified price or guarantee the depreciation rate on the vehicles during established repurchase or auction periods, subject to, among other things, certain vehicle condition, mileage and holding period requirements. Guaranteed depreciation programs guarantee on an aggregate basis the residual value of the program vehicle upon sale according to certain parameters which include the holding period, mileage and condition of the vehicles. The Company records a provision for excess mileage and vehicle condition, as necessary, during the holding period.
Donlen's revenue earning vehicles are leased under long term agreements with its customers. These leases contain provisions whereby Donlen has a contracted residual value guaranteed by the lessee, such that it does not bear the risk of any gains or losses on the disposal of these vehicles. Donlen accounts for its lease contracts using the appropriate lease classifications.
The Company continually evaluates revenue earning vehicles to determine whether events or changes in circumstances have occurred that may warrant revision of the estimated useful life or holding period.
Self-insured Liabilities
Self-insured liabilities in the accompanying consolidated balance sheets include public liability, property damage, liability insurance supplement, personal accident insurance, and worker's compensation. These represent an estimate for both reported accident claims not yet paid, and claims incurred but not yet reported and are recorded on a non-discounted basis. Reserve requirements are based on rental volume and actuarial evaluations of historical accident claim experience and trends, as well as future projections of ultimate losses, expenses, premiums and administrative costs. The adequacy of the liability is regularly monitored based on evolving accident claim history and insurance related state legislation changes. If the Company's estimates change or if actual results differ from these assumptions, the amount of the recorded liability is adjusted to reflect these results.
89
HERTZ GLOBAL HOLDINGS, INC. AND SUBSIDIARIES
THE HERTZ CORPORATION AND SUBSIDIARIES
NOTES TO CONSOLIDATED FINANCIAL STATEMENTS (Continued)
Recoverability of Goodwill and Indefinite-lived Intangible Assets
The Company tests the recoverability of its goodwill and indefinite-lived intangible assets by performing an impairment analysis on an annual basis, as of October 1, and at interim periods when circumstances require as a result of a triggering event.
On January 1, 2017, the Company prospectively adopted guidance that eliminated the second step of the two-step goodwill impairment test, therefore, a goodwill impairment charge is calculated as the amount by which a reporting unit's carrying amount exceeds its fair value. Prior to 2017, the Company tested the recoverability of its goodwill using a two-step process. The first step was to identify any potential impairment by comparing the carrying value of the reporting unit to its fair value. If a potential impairment was identified, the second step was to determine an implied fair value of goodwill and compare that with its carrying value to measure the amount of impairment. For goodwill, fair value is determined using an income approach based on the discounted cash flows of each reporting unit. A reporting unit is an operating segment or a business one level below that operating segment (the component level) if discrete financial information is prepared and regularly reviewed by segment management. Components are aggregated into a single reporting unit when they have similar economic characteristics. The Company has four reporting units: U.S. Rental Car, Europe Rental Car, Other International Rental Car and Donlen. The fair values of the reporting units are estimated using the net present value of discounted cash flows generated by each reporting unit and incorporate various assumptions related to discount rates, growth rates, cash flow projections, tax rates and terminal value rates specific to the reporting unit to which they are applied. Discount rates are set by using the Weighted Average Cost of Capital (“WACC”) methodology. The Company’s discounted cash flows are based upon reasonable and appropriate assumptions about the underlying business activities of the Company’s reporting units.
In the impairment analysis for an indefinite-lived intangible asset, the Company compares the carrying value of the asset to its implied fair value and recognizes an impairment charge whenever the carrying amount of the asset exceeds its implied fair value. The implied fair value for a tradename is estimated using a relief from royalty approach, which utilizes the Company’s revenue projections for each asset along with assumptions for royalty rates, tax rates and WACC.
Subrogation Receivables
The Company records receivables for vehicle damage caused while a vehicle is on rent with a customer based on billed and unbilled recoveries and represents the amount of damage the Company expects to recover. Amounts recorded are estimated using a combination of actual historical data with respect to damage expense and collections and other facts and circumstances. Subrogation receivables are recorded as a contra-expense (i.e. a credit to direct operating expense) in the period in which the expense was incurred. The Company had net subrogation receivables of
$84 million
and
$64 million
which are included in non-vehicle receivables, net in the accompanying consolidated balance sheets as of December 31, 2018 and 2017, respectively.
Income Taxes
The Company recognized the effects of income tax reform, the TCJA, when enacted in its 2017 financial statements in accordance with Staff Accounting Bulletin No. 118 ("SAB 118"), which provides SEC staff guidance for the application of Topic 740, Income Taxes, in the reporting period in which the TCJA was signed into law.
The TCJA lowered the U.S. statutory corporate tax rate to
21%
effective January 1, 2018. The effect of this change in tax rate is recognized in the consolidated statements of operations in the period that includes the enactment date, the fourth quarter of 2017. Valuation allowances are recorded to reduce deferred tax assets when it is more likely than not that a tax benefit will not be realized. Subsequent changes to enacted tax rates and changes to the global mix of operating results will result in changes to the tax rates used to calculate deferred taxes and any related valuation allowances. Updates or revisions to accounting standards resulting from tax policy changes are evaluated when issued and adopted as effective. The Company has recorded a deferred tax asset for net operating loss carry forwards in various tax jurisdictions. Upon utilization, the taxing authorities may examine the positions that led to the generation of those net operating losses. If the utilization of any of those losses are disallowed, a deferred tax liability may have to be recorded.
90
HERTZ GLOBAL HOLDINGS, INC. AND SUBSIDIARIES
THE HERTZ CORPORATION AND SUBSIDIARIES
NOTES TO CONSOLIDATED FINANCIAL STATEMENTS (Continued)
Deferred tax assets and liabilities are recognized for the future tax consequences attributable to differences between the financial statement carrying amounts of existing assets and liabilities and their respective tax bases. Deferred tax assets and liabilities are measured using enacted tax rates expected to apply to taxable income in the years in which those temporary differences are expected to be recovered or settled.
As of December 31, 2018, the Company has completed its accounting for and recorded the tax effects of the TCJA. The Company has elected to account for taxes on GILTI as incurred and the Company continues to assert indefinite reinvestment on certain of its foreign earnings. The Company early adopted FASB guidance related to the stranded tax effects in accumulated other comprehensive income (loss) resulting from U.S. tax reform as further disclosed below in "Reporting Comprehensive Income.
"
Revenue Recognition
In May 2014, the FASB issued Topic 606, guidance that replaced most existing revenue recognition guidance under U.S. GAAP along with subsequent amendments and updates (collectively, "Topic 606"). The impact of the adoption of Topic 606 is disclosed below in "Recently Issued Accounting Pronouncements.
"
Prior to the adoption of Topic 606, the Company recognized revenue under the then existing guidance under U.S. GAAP ("Topic 605"). As such, revenue is recognized under Topic 606 for the year ended December 31, 2018 and under Topic 605 for the years ended December 31, 2017 and 2016. The policy that follows herein is applicable under both Topics 606 and 605 unless otherwise noted.
The Company recognizes two types of revenue: (i) revenue from contracts with customers; and (ii) lease revenue, which is generated through the fleet leasing operations of its Donlen subsidiary.
The Company reports revenues for taxes or non-concession fees collected from customers on behalf of governmental authorities on a net basis.
Vehicle Rental and Rental Related Revenues
The Company recognizes revenue from its vehicle rental operations when persuasive evidence of a contract exists, the performance obligations have been satisfied, the transaction price is fixed or determinable and collection is reasonably assured. Performance obligations associated with vehicle rental transactions are satisfied over the rental period, except for the portion associated with loyalty points, as further described below. Rental periods are short term in nature. Performance obligations associated with rental related activities, such as charges to the customer for the fueling of vehicles and value-added services such as loss damage waivers, insurance products, navigation units, supplemental equipment and other consumables, are also satisfied over the rental period. Revenue from charges that are passed through to the customer, such as gasoline, vehicle licensing and airport concession fees, is recorded on a gross basis with a corresponding charge to direct vehicle and operating expense. Sales commissions paid to third parties are generally expensed when incurred due to the short-term nature of the related transaction on which the commission was earned and are recorded within selling, general and administrative expense. Payments are due from customers at the completion of the rental, except for customers with negotiated payment terms, generally net 30 days or less, which are invoiced and remain as accounts receivable until collected.
Loyalty Programs
- The Company offers loyalty programs, primarily Hertz Gold Plus Rewards, wherein customers are eligible to earn loyalty points that are redeemable for free rental days or can be converted to loyalty points for redemption of products and services under loyalty programs of other companies. Under Topic 605, for each transaction that generated loyalty points, the Company would accrue an expense associated with the incremental cost of providing the rental when the reward points were earned. Upon adoption of Topic 606, each transaction that generates loyalty points results in the deferral of revenue equivalent to the retail value at the date the points are earned. The associated revenue is recognized when the customer redeems the loyalty points at some point in the future. The retail value of loyalty points is estimated based on the current retail value measured as of the date the loyalty points are earned, less an estimated amount representing loyalty points that are not expected to be redeemed (“breakage”). Breakage is estimated on a quarterly basis and includes significant assumptions such as historical breakage trends and internal Company forecasts.
91
HERTZ GLOBAL HOLDINGS, INC. AND SUBSIDIARIES
THE HERTZ CORPORATION AND SUBSIDIARIES
NOTES TO CONSOLIDATED FINANCIAL STATEMENTS (Continued)
Customer Rebates
- The Company has business customers that rent vehicles based on terms that have been negotiated through contracts with their employers, or other entities with which they are associated (“commercial contracts”), which can differ substantially from the terms on which the Company rents vehicles to the general public. Some of the commercial contracts contain provisions which allow for rebates to the entity based on achieving a specific rental volume threshold. Rebates are treated as variable consideration and are recognized as a reduction of revenue at the time of the rental based on the rebate expected to be earned by the entity.
Licensee Revenue
The Company has franchise agreements which allow an independent entity to rent their vehicles under the Company’s brands, primarily Hertz, Dollar or Thrifty, for a fee (“franchise fee”). Franchise fees are earned over time for the duration of the franchise agreement and are typically based on the larger of a minimum payment or an amount representing a percentage of net sales of the franchised business. Under Topic 605, initial franchise fees were recorded as deferred income when received and were recognized as revenue when all material services and conditions related to the franchise fee had been substantially performed. Renewal franchise fees were recognized as revenue when the license agreements were effective and collectability was reasonably assured. Under Topic 606, franchise fees are recognized as earned and when collectability is reasonably assured. Franchise fees that relate to a future contract term, such as initial fees or renewal fees, are deferred and recognized over the term of the franchise agreement.
Ancillary Retail Vehicle Sales Revenue
Ancillary retail vehicle sales represent revenues generated from the sale of warranty contracts, financing and title fees, and other ancillary services associated with vehicles disposed of at the Company’s retail outlets. These revenues are recorded at the point in time when the Company sells the product or provides the service to the customer. These revenues exclude the sale price of the vehicle which is a component of the gain or loss on the disposition and is included in depreciation of revenue earning vehicles and lease charges, net.
Fleet Management Revenue
The Company's Donlen subsidiary generates revenue from various fleet management services, such as fuel purchasing and management, preventive vehicle maintenance, repair consultation, toll management and accident management. Fleet management revenue is recognized net of any fees collected from customers on behalf of third-party service providers, as services are rendered.
Contract Balances
The Company recognizes receivables and liabilities resulting from its contracts with customers. Contract receivables primarily consist of receivables from customers for vehicle rentals. Contract liabilities primarily consist of obligations to customers for prepaid vehicle rentals and related to the Company’s points-based loyalty programs.
Cash, Restricted Cash, Cash Equivalents and Restricted Cash Equivalents
Cash and cash equivalents include cash on hand and highly liquid investments with an original maturity of
three months
or less. The Company's cash and cash equivalents are invested in various investment grade institutional money market accounts and bank term deposits.
Restricted cash and cash equivalents includes cash and cash equivalents that are not readily available for use in the Company's operating activities. Restricted cash and cash equivalents are primarily comprised of proceeds from the disposition of vehicles pledged under the terms of vehicle debt financing arrangements and is restricted for the purchase of revenue earning vehicles and other specified uses under the Vehicle Debt facilities and the LKE program, cash utilized as credit enhancement under those arrangements, and certain cash accounts supporting regulatory reserve requirements related to the Company's self-insurance. These funds are primarily held in demand deposit accounts or in highly rated money market funds with investments primarily in government and corporate obligations.
92
HERTZ GLOBAL HOLDINGS, INC. AND SUBSIDIARIES
THE HERTZ CORPORATION AND SUBSIDIARIES
NOTES TO CONSOLIDATED FINANCIAL STATEMENTS (Continued)
Deposits held at financial institutions may exceed the amount of insurance provided on such deposits. Generally, these deposits may be redeemed upon demand and are maintained with financial institutions with reputable credit and therefore bear minimal credit risk. The Company limits exposure relating to financial instruments by diversifying the financial instruments among various counterparties, which consist of major financial institutions.
Receivables, Net of Allowance
Receivables are stated net of allowances and primarily represent credit extended to vehicle manufacturers, customers that satisfy defined credit criteria, and amounts due from customers resulting from damage to rental vehicles. The estimate of the allowance for doubtful accounts is based on the Company's historical experience and its judgment as to the likelihood of ultimate payment. Actual receivables are written-off against the allowance for doubtful accounts when the Company determines the balance will not be collected. Estimates for future credit memos are based on historical experience and are reflected as reductions to revenue, while bad debt expense is reflected as a component of direct vehicle and operating expenses in the accompanying consolidated statements of operations.
Property and Equipment, Net
The Company's property and equipment, net consists of the following:
|
December 31, 2018
|
December 31, 2017
|
||||||
|
Land, buildings and leasehold improvements
|
$
|
1,220
|
|
$
|
1,233
|
|
|
|
Service vehicles, equipment and furniture and fixtures
|
782
|
|
763
|
|
|||
|
Less: accumulated depreciation
|
(1,224
|
)
|
(1,156
|
)
|
|||
|
Total property and equipment, net
|
$
|
778
|
|
$
|
840
|
|
|
Land is stated at cost and reviewed annually for impairment as further disclosed above in the "Long-lived Assets, Including Finite-lived Intangible Assets."
Property and equipment are stated at cost and are depreciated utilizing the straight-line method over the estimated useful lives of the related assets. Useful lives are as follows:
|
Buildings
|
1 to 50 years
|
|
Furniture and fixtures
|
1 to 5 years
|
|
Service vehicles and equipment
|
1 to 25 years
|
|
Leasehold improvements
|
The lesser of the economic life or the lease term
|
Depreciation expense for property and equipment, net for the years ended
December 31, 2018, 2017 and 2016
was
$129 million
,
$143 million
and
$167 million
, respectively.
The Company follows the practice of charging maintenance and repair costs for service vehicles, furniture and fixtures, and equipment, including the cost of minor replacements, to maintenance expense.
Long-lived Assets, Including Finite-lived Intangible Assets
Finite-lived intangible assets include concession agreements, technology, customer relationships and other intangibles. Long-lived assets and intangible assets with finite lives, including technology-related intangibles, are amortized using the straight-line method over the estimated economic lives of the assets, which range from
one to fifty years
and
two to twenty years
, respectively. Long-lived assets and intangible assets with finite lives are reviewed for impairment whenever events or changes in circumstances indicate that the carrying value of such assets may not be recoverable. Determination of recoverability is based on an estimate of undiscounted future cash flows resulting from the use of the asset and its eventual disposition. Measurement of an impairment loss for long-lived assets that management expects
93
HERTZ GLOBAL HOLDINGS, INC. AND SUBSIDIARIES
THE HERTZ CORPORATION AND SUBSIDIARIES
NOTES TO CONSOLIDATED FINANCIAL STATEMENTS (Continued)
to hold and use is based on the estimated fair value of the asset. Long-lived assets to be disposed of are reported at the lower of carrying value or estimated fair value less costs to sell.
Stock-Based Compensation
The Company measures the cost of employee services received in exchange for an award of equity instruments based on the grant date fair value of the award. That cost is to be recognized over the period during which the employee is required to provide service in exchange for the award. The Company has estimated the fair value of options issued at the date of grant using a Black-Scholes option-pricing model, which includes assumptions related to volatility, expected term, dividend yield and risk-free interest rate.
The Company accounts for restricted stock unit and performance stock unit awards as equity classified awards. For restricted stock units ("RSUs") the expense is based on the grant-date fair value of the stock and the number of shares that vest, recognized over the service period. For performance stock units ("PSUs") and performance stock awards ("PSAs"), the expense is based on the grant-date fair value of the stock, recognized over a
two to four year
service period depending upon the applicable performance condition. For PSUs and PSAs, the Company re-assesses the probability of achieving the applicable performance condition each reporting period and adjusts the recognition of expense accordingly. The Company includes tax "windfalls" within income tax expense in its statements of operations.
Fair Value Measurements
Generally accepted accounting principles define fair value as the price that would be received to sell an asset or paid to transfer a liability in an orderly transaction between market participants in the principal market or, if none exists, the most advantageous market, for the specific asset or liability at the measurement date (referred to as the "exit price"). Fair value is a market-based measurement that is determined based upon assumptions that market participants would use in pricing an asset or liability, including consideration of nonperformance risk.
The Company assesses the inputs used to measure fair value using the three-tier hierarchy promulgated under U.S. GAAP. This hierarchy indicates the extent to which inputs used in measuring fair value are observable in the market.
Level 1: Inputs that reflect quoted prices for identical assets or liabilities in active markets that are observable.
Level 2: Inputs other than quoted prices included in Level 1 that are observable either directly or indirectly, including quoted prices for similar assets or liabilities in active markets; quoted prices for identical or similar assets or liabilities in markets that are not active; or model-derived valuations in which significant inputs are observable or can be derived principally from, or corroborated by, observable market data.
Level 3: Inputs that are unobservable to the extent that observable inputs are not available for the asset or liability at the measurement date and include management's judgment about assumptions market participants would use in pricing the asset or liability.
Foreign Currency Translation and Transactions
Assets and liabilities of international subsidiaries whose functional currency is the local currency are translated at the rate of exchange in effect on the balance sheet date; income and expenses are translated at the average exchange rates throughout the year. The related translation adjustments are reflected in accumulated other comprehensive income (loss) in the equity section of the accompanying consolidated balance sheets. Foreign currency exchange rate gains and losses resulting from transactions are included in the Company's operating results.
Advertising
Advertising and sales promotion costs are expensed the first time the advertising or sales promotion takes place. Advertising costs are reflected as a component of selling, general and administrative expenses in the accompanying consolidated statements of operations and for the years ended
December 31, 2018, 2017 and 2016
were
$238 million
,
$191 million
and
$159 million
, respectively.
94
HERTZ GLOBAL HOLDINGS, INC. AND SUBSIDIARIES
THE HERTZ CORPORATION AND SUBSIDIARIES
NOTES TO CONSOLIDATED FINANCIAL STATEMENTS (Continued)
Divestitures
The Company classifies long-lived assets and liabilities to be disposed of as held for sale in the period in which they are available for immediate sale in their present condition and the sale is probable and expected to be completed within one year. The Company initially measures assets and liabilities held for sale at the lower of their carrying value or fair value less costs to sell and assesses their fair value each reporting period until disposed. When the divestiture represents a strategic shift that has (or will have) a major effect on the Company's operations and financial results, the disposal is presented as a discontinued operation.
Recently Issued Accounting Pronouncements
Adopted
Revenue from Contracts with Customers
The Company adopted Topic 606 on the effective date, January 1, 2018, using a modified retrospective approach applied to all contracts and did not retrospectively adjust its presentation for periods prior to adoption. Topic 606 applies to all contracts with customers except for leases, insurance contracts, financial instruments, certain nonmonetary exchanges and certain guarantees. The core principle of Topic 606 is that an entity should recognize revenue from customers for the transfer of goods or services equal to the amount that it expects to be entitled to receive for those goods or services, as well as when an entity should recognize revenue gross as a principal or net as an agent and how an entity should identify performance obligations. Topic 606 requires disclosures about the nature, amount, timing and uncertainty of revenue and cash flows arising from customer contracts, including significant judgments and changes in judgments.
The impact to the Company’s financial position, results of operations and cash flows is primarily for revenue associated with the redemption of points earned by customers under the Company’s loyalty programs (“loyalty points”). For transactions that generate loyalty points to the customer, a portion of revenue is deferred until the loyalty points are redeemed by the customer. The amount of revenue deferred is equivalent to the retail value of each loyalty point less an estimated amount representing loyalty points that are not expected to be redeemed.
The Company elected to apply the practical expedient which eliminated the requirement to disclose information about remaining performance obligations related to its short-term vehicle rentals. Additionally, the Company elected to apply the practical expedient where the value of unsatisfied performance obligations for sales-based royalty fees from franchisees is not disclosed. As disclosed above, the Company adopted Topic 606 on a modified retrospective basis, therefore, historical financial information has not been restated for comparative purposes and continues to be reported under the accounting standards in effect for those periods (“legacy guidance”).
The cumulative effect of applying the new guidance to all contracts with customers that were not completed as of January 1, 2018 has been recorded as an adjustment to accumulated deficit, net of tax, as of the adoption date is shown below.
Hertz Global
|
(In millions)
|
Deferred Income Taxes, Net
|
Accrued Liabilities
|
Total Liabilities
|
Accumulated Deficit
|
Total Equity
|
Total Liabilities and Equity
|
|||||||||||||||||
|
As of December 31, 2017
|
$
|
1,220
|
|
$
|
920
|
|
$
|
18,538
|
|
$
|
(506
|
)
|
$
|
1,520
|
|
$
|
20,058
|
|
|||||
|
Effect of Adopting Topic 606
|
(51
|
)
|
240
|
|
189
|
|
(189
|
)
|
(189
|
)
|
—
|
|
|||||||||||
|
As of January 1, 2018
|
$
|
1,169
|
|
$
|
1,160
|
|
$
|
18,727
|
|
$
|
(695
|
)
|
$
|
1,331
|
|
$
|
20,058
|
|
|||||
95
HERTZ GLOBAL HOLDINGS, INC. AND SUBSIDIARIES
THE HERTZ CORPORATION AND SUBSIDIARIES
NOTES TO CONSOLIDATED FINANCIAL STATEMENTS (Continued)
Hertz
|
(In millions)
|
Deferred Income Taxes, Net
|
Accrued Liabilities
|
Total Liabilities
|
Accumulated Deficit
|
Total Equity
|
Total Liabilities and Equity
|
|||||||||||||||||
|
As of December 31, 2017
|
$
|
1,220
|
|
$
|
920
|
|
$
|
18,538
|
|
$
|
(1,486
|
)
|
$
|
1,520
|
|
$
|
20,058
|
|
|||||
|
Effect of Adopting Topic 606
|
(51
|
)
|
240
|
|
189
|
|
(189
|
)
|
(189
|
)
|
—
|
|
|||||||||||
|
As of January 1, 2018
|
$
|
1,169
|
|
$
|
1,160
|
|
$
|
18,727
|
|
$
|
(1,675
|
)
|
$
|
1,331
|
|
$
|
20,058
|
|
|||||
The following table presents the amounts for line items in the Company’s consolidated balance sheet, statement of operations and cash flows impacted by the adoption of Topic 606 as compared to the amounts that would have been recognized in accordance with legacy guidance.
Hertz Global
|
(In millions, except per share data)
|
As Reported
|
Effect of Adoption Increase (Decrease)
|
Balances Without Adoption
|
||||||||
|
Consolidated Balance Sheet as of December 31, 2018:
|
|||||||||||
|
Accrued liabilities
|
$
|
1,304
|
|
$
|
244
|
|
$
|
1,060
|
|
||
|
Deferred income taxes, net
|
1,092
|
|
(54
|
)
|
1,146
|
|
|||||
|
Total liabilities
|
20,262
|
|
190
|
|
20,072
|
|
|||||
|
Accumulated deficit
|
(909
|
)
|
(190
|
)
|
(719
|
)
|
|||||
|
Total stockholders' equity
|
1,120
|
|
(190
|
)
|
1,310
|
|
|||||
|
Consolidated Statement of Operations for the Year Ended December 31, 2018:
|
|||||||||||
|
Worldwide vehicle rental revenues
|
$
|
8,756
|
|
$
|
(6
|
)
|
$
|
8,762
|
|
||
|
Selling, general and administrative expense
|
1,017
|
|
(2
|
)
|
1,019
|
|
|||||
|
Income (loss) from continuing operations before income taxes
|
(257
|
)
|
(4
|
)
|
(253
|
)
|
|||||
|
Income tax (provision) benefit
|
30
|
|
3
|
|
27
|
|
|||||
|
Net income (loss) from continuing operations
|
(227
|
)
|
(1
|
)
|
(226
|
)
|
|||||
|
Net (income) loss attributable to noncontrolling interests
|
2
|
|
—
|
|
2
|
|
|||||
|
Net income (loss) attributable to Hertz Global
|
(225
|
)
|
(1
|
)
|
(224
|
)
|
|||||
|
Basic earnings (loss) per share
|
(2.68
|
)
|
(0.01
|
)
|
(2.67
|
)
|
|||||
|
Diluted earnings (loss) per share
|
(2.68
|
)
|
(0.01
|
)
|
(2.67
|
)
|
|||||
|
Consolidated Statement of Cash Flows for the Year Ended December 31, 2018:
|
|||||||||||
|
Cash flows from operating activities:
|
|||||||||||
|
Net income (loss)
|
$
|
(227
|
)
|
$
|
(1
|
)
|
$
|
(226
|
)
|
||
|
Deferred income taxes, net
|
(66
|
)
|
(3
|
)
|
(63
|
)
|
|||||
|
Accrued liabilities
|
75
|
|
4
|
|
71
|
|
|||||
96
HERTZ GLOBAL HOLDINGS, INC. AND SUBSIDIARIES
THE HERTZ CORPORATION AND SUBSIDIARIES
NOTES TO CONSOLIDATED FINANCIAL STATEMENTS (Continued)
Hertz
|
(In millions, except per share data)
|
As Reported
|
Effect of Adoption Increase (Decrease)
|
Balances Without Adoption
|
||||||||
|
Consolidated Balance Sheet as of December 31, 2018:
|
|||||||||||
|
Accrued liabilities
|
$
|
1,304
|
|
$
|
244
|
|
$
|
1,060
|
|
||
|
Deferred income taxes, net
|
1,094
|
|
(54
|
)
|
1,148
|
|
|||||
|
Total liabilities
|
20,264
|
|
190
|
|
20,074
|
|
|||||
|
Accumulated deficit
|
(1,884
|
)
|
(190
|
)
|
(1,694
|
)
|
|||||
|
Total stockholder's equity
|
1,118
|
|
(190
|
)
|
1,308
|
|
|||||
|
Consolidated Statement of Operations for the Year Ended December 31, 2018:
|
|||||||||||
|
Worldwide vehicle rental revenues
|
$
|
8,756
|
|
$
|
(6
|
)
|
$
|
8,762
|
|
||
|
Selling, general and administrative expense
|
1,017
|
|
(2
|
)
|
1,019
|
|
|||||
|
Income (loss) from continuing operations before income taxes
|
(250
|
)
|
(4
|
)
|
(246
|
)
|
|||||
|
Income tax (provision) benefit
|
28
|
|
3
|
|
25
|
|
|||||
|
Net income (loss) from continuing operations
|
(222
|
)
|
(1
|
)
|
(221
|
)
|
|||||
|
Net (income) loss attributable to noncontrolling interests
|
2
|
|
—
|
|
2
|
|
|||||
|
Net income (loss) attributable to Hertz
|
(220
|
)
|
(1
|
)
|
(219
|
)
|
|||||
|
Consolidated Statement of Cash Flows for the Year Ended December 31, 2018:
|
|||||||||||
|
Cash flows from operating activities:
|
|||||||||||
|
Net income (loss)
|
$
|
(222
|
)
|
$
|
(1
|
)
|
$
|
(221
|
)
|
||
|
Deferred income taxes, net
|
(64
|
)
|
(3
|
)
|
(61
|
)
|
|||||
|
Accrued liabilities
|
75
|
|
4
|
|
71
|
|
|||||
The impact to the Company's consolidated statement of comprehensive income (loss) is comprised solely of the impact to net income (loss) as shown in the tables above.
See "Revenue Recognition" above regarding the Company’s accounting policies for revenue recognition, including the nature, amount, timing, and uncertainty of revenue and cash flows arising from contracts with customers. Also see
Note 8
, "
Revenue from Contracts with Customers
," for other required disclosures under Topic 606.
Restricted Cash
In November 2016, the FASB issued guidance that clarifies existing guidance on the classification and presentation of restricted cash in the statement of cash flows. The guidance requires entities to show the changes in the total of cash, cash equivalents, restricted cash and restricted cash equivalents in the statement of cash flows. Additionally, entities will no longer present transfers between cash and cash equivalents and restricted cash and restricted cash equivalents in the statement of cash flows. The Company adopted this guidance retrospectively in accordance with the effective date on January 1, 2018.
97
HERTZ GLOBAL HOLDINGS, INC. AND SUBSIDIARIES
THE HERTZ CORPORATION AND SUBSIDIARIES
NOTES TO CONSOLIDATED FINANCIAL STATEMENTS (Continued)
Adoption of this guidance had no impact on the Company's financial position or results of operations. The impact to the consolidated statement of cash flows of adopting this guidance is as follows:
Hertz Global
|
Year Ended December 31, 2017
|
|||||||||||
|
(In millions)
|
As Previously Reported
|
Adjustments
|
As Adjusted
|
||||||||
|
Net change in restricted cash and cash equivalents, vehicle
|
$
|
(147
|
)
|
$
|
147
|
|
$
|
—
|
|
||
|
Net cash provided by (used in) investing activities
|
(3,147
|
)
|
147
|
|
(3,000
|
)
|
|||||
|
Effect of foreign currency exchange rate changes on cash, cash equivalents, restricted cash and restricted cash equivalents from continuing operations
(1)
|
21
|
|
7
|
|
28
|
|
|||||
|
Cash, cash equivalents, restricted cash and restricted cash equivalents at beginning of period
(1)
|
816
|
|
278
|
|
1,094
|
|
|||||
|
Cash, cash equivalents, restricted cash and restricted cash equivalents at end of period
(1)
|
1,072
|
|
432
|
|
1,504
|
|
|||||
|
Year Ended December 31, 2016
|
|||||||||||
|
(In millions)
|
As Previously Reported
|
Adjustments
|
As Adjusted
|
||||||||
|
Net change in restricted cash and cash equivalents, vehicle
|
$
|
53
|
|
$
|
(53
|
)
|
$
|
—
|
|
||
|
Net change in restricted cash and cash equivalents, non-vehicle
|
(1
|
)
|
1
|
|
—
|
|
|||||
|
Net cash provided by (used in) investing activities
|
(1,996
|
)
|
(52
|
)
|
(2,048
|
)
|
|||||
|
Effect of foreign currency exchange rate changes on cash, cash equivalents, restricted cash and restricted cash equivalents from continuing operations
(1)
|
(8
|
)
|
(3
|
)
|
(11
|
)
|
|||||
|
Cash, cash equivalents, restricted cash and restricted cash equivalents at beginning of period
(1)
|
474
|
|
333
|
|
807
|
|
|||||
|
Cash, cash equivalents, restricted cash and restricted cash equivalents at end of period
(1)
|
816
|
|
278
|
|
1,094
|
|
|||||
Hertz
|
Year Ended December 31, 2017
|
|||||||||||
|
(In millions)
|
As Previously Reported
|
Adjustments
|
As Adjusted
|
||||||||
|
Net change in restricted cash and cash equivalents, vehicle
|
$
|
(147
|
)
|
$
|
147
|
|
$
|
—
|
|
||
|
Net cash provided by (used in) investing activities
|
(3,147
|
)
|
147
|
|
(3,000
|
)
|
|||||
|
Effect of foreign currency exchange rate changes on cash, cash equivalents, restricted cash and restricted cash equivalents from continuing operations
(1)
|
21
|
|
7
|
|
28
|
|
|||||
|
Cash, cash equivalents, restricted cash and restricted cash equivalents at beginning of period
(1)
|
816
|
|
278
|
|
1,094
|
|
|||||
|
Cash, cash equivalents, restricted cash and restricted cash equivalents at end of period
(1)
|
1,072
|
|
432
|
|
1,504
|
|
|||||
98
HERTZ GLOBAL HOLDINGS, INC. AND SUBSIDIARIES
THE HERTZ CORPORATION AND SUBSIDIARIES
NOTES TO CONSOLIDATED FINANCIAL STATEMENTS (Continued)
|
Year Ended December 31, 2016
|
|||||||||||
|
(In millions)
|
As Previously Reported
|
Adjustments
|
As Adjusted
|
||||||||
|
Net change in restricted cash and cash equivalents, vehicle
|
$
|
53
|
|
$
|
(53
|
)
|
$
|
—
|
|
||
|
Net change in restricted cash and cash equivalents, non-vehicle
|
(1
|
)
|
1
|
|
—
|
|
|||||
|
Net cash provided by (used in) investing activities
|
(1,996
|
)
|
(52
|
)
|
(2,048
|
)
|
|||||
|
Effect of foreign currency exchange rate changes on cash, cash equivalents, restricted cash and restricted cash equivalents from continuing operations
(1)
|
(8
|
)
|
(3
|
)
|
(11
|
)
|
|||||
|
Cash, cash equivalents, restricted cash and restricted cash equivalents at beginning of period
(1)
|
474
|
|
333
|
|
807
|
|
|||||
|
Cash, cash equivalents, restricted cash and restricted cash equivalents at end of period
(1)
|
816
|
|
278
|
|
1,094
|
|
|||||
|
(1)
|
The amounts as previously reported were comprised of cash and cash equivalents and did not include restricted cash and restricted cash equivalents.
|
Reporting Comprehensive Income
In February 2018, the FASB issued guidance that allows a reclassification from accumulated other comprehensive income to retained earnings for the stranded tax effects resulting from the U.S. Tax reform. The guidance is effective for annual periods beginning after December 15, 2018, and interim periods within those annual periods. The Company adopted this guidance early, as permitted, in its fourth fiscal quarter of 2018. Adoption of this guidance resulted in an
$11 million
reclassification for amounts related to pension and other post-employment benefits from accumulated other comprehensive income to accumulated deficit as of the date adopted. Prior periods have not been retrospectively adjusted.
Not Yet Adopted as of December 31, 2018
In February 2016, the FASB issued guidance that replaces the existing lease guidance in U.S. GAAP and in 2018 issued several amendments and updates to the guidance (collectively, "Topic 842"). Topic 842 establishes a right-of-use (“ROU”) model that requires a lessee to record on the balance sheet a ROU asset and corresponding lease liability based on the present value of future lease payments. Leases will be classified as either finance or operating, with classification affecting the pattern of expense recognition in the income statement. Topic 842 also expands the requirements for lessees to record leases embedded in other arrangements. Additionally, enhanced quantitative and qualitative disclosures surrounding leases are required which provide financial statement users the ability to assess the amount, timing and uncertainty of cash flows arising from leases. Topic 842 is effective for annual periods beginning after December 15, 2018 and interim periods within those annual periods with early adoption permitted. The Company will adopt the standard when effective in its first fiscal quarter of 2019 as of January 1st, using a simplified transition approach for both lessees and lessors and will recognize a cumulative-effect adjustment to the opening balance of retained earnings in the period of adoption. Prior periods will not be retrospectively adjusted.
The Company will avail itself of the package of practical expedients for existing or expired contracts of lessees and lessors wherein the Company would not be required to reassess whether such contracts contain leases, the lease classification or the initial direct costs. The Company will not utilize the practical expedient which allows the use of hindsight by lessees and lessors in determining the lease term and in assessing impairment of its ROU assets. Also, with respect to the Company's real estate leases and Donlen's fleet leases, the Company will avail itself of the practical expedient for lessees and lessors which allows it to elect an accounting policy by class of underlying asset to combine lease and non-lease components. Additionally, the Company will elect an accounting policy to not recognize ROU assets or lease liabilities for short-term leases (i.e. those with a term of twelve months or less).
The Company estimates that the adoption of Topic 842 will result in recognition of ROU assets and lease liabilities in a range from
$1.2 billion
to
$1.6 billion
. Adoption of Topic 842 is not expected to have a material impact on the Company’s
99
HERTZ GLOBAL HOLDINGS, INC. AND SUBSIDIARIES
THE HERTZ CORPORATION AND SUBSIDIARIES
NOTES TO CONSOLIDATED FINANCIAL STATEMENTS (Continued)
results of operations or the nature, timing and recognition of rental lease revenues which are accounted for under Topic 606 until adoption of Topic 842. Additionally, adoption of this guidance will impact the statement of cash flows with respect to the presentation of the Company's operating activities, but is not expected to impact its cash flows from operations or its presentation or cash flows from investing and financing activities. The Company has designed its internal controls over financial reporting to ensure that controls are in place to prevent or detect material misstatements to the consolidated financial statements upon adoption of Topic 842.
Changes to Disclosure Requirements for Defined Benefit Plans
In August 2018, the FASB issued guidance that modifies disclosure requirements for employers that sponsor defined benefit pension or other postretirement plans to remove disclosures no longer considered cost beneficial, add disclosures identified as relevant and clarify certain disclosure requirements. The guidance is effective for annual periods beginning after December 15, 2020 using a retrospective transition method. Early adoption is permitted. The Company is in the process of determining the timing of adoption and assessing the overall impact of adopting this guidance on its disclosures.
Customer's Accounting for Implementation Costs Incurred in a Cloud Computing Arrangement
In August 2018, the FASB issued guidance on a customer's accounting for implementation fees paid in a cloud computing service contract arrangement that addresses which implementation costs to capitalize as an asset and which costs to expense. Capitalized implementation fees are to be expensed over the term of the cloud computing arrangement, and the expense is required to be recognized in the same line item in the income statement as the associated hosting service expenses. The entity is also required to present the capitalized implementation fees on the balance sheet in the same line item as the prepayment for hosting service fees associated with the cloud computing arrangement.
The guidance is effective for annual periods beginning after December 15, 2019, and interim periods within those annual periods using a retrospective or prospective transition method. Early adoption is permitted, including adoption in any interim period. The Company is in the process of determining the method and timing of adoption and assessing the overall impact of adopting this guidance on its financial position, results of operations and cash flows.
Note 3
—
Discontinued Operations
As further described in
Note 1
, "
Background
," on June 30, 2016, the separation of Old Hertz Holdings' global vehicle rental and equipment rental businesses was completed. In connection with the Spin-Off, Hertz Global and Herc Holdings entered into multiple agreements that provide a framework for the relationships between the parties going forward. As the primary operating company for Hertz Global, the agreements that follow also directly apply to Hertz.
Separation and Distribution Agreement
Hertz Global entered into a separation and distribution agreement (the “Separation Agreement”) with Herc Holdings which sets forth the general terms and conditions of the Spin-Off. The Separation Agreement provides for the transfers of entities and assets and the assumption of liabilities necessary to complete the Spin-Off. Subject to any specified exceptions, each party to the Separation Agreement has assumed the liability for, and control of, all pending and threatened legal matters related to its own business, as well as assumed or retained liabilities. The Separation Agreement provides for certain liabilities to be shared by the parties. Hertz Global and Herc Holdings are each responsible for a portion of these shared liabilities. In addition, the Separation Agreement, among other things, (i) terminates all intercompany arrangements between Hertz Global and Herc Holdings except for specified agreements and arrangements that follow the Spin-Off, (ii) releases certain claims between the parties and their affiliates, successors and assigns, and (iii) contains mutual indemnification clauses with respect to each party's respective assumed legal matters and assumed or retained liabilities.
Intellectual Property Agreement
Hertz Global and Herc Holdings entered into an intellectual property agreement that provides for ownership, licensing and other arrangements regarding the trademarks and related intellectual property that Hertz Global and Herc Holdings
100
HERTZ GLOBAL HOLDINGS, INC. AND SUBSIDIARIES
THE HERTZ CORPORATION AND SUBSIDIARIES
NOTES TO CONSOLIDATED FINANCIAL STATEMENTS (Continued)
use in conducting their respective businesses. The agreement provides that, following the Spin-Off, Herc Holdings will continue to have the right to use certain intellectual property associated with the Hertz brand for a period of
four
years on a royalty free basis.
Tax Matters Agreement
Hertz Global and Hertz entered into a tax matters agreement (the “Tax Matters Agreement”) with Herc Holdings and Herc Rentals Inc. that governs the parties’ respective rights, responsibilities and obligations after the Spin-Off with respect to tax liabilities and benefits, tax attributes, tax contests and other tax matters regarding income taxes, other taxes and related tax returns.
The Tax Matters Agreement also requires that an unqualified opinion from a nationally recognized law firm, supplemental ruling from the Internal Revenue Service, or waiver from the other party be obtained upon the occurrence or contemplated occurrence of certain events which could impact the taxability of the transaction under the U.S. federal income tax law.
Employee Matters Agreement
Hertz Global and Herc Holdings entered into an employee matters agreement to allocate liabilities and responsibilities relating to employment matters, employee compensation, benefit plans and programs and other related matters.
Results of Discontinued Operations - Hertz Global
The following table summarizes the results of the equipment rental business and certain parent legal entities which are presented as discontinued operations in the accompanying consolidated statement of operations for the year ended December 31, 2016. The operations that are discontinued are comprised of Old Hertz Holdings' Worldwide Equipment Rental segment as well as certain parent entities that were presented as part of corporate operations prior to the Spin-Off.
|
(In millions)
|
Year Ended December 31, 2016
|
||
|
Total revenues
|
$
|
677
|
|
|
Direct operating expenses
|
366
|
|
|
|
Depreciation of revenue earning equipment and lease charges, net
|
181
|
|
|
|
Selling, general and administrative expenses
|
123
|
|
|
|
Interest expense, net
(1)
|
17
|
|
|
|
Other (income) expense, net
|
(1
|
)
|
|
|
Income (loss) from discontinued operations before income taxes
|
(9
|
)
|
|
|
(Provision) benefit for taxes on discontinued operations
|
(8
|
)
|
|
|
Net income (loss) from discontinued operations
|
$
|
(17
|
)
|
|
(1)
|
In addition to interest expense directly associated with Herc Holdings, the Company allocated
$5 million
of interest expense related to certain debt repaid in connection with the Spin-Off to discontinued operations.
|
101
HERTZ GLOBAL HOLDINGS, INC. AND SUBSIDIARIES
THE HERTZ CORPORATION AND SUBSIDIARIES
NOTES TO CONSOLIDATED FINANCIAL STATEMENTS (Continued)
Results of Discontinued Operations - Hertz
The following table summarizes the results of the equipment rental business which is presented as discontinued operations in the accompanying consolidated statement of operations for the year ended December 31, 2016. The operations of Hertz that are discontinued are comprised of it's former Worldwide Equipment Rental segment.
|
(In millions)
|
Year Ended December 31, 2016
|
||
|
Total revenues
|
$
|
677
|
|
|
Direct operating expenses
|
366
|
|
|
|
Depreciation of revenue earning equipment and lease charges, net
|
181
|
|
|
|
Selling, general and administrative expenses
|
124
|
|
|
|
Interest expense, net
(1)
|
13
|
|
|
|
Other (income) expense, net
|
(1
|
)
|
|
|
Income (loss) from discontinued operations before income taxes
|
(6
|
)
|
|
|
(Provision) benefit for taxes on discontinued operations
|
(9
|
)
|
|
|
Net income (loss) from discontinued operations
|
$
|
(15
|
)
|
|
(1)
|
In addition to interest expense directly associated with Herc Holdings, the Company allocated
$5 million
of interest expense related to certain debt repaid in connection with the Spin-Off to discontinued operations.
|
Note 4
—
Divestitures
CAR Inc. Investment
During 2016, the Company sold approximately
236 million
shares of common stock of CAR Inc., a publicly traded rental car company on the Hong Kong Stock Exchange, and extended its commercial agreement with CAR Inc. to 2023, in exchange for approximately
$274 million
, of which
$267 million
was allocated to the sale of shares based on the fair value of those shares. The sale of shares resulted in a pre-tax gain of approximately
$84 million
. Additionally,
$7 million
of the proceeds were allocated to the extension of the commercial agreement which have been deferred and are being recognized over the remaining term of the commercial agreement. During 2017, the Company sold its remaining shares of common stock of CAR Inc. and no longer has an ownership interest in the entity.
The pre-tax gains recognized on the sales of common stock of CAR Inc. are recorded in the Company's Corporate operations and are included in other (income) expense, net in the accompanying consolidated statements of operations for the years ended December 31, 2017 and 2016.
Investment in Additional Equity
In April 2016, the Company paid approximately
$45 million
for an equity method investment. In March 2017, the Company determined it had an other than temporary loss in value of its investment and recorded an impairment charge of
$30 million
based on the fair value of the investment determined using level 3 inputs under the fair value hierarchy. Due to cumulative equity losses and amortization of
$11 million
, the carrying value of the investment as of March 31, 2017, subsequent to the impairment, was
$4 million
. In September 2017, the investee was dissolved which resulted in a return of capital to the Company and a pre-tax gain of
$4 million
. The net amount of the fair value adjustments of
$26 million
is included in other (income) expense, net in the accompanying consolidated statement of operations for the year ended December 31, 2017 and is attributable to the Company's Corporate operations.
102
HERTZ GLOBAL HOLDINGS, INC. AND SUBSIDIARIES
THE HERTZ CORPORATION AND SUBSIDIARIES
NOTES TO CONSOLIDATED FINANCIAL STATEMENTS (Continued)
Brazil Operations
During 2016, the Company, along with certain of its wholly owned subsidiaries, entered into a definitive stock purchase agreement to sell Car Rental Systems do Brasil Locação de Veiculos Ltd., a wholly owned subsidiary of the Company located in Brazil ("Brazil Operations"), to Localiza Fleet S.A. (“Localiza”), a corporation headquartered in Brazil. The Brazil Operations are reported in the Company's International Rental Car segment. As a result of the then pending sale, the carrying values of the assets and liabilities being sold were written down to fair value less costs to sell, which resulted in an impairment charge of
$18 million
based upon the estimated agreed-upon sales price and related transaction costs, which is included in other (income) expense, net, in the accompanying consolidated statement of operations for the year ended December 31, 2016.
In August 2017, the Company completed the sale of its Brazil Operations to Localiza and received proceeds of
$115 million
, of which
$13 million
was placed into escrow to secure certain indemnification obligations. As a result of the sale, the Company recorded a
$6 million
gain, net of the impact of foreign currency adjustments, which is included in other (income) expense, net in the accompanying consolidated statement of operations for the year ended December 31, 2017. As part of the sale, both companies entered into referral and brand cooperation agreements to govern their ongoing relationship which have an initial term of
twenty years
with an option to extend for another
twenty years
. The alliance will also involve the exchange of knowledge in areas of technology, customer service and operational excellence.
Note 5
—
Revenue Earning Vehicles, Net
The components of revenue earning vehicles, net are as follows:
|
December 31,
|
|||||||
|
(In millions)
|
2018
|
2017
|
|||||
|
Revenue earning vehicles
|
$
|
15,242
|
|
$
|
14,209
|
|
|
|
Less: Accumulated depreciation
|
(3,134
|
)
|
(3,123
|
)
|
|||
|
12,108
|
|
11,086
|
|
||||
|
Revenue earning vehicles intended for sale, net of depreciation
|
311
|
|
250
|
|
|||
|
Revenue earning vehicles, net
|
$
|
12,419
|
|
$
|
11,336
|
|
|
Revenue earning vehicles intended for sale represents the carrying amount of vehicles currently placed on the Company's retail lots for sale or actively in the process of being sold through other disposition channels.
Depreciation of revenue earning vehicles and lease charges, net includes the following:
|
Years Ended December 31,
|
|||||||||||
|
(In millions)
|
2018
|
2017
|
2016
|
||||||||
|
Depreciation of revenue earning vehicles
|
$
|
2,457
|
|
$
|
2,486
|
|
$
|
2,359
|
|
||
|
(Gain) loss on disposal of revenue earning vehicles
(a)
|
142
|
|
236
|
|
172
|
|
|||||
|
Rents paid for vehicles leased
|
91
|
|
76
|
|
70
|
|
|||||
|
Depreciation of revenue earning vehicles and lease charges, net
|
$
|
2,690
|
|
$
|
2,798
|
|
$
|
2,601
|
|
||
(a) (Gain) loss on disposal of revenue earning vehicles by segment is as follows:
|
Years Ended December 31,
|
|||||||||||
|
(In millions)
|
2018
|
2017
|
2016
|
||||||||
|
U.S. Rental Car
(i)
|
$
|
145
|
|
$
|
234
|
|
$
|
177
|
|
||
|
International Rental Car
|
(3
|
)
|
2
|
|
(5
|
)
|
|||||
|
Total
|
$
|
142
|
|
$
|
236
|
|
$
|
172
|
|
||
|
(i)
|
Includes costs associated with the Company's U.S. vehicle sales operations of
$148 million
,
$132 million
and
$109 million
for the years ended
December 31, 2018, 2017 and 2016
, respectively.
|
103
HERTZ GLOBAL HOLDINGS, INC. AND SUBSIDIARIES
THE HERTZ CORPORATION AND SUBSIDIARIES
NOTES TO CONSOLIDATED FINANCIAL STATEMENTS (Continued)
Depreciation rates are reviewed on a quarterly basis based on management's ongoing assessment of present and estimated future market conditions, their effect on residual values at the expected time of disposal and the estimated holding periods for the vehicles. The impact of depreciation rate changes is as follows:
|
Increase (decrease)
|
Years Ended December 31,
|
||||||||||
|
(In millions)
|
2018
|
2017
|
2016
|
||||||||
|
U.S. Rental Car
|
$
|
(60
|
)
|
$
|
77
|
|
$
|
141
|
|
||
|
International Rental Car
|
1
|
|
10
|
|
4
|
|
|||||
|
Total
|
$
|
(59
|
)
|
$
|
87
|
|
$
|
145
|
|
||
Note 6
—
Goodwill and Intangible Assets, Net
Goodwill
In 2016, the Company performed its annual goodwill impairment analysis as of October 1
st
using a two-step process and determined that an impairment existed related to the Europe Rental Car reporting unit and recorded a charge of
$172 million
. The impairment was largely due to declines in revenue and profitability projections associated with the vehicle rental operations in Europe, coupled with an increased weighted average cost of capital. The Company concluded there was no impairment of its other reporting units.
As a result of declines in revenues and profitability of the Company and a decline in the share price of Hertz Global's common stock, the Company tested the recoverability of its goodwill as of June 30, 2017. The Company also tested the recoverability of its goodwill as of its annual test dates of October 1, 2017 and 2018, the results of which indicated that the estimated fair value of each reporting unit was in excess of its carrying value, therefore, the Company determined that its goodwill was not impaired.
The Company performed these impairment analyses using the income approach, a measurement using level 3 inputs under the GAAP fair value hierarchy. In performing the impairment analyses, the Company leveraged long-term strategic plans, which are based on strategic initiatives for future profitability growth. The weighted average cost of capital used in the discounted cash flow model was calculated based upon the fair value of the Company's debt and stock price with a debt to equity ratio comparable to the vehicle rental car industry.
The following summarizes the changes in the Company's goodwill, by segment:
|
(In millions)
|
U.S. Rental Car
|
International Rental Car
|
All Other Operations
|
Total
|
|||||||||||
|
Balance as of January 1, 2018
|
|||||||||||||||
|
Goodwill
|
$
|
1,029
|
|
$
|
237
|
|
$
|
36
|
|
$
|
1,302
|
|
|||
|
Accumulated impairment losses
|
—
|
|
(218
|
)
|
—
|
|
(218
|
)
|
|||||||
|
1,029
|
|
19
|
|
36
|
|
1,084
|
|
||||||||
|
Goodwill acquired and other changes during the period
(a)
|
—
|
|
(1
|
)
|
—
|
|
(1
|
)
|
|||||||
|
—
|
|
(1
|
)
|
—
|
|
(1
|
)
|
||||||||
|
Balance as of December 31, 2018
|
|||||||||||||||
|
Goodwill
|
1,029
|
|
236
|
|
36
|
|
1,301
|
|
|||||||
|
Accumulated impairment losses
|
—
|
|
(218
|
)
|
—
|
|
(218
|
)
|
|||||||
|
$
|
1,029
|
|
$
|
18
|
|
$
|
36
|
|
$
|
1,083
|
|
||||
104
HERTZ GLOBAL HOLDINGS, INC. AND SUBSIDIARIES
THE HERTZ CORPORATION AND SUBSIDIARIES
NOTES TO CONSOLIDATED FINANCIAL STATEMENTS (Continued)
|
(In millions)
|
U.S. Rental Car
|
International Rental Car
|
All Other Operations
|
Total
|
|||||||||||
|
Balance as of January 1, 2017
|
|||||||||||||||
|
Goodwill
|
$
|
1,028
|
|
$
|
237
|
|
$
|
34
|
|
$
|
1,299
|
|
|||
|
Accumulated impairment losses
|
—
|
|
(218
|
)
|
—
|
|
(218
|
)
|
|||||||
|
1,028
|
|
19
|
|
34
|
|
1,081
|
|
||||||||
|
Goodwill acquired and other changes during the period
(a)
|
1
|
|
—
|
|
2
|
|
3
|
|
|||||||
|
1
|
|
—
|
|
2
|
|
3
|
|
||||||||
|
Balance as of December 31, 2017
|
|||||||||||||||
|
Goodwill
|
1,029
|
|
237
|
|
36
|
|
1,302
|
|
|||||||
|
Accumulated impairment losses
|
—
|
|
(218
|
)
|
—
|
|
(218
|
)
|
|||||||
|
$
|
1,029
|
|
$
|
19
|
|
$
|
36
|
|
$
|
1,084
|
|
||||
|
(a)
|
Changes in the International Rental Car segment and All Other Operations segment primarily consists of foreign currency exchange rate adjustments.
|
Intangible Assets, Net
The Company's indefinite-lived intangible assets primarily consist of the Hertz and Dollar Thrifty tradenames. In 2016, the Company performed its annual impairment analysis of its indefinite-lived intangible assets as of October 1
st
and concluded that there was an impairment of the Dollar Thrifty tradename in the U.S. Rental Car segment and recorded a charge of
$120 million
. The Company concluded there was no impairment of the Hertz tradename.
In 2017, as a result of declines in revenues and profitability of the Company and a decline in the share price of Hertz Global's common stock, the Company tested the recoverability of its indefinite-lived intangible assets as of June 30, 2017 and concluded that there was an impairment of the Dollar Thrifty tradename in its U.S. Rental Car segment and recorded a charge of
$86 million
. The Company concluded there was no impairment of the Hertz tradename. The Company also tested the recoverability of its indefinite-lived intangible assets as of its annual test dates of October 1, 2017 and 2018 and concluded there was no impairment of either tradename.
The Company performed these impairment analyses using the relief from royalty method, a measurement using level 3 inputs under the GAAP fair value hierarchy. The impairments in 2017 and 2016 were largely due to decreases in long-term revenue projections coupled with an increase in the weighted average cost of capital.
Intangible assets, net, consisted of the following major classes:
|
December 31, 2018
|
|||||||||||
|
(In millions)
|
Gross
Carrying Amount |
Accumulated
Amortization |
Net
Carrying Value |
||||||||
|
Amortizable intangible assets:
|
|||||||||||
|
Customer-related
|
$
|
333
|
|
$
|
(309
|
)
|
$
|
24
|
|
||
|
Concession rights
|
413
|
|
(279
|
)
|
134
|
|
|||||
|
Technology-related intangibles
(a)
|
412
|
|
(219
|
)
|
193
|
|
|||||
|
Other
(b)
|
82
|
|
(69
|
)
|
13
|
|
|||||
|
Total
|
1,240
|
|
(876
|
)
|
364
|
|
|||||
|
Indefinite-lived intangible assets:
|
|||||||||||
|
Tradenames
|
2,814
|
|
—
|
|
2,814
|
|
|||||
|
Other
(c)
|
25
|
|
—
|
|
25
|
|
|||||
|
Total
|
2,839
|
|
—
|
|
2,839
|
|
|||||
|
Total intangible assets, net
|
$
|
4,079
|
|
$
|
(876
|
)
|
$
|
3,203
|
|
||
105
HERTZ GLOBAL HOLDINGS, INC. AND SUBSIDIARIES
THE HERTZ CORPORATION AND SUBSIDIARIES
NOTES TO CONSOLIDATED FINANCIAL STATEMENTS (Continued)
|
December 31, 2017
|
|||||||||||
|
(In millions)
|
Gross
Carrying Amount |
Accumulated
Amortization |
Net
Carrying Value |
||||||||
|
Amortizable intangible assets:
|
|||||||||||
|
Customer-related
|
$
|
333
|
|
$
|
(301
|
)
|
$
|
32
|
|
||
|
Concession rights
|
413
|
|
(233
|
)
|
180
|
|
|||||
|
Technology-related intangibles
(a)
|
377
|
|
(204
|
)
|
173
|
|
|||||
|
Other
(b)
|
82
|
|
(64
|
)
|
18
|
|
|||||
|
Total
|
1,205
|
|
(802
|
)
|
403
|
|
|||||
|
Indefinite-lived intangible assets:
|
|||||||||||
|
Tradenames
|
2,814
|
|
—
|
|
2,814
|
|
|||||
|
Other
(c)
|
25
|
|
—
|
|
25
|
|
|||||
|
Total
|
2,839
|
|
—
|
|
2,839
|
|
|||||
|
Total intangible assets, net
|
$
|
4,044
|
|
$
|
(802
|
)
|
$
|
3,242
|
|
||
|
(a)
|
Technology-related intangibles include software not yet placed into service.
|
|
(b)
|
Other amortizable intangible assets primarily include the Donlen tradename and reacquired franchise rights.
|
|
(c)
|
Other indefinite-lived intangible assets primarily consist of reacquired franchise rights.
|
Amortization of intangible assets for the years ended
December 31, 2018, 2017 and 2016
was
$89 million
,
$97 million
and
$98 million
, respectively. Based on its amortizable intangible assets as of
December 31, 2018
, the Company expects amortization expense to be approximately
$83 million
in
2019
,
$86 million
in
2020
,
$75 million
in
2021
,
$30 million
in
2022
,
$27 million
in
2023
and
$63 million
thereafter.
106
HERTZ GLOBAL HOLDINGS, INC. AND SUBSIDIARIES
THE HERTZ CORPORATION AND SUBSIDIARIES
NOTES TO CONSOLIDATED FINANCIAL STATEMENTS (Continued)
Note 7
—
Debt
The Company's debt, including its available credit facilities, consists of the following ($ in millions):
|
Facility
|
Weighted Average Interest Rate as of December 31, 2018
|
Fixed or
Floating
Interest
Rate
|
Maturity
|
December 31,
2018 |
December 31,
2017 |
|||||||||
|
Non-Vehicle Debt
|
||||||||||||||
|
Senior Term Loan
|
5.28%
|
Floating
|
6/2023
|
$
|
674
|
|
$
|
688
|
|
|||||
|
Senior RCF
|
N/A
|
Floating
|
6/2021
|
—
|
|
—
|
|
|||||||
|
Senior Notes
(1)
|
6.13%
|
Fixed
|
10/2020-10/2024
|
2,500
|
|
2,500
|
|
|||||||
|
Senior Second Priority Secured Notes
|
7.63%
|
Fixed
|
6/2022
|
1,250
|
|
1,250
|
|
|||||||
|
Promissory Notes
|
7.00%
|
Fixed
|
1/2028
|
27
|
|
27
|
|
|||||||
|
Other Non-Vehicle Debt
|
6.73%
|
Fixed
|
Various
|
4
|
|
11
|
|
|||||||
|
Unamortized Debt Issuance Costs and Net (Discount) Premium
|
(33
|
)
|
(42
|
)
|
||||||||||
|
Total Non-Vehicle Debt
|
4,422
|
|
4,434
|
|
||||||||||
|
Vehicle Debt
|
||||||||||||||
|
HVF U.S. Vehicle Medium Term Notes
|
||||||||||||||
|
HVF Series 2010-1
|
N/A
|
N/A
|
N/A
|
—
|
|
39
|
|
|||||||
|
HVF Series 2013-1
|
N/A
|
N/A
|
N/A
|
—
|
|
625
|
|
|||||||
|
|
|
|
—
|
|
664
|
|
||||||||
|
HVF II U.S. ABS Program
|
||||||||||||||
|
HVF II U.S. Vehicle Variable Funding Notes
|
||||||||||||||
|
HVF II Series 2013-A
(2)
|
3.92%
|
Floating
|
3/2020
|
2,940
|
|
1,970
|
|
|||||||
|
HVF II Series 2013-B
(2)
|
N/A
|
Floating
|
3/2020
|
—
|
|
123
|
|
|||||||
|
2,940
|
|
2,093
|
|
|||||||||||
|
HVF II U.S. Vehicle Medium Term Notes
|
||||||||||||||
|
HVF II Series 2015-1
(2)
|
2.93%
|
Fixed
|
3/2020
|
780
|
|
780
|
|
|||||||
|
HVF II Series 2015-2
(2)
|
N/A
|
N/A
|
N/A
|
—
|
|
265
|
|
|||||||
|
HVF II Series 2015-3
(2)
|
3.10%
|
Fixed
|
9/2020
|
371
|
|
371
|
|
|||||||
|
HVF II Series 2016-1
(2)
|
2.89%
|
Fixed
|
3/2019
|
466
|
|
466
|
|
|||||||
|
HVF II Series 2016-2
(2)
|
3.41%
|
Fixed
|
3/2021
|
595
|
|
595
|
|
|||||||
|
HVF II Series 2016-3
(2)
|
2.72%
|
Fixed
|
7/2019
|
424
|
|
424
|
|
|||||||
|
HVF II Series 2016-4
(2)
|
3.09%
|
Fixed
|
7/2021
|
424
|
|
424
|
|
|||||||
|
HVF II Series 2017-1
(2)
|
3.38%
|
Fixed
|
10/2020
|
450
|
|
450
|
|
|||||||
|
HVF II Series 2017-2
(2)
|
3.57%
|
Fixed
|
10/2022
|
350
|
|
350
|
|
|||||||
|
HVF II Series 2018-1
(2)
|
3.41%
|
Fixed
|
2/2023
|
1,000
|
|
—
|
|
|||||||
|
HVF II Series 2018-2
(2)
|
3.80%
|
Fixed
|
6/2021
|
200
|
|
—
|
|
|||||||
|
HVF II Series 2018-3
(2)
|
4.15%
|
Fixed
|
7/2023
|
200
|
|
—
|
|
|||||||
|
5,260
|
|
4,125
|
|
|||||||||||
|
Donlen ABS Program
|
||||||||||||||
|
HFLF Variable Funding Notes
|
||||||||||||||
|
HFLF Series 2013-2
(2)
|
3.39%
|
Floating
|
3/2020
|
320
|
|
380
|
|
|||||||
|
320
|
|
380
|
|
|||||||||||
107
HERTZ GLOBAL HOLDINGS, INC. AND SUBSIDIARIES
THE HERTZ CORPORATION AND SUBSIDIARIES
NOTES TO CONSOLIDATED FINANCIAL STATEMENTS (Continued)
|
Facility
|
Weighted Average Interest Rate as of December 31, 2018
|
Fixed or
Floating
Interest
Rate
|
Maturity
|
December 31,
2018 |
December 31,
2017 |
|||||||||
|
HFLF Medium Term Notes
|
||||||||||||||
|
HFLF Series 2015-1
(3)
|
3.86%
|
Floating
|
1/2019-3/2019
|
33
|
|
145
|
|
|||||||
|
HFLF Series 2016-1
(3)
|
3.57%
|
Both
|
1/2019-2/2020
|
171
|
|
318
|
|
|||||||
|
HFLF Series 2017-1
(3)
|
2.79%
|
Both
|
1/2019-4/2021
|
397
|
|
500
|
|
|||||||
|
HFLF Series 2018-1
(3)
|
3.24%
|
Both
|
7/2019-6/2021
|
550
|
|
—
|
|
|||||||
|
1,151
|
|
963
|
|
|||||||||||
|
Vehicle Debt - Other
|
||||||||||||||
|
U.S. Vehicle RCF
|
5.01%
|
Floating
|
6/2021
|
146
|
|
186
|
|
|||||||
|
European Revolving Credit Facility
|
N/A
|
Floating
|
N/A
|
—
|
|
184
|
|
|||||||
|
European Vehicle Notes
(4)
|
5.07%
|
Fixed
|
10/2021-3/2023
|
829
|
|
773
|
|
|||||||
|
European Securitization
(2)
|
N/A
|
N/A
|
N/A
|
—
|
|
367
|
|
|||||||
|
European ABS
(2)
|
1.75%
|
Floating
|
10/2020
|
600
|
|
—
|
|
|||||||
|
Canadian Securitization
(2)
|
3.43%
|
Floating
|
3/2020
|
220
|
|
237
|
|
|||||||
|
Australian Securitization
(2)
|
3.63%
|
Floating
|
3/2020
|
155
|
|
155
|
|
|||||||
|
New Zealand RCF
|
4.64%
|
Floating
|
3/2020
|
40
|
|
42
|
|
|||||||
|
U.K. Financing Facility
|
3.08%
|
Floating
|
1/2019-9/2021
|
242
|
|
251
|
|
|||||||
|
Other Vehicle Debt
|
3.99%
|
Floating
|
1/2019-10/2022
|
42
|
|
51
|
|
|||||||
|
2,274
|
|
2,246
|
|
|||||||||||
|
Unamortized Debt Issuance Costs and Net (Discount) Premium
|
(43
|
)
|
(40
|
)
|
||||||||||
|
Total Vehicle Debt
|
11,902
|
|
10,431
|
|
||||||||||
|
Total Debt
|
$
|
16,324
|
|
$
|
14,865
|
|
||||||||
N/A - Not applicable
|
(1)
|
References to the "Senior Notes" include the series of Hertz's unsecured senior notes set forth in the table below. Outstanding principal amounts for each such series of the Senior Notes is also specified below:
|
|
(In millions)
|
Outstanding Principal
|
||||||
|
Senior Notes
|
December 31, 2018
|
December 31, 2017
|
|||||
|
5.875% Senior Notes due October 2020
|
$
|
700
|
|
$
|
700
|
|
|
|
7.375% Senior Notes due January 2021
|
500
|
|
500
|
|
|||
|
6.250% Senior Notes due October 2022
|
500
|
|
500
|
|
|||
|
5.500% Senior Notes due October 2024
|
800
|
|
800
|
|
|||
|
|
$
|
2,500
|
|
$
|
2,500
|
|
|
|
(2)
|
Maturity reference is to the earlier "expected final maturity date" as opposed to the subsequent "legal final maturity date." The expected final maturity date is the date by which Hertz and investors in the relevant indebtedness expect the outstanding principal of the relevant indebtedness to be repaid in full. The legal final maturity date is the date on which the outstanding principal of the relevant indebtedness is legally due and payable in full.
|
|
(3)
|
In the case of the Hertz Fleet Lease Funding LP ("HFLF") Medium Term Notes, such notes are repayable from cash flows derived from third-party leases comprising the underlying HFLF collateral pool. The initial maturity date referenced for each series of HFLF Medium Term Notes represents the end of the revolving period for such series, at which time the related notes begin to amortize monthly by an amount equal to the lease collections payable to that series. To the extent the revolving period already has ended, the initial maturity date reflected is January 2019. The second maturity date referenced for each series of HFLF Medium Term Notes represents the date by which Hertz and the investors in the related series expect such series of notes to be repaid in full, which is based upon various assumptions made at the time of pricing of such notes, including the contractual amortization of the underlying leases as well as the assumed rate of prepayments of such leases. Such maturity reference is to the “expected final maturity date” as opposed to the subsequent “legal final maturity date.” The legal final maturity date is the date on which the relevant indebtedness is legally due and
|
108
HERTZ GLOBAL HOLDINGS, INC. AND SUBSIDIARIES
THE HERTZ CORPORATION AND SUBSIDIARIES
NOTES TO CONSOLIDATED FINANCIAL STATEMENTS (Continued)
payable. Although the underlying lease cash flows that support the repayment of the HFLF Medium Term Notes may vary, the cash flows generally are expected to approximate a straight line amortization of the related notes from the initial maturity date through the expected final maturity date.
|
(4)
|
References to the "European Vehicle Notes" include the series of Hertz Holdings Netherlands B.V.'s, an indirect wholly-owned subsidiary of Hertz organized under the laws of the Netherlands ("HHN BV"), unsecured senior notes (converted from Euros to U.S. dollars at a rate of
1.14
to 1 and
1.19
to 1 as of December 31, 2018 and 2017, respectively) set forth in the table below. Outstanding principal amounts for each such series of the European Vehicle Notes is also specified below:
|
|
(In millions)
|
Outstanding Principal
|
||||||
|
European Vehicle Notes
|
December 31, 2018
|
December 31, 2017
|
|||||
|
4.375% Senior Notes due January 2019
|
$
|
—
|
|
$
|
505
|
|
|
|
4.125% Senior Notes due October 2021
|
257
|
|
268
|
|
|||
|
5.500% Senior Notes due March 2023
|
572
|
|
—
|
|
|||
|
$
|
829
|
|
$
|
773
|
|
||
Non-Vehicle Debt
Senior Facilities
In June 2016, in connection with the Spin-Off, Hertz entered into a credit agreement with respect to a new senior secured term facility (as amended, the “Senior Term Loan”) with a
$700 million
initial principal balance and a
$1.7 billion
senior secured revolving credit facility (as amended, the “Senior RCF” and, together with the Senior Term Loan, the “Senior Facilities”) with a portion of the Senior RCF available for the issuance of letters of credit and the issuance of swing line loans.
The interest rate applicable to the Senior Term Loan is based on a floating rate (subject to a LIBOR floor of
0.75%
) that varies depending on Hertz’s consolidated total net corporate leverage ratio. The interest rates applicable to the Senior RCF are based on a floating rate that varies depending on Hertz’s consolidated total net corporate leverage ratio and corporate ratings.
During 2017, certain terms of the credit agreement governing the Senior Facilities were amended with the consent of the required lenders under such credit agreement. The amendments, among other things, (i) amended the terms of the financial maintenance covenant for the Senior RCF to test, when applicable, Hertz’s consolidated first lien net leverage ratio in lieu of Hertz’s consolidated total net corporate leverage ratio, (ii) provided that Hertz shall not make dividends and certain restricted payments unless a leverage ratio test is satisfied, (iii) added a covenant to restrict the incurrence of certain non-vehicle indebtedness which covenant permits the incurrence of additional indebtedness that is junior to the indebtedness under the Senior Facilities to the extent the amount outstanding under the Senior Facilities is less than
$2.4 billion
, (iv) capped the amount of unrestricted cash that may be netted for purposes of calculating the consolidated first lien net leverage ratio at
$500 million
unless a specified consolidated total gross corporate leverage ratio is met for a specified period, (v) amended the amortization of the Senior Term Loan such that it will amortize, payable in equal quarterly installments, in annual amounts equal to
2%
per annum of the original principal amount of the term loans until the maturity date thereof, and (vi) amended certain financial definitions relating to the foregoing. Additionally, the amendments provided for the entry by Hertz into a standalone
$400 million
letter of credit facility (the "Letter of Credit Facility"). Additionally, during 2017, Hertz terminated
$533 million
of commitments under the Senior RCF, such that after giving effect to such terminations the Senior RCF consisted of a
$1.167 billion
senior secured revolving credit facility.
During 2018, Hertz terminated letters of credit issued under the Senior RCF with a stated amount of
$305 million
and reissued such letters of credit under the Letter of Credit Facility. As a result, the commitments under the Senior RCF were permanently reduced on a dollar-for-dollar basis, such that after giving effect to such reductions the Senior RCF consists of a
$862 million
senior secured revolving credit facility.
109
HERTZ GLOBAL HOLDINGS, INC. AND SUBSIDIARIES
THE HERTZ CORPORATION AND SUBSIDIARIES
NOTES TO CONSOLIDATED FINANCIAL STATEMENTS (Continued)
Senior Notes
During 2017, Hertz redeemed all
$250 million
of its outstanding
4.25%
Senior Notes due April 2018 and all
$450 million
of its outstanding
6.75%
Senior Notes due April 2019.
Hertz's obligations under the indentures for the Senior Notes are guaranteed by each of its direct and indirect U.S. subsidiaries that are guarantors under the Senior Facilities. The guarantees of such subsidiary guarantors may be released to the extent such subsidiaries no longer guarantee the Company's Senior Facilities in the U.S.
Senior Second Priority Secured Notes
In June 2017, Hertz issued
$1.25 billion
in aggregate principal amount of
7.625%
Senior Second Priority Secured Notes due 2022 (the "Senior Second Priority Secured Notes").
Hertz's obligations under the indentures for the Senior Second Priority Secured Notes are guaranteed by each of its direct and indirect U.S. subsidiaries that are guarantors under the Senior Facilities. The guarantees of such subsidiary guarantors may be released to the extent such subsidiaries no longer guarantee the Company's Senior Facilities in the U.S.
Vehicle Debt
The governing documents of certain of the vehicle debt financing arrangements specified below contain covenants that, among other things, significantly limit or restrict (or upon certain circumstances may significantly restrict or prohibit) the ability of the borrowers/issuers, and the guarantors if applicable, to make certain restricted payments (including paying dividends, redeeming stock, making other distributions, loans or advances) to Hertz Holdings and Hertz, whether directly or indirectly. To the extent applicable, aggregate maximum borrowings are subject to borrowing base availability. There is subordination within certain series of vehicle debt based on class. Proceeds from the issuance of vehicle debt is typically used to acquire or refinance vehicles or to repay portions of outstanding principal amounts of vehicle debt with an earlier maturity.
HVF U.S. Vehicle Medium Term Notes
HVF Series 2010-1 Notes
: In July 2010, HVF issued the Series 2010-1 Rental Car Asset Backed Notes in an aggregate original principal amount of
$750 million
.
HVF Series 2013-1 Notes
: In January 2013, HVF issued the Series 2013-1 Rental Car Asset Backed Notes, Class A and Class B in an aggregate original principal amount of
$950 million
.
As of December 31, 2018, all HVF U.S. Vehicle Medium Term Notes have been paid in full.
HVF II U.S. ABS Program
In November 2013, Hertz established a securitization platform, the HVF II U.S. ABS Program, designed to facilitate its financing activities relating to the vehicles used by Hertz in the U.S. daily vehicle rental operations of its Hertz, Dollar, and Thrifty brands. Hertz Vehicle Financing II LP, a bankruptcy remote, indirect, wholly-owned, special purpose subsidiary of Hertz ("HVF II") is the issuer of variable funding notes and medium term notes under the HVF II U.S. ABS Program. HVF II has entered into a base indenture that permits it to issue term and revolving rental vehicle asset- backed securities, secured by one or more shared or segregated collateral pools consisting primarily of portions of the rental vehicles used in its U.S. vehicle rental operations and contractual rights related to such vehicles that have been allocated as the ultimate indirect collateral for HVF II's financings. Within each series of HVF II U.S. Vehicle Medium Term Notes there is subordination based on class.
The assets of HVF II and HVF II GP Corp. are owned by HVF II and HVF II GP Corp., respectively, and are not available to satisfy the claims of Hertz’s general creditors.
110
HERTZ GLOBAL HOLDINGS, INC. AND SUBSIDIARIES
THE HERTZ CORPORATION AND SUBSIDIARIES
NOTES TO CONSOLIDATED FINANCIAL STATEMENTS (Continued)
References to the “HVF II U.S. ABS Program” include HVF II’s U.S. Vehicle Variable Funding Notes and HVF II's U.S. Vehicle Medium Term Notes.
HVF II U.S. Vehicle Variable Funding Notes
HVF II Series 2013 Notes:
During 2017, HVF II increased the commitments of the HVF II Series 2013 Notes by
$415 million
and transitioned
$300 million
of commitments available under the HVF II Series 2013-B Notes to the HVF Series 2013-A Notes.
In April 2018, HVF II increased the maximum commitments under the HVF II Series 2013 Notes by
$250 million
, such that after giving effect to such increase, the aggregate maximum principal amount of the HVF II Series 2013-A Notes and HVF II Series 2013-B Notes was approximately
$3.4 billion
and
$300 million
, respectively.
In February 2019, HVF II extended the maturities of
$3.4 billion
of existing commitments under the HVF II Series 2013-A Notes from March 2020 to March 2021 and added
$400 million
in new commitments. Additionally, the commitments under the HVF II Series 2013-B Notes were terminated.
HVF II Series 2017-A Notes:
In March 2018, the HVF II Series 2017-A Notes were paid in full and all $
500 million
of commitments were terminated.
HVF II Series 2019-A Notes
: In February 2019, HVF II issued the Series 2019-A Variable Funding Rental Car Asset Backed Notes with an aggregate maximum principal amount of
$500 million
and a maturity date of October 2019.
HVF II U.S. Vehicle Medium Term Notes
HVF II Series 2015-1 Notes:
In April 2015, HVF II issued the Series 2015-1 Rental Car Asset Backed Notes, Class A, Class B, and Class C in an aggregate principal amount of
$780 million
.
HVF II Series 2015-2 Notes and HVF II Series 2015-3 Notes:
In October 2015, HVF II issued the Series 2015-2 Rental Car Asset Backed Notes, Class A, Class B, Class C and Class D in an aggregate principal amount of
$265 million
and Series 2015-3 Rental Car Asset Backed Notes, Class A, Class B, Class C and Class D in an aggregate principal amount of
$371 million
.
HVF II Series 2016-1 Notes and HVF II Series 2016-2 Notes:
In February 2016, HVF II issued the Series 2016-1 Rental Car Asset Backed Notes, Class A, Class B, Class C and Class D in an aggregate principal amount of
$466 million
and Series 2016-2 Rental Car Asset Backed Notes, Class A, Class B, Class C and Class D in an aggregate principal amount of
$595 million
.
HVF II Series 2016-3 Notes and HVF II Series 2016-4 Notes:
In June 2016, HVF II issued the Series 2016-3 Rental Car Asset Backed Notes, Class A, Class B, Class C and Class D and Series 2016-4 Rental Car Asset Backed Notes, Class A, Class B, Class C and Class D each in an aggregate principal amount of
$424 million
.
HVF II Various Series 2015 and 2016 Class D Notes:
In August 2017, Hertz sold the below notes, which it had acquired at the time of the respective HVF II initial offerings disclosed above and which were previously eliminated in consolidation, to third parties. The interest terms, maturity, and subordination of the notes sold to third parties remained consistent with the terms per the respective initial offerings.
|
(In millions)
|
Aggregate Principal Amount
|
|||
|
HVF II Series 2015-2 Class D Notes
|
$
|
15
|
|
|
|
HVF II Series 2015-3 Class D Notes
|
21
|
|
||
|
HVF II Series 2016-1 Class D Notes
|
27
|
|
||
|
HVF II Series 2016-2 Class D Notes
|
34
|
|
||
|
HVF II Series 2016-3 Class D Notes
|
24
|
|
||
|
HVF II Series 2016-4 Class D Notes
|
24
|
|
||
|
Total
|
$
|
145
|
|
|
111
HERTZ GLOBAL HOLDINGS, INC. AND SUBSIDIARIES
THE HERTZ CORPORATION AND SUBSIDIARIES
NOTES TO CONSOLIDATED FINANCIAL STATEMENTS (Continued)
HVF II Series 2017-1 Notes and HVF II Series 2017-2 Notes:
In September 2017, HVF II issued the Series 2017-1 Rental Car Asset Backed Notes, Class A, Class B, Class C, and Class D in an aggregate principal amount of
$450 million
and the Series 2017-2 Rental Car Asset Backed Notes, Class A, Class B, Class C, and Class D in an aggregate principal amount of
$370 million
.
HVF II Series 2018-1 Notes
: In January 2018, HVF II issued the Series 2018-1 Rental Car Asset Backed Notes, Class A, Class B, Class C and Class D in an aggregate principal amount of
$1.1 billion
.
HVF II Series 2018-2 Notes and HVF II Series 2018-3 Notes
: In June 2018, HVF II issued the Series 2018-2 Rental Car Asset Backed Notes, Class A, Class B, Class C and Class D and the Series 2018-3 Rental Car Asset Backed Notes, Class A, Class B, Class C and Class D each in an aggregate principal amount of
$213 million
.
HVF II Various Series 2017 and 2018 Class D Notes:
At the time of the respective HVF II initial offering disclosed above, an affiliate of HVF II purchased the Class D Notes. Accordingly, the related principal amounts below are eliminated in consolidation as of December 31, 2018.
|
(In millions)
|
Aggregate Principal Amount
|
|||
|
HVF II Series 2017-2 Class D Notes
|
$
|
20
|
|
|
|
HVF II Series 2018-1 Class D Notes
|
58
|
|
||
|
HVF II Series 2018-2 Class D Notes
|
13
|
|
||
|
HVF II Series 2018-3 Class D Notes
|
13
|
|
||
|
Total
|
$
|
104
|
|
|
HVF II Series 2019-1 Notes:
In February 2019, HVF II issued the Series 2019-1 Rental Car Asset Backed Notes, Class A, Class B, Class C and Class D in an aggregate principal amount of
$745 million
. An affiliate of HVF II purchased the Class D Notes of each such series at the time of issuance, and as a result,
$45 million
of the aggregate principal amount will be eliminated in consolidation.
Donlen ABS Program
Hertz Vehicle Lease Funding LP, a bankruptcy remote, indirect, wholly-owned, special purpose subsidiary of Donlen ("HFLF") is the issuer under the Donlen U.S. ABS Program. HFLF has entered into a base indenture that permits it to issue term and revolving vehicle lease asset-backed securities. Donlen utilizes the HFLF securitization platform to finance its U.S. vehicle leasing operations. The notes issued by HFLF are ultimately backed by a special unit of beneficial interest in a pool of leases and the related vehicles.
References to the “Donlen ABS Program” include HFLF’s Variable Funding Notes together with HFLF’s Medium Term Notes.
HFLF Variable Funding Notes
HFLF Series 2013-2 Notes:
In connection with the establishment of the HFLF financing platform, in September 2013, HFLF executed a committed financing arrangement with an aggregate maximum principal amount of
$500 million
as upsized.
In February 2019, HFLF amended the HFLF Series 2013-2 Notes to extend the end of the revolving period from March 2020 to March 2021.
HFLF Medium Term Notes
HFLF Series 2015-1 Notes:
In June 2015, HFLF issued
$300 million
in aggregate principal amount of Series 2015-1 Floating Rate Asset Backed Notes, Class A, Class B, Class C, Class D and Class E. The HFLF Series 2015-1 Notes are floating rate and carry an interest rate based upon a spread to one-month LIBOR.
112
HERTZ GLOBAL HOLDINGS, INC. AND SUBSIDIARIES
THE HERTZ CORPORATION AND SUBSIDIARIES
NOTES TO CONSOLIDATED FINANCIAL STATEMENTS (Continued)
HFLF Series 2016-1 Notes:
In April 2016, HFLF issued the Series 2016-1 Asset Backed Notes, Class A, Class B, Class C, Class D and Class E in an aggregate principal amount of
$400 million
. The HFLF Series 2016-1 Notes (other than the Class A-2 Notes which are fixed rate) are floating rate and carry an interest rate based upon a spread to one-month LIBOR. The interest terms, maturity, and subordination of the notes sold to third parties remained consistent with the terms per the initial offering.
HFLF Series 2017-1 Notes:
In April 2017, HFLF issued the Series 2017-1 Asset Backed Notes, Class A, Class B, Class C, Class D and Class E in an aggregate principal amount of
$500 million
. The HFLF Series 2017-1 Notes are fixed rate, except for the Class A-1 Notes which are floating rate and carry an interest rate based upon a spread to one-month LIBOR.
HFLF Series 2018-1 Notes
: In May 2018, HFLF issued the Series 2018-1 Asset Backed Notes, Class A, Class B, Class C, Class D and Class E in an aggregate principal amount of
$550 million
. The HFLF Series 2018-1 Notes are fixed rate, except for the Class A-1 Notes which are floating rate and carry an interest rate based upon a spread to one-month LIBOR. A portion of the net proceeds from the issuance of the HFLF Series 2018-1 Notes were used to reduce amounts outstanding under the HFLF Series 2013-2 Notes.
Vehicle Debt-Other
U.S. Vehicle Revolving Credit Facility
In June 2016, in connection with the Spin-Off, Hertz executed a U.S. Vehicle Revolving Credit Facility of
$200 million
(the “U.S. Vehicle RCF”). Eligible vehicle collateral for the U.S. Vehicle RCF includes retail vehicle sales inventory, certain vehicles in Hawaii and Kansas and other vehicles owned by certain of the Company’s U.S. operating companies.
As of December 31, 2018, the U.S. Vehicle RCF consists of a
$146 million
revolving credit facility.
European Revolving Credit Facility
In March 2018, HHN BV amended the European Revolving Credit Facility to provide for aggregate maximum borrowing capacity of up to
€438 million
during the peak rental season (subject to borrowing base availability), for a seasonal commitment period through October 2018, at which time the European Revolving Credit Facility was terminated, in connection with the establishment of the European ABS.
European Vehicle Notes
The European Vehicle Notes are the primary vehicle financing for the Company's vehicle rental operations in Italy, Belgium and Luxembourg and finances a portion of its assets in the United Kingdom, France, The Netherlands, Spain and Germany. The agreements governing the European Vehicle Notes contain covenants that apply to the Hertz credit group similar to those for the Senior Notes. The terms of the European Vehicle Notes permit HHN BV to incur additional indebtedness that would be pari passu with the European Vehicle Notes.
In September 2016, HHN BV issued the
4.125%
Senior Notes due October 2021 in an aggregate original principal amount of
€225 million
.
In March 2018, HHN BV issued
5.50%
Senior Notes due
March 2023
in an aggregate original principal amount of
€500 million
(the "2023 Notes"). A portion of the net proceeds from the issuance of the 2023 Notes were used in April 2018 to fully redeem all
€425 million
of HHN BV's
4.375%
Senior Notes due January 2019.
European Securitization
In October 2018, the European Securitization was terminated in connection with the establishment of the European ABS.
113
HERTZ GLOBAL HOLDINGS, INC. AND SUBSIDIARIES
THE HERTZ CORPORATION AND SUBSIDIARIES
NOTES TO CONSOLIDATED FINANCIAL STATEMENTS (Continued)
European ABS
In October 2018, International Fleet Financing No.2 B.V (“IFF No. 2”), a special purpose entity which is intended to be bankruptcy remote, issued variable funding rental car asset-backed notes that permit borrowings by IFF No. 2 on a revolving basis in an aggregate amount up to
€1.0 billion
with a term of
two
years ("European ABS"). The European ABS is the primary vehicle financing facility for the Company's vehicle rental operations in France, the Netherlands, Germany and Spain. The lenders under the European ABS have been granted a security interest in the owned rental vehicles used in the Company's vehicle rental operations in these countries and certain contractual rights related to such vehicles.
In connection with the establishment of the European ABS, the Company terminated the European Revolving Credit Facility and the European Securitization.
Canadian Securitization
In September 2015, Hertz established a new securitization platform (the “Canadian Securitization”) designed to facilitate its financing activities relating to the vehicles used by Hertz in the Canadian daily vehicle rental operations. The lenders under the Canadian Securitization have been granted a security interest primarily in the owned rental vehicles used in the Company's vehicle rental operations in Canada and certain contractual rights related to such vehicles as well as certain other assets owned by the Hertz entities connected to the financing. TCL Funding Limited Partnership, a bankruptcy remote, indirect, wholly-owned, special purpose subsidiary of Hertz (“Funding LP”), is the issuer under the Canadian Securitization. In connection with the establishment of the Canadian Securitization, Funding LP issued the Series 2015-A Variable Funding Rental Car Asset Backed Notes (the “Funding LP Series 2015-A Notes”) that provided for aggregate maximum borrowings of CAD
$350 million
on a revolving basis.
In May 2018, Funding LP amended the Canadian Securitization to provide for aggregate maximum borrowing capacity (subject to borrowing base availability) of up to CAD
$410 million
during the peak rental season, for a seasonal commitment period through
October 2018
. Following the expiration of the seasonal commitment period, aggregate maximum borrowings available under the Funding LP Series 2015-A Notes reverted to CAD
$350 million
(subject to borrowing base availability).
Australian Securitization
In November 2010, HA Fleet Pty Limited, an indirect wholly-owned subsidiary of Hertz entered into a facility agreement that provided for aggregate maximum borrowings of AUD
$250 million
on a revolving basis under an asset-backed securitization facility (the “Australian Securitization”). The Australian Securitization is the primary fleet financing for Hertz's vehicle rental operations in Australia. The lender under the Australian Securitization has been granted a security interest primarily in the owned rental vehicles used in its vehicle rental operations in Australia and certain contractual rights related to such vehicles.
In November 2017, HA Fleet Pty Limited amended the Australian Securitization to extend the maturity of AUD
$250 million
aggregate maximum available borrowings from July 2018 to March 2020.
New Zealand Revolving Credit Facility
In September 2016, Hertz New Zealand Holdings Limited, an indirect wholly-owned subsidiary of Hertz, entered into a credit agreement that provided for aggregate maximum borrowings of NZD
$60 million
on a revolving basis under an asset-based revolving credit facility (the “New Zealand RCF”). The New Zealand RCF is the primary vehicle financing facility for its vehicle rental operations in New Zealand.
In November 2017, Hertz New Zealand Holdings Limited amended the New Zealand Revolving Credit Facility to extend the maturity of NZD
$60 million
from September 2018 to March 2020.
114
HERTZ GLOBAL HOLDINGS, INC. AND SUBSIDIARIES
THE HERTZ CORPORATION AND SUBSIDIARIES
NOTES TO CONSOLIDATED FINANCIAL STATEMENTS (Continued)
U.K. Financing Facility
In May 2018, Hertz U.K. Limited amended its credit agreement ("U.K. Financing Facility") to provide for aggregate maximum borrowing capacity (subject to asset availability) of up to £
287.5 million
during the peak rental season, and in July 2018, the U.K. Financing Facility was further amended to provide for aggregate maximum borrowing capacity (subject to asset availability) of up to £
300 million
during the peak rental season, for a seasonal commitment period through
September 2018
. Following the expiration of the seasonal commitment period, aggregate maximum borrowings available under the U.K. Financing Facility reverted to £
250 million
(subject to asset availability).
Loss on Extinguishment of Debt
The Company incurred losses in the form of early redemption premiums and/or the write-off of deferred financing costs associated with the redemptions and terminations described above. Losses on extinguishment of debt are presented in vehicle and non-vehicle interest expense, net, as applicable in the accompanying statements of operations. The following table reflects the amount of losses for each respective redemption/termination:
|
Years Ended December 31,
|
||||||||||||
|
Redemption/Termination (In millions)
|
2018
|
2017
|
2016
|
|||||||||
|
Non-Vehicle Debt:
|
||||||||||||
|
Senior Term Facilities
|
$
|
—
|
|
$
|
—
|
|
$
|
15
|
|
|||
|
Senior RCF
|
—
|
|
7
|
|
—
|
|
||||||
|
4.25% Senior Notes due April 2018
|
—
|
|
6
|
|
—
|
|
||||||
|
7.50% Senior Notes due October 2018
|
—
|
|
—
|
|
18
|
|
||||||
|
6.75% Senior Notes due April 2019
|
—
|
|
—
|
|
16
|
|
||||||
|
Total Non-Vehicle Debt
|
—
|
|
13
|
|
49
|
|
||||||
|
Vehicle Debt:
|
||||||||||||
|
HVF II Series 2014-A
|
—
|
|
—
|
|
6
|
|
||||||
|
HVF II Series 2017-A
|
2
|
|
—
|
|
—
|
|
||||||
|
4.375% European Vehicle Notes due 2019
|
20
|
|
—
|
|
—
|
|
||||||
|
Total Vehicle Debt
|
22
|
|
—
|
|
6
|
|
||||||
|
Total Loss on Extinguishment of Debt
|
$
|
22
|
|
$
|
13
|
|
$
|
55
|
|
|||
Maturities
At
December 31, 2018
, the nominal amounts of maturities of debt for each of the years ending December 31 are as follows:
|
(In millions)
|
2019
|
2020
|
2021
|
2022
|
2023
|
After 2023
|
|||||||||||||||||
|
Non-Vehicle Debt
|
$
|
16
|
|
$
|
714
|
|
$
|
515
|
|
$
|
1,764
|
|
$
|
619
|
|
$
|
827
|
|
|||||
|
Vehicle Debt
|
1,597
|
|
6,412
|
|
1,813
|
|
352
|
|
1,771
|
|
—
|
|
|||||||||||
|
Total
|
$
|
1,613
|
|
$
|
7,126
|
|
$
|
2,328
|
|
$
|
2,116
|
|
$
|
2,390
|
|
$
|
827
|
|
|||||
The Company is highly leveraged and a substantial portion of its liquidity requirements arise from servicing its indebtedness and from funding its operations, including purchases of revenue earning vehicles, and funding non-vehicle capital expenditures. The Company’s practice is to maintain sufficient liquidity through cash from operations, credit facilities and other financing arrangements, to mitigate any adverse impact on its operations resulting from adverse financial market conditions.
As of
December 31, 2018
,
$1.6 billion
of vehicle debt and
$16 million
of non-vehicle debt was due to mature in
2019
. The Company has reviewed its debt facilities and determined that it is probable that the Company will be able, and has the intent, to refinance these facilities at such times as the Company determines appropriate prior to their respective
115
HERTZ GLOBAL HOLDINGS, INC. AND SUBSIDIARIES
THE HERTZ CORPORATION AND SUBSIDIARIES
NOTES TO CONSOLIDATED FINANCIAL STATEMENTS (Continued)
maturities. Also, as of
December 31, 2018
, the Company was in compliance with its financial maintenance covenant under the Senior RCF and the Letter of Credit Facility, see "Covenant Compliance" below.
Borrowing Capacity and Availability
Borrowing capacity and availability comes from the Company's "revolving credit facilities," which are a combination of variable funding asset-backed securitization facilities, cash-flow-based revolving credit facilities, asset-based revolving credit facilities and the Letter of Credit Facility. Creditors under each such asset-backed securitization facility and asset-based revolving credit facility have a claim on a specific pool of assets as collateral. The Company's ability to borrow under each such asset-backed securitization facility and asset-based revolving credit facility is a function of, among other things, the value of the assets in the relevant collateral pool. With respect to each such asset-backed securitization facility and asset-based revolving credit facility, the Company refers to the amount of debt it can borrow given a certain pool of assets as the borrowing base.
The Company refers to "Remaining Capacity" as the maximum principal amount of debt permitted to be outstanding under the respective facility (i.e., with respect to a variable funding asset-backed securitization facility or asset-based revolving credit facility, the amount of debt the Company could borrow assuming it possessed sufficient assets as collateral) less the principal amount of debt then-outstanding under such facility. With respect to a variable funding asset-backed securitization facility or asset-based revolving credit facility, the Company refers to "Availability Under Borrowing Base Limitation" as the lower of Remaining Capacity or the borrowing base less the principal amount of debt then-outstanding under such facility (i.e., the amount of debt that can be borrowed given the collateral possessed at such time). With respect to the Senior RCF and the Letter of Credit Facility, "Availability Under Borrowing Base Limitation" is the same as "Remaining Capacity" since borrowings under the Senior RCF and availability for issuances of letters of credit under the Letter of Credit Facility are not subject to a borrowing base.
The following facilities were available to the Company as of
December 31, 2018
and are presented net of any outstanding letters of credit:
|
(In millions)
|
Remaining
Capacity |
Availability Under
Borrowing Base Limitation |
|||||
|
Non-Vehicle Debt
|
|||||||
|
Senior RCF
|
$
|
496
|
|
$
|
496
|
|
|
|
Letter of Credit Facility
|
3
|
|
3
|
|
|||
|
Total Non-Vehicle Debt
|
499
|
|
499
|
|
|||
|
Vehicle Debt
|
|
|
|||||
|
U.S. Vehicle RCF
|
—
|
|
—
|
|
|||
|
HVF II U.S. Vehicle Variable Funding Notes
|
725
|
|
—
|
|
|||
|
HFLF Variable Funding Notes
|
180
|
|
19
|
|
|||
|
European ABS
|
543
|
|
69
|
|
|||
|
Canadian Securitization
|
37
|
|
—
|
|
|||
|
Australian Securitization
|
21
|
|
—
|
|
|||
|
U.K. Financing Facility
|
73
|
|
—
|
|
|||
|
New Zealand RCF
|
—
|
|
—
|
|
|||
|
Total Vehicle Debt
|
1,579
|
|
88
|
|
|||
|
Total
|
$
|
2,078
|
|
$
|
587
|
|
|
Letters of Credit
In November 2017, Hertz entered into a credit agreement with respect to the Letter of Credit Facility. At Hertz’s option and subject to certain conditions, Hertz may request the issuing banks party to the Letter of Credit Facility to issue letters of credit for itself and on behalf of certain of Hertz’s domestic subsidiaries. The Letter of Credit Facility consists of
$400 million
of commitments from the issuing banks party thereto. Availability under the Letter of Credit Facility will
116
HERTZ GLOBAL HOLDINGS, INC. AND SUBSIDIARIES
THE HERTZ CORPORATION AND SUBSIDIARIES
NOTES TO CONSOLIDATED FINANCIAL STATEMENTS (Continued)
be limited to an amount equal to the amount of commitments terminated under the Senior RCF. The Letter of Credit Facility will mature on June 30, 2021.
As of
December 31, 2018
, there were outstanding standby letters of credit totaling
$677 million
. Such letters of credit have been issued primarily to support the Company's insurance programs, vehicle rental concessions and leaseholds as well as to provide credit enhancement for its asset-backed securitization facilities. Of this amount,
$366 million
was issued under the Senior RCF and
$302 million
were issued under the Letter of Credit Facility. As of
December 31, 2018
, none of the issued letters of credit have been drawn upon.
Special Purpose Entities
Substantially all of the Company's revenue earning vehicles and certain related assets are owned by special purpose entities or are encumbered in favor of the lenders under the various credit facilities, other secured financings and asset-backed securities programs. None of such assets (including the assets owned by Hertz Vehicle Financing II LP, HVF II GP Corp., Hertz Vehicle Financing LLC, Rental Car Finance LLC, DNRS II LLC, HFLF, Donlen Trust and various international subsidiaries that facilitate the Company's international securitizations) are available to satisfy the claims of general creditors.
The Company has a
25%
ownership interest in IFF No. 2, whose sole purpose is to provide commitments to lend in various currencies subject to borrowing bases comprised of revenue earning vehicles and related assets of certain of Hertz International, Ltd.'s subsidiaries. IFF No. 2 is a variable interest entity and the Company is the primary beneficiary, therefore, the assets, liabilities, and results of operations of IFF No. 2 are included in the Company's consolidated financial statements. As of
December 31, 2018 and 2017
, IFF No. 2 had total assets of
$946 million
and
$524 million
, respectively, primarily comprised of loans receivable, and total liabilities of
$946 million
and
$524 million
, respectively, primarily comprised of debt.
Covenant Compliance
Hertz and its subsidiaries are referred to as the Hertz credit group. The indentures for the Senior Notes and the Senior Second Priority Secured Notes contain covenants that, among other things, limit or restrict the ability of the Hertz credit group to incur additional indebtedness, incur guarantee obligations, prepay certain indebtedness, make certain restricted payments (including paying dividends, redeeming stock or making other distributions to parent entities of Hertz and other persons outside of the Hertz credit group), make investments, create liens, transfer or sell assets, merge or consolidate, and enter into certain transactions with Hertz's affiliates that are not members of the Hertz credit group.
Certain of the Company's other debt instruments and credit facilities (including the Senior Facilities and Letter of Credit Facility) contain a number of covenants that, among other things, limit or restrict the ability of the borrowers and the guarantors to dispose of assets, incur additional indebtedness, incur guarantee obligations, prepay certain indebtedness, make certain restricted payments (including paying dividends, share repurchases or making other distributions), create liens, make investments, make acquisitions, engage in mergers, fundamentally change the nature of their business, make capital expenditures, or engage in certain transactions with certain affiliates. The Senior RCF and the Letter of Credit Facility contain a financial maintenance covenant that is only applicable to such facilities. This financial covenant and related components of its computation are defined in the credit agreements related to such facilities.
The credit agreements governing the Company's Senior Facilities and Letter of Credit Facility require Hertz upon a change of control, as defined therein, to make an offer to repay in full all amounts outstanding thereunder upon such a change of control. The Company's failure to make such an offer would result in an event of default thereunder. In addition, the indentures governing the Company's Senior Notes and Senior Second Priority Secured Notes require Hertz upon a change of control, as defined therein, to make an offer to repurchase all of such outstanding Senior Notes and Senior Second Priority Secured Notes at a price equal to
101%
of the principal amount, together with any accrued and unpaid interest. If Hertz failed to repurchase the Senior Notes and Senior Second Priority Secured Notes, Hertz would be in default under the related indenture. Certain of the Company's other indebtedness also could result in defaults and/or amortization events upon the occurrence of certain change of control events, as defined therein.
117
HERTZ GLOBAL HOLDINGS, INC. AND SUBSIDIARIES
THE HERTZ CORPORATION AND SUBSIDIARIES
NOTES TO CONSOLIDATED FINANCIAL STATEMENTS (Continued)
The financial covenant provides that Hertz’s consolidated first lien net leverage ratio, as defined in the credit agreements governing the Senior RCF and the Letter of Credit Facility, as of the last day of any fiscal quarter may not exceed a ratio of
3.00
to
1.00
(the "Covenant Leverage Ratio"). As of
December 31, 2018
, Hertz was in compliance with the Covenant Leverage Ratio.
Accrued Interest
As of
December 31, 2018 and 2017
, accrued interest was
$73 million
and
$71 million
, respectively, which is included within the accompanying consolidated balance sheets in accrued liabilities.
Restricted Net Assets
As a result of the contractual restrictions on Hertz's or its subsidiaries' ability to pay dividends (directly or indirectly) under various terms of its debt, as of
December 31, 2018
, the restricted net assets of the subsidiaries of Hertz and Hertz Global exceed
25%
of their total consolidated net assets, respectively.
Note 8
—
Revenue from Contracts with Customers
As disclosed in the Revenue from Contracts with Customers section of
Note 2
, “
Significant Accounting Policies
” ("
Note 2
"), the Company adopted Topic 606 in accordance with the effective date on January 1, 2018.
Note 2
includes disclosures regarding the Company’s method of adoption and the impact on the Company’s financial position, results of operations and cash flows. In the Leases section of
Note 2
, the Company discloses that it has concluded that revenue earned from vehicle rentals, and from other forms of rental related activities wherein an identified asset is transferred to the customer and the customer has the ability to control that asset, will be accounted for under Topic 842 upon its adoption. Until the Company adopts Topic 842, vehicle rental and rental related revenues are recognized in accordance with Topic 606.
The Company operates at airport rental locations in the U.S. and internationally ("airport") and at off airport locations also in the U.S. and internationally ("off airport"). For the Company's airport company-operated rental locations, the Company has obtained concessions or similar leasing agreements or arrangements, granting it the right to conduct a vehicle rental business at the respective airport. The terms of an airport concession typically require the Company to pay the airport's operator concession fees based upon a specified percentage of the revenues it generates at the airport, subject to a minimum annual guarantee. The terms of the Company's concessions typically do not forbid it from seeking, and in a few instances require it to seek, reimbursement from customers for concession fees it pays; however, in certain jurisdictions the law limits or forbids the Company from doing so. Where the Company is required or permitted to seek such reimbursement, it is its general practice to do so. The Company's airport rental customers are typically airline travelers; whereas the Company's off airport rental customers include people who prefer to rent vehicles closer to their home or place of work for business or leisure purposes, as well as those needing to travel to or from airports. The Company's off airport customers also include people who have been referred by, or whose rental costs are being wholly or partially reimbursed by, insurance companies following accidents in which their vehicles were damaged, those expecting to lease vehicles that are not yet available from their leasing companies and replacement renters. In addition, the Company's off airport customers include drivers for transportation network companies ("TNC").
118
HERTZ GLOBAL HOLDINGS, INC. AND SUBSIDIARIES
THE HERTZ CORPORATION AND SUBSIDIARIES
NOTES TO CONSOLIDATED FINANCIAL STATEMENTS (Continued)
The following table presents revenues from contracts with customers by reportable segment and disaggregated by product/service and type of location and customer:
|
Year Ended December 31, 2018
|
|||||||||||||||
|
(In millions)
|
U.S. Rental Car
|
International Rental Car
|
All Other Operations
|
Consolidated
|
|||||||||||
|
Vehicle rental and rental related:
|
|||||||||||||||
|
Airport
|
$
|
4,465
|
|
$
|
1,288
|
|
$
|
—
|
|
$
|
5,753
|
|
|||
|
Off airport
|
1,881
|
|
842
|
|
—
|
|
2,723
|
|
|||||||
|
Total vehicle rental and rental related
|
6,346
|
|
2,130
|
|
—
|
|
8,476
|
|
|||||||
|
Other:
|
|||||||||||||||
|
Licensee revenue
|
32
|
|
145
|
|
—
|
|
177
|
|
|||||||
|
Ancillary retail vehicle sales
|
102
|
|
1
|
|
—
|
|
103
|
|
|||||||
|
Fleet management
|
—
|
|
—
|
|
45
|
|
45
|
|
|||||||
|
Total other
|
134
|
|
146
|
|
45
|
|
325
|
|
|||||||
|
Total revenue from contracts with customers
|
$
|
6,480
|
|
$
|
2,276
|
|
$
|
45
|
|
$
|
8,801
|
|
|||
The Company recognizes receivables and liabilities resulting from its contracts with customers. Contract receivables primarily consist of receivables from customers for vehicle rentals. Contract liabilities primarily consist of obligations to customers for prepaid vehicle rentals and related to the Company’s points-based loyalty programs.
The contract liability balance as of
December 31, 2018
is
$341 million
and is included in accrued liabilities in the accompanying consolidated balance sheet. The contract liability as of January 1, 2018, after giving effect to the adoption of Topic 606, was
$345 million
and revenue recognized during the
year ended
December 31, 2018
for such contract liabilities is
$127 million
. Additionally, the Company elected to apply the practical expedient where the value of unsatisfied performance obligations for sales-based royalty fees from franchisees is not disclosed.
During the
year ended
December 31, 2018
, based on the net impact of loyalty points earned and redeemed by customers, the Company recorded a net revenue deferral of
$7 million
. As of
December 31, 2018
, the value of unredeemed loyalty points is
$272 million
, which is recorded as a contract liability in accrued liabilities in the accompanying consolidated balance sheet.
Note 9
—
Employee Retirement Benefits
The Company sponsors multiple domestic and international employee benefit plans. Benefits are based upon years of service and compensation. The Hertz Corporation Account Balance Defined Benefit Pension Plan (the “Hertz Retirement Plan”) is a U.S. cash balance plan which was amended in 2014 to permanently discontinue future benefit accruals and participation under the plan for non-union employees. Some of the Company’s international subsidiaries have defined benefit retirement plans or participate in various insured or multiemployer plans. In certain countries, when the subsidiaries make the required funding payments, they have no further obligations under such plans. The Company's benefit plans are generally funded, except for certain nonqualified U.S. defined benefit plans and in Germany and France, where unfunded liabilities are recorded. The Company also sponsors defined contribution plans for certain eligible U.S. and non-U.S. employees, where contributions are matched based on specific guidelines in the plans.
The Company also sponsors postretirement health care and life insurance benefits for a limited number of employees with hire dates prior to January 1, 1990.
Management makes certain assumptions relating to discount rates, salary growth, long-term return on plan assets, retirement rates, mortality rates and other factors when determining amounts to be recognized. These assumptions are reviewed annually by management, assisted by the enrolled actuary, and updated as warranted. The Company uses a December 31 measurement date for all of the plans and utilizes fair value to calculate the market-related value
119
HERTZ GLOBAL HOLDINGS, INC. AND SUBSIDIARIES
THE HERTZ CORPORATION AND SUBSIDIARIES
NOTES TO CONSOLIDATED FINANCIAL STATEMENTS (Continued)
of pension assets for purposes of determining the expected return on plan assets and accounting for asset gains and losses.
Actual results that differ from the Company's assumptions are accumulated and amortized over future periods and, therefore, significant differences in actual experience or significant changes in assumptions would affect the Company's pension costs and obligations. The Company recognizes an asset for each overfunded plan and a liability for each underfunded plan in the consolidated balance sheets. Pension plan liabilities are revalued annually based on updated assumptions and information about the individuals covered by the plan. For pension plans, if accumulated actuarial gains and losses are in excess of a 10 percent corridor, the excess is amortized on a straight-line basis over the average remaining service period of active participants. Prior service cost and the transition asset are amortized on a straight-line basis from the date recognized over the average remaining service period of active participants, when applicable.
Employee Matters Agreement
As described in
Note 3
, "
Discontinued Operations
," Hertz Global and Herc Holdings entered into the Employee Matters Agreement to allocate liabilities and responsibilities relating to employment matters, employee compensation, benefit plans and programs and other related matters in connection with the Spin-Off. The Employee Matters Agreement governs the Company's and Herc Holdings’ obligations with respect to such matters for current and former employees of the vehicle rental business and the equipment rental business. The Employee Matters Agreement specifies the method by which the pension plans are split in connection with the Spin-Off. Pension liabilities and an associated asset allocation related to employees of the equipment rental business were transferred to a new plan. The pension asset allocation was completed in 2017.
120
HERTZ GLOBAL HOLDINGS, INC. AND SUBSIDIARIES
THE HERTZ CORPORATION AND SUBSIDIARIES
NOTES TO CONSOLIDATED FINANCIAL STATEMENTS (Continued)
The following tables set forth the funded status and the net periodic pension cost of the Hertz Retirement Plan and other U.S. based retirement plans, other postretirement benefit plans including health care and life insurance plans covering domestic (“U.S.”) employees and the retirement plans for international operations (“Non-U.S.”), together with amounts included in the accompanying consolidated balance sheets and statements of operations:
|
Pension Benefits
|
Postretirement
|
||||||||||||||||||||||
|
U.S.
|
Non-U.S.
|
Benefits (U.S.)
|
|||||||||||||||||||||
|
(In millions)
|
2018
|
2017
|
2018
|
2017
|
2018
|
2017
|
|||||||||||||||||
|
Change in Benefit Obligation
|
|||||||||||||||||||||||
|
Benefit obligation as of January 1
|
$
|
555
|
|
$
|
538
|
|
$
|
279
|
|
$
|
257
|
|
$
|
14
|
|
$
|
14
|
|
|||||
|
Service cost
|
1
|
|
1
|
|
1
|
|
1
|
|
—
|
|
—
|
|
|||||||||||
|
Interest cost
|
19
|
|
21
|
|
7
|
|
6
|
|
1
|
|
1
|
|
|||||||||||
|
Employee contributions
|
—
|
|
—
|
|
—
|
|
—
|
|
—
|
|
—
|
|
|||||||||||
|
Plan amendments
|
—
|
|
—
|
|
1
|
|
—
|
|
—
|
|
—
|
|
|||||||||||
|
Plan curtailments
|
—
|
|
(1
|
)
|
—
|
|
—
|
|
—
|
|
—
|
|
|||||||||||
|
Plan settlements
|
(31
|
)
|
(2
|
)
|
—
|
|
—
|
|
—
|
|
—
|
|
|||||||||||
|
Benefits paid
|
(4
|
)
|
(22
|
)
|
(6
|
)
|
(8
|
)
|
(1
|
)
|
(2
|
)
|
|||||||||||
|
Foreign currency exchange rate translation
|
—
|
|
—
|
|
(13
|
)
|
27
|
|
—
|
|
—
|
|
|||||||||||
|
Actuarial loss (gain)
|
(23
|
)
|
20
|
|
(23
|
)
|
(4
|
)
|
(2
|
)
|
1
|
|
|||||||||||
|
Transfers in connection with the Spin-Off
|
(1
|
)
|
—
|
|
—
|
|
—
|
|
—
|
|
—
|
|
|||||||||||
|
Benefit obligation as of December 31
|
$
|
516
|
|
$
|
555
|
|
$
|
246
|
|
$
|
279
|
|
$
|
12
|
|
$
|
14
|
|
|||||
|
Change in Plan Assets
|
|||||||||||||||||||||||
|
Fair value of plan assets as of January 1
|
$
|
526
|
|
$
|
459
|
|
$
|
217
|
|
$
|
188
|
|
$
|
—
|
|
$
|
—
|
|
|||||
|
Actual return (loss) gain on plan assets
|
(42
|
)
|
84
|
|
(12
|
)
|
15
|
|
—
|
|
—
|
|
|||||||||||
|
Company contributions
|
5
|
|
3
|
|
4
|
|
4
|
|
1
|
|
2
|
|
|||||||||||
|
Employee contributions
|
—
|
|
—
|
|
—
|
|
—
|
|
—
|
|
—
|
|
|||||||||||
|
Plan settlements
|
(31
|
)
|
(2
|
)
|
—
|
|
—
|
|
—
|
|
—
|
|
|||||||||||
|
Benefits paid
|
(4
|
)
|
(22
|
)
|
(6
|
)
|
(8
|
)
|
(1
|
)
|
(2
|
)
|
|||||||||||
|
Foreign currency exchange rate translation
|
—
|
|
—
|
|
(11
|
)
|
18
|
|
—
|
|
—
|
|
|||||||||||
|
Transfers in connection with the Spin-Off
|
—
|
|
—
|
|
—
|
|
—
|
|
—
|
|
—
|
|
|||||||||||
|
Amounts associated with the Spin-Off
|
(2
|
)
|
4
|
|
—
|
|
—
|
|
—
|
|
—
|
|
|||||||||||
|
Fair value of plan assets as of December 31
|
$
|
452
|
|
$
|
526
|
|
$
|
192
|
|
$
|
217
|
|
$
|
—
|
|
$
|
—
|
|
|||||
|
Funded Status of the Plan
|
|
|
|||||||||||||||||||||
|
Plan assets less than benefit obligation
|
$
|
(64
|
)
|
$
|
(29
|
)
|
$
|
(54
|
)
|
$
|
(62
|
)
|
$
|
(12
|
)
|
$
|
(14
|
)
|
|||||
121
HERTZ GLOBAL HOLDINGS, INC. AND SUBSIDIARIES
THE HERTZ CORPORATION AND SUBSIDIARIES
NOTES TO CONSOLIDATED FINANCIAL STATEMENTS (Continued)
|
Pension Benefits
|
Postretirement
|
||||||||||||||||||||||
|
U.S.
|
Non-U.S.
|
Benefits (U.S.)
|
|||||||||||||||||||||
|
($ in millions)
|
2018
|
2017
|
2018
|
2017
|
2018
|
2017
|
|||||||||||||||||
|
Amounts recognized in balance sheet:
|
|||||||||||||||||||||||
|
Prepaid expenses and other assets
|
$
|
—
|
|
$
|
—
|
|
$
|
21
|
|
$
|
17
|
|
$
|
—
|
|
$
|
—
|
|
|||||
|
Accrued liabilities
|
(64
|
)
|
(29
|
)
|
(75
|
)
|
(79
|
)
|
(12
|
)
|
(14
|
)
|
|||||||||||
|
Net obligation recognized in the balance sheet
|
$
|
(64
|
)
|
$
|
(29
|
)
|
$
|
(54
|
)
|
$
|
(62
|
)
|
$
|
(12
|
)
|
$
|
(14
|
)
|
|||||
|
Prior service credit
|
$
|
—
|
|
$
|
—
|
|
(1
|
)
|
$
|
—
|
|
—
|
|
$
|
—
|
|
|||||||
|
Net gain (loss)
|
(87
|
)
|
(43
|
)
|
(58
|
)
|
(62
|
)
|
1
|
|
(1
|
)
|
|||||||||||
|
Accumulated other comprehensive income (loss)
|
(87
|
)
|
(43
|
)
|
(59
|
)
|
(62
|
)
|
1
|
|
(1
|
)
|
|||||||||||
|
Funded/(Unfunded) accrued pension or postretirement benefit
|
23
|
|
14
|
|
5
|
|
—
|
|
(13
|
)
|
(13
|
)
|
|||||||||||
|
Net obligation recognized in the balance sheet
|
$
|
(64
|
)
|
$
|
(29
|
)
|
$
|
(54
|
)
|
$
|
(62
|
)
|
$
|
(12
|
)
|
$
|
(14
|
)
|
|||||
|
Total recognized in other comprehensive (income) loss
|
$
|
44
|
|
$
|
(43
|
)
|
$
|
(2
|
)
|
$
|
(4
|
)
|
$
|
(2
|
)
|
$
|
1
|
|
|||||
|
Total recognized in net periodic benefit cost and other comprehensive (income) loss
|
$
|
40
|
|
$
|
(43
|
)
|
$
|
(5
|
)
|
$
|
(5
|
)
|
$
|
(1
|
)
|
$
|
2
|
|
|||||
|
Estimated amounts that will be amortized from accumulated other comprehensive (income) loss over the next fiscal year:
|
|||||||||||||||||||||||
|
Net gain (loss)
|
$
|
5
|
|
$
|
(1
|
)
|
$
|
(1
|
)
|
$
|
(1
|
)
|
$
|
—
|
|
$
|
—
|
|
|||||
|
Accumulated Benefit Obligation as of December 31
|
$
|
516
|
|
$
|
554
|
|
$
|
245
|
|
$
|
278
|
|
N/A
|
|
N/A
|
|
|||||||
|
Weighted average assumptions as of December 31
|
|||||||||||||||||||||||
|
Discount rate
|
4.2
|
%
|
3.6
|
%
|
2.7
|
%
|
2.4
|
%
|
4.2
|
%
|
3.5
|
%
|
|||||||||||
|
Expected return on assets
|
6.3
|
%
|
6.3
|
%
|
4.9
|
%
|
5.2
|
%
|
N/A
|
|
N/A
|
|
|||||||||||
|
Average rate of increase in compensation
|
4.3
|
%
|
4.3
|
%
|
2.8
|
%
|
2.8
|
%
|
N/A
|
|
N/A
|
|
|||||||||||
|
Initial health care cost trend rate
|
N/A
|
|
N/A
|
|
N/A
|
|
N/A
|
|
6.1
|
%
|
6.4
|
%
|
|||||||||||
|
Ultimate health care cost trend rate
|
N/A
|
|
N/A
|
|
N/A
|
|
N/A
|
|
4.5
|
%
|
4.5
|
%
|
|||||||||||
|
Number of years to ultimate trend rate
|
N/A
|
|
N/A
|
|
N/A
|
|
N/A
|
|
20
|
|
21
|
|
|||||||||||
N/A - Not applicable
The discount rate used to determine the
December 31, 2018
and 2017 benefit obligations for U.S. pension plans is based on the rate from the Mercer Pension Discount Curve-Above Mean Yield that is appropriate for the duration of the Company's plan liabilities. For its plans outside the U.S., the discount rate reflects the market rates for an optimized subset of high-quality corporate bonds currently available. The discount rate in a country was determined based on a yield curve constructed from high quality corporate bonds in that country. The rate selected from the yield curve has a duration that matches its plan.
The expected return on plan assets for each funded plan is based on expected future investment returns considering the target investment mix of plan assets.
122
HERTZ GLOBAL HOLDINGS, INC. AND SUBSIDIARIES
THE HERTZ CORPORATION AND SUBSIDIARIES
NOTES TO CONSOLIDATED FINANCIAL STATEMENTS (Continued)
The following table sets forth the net periodic pension and postretirement (including health care, life insurance and auto) expense charged to net income (loss) from continuing operations:
|
|
Pension Benefits
|
Postretirement
Benefits (U.S.)
|
|||||||||||||||||||||||||||||||||
|
U.S.
|
Non-U.S.
|
||||||||||||||||||||||||||||||||||
|
|
Years Ended December 31,
|
||||||||||||||||||||||||||||||||||
|
($ in millions)
|
2018
|
2017
|
2016
|
2018
|
2017
|
2016
|
2018
|
2017
|
2016
|
||||||||||||||||||||||||||
|
Components of Net Periodic Pension and Postretirement (Expense) Benefit
|
|||||||||||||||||||||||||||||||||||
|
Service cost
|
$
|
1
|
|
$
|
1
|
|
$
|
2
|
|
$
|
1
|
|
$
|
1
|
|
$
|
1
|
|
$
|
—
|
|
$
|
—
|
|
$
|
—
|
|
||||||||
|
Interest cost
|
19
|
|
21
|
|
24
|
|
7
|
|
6
|
|
8
|
|
1
|
|
1
|
|
1
|
|
|||||||||||||||||
|
Expected return on plan assets
|
(28
|
)
|
(26
|
)
|
(32
|
)
|
(11
|
)
|
(10
|
)
|
(11
|
)
|
—
|
|
—
|
|
—
|
|
|||||||||||||||||
|
Net amortizations
|
1
|
|
3
|
|
6
|
|
1
|
|
2
|
|
—
|
|
—
|
|
—
|
|
—
|
|
|||||||||||||||||
|
Settlement loss
|
3
|
|
1
|
|
5
|
|
—
|
|
—
|
|
—
|
|
—
|
|
—
|
|
—
|
|
|||||||||||||||||
|
Net pension and postretirement expense (benefit)
|
$
|
(4
|
)
|
$
|
—
|
|
$
|
5
|
|
$
|
(2
|
)
|
$
|
(1
|
)
|
$
|
(2
|
)
|
$
|
1
|
|
$
|
1
|
|
$
|
1
|
|
||||||||
|
Weighted average discount rate for expense (January 1)
|
3.6
|
%
|
4.0
|
%
|
4.3
|
%
|
2.4
|
%
|
2.5
|
%
|
3.6
|
%
|
3.5
|
%
|
3.9
|
%
|
4.2
|
%
|
|||||||||||||||||
|
Weighted average assumed long-term rate of return on assets (January 1)
|
6.3
|
%
|
7.0
|
%
|
7.2
|
%
|
5.2
|
%
|
5.2
|
%
|
6.1
|
%
|
N/A
|
|
N/A
|
|
N/A
|
|
|||||||||||||||||
|
Initial health care cost trend rate
|
N/A
|
|
N/A
|
|
N/A
|
|
N/A
|
|
N/A
|
|
N/A
|
|
6.4
|
%
|
6.7
|
%
|
6.9
|
%
|
|||||||||||||||||
|
Ultimate health care cost trend rate
|
N/A
|
|
N/A
|
|
N/A
|
|
N/A
|
|
N/A
|
|
N/A
|
|
4.5
|
%
|
4.5
|
%
|
4.5
|
%
|
|||||||||||||||||
|
Number of years to ultimate trend rate
|
N/A
|
|
N/A
|
|
N/A
|
|
N/A
|
|
N/A
|
|
N/A
|
|
20
|
|
21
|
|
22
|
|
|||||||||||||||||
N/A - Not applicable
The net of tax loss in accumulated other comprehensive income (loss) as of
December 31, 2018 and 2017
relating to pension benefits of the Hertz Retirement Plan was
$115 million
and
$76 million
, respectively. Changing the assumed health care cost trend rates by one percentage point is not expected to have a material impact on the total of service and interest cost components or on the postretirement benefit obligation.
The provisions charged to net income (loss) from continuing operations for the years ended
December 31, 2018, 2017 and 2016
for all other pension plans were approximately
$10 million
,
$10 million
and
$9 million
, respectively.
Net pension and postretirement expense for the year ended December 31, 2016 includes a settlement loss of approximately
$5 million
relating to lump-sum distributions to participants primarily due to restructuring actions taken during the year.
The provisions charged to net income (loss) from continuing operations for the years ended
December 31, 2018, 2017 and 2016
for the defined contribution plans were approximately
$26 million
,
$23 million
and
$23 million
, respectively.
123
HERTZ GLOBAL HOLDINGS, INC. AND SUBSIDIARIES
THE HERTZ CORPORATION AND SUBSIDIARIES
NOTES TO CONSOLIDATED FINANCIAL STATEMENTS (Continued)
Plan Assets
The Company has a long-term investment outlook for the assets held in the Company sponsored plans, which is consistent with the long-term nature of each plan's respective liabilities. The Company has two major plans which reside in the U.S. and the United Kingdom.
The U.S. Plan
The U.S. Plan (the “Plan”) currently has a target asset allocation of
65%
equity and
35%
fixed income. The equity portion of the Plan is primarily invested in passively managed equity funds, along with international and emerging market funds that are actively managed. The fixed income portion of the Plan is actively managed by professional investment managers and is benchmarked to the Bloomberg Barclays U.S. Long Government/Credit Index. The Plan assumes a
6.3%
expected long-term annual weighted average rate of return on assets.
The fair value measurements of the Company's U.S. pension plan assets are based upon inputs that reflect quoted prices for identical assets or liabilities in active markets that are observable (Level 1) and significant observable inputs (Level 2) that reflect quoted prices for similar assets or liabilities in active markets. The fair value measurements of the U.S. pension plan assets relate to common collective trusts and other pooled investment vehicles consisting of the following asset categories:
|
(In millions)
|
December 31, 2018
|
December 31, 2017
|
|||||||||||||
|
Asset Category
|
Level 1
|
Level 2
|
Level 1
|
Level 2
|
|||||||||||
|
Cash
|
$
|
1
|
|
$
|
—
|
|
$
|
1
|
|
$
|
—
|
|
|||
|
Short Term Investments
|
—
|
|
3
|
|
—
|
|
2
|
|
|||||||
|
Equity Funds:
|
|
|
|||||||||||||
|
U.S. Large Cap
|
—
|
|
121
|
|
—
|
|
148
|
|
|||||||
|
U.S. Mid Cap
|
—
|
|
34
|
|
—
|
|
42
|
|
|||||||
|
U.S. Small Cap
|
—
|
|
27
|
|
—
|
|
33
|
|
|||||||
|
International Large Cap
|
—
|
|
76
|
|
—
|
|
87
|
|
|||||||
|
International Emerging Markets
|
—
|
|
23
|
|
—
|
|
26
|
|
|||||||
|
Asset-Backed Securities
|
—
|
|
8
|
|
—
|
|
8
|
|
|||||||
|
Fixed Income Securities:
|
|
|
|||||||||||||
|
U.S. Treasuries
|
—
|
|
51
|
|
—
|
|
53
|
|
|||||||
|
Corporate Bonds
|
—
|
|
82
|
|
—
|
|
96
|
|
|||||||
|
Government Bonds
|
—
|
|
8
|
|
—
|
|
10
|
|
|||||||
|
Municipal Bonds
|
—
|
|
11
|
|
—
|
|
12
|
|
|||||||
|
Real Estate (REITs)
|
—
|
|
7
|
|
—
|
|
8
|
|
|||||||
|
Total fair value of pension plan assets
|
$
|
1
|
|
$
|
451
|
|
1
|
|
525
|
|
|||||
124
HERTZ GLOBAL HOLDINGS, INC. AND SUBSIDIARIES
THE HERTZ CORPORATION AND SUBSIDIARIES
NOTES TO CONSOLIDATED FINANCIAL STATEMENTS (Continued)
The U.K. Plan
The Company's United Kingdom defined benefit pension plan (the "U.K. Plan") has a target allocation of
37.5%
actively managed multi-asset funds,
27.5%
passive equity funds and
35%
protection portfolio that consists of liability driven investments, Sterling liquidity fund and United Kingdom corporate bonds. The actively managed multi-asset funds are intended to deliver a long-term equity-like return but with reduced levels of volatility. The protection portfolio is designed to partially hedge the interest rate and inflation expectation exposure of the liabilities which are measured on a local regulatory basis. The amount that is required to be invested in each fund to maintain target hedge ratios will vary over time as the value of the liabilities changes and the allocations within the protection portfolio will be allowed to vary accordingly
.
All of the invested assets of the U.K. Plan are held via pooled funds managed by professional investment managers. The U.K. Plan assumes a
4.9%
expected long-term weighted average rate of return on assets for the Plan in total.
The Company's U.K. Plan accounts for
$186 million
of the
$192 million
in fair value of Non-U.S. plan assets as of
December 31, 2018
and accounts for
$211 million
of the
$217 million
in fair value of Non-U.S. plan assets as of December 31, 2017. The fair value measurements of the Company's U.K. Plan assets are based upon inputs that reflect quoted prices for identical assets or liabilities in active markets that are observable (Level 1) and significant observable inputs that reflect quoted prices for similar assets or liabilities in active markets (Level 2). The fair value measurements of the U.K. Plan assets relate to common collective trusts and other pooled investment vehicles consisting of the following asset categories:
|
(In millions)
|
December 31, 2018
|
December 31, 2017
|
|||||||||||||
|
Asset Category
|
Level 1
|
Level 2
|
Level 1
|
Level 2
|
|||||||||||
|
Actively Managed Multi-Asset Funds:
|
|||||||||||||||
|
Diversified Growth Funds
|
$
|
—
|
|
$
|
36
|
|
$
|
—
|
|
$
|
76
|
|
|||
|
Multi Asset Credit
|
—
|
|
32
|
|
—
|
|
—
|
|
|||||||
|
Passive Equity Funds:
|
|||||||||||||||
|
U.K. Equities
|
—
|
|
23
|
|
—
|
|
28
|
|
|||||||
|
Overseas Equities
|
—
|
|
28
|
|
—
|
|
33
|
|
|||||||
|
Passive Bond Funds:
|
|||||||||||||||
|
Corporate Bonds
|
—
|
|
21
|
|
—
|
|
23
|
|
|||||||
|
Index-Linked Gilts
|
—
|
|
—
|
|
—
|
|
—
|
|
|||||||
|
Liability Driven Investments
|
—
|
|
35
|
|
—
|
|
42
|
|
|||||||
|
Liquidity Fund
|
11
|
|
—
|
|
9
|
|
—
|
|
|||||||
|
Total fair value of pension plan assets
|
$
|
11
|
|
$
|
175
|
|
$
|
9
|
|
$
|
202
|
|
|||
Contributions
The Company's policy for funded plans is to contribute annually, at a minimum, amounts required by applicable laws, regulations and union agreements. From time to time, the Company makes contributions beyond those legally required. In
2018
and
2017
, the Company did not make any cash contributions to its U.S. qualified pension plan.
In
2018
and
2017
, the Company made contributions to its U.S. non-qualified pension plans of
$5 million
and
$3 million
, respectively. The Company made discretionary contributions of
$2 million
and
$3 million
to its U.K. Plan during the years ended
December 31, 2018
and
2017
, respectively.
The Company does not anticipate contributing to the U.S. qualified pension plan during
2019
. For the U.K. Plan the Company anticipates contributing
$3 million
during
2019
and does not anticipate contributing any significant amounts to its other international plans. The level of
2019
and future contributions will vary, and is dependent on a number of factors including investment returns, interest rate fluctuations, plan demographics, funding regulations and the results of the final actuarial valuation.
125
HERTZ GLOBAL HOLDINGS, INC. AND SUBSIDIARIES
THE HERTZ CORPORATION AND SUBSIDIARIES
NOTES TO CONSOLIDATED FINANCIAL STATEMENTS (Continued)
Estimated Future Benefit Payments
The following table presents estimated future benefit payments:
|
(In millions)
|
Pension Benefits
|
Postretirement
Benefits (U.S.) |
|||||
|
2019
|
$
|
46
|
|
$
|
1
|
|
|
|
2020
|
41
|
|
1
|
|
|||
|
2021
|
43
|
|
1
|
|
|||
|
2022
|
45
|
|
1
|
|
|||
|
2023
|
48
|
|
1
|
|
|||
|
After 2023
|
245
|
|
5
|
|
|||
|
$
|
468
|
|
$
|
10
|
|
||
Multiemployer Pension Plans
The Company contributes to several multiemployer defined benefit pension plans under collective bargaining agreements that cover certain of its union-represented employees. The risks of participating in such plans are different from the risks of single-employer plans, in the following respects:
|
a)
|
Assets contributed to a multiemployer plan by one employer may be used to provide benefits to employees of other participating employers.
|
|
b)
|
If a participating employer ceases to contribute to the plan, the unfunded obligations of the plan may be borne by the remaining participating employers.
|
|
c)
|
If the Company ceases to have an obligation to contribute to the multiemployer plan in which the Company had been a contributing employer, the Company may be required to pay to the plan an amount based on the underfunded status of the plan and on the history of its participation in the plan prior to the cessation of its obligation to contribute. The amount that an employer that has ceased to have an obligation to contribute to a multiemployer plan is required to pay to the plan is referred to as a withdrawal liability.
|
The Company's participation in multiemployer plans is outlined in the table below. For plans that are not individually significant to the Company, the total amount of contributions is presented in the aggregate.
|
|
EIN /Pension
Plan Number |
Pension
Protection Act
Zone Status
|
FIP /
RP Status Pending /Implemented (1) |
Contributions by
The Hertz Corporation
(In millions)
|
Surcharge Imposed
|
Expiration
Dates of Collective Bargaining Agreements |
|||||||||||||||||
|
Pension Fund
|
2018
|
2017
|
2018
|
2017
|
2016
|
||||||||||||||||||
|
Western Conference of Teamsters
|
91-6145047
|
Green
|
Green
|
NA
|
$
|
7
|
|
$
|
6
|
|
$
|
6
|
|
N/A
|
10/1/2020
|
||||||||
|
Other Plans
(2)
|
3
|
|
4
|
|
3
|
|
|||||||||||||||||
|
Total Contributions
|
$
|
10
|
|
$
|
10
|
|
$
|
9
|
|
||||||||||||||
|
N/A
|
Not applicable
|
|
(1)
|
Indicates whether a Funding Improvement Plan, as required under the Code to be adopted by plans in the “yellow” zone, or a Rehabilitation Plan, as required under the Code to be adopted by plans in the “red” zone, is pending or has been implemented as of the end of the plan year that ended in
2018
.
|
|
(2)
|
Included in the Other Plans are contributions to the Local 1034 Pension Fund. The amount contributed by Hertz to the Local 1034 Pension Fund was reported as being more than 5% of total contributions to the plan, on the fund's Form 5500 for the year ended December 31, 2017.
|
126
HERTZ GLOBAL HOLDINGS, INC. AND SUBSIDIARIES
THE HERTZ CORPORATION AND SUBSIDIARIES
NOTES TO CONSOLIDATED FINANCIAL STATEMENTS (Continued)
Note 10
—
Stock-Based Compensation
The stock-based compensation expense associated with the Hertz Holdings stock-based compensation plans is pushed down from Hertz Global and recorded on the books at the Hertz level.
Plans
Prior to the Spin-Off, Old Hertz Holdings board of directors adopted the Hertz Global Holdings, Inc. 2016 Omnibus Incentive Plan (the “Omnibus Plan”). The Omnibus Plan contains
6,600,000
shares which can be granted pursuant to the terms and conditions of the Omnibus Plan, plus an unspecified number of shares awarded in connection with distribution awards granted under the Omnibus Plan in accordance with the Employee Matters Agreement, in substitution of, or in accordance with, an outstanding award granted under an Old Hertz Holdings plan that was held by a participant immediately before the completion of the Spin-Off, as described in the next paragraph. The Omnibus Plan provides for grants of both equity and cash awards, including non-qualified stock options, incentive stock options, stock appreciation rights, performance awards (shares and units), restricted stock, restricted stock units and deferred stock units to key executives, employees and non-management directors. The shares of common stock to be delivered under the Omnibus Plan may consist, in whole or in part, of common stock held in treasury or authorized but unissued shares of common stock, not reserved for any other purpose.
In accordance with the Employee Matters Agreement entered into between the Hertz Global and Herc Holdings, as further described in
Note 3
, "
Discontinued Operations
," previously outstanding stock-based compensation awards granted under Old Hertz Holdings' equity compensation programs prior to the Spin-Off and held by certain executives and employees of Old Hertz Holdings were adjusted to reflect the impact of the Spin-Off on these awards. To preserve the aggregate intrinsic value of these stock-based compensation awards, as measured immediately before and immediately after the Spin-Off, each holder of Old Hertz Holdings stock-based compensation awards received an adjusted award consisting of a stock-based compensation award denominated in the equity of the company at which the person was employed following the Spin-Off. In the Spin-Off, the determination as to which type of adjustment applied to a holder’s previously outstanding Old Hertz Holdings award was based upon the type of stock-based compensation award that was to be adjusted and the date on which the award was originally granted under the Old Hertz Holdings equity compensation programs prior to the Spin-Off. At the Spin-Off, a total of
2,677,723
shares were awarded in connection with distribution awards granted pursuant to the Omnibus Plan in accordance with the Employee Matters Agreement.
Effective January 1, 2017, the Company's board of directors adopted the 2017 Executive Incentive Compensation Plan ("2017 EICP"), pursuant to which any awards granted were to be from shares available under the Omnibus Plan. The provisions of the plan provided for the pay out of any bonus earned in either cash or PSUs for certain groups of employees. The Company accumulated these charges as a liability until the grant date, March 2, 2018, at which time the liability was reclassified to equity and
324,000
shares were granted in connection with this program based on Hertz Global's stock price as of the grant date. During the year ended December 31, 2017, the Company recognized approximately
$6 million
of stock-based compensation expense associated with the 2017 EICP based on Hertz Global's stock price as of December 31, 2017. There are no outstanding awards under the 2017 EICP as of December 31, 2018.
As of December 31, 2018, the Company had
4,509,885
shares underlying awards outstanding under the Omnibus Plan.
Shares subject to any award (other than distribution awards) granted under the Omnibus Plan that for any reason are canceled, terminated, forfeited, settled in cash or otherwise settled without the issuance of common stock after the effective date of the Omnibus Plan will generally be available for future grants under the Omnibus Plan.
127
HERTZ GLOBAL HOLDINGS, INC. AND SUBSIDIARIES
THE HERTZ CORPORATION AND SUBSIDIARIES
NOTES TO CONSOLIDATED FINANCIAL STATEMENTS (Continued)
A summary of the total compensation expense and associated income tax benefits recognized, including the cost of stock options, RSUs, PSUs, and PSAs is as follows:
|
Years Ended December 31,
|
|||||||||||
|
(In millions)
|
2018
|
2017
|
2016
|
||||||||
|
Compensation expense
|
$
|
14
|
|
$
|
19
|
|
$
|
13
|
|
||
|
Income tax benefit
|
(3
|
)
|
(8
|
)
|
(5
|
)
|
|||||
|
Total
|
$
|
11
|
|
$
|
11
|
|
$
|
8
|
|
||
As of
December 31, 2018
, there was approximately
$26 million
of total unrecognized compensation cost related to non-vested stock options, RSUs, PSUs and PSAs granted. The total unrecognized compensation cost is expected to be recognized over the remaining
1.6 years
, on a weighted average basis, of the requisite service period that began on the grant dates.
Stock Options and Stock Appreciation Rights
All stock options and stock appreciation rights granted under the Omnibus Plan will have a per-share exercise price of not less than the fair market value of
one
share of Hertz Global's common stock on the grant date. Stock options and stock appreciation rights will vest based on a minimum period of service or the occurrence of events (such as a change in control, as defined in the Omnibus Plan) specified by the Compensation Committee of the Company's board of directors. No stock options or stock appreciation rights will be exercisable after a maximum of
ten years
from the grant date.
The Company accounts for options as equity-classified awards and recognizes compensation cost on a straight-line basis over the vesting period. The value of each option award is estimated on the grant date using a Black-Scholes option valuation model that incorporates the assumptions noted in the following table.
The Company calculates the expected volatility based on the historical movement of its stock price.
|
Grants
|
|||||||||||
|
Assumption
|
2018
|
2017
|
2016
|
||||||||
|
Expected volatility
|
56.7
|
%
|
47.8
|
%
|
44.2
|
%
|
|||||
|
Expected dividend yield
|
—
|
%
|
—
|
%
|
—
|
%
|
|||||
|
Expected term (years)
|
5
|
|
7
|
|
5
|
|
|||||
|
Risk-free interest rate
|
2.57
|
%
|
1.95
|
%
|
1.00
|
%
|
|||||
|
Weighted average grant date fair value
|
$
|
8.92
|
|
$
|
9.44
|
|
$
|
39.35
|
|
||
A summary of option activity as of
December 31, 2018
is presented below.
|
Options
|
Shares
|
Weighted
Average Exercise Price |
Weighted
Average Remaining Contractual Term (years) |
Aggregate Intrinsic
Value (In millions) |
|||||||||
|
Outstanding as of January 1, 2018
|
1,134,694
|
|
$
|
44.35
|
|
4.3
|
|
$
|
—
|
|
|||
|
Granted
|
524,817
|
|
17.76
|
|
—
|
|
—
|
|
|||||
|
Exercised
|
(10,847
|
)
|
2.80
|
|
—
|
|
—
|
|
|||||
|
Forfeited or Expired
|
(478,346
|
)
|
50.14
|
|
—
|
|
—
|
|
|||||
|
Outstanding as of December 31, 2018
|
1,170,318
|
|
30.44
|
|
4.8
|
|
—
|
|
|||||
|
Exercisable as of December 31, 2018
|
240,625
|
|
62.30
|
|
1.9
|
|
—
|
|
|||||
128
HERTZ GLOBAL HOLDINGS, INC. AND SUBSIDIARIES
THE HERTZ CORPORATION AND SUBSIDIARIES
NOTES TO CONSOLIDATED FINANCIAL STATEMENTS (Continued)
A summary of non-vested option activity as of
December 31, 2018
is presented below.
|
Non-vested
Shares |
Weighted
Average Exercise Price |
Weighted Average
Grant-Date Fair Value |
||||||||
|
Non-vested as of January 1, 2018
|
764,289
|
|
$
|
35.25
|
|
$
|
13.54
|
|
||
|
Granted
|
524,817
|
|
17.76
|
|
8.92
|
|
||||
|
Vested
|
(124,262
|
)
|
63.05
|
|
21.64
|
|
||||
|
Forfeited
|
(235,151
|
)
|
33.14
|
|
13.28
|
|
||||
|
Non-vested as of December 31, 2018
|
929,693
|
|
22.20
|
|
9.92
|
|
||||
Additional information pertaining to option activity under the plans is as follows:
|
Years Ended December 31,
|
|||||||||||
|
(In millions)
|
2018
|
2017
|
2016
|
||||||||
|
Aggregate intrinsic value of stock options exercised
|
$
|
—
|
|
$
|
—
|
|
$
|
12
|
|
||
|
Cash received from the exercise of stock options
|
—
|
|
—
|
|
10
|
|
|||||
|
Fair value of options that vested
|
3
|
|
3
|
|
10
|
|
|||||
|
Tax benefit realized on exercise of stock options
|
—
|
|
—
|
|
4
|
|
|||||
Performance Stock, Performance Stock Units, Performance Stock Awards, Restricted Stock and Restricted Stock Units
Performance stock, PSUs and PSAs granted under the Omnibus Plan will vest based on the achievement of pre-determined performance goals over performance periods determined by the Compensation Committee. Each of the units granted represent the right to receive
one
share of Hertz Global's common stock on a specified future date. In the event of an employee's death or disability, a pro rata portion of the employee's performance stock, PSUs and performance units will vest to the extent performance goals are achieved at the end of the performance period. Restricted stock and RSUs granted under the Omnibus Plan will vest based on a minimum period of service or the occurrence of events (such as a change in control, as defined in the Omnibus Plan) specified by the Compensation Committee.
A summary of the PSU and PSA activity as of
December 31, 2018
is presented below.
|
Shares
|
Weighted
Average Fair Value |
Aggregate Intrinsic
Value (In millions) |
||||||||
|
Outstanding as of January 1, 2018
|
1,233,923
|
|
$
|
29.98
|
|
$
|
5
|
|
||
|
Granted
|
1,424,974
|
|
17.64
|
|
—
|
|
||||
|
Vested
|
(367,650
|
)
|
21.31
|
|
—
|
|
||||
|
Forfeited or Expired
|
(724,121
|
)
|
28.39
|
|
—
|
|
||||
|
Outstanding as of December 31, 2018
|
1,567,126
|
|
21.61
|
|
12
|
|
||||
A summary of RSU activity as of
December 31, 2018
is presented below.
|
Shares
|
Weighted-
Average Fair Value |
Aggregate Intrinsic
Value (In millions) |
||||||||
|
Outstanding as of January 1, 2018
|
738,540
|
|
$
|
24.20
|
|
$
|
16
|
|
||
|
Granted
|
904,542
|
|
17.40
|
|
—
|
|
||||
|
Vested
|
(237,534
|
)
|
20.05
|
|
—
|
|
||||
|
Forfeited or Expired
|
(283,315
|
)
|
22.14
|
|
—
|
|
||||
|
Outstanding as of December 31, 2018
|
1,122,233
|
|
20.11
|
|
15
|
|
||||
129
HERTZ GLOBAL HOLDINGS, INC. AND SUBSIDIARIES
THE HERTZ CORPORATION AND SUBSIDIARIES
NOTES TO CONSOLIDATED FINANCIAL STATEMENTS (Continued)
Additional information pertaining to RSU activity is as follows:
|
Years Ended December 31,
|
|||||||||||
|
2018
|
2017
|
2016
|
|||||||||
|
Total fair value of awards that vested (In millions)
|
$
|
5
|
|
$
|
6
|
|
$
|
7
|
|
||
|
Weighted average grant date fair value of awards
|
17.40
|
|
19.27
|
|
38.86
|
|
|||||
Compensation expense for PSUs, PSAs and RSUs is based on the grant date fair value, and is recognized ratably over the vesting period. For grants in
2018
,
2017
and
2016
, the vesting period is
three
years. In addition to the service vesting condition, the PSUs and PSAs had an additional vesting condition which called for the number of units that will be awarded being based on achievement of a certain level of Adjusted Corporate EBITDA or other performance measures over the applicable measurement period.
Note 11
—
Leases
The Company is a lessee under the following types of leases, all of which are operating:
|
•
|
Concession agreements which grant the Company the right to conduct its vehicle rental operations at airports, hotels and train stations;
|
|
•
|
Real estate leases for its off airport vehicle rental locations and other premises;
|
|
•
|
Revenue earning vehicle leases; and
|
|
•
|
Other equipment leases.
|
Lease terms generally range from one month to
thirty-five
years and a number of agreements contain escalation clauses, which increase the payment obligation based on a fixed or variable rate, and renewal options. The length of renewals vary and may result in different payment terms.
Payment terms are based on fixed rates explicit in the lease, including guaranteed minimums, and/or variable rates based on:
|
•
|
Operating expenses, such as common area charges, real estate taxes and insurance;
|
|
•
|
A percentage of revenues or sales arising at the relevant premises; and/or
|
|
•
|
Periodic inflation adjustments.
|
The following table summarizes the amount of lease costs included as rent expense, or included in depreciation of revenue earning vehicles and lease charges, net when the lease is associated with the Company's retail vehicle sales lots, in the accompanying statements of operations. Certain variable lease costs of
$135 million
and
$129 million
for 2017 and 2016, respectively, were previously disclosed as minimum fixed lease costs and have been subsequently adjusted and presented as variable lease costs in the table below as these costs were based on a variable component which was unknown at the onset of the agreement.
|
Years ended December 31,
|
|||||||||||
|
(In millions)
|
2018
|
2017
|
2016
|
||||||||
|
Minimum fixed lease cost
|
$
|
577
|
|
$
|
515
|
|
$
|
493
|
|
||
|
Variable lease cost
|
438
|
|
430
|
|
421
|
|
|||||
|
Total
|
$
|
1,015
|
|
$
|
945
|
|
$
|
914
|
|
||
130
HERTZ GLOBAL HOLDINGS, INC. AND SUBSIDIARIES
THE HERTZ CORPORATION AND SUBSIDIARIES
NOTES TO CONSOLIDATED FINANCIAL STATEMENTS (Continued)
The following table reflects the Company's obligations for minimum fixed lease costs under existing agreements, excluding variable concession obligations and short-term leases, as of
December 31, 2018
:
|
(In millions)
|
Total
|
|||
|
2019
|
$
|
413
|
|
|
|
2020
|
313
|
|
||
|
2021
|
255
|
|
||
|
2022
|
194
|
|
||
|
2023
|
139
|
|
||
|
After 2023
|
866
|
|
||
|
Total
|
$
|
2,180
|
|
|
Note 12
—
Restructuring
During 2016, the Company initiated
$63 million
of restructuring programs that included headcount reductions, business process re-engineering, asset impairments and outsourcing certain information technology application and infrastructure functions to a third-party service provider.
Restructuring charges under these programs were as follows:
|
|
Year Ended December 31,
|
|||
|
(In millions)
|
2016
|
|||
|
By Type:
|
||||
|
Termination benefits
|
$
|
24
|
|
|
|
Impairments and asset write-downs
|
30
|
|
||
|
Facility closure and lease obligation costs
|
7
|
|
||
|
Other
|
1
|
|
||
|
Total
|
$
|
62
|
|
|
|
By Caption:
|
||||
|
Direct vehicle and operating expense
|
$
|
36
|
|
|
|
Selling, general and administrative expense
|
26
|
|
||
|
Total
|
$
|
62
|
|
|
|
By Segment:
|
||||
|
U.S. Rental Car
|
$
|
49
|
|
|
|
International Rental Car
|
9
|
|
||
|
Corporate
|
4
|
|
||
|
Total
|
$
|
62
|
|
|
Note 13
—
Income Tax (Provision) Benefit
On December 22, 2017, the U.S. enacted the TCJA, which made substantial changes to corporate income tax laws. Among the key provisions were a U.S. corporate tax rate reduction from
35%
to
21%
effective for tax years beginning January 1, 2018; an acceleration of expensing for certain business assets; a repeal of the LKE deferral rules as applicable to personal property, including rental vehicles; a one-time transition tax on the deemed repatriation of cumulative earnings from foreign subsidiaries; and changes to U.S. taxation of foreign earnings from a worldwide to a territorial tax system effective for tax years beginning January 1, 2018. As of December 31, 2018, the Company has recognized the effects of TCJA in its current year consolidated financial statements.
131
HERTZ GLOBAL HOLDINGS, INC. AND SUBSIDIARIES
THE HERTZ CORPORATION AND SUBSIDIARIES
NOTES TO CONSOLIDATED FINANCIAL STATEMENTS (Continued)
During 2017, the Company recorded a net tax benefit of
$679 million
as a result of the preliminary remeasurement of deferred tax assets and liabilities and other provisions of U.S. tax reform. In 2018, the Company finalized its assessment of the impact of the TCJA and recorded net tax expense of $
22 million
. The Company further elected to account for taxes on GILTI as incurred and is not subject to foreign-derived intangible income, base-erosion and anti-abuse tax, or interest limitations under Section 163(j) as of December 31, 2018. Lastly, the Company continues to assert indefinite reinvestment on certain of our foreign earnings as of December 31, 2018.
As of December 31, 2017, the alternative minimum tax ("AMT") credits were reduced by
$3 million
due to the potential impact of sequestration. In January 2019, the IRS published guidance that allows the Company to reverse the sequestration adjustment for tax years beginning after December 31, 2017 as the refundable minimum tax credits are no longer subject to the reduction. AMT credits are fully refundable in tax returns through the year 2021. As of December 31, 2018, the Company estimates to recover AMT refunds of
$40 million
:
$20 million
, $
10 million
, $
5 million
and $
5 million
, for tax years ending 2018, 2019, 2020, and 2021, respectively. These tax returns will be filed in 2019, 2020, 2021 and 2022, respectively.
The components of income (loss) from continuing operations before income taxes for the periods were as follows (in millions):
Hertz Global
|
As of December 31,
|
|||||||||||
|
2018
|
2017
|
2016
|
|||||||||
|
Domestic
|
$
|
(293
|
)
|
$
|
(680
|
)
|
$
|
(535
|
)
|
||
|
Foreign
|
36
|
|
105
|
|
65
|
|
|||||
|
Total income (loss) from continuing operations before income taxes
|
$
|
(257
|
)
|
$
|
(575
|
)
|
$
|
(470
|
)
|
||
Hertz
|
As of December 31,
|
|||||||||||
|
2018
|
2017
|
2016
|
|||||||||
|
Domestic
|
$
|
(286
|
)
|
$
|
(675
|
)
|
$
|
(534
|
)
|
||
|
Foreign
|
36
|
|
105
|
|
65
|
|
|||||
|
Total income (loss) from continuing operations before income taxes
|
$
|
(250
|
)
|
$
|
(570
|
)
|
$
|
(469
|
)
|
||
132
HERTZ GLOBAL HOLDINGS, INC. AND SUBSIDIARIES
THE HERTZ CORPORATION AND SUBSIDIARIES
NOTES TO CONSOLIDATED FINANCIAL STATEMENTS (Continued)
The total income tax provision (benefit) consists of the following (in millions):
Hertz Global and Hertz
|
|
As of December 31,
|
||||||||||
|
2018
|
2017
|
2016
|
|||||||||
|
Current:
|
|||||||||||
|
Federal
|
$
|
(3
|
)
|
$
|
—
|
|
$
|
22
|
|
||
|
Foreign
|
32
|
|
19
|
|
48
|
|
|||||
|
State and local
|
7
|
|
1
|
|
12
|
|
|||||
|
Total current
|
36
|
|
20
|
|
82
|
|
|||||
|
Deferred:
|
|||||||||||
|
Federal
|
(66
|
)
|
(900
|
)
|
(131
|
)
|
|||||
|
Foreign
|
11
|
|
10
|
|
1
|
|
|||||
|
State and local
|
(11
|
)
|
(32
|
)
|
52
|
|
|||||
|
Total deferred
|
(66
|
)
|
(922
|
)
|
(78
|
)
|
|||||
|
Total provision (benefit) - Hertz Global
|
(30
|
)
|
(902
|
)
|
4
|
|
|||||
|
Federal deferred tax expense applicable to Hertz only
|
2
|
|
—
|
|
—
|
|
|||||
|
Total provision (benefit) - Hertz
|
$
|
(28
|
)
|
$
|
(902
|
)
|
$
|
4
|
|
||
The principal items of the U.S. and foreign net deferred tax assets and liabilities are as follows (in millions):
Hertz Global and Hertz
|
As of December 31,
|
|||||||
|
2018
|
2017
|
||||||
|
Deferred tax assets:
|
|||||||
|
Employee benefit plans
|
$
|
34
|
|
$
|
27
|
|
|
|
Net operating loss carry forwards
|
1,937
|
|
1,343
|
|
|||
|
Federal, state and foreign local tax credit carry forwards
|
42
|
|
24
|
|
|||
|
Accrued and prepaid expenses
|
163
|
|
90
|
|
|||
|
Total deferred tax assets
|
2,176
|
|
1,484
|
|
|||
|
Less: valuation allowance
|
(318
|
)
|
(305
|
)
|
|||
|
Total net deferred tax assets
|
1,858
|
|
1,179
|
|
|||
|
Deferred tax liabilities:
|
|||||||
|
Depreciation on tangible assets
|
(2,130
|
)
|
(1,576
|
)
|
|||
|
Intangible assets
|
(761
|
)
|
(764
|
)
|
|||
|
Total deferred tax liabilities
|
(2,891
|
)
|
(2,340
|
)
|
|||
|
Net deferred tax liability - Hertz Global
|
$
|
(1,033
|
)
|
$
|
(1,161
|
)
|
|
|
Deferred tax asset - net operating loss not applicable to Hertz
|
(3
|
)
|
—
|
|
|||
|
Net deferred tax liability - Hertz
|
$
|
(1,036
|
)
|
$
|
(1,161
|
)
|
|
Hertz Global and Hertz
As of
December 31, 2018
, the Company had U.S. federal net operating loss carry forwards ("Federal NOL") of approximately
$7.0 billion
, which generated a deferred tax asset of
$1.5 billion
. Such net operating loss carry forwards are primarily related to accelerated depreciation of the Company's U.S. vehicles and will begin to expire in
2029
, except those losses incurred after 2017 which have indefinite lives but may offset 80% of taxable income. Currently, the
133
HERTZ GLOBAL HOLDINGS, INC. AND SUBSIDIARIES
THE HERTZ CORPORATION AND SUBSIDIARIES
NOTES TO CONSOLIDATED FINANCIAL STATEMENTS (Continued)
Company does not record valuation allowances on its U.S. federal tax loss carry forwards as there are adequate deferred tax liabilities that could be realized within the carry forward period. As of
December 31, 2018
, the Company had state net operating loss carry forwards ("State NOL") which generated a deferred tax asset of
$279 million
, offset with a valuation allowance of
$116 million
for separate states that have historical losses where it is more likely than not that the State NOL carry forwards will not be utilized in the future. The State NOLs expire over various years beginning in 2019 depending on the jurisdiction. As of
December 31, 2018
, the Company had foreign net operating loss carry forwards ("Foreign NOL") of approximately
$728 million
, of which
$649 million
have an indefinite utilization period with the remaining Foreign NOLs beginning to expire in
2024
. The Foreign NOLs generated a deferred tax asset of
$192 million
and are offset with a valuation allowance of
$126 million
related to jurisdictions that have historical losses and for which it is more likely than not that a portion of the Foreign NOLs will not be utilized in the future. An additional valuation allowance of
$52 million
was recorded against other deferred tax assets in these jurisdictions.
As of
December 31, 2017
, the Company had Federal NOLs of
$4.2 billion
, which generated deferred tax assets of
$873 million
. State NOLs have generated a deferred tax asset of
$290 million
, offset by a valuation allowance of
$101 million
. As of
December 31, 2017
, deferred tax assets of
$180 million
were recorded for Foreign NOLs of
$655 million
,
$595 million
of which has an indefinite carry forward period. The Foreign NOLs are offset with a valuation allowance of
$126 million
. Additionally, a valuation allowance of
$50 million
was recorded against other deferred tax assets in these jurisdictions.
As of
December 31, 2018 and 2017
, deferred tax assets of
$7 million
and
$9 million
were recorded for U.S. federal net capital losses, respectively, offset by valuation allowances of
$0 million
and
$9 million
, respectively. The valuation allowance of
$9 million
was released during 2018 due to the sales or anticipated sales of properties which will generate capital gain.
As of
December 31, 2018
and 2017, deferred tax assets of
$38 million
and
$23 million
, respectively, were recorded for various U.S. federal and state credits and are offset by valuation allowances of
$24 million
and
$19 million
, respectively. The deferred tax balance reflects the reclassification of AMT credits to the tax receivable account resulting from the TCJA's repeal of the corporate AMT. The state tax credits expire over various years beginning in 2019 depending upon when they were generated and the particular jurisdiction.
In determining valuation allowances, an assessment of positive and negative evidence was performed regarding realization of the net deferred tax assets. This assessment included the evaluation of cumulative earnings and losses in recent years, scheduled reversals of net deferred tax liabilities, the availability of carry forwards and the remaining period of the respective carry forward, future taxable income and any applicable tax-planning strategies that are available.
134
HERTZ GLOBAL HOLDINGS, INC. AND SUBSIDIARIES
THE HERTZ CORPORATION AND SUBSIDIARIES
NOTES TO CONSOLIDATED FINANCIAL STATEMENTS (Continued)
The significant items in the reconciliation of the statutory and effective income tax rates consisted of the following:
Hertz Global and Hertz
|
Years Ended December 31,
|
||||||||
|
2018
|
2017
|
2016
|
||||||
|
Statutory federal tax rate
|
21
|
%
|
35
|
%
|
35
|
%
|
||
|
Foreign tax rate differential
|
(1
|
)
|
2
|
|
2
|
|
||
|
State and local income taxes, net of federal income tax benefit
|
7
|
|
6
|
|
3
|
|
||
|
Change in state apportionment and statutory rates, net of federal income tax benefit
|
1
|
|
6
|
|
(7
|
)
|
||
|
Tax reform
|
(9
|
)
|
118
|
|
—
|
|
||
|
Federal and foreign permanent differences
|
—
|
|
—
|
|
(1
|
)
|
||
|
Withholding taxes
|
(3
|
)
|
(2
|
)
|
(2
|
)
|
||
|
Uncertain tax positions
|
(3
|
)
|
—
|
|
—
|
|
||
|
Change in valuation allowance
|
(5
|
)
|
(7
|
)
|
(11
|
)
|
||
|
Change in foreign statutory rates
|
(3
|
)
|
—
|
|
(3
|
)
|
||
|
Tax credits
|
7
|
|
(1
|
)
|
—
|
|
||
|
Goodwill impairment
|
—
|
|
—
|
|
(12
|
)
|
||
|
Stock option shortfalls
|
(1
|
)
|
(1
|
)
|
(3
|
)
|
||
|
All other items, net
|
1
|
|
1
|
|
(2
|
)
|
||
|
Effective tax rate - Hertz Global
|
12
|
%
|
157
|
%
|
(1
|
)%
|
||
|
All other items, net rate impact not applicable to Hertz
|
(1
|
)
|
1
|
|
—
|
|
||
|
Effective tax rate - Hertz
|
11
|
%
|
158
|
%
|
(1
|
)%
|
||
The decrease in the tax benefit in 2018 versus 2017 is due to the one-time remeasurement of net deferred tax liabilities as a result of TCJA in 2017, the reduction in the statutory federal tax rate from 35% to 21% and an increase in pretax operating results.
The Company recorded a tax benefit in 2017 versus a tax provision in 2016. The change was primarily due to the benefit from the TCJA in 2017 and the provision of goodwill impairment in 2016. In addition, contributing factors to the tax benefit versus tax provision include a decrease in pretax operating results, the composition of operating results by jurisdiction, a change in the state statutory effective tax rates, and an increase in the valuation allowance relating to losses in certain U.S. and non-U.S. jurisdictions.
As of
December 31, 2018
, total unrecognized tax benefits were
$49 million
, of which
$5 million
, if settled, would positively impact the effective tax rate in future periods because of correlative adjustments associated with these liabilities. A reconciliation of the beginning and ending amount of unrecognized tax benefits is as follows:
Hertz Global and Hertz
|
Years Ended December 31,
|
|||||||||||
|
(In millions)
|
2018
|
2017
|
2016
|
||||||||
|
Balance as of January 1
|
$
|
43
|
|
$
|
45
|
|
$
|
81
|
|
||
|
Increase (decrease) attributable to tax positions taken during prior periods
|
3
|
|
(2
|
)
|
(35
|
)
|
|||||
|
Increase (decrease) attributable to tax positions taken during the current year
|
5
|
|
3
|
|
—
|
|
|||||
|
Decrease attributable to settlements with taxing authorities
|
(2
|
)
|
(3
|
)
|
(1
|
)
|
|||||
|
Balance as of December 31
|
$
|
49
|
|
$
|
43
|
|
$
|
45
|
|
||
135
HERTZ GLOBAL HOLDINGS, INC. AND SUBSIDIARIES
THE HERTZ CORPORATION AND SUBSIDIARIES
NOTES TO CONSOLIDATED FINANCIAL STATEMENTS (Continued)
The Company conducts business globally and, as a result, files tax returns in the U.S. and non-U.S. jurisdictions. In the normal course of business, the Company is subject to examination by taxing authorities throughout the world. The open tax years for these jurisdictions span from 2003 to 2018. Currently, the Company's 2014 and 2015 tax years are under audit by the Internal Revenue Service and they have indicated they will begin to audit the 2016 tax year in 2019. Several U.S. state and other non-U.S. jurisdictions are under audit, and it is reasonably possible that the amount of unrecognized tax benefits may change as the result of the completion of ongoing examinations, the expiration of the statute of limitations or other unforeseen circumstances. At this time, an estimate of the range of the reasonably possible change cannot be made. It is reasonable that approximately
$1 million
of unrecognized tax benefits may reverse within the next twelve months due to settlement with the relevant non-U.S. taxing authorities.
Net, after-tax interest and penalties related to tax liabilities are classified as a component of income tax (provision) benefit in the consolidated statements of operations. During the years ended
December 31, 2018, 2017 and 2016
, approximately
$1 million
,
$(1) million
and
$1 million
, respectively, in net, after-tax interest and penalties were recognized. As of
December 31, 2018 and 2017
, approximately
$8 million
and
$7 million
, respectively, of net, after-tax interest and penalties were accrued in the Company's consolidated balance sheets within accrued taxes.
Note 14
—
Fair Value Measurements
Under U.S. GAAP, entities are allowed to measure certain financial instruments and other items at fair value. The Company has not elected the fair value measurement option for any of its assets or liabilities that meet the criteria for this option. Irrespective of the fair value option previously described, U.S. GAAP requires certain financial and non-financial assets and liabilities of the Company to be measured on either a recurring basis or on a nonrecurring basis.
Assets and Liabilities Measured at Fair Value on a Recurring Basis
The fair value of cash, restricted cash, accounts receivable, accounts payable and accrued expenses, to the extent the underlying liability will be settled in cash, approximates the carrying values because of the short-term nature of these instruments. The Company's assessment of goodwill and other intangible assets for impairment includes an assessment using various Level 2 inputs (earnings before interest, taxes, depreciation and amortization ("EBITDA") multiples and royalty rates) and Level 3 inputs (forecasted cash flows and discount rates). See
Note 2
, "
Significant Accounting Policies
— Recoverability of Goodwill and Intangible Assets," for more information on the application of the use of fair value methodology in the Company's assessment.
Cash Equivalents and Investments
The Company’s cash equivalents and restricted cash primarily consist of investments in money market funds and time deposits. The Company determines the fair value of cash equivalents using a market approach based on quoted prices in active markets (Level 1 inputs).
Investments in equity securities that are measured at fair value on a recurring basis consist of marketable securities.
The following table summarizes the ending balances of the Company's cash equivalents, restricted cash equivalents and investments.
|
December 31, 2018
|
December 31, 2017
|
||||||||||||||||||||||||||||||
|
(In millions)
|
Level 1
|
Level 2
|
Level 3
|
Total
|
Level 1
|
Level 2
|
Level 3
|
Total
|
|||||||||||||||||||||||
|
Money market funds and time deposits
|
$
|
701
|
|
$
|
—
|
|
$
|
—
|
|
$
|
701
|
|
$
|
634
|
|
$
|
—
|
|
$
|
—
|
|
$
|
634
|
|
|||||||
|
Equity securities
|
44
|
|
—
|
|
—
|
|
44
|
|
—
|
|
—
|
|
—
|
|
—
|
|
|||||||||||||||
136
HERTZ GLOBAL HOLDINGS, INC. AND SUBSIDIARIES
THE HERTZ CORPORATION AND SUBSIDIARIES
NOTES TO CONSOLIDATED FINANCIAL STATEMENTS (Continued)
Debt Obligations
The fair value of debt is estimated based on quoted market rates as well as borrowing rates currently available to the Company for loans with similar terms and average maturities (Level 2 inputs).
|
As of December 31, 2018
|
As of December 31, 2017
|
||||||||||||||
|
(In millions)
|
Nominal Unpaid Principal Balance
|
Aggregate Fair Value
|
Nominal Unpaid Principal Balance
|
Aggregate Fair Value
|
|||||||||||
|
Non-Vehicle Debt
|
$
|
4,455
|
|
$
|
4,011
|
|
$
|
4,476
|
|
$
|
4,438
|
|
|||
|
Vehicle Debt
|
11,945
|
|
11,891
|
|
10,471
|
|
10,456
|
|
|||||||
|
Total
|
$
|
16,400
|
|
$
|
15,902
|
|
$
|
14,947
|
|
$
|
14,894
|
|
|||
Note 15
—
Accumulated Other Comprehensive Income (Loss)
Changes in the accumulated other comprehensive income (loss) balance by component (net of tax) are as follows:
|
(In millions)
|
Pension and Other Post-Employment Benefits
|
Foreign Currency Items
|
Unrealized Losses on Terminated Net Investment Hedges
|
Accumulated Other Comprehensive Income (Loss)
|
|||||||||||
|
Balance as of January 1, 2018
|
$
|
(76
|
)
|
$
|
(23
|
)
|
$
|
(19
|
)
|
$
|
(118
|
)
|
|||
|
Other comprehensive income (loss) before reclassification
|
(32
|
)
|
(34
|
)
|
—
|
|
(66
|
)
|
|||||||
|
Amounts reclassified from accumulated other comprehensive income (loss)
|
4
|
|
(1
|
)
|
—
|
|
3
|
|
|||||||
|
Reclassification of income tax effects to accumulated deficit resulting from the Tax Cuts and Job Act
|
(11
|
)
|
—
|
|
—
|
|
(11
|
)
|
|||||||
|
Balance as of December 31, 2018
|
$
|
(115
|
)
|
$
|
(58
|
)
|
$
|
(19
|
)
|
$
|
(192
|
)
|
|||
|
(In millions)
|
Pension and Other Post-Employment Benefits
|
Foreign Currency Items
|
Unrealized Losses on Terminated Net Investment Hedges
|
Realized/Unrealized Gains on Available for Sale Securities
|
Accumulated Other Comprehensive Income (Loss)
|
||||||||||||||
|
Balance as of January 1, 2017
|
$
|
(110
|
)
|
$
|
(45
|
)
|
$
|
(19
|
)
|
$
|
3
|
|
$
|
(171
|
)
|
||||
|
Other comprehensive income (loss) before reclassification
|
30
|
|
14
|
|
—
|
|
—
|
|
44
|
|
|||||||||
|
Amounts reclassified from accumulated other comprehensive income (loss)
|
4
|
|
8
|
|
—
|
|
(3
|
)
|
9
|
|
|||||||||
|
Balance as of December 31, 2017
|
$
|
(76
|
)
|
$
|
(23
|
)
|
$
|
(19
|
)
|
$
|
—
|
|
$
|
(118
|
)
|
||||
Note 16
—
Contingencies and Off-Balance Sheet Commitments
Legal Proceedings
Public Liability and Property Damage
The Company is currently a defendant in numerous actions and has received numerous claims on which actions have not yet been commenced for public liability and property damage arising from the operation of motor vehicles rented from the Company. The obligation for public liability and property damage on self-insured U.S. and international vehicles, as stated on the accompanying consolidated balance sheets, represents an estimate for both reported accident claims not yet paid and claims incurred but not yet reported. The related liabilities are recorded on a non-discounted basis.
137
HERTZ GLOBAL HOLDINGS, INC. AND SUBSIDIARIES
THE HERTZ CORPORATION AND SUBSIDIARIES
NOTES TO CONSOLIDATED FINANCIAL STATEMENTS (Continued)
Reserve requirements are based on rental volume and actuarial evaluations of historical accident claim experience and trends, as well as future projections of ultimate losses, expenses, premiums and administrative costs. As of
December 31, 2018 and 2017
, the Company's liability recorded for public liability and property damage matters was
$418 million
and
$427 million
, respectively. The Company believes that its analysis is based on the most relevant information available, combined with reasonable assumptions, and that the Company may prudently rely on this information to determine the estimated liability. The liability is subject to significant uncertainties. The adequacy of the liability reserve is regularly monitored based on evolving accident claim history and insurance related state legislation changes. If the Company's estimates change or if actual results differ from these assumptions, the amount of the recorded liability is adjusted to reflect these results.
Other Matters
From time to time the Company is a party to various legal proceedings, typically involving operational issues common to the vehicle rental business, including claims by employees and former employees, and governmental investigations. The Company has summarized below, the most significant legal proceedings to which the Company was and/or is a party to during
2018
or the period after
December 31, 2018
but before the filing of this
2018
Annual Report.
Governmental Investigations
- In June 2014, the Company was advised by the staff of the New York Regional Office of the Securities and Exchange Commission (“SEC”) that it was investigating the events disclosed in certain of the Company’s filings with the SEC. In addition, starting in June 2016, the Company had communications with the U.S. Attorney’s Office for the District of New Jersey regarding the same or similar events. The investigations and communications generally involved the restatements included in the Old Hertz Holdings Form 10-K for the year ended December 31, 2014, as filed with the SEC on July 16, 2015 and related accounting for prior periods. In November 2018, the U.S. Attorney's Office for the District of New Jersey advised that it would be declining prosecution of the Company. On December 31, 2018, the SEC approved and authorized the entry of an administrative order with respect to the Company, to which the Company consented without admitting or denying the order’s assertions of factual findings. The order directs (i) Hertz Global to cease and desist from committing or causing any violations and any future violations of Sections 17(a)(2) and 17(a)(3) of the Securities Act of 1933 and Sections 13(a), 13(b)(2)(A) and 13(b)(2)(B) of the Securities Exchange Act of 1934 (the “Exchange Act”) and Rules 12b-20, 13a-1, 13a-11 and 13a-13 thereunder and (ii) Hertz to cease and desist from committing or causing any violations and any future violations of Sections 13(b)(2)(A), 13(b)(2)(B) and 15(d) of the Exchange Act and Rules 12b-20, 15d-1, 15d-11 and 15d-13 thereunder. In connection with the order, Hertz Global agreed to pay a civil penalty in the amount of
$16.0 million
to the SEC. Pursuant to the agreements governing the separation of Herc Holdings from Hertz Global that occurred on June 30, 2016, Herc Holdings is responsible for 15% of the civil penalty, leaving Hertz Global with a net obligation of
$13.6 million
as of December 31, 2018. On January 18, 2019, Hertz Global paid the SEC the
$16.0 million
civil penalty.
Additionally, the Company previously identified certain activities in Brazil that raised issues under the Foreign Corrupt Practices Act (the "FCPA") and other federal and local laws, which the Company self-reported to appropriate government entities. The matters associated with the FCPA and other federal matters have been resolved without further action by the applicable U.S. government entities. The Company is continuing its cooperation with respect to matters under local Brazilian laws. The Company has accrued a loss contingency with respect to the ongoing Brazil-related matters that is not material. However, it is possible that an adverse outcome with respect to the ongoing matters in Brazil could result in losses that could be material to the Company's consolidated financial condition, results of operations or cash flows in any particular reporting period.
In re Hertz Global Holdings, Inc. Securities Litigation
- In November 2013, a purported shareholder class action, Pedro Ramirez, Jr. v. Hertz Global Holdings, Inc., et al., was commenced in the U.S. District Court for the District of New Jersey naming Old Hertz Holdings and certain of its officers as defendants and alleging violations of the federal securities laws. The complaint alleged that Old Hertz Holdings made material misrepresentations and/or omissions of material fact in certain of its public disclosures in violation of Section 10(b) and 20(a) of the Securities Exchange Act of 1934, as amended, and Rule 10b-5 promulgated thereunder. The complaint sought an unspecified amount of monetary damages on behalf of the purported class and an award of costs
138
HERTZ GLOBAL HOLDINGS, INC. AND SUBSIDIARIES
THE HERTZ CORPORATION AND SUBSIDIARIES
NOTES TO CONSOLIDATED FINANCIAL STATEMENTS (Continued)
and expenses, including counsel fees and expert fees. The complaint, as amended, was dismissed with prejudice on April 27, 2017. On September 20, 2018, the Third Circuit affirmed the dismissal of the complaint with prejudice. The plaintiffs have not sought further appellate review of the affirmance, however on February 5, 2019, the plaintiffs filed a motion asking the federal district court to exercise its discretion and allow plaintiffs to reinstate their claims to include additional allegations from the administrative order entered by the SEC with respect to the Company on December 31, 2018.
In addition to the matters described above, the Company maintains an internal compliance program through which it from time to time identifies other potential violations of laws and regulations applicable to the Company. When the Company identifies such matters, the Company conducts an internal investigation and otherwise cooperates with governmental authorities, as appropriate.
The Company has established reserves for matters where the Company believes that losses are probable and can be reasonably estimated. Other than the aggregate reserve established for claims for public liability and property damage, none of those reserves are material. For matters, including certain of those described above, where the Company has not established a reserve, the ultimate outcome or resolution cannot be predicted at this time, or the amount of ultimate loss, if any, cannot be reasonably estimated. These matters are subject to many uncertainties and the outcome of the individual litigated matters is not predictable with assurance. It is possible that certain of the actions, claims, inquiries or proceedings, including those discussed above, could be decided unfavorably to the Company or any of its subsidiaries involved. Accordingly, it is possible that an adverse outcome from such a proceeding could exceed the amount accrued in an amount that could be material to the accompanying consolidated financial condition, results of operations or cash flows in any particular reporting period.
Indemnification Obligations
In the ordinary course of business, the Company has executed contracts involving indemnification obligations customary in the relevant industry and indemnifications specific to a transaction such as the sale of a business. These indemnification obligations might include claims relating to the following: environmental matters; intellectual property rights; governmental regulations and employment-related matters; customer, supplier and other commercial contractual relationships; and financial matters. Specifically, the Company has indemnified various parties for the costs associated with remediating numerous hazardous substance storage, recycling or disposal sites in many states and, in some instances, for natural resource damages. The amount of any such expenses or related natural resource damages for which the Company may be held responsible could be substantial. In addition, Hertz entered into customary indemnification agreements with Hertz Holdings and certain of the Company's stockholders and their affiliates pursuant to which Hertz Holdings and Hertz will indemnify those entities and their respective affiliates, directors, officers, partners, members, employees, agents, representatives and controlling persons, against certain liabilities arising out of performance of a consulting agreement with Hertz Holdings and each of such entities and certain other claims and liabilities, including liabilities arising out of financing arrangements or securities offerings. The Company has entered into customary indemnification agreements with each of its directors and certain of its officers. Performance under these indemnification obligations would generally be triggered by a breach of terms of the contract or by a third-party claim. In connection with the Spin-Off, the Company executed an agreement with Herc Holdings that contains mutual indemnification clauses and a customary indemnification provision with respect to liability arising out of or resulting from assumed legal matters. The Company regularly evaluates the probability of having to incur costs associated with these indemnification obligations and has accrued for expected losses that are probable and estimable.
Note 17
—
Related Party Transactions
Agreements with the Icahn Group
In June 2016, Hertz Global entered into a confidentiality agreement (the “Confidentiality Agreement”) with Carl C. Icahn, High River Limited Partnership, Hopper Investments LLC, Barberry Corp., Icahn Partners LP, Icahn Partners Master Fund LP, Icahn Enterprises G.P. Inc., Icahn Enterprises Holdings L.P., IPH GP LLC, Icahn Capital LP, Icahn Onshore LP, Icahn Offshore LP, Beckton Corp., Vincent J. Intrieri, Samuel J. Merksamer and Daniel A. Ninivaggi (collectively, the “Icahn Group”). Pursuant to the Confidentiality Agreement, Vincent J. Intrieri, Daniel A. Ninivaggi and SungHwan Cho, each of whom was appointed as a director of Hertz Global, are permitted to disclose confidential information to
139
HERTZ GLOBAL HOLDINGS, INC. AND SUBSIDIARIES
THE HERTZ CORPORATION AND SUBSIDIARIES
NOTES TO CONSOLIDATED FINANCIAL STATEMENTS (Continued)
representatives of the Icahn Group. Until the date that the Icahn Group no longer has a designee on the Hertz Global board of directors, the Icahn Group agrees to vote all of its shares of common stock of Hertz Global in favor of the election of all of Hertz Global’s director nominees at each annual or special meeting of Hertz Global.
In addition, Hertz Global, High River Limited Partnership, Icahn Partners LP and Icahn Partners Master Fund LP entered into a registration rights agreement, dated June 30, 2016 (the “Registration Rights Agreement”). Pursuant to the Registration Rights Agreement, among other things, and subject to certain exceptions, Hertz Global agreed to effect up to two demand registrations with respect to shares of Hertz Global common stock held by members of the Icahn Group. Hertz Global also agreed to provide, with certain exceptions, certain piggyback registration rights with respect to common stock held by members of the Icahn Group.
In the normal course of business, the Company purchases goods and services and leases property from entities controlled by Carl C. Icahn and his affiliates, including The Pep Boys - Manny, Moe & Jack. During the years ended December 31, 2018, 2017 and 2016, the Company purchased approximately
$39 million
,
$13 million
and
$6 million
, respectively worth of goods and services from these related parties.
In May 2018, the Company sold approximately
$36 million
of marketable securities to the Icahn Group at the then current market price of such securities.
Transactions and Agreements between Hertz Holdings/Old Hertz Holdings and Hertz
In June 2016, Hertz entered into a master loan agreement with Hertz Global at an interest rate based on the U.S. Dollar LIBOR rate plus a margin (the "2016 Master Loan") and advanced Hertz Global
$102 million
under the agreement during the year ended December 31, 2016.
In June 2017, upon expiration of the 2016 Master Loan, Hertz entered into a new master loan agreement with Hertz Holdings for a facility size of up to
$425 million
at an interest rate based on the U.S. Dollar LIBOR rate plus a margin (the "2017 Master Loan") where amounts outstanding under the 2016 Master Loan were transferred to the 2017 Master Loan. In June 2018, upon expiration of the 2017 Master Loan, Hertz entered into a new master loan agreement with Hertz Holdings for a facility size of
$425 million
with an expiration in June 2019 (the "2018 Master Loan") where amounts outstanding under the 2017 Master Loan were transferred to the 2018 Master Loan. The interest rate is based on the U.S. Dollar LIBOR rate plus a margin. As of
December 31, 2018 and 2017
, there was
$117 million
and
$107 million
outstanding under the 2018 Master Loan and 2017 Master Loan, respectively, representing advances and any accrued but unpaid interest. Additionally, Hertz has a due to an affiliate in the amount of
$65 million
as of
December 31, 2018 and 2017
which represents a tax related liability to Hertz Holdings.
The net impact of the above amounts are included in stockholder's equity in the accompanying consolidated balance sheets of Hertz.
Other Relationships
In connection with its vehicle rental businesses, the Company enters into millions of rental transactions every year involving millions of customers. In order to conduct those businesses, the Company also procures goods and services from thousands of vendors. Some of those customers and vendors may be affiliated with members of the Company's board of directors. The Company believes that all such rental and procurement transactions involved terms no less favorable to the Company than those that it believes would have been obtained in the absence of such affiliation. The Company's Nominating and Governance Committee oversees compliance through our Standards of Business Conduct, reviews conflicts of interest involving directors and determines whether to approve each transaction that involves the Company or any of its affiliates, on one hand, and (directly or indirectly) a director or member of his or her family or any entity managed by any such person, on the other hand.
Lyft, Inc.
140
HERTZ GLOBAL HOLDINGS, INC. AND SUBSIDIARIES
THE HERTZ CORPORATION AND SUBSIDIARIES
NOTES TO CONSOLIDATED FINANCIAL STATEMENTS (Continued)
The Company has an agreement with Lyft, Inc. (“Lyft”) pursuant to which the Company offers vehicles under specified rental agreements to drivers on the Lyft platform in various U.S. markets. Affiliates of Mr. Icahn own a noncontrolling minority interest in Lyft, and a former employee of one of Mr. Icahn’s companies serves on Lyft’s board of directors.
767 Auto Leasing LLC
In January 2018, Hertz entered into a Master Motor Vehicle Lease and Management Agreement (the “767 Lease Agreement”) pursuant to which Hertz granted 767 Auto Leasing LLC (“767”), an entity affiliated with the Icahn Group, the option to acquire certain vehicles from Hertz at rates aligned with the rates at which Hertz sells vehicles to third parties. Hertz leases the vehicles purchased by 767 under the 767 Lease Agreement or from third parties, under a mutually developed fleet plan and Hertz manages, services, repairs, sells and maintains those leased vehicles on behalf of 767. Hertz rents the leased vehicles to drivers of TNCs, including Lyft drivers, from rental counters within locations leased or owned by affiliates of 767, including locations operated under a master lease agreement with The Pep Boys - Manny, Joe & Jack. The 767 Lease Agreement has an initial term of 18 months and is subject to automatic six-month renewals thereafter, unless terminated by either party (with or without cause) prior to the start of any such six-month renewal. 767’s payment obligations under the 767 Lease Agreement are guaranteed by American Entertainment Properties Corp. ("American"), an entity affiliated with Mr. Icahn. During
2018
, American contributed
$60 million
to 767 along with certain services and the Company sold approximately
3,600
vehicles to 767 for approximately
$37 million
.
The Company is entitled to
25%
of the profit from the rental of the leased vehicles, as specified in the 767 Lease Agreement, which is variable and based primarily on the rental revenue, less certain vehicle-related costs, such as depreciation, licensing and maintenance expenses. The Company has determined that it is the primary beneficiary of 767 due to its power to direct the activities of 767 that most significantly impact 767's economic performance and the Company's obligation to absorb
25%
of 767's gains/losses. Accordingly, 767 is consolidated by the Company as a VIE.
Note 18
—
Equity and Earnings (Loss) Per Share - Hertz Global
Equity of Hertz Global Holdings, Inc.
As of December 31, 2018 and 2017, there were
40 million
shares of Hertz Holdings preferred stock authorized, par value
$0.01
per share,
400 million
shares of Hertz Holdings common stock authorized, par value
$0.01
per share, and
two million
shares of treasury stock.
Share Repurchase Program
Hertz Holdings has a Board-approved share repurchase program that authorizes it to repurchase shares of its common stock through a variety of methods, including in the open market or through privately negotiated transactions, in accordance with applicable securities laws. It does not obligate Hertz Holdings to make any repurchases at any specific time or situation. There were no shares repurchased under this program in
2018
or
2017
. As of
December 31, 2018
, Hertz Holdings has repurchased
two million
shares for
$100 million
under this program. This amount is included in treasury stock in the accompanying Hertz Global consolidated balance sheets as of
December 31, 2018
and 2017, respectively. The timing and extent to which Hertz Holdings repurchases its shares will depend upon, among other things, market conditions, share price, liquidity targets and other factors. Share repurchases may be commenced or suspended at any time or from time to time without prior notice. Since Hertz Holdings does not conduct business itself, it primarily funds repurchases of its common stock using dividends from Hertz or amounts borrowed under the master loan agreement. The credit agreements governing Hertz' Senior Facilities and Letter of Credit Facility restrict its ability to make dividends and certain payments, including payments to Hertz Holdings for share repurchases.
Earnings (Loss) Per Share
Basic earnings (loss) per share has been computed based upon the weighted average number of common shares outstanding. Diluted earnings (loss) per share has been computed based upon the weighted average number of common shares outstanding plus the effect of all potentially dilutive common stock equivalents, except when the effect would be anti-dilutive.
141
HERTZ GLOBAL HOLDINGS, INC. AND SUBSIDIARIES
THE HERTZ CORPORATION AND SUBSIDIARIES
NOTES TO CONSOLIDATED FINANCIAL STATEMENTS (Continued)
As described in
Note 1
, "
Background
", on June 30, 2016, the distribution date, Old Hertz Holdings stockholders of record as of the close of business on June 22, 2016 received one share of Hertz Holdings common stock for every five shares of Old Hertz Holdings common stock held as of the record date. Basic and diluted earnings (loss) per share for 2016 is calculated using a weighted average number of basic, dilutive and anti-dilutive common shares outstanding during the period that has been adjusted for the one-to-five distribution ratio for the period outstanding prior to the Spin-Off.
The following table sets forth the computation of basic and diluted earnings (loss) per share:
|
Years Ended December 31,
|
|||||||||||
|
(In millions, except per share data)
|
2018
|
2017
|
2016
|
||||||||
|
Numerator:
|
|||||||||||
|
Net income (loss) from continuing operations
|
$
|
(227
|
)
|
$
|
327
|
|
$
|
(474
|
)
|
||
|
Net (income) loss attributable to noncontrolling interests
|
2
|
|
—
|
|
—
|
|
|||||
|
Net income (loss) from continuing operations attributable to Hertz Global
|
(225
|
)
|
327
|
|
(474
|
)
|
|||||
|
Net income (loss) from discontinued operations
|
—
|
|
—
|
|
(17
|
)
|
|||||
|
Net income (loss) attributable to Hertz Global
|
$
|
(225
|
)
|
$
|
327
|
|
$
|
(491
|
)
|
||
|
Denominator:
|
|||||||||||
|
Basic weighted average common shares
|
84
|
|
83
|
|
84
|
|
|||||
|
Dilutive stock options, RSUs and PSUs
|
—
|
|
—
|
|
—
|
|
|||||
|
Weighted average shares used to calculate diluted earnings (loss) per share
|
84
|
|
83
|
|
84
|
|
|||||
|
Antidilutive stock options, RSUs, PSUs and PSAs
|
1
|
|
3
|
|
1
|
|
|||||
|
Earnings (loss) per share:
|
|||||||||||
|
Basic earnings (loss) per share from continuing operations attributable to Hertz Global
|
$
|
(2.68
|
)
|
$
|
3.94
|
|
$
|
(5.65
|
)
|
||
|
Basic earnings (loss) per share from discontinued operations
|
—
|
|
—
|
|
(0.20
|
)
|
|||||
|
Basic earnings (loss) per share
|
$
|
(2.68
|
)
|
$
|
3.94
|
|
$
|
(5.85
|
)
|
||
|
Diluted earnings (loss) per share from continuing operations attributable to Hertz Global
|
$
|
(2.68
|
)
|
$
|
3.94
|
|
$
|
(5.65
|
)
|
||
|
Diluted earnings (loss) per share from discontinued operations
|
—
|
|
—
|
|
(0.20
|
)
|
|||||
|
Diluted earnings (loss) per share
|
$
|
(2.68
|
)
|
$
|
3.94
|
|
$
|
(5.85
|
)
|
||
Note 19
—
Segment Information
The Company has identified
three
reportable segments, which are organized based on the products and services provided by its operating segments and the geographic areas in which its operating segments conduct business, as follows:
|
•
|
U.S. Rental Car ("U.S. RAC") - rental of vehicles (cars, crossovers and light trucks), as well as sales of value-added services, in the U.S. and consists of the Company's U.S. operating segment;
|
|
•
|
International Rental Car ("International RAC") - rental and leasing of vehicles (cars, vans, crossovers and light trucks), as well as sales of value-added services, internationally and consists of the Company's Europe and Other International operating segments, which are aggregated into a reportable segment based primarily upon similar economic characteristics, products and services, customers, delivery methods and general regulatory environments;
|
142
HERTZ GLOBAL HOLDINGS, INC. AND SUBSIDIARIES
THE HERTZ CORPORATION AND SUBSIDIARIES
NOTES TO CONSOLIDATED FINANCIAL STATEMENTS (Continued)
|
•
|
All Other Operations - primarily consists of the Company's Donlen business, which provides vehicle leasing and fleet management services, together with other business activities which represent less than 1% of revenues and expenses of the segment.
|
In addition to the above reportable segments, the Company has corporate operations ("Corporate") which includes general corporate assets and expenses and certain interest expense (including net interest on non-vehicle debt).
The following tables provide significant statement of operations, balance sheet and cash flow information by segment for each of Hertz Global and Hertz, as well as Adjusted Pre-tax Income (Loss), the segment measure of profitability.
|
Years Ended December 31,
|
|||||||||||
|
(In millions)
|
2018
|
2017
|
2016
|
||||||||
|
Revenues
|
|||||||||||
|
U.S. Rental Car
|
$
|
6,480
|
|
$
|
5,994
|
|
$
|
6,114
|
|
||
|
International Rental Car
|
2,276
|
|
2,169
|
|
2,097
|
|
|||||
|
All Other Operations
|
748
|
|
640
|
|
592
|
|
|||||
|
Total Hertz Global and Hertz
|
$
|
9,504
|
|
$
|
8,803
|
|
$
|
8,803
|
|
||
|
Depreciation of revenue earning vehicles and lease charges, net
|
|||||||||||
|
U.S. Rental Car
|
$
|
1,678
|
|
$
|
1,904
|
|
$
|
1,753
|
|
||
|
International Rental Car
|
448
|
|
416
|
|
389
|
|
|||||
|
All Other Operations
|
564
|
|
478
|
|
459
|
|
|||||
|
Total Hertz Global and Hertz
|
$
|
2,690
|
|
$
|
2,798
|
|
$
|
2,601
|
|
||
|
Depreciation and amortization, non-vehicle assets
|
|||||||||||
|
U.S. Rental Car
|
$
|
159
|
|
$
|
181
|
|
$
|
198
|
|
||
|
International Rental Car
|
32
|
|
33
|
|
33
|
|
|||||
|
All Other Operations
|
10
|
|
11
|
|
11
|
|
|||||
|
Corporate
|
17
|
|
15
|
|
23
|
|
|||||
|
Total Hertz Global and Hertz
|
$
|
218
|
|
$
|
240
|
|
$
|
265
|
|
||
|
Interest expense, net
|
|||||||||||
|
U.S. Rental Car
|
$
|
144
|
|
$
|
132
|
|
$
|
154
|
|
||
|
International Rental Car
|
113
|
|
80
|
|
66
|
|
|||||
|
All Other Operations
|
27
|
|
19
|
|
14
|
|
|||||
|
Corporate
|
455
|
|
406
|
|
390
|
|
|||||
|
Total Hertz Global
|
739
|
|
637
|
|
624
|
|
|||||
|
Hertz interest income from loan to Hertz Global
|
(7
|
)
|
(5
|
)
|
(1
|
)
|
|||||
|
Total - Hertz
|
$
|
732
|
|
$
|
632
|
|
$
|
623
|
|
||
|
Adjusted Pre-tax Income (Loss)
(a)
|
|||||||||||
|
U.S. Rental Car
|
$
|
262
|
|
$
|
13
|
|
$
|
298
|
|
||
|
International Rental Car
|
204
|
|
203
|
|
194
|
|
|||||
|
All Other Operations
|
94
|
|
80
|
|
72
|
|
|||||
|
Corporate
|
(579
|
)
|
(506
|
)
|
(499
|
)
|
|||||
|
Total Hertz Global
|
(19
|
)
|
(210
|
)
|
65
|
|
|||||
|
Corporate - Hertz
|
7
|
|
5
|
|
1
|
|
|||||
|
Total Hertz
|
$
|
(12
|
)
|
$
|
(205
|
)
|
$
|
66
|
|
||
143
HERTZ GLOBAL HOLDINGS, INC. AND SUBSIDIARIES
THE HERTZ CORPORATION AND SUBSIDIARIES
NOTES TO CONSOLIDATED FINANCIAL STATEMENTS (Continued)
|
As of December 31,
|
|||||||
|
(In millions)
|
2018
|
2017
|
|||||
|
Revenue earning vehicles, net
|
|||||||
|
U.S. Rental Car
|
$
|
8,793
|
|
$
|
7,761
|
|
|
|
International Rental Car
|
2,146
|
|
2,153
|
|
|||
|
All Other Operations
|
1,480
|
|
1,422
|
|
|||
|
Total Hertz Global and Hertz
|
$
|
12,419
|
|
$
|
11,336
|
|
|
|
Property and equipment, net
|
|||||||
|
U.S. Rental Car
|
$
|
564
|
|
$
|
602
|
|
|
|
International Rental Car
|
100
|
|
115
|
|
|||
|
All Other Operations
|
9
|
|
11
|
|
|||
|
Corporate
|
105
|
|
112
|
|
|||
|
Total Hertz Global and Hertz
|
$
|
778
|
|
$
|
840
|
|
|
|
Total assets
|
|||||||
|
U.S. Rental Car
|
$
|
13,983
|
|
$
|
12,785
|
|
|
|
International Rental Car
|
4,057
|
|
3,971
|
|
|||
|
All Other Operations
|
1,843
|
|
1,700
|
|
|||
|
Corporate
|
1,499
|
|
1,602
|
|
|||
|
Total Hertz Global and Hertz
|
$
|
21,382
|
|
$
|
20,058
|
|
|
|
Years Ended December 31,
|
|||||||||||
|
(In millions)
|
2018
|
2017
|
2016
|
||||||||
|
Revenue earning vehicles and capital assets, non-vehicle
|
|||||||||||
|
U.S. Rental Car:
|
|||||||||||
|
Expenditures
|
$
|
(8,597
|
)
|
$
|
(6,837
|
)
|
$
|
(7,376
|
)
|
||
|
Proceeds from disposals
|
5,570
|
|
4,882
|
|
6,010
|
|
|||||
|
Net expenditures - Hertz Global and Hertz
|
$
|
(3,027
|
)
|
$
|
(1,955
|
)
|
$
|
(1,366
|
)
|
||
|
International Rental Car:
|
|||||||||||
|
Expenditures
|
$
|
(3,191
|
)
|
$
|
(3,144
|
)
|
$
|
(2,868
|
)
|
||
|
Proceeds from disposals
|
2,755
|
|
2,606
|
|
2,504
|
|
|||||
|
Net expenditures - Hertz Global and Hertz
|
$
|
(436
|
)
|
$
|
(538
|
)
|
$
|
(364
|
)
|
||
|
All Other Operations:
|
|||||||||||
|
Expenditures
|
$
|
(807
|
)
|
$
|
(735
|
)
|
$
|
(729
|
)
|
||
|
Proceeds from disposals
|
176
|
|
182
|
|
209
|
|
|||||
|
Net expenditures - Hertz Global and Hertz
|
$
|
(631
|
)
|
$
|
(553
|
)
|
$
|
(520
|
)
|
||
|
Corporate:
|
|||||||||||
|
Expenditures
|
$
|
(75
|
)
|
$
|
(53
|
)
|
$
|
(33
|
)
|
||
|
Proceeds from disposals
|
2
|
|
4
|
|
15
|
|
|||||
|
Net expenditures - Hertz Global and Hertz
|
$
|
(73
|
)
|
$
|
(49
|
)
|
$
|
(18
|
)
|
||
144
HERTZ GLOBAL HOLDINGS, INC. AND SUBSIDIARIES
THE HERTZ CORPORATION AND SUBSIDIARIES
NOTES TO CONSOLIDATED FINANCIAL STATEMENTS (Continued)
The Company operates in the United States and in international countries. International operations are substantially in Europe. The operations within major geographic areas for each of Hertz Global and Hertz are summarized below:
|
Years Ended December 31,
|
|||||||||||
|
(In millions)
|
2018
|
2017
|
2016
|
||||||||
|
Revenues
|
|||||||||||
|
United States
|
$
|
7,211
|
|
$
|
6,620
|
|
$
|
6,690
|
|
||
|
International
|
2,293
|
|
2,183
|
|
2,113
|
|
|||||
|
Total Hertz Global and Hertz
|
$
|
9,504
|
|
$
|
8,803
|
|
$
|
8,803
|
|
||
|
As of December 31,
|
|||||||
|
(In millions)
|
2018
|
2017
|
|||||
|
Revenue earning vehicles, net
|
|||||||
|
United States
|
$
|
10,235
|
|
$
|
9,149
|
|
|
|
International
|
2,184
|
|
2,187
|
|
|||
|
Total Hertz Global and Hertz
|
$
|
12,419
|
|
$
|
11,336
|
|
|
|
Property and equipment, net
|
|||||||
|
United States
|
$
|
678
|
|
$
|
725
|
|
|
|
International
|
100
|
|
115
|
|
|||
|
Total Hertz Global and Hertz
|
$
|
778
|
|
$
|
840
|
|
|
|
Total assets
|
|||||||
|
United States
|
$
|
17,144
|
|
$
|
15,912
|
|
|
|
International
|
4,238
|
|
4,146
|
|
|||
|
Total Hertz Global and Hertz
|
$
|
21,382
|
|
$
|
20,058
|
|
|
|
(a)
|
Adjusted Pre-tax Income (Loss), the Company's segment profitability measure, is calculated as income (loss) from continuing operations before income taxes plus non-cash acquisition accounting charges, debt-related charges relating to the amortization and write-off of debt financing costs and debt discounts and premiums, goodwill, intangible and tangible asset impairments and write downs, information technology and finance transformation costs, income or loss attributable to noncontrolling interests, and certain other miscellaneous or non-recurring items.
|
Reconciliations of Adjusted Pre-tax Income (Loss) by segment to consolidated amounts are summarized below.
145
HERTZ GLOBAL HOLDINGS, INC. AND SUBSIDIARIES
THE HERTZ CORPORATION AND SUBSIDIARIES
NOTES TO CONSOLIDATED FINANCIAL STATEMENTS (Continued)
Hertz Global
|
Years Ended December 31,
|
|||||||||||
|
(In millions)
|
2018
|
2017
|
2016
|
||||||||
|
Adjusted Pre-tax Income (Loss):
|
|||||||||||
|
U.S. Rental Car
|
$
|
262
|
|
$
|
13
|
|
$
|
298
|
|
||
|
International Rental Car
|
204
|
|
203
|
|
194
|
|
|||||
|
All Other Operations
|
94
|
|
80
|
|
72
|
|
|||||
|
Total reportable segments
|
560
|
|
296
|
|
564
|
|
|||||
|
Corporate
(1)
|
(579
|
)
|
(506
|
)
|
(499
|
)
|
|||||
|
Adjusted Pre-tax Income (Loss)
|
(19
|
)
|
(210
|
)
|
65
|
|
|||||
|
Adjustments:
|
|||||||||||
|
Acquisition accounting
(2)
|
(62
|
)
|
(62
|
)
|
(65
|
)
|
|||||
|
Debt-related charges
(3)
|
(50
|
)
|
(47
|
)
|
(48
|
)
|
|||||
|
Loss on extinguishment of debt
(4)
|
(22
|
)
|
(13
|
)
|
(55
|
)
|
|||||
|
Restructuring and restructuring related charges
(5)
|
(32
|
)
|
(22
|
)
|
(53
|
)
|
|||||
|
Sale of CAR Inc. common stock
(6)
|
—
|
|
3
|
|
84
|
|
|||||
|
Impairment charges and asset write-downs
(7)
|
—
|
|
(118
|
)
|
(340
|
)
|
|||||
|
Information technology and finance transformation costs
(8)
|
(98
|
)
|
(68
|
)
|
(53
|
)
|
|||||
|
Other
(9)
|
26
|
|
(38
|
)
|
(5
|
)
|
|||||
|
Income (loss) from continuing operations before income taxes
|
$
|
(257
|
)
|
$
|
(575
|
)
|
$
|
(470
|
)
|
||
Hertz
|
Years Ended December 31,
|
|||||||||||
|
(In millions)
|
2018
|
2017
|
2016
|
||||||||
|
Adjusted Pre-tax Income (Loss):
|
|||||||||||
|
U.S. Rental Car
|
$
|
262
|
|
$
|
13
|
|
$
|
298
|
|
||
|
International Rental Car
|
204
|
|
203
|
|
194
|
|
|||||
|
All Other Operations
|
94
|
|
80
|
|
72
|
|
|||||
|
Total reportable segments
|
560
|
|
296
|
|
564
|
|
|||||
|
Corporate
(1)
|
(572
|
)
|
(501
|
)
|
(498
|
)
|
|||||
|
Adjusted Pre-tax Income (Loss)
|
(12
|
)
|
(205
|
)
|
66
|
|
|||||
|
Adjustments:
|
|||||||||||
|
Acquisition accounting
(2)
|
(62
|
)
|
(62
|
)
|
(65
|
)
|
|||||
|
Debt-related charges
(3)
|
(50
|
)
|
(47
|
)
|
(48
|
)
|
|||||
|
Loss on extinguishment of debt
(4)
|
(22
|
)
|
(13
|
)
|
(55
|
)
|
|||||
|
Restructuring and restructuring related charges
(5)
|
(32
|
)
|
(22
|
)
|
(53
|
)
|
|||||
|
Sale of CAR Inc. common stock
(6)
|
—
|
|
3
|
|
84
|
|
|||||
|
Impairment charges and asset write-downs
(7)
|
—
|
|
(118
|
)
|
(340
|
)
|
|||||
|
Information technology and finance transformation costs
(8)
|
(98
|
)
|
(68
|
)
|
(53
|
)
|
|||||
|
Other
(9)
|
26
|
|
(38
|
)
|
(5
|
)
|
|||||
|
Income (loss) from continuing operations before income taxes
|
$
|
(250
|
)
|
$
|
(570
|
)
|
$
|
(469
|
)
|
||
|
(1)
|
Represents general corporate expenses, non-vehicle interest expense, as well as other business activities.
|
|
(2)
|
Represents incremental expense associated with amortization of other intangible assets and depreciation of property and equipment relating to acquisition accounting.
|
146
HERTZ GLOBAL HOLDINGS, INC. AND SUBSIDIARIES
THE HERTZ CORPORATION AND SUBSIDIARIES
NOTES TO CONSOLIDATED FINANCIAL STATEMENTS (Continued)
|
(3)
|
Represents debt-related charges relating to the amortization of deferred financing costs and debt discounts and premiums.
|
|
(4)
|
In 2018, primarily comprised of
$20 million
of early redemption premium and write-off of deferred financing costs associated with the redemption of the outstanding
4.375%
European Vehicle
Notes due January 2019
. In 2017, comprised of
$6 million
of early redemption premium and write-off of deferred financing costs associated with the redemption of the outstanding 4.25% Senior Notes due April 2018 and
$7 million
write-off of deferred financing costs associated with the termination of commitments under the Senior RCF. In 2016, amount represents
$6 million
of deferred financing costs written off as a result of terminating and refinancing various vehicle debt,
$27 million
in early redemption premiums associated with the redemption of all of the outstanding 7.50% Senior Notes due October 2018 and a portion of the outstanding 6.75% Senior Notes due April 2019 and
$22 million
of deferred financing costs and debt discount written off as a result of paying off such Senior Notes and the Company's Senior Credit Facilities.
|
|
(5)
|
Represents charges incurred under restructuring actions as defined in U.S. GAAP, excluding impairments and asset write-downs, which are shown separately in the table. Also includes restructuring related charges such as incremental costs incurred directly supporting business transformation initiatives. Such costs include transition costs incurred in connection with business process outsourcing arrangements and incremental costs incurred to facilitate business process re-engineering initiatives that involve significant organization redesign and extensive operational process changes. Also includes consulting costs, legal fees, a net loss contingency of
$13.6 million
and other expenses related to the previously disclosed accounting review and investigation.
|
|
(6)
|
Represents the pre-tax gain on the sale of CAR Inc. common stock.
|
|
(7)
|
In 2017, primarily represents an
$86 million
impairment of the Dollar Thrifty tradename and an impairment of
$30 million
related to an equity method investment. In 2016, primarily comprised of a
$172 million
impairment of goodwill associated with the Company's vehicle rental operations in Europe, a
$120 million
impairment of the Dollar Thrifty tradename, a
$25 million
impairment of certain tangible assets used in the U.S. RAC segment in conjunction with a restructuring program and an
$18 million
impairment of the net assets held for sale related to the Company's Brazil operations.
|
|
(8)
|
Represents costs associated with the Company's information technology and finance transformation programs, both of which are multi-year initiatives to upgrade and modernize the Company's systems and processes.
|
|
(9)
|
Represents miscellaneous or non-recurring items, and includes amounts attributable to noncontrolling interests. In 2018, also includes a
$20 million
gain on marketable securities, and a
$6 million
legal settlement received in the second quarter related to an oil spill in the Gulf of Mexico in 2010. In 2017, also includes net expenses of
$16 million
resulting from hurricanes and charges of
$8 million
associated with strategic financings, partially offset by a
$6 million
gain on the sale of the Company's Brazil Operations and a
$4 million
return of capital from an equity method investment, and charges of
$5 million
relating to PLPD as a result of a terrorist event. In 2016, also includes a
$9 million
settlement gain from an eminent domain case related to one of the Company's airport locations.
|
Note 20
—
Quarterly Financial Information (Unaudited)
Provided below is a summary of the quarterly operating results during
2018
and
2017
. Amounts are computed independently each quarter. As a result, the sum of the quarter's amounts may not equal the total amount for the respective year.
Hertz Global
|
First
Quarter |
Second
Quarter |
Third
Quarter |
Fourth
Quarter |
||||||||||||
|
(In millions, except per share data)
|
2018
|
2018
|
2018
|
2018
|
|||||||||||
|
Total revenues
|
$
|
2,063
|
|
$
|
2,389
|
|
$
|
2,758
|
|
$
|
2,294
|
|
|||
|
Income (loss) from continuing operations before income taxes
|
(231
|
)
|
(86
|
)
|
181
|
|
(120
|
)
|
|||||||
|
Net income (loss) attributable to Hertz Global
|
(202
|
)
|
(63
|
)
|
141
|
|
(101
|
)
|
|||||||
|
Earnings (loss) per share:
|
|||||||||||||||
|
Basic
|
(2.43
|
)
|
(0.75
|
)
|
1.68
|
|
(1.20
|
)
|
|||||||
|
Diluted
|
(2.43
|
)
|
(0.75
|
)
|
1.68
|
|
(1.20
|
)
|
|||||||
147
HERTZ GLOBAL HOLDINGS, INC. AND SUBSIDIARIES
THE HERTZ CORPORATION AND SUBSIDIARIES
NOTES TO CONSOLIDATED FINANCIAL STATEMENTS (Continued)
|
First
Quarter |
Second
Quarter |
Third
Quarter |
Fourth
Quarter |
||||||||||||
|
(In millions, except per share data)
|
2017
|
2017
|
2017
|
2017
|
|||||||||||
|
Total revenues
|
$
|
1,916
|
|
$
|
2,224
|
|
$
|
2,572
|
|
$
|
2,091
|
|
|||
|
Income (loss) from continuing operations before income taxes
|
(294
|
)
|
(245
|
)
|
143
|
|
(179
|
)
|
|||||||
|
Net income (loss) attributable to Hertz Global
|
(223
|
)
|
(158
|
)
|
93
|
|
616
|
|
|||||||
|
Earnings (loss) per share:
|
|||||||||||||||
|
Basic
|
(2.69
|
)
|
(1.90
|
)
|
1.12
|
|
7.42
|
|
|||||||
|
Diluted
|
(2.69
|
)
|
(1.90
|
)
|
1.12
|
|
7.42
|
|
|||||||
Hertz
|
First
Quarter |
Second
Quarter |
Third
Quarter |
Fourth
Quarter |
||||||||||||
|
(In millions)
|
2018
|
2018
|
2018
|
2018
|
|||||||||||
|
Total revenues
|
$
|
2,063
|
|
$
|
2,389
|
|
$
|
2,758
|
|
$
|
2,294
|
|
|||
|
Income (loss) from continuing operations before income taxes
|
(230
|
)
|
(84
|
)
|
183
|
|
(118
|
)
|
|||||||
|
Net income (loss) attributable to Hertz
|
(201
|
)
|
(61
|
)
|
142
|
|
(99
|
)
|
|||||||
|
First
Quarter |
Second
Quarter |
Third
Quarter |
Fourth
Quarter |
||||||||||||
|
(In millions)
|
2017
|
2017
|
2017
|
2017
|
|||||||||||
|
Total revenues
|
$
|
1,916
|
|
$
|
2,224
|
|
$
|
2,572
|
|
$
|
2,091
|
|
|||
|
Income (loss) from continuing operations before income taxes
|
(293
|
)
|
(244
|
)
|
144
|
|
(178
|
)
|
|||||||
|
Net income (loss) attributable to Hertz
|
(222
|
)
|
(158
|
)
|
94
|
|
619
|
|
|||||||
In the fourth quarter 2017, the TCJA went into effect which contained wide-ranging changes to the U.S. tax structure, most notable of which was a reduction in the Company's tax rate, as further disclosed in
Note 13
, "
Income Tax (Provision) Benefit
."
Note 21
—
Guarantor and Non-Guarantor Annual Condensed Consolidating Financial Information - Hertz
The following tables present the Condensed Consolidating Balance Sheets as of
December 31, 2018 and 2017
and the Condensed Consolidating Statements of Operations and Comprehensive Income (Loss) and Statements of Cash Flows for the years ended
December 31, 2018, 2017 and 2016
, of (a) The Hertz Corporation ("Parent”); (b) the Parent's subsidiaries that guarantee the Senior Notes issued by the Parent ("Guarantor Subsidiaries"); (c) the Parent's subsidiaries that do not guarantee the Senior Notes issued by the Parent ("Non-Guarantor Subsidiaries"); (d) elimination entries necessary to consolidate the Parent with the Guarantor Subsidiaries and Non-Guarantor Subsidiaries ("Eliminations"); and of (e) Hertz on a consolidated basis.
Investments in subsidiaries are accounted for using the equity method for purposes of the consolidating presentation. The principal elimination entries relate to investments in subsidiaries and intercompany balances and transactions. The Guarantor Subsidiaries are 100% owned by the Parent and all guarantees are full and unconditional and joint and several. Additionally, substantially all of the assets of the Guarantor Subsidiaries are pledged under the Senior Facilities and Senior Second Priority Secured Notes, and consequently will not be available to satisfy the claims of Hertz general creditors. In lieu of providing separate unaudited financial statements for the Guarantor Subsidiaries, Hertz has included the accompanying condensed consolidating financial statements based on Rule 3-10 of the SEC's Regulation S-X. Management of Hertz does not believe that separate financial statements of the Guarantor Subsidiaries are material
148
HERTZ GLOBAL HOLDINGS, INC. AND SUBSIDIARIES
THE HERTZ CORPORATION AND SUBSIDIARIES
NOTES TO CONSOLIDATED FINANCIAL STATEMENTS (Continued)
to Hertz's investors; therefore, separate financial statements and other disclosures concerning the Guarantor Subsidiaries are not presented.
149
HERTZ GLOBAL HOLDINGS, INC. AND SUBSIDIARIES
THE HERTZ CORPORATION AND SUBSIDIARIES
NOTES TO CONSOLIDATED FINANCIAL STATEMENTS (Continued)
THE HERTZ CORPORATION AND SUBSIDIARIES
CONDENSED CONSOLIDATING BALANCE SHEET
December 31, 2018
(In millions)
|
Parent
(The Hertz
Corporation)
|
Guarantor
Subsidiaries
|
Non-
Guarantor
Subsidiaries
|
Eliminations
|
The Hertz
Corporation &
Subsidiaries
|
||||||||||||||||
|
ASSETS
|
||||||||||||||||||||
|
Cash and cash equivalents
|
$
|
576
|
|
$
|
3
|
|
$
|
548
|
|
$
|
—
|
|
$
|
1,127
|
|
|||||
|
Restricted cash and cash equivalents
|
137
|
|
8
|
|
138
|
|
—
|
|
283
|
|
||||||||||
|
Total cash, cash equivalents, restricted cash and restricted cash equivalents
|
713
|
|
11
|
|
686
|
|
—
|
|
1,410
|
|
||||||||||
|
Receivables, net of allowance
|
421
|
|
174
|
|
992
|
|
—
|
|
1,587
|
|
||||||||||
|
Due from affiliates
|
3,522
|
|
5,312
|
|
9,101
|
|
(17,935
|
)
|
—
|
|
||||||||||
|
Prepaid expenses and other assets
|
4,863
|
|
34
|
|
269
|
|
(4,264
|
)
|
902
|
|
||||||||||
|
Revenue earning vehicles, net
|
421
|
|
1
|
|
11,997
|
|
—
|
|
12,419
|
|
||||||||||
|
Property and equipment, net
|
590
|
|
64
|
|
124
|
|
—
|
|
778
|
|
||||||||||
|
Investment in subsidiaries, net
|
7,648
|
|
1,526
|
|
—
|
|
(9,174
|
)
|
—
|
|
||||||||||
|
Intangible assets, net
|
160
|
|
3,039
|
|
4
|
|
—
|
|
3,203
|
|
||||||||||
|
Goodwill
|
102
|
|
943
|
|
38
|
|
—
|
|
1,083
|
|
||||||||||
|
Total assets
|
$
|
18,440
|
|
$
|
11,104
|
|
$
|
23,211
|
|
$
|
(31,373
|
)
|
$
|
21,382
|
|
|||||
|
LIABILITIES AND STOCKHOLDER'S EQUITY
|
||||||||||||||||||||
|
Due to affiliates
|
$
|
11,351
|
|
$
|
2,306
|
|
$
|
4,278
|
|
$
|
(17,935
|
)
|
$
|
—
|
|
|||||
|
Accounts payable
|
388
|
|
97
|
|
503
|
|
—
|
|
988
|
|
||||||||||
|
Accrued liabilities
|
823
|
|
69
|
|
412
|
|
—
|
|
1,304
|
|
||||||||||
|
Accrued taxes, net
|
67
|
|
15
|
|
2,359
|
|
(2,305
|
)
|
136
|
|
||||||||||
|
Debt
|
4,567
|
|
—
|
|
11,757
|
|
—
|
|
16,324
|
|
||||||||||
|
Public liability and property damage
|
185
|
|
41
|
|
192
|
|
—
|
|
418
|
|
||||||||||
|
Deferred income taxes, net
|
—
|
|
1,729
|
|
1,324
|
|
(1,959
|
)
|
1,094
|
|
||||||||||
|
Total liabilities
|
17,381
|
|
4,257
|
|
20,825
|
|
(22,199
|
)
|
20,264
|
|
||||||||||
|
Stockholder's equity:
|
||||||||||||||||||||
|
Total stockholder's equity attributable to Hertz
|
1,059
|
|
6,847
|
|
2,327
|
|
(9,174
|
)
|
1,059
|
|
||||||||||
|
Noncontrolling interest
|
—
|
|
—
|
|
59
|
|
—
|
|
59
|
|
||||||||||
|
Total stockholder's equity
|
1,059
|
|
6,847
|
|
2,386
|
|
(9,174
|
)
|
1,118
|
|
||||||||||
|
Total liabilities and stockholder's equity
|
$
|
18,440
|
|
$
|
11,104
|
|
$
|
23,211
|
|
$
|
(31,373
|
)
|
$
|
21,382
|
|
|||||
150
HERTZ GLOBAL HOLDINGS, INC. AND SUBSIDIARIES
THE HERTZ CORPORATION AND SUBSIDIARIES
NOTES TO CONSOLIDATED FINANCIAL STATEMENTS (Continued)
THE HERTZ CORPORATION AND SUBSIDIARIES
CONDENSED CONSOLIDATING BALANCE SHEET
December 31, 2017
(In millions)
|
Parent
(The Hertz
Corporation)
|
Guarantor
Subsidiaries
|
Non-
Guarantor
Subsidiaries
|
Eliminations
|
The Hertz
Corporation &
Subsidiaries
|
||||||||||||||||
|
ASSETS
|
||||||||||||||||||||
|
Cash and cash equivalents
|
$
|
686
|
|
$
|
9
|
|
$
|
377
|
|
$
|
—
|
|
$
|
1,072
|
|
|||||
|
Restricted cash and cash equivalents
|
225
|
|
7
|
|
200
|
|
—
|
|
432
|
|
||||||||||
|
Total cash, cash equivalents, restricted cash and restricted cash equivalents
|
911
|
|
16
|
|
577
|
|
—
|
|
1,504
|
|
||||||||||
|
Receivables, net of allowance
|
366
|
|
167
|
|
832
|
|
—
|
|
1,365
|
|
||||||||||
|
Due from affiliates
|
3,373
|
|
4,567
|
|
8,794
|
|
(16,734
|
)
|
—
|
|
||||||||||
|
Prepaid expenses and other assets
|
3,747
|
|
37
|
|
302
|
|
(3,399
|
)
|
687
|
|
||||||||||
|
Revenue earning vehicles, net
|
352
|
|
2
|
|
10,982
|
|
—
|
|
11,336
|
|
||||||||||
|
Property and equipment, net
|
639
|
|
61
|
|
140
|
|
—
|
|
840
|
|
||||||||||
|
Investment in subsidiaries, net
|
7,966
|
|
1,265
|
|
—
|
|
(9,231
|
)
|
—
|
|
||||||||||
|
Intangible assets, net
|
141
|
|
3,091
|
|
10
|
|
—
|
|
3,242
|
|
||||||||||
|
Goodwill
|
102
|
|
944
|
|
38
|
|
—
|
|
1,084
|
|
||||||||||
|
Total assets
|
$
|
17,597
|
|
$
|
10,150
|
|
$
|
21,675
|
|
$
|
(29,364
|
)
|
$
|
20,058
|
|
|||||
|
LIABILITIES AND STOCKHOLDER'S EQUITY
|
||||||||||||||||||||
|
Due to affiliates
|
$
|
10,368
|
|
$
|
2,156
|
|
$
|
4,210
|
|
$
|
(16,734
|
)
|
$
|
—
|
|
|||||
|
Accounts payable
|
375
|
|
92
|
|
479
|
|
—
|
|
946
|
|
||||||||||
|
Accrued liabilities
|
473
|
|
73
|
|
374
|
|
—
|
|
920
|
|
||||||||||
|
Accrued taxes, net
|
77
|
|
21
|
|
2,235
|
|
(2,173
|
)
|
160
|
|
||||||||||
|
Debt
|
4,619
|
|
—
|
|
10,246
|
|
—
|
|
14,865
|
|
||||||||||
|
Public liability and property damage
|
165
|
|
37
|
|
225
|
|
—
|
|
427
|
|
||||||||||
|
Deferred income taxes, net
|
—
|
|
1,451
|
|
995
|
|
(1,226
|
)
|
1,220
|
|
||||||||||
|
Total liabilities
|
16,077
|
|
3,830
|
|
18,764
|
|
(20,133
|
)
|
18,538
|
|
||||||||||
|
Stockholder's equity:
|
||||||||||||||||||||
|
Total stockholder's equity
|
1,520
|
|
6,320
|
|
2,911
|
|
(9,231
|
)
|
1,520
|
|
||||||||||
|
Total liabilities and stockholder's equity
|
$
|
17,597
|
|
$
|
10,150
|
|
$
|
21,675
|
|
$
|
(29,364
|
)
|
$
|
20,058
|
|
|||||
151
HERTZ GLOBAL HOLDINGS, INC. AND SUBSIDIARIES
THE HERTZ CORPORATION AND SUBSIDIARIES
NOTES TO CONSOLIDATED FINANCIAL STATEMENTS (Continued)
THE HERTZ CORPORATION AND SUBSIDIARIES
CONDENSED CONSOLIDATING STATEMENT OF OPERATIONS AND COMPREHENSIVE INCOME (LOSS)
For the Year Ended
December 31, 2018
(In millions)
|
Parent
(The Hertz
Corporation)
|
Guarantor
Subsidiaries
|
Non-
Guarantor
Subsidiaries
|
Eliminations
|
The Hertz
Corporation &
Subsidiaries
|
||||||||||||||||
|
Total revenues
|
$
|
4,769
|
|
$
|
1,448
|
|
$
|
7,785
|
|
$
|
(4,498
|
)
|
$
|
9,504
|
|
|||||
|
Expenses:
|
|
|
||||||||||||||||||
|
Direct vehicle and operating
|
3,286
|
|
711
|
|
1,358
|
|
—
|
|
5,355
|
|
||||||||||
|
Depreciation of revenue earning vehicles and lease charges, net
|
4,268
|
|
354
|
|
2,566
|
|
(4,498
|
)
|
2,690
|
|
||||||||||
|
Selling, general and administrative
|
681
|
|
69
|
|
267
|
|
—
|
|
1,017
|
|
||||||||||
|
Interest (income) expense, net
|
416
|
|
(155
|
)
|
471
|
|
—
|
|
732
|
|
||||||||||
|
Other (income) expense, net
|
(33
|
)
|
—
|
|
(7
|
)
|
—
|
|
(40
|
)
|
||||||||||
|
Total expenses
|
8,618
|
|
979
|
|
4,655
|
|
(4,498
|
)
|
9,754
|
|
||||||||||
|
Income (loss) before income taxes and equity in earnings (losses) of subsidiaries
|
(3,849
|
)
|
469
|
|
3,130
|
|
—
|
|
(250
|
)
|
||||||||||
|
Income tax (provision) benefit
|
807
|
|
(102
|
)
|
(677
|
)
|
—
|
|
28
|
|
||||||||||
|
Equity in earnings (losses) of subsidiaries, net of tax
|
2,822
|
|
291
|
|
—
|
|
(3,113
|
)
|
—
|
|
||||||||||
|
Net income (loss)
|
(220
|
)
|
658
|
|
2,453
|
|
(3,113
|
)
|
(222
|
)
|
||||||||||
|
Net (income) loss attributable to noncontrolling interests
|
—
|
|
—
|
|
2
|
|
—
|
|
2
|
|
||||||||||
|
Net income (loss) attributable to Hertz
|
(220
|
)
|
658
|
|
2,455
|
|
(3,113
|
)
|
(220
|
)
|
||||||||||
|
Total other comprehensive income (loss), net of tax
|
(63
|
)
|
(7
|
)
|
(33
|
)
|
40
|
|
(63
|
)
|
||||||||||
|
Comprehensive income (loss) attributable to Hertz
|
$
|
(283
|
)
|
$
|
651
|
|
$
|
2,422
|
|
$
|
(3,073
|
)
|
$
|
(283
|
)
|
|||||
For the Year Ended
December 31, 2017
(In millions)
|
Parent
(The Hertz
Corporation)
|
Guarantor
Subsidiaries
|
Non-
Guarantor
Subsidiaries
|
Eliminations
|
The Hertz
Corporation &
Subsidiaries
|
||||||||||||||||
|
Total revenues
|
$
|
4,361
|
|
$
|
1,381
|
|
$
|
6,442
|
|
$
|
(3,381
|
)
|
$
|
8,803
|
|
|||||
|
Expenses:
|
||||||||||||||||||||
|
Direct vehicle and operating
|
2,937
|
|
698
|
|
1,323
|
|
—
|
|
4,958
|
|
||||||||||
|
Depreciation of revenue earning vehicles and lease charges, net
|
3,157
|
|
413
|
|
2,609
|
|
(3,381
|
)
|
2,798
|
|
||||||||||
|
Selling, general and administrative
|
612
|
|
37
|
|
231
|
|
—
|
|
880
|
|
||||||||||
|
Interest (income) expense, net
|
400
|
|
(105
|
)
|
337
|
|
—
|
|
632
|
|
||||||||||
|
Goodwill and intangible asset impairments
|
—
|
|
86
|
|
—
|
|
—
|
|
86
|
|
||||||||||
|
Other (income) expense, net
|
30
|
|
—
|
|
(11
|
)
|
—
|
|
19
|
|
||||||||||
|
Total expenses
|
7,136
|
|
1,129
|
|
4,489
|
|
(3,381
|
)
|
9,373
|
|
||||||||||
|
Income (loss) before income taxes and equity in earnings (losses) of subsidiaries
|
(2,775
|
)
|
252
|
|
1,953
|
|
—
|
|
(570
|
)
|
||||||||||
|
Income tax (provision) benefit
|
(925
|
)
|
311
|
|
1,516
|
|
—
|
|
902
|
|
||||||||||
|
Equity in earnings (losses) of subsidiaries, net of tax
|
4,032
|
|
629
|
|
—
|
|
(4,661
|
)
|
—
|
|
||||||||||
|
Net income (loss)
|
332
|
|
1,192
|
|
3,469
|
|
(4,661
|
)
|
332
|
|
||||||||||
|
Total other comprehensive income (loss), net of tax
|
53
|
|
6
|
|
22
|
|
(28
|
)
|
53
|
|
||||||||||
|
Comprehensive income (loss)
|
$
|
385
|
|
$
|
1,198
|
|
$
|
3,491
|
|
$
|
(4,689
|
)
|
$
|
385
|
|
|||||
152
HERTZ GLOBAL HOLDINGS, INC. AND SUBSIDIARIES
THE HERTZ CORPORATION AND SUBSIDIARIES
NOTES TO CONSOLIDATED FINANCIAL STATEMENTS (Continued)
THE HERTZ CORPORATION AND SUBSIDIARIES
CONDENSED CONSOLIDATING STATEMENT OF OPERATIONS AND COMPREHENSIVE INCOME (LOSS)
For the Year Ended
December 31, 2016
(In millions)
|
Parent
(The Hertz
Corporation)
|
Guarantor
Subsidiaries
|
Non-
Guarantor
Subsidiaries
|
Eliminations
|
The Hertz
Corporation &
Subsidiaries
|
||||||||||||||||
|
Total revenues
|
$
|
4,604
|
|
$
|
1,483
|
|
$
|
6,022
|
|
$
|
(3,306
|
)
|
$
|
8,803
|
|
|||||
|
Expenses:
|
||||||||||||||||||||
|
Direct vehicle and operating
|
2,909
|
|
761
|
|
1,263
|
|
(1
|
)
|
4,932
|
|
||||||||||
|
Depreciation of revenue earning vehicles and lease charges, net
|
2,766
|
|
685
|
|
2,453
|
|
(3,303
|
)
|
2,601
|
|
||||||||||
|
Selling, general and administrative
|
602
|
|
51
|
|
248
|
|
(2
|
)
|
899
|
|
||||||||||
|
Interest (income) expense, net
|
407
|
|
(58
|
)
|
274
|
|
—
|
|
623
|
|
||||||||||
|
Goodwill and intangible asset impairments
|
—
|
|
120
|
|
172
|
|
—
|
|
292
|
|
||||||||||
|
Other (income) expense, net
|
6
|
|
(10
|
)
|
(71
|
)
|
—
|
|
(75
|
)
|
||||||||||
|
Total expenses
|
6,690
|
|
1,549
|
|
4,339
|
|
(3,306
|
)
|
9,272
|
|
||||||||||
|
Income (loss) from continuing operations before income taxes and equity in earnings (losses) of subsidiaries
|
(2,086
|
)
|
(66
|
)
|
1,683
|
|
—
|
|
(469
|
)
|
||||||||||
|
Income tax (provision) benefit
|
682
|
|
(26
|
)
|
(660
|
)
|
—
|
|
(4
|
)
|
||||||||||
|
Equity in earnings (losses) of subsidiaries, net of tax
|
916
|
|
266
|
|
—
|
|
(1,182
|
)
|
—
|
|
||||||||||
|
Net income (loss) from continuing operations
|
(488
|
)
|
174
|
|
1,023
|
|
(1,182
|
)
|
(473
|
)
|
||||||||||
|
Net income (loss) from discontinued operations
|
—
|
|
(5
|
)
|
(10
|
)
|
—
|
|
(15
|
)
|
||||||||||
|
Net income (loss)
|
(488
|
)
|
169
|
|
1,013
|
|
(1,182
|
)
|
(488
|
)
|
||||||||||
|
Total other comprehensive income (loss), net of tax
|
(29
|
)
|
7
|
|
(47
|
)
|
40
|
|
(29
|
)
|
||||||||||
|
Comprehensive income (loss)
|
$
|
(517
|
)
|
$
|
176
|
|
$
|
966
|
|
$
|
(1,142
|
)
|
$
|
(517
|
)
|
|||||
153
HERTZ GLOBAL HOLDINGS, INC. AND SUBSIDIARIES
THE HERTZ CORPORATION AND SUBSIDIARIES
NOTES TO CONSOLIDATED FINANCIAL STATEMENTS (Continued)
THE HERTZ CORPORATION AND SUBSIDIARIES
CONDENSED CONSOLIDATING STATEMENT OF CASH FLOWS
For the Year Ended
December 31, 2018
(In millions)
|
Parent
(The Hertz
Corporation)
|
Guarantor
Subsidiaries
|
Non-
Guarantor
Subsidiaries
|
Eliminations
|
The Hertz
Corporation &
Subsidiaries
|
|||||||||||||||
|
Net cash provided by (used in) operating activities
|
$
|
468
|
|
$
|
5
|
|
$
|
4,684
|
|
$
|
(2,594
|
)
|
$
|
2,563
|
|
||||
|
Cash flows from investing activities:
|
|||||||||||||||||||
|
Revenue earning vehicles expenditures
|
(408
|
)
|
—
|
|
(12,085
|
)
|
—
|
|
(12,493
|
)
|
|||||||||
|
Proceeds from disposal of revenue earning vehicles
|
276
|
|
—
|
|
8,176
|
|
—
|
|
8,452
|
|
|||||||||
|
Capital asset expenditures, non-vehicle
|
(134
|
)
|
(10
|
)
|
(33
|
)
|
—
|
|
(177
|
)
|
|||||||||
|
Proceeds from property and other equipment disposed of or to be disposed of
|
36
|
|
—
|
|
15
|
|
—
|
|
51
|
|
|||||||||
|
Purchases of marketable securities
|
(60
|
)
|
—
|
|
—
|
|
—
|
|
(60
|
)
|
|||||||||
|
Sales of marketable securities
|
36
|
|
—
|
|
—
|
|
—
|
|
36
|
|
|||||||||
|
Acquisitions, net of cash acquired
|
(2
|
)
|
—
|
|
—
|
|
—
|
|
(2
|
)
|
|||||||||
|
Other
|
—
|
|
—
|
|
(4
|
)
|
—
|
|
(4
|
)
|
|||||||||
|
Capital contributions to subsidiaries
|
(3,178
|
)
|
—
|
|
—
|
|
3,178
|
|
—
|
|
|||||||||
|
Return of capital from subsidiaries
|
2,832
|
|
—
|
|
—
|
|
(2,832
|
)
|
—
|
|
|||||||||
|
Net cash provided by (used in) investing activities
|
(602
|
)
|
(10
|
)
|
(3,931
|
)
|
346
|
|
(4,197
|
)
|
|||||||||
|
Cash flows from financing activities:
|
|||||||||||||||||||
|
Proceeds from issuance of vehicle debt
|
2,328
|
|
—
|
|
11,681
|
|
—
|
|
14,009
|
|
|||||||||
|
Repayments of vehicle debt
|
(2,368
|
)
|
—
|
|
(10,058
|
)
|
—
|
|
(12,426
|
)
|
|||||||||
|
Proceeds from issuance of non-vehicle debt
|
557
|
|
—
|
|
—
|
|
—
|
|
557
|
|
|||||||||
|
Repayments of non-vehicle debt
|
(571
|
)
|
—
|
|
—
|
|
—
|
|
(571
|
)
|
|||||||||
|
Payment of financing costs
|
(1
|
)
|
—
|
|
(46
|
)
|
—
|
|
(47
|
)
|
|||||||||
|
Early redemption premium payment
|
—
|
|
—
|
|
(19
|
)
|
—
|
|
(19
|
)
|
|||||||||
|
Advances to Hertz Holdings
|
(9
|
)
|
—
|
|
—
|
|
—
|
|
(9
|
)
|
|||||||||
|
Contributions from noncontrolling interests
|
—
|
|
—
|
|
60
|
|
—
|
|
60
|
|
|||||||||
|
Capital contributions received from parent
|
—
|
|
—
|
|
3,178
|
|
(3,178
|
)
|
—
|
|
|||||||||
|
Payment of dividends and return of capital
|
—
|
|
—
|
|
(5,426
|
)
|
5,426
|
|
—
|
|
|||||||||
|
Net cash provided by (used in) financing activities
|
(64
|
)
|
—
|
|
(630
|
)
|
2,248
|
|
1,554
|
|
|||||||||
|
Effect of foreign currency exchange rate changes on cash, cash equivalents, restricted cash and restricted cash equivalents
|
—
|
|
—
|
|
(14
|
)
|
—
|
|
(14
|
)
|
|||||||||
|
Net increase (decrease) in cash, cash equivalents, restricted cash and restricted cash equivalents during the period
|
(198
|
)
|
(5
|
)
|
109
|
|
—
|
|
(94
|
)
|
|||||||||
|
Cash, cash equivalents, restricted cash and restricted cash equivalents at beginning of period
|
911
|
|
16
|
|
577
|
|
—
|
|
1,504
|
|
|||||||||
|
Cash, cash equivalents, restricted cash and restricted cash equivalents at end of period
|
$
|
713
|
|
$
|
11
|
|
$
|
686
|
|
$
|
—
|
|
$
|
1,410
|
|
||||
154
HERTZ GLOBAL HOLDINGS, INC. AND SUBSIDIARIES
THE HERTZ CORPORATION AND SUBSIDIARIES
NOTES TO CONSOLIDATED FINANCIAL STATEMENTS (Continued)
THE HERTZ CORPORATION AND SUBSIDIARIES
CONDENSED CONSOLIDATING STATEMENT OF CASH FLOWS
For the Year Ended
December 31, 2017
(In millions)
|
Parent
(The Hertz
Corporation)
|
Guarantor
Subsidiaries
|
Non-
Guarantor
Subsidiaries
|
Eliminations
|
The Hertz
Corporation &
Subsidiaries
|
|||||||||||||||
|
Net cash provided by (used in) operating activities
|
$
|
246
|
|
$
|
28
|
|
$
|
3,501
|
|
$
|
(1,376
|
)
|
$
|
2,399
|
|
||||
|
Cash flows from investing activities:
|
|||||||||||||||||||
|
Revenue earning vehicles expenditures
|
(314
|
)
|
(5
|
)
|
(10,277
|
)
|
—
|
|
(10,596
|
)
|
|||||||||
|
Proceeds from disposal of revenue earning vehicles
|
213
|
|
—
|
|
7,440
|
|
—
|
|
7,653
|
|
|||||||||
|
Capital asset expenditures, non-vehicle
|
(122
|
)
|
(11
|
)
|
(40
|
)
|
—
|
|
(173
|
)
|
|||||||||
|
Proceeds from disposal of property and other equipment
|
7
|
|
—
|
|
14
|
|
—
|
|
21
|
|
|||||||||
|
Proceeds from sale of Brazil Operations, net of retained cash
|
—
|
|
—
|
|
94
|
|
—
|
|
94
|
|
|||||||||
|
Sales of marketable securities
|
—
|
|
—
|
|
9
|
|
—
|
|
9
|
|
|||||||||
|
Sales of shares in equity investment, net of amounts invested
|
7
|
|
—
|
|
—
|
|
—
|
|
7
|
|
|||||||||
|
Acquisitions, net of cash acquired
|
—
|
|
(10
|
)
|
(5
|
)
|
—
|
|
(15
|
)
|
|||||||||
|
Capital contributions to subsidiaries
|
(2,979
|
)
|
—
|
|
—
|
|
2,979
|
|
—
|
|
|||||||||
|
Return of capital from subsidiaries
|
2,861
|
|
—
|
|
—
|
|
(2,861
|
)
|
—
|
|
|||||||||
|
Loan to Parent/Guarantor from Non-Guarantor
|
—
|
|
—
|
|
19
|
|
(19
|
)
|
—
|
|
|||||||||
|
Net cash provided by (used in) investing activities
|
(327
|
)
|
(26
|
)
|
(2,746
|
)
|
99
|
|
(3,000
|
)
|
|||||||||
|
Cash flows from financing activities:
|
|||||||||||||||||||
|
Proceeds from issuance of vehicle debt
|
1,789
|
|
—
|
|
8,967
|
|
—
|
|
10,756
|
|
|||||||||
|
Repayments of vehicle debt
|
(1,796
|
)
|
—
|
|
(8,448
|
)
|
—
|
|
(10,244
|
)
|
|||||||||
|
Proceeds from issuance of non-vehicle debt
|
2,100
|
|
—
|
|
—
|
|
—
|
|
2,100
|
|
|||||||||
|
Repayments of non-vehicle debt
|
(1,560
|
)
|
—
|
|
—
|
|
—
|
|
(1,560
|
)
|
|||||||||
|
Payment of financing costs
|
(23
|
)
|
(4
|
)
|
(32
|
)
|
—
|
|
(59
|
)
|
|||||||||
|
Early redemption premium payment
|
(5
|
)
|
—
|
|
—
|
|
—
|
|
(5
|
)
|
|||||||||
|
Advances to Hertz Holdings
|
(6
|
)
|
—
|
|
—
|
|
—
|
|
(6
|
)
|
|||||||||
|
Other
|
1
|
|
—
|
|
—
|
|
—
|
|
1
|
|
|||||||||
|
Capital contributions received from parent
|
—
|
|
—
|
|
2,979
|
|
(2,979
|
)
|
—
|
|
|||||||||
|
Payment of dividends and return of capital
|
—
|
|
—
|
|
(4,237
|
)
|
4,237
|
|
—
|
|
|||||||||
|
Loan to Parent/Guarantor from Non-Guarantor
|
(19
|
)
|
—
|
|
—
|
|
19
|
|
—
|
|
|||||||||
|
Net cash provided by (used in) financing activities
|
481
|
|
(4
|
)
|
(771
|
)
|
1,277
|
|
983
|
|
|||||||||
|
Effect of foreign currency exchange rate changes on cash, cash equivalents, restricted cash and restricted cash equivalents
|
—
|
|
—
|
|
28
|
|
—
|
|
28
|
|
|||||||||
|
Net increase (decrease) in cash, cash equivalents, restricted cash and restricted cash equivalents during the period
|
400
|
|
(2
|
)
|
12
|
|
—
|
|
410
|
|
|||||||||
|
Cash, cash equivalents, restricted cash and restricted cash equivalents at beginning of period
|
511
|
|
18
|
|
565
|
|
—
|
|
1,094
|
|
|||||||||
|
Cash, cash equivalents, restricted cash and restricted cash equivalents at end of period
|
$
|
911
|
|
$
|
16
|
|
$
|
577
|
|
$
|
—
|
|
$
|
1,504
|
|
||||
155
HERTZ GLOBAL HOLDINGS, INC. AND SUBSIDIARIES
THE HERTZ CORPORATION AND SUBSIDIARIES
NOTES TO CONSOLIDATED FINANCIAL STATEMENTS (Continued)
THE HERTZ CORPORATION AND SUBSIDIARIES
CONDENSED CONSOLIDATING STATEMENT OF CASH FLOWS
For the Year Ended
December 31, 2016
(In millions)
|
Parent
(The Hertz
Corporation)
|
Guarantor
Subsidiaries
|
Non-
Guarantor
Subsidiaries
|
Eliminations
|
The Hertz
Corporation &
Subsidiaries
|
|||||||||||||||
|
Net cash provided by (used in) operating activities from continuing operations
|
$
|
(1,892
|
)
|
$
|
85
|
|
$
|
5,151
|
|
$
|
(814
|
)
|
$
|
2,530
|
|
||||
|
Cash flows from investing activities:
|
|||||||||||||||||||
|
Revenue earning vehicles expenditures
|
(342
|
)
|
(69
|
)
|
(10,461
|
)
|
—
|
|
(10,872
|
)
|
|||||||||
|
Proceeds from disposal of revenue earning vehicles
|
417
|
|
—
|
|
8,262
|
|
—
|
|
8,679
|
|
|||||||||
|
Capital asset expenditures, non-vehicle
|
(80
|
)
|
(16
|
)
|
(38
|
)
|
—
|
|
(134
|
)
|
|||||||||
|
Proceeds from disposal of property and other equipment
|
35
|
|
1
|
|
23
|
|
—
|
|
59
|
|
|||||||||
|
Sales of marketable securities
|
—
|
|
—
|
|
267
|
|
—
|
|
267
|
|
|||||||||
|
Sales of shares in equity investment, net of amounts invested
|
(45
|
)
|
—
|
|
—
|
|
—
|
|
(45
|
)
|
|||||||||
|
Acquisitions, net of cash acquired
|
—
|
|
—
|
|
(2
|
)
|
—
|
|
(2
|
)
|
|||||||||
|
Capital contributions to subsidiaries
|
(2,368
|
)
|
—
|
|
—
|
|
2,368
|
|
—
|
|
|||||||||
|
Return of capital from subsidiaries
|
3,585
|
|
—
|
|
—
|
|
(3,585
|
)
|
—
|
|
|||||||||
|
Loan to Parent/Guarantor from Non-Guarantor
|
—
|
|
—
|
|
(1,055
|
)
|
1,055
|
|
—
|
|
|||||||||
|
Net cash provided by (used in) investing activities from continuing operations
|
1,202
|
|
(84
|
)
|
(3,004
|
)
|
(162
|
)
|
(2,048
|
)
|
|||||||||
|
Cash flows from financing activities:
|
|||||||||||||||||||
|
Proceeds from issuance of vehicle debt
|
716
|
|
—
|
|
8,976
|
|
—
|
|
9,692
|
|
|||||||||
|
Repayments of vehicle debt
|
(707
|
)
|
—
|
|
(9,041
|
)
|
—
|
|
(9,748
|
)
|
|||||||||
|
Proceeds from issuance of non-vehicle debt
|
2,592
|
|
—
|
|
—
|
|
—
|
|
2,592
|
|
|||||||||
|
Repayments of non-vehicle debt
|
(4,651
|
)
|
—
|
|
—
|
|
—
|
|
(4,651
|
)
|
|||||||||
|
Payment of financing costs
|
(46
|
)
|
(3
|
)
|
(26
|
)
|
—
|
|
(75
|
)
|
|||||||||
|
Early redemption premium payment
|
(27
|
)
|
—
|
|
—
|
|
—
|
|
(27
|
)
|
|||||||||
|
Transfers from discontinued entities
|
2,122
|
|
—
|
|
—
|
|
—
|
|
2,122
|
|
|||||||||
|
Advances to Hertz Holdings
|
(102
|
)
|
—
|
|
—
|
|
—
|
|
(102
|
)
|
|||||||||
|
Other
|
13
|
|
—
|
|
—
|
|
—
|
|
13
|
|
|||||||||
|
Capital contributions received from parent
|
—
|
|
—
|
|
2,368
|
|
(2,368
|
)
|
—
|
|
|||||||||
|
Payment of dividends and return of capital
|
—
|
|
—
|
|
(4,399
|
)
|
4,399
|
|
—
|
|
|||||||||
|
Loan to Parent/Guarantor from Non-Guarantor
|
1,055
|
|
—
|
|
—
|
|
(1,055
|
)
|
—
|
|
|||||||||
|
Net cash provided by (used in) financing activities from continuing operations
|
965
|
|
(3
|
)
|
(2,122
|
)
|
976
|
|
(184
|
)
|
|||||||||
|
Effect of foreign currency exchange rate changes on cash, cash equivalents, restricted cash and restricted cash equivalents
|
—
|
|
—
|
|
(11
|
)
|
—
|
|
(11
|
)
|
|||||||||
|
Net increase (decrease) in cash, cash equivalents, restricted cash and restricted cash equivalents during the period
|
275
|
|
(2
|
)
|
14
|
|
—
|
|
287
|
|
|||||||||
|
Cash, cash equivalents, restricted cash and restricted cash equivalents at beginning of period
|
236
|
|
20
|
|
551
|
|
—
|
|
807
|
|
|||||||||
|
Cash, cash equivalents, restricted cash and restricted cash equivalents at end of period
|
$
|
511
|
|
$
|
18
|
|
$
|
565
|
|
$
|
—
|
|
$
|
1,094
|
|
||||
|
Cash flows from discontinued operations:
|
|||||||||||||||||||
|
Cash flows provided by (used in) operating activities
|
$
|
—
|
|
$
|
59
|
|
$
|
148
|
|
$
|
—
|
|
$
|
207
|
|
||||
|
Cash flows provided by (used in) investing activities
|
—
|
|
(75
|
)
|
(2
|
)
|
—
|
|
(77
|
)
|
|||||||||
|
Cash flows provided by (used in) financing activities
|
—
|
|
44
|
|
(138
|
)
|
—
|
|
(94
|
)
|
|||||||||
|
Net increase (decrease) in cash, cash equivalents, restricted cash and restricted cash equivalents during the period from discontinued operations
|
$
|
—
|
|
$
|
28
|
|
$
|
8
|
|
$
|
—
|
|
$
|
36
|
|
||||
156
SCHEDULE I
CONDENSED FINANCIAL INFORMATION OF REGISTRANT
HERTZ GLOBAL HOLDINGS, INC.
PARENT COMPANY BALANCE SHEETS
(In millions, except par value)
|
December 31,
|
|||||||
|
2018
|
2017
|
||||||
|
ASSETS
|
|||||||
|
Cash and cash equivalents
|
$
|
—
|
|
$
|
—
|
|
|
|
Investments in subsidiaries, net
|
1,059
|
|
1,520
|
|
|||
|
Deferred income taxes, net
|
2
|
|
—
|
|
|||
|
Total assets
|
$
|
1,061
|
|
$
|
1,520
|
|
|
|
STOCKHOLDERS' EQUITY
|
|||||||
|
Preferred stock, $0.01 par value, no shares issued and outstanding
|
$
|
—
|
|
$
|
—
|
|
|
|
Common stock, $0.01 par value, 86 and 86 shares issued, respectively and 84 and 84 shares outstanding, respectively
|
1
|
|
1
|
|
|||
|
Additional paid-in capital
|
2,261
|
|
2,243
|
|
|||
|
Accumulated deficit
|
(909
|
)
|
(506
|
)
|
|||
|
Accumulated other comprehensive income (loss)
|
(192
|
)
|
(118
|
)
|
|||
|
1,161
|
|
1,620
|
|
||||
|
Treasury stock, at cost, 2 shares and 2 shares, respectively
|
(100
|
)
|
(100
|
)
|
|||
|
Total stockholders' equity
|
$
|
1,061
|
|
$
|
1,520
|
|
|
The accompanying notes are an integral part of these financial statements.
PARENT COMPANY STATEMENTS OF OPERATIONS
(In millions)
|
Years Ended December 31,
|
|||||||||||
|
2018
|
2017
|
2016
|
|||||||||
|
Total Revenues
|
$
|
—
|
|
$
|
—
|
|
$
|
—
|
|
||
|
Expenses:
|
|||||||||||
|
Interest expense, net
|
7
|
|
5
|
|
1
|
|
|||||
|
Total expenses
|
7
|
|
5
|
|
1
|
|
|||||
|
Income (loss) from continuing operations before income taxes and equity in earnings (losses) of subsidiaries
|
(7
|
)
|
(5
|
)
|
(1
|
)
|
|||||
|
Income tax (provision) benefit
|
2
|
|
—
|
|
—
|
|
|||||
|
Equity in earnings (losses) of subsidiaries, net of tax
|
(220
|
)
|
332
|
|
(488
|
)
|
|||||
|
Net income (loss) from continuing operations
|
(225
|
)
|
327
|
|
(489
|
)
|
|||||
|
Net income (loss) from discontinued operations
|
—
|
|
—
|
|
(2
|
)
|
|||||
|
Net income (loss)
|
$
|
(225
|
)
|
$
|
327
|
|
$
|
(491
|
)
|
||
The accompanying notes are an integral part of these financial statements.
157
SCHEDULE I (Continued)
CONDENSED FINANCIAL INFORMATION OF REGISTRANT
HERTZ GLOBAL HOLDINGS, INC.
PARENT COMPANY STATEMENTS OF COMPREHENSIVE INCOME (LOSS)
(In millions)
|
Years Ended December 31,
|
|||||||||||
|
2018
|
2017
|
2016
|
|||||||||
|
Net income (loss)
|
$
|
(225
|
)
|
$
|
327
|
|
$
|
(491
|
)
|
||
|
Total other comprehensive income (loss)
|
(63
|
)
|
53
|
|
(29
|
)
|
|||||
|
Total comprehensive income (loss)
|
$
|
(288
|
)
|
$
|
380
|
|
$
|
(520
|
)
|
||
The accompanying notes are an integral part of these financial statements.
PARENT COMPANY STATEMENTS OF CASH FLOWS
(In millions)
|
Years Ended December 31,
|
|||||||||||
|
2018
|
2017
|
2016
|
|||||||||
|
Net cash provided by (used in) operating activities
|
$
|
(7
|
)
|
$
|
(5
|
)
|
$
|
(1
|
)
|
||
|
Cash flows from financing activities:
|
|||||||||||
|
Proceeds from exercise of stock options
|
—
|
|
—
|
|
11
|
|
|||||
|
Net settlement on vesting of restricted stock
|
—
|
|
—
|
|
(2
|
)
|
|||||
|
Purchase of treasury shares
|
—
|
|
—
|
|
(100
|
)
|
|||||
|
Proceeds from loans with Hertz
|
9
|
|
6
|
|
102
|
|
|||||
|
Repayments of loans with Hertz
|
—
|
|
—
|
|
(10
|
)
|
|||||
|
Other
|
(2
|
)
|
(1
|
)
|
—
|
|
|||||
|
Net cash provided by (used in) financing activities
|
7
|
|
5
|
|
1
|
|
|||||
|
Net increase (decrease) in cash and cash equivalents during the period
|
—
|
|
—
|
|
—
|
|
|||||
|
Cash and cash equivalents at beginning of period
|
—
|
|
—
|
|
—
|
|
|||||
|
Cash and cash equivalents at end of period
|
$
|
—
|
|
$
|
—
|
|
$
|
—
|
|
||
|
Supplemental disclosures of non-cash information:
|
|||||||||||
|
Settlement of amount due to affiliate
|
$
|
—
|
|
$
|
—
|
|
$
|
334
|
|
||
The accompanying notes are an integral part of these financial statements.
158
SCHEDULE I (Continued)
HERTZ GLOBAL HOLDINGS, INC.
NOTES TO PARENT COMPANY FINANCIAL STATEMENTS
Note 1
—
Background and Basis of Presentation
Hertz Global Holdings, Inc. ("Hertz Global" when including its subsidiaries and "Hertz Holdings" excluding its subsidiaries) was incorporated in Delaware in 2015 and wholly owns Rental Car Intermediate Holdings, LLC which wholly owns The Hertz Corporation ("Hertz"), Hertz Global's primary operating company.
On June 30, 2016, former Hertz Global Holdings, Inc. (for periods on or prior to June 30, 2016, “Old Hertz Holdings” and for periods after June 30, 2016, “Herc Holdings”) completed a spin-off (the “Spin-Off”) of its global vehicle rental business through a dividend to stockholders of record of Old Hertz Holdings as of the close of business on June 22, 2016, the record date for the distribution, of all of the issued and outstanding common stock of Hertz Rental Car Holding Company, Inc. (“New Hertz”), which was re-named Hertz Global Holdings, Inc. in connection with the Spin-Off, on a one-to-five basis. Hertz Global is an independent public company and trades on the New York Stock Exchange under the symbol "HTZ".
Despite the fact that this was a reverse spin off and Hertz Global was spun off from Old Hertz Holdings and was the legal spinnee in the transaction, for accounting purposes, due to the relative significance of New Hertz to Old Hertz Holdings, Hertz Global is considered the spinnor or divesting entity and Herc Holdings is considered the spinnee or divested entity. As a result, New Hertz, or Hertz Global, is the “accounting successor” to Old Hertz Holdings. As such, the historical financial information of Hertz Global reflects the equipment rental business and certain parent legal entities as discontinued operations.
These condensed parent company financial statements reflect the activity of Hertz Holdings as the parent company to Hertz and have been prepared in accordance with Rule 12-04, Schedule 1 of Regulation S-X, as the restricted net assets of Hertz exceed 25% of the consolidated net assets of Hertz Holdings. This information should be read in conjunction with the consolidated financial statements of Hertz Global included in this
2018
Annual Report under the caption Item 8, "Financial Statements and Supplementary Data."
On January 1, 2017, Hertz Holdings adopted guidance issued by the FASB on
Improvements to Employee Share-Based Payment Accounting
. This resulted in an opening balance sheet adjustment recorded to accumulated deficit of
$49 million
in the accompanying parent-only balance sheets of Hertz Holdings. See
Note 2
, "
Significant Accounting Policies
,"
to the Notes to its consolidated financial statements included in this
2018
Annual Report under the caption Item 8, "Financial Statements and Supplementary Data" for further details.
On January 1, 2018, Hertz Holdings adopted guidance issued by the FASB on
Revenue from Contracts with Customers
and, during the fourth fiscal quarter of 2018, adopted guidance on
Reporting Comprehensive Income.
This resulted in a net adjustment recorded to accumulated deficit of
$178 million
in the accompanying parent-only balance sheets of Hertz Holdings. See
Note 2
, "
Significant Accounting Policies
,"
to the Notes to its consolidated financial statements included in this
2018
Annual Report under the caption Item 8, "Financial Statements and Supplementary Data" for further details.
Note 2
—
Contingencies
For a discussion of the commitments and contingencies of Hertz Holdings, refer to the sections below included in "Other Matters" in
Note 16
, "
Contingencies and Off-Balance Sheet Commitments
," to the Notes to its consolidated financial statements included in this
2018
Annual Report under the caption Item 8, "Financial Statements and Supplementary Data."
|
•
|
Governmental Investigations, insofar as it relates to the SEC investigation, and
|
|
•
|
In re Hertz Global Holdings, Inc. Securities Litigation
|
The remaining sections of
Note 16
, "
Contingencies and Off-Balance Sheet Commitments
," and
Note 11
, "
Leases
," describe the commitments and contingencies of Hertz Holdings, including its subsidiaries.
159
SCHEDULE I (Continued)
HERTZ GLOBAL HOLDINGS, INC.
NOTES TO PARENT COMPANY FINANCIAL STATEMENTS (continued)
Note 3
—
Dividends
Prior to the Spin-Off on June 30, 2016, Hertz paid a non-cash dividend to Hertz Investors, Inc. consisting of the full rights to the receivable due from Old Hertz Holdings in the amount of
$334 million
plus accrued interest. Hertz Investors, Inc. declared and paid the same dividend to Old Hertz Holdings; thereby settling the amount due to Hertz.
There were
no
non-cash dividends paid by Hertz in 2017 or 2018.
Note 4—Share Repurchase
For a discussion of the share repurchase program of Hertz Holdings, refer to
Note 18
, "
Equity and Earnings (Loss) Per Share - Hertz Global
" to the notes to the Company's consolidated financial statements
.
As of December 31, 2018, Hertz Holdings repurchased
two million
shares for
$100 million
under this program. This amount is included in treasury stock in the accompanying parent-only balance sheets of Hertz Holdings as of December 31, 2018 and 2017.
Note 5—Transactions with Affiliates
For a discussion of Hertz Holdings transactions with Hertz under the master loan, refer to
Note 17
, "
Related Party Transactions
,"
to the Notes to the Company's consolidated financial statements. The amounts related to the master loan transactions are included in investments in subsidiaries in the accompanying parent-only balance sheets of Hertz Holdings.
SCHEDULE II
VALUATION AND QUALIFYING ACCOUNTS
HERTZ GLOBAL HOLDINGS, INC. AND SUBSIDIARIES
THE HERTZ CORPORATION AND SUBSIDIARIES
(In millions)
|
Balance at Beginning of
Period
|
Additions
|
||||||||||||||||||
|
Charged to
Expense
|
Translation
Adjustments
|
Deductions
|
Balance at
End of Period
|
||||||||||||||||
|
Receivables allowances:
|
|||||||||||||||||||
|
Year Ended December 31, 2018
|
$
|
33
|
|
$
|
35
|
|
$
|
(1
|
)
|
$
|
(40
|
)
|
(a)
|
$
|
27
|
|
|||
|
Year Ended December 31, 2017
|
42
|
|
33
|
|
3
|
|
(45
|
)
|
(a)
|
33
|
|
||||||||
|
Year Ended December 31, 2016
|
36
|
|
51
|
|
(2
|
)
|
(43
|
)
|
(a)
|
42
|
|
||||||||
|
Tax valuation allowances:
|
|||||||||||||||||||
|
Year Ended December 31, 2018
|
$
|
305
|
|
$
|
21
|
|
$
|
1
|
|
$
|
(9
|
)
|
(b)
|
$
|
318
|
|
|||
|
Year Ended December 31, 2017
|
230
|
|
57
|
|
18
|
|
—
|
|
305
|
|
|||||||||
|
Year Ended December 31, 2016
|
148
|
|
83
|
|
(1
|
)
|
—
|
|
230
|
|
|||||||||
|
(a)
|
Amounts written off, net of recoveries.
|
|
(b)
|
See
Note 13
, "
Income Tax (Provision) Benefit
" for more information related to the release of the valuation allowance.
|
160
HERTZ GLOBAL HOLDINGS, INC. AND SUBSIDIARIES
THE HERTZ CORPORATION AND SUBSIDIARIES
ITEM 9. CHANGES IN AND DISAGREEMENTS WITH ACCOUNTANTS ON ACCOUNTING AND FINANCIAL DISCLOSURE
None.
ITEM 9A. CONTROLS AND PROCEDURES
HERTZ GLOBAL HOLDINGS, INC.
Evaluation of Disclosure Controls and Procedures
Our senior management has evaluated the effectiveness of the design and operation of our disclosure controls and procedures (as defined under Exchange Act Rules 13a-15(e) and 15d-15(e)) as of the end of the period covered by this 2018 Annual Report. Based upon that evaluation, our Chief Executive Officer and Chief Financial Officer have concluded that as of December 31, 2018, the Company’s disclosure controls and procedures were effective to provide reasonable assurance that the information required to be disclosed by us in the reports that we file or submit under the Exchange Act of 1934 is recorded, processed, summarized and reported within the time periods specified in the SEC’s rules and forms, and that such information is accumulated and communicated to management as appropriate to allow timely decisions regarding required disclosure.
Management’s Report on Internal Control over Financial Reporting
Management is responsible for establishing and maintaining adequate internal control over financial reporting, as defined in Exchange Act Rules 13a-15(f) and 15d-15(f).
Internal control over financial reporting has inherent limitations. Internal control over financial reporting is a process that involves human diligence and compliance and is subject to lapses in judgment and breakdowns resulting from human failures. Internal control over financial reporting can also be circumvented by collusion or improper management override. Because of such limitations, there is a risk that material misstatements will not be prevented or detected on a timely basis by internal control over financial reporting. Therefore, it is possible to design into the process safeguards to reduce, though not eliminate, this risk.
Management, including our Chief Executive Officer and our Chief Financial Officer, assessed the effectiveness of our internal control over financial reporting as of December 31, 2018. In making this assessment, management used the criteria set forth by the Committee of Sponsoring Organizations of the Treadway Commission (“COSO”) in
Internal Control - Integrated Framework
(2013). Based on this assessment, management has concluded that we maintained effective internal control over financial reporting as of December 31, 2018.
The effectiveness of our internal control over financial reporting as of December 31, 2018 has been audited by PricewaterhouseCoopers LLP, an independent registered public accounting firm, as stated in their report, which appears in this 2018 Annual Report.
Remediation of Prior Material Weaknesses
Risk Assessment
We have remediated the material weakness associated with effective design and maintenance of controls in response to the risk of material misstatement by: (i) reestablishing an internal controls project management team to perform ongoing quantitative and qualitative risk assessment evaluation, (ii) evidencing the Company’s ability to identify, evaluate, and monitor risks to financial reporting throughout the organization and (iii) designing and implementing controls to address changing risks in the business.
161
HERTZ GLOBAL HOLDINGS, INC. AND SUBSIDIARIES
THE HERTZ CORPORATION AND SUBSIDIARIES
ITEM 9A. CONTROLS AND PROCEDURES (Continued)
IT Systems
We have remediated the material weakness associated with effective design and maintenance over certain information technology (“IT”) systems that are relevant to the preparation of our consolidated financial statements by: (i) enhancing policies and procedures to govern logical security, change management and monitoring of critical jobs, (ii) delivering supplemental training to control owners to develop a thorough understanding of the Company’s policies and review protocols, (iii) designing and maintaining user access controls to adequately restrict user and privileged access to financial applications and data to appropriate personnel, (iv) designing and maintaining effective controls to restrict and/or monitor developers’ access to promote source code changes into production, (v) designing and maintaining effective controls related to access and monitoring of critical jobs and (vi) dedicating additional resources to monitor IT general controls and compliance with policies, procedures and processes.
Income Taxes
We have remediated the material weakness associated with controls over the analysis and assessment of the income tax effects related to non-recurring transactions, the provision for income taxes and state deferred tax asset valuation allowances by: (i) enhancing the Tax department with qualified personnel in key tax positions, (ii) designing and maintaining effective controls to ensure significant quarterly transactions and related accounting for income tax effects are appropriately assessed and (iii) redesigning and maintaining the income tax provision quarterly and annual control activities at the appropriate level of precision to address the risks of material misstatement.
Changes in Internal Control over Financial Reporting
During the three months ended December 31, 2018 management implemented annual control activities related to the provision for income taxes at the appropriate level of precision to address the risks of material misstatement, which constituted a change in our internal control over financial reporting that occurred during the three months ended December 31, 2018 that materially affected, or that is reasonably likely to materially affect our internal control over financial reporting.
THE HERTZ CORPORATION
Evaluation of Disclosure Controls and Procedures
Our senior management has evaluated the effectiveness of the design and operation of our disclosure controls and procedures (as defined under Exchange Act Rules 13a-15(e) and 15d-15(e)) as of the end of the period covered by this 2018 Annual Report. Based upon that evaluation, our Chief Executive Officer and Chief Financial Officer have concluded that as of December 31, 2018, the Company’s disclosure controls and procedures were effective to provide reasonable assurance that the information required to be disclosed by us in the reports that we file or submit under the Exchange Act of 1934 is recorded, processed, summarized and reported within the time periods specified in the SEC’s rules and forms, and that such information is accumulated and communicated to management as appropriate to allow timely decisions regarding required disclosure.
Management’s Report on Internal Control over Financial Reporting
Management is responsible for establishing and maintaining adequate internal control over financial reporting, as defined in Exchange Act Rules 13a-15(f) and 15d-15(f).
Internal control over financial reporting has inherent limitations. Internal control over financial reporting is a process that involves human diligence and compliance and is subject to lapses in judgment and breakdowns resulting from human failures. Internal control over financial reporting can also be circumvented by collusion or improper management override. Because of such limitations, there is a risk that material misstatements will not be prevented or detected on a timely basis by internal control over financial reporting. Therefore, it is possible to design into the process safeguards to reduce, though not eliminate, this risk.
162
HERTZ GLOBAL HOLDINGS, INC. AND SUBSIDIARIES
THE HERTZ CORPORATION AND SUBSIDIARIES
ITEM 9A. CONTROLS AND PROCEDURES (Continued)
Management, including our Chief Executive Officer and our Chief Financial Officer, assessed the effectiveness of our internal control over financial reporting as of December 31, 2018. In making this assessment, management used the criteria set forth by the Committee of Sponsoring Organizations of the Treadway Commission (“COSO”) in
Internal Control - Integrated Framework
(2013). Based on this assessment, management has concluded that we maintained effective internal control over financial reporting as of December 31, 2018.
The effectiveness of our internal control over financial reporting as of December 31, 2018 has been audited by PricewaterhouseCoopers LLP, an independent registered public accounting firm, as stated in their report, which appears in this 2018 Annual Report.
Remediation of Prior Material Weaknesses
Risk Assessment
We have remediated the material weakness associated with effective design and maintenance of controls in response to the risk of material misstatement by: (i) reestablishing an internal controls project management team to perform ongoing quantitative and qualitative risk assessment evaluation, (ii) evidencing the Company’s ability to identify, evaluate, and monitor risks to financial reporting throughout the organization and (iii) designing and implementing controls to address changing risks in the business.
IT Systems
We have remediated the material weakness associated with effective design and maintenance over certain information technology (“IT”) systems that are relevant to the preparation of our consolidated financial statements by: (i) enhancing policies and procedures to govern logical security, change management and monitoring of critical jobs, (ii) delivering supplemental training to control owners to develop a thorough understanding of the Company’s policies and review protocols, (iii) designing and maintaining user access controls to adequately restrict user and privileged access to financial applications and data to appropriate personnel, (iv) designing and maintaining effective controls to restrict and/or monitor developers’ access to promote source code changes into production, (v) designing and maintaining effective controls related to access and monitoring of critical jobs and (vi) dedicating additional resources to monitor IT general controls and compliance with policies, procedures and processes.
Income Taxes
We have remediated the material weakness associated with controls over the analysis and assessment of the income tax effects related to non-recurring transactions, the provision for income taxes and state deferred tax asset valuation allowances by: (i) enhancing the Tax department with qualified personnel in key tax positions, (ii) designing and maintaining effective controls to ensure significant quarterly transactions and related accounting for income tax effects are appropriately assessed and (iii) redesigning and maintaining the income tax provision quarterly and annual control activities at the appropriate level of precision to address the risks of material misstatement.
Changes in Internal Control over Financial Reporting
During the three months ended December 31, 2018 management implemented annual control activities related to the provision for income taxes at the appropriate level of precision to address the risks of material misstatement, which constituted a change in our internal control over financial reporting that occurred during the three months ended December 31, 2018 that materially affected, or that is reasonably likely to materially affect our internal control over financial reporting.
ITEM 9B. OTHER INFORMATION
None.
163
HERTZ GLOBAL HOLDINGS, INC. AND SUBSIDIARIES
THE HERTZ CORPORATION AND SUBSIDIARIES
PART III
Hertz Global expects to file with the SEC in April 2019, a definitive proxy statement (the "Proxy Statement"), pursuant to SEC Regulation 14A in connection with our Annual Meeting of Shareholders to be held on May 24, 2019. The following information to be included in such Proxy Statement is herein incorporated by reference in this Part III.
ITEM 10. DIRECTORS, EXECUTIVE OFFICERS AND CORPORATE GOVERNANCE
Hertz Global incorporates by reference the information appearing under “Election of Directors (Proposal 1) - Director Nominees,” “Ownership of Our Common Stock - Section 16(a) Beneficial Ownership Reporting Compliance,” “Corporate Governance - Corporate Governance Guidelines,” “Corporate Governance - Director Nominations,” “Corporate Governance - Roles and Responsibilities of the Board Committees” and "Corporate Governance - Meetings and Committees of the Board of Directors" in the Proxy Statement.
Information required by this item with respect to Hertz is omitted pursuant to General Instruction I(2)(c) of Form 10-K.
ITEM 11. EXECUTIVE COMPENSATION
Hertz Global incorporates by reference the information appearing under the captions “Compensation Discussion and Analysis," "Potential Payments on Termination or Change in Control," "Corporate Governance - Risk Oversight," "CEO Pay Ratio," "Ownership of Our Common Stock - Compensation Committee Interlocks and Insider Participation” and “Compensation Committee Report” in the Proxy Statement.
Information required by this item with respect to Hertz is omitted pursuant to General Instruction I(2)(c) of Form 10-K.
ITEM 12. SECURITY OWNERSHIP OF CERTAIN BENEFICIAL OWNERS AND MANAGEMENT AND RELATED STOCKHOLDER MATTERS
Hertz Global incorporates by reference the information appearing under “Item 5—Market for Registrant's Common Equity, Related Stockholder Matters and Issuer Purchases of Equity Securities-Equity Compensation Information” in this 2018 Annual Report and under the caption “Ownership of Our Common Stock” in the Proxy Statement.
Information required by this item with respect to Hertz is omitted pursuant to General Instruction I(2)(c) of Form 10-K.
ITEM 13. CERTAIN RELATIONSHIPS AND RELATED TRANSACTIONS, AND DIRECTOR INDEPENDENCE
Hertz Global incorporates by reference the information appearing under the captions “Corporate Governance - Certain Relationships and Related Party Transactions,” “Corporate Governance - Director Independence” and “Corporate Governance - Roles and Responsibilities of the Board Committees” in the Proxy Statement.
Information required by this item with respect to Hertz is omitted pursuant to General Instruction I(2)(c) of Form 10-K.
|
ITEM 14.
|
PRINCIPAL ACCOUNTING FEES AND SERVICES
|
Fees for services performed by the Company's principal accounting firm, PricewaterhouseCoopers LLP, during fiscal years
2018 and 2017
were as follows:
|
(In millions)
|
2018
|
2017
|
|||||
|
Audit fees
(1)
|
$
|
13
|
|
$
|
14
|
|
|
|
Audit-related fees
(2)
|
1
|
|
2
|
|
|||
|
Tax fees
(3)
|
1
|
|
1
|
|
|||
|
Total
|
$
|
15
|
|
$
|
17
|
|
|
(1) Audit fees were for services rendered in connection with (i) the audit of the financial statements included in the Hertz Global and Hertz Annual Reports, (ii) reviews of the financial statements included in the Hertz Global and Hertz Quarterly Reports on Form 10-Q, (iii) attestation of the
164
HERTZ GLOBAL HOLDINGS, INC. AND SUBSIDIARIES
THE HERTZ CORPORATION AND SUBSIDIARIES
|
ITEM 14.
|
PRINCIPAL ACCOUNTING FEES AND SERVICES (Continued)
|
effectiveness of internal controls over financial reporting for Hertz Global and Hertz, (iv) statutory audits and (v) providing comfort letters in connection with our financing transactions.
(2) Audit-related fees were for services rendered in connection with due diligence and assurance services and employee benefit plan audits.
(3) Tax fees related to our LKE program and tax audit assistance.
Our Audit Committee’s charter requires the Audit Committee to pre-approve all audit and permitted non-audit services to be performed by our independent registered public accounting firm; however, the Audit Committee is permitted to delegate pre-approval authority to the Chair of the Audit Committee, who must then provide a report to the full Audit Committee at its next scheduled meeting. All audit and non-audit fees were pre-approved by the Audit Committee.
165
HERTZ GLOBAL HOLDINGS, INC. AND SUBSIDIARIES
THE HERTZ CORPORATION AND SUBSIDIARIES
PART IV
ITEM 15. EXHIBITS, FINANCIAL STATEMENT SCHEDULES
The following documents are filed as part of this
2018
Annual Report:
|
Page
|
|||
|
(a)
|
1.
|
Financial Statements:
|
|
|
Our financial statements filed herewith are set forth in Part II, Item 8 of this 2018 Annual Report as follows:
|
|||
|
(A) Hertz Global Holdings, Inc. and Subsidiaries—
|
|||
|
Report of Independent Registered Public Accounting Firm
|
|||
|
Consolidated Balance Sheets
|
|||
|
Consolidated Statements of Operations
|
|||
|
Consolidated Statements of Comprehensive Income (Loss)
|
|||
|
Consolidated Statements of Changes in Equity
|
|||
|
Consolidated Statements of Cash Flows
|
|||
|
Notes to Consolidated Financial Statements
|
|||
|
(B) The Hertz Corporation and Subsidiaries—
|
|||
|
Report of Independent Registered Public Accounting Firm
|
|||
|
Consolidated Balance Sheets
|
|||
|
Consolidated Statements of Operations
|
|||
|
Consolidated Statements of Comprehensive Income (Loss)
|
|||
|
Consolidated Statements of Changes in Equity
|
|||
|
Consolidated Statements of Cash Flows
|
|||
|
Notes to Consolidated Financial Statements
|
|||
|
2.
|
Financial Statement Schedules:
|
||
|
Our financial statement schedules filed herewith are set forth in Part II, Item 8 of this
2018 Annual Report as follows:
|
|||
|
(A) Hertz Global Holdings, Inc.—Schedule I—Condensed Financial Information of Registrant
|
|||
|
(B) Hertz Global Holdings, Inc. and Subsidiaries and The Hertz Corporation and Subsidiaries-Schedule II—Valuation and Qualifying Accounts
|
|||
|
3.
|
Exhibits:
|
||
|
The attached list of exhibits in the “Exhibit Index” immediately following the signature pages to this 2018 Annual Report is filed as part of this 2018 Annual Report and is incorporated herein by reference in response to this item.
|
|||
166
HERTZ GLOBAL HOLDINGS, INC. AND SUBSIDIARIES
THE HERTZ CORPORATION AND SUBSIDIARIES
SIGNATURES
Pursuant to the requirements of Section 13 or 15(d) of the Securities Exchange Act of 1934, the registrants have duly caused this report to be signed on its behalf by the undersigned, thereunto duly authorized, in Lee County, Florida on the
25th
day of
February
,
2019
.
|
HERTZ GLOBAL HOLDINGS, INC.
THE HERTZ CORPORATION
(Registrants)
|
||
|
By:
|
/s/ JAMERE JACKSON
|
|
|
Name:
|
Jamere Jackson
|
|
|
Title:
|
Executive Vice President and Chief Financial Officer
|
|
Pursuant to the requirements of the Securities Exchange Act of 1934, this report has been signed below by the following persons on behalf of the registrants and in the capacities indicated on
February 25, 2019
:
|
Signature
|
Title
|
||||
|
|
|
||||
|
/s/ HENRY R. KEIZER
|
Independent Non-Executive Chairman of the Board of Directors
|
||||
|
Henry R. Keizer
|
|
||||
|
|
|
||||
|
/s/ KATHRYN V. MARINELLO
|
President and Chief Executive Officer, Director
|
||||
|
Kathryn V. Marinello
|
|
||||
|
|
|
||||
|
/s/ JAMERE JACKSON
|
Executive Vice President and Chief Financial Officer
|
||||
|
Jamere Jackson
|
|
||||
|
|
|
||||
|
/s/ ERIC ESPER
|
Senior Vice President and Chief Accounting Officer
|
||||
|
Eric Esper
|
|
||||
|
/s/ DAVID A. BARNES
|
Director
|
||||
|
David A. Barnes
|
|
||||
|
|
|
||||
|
/s/ SUNGHWAN CHO
|
Director
|
||||
|
SungHwan Cho
|
|
||||
|
|
|
||||
|
/s/ VINCENT J. INTRIERI
|
Director
|
||||
|
Vincent J. Intrieri
|
|
||||
|
|
|
||||
|
/s/ ANINDITA MUKHERJEE
|
Director
|
||||
|
Anindita Mukherjee
|
|||||
|
/s/ DANIEL A. NINIVAGGI
|
Director
|
||||
|
Daniel A. Ninivaggi
|
|
||||
|
/s/ KEVIN M. SHEEHAN
|
Director
|
||||
|
Kevin M. Sheehan
|
|
||||
167
HERTZ GLOBAL HOLDINGS, INC. AND SUBSIDIARIES
THE HERTZ CORPORATION AND SUBSIDIARIES
EXHIBIT INDEX
|
Exhibit Number
|
Description
|
|
|
2
|
Hertz Holdings
Hertz
|
|
|
3.1.1
|
Hertz Holdings
|
|
|
3.1.2
|
Hertz
|
|
|
3.1.3
|
Hertz
|
|
|
3.1.4
|
Hertz
|
|
|
3.2.1
|
Hertz Holdings
|
|
|
3.2.2
|
Hertz
|
|
|
4.1.1
|
Hertz Holdings
Hertz
|
|
|
4.1.2
|
Hertz Holdings
Hertz
|
|
|
4.1.3
|
Hertz Holdings
Hertz
|
|
|
4.1.4
|
Hertz Holdings
Hertz
|
|
|
4.1.5
|
Hertz Holdings
Hertz
|
|
168
HERTZ GLOBAL HOLDINGS, INC. AND SUBSIDIARIES
THE HERTZ CORPORATION AND SUBSIDIARIES
EXHIBIT INDEX (Continued)
|
Exhibit Number
|
Description
|
|
|
4.1.6
|
Hertz Holdings
Hertz
|
|
|
4.1.7
|
Hertz Holdings
Hertz
|
|
|
4.1.8
|
Hertz Holdings
Hertz
|
|
|
4.1.9
|
Hertz Holdings
Hertz
|
|
|
4.1.10
|
Hertz Holdings
Hertz
|
|
|
4.2.1
|
Hertz Holdings
Hertz
|
|
|
4.2.2
|
Hertz Holdings
Hertz
|
|
|
4.2.3
|
Hertz Holdings
Hertz |
|
|
4.2.4
|
Hertz Holdings
Hertz |
|
169
HERTZ GLOBAL HOLDINGS, INC. AND SUBSIDIARIES
THE HERTZ CORPORATION AND SUBSIDIARIES
EXHIBIT INDEX (Continued)
|
Exhibit Number
|
Description
|
|
|
4.2.5
|
Hertz Holdings
Hertz
|
|
|
4.2.6
|
Hertz Holdings
Hertz
|
|
|
4.2.7
|
Hertz Holdings
Hertz
|
|
|
4.2.8
|
Hertz Holdings
Hertz
|
|
|
4.2.9
|
Hertz Holdings
Hertz
|
|
|
4.3.1
|
Hertz Holdings
Hertz
|
|
|
4.3.5
|
Hertz Holdings
Hertz
|
|
|
4.3.6
|
Hertz Holdings
Hertz
|
|
|
4.3.7
|
Hertz Holdings
Hertz
|
|
170
HERTZ GLOBAL HOLDINGS, INC. AND SUBSIDIARIES
THE HERTZ CORPORATION AND SUBSIDIARIES
EXHIBIT INDEX (Continued)
|
Exhibit Number
|
Description
|
|
|
4.3.8
|
Hertz Holdings
Hertz
|
|
|
4.3.9
|
Hertz Holdings
Hertz
|
|
|
4.3.10
|
Hertz Holdings
Hertz
|
|
|
4.3.11
|
Hertz Holdings
Hertz
|
|
|
4.3.13
|
Hertz Holdings
Hertz
|
|
|
4.3.14
|
Hertz Holdings
Hertz
|
|
|
4.7.1
|
Hertz Holdings
Hertz
|
|
|
4.7.2
|
Hertz Holdings
Hertz
|
|
|
4.7.3
|
Hertz Holdings
Hertz
|
|
171
HERTZ GLOBAL HOLDINGS, INC. AND SUBSIDIARIES
THE HERTZ CORPORATION AND SUBSIDIARIES
EXHIBIT INDEX (Continued)
|
Exhibit Number
|
Description
|
|
|
4.7.4
|
Hertz Holdings
Hertz
|
|
|
4.7.5
|
Hertz Holdings
Hertz |
|
|
4.7.6
|
Hertz Holdings
Hertz |
|
|
4.8
|
Hertz Holdings
Hertz
|
|
|
4.9.1
|
Hertz Holdings
Hertz
|
|
|
4.9.2
|
Hertz Holdings
Hertz
|
|
|
4.9.3
|
Hertz Holdings
Hertz
|
|
172
HERTZ GLOBAL HOLDINGS, INC. AND SUBSIDIARIES
THE HERTZ CORPORATION AND SUBSIDIARIES
EXHIBIT INDEX (Continued)
|
Exhibit Number
|
Description
|
|
|
4.9.6
|
Hertz Holdings
Hertz
|
|
|
4.9.8
|
Hertz Holdings
Hertz
|
|
|
4.9.9
|
Hertz Holdings
Hertz
|
|
|
4.9.11
|
Hertz Holdings
Hertz
|
|
|
4.9.12
|
Hertz Holdings Hertz
|
|
|
4.10
|
Hertz Holdings
Hertz
|
|
|
4.11
|
Hertz Holdings
Hertz
|
|
173
HERTZ GLOBAL HOLDINGS, INC. AND SUBSIDIARIES
THE HERTZ CORPORATION AND SUBSIDIARIES
EXHIBIT INDEX (Continued)
|
Exhibit Number
|
Description
|
|
|
4.12
|
Hertz Holdings
Hertz
|
|
|
4.13.1
|
Hertz Holdings
Hertz
|
|
|
4.13.2
|
Hertz Holdings
Hertz
|
|
|
4.14.1
|
Hertz Holdings
Hertz |
|
|
4.14.2
|
Hertz Holdings
Hertz |
|
|
4.14.3
|
Hertz Holdings
Hertz |
|
|
4.15.1
|
Hertz Holdings Hertz
|
|
|
4.15.2
|
Hertz Holdings Hertz
|
|
174
HERTZ GLOBAL HOLDINGS, INC. AND SUBSIDIARIES
THE HERTZ CORPORATION AND SUBSIDIARIES
EXHIBIT INDEX (Continued)
|
Exhibit Number
|
Description
|
|
|
4.15.3
|
Hertz Holdings Hertz
|
|
|
4.15.4
|
Hertz Holdings Hertz
|
|
|
4.15.5
|
Hertz Holdings Hertz
|
|
|
4.15.6
|
Hertz Holdings Hertz
|
|
|
4.15.7
|
Hertz Holdings Hertz
|
|
|
10.1.1
|
Hertz Holdings
Hertz
|
|
|
10.1.2
|
Hertz Holdings
Hertz
|
|
|
10.1.3
|
Hertz Holdings
Hertz
|
|
|
10.1.4
|
Hertz Holdings
Hertz
|
|
175
HERTZ GLOBAL HOLDINGS, INC. AND SUBSIDIARIES
THE HERTZ CORPORATION AND SUBSIDIARIES
EXHIBIT INDEX (Continued)
|
Exhibit Number
|
Description
|
|
|
10.1.5
|
Hertz Holdings
Hertz |
|
|
10.1.6
|
Hertz Holdings
Hertz |
|
|
10.2.1
|
Hertz Holdings
Hertz
|
|
|
10.2.2
|
Hertz Holdings
Hertz
|
|
|
10.2.3
|
Hertz Holdings
Hertz
|
|
|
10.2.4
|
Hertz Holdings
Hertz
|
|
|
10.2.5
|
Hertz Holdings
Hertz
|
|
|
10.2.6
|
Hertz Holdings
Hertz
|
|
|
10.2.7
|
Hertz Holdings
Hertz
|
|
|
10.2.8
|
Hertz Holdings
Hertz
|
|
|
10.2.9
|
Hertz Holdings
Hertz
|
|
|
10.2.10
|
Hertz Holdings Hertz
|
|
176
HERTZ GLOBAL HOLDINGS, INC. AND SUBSIDIARIES
THE HERTZ CORPORATION AND SUBSIDIARIES
EXHIBIT INDEX (Continued)
|
Exhibit Number
|
Description
|
|
|
10.2.11
|
Hertz Holdings Hertz
|
|
|
10.2.12
|
Hertz Holdings Hertz
|
|
|
10.2.13
|
Hertz Holdings Hertz
|
|
|
10.2.14
|
Hertz Holdings Hertz
|
|
|
10.2.15
|
Hertz Holdings Hertz
|
|
|
10.2.16
|
Hertz Holdings Hertz
|
|
|
10.2.17
|
Hertz Holdings Hertz
|
|
|
10.2.18
|
Hertz Holdings Hertz
|
|
|
10.3
|
Hertz Holdings
Hertz
|
|
|
10.4
|
Hertz Holdings
Hertz
|
|
|
10.5
|
Hertz Holdings
Hertz
|
|
|
10.6
|
Hertz Holdings
Hertz
|
|
|
10.7.1
|
Hertz Holdings
Hertz
|
|
|
10.7.2
|
Hertz Holdings
Hertz
|
|
177
HERTZ GLOBAL HOLDINGS, INC. AND SUBSIDIARIES
THE HERTZ CORPORATION AND SUBSIDIARIES
EXHIBIT INDEX (Continued)
|
Exhibit Number
|
Description
|
|
|
10.7.3
|
Hertz Holdings
Hertz
|
|
|
10.7.4
|
Hertz Holdings
Hertz
|
|
|
10.7.5
|
Hertz Holdings
Hertz
|
|
|
10.8
|
Hertz Holdings
Hertz
|
|
|
10.9
|
Hertz Holdings
Hertz
|
|
|
10.10
|
Hertz Holdings
Hertz
|
|
|
10.11
|
Hertz Holdings
Hertz
|
|
|
10.12
|
Hertz Holdings
Hertz
|
|
|
10.13
|
Hertz Holdings
Hertz
|
|
|
10.14
|
Hertz Holdings
Hertz
|
|
|
10.15
|
Hertz Holdings
Hertz
|
|
|
10.16
|
Hertz Holdings
Hertz
|
|
|
10.17
|
Hertz Holdings
Hertz
|
|
|
10.18
|
Hertz Holdings
Hertz
|
|
178
HERTZ GLOBAL HOLDINGS, INC. AND SUBSIDIARIES
THE HERTZ CORPORATION AND SUBSIDIARIES
EXHIBIT INDEX (Continued)
|
Exhibit Number
|
Description
|
|
|
10.19
|
Hertz Holdings
|
|
|
10.20
|
Hertz Holdings
|
|
|
10.21
|
Hertz Holdings
Hertz
|
|
|
10.22
|
Hertz Holdings
Hertz |
|
|
10.23
|
Hertz Holdings
Hertz |
|
|
10.24
|
Hertz Holdings Hertz
|
|
|
10.25
|
Hertz Holdings Hertz
|
|
|
10.26
|
Hertz Holdings Hertz
|
|
|
10.27
|
Hertz Holdings Hertz
|
|
|
10.28
|
Hertz Holdings Hertz
|
|
|
21.1
|
Hertz Holdings
Hertz
|
|
|
23.1
|
Hertz Holdings
|
|
|
31.1
|
Hertz Holdings
|
|
|
31.2
|
Hertz Holdings
|
|
|
31.3
|
Hertz
|
|
|
31.4
|
Hertz
|
|
|
32.1
|
Hertz Holdings
|
|
179
HERTZ GLOBAL HOLDINGS, INC. AND SUBSIDIARIES
THE HERTZ CORPORATION AND SUBSIDIARIES
EXHIBIT INDEX (Continued)
|
Exhibit Number
|
Description
|
|
|
32.2
|
Hertz Holdings
|
|
|
32.3
|
Hertz
|
|
|
32.4
|
Hertz
|
|
|
101.INS
|
Hertz Holdings
Hertz
|
XBRL Instance Document*
|
|
101.SCH
|
Hertz Holdings
Hertz
|
XBRL Taxonomy Extension Schema Document*
|
|
101.CAL
|
Hertz Holdings
Hertz
|
XBRL Taxonomy Extension Calculation Linkbase Document*
|
|
101.DEF
|
Hertz Holdings
Hertz
|
XBRL Taxonomy Extension Definition Linkbase Document*
|
|
101.LAB
|
Hertz Holdings
Hertz
|
XBRL Taxonomy Extension Label Linkbase Document*
|
|
101.PRE
|
Hertz Holdings
Hertz
|
XBRL Taxonomy Extension Presentation Linkbase Document*
|
_______________________________________________________________________________
† Indicates management contract or compensatory plan or arrangement.
* Furnished herewith.
As of
December 31, 2018
, we had various additional obligations which could be considered long-term debt, none of which exceeded 10% of our total assets on a consolidated basis. We agree to furnish to the SEC upon request a copy of any such instrument defining the rights of the holders of such long-term debt.
Schedules and exhibits not included above have been omitted because the information required has been included in the financial statements or notes thereto or are not applicable or not required.
180
TABLE OF CONTENTS
Part IItem 1. BusinessItem 1. Business (continued)Item 1A. Risk FactorsItem 1A. Risk Factors (continued)Item 1B. Unresolved Staff CommentsItem 2. PropertiesItem 3. Legal ProceedingsPart IIItem 5. Market For Registrant's Common Equity, Related Stockholder Matters and Issuer Purchases Of Equity SecuritiesItem 5. Market For Registrant's Common Equity, Related Stockholder Matters and Issuer Purchases Of Equity Securities (continued)Item 6. Selected Financial DataItem 6. Selected Financial Data (continued)Item 7. Management's Discussion and Analysis Of Financial Condition and Results Of OperationsItem 7. Management's Discussion and Analysis Of Financial Condition and Results Of Operations (continued)Item 7A. Quantitative and Qualitative Disclosures About Market RiskItem 7A. Quantitative and Qualitative Disclosures About Market Risk (continued)Item 8. Financial Statements and Supplementary DataNote 1 BackgroundNote 2 Significant Accounting PoliciesNote 3 Discontinued OperationsNote 4 DivestituresNote 5 Revenue Earning Vehicles, NetNote 6 Goodwill and Intangible Assets, NetNote 7 DebtNote 8 Revenue From Contracts with CustomersNote 9 Employee Retirement BenefitsNote 10 Stock-based CompensationNote 11 LeasesNote 12 RestructuringNote 13 Income Tax (provision) BenefitNote 14 Fair Value MeasurementsNote 15 Accumulated Other Comprehensive Income (loss)Note 16 Contingencies and Off-balance Sheet CommitmentsNote 17 Related Party TransactionsNote 18 Equity and Earnings (loss) Per Share - Hertz GlobalNote 19 Segment InformationNote 20 Quarterly Financial Information (unaudited)Note 21 Guarantor and Non-guarantor Annual Condensed Consolidating Financial Information - HertzNote 1 Background and Basis Of PresentationNote 2 ContingenciesNote 3 DividendsNote 4 Share RepurchaseNote 5 Transactions with AffiliatesItem 9. Changes in and Disagreements with Accountants on Accounting and Financial DisclosureItem 9A. Controls and ProceduresItem 9A. Controls and Procedures (continued)Item 9B. Other InformationPart IIIItem 10. Directors, Executive Officers and Corporate GovernanceItem 11. Executive CompensationItem 12. Security Ownership Of Certain Beneficial Owners and Management and Related Stockholder MattersItem 13. Certain Relationships and Related Transactions, and Director IndependenceItem 14. Principal Accounting Fees and ServicesItem 14. Principal Accounting Fees and Services (continued)Part IVItem 15. Exhibits, Financial Statement Schedules