HUMANA INC
10-Ks and 10-Qs
|
|
|
|
|
|
|
|
|
|
|
|
|
|
|
|
|
|
|
|
|
|
|
|
|
|
|
|
|
|
|
|
|
|
|
|
|
|
|
|
|
|
|
|
|
|
|
|
|
|
|
|
|
|
|
|
UNITED STATES
SECURITIES AND EXCHANGE COMMISSION
Washington, D.C. 20549
FORM 10-K
|
þ
|
ANNUAL REPORT PURSUANT TO SECTION 13 OR 15(d) OF THE SECURITIES EXCHANGE ACT OF 1934
|
For the fiscal year ended
December 31, 2016
OR
|
¨
|
TRANSITION REPORT PURSUANT TO SECTION 13 OR 15 (d) OF THE SECURITIES EXCHANGE ACT OF 1934
|
For the transition period from to
Commission file number 1-5975
HUMANA INC.
(Exact name of registrant as specified in its charter)
|
Delaware
|
|
61-0647538
|
|
(State of incorporation)
|
|
(I.R.S. Employer Identification Number)
|
|
500 West Main Street Louisville, Kentucky
|
|
40202
|
|
(Address of principal executive offices)
|
|
(Zip Code)
|
|
Registrant’s telephone number, including area code: (502) 580-1000
Securities registered pursuant to Section 12(b) of the Act:
|
||
|
Title of each class
|
|
Name of exchange on which registered
|
|
Common stock, $0.16 2/3 par value
|
|
New York Stock Exchange
|
Securities registered pursuant to Section 12(g) of the Act:
None
Indicate by check mark if the registrant is a well-known seasoned issuer, as defined in Rule 405 of the Securities Act. Yes
þ
No
¨
Indicate by check mark if the registrant is not required to file reports pursuant to Section 13 or Section 15(d) of the Act. Yes
¨
No
þ
Indicate by check mark whether the registrant (1) has filed all reports required to be filed by Section 13 or 15(d) of the Securities Exchange Act of 1934 during the preceding 12 months (or for such shorter period that the registrant was required to file such reports), and (2) has been subject to such filing requirements for the past 90 days. Yes
þ
No
¨
Indicate by check mark whether the registrant has submitted electronically and posted on its corporate Web site, if any, every Interactive Data File required to be submitted and posted pursuant to Rule 405 of Regulation S-T (§232.405 of this chapter) during the preceding 12 months (or for such shorter period that the registrant was required to submit and post such files). Yes
þ
No
¨
Indicate by check mark if disclosure of delinquent filers pursuant to Item 405 of Regulation S-K is not contained herein, and will not be contained, to the best of registrant’s knowledge, in definitive proxy or information statements incorporated by reference in Part III of this Form 10-K or any amendment to this Form 10-K.
þ
Indicate by checkmark whether the registrant is a large accelerated filer, an accelerated filer, a non-accelerated filer, or a smaller reporting company. See the definitions of “large accelerated filer,” “accelerated filer” and “smaller reporting company” in Rule 12b-2 of the Exchange Act. (Check one):
Large accelerated filer
þ
Accelerated filer
¨
Non-accelerated filer
¨
Smaller reporting company
¨
Indicate by check mark whether the registrant is a shell company (as defined in Rule 12b-2 of the Exchange Act). Yes
¨
No
þ
The aggregate market value of voting stock held by non-affiliates of the Registrant as of June 30,
2016
was
$26,887,040,202
calculated using the average price on
June 30, 2016
of
$180.70
.
The number of shares outstanding of the Registrant’s Common Stock as of
January 31, 2017
was
149,324,101
.
DOCUMENTS INCORPORATED BY REFERENCE
Parts II and III incorporate herein by reference portions of the Registrant’s Proxy Statement to be filed pursuant to Regulation 14A with respect to the Annual Meeting of Stockholders scheduled to be held on
April 20, 2017
.
HUMANA INC.
INDEX TO ANNUAL REPORT ON FORM 10-K
For the Year Ended
December 31, 2016
|
|
|
Page
|
|
Part I
|
||
|
Item 1.
|
||
|
Item 1A.
|
||
|
Item 1B.
|
||
|
Item 2.
|
||
|
Item 3.
|
||
|
Item 4.
|
||
|
Part II
|
||
|
Item 5.
|
||
|
Item 6.
|
||
|
Item 7.
|
||
|
Item 7A.
|
||
|
Item 8.
|
||
|
Item 9.
|
||
|
Item 9A.
|
||
|
Item 9B.
|
||
|
Part III
|
||
|
Item 10.
|
||
|
Item 11.
|
||
|
Item 12.
|
||
|
Item 13.
|
||
|
Item 14.
|
||
|
Part IV
|
||
|
Item 15.
|
||
2
Forward-Looking Statements
Some of the statements under “Business,” “Management’s Discussion and Analysis of Financial Condition and Results of Operations,” and elsewhere in this report may contain forward-looking statements which reflect our current views with respect to future events and financial performance. These forward-looking statements are made within the meaning of Section 27A of the Securities Act of 1933 and Section 21E of the Securities Exchange Act of 1934, or the Exchange Act. We intend such forward-looking statements to be covered by the safe harbor provisions for forward-looking statements contained in the Private Securities Litigation Reform Act of 1995, and we are including this statement for purposes of complying with these safe harbor provisions. We have based these forward-looking statements on our current expectations and projections about future events, trends and uncertainties. These forward-looking statements are not guarantees of future performance and are subject to risks, uncertainties and assumptions, including the information discussed under the section entitled “Risk Factors” in this report. In making these statements, we are not undertaking to address or update them in future filings or communications regarding our business or results. Our business is highly complicated, regulated and competitive with many different factors affecting results.
General
Headquartered in Louisville, Kentucky, Humana Inc. and its subsidiaries, referred to throughout this document as “we,” “us,” “our,” the “Company” or “Humana,” is a leading health and well-being company focused on making it easy for people to achieve their best health with clinical excellence through coordinated care. Our strategy integrates care delivery, the member experience, and clinical and consumer insights to encourage engagement, behavior change, proactive clinical outreach and wellness for the millions of people we serve across the country. As of December 31,
2016
, we had approximately
14.2 million
members in our medical benefit plans, as well as approximately
7.0 million
members in our specialty products. During
2016
,
75%
of our total premiums and services revenue were derived from contracts with the federal government, including
14%
derived from our individual Medicare Advantage contracts in Florida with the Centers for Medicare and Medicaid Services, or CMS, under which we provide health insurance coverage to approximately
598,100
members as of December 31,
2016
.
Humana Inc. was organized as a Delaware corporation in 1964. Our principal executive offices are located at 500 West Main Street, Louisville, Kentucky 40202, the telephone number at that address is (502) 580-1000, and our website address is www.humana.com. We have made available free of charge through the Investor Relations section of our web site our annual reports on Form 10-K, quarterly reports on Form 10-Q, current reports on Form 8-K, proxy statements, and, if applicable, amendments to those reports filed or furnished pursuant to Section 13(a) of the Exchange Act, as soon as reasonably practicable after we electronically file such material with, or furnish it to, the Securities and Exchange Commission.
This Annual Report on Form 10-K, or
2016
Form 10-K, contains both historical and forward-looking information. See Item 1A. – Risk Factors in this
2016
Form 10-K for a description of a number of factors that may adversely affect our results or business.
Aetna Merger
On July 2, 2015, we entered into an Agreement and Plan of Merger, which we refer to in this report as the Merger Agreement, with Aetna Inc. and certain wholly owned subsidiaries of Aetna Inc., which we refer to collectively as Aetna, which sets forth the terms and conditions under which we agreed to merge with, and become a wholly owned subsidiary of Aetna, a transaction we refer to in this report as the Merger.
3
The Merger was subject to customary closing conditions, including, among other things, (i) the expiration or termination of the applicable waiting period under the Hart-Scott-Rodino Antitrust Improvements Act of 1976, as amended, and the receipt of necessary approvals under state insurance and healthcare laws and regulations and pursuant to certain licenses of certain of Humana’s subsidiaries, and (ii) the absence of legal restraints and prohibitions on the consummation of the Merger.
On December 22, 2016, in order to extend the “End Date” (as defined in the Merger Agreement), Aetna and Humana each agreed to waive until 11:59 p.m. (Eastern time) on February 15, 2017 its right to terminate the Merger Agreement due to a failure of the Mergers to have been completed on or before December 31, 2016.
On July 21, 2016, the U.S. Department of Justice and the attorneys general of certain U.S. jurisdictions filed a civil antitrust complaint in the U.S. District Court for the District of Columbia against us and Aetna, alleging that the Merger would violate Section 7 of the Clayton Antitrust Act and seeking a permanent injunction to prevent the Merger from being completed. On January 23, 2017, the Court ruled in favor of the DOJ and granted a permanent injunction of the proposed transaction.
On February 14, 2017, we and Aetna agreed to mutually terminate the Merger Agreement, as our Board determined that an appeal of the Court's ruling would not be in the best interest of our stockholders.
Under terms of the Merger Agreement, we are entitled to a breakup fee of
$1 billion
.
Health Care Reform
The Patient Protection and Affordable Care Act and The Health Care and Education Reconciliation Act of 2010 (which we collectively refer to as the Health Care Reform Law) enacted significant reforms to various aspects of the U.S. health insurance industry. Certain significant provisions of the Health Care Reform Law include, among others, mandated coverage requirements, mandated benefits and guarantee issuance associated with commercial medical insurance, rebates to policyholders based on minimum benefit ratios, adjustments to Medicare Advantage premiums, the establishment of federally-facilitated or state-based exchanges coupled with programs designed to spread risk among insurers, and the introduction of plan designs based on set actuarial values. In addition, the Health Care Reform Law established insurance industry assessments, including an annual health insurance industry fee and a three-year industry wide commercial reinsurance fee. The Health Care Reform Law is discussed more fully in Item 7. – Management’s Discussion and Analysis of Financial Condition and Results of Operations under the section titled “Health Care Reform” in this
2016
Form 10-K.
If we fail to effectively implement our operational and strategic initiatives with respect to the implementation of the Health Care Reform Law, our business may be materially adversely affected. Additionally, potential legislative changes, including activities to repeal or replace the Health Care Reform Law, creates uncertainty for our business, and we cannot predict when, or in what form, such legislative changes may occur.
Business Segments
We manage our business with
three
reportable segments: Retail, Group, and Healthcare Services. In addition, the Other Businesses category includes businesses that are not individually reportable because they do not meet the quantitative thresholds required by generally accepted accounting principles. These segments are based on a combination of the type of health plan customer and adjacent businesses centered on well-being solutions for our health plans and other customers, as described below. These segment groupings are consistent with information used by our Chief Executive Officer to assess performance and allocate resources.
Our Products
Our medical and specialty insurance products allow members to access health care services primarily through our networks of health care providers with whom we have contracted. These products may vary in the degree to which members have coverage. Health maintenance organizations, or HMOs, generally require a referral from the member’s primary care provider before seeing certain specialty physicians. Preferred provider organizations, or PPOs, provide members the freedom to choose a health care provider without requiring a referral. However PPOs generally require the member to pay a greater portion of the provider’s fee in the event the member chooses not to use a provider participating in the PPO’s network. Point of Service, or POS, plans combine the advantages of HMO plans with the
4
flexibility of PPO plans. In general, POS plans allow members to choose, at the time medical services are needed, to seek care from a provider within the plan’s network or outside the network. In addition, we offer services to our health plan members as well as to third parties that promote health and wellness, including pharmacy solutions, provider, home based, and clinical programs, as well as services and capabilities to advance population health. At the core of our strategy is our integrated care delivery model, which unites quality care, high member engagement, and sophisticated data analytics. Three core elements of the model are to improve the consumer experience by simplifying the interaction with us, engaging members in clinical programs, and offering assistance to providers in transitioning from a fee-for-service to a value-based arrangement. Our approach to primary, physician-directed care for our members aims to provide quality care that is consistent, integrated, cost-effective, and member-focused. The model is designed to improve health outcomes and affordability for individuals and for the health system as a whole, while offering our members a simple, seamless healthcare experience. The discussion that follows describes the products offered by each of our segments.
Our Retail Segment Products
This segment is comprised of products sold on a retail basis to individuals including medical and supplemental benefit plans described in the discussion that follows. The following table presents our premiums and services revenue for the Retail segment by product for the year ended December 31,
2016
:
|
Retail Segment
Premiums and Services Revenue |
Percent of
Consolidated Premiums and Services Revenue |
||||||
|
|
(dollars in millions)
|
||||||
|
Premiums:
|
|||||||
|
Individual Medicare Advantage
|
$
|
31,863
|
|
59.0
|
%
|
||
|
Group Medicare Advantage
|
4,283
|
|
8.0
|
%
|
|||
|
Medicare stand-alone PDP
|
4,009
|
|
7.4
|
%
|
|||
|
Total Medicare
|
40,155
|
|
74.4
|
%
|
|||
|
Individual commercial
|
3,492
|
|
6.4
|
%
|
|||
|
State-based Medicaid
|
2,640
|
|
4.9
|
%
|
|||
|
Individual specialty
|
259
|
|
0.5
|
%
|
|||
|
Total premiums
|
46,546
|
|
86.2
|
%
|
|||
|
Services
|
8
|
|
—
|
%
|
|||
|
Total premiums and services revenue
|
$
|
46,554
|
|
86.2
|
%
|
||
Medicare
We have participated in the Medicare program for private health plans for over 30 years and have established a national presence, offering at least one type of Medicare plan in all 50 states. We have a geographically diverse membership base that we believe provides us with greater ability to expand our network of PPO and HMO providers. We employ strategies including health assessments and clinical guidance programs such as lifestyle and fitness programs for seniors to guide Medicare beneficiaries in making cost-effective decisions with respect to their health care. We believe these strategies result in cost savings that occur from making positive behavior changes.
Medicare is a federal program that provides persons age 65 and over and some disabled persons under the age of 65 certain hospital and medical insurance benefits. CMS, an agency of the United States Department of Health and Human Services, administers the Medicare program. Hospitalization benefits are provided under Part A, without the payment of any premium, for up to 90 days per incident of illness plus a lifetime reserve aggregating 60 days. Eligible beneficiaries are required to pay an annually adjusted premium to the federal government to be eligible for physician care and other services under Part B. Beneficiaries eligible for Part A and Part B coverage under traditional fee-for-service Medicare are still required to pay out-of-pocket deductibles and coinsurance. Throughout this document this program is referred to as Medicare FFS. As an alternative to Medicare FFS, in geographic areas where a managed care organization has contracted with CMS pursuant to the Medicare Advantage program, Medicare beneficiaries may choose to receive benefits from a Medicare Advantage organization under Medicare Part C. Pursuant to Medicare Part
C, Medicare Advantage organizations contract with CMS to offer Medicare Advantage plans to provide benefits at least comparable to those offered under Medicare FFS. Our Medicare Advantage, or MA, plans are discussed more fully below. Prescription drug benefits are provided under Part D.
Individual Medicare Advantage Products
We contract with CMS under the Medicare Advantage program to provide a comprehensive array of health insurance benefits, including wellness programs, chronic care management, and care coordination, to Medicare eligible persons under HMO, PPO, and Private Fee-For-Service, or PFFS, plans in exchange for contractual payments received from CMS, usually a fixed payment per member per month. With each of these products, the beneficiary receives benefits in excess of Medicare FFS, typically including reduced cost sharing, enhanced prescription drug benefits, care coordination, data analysis techniques to help identify member needs, complex case management, tools to guide members in their health care decisions, care management programs, wellness and prevention programs and, in some instances, a reduced monthly Part B premium. Most Medicare Advantage plans offer the prescription drug benefit under Part D as part of the basic plan, subject to cost sharing and other limitations. Accordingly, all of the provisions of the Medicare Part D program described in connection with our stand-alone prescription drug plans in the following section also are applicable to most of our Medicare Advantage plans. Medicare Advantage plans may charge beneficiaries monthly premiums and other copayments for Medicare-covered services or for certain extra benefits. Generally, Medicare-eligible individuals enroll in one of our plan choices between October 15 and December 7 for coverage that begins on the following January 1.
Our Medicare HMO and PPO plans, which cover Medicare-eligible individuals residing in certain counties, may eliminate or reduce coinsurance or the level of deductibles on many other medical services while seeking care from participating in-network providers or in emergency situations. Except in emergency situations or as specified by the plan, most HMO plans provide no out-of-network benefits. PPO plans carry an out-of network benefit that is subject to higher member cost-sharing. In some cases, these beneficiaries are required to pay a monthly premium to the HMO or PPO plan in addition to the monthly Part B premium they are required to pay the Medicare program.
Most of our Medicare PFFS plans are network-based products with in and out of network benefits due to a requirement that Medicare Advantage organizations establish adequate provider networks, except in geographic areas that CMS determines have fewer than two network-based Medicare Advantage plans. In these areas, we offer Medicare PFFS plans that have no preferred network. Individuals in these plans pay us a monthly premium to receive typical Medicare Advantage benefits along with the freedom to choose any health care provider that accepts individuals at rates equivalent to Medicare FFS payment rates.
CMS uses monthly rates per person for each county to determine the fixed monthly payments per member to pay to health benefit plans. These rates are adjusted under CMS’s risk-adjustment model which uses health status indicators, or risk scores, to improve the accuracy of payment. The risk-adjustment model, which CMS implemented pursuant to the Balanced Budget Act of 1997 (BBA) and the Benefits and Improvement Protection Act of 2000 (BIPA), generally pays more for members with predictably higher costs and uses principal hospital inpatient diagnoses as well as diagnosis data from ambulatory treatment settings (hospital outpatient department and physician visits) to establish the risk-adjustment payments. Under the risk-adjustment methodology, all health benefit organizations must collect from providers and submit the necessary diagnosis code information to CMS within prescribed deadlines.
CMS is phasing-in the process of calculating risk scores using diagnoses data from the Risk Adjustment Processing System, or RAPS, to diagnosis data from the Encounter Data System, or EDS. The RAPS process requires MA plans to apply a filter logic based on CMS guidelines and only submit those claims that pass the filtering logic. For submissions through EDS, CMS requires MA plans to submit all the claims data and CMS will apply the risk adjustment filtering logic to determine the risk adjustment data used to calculate risk scores. For 2016, 10% of the risk score was calculated from claims data submitted through EDS, increasing to 25% of the risk score calculated from claims data through EDS for 2017.
At December 31,
2016
, we provided health insurance coverage under CMS contracts to approximately
2,837,600
individual Medicare Advantage members, including approximately
598,100
members in Florida. These Florida contracts accounted for premiums revenue of approximately
$7.7 billion
, which represented approximately
24.2%
of our individual Medicare Advantage premiums revenue, or
14.0%
of our consolidated premiums and services revenue for the year ended December 31,
2016
.
6
Our HMO, PPO, and PFFS products covered under Medicare Advantage contracts with CMS are renewed generally for a calendar year term unless CMS notifies us of its decision not to renew by May 1 of the calendar year in which the contract would end, or we notify CMS of our decision not to renew by the first Monday in June of the calendar year in which the contract would end. All material contracts between Humana and CMS relating to our Medicare Advantage products have been renewed for
2017
, and all of our product offerings filed with CMS for
2017
have been approved.
Individual Medicare Stand-Alone Prescription Drug Products
We offer stand-alone prescription drug plans, or PDPs, under Medicare Part D, including a PDP offering co-branded with Wal-Mart Stores, Inc., or the Humana-Walmart plan. Generally, Medicare-eligible individuals enroll in one of our plan choices between October 15 and December 7 for coverage that begins on the following January 1. Our stand-alone PDP offerings consist of plans offering basic coverage with benefits mandated by Congress, as well as plans providing enhanced coverage with varying degrees of out-of-pocket costs for premiums, deductibles, and co-insurance. Our revenues from CMS and the beneficiary are determined from our PDP bids submitted annually to CMS. These revenues also reflect the health status of the beneficiary and risk sharing provisions as more fully described in Item 7. – Management’s Discussion and Analysis of Financial Condition and Results of Operations under the section titled “Medicare Part D Provisions.” Our stand-alone PDP contracts with CMS are renewed generally for a calendar year term unless CMS notifies us of its decision not to renew by May 1 of the calendar year in which the contract would end, or we notify CMS of our decision not to renew by the first Monday in June of the calendar year in which the contract would end. All material contracts between Humana and CMS relating to our Medicare stand-alone PDP products have been renewed for
2017
, and all of our product offerings filed with CMS for
2017
have been approved.
We have administered CMS’s Limited Income Newly Eligible Transition, or LI-NET, prescription drug plan program since 2010. This program allows individuals who receive Medicare’s low-income subsidy to also receive immediate prescription drug coverage at the point of sale if they are not already enrolled in a Medicare Part D plan. CMS temporarily enrolls newly identified individuals with both Medicare and Medicaid into the LI-NET prescription drug plan program, and subsequently transitions each member into a Medicare Part D plan that may or may not be a Humana Medicare plan.
Group Medicare Advantage and Medicare stand-alone PDP
We offer products that enable employers that provide post-retirement health care benefits to replace Medicare wrap or Medicare supplement products with Medicare Advantage or stand-alone PDPs from Humana. These products offer the same types of benefits and services available to members in our individual Medicare plans discussed previously and can be tailored to closely match an employer’s post-retirement benefit structure.
State-based Medicaid Contracts
Our state-based contracts allow us to serve members enrolled in state-based Medicaid programs including Temporary Assistance to Needy Families, or TANF, Long-Term Support Services, or LTSS, and dual eligible demonstration programs. TANF is a state and federally funded program that provides cash assistance and supportive services to assist families with children under age 18, helping them achieve economic self-sufficiency. LTSS is a state and federally funded program that offers states a broad and flexible set of program design options and refers to the delivery of long-term support services for our members who receive home and community or institution-based services for long-term care. Our contracts are generally for three to five year terms.
Medicare beneficiaries who also qualify for Medicaid due to low income or special needs are known as dual eligible beneficiaries, or dual eligibles. The dual eligible population represents a disproportionate share of Medicaid and Medicare costs. There were approximately
10.4 million
dual eligible individuals in the United States in
2016
, trending upward due to Medicaid eligibility expansions and individuals aging into the Medicare program. Since the enactment of the Health Care Reform Law, states are pursuing stand-alone dual eligible CMS demonstration programs in which Medicare, Medicaid, and LTSS benefits are more tightly integrated. Eligibility for participation in these stand-alone dual eligible demonstration programs may require state-based contractual relationships in existing Medicaid programs.
7
We have contracts to serve Medicaid eligible members in Florida under the TANF and LTSS programs. Our contracts in Virginia and Illinois serve members under each state’s stand-alone dual eligible demonstration program. In addition, in Illinois we have an Integrated Care Program, or ICP, Medicaid contract. Our Kentucky Medicaid contract is subject to a 100% coinsurance contract with CareSource Management Group Company, ceding all the risk to CareSource.
In addition to the dual eligible members we serve under the Virginia and Illinois demonstration program, we serve other dual eligible members enrolled in our Medicare Advantage and stand-alone prescription drug plans. As of December 31,
2016
, we served approximately
486,000
dual eligible members in our Medicare Advantage plans and approximately
1,179,000
dual eligible members in our stand-alone prescription drug plans.
Individual Commercial Coverage
Our individual health plans are marketed under the HumanaOne brand. We offer products both on and off of the public exchange. We offer products on exchanges where we can achieve an affordable cost of care, including HMO offerings and select networks in most markets. Our off-exchange products are primarily PPO and POS offerings, including plans issued prior to 2014 that were previously underwritten. For 2017, we discontinued substantially all Health Care Reform Law compliant off-exchange individual commercial medical plans effective January 1, 2017. Policies issued prior to the enactment of the Health Care Reform Law on March 23, 2010 are grandfathered policies. Grandfathered policies are exempt from most of the requirements of the Health Care Reform Law, including mandated benefits. However, our grandfathered plans include provisions that guarantee renewal of coverage for as long as the plan is continued and the individual chooses to renew. Policies issued between March 23, 2010 and December 31, 2013 are required to conform to the Health Care Reform Law, including mandated benefits, upon renewal at various transition dates between 2016 and 2017 depending on the state.
On February 14, 2017, we announced we are exiting our individual commercial medical businesses January 1, 2018
as more fully described in Note 7 to the consolidated financial statements included in Item 8. – Financial Statements and Supplementary Data.
Rewards-based wellness programs are included with many individual products. We also offer optional benefits such as dental, vision, life, and a portfolio of financial protection products.
8
Group Segment Products
This segment is comprised of products sold to employer groups including medical and supplemental benefit plans as well as health and wellness products as described in the discussion that follows. The following table presents our premiums and services revenue for the Group segment by product for the year ended December 31,
2016
:
|
Group
Segment Premiums and Services Revenue |
Percent of
Consolidated Premiums and Services Revenue |
||||||
|
|
(dollars in millions)
|
||||||
|
External Revenue:
|
|||||||
|
Premiums:
|
|||||||
|
Fully-insured commercial group
|
$
|
5,405
|
|
10.0
|
%
|
||
|
Group specialty
|
1,020
|
|
1.9
|
%
|
|||
|
Military services
|
12
|
|
—
|
%
|
|||
|
Total premiums
|
6,437
|
|
11.9
|
%
|
|||
|
Services
|
694
|
|
1.3
|
%
|
|||
|
Total premiums and services revenue
|
$
|
7,131
|
|
13.2
|
%
|
||
|
Intersegment services revenue:
|
|||||||
|
Wellness
|
$
|
99
|
|
n/a
|
|
||
|
Total intersegment services revenue
|
$
|
99
|
|
||||
n/a – not applicable
Group Commercial Coverage
Our commercial products sold to employer groups include a broad spectrum of major medical benefits with multiple in-network coinsurance levels and annual deductible choices that employers of all sizes can offer to their employees on either a fully-insured, through HMO, PPO, or POS plans, or self-funded basis. Our plans integrate clinical programs, plan designs, communication tools, and spending accounts. We participate in the Federal Employee Health Benefits Program, or FEHBP, primarily with our HMO offering in certain markets. FEHBP is the government’s health insurance program for Federal employees, retirees, former employees, family members, and spouses. As with our individual commercial products, the employer group offerings include Go365
TM
, our wellness and loyalty reward program.
Our administrative services only, or ASO, products are offered to employers who self-insure their employee health plans. We receive fees to provide administrative services which generally include the processing of claims, offering access to our provider networks and clinical programs, and responding to customer service inquiries from members of self-funded employers. These products may include all of the same benefit and product design characteristics of our fully-insured HMO, PPO, or POS products described previously. Under ASO contracts, self-funded employers generally retain the risk of financing substantially all of the cost of health benefits. However, more than half of our ASO customers purchase stop loss insurance coverage from us to cover catastrophic claims or to limit aggregate annual costs.
As with individual commercial policies, employers can customize their offerings with optional benefits such as dental, vision, life, and a portfolio of voluntary benefit products.
Military Services
Under our TRICARE South Region contract with the United States Department of Defense, or DoD, we provide administrative services to arrange health care services for the dependents of active duty military personnel and for retired military personnel and their dependents. We have participated in the TRICARE program since 1996 under contracts with the DoD. On April 1, 2012, we began delivering services under our current TRICARE South Region contract that the Defense Health Agency, or DHA (formerly known as the TRICARE Management Activity), awarded to us on February 25, 2011. Under the current contract, we provide administrative services while the federal government
9
retains all of the risk of the cost of health benefits. Accordingly, we account for revenues under the current contract net of estimated health care costs similar to an administrative services fee only agreement.
Wellness
We offer wellness solutions including our Go365 wellness and loyalty rewards program, health coaching, employee assistance program, and clinical programs. These programs, when offered collectively to employer customers as our Total Health product, turn any standard plan of the employer's choosing into an integrated health and well-being solution that encourages participation in these programs.
Our Go365 program provides our members with access to a science-based, actuarially driven wellness and loyalty program that features a wide range of well-being tools and rewards that are customized to an individual’s needs and wants. A key element of the program includes a sophisticated health-behavior-change model supported by an incentive program.
We also provide employee assistance programs and coaching services including a comprehensive turn-key coaching program, an enhancement to a medically based coaching protocol and a platform that makes coaching programs more efficient.
Our Healthcare Services Segment Products
The products offered by our Healthcare Services segment are key to our integrated care delivery model. This segment is comprised of stand-alone businesses that offer services including pharmacy solutions, provider services, home based services, clinical programs, and predictive modeling and informatics services to other Humana businesses, as well as external health plan members, external health plans, and other employers or individuals and are described in the discussion that follows. Our intersegment revenue is described in Note 17 to the consolidated financial statements included in Item 8. – Financial Statements and Supplementary Data. The following table presents our services revenue for the Healthcare Services segment by line of business for the year ended December 31,
2016
:
|
Healthcare Services
Segment Services Revenue |
Percent of
Consolidated Premiums and Services Revenue |
||||||
|
|
(dollars in millions)
|
||||||
|
Intersegment revenue:
|
|||||||
|
Pharmacy solutions
|
$
|
21,952
|
|
n/a
|
|
||
|
Provider services
|
1,677
|
|
n/a
|
|
|||
|
Home based services
|
1,026
|
|
n/a
|
|
|||
|
Clinical programs
|
180
|
|
n/a
|
|
|||
|
Total intersegment revenue
|
$
|
24,835
|
|
||||
|
External services revenue:
|
|||||||
|
Pharmacy solutions
|
$
|
31
|
|
0.1
|
%
|
||
|
Provider services
|
78
|
|
0.1
|
%
|
|||
|
Home based services
|
148
|
|
0.3
|
%
|
|||
|
Total external services revenue
|
$
|
257
|
|
0.5
|
%
|
||
n/a – not applicable
Pharmacy solutions
Humana Pharmacy Solutions
®
, or HPS, manages traditional prescription drug coverage for both individuals and employer groups in addition to providing a broad array of pharmacy solutions. HPS also operates prescription mail order services for brand, generic, and specialty drugs and diabetic supplies through Humana Pharmacy, Inc., as well as research services.
10
Provider services
We operate full-service, multi-specialty medical centers, primarily in Florida, staffed by primary care providers and medical specialists practicing cardiology, endocrinology, geriatric medicine, internal medicine, ophthalmology, neurology, and podiatry.
We also operate Transcend, a Medical Services Organization, or MSO, that coordinates medical care for Medicare Advantage beneficiaries primarily in four states. Transcend provides resources in care coordination, financial risk management, clinical integration and patient engagement that help physicians improve the patient experience as well as care outcomes. Transcend collaborates with physicians, medical groups and integrated delivery systems to successfully transition to value-based care by engaging, partnering and offering practical services and solutions. Transcend represents a key component of our integrated care delivery model which we believe is scalable to new markets. In addition, we own a noncontrolling equity interest in MCCI Holdings, LLC, a privately held MSO headquartered in Miami, Florida, that primarily coordinates medical care for Medicare Advantage beneficiaries in Florida, Texas and Georgia.
Programs to enhance the quality of care for members are key elements of our integrated care delivery model. We believe that technology represents a significant opportunity in health care that positively impacts our members. Our Transcend Insights business focuses on population health and wellness capabilities across the sector and serves health care systems, physicians and care teams by leveraging actionable data to help improve patient care. We help care teams and patients transition from a reactive approach to care to one that proactively promotes health and long-term wellness. We have enhanced our health information technology capabilities enabling us to create a more complete view of an individual’s health, designed to connect, coordinate and simplify health care while reducing costs. These capabilities include our health care analytics engine, which reviews billions of clinical data points on millions of patients each day to provide members, providers, and payers real-time clinical insights to identify evidence-based gaps-in-care, drug safety alerts and other critical health concerns to improve outcomes. Additionally, our technology connects Humana and disparate electronic health record systems to enable the exchange of essential health information in real-time to provide physicians and care teams with a single, comprehensive patient view.
On June 1, 2015, we completed the sale of our wholly owned subsidiary, Concentra Inc., or Concentra, that delivered occupational medicine, urgent care, physical therapy, and wellness services to employees and the general public through its operation of medical centers and worksite medical facilities. See Note 3 to the consolidated financial statements included in Item 8. - Financial Statements and Supplementary Data.
Home based services
Via in-home care, telephonic health counseling/coaching, and remote monitoring, we are actively involved in the care management of our customers with the greatest needs. Home based services include the operations of Humana At Home, Inc., or Humana At Home
®
. As a chronic-care provider of in-home care for seniors, we provide innovative and holistic care coordination services for individuals living with multiple chronic conditions, individuals with disabilities, fragile and aging-in-place members and their care givers. We focus our deployment of these services in geographies, such as Florida, with a high concentration of members living with multiple chronic conditions. The clinical support and care provided by Humana At Home is designed to improve health outcomes and result in a higher number of days members can spend at their homes instead of in an acute care facility. To that end, we have accelerated our process for identifying and reaching out to members in need of clinical intervention. At December 31,
2016
, we enrolled approximately
622,300
members with complex chronic conditions in the Humana Chronic Care Program, a
5.4%
increase
compared with approximately
590,300
members at December 31,
2015
, reflecting enhanced predictive modeling capabilities and focus on proactive clinical outreach and member engagement, particularly for our Medicare Advantage membership. We believe these initiatives lead to better health outcomes for our members and lower health care costs.
Clinical programs
We are committed to the integrated physical and mental health of our members. Accordingly, we take a holistic approach to healthcare, offering care management, behavioral health services and wellness programs.
11
Our care management programs take full advantage of the population health, wellness and clinical applications offered by Transcend Insights and CareHub, our clinical management tool used by providers and care managers across the company to help our members achieve their best health, to offer various levels of support, matching the intensity of the support to the needs of members with ongoing health challenges through telephonic and onsite programs. These programs include Personal Nurse, chronic condition management, and case management as well as programs supporting maternity, cancer, neonatal intensive care unit, and transplant services.
In addition, we focus on the behavioral aspects of a members' health such as managing stress and work/life balance. Humana Behavioral Health takes a holistic, mind-and-body approach to behavioral healthcare to address the whole person, encouraging faster recovery and improving clinical outcomes while reducing costs for both the member and employer.
Other Businesses
Other Businesses primarily includes our closed block of long-term care insurance policies described below. Total premiums and services revenue for our Other Businesses was
$48 million
, or
0.1%
of consolidated premiums and services revenue for the year ended December 31,
2016
.
We have a non-strategic closed block of approximately
30,800
long-term care insurance policies associated with our acquisition of KMG America Corporation in 2007. Long-term care insurance policies are intended to protect the insured from the cost of long-term care services including those provided by nursing homes, assisted living facilities, and adult day care as well as home health care services. No new policies have been written since 2005 under this closed block.
Membership
The following table summarizes our total medical membership at December 31,
2016
, by market and product:
|
|
Retail Segment
|
Group Segment
|
|
|
|
||||||||||||||||||||
|
|
(in thousands)
|
||||||||||||||||||||||||
|
|
Individual
Medicare Advantage |
Group
Medicare Advantage |
Medicare stand- alone PDP |
Individual
Commercial |
Medicare Supplement
|
State-
based contracts |
Fully-
insured commercial Group |
ASO
|
Military services
|
Other
Businesses |
Total
|
Percent
of Total |
|||||||||||||
|
Florida
|
598.1
|
|
16.0
|
|
345.0
|
|
194.4
|
|
6.7
|
|
365.9
|
|
140.2
|
|
50.7
|
|
—
|
|
—
|
|
1,717.0
|
|
12.1
|
%
|
|
|
Texas
|
222.5
|
|
69.9
|
|
309.7
|
|
101.4
|
|
7.5
|
|
—
|
|
203.1
|
|
24.6
|
|
—
|
|
—
|
|
938.7
|
|
6.6
|
%
|
|
|
Kentucky
|
76.3
|
|
58.2
|
|
206.5
|
|
10.1
|
|
5.4
|
|
—
|
|
107.7
|
|
170.1
|
|
—
|
|
—
|
|
634.3
|
|
4.5
|
%
|
|
|
Georgia
|
115.8
|
|
2.5
|
|
130.2
|
|
163.7
|
|
9.9
|
|
—
|
|
158.1
|
|
20.8
|
|
—
|
|
—
|
|
601.0
|
|
4.2
|
%
|
|
|
California
|
70.0
|
|
0.1
|
|
444.3
|
|
—
|
|
15.7
|
|
—
|
|
—
|
|
—
|
|
—
|
|
—
|
|
530.1
|
|
3.7
|
%
|
|
|
Ohio
|
118.2
|
|
16.3
|
|
181.8
|
|
5.8
|
|
48.5
|
|
—
|
|
51.0
|
|
69.1
|
|
—
|
|
—
|
|
490.7
|
|
3.4
|
%
|
|
|
Illinois
|
87.8
|
|
21.3
|
|
174.7
|
|
5.4
|
|
4.4
|
|
11.5
|
|
72.8
|
|
89.9
|
|
—
|
|
—
|
|
467.8
|
|
3.3
|
%
|
|
|
Missouri/Kansas
|
90.7
|
|
4.3
|
|
213.2
|
|
16.4
|
|
8.1
|
|
—
|
|
54.9
|
|
10.8
|
|
—
|
|
—
|
|
398.4
|
|
2.8
|
%
|
|
|
North Carolina
|
146.4
|
|
39.5
|
|
178.3
|
|
2.6
|
|
4.7
|
|
—
|
|
—
|
|
—
|
|
—
|
|
—
|
|
371.5
|
|
2.6
|
%
|
|
|
Tennessee
|
144.9
|
|
3.7
|
|
108.6
|
|
27.9
|
|
4.0
|
|
—
|
|
46.7
|
|
29.4
|
|
—
|
|
—
|
|
365.2
|
|
2.6
|
%
|
|
|
Louisiana
|
155.9
|
|
11.5
|
|
58.2
|
|
29.2
|
|
1.6
|
|
—
|
|
68.6
|
|
32.9
|
|
—
|
|
—
|
|
357.9
|
|
2.5
|
%
|
|
|
Wisconsin
|
63.2
|
|
10.6
|
|
113.0
|
|
5.9
|
|
5.0
|
|
—
|
|
89.0
|
|
37.2
|
|
—
|
|
—
|
|
323.9
|
|
2.3
|
%
|
|
|
Virginia
|
112.3
|
|
6.1
|
|
140.3
|
|
1.4
|
|
7.9
|
|
10.7
|
|
—
|
|
—
|
|
—
|
|
—
|
|
278.7
|
|
2.0
|
%
|
|
|
Indiana
|
93.1
|
|
3.7
|
|
133.3
|
|
2.1
|
|
7.5
|
|
—
|
|
22.8
|
|
14.2
|
|
—
|
|
—
|
|
276.7
|
|
1.9
|
%
|
|
|
Michigan
|
47.4
|
|
14.0
|
|
147.6
|
|
27.2
|
|
2.9
|
|
—
|
|
5.3
|
|
0.5
|
|
—
|
|
—
|
|
244.9
|
|
1.7
|
%
|
|
|
Pennsylvania
|
40.3
|
|
0.9
|
|
157.4
|
|
—
|
|
4.6
|
|
—
|
|
—
|
|
—
|
|
—
|
|
—
|
|
203.2
|
|
1.4
|
%
|
|
|
South Carolina
|
95.0
|
|
0.8
|
|
86.0
|
|
0.2
|
|
4.7
|
|
—
|
|
—
|
|
—
|
|
—
|
|
—
|
|
186.7
|
|
1.3
|
%
|
|
|
Military services
|
—
|
|
—
|
|
—
|
|
—
|
|
—
|
|
—
|
|
—
|
|
—
|
|
3,084.1
|
|
—
|
|
3,084.1
|
|
21.7
|
%
|
|
|
Others
|
559.7
|
|
76.0
|
|
1,823.3
|
|
61.1
|
|
69.7
|
|
—
|
|
115.8
|
|
23.0
|
|
—
|
|
30.8
|
|
2,759.4
|
|
19.4
|
%
|
|
|
Totals
|
2,837.6
|
|
355.4
|
|
4,951.4
|
|
654.8
|
|
218.8
|
|
388.1
|
|
1,136.0
|
|
573.2
|
|
3,084.1
|
|
30.8
|
|
14,230.2
|
|
100.0
|
%
|
|
12
Provider Arrangements
We provide our members with access to health care services through our networks of health care providers whom we employ or with whom we have contracted, including hospitals and other independent facilities such as outpatient surgery centers, primary care providers, specialist physicians, dentists, and providers of ancillary health care services and facilities. These ancillary services and facilities include laboratories, ambulance services, medical equipment services, home health agencies, mental health providers, rehabilitation facilities, nursing homes, optical services, and pharmacies. Our membership base and the ability to influence where our members seek care generally enable us to obtain contractual discounts with providers.
We use a variety of techniques to provide access to effective and efficient use of health care services for our members. These techniques include the coordination of care for our members, product and benefit designs, hospital inpatient management systems, the use of sophisticated analytics, and enrolling members into various care management programs. The focal point for health care services in many of our HMO networks is the primary care provider who, under contract with us, provides services to our members, and may control utilization of appropriate services by directing or approving hospitalization and referrals to specialists and other providers. Some physicians may have arrangements under which they can earn bonuses when certain target goals relating to the provision of quality patient care are met. We have available care management programs related to complex chronic conditions such as congestive heart failure and coronary artery disease. We also have programs for prenatal and premature infant care, asthma related illness, end stage renal disease, diabetes, cancer, and certain other conditions.
We typically contract with hospitals on either (1) a per diem rate, which is an all-inclusive rate per day, (2) a case rate or diagnosis-related groups (DRG), which is an all-inclusive rate per admission, or (3) a discounted charge for inpatient hospital services. Outpatient hospital services generally are contracted at a flat rate by type of service, ambulatory payment classifications, or APCs, or at a discounted charge. APCs are similar to flat rates except multiple services and procedures may be aggregated into one fixed payment. These contracts are often multi-year agreements, with rates that are adjusted for inflation annually based on the consumer price index, other nationally recognized inflation indexes, or specific negotiations with the provider. Outpatient surgery centers and other ancillary providers typically are contracted at flat rates per service provided or are reimbursed based upon a nationally recognized fee schedule such as the Medicare allowable fee schedule.
Our contracts with physicians typically are renewed automatically each year, unless either party gives written notice, generally ranging from 90 to 120 days, to the other party of its intent to terminate the arrangement. Most of the physicians in our PPO networks and some of our physicians in our HMO networks are reimbursed based upon a fixed fee schedule, which typically provides for reimbursement based upon a percentage of the standard Medicare allowable fee schedule.
The terms of our contracts with hospitals and physicians may also vary between Medicare and commercial business. A significant portion of our Medicare network contracts, including those with both hospitals and physicians, are tied to Medicare reimbursement levels and methodologies.
Automatic reductions to the federal budget, known as sequestration, took effect on April 1, 2013, including aggregate reductions to Medicare payments to providers of up to 2% per fiscal year. Due to the uncertainty around the application of these reductions, there can be no assurances that we can completely offset any reductions to the Medicare healthcare programs.
Capitation
We offer providers a continuum of opportunities to increase the integration of care and offer assistance to providers in transitioning from a fee-for-service to a value-based arrangement. These include performance bonuses, shared savings and shared risk relationships. For some of our medical membership, we share risk with providers under capitation contracts where physicians and hospitals accept varying levels of financial risk for a defined set of membership, primarily HMO membership. Under the typical capitation arrangement, we prepay these providers a monthly fixed-fee per member, known as a capitation (per capita) payment, to cover all or a defined portion of the benefits provided to the capitated member.
13
We believe these risk-based models represent a key element of our integrated care delivery model at the core of our strategy. Our health plan subsidiaries may enter into these risk-based contracts with third party providers or our owned provider subsidiaries.
At December 31,
2016
, approximately
1,193,400
members, or
8.4%
of our medical membership, were covered under risk-based contracts, including
921,000
individual Medicare Advantage members, or
32.5%
of our total individual Medicare Advantage membership.
Physicians under capitation arrangements typically have stop loss coverage so that a physician’s financial risk for any single member is limited to a maximum amount on an annual basis. We typically process all claims and monitor the financial performance and solvency of our capitated providers. However, we delegated claim processing functions under capitation arrangements covering approximately
191,300
HMO members, including
170,500
individual Medicare Advantage members, or
18.5%
of the
921,000
individual Medicare Advantage members covered under risk-based contracts at December 31,
2016
, with the provider assuming substantially all the risk of coordinating the members’ health care benefits. Capitation expense under delegated arrangements for which we have a limited view of the underlying claims experience was approximately
$1.3 billion
, or
2.9%
of total benefits expense, for the year ended December 31,
2016
. We remain financially responsible for health care services to our members in the event our providers fail to provide such services.
Accreditation Assessment
Our accreditation assessment program consists of several internal programs, including those that credential providers and those designed to meet the audit standards of federal and state agencies as well as external accreditation standards. We also offer quality and outcome measurement and improvement programs such as the Health Care Effectiveness Data and Information Sets, or HEDIS, which is used by employers, government purchasers and the National Committee for Quality Assurance, or NCQA, to evaluate health plans based on various criteria, including effectiveness of care and member satisfaction.
Providers participating in our networks must satisfy specific criteria, including licensing, patient access, office standards, after-hours coverage, and other factors. Most participating hospitals also meet accreditation criteria established by CMS and/or the Joint Commission on Accreditation of Healthcare Organizations.
Recredentialing of participating providers occurs every two to three years, depending on applicable state laws. Recredentialing of participating providers includes verification of their medical licenses, review of their malpractice liability claims histories, review of their board certifications, if applicable, and review of applicable quality information. A committee, composed of a peer group of providers, reviews the applications of providers being considered for credentialing and recredentialing.
We request accreditation for certain of our health plans and/or departments from NCQA, the Accreditation Association for Ambulatory Health Care, and URAC. Accreditation or external review by an approved organization is mandatory in the states of Florida and Kansas for licensure as an HMO. Additionally, all products sold on the federal and state marketplaces are required to be accredited. Certain commercial businesses, like those impacted by a third-party labor agreement or those where a request is made by the employer, may require or prefer accredited health plans.
NCQA reviews our compliance based on standards for quality improvement, credentialing, utilization management, member connections, and member rights and responsibilities. We have achieved and maintained NCQA accreditation in most of our commercial, Medicare and Medicaid HMO/POS markets with enough history and membership, and for many of our PPO markets.
Sales and Marketing
We use various methods to market our products, including television, radio, the Internet, telemarketing, and direct mailings.
At December 31,
2016
, we employed approximately
1,500
sales representatives, as well as approximately
1,300
telemarketing representatives who assisted in the marketing of Medicare and individual commercial health insurance
14
and specialty products in our Retail segment, including making appointments for sales representatives with prospective members. We have a marketing arrangement with Wal-Mart Stores, Inc., or Wal-Mart, for our individual Medicare stand-alone PDP offering. We also sell group Medicare Advantage products through large employers. In addition, we market our Medicare and individual commercial health insurance and specialty products through licensed independent brokers and agents. For our Medicare products, commissions paid to employed sales representatives and independent brokers and agents are based on a per unit commission structure, regulated in structure and amount by CMS. For our individual commercial health insurance and specialty products, we generally pay brokers a commission based on premiums, with commissions varying by market and premium volume. In addition to a commission based directly on premium volume for sales to particular customers, we also have programs that pay brokers and agents based on other metrics. These include commission bonuses based on sales that attain certain levels or involve particular products. We also pay additional commissions based on aggregate volumes of sales involving multiple customers.
In our Group segment, individuals may become members of our commercial HMOs and PPOs through their employers or other groups, which typically offer employees or members a selection of health insurance products, pay for all or part of the premiums, and make payroll deductions for any premiums payable by the employees. We attempt to become an employer’s or group’s exclusive source of health insurance benefits by offering a variety of HMO, PPO, and specialty products that provide cost-effective quality health care coverage consistent with the needs and expectations of their employees or members. In addition, we have begun to offer plans to employer groups through private exchanges. Employers can give their employees a set amount of money and then direct them to a private exchange where employees can shop for a health plan and other benefits based on what the employer has selected as options. We use licensed independent brokers, independent agents, and employees to sell our group products. Many of our larger employer group customers are represented by insurance brokers and consultants who assist these groups in the design and purchase of health care products. We pay brokers and agents using the same commission structure described above for our individual commercial health insurance and specialty products.
Underwriting
Since 2014, the Health Care Reform Law requires all individual and certain group health plans to guarantee issuance and renew coverage without pre-existing condition exclusions or health-status rating adjustments. Accordingly, newly issued individual and certain group health plans are not subject to underwriting. Further, underwriting techniques are not employed in connection with our Medicare, military services, or Medicaid products because government regulations require us to accept all eligible applicants regardless of their health or prior medical history.
Competition
The health benefits industry is highly competitive. Our competitors vary by local market and include other managed care companies, national insurance companies, and other HMOs and PPOs. Many of our competitors have a larger membership base and/or greater financial resources than our health plans in the markets in which we compete. Our ability to sell our products and to retain customers may be influenced by such factors as those described in Item 1A. – Risk Factors in this
2016
Form 10-K.
Government Regulation
Diverse legislative and regulatory initiatives at both the federal and state levels continue to affect aspects of the nation’s health care system.
Our management works proactively to ensure compliance with all governmental laws and regulations affecting our business. We are unable to predict how existing federal or state laws and regulations may be changed or interpreted, what additional laws or regulations affecting our businesses may be enacted or proposed, when and which of the proposed laws will be adopted or what effect any such new laws and regulations will have on our results of operations, financial position, or cash flows.
For a description of certain material current activities in the federal and state legislative areas, see Item 1A. – Risk Factors in this
2016
Form 10-K.
15
Certain Other Services
Captive Insurance Company
We bear general business risks associated with operating our Company such as professional and general liability, employee workers’ compensation, and officer and director errors and omissions risks. Professional and general liability risks may include, for example, medical malpractice claims and disputes with members regarding benefit coverage. We retain certain of these risks through our wholly-owned, captive insurance subsidiary. We reduce exposure to these risks by insuring levels of coverage for losses in excess of our retained limits with a number of third-party insurance companies. We remain liable in the event these insurance companies are unable to pay their portion of the losses.
Centralized Management Services
We provide centralized management services to each of our health plans and to our business segments from our headquarters and service centers. These services include management information systems, product development and administration, finance, human resources, accounting, law, public relations, marketing, insurance, purchasing, risk management, internal audit, actuarial, underwriting, claims processing, billing/enrollment, and customer service. Through intercompany service agreements approved, if required, by state regulatory authorities, Humana Inc., our parent company, charges a management fee for reimbursement of certain centralized services provided to its subsidiaries.
Employees
As of December 31,
2016
, we had approximately
51,600
employees and approximately
2,600
additional medical professionals working under management agreements primarily between us and affiliated physician-owned associations. We believe we have good relations with our employees and have not experienced any work stoppages.
16
Risks Relating to the Terminated Merger with Aetna
Our proposed merger with Aetna has affected and may in the future, materially and adversely affect our results of operations and stock price.
On February 14, 2017, we and Aetna agreed to mutually terminate our Merger Agreement, as our Board determined that an appeal of the Court's ruling enjoining the transaction would not be in the best interest of our stockholders. Although difficult to quantify, we believe that the proposed merger with Aetna, and subsequent termination of the Merger Agreement, has affected and may, in the future, materially and adversely affect our results of operations, due to the following:
|
•
|
continued liability for certain transaction costs, including legal, accounting, financial advisory and other costs relating to the transaction;
|
|
•
|
diverted management attention to the transaction and integration planning efforts;
|
|
•
|
disruption of our business due to member uncertainty over when or if the acquisition will be completed or members' perception of us as a standalone company, our perception among and activities by external brokers, as well as our ability to negotiate and maintain relationships with certain providers in our network;
|
|
•
|
certain restrictions in the Merger Agreement on the conduct of our business prior to its termination; and
|
|
•
|
other uncertainties that have impaired our ability to retain, recruit and motivate key personnel.
|
The occurrence, continuation or exacerbation of any of these events individually or in combination could materially and adversely affect our results of operations.
Risks Relating to Our Business
If we do not design and price our products properly and competitively, if the premiums we charge are insufficient to cover the cost of health care services delivered to our members, if we are unable to implement clinical initiatives to provide a better health care experience for our members, lower costs and appropriately document the risk profile of our members, or if our estimates of benefits expense are inadequate, our profitability may be materially adversely affected. We estimate the costs of our benefits expense payments, and design and price our products accordingly, using actuarial methods and assumptions based upon, among other relevant factors, claim payment patterns, medical cost inflation, and historical developments such as claim inventory levels and claim receipt patterns. We continually review these estimates, however these estimates involve extensive judgment, and have considerable inherent variability because they are extremely sensitive to changes in claim payment patterns and medical cost trends. Any reserve, including a premium deficiency reserve, may be insufficient.
We use a substantial portion of our revenues to pay the costs of health care services delivered to our members. These costs include claims payments, capitation payments to providers (predetermined amounts paid to cover services), and various other costs incurred to provide health insurance coverage to our members. These costs also include estimates of future payments to hospitals and others for medical care provided to our members. Generally, premiums in the health care business are fixed for one-year periods. Accordingly, costs we incur in excess of our benefit cost projections generally are not recovered in the contract year through higher premiums. We estimate the costs of our future benefit claims and other expenses using actuarial methods and assumptions based upon claim payment patterns, medical inflation, historical developments, including claim inventory levels and claim receipt patterns, and other relevant factors. We also record benefits payable for future payments. We continually review estimates of future payments relating to benefit claims costs for services incurred in the current and prior periods and make necessary adjustments to our reserves, including premium deficiency reserves where appropriate. However, these estimates involve extensive judgment, and have considerable inherent variability that is sensitive to claim payment patterns and medical cost trends. Many factors may and often do cause actual health care costs to exceed what was estimated and used to set our premiums. These factors may include:
|
•
|
increased use of medical facilities and services;
|
17
|
•
|
increased cost of such services;
|
|
•
|
increased use or cost of prescription drugs, including specialty prescription drugs;
|
|
•
|
the introduction of new or costly treatments, including new technologies;
|
|
•
|
our membership mix;
|
|
•
|
variances in actual versus estimated levels of cost associated with new products, benefits or lines of business, product changes or benefit level changes;
|
|
•
|
changes in the demographic characteristics of an account or market;
|
|
•
|
changes or reductions of our utilization management functions such as preauthorization of services, concurrent review or requirements for physician referrals;
|
|
•
|
changes in our pharmacy volume rebates received from drug manufacturers;
|
|
•
|
catastrophes, including acts of terrorism, public health epidemics, or severe weather (e.g. hurricanes and earthquakes);
|
|
•
|
medical cost inflation; and
|
|
•
|
government mandated benefits or other regulatory changes, including any that result from the Health Care Reform Law.
|
Key to our operational strategy is the implementation of clinical initiatives that we believe provide a better health care experience for our members, lower the cost of healthcare services delivered to our members, and appropriately document the risk profile of our members. Our profitability and competitiveness depend in large part on our ability to appropriately manage health care costs through, among other things, the application of medical management programs such as our chronic care management program.
In addition, we also estimate costs associated with long-duration insurance policies including long-term care, life insurance, annuities, and certain health and other supplemental insurance policies sold to individuals for which some of the premium received in the earlier years is intended to pay anticipated benefits to be incurred in future years. At policy issuance, these future policy benefit reserves are recognized on a net level premium method based on interest rates, mortality, morbidity, and maintenance expense assumptions. Because these policies have long-term claim payout periods, there is a greater risk of significant variability in claims costs, either positive or negative. Our actual claims experience will emerge many years after assumptions have been established. The risk of a deviation of the actual interest, morbidity, mortality, and maintenance expense assumptions from those assumed in our reserves are particularly significant to our closed block of long-term care insurance policies. We monitor the loss experience of these long-term care insurance policies, and, when necessary, apply for premium rate increases through a regulatory filing and approval process in the jurisdictions in which such products were sold. However, to the extent premium rate increases or loss experience vary from the assumptions we have locked in, additional future adjustments to reserves could be required.
While we proactively attempt to effectively manage our operating expenses, increases or decreases in staff-related expenses, any costs associated with exiting products, additional investment in new products (including our opportunities in the Medicare programs, state-based contracts, participation in health insurance exchanges, and expansion of clinical capabilities as part of our integrated care delivery model), investments in health and well-being product offerings, acquisitions, new taxes and assessments (including the non-deductible health insurance industry fee and other assessments under the Health Care Reform Law), and implementation of regulatory requirements may increase our operating expenses.
Failure to adequately price our products or estimate sufficient benefits payable or future policy benefits payable, or effectively manage our operating expenses, may result in a material adverse effect on our results of operations, financial position, and cash flows.
We are in a highly competitive industry. Some of our competitors are more established in the health care industry in terms of a larger market share and have greater financial resources than we do in some markets. In addition, other companies may enter our markets in the future, including emerging competitors in the Medicare program or competitors in the delivery of health care services. We may also face increased competition due to participation by other insurers in the health insurance exchanges implemented under the Health Care Reform Law. We believe that barriers to entry
18
in our markets are not substantial, so the addition of new competitors can occur relatively easily, and customers enjoy significant flexibility in moving between competitors. Contracts for the sale of commercial products are generally bid upon or renewed annually. While health plans compete on the basis of many factors, including service and the quality and depth of provider networks, we expect that price will continue to be a significant basis of competition. In addition to the challenge of controlling health care costs, we face intense competitive pressure to contain premium prices. Factors such as business consolidations, strategic alliances, legislative reform, and marketing practices create pressure to contain premium price increases, despite being faced with increasing medical costs.
The policies and decisions of the federal and state governments regarding the Medicare, military, Medicaid and health insurance exchange programs in which we participate have a substantial impact on our profitability. These governmental policies and decisions, which we cannot predict with certainty, directly shape the premiums or other revenues to us under the programs, the eligibility and enrollment of our members, the services we provide to our members, and our administrative, health care services, and other costs associated with these programs. Legislative or regulatory actions, such as those resulting in a reduction in premium payments to us, an increase in our cost of administrative and health care services, or additional fees, taxes or assessments, may have a material adverse effect on our results of operations, financial position, and cash flows.
Premium increases, introduction of new product designs, and our relationships with our providers in various markets, among other issues, could also affect our membership levels. Other actions that could affect membership levels include our possible exit from or entrance into Medicare or commercial markets, or the termination of a large contract.
If we do not compete effectively in our markets, if we set rates too high or too low in highly competitive markets to keep or increase our market share, if membership does not increase as we expect, if membership declines, or if we lose membership with favorable medical cost experience while retaining or increasing membership with unfavorable medical cost experience, our results of operations, financial position, and cash flows may be materially adversely affected.
If we fail to effectively implement our operational and strategic initiatives, including our Medicare initiatives, our state-based contracts strategy, and our participation in the new health insurance exchanges, our business may be materially adversely affected, which is of particular importance given the concentration of our revenues in these products.
Our future performance depends in large part upon our ability to execute our strategy, including opportunities created by the expansion of our Medicare programs, the successful implementation of our integrated care delivery model, our strategy with respect to state-based contracts, including those covering members dually eligible for the Medicare and Medicaid programs, and our participation in health insurance exchanges.
We have made substantial investments in the Medicare program to enhance our ability to participate in these programs. We have increased the size of our Medicare geographic reach through expanded Medicare product offerings. We offer both stand-alone Medicare prescription drug coverage and Medicare Advantage health plans with prescription drug coverage in addition to our other product offerings. We offer a Medicare prescription drug plan in 50 states as well as Puerto Rico and the District of Columbia. The growth of our Medicare products is an important part of our business strategy. Any failure to achieve this growth may have a material adverse effect on our results of operations, financial position, or cash flows. In addition, the expansion of our Medicare products in relation to our other businesses may intensify the risks to us inherent in Medicare products. There is significant concentration of our revenues in Medicare products, with approximately
74%
of our total premiums and services revenue for the year ended December 31,
2016
generated from our Medicare products, including
14%
derived from our individual Medicare Advantage contracts with CMS in Florida. These expansion efforts may result in less diversification of our revenue stream and increased risks associated with operating in a highly regulated industry, as discussed further below.
The Health Care Reform Law created a federal Medicare-Medicaid Coordination Office to serve dual eligibles. This Medicare-Medicaid Coordination Office has initiated a series of state demonstration projects to experiment with better coordination of care between Medicare and Medicaid. Depending upon the results of those demonstration projects, CMS may change the way in which dual eligibles are serviced. If we are unable to implement our strategic initiatives
19
to address the dual eligibles opportunity, including our participation in state-based contracts, or if our initiatives are not successful at attracting or retaining dual eligible members, our business may be materially adversely affected.
Additionally, our strategy includes the growth of our commercial products, including participation in certain health insurance exchanges, introduction of new products and benefit designs, including Go365 and other wellness products, growth of our specialty products such as dental, vision and other supplemental products, the adoption of new technologies, development of adjacent businesses, and the integration of acquired businesses and contracts.
There can be no assurance that we will be able to successfully implement our operational and strategic initiatives, including implementing our integrated care delivery model, that are intended to position us for future growth or that the products we design will be accepted or adopted in the time periods assumed. Failure to implement this strategy may result in a material adverse effect on our results of operations, financial position, and cash flows.
There can be no assurances that we will be successful in maintaining or improving our Star ratings in future years. In addition, there can be no guarantees that the reconsideration that we filed with respect to certain of our Star rating measures for the 2018 bonus year will be successful, that operational measures we may take will successfully mitigate any negative effects of Star quality ratings for the 2018 bonus year or future years, or that we will not experience a decline in membership growth for 2018 as a result of our 2018 bonus year Star ratings.
The achievement of Star ratings of 4-Star or higher qualifies Medicare Advantage plans for premium bonuses. Our Medicare Advantage plans' operating results may be significantly affected by their star ratings. Despite our operational efforts to improve our star ratings, there can be no assurances that we will be successful in maintaining or improving our star ratings in future years. In addition, audits of our performance for past or future periods may result in downgrades to our Star ratings. Accordingly, our plans may not be eligible for full level quality bonuses, which could adversely affect the benefits such plans can offer, reduce membership and/or reduce profit margins.
On October 12, 2016, CMS published updated Star quality ratings for the 2018 bonus year, which showed that the percentage of our July 31, 2016 Medicare Advantage membership in 4-Star plans or higher had declined to approximately 37 percent from approximately 78 percent of our July 31, 2015 Medicare Advantage membership. This decline in membership in 4-Star rated plans does not take into account certain operational actions we intend to take over the coming quarters to mitigate any potential negative impact of these published ratings on Star bonus revenues for 2018. Moreover, we expect the impact of CMS’ comprehensive program audit on our Star ratings to be limited to the 2018 bonus year, and Star results for the 2018 bonus year are not expected to materially impact our Medicare revenue for 2017.
We believe that our Star ratings for the 2018 bonus year do not accurately reflect our actual performance under the applicable Star measures. Consequently, we have filed for reconsideration of certain of those ratings by CMS under the appropriate administrative process.
There can be no guarantees, however, that the request for reconsideration that we filed with CMS will be successful, that any operational measures we may take will successfully mitigate all negative effects of our Star quality ratings for the 2018 bonus year, which could be material, or that we will not experience a decline in membership growth for 2018 as a result of our 2018 bonus year Star ratings.
If we fail to properly maintain the integrity of our data, to strategically implement new information systems, or to protect our proprietary rights to our systems, our business may be materially adversely affected.
Our business depends significantly on effective information systems and the integrity and timeliness of the data we use to run our business. Our business strategy involves providing members and providers with easy to use products that leverage our information to meet their needs. Our ability to adequately price our products and services, provide effective and efficient service to our customers, and to timely and accurately report our financial results depends significantly on the integrity of the data in our information systems. As a result of our past and on-going acquisition activities, we have acquired additional information systems. We have reduced the number of systems we operate, have upgraded and expanded our information systems capabilities, and are gradually migrating existing business to fewer systems. Our information systems require an ongoing commitment of significant resources to maintain, protect, and
20
enhance existing systems and develop new systems to keep pace with continuing changes in information processing technology, evolving industry and regulatory standards, and changing customer preferences. If the information we rely upon to run our businesses was found to be inaccurate or unreliable or if we fail to maintain effectively our information systems and data integrity, we could have operational disruptions, have problems in determining medical cost estimates and establishing appropriate pricing, have customer and physician and other health care provider disputes, have regulatory or other legal problems, have increases in operating expenses, lose existing customers, have difficulty in attracting new customers, or suffer other adverse consequences.
We depend on independent third parties for significant portions of our systems-related support, equipment, facilities, and certain data, including data center operations, data network, voice communication services and pharmacy data processing. This dependence makes our operations vulnerable to such third parties' failure to perform adequately under the contract, due to internal or external factors. A change in service providers could result in a decline in service quality and effectiveness or less favorable contract terms which may adversely affect our operating results.
We rely on our agreements with customers, confidentiality agreements with employees, and our trade secrets and copyrights to protect our proprietary rights. These legal protections and precautions may not prevent misappropriation of our proprietary information. In addition, substantial litigation regarding intellectual property rights exists in the software industry, including litigation involving end users of software products. We expect software products to be increasingly subject to third-party infringement claims as the number of products and competitors in this area grows.
There can be no assurance that our information technology, or IT, process will successfully improve existing systems, develop new systems to support our expanding operations, integrate new systems, protect our proprietary information, defend against cybersecurity attacks, or improve service levels. In addition, there can be no assurance that additional systems issues will not arise in the future. Failure to adequately protect and maintain the integrity of our information systems and data, or to defend against cybersecurity attacks, may result in a material adverse effect on our results of operations, financial position, and cash flows.
If we are unable to defend our information technology security systems against cybersecurity attacks or prevent other privacy or data security incidents that result in security breaches that disrupt our operations or in the unintended dissemination of sensitive personal information or proprietary or confidential information, we could be exposed to significant regulatory fines or penalties, liability or reputational damage, or experience a material adverse effect on our results of operations, financial position, and cash flows.
In the ordinary course of our business, we process, store and transmit large amounts of data, including sensitive personal information as well as proprietary or confidential information relating to our business or a third-party. A cybersecurity attack may penetrate our layered security controls and misappropriate or compromise sensitive personal information or proprietary or confidential information or that of third-parties, create system disruptions, cause shutdowns, or deploy viruses, worms, and other malicious software programs that attack our systems. A cybersecurity attack that bypasses our IT security systems successfully could materially affect us due to the theft, destruction, loss, misappropriation or release of confidential data or intellectual property, operational or business delays resulting from the disruption of our IT systems, or negative publicity resulting in reputation or brand damage with our members, customers, providers, and other stakeholders.
The costs to eliminate or address cybersecurity threats and vulnerabilities before or after an incident could be substantial. Our remediation efforts may not be successful and could result in interruptions, delays, or cessation of service, and loss of existing or potential members. In addition, breaches of our security measures and the unauthorized dissemination of sensitive personal information or proprietary or confidential information about us or our members or other third-parties, could expose our members’ private information and result in the risk of financial or medical identity theft, or expose us or other third-parties to a risk of loss or misuse of this information, result in significant regulatory fines or penalties, litigation and potential liability for us, damage our brand and reputation, or otherwise harm our business.
21
We are involved in various legal actions and governmental and internal investigations, any of which, if resolved unfavorably to us, could result in substantial monetary damages or changes in our business practices. Increased litigation and negative publicity could increase our cost of doing business.
We are or may become a party to a variety of legal actions that affect our business, including breach of contract actions, employment and employment discrimination-related suits, employee benefit claims, stockholder suits and other securities laws claims, and tort claims.
In addition, because of the nature of the health care business, we are subject to a variety of legal actions relating to our business operations, including the design, management, and offering of products and services. These include and could include in the future:
|
•
|
claims relating to the methodologies for calculating premiums;
|
|
•
|
claims relating to the denial of health care benefit payments;
|
|
•
|
claims relating to the denial or rescission of insurance coverage;
|
|
•
|
challenges to the use of some software products used in administering claims;
|
|
•
|
claims relating to our administration of our Medicare Part D offerings;
|
|
•
|
medical malpractice actions based on our medical necessity decisions or brought against us on the theory that we are liable for providers' alleged malpractice;
|
|
•
|
claims arising from any adverse medical consequences resulting from our recommendations about the appropriateness of providers’ proposed medical treatment plans for patients;
|
|
•
|
allegations of anti-competitive and unfair business activities;
|
|
•
|
provider disputes over compensation or non-acceptance or termination of provider contracts or provider contract disputes relating to rate adjustments resulting from the Balance Budget and Emergency Deficit Control Act of 1985, as amended (commonly referred to as “sequestration”);
|
|
•
|
disputes related to ASO business, including actions alleging claim administration errors;
|
|
•
|
qui tam litigation brought by individuals who seek to sue on behalf of the government, alleging that we, as a government contractor, submitted false claims to the government including, among other allegations, resulting from coding and review practices under the Medicare risk-adjustment model;
|
|
•
|
claims related to the failure to disclose some business practices;
|
|
•
|
claims relating to customer audits and contract performance;
|
|
•
|
claims relating to dispensing of drugs associated with our in-house mail-order pharmacy; and
|
|
•
|
professional liability claims arising out of the delivery of healthcare and related services to the public.
|
In some cases, substantial non-economic or punitive damages as well as treble damages under the federal False Claims Act, Racketeer Influenced and Corrupt Organizations Act and other statutes may be sought.
While we currently have insurance coverage for some of these potential liabilities, other potential liabilities may not be covered by insurance, insurers may dispute coverage, or the amount of our insurance may not be enough to cover the damages awarded. In addition, some types of damages, like punitive damages, may not be covered by insurance. In some jurisdictions, coverage of punitive damages is prohibited. Insurance coverage for all or some forms of liability may become unavailable or prohibitively expensive in the future.
The health benefits industry continues to receive significant negative publicity reflecting the public perception of the industry. This publicity and perception have been accompanied by increased litigation, including some large jury awards, legislative activity, regulation, and governmental review of industry practices. These factors may materially adversely affect our ability to market our products or services, may require us to change our products or services or otherwise change our business practices, may increase the regulatory burdens under which we operate, and may require
22
us to pay large judgments or fines. Any combination of these factors could further increase our cost of doing business and adversely affect our results of operations, financial position, and cash flows.
See "Legal Proceedings and Certain Regulatory Matters" in Note 16 to the consolidated financial statements included in Item 8. - Financial Statements and Supplementary Data. We cannot predict the outcome of these matters with certainty.
As a government contractor, we are exposed to risks that may materially adversely affect our business or our willingness or ability to participate in government health care programs.
A significant portion of our revenues relates to federal and state government health care coverage programs, including the Medicare, military, and Medicaid programs. These programs accounted for approximately
75%
of our total premiums and services revenue for the year ended December 31,
2016
. These programs involve various risks, as described further below.
|
•
|
At December 31,
2016
, under our contracts with CMS we provided health insurance coverage to approximately
598,100
individual Medicare Advantage members in Florida. These contracts accounted for approximately
14%
of our total premiums and services revenue for the year ended December 31,
2016
. The loss of these and other CMS contracts or significant changes in the Medicare program as a result of legislative or regulatory action, including reductions in premium payments to us or increases in member benefits without corresponding increases in premium payments to us, may have a material adverse effect on our results of operations, financial position, and cash flows.
|
|
•
|
At December 31,
2016
, our military services business primarily consisted of the TRICARE South Region contract which covers approximately
3,084,100
beneficiaries. For the year ended December 31,
2016
, premiums and services revenue associated with the TRICARE South Region contract accounted for approximately
1%
of our total premiums and services revenue. On April 1, 2012, we began delivering services under the current TRICARE South Region contract that the Defense Health Agency, or DHA (formerly known as the TRICARE Management Activity), awarded to us on February 25, 2011. The current 5-year South Region contract, which expires March 31, 2017, is subject to annual renewals on April 1 of each year during its term at the government’s option. On March 30, 2016, we received notice that the DHA exercised its option to extend the TRICARE South Region contract through March 31, 2017. On July 21, 2016, we were notified by the DHA that we were awarded the contract for the new TRICARE East Region, which is a consolidation of the former North and South Regions, with delivery of health care services expected to commence on October 1, 2017. The next generation East Region and West Region contract awards are currently subject to protests by unsuccessful bidders in the U.S. Court of Federal Claims and before the DHA. The loss of the TRICARE South Region contract or an overturn of the award of the East Region contract to us, should either occur, may have a material adverse effect on our results of operations, financial position, and cash flows.
|
|
•
|
There is a possibility of temporary or permanent suspension from participating in government health care programs, including Medicare and Medicaid, if we are convicted of fraud or other criminal conduct in the performance of a health care program or if there is an adverse decision against us under the federal False Claims Act. As a government contractor, we may be subject to qui tam litigation brought by individuals who seek to sue on behalf of the government, alleging that the government contractor submitted false claims to the government. Litigation of this nature is filed under seal to allow the government an opportunity to investigate and to decide if it wishes to intervene and assume control of the litigation. If the government does not intervene, the lawsuit is unsealed, and the individual may continue to prosecute the action on his or her own.
|
|
•
|
CMS uses a risk-adjustment model which apportions premiums paid to Medicare Advantage, or MA, plans according to health severity of covered members. The risk-adjustment model, which CMS implemented pursuant to the Balanced Budget Act of 1997(BBA) and the Benefits Improvement and Protection Act of 2000 (BIPA), generally pays more where a plan's membership has higher expected costs. Under this model, rates paid to MA plans are based on actuarially determined bids, which include a process whereby our prospective payments are based on a comparison of our beneficiaries’ risk scores, derived from medical
|
23
diagnoses, to those enrolled in the government’s traditional fee-for-service Medicare program (referred to as "Medicare FFS"). Under the risk-adjustment methodology, all MA plans must collect and submit the necessary diagnosis code information from hospital inpatient, hospital outpatient, and physician providers to CMS within prescribed deadlines. The CMS risk-adjustment model uses the diagnosis data to calculate the risk-adjusted premium payment to MA plans, which CMS adjusts for coding pattern differences between the health plans and the government fee-for-service program. We generally rely on providers, including certain providers in our network who are our employees, to code their claim submissions with appropriate diagnoses, which we send to CMS as the basis for our payment received from CMS under the actuarial risk-adjustment model. We also rely on these providers to document appropriately all medical data, including the diagnosis data submitted with claims. In addition, we conduct medical record reviews as part of our data and payment accuracy compliance efforts, to more accurately reflect diagnosis conditions under the risk adjustment model. These compliance efforts include the internal contract level audits described in more detail below.
CMS is phasing-in the process of calculating risk scores using diagnoses data from the Risk Adjustment Processing System, or RAPS, to diagnosis data from the Encounter Data System, or EDS. The RAPS process requires MA plans to apply a filter logic based on CMS guidelines and only submit those claims that pass the filtering logic. For submissions through EDS, CMS requires MA plans to submit all the claims data and CMS will apply the risk adjustment filtering logic to determine the risk adjustment data used to calculate risk scores. For 2016, 10% of the risk score was calculated from claims data submitted through EDS, increasing to 25% of the risk score calculated from claims data through EDS for 2017.
The phase-in from RAPS to EDS could result in different risk scores from each dataset as a result of plan processing issues, CMS processing issues, or filtering logic differences between RAPS and EDS, and could have a material adverse effect on our results of operations, financial position, or cash flows.
CMS is continuing to perform audits of various companies’ selected MA contracts related to this risk adjustment diagnosis data. We refer to these audits as Risk-Adjustment Data Validation Audits, or RADV audits. RADV audits review medical records in an attempt to validate provider medical record documentation and coding practices which influence the calculation of premium payments to MA plans.
In 2012, CMS released a “Notice of Final Payment Error Calculation Methodology for Part C Medicare Advantage Risk Adjustment Data Validation (RADV) Contract-Level Audits.” The payment error calculation methodology provides that, in calculating the economic impact of audit results for an MA contract, if any, the results of the audit sample will be extrapolated to the entire MA contract based upon a comparison to “benchmark” audit data in Medicare FFS (which we refer to as the "FFS Adjuster"). This comparison to the FFS Adjuster is necessary to determine the economic impact, if any, of audit results because the government program data set, including any attendant errors that are present in that data set, provides the basis for MA plans’ risk adjustment to payment rates. CMS already makes other adjustments to payment rates based on a comparison of coding pattern differences between MA plans and Medicare FFS data (such as for frequency of coding for certain diagnoses in MA plan data versus the government program data set).
The final methodology, including the first application of extrapolated audit results to determine audit settlements, is expected to be applied to RADV contract level audits conducted for contract year 2011 and subsequent years. CMS is currently conducting RADV contract level audits for contract years 2011, 2012, and 2013, in which two, five, and five of our Medicare Advantage plans are being audited, respectively. Per CMS guidance, selected MA contracts will be notified of an audit at some point after the close of the final reconciliation for the payment year being audited. The final reconciliation occurs in August of the calendar year following the payment year.
Estimated audit settlements are recorded as a reduction of premiums revenue in our consolidated statements of income, based upon available information. We perform internal contract level audits based on the RADV audit methodology prescribed by CMS. Included in these internal contract level audits is an audit of our Private Fee-For-Service business which we used to represent a proxy of the FFS Adjuster which has not yet been released. We based our accrual of estimated audit settlements for each contract year on the results of
24
these internal contract level audits and update our estimates as each audit is completed. Estimates derived from these results were not material to our results of operations, financial position, or cash flows. However, as indicated, we are awaiting additional guidance from CMS regarding the FFS Adjuster. Accordingly, we cannot determine whether such RADV audits will have a material adverse effect on our results of operations, financial position, or cash flows.
In addition, CMS' comments in formalized guidance regarding “overpayments” to MA plans appear to be inconsistent with CMS' prior RADV audit guidance. These statements, contained in the preamble to CMS’ final rule release regarding Medicare Advantage and Part D prescription drug benefit program regulations for Contract Year 2015, appear to equate each Medicare Advantage risk adjustment data error with an “overpayment” without reconciliation to the principles underlying the FFS Adjuster referenced above. We will continue to work with CMS to ensure that MA plans are paid accurately and that payment model principles are in accordance with the requirements of the Social Security Act, which, if not implemented correctly could have a material adverse effect on our results of operations, financial position, or cash flows.
|
•
|
Our CMS contracts which cover members’ prescription drugs under Medicare Part D contain provisions for risk sharing and certain payments for prescription drug costs for which we are not at risk. These provisions, certain of which are described below, affect our ultimate payments from CMS.
|
The premiums from CMS are subject to risk corridor provisions which compare costs targeted in our annual bids to actual prescription drug costs, limited to actual costs that would have been incurred under the standard coverage as defined by CMS. Variances exceeding certain thresholds may result in CMS making additional payments to us or require us to refund to CMS a portion of the premiums we received (known as a “risk corridor”). We estimate and recognize an adjustment to premiums revenue related to the risk corridor payment settlement based upon pharmacy claims experience. The estimate of the settlement associated with these risk corridor provisions requires us to consider factors that may not be certain, including member eligibility differences with CMS. Our estimate of the settlement associated with the Medicare Part D risk corridor provisions was a net payable of
$150 million
at December 31,
2016
.
Reinsurance and low-income cost subsidies represent payments from CMS in connection with the Medicare Part D program for which we assume no risk. Reinsurance subsidies represent payments for CMS’s portion of claims costs which exceed the member’s out-of-pocket threshold, or the catastrophic coverage level. Low-income cost subsidies represent payments from CMS for all or a portion of the deductible, the coinsurance and co-payment amounts above the out-of-pocket threshold for low-income beneficiaries. Monthly prospective payments from CMS for reinsurance and low-income cost subsidies are based on assumptions submitted with our annual bid. A reconciliation and settlement of CMS’s prospective subsidies against actual prescription drug costs we paid is made after the end of the applicable year.
Settlement of the reinsurance and low-income cost subsidies as well as the risk corridor payment is based on a reconciliation made approximately
9
months after the close of each calendar year.
This reconciliation process requires us to submit claims data necessary for CMS to administer the program. Our claims data may not pass CMS’s claims edit processes due to various reasons, including discrepancies in eligibility or classification of low-income members. To the extent our data does not pass CMS’s claim edit processes, we may bear the risk for all or a portion of the claim which otherwise may have been subject to the risk corridor provision or payment which we would have otherwise received as a low-income subsidy or reinsurance claim. In addition, in the event the settlement represents an amount CMS owes us, there is a negative impact on our cash flows and financial condition as a result of financing CMS’s share of the risk. The opposite is true in the event the settlement represents an amount we owe CMS.
|
•
|
We are also subject to various other governmental audits and investigations. Under state laws, our HMOs and health insurance companies are audited by state departments of insurance for financial and contractual compliance. Our HMOs are audited for compliance with health services by state departments of health. Audits and investigations are also conducted by state attorneys general, CMS, the Office of the Inspector General of Health and Human Services, the Office of Personnel Management, the Department of Justice, the Department of Labor, and the Defense Contract Audit Agency. All of these activities could result in the loss of licensure or the right to participate in various programs, including a limitation on our ability to market
|
25
or sell products, the imposition of fines, penalties and other civil and criminal sanctions, or changes in our business practices. The outcome of any current or future governmental or internal investigations cannot be accurately predicted, nor can we predict any resulting penalties, fines or other sanctions that may be imposed at the discretion of federal or state regulatory authorities. Nevertheless, it is reasonably possible that any such outcome of litigation, penalties, fines or other sanctions could be substantial, and the outcome of these matters may have a material adverse effect on our results of operations, financial position, and cash flows. Certain of these matters could also affect our reputation. In addition, disclosure of any adverse investigation or audit results or sanctions could negatively affect our industry or our reputation in various markets and make it more difficult for us to sell our products and services.
The Patient Protection and Affordable Care Act and The Health Care and Education Reconciliation Act of 2010 could have a material adverse effect on our results of operations (including restricting revenue, enrollment and premium growth in certain products and market segments, restricting our ability to expand into new markets, increasing our medical and operating costs by, among other things, requiring a minimum benefit ratio on insured products, lowering our Medicare payment rates and increasing our expenses associated with a non-deductible health insurance industry fee and other assessments); our financial position (including our ability to maintain the value of our goodwill); and our cash flows.
The Patient Protection and Affordable Care Act and The Health Care and Education Reconciliation Act of 2010 (which we collectively refer to as the Health Care Reform Law) enacted significant reforms to various aspects of the U.S. health insurance industry. The provisions of the Health Care Reform Law include, among others, imposing a significant new non-deductible health insurance industry fee and other assessments on health insurers, limiting Medicare Advantage payment rates, stipulating a prescribed minimum ratio for the amount of premiums revenue to be expended on medical costs for insured products, additional mandated benefits and guarantee issuance associated with commercial medical insurance, requirements that limit the ability of health plans to vary premiums based on assessments of underlying risk, and heightened scrutiny by state and federal regulators of our business practices, including our Medicare bid and pricing practices. The Health Care Reform Law also specifies benefit design guidelines, limits rating and pricing practices, encourages additional competition (including potential incentives for new market entrants), establishes federally-facilitated or state-based exchanges for individuals and small employers (with up to 100 employees) coupled with programs designed to spread risk among insurers (subject to federal administrative action), and expands eligibility for Medicaid programs (subject to state-by-state implementation of this expansion). In addition, the Health Care Reform Law has increased and will continue to increase federal oversight of health plan premium rates and could adversely affect our ability to appropriately adjust health plan premiums on a timely basis. Financing for these reforms will come, in part, from material additional fees and taxes on us and other health plans and individuals which began in 2014, as well as reductions in certain levels of payments to us and other health plans under Medicare. If we fail to effectively implement our operational and strategic initiatives with respect to the implementation of the Health Care Reform Law, our business may be materially adversely affected. Additionally, potential legislative changes, including activities to repeal or replace the Health Care Reform Law, creates uncertainty for our business, and we cannot predict when, or in what form, such legislative changes may occur.
For additional information, please refer to the section entitled, “Health Care Reform” in “Item 7 - Management’s Discussion and Analysis of Financial Condition and Results of Operations” appearing in this annual report.
Our continued participation in the federal and state health insurance exchanges, which entail uncertainties associated with mix, volume of business and the operation of premium stabilization programs, which are subject to federal administrative action, could adversely affect our results of operations, financial position, and cash flows.
The Health Care Reform Law required the establishment of health insurance exchanges for individuals and small employers to purchase health insurance that became effective January 1, 2014, with an annual open enrollment period. Insurers participating on the health insurance exchanges must offer a minimum level of benefits and are subject to guidelines on setting premium rates and coverage limitations. We may be adversely selected by individuals who have a higher acuity level than the anticipated pool of participants in this market. In addition, the risk corridor, reinsurance, and risk adjustment provisions of the Health Care Reform Law, established to apportion risk for insurers, may not be effective in appropriately mitigating the financial risks related to our products. The risk corridor program is a three-
26
year program, and the Department of Health and Human Services (HHS) guidance provides that risk corridor collections over the life of the three year program will first be applied to any shortfalls from previous benefit years before application to current year obligations. On November 10, 2016, the U.S. Court of Federal Claims ruled in favor of the government in one of a series of cases filed by insurers against HHS to collect risk corridor payments, rejecting all of the insurer’s statutory, contract and Constitutional claims for payment. On November 18, 2016, HHS issued a memorandum indicating a significant funding shortfall for the 2015 coverage year, the second consecutive year of significant shortfalls. Given the successful challenge of the risk corridor provisions in court, Congressional inquiries into the funding of the risk corridor program, and significant funding shortfalls under the first two years of the program, during the fourth quarter of 2016 we wrote-off our risk corridor receivables. In addition, other regulatory changes to the implementation of the Health Care Reform Law that allowed individuals to remain in plans that are not compliant with the Health Care Reform Law or to enroll outside of the annual enrollment period may have an adverse effect on our pool of participants in the health insurance exchange.
For 2017, we are offering on-exchange individual commercial medical plans in 11 states, a reduction from the 15 states in which we offered on-exchange coverage in 2016. In addition, we discontinued substantially all Health Care Reform Law compliant off-exchange individual commercial medical plans in 2017. Despite this reduction in our individual commercial membership plans, the above factors, in addition to competitor actions to withdraw from exchanges and/or alter their product offerings, may have a material adverse effect on our results of operations, financial position, or cash flows if our premiums are not adequate or do not appropriately reflect the acuity of these individuals. In addition, audits of our submissions under the risk adjustment program may result in repayment of amounts distributed under the program. Any variation from our expectations regarding acuity, enrollment levels, adverse selection, or other assumptions used in setting premium rates could have a material adverse effect on our results of operations, financial position, and cash flows, and we may be unable to adjust our product offerings, geographic footprint, or pricing during any given year in sufficient time to mitigate any such effects.
Our business activities are subject to substantial government regulation. New laws or regulations, or changes in existing laws or regulations or their manner of application, including reductions in Medicare Advantage payment rates, could increase our cost of doing business and may adversely affect our business, profitability, financial condition, and cash flows.
In addition to the Health Care Reform Law, the health care industry in general and health insurance are subject to substantial federal and state government regulation:
Health Insurance Portability and Accountability Act (HIPAA) and the Health Information Technology for Economic and Clinical Health Act (HITECH Act)
The use of individually identifiable health data by our business is regulated at federal and state levels. These laws and rules are changed frequently by legislation or administrative interpretation. Various state laws address the use and maintenance of individually identifiable health data. Most are derived from the privacy provisions in the federal Gramm-Leach-Bliley Act and the Health Insurance Portability and Accountability Act, or HIPAA. HIPAA includes administrative provisions directed at simplifying electronic data interchange through standardizing transactions, establishing uniform health care provider, payer, and employer identifiers, and seeking protections for confidentiality and security of patient data. The rules do not provide for complete federal preemption of state laws, but rather preempt all inconsistent state laws unless the state law is more stringent.
These regulations set standards for the security of electronic health information. Violations of these rules could subject us to significant criminal and civil penalties, including significant monetary penalties. Compliance with HIPAA regulations requires significant systems enhancements, training and administrative effort. HIPAA can also expose us to additional liability for violations by our business associates (e.g., entities that provide services to health plans and providers).
The HITECH Act, one part of the American Recovery and Reinvestment Act of 2009, significantly broadened the scope of the privacy and security regulations of HIPAA. Among other requirements, the HITECH Act and HIPAA mandate individual notification in the event of a breach of unsecured, individually identifiable health information,
27
provides enhanced penalties for HIPAA violations, requires business associates to comply with certain provisions of the HIPAA privacy and security rule, and grants enforcement authority to state attorneys general in addition to the HHS Office of Civil Rights.
In addition, there are numerous federal and state laws and regulations addressing patient and consumer privacy concerns, including unauthorized access or theft of personal information. State statutes and regulations vary from state to state and could impose additional penalties. Violations of HIPAA or applicable federal or state laws or regulations could subject us to significant criminal or civil penalties, including significant monetary penalties. Compliance with HIPAA and other privacy regulations requires significant systems enhancements, training and administrative effort.
American Recovery and Reinvestment Act of 2009 (ARRA)
On February 17, 2009, the American Recovery and Reinvestment Act of 2009, or ARRA, was enacted into law. In addition to including a temporary subsidy for health care continuation coverage issued pursuant to the Consolidated Omnibus Budget Reconciliation Act, or COBRA, ARRA also expands and strengthens the privacy and security provisions of HIPAA and imposes additional limits on the use and disclosure of protected health information, or PHI. Among other things, ARRA requires us and other covered entities to report any unauthorized release or use of or access to PHI to any impacted individuals and to HHS in those instances where the unauthorized activity poses a significant risk of financial, reputational or other harm to the individuals, and to notify the media in any states where 500 or more people are impacted by any unauthorized release or use of or access to PHI. ARRA also requires business associates to comply with certain HIPAA provisions. ARRA also establishes higher civil and criminal penalties for covered entities and business associates who fail to comply with HIPAA’s provisions and requires HHS to issue regulations implementing its privacy and security enhancements.
Corporate Practice of Medicine and Other Laws
As a corporate entity, Humana Inc. is not licensed to practice medicine. Many states in which we operate through our subsidiaries limit the practice of medicine to licensed individuals or professional organizations comprised of licensed individuals, and business corporations generally may not exercise control over the medical decisions of physicians. Statutes and regulations relating to the practice of medicine, fee-splitting between physicians and referral sources, and similar issues vary widely from state to state. Under management agreements between certain of our subsidiaries and affiliated physician-owned professional groups, these groups retain sole responsibility for all medical decisions, as well as for hiring and managing physicians and other licensed healthcare providers, developing operating policies and procedures, implementing professional standards and controls, and maintaining malpractice insurance. We believe that our health services operations comply with applicable state statutes regarding corporate practice of medicine, fee-splitting, and similar issues. However, any enforcement actions by governmental officials alleging non-compliance with these statutes, which could subject us to penalties or restructuring or reorganization of our business, may result in a material adverse effect on our results of operations, financial position, or cash flows.
Anti-Kickback, Physician Self-Referral, and Other Fraud and Abuse Laws
A federal law commonly referred to as the “Anti-Kickback Statute” prohibits the offer, payment, solicitation, or receipt of any form of remuneration to induce, or in return for, the referral of Medicare or other governmental health program patients or patient care opportunities, or in return for the purchase, lease, or order of items or services that are covered by Medicare or other federal governmental health programs. Because the prohibitions contained in the Anti-Kickback Statute apply to the furnishing of items or services for which payment is made in “whole or in part,” the Anti-Kickback Statute could be implicated if any portion of an item or service we provide is covered by any of the state or federal health benefit programs described above. Violation of these provisions constitutes a felony criminal offense and applicable sanctions could include exclusion from the Medicare and Medicaid programs.
Section 1877 of the Social Security Act, commonly known as the “Stark Law,” prohibits physicians, subject to certain exceptions described below, from referring Medicare or Medicaid patients to an entity providing “designated health services” in which the physician, or an immediate family member, has an ownership or investment interest or with which the physician, or an immediate family member, has entered into a compensation arrangement. These prohibitions, contained in the Omnibus Budget Reconciliation Act of 1993, commonly known as “Stark II,” amended
28
prior federal physician self-referral legislation known as “Stark I” by expanding the list of designated health services to a total of 11 categories of health services. The professional groups with which we are affiliated provide one or more of these designated health services. Persons or entities found to be in violation of the Stark Law are subject to denial of payment for services furnished pursuant to an improper referral, civil monetary penalties, and exclusion from the Medicare and Medicaid programs.
Many states also have enacted laws similar in scope and purpose to the Anti-Kickback Statute and, in more limited instances, the Stark Law, that are not limited to services for which Medicare or Medicaid payment is made. In addition, most states have statutes, regulations, or professional codes that restrict a physician from accepting various kinds of remuneration in exchange for making referrals. These laws vary from state to state and have seldom been interpreted by the courts or regulatory agencies. In states that have enacted these statutes, we believe that regulatory authorities and state courts interpreting these statutes may regard federal law under the Anti-Kickback Statute and the Stark Law as persuasive.
We believe that our operations comply with the Anti-Kickback Statute, the Stark Law, and similar federal or state laws addressing fraud and abuse. These laws are subject to modification and changes in interpretation, and are enforced by authorities vested with broad discretion. We continually monitor developments in this area. If these laws are interpreted in a manner contrary to our interpretation or are reinterpreted or amended, or if new legislation is enacted with respect to healthcare fraud and abuse, illegal remuneration, or similar issues, we may be required to restructure our affected operations to maintain compliance with applicable law. There can be no assurances that any such restructuring will be possible or, if possible, would not have a material adverse effect on our results of operations, financial position, or cash flows.
Environmental
We are subject to various federal, state, and local laws and regulations relating to the protection of human health and the environment. If an environmental regulatory agency finds any of our facilities to be in violation of environmental laws, penalties and fines may be imposed for each day of violation and the affected facility could be forced to cease operations. We could also incur other significant costs, such as cleanup costs or claims by third parties, as a result of violations of, or liabilities under, environmental laws. Although we believe that our environmental practices, including waste handling and disposal practices, are in material compliance with applicable laws, future claims or violations, or changes in environmental laws, could have a material adverse effect on our results of operations, financial position or cash flows.
State Regulation of Insurance-Related Products
Laws in each of the states (and Puerto Rico) in which we operate our HMOs, PPOs and other health insurance-related services regulate our operations including: capital adequacy and other licensing requirements, policy language describing benefits, mandated benefits and processes, entry, withdrawal or re-entry into a state or market, rate increases, delivery systems, utilization review procedures, quality assurance, complaint systems, enrollment requirements, claim payments, marketing, and advertising. The HMO, PPO, and other health insurance-related products we offer are sold under licenses issued by the applicable insurance regulators.
Our licensed insurance subsidiaries are also subject to regulation under state insurance holding company and Puerto Rico regulations. These regulations generally require, among other things, prior approval and/or notice of new products, rates, benefit changes, and certain material transactions, including dividend payments, purchases or sales of assets, intercompany agreements, and the filing of various financial and operational reports.
Any failure by us to manage acquisitions, divestitures and other significant transactions successfully may have a material adverse effect on our results of operations, financial position, and cash flows.
As part of our business strategy, we frequently engage in discussions with third parties regarding possible investments, acquisitions, divestitures, strategic alliances, joint ventures, and outsourcing transactions and often enter into agreements relating to such transactions in order to further our business objectives. In order to pursue our acquisition strategy successfully, we must identify suitable candidates for and successfully complete transactions, some of which
29
may be large and complex, and manage post-closing issues such as the integration of acquired companies or employees. Integration and other risks can be more pronounced for larger and more complicated transactions, transactions outside of our core business space, or if multiple transactions are pursued simultaneously. The failure to successfully integrate acquired entities and businesses or failure to produce results consistent with the financial model used in the analysis of our acquisitions may have a material adverse effect on our results of operations, financial position, and cash flows. If we fail to identify and complete successfully transactions that further our strategic objectives, we may be required to expend resources to develop products and technology internally. In addition, from time to time, we evaluate alternatives for our businesses that do not meet our strategic, growth or profitability objectives. The divestiture of certain businesses could result, individually or in the aggregate, in the recognition of material losses and a material adverse effect on our results of operations. There can be no assurance that we will be able to complete any such divestitures on terms favorable to us.
If we fail to develop and maintain satisfactory relationships with the providers of care to our members, our business may be adversely affected.
We employ or contract with physicians, hospitals and other providers to deliver health care to our members. Our products encourage or require our customers to use these contracted providers. A key component of our integrated care delivery strategy is to increase the number of providers who share medical cost risk with us or have financial incentives to deliver quality medical services in a cost-effective manner.
In any particular market, providers could refuse to contract with us, demand higher payments, or take other actions that could result in higher health care costs for us, less desirable products for customers and members or difficulty meeting regulatory or accreditation requirements. In some markets, some providers, particularly hospitals, physician specialty groups, physician/hospital organizations, or multi-specialty physician groups, may have significant market positions and negotiating power. In addition, physician or practice management companies, which aggregate physician practices for administrative efficiency and marketing leverage, may compete directly with us. If these providers refuse to contract with us, use their market position to negotiate unfavorable contracts with us or place us at a competitive disadvantage, or do not enter into contracts with us that encourage the delivery of quality medical services in a cost-effective manner, our ability to market products or to be profitable in those areas may be adversely affected.
In some situations, we have contracts with individual or groups of primary care providers for an actuarially determined, fixed fee per month to provide a basket of required medical services to our members. This type of contract is referred to as a “capitation” contract. The inability of providers to properly manage costs under these capitation arrangements can result in the financial instability of these providers and the termination of their relationship with us. In addition, payment or other disputes between a primary care provider and specialists with whom the primary care provider contracts can result in a disruption in the provision of services to our members or a reduction in the services available to our members. The financial instability or failure of a primary care provider to pay other providers for services rendered could lead those other providers to demand payment from us even though we have made our regular fixed payments to the primary provider. There can be no assurance that providers with whom we contract will properly manage the costs of services, maintain financial solvency or avoid disputes with other providers. Any of these events may have a material adverse effect on the provision of services to our members and our results of operations, financial position, and cash flows.
Our pharmacy business is highly competitive and subjects us to regulations in addition to those we face with our core health benefits businesses.
Our pharmacy mail order business competes with locally owned drugstores, retail drugstore chains, supermarkets, discount retailers, membership clubs, internet companies and other mail-order and long-term care pharmacies. Our pharmacy business also subjects us to extensive federal, state, and local regulation. The practice of pharmacy is generally regulated at the state level by state boards of pharmacy. Many of the states where we deliver pharmaceuticals, including controlled substances, have laws and regulations that require out-of-state mail-order pharmacies to register with that state’s board of pharmacy. Federal agencies further regulate our pharmacy operations, requiring registration with the U.S. Drug Enforcement Administration and individual state controlled substance authorities in order to dispense controlled substances. In addition, the FDA inspects facilities in connection with procedures to effect recalls of
30
prescription drugs. The Federal Trade Commission also has requirements for mail-order sellers of goods. The U.S. Postal Service, or USPS, has statutory authority to restrict the transmission of drugs and medicines through the mail to a degree that may have an adverse effect on our mail-order operations. The USPS historically has exercised this statutory authority only with respect to controlled substances. If the USPS restricts our ability to deliver drugs through the mail, alternative means of delivery are available to us. However, alternative means of delivery could be significantly more expensive. The U.S. Department of Transportation has regulatory authority to impose restrictions on drugs inserted in the stream of commerce. These regulations generally do not apply to the USPS and its operations. In addition, we are subject to CMS rules regarding the administration of our PDP plans and intercompany pricing between our PDP plans and our pharmacy business.
We are also subject to risks inherent in the packaging and distribution of pharmaceuticals and other health care products, and the application of state laws related to the operation of internet and mail-order pharmacies. The failure to adhere to these laws and regulations may expose us to civil and criminal penalties.
Changes in the prescription drug industry pricing benchmarks may adversely affect our financial performance.
Contracts in the prescription drug industry generally use certain published benchmarks to establish pricing for prescription drugs. These benchmarks include average wholesale price, which is referred to as “AWP,” average selling price, which is referred to as “ASP,” and wholesale acquisition cost. It is uncertain whether payors, pharmacy providers, pharmacy benefit managers, or PBMs, and others in the prescription drug industry will continue to utilize AWP as it has previously been calculated, or whether other pricing benchmarks will be adopted for establishing prices within the industry. Legislation may lead to changes in the pricing for Medicare and Medicaid programs. Regulators have conducted investigations into the use of AWP for federal program payment, and whether the use of AWP has inflated drug expenditures by the Medicare and Medicaid programs. Federal and state proposals have sought to change the basis for calculating payment of certain drugs by the Medicare and Medicaid programs. Adoption of ASP in lieu of AWP as the measure for determining payment by Medicare or Medicaid programs for the drugs sold in our mail-order pharmacy business may reduce the revenues and gross margins of this business which may result in a material adverse effect on our results of operations, financial position, and cash flows.
If we do not continue to earn and retain purchase discounts and volume rebates from pharmaceutical manufacturers at current levels, our gross margins may decline.
We have contractual relationships with pharmaceutical manufacturers or wholesalers that provide us with purchase discounts and volume rebates on certain prescription drugs dispensed through our mail-order and specialty pharmacies. These discounts and volume rebates are generally passed on to clients in the form of steeper price discounts. Changes in existing federal or state laws or regulations or in their interpretation by courts and agencies or the adoption of new laws or regulations relating to patent term extensions, and purchase discount and volume rebate arrangements with pharmaceutical manufacturers, may reduce the discounts or volume rebates we receive and materially adversely impact our results of operations, financial position, and cash flows.
Our ability to obtain funds from certain of our licensed subsidiaries is restricted by state insurance regulations.
Because we operate as a holding company, we are dependent upon dividends and administrative expense reimbursements from our subsidiaries to fund the obligations of Humana Inc., our parent company. Certain of our insurance subsidiaries operate in states that regulate the payment of dividends, loans, administrative expense reimbursements or other cash transfers to Humana Inc., and require minimum levels of equity as well as limit investments to approved securities. The amount of dividends that may be paid to Humana Inc. by these insurance subsidiaries, without prior approval by state regulatory authorities, or ordinary dividends, is limited based on the entity's level of statutory income and statutory capital and surplus. In most states, prior notification is provided before paying a dividend even if approval is not required. Actual dividends paid may vary due to consideration of excess statutory capital and surplus and expected future surplus requirements related to, for example, premium volume and product mix. Dividends from our non-insurance companies such as in our Healthcare Services segment are generally not restricted by Departments of Insurance. In the event that we are unable to provide sufficient capital to fund the obligations of Humana Inc., our results of operations, financial position, and cash flows may be materially adversely affected.
31
Downgrades in our debt ratings, should they occur, may adversely affect our business, results of operations, and financial condition.
Claims paying ability, financial strength, and debt ratings by recognized rating organizations are an increasingly important factor in establishing the competitive position of insurance companies. Ratings information is broadly disseminated and generally used throughout the industry. We believe our claims paying ability and financial strength ratings are an important factor in marketing our products to certain of our customers. In addition, our debt ratings impact both the cost and availability of future borrowings. Each of the rating agencies reviews its ratings periodically and there can be no assurance that current ratings will be maintained in the future. Our ratings reflect each rating agency’s opinion of our financial strength, operating performance, and ability to meet our debt obligations or obligations to policyholders, but are not evaluations directed toward the protection of investors in our common stock and should not be relied upon as such.
Historically, rating agencies take action to lower ratings due to, among other things, perceived concerns about liquidity or solvency, the competitive environment in the insurance industry, the inherent uncertainty in determining reserves for future claims, the outcome of pending litigation and regulatory investigations, and possible changes in the methodology or criteria applied by the rating agencies. In addition, rating agencies have come under regulatory and public scrutiny over the ratings assigned to various fixed-income products. As a result, rating agencies may (i) become more conservative in their methodology and criteria, (ii) increase the frequency or scope of their credit reviews, (iii) request additional information from the companies that they rate, or (iv) adjust upward the capital and other requirements employed in the rating agency models for maintenance of certain ratings levels.
We believe that some of our customers place importance on our credit ratings, and we may lose customers and compete less successfully if our ratings were to be downgraded. In addition, our credit ratings affect our ability to obtain investment capital on favorable terms. If our credit ratings were to be lowered, our cost of borrowing likely would increase, our sales and earnings could decrease, and our results of operations, financial position, and cash flows may be materially adversely affected.
The securities and credit markets may experience volatility and disruption, which may adversely affect our business.
Volatility or disruption in the securities and credit markets could impact our investment portfolio. We evaluate our investment securities for impairment on a quarterly basis. This review is subjective and requires a high degree of judgment. For the purpose of determining gross realized gains and losses, the cost of investment securities sold is based upon specific identification. For debt securities held, we recognize an impairment loss in income when the fair value of the debt security is less than the carrying value and we have the intent to sell the debt security or it is more likely than not that we will be required to sell the debt security before recovery of our amortized cost basis, or if a credit loss has occurred. When we do not intend to sell a security in an unrealized loss position, potential other-than-temporary impairments are considered using variety of factors, including the length of time and extent to which the fair value has been less than cost; adverse conditions specifically related to the industry, geographic area or financial condition of the issuer or underlying collateral of a security; payment structure of the security; changes in credit rating of the security by the rating agencies; the volatility of the fair value changes; and changes in fair value of the security after the balance sheet date. For debt securities, we take into account expectations of relevant market and economic data. We continuously review our investment portfolios and there is a continuing risk that declines in fair value may occur and additional material realized losses from sales or other-than-temporary impairments may be recorded in future periods.
We believe our cash balances, investment securities, operating cash flows, and funds available under our credit agreement or from other public or private financing sources, taken together, provide adequate resources to fund ongoing operating and regulatory requirements, acquisitions, future expansion opportunities, and capital expenditures for at least the next twelve months, as well as to refinance or repay debt, and repurchase shares. However, continuing adverse securities and credit market conditions may significantly affect the availability of credit. While there is no assurance in the current economic environment, we have no reason to believe the lenders participating in our credit agreement will not be willing and able to provide financing in accordance with the terms of the agreement.
32
Our access to additional credit will depend on a variety of factors such as market conditions, the general availability of credit, both to the overall market and our industry, our credit ratings and debt capacity, as well as the possibility that customers or lenders could develop a negative perception of our long or short-term financial prospects. Similarly, our access to funds could be limited if regulatory authorities or rating agencies were to take negative actions against us. If a combination of these factors were to occur, we may not be able to successfully obtain additional financing on favorable terms or at all.
None.
The following table lists, by state, the number of medical centers and administrative offices we owned or leased at December 31,
2016
:
|
|
Medical
Centers |
Administrative
Offices |
|
|||||||||||
|
|
Owned
|
Leased
|
Owned
|
Leased
|
Total
|
|||||||||
|
Florida
|
11
|
|
129
|
|
—
|
|
87
|
|
227
|
|
||||
|
Texas
|
—
|
|
16
|
|
2
|
|
17
|
|
35
|
|
||||
|
Kentucky
|
2
|
|
1
|
|
11
|
|
12
|
|
26
|
|
||||
|
Arizona
|
—
|
|
10
|
|
—
|
|
6
|
|
16
|
|
||||
|
Virginia
|
—
|
|
8
|
|
—
|
|
8
|
|
16
|
|
||||
|
California
|
—
|
|
2
|
|
—
|
|
13
|
|
15
|
|
||||
|
South Carolina
|
—
|
|
6
|
|
4
|
|
5
|
|
15
|
|
||||
|
Illinois
|
—
|
|
5
|
|
—
|
|
9
|
|
14
|
|
||||
|
Louisiana
|
—
|
|
4
|
|
—
|
|
10
|
|
14
|
|
||||
|
New York
|
—
|
|
—
|
|
—
|
|
13
|
|
13
|
|
||||
|
Ohio
|
—
|
|
1
|
|
—
|
|
11
|
|
12
|
|
||||
|
Indiana
|
—
|
|
4
|
|
—
|
|
7
|
|
11
|
|
||||
|
Nevada
|
—
|
|
6
|
|
—
|
|
5
|
|
11
|
|
||||
|
Tennessee
|
—
|
|
—
|
|
—
|
|
11
|
|
11
|
|
||||
|
Colorado
|
—
|
|
5
|
|
—
|
|
4
|
|
9
|
|
||||
|
Georgia
|
—
|
|
5
|
|
—
|
|
3
|
|
8
|
|
||||
|
New Jersey
|
—
|
|
—
|
|
—
|
|
8
|
|
8
|
|
||||
|
Washington
|
—
|
|
4
|
|
—
|
|
4
|
|
8
|
|
||||
|
Puerto Rico
|
—
|
|
—
|
|
—
|
|
7
|
|
7
|
|
||||
|
Michigan
|
—
|
|
2
|
|
—
|
|
4
|
|
6
|
|
||||
|
North Carolina
|
—
|
|
—
|
|
—
|
|
6
|
|
6
|
|
||||
|
Others
|
—
|
|
—
|
|
1
|
|
46
|
|
47
|
|
||||
|
Total
|
13
|
|
208
|
|
18
|
|
296
|
|
535
|
|
||||
The medical centers we operate are primarily located in Florida and Texas, including full-service, multi-specialty medical centers staffed by primary care providers and medical specialists. Of the medical centers included in the table above, approximately
67
of these facilities are leased or subleased to our contracted providers to operate.
Our principal executive office is located in the Humana Building, 500 West Main Street, Louisville, Kentucky 40202. In addition to the headquarters in Louisville, Kentucky, we maintain other principal operating facilities used
33
for customer service, enrollment, and/or claims processing and certain other corporate functions in Louisville, Kentucky; Green Bay, Wisconsin; Tampa, Florida; Cincinnati, Ohio; San Antonio, Texas; and San Juan, Puerto Rico.
We are party to a variety of legal actions in the ordinary course of business, certain of which may be styled as class-action lawsuits. Among other matters, this litigation may include employment matters, claims of medical malpractice, bad faith, nonacceptance or termination of providers, anticompetitive practices, improper rate setting, provider contract rate disputes, failure to disclose network discounts and various other provider arrangements, general contractual matters, intellectual property matters, and challenges to subrogation practices. For a discussion of our material legal actions, including those not in the ordinary course of business, see “Legal Proceedings and Certain Regulatory Matters” in Note 16 to the consolidated financial statements included in Item 8. – Financial Statements and Supplementary Data. We cannot predict the outcome of these suits with certainty.
Not applicable.
34
Market Information
Our common stock trades on the New York Stock Exchange under the symbol HUM. The following table shows the range of high and low closing sales prices as reported on the New York Stock Exchange Composite Price for each quarter in the years ended December 31,
2016
and
2015
:
|
High
|
Low
|
||||||
|
Year Ended December 31, 2016
|
|||||||
|
First quarter
|
$
|
186.91
|
|
$
|
156.96
|
|
|
|
Second quarter
|
$
|
190.07
|
|
$
|
165.23
|
|
|
|
Third quarter
|
$
|
180.86
|
|
$
|
153.38
|
|
|
|
Fourth quarter
|
$
|
216.76
|
|
$
|
165.31
|
|
|
|
Year Ended December 31, 2015
|
|||||||
|
First quarter
|
$
|
182.79
|
|
$
|
139.09
|
|
|
|
Second quarter
|
$
|
214.92
|
|
$
|
163.07
|
|
|
|
Third quarter
|
$
|
193.14
|
|
$
|
174.16
|
|
|
|
Fourth quarter
|
$
|
186.67
|
|
$
|
164.25
|
|
|
Holders of our Capital Stock
As of January 31,
2017
, there were approximately
2,700
holders of record of our common stock and approximately
92,300
beneficial holders of our common stock.
Dividends
The following table provides details of dividend payments, excluding dividend equivalent rights, in
2015
and
2016
, under our Board approved quarterly cash dividend policy:
|
Record
Date
|
Payment
Date
|
Amount
per Share
|
Total
Amount
|
|||
|
|
|
|
(in millions)
|
|||
|
2015 payments
|
||||||
|
12/31/2014
|
1/30/2015
|
$0.28
|
$42
|
|||
|
3/31/2015
|
4/24/2015
|
$0.28
|
$42
|
|||
|
6/30/2015
|
7/31/2015
|
$0.29
|
$43
|
|||
|
9/30/2015
|
10/30/2015
|
$0.29
|
$43
|
|||
|
2016 payments
|
||||||
|
12/30/2015
|
1/29/2016
|
$0.29
|
$43
|
|||
|
3/31/2016
|
4/29/2016
|
$0.29
|
$43
|
|||
|
6/30/2016
|
7/29/2016
|
$0.29
|
$43
|
|||
|
10/13/2016
|
10/28/2016
|
$0.29
|
$43
|
|||
Under the terms of the Merger Agreement, we agreed with Aetna that our quarterly dividend would not exceed $0.29 per share prior to the closing or termination of the Merger.
On
October 26, 2016
, the Board declared a cash dividend of
$0.29
per share that was paid on
January 27, 2017
to stockholders of record on
January 12, 2017
, for an aggregate amount of
$43 million
.
35
On February 14, 2017, following the termination of the Merger Agreement, the Board declared a cash dividend of
$0.40
per share, to be paid on April 28, 2017, to the stockholders of record on March 31, 2017
.
Declaration and payment of future quarterly dividends is at the discretion of our Board and may be adjusted as business needs or market conditions change.
Stock Total Return Performance
The following graph compares our total return to stockholders with the returns of the Standard & Poor’s Composite 500 Index (“S&P 500”) and the Dow Jones US Select Health Care Providers Index (“Peer Group”) for the five years ended December 31,
2016
. The graph assumes an investment of $100 in each of our common stock, the S&P 500, and the Peer Group on December 31, 2011, and that dividends were reinvested when paid.
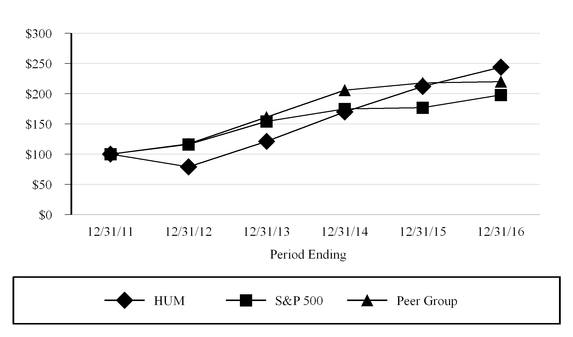
|
12/31/2011
|
12/31/2012
|
12/31/2013
|
12/31/2014
|
12/31/2015
|
12/31/2016
|
||||||||||||||||||
|
HUM
|
$
|
100
|
|
$
|
79
|
|
$
|
121
|
|
$
|
170
|
|
$
|
212
|
|
$
|
244
|
|
|||||
|
S&P 500
|
$
|
100
|
|
$
|
116
|
|
$
|
154
|
|
$
|
175
|
|
$
|
177
|
|
$
|
198
|
|
|||||
|
Peer Group
|
$
|
100
|
|
$
|
117
|
|
$
|
161
|
|
$
|
206
|
|
$
|
218
|
|
$
|
220
|
|
|||||
The stock price performance included in this graph is not necessarily indicative of future stock price performance.
36
Issuer Purchases of Equity Securities
The following table indicates that we made no purchases during the three months ended December 31,
2016
of equity securities that are registered by us pursuant to Section 12 of the Exchange Act:
|
Period
|
Total Number
of Shares Purchased (1)(2) |
Average
Price Paid per Share |
Total Number of
Shares Purchased as Part of Publicly Announced Plans or Programs (1)(2) |
Dollar Value of
Shares that May Yet Be Purchased Under the Plans or Programs (1) |
|||||||||
|
October 2016
|
—
|
|
$
|
—
|
|
—
|
|
$
|
—
|
|
|||
|
November 2016
|
—
|
|
—
|
|
—
|
|
—
|
|
|||||
|
December 2016
|
—
|
|
—
|
|
—
|
|
—
|
|
|||||
|
Total
|
—
|
|
$
|
—
|
|
—
|
|
||||||
|
(1)
|
In
September 2014
, the Board of Directors replaced a previous share repurchase authorization of up to
$1 billion
with an authorization for repurchases of up to
$2 billion
of our common shares exclusive of shares repurchased in connection with employee stock plans, which expired on
December 31, 2016
.
Pursuant to the Merger Agreement, after July 2, 2015, we were prohibited from repurchasing any of our outstanding securities without the prior written consent of Aetna, other than repurchases of shares of our common stock in connection with the exercise of outstanding stock options or the vesting or settlement of outstanding restricted stock awards. Accordingly, as announced on July 3, 2015, we suspended our share repurchase program.
|
|
(2)
|
Excludes
0.6 million
shares repurchased in connection with employee stock plans.
|
The Merger Agreement included customary restrictions on the conduct of our business prior to the completion of the Merger, generally requiring us to conduct our business in the ordinary course and subjecting us to a variety of customary specified limitations absent Aetna’s prior written consent, including, for example, limitations on dividends (we agreed that our quarterly dividend would not exceed $0.29 per share) and repurchases of our securities (we agreed to suspend our share repurchase program).
On February 14, 2017, we and Aetna agreed to mutually terminate the Merger Agreement. We also announced that the Board had approved a new authorization for share repurchases of up to
$2.25 billion
of our common stock exclusive of shares repurchased in connection with employee stock plans, expiring on December 31, 2017.
Under this new authorization, we expect to complete a $1.5 billion accelerated share repurchase program in the first quarter of 2017.
37
|
2016 (a)
|
2015 (b)(c)
|
2014 (b)(d)
|
2013 (b)(e)
|
2012 (b)(f)
|
|||||||||||||||
|
|
(dollars in millions, except per common share results)
|
||||||||||||||||||
|
Summary of Operating Results:
|
|||||||||||||||||||
|
Revenues:
|
|||||||||||||||||||
|
Premiums
|
$
|
53,021
|
|
$
|
52,409
|
|
$
|
45,959
|
|
$
|
38,829
|
|
$
|
37,009
|
|
||||
|
Services
|
969
|
|
1,406
|
|
2,164
|
|
2,109
|
|
1,726
|
|
|||||||||
|
Investment income
|
389
|
|
474
|
|
377
|
|
375
|
|
391
|
|
|||||||||
|
Total revenues
|
54,379
|
|
54,289
|
|
48,500
|
|
41,313
|
|
39,126
|
|
|||||||||
|
Operating expenses:
|
|||||||||||||||||||
|
Benefits
|
45,007
|
|
44,269
|
|
38,166
|
|
32,564
|
|
30,985
|
|
|||||||||
|
Operating costs
|
7,277
|
|
7,318
|
|
7,639
|
|
6,355
|
|
5,830
|
|
|||||||||
|
Depreciation and amortization
|
354
|
|
355
|
|
333
|
|
333
|
|
295
|
|
|||||||||
|
Total operating expenses
|
52,638
|
|
51,942
|
|
46,138
|
|
39,252
|
|
37,110
|
|
|||||||||
|
Income from operations
|
1,741
|
|
2,347
|
|
2,362
|
|
2,061
|
|
2,016
|
|
|||||||||
|
Gain on sale of business
|
—
|
|
270
|
|
—
|
|
—
|
|
—
|
|
|||||||||
|
Interest expense
|
189
|
|
186
|
|
192
|
|
140
|
|
105
|
|
|||||||||
|
Income before income taxes
|
1,552
|
|
2,431
|
|
2,170
|
|
1,921
|
|
1,911
|
|
|||||||||
|
Provision for income taxes
|
938
|
|
1,155
|
|
1,023
|
|
690
|
|
689
|
|
|||||||||
|
Net income
|
$
|
614
|
|
$
|
1,276
|
|
$
|
1,147
|
|
$
|
1,231
|
|
$
|
1,222
|
|
||||
|
Basic earnings per common share
|
$
|
4.11
|
|
$
|
8.54
|
|
$
|
7.44
|
|
$
|
7.81
|
|
$
|
7.56
|
|
||||
|
Diluted earnings per common share
|
$
|
4.07
|
|
$
|
8.44
|
|
$
|
7.36
|
|
$
|
7.73
|
|
$
|
7.47
|
|
||||
|
Dividends declared per
common share |
$
|
1.16
|
|
$
|
1.15
|
|
$
|
1.11
|
|
$
|
1.07
|
|
$
|
1.03
|
|
||||
|
Financial Position:
|
|||||||||||||||||||
|
Cash and investments
|
$
|
13,675
|
|
$
|
11,681
|
|
$
|
11,482
|
|
$
|
10,938
|
|
$
|
11,153
|
|
||||
|
Total assets
|
25,396
|
|
24,678
|
|
23,497
|
|
20,719
|
|
19,962
|
|
|||||||||
|
Benefits payable
|
4,563
|
|
4,976
|
|
4,475
|
|
3,893
|
|
3,779
|
|
|||||||||
|
Debt
|
4,092
|
|
4,093
|
|
3,795
|
|
2,584
|
|
2,594
|
|
|||||||||
|
Stockholders’ equity
|
10,685
|
|
10,346
|
|
9,646
|
|
9,316
|
|
8,847
|
|
|||||||||
|
Cash flows from operations
|
$
|
1,936
|
|
$
|
868
|
|
$
|
1,618
|
|
$
|
1,716
|
|
$
|
1,923
|
|
||||
|
Key Financial Indicators:
|
|||||||||||||||||||
|
Benefit ratio
|
84.9
|
%
|
84.5
|
%
|
83.0
|
%
|
83.9
|
%
|
83.7
|
%
|
|||||||||
|
Operating cost ratio
|
13.5
|
%
|
13.6
|
%
|
15.9
|
%
|
15.5
|
%
|
15.1
|
%
|
|||||||||
|
Membership by Segment:
|
|||||||||||||||||||
|
Retail segment:
|
|||||||||||||||||||
|
Medical membership
|
9,406,100
|
|
9,226,800
|
|
8,376,500
|
|
6,459,300
|
|
5,956,700
|
|
|||||||||
|
Specialty membership
|
1,088,100
|
|
1,153,100
|
|
1,165,800
|
|
1,042,500
|
|
948,700
|
|
|||||||||
|
Group segment:
|
|||||||||||||||||||
|
Medical membership
|
4,793,300
|
|
4,963,400
|
|
5,430,200
|
|
5,501,600
|
|
5,573,400
|
|
|||||||||
|
Specialty membership
|
5,873,100
|
|
6,068,700
|
|
6,502,700
|
|
6,780,800
|
|
7,136,200
|
|
|||||||||
|
Other Businesses:
|
|||||||||||||||||||
|
Medical membership
|
30,800
|
|
32,600
|
|
35,000
|
|
23,400
|
|
558,700
|
|
|||||||||
|
Consolidated:
|
|||||||||||||||||||
|
Total medical membership
|
14,230,200
|
|
14,222,800
|
|
13,841,700
|
|
11,984,300
|
|
12,088,800
|
|
|||||||||
|
Total specialty membership
|
6,961,200
|
|
7,221,800
|
|
7,668,500
|
|
7,823,300
|
|
8,084,900
|
|
|||||||||
|
(a)
|
Includes a reduction in premiums revenue of
$583 million
(
$367 million
after tax, or
$2.43
per diluted common share) associated with the write-off of commercial risk corridor receivables. Also includes benefits expense of
$505 million
(
$318 million
after tax, or
$2.11
per diluted common share) for reserve strengthening associated with our non-strategic closed block of long-term care insurance policies. In addition, we recorded transaction and integration planning costs in connection with the Merger of approximately
$104 million
, or
$0.64
per diluted common share.
|
|
(b)
|
Debt for prior periods has been recast to conform to the 2016 presentation which presents debt issuance cost as a direct reduction of the related liability instead of an asset.
|
|
(c)
|
Includes a gain on the sale of Concentra Inc., net of transaction costs, of
$270 million
(
$238 million
after tax, or
$1.57
per diluted common share). Also includes benefits expense of
$176 million
(
$112 million
after tax, or
$0.74
per diluted common share) for a provision for probable
|
38
future losses (premium deficiency) for individual commercial medical business compliant with the Health Care Reform Law for the 2016 coverage year.
|
(d)
|
Includes loss on extinguishment of debt of
$37 million
(
$23 million
after tax, or
$0.15
per diluted common share) for the redemption of senior notes.
|
|
(e)
|
Includes benefits expense of $243 million ($154 million after tax, or $0.99 per diluted common share) for reserve strengthening associated with our non-strategic closed block of long-term care insurance policies.
|
|
(f)
|
Includes the acquired operations of Arcadian Management Services, Inc. from March 31, 2012, SeniorBridge Family Companies, Inc. from July 6, 2012, and Metropolitan Health Networks, Inc. from December 21, 2012.
|
39
Executive Overview
General
Humana Inc., headquartered in Louisville, Kentucky, is a leading health and well-being company focused on making it easy for people to achieve their best health with clinical excellence through coordinated care. Our strategy integrates care delivery, the member experience, and clinical and consumer insights to encourage engagement, behavior change, proactive clinical outreach and wellness for the millions of people we serve across the country.
Our industry relies on two key statistics to measure performance. The benefit ratio, which is computed by taking total benefits expense as a percentage of premiums revenue, represents a statistic used to measure underwriting profitability. The operating cost ratio, which is computed by taking total operating costs, excluding depreciation and amortization, as a percentage of total revenue less investment income, represents a statistic used to measure administrative spending efficiency.
Aetna Merger
On July 2, 2015, we entered into an Agreement and Plan of Merger, which we refer to in this report as the Merger Agreement, with Aetna Inc. and certain wholly owned subsidiaries of Aetna Inc., which we refer to collectively as Aetna, which sets forth the terms and conditions under which we agreed to merge with, and become a wholly owned subsidiary of Aetna, a transaction we refer to in this report as the Merger.
The Merger was subject to customary closing conditions, including, among other things, (i) the expiration or termination of the applicable waiting period under the Hart-Scott-Rodino Antitrust Improvements Act of 1976, as amended, and the receipt of necessary approvals under state insurance and healthcare laws and regulations and pursuant to certain licenses of certain of Humana’s subsidiaries, and (ii) the absence of legal restraints and prohibitions on the consummation of the Merger.
On December 22, 2016, in order to extend the “End Date” (as defined in the Merger Agreement), Aetna and Humana each agreed to waive until 11:59 p.m. (Eastern time) on February 15, 2017 its right to terminate the Merger Agreement due to a failure of the Mergers to have been completed on or before December 31, 2016.
On July 21, 2016, the U.S. Department of Justice and the attorneys general of certain U.S. jurisdictions filed a civil antitrust complaint in the U.S. District Court for the District of Columbia against us and Aetna, alleging that the Merger would violate Section 7 of the Clayton Antitrust Act and seeking a permanent injunction to prevent the Merger from being completed. On January 23, 2017, the Court ruled in favor of the DOJ and granted a permanent injunction of the proposed transaction.
On February 14, 2017, we and Aetna agreed to mutually terminate the Merger Agreement, as our Board determined that an appeal of the Court's ruling would not be in the best interest of our stockholders.
Under terms of the Merger Agreement, we are entitled to a breakup fee of
$1 billion
.
Business Segments
We manage our business with
three
reportable segments: Retail, Group, and Healthcare Services. In addition, the Other Businesses category includes businesses that are not individually reportable because they do not meet the quantitative thresholds required by generally accepted accounting principles. These segments are based on a combination of the type of health plan customer and adjacent businesses centered on well-being solutions for our health plans and other customers, as described below. These segment groupings are consistent with information used by our Chief Executive Officer to assess performance and allocate resources.
The Retail segment consists of Medicare benefits, marketed to individuals or directly via group accounts, as well as individual commercial fully-insured medical and specialty health insurance benefits, including dental, vision, and other supplemental health and financial protection products. In addition, the Retail segment also includes our contract
40
with CMS to administer the LI-NET prescription drug plan program and contracts with various states to provide Medicaid, dual eligible, and Long-Term Support Services benefits, collectively our state-based contracts. The Group segment consists of employer group commercial fully-insured medical and specialty health insurance benefits, including dental, vision, and other supplemental health and voluntary insurance benefits, as well as administrative services only, or ASO products. In addition, our Group segment includes our health and wellness products (primarily marketed to employer groups) and military services business, primarily our TRICARE South Region contract. The Healthcare Services segment includes services offered to our health plan members as well as to third parties, including pharmacy solutions, provider services, home based services, and clinical programs, as well as services and capabilities to advance population health. We will continue to report under the category of Other Businesses those businesses which do not align with the reportable segments described above, primarily our closed-block long-term care insurance policies.
The results of each segment are measured by income before income taxes.
Transactions between reportable segments primarily consist of sales of services rendered by our Healthcare Services segment, primarily pharmacy, provider, and home based services as well as clinical programs, to our Retail and Group customers
.
Intersegment sales and expenses are recorded at fair value and eliminated in consolidation. Members served by our segments often use the same provider networks, enabling us in some instances to obtain more favorable contract terms with providers. Our segments also share indirect costs and assets. As a result, the profitability of each segment is interdependent. We allocate most operating expenses to our segments. Assets and certain corporate income and expenses are not allocated to the segments, including the portion of investment income not supporting segment operations, interest expense on corporate debt, and certain other corporate expenses. These items are managed at a corporate level. These corporate amounts are reported separately from our reportable segments and are included with intersegment eliminations
.
Seasonality
One of the product offerings of our Retail segment is Medicare stand-alone prescription drug plans, or PDPs, under the Medicare Part D program. Our quarterly Retail segment earnings and operating cash flows are impacted by the Medicare Part D benefit design and changes in the composition of our membership. The Medicare Part D benefit design results in coverage that varies as a member’s cumulative out-of-pocket costs pass through successive stages of a member’s plan period, which begins annually on January 1 for renewals. These plan designs generally result in us sharing a greater portion of the responsibility for total prescription drug costs in the early stages and less in the latter stages. As a result, the PDP benefit ratio generally decreases as the year progresses. In addition, the number of low-income senior members as well as year-over-year changes in the mix of membership in our stand-alone PDP products affects the quarterly benefit ratio pattern.
Our Group segment also experiences seasonality in the benefit ratio pattern. However, the effect is opposite of Medicare stand-alone PDP in the Retail segment, with the Group segment’s benefit ratio increasing as fully-insured members progress through their annual deductible and maximum out-of-pocket expenses. Similarly, certain of our fully-insured individual commercial medical products in our Retail segment experience seasonality in the benefit ratio akin to the Group segment, including the effect of existing previously underwritten members transitioning to policies compliant with the Health Care Reform Law with us and other carriers. As previously underwritten members transition, it results in policy lapses and the release of reserves for future policy benefits partially offset by the recognition of previously deferred acquisition costs. These policy lapses generally occur during the first quarter of the new coverage year following the open enrollment period reducing the benefit ratio in the first quarter. The recognition of a premium deficiency reserve for our individual commercial medical business compliant with the Health Care Reform Law in the fourth quarter of 2015, and subsequent changes in estimates, also impact the quarterly benefit ratio pattern for this business in 2016 and 2015.
In addition, the Retail segment also experiences seasonality in the operating cost ratio as a result of costs incurred in the second half of the year associated with the Medicare and individual health care exchange marketing seasons.
41
Highlights
Consolidated
|
•
|
On February 14, 2017, we and Aetna agreed to mutually terminate the Merger Agreement. We also announced that the Board had approved a new authorization for share repurchases of up to
$2.25 billion
of our common stock exclusive of shares repurchased in connection with employee stock plans, expiring on December 31, 2017.
Under this new authorization, we expect to complete a $1.5 billion accelerated share repurchase program in the first quarter of 2017.
Under terms of the Merger Agreement, we are entitled to a breakup fee of
$1 billion
.
|
|
•
|
Our
2016
results reflect the continued implementation of our strategy to offer our members affordable health care combined with a positive consumer experience in growing markets. At the core of this strategy is our integrated care delivery model, which unites quality care, high member engagement, and sophisticated data analytics. Our approach to primary, physician-directed care for our members aims to provide quality care that is consistent, integrated, cost-effective, and member-focused, provided by both employed physicians and physicians with network contract arrangements. The model is designed to improve health outcomes and affordability for individuals and for the health system as a whole, while offering our members a simple, seamless healthcare experience. We believe this strategy is positioning us for long-term growth in both membership and earnings. We offer providers a continuum of opportunities to increase the integration of care and offer assistance to providers in transitioning from a fee-for-service to a value-based arrangement. These include performance bonuses, shared savings and shared risk relationships. At December 31,
2016
, approximately
1,816,300
members, or
64.0%
, of our individual Medicare Advantage members were in value-based relationships under our integrated care delivery model, as compared to
1,633,100
members, or
59.3%
, at December 31,
2015
.
|
|
•
|
On November 10, 2016, the U.S. Court of Federal Claims ruled in favor of the government in one of a series of cases filed by insurers, unrelated to us, against HHS to collect risk corridor payments, rejecting all of the insurer’s statutory, contract and Constitutional claims for payment. On November 18, 2016, HHS issued a memorandum indicating a significant funding shortfall for the 2015 coverage year, the second consecutive year of significant shortfalls. Given the successful challenge of the risk corridor provisions in court, Congressional inquiries into the funding of the risk corridor program, and significant funding shortfalls under the first two years of the program, during the fourth quarter of 2016 we wrote-off
$583 million
(
$367 million
after-tax, or
$2.43
per diluted common share)
in risk corridor receivables outstanding as of September 30, 2016, including
$415 million
associated with the 2014 and 2015 coverage years. At December 31,
2016
, we estimate that we are entitled to collect a total of
$619 million
from HHS under the commercial risk corridor program for the 2014 through 2016 program years.
|
|
•
|
In the fourth quarter of 2016, we increased the future policy benefits expense by approximately
$505 million
(
$318 million
after tax, or
$2.11
per diluted common share) for reserve strengthening associated with our closed block of long-term care insurance policies. This increase primarily was driven by emerging experience indicating longer claims duration, a prolonged lower interest rate environment, and an increase in policyholder life expectancies.
|
|
•
|
As discussed in the Retail segment highlights that follow, during 2015, we recognized a premium deficiency reserve of approximately
$176 million
for certain of our individual commercial medical products for the 2016 coverage year. During 2016, we increased this premium deficiency reserve associated with the 2016 coverage year by
$208 million
, or
$0.87
per diluted common share.
|
|
•
|
During
2016
, we recorded transaction and integration planning costs in connection with the Merger of approximately
$104 million
, or
$0.64
per diluted common share. During
2015
, we recorded transaction costs in connection with the Merger of approximately
$23 million
, or
$0.14
per diluted common share. Certain costs associated with the transaction were not deductible for tax purposes.
|
42
|
•
|
On June 1, 2015, we completed the sale of our wholly owned subsidiary, Concentra Inc., or Concentra, to MJ Acquisition Corporation, a joint venture between Select Medical Holdings Corporation and Welsh, Carson, Anderson & Stowe XII, L.P., a private equity fund, for approximately
$1,055 million
in cash, excluding approximately
$22 million
of transaction costs. In connection with the sale, we recognized a pre-tax gain, net of transaction costs, of
$270 million
, or
$1.57
per diluted common share in 2015.
|
|
•
|
Excluding the impact of the risk corridor receivables write-off, the long-term care reserve strengthening, the premium deficiency reserve recorded for the 2016 coverage year, and the sale of Concentra in 2015, the increase in pretax income primarily was due to year-over-year improvements in results for our individual Medicare Advantage business and Healthcare Services segment as well as increased profitability in our state-based contracts business.
|
|
•
|
Year-over-year comparisons of the operating cost ratio are impacted by the completion of the sale of Concentra on June 1, 2015. Concentra carried a higher operating cost ratio than our Group and Retail segments. This was partially offset by the risk corridor receivables write-off.
|
|
•
|
Investment income
decreased
$85 million
in
2016
, primarily due
to lower realized capital gains in
2016
and lower interest rates partially offset by a higher average invested balance.
|
|
•
|
As disclosed in Note 2 to the consolidated financial statements included in this report, we elected to early adopt new accounting guidance related to accounting for employee share-based payments, which changes how income tax effects of employee share-based payments are recorded. We adopted this guidance prospectively effective January 1, 2016. The adoption of this new guidance resulted in the recognition of approximately $20 million of tax benefits in net income, or $0.12 per diluted common share, in the first quarter of 2016.
|
|
•
|
Operating cash flow provided by operations was
$1.9 billion
for the year ended December 31,
2016
as compared to operating cash flow provided by operations of
$868 million
for the year ended December 31,
2015
. The increase in operating cash flow
primarily was due to significantly favorable working capital items and higher earnings exclusive of the commercial risk corridor receivables write-off and the long-term care reserve strengthening in 2016, as well as the gain on sale of Concentra and the recognition of the premium deficiency reserve in 2015 discussed previously. The working capital changes year-over-year primarily reflect lower income tax payments, changes in the net receivable balance associated with the premium stabilization programs established under health care reform, or the 3R's, and the timing of payroll cycles resulting in one less payroll cycle in 2016, partially offset by the timing of payments for benefits expense.
|
|
•
|
In
2016
, we paid the federal government
$916 million
for the annual non-deductible health insurance industry fee compared to our payment of
$867 million
in
2015
. This fee is not deductible for tax purposes, which significantly increased our effective income tax rate beginning in 2014. The health insurance industry fee is further described below under the section titled "Health Care Reform."
The Consolidated Appropriations Act, 2016, enacted on December 18, 2015, included a one-time one year suspension in 2017 of the health insurer fee.
This suspension will significantly reduce our operating costs and effective tax rate in 2017.
Our effective tax rate for
2017
is expected to be approximately
36%
to
37%
.
The decline in the effective tax rate primarily is due to the suspension of the annual health insurance industry fee in 2017.
|
|
•
|
We paid dividends to stockholders of
$177 million
in
2016
as compared to
$172 million
in 2015.
|
Retail Segment
|
•
|
On February 1, 2017, CMS issued its preliminary 2018 Medicare Advantage and Part D payment rates and proposed policy changes, which we refer to collectively as the Advance Notice. CMS has invited public comment on the Advance Notice before publishing final rates on April 3, 2017 (the Final Notice). In the Advance Notice, CMS estimates Medicare Advantage plans across the sector will, on average, experience a 0.25 percent increase in benchmark funding based on proposals included therein. As indicated by CMS, its estimate excludes the impact of fee-for-service county rebasing/re-pricing since the related impact is dependent upon finalization of certain data, which will be available with the publication of the Final Notice. CMS' estimate
|
43
includes 40 basis points of negative impact associated with Star quality bonuses sector-wide. Excluding that item, CMS' estimate would be a 0.65 percent increase. Based on our preliminary analysis using the same factors CMS included in its estimate, the components of which are detailed on CMS' website, we anticipate the proposals in the Advance Notice would result in a change to our benchmark funding relatively in line with CMS' estimate, excluding the impact attributable to Star quality bonuses. We believe we can design our 2018 Medicare Advantage plan filings, including the applicable level of rate changes, to remain competitive compared to both the combination of original Medicare with a supplement policy and Medicare Advantage products offered by our competitors. Failure to execute these strategies may result in a material adverse effect on our results of operations, financial position, and cash flows.
|
•
|
The achievement of Star Ratings of four or higher qualifies Medicare Advantage plans for premium bonuses. Star Ratings for the 2018 bonus year issued by CMS in October 2016 indicated that the percentage of our July 31, 2016 Medicare Advantage membership in 4-Star plans or higher declined to approximately 37% from approximately 78% of our July 31, 2015 Medicare Advantage membership. The decline in membership in 4- Star rated plans does not take into account certain operational actions discussed below that we have taken and intend to take over the coming months to mitigate any potential negative impact of these published ratings on Star bonus revenues for 2018.
|
We believe that the decline is primarily attributable to the impact of lower scores for certain Stars measures as a result of our 2015 comprehensive program audit by CMS. The Civil Monetary Penalty imposed by CMS following the audit resulted in a significant reduction to the Beneficiary Access and Plan Performance, or BAPP, measure. Additionally, an issue with the timeliness of appeal decisions noted in the audit resulted in automatic downgrades to two additional Star measures. Moreover, higher threshold levels for certain individual Star measures as compared to the previous year reduced our ratings on these measures. Thresholds for Star measures are calculated across the sector, without regard to weighted average membership of each plan. Together, these factors more than offset our improved Star rating performance in certain quality measures such as Healthcare Effectiveness Data and Information, or HEDIS.
Our Healthcare Effectiveness Data and Information Set, or HEDIS, measures, demonstrating the achievement of clinical outcomes, are at record-high results for the company. Accordingly, we believe that our Star ratings for the 2018 bonus year do not accurately reflect our actual performance under certain Star measures. Consequently, we filed for reconsideration of certain of those ratings under the appropriate administrative process. We are also evaluating our contract structures for rationalization to mitigate the negative impact on Star bonus revenues for 2018.
The ultimate financial impact to us related to 2018 Star bonus revenues is dependent upon multiple variables including, but not limited to, the number of Medicare Advantage members in 4-Star or higher rated plans and the geographic distribution of those members as well as a number of operational initiatives which would serve to mitigate the negative impact of our Star performance. Star results for the 2018 bonus year are not expected to materially impact our Medicare revenue for 2017 but could be material to 2018 Medicare revenues.
|
•
|
In
2016
, our Retail segment pretax income increased by
$7 million
, or
0.8%
, from
2015
primarily driven by the year-over-year improvement in our individual Medicare Advantage and state-based Medicaid businesses along with the impact of the premium deficiency reserve recorded in the fourth quarter of 2015 associated with certain individual commercial medical policies for the 2016 coverage year. These items were substantially offset by the write-off of commercial risk corridor receivables as described further below and in the results of operations discussion that follows.
|
|
•
|
Our Medicare Advantage results improved year-over-year primarily due to lower utilization and favorable year-over-year comparisons of prior-period medical claims reserve development. Operational initiatives are centered around optimizing the performance of our clinical programs to reduce medical cost trend. In addition our Medicare Advantage membership increased year-over-year as discussed below.
|
|
•
|
Operating results for our individual commercial medical business compliant with the Health Care Reform Law have been challenged primarily due to unanticipated modifications in the program subsequent to the
|
44
passing of the Health Care Reform Law, resulting in higher covered population morbidity and the ensuing enrollment and claims issues causing volatility in claims experience.
We took a number of actions in 2015 that we believed would improve the profitability of our individual commercial medical business in 2016.
These actions were subject to regulatory restrictions in certain geographies and included premium increases for the 2016 coverage year related generally to the first half of 2015 claims experience, the discontinuation of certain products as well as exit of certain markets for 2016, network improvements, enhancements to claims and clinical processes and administrative cost control. Despite these actions, the deterioration in the second half of 2015 claims experience together with 2016 open enrollment results that included the retention of many high-utilizing members for 2016 resulted in a probable future loss. As a result of our assessment in the fourth quarter of 2015 of the profitability of our individual commercial medical policies compliant with the Health Care Reform Law, we recorded in that quarter a provision for probable future losses (premium deficiency reserve) for the 2016 coverage year of
$176 million
, or
$0.74
per diluted common share. In 2016, we increased the premium deficiency reserve for the 2016 coverage year by
$208 million
, primarily as a result of unfavorable current and projected claims experience at that time. As of December 31, 2016, we had no remaining premium deficiency reserve.
For 2017, we are offering on-exchange individual commercial medical plans in 11 states, a reduction from the 15 states in which we offered on-exchange coverage in 2016. In addition, we discontinued substantially all Health Care Reform Law compliant off-exchange individual commercial medical plans effective January 1, 2017. Our 2017 geographic presence for our individual commercial medical offerings covers 156 counties, down from our 2016 presence in 1,351 counties (covering both on-exchange and off-exchange offerings). Given recent competitor actions, including market exits resulting in the automatic assignment of members to our plans, as well as sales and renewal results from the open enrollment process, we now expect 2017 premiums associated with Health Care Reform Law compliant offerings to be in the range of $850 million to $900 million. By comparison, our full year 2016 premiums associated with Health Care Reform Law compliant offerings were $3.3 billion. The decrease from 2016 results reflects the adjustment to our geographic presence and product discontinuances, erosion of competitive position, partially offset by premium increases as well as the projected impact of certain competitor actions.
On February 14, 2017, we announced we are exiting our individual commercial medical businesses January 1, 2018
. As discussed previously, we have worked over the past several years to address market and programmatic challenges in order to keep coverage options available wherever we could offer a viable product. This has included pursuing business changes, such as modifying networks, restructuring product offerings, reducing the company’s geographic footprint and increasing premiums.
All of these actions were taken with the expectation that our individual commercial medical business would stabilize to the point where we could continue to participate in the program. However, based on our initial analysis of data associated with our healthcare exchange membership following the 2017 open enrollment period, we are seeing further signs of an unbalanced risk pool. Therefore, we have decided that we cannot continue to offer this coverage for 2018.
|
•
|
Individual Medicare Advantage membership of
2,837,600
at December 31,
2016
increased
84,200
members, or
3.1%
, from
2,753,400
at December 31,
2015
reflecting net membership additions, particularly for our Medicare Advantage Health Maintenance Organization, or HMO, offerings. January
2017
individual Medicare Advantage membership approximated
2,848,000
,
increasing
approximately
10,400
members from December 31,
2016
reflecting net membership additions during the recently completed Annual Election Period for Medicare beneficiaries, including the loss of approximately
50,000
members in plans no longer offered for 2017. For full year
2017
, we anticipate net membership growth in our individual Medicare Advantage offerings of 30,000 to 40,000.
|
|
•
|
Group Medicare Advantage membership of
355,400
at December 31,
2016
decreased
128,700
members, or
26.6%
, from
484,100
at December 31,
2015
primarily reflecting the loss of a large account that moved to a private exchange offering on January 1, 2016. January
2017
group Medicare Advantage membership approximated
431,000
,
increasing
approximately
75,600
members, or
21%
, from December 31,
2016
reflecting net membership additions during the recently completed Annual Election Period for Medicare beneficiaries.
|
45
For full year
2017
, we expect net membership growth in our Group Medicare Advantage offerings of 70,000 to 80,000.
|
•
|
Medicare stand-alone PDP membership of
4,951,400
at December 31,
2016
increased
393,500
members, or
8.6%
, from
4,557,900
at December 31,
2015
reflecting net membership additions, primarily for our Humana-Walmart plan offering, for the 2016 plan year
. January
2017
Medicare stand-alone PDP membership (excluding transitional growth from the LI-NET prescription drug plan program)
increased
approximately
222,600
members, or
4%
, from December 31,
2016
to
5,174,000
members reflecting net membership additions during the recently completed Annual Election Period for Medicare beneficiaries. For full year
2017
, we anticipate net membership growth in our Medicare stand-alone PDP offerings of 320,000 to 340,000.
|
|
•
|
Our state-based Medicaid membership of
388,100
at December 31,
2016
increased
14,400
members, or
3.9%
, from
373,700
at December 31,
2015
primarily driven by the addition of members under our Florida Medicaid contract
.
|
|
•
|
Individual commercial medical membership of
654,800
at December 31,
2016
decreased
244,300
members, or
27.2%
, from
899,100
at December 31,
2015
primarily reflecting the loss of on-exchange members due to product competitiveness, the loss of membership associated with the discontinuance of certain Health Care Reform Law compliant plans in 2016, the loss of membership associated with non-payment of premiums or termination by CMS due to lack of eligibility documentation, and the loss of members subscribing to plans that are not compliant with the Health Care Reform Law
. At December 31,
2016
, individual commercial medical membership in plans compliant with the Health Care Reform Law, both on-exchange and off-exchange, was
580,100
members,
a decrease
of
177,800
members or
23.5%
from December 31,
2015
.
|
January
2017
individual commercial medical membership approximated
204,000
, including
152,000
enrolled in plans compliant with the Health Care Reform Law. The
decline
of approximately
450,800
members, or
69%
, from December 31,
2016
reflects net membership declines during the on-going open enrollment period for healthcare exchanges and the impact of product and service area reductions.
Group Segment
|
•
|
Group segment pretax income for the year ended December 31,
2016
was essentially unchanged from the year ended December 31,
2015
as discussed in the results of operations discussion that follows.
|
|
•
|
On July 21, 2016, we were notified by the Defense Health Agency, or DHA, that we were awarded the TRICARE East Region contract, with delivery of health care services expected to commence on October 1, 2017. The new East Region is a combination of the current North Region and South Region. The next generation East Region and West Region contract awards are currently subject to protests by unsuccessful bidders in the U.S. Court of Federal Claims and before the DHA. Our current TRICARE South Region contract expires March 31, 2017.
|
|
•
|
Membership in Go365
TM
(known as HumanaVitality
®
prior to January 2017), our wellness and loyalty rewards program, declined
7.2%
to
3,649,100
at December 31,
2016
from
3,932,300
at December 31,
2015
reflecting a decline in group Medicare Advantage membership from the loss of the large account on January 1, 2016 and a decline in individual commercial medical membership.
|
Healthcare Services Segment
|
•
|
Year-over-year comparisons of results of operations are impacted by the completion of the sale of Concentra on June 1, 2015.
|
46
|
•
|
As discussed in the detailed Healthcare Services segment results of operations discussion that follows, our Healthcare Services segment pretax income
increased
$86 million
, or
8.8%
, for the year ended December 31,
2016
. This increase was primarily due to incremental earnings associated with revenue growth from our pharmacy solutions business as it increased mail-order penetration and served our growing individual Medicare membership, partially offset by ongoing pressures in our provider services business reflecting significantly lower Medicare rates year-over-year associated with CMS' risk coding recalibration for 2016 in geographies where our provider assets are primarily located.
|
|
•
|
Programs to enhance the quality of care for members are key elements of our integrated care delivery model. At December 31,
2016
, we enrolled approximately
622,300
Medicare Advantage members with complex chronic conditions in the Humana Chronic Care Program, a
5.4%
increase
compared with approximately
590,300
members at December 31,
2015
, reflecting a greater focus on members living with the most chronic conditions. Enhanced predictive modeling capabilities and proactive clinical outreach and engagement of those members helped drive increased clinical program participation, offset by the loss of engaged members associated with the group Medicare Advantage account that termed on January 1, 2016 as discussed previously. We continue to refine our clinical management programs to help optimize the quality of healthcare for our members and ensure appropriate returns on our investments.
|
Other Businesses
|
•
|
As previously disclosed, in the fourth quarter of 2016, we increased future policy benefits expense by approximately
$505 million
for reserve strengthening associated with our closed block of long-term care insurance policies. This increase primarily was driven by emerging experience indicating longer claims duration, a prolonged lower interest rate environment, and an increase in policyholder life expectancies as discussed further in Note 18 to the consolidated financial statements included in Item 8. Financial Statements and Supplementary Data in this
2016
Form 10-K.
|
Health Care Reform
The Health Care Reform Law enacted significant reforms to various aspects of the U.S. health insurance industry. Certain significant provisions of the Health Care Reform Law include, among others, mandated coverage requirements, mandated benefits and guarantee issuance associated with commercial medical insurance, rebates to policyholders based on minimum benefit ratios, adjustments to Medicare Advantage premiums, the establishment of federally-facilitated or state-based exchanges coupled with programs designed to spread risk among insurers, and the introduction of plan designs based on set actuarial values. In addition, the Health Care Reform Law established insurance industry assessments, including an annual health insurance industry fee and a three-year $25 billion industry wide commercial reinsurance fee. The annual health insurance industry fee levied on the insurance industry was $8 billion in 2014 and $11.3 billion in each of 2015 and 2016, with increasing annual amounts starting in 2018, and is not deductible for income tax purposes, which significantly increased our effective income tax rate. Our effective tax rate for
2016
was approximately
60.5%
.
The Consolidated Appropriations Act, 2016, enacted on December 18, 2015, included a one-time one year suspension in 2017 of the health insurer fee.
This suspension will significantly reduce our operating costs and effective tax rate in 2017.
Our effective tax rate for 2017 is expected to be approximately
36%
to
37%
.
The decline in the effective tax rate primarily is due to the suspension of the annual health insurance industry fee in 2017.
The health insurance industry fee levied on the insurance industry was previously expected to be $14 billion in 2017. In
2016
, we paid the federal government
$916 million
for the annual health insurance industry fee, a
5.7%
increase from
$867 million
in
2015
, primarily reflecting growth in our market share.
In addition, the Health Care Reform Law expands federal oversight of health plan premium rates and could adversely affect our ability to appropriately adjust health plan premiums on a timely basis. Financing for these reforms comes, in part, from material additional fees and taxes on us (as discussed above) and other health plans and individuals which began in 2014, as well as reductions in certain levels of payments to us and other health plans under Medicare as described in this
2016
Form 10-K.
As noted above, the Health Care Reform Law required the establishment of health insurance exchanges for individuals and small employers to purchase health insurance that became effective January 1, 2014, with an annual open enrollment period. Insurers participating on the health insurance exchanges must offer a minimum level of benefits
47
and are subject to guidelines on setting premium rates and coverage limitations. We may be adversely selected by individuals who have a higher acuity level than the anticipated pool of participants in this market. In addition, the risk corridor, reinsurance, and risk adjustment provisions of the Health Care Reform Law, established to apportion risk for insurers, may not be effective in appropriately mitigating the financial risks related to our products, and audits of our submissions under these programs may result in returns of funds distributed. In addition, regulatory changes to the implementation of the Health Care Reform Law that allowed individuals to remain in plans that are not compliant with the Health Care Reform Law or to enroll outside of the annual enrollment period may have an adverse effect on our pool of participants in the health insurance exchange. In addition, states may impose restrictions on our ability to increase rates. All of these factors may have a material adverse effect on our results of operations, financial position, or cash flows if our premiums are not adequate or do not appropriately reflect the acuity of these individuals. Any variation from our expectations regarding acuity, enrollment levels, adverse selection, or other assumptions used in setting premium rates could have a material adverse effect on our results of operations, financial position, and cash flows and could impact our decision to participate or continue in the program in certain states. For 2017, we are offering on-exchange individual commercial medical plans in 11 states, a reduction from the 15 states in which we offered on-exchange coverage in 2016. In addition, we discontinued substantially all Health Care Reform Law compliant off-exchange individual commercial medical plans effective January 1, 2017.
If we fail to effectively implement our operational and strategic initiatives with respect to the implementation of the Health Care Reform Law, our business may be materially adversely affected. Additionally, potential legislative changes, including activities to repeal or replace the Health Care Reform Law, creates uncertainty for our business, and we cannot predict when, or in what form, such legislative changes may occur.
We may be unable to adjust our product offerings, geographic footprint, or pricing during any given year such legislative changes occur in sufficient time to mitigate any adverse effects.
As discussed above, it is reasonably possible that the Health Care Reform Law and related regulations, as well as future legislative changes, including legislative restrictions on our ability to manage our provider network or otherwise operate our business, or regulatory restrictions on profitability, including by comparison of our Medicare Advantage profitability to our non-Medicare Advantage business profitability and a requirement that they remain within certain ranges of each other, in the aggregate may have a material adverse effect on our results of operations (including restricting revenue, enrollment and premium growth in certain products and market segments, restricting our ability to expand into new markets, increasing our medical and operating costs, further lowering our Medicare payment rates and increasing our expenses associated with the non-deductible health insurance industry fee and other assessments); our financial position (including our ability to maintain the value of our goodwill); and our cash flows (including the delayed receipt of amounts due under the commercial risk adjustment, risk corridor, and reinsurance provisions of the Health Care Reform Law).
On November 10, 2016, the U.S. Court of Federal Claims ruled in favor of the government in one of a series of cases filed by insurers, unrelated to us, against HHS to collect risk corridor payments, rejecting all of the insurer’s statutory, contract and Constitutional claims for payment. On November 18, 2016, HHS issued a memorandum indicating a significant funding shortfall for the 2015 coverage year, the second consecutive year of significant shortfalls. Given the successful challenge of the risk corridor provisions in court, Congressional inquiries into the funding of the risk corridor program, and significant funding shortfalls under the first two years of the program, during the fourth quarter of 2016 we wrote-off
$583 million
in risk corridor receivables outstanding as of September 30, 2016, including
$415 million
associated with the 2014 and 2015 coverage years. From inception of the risk corridor program through December 31, 2016, we collected approximately
$36 million
from CMS for risk corridor receivables associated with the 2014 coverage year funded by HHS in accordance with previous guidance, utilizing funds HHS collected from us and other carriers under the 2014 and 2015 risk corridor program.
We intend for the discussion of our financial condition and results of operations that follows to assist in the understanding of our financial statements and related changes in certain key items in those financial statements from year to year, including the primary factors that accounted for those changes.
Transactions between reportable segments primarily consist of sales of services rendered by our Healthcare Services segment, primarily pharmacy, provider, and home based services as well as clinical programs, to our Retail and Group customers
and are described in Note 17
to the consolidated financial statements included in Item 8. Financial Statements and Supplementary Data in this
2016
Form 10-K.
48
Comparison of Results of Operations for
2016
and
2015
Certain financial data on a consolidated basis and for our segments was as follows for the years ended December 31,
2016
and
2015
:
Consolidated
|
|
|
Change
|
|||||||||||||
|
|
2016
|
2015
|
Dollars
|
Percentage
|
|||||||||||
|
|
(dollars in millions, except per
common share results) |
|
|||||||||||||
|
Revenues:
|
|||||||||||||||
|
Premiums:
|
|||||||||||||||
|
Retail
|
$
|
46,546
|
|
$
|
45,805
|
|
$
|
741
|
|
1.6
|
%
|
||||
|
Group
|
6,437
|
|
6,569
|
|
(132
|
)
|
(2.0
|
)%
|
|||||||
|
Other Businesses
|
38
|
|
35
|
|
3
|
|
8.6
|
%
|
|||||||
|
Total premiums
|
53,021
|
|
52,409
|
|
612
|
|
1.2
|
%
|
|||||||
|
Services:
|
|||||||||||||||
|
Retail
|
8
|
|
9
|
|
(1
|
)
|
(11.1
|
)%
|
|||||||
|
Group
|
694
|
|
698
|
|
(4
|
)
|
(0.6
|
)%
|
|||||||
|
Healthcare Services
|
257
|
|
685
|
|
(428
|
)
|
(62.5
|
)%
|
|||||||
|
Other Businesses
|
10
|
|
14
|
|
(4
|
)
|
(28.6
|
)%
|
|||||||
|
Total services
|
969
|
|
1,406
|
|
(437
|
)
|
(31.1
|
)%
|
|||||||
|
Investment income
|
389
|
|
474
|
|
(85
|
)
|
(17.9
|
)%
|
|||||||
|
Total revenues
|
54,379
|
|
54,289
|
|
90
|
|
0.2
|
%
|
|||||||
|
Operating expenses:
|
|||||||||||||||
|
Benefits
|
45,007
|
|
44,269
|
|
738
|
|
1.7
|
%
|
|||||||
|
Operating costs
|
7,277
|
|
7,318
|
|
(41
|
)
|
(0.6
|
)%
|
|||||||
|
Depreciation and amortization
|
354
|
|
355
|
|
(1
|
)
|
(0.3
|
)%
|
|||||||
|
Total operating expenses
|
52,638
|
|
51,942
|
|
696
|
|
1.3
|
%
|
|||||||
|
Income from operations
|
1,741
|
|
2,347
|
|
(606
|
)
|
(25.8
|
)%
|
|||||||
|
Gain on sale of business
|
—
|
|
270
|
|
(270
|
)
|
100.0
|
%
|
|||||||
|
Interest expense
|
189
|
|
186
|
|
3
|
|
1.6
|
%
|
|||||||
|
Income before income taxes
|
1,552
|
|
2,431
|
|
(879
|
)
|
(36.2
|
)%
|
|||||||
|
Provision for income taxes
|
938
|
|
1,155
|
|
(217
|
)
|
(18.8
|
)%
|
|||||||
|
Net income
|
$
|
614
|
|
$
|
1,276
|
|
$
|
(662
|
)
|
(51.9
|
)%
|
||||
|
Diluted earnings per common share
|
$
|
4.07
|
|
$
|
8.44
|
|
$
|
(4.37
|
)
|
(51.8
|
)%
|
||||
|
Benefit ratio (a)
|
84.9
|
%
|
84.5
|
%
|
0.4
|
%
|
|||||||||
|
Operating cost ratio (b)
|
13.5
|
%
|
13.6
|
%
|
(0.1
|
)%
|
|||||||||
|
Effective tax rate
|
60.5
|
%
|
47.5
|
%
|
13.0
|
%
|
|||||||||
|
(a)
|
Represents total benefits expense as a percentage of premiums revenue.
|
|
(b)
|
Represents total operating costs, excluding depreciation and amortization, as a percentage of total revenues less investment income.
|
Summary
Net income for 2016 was
$614 million
, or
$4.07
per diluted common share, in
2016
compared to
$1.3 billion
, or
$8.44
per diluted common share, in
2015
. Net income includes a write-off of
$2.43
per diluted common share
in
49
receivables associated with the commercial risk corridor premium stabilization program
and reserve strengthening for our non-strategic closed block of long-term care insurance business
of
$2.11
per diluted common share, as discussed below. These items were partially offset by the impact of the premium deficiency reserve of
$0.74
per diluted common share recorded in the fourth quarter of 2015 for certain of our individual commercial medical products for the 2016 coverage year. In addition, the completion of the sale of Concentra on June 1, 2015 resulted in an after-tax gain of
$1.57
per diluted common share in 2015. Excluding these items, the increase primarily was due to year-over-year improvement in results for our individual Medicare Advantage business and our Healthcare Services segment as well as increased profitability in our state-based Medicaid business, partially offset by an increase in the effective tax rate as discussed below. In addition,
2016
includes expenses of
$0.64
per diluted common share and
2015
includes expenses of $
0.14
per diluted common share for transaction and integration planning costs associated with the Merger, certain of which were not deductible for tax purposes.
Premiums Revenue
Consolidated premiums
increased
$612 million
, or
1.2%
, from
2015
to
$53.0 billion
for
2016
primarily reflecting higher premiums in the Retail segment mainly driven by average membership growth and per member premium increases for certain of our lines of business. These increases were partially offset by the write-off of
$583 million
of receivables associated with the commercial risk corridor premium stabilization program, the loss of premiums associated with a large group Medicare account that moved to a private exchange on January 1, 2016, and a decline in premiums revenue associated with fewer individual commercial medical members as discussed in our segment results of operations discussion that follows. Average membership is calculated by summing the ending membership for each month in a period and dividing the result by the number of months in a period. Premiums revenue reflects changes in membership and average per member premiums. Items impacting average per member premiums include changes in premium rates as well as changes in the geographic mix of membership, the mix of product offerings, and the mix of benefit plans selected by our membership.
Services Revenue
Consolidated services revenue
decreased
$437 million
, or
31.1%
, from
2015
to
$1.0 billion
for
2016
primarily due to the completion of the sale of Concentra on June 1, 2015.
Investment Income
Investment income totaled
$389 million
for
2016
,
a decrease
of
$85 million
, or
17.9%
, from
2015
, primarily due
to lower realized capital gains in
2016
and lower interest rates partially offset by a higher average invested balance.
Benefits Expense
Consolidated benefits expense was
$45.0 billion
for
2016
,
an increase
of
$738 million
, or
1.7%
, from
2015
primarily due to
$505 million
in incremental benefits expense for the reserve strengthening in our non-strategic closed block of long-term care insurance policies partially offset by the premium deficiency reserve recorded in the fourth quarter of 2015 for certain of our individual commercial medical products for the 2016 coverage year. Excluding the long-term care reserve strengthening and impact of the premium deficiency reserve, the increase is primarily due to an increase in the Retail segment mainly driven by higher average individual Medicare Advantage membership. As more fully described herein under the section entitled “Benefits Expense Recognition”, actuarial standards require the use of assumptions based on moderately adverse experience, which generally results in favorable reserve development, or reserves that are considered redundant. We experienced favorable medical claims reserve development related to prior fiscal years of
$582 million
in
2016
and
$236 million
in
2015
. The increase in prior-period medical claims reserve development year over-year primarily was due to favorable year-over-year comparisons for our Medicare Advantage and individual commercial medical businesses.
The consolidated benefit ratio for
2016
was
84.9%
,
an increase
of
40
basis points from
2015
primarily due to the incremental benefits expense for the reserve strengthening in our non-strategic closed block of long-term care insurance policies, the impact on the benefit ratio of lower consolidated premiums associated with the write-off of receivables for the commercial risk corridor premium stabilization program, and the impact of the premium deficiency reserve
50
recorded in the fourth quarter of 2015 for certain of our individual commercial medical products for the 2016 coverage year. Excluding the impact of the write-off of the commercial risk corridor receivables and the premium deficiency reserve, these items were partially offset by year-over-year improvement in both the Retail and Group segment benefit ratios as discussed in the segment results of operations discussion that follows. Favorable prior-period medical claims reserve development
decreased
the consolidated benefit ratio by approximately
110
basis points in
2016
versus approximately
50
basis points in
2015
.
Operating Costs
Our segments incur both direct and shared indirect operating costs. We allocate the indirect costs shared by the segments primarily as a function of revenues. As a result, the profitability of each segment is interdependent.
Consolidated operating costs
decreased
$41 million
, or
0.6%
, from
2015
to
$7.3 billion
in
2016
primarily due to the completion of the sale of Concentra on June 1, 2015
The consolidated operating cost ratio for
2016
was
13.5%
,
decreasing
10
basis points from
2015
primarily due to the completion of the sale of Concentra on June 1, 2015. Concentra carried a higher operating cost ratio than our Group and Retail segments. This was partially offset by the unfavorable year-over-year comparison associated with the temporary suspension of certain discretionary administrative costs in the latter half of 2015, along with the impact of the commercial risk corridor receivables write-off in the fourth quarter of 2016. In addition, transaction and integration planning costs associated with the Merger increased the operating cost ratio by 20 basis points in 2016. There was minimal impact for transaction costs to the operating cost ratio in 2015.
Depreciation and Amortization
Depreciation and amortization for
2016
of
$354 million
was relatively unchanged from
2015
.
Interest Expense
Interest expense was
$189 million
for
2016
compared to
$186 million
for
2015
,
an increase
of
$3 million
, or
1.6%
.
Income Taxes
Our effective tax rate during
2016
was
60.5%
compared to the effective tax rate of
47.5%
in
2015
primarily reflecting lower pretax income year-over-year, the beneficial effect of the sale of Concentra on June 1, 2015 and the impact of non-deductible transaction costs associated with the Merger. Non-deductible transaction and integration planning costs associated with the Merger increased our effective tax rate by approximately
3.4
percentage points in
2016
versus approximately
0.4
percentage points in
2015
. Conversely, the tax effect of the sale of Concentra reduced our effective tax rate by approximately
4.5
percentage points in 2015. See Note 11 to the consolidated financial statements included in Item 8. – Financial Statements and Supplementary Data for a complete reconciliation of the federal statutory rate to the effective tax rate.
Our effective tax rate for
2017
is expected to be approximately
36%
to
37%
.
The decline in the effective tax rate primarily is due to the suspension of the annual health insurance industry fee in 2017.
The effective tax rate for 2016 also reflects tax benefits associated with adopting new guidance related to the accounting for employee share-based payments effective January 1, 2016 as described in Note 2 to the condensed consolidated financial statements included in this report, which decreased our effective tax rate by approximately 1.2 percentage points in 2016.
51
Retail Segment
|
|
Change
|
|||||||||||
|
|
2016
|
2015
|
Members
|
Percentage
|
||||||||
|
Membership:
|
||||||||||||
|
Medical membership:
|
||||||||||||
|
Individual Medicare Advantage
|
2,837,600
|
|
2,753,400
|
|
84,200
|
|
3.1
|
%
|
||||
|
Group Medicare Advantage
|
355,400
|
|
484,100
|
|
(128,700
|
)
|
(26.6
|
)%
|
||||
|
Medicare stand-alone PDP
|
4,951,400
|
|
4,557,900
|
|
393,500
|
|
8.6
|
%
|
||||
|
Total Retail Medicare
|
8,144,400
|
|
7,795,400
|
|
349,000
|
|
4.5
|
%
|
||||
|
Individual commercial
|
654,800
|
|
899,100
|
|
(244,300
|
)
|
(27.2
|
)%
|
||||
|
State-based Medicaid
|
388,100
|
|
373,700
|
|
14,400
|
|
3.9
|
%
|
||||
|
Medicare Supplement
|
218,800
|
|
158,600
|
|
60,200
|
|
38.0
|
%
|
||||
|
Total Retail medical members
|
9,406,100
|
|
9,226,800
|
|
179,300
|
|
1.9
|
%
|
||||
|
Individual specialty membership (a)
|
1,088,100
|
|
1,153,100
|
|
(65,000
|
)
|
(5.6
|
)%
|
||||
|
(a)
|
Specialty products include dental, vision, and other supplemental health and financial protection products. Members included in these products may not be unique to each product since members have the ability to enroll in multiple products.
|
|
|
|
Change
|
|||||||||||||
|
|
2016
|
2015
|
Dollars
|
Percentage
|
|||||||||||
|
|
(in millions)
|
|
|||||||||||||
|
Premiums and Services Revenue:
|
|||||||||||||||
|
Premiums:
|
|||||||||||||||
|
Individual Medicare Advantage
|
$
|
31,863
|
|
$
|
29,526
|
|
$
|
2,337
|
|
7.9
|
%
|
||||
|
Group Medicare Advantage
|
4,283
|
|
5,588
|
|
(1,305
|
)
|
(23.4
|
)%
|
|||||||
|
Medicare stand-alone PDP
|
4,009
|
|
3,846
|
|
163
|
|
4.2
|
%
|
|||||||
|
Total Retail Medicare
|
40,155
|
|
38,960
|
|
1,195
|
|
3.1
|
%
|
|||||||
|
Individual commercial
|
3,064
|
|
3,939
|
|
(875
|
)
|
(22.2
|
)%
|
|||||||
|
State-based Medicaid
|
2,640
|
|
2,341
|
|
299
|
|
12.8
|
%
|
|||||||
|
Medicare Supplement
|
428
|
|
304
|
|
124
|
|
40.8
|
%
|
|||||||
|
Individual specialty
|
259
|
|
261
|
|
(2
|
)
|
(0.8
|
)%
|
|||||||
|
Total premiums
|
46,546
|
|
45,805
|
|
741
|
|
1.6
|
%
|
|||||||
|
Services
|
8
|
|
9
|
|
(1
|
)
|
(11.1
|
)%
|
|||||||
|
Total premiums and services revenue
|
$
|
46,554
|
|
$
|
45,814
|
|
$
|
740
|
|
1.6
|
%
|
||||
|
Income before income taxes
|
$
|
937
|
|
$
|
930
|
|
$
|
7
|
|
0.8
|
%
|
||||
|
Benefit ratio
|
86.2
|
%
|
86.7
|
%
|
(0.5
|
)%
|
|||||||||
|
Operating cost ratio
|
11.5
|
%
|
11.2
|
%
|
0.3
|
%
|
|||||||||
Pretax Results
|
•
|
Retail segment pretax income was
$937 million
in
2016
,
an increase
of
$7 million
, or
0.8%
, compared to
2015
primarily driven by the year-over-year improvement in our individual Medicare Advantage and state-based Medicaid businesses along with the impact of the premium deficiency reserve recorded in the fourth quarter of 2015 associated with certain individual commercial medical policies for the 2016 coverage year. These items were substantially offset by the write-off of commercial risk corridor receivables as discussed below.
|
52
Enrollment
|
•
|
Individual Medicare Advantage membership
increased
84,200
members, or
3.1%
, from December 31,
2015
to December 31,
2016
reflecting net membership additions, particularly for our HMO offerings, for the
2016
plan year.
|
|
•
|
Group Medicare Advantage membership
decreased
128,700
members, or
26.6%
, from December 31,
2015
to December 31,
2016
reflecting the loss of a large account that moved to a private exchange offering on January 1, 2016.
|
|
•
|
Medicare stand-alone PDP membership
increased
393,500
members, or
8.6%
, from December 31,
2015
to December 31,
2016
reflecting net membership additions, primarily for our Humana-Walmart plan offering, for the 2016 plan year
.
|
|
•
|
Individual commercial medical membership
decreased
244,300
members, or
27.2%
, from December 31,
2015
to December 31,
2016
primarily reflecting the loss of on-exchange members due to product competitiveness, the loss of membership associated with the discontinuance of certain Health Care Reform Law compliant plans in 2016, the loss of membership associated with non-payment of premiums or termination by CMS due to lack of eligibility documentation, and the loss of members subscribing to plans that are not compliant with the Health Care Reform Law
.
|
|
•
|
State-based Medicaid membership
increased
14,400
members, or
3.9%
, from December 31,
2015
to December 31,
2016
primarily driven by the addition of members under our Florida Medicaid contract
.
|
|
•
|
Individual specialty membership
decreased
65,000
members, or
5.6%
, from December 31,
2015
to December 31,
2016
primarily due to the loss of individual commercial medical members that also had specialty coverage.
|
Premiums revenue
|
•
|
Retail segment premiums
increased
$741 million
, or
1.6%
, from
2015
to
2016
primarily due to higher average membership for our individual Medicare Advantage and state-based Medicaid businesses and per member premium increases for certain lines of business. Average individual Medicare Advantage membership
increased
3.9%
in
2016
. These items were partially offset by the write-off of approximately
$583 million
of receivables associated with the commercial risk corridor premium stabilization program, and declines in group Medicare Advantage (including the loss of a large group Medicare Advantage account) and individual commercial medical membership.
|
Benefits expense
|
•
|
The Retail segment benefit ratio of
86.2%
for
2016
decreased
50
basis points from
2015
primarily due to lower year-over-year Medicare Advantage utilization, favorable comparisons of prior-year medical claims reserve development, and the impact of the premium deficiency reserve recorded in the fourth quarter of 2015 for certain of our individual commercial medical products for the 2016 coverage year. These items were partially offset by the reduction of premiums related to the write-off of receivables associated with the commercial risk corridor premium stabilization program which increased the Retail segment benefit ratio by approximately
100
basis points in 2016. As previously disclosed, in the fourth quarter of 2015 we recorded a premium deficiency reserve associated with our 2016 individual commercial offerings compliant with the Health Care Reform Law, increasing our 2015 benefit ratio by 40 basis points. During 2016, we increased the premium deficiency reserve for the 2016 coverage year and recorded a change in estimate of
$208 million
with a corresponding increase in benefits expense primarily as a result of unfavorable current and projected claims experience.
|
|
•
|
The Retail segment’s benefits expense for
2016
included the beneficial effect of
$535 million
in favorable prior-year medical claims reserve development versus
$228 million
in
2015
. This favorable prior-year medical claims reserve development
decreased
the Retail segment benefit ratio by approximately
110
basis points in
|
53
2016
versus approximately
50
basis points in
2015
. The year-over-year increase in prior-period medical claims reserve development primarily was due to favorable year-over-year comparisons for our Medicare Advantage and individual commercial medical business.
Operating costs
|
•
|
The Retail segment operating cost ratio of
11.5%
for
2016
increased
30
basis points from
2015
primarily due to the impact on premiums of the write-off of receivables associated with the commercial risk corridor premium stabilization program, the unfavorable comparison to unusually low operating expenses in 2015 resulting from the temporary suspension of certain discretionary administrative costs, and the loss of a large group Medicare Advantage account which carried a lower operating cost ratio than that for our individual Medicare Advantage business. The non-deductible health insurance industry fee
increased
the operating cost ratio by approximately
170
basis points in
2016
as compared to
160
basis points in
2015
.
|
Group Segment
|
|
|
Change
|
||||||||||
|
|
2016
|
2015
|
Members
|
Percentage
|
||||||||
|
Membership:
|
||||||||||||
|
Medical membership:
|
||||||||||||
|
Fully-insured commercial group
|
1,136,000
|
|
1,178,300
|
|
(42,300
|
)
|
(3.6
|
)%
|
||||
|
ASO
|
573,200
|
|
710,700
|
|
(137,500
|
)
|
(19.3
|
)%
|
||||
|
Military services
|
3,084,100
|
|
3,074,400
|
|
9,700
|
|
0.3
|
%
|
||||
|
Total group medical members
|
4,793,300
|
|
4,963,400
|
|
(170,100
|
)
|
(3.4
|
)%
|
||||
|
Group specialty membership (a)
|
5,873,100
|
|
6,068,700
|
|
(195,600
|
)
|
(3.2
|
)%
|
||||
|
(a)
|
Specialty products include dental, vision, and other voluntary benefit products. Members included in these products may not be unique to each product since members have the ability to enroll in multiple products.
|
|
|
|
Change
|
|||||||||||||
|
|
2016
|
2015
|
Dollars
|
Percentage
|
|||||||||||
|
|
(in millions)
|
|
|||||||||||||
|
Premiums and Services Revenue:
|
|||||||||||||||
|
Premiums:
|
|||||||||||||||
|
Fully-insured commercial group
|
$
|
5,405
|
|
$
|
5,493
|
|
$
|
(88
|
)
|
(1.6
|
)%
|
||||
|
Group specialty
|
1,020
|
|
1,055
|
|
(35
|
)
|
(3.3
|
)%
|
|||||||
|
Military services
|
12
|
|
21
|
|
(9
|
)
|
(42.9
|
)%
|
|||||||
|
Total premiums
|
6,437
|
|
6,569
|
|
(132
|
)
|
(2.0
|
)%
|
|||||||
|
Services
|
694
|
|
698
|
|
(4
|
)
|
(0.6
|
)%
|
|||||||
|
Total premiums and services revenue
|
$
|
7,131
|
|
$
|
7,267
|
|
$
|
(136
|
)
|
(1.9
|
)%
|
||||
|
Income before income taxes
|
$
|
257
|
|
$
|
258
|
|
$
|
(1
|
)
|
(0.4
|
)%
|
||||
|
Benefit ratio
|
79.6
|
%
|
80.2
|
%
|
(0.6
|
)%
|
|||||||||
|
Operating cost ratio
|
24.6
|
%
|
24.0
|
%
|
0.6
|
%
|
|||||||||
Pretax Results
|
•
|
Group segment pretax income was relatively unchanged,
decreasing
$1 million
, or
0.4%
, to
$257 million
in
2016
as an increase in the operating cost ratio was substantially offset by improvement in the benefit ratio as discussed below.
|
54
Enrollment
|
•
|
Fully-insured commercial group medical membership
decreased
42,300
members, or
3.6%
from December 31,
2015
reflecting lower membership in both large and small group accounts.
|
|
•
|
Group ASO commercial medical membership
decreased
137,500
members, or
19.3%
, from December 31,
2015
to December 31,
2016
primarily due to the loss of certain large group accounts as a result of continued discipline in pricing of services for self-funded accounts amid a highly competitive environment.
|
|
•
|
Group specialty membership
decreased
195,600
members, or
3.2%
, from December 31,
2015
to December 31,
2016
primarily due to the loss of several large stand-alone dental and vision accounts as well as the loss of certain fully-insured group medical accounts that also had specialty coverage.
|
Premiums revenue
|
•
|
Group segment premiums
decreased
$132 million
, or
2.0%
, from
2015
to
2016
primarily due to a decline in fully-insured commercial medical membership as described above, partially offset by an increase in fully-insured commercial medical per member premiums.
|
Services revenue
|
•
|
Group segment services revenue
decreased
$4 million
, or
0.6%
, from
2015
to
2016
primarily due to a decline in group ASO commercial medical membership.
|
Benefits expense
|
•
|
The Group segment benefit ratio
decreased
60
basis points from
80.2%
in
2015
to
79.6%
in
2016
primarily reflecting the beneficial effect of higher prior-year medical claims reserve development in
2016
and lower utilization.
|
|
•
|
The Group segment’s benefits expense included the beneficial effect of
$46 million
in favorable prior-year medical claims reserve development in
2016
versus
$7 million
in
2015
. This favorable prior-year medical claims reserve development
decreased
the Group segment benefit ratio by approximately
70
basis points in
2016
versus approximately
10
basis points in
2015
.
|
Operating costs
|
•
|
The Group segment operating cost ratio of
24.6%
for
2016
increased
60
basis points from
24.0%
for
2015
primarily due to the unfavorable comparison to unusually low operating expenses in 2015 resulting from the temporary suspension of certain discretionary administrative costs. The non-deductible health insurance industry fee
increased
the operating cost ratio by approximately
150
basis points in
2016
as compared to
140
basis points in
2015
.
|
55
Healthcare Services Segment
|
|
|
Change
|
|||||||||||||
|
|
2016
|
2015
|
Dollars
|
Percentage
|
|||||||||||
|
|
(in millions)
|
|
|||||||||||||
|
Revenues:
|
|||||||||||||||
|
Services:
|
|||||||||||||||
|
Provider services
|
$
|
78
|
|
$
|
515
|
|
$
|
(437
|
)
|
(84.9
|
)%
|
||||
|
Home based services
|
148
|
|
140
|
|
8
|
|
5.7
|
%
|
|||||||
|
Pharmacy solutions
|
31
|
|
30
|
|
1
|
|
3.3
|
%
|
|||||||
|
Total services revenues
|
257
|
|
685
|
|
(428
|
)
|
(62.5
|
)%
|
|||||||
|
Intersegment revenues:
|
|||||||||||||||
|
Pharmacy solutions
|
21,952
|
|
20,551
|
|
1,401
|
|
6.8
|
%
|
|||||||
|
Provider services
|
1,677
|
|
1,291
|
|
386
|
|
29.9
|
%
|
|||||||
|
Home based services
|
1,026
|
|
875
|
|
151
|
|
17.3
|
%
|
|||||||
|
Clinical programs
|
180
|
|
203
|
|
(23
|
)
|
(11.3
|
)%
|
|||||||
|
Total intersegment revenues
|
24,835
|
|
22,920
|
|
1,915
|
|
8.4
|
%
|
|||||||
|
Total services and intersegment revenues
|
$
|
25,092
|
|
$
|
23,605
|
|
$
|
1,487
|
|
6.3
|
%
|
||||
|
Income before income taxes
|
$
|
1,067
|
|
$
|
981
|
|
$
|
86
|
|
8.8
|
%
|
||||
|
Operating cost ratio
|
95.4
|
%
|
95.2
|
%
|
0.2
|
%
|
|||||||||
Pretax results
|
•
|
Healthcare Services segment pretax income of
$1,067 million
for
2016
increased
$86 million
, or
8.8%
, from
2015
primarily due to incremental earnings associated with revenue growth from our pharmacy solutions business as it increased mail-order penetration and served our growing individual Medicare membership. The increase was partially offset by ongoing pressures in our provider services business reflecting significantly lower Medicare rates year-over-year associated with CMS' risk coding recalibration for 2016 in geographies where our provider assets are primarily located.
|
Script Volume
|
•
|
Humana Pharmacy Solutions
®
script volumes for the Retail and Group segment membership increased to approximately
426 million
in
2016
,
up
7%
versus scripts of approximately
398 million
in
2015
. The increase primarily reflects growth associated with higher average medical membership for
2016
than in
2015
.
|
Services revenue
|
•
|
Services revenue
decreased
$428 million
, or
62.5%
, from
2015
to
$257 million
for
2016
primarily due to the completion of the sale of Concentra on June 1, 2015.
|
Intersegment revenues
|
•
|
Intersegment revenues
increased
$1.9 billion
, or
8.4%
, from
2015
to
$24.8 billion
for
2016
primarily due to increased mail order penetration and growth in our individual Medicare Advantage and Medicare stand-alone PDP membership which resulted in increased engagement of members in clinical programs and higher utilization of services across the segment.
|
56
Operating costs
|
•
|
The Healthcare Services segment operating cost ratio of
95.4%
for
2016
increased
slightly from
2015
primarily due to a higher operating cost ratio for our provider services business reflecting significantly lower Medicare rates year-over-year as discussed above, partially offset by operating cost efficiencies associated with our pharmacy operations.
|
Other Businesses
As previously disclosed, in the fourth quarter of 2016, we increased future policy benefits expense by approximately
$505 million
for reserve strengthening associated with our closed block of long-term care insurance policies. This increase primarily was driven by emerging experience indicating longer claims duration, a prolonged lower interest rate environment, and an increase in policyholder life expectancies as discussed further in Note 18 to the consolidated financial statements included in Item 8. Financial Statements and Supplementary Data in this
2016
Form 10-K.
57
Comparison of Results of Operations for
2015
and
2014
Certain financial data on a consolidated basis and for our segments was as follows for the years ended December 31,
2015
and
2014
:
Consolidated
|
|
|
Change
|
|||||||||||||
|
|
2015
|
2014
|
Dollars
|
Percentage
|
|||||||||||
|
|
(dollars in millions, except per
common share results)
|
|
|||||||||||||
|
Revenues:
|
|||||||||||||||
|
Premiums:
|
|||||||||||||||
|
Retail
|
$
|
45,805
|
|
$
|
39,452
|
|
$
|
6,353
|
|
16.1
|
%
|
||||
|
Group
|
6,569
|
|
6,456
|
|
113
|
|
1.8
|
%
|
|||||||
|
Other Businesses
|
35
|
|
51
|
|
(16
|
)
|
(31.4
|
)%
|
|||||||
|
Total premiums
|
52,409
|
|
45,959
|
|
6,450
|
|
14.0
|
%
|
|||||||
|
Services:
|
|||||||||||||||
|
Retail
|
9
|
|
39
|
|
(30
|
)
|
(76.9
|
)%
|
|||||||
|
Group
|
698
|
|
763
|
|
(65
|
)
|
(8.5
|
)%
|
|||||||
|
Healthcare Services
|
685
|
|
1,353
|
|
(668
|
)
|
(49.4
|
)%
|
|||||||
|
Other Businesses
|
14
|
|
9
|
|
5
|
|
55.6
|
%
|
|||||||
|
Total services
|
1,406
|
|
2,164
|
|
(758
|
)
|
(35.0
|
)%
|
|||||||
|
Investment income
|
474
|
|
377
|
|
97
|
|
25.7
|
%
|
|||||||
|
Total revenues
|
54,289
|
|
48,500
|
|
5,789
|
|
11.9
|
%
|
|||||||
|
Operating expenses:
|
|||||||||||||||
|
Benefits
|
44,269
|
|
38,166
|
|
6,103
|
|
16.0
|
%
|
|||||||
|
Operating costs
|
7,318
|
|
7,639
|
|
(321
|
)
|
(4.2
|
)%
|
|||||||
|
Depreciation and amortization
|
355
|
|
333
|
|
22
|
|
6.6
|
%
|
|||||||
|
Total operating expenses
|
51,942
|
|
46,138
|
|
5,804
|
|
12.6
|
%
|
|||||||
|
Income from operations
|
2,347
|
|
2,362
|
|
(15
|
)
|
(0.6
|
)%
|
|||||||
|
Gain on sale of business
|
270
|
|
—
|
|
270
|
|
100.0
|
%
|
|||||||
|
Interest expense
|
186
|
|
192
|
|
(6
|
)
|
(3.1
|
)%
|
|||||||
|
Income before income taxes
|
2,431
|
|
2,170
|
|
261
|
|
12.0
|
%
|
|||||||
|
Provision for income taxes
|
1,155
|
|
1,023
|
|
132
|
|
12.9
|
%
|
|||||||
|
Net income
|
$
|
1,276
|
|
$
|
1,147
|
|
$
|
129
|
|
11.2
|
%
|
||||
|
Diluted earnings per common share
|
$
|
8.44
|
|
$
|
7.36
|
|
$
|
1.08
|
|
14.7
|
%
|
||||
|
Benefit ratio (a)
|
84.5
|
%
|
83.0
|
%
|
1.5
|
%
|
|||||||||
|
Operating cost ratio (b)
|
13.6
|
%
|
15.9
|
%
|
(2.3
|
)%
|
|||||||||
|
Effective tax rate
|
47.5
|
%
|
47.2
|
%
|
0.3
|
%
|
|||||||||
|
(a)
|
Represents total benefits expense as a percentage of premiums revenue.
|
|
(b)
|
Represents total operating costs, excluding depreciation and amortization, as a percentage of total revenues less investment income.
|
Summary
Net income was
$1.3 billion
, or
$8.44
per diluted common share, in
2015
compared to
$1.1 billion
, or
$7.36
per diluted common share, in
2014
. The completion of the sale of Concentra on June 1, 2015 resulted in an after-tax gain of $1.57 per diluted common share in 2015. Excluding the impact of the sale of Concentra, the decrease primarily was
58
due to a decline in Retail segment pretax results, including expense of
$0.74
per diluted common share for a premium deficiency reserve for certain of our individual commercial medical products for the 2016 coverage year, and an increase in the effective tax rate as discussed below. These items were partially offset by year-over-year improvement in the Group and Healthcare Services segment pretax results and higher investment income. In addition,
2015
includes expenses of $0.14 per diluted common share for transaction costs associated with the Merger, certain of which were not deductible for tax purposes. Net income for
2014
includes expenses of $0.15 per diluted common share associated with a loss on extinguishment of debt for the redemption of certain senior notes in
2014
. Year-over-year comparisons of diluted earnings per common share are also favorably impacted by a lower number of shares used to compute diluted earnings per common share in
2015
reflecting the impact of share repurchases.
Premiums Revenue
Consolidated premiums
increased
$6.5 billion
, or
14.0%
, from
2014
to
$52.4 billion
for
2015
primarily reflecting higher premiums in both the Retail and Group segments. These higher premiums were primarily driven by average membership growth in the Retail segment and an increase in fully-insured group commercial medical per member premiums in the Group segment.
Services Revenue
Consolidated services revenue
decreased
$758 million
, or
35.0%
, from
2014
to
$1.4 billion
for
2015
primarily due to the completion of the sale of Concentra on June 1, 2015 as well as the loss of certain large group ASO accounts as a result of continued discipline in pricing of services for self-funded accounts amid a highly competitive environment.
Investment Income
Investment income totaled
$474 million
for
2015
,
an increase
of
$97 million
from
2014
, primarily due to higher realized capital gains in 2015 as a result of the repositioning of our portfolio given recent market volatility and anticipated changes to interest rates, with higher average invested balances being substantially offset by lower interest rates.
Benefits Expense
Consolidated benefits expense was
$44.3 billion
for
2015
,
an increase
of
$6.1 billion
, or
16.0%
, from
2014
primarily due to an increase in the Retail segment mainly driven by higher average Medicare Advantage membership and individual commercial medical on-exchange and off-exchange membership in plans compliant with the Health Care Reform Law. As more fully described herein under the section entitled “Benefits Expense Recognition”, actuarial standards require the use of assumptions based on moderately adverse experience, which generally results in favorable reserve development, or reserves that are considered redundant. We experienced favorable medical claims reserve development related to prior fiscal years of
$236 million
in
2015
and
$518 million
in
2014
. The decline in prior-period medical claims reserve development year over-year primarily was due to Medicare Advantage and individual commercial medical claims development in the Retail segment as discussed further in the segment results of operations discussion that follows.
The consolidated benefit ratio for
2015
was
84.5%
,
an increase
of
150
basis points from
2014
primarily due to increases in the Retail segment, including the impact of recognizing a premium deficiency reserve for certain of our individual commercial medical products for the 2016 coverage year, and Group segment ratios as discussed in the segment results of operations discussion that follows. The increase in benefits expense associated with the recognition of the premium deficiency reserve increased the consolidated benefit ratio by approximately 30 basis points in 2015. Favorable prior-period medical claims reserve development decreased the consolidated benefit ratio by approximately 50 basis points in 2015 versus approximately 110 basis points in 2014.
Operating Costs
Consolidated operating costs
decreased
$321 million
, or
4.2%
, in
2015
compared to
2014
primarily due to cost management initiatives across all lines of business as well as the completion of the sale of Concentra on June 1, 2015, partially offset by increases in costs mandated by the Health Care Reform Law, including the non-deductible health insurance industry fee.
59
The consolidated operating cost ratio for
2015
was
13.6%
,
decreasing
230
basis points from
2014
primarily due to decreases in the operating cost ratios in the Group and Retail segments reflecting cost management initiatives, as well as the completion of the sale of Concentra on June 1, 2015. Concentra carried a higher operating cost ratio.
Depreciation and Amortization
Depreciation and amortization for
2015
totaled
$355 million
, increasing
$22 million
, or
6.6%
from
2014
, reflecting higher depreciation expense from capital expenditures.
Interest Expense
Interest expense was
$186 million
for
2015
compared to
$192 million
for
2014
,
a decrease
of
$6 million
, or
3.1%
, primarily reflecting a higher average long-term debt balance due to the issuance of senior notes in September 2014, partially offset by the recognition of a loss on extinguishment of debt of approximately
$37 million
in October 2014 for the redemption of our $500 million 6.45% senior unsecured notes due June 1, 2016.
Income Taxes
Our effective tax rate during
2015
was
47.5%
compared to the effective tax rate of
47.2%
in
2014
. The increase in the effective tax rate primarily was due to an increase in the non-deductible health insurance industry fee from 2014, substantially offset by the favorable tax effect of the gain on the sale of Concentra. See Note 11 to the consolidated financial statements included in Item 8. – Financial Statements and Supplementary Data for a complete reconciliation of the federal statutory rate to the effective tax rate.
Retail Segment
|
|
|
Change
|
||||||||||
|
|
2015
|
2014
|
Members
|
Percentage
|
||||||||
|
Membership:
|
||||||||||||
|
Medical membership:
|
||||||||||||
|
Individual Medicare Advantage
|
2,753,400
|
|
2,427,900
|
|
325,500
|
|
13.4
|
%
|
||||
|
Group Medicare Advantage
|
484,100
|
|
489,700
|
|
(5,600
|
)
|
(1.1
|
)%
|
||||
|
Medicare stand-alone PDP
|
4,557,900
|
|
3,994,000
|
|
563,900
|
|
14.1
|
%
|
||||
|
Total Retail Medicare
|
7,795,400
|
|
6,911,600
|
|
883,800
|
|
12.8
|
%
|
||||
|
Individual commercial
|
899,100
|
|
1,016,200
|
|
(117,100
|
)
|
(11.5
|
)%
|
||||
|
State-based Medicaid
|
373,700
|
|
316,800
|
|
56,900
|
|
18.0
|
%
|
||||
|
Medicare Supplement
|
158,600
|
|
131,900
|
|
26,700
|
|
20.2
|
%
|
||||
|
Total Retail medical members
|
9,226,800
|
|
8,376,500
|
|
850,300
|
|
10.2
|
%
|
||||
|
Individual specialty membership (a)
|
1,153,100
|
|
1,165,800
|
|
(12,700
|
)
|
(1.1
|
)%
|
||||
|
(a)
|
Specialty products include dental, vision, and other supplemental health and financial protection products. Members included in these products may not be unique to each product since members have the ability to enroll in multiple products.
|
60
|
|
|
Change
|
|||||||||||||
|
|
2015
|
2014
|
Dollars
|
Percentage
|
|||||||||||
|
|
(in millions)
|
|
|||||||||||||
|
Premiums and Services Revenue:
|
|||||||||||||||
|
Premiums:
|
|||||||||||||||
|
Individual Medicare Advantage
|
$
|
29,526
|
|
$
|
25,782
|
|
$
|
3,744
|
|
14.5
|
%
|
||||
|
Group Medicare Advantage
|
5,588
|
|
5,490
|
|
98
|
|
1.8
|
%
|
|||||||
|
Medicare stand-alone PDP
|
3,846
|
|
3,404
|
|
442
|
|
13.0
|
%
|
|||||||
|
Total Retail Medicare
|
38,960
|
|
34,676
|
|
4,284
|
|
12.4
|
%
|
|||||||
|
Individual commercial
|
3,939
|
|
3,020
|
|
919
|
|
30.4
|
%
|
|||||||
|
State-based Medicaid
|
2,341
|
|
1,255
|
|
1,086
|
|
86.5
|
%
|
|||||||
|
Medicare Supplement
|
304
|
|
245
|
|
59
|
|
24.1
|
%
|
|||||||
|
Individual specialty
|
261
|
|
256
|
|
5
|
|
2.0
|
%
|
|||||||
|
Total premiums
|
45,805
|
|
39,452
|
|
6,353
|
|
16.1
|
%
|
|||||||
|
Services
|
9
|
|
39
|
|
(30
|
)
|
(76.9
|
)%
|
|||||||
|
Total premiums and services revenue
|
$
|
45,814
|
|
$
|
39,491
|
|
$
|
6,323
|
|
16.0
|
%
|
||||
|
Income before income taxes
|
$
|
930
|
|
$
|
1,339
|
|
$
|
(409
|
)
|
(30.5
|
)%
|
||||
|
Benefit ratio
|
86.7
|
%
|
84.9
|
%
|
1.8
|
%
|
|||||||||
|
Operating cost ratio
|
11.2
|
%
|
11.6
|
%
|
(0.4
|
)%
|
|||||||||
Pretax Results
|
•
|
Retail segment pretax income was
$930 million
in
2015
,
a decrease
of
$409 million
, or
30.5%
, compared to
2014
primarily driven by an increase in the benefit ratio for 2015, including the impact of recognizing a premium deficiency reserve of approximately
$176 million
for certain of our individual commercial medical products for the 2016 coverage year, partially offset by a decline in the operating cost ratio, Medicare Advantage membership growth, and higher investment income year-over-year.
|
Enrollment
|
•
|
Individual Medicare Advantage membership
increased
325,500
members, or
13.4%
, from December 31,
2014
to December 31,
2015
reflecting net membership additions, particularly for our HMO offerings, for the
2015
plan year.
|
|
•
|
Group Medicare Advantage membership
decreased
5,600
members, or
1.1%
, from December 31,
2014
to December 31,
2015
.
|
|
•
|
Medicare stand-alone PDP membership
increased
563,900
members, or
14.1%
, from December 31,
2014
to December 31,
2015
reflecting net membership additions, primarily for our Humana-Walmart plan offering, for the 2015 plan year.
|
|
•
|
Individual commercial medical membership
decreased
117,100
members, or
11.5%
, from December 31,
2014
to December 31,
2015
primarily reflecting the loss of approximately 150,000 members due to termination by CMS for lack of proper eligibility documentation from the member as well as the loss of members who had subscribed to plans that were not compliant with the Health Care Reform Law. These declines were partially offset by an increase in membership in plans that are compliant with the Health Care Reform Law, primarily off-exchange
|
|
•
|
State-based Medicaid membership
increased
56,900
members, or
18.0%
, from December 31,
2014
to December 31,
2015
primarily driven by the addition of members under our Florida Medicaid contract.
|
61
|
•
|
Individual specialty membership
decreased
12,700
members, or
1.1%
, from December 31,
2014
to December 31,
2015
primarily driven by a membership decline in supplemental health and financial protection product and vision offerings.
|
Premiums revenue
|
•
|
Retail segment premiums
increased
$6.4 billion
, or
16.1%
, from
2014
to
2015
primarily due to membership growth across our Medicare Advantage, state-based Medicaid, and Medicare stand-alone PDP lines of business, as well as a heavier percentage of individual commercial medical business in higher premium plans compliant with the Health Care Reform Law. Average Medicare Advantage membership increased
11.8%
in
2015
.
|
Benefits expense
|
•
|
The Retail segment benefit ratio of
86.7%
for
2015
increased
180
basis points from
2014
primarily due to higher than expected medical costs as compared to the assumptions used in our pricing, the recognition of a premium deficiency reserve in the fourth quarter of 2015 for certain of our individual commercial medical products for the 2016 coverage year, and unfavorable year-over-year comparisons of prior-period medical claims reserve development as discussed below. In addition, the increase reflects higher benefit ratios associated with a greater number of members from state-based contracts and the impact of the change in estimate for the 2014 net 3Rs receivables in 2015. These items were partially offset by the impact of the increase in the health insurance industry fee included in the pricing of our products. In addition, the 2015 period was favorably impacted by the release of reserves for future policy benefits as individual commercial medical members transitioned to plans compliant with the Health Care Reform Law.
|
|
•
|
We experienced higher than expected medical costs as compared to the assumptions used in our pricing for 2015 primarily due to lower-than-expected 2015 Medicare Advantage financial claim recovery levels and lower-than-anticipated reductions in inpatient admissions. In addition, medical claims associated with certain individual commercial medical products, in particular products compliant with the Health Care Reform Law, exceeded the assumptions used when we set pricing for 2015. We took a number of actions in 2015 to improve the profitability of our individual commercial medical business in 2016. These actions were subject to regulatory restrictions in certain geographies and included premium increases for the 2016 coverage year related generally to the first half of 2015 claims experience, the discontinuation of certain products as well as exit of certain markets for 2016, network improvements, enhancements to claims and clinical processes and administrative cost control. Despite these actions, the deterioration in the second half of 2015 claims experience together with 2016 open enrollment results indicating the retention of many high-utilizing members for 2016 resulted in a probable future loss. As a result of our assessment of the profitability of our individual medical policies compliant with the Health Care Reform Law, in the fourth quarter of 2015, we recorded a provision for probable future losses (premium deficiency reserve) for the 2016 coverage year of $176 million. The increase in benefits expense associated with the recognition of the premium deficiency reserve increased the Retail segment benefit ratio by approximately 40 basis points in 2015.
|
|
•
|
The Retail segment’s benefits expense for
2015
included the beneficial effect of
$228 million
in favorable prior-year medical claims reserve development versus
$488 million
in
2014
. This favorable prior-year medical claims reserve development
decreased
the Retail segment benefit ratio by approximately
50
basis points in
2015
versus approximately
120
basis points in
2014
. The year-over-year decline in prior-period medical claims reserve development primarily was due to the impact of lower financial claim recoveries due in part to our gradual implementation during 2014 of inpatient authorization review prior to admission as opposed to post adjudication, as well as higher than expected flu associated claims from the fourth quarter of 2014 and continued volatility in claims associated with individual commercial medical products.
|
Operating costs
|
•
|
The Retail segment operating cost ratio of
11.2%
for
2015
decreased
40
basis points from
2014
primarily reflecting administrative cost efficiencies associated with medical membership growth in the segment and other discretionary cost reductions, partially offset by the increase in the non-deductible health insurance
|
62
industry fee. The non-deductible health insurance industry fee increased the operating cost ratio by approximately
160
basis points in
2015
as compared to 120 basis points in 2014.
Group Segment
|
|
|
Change
|
||||||||||
|
|
2015
|
2014
|
Members
|
Percentage
|
||||||||
|
Membership:
|
||||||||||||
|
Medical membership:
|
||||||||||||
|
Fully-insured commercial group
|
1,178,300
|
|
1,235,500
|
|
(57,200
|
)
|
(4.6
|
)%
|
||||
|
ASO
|
710,700
|
|
1,104,300
|
|
(393,600
|
)
|
(35.6
|
)%
|
||||
|
Military services
|
3,074,400
|
|
3,090,400
|
|
(16,000
|
)
|
(0.5
|
)%
|
||||
|
Total group medical members
|
4,963,400
|
|
5,430,200
|
|
(466,800
|
)
|
(8.6
|
)%
|
||||
|
Group specialty membership (a)
|
6,068,700
|
|
6,502,700
|
|
(434,000
|
)
|
(6.7
|
)%
|
||||
|
(a)
|
Specialty products include dental, vision, and voluntary benefit products. Members included in these products may not be unique to each product since members have the ability to enroll in multiple products.
|
|
|
|
Change
|
|||||||||||||
|
|
2015
|
2014
|
Dollars
|
Percentage
|
|||||||||||
|
|
(in millions)
|
|
|||||||||||||
|
Premiums and Services Revenue:
|
|||||||||||||||
|
Premiums:
|
|||||||||||||||
|
Fully-insured commercial group
|
$
|
5,493
|
|
$
|
5,339
|
|
$
|
154
|
|
2.9
|
%
|
||||
|
Group specialty
|
1,055
|
|
1,098
|
|
(43
|
)
|
(3.9
|
)%
|
|||||||
|
Military services
|
21
|
|
19
|
|
2
|
|
10.5
|
%
|
|||||||
|
Total premiums
|
6,569
|
|
6,456
|
|
113
|
|
1.8
|
%
|
|||||||
|
Services
|
698
|
|
763
|
|
(65
|
)
|
(8.5
|
)%
|
|||||||
|
Total premiums and services revenue
|
$
|
7,267
|
|
$
|
7,219
|
|
$
|
48
|
|
0.7
|
%
|
||||
|
Income before income taxes
|
$
|
258
|
|
$
|
151
|
|
$
|
107
|
|
70.9
|
%
|
||||
|
Benefit ratio
|
80.2
|
%
|
79.5
|
%
|
0.7
|
%
|
|||||||||
|
Operating cost ratio
|
24.0
|
%
|
26.5
|
%
|
(2.5
|
)%
|
|||||||||
Pretax Results
|
•
|
Group segment pretax income
increased
$107 million
, or
70.9%
, to
$258 million
in
2015
primarily reflecting improvement in the operating cost ratio partially offset by an increase in the benefit ratio as discussed below.
|
Enrollment
|
•
|
Fully-insured commercial group medical membership
decreased
57,200
members, or
4.6%
from December 31,
2014
reflecting lower membership in both large and small group accounts.
|
|
•
|
Group ASO commercial medical membership
decreased
393,600
members, or
35.6%
, from December 31,
2014
to December 31,
2015
primarily due to the loss of certain large group accounts as a result of continued discipline in pricing of services for self-funded accounts amid a highly competitive environment.
|
|
•
|
Group specialty membership
decreased
434,000
members, or
6.7%
, from December 31,
2014
to December 31,
2015
primarily due to the loss of certain fully-insured group medical accounts that also had specialty coverage.
|
63
Premiums revenue
|
•
|
Group segment premiums
increased
$113.0 million
, or
1.8%
, from
2014
to
2015
primarily due to an increase in fully-insured commercial medical per member premiums partially offset by a net decline in fully-insured commercial medical membership.
|
Benefits expense
|
•
|
The Group segment benefit ratio
increased
70
basis points from
79.5%
in
2014
to
80.2%
in
2015
primarily reflecting the impact of higher specialty drug costs, net of rebates, as well as higher outpatient costs and lower prior-period medical claims reserve development, partially offset by an increase in the non-deductible health insurance industry fee included in the pricing of our products.
|
|
•
|
The Group segment’s benefits expense included the beneficial effect of
$7 million
in favorable prior-year medical claims reserve development versus
$29 million
in
2014
. This favorable prior-year medical claims reserve development
decreased
the Group segment benefit ratio by approximately
10
basis points in
2015
versus approximately
40
basis points in
2014
. The year-over-year decline in favorable prior-period medical claims reserve development primarily was due to a relatively small number of higher severity claims in the 2015 period associated with prior periods.
|
Operating costs
|
•
|
The Group segment operating cost ratio of
24.0%
for 2015
decreased
250
basis points from
26.5%
for
2014
, reflecting a decline in our group ASO commercial medical membership which carries a higher operating cost ratio than our fully-insured commercial medical membership, as well as operating cost efficiencies associated with our fully-insured business. Operating cost efficiencies were the result of both sustainable cost reduction initiatives and discretionary reductions. These declines were partially offset by the impact of an increase in the non-deductible health insurance industry fee. The non-deductible health insurance industry fee increased the operating cost ratio by approximately 140 basis points in 2015 as compared to 100 basis points in 2014.
|
Healthcare Services Segment
|
|
|
Change
|
|||||||||||||
|
|
2015
|
2014
|
Dollars
|
Percentage
|
|||||||||||
|
|
(in millions)
|
|
|||||||||||||
|
Revenues:
|
|||||||||||||||
|
Services:
|
|||||||||||||||
|
Provider services
|
$
|
515
|
|
$
|
1,147
|
|
$
|
(632
|
)
|
(55.1
|
)%
|
||||
|
Home based services
|
140
|
|
107
|
|
33
|
|
30.8
|
%
|
|||||||
|
Pharmacy solutions
|
30
|
|
99
|
|
(69
|
)
|
(69.7
|
)%
|
|||||||
|
Total services revenues
|
685
|
|
1,353
|
|
(668
|
)
|
(49.4
|
)%
|
|||||||
|
Intersegment revenues:
|
|||||||||||||||
|
Pharmacy solutions
|
20,551
|
|
16,905
|
|
3,646
|
|
21.6
|
%
|
|||||||
|
Provider services
|
1,291
|
|
1,149
|
|
142
|
|
12.4
|
%
|
|||||||
|
Home based services
|
875
|
|
585
|
|
290
|
|
49.6
|
%
|
|||||||
|
Clinical programs
|
203
|
|
208
|
|
(5
|
)
|
(2.4
|
)%
|
|||||||
|
Total intersegment revenues
|
22,920
|
|
18,847
|
|
4,073
|
|
21.6
|
%
|
|||||||
|
Total services and intersegment revenues
|
$
|
23,605
|
|
$
|
20,200
|
|
$
|
3,405
|
|
16.9
|
%
|
||||
|
Income before income taxes
|
$
|
981
|
|
$
|
738
|
|
$
|
243
|
|
32.9
|
%
|
||||
|
Operating cost ratio
|
95.2
|
%
|
95.6
|
%
|
(0.4
|
)%
|
|||||||||
64
Pretax results
|
•
|
Healthcare Services segment pretax income of
$981 million
for
2015
increased
$243 million
, or
32.9%
, from
2014
primarily due to higher earnings from our pharmacy solutions and home based services businesses as they serve our growing Medicare membership.
|
Script Volume
|
•
|
Humana Pharmacy Solutions
®
script volumes for the Retail and Group segment membership increased to approximately
398 million
in
2015
,
up
21%
versus scripts of approximately
329 million
in
2014
. The increase primarily reflects growth associated with higher average medical membership for
2015
than in
2014
.
|
Services revenue
|
•
|
Services revenue for
2015
decreased
$668 million
, or
49.4%
from
2014
, to
$685 million
for
2015
, primarily due to the completion of the sale of Concentra on June 1, 2015.
|
Intersegment revenues
|
•
|
Intersegment revenues
increased
$4.1 billion
, or
21.6%
, from
2014
to
$22.9 billion
for
2015
primarily due to growth in our Medicare membership which resulted in higher utilization of our Healthcare Services segment businesses.
|
Operating costs
|
•
|
The Healthcare Services segment operating cost ratio of
95.2%
for
2015
decreased
40
basis points from
95.6%
for
2014
primarily due to lower operating costs in our pharmacy business together with discretionary cost reductions across the segment, partially offset by the increasing percentage of pharmacy business associated with lower margin specialty drugs. Improving operating efficiency in the pharmacy business was primarily driven by lower cost of goods associated with increased purchasing scale and lower cost-to-fill primarily due to improvements in technology.
|
Liquidity
Historically, our primary sources of cash have included receipts of premiums, services revenue, and investment and other income, as well as proceeds from the sale or maturity of our investment securities, borrowings, and proceeds from sales of businesses. Our primary uses of cash historically have included disbursements for claims payments, operating costs, interest on borrowings, taxes, purchases of investment securities, acquisitions, capital expenditures, repayments on borrowings, dividends, and share repurchases. Because premiums generally are collected in advance of claim payments by a period of up to several months, our business normally should produce positive cash flows during periods of increasing premiums and enrollment. Conversely, cash flows would be negatively impacted during periods of decreasing premiums and enrollment. From period to period, our cash flows may also be affected by the timing of working capital items including premiums receivable, benefits payable, and other receivables and payables. Our cash flows are impacted by the timing of payments to and receipts from CMS associated with Medicare Part D subsidies for which we do not assume risk. The use of operating cash flows may be limited by regulatory requirements of state departments of insurance (or comparable state regulators) which require, among other items, that our regulated subsidiaries maintain minimum levels of capital and seek approval before paying dividends from the subsidiaries to the parent. Our use of operating cash flows derived from our non-insurance subsidiaries, such as in our Healthcare Services segment, is generally not restricted by state departments of insurance (or comparable state regulators).
The effect of the commercial risk adjustment, risk corridor, and reinsurance provisions of the Health Care Reform Law impact the timing of our operating cash flows, as we build receivables for each coverage year that are expected to be collected in subsequent coverage years.
During 2016, net collections under the 3Rs associated with prior coverage years were
$383 million
. We expect to collect the remaining
$54 million
of reinsurance recoverables related to prior coverage years in 2017.
On November 10, 2016, the U.S. Court of Federal Claims ruled in favor of the government in one of a series of cases filed by insurers, unrelated to us, against HHS to collect risk corridor payments, rejecting all
65
of the insurer’s statutory, contract and Constitutional claims for payment. On November 18, 2016, HHS issued a memorandum indicating a significant funding shortfall for the 2015 coverage year, the second consecutive year of significant shortfalls. Given the successful challenge of the risk corridor provisions in court, Congressional inquiries into the funding of the risk corridor program, and significant funding shortfalls under the first two years of the program, during the fourth quarter of 2016 we wrote-off
$583 million
in risk corridor receivables outstanding as of September 30, 2016, including
$415 million
associated with the 2014 and 2015 coverage years. From inception of the risk corridor program through December 31, 2016, we collected approximately
$36 million
from CMS for risk corridor receivables associated with the 2014 coverage year funded by HHS in accordance with previous guidance, utilizing funds HHS collected from us and other carriers under the 2014 and 2015 risk corridor program.
The remaining net receivable balance associated with the 3Rs was approximately
$456 million
at December 31,
2016
, including the
$54 million
related to the
2015
coverage year, as compared to
$982 million
at December 31,
2015
. Any amounts receivable or payable associated with these risk limiting programs may have an impact on subsidiary liquidity, with any temporary shortfalls funded by the parent company.
For additional information on our liquidity risk, please refer to Item 1A. – Risk Factors in this
2016
Form 10-K.
Cash and cash equivalents
increased
to
$3.9 billion
at December 31,
2016
from
$2.6 billion
at December 31,
2015
. The change in cash and cash equivalents for the years ended December 31,
2016
,
2015
and
2014
is summarized as follows:
|
2016
|
2015
|
2014
|
|||||||||
|
|
(in millions)
|
||||||||||
|
Net cash provided by operating activities
|
$
|
1,936
|
|
$
|
868
|
|
$
|
1,618
|
|
||
|
Net cash (used in) provided by investing activities
|
(1,362
|
)
|
320
|
|
(63
|
)
|
|||||
|
Net cash provided by (used in) financing activities
|
732
|
|
(552
|
)
|
(758
|
)
|
|||||
|
Increase in cash and cash equivalents
|
$
|
1,306
|
|
$
|
636
|
|
$
|
797
|
|
||
Cash Flow from Operating Activities
The change in operating cash flows over the three year period primarily results from the corresponding change in the timing of working capital items, earnings, and enrollment activity as discussed below. The increase in operating cash flows in
2016
primarily was due to significantly favorable working capital items and higher earnings exclusive of the commercial risk corridor receivables write-off and the long-term care reserve strengthening in 2016, as well as the gain on sale of Concentra and the recognition of the premium deficiency reserve in 2015 discussed previously. The working capital changes year-over-year primarily reflect lower income tax payments, changes in the net receivable balance associated with the premium stabilization programs established under health care reform, or the 3R's, and the timing of payroll cycles resulting in one less payroll cycle in 2016, partially offset by the timing of payments for benefits expense.
The lower operating cash flows in 2015 primarily reflect the effect of significant growth in individual commercial medical and group Medicare Advantage membership in 2014 and changes in the timing of working capital items related to the growth in our pharmacy business.
The most significant drivers of changes in our working capital are typically the timing of payments of benefits expense and receipts for premiums. We illustrate these changes with the following summaries of benefits payable and receivables.
66
The detail of benefits payable was as follows at December 31,
2016
,
2015
and
2014
:
|
|
|
|
|
Change
|
|||||||||||||||||||
|
|
2016
|
2015
|
2014
|
2016
|
2015
|
2014
|
|||||||||||||||||
|
|
(in millions)
|
|
|||||||||||||||||||||
|
IBNR (1)
|
$
|
3,422
|
|
$
|
3,730
|
|
$
|
3,254
|
|
$
|
(308
|
)
|
$
|
476
|
|
$
|
668
|
|
|||||
|
Reported claims in process (2)
|
654
|
|
600
|
|
475
|
|
54
|
|
125
|
|
94
|
|
|||||||||||
|
Premium deficiency reserve (3)
|
—
|
|
176
|
|
—
|
|
(176
|
)
|
176
|
|
—
|
|
|||||||||||
|
Other benefits payable (4)
|
487
|
|
470
|
|
746
|
|
17
|
|
(276
|
)
|
(180
|
)
|
|||||||||||
|
Total benefits payable
|
$
|
4,563
|
|
$
|
4,976
|
|
$
|
4,475
|
|
$
|
(413
|
)
|
$
|
501
|
|
$
|
582
|
|
|||||
|
(1)
|
IBNR represents an estimate of benefits payable for claims incurred but not reported (IBNR) at the balance sheet date and includes unprocessed claim inventories. The level of IBNR is primarily impacted by membership levels, medical claim trends and the receipt cycle time, which represents the length of time between when a claim is initially incurred and when the claim form is received (i.e. a shorter time span results in a lower IBNR).
|
|
(2)
|
Reported claims in process represents the estimated valuation of processed claims that are in the post claim adjudication process, which consists of administrative functions such as audit and check batching and handling, as well as amounts owed to our pharmacy benefit administrator which fluctuate due to bi-weekly payments and the month-end cutoff.
|
|
(3)
|
Premium deficiency reserve recognized for our individual commercial medical business compliant with the Health Care Reform Law associated with the 2016 coverage year.
|
|
(4)
|
Other benefits payable include amounts owed to providers under capitated and risk sharing arrangements.
|
The
decrease
in benefits payable in
2016
largely was due to
a decrease
in IBNR, discussed further below, as well as the application of
2016
results to the premium deficiency reserve liability recognized in 2015 associated with our individual commercial medical products compliant with the Health Care Reform Law for the 2016 coverage year. There was no premium deficiency reserve liability at December 31, 2016. The increases in benefits payable in
2015
and
2014
largely were due to increases in IBNR as well as an
increase
in the amount of processed but unpaid claims due to our pharmacy benefit administrator, which fluctuates due to month-end cutoff. These items were partially offset by a decrease in amounts owed to providers under capitated and risk sharing arrangements in both 2015 and 2014, including the disbursement of a portion of our Medicare risk adjustment collections under our contractual obligations associated with our risk sharing arrangements. In addition, benefits payable in
2015
reflects the recognition of the premium deficiency reserve discussed previously.
IBNR decreased during
2016
primarily due to declines in group Medicare Advantage, individual commercial medical, and fully-insured commercial group medical membership in 2016. IBNR increased during 2015 primarily as a result of individual Medicare Advantage membership growth while during 2014 IBNR also increased as a result of individual Medicare Advantage membership growth as well as significant growth in individual commercial medical and group Medicare Advantage membership. As discussed previously, our cash flows are impacted by changes in enrollment. In 2014 (the first year plans compliant with the Health Care Reform Law were effective), membership in new fully-insured individual commercial medical plans compliant with the Health Care Reform Law grew as compared with much lower growth in membership in these plans in 2015 and a decline in membership in these plans in 2016. Similarly, growth in group Medicare Advantage membership in 2014 favorably impacted the 2014 cash flows while a decline in group Medicare Advantage membership in 2015 and more significantly in 2016, negatively impacted the 2015 and 2016 cash flows.
67
The detail of total net receivables was as follows at December 31,
2016
,
2015
and
2014
:
|
|
|
|
|
Change
|
|||||||||||||||||||
|
|
2016
|
2015
|
2014
|
2016
|
2015
|
2014
|
|||||||||||||||||
|
|
(in millions)
|
||||||||||||||||||||||
|
Medicare
|
$
|
787
|
|
$
|
765
|
|
$
|
664
|
|
$
|
22
|
|
$
|
101
|
|
$
|
88
|
|
|||||
|
Commercial and other
|
579
|
|
420
|
|
381
|
|
159
|
|
39
|
|
162
|
|
|||||||||||
|
Military services
|
32
|
|
77
|
|
106
|
|
(45
|
)
|
(29
|
)
|
19
|
|
|||||||||||
|
Allowance for doubtful accounts
|
(118
|
)
|
(101
|
)
|
(98
|
)
|
(17
|
)
|
(3
|
)
|
(27
|
)
|
|||||||||||
|
Total net receivables
|
$
|
1,280
|
|
$
|
1,161
|
|
$
|
1,053
|
|
119
|
|
108
|
|
242
|
|
||||||||
|
Reconciliation to cash flow statement:
|
|||||||||||||||||||||||
|
Provision for doubtful accounts
|
39
|
|
61
|
|
32
|
|
|||||||||||||||||
|
Change in receivables acquired,
held-for-sale, or disposed from sale of business |
—
|
|
11
|
|
(10
|
)
|
|||||||||||||||||
|
Change in receivables per cash flow
statement resulting in cash from operations |
$
|
158
|
|
$
|
180
|
|
$
|
264
|
|
||||||||||||||
As disclosed previously, on June 1, 2015, we completed the sale of our wholly owned subsidiary Concentra. Net receivables associated with Concentra were classified as held-for-sale at December 31, 2014 excluded from the table above for comparative purposes.
Medicare receivables are impacted by changes in revenue associated with individual and group Medicare membership changes as well as the timing of accruals and related collections associated with the CMS risk-adjustment model.
The increases in commercial and other receivables in
2016
as compared to
2015
primarily reflects an increase in our receivable associated with the commercial risk adjustment provision of the Health Care Reform Law. Similarly, excluding the effect of classifying Concentra receivables as held-for-sale at December 31, 2014, the increase in commercial and other receivables in
2014
primarily was due to the commercial risk adjustment provisions of the Health Care Reform Law which became effective in 2014.
Military services receivables at December 31,
2016
,
2015
, and
2014
primarily consist of administrative services only fees owed from the federal government for administrative services provided under our current TRICARE South Region contract.
Many provisions of the Health Care Reform Law became effective in 2014, including the commercial risk adjustment, risk corridor, and reinsurance provisions as well as the non-deductible health insurance industry fee. As discussed previously, the timing of payments and receipts associated with these provisions impact our operating cash flows as we build receivables for each coverage year that are expected to be collected in subsequent coverage years.
During 2016, net collections under the 3Rs associated with prior coverage years were
$383 million
as compared to net collections of
$417 million
in
2015
. There were no amounts collected in 2014, the first year of the programs. The net receivable balance associated with the 3Rs was approximately
$456 million
at December 31,
2016
, including certain amounts recorded in receivables as noted above. In
2016
, we paid the federal government
$916 million
for the annual health insurance industry fee compared to our payments of
$867 million
in
2015
and $
562 million
in
2014
.
In addition to the timing of payments of benefits expense, receipts for premiums and services revenues, and amounts due under the risk limiting and health insurance industry fee provisions of the Health Care Reform Law, other items impacting operating cash flows include income tax payments and the timing of payroll cycles resulting in one less payroll cycle in 2016 than in 2015.
68
Cash Flow from Investing Activities
Our ongoing capital expenditures primarily relate to our information technology initiatives, support of services in our provider services operations including medical and administrative facility improvements necessary for activities such as the provision of care to members, claims processing, billing and collections, wellness solutions, care coordination, regulatory compliance and customer service. Total capital expenditures, excluding acquisitions, were
$527 million
in
2016
,
$523 million
in
2015
, and
$528 million
in
2014
.
We reinvested a portion of our operating cash flows in investment securities, primarily investment-grade fixed income securities, totaling
$828 million
in
2016
.
Proceeds from sales and maturities of investment securities exceeded purchases by
$103 million
in
2015
and
$411 million
in
2014
. These net proceeds were used to fund normal working capital needs due to an increase in receivables associated with the 3Rs in addition to the timing of payments to and receipts from CMS associated with Medicare Part D reinsurance subsidies, as discussed below.
In 2015, we purchased a
$284 million
note receivable directly from a third-party bank syndicate related to the financing of
MCCI Holdings, LLC's business as described in Note 2 to the consolidated financial statements included in Item 8. – Financial Statements and Supplementary Data. The purchase of this note is included with purchases of investment securities in our consolidated statement of cash flows.
On June 1, 2015, we completed the sale of Concentra for approximately
$1,055 million
in cash, excluding approximately
$22 million
of transaction costs.
Cash consideration paid for acquisitions, net of cash acquired, was
$7 million
in
2016
,
$38 million
in
2015
, and
$18 million
in
2014
. Acquisitions in each year included health and wellness related acquisitions.
Cash Flow from Financing Activities
Our financing cash flows are significantly impacted by the timing of claims payments and the related receipts from CMS associated with Medicare Part D claim subsidies for which we do not assume risk. Monthly prospective payments from CMS for reinsurance and low-income cost subsidies are based on assumptions submitted with our annual bid. Settlement of the reinsurance and low-income cost subsidies is based on a reconciliation made approximately
9
months after the close of each calendar year.
Receipts from CMS associated with Medicare Part D claim subsidies for which we do not assume risk were
$1.1 billion
higher than claims payments
during
2016
. Conversely, claims payments were
$361 million
higher than receipts from CMS associated with Medicare Part D claims subsidies for which we do not assume risk during
2015
and
$945 million
higher during
2014
. In 2014 and 2015, we experienced higher specialty prescription drug costs associated with a new treatment for Hepatitis C than were contemplated in our bids which resulted in higher subsidy receivable balances in those years that were settled in 2015 and 2016, respectively, under the terms of our contracts with CMS. Our net receivable for CMS subsidies and brand name prescription drug discounts was
$0.9 billion
at December 31,
2016
compared to
$2.0 billion
at December 31,
2015
. Refer to Note 6 to the consolidated financial statements included in Item 8. – Financial Statements and Supplementary Data.
Under our administrative services only TRICARE South Region contract,
health care cost payments for which we do not assume risk exceeded reimbursements from the federal government
by
$25 million
in
2016
and by
$4 million
in
2015
. Reimbursements from the federal government equaled health care cost payments for which we do not assume risk in
2014
.
Claims payments associated with cost sharing provisions of the Health Care Reform Law for which we do not assume risk were
higher than reimbursements from HHS
by
$28 million
in
2016
and less than reimbursements by
$69 million
in
2015
and by
$26 million
in
2014
. See Note 2 to the consolidated financial statements included in Item 8. – Financial Statements and Supplementary Data for further description.
We repurchased
1.85 million
shares for
$329 million
in
2015
and
5.7 million
shares for
$730 million
in
2014
(excludes another $100 million held back pending final settlement of an accelerated stock repurchase plan in March 2015) under share repurchase plans authorized by the Board of Directors. We did not repurchase shares in 2016 due to restrictions under the Merger Agreement. We also acquired common shares in connection with employee stock plans for an aggregate cost of
$104 million
in
2016
,
$56 million
in
2015
, and
$42 million
in
2014
.
69
As discussed further below, we paid dividends to stockholders of
$177 million
in
2016
and
$172 million
in each of
2015
and
2014
.
We entered into a commercial paper program in October 2014. Net repayments of commercial paper were
$2 million
in
2016
and the maximum principal amount outstanding at any one time during
2016
was
$475 million
. Net proceeds from the issuance of commercial paper were
$298 million
in
2015
and the maximum principal amount outstanding at any one time during
2015
was
$414 million
. There were no net proceeds from the issuance of commercial paper in
2014
and the maximum principal amount outstanding at any one time during
2014
was
$175 million
.
In September 2014, we issued $400 million of 2.625% senior notes due October 1, 2019, $600 million of 3.85% senior notes due October 1, 2024 and $750 million of 4.95% senior notes due October 1, 2044.
Our net proceeds, reduced for the underwriters' discount and commission and offering expenses, were
$1.73 billion
. We used a portion of the net proceeds to redeem our $500 million 6.45% senior unsecured notes.
The remainder of the cash used in or provided by financing activities in
2016
,
2015
, and
2014
primarily resulted from proceeds from stock option exercises and the change in book overdraft.
Future Sources and Uses of Liquidity
Dividends
For a detailed discussion of dividends to stockholders, please refer to Note 15 to the consolidated financial statements included in Item 8. – Financial Statements and Supplementary Data.
Stock Repurchases
On February 14, 2017, we and Aetna agreed to mutually terminate the Merger Agreement, and also announced that the Board had approved a new authorization for share repurchases of up to
$2.25 billion
of our common stock exclusive of shares repurchased in connection with employee stock plans, expiring on December 31, 2017.
Under this new authorization, we expect to complete a $1.5 billion accelerated share repurchase program in the first quarter of 2017.
For a detailed discussion of stock repurchases, please refer to Note 15 to the consolidated financial statements included in Item 8. – Financial Statements and Supplementary Data.
For a detailed discussion of our debt, including our senior notes, credit agreement and commercial paper program, please refer to Note 15 to the consolidated financial statements included in Item 8. – Financial Statements and Supplementary Data.
Liquidity Requirements
We believe our cash balances, investment securities, operating cash flows, and funds available under our credit agreement and our commercial paper program or from other public or private financing sources, taken together, provide adequate resources to fund ongoing operating and regulatory requirements, acquisitions, future expansion opportunities, and capital expenditures for at least the next twelve months, as well as to refinance or repay debt, and repurchase shares.
Adverse changes in our credit rating may increase the rate of interest we pay and may impact the amount of credit available to us in the future. Our investment-grade credit rating at December 31,
2016
was
A-
according to Standard & Poor’s Rating Services, or S&P, and
Baa3
according to Moody’s Investors Services, Inc., or Moody’s. A downgrade by S&P to BB+ or by Moody’s to Ba1 triggers an interest rate increase of 25 basis points with respect to $750 million of our senior notes. Successive one notch downgrades increase the interest rate an additional 25 basis points, or annual interest expense by $2 million, up to a maximum 100 basis points, or annual interest expense by $8 million.
In addition, we operate as a holding company in a highly regulated industry. Humana Inc., our parent company, is dependent upon dividends and administrative expense reimbursements from our subsidiaries, most of which are subject to regulatory restrictions. We continue to maintain significant levels of aggregate excess statutory capital and surplus in our state-regulated operating subsidiaries. Cash, cash equivalents, and short-term investments at the parent company
70
increased to
$2.0 billion
at December 31,
2016
from
$1.6 billion
at December 31,
2015
. This increase primarily reflects operating cash derived from our non-insurance subsidiaries' profits partially offset by capital expenditures, payment of stockholder dividends, and common stock repurchases. Our use of operating cash derived from our non-insurance subsidiaries, such as our Healthcare Services segment, is generally not restricted by Departments of Insurance (or comparable state regulatory agencies). Our regulated subsidiaries paid dividends to the parent of
$763 million
in
2016
,
$493 million
in
2015
, and
$927 million
in
2014
. Subsidiary dividends in 2015 reflect the impact of losses for our individual commercial medical business compliant with the Health Care Reform Law and the November 5, 2015 revised statutory accounting guidance requiring the exclusion of risk corridor receivables from related statutory surplus. Refer to our parent company financial statements and accompanying notes in Schedule I - Parent Company Financial Information.
Excluding Puerto Rico subsidiaries, the amount of ordinary dividends that may be paid to our parent company in
2017
is approximately
$850 million
, in the aggregate. Actual dividends paid may vary due to consideration of excess statutory capital and surplus and expected future surplus requirements related to, for example, premium volume and product mix.
Our parent company funded a subsidiary capital contribution of approximately
$535 million
in the first quarter of 2017 for reserve strengthening associated with our closed block of long-term care insurance policies discussed further in Note 18 to the consolidated financial statements included in Item 8. – Financial Statements and Supplementary Data.
In
2016
, we paid the federal government
$916 million
for the annual health insurance industry fee.
The Consolidated Appropriations Act, 2016, enacted on December 18, 2015, included a one-time one year suspension in 2017 of the health insurer fee.
Regulatory Requirements
For a detailed discussion of our regulatory requirements, including aggregate statutory capital and surplus as well as dividends paid from the subsidiaries to the parent, please refer to Note 15 to the consolidated financial statements included in Item 8. – Financial Statements and Supplementary Data.
Contractual Obligations
We are contractually obligated to make payments for years subsequent to December 31,
2016
as follows:
|
|
Payments Due by Period
|
|||||||||||||||||||
|
|
Total
|
Less than
1 Year |
1-3 Years
|
3-5 Years
|
More than
5 Years |
|||||||||||||||
|
|
(in millions)
|
|||||||||||||||||||
|
Debt
|
$
|
4,100
|
|
$
|
300
|
|
$
|
1,200
|
|
$
|
—
|
|
$
|
2,600
|
|
|||||
|
Interest (1)
|
2,354
|
|
188
|
|
283
|
|
236
|
|
1,647
|
|
||||||||||
|
Operating leases (2)
|
697
|
|
185
|
|
283
|
|
134
|
|
95
|
|
||||||||||
|
Purchase obligations (3)
|
348
|
|
184
|
|
156
|
|
7
|
|
1
|
|
||||||||||
|
Future policy benefits payable and other long-term liabilities (4)
|
3,279
|
|
93
|
|
453
|
|
215
|
|
2,518
|
|
||||||||||
|
Total
|
$
|
10,778
|
|
$
|
950
|
|
$
|
2,375
|
|
$
|
592
|
|
$
|
6,861
|
|
|||||
|
(1)
|
Interest includes the estimated contractual interest payments under our debt agreements.
|
|
(2)
|
We lease facilities, computer hardware, and other furniture and equipment under long-term operating leases that are noncancelable and expire on various dates through
2037
. We sublease facilities or partial facilities to third party tenants for space not used in our operations which partially mitigates our operating lease commitments. An operating lease is a type of off-balance sheet arrangement. Assuming we acquired the asset, rather than leased such asset, we would have recognized a liability for the financing of these assets. See also Note 16 to the consolidated financial statements included in Item 8. – Financial Statements and Supplementary Data.
|
71
|
(3)
|
Purchase obligations include agreements to purchase services, primarily information technology related services, or to make improvements to real estate, in each case that are enforceable and legally binding on us and that specify all significant terms, including: fixed or minimum levels of service to be purchased; fixed, minimum or variable price provisions; and the appropriate timing of the transaction. Purchase obligations exclude agreements that are cancelable without penalty.
|
|
(4)
|
Includes future policy benefits payable ceded to third parties through 100% coinsurance agreements as more fully described in Note 19 to the consolidated financial statements included in Item 8. – Financial Statements and Supplementary Data. We expect the assuming reinsurance carriers to fund these obligations and reflected these amounts as reinsurance recoverables included in other long-term assets on our consolidated balance sheet. Amounts payable in less than one year are included in trade accounts payable and accrued expenses in the consolidated balance sheet.
|
Off-Balance Sheet Arrangements
As of December 31,
2016
, we were not involved in any special purpose entity, or SPE, transactions. For a detailed discussion of off-balance sheet arrangements, please refer to Note 16 to the consolidated financial statements included in Item 8. – Financial Statements and Supplementary Data.
Guarantees and Indemnifications
For a detailed discussion of our guarantees and indemnifications, please refer to Note 16 to the consolidated financial statements included in Item 8. – Financial Statements and Supplementary Data.
Government Contracts
For a detailed discussion of our government contracts, including our Medicare, Military, and Medicaid contracts, please refer to Note 16 to the consolidated financial statements included in Item 8. – Financial Statements and Supplementary Data.
Other
On February 14, 2017, we and Aetna agreed to mutually terminate the Merger Agreement, as our Board determined that an appeal of the Court's ruling would not be in the best interest of our stockholders.
Under terms of the Merger Agreement, we are entitled to a breakup fee of
$1 billion
.
Under state guaranty assessment laws, including those related to state cooperative failures in the industry, we may be assessed (up to prescribed limits) for certain obligations to the policyholders and claimants of insolvent insurance companies that write the same line or lines of business as we do. Penn Treaty is a financially distressed unaffiliated long-term care insurance company. A final court ruling on Penn Treaty's insolvency would trigger a guarantee fund assessment that would result in expense for us, based on current information, estimated at approximately $30 million.
Critical Accounting Policies and Estimates
The discussion and analysis of our financial condition and results of operations is based upon our consolidated financial statements and accompanying notes, which have been prepared in accordance with accounting principles generally accepted in the United States of America. The preparation of these financial statements and accompanying notes requires us to make estimates and assumptions that affect the amounts reported in the consolidated financial statements and accompanying notes. We continuously evaluate our estimates and those critical accounting policies primarily related to benefits expense and revenue recognition as well as accounting for impairments related to our investment securities, goodwill, and long-lived assets. These estimates are based on knowledge of current events and anticipated future events and, accordingly, actual results ultimately may differ from those estimates. We believe the following critical accounting policies involve the most significant judgments and estimates used in the preparation of our consolidated financial statements.
72
Benefits Expense Recognition
Benefits expense is recognized in the period in which services are provided and includes an estimate of the cost of services which have been incurred but not yet reported, or IBNR. IBNR represents a substantial portion of our benefits payable as follows:
|
December 31, 2016
|
Percentage
of Total
|
December 31, 2015
|
Percentage
of Total
|
||||||||||
|
|
(dollars in millions)
|
||||||||||||
|
IBNR
|
$
|
3,422
|
|
75.0
|
%
|
$
|
3,730
|
|
75.0
|
%
|
|||
|
Reported claims in process
|
654
|
|
14.3
|
%
|
600
|
|
12.1
|
%
|
|||||
|
Premium deficiency reserve
|
—
|
|
—
|
%
|
176
|
|
3.5
|
%
|
|||||
|
Other benefits payable
|
487
|
|
10.7
|
%
|
470
|
|
9.4
|
%
|
|||||
|
Total benefits payable
|
$
|
4,563
|
|
100.0
|
%
|
$
|
4,976
|
|
100.0
|
%
|
|||
Our reserving practice is to consistently recognize the actuarial best point estimate within a level of confidence required by actuarial standards. For further discussion of our reserving methodology, including our use of completion and claims per member per month trend factors to estimate IBNR, refer to Note 2 to the consolidated financial statements included in Item 8. – Financial Statements and Supplementary Data.
The completion and claims per member per month trend factors are the most significant factors impacting the IBNR estimate. The portion of IBNR estimated using completion factors for claims incurred prior to the most recent two months is generally less variable than the portion of IBNR estimated using trend factors. The following table illustrates the sensitivity of these factors assuming moderate adverse experience and the estimated potential impact on our operating results caused by reasonably likely changes in these factors based on December 31,
2016
data:
|
Completion Factor (a):
|
Claims Trend Factor (b):
|
|||||
|
Factor
Change (c) |
Decrease in
Benefits Payable |
Factor
Change (c) |
Decrease in
Benefits Payable |
|||
|
(dollars in millions)
|
||||||
|
0.60%
|
$(186)
|
(2.75)%
|
$(296)
|
|||
|
0.50%
|
$(155)
|
(2.50)%
|
$(269)
|
|||
|
0.40%
|
$(124)
|
(2.25)%
|
$(242)
|
|||
|
0.30%
|
$(93)
|
(2.00)%
|
$(215)
|
|||
|
0.20%
|
$(62)
|
(1.75)%
|
$(188)
|
|||
|
0.10%
|
$(31)
|
(1.50)%
|
$(162)
|
|||
|
—%
|
$—
|
(1.25)%
|
$(135)
|
|||
|
(a)
|
Reflects estimated potential changes in benefits payable at December 31,
2016
caused by changes in completion factors for incurred months prior to the most recent two months.
|
|
(b)
|
Reflects estimated potential changes in benefits payable at December 31,
2016
caused by changes in annualized claims trend used for the estimation of per member per month incurred claims for the most recent two months.
|
|
(c)
|
The factor change indicated represents the percentage point change.
|
The following table provides a historical perspective regarding the accrual and payment of our benefits payable, excluding military services. Components of the total incurred claims for each year include amounts accrued for current year estimated benefits expense as well as adjustments to prior year estimated accruals. Refer to Note 10 to the consolidated financial statements included in Item 8. – Financial Statements and Supplementary Data for Retail and Group segment tables including information about incurred and paid claims development as of
December 31, 2016
, net of reinsurance, as well as cumulative claim frequency and the total of IBNR included within the net incurred claims amounts.
73
|
2016
|
2015
|
2014
|
||||||||||
|
|
(in millions)
|
|||||||||||
|
Balances at January 1
|
$
|
4,976
|
|
$
|
4,475
|
|
$
|
3,893
|
|
|||
|
Less: Premium deficiency reserve
|
(176
|
)
|
—
|
|
—
|
|
||||||
|
Less: Reinsurance recoverables
|
(85
|
)
|
(78
|
)
|
—
|
|
||||||
|
Balances at January 1, net
|
4,715
|
|
4,397
|
|
3,893
|
|
||||||
|
Incurred related to:
|
||||||||||||
|
Current year
|
45,318
|
|
44,397
|
|
38,641
|
|
||||||
|
Prior years
|
(582
|
)
|
(236
|
)
|
(518
|
)
|
||||||
|
Total incurred
|
44,736
|
|
44,161
|
|
38,123
|
|
||||||
|
Paid related to:
|
||||||||||||
|
Current year
|
(40,852
|
)
|
(39,802
|
)
|
(34,357
|
)
|
||||||
|
Prior years
|
(4,112
|
)
|
(4,041
|
)
|
(3,262
|
)
|
||||||
|
Total paid
|
(44,964
|
)
|
(43,843
|
)
|
(37,619
|
)
|
||||||
|
Premium deficiency reserve
|
—
|
|
176
|
|
—
|
|
||||||
|
Reinsurance recoverable
|
76
|
|
85
|
|
78
|
|
||||||
|
Balances at December 31
|
$
|
4,563
|
|
$
|
4,976
|
|
$
|
4,475
|
|
|||
The following table summarizes the changes in estimate for incurred claims related to prior years attributable to our key assumptions. As previously described, our key assumptions consist of trend and completion factors estimated using an assumption of moderately adverse conditions. The amounts below represent the difference between our original estimates and the actual benefits expense ultimately incurred as determined from subsequent claim payments.
|
|
Favorable Development by Changes in Key Assumptions
|
|||||||||||||||||||
|
|
2016
|
2015
|
2014
|
|||||||||||||||||
|
|
Amount
|
Factor
Change (a) |
Amount
|
Factor
Change (a) |
Amount
|
Factor
Change (a) |
||||||||||||||
|
|
(dollars in millions)
|
|||||||||||||||||||
|
Trend factors
|
$
|
(316
|
)
|
(2.9
|
)%
|
$
|
(145
|
)
|
(1.5
|
)%
|
$
|
(266
|
)
|
(3.7
|
)%
|
|||||
|
Completion factors
|
(266
|
)
|
0.9
|
%
|
(91
|
)
|
0.4
|
%
|
(252
|
)
|
1.2
|
%
|
||||||||
|
Total
|
$
|
(582
|
)
|
$
|
(236
|
)
|
$
|
(518
|
)
|
|||||||||||
|
(a)
|
The factor change indicated represents the percentage point change.
|
As previously discussed, our reserving practice is to consistently recognize the actuarial best estimate of our ultimate liability for claims. Actuarial standards require the use of assumptions based on moderately adverse experience, which generally results in favorable reserve development, or reserves that are considered redundant. We experienced favorable medical claims reserve development related to prior fiscal years of
$582 million
in
2016
,
$236 million
in
2015
, and
$518 million
in
2014
. The table below details our favorable medical claims reserve development related to prior fiscal years by segment for
2016
,
2015
, and
2014
.
|
|
Favorable Medical Claims Reserve
Development |
Change
|
|||||||||||||||||
|
|
2016
|
2015
|
2014
|
2016
|
2015
|
||||||||||||||
|
|
(in millions)
|
||||||||||||||||||
|
Retail Segment
|
$
|
(535
|
)
|
$
|
(228
|
)
|
$
|
(488
|
)
|
$
|
(307
|
)
|
$
|
260
|
|
||||
|
Group Segment
|
(46
|
)
|
(7
|
)
|
(29
|
)
|
(39
|
)
|
22
|
|
|||||||||
|
Other Businesses
|
(1
|
)
|
(1
|
)
|
(1
|
)
|
—
|
|
—
|
|
|||||||||
|
Total
|
$
|
(582
|
)
|
$
|
(236
|
)
|
$
|
(518
|
)
|
$
|
(346
|
)
|
$
|
282
|
|
||||
74
The favorable medical claims reserve development for
2016
,
2015
, and
2014
primarily reflects the consistent application of trend and completion factors estimated using an assumption of moderately adverse conditions. Our favorable development for each of the years presented above is discussed further in Note 10 to the consolidated financial statements included in Item 8. – Financial Statements and Supplementary Data.
We continually adjust our historical trend and completion factor experience with our knowledge of recent events that may impact current trends and completion factors when establishing our reserves. Because our reserving practice is to consistently recognize the actuarial best point estimate using an assumption of moderately adverse conditions as required by actuarial standards, there is a reasonable possibility that variances between actual trend and completion factors and those assumed in our December 31,
2016
estimates would fall towards the middle of the ranges previously presented in our sensitivity table.
Benefits expense excluded from the previous table was as follows for the years ended December 31,
2016
,
2015
and
2014
:
|
2016
|
2015
|
2014
|
|||||||||
|
|
(in millions)
|
||||||||||
|
Premium deficiency reserve for short-duration policies
|
$
|
(176
|
)
|
$
|
176
|
|
$
|
—
|
|
||
|
Military services
|
8
|
|
12
|
|
11
|
|
|||||
|
Future policy benefits
|
439
|
|
(80
|
)
|
32
|
|
|||||
|
Total
|
$
|
271
|
|
$
|
108
|
|
$
|
43
|
|
||
In the fourth quarter of 2015, we recognized a premium deficiency reserve for our individual commercial medical business compliant with the Health Care Reform Law associated with the 2016 coverage year as discussed in more detail in Note 7
to the consolidated financial statements included in Item 8. – Financial Statements and Supplementary Data.
Military services benefits expense for each year in the table above reflect expenses associated with our contracts with the Veterans Administration.
The higher benefits expense associated with future policy benefits payable during 2016 primarily relates to reserve strengthening for our closed block of long-term care insurance policies acquired in connection with the 2007 KMG America Corporation, or KMG, acquisition more fully described
below and in Note 18 to the consolidated financial statements included in Item 8. – Financial Statements and Supplementary Data. Certain health policies sold to individuals prior to 2014 (the first year plans compliant with the Health Care Reform Law were effective) are accounted for as long-duration as more fully described below.
The decrease in benefits expense associated with future policy benefits payable in 2015 primarily reflects the release of reserves as individual commercial medical members transitioned to plans compliant with the Health Care Reform Law.
Future policy benefits payable of
$2.8 billion
and
$2.2 billion
at December 31,
2016
and
2015
, respectively, represent liabilities for long-duration insurance policies including long-term care insurance, life insurance, annuities, and certain health and other supplemental policies sold to individuals for which some of the premium received in the earlier years is intended to pay anticipated benefits to be incurred in future years. At policy issuance, these reserves are recognized on a net level premium method based on premium rate increase, interest rate, mortality, morbidity, persistency (the percentage of policies remaining in-force), and maintenance expense assumptions. Interest rates are based on our expected net investment returns on the investment portfolio supporting the reserves for these blocks of business. Mortality, a measure of expected death, and morbidity, a measure of health status, assumptions are based on published actuarial tables, modified based upon actual experience. The assumptions used to determine the liability for future policy benefits are established and locked in at the time each contract is issued and only change if our expected future experience deteriorates to the point that the level of the liability, together with the present value of future gross premiums, are not adequate to provide for future expected policy benefits and maintenance costs (i.e. the loss recognition date). Because these policies have long-term claim payout periods, there is a greater risk of significant variability in claims costs, either positive or negative. We perform loss recognition tests at least annually in the fourth quarter, and more frequently if adverse events or changes in circumstances indicate that the level of the liability, together with the present
75
value of future gross premiums, may not be adequate to provide for future expected policy benefits and maintenance costs.
Future policy benefits payable include
$2.2 billion
at December 31,
2016
and
$1.5 billion
at December 31,
2015
associated with a non-strategic closed block of long-term care insurance policies acquired in connection with the 2007 acquisition of KMG.
Approximately
30,800
policies remain in force as of December 31,
2016
. No new policies have been written since 2005 under this closed block.
Future policy benefits payable includes amounts charged to accumulated other comprehensive income for an additional liability that would exist on our closed-block of long-term care insurance policies if unrealized gains on the sale of the investments backing such products had been realized and the proceeds reinvested at then current yields. There was a
$77 million
additional liability at December 31,
2016
and no additional liability at December 31,
2015
. Amounts charged to accumulated other comprehensive income are net of applicable deferred taxes.
Long-term care insurance policies provide nursing home and home health coverage for which premiums are collected many years in advance of benefits paid, if any. Therefore, our actual claims experience will emerge many years after assumptions have been established. The risk of a deviation of the actual interest, morbidity, mortality, and maintenance expense assumptions from those assumed in our reserves are particularly significant to our closed block of long-term care insurance policies. A prolonged period during which interest rates remain at levels lower than those anticipated in our reserving would result in shortfalls in investment income on assets supporting our obligation under long term care policies because the long duration of the policy obligations exceeds the duration of the supporting investment assets. Further, we monitor the loss experience of these long-term care insurance policies and, when necessary, apply for premium rate increases through a regulatory filing and approval process in the jurisdictions in which such products were sold. To the extent premium rate increases, interest rates, and/or loss experience vary from our loss recognition date assumptions, future material adjustments to reserves could be required.
During 2016, we recorded a loss for a premium deficiency. The premium deficiency was based on current and anticipated experience that had deteriorated from our locked-in assumptions from the previous December 31, 2013 loss recognition date, particularly as they related to emerging experience indicating longer claims duration, a prolonged lower interest rate environment, and an increase in policyholder life expectancies. Based on this deterioration, we determined that our existing future policy benefits payable, together with the present value of future gross premiums, associated with our closed block of long-term care insurance policies were not adequate to provide for future policy benefits and maintenance costs under these policies; therefore we unlocked and modified our assumptions based on current expectations. Accordingly, during 2016 we recorded
$505 million
of additional benefits expense, with a corresponding increase in future policy benefits payable of
$659 million
partially offset by a related reinsurance recoverable of
$154 million
included in other long-term assets.
For our closed block of long-term care policies, actuarial assumptions used to estimate reserves are inherently uncertain due to the potential changes in trends in mortality, morbidity, persistency and interest rates as well as premium rate increases. As a result, our long term care reserves may be subject to material increases if these trends develop adversely to our expectations. The estimated increase in reserves and additional benefit expense from hypothetically modeling adverse variations in our actuarial assumptions, in the aggregate, could be up to
$250 million
, net of reinsurance. Although such hypothetical revisions are not currently appropriate, we believe they could occur based on past variances in experience and our expectation of the ranges of future experience that could reasonably occur, and any such revision could be material. Generally accepted accounting principles do not allow us to unlock our assumptions for favorable items.
In addition, future policy benefits payable includes amounts of
$201 million
at December 31,
2016
,
$205 million
at December 31,
2015
, and
$210 million
at December 31,
2014
which are subject to 100% coinsurance agreements as more fully described in Note 19 to the consolidated financial statements included in Item 8. – Financial Statements and Supplementary Data, and as such are offset by a related reinsurance recoverable included in other long-term assets.
76
Revenue Recognition
We generally establish one-year commercial membership contracts with employer groups, subject to cancellation by the employer group on 30-day written notice. Our Medicare contracts with CMS renew annually. Our military services contracts with the federal government and our contracts with various state Medicaid programs generally are multi-year contracts subject to annual renewal provisions.
Our commercial contracts establish rates on a per employee basis for each month of coverage based on the type of coverage purchased (single to family coverage options). Our Medicare and Medicaid contracts also establish monthly rates per member. However, our Medicare contracts also have additional provisions as outlined in the following separate section.
Premiums revenue and administrative services only, or ASO, fees are estimated by multiplying the membership covered under the various contracts by the contractual rates. In addition, we adjust revenues for estimated changes in an employer’s enrollment and individuals that ultimately may fail to pay, and for estimated rebates under the minimum benefit ratios required under the Health Care Reform Law. Enrollment changes not yet processed or not yet reported by an employer group or the government, also known as retroactive membership adjustments, are estimated based on available data and historical trends. We routinely monitor the collectibility of specific accounts, the aging of receivables, historical retroactivity trends, estimated rebates, as well as prevailing and anticipated economic conditions, and reflect any required adjustments in the current period’s revenue.
We bill and collect premium from employer groups and members in our Medicare and other individual products monthly. We receive monthly premiums from the federal government and various states according to government specified payment rates and various contractual terms. Changes in revenues from for our Medicare and individual commercial medical products resulting from the periodic changes in risk-adjustment scores derived from medical diagnoses for our membership are recognized when the amounts become determinable and the collectibility is reasonably assured.
Medicare Risk-Adjustment Provisions
CMS utilizes a risk-adjustment model which apportions premiums paid to Medicare Advantage, or MA, plans according to health severity. The risk-adjustment model, which CMS implemented pursuant to the Balanced Budget Act of 1997(BBA) and the Benefits and Improvement Protection Act of 2000 (BIPA), generally pays more for enrollees with predictably higher costs. Under the risk-adjustment methodology, all MA plans must collect and submit the necessary diagnosis code information from hospital inpatient, hospital outpatient, and physician providers to CMS within prescribed deadlines. The CMS risk-adjustment model uses this diagnosis data to calculate the risk-adjusted premium payment to MA plans. Rates paid to MA plans are established under an actuarial bid model, including a process that bases our payments on a comparison of our beneficiaries’ risk scores, derived from medical diagnoses, to those enrolled in the government’s Medicare FFS program. We generally rely on providers, including certain providers in our network who are our employees, to code their claim submissions with appropriate diagnoses, which we send to CMS as the basis for our payment received from CMS under the actuarial risk-adjustment model. We also rely on providers to appropriately document all medical data, including the diagnosis data submitted with claims.
CMS is phasing-in the process of calculating risk scores using diagnoses data from the Risk Adjustment Processing System, or RAPS, to diagnosis data from the Encounter Data System, or EDS. The RAPS process requires MA plans to apply a filter logic based on CMS guidelines and only submit those claims that pass the filtering logic. For submissions through EDS, CMS requires MA plans to submit all the claims data and CMS will apply the risk adjustment filtering logic to determine the risk adjustment data used to calculate risk scores. For 2016, 10% of the risk score was calculated from claims data submitted through EDS, increasing to 25% of the risk score calculated from claims data through EDS for 2017.
The phase-in from RAPS to EDS could result in different risk scores from each dataset as a result of plan processing issues, CMS processing issues, or filtering logic differences between RAPS and EDS, and could have a material adverse effect on our results of operations, financial position, or cash flows.
We estimate risk-adjustment revenues based on medical diagnoses for our membership. The risk-adjustment model, including CMS changes to the submission process, is more fully described in Item 1. – Business under the section titled “Individual Medicare.”
77
Investment Securities
Investment securities totaled
$9.8 billion
, or
39%
of total assets at December 31,
2016
, and
$9.1 billion
, or
37%
of total assets at December 31,
2015
. Debt securities, detailed below, comprised this entire investment portfolio at December 31,
2016
and
2015
. The fair value of debt securities were as follows at December 31,
2016
and
2015
:
|
December 31, 2016
|
Percentage
of Total |
December 31, 2015
|
Percentage
of Total |
|||||||||||
|
|
(dollars in millions)
|
|||||||||||||
|
U.S. Treasury and other U.S. government corporations and agencies:
|
||||||||||||||
|
U.S. Treasury and agency obligations
|
$
|
786
|
|
8.0
|
%
|
$
|
332
|
|
3.6
|
%
|
||||
|
Mortgage-backed securities
|
1,637
|
|
16.7
|
%
|
1,891
|
|
20.8
|
%
|
||||||
|
Tax-exempt municipal securities
|
3,305
|
|
33.7
|
%
|
2,668
|
|
29.3
|
%
|
||||||
|
Mortgage-backed securities:
|
||||||||||||||
|
Residential
|
9
|
|
0.1
|
%
|
13
|
|
0.1
|
%
|
||||||
|
Commercial
|
304
|
|
3.1
|
%
|
985
|
|
10.8
|
%
|
||||||
|
Asset-backed securities
|
160
|
|
1.7
|
%
|
263
|
|
2.9
|
%
|
||||||
|
Corporate debt securities
|
3,597
|
|
36.7
|
%
|
2,958
|
|
32.5
|
%
|
||||||
|
Total debt securities
|
$
|
9,798
|
|
100.0
|
%
|
$
|
9,110
|
|
100.0
|
%
|
||||
Approximately
98%
of our debt securities were investment-grade quality, with a weighted average credit rating of
AA
by S&P at December 31,
2016
. Most of the debt securities that were below investment-grade were rated
BB
, the higher end of the below investment-grade rating scale. Our investment policy limits investments in a single issuer and requires diversification among various asset types.
Tax-exempt municipal securities included pre-refunded bonds of
$276 million
at December 31,
2016
and
$178 million
at December 31,
2015
. These pre-refunded bonds were secured by an escrow fund consisting of U.S. government obligations sufficient to pay off all amounts outstanding at maturity. The ratings of these pre-refunded bonds generally assume the rating of the government obligations at the time the fund is established. Tax-exempt municipal securities that were not pre-refunded were diversified among general obligation bonds of U.S. states and local municipalities as well as special revenue bonds. General obligation bonds, which are backed by the taxing power and full faith of the issuer, accounted for
$1.4 billion
of these municipals in the portfolio. Special revenue bonds, issued by a municipality to finance a specific public works project such as utilities, water and sewer, transportation, or education, and supported by the revenues of that project, accounted for
$1.6 billion
of these municipals. Our general obligation bonds are diversified across the U.S. with no individual state exceeding
11%
. In addition, certain monoline insurers guarantee the timely repayment of bond principal and interest when a bond issuer defaults and generally provide credit enhancement for bond issues related to our tax-exempt municipal securities. We have no direct exposure to these monoline insurers. We owned
$132 million
and
$173 million
at December 31,
2016
and
2015
, respectively, of tax-exempt securities guaranteed by monoline insurers. The equivalent weighted average S&P credit rating of these tax-exempt securities without the guarantee from the monoline insurer was
AA
.
Our direct exposure to subprime mortgage lending is limited to investment in residential mortgage-backed securities and asset-backed securities backed by home equity loans. The fair value of securities backed by Alt-A and subprime loans was
less than $1 million
at December 31,
2016
and
$1 million
at December 31,
2015
. There are no collateralized debt obligations or structured investment vehicles in our investment portfolio. The percentage of corporate securities associated with the financial services industry was
23%
at December 31,
2016
and
25%
at December 31,
2015
.
Gross unrealized losses and fair values aggregated by investment category and length of time that individual securities have been in a continuous unrealized loss position were as follows at December 31,
2016
:
78
|
|
Less than 12 months
|
12 months or more
|
Total
|
|||||||||||||||||||||
|
|
Fair
Value |
Gross
Unrealized Losses |
Fair
Value |
Gross
Unrealized Losses |
Fair
Value |
Gross
Unrealized Losses |
||||||||||||||||||
|
|
(in millions)
|
|||||||||||||||||||||||
|
December 31, 2016
|
||||||||||||||||||||||||
|
U.S. Treasury and other U.S. government
corporations and agencies: |
||||||||||||||||||||||||
|
U.S. Treasury and agency obligations
|
$
|
697
|
|
$
|
(15
|
)
|
$
|
3
|
|
$
|
—
|
|
$
|
700
|
|
$
|
(15
|
)
|
||||||
|
Mortgage-backed securities
|
1,528
|
|
(31
|
)
|
3
|
|
—
|
|
1,531
|
|
(31
|
)
|
||||||||||||
|
Tax-exempt municipal securities
|
2,756
|
|
(67
|
)
|
43
|
|
(1
|
)
|
2,799
|
|
(68
|
)
|
||||||||||||
|
Mortgage-backed securities:
|
||||||||||||||||||||||||
|
Residential
|
—
|
|
—
|
|
4
|
|
—
|
|
4
|
|
—
|
|
||||||||||||
|
Commercial
|
182
|
|
(3
|
)
|
24
|
|
(1
|
)
|
206
|
|
(4
|
)
|
||||||||||||
|
Asset-backed securities
|
51
|
|
—
|
|
63
|
|
—
|
|
114
|
|
—
|
|
||||||||||||
|
Corporate debt securities
|
1,544
|
|
(71
|
)
|
69
|
|
(7
|
)
|
1,613
|
|
(78
|
)
|
||||||||||||
|
Total debt securities
|
$
|
6,758
|
|
$
|
(187
|
)
|
$
|
209
|
|
$
|
(9
|
)
|
$
|
6,967
|
|
$
|
(196
|
)
|
||||||
Under the other-than-temporary impairment model for debt securities held, we recognize an impairment loss in income in an amount equal to the full difference between the amortized cost basis and the fair value when we have the intent to sell the debt security or it is more likely than not we will be required to sell the debt security before recovery of our amortized cost basis. However, if we do not intend to sell the debt security, we evaluate the expected cash flows to be received as compared to amortized cost and determine if a credit loss has occurred. In the event of a credit loss, only the amount of the impairment associated with the credit loss is recognized currently in income with the remainder of the loss recognized in other comprehensive income.
When we do not intend to sell a security in an unrealized loss position, potential other-than-temporary impairment is considered using a variety of factors, including the length of time and extent to which the fair value has been less than cost; adverse conditions specifically related to the industry, geographic area or financial condition of the issuer or underlying collateral of a security; payment structure of the security; changes in credit rating of the security by the rating agencies; the volatility of the fair value changes; and changes in fair value of the security after the balance sheet date. For debt securities, we take into account expectations of relevant market and economic data. For example, with respect to mortgage and asset-backed securities, such data includes underlying loan level data and structural features such as seniority and other forms of credit enhancements. A decline in fair value is considered other-than-temporary when we do not expect to recover the entire amortized cost basis of the security. We estimate the amount of the credit loss component of a debt security as the difference between the amortized cost and the present value of the expected cash flows of the security. The present value is determined using the best estimate of future cash flows discounted at the implicit interest rate at the date of purchase. The risks inherent in assessing the impairment of an investment include the risk that market factors may differ from our expectations, facts and circumstances factored into our assessment may change with the passage of time, or we may decide to subsequently sell the investment. The determination of whether a decline in the value of an investment is other than temporary requires us to exercise significant diligence and judgment. The discovery of new information and the passage of time can significantly change these judgments. The status of the general economic environment and significant changes in the national securities markets influence the determination of fair value and the assessment of investment impairment. There is a continuing risk that declines in fair value may occur and additional material realized losses from sales or other-than-temporary impairments may be recorded in future periods.
The recoverability of our non-agency residential and commercial mortgage-backed securities is supported by factors such as seniority, underlying collateral characteristics and credit enhancements. These residential and commercial mortgage-backed securities at December 31,
2016
primarily were composed of senior tranches having high
79
credit support, with over
99%
of the collateral consisting of prime loans. The weighted average credit rating of all commercial mortgage-backed securities was
AA+
at December 31,
2016
.
All issuers of securities we own that were trading at an unrealized loss at
December 31, 2016
remain current on all contractual payments. After taking into account these and other factors previously described, we believe these unrealized losses primarily were caused by an increase in market interest rates in the current markets than when the securities were purchased. At
December 31, 2016
, we did not intend to sell the securities with an unrealized loss position in accumulated other comprehensive income, and it is not likely that we will be required to sell these securities before recovery of their amortized cost basis. As a result, we believe that the securities with an unrealized loss were not other-than-temporarily impaired at
December 31, 2016
. There were no material other-than-temporary impairments in
2016
,
2015
, or
2014
.
Goodwill and Long-lived Assets
At December 31,
2016
, goodwill and other long-lived assets represented
20%
of total assets and
47%
of total stockholders’ equity, compared to
20%
and
48%
, respectively, at December 31,
2015
.
We are required to test at least annually for impairment at a level of reporting referred to as the reporting unit, and more frequently if adverse events or changes in circumstances indicate that the asset may be impaired. A reporting unit either is our operating segments or one level below the operating segments, referred to as a component, which comprise our reportable segments. A component is considered a reporting unit if the component constitutes a business for which discrete financial information is available that is regularly reviewed by management. We are required to aggregate the components of an operating segment into one reporting unit if they have similar economic characteristics. Goodwill is assigned to the reporting unit that is expected to benefit from a specific acquisition. The carrying amount of goodwill for our reportable segments has been retrospectively adjusted to conform to the 2015 segment change discussed in Note 2 to the consolidated financial statements included in Item 8. – Financial Statements and Supplementary Data.
We use a two-step process to review goodwill for impairment. The first step is a screen for potential impairment, and the second step measures the amount of impairment, if any. Our strategy, long-range business plan, and annual planning process support our goodwill impairment tests. These tests are performed, at a minimum, annually in the fourth quarter, and are based on an evaluation of future discounted cash flows. We rely on this discounted cash flow analysis to determine fair value. However outcomes from the discounted cash flow analysis are compared to other market approach valuation methodologies for reasonableness. We use discount rates that correspond to a market-based weighted-average cost of capital and terminal growth rates that correspond to long-term growth prospects, consistent with the long-term inflation rate. Key assumptions in our cash flow projections, including changes in membership, premium yields, medical and operating cost trends, and certain government contract extensions, are consistent with those utilized in our long-range business plan and annual planning process. If these assumptions differ from actual, including the impact of the Health Care Reform Law or changes in Government rates, the estimates underlying our goodwill impairment tests could be adversely affected. Goodwill impairment tests completed in each of the last three years did not result in an impairment loss. The fair value of our reporting units with significant goodwill exceeded carrying amounts by a substantial margin. A 100 basis point increase in the discount rate would not have a significant impact on the amount of margin for any of our reporting units with significant goodwill, with the exception of our provider services reporting unit in our Healthcare Services segment. The provider services reporting unit would decline to less than 10% margin after factoring in a 100 basis point increase in the discount rate.
Long-lived assets consist of property and equipment and other finite-lived intangible assets. These assets are depreciated or amortized over their estimated useful life, and are subject to impairment reviews. We periodically review long-lived assets whenever adverse events or changes in circumstances indicate the carrying value of the asset may not be recoverable. In assessing recoverability, we must make assumptions regarding estimated future cash flows and other factors to determine if an impairment loss may exist, and, if so, estimate fair value. We also must estimate and make assumptions regarding the useful life we assign to our long-lived assets. If these estimates or their related assumptions change in the future, we may be required to record impairment losses or change the useful life, including accelerating depreciation or amortization for these assets. There were no material impairment losses in the last three years.
80
Our earnings and financial position are exposed to financial market risk, including those resulting from changes in interest rates.
The level of our pretax earnings is subject to market risk due to changes in interest rates and the resulting impact on investment income and interest expense. Prior to 2009, under interest rate swap agreements, we exchanged the fixed interest rate under all of our senior notes for a variable interest rate based on LIBOR using interest rate swap agreements. We terminated all of our interest rate swap agreements in 2008. We may re-enter into interest rate swap agreements in the future depending on market conditions and other factors. Amounts borrowed under the revolving credit portion of our
$1.0 billion
unsecured revolving credit agreement bear interest at either LIBOR plus a spread or the base rate plus a spread. There were no borrowings outstanding under our credit agreement at
December 31, 2016
or
December 31, 2015
.
Interest rate risk also represents a market risk factor affecting our consolidated financial position due to our significant investment portfolio, consisting primarily of fixed maturity securities of investment-grade quality with a weighted average S&P credit rating of
AA
at
December 31, 2016
. Our net unrealized position
decreased
$120 million
from a net unrealized gain position of
$92 million
at
December 31, 2015
to a net unrealized loss position of
$28 million
at
December 31, 2016
. At
December 31, 2016
, we had gross unrealized losses of
$196 million
on our investment portfolio primarily due to an increase in market interest rates since the time the securities were purchased. There were no material other-than-temporary impairments during
2016
. While we believe that these impairments are temporary and we currently do not have the intent to sell such securities, given the current market conditions and the significant judgments involved, there is a continuing risk that future declines in fair value may occur and material realized losses from sales or other-than-temporary impairments may be recorded in future periods.
Duration is the time-weighted average of the present value of the bond portfolio’s cash flow. Duration is indicative of the relationship between changes in fair value and changes in interest rates, providing a general indication of the sensitivity of the fair values of our fixed maturity securities to changes in interest rates. However, actual fair values may differ significantly from estimates based on duration. The average duration of our investment portfolio, including cash and cash equivalents, was approximately
4.4 years
as of
December 31, 2016
and
4.1 years
as of
December 31, 2015
. Based on the duration including cash equivalents, a 1% increase in interest rates would generally decrease the fair value of our securities by approximately
$590 million
.
We have also evaluated the impact on our investment income and interest expense resulting from a hypothetical change in interest rates of 100, 200, and 300 basis points over the next twelve-month period, as reflected in the following table. The evaluation was based on our investment portfolio and our outstanding indebtedness at
December 31, 2016
and
2015
. Our investment portfolio consists of cash, cash equivalents, and investment securities. The modeling technique used to calculate the pro forma net change in pretax earnings considered the cash flows related to fixed income investments and debt, which are subject to interest rate changes during a prospective twelve-month period. This evaluation measures parallel shifts in interest rates and may not account for certain unpredictable events that may affect interest income, including unexpected changes of cash flows into and out of the portfolio, changes in the asset allocation, including shifts between taxable and tax-exempt securities, and spread changes specific to various investment categories. In the past ten years, changes in 3 month LIBOR rates during the year have exceeded 300 basis points
once
, have not changed between 200 and 300 basis points, have changed between 100 and 200 basis points
two
times, and have changed by less than 100 basis points
seven
times.
81
|
|
Increase (decrease) in
pretax earnings given an interest rate decrease of X basis points |
Increase (decrease) in
pretax earnings given an interest rate increase of X basis points |
||||||||||||||||||||||
|
|
(300)
|
(200)
|
(100)
|
100
|
200
|
300
|
||||||||||||||||||
|
|
(in millions)
|
|||||||||||||||||||||||
|
As of December 31, 2016
|
||||||||||||||||||||||||
|
Investment income (a)
|
$
|
(49
|
)
|
$
|
(44
|
)
|
$
|
(36
|
)
|
$
|
53
|
|
$
|
107
|
|
$
|
162
|
|
||||||
|
Interest expense (b)
|
3
|
|
3
|
|
3
|
|
(2
|
)
|
(5
|
)
|
(9
|
)
|
||||||||||||
|
Pretax
|
$
|
(46
|
)
|
$
|
(41
|
)
|
$
|
(33
|
)
|
$
|
51
|
|
$
|
102
|
|
$
|
153
|
|
||||||
|
As of December 31, 2015
|
||||||||||||||||||||||||
|
Investment income (a)
|
$
|
(33
|
)
|
$
|
(27
|
)
|
$
|
(21
|
)
|
$
|
41
|
|
$
|
82
|
|
$
|
124
|
|
||||||
|
Interest expense (b)
|
3
|
|
3
|
|
3
|
|
(3
|
)
|
(6
|
)
|
(9
|
)
|
||||||||||||
|
Pretax
|
$
|
(30
|
)
|
$
|
(24
|
)
|
$
|
(18
|
)
|
$
|
38
|
|
$
|
76
|
|
$
|
115
|
|
||||||
|
(a)
|
As of
December 31, 2016
and
2015
, some of our investments had interest rates below 3% so the assumed hypothetical change in pretax earnings does not reflect the full 3% point reduction.
|
|
(b)
|
The interest rate under our senior notes is fixed. There were no borrowings outstanding under the credit agreement at
December 31, 2016
or
December 31, 2015
. There was
$300 million
outstanding under our commercial paper program at
December 31, 2016
. As of
December 31, 2016
, our interest rate under our commercial paper program was less than 2% so the assumed hypothetical change in pretax earnings does not reflect the full 2% point reduction.
|
82
Humana Inc.
|
|
December 31,
|
||||||
|
|
2016
|
2015
|
|||||
|
|
(in millions, except
share amounts)
|
||||||
|
ASSETS
|
|||||||
|
Current assets:
|
|||||||
|
Cash and cash equivalents
|
$
|
3,877
|
|
$
|
2,571
|
|
|
|
Investment securities
|
7,595
|
|
7,267
|
|
|||
|
Receivables, less allowance for doubtful accounts
of $118 in 2016 and $101 in 2015 |
1,280
|
|
1,161
|
|
|||
|
Other current assets
|
3,438
|
|
4,712
|
|
|||
|
Total current assets
|
16,190
|
|
15,711
|
|
|||
|
Property and equipment, net
|
1,505
|
|
1,384
|
|
|||
|
Long-term investment securities
|
2,203
|
|
1,843
|
|
|||
|
Goodwill
|
3,272
|
|
3,265
|
|
|||
|
Other long-term assets
|
2,226
|
|
2,475
|
|
|||
|
Total assets
|
$
|
25,396
|
|
$
|
24,678
|
|
|
|
LIABILITIES AND STOCKHOLDERS’ EQUITY
|
|||||||
|
Current liabilities:
|
|||||||
|
Benefits payable
|
$
|
4,563
|
|
$
|
4,976
|
|
|
|
Trade accounts payable and accrued expenses
|
2,467
|
|
2,212
|
|
|||
|
Book overdraft
|
212
|
|
301
|
|
|||
|
Unearned revenues
|
280
|
|
364
|
|
|||
|
Short-term borrowings
|
300
|
|
299
|
|
|||
|
Total current liabilities
|
7,822
|
|
8,152
|
|
|||
|
Long-term debt
|
3,792
|
|
3,794
|
|
|||
|
Future policy benefits payable
|
2,834
|
|
2,151
|
|
|||
|
Other long-term liabilities
|
263
|
|
235
|
|
|||
|
Total liabilities
|
14,711
|
|
14,332
|
|
|||
|
Commitments and contingencies (Note 16)
|
|
|
|||||
|
Stockholders’ equity:
|
|||||||
|
Preferred stock, $1 par; 10,000,000 shares authorized; none issued
|
—
|
|
—
|
|
|||
|
Common stock, $0.16 2/3 par; 300,000,000 shares authorized;
198,495,007 shares issued at December 31, 2016 and 198,372,059 shares issued at December 31, 2015 |
33
|
|
33
|
|
|||
|
Capital in excess of par value
|
2,562
|
|
2,530
|
|
|||
|
Retained earnings
|
11,454
|
|
11,017
|
|
|||
|
Accumulated other comprehensive (loss) income
|
(66
|
)
|
58
|
|
|||
|
Treasury stock, at cost, 49,189,811 shares at December 31, 2016
and 50,084,043 shares at December 31, 2015 |
(3,298
|
)
|
(3,292
|
)
|
|||
|
Total stockholders’ equity
|
10,685
|
|
10,346
|
|
|||
|
Total liabilities and stockholders’ equity
|
$
|
25,396
|
|
$
|
24,678
|
|
|
The accompanying notes are an integral part of the consolidated financial statements.
83
Humana Inc.
|
|
For the year ended December 31,
|
||||||||||
|
|
2016
|
2015
|
2014
|
||||||||
|
|
(in millions, except per share results)
|
||||||||||
|
Revenues:
|
|||||||||||
|
Premiums
|
$
|
53,021
|
|
$
|
52,409
|
|
$
|
45,959
|
|
||
|
Services
|
969
|
|
1,406
|
|
2,164
|
|
|||||
|
Investment income
|
389
|
|
474
|
|
377
|
|
|||||
|
Total revenues
|
54,379
|
|
54,289
|
|
48,500
|
|
|||||
|
Operating expenses:
|
|||||||||||
|
Benefits
|
45,007
|
|
44,269
|
|
38,166
|
|
|||||
|
Operating costs
|
7,277
|
|
7,318
|
|
7,639
|
|
|||||
|
Depreciation and amortization
|
354
|
|
355
|
|
333
|
|
|||||
|
Total operating expenses
|
52,638
|
|
51,942
|
|
46,138
|
|
|||||
|
Income from operations
|
1,741
|
|
2,347
|
|
2,362
|
|
|||||
|
Gain on sale of business
|
—
|
|
270
|
|
—
|
|
|||||
|
Interest expense
|
189
|
|
186
|
|
192
|
|
|||||
|
Income before income taxes
|
1,552
|
|
2,431
|
|
2,170
|
|
|||||
|
Provision for income taxes
|
938
|
|
1,155
|
|
1,023
|
|
|||||
|
Net income
|
$
|
614
|
|
$
|
1,276
|
|
$
|
1,147
|
|
||
|
Basic earnings per common share
|
$
|
4.11
|
|
$
|
8.54
|
|
$
|
7.44
|
|
||
|
Diluted earnings per common share
|
$
|
4.07
|
|
$
|
8.44
|
|
$
|
7.36
|
|
||
|
Dividends declared per common share
|
$
|
1.16
|
|
$
|
1.15
|
|
$
|
1.11
|
|
||
The accompanying notes are an integral part of the consolidated financial statements.
84
Humana Inc.
CONSOLIDATED STATEMENTS OF COMPREHENSIVE INCOME
|
|
For the year ended December 31,
|
||||||||||
|
|
2016
|
2015
|
2014
|
||||||||
|
|
(in millions)
|
||||||||||
|
Net income
|
$
|
614
|
|
$
|
1,276
|
|
$
|
1,147
|
|
||
|
Other comprehensive (loss) income:
|
|||||||||||
|
Change in gross unrealized investment gains/losses
|
(101
|
)
|
(114
|
)
|
122
|
|
|||||
|
Effect of income taxes
|
38
|
|
42
|
|
(44
|
)
|
|||||
|
Total change in unrealized investment
gains/losses, net of tax |
(63
|
)
|
(72
|
)
|
78
|
|
|||||
|
Reclassification adjustment for net realized
gains included in investment income |
(96
|
)
|
(146
|
)
|
(20
|
)
|
|||||
|
Effect of income taxes
|
35
|
|
53
|
|
7
|
|
|||||
|
Total reclassification adjustment, net of tax
|
(61
|
)
|
(93
|
)
|
(13
|
)
|
|||||
|
Other comprehensive (loss) income, net of tax
|
(124
|
)
|
(165
|
)
|
65
|
|
|||||
|
Comprehensive income
|
$
|
490
|
|
$
|
1,111
|
|
$
|
1,212
|
|
||
The accompanying notes are an integral part of the consolidated financial statements.
85
Humana Inc.
CONSOLIDATED STATEMENTS OF STOCKHOLDERS’ EQUITY
|
|
Common Stock
|
Capital In
Excess of
Par Value
|
Retained
Earnings
|
Accumulated
Other
Comprehensive
Income (Loss)
|
Treasury
Stock
|
Total
Stockholders’
Equity
|
||||||||||||||||||||
|
|
Issued
Shares
|
Amount
|
||||||||||||||||||||||||
|
|
(dollars in millions, share amounts in thousands)
|
|||||||||||||||||||||||||
|
Balances, January 1, 2014
|
196,276
|
|
$
|
33
|
|
$
|
2,267
|
|
$
|
8,942
|
|
$
|
158
|
|
$
|
(2,084
|
)
|
$
|
9,316
|
|
||||||
|
Net income
|
|
|
|
1,147
|
|
|
|
1,147
|
|
|||||||||||||||||
|
Other comprehensive income
|
|
|
|
|
65
|
|
|
65
|
|
|||||||||||||||||
|
Common stock repurchases
|
|
|
(100
|
)
|
|
|
(772
|
)
|
(872
|
)
|
||||||||||||||||
|
Dividends and dividend
equivalents |
|
|
—
|
|
(173
|
)
|
|
|
(173
|
)
|
||||||||||||||||
|
Stock-based compensation
|
|
|
98
|
|
|
|
|
98
|
|
|||||||||||||||||
|
Restricted stock unit vesting
|
966
|
|
—
|
|
—
|
|
|
|
—
|
|
—
|
|
||||||||||||||
|
Stock option exercises
|
710
|
|
—
|
|
52
|
|
|
|
|
52
|
|
|||||||||||||||
|
Stock option and restricted
stock tax benefit |
|
|
13
|
|
|
|
|
13
|
|
|||||||||||||||||
|
Balances, December 31, 2014
|
197,952
|
|
33
|
|
2,330
|
|
9,916
|
|
223
|
|
(2,856
|
)
|
9,646
|
|
||||||||||||
|
Net income
|
|
1,276
|
|
1,276
|
|
|||||||||||||||||||||
|
Other comprehensive loss
|
|
(165
|
)
|
(165
|
)
|
|||||||||||||||||||||
|
Common stock repurchases
|
|
100
|
|
(485
|
)
|
(385
|
)
|
|||||||||||||||||||
|
Dividends and dividend
equivalents |
|
—
|
|
(175
|
)
|
(175
|
)
|
|||||||||||||||||||
|
Stock-based compensation
|
|
109
|
|
109
|
|
|||||||||||||||||||||
|
Restricted stock unit vesting
|
159
|
|
—
|
|
(49
|
)
|
49
|
|
—
|
|
||||||||||||||||
|
Stock option exercises
|
261
|
|
—
|
|
23
|
|
23
|
|
||||||||||||||||||
|
Stock option and restricted
stock tax benefit |
|
17
|
|
17
|
|
|||||||||||||||||||||
|
Balances, December 31, 2015
|
198,372
|
|
33
|
|
2,530
|
|
11,017
|
|
58
|
|
(3,292
|
)
|
10,346
|
|
||||||||||||
|
Net income
|
614
|
|
614
|
|
||||||||||||||||||||||
|
Other comprehensive loss
|
(124
|
)
|
(124
|
)
|
||||||||||||||||||||||
|
Common stock repurchases
|
—
|
|
(104
|
)
|
(104
|
)
|
||||||||||||||||||||
|
Dividends and dividend
equivalents |
—
|
|
(177
|
)
|
(177
|
)
|
||||||||||||||||||||
|
Stock-based compensation
|
115
|
|
115
|
|
||||||||||||||||||||||
|
Restricted stock unit vesting
|
13
|
|
—
|
|
(98
|
)
|
98
|
|
—
|
|
||||||||||||||||
|
Stock option exercises
|
110
|
|
—
|
|
13
|
|
|
13
|
|
|||||||||||||||||
|
Stock option and restricted
stock tax benefit |
2
|
|
2
|
|
||||||||||||||||||||||
|
Balances, December 31, 2016
|
198,495
|
|
$
|
33
|
|
$
|
2,562
|
|
$
|
11,454
|
|
$
|
(66
|
)
|
$
|
(3,298
|
)
|
$
|
10,685
|
|
||||||
The accompanying notes are an integral part of the consolidated financial statements.
86
Humana Inc.
|
|
For the year ended December 31,
|
||||||||||
|
|
2016
|
2015
|
2014
|
||||||||
|
|
(in millions)
|
||||||||||
|
Cash flows from operating activities
|
|||||||||||
|
Net income
|
$
|
614
|
|
$
|
1,276
|
|
$
|
1,147
|
|
||
|
Adjustments to reconcile net income to net cash
provided by operating activities: |
|||||||||||
|
Gain on sale of business
|
—
|
|
(270
|
)
|
—
|
|
|||||
|
Depreciation
|
388
|
|
354
|
|
328
|
|
|||||
|
Amortization
|
77
|
|
93
|
|
121
|
|
|||||
|
Stock-based compensation
|
115
|
|
109
|
|
98
|
|
|||||
|
Net realized capital gains
|
(96
|
)
|
(146
|
)
|
(20
|
)
|
|||||
|
Benefit for deferred income taxes
|
(71
|
)
|
(2
|
)
|
(64
|
)
|
|||||
|
Provision for doubtful accounts
|
39
|
|
61
|
|
32
|
|
|||||
|
Changes in operating assets and liabilities, net of
effect of businesses acquired and dispositions: |
|||||||||||
|
Receivables
|
(158
|
)
|
(180
|
)
|
(264
|
)
|
|||||
|
Other assets
|
426
|
|
(872
|
)
|
(952
|
)
|
|||||
|
Benefits payable
|
(413
|
)
|
501
|
|
582
|
|
|||||
|
Other liabilities
|
937
|
|
(129
|
)
|
413
|
|
|||||
|
Unearned revenues
|
(84
|
)
|
3
|
|
155
|
|
|||||
|
Other
|
162
|
|
70
|
|
42
|
|
|||||
|
Net cash provided by operating activities
|
1,936
|
|
868
|
|
1,618
|
|
|||||
|
Cash flows from investing activities
|
|||||||||||
|
Acquisitions, net of cash acquired
|
(7
|
)
|
(38
|
)
|
(18
|
)
|
|||||
|
Proceeds from sale of business
|
—
|
|
1,061
|
|
72
|
|
|||||
|
Purchases of property and equipment
|
(527
|
)
|
(523
|
)
|
(528
|
)
|
|||||
|
Proceeds from sales of property and equipment
|
—
|
|
1
|
|
—
|
|
|||||
|
Purchases of investment securities
|
(6,566
|
)
|
(6,739
|
)
|
(2,883
|
)
|
|||||
|
Maturities of investment securities
|
1,426
|
|
1,065
|
|
885
|
|
|||||
|
Proceeds from sales of investment securities
|
4,312
|
|
5,493
|
|
2,409
|
|
|||||
|
Net cash (used in) provided by investing activities
|
(1,362
|
)
|
320
|
|
(63
|
)
|
|||||
|
Cash flows from financing activities
|
|||||||||||
|
Receipts (withdrawals) from contract deposits, net
|
1,093
|
|
(296
|
)
|
(919
|
)
|
|||||
|
Proceeds from issuance of senior notes, net
|
—
|
|
—
|
|
1,733
|
|
|||||
|
(Repayments) proceeds from issuance of commercial paper, net
|
(2
|
)
|
298
|
|
—
|
|
|||||
|
Repayment of long-term debt
|
—
|
|
—
|
|
(500
|
)
|
|||||
|
Common stock repurchases
|
(104
|
)
|
(385
|
)
|
(872
|
)
|
|||||
|
Dividends paid
|
(177
|
)
|
(172
|
)
|
(172
|
)
|
|||||
|
Excess tax benefit from stock-based compensation
|
—
|
|
15
|
|
12
|
|
|||||
|
Change in book overdraft
|
(89
|
)
|
(33
|
)
|
(69
|
)
|
|||||
|
Proceeds from stock option exercises and other, net
|
11
|
|
21
|
|
29
|
|
|||||
|
Net cash provided by (used in) financing activities
|
732
|
|
(552
|
)
|
(758
|
)
|
|||||
|
Increase in cash and cash equivalents
|
1,306
|
|
636
|
|
797
|
|
|||||
|
Cash and cash equivalents at beginning of year
|
2,571
|
|
1,935
|
|
1,138
|
|
|||||
|
Cash and cash equivalents at end of year
|
$
|
3,877
|
|
$
|
2,571
|
|
$
|
1,935
|
|
||
|
Supplemental cash flow disclosures:
|
|||||||||||
|
Interest payments
|
$
|
185
|
|
$
|
187
|
|
$
|
143
|
|
||
|
Income tax payments, net
|
$
|
916
|
|
$
|
1,179
|
|
$
|
1,030
|
|
||
|
Details of businesses acquired in purchase transactions:
|
|||||||||||
|
Fair value of assets acquired, net of cash acquired
|
$
|
7
|
|
$
|
38
|
|
$
|
18
|
|
||
|
Less: Fair value of liabilities assumed
|
—
|
|
—
|
|
—
|
|
|||||
|
Cash paid for acquired businesses, net of cash acquired
|
$
|
7
|
|
$
|
38
|
|
$
|
18
|
|
||
The accompanying notes are an integral part of the consolidated financial statements.
87
Humana Inc.
NOTES TO CONSOLIDATED FINANCIAL STATEMENTS
1. REPORTING ENTITY
Nature of Operations
Humana Inc., headquartered in Louisville, Kentucky, is a leading health and well-being company focused on making it easy for people to achieve their best health with clinical excellence through coordinated care. Our strategy integrates care delivery, the member experience, and clinical and consumer insights to encourage engagement, behavior change, proactive clinical outreach and wellness for the millions of people we serve across the country.
References throughout these notes to consolidated financial statements to “we,” “us,” “our,” “Company,” and “Humana,” mean Humana Inc. and its subsidiaries. We derived approximately
75%
of our total premiums and services revenue from contracts with the federal government in
2016
, including
14%
related to our federal government contracts with the Centers for Medicare and Medicaid Services, or CMS, to provide health insurance coverage for individual Medicare Advantage members in Florida. CMS is the federal government’s agency responsible for administering the Medicare program.
2. SUMMARY OF SIGNIFICANT ACCOUNTING POLICIES
Basis of Presentation
Our financial statements and accompanying notes are prepared in accordance with accounting principles generally accepted in the United States of America. Our consolidated financial statements include the accounts of Humana Inc. and subsidiaries that the Company controls, including variable interest entities associated with medical practices for which we are the primary beneficiary. We do not own many of our medical practices but instead enter into exclusive management agreements with the affiliated Professional Associations, or P.A.s, that operate these medical practices. Based upon the provisions of these agreements, these affiliated P.A.s are variable interest entities and we are the primary beneficiary, and accordingly we consolidated the affiliated P.A.s. All significant intercompany balances and transactions have been eliminated.
The preparation of financial statements in accordance with accounting principles generally accepted in the United States of America requires us to make estimates and assumptions that affect the amounts reported in the consolidated financial statements and accompanying notes. The areas involving the most significant use of estimates are the estimation of benefits payable, future policy benefits payable, the impact of risk adjustment provisions related to our Medicare contracts, the valuation and related impairment recognition of investment
securities, and the valuation and related impairment recognition of long-lived assets, including goodwill. These estimates are based on knowledge of current events and anticipated future events, and accordingly, actual results may ultimately differ materially from those estimates.
Certain amounts have been reclassified to conform to the current year presentation.
Aetna Merger
On July 2, 2015, we entered into an Agreement and Plan of Merger, which we refer to in this report as the Merger Agreement, with Aetna Inc. and certain wholly owned subsidiaries of Aetna Inc., which we refer to collectively as Aetna, which sets forth the terms and conditions under which we agreed to merge with, and become a wholly owned subsidiary of Aetna, a transaction we refer to in this report as the Merger.
The Merger was subject to customary closing conditions, including, among other things, (i) the expiration or termination of the applicable waiting period under the Hart-Scott-Rodino Antitrust Improvements Act of 1976, as amended, and the receipt of necessary approvals under state insurance and healthcare laws and regulations and pursuant to certain licenses of certain of Humana’s subsidiaries, and (ii) the absence of legal restraints and prohibitions on the consummation of the Merger.
On December 22, 2016, in order to extend the “End Date” (as defined in the Merger Agreement), Aetna and Humana each agreed to waive until 11:59 p.m. (Eastern time) on February 15, 2017 its right to terminate the Merger Agreement due to a failure of the Mergers to have been completed on or before December 31, 2016.
88
Humana Inc.
NOTES TO CONSOLIDATED FINANCIAL STATEMENTS—(Continued)
On July 21, 2016, the U.S. Department of Justice and the attorneys general of certain U.S. jurisdictions filed a civil antitrust complaint in the U.S. District Court for the District of Columbia against us and Aetna, alleging that the Merger would violate Section 7 of the Clayton Antitrust Act and seeking a permanent injunction to prevent the Merger from being completed. On January 23, 2017, the Court ruled in favor of the DOJ and granted a permanent injunction of the proposed transaction.
On February 14, 2017, we and Aetna agreed to mutually terminate the Merger Agreement, as our Board determined that an appeal of the Court's ruling would not be in the best interest of our stockholders.
Under terms of the Merger Agreement, we are entitled to a breakup fee of
$1 billion
.
Health Care Reform
The Patient Protection and Affordable Care Act and The Health Care and Education Reconciliation Act of 2010 (which we collectively refer to as the Health Care Reform Law) enacted significant reforms to various aspects of the U.S. health insurance industry. Certain of these reforms became effective January 1, 2014, including an annual insurance industry premium-based fee and the establishment of federally-facilitated or state-based exchanges coupled with three premium stabilization programs, as described more fully below.
The Health Care Reform Law imposes an annual premium-based fee on health insurers for each calendar year beginning on or after January 1, 2014 which is not deductible for tax purposes. We are required to estimate a liability for the health insurer fee and record it in full once qualifying insurance coverage is provided in the applicable calendar year in which the fee is payable with a corresponding deferred cost that is amortized ratably to expense over the same calendar year. We record the liability for the health insurer fee in trade accounts payable and accrued expenses and record the deferred cost in other current assets in our consolidated financial statements. We pay the health insurer fee in September of each year.
The Consolidated Appropriations Act, 2016, enacted on December 18, 2015, included a one-time one year suspension in 2017 of the health insurer fee.
See Note 7 for detail regarding amounts paid for the annual health insurer fee.
The Health Care Reform Law also establishes risk spreading premium stabilization programs effective January 1, 2014. The risk spreading programs are applicable to certain of our commercial medical insurance products. In the aggregate, our commercial medical insurance products represented approximately
16%
of our total premiums and services revenue for the
year ended December 31, 2016
, a subset of which is subject to these programs. These programs, commonly referred to as the 3Rs, include a permanent risk adjustment program, a transitional reinsurance program, and a temporary risk corridors program designed to more evenly spread the financial risk borne by issuers and to mitigate the risk that issuers would have mispriced products. The transitional reinsurance and temporary risk corridors programs were for years 2014 through 2016. Policies issued prior to March 23, 2010 are considered grandfathered policies and are exempt from the 3Rs. Certain states have allowed non-grandfathered policies issued prior to January 1, 2014 to extend the date of required transition to policies compliant with the Health Care Reform Law to as late as 2017. Accordingly, such policies are exempt from the 3Rs until they transition to policies compliant with the Health Care Reform Law.
The permanent risk adjustment program adjusts the premiums that commercial individual and small group health insurance issuers receive based on the demographic factors and health status of each member as derived from current year medical diagnosis as reported throughout the year. This program transfers funds from lower risk plans to higher risk plans within similar plans in the same state. The risk adjustment program is applicable to commercial individual and small group health plans (except certain exempt and grandfathered plans as discussed above) operating both inside and outside of the health insurance exchanges established under the Health Care Reform Law. Under the risk adjustment program, a risk score is assigned to each covered member to determine an average risk score at the individual and small group level by legal entity in a particular market in a state. Additionally, an average risk score is determined for the entire subject population for each market in each state. Settlements are determined on a net basis by legal entity and state. Each health insurance issuer’s average risk score is compared to the state’s average risk score. Plans with an average risk score below the state average will pay into a pool and health insurance issuers with an average risk score that is greater than the state average risk score will receive money from that pool. We generally rely on providers, including certain network providers who are our employees, to appropriately document all medical data, including the diagnosis codes submitted with claims, as the basis for our risk scores under the program. Our estimate of amounts receivable and/or payable under the risk adjustment program is based on our estimate of both our own and the state
89
Humana Inc.
NOTES TO CONSOLIDATED FINANCIAL STATEMENTS—(Continued)
average risk scores. Assumptions used in these estimates include but are not limited to published third party studies and other publicly available data including regulatory plan filings, geographic considerations including our historical experience in markets we have participated in over a long period of time, member demographics (including age and gender for our members and other health insurance issuers), our pricing model, sales data for each metal tier (different metal tiers yield different risk scores), and the mix of previously underwritten membership as compared to new members in plans compliant with the Health Care Reform Law. We refine our estimates as new information becomes available, including additional data released by the Department of Health and Human Services, or HHS, regarding estimates of state average risk scores. Risk adjustment is subject to audit by HHS beginning with the 2015 coverage year, however, there will be no payments associated with these audits for 2015, the pilot year for the audits.
The temporary risk corridor program applies to individual and small group Qualified Health Plans (or substantially equivalent plans), or QHPs, as defined by HHS, operating both inside and outside of the exchanges. Accordingly, plans subject to risk adjustment that are not QHPs, including our small group health plans, were not subject to the risk corridor program. The risk corridor provisions limit issuer gains and losses by comparing allowable medical costs to a target amount, each defined/prescribed by HHS, and sharing the risk for allowable costs with the federal government. Allowable medical costs are adjusted for risk adjustment settlements, transitional reinsurance recoveries, and cost sharing reductions received from HHS. Variances from the target exceeding certain thresholds may result in HHS making additional payments to us or require us to refund HHS a portion of the premiums we received.
We estimate and recognize adjustments to premiums revenue for the risk adjustment and risk corridor provisions by projecting our ultimate premium for the calendar year separately for individual and group plans by state and legal entity. Estimated calendar year settlement amounts are recognized ratably during the year and are revised each period to reflect current experience, including changes in risk scores derived from medical diagnoses submitted by providers. We record receivables or payables at the individual or group level within each state and legal entity and classify the amounts as current or long-term in our consolidated balance sheets based on the timing of expected settlement.
On November 10, 2016, the U.S. Court of Federal Claims ruled in favor of the government in one of a series of cases filed by insurers, unrelated to us, against HHS to collect risk corridor payments, rejecting all of the insurer’s statutory, contract and Constitutional claims for payment. On November 18, 2016, HHS issued a memorandum indicating a significant funding shortfall for the 2015 coverage year, the second consecutive year of significant shortfalls. Given the successful challenge of the risk corridor provisions in court, Congressional inquiries into the funding of the risk corridor program, and significant funding shortfalls under the first two years of the program, during the fourth quarter of 2016 we wrote-off
$583 million
in risk corridor receivables outstanding as of September 30, 2016, and ceased recognizing revenues under the risk corridor program as discussed further in Note 7.
The transitional reinsurance program required us to make reinsurance contributions for calendar years 2014 through 2016 to a state or HHS established reinsurance entity based on a national contribution rate per covered member as determined by HHS. While all commercial medical plans, including self-funded plans, are required to fund the reinsurance entity, only fully-insured non-grandfathered plans compliant with the Health Care Reform Law in the individual commercial market will be eligible for recoveries if individual claims exceed a specified threshold. Accordingly, we account for transitional reinsurance contributions associated with all commercial medical health plans other than these non-grandfathered individual plans as an assessment in operating costs in our consolidated statements of income. We account for contributions made by individual commercial plans compliant with the Health Care Reform Law, which are subject to recoveries, as ceded premiums (a reduction of premiums) and similarly we account for any recoveries as ceded benefits (a reduction of benefits expense) in our consolidated statements of income.
We were required to remit payment for our per member reinsurance contribution, exclusive of the portion payable to the U.S. Treasury, by January 15 of the year following the coverage year, or January 15, 2017 for the 2016 coverage year. The portion of the reinsurance contribution due to the U.S. Treasury must be paid by November 15 of the year following the coverage year, or November 15, 2017 for the 2016 coverage year. Risk adjustment calculations will be completed and HHS will notify us of recoveries due or payments owed to/from us under the risk adjustment and reinsurance programs by June 30 of the year following the coverage year. Following this notification, risk corridor calculations are then due by July 31 of the year following the coverage year. Payments due to HHS under the risk adjustment and risk corridor programs must be remitted within
30
days of notification for each program and will be collected prior to the distribution of recoveries by HHS under each program. Payment and recovery amounts associated
90
Humana Inc.
NOTES TO CONSOLIDATED FINANCIAL STATEMENTS—(Continued)
with reinsurance and risk adjustment will generally be settled with HHS annually in the year following the coverage year. Accordingly, for the 2016 coverage year, we expect to receive recoveries and/or pay amounts due under these programs in 2017.
See Note 7 for detail regarding amounts recorded to the consolidated balance sheets related to the 3Rs.
In addition to the provisions discussed above, beginning in 2014, HHS pays us a portion of the health care costs for low-income individual members for which we assume no risk in accordance with the Health Care Reform Law. We account for these subsidies as a deposit in our consolidated balance sheets and as a financing activity in our consolidated statements of cash flows. We do not recognize premiums revenue or benefits expense for these subsidies. Receipt and payment activity is accumulated at the state and legal entity level and recorded in our consolidated balance sheet in other current assets or trade accounts payable and accrued expenses depending on the state and legal entity balance at the end of the reporting period. We will be notified of final settlement amounts by June 30 of the year following the coverage year. For 2016, payments to HHS associated with cost sharing subsidies for which we do not assume risk were approximately
$373 million
, exceeding receipts of
$345 million
by
$28 million
. For
2015
, receipts from HHS associated with cost sharing subsidies for which we do not assume risk were approximately
$478 million
, exceeding payments of
$409 million
by
$69 million
. For
2014
, receipts from HHS associated with cost sharing subsidies for which we do not assume risk were approximately
$281 million
, exceeding payments of
$255 million
by
$26 million
.
If we fail to effectively implement our operational and strategic initiatives with respect to the implementation of the Health Care Reform Law, our business may be materially adversely affected. Additionally, potential legislative changes, including activities to repeal or replace the Health Care Reform Law, creates uncertainty for our business, and we cannot predict when, or in what form, such legislative changes may occur.
Cash and Cash Equivalents
Cash and cash equivalents include cash, time deposits, money market funds, commercial paper, other money market instruments, and certain U.S. Government securities with an original maturity of three months or less. Carrying value approximates fair value due to the short-term maturity of the investments.
Investment Securities
Investment securities, which consist entirely of debt securities, have been categorized as available for sale and, as a result, are stated at fair value. Investment securities available for current operations are classified as current assets. Investment securities available for our long-term insurance products and professional liability funding requirements, as well as restricted statutory deposits, are classified as long-term assets. For the purpose of determining gross realized gains and losses, which are included as a component of investment income in the consolidated statements of income, the cost of investment securities sold is based upon specific identification. Unrealized holding gains and losses, net of applicable deferred taxes, are included as a component of stockholders’ equity and comprehensive income until realized from a sale or other-than-temporary impairment.
Under the other-than-temporary impairment model for debt securities held, we recognize an impairment loss in income in an amount equal to the full difference between the amortized cost basis and the fair value when we have the intent to sell the debt security or it is more likely than not we will be required to sell the debt security before recovery of our amortized cost basis. However, if we do not intend to sell the debt security, we evaluate the expected cash flows to be received as compared to amortized cost and determine if a credit loss has occurred. In the event of a credit loss, only the amount of the impairment associated with the credit loss is recognized currently in income with the remainder of the loss recognized in other comprehensive income.
When we do not intend to sell a security in an unrealized loss position, potential other-than-temporary impairment is considered using a variety of factors, including the length of time and extent to which the fair value has been less than cost; adverse conditions specifically related to the industry, geographic area or financial condition of the issuer or underlying collateral of a security; payment structure of the security; changes in credit rating of the security by the rating agencies; the volatility of the fair value changes; and changes in fair value of the security after the balance sheet date. For debt securities, we take into account expectations of relevant market and economic data. For example, with
91
Humana Inc.
NOTES TO CONSOLIDATED FINANCIAL STATEMENTS—(Continued)
respect to mortgage and asset-backed securities, such data includes underlying loan level data and structural features such as seniority and other forms of credit enhancements. A decline in fair value is considered other-than-temporary when we do not expect to recover the entire amortized cost basis of the security. We estimate the amount of the credit loss component of a debt security as the difference between the amortized cost and the present value of the expected cash flows of the security. The present value is determined using the best estimate of future cash flows discounted at the implicit interest rate at the date of purchase.
Receivables and Revenue Recognition
We generally establish one-year commercial membership contracts with employer groups, subject to cancellation by the employer group on
30
-day written notice. Our Medicare contracts with CMS renew annually. Our military services contracts with the federal government and our contracts with various state Medicaid programs generally are multi-year contracts subject to annual renewal provisions. Individual polices are subject to the requirements of the Health Care Reform Law as discussed previously.
Premiums Revenue
We bill and collect premium from employer groups and members in our Medicare and other individual products monthly. We receive monthly premiums from the federal government and various states according to government specified payment rates and various contractual terms. Changes in revenues for our Medicare and individual commercial medical products resulting from the periodic changes in risk-adjustment scores derived from medical diagnoses for our membership and changes in risk corridor estimates are recognized when the amounts become determinable and the collectibility is reasonably assured.
Premiums revenue is estimated by multiplying the membership covered under the various contracts by the contractual rates. Premiums revenue is recognized as income in the period members are entitled to receive services, and is net of estimated uncollectible amounts, retroactive membership adjustments, and adjustments to recognize rebates under the minimum benefit ratios required under the Health Care Reform Law. We estimate policyholder rebates by projecting calendar year minimum benefit ratios for the individual, small group, and large group markets, as defined by the Health Care Reform Law using a methodology prescribed by HHS, separately by state and legal entity. Medicare Advantage products are also subject to minimum benefit ratio requirements under the Health Care Reform Law. Estimated calendar year rebates recognized ratably during the year are revised each period to reflect current experience. Retroactive membership adjustments result from enrollment changes not yet processed, or not yet reported by an employer group or the government. We routinely monitor the collectibility of specific accounts, the aging of receivables, historical retroactivity trends, estimated rebates, as well as prevailing and anticipated economic conditions, and reflect any required adjustments in current operations. Premiums received prior to the service period are recorded as unearned revenues.
Medicare Part D
We cover prescription drug benefits in accordance with Medicare Part D under multiple contracts with CMS. The payments we receive monthly from CMS and members, which are determined from our annual bid, represent amounts for providing prescription drug insurance coverage. We recognize premiums revenue for providing this insurance coverage ratably over the term of our annual contract. Our CMS payment is subject to risk sharing through the Medicare Part D risk corridor provisions. In addition, receipts for reinsurance and low-income cost subsidies as well as receipts for certain discounts on brand name prescription drugs in the coverage gap represent payments for prescription drug costs for which we are not at risk.
The risk corridor provisions compare costs targeted in our bids to actual prescription drug costs, limited to actual costs that would have been incurred under the standard coverage as defined by CMS. Variances exceeding certain thresholds may result in CMS making additional payments to us or require us to refund to CMS a portion of the premiums we received. As risk corridor provisions are considered in our overall annual bid process, we estimate and recognize an adjustment to premiums revenue related to these provisions based upon pharmacy claims experience. We record a receivable or payable at the contract level and classify the amount as current or long-term in our consolidated balance sheets based on the timing of expected settlement.
92
Humana Inc.
NOTES TO CONSOLIDATED FINANCIAL STATEMENTS—(Continued)
Reinsurance and low-income cost subsidies represent funding from CMS in connection with the Medicare Part D program for which we assume no risk. Reinsurance subsidies represent funding from CMS for its portion of prescription drug costs which exceed the member’s out-of-pocket threshold, or the catastrophic coverage level. Low-income cost subsidies represent funding from CMS for all or a portion of the deductible, the coinsurance and co-payment amounts above the out-of-pocket threshold for low-income beneficiaries. Monthly prospective payments from CMS for reinsurance and low-income cost subsidies are based on assumptions submitted with our annual bid. A reconciliation and related settlement of CMS’s prospective subsidies against actual prescription drug costs we paid is made after the end of the year. The Health Care Reform Law mandates consumer discounts of
50%
on brand name prescription drugs for Part D plan participants in the coverage gap. These discounts are funded by CMS and pharmaceutical manufacturers while we administer the application of these funds. We account for these subsidies and discounts as a deposit in our consolidated balance sheets and as a financing activity under receipts (withdrawals) from contract deposits in our consolidated statements of cash flows. For
2016
, subsidy and discount reimbursements of
$11.1 billion
exceeded payments of
$10.0 billion
by
$1.1 billion
. For
2015
, subsidy and discount payments of
$8.9 billion
exceeded reimbursements of
$8.6 billion
by
$361 million
. For
2014
, subsidy and discount payments of
$6.7 billion
exceeded reimbursements of
$5.8 billion
by
$945 million
. We do not recognize premiums revenue or benefit expenses for these subsidies or discounts. Receipt and payment activity is accumulated at the contract level and recorded in our consolidated balance sheets in other current assets or trade accounts payable and accrued expenses depending on the contract balance at the end of the reporting period.
Settlement of the reinsurance and low-income cost subsidies as well as the risk corridor payment is based on a reconciliation made approximately
9
months after the close of each calendar year.
Settlement with CMS for brand name prescription drug discounts is based on a reconciliation made approximately
14
to
18
months after the close of each calendar year. We continue to revise our estimates with respect to the risk corridor provisions based on subsequent period pharmacy claims data. See Note 6 for detail regarding amounts recorded to our consolidated balance sheets related to the risk corridor settlement and subsidies from CMS with respect to the Medicare Part D program.
Services Revenue
Patient services revenue
Patient services include injury and illness care and related services as well as other healthcare services related to employer needs or as required by law. Patient services revenues are recognized in the period services are provided to the customer when the sales price is fixed or determinable, and are net of contractual allowances.
Administrative services fees
Administrative services fees cover the processing of claims, offering access to our provider networks and clinical programs, and responding to customer service inquiries from members of self-funded groups. Revenues from providing administration services, also known as administrative services only, or ASO, are recognized in the period services are performed and are net of estimated uncollectible amounts. ASO fees are estimated by multiplying the membership covered under the various contracts by the contractual rates. Under ASO contracts, self-funded employers retain the risk of financing substantially all of the cost of health benefits. However, many ASO customers purchase stop loss insurance coverage from us to cover catastrophic claims or to limit aggregate annual costs. Accordingly, we have recorded premiums revenue and benefits expense related to these stop loss insurance contracts. We routinely monitor the collectibility of specific accounts, the aging of receivables, as well as prevailing and anticipated economic conditions, and reflect any required adjustments in current operations. ASO fees received prior to the service period are recorded as unearned revenues.
Under our current TRICARE South Region contract with the Department of Defense, we provide administrative services, including offering access to our provider networks and clinical programs, claim processing, customer service, enrollment, and other services, while the federal government retains all of the risk of the cost of health benefits. We account for revenues under the current contract net of estimated health care costs similar to an administrative services fee only agreement. The current contract includes fixed administrative services fees and incentive fees and penalties. Administrative services fees are recognized as services are performed.
93
Humana Inc.
NOTES TO CONSOLIDATED FINANCIAL STATEMENTS—(Continued)
Our TRICARE members are served by both in-network and out-of-network providers in accordance with the current contract. We pay health care costs related to these services to the providers and are subsequently reimbursed by the DoD for such payments. We account for the payments of the federal government’s claims and the related reimbursements under deposit accounting in our consolidated balance sheets and as a financing activity under receipts (withdrawals) from contract deposits in our consolidated statements of cash flows. For 2016, health care cost reimbursements and payments were each approximately
$3.3 billion
, with payments exceeding reimbursements by
$25 million
for the year. For 2015, health care cost reimbursements and payments were each approximately
$3.3 billion
, with payments exceeding reimbursements by
$4 million
for the year.
For 2014, health care cost reimbursements and payments were each
$3.2 billion
.
Receivables
Receivables, including premium receivables, patient services revenue receivables, and ASO fee receivables, are shown net of allowances for estimated uncollectible accounts, retroactive membership adjustments, and contractual allowances.
Other Current Assets
Other current assets includes amounts associated with Medicare Part D as discussed above and in Note 6, rebates due from pharmaceutical manufacturers and other amounts due within one year. We accrue pharmaceutical rebates as they are earned based on contractual terms and usage of the product. The balance of pharmaceutical rebates was
$889 million
at
December 31, 2016
and
$723 million
at
December 31, 2015
.
Policy Acquisition Costs
Policy acquisition costs are those costs that relate directly to the successful acquisition of new and renewal insurance policies. Such costs include commissions, costs of policy issuance and underwriting, and other costs we incur to acquire new business or renew existing business. We expense policy acquisition costs related to our employer-group prepaid health services policies as incurred. These short-duration employer-group prepaid health services policies typically have a
1
-year term and may be canceled upon
30
days notice by the employer group.
Life insurance, annuities, and certain health and other supplemental policies sold to individuals are accounted for as long-duration insurance products because they are expected to remain in force for an extended period beyond one year and premium received in the earlier years is intended to pay anticipated benefits to be incurred in future years
.
As a result, we defer policy acquisition costs, primarily consisting of commissions, and amortize them over the estimated life of the policies in proportion to premiums earned. Deferred acquisition costs are reviewed to determine if they are recoverable from future income. See Note 18.
Beginning in 2014, health policies sold to individuals that conform to the Health Care Reform Law are accounted for under a short-duration model and accordingly policy acquisition costs are expensed as incurred because premiums received in the current year are intended to pay anticipated benefits in that year
.
In addition, as previously underwritten members transition to plans compliant with the Health Care Reform Law, it results in policy lapses and the recognition of previously deferred acquisition costs.
Long-Lived Assets
Property and equipment is recorded at cost. Gains and losses on sales or disposals of property and equipment are included in operating costs. Certain costs related to the development or purchase of internal-use software are capitalized. Depreciation is computed using the straight-line method over estimated useful lives ranging from
3
to
10
years for equipment,
3
to
5
years for computer software, and
10
to
20
years for buildings. Improvements to leased facilities are depreciated over the shorter of the remaining lease term or the anticipated life of the improvement.
We periodically review long-lived assets, including property and equipment and other intangible assets, for impairment whenever adverse events or changes in circumstances indicate the carrying value of the asset may not be recoverable. Losses are recognized for a long-lived asset to be held and used in our operations when the undiscounted
94
Humana Inc.
NOTES TO CONSOLIDATED FINANCIAL STATEMENTS—(Continued)
future cash flows expected to result from the use of the asset are less than its carrying value. We recognize an impairment loss based on the excess of the carrying value over the fair value of the asset. A long-lived asset held for sale is reported at the lower of the carrying amount or fair value less costs to sell. Depreciation expense is not recognized on assets held for sale. Losses are recognized for a long-lived asset to be abandoned when the asset ceases to be used. In addition, we periodically review the estimated lives of all long-lived assets for reasonableness.
Goodwill and Other Intangible Assets
Goodwill represents the unamortized excess of cost over the fair value of the net tangible and other intangible assets acquired. We are required to test at least annually for impairment at a level of reporting referred to as the reporting unit, and more frequently if adverse events or changes in circumstances indicate that the asset may be impaired. A reporting unit either is our operating segments or one level below the operating segments, referred to as a component, which comprise our reportable segments. A component is considered a reporting unit if the component constitutes a business for which discrete financial information is available that is regularly reviewed by management. We aggregate the components of an operating segment into one reporting unit if they have similar economic characteristics. Goodwill is assigned to the reporting unit that is expected to benefit from a specific acquisition.
We use a two-step process to review goodwill for impairment. The first step is a screen for potential impairment, and the second step measures the amount of impairment, if any. Impairment tests are performed, at a minimum, in the fourth quarter of each year supported by our long-range business plan and annual planning process. We rely on an evaluation of future discounted cash flows to determine fair value of our reporting units. Impairment tests completed for
2016
,
2015
, and
2014
did not result in an impairment loss.
Other intangible assets primarily relate to acquired customer contracts/relationships and are included with other long-term assets in the consolidated balance sheets. Other intangible assets are amortized over the useful life, based upon the pattern of future cash flows attributable to the asset. This sometimes results in an accelerated method of amortization for customer contracts because the asset tends to dissipate at a more rapid rate in earlier periods. Other than customer contracts, other intangible assets generally are amortized using the straight-line method. We review other finite-lived intangible assets for impairment under our long-lived asset policy.
Benefits Payable and Benefits Expense Recognition
Benefits expense includes claim payments, capitation payments, pharmacy costs net of rebates, allocations of certain centralized expenses and various other costs incurred to provide health insurance coverage to members, as well as estimates of future payments to hospitals and others for medical care and other supplemental benefits provided on or prior to the balance sheet date. Capitation payments represent monthly contractual fees disbursed to primary care and other providers who are responsible for providing medical care to members. Pharmacy costs represent payments for members’ prescription drug benefits, net of rebates from drug manufacturers. Receivables for such pharmacy rebates are included in other current assets in our consolidated balance sheets. Other supplemental benefits include dental, vision, and other supplemental health and financial protection products.
We estimate the costs of our benefits expense payments using actuarial methods and assumptions based upon claim payment patterns, medical cost inflation, historical developments such as claim inventory levels and claim receipt patterns, and other relevant factors, and record benefit reserves for future payments. We continually review estimates of future payments relating to claims costs for services incurred in the current and prior periods and make necessary adjustments to our reserves.
95
Humana Inc.
NOTES TO CONSOLIDATED FINANCIAL STATEMENTS—(Continued)
Benefits expense is recognized in the period in which services are provided and includes an estimate of the cost of services which have been incurred but not yet reported, or IBNR. Our reserving practice is to consistently recognize the actuarial best point estimate within a level of confidence required by actuarial standards. Actuarial standards of practice generally require a level of confidence such that the liabilities established for IBNR have a greater probability of being adequate versus being insufficient, or such that the liabilities established for IBNR are sufficient to cover obligations under an assumption of moderately adverse conditions. Adverse conditions are situations in which the actual claims are expected to be higher than the otherwise estimated value of such claims at the time of the estimate. Therefore, in many situations, the claim amounts ultimately settled will be less than the estimate that satisfies the actuarial standards of practice.
We develop our estimate for IBNR using actuarial methodologies and assumptions, primarily based upon historical claim experience. Depending on the period for which incurred claims are estimated, we apply a different method in determining our estimate. For periods prior to the most recent two months, the key assumption used in estimating our IBNR is that the completion factor pattern remains consistent over a rolling 12-month period after adjusting for known changes in claim inventory levels and known changes in claim payment processes. Completion factors result from the calculation of the percentage of claims incurred during a given period that have historically been adjudicated as of the reporting period. For the most recent two months, the incurred claims are estimated primarily from a trend analysis based upon per member per month claims trends developed from our historical experience in the preceding months, adjusted for known changes in estimates of recent hospital and drug utilization data, provider contracting changes, changes in benefit levels, changes in member cost sharing, changes in medical management processes, product mix, and weekday seasonality.
The completion factor method is used for the months of incurred claims prior to the most recent two months because the historical percentage of claims processed for those months is at a level sufficient to produce a consistently reliable result. Conversely, for the most recent two months of incurred claims, the volume of claims processed historically is not at a level sufficient to produce a reliable result, which therefore requires us to examine historical trend patterns as the primary method of evaluation. Changes in claim processes, including recoveries of overpayments, receipt cycle times, claim inventory levels, outsourcing, system conversions, and processing disruptions due to weather or other events affect views regarding the reasonable choice of completion factors. Claim payments to providers for services rendered are often net of overpayment recoveries for claims paid previously, as contractually allowed. Claim overpayment recoveries can result from many different factors, including retroactive enrollment activity, audits of provider billings, and/or payment errors. Changes in patterns of claim overpayment recoveries can be unpredictable and result in completion factor volatility, as they often impact older dates of service. The receipt cycle time measures the average length of time between when a medical claim was initially incurred and when the claim form was received. Increases in electronic claim submissions from providers decrease the receipt cycle time. If claims are submitted or processed on a faster (slower) pace than prior periods, the actual claim may be more (less) complete than originally estimated using our completion factors, which may result in reserves that are higher (lower) than required.
Medical cost trends potentially are more volatile than other segments of the economy. The drivers of medical cost trends include increases in the utilization of hospital facilities, physician services, new higher priced technologies and medical procedures, and new prescription drugs and therapies, as well as the inflationary effect on the cost per unit of each of these expense components. Other external factors such as government-mandated benefits or other regulatory changes, the tort liability system, increases in medical services capacity, direct to consumer advertising for prescription drugs and medical services, an aging population, lifestyle changes including diet and smoking, catastrophes, and epidemics also may impact medical cost trends. Internal factors such as system conversions, claims processing cycle times, changes in medical management practices and changes in provider contracts also may impact our ability to accurately predict estimates of historical completion factors or medical cost trends. All of these factors are considered in estimating IBNR and in estimating the per member per month claims trend for purposes of determining the reserve for the most recent two months. Additionally, we continually prepare and review follow-up studies to assess the reasonableness of the estimates generated by our process and methods over time. The results of these studies are also considered in determining the reserve for the most recent two months. Each of these factors requires significant judgment by management.
96
Humana Inc.
NOTES TO CONSOLIDATED FINANCIAL STATEMENTS—(Continued)
We reassess the profitability of our contracts for providing insurance coverage to our members when current operating results or forecasts indicate probable future losses. We establish a premium deficiency reserve in current operations to the extent that the sum of expected future costs, claim adjustment expenses, and maintenance costs exceeds related future premiums under contracts without consideration of investment income. For purposes of determining premium deficiencies, contracts are grouped in a manner consistent with our method of acquiring, servicing, and measuring the profitability of such contracts. Losses recognized as a premium deficiency result in a beneficial effect in subsequent periods as operating losses under these contracts are charged to the liability previously established. Because the majority of our member contracts renew annually, we would not record a material premium deficiency reserve, except when unanticipated adverse events or changes in circumstances indicate otherwise. In the fourth quarter of 2015, we recognized a premium deficiency reserve of
$176 million
for our individual commercial medical business compliant with the Health Care Reform Law associated with the 2016 coverage year and recorded a change in estimate of
$208 million
in the second quarter of 2016 associated with the 2016 coverage year as discussed in more detail in Note 7. As of December 31, 2016, we had no remaining premium deficiency reserve.
We believe our benefits payable are adequate to cover future claims payments required. However, such estimates are based on knowledge of current events and anticipated future events. Therefore, the actual liability could differ materially from the amounts provided.
Future policy benefits payable
Future policy benefits payable include liabilities for long-duration insurance policies including long-term care, life insurance, annuities, and certain health and other supplemental policies sold to individuals for which some of the premium received in the earlier years is intended to pay anticipated benefits to be incurred in future years. At policy issuance, these reserves are recognized on a net level premium method based on interest rates, mortality, morbidity, and maintenance expense assumptions. Interest rates are based on our expected net investment returns on the investment portfolio supporting the reserves for these blocks of business. Mortality, a measure of expected death, and morbidity, a measure of health status, assumptions are based on published actuarial tables, modified based upon actual experience. Changes in estimates of these reserves are recognized as an adjustment to benefits expense in the period the changes occur. We perform loss recognition tests at least annually in the fourth quarter, and more frequently if adverse events or changes in circumstances indicate that the level of the liability, together with the present value of future gross premiums, may not be adequate to provide for future expected policy benefits and maintenance costs. During 2016, we recorded a loss for a premium deficiency as discussed further in Note 18.
We adjust future policy benefits payable for the additional liability that would have been recorded if investment securities backing the liability had been sold at their stated aggregate fair value and the proceeds reinvested at current yields. We include the impact of this adjustment, if any, net of applicable deferred taxes, with the change in unrealized investment gain (loss) in accumulated other comprehensive income in stockholders’ equity. As discussed previously, beginning in 2014, health policies sold to individuals that conform to the Health Care Reform Law are accounted for under a short-duration model under which policy reserves are not established because premiums received in the current year are intended to pay anticipated benefits in that year
.
In addition, as previously underwritten members transition to plans compliant with the Health Care Reform Law, it results in policy lapses and the release of reserves for future policy benefits.
Book Overdraft
Under our cash management system, checks issued but not yet presented to banks that would result in negative bank balances when presented are classified as a current liability in the consolidated balance sheets. Changes in book overdrafts from period to period are reported in the consolidated statement of cash flows as a financing activity.
Income Taxes
We recognize an asset or liability for the deferred tax consequences of temporary differences between the tax bases of assets or liabilities and their reported amounts in the consolidated financial statements. These temporary differences will result in taxable or deductible amounts in future years when the reported amounts of the assets or liabilities are recovered or settled. We also recognize the future tax benefits such as net operating and capital loss carryforwards as
97
Humana Inc.
NOTES TO CONSOLIDATED FINANCIAL STATEMENTS—(Continued)
deferred tax assets. A valuation allowance is provided against these deferred tax assets if it is more likely than not that some portion or all of the deferred tax assets will not be realized. Future years’ tax expense may be increased or decreased by adjustments to the valuation allowance or to the estimated accrual for income taxes.
We record tax benefits when it is more likely than not that the tax return position taken with respect to a particular transaction will be sustained. A liability, if recorded, is not considered resolved until the statute of limitations for the relevant taxing authority to examine and challenge the tax position has expired, or the tax position is ultimately settled through examination, negotiation, or litigation. We classify interest and penalties associated with uncertain tax positions in our provision for income taxes.
Derivative Financial Instruments
On
October 29, 2012
, we acquired a noncontrolling equity interest in MCCI Holdings, LLC, or MCCI,
a privately held Medical Services Organization, or MSO, headquartered in Miami, Florida, that primarily coordinates medical care for Medicare Advantage beneficiaries in Florida, Texas and Georgia
. Our agreement with MCCI includes a put option that would allow the controlling interest holder to put their interest to us beginning in 2018 as well as a call option that would allow us to purchase the controlling interest beginning in 2021. Accordingly, we recorded, at fair value, a liability and an asset associated with the put and call, respectively. Changes in the fair value of the liability and asset during the
years ended December 31,
2016
,
2015
, and
2014
were not material to our results of operations, financial condition, or cash flows.
At times, we may use interest-rate swap agreements to manage our exposure to interest rate risk. The differential between fixed and variable rates to be paid or received is accrued and recognized over the life of the agreements as adjustments to interest expense in the consolidated statements of income. We were not party to any interest-rate swap agreements in
2016
,
2015
, or
2014
.
Related Party
As noted above, MCCI is a related party to Humana. In December 2015, we purchased a
note receivable directly from a third-party bank syndicate related to the financing of
MCCI's business and extended the exercise date of the put option to 2018 and the call option to 2021. The note balance was
$314 million
at
December 31, 2016
and
$284 million
at
December 31, 2015
. The note receivable bears interest at
10%
annually, payable in quarterly installments, and matures in
December 2020
. We have also entered into a revolving note agreement providing a line of credit up to
$55 million
under which no balance is outstanding at
December 31, 2016
. The note receivable is included with other long-term assets in our consolidated balance sheet and with purchases of investment securities in our consolidated statement of cash flows. The related interest income of
$30 million
for
2016
is included in investment income in our consolidated statement of income. The interest was accrued to the loan balance during 2016 pursuant to the terms of the note. MCCI provides services to Humana Medicare Advantage members under capitation contracts with our health plans. Under these capitation agreements with Humana, MCCI assumes the financial risk associated with these Medicare Advantage members. We also have an outstanding advance to MCCI of approximately
$6 million
at
December 31, 2016
, with repayment terms tied to the performance under the capitation agreements. We recognized benefits expense of approximately
$1.1 billion
in
2016
,
$1.0 billion
in
2015
and
$962 million
in
2014
under these capitation agreements with MCCI.
Stock-Based Compensation
We generally recognize stock-based compensation expense, as determined on the date of grant at fair value, on a straight-line basis over the period during which an employee is required to provide service in exchange for the award (the vesting period). In addition, for awards with both time and performance-based conditions, we generally recognize compensation expense on a straight line basis over the vesting period when it is probable that the performance condition will be achieved. However, prior to July 2, 2015, for awards granted to retirement eligible employees, compensation expense is recognized on a straight-line basis over the shorter of the requisite service period or the period from the date of grant to an employee’s eligible retirement date. For awards granted on or after July 2, 2015 to retirement eligible employees, we recognize expense on a straight-line basis over the service period (the vesting period). We estimate expected forfeitures and recognize compensation expense only for those awards which are expected to vest. We estimate
98
Humana Inc.
NOTES TO CONSOLIDATED FINANCIAL STATEMENTS—(Continued)
the grant-date fair value of stock options using the Black-Scholes option-pricing model. Prior to 2016 we reported certain tax effects of stock-based compensation as a financing activity rather than an operating activity in the consolidated statement of cash flows. In 2016, we prospectively applied the provisions of new guidance issued by the Financial Accounting Standards Board, or FASB, related to the presentation of windfall tax benefits as cash flows from operating activities which resulted in reclassifying
$20 million
of cash flows from financing activities to operating activities for the three months ended March 31, 2016. We elected to continue to estimate forfeitures expected to occur to determine the amount of compensation cost to be recognized in each period.
Additional detail regarding our stock-based compensation plans is included in Note 13.
Earnings Per Common Share
We compute basic earnings per common share on the basis of the weighted-average number of unrestricted common shares outstanding. Diluted earnings per common share is computed on the basis of the weighted-average number of unrestricted common shares outstanding plus the dilutive effect of outstanding employee stock options and restricted shares, or units, using the treasury stock method.
Fair Value
Assets and liabilities measured at fair value are categorized into a fair value hierarchy based on whether the inputs to valuation techniques are observable or unobservable. Observable inputs reflect market data obtained from independent sources, while unobservable inputs reflect our own assumptions about the assumptions market participants would use. The fair value hierarchy includes three levels of inputs that may be used to measure fair value as described below.
Level 1 – Quoted prices in active markets for identical assets or liabilities. Level 1 assets and liabilities include debt securities that are traded in an active exchange market.
Level 2 – Observable inputs other than Level 1 prices such as quoted prices in active markets for similar assets or liabilities, quoted prices for identical or similar assets or liabilities in markets that are not active, or other inputs that are observable or can be corroborated by observable market data for substantially the full term of the assets or liabilities. Level 2 assets and liabilities include debt securities with quoted prices that are traded less frequently than exchange-traded instruments as well as debt securities whose value is determined using a pricing model with inputs that are observable in the market or can be derived principally from or corroborated by observable market data.
Level 3 – Unobservable inputs that are supported by little or no market activity and are significant to the fair value of the assets or liabilities. Level 3 includes assets and liabilities whose value is determined using pricing models, discounted cash flow methodologies, or similar techniques reflecting our own assumptions about the assumptions market participants would use as well as those requiring significant management judgment.
Fair value of actively traded debt securities are based on quoted market prices. Fair value of other debt securities are based on quoted market prices of identical or similar securities or based on observable inputs like interest rates generally using a market valuation approach, or, less frequently, an income valuation approach and are generally classified as Level 2. We obtain at least one price for each security from a third party pricing service. These prices are generally derived from recently reported trades for identical or similar securities, including adjustments through the reporting date based upon observable market information. When quoted prices are not available, the third party pricing service may use quoted market prices of comparable securities or discounted cash flow analysis, incorporating inputs that are currently observable in the markets for similar securities. Inputs that are often used in the valuation methodologies include benchmark yields, reported trades, credit spreads, broker quotes, default rates, and prepayment speeds. We are responsible for the determination of fair value and as such we perform analysis on the prices received from the third party pricing service to determine whether the prices are reasonable estimates of fair value. Our analysis includes a review of monthly price fluctuations as well as a quarterly comparison of the prices received from the pricing service to prices reported by our third party investment advisor. In addition, on a quarterly basis we examine the underlying inputs and assumptions for a sample of individual securities across asset classes, credit rating levels, and various durations.
99
Humana Inc.
NOTES TO CONSOLIDATED FINANCIAL STATEMENTS—(Continued)
Fair value of privately held debt securities, as well as auction rate securities, are estimated using a variety of valuation methodologies, including both market and income approaches, where an observable quoted market does not exist and are generally classified as Level 3. For privately-held debt securities, such methodologies include reviewing the value ascribed to the most recent financing, comparing the security with securities of publicly-traded companies in similar lines of business, and reviewing the underlying financial performance including estimating discounted cash flows. Auction rate securities are debt instruments with interest rates that reset through periodic short-term auctions. From time to time, liquidity issues in the credit markets have led to failed auctions. Given the liquidity issues, fair value could not be estimated based on observable market prices, and as such, unobservable inputs were used. For auction rate securities, valuation methodologies include consideration of the quality of the sector and issuer, underlying collateral, underlying final maturity dates, and liquidity.
Recently Issued Accounting Pronouncements
Recently Adopted Accounting Pronouncements
In March 2016, the FASB issued new guidance related to accounting for employee share-based payments, which changes how income tax effects of share-based payments are recorded as well as the minimum statutory tax withholding requirements and allows an accounting policy election to recognize forfeitures when they occur. As permitted, we elected to early adopt this new guidance during the second quarter of 2016 prospectively effective January 1, 2016. The adoption of this new guidance resulted in the recognition of approximately
$20 million
, or
$0.12
per diluted common share, of tax benefits in net income in our consolidated statement of income for the three months ended March 31, 2016 that had previously been recorded as additional paid-in capital in our condensed consolidated balance sheet. We also prospectively applied the provisions of the new guidance related to the presentation of windfall tax benefits as cash flows from operating activities which resulted in reclassifying
$20 million
of cash flows from financing activities to operating activities for the three months ended March 31, 2016. We elected to continue to estimate forfeitures expected to occur to determine the amount of compensation cost to be recognized in each period.
In November 2015, the FASB issued new guidance related to accounting for income taxes which changes the balance sheet classification of deferred taxes, requiring deferred tax liabilities and assets be classified as noncurrent in a classified statement of financial position.
The new guidance is effective for us beginning with annual and interim periods in 2017, with early adoption permitted.
We elected to early adopt the guidance and have classified all deferred tax liabilities and assets as noncurrent in our consolidated balance sheet at December 31, 2015 to simplify their presentation.
The adoption of the new guidance did not have any impact on our results of operations or cash flows.
In May 2015, the FASB issued new guidance requiring insurance entities to provide additional disclosures about claim liabilities including paid claims development information by accident year and claim frequency data and related methodologies. We adopted this new guidance in this 2016 Form 10-K. The applicable disclosures are included in this Note 2 and Note 10.
In March 2015, the FASB issued new guidance which changes the presentation of debt issuance costs from an asset to a direct reduction of the related debt liability. We adopted this new guidance on January 1, 2016 on a retrospective basis by directly deducting unamortized debt issuance costs from long-term debt on our balance sheet for all periods presented. Debt issuance costs had previously been classified in our balance sheet as other long-term assets.
Accounting Pronouncements Effective in Future Periods
In June 2016, the FASB issued guidance introducing a new model for recognizing credit losses on financial instruments based on an estimate of current expected credit losses. The guidance is effective for us beginning January 1, 2019. The new current expected credit losses (CECL) model generally calls for the immediate recognition of all expected credit losses and applies to loans, accounts and trade receivables as well as other financial assets measured at amortized cost, loan commitments and off-balance sheet credit exposures, debt securities and other financial assets measured at fair value through other comprehensive income, and beneficial interests in securitized financial assets. The new guidance replaces the current incurred loss model for measuring expected credit losses, requires expected losses on available-for-sale debt securities to be recognized through an allowance for credit losses rather than as reductions in the amortized cost of the securities, and provides for additional disclosure requirements. Our investment portfolio
100
Humana Inc.
NOTES TO CONSOLIDATED FINANCIAL STATEMENTS—(Continued)
consists of available for sale debt securities. We are currently evaluating the impact on our results of operations, financial condition, or cash flows.
In February 2016, the FASB issued new guidance related to accounting for leases which requires lessees to record assets and liabilities reflecting the leased assets and lease obligations, respectively, while following the dual model for recognition in statements of income requiring leases to be classified as either operating or finance. Operating leases will result in straight-line expense (similar to current operating leases) while finance leases will result in a front-loaded expense pattern (similar to current capital leases). The new guidance is effective for us beginning with annual and interim periods in 2019, with earlier adoption permitted, and requires retrospective application to previously issued annual and interim financial statements. We have begun the process of identifying the population of lease agreements and other arrangements that may contain embedded leases for purposes of adopting the new standard. While we expect to record significant leased assets and corresponding lease obligations based on our existing population of individual leases, we continue to evaluate the impact on our results of operations, financial position and cash flows.
In May 2014, the FASB issued new guidance that amends the accounting for revenue recognition. The amendments are intended to provide a more robust framework for addressing revenue issues, improve comparability of revenue recognition practices, and improve disclosure requirements. Insurance contracts are not included in the scope of this new guidance. Accordingly, our premiums revenue and investment income, collectively representing approximately
98%
of our consolidated external revenues for 2016, are not included in the scope of the new guidance. We are analyzing how we may recognize revenue under the new guidance by reviewing selected sample contracts presently in place. The new guidance is effective for us beginning with annual and interim periods in 2018. While we expect revenue related to our Pharmacy, Provider Services, ASO and other services businesses to remain primarily unchanged, we are still evaluating the impact of the new guidance on the customer arrangements for these businesses. Accordingly, we continue to evaluate the impact of the new standard on our results of operations, financial condition and cash flows.
There are no other recently issued accounting standards that apply to us or that are expected to have a material impact on our results of operations, financial condition, or cash flows.
3. ACQUISITIONS AND DIVESTITURES
On June 1, 2015, we completed the sale of our wholly owned subsidiary, Concentra Inc., or Concentra, to MJ Acquisition Corporation, a joint venture between Select Medical Holdings Corporation and Welsh, Carson, Anderson & Stowe XII, L.P., a private equity fund, for approximately
$1,055 million
in cash, excluding approximately
$22 million
of transaction costs. In connection with the sale, we recognized a pre-tax gain, net of transaction costs, of
$270 million
which is reported as gain on sale of business in the accompanying consolidated statements of income for
the year ended December 31, 2015. The accompanying consolidated statements of income include revenues related to Concentra of
$411 million
in
2015
and
$998 million
in
2014
.
During
2016
,
2015
and
2014
, we acquired health and wellness related businesses which, individually or in the aggregate, have not had a material impact on our results of operations, financial condition, or cash flows. The results of operations and financial condition of these businesses have been included in our condensed consolidated statements of income and condensed consolidated balance sheets from the respective acquisition dates. Acquisition-related costs recognized in each of
2016
,
2015
, and
2014
were not material to our results of operations. The pro forma financial information assuming the acquisitions had occurred as of the beginning of the calendar year prior to the year of acquisition, as well as the revenues and earnings generated during the year of acquisition, were not material for disclosure purposes.
101
Humana Inc.
NOTES TO CONSOLIDATED FINANCIAL STATEMENTS—(Continued)
4. INVESTMENT SECURITIES
Investment securities classified as current and long-term were as follows at
December 31, 2016
and
2015
, respectively:
|
Amortized
Cost |
Gross
Unrealized Gains |
Gross
Unrealized Losses |
Fair
Value |
||||||||||||
|
|
(in millions)
|
||||||||||||||
|
December 31, 2016
|
|||||||||||||||
|
U.S. Treasury and other U.S. government
corporations and agencies: |
|||||||||||||||
|
U.S. Treasury and agency obligations
|
$
|
800
|
|
$
|
1
|
|
$
|
(15
|
)
|
$
|
786
|
|
|||
|
Mortgage-backed securities
|
1,662
|
|
6
|
|
(31
|
)
|
1,637
|
|
|||||||
|
Tax-exempt municipal securities
|
3,358
|
|
15
|
|
(68
|
)
|
3,305
|
|
|||||||
|
Mortgage-backed securities:
|
|||||||||||||||
|
Residential
|
9
|
|
—
|
|
—
|
|
9
|
|
|||||||
|
Commercial
|
307
|
|
1
|
|
(4
|
)
|
304
|
|
|||||||
|
Asset-backed securities
|
160
|
|
—
|
|
—
|
|
160
|
|
|||||||
|
Corporate debt securities
|
3,530
|
|
145
|
|
(78
|
)
|
3,597
|
|
|||||||
|
Total debt securities
|
$
|
9,826
|
|
$
|
168
|
|
$
|
(196
|
)
|
$
|
9,798
|
|
|||
|
December 31, 2015
|
|||||||||||||||
|
U.S. Treasury and other U.S. government
corporations and agencies: |
|||||||||||||||
|
U.S. Treasury and agency obligations
|
$
|
331
|
|
$
|
2
|
|
$
|
(1
|
)
|
$
|
332
|
|
|||
|
Mortgage-backed securities
|
1,902
|
|
12
|
|
(23
|
)
|
1,891
|
|
|||||||
|
Tax-exempt municipal securities
|
2,611
|
|
61
|
|
(4
|
)
|
2,668
|
|
|||||||
|
Mortgage-backed securities:
|
|||||||||||||||
|
Residential
|
13
|
|
—
|
|
—
|
|
13
|
|
|||||||
|
Commercial
|
1,024
|
|
2
|
|
(41
|
)
|
985
|
|
|||||||
|
Asset-backed securities
|
264
|
|
1
|
|
(2
|
)
|
263
|
|
|||||||
|
Corporate debt securities
|
2,873
|
|
140
|
|
(55
|
)
|
2,958
|
|
|||||||
|
Total debt securities
|
$
|
9,018
|
|
$
|
218
|
|
$
|
(126
|
)
|
$
|
9,110
|
|
|||
102
Humana Inc.
NOTES TO CONSOLIDATED FINANCIAL STATEMENTS—(Continued)
Gross unrealized losses and fair values aggregated by investment category and length of time that individual securities have been in a continuous unrealized loss position were as follows at
December 31, 2016
and
2015
, respectively:
|
|
Less than 12 months
|
12 months or more
|
Total
|
|||||||||||||||||||||
|
|
Fair
Value |
Gross
Unrealized Losses |
Fair
Value |
Gross
Unrealized Losses |
Fair
Value |
Gross
Unrealized Losses |
||||||||||||||||||
|
|
(in millions)
|
|||||||||||||||||||||||
|
December 31, 2016
|
||||||||||||||||||||||||
|
U.S. Treasury and other U.S. government
corporations and agencies: |
||||||||||||||||||||||||
|
U.S. Treasury and agency obligations
|
$
|
697
|
|
$
|
(15
|
)
|
$
|
3
|
|
$
|
—
|
|
$
|
700
|
|
$
|
(15
|
)
|
||||||
|
Mortgage-backed securities
|
1,528
|
|
(31
|
)
|
3
|
|
—
|
|
1,531
|
|
(31
|
)
|
||||||||||||
|
Tax-exempt municipal securities
|
2,756
|
|
(67
|
)
|
43
|
|
(1
|
)
|
2,799
|
|
(68
|
)
|
||||||||||||
|
Mortgage-backed securities:
|
||||||||||||||||||||||||
|
Residential
|
—
|
|
—
|
|
4
|
|
—
|
|
4
|
|
—
|
|
||||||||||||
|
Commercial
|
182
|
|
(3
|
)
|
24
|
|
(1
|
)
|
206
|
|
(4
|
)
|
||||||||||||
|
Asset-backed securities
|
51
|
|
—
|
|
63
|
|
—
|
|
114
|
|
—
|
|
||||||||||||
|
Corporate debt securities
|
1,544
|
|
(71
|
)
|
69
|
|
(7
|
)
|
1,613
|
|
(78
|
)
|
||||||||||||
|
Total debt securities
|
$
|
6,758
|
|
$
|
(187
|
)
|
$
|
209
|
|
$
|
(9
|
)
|
$
|
6,967
|
|
$
|
(196
|
)
|
||||||
|
December 31, 2015
|
||||||||||||||||||||||||
|
U.S. Treasury and other U.S. government
corporations and agencies: |
||||||||||||||||||||||||
|
U.S. Treasury and agency obligations
|
$
|
195
|
|
$
|
(1
|
)
|
$
|
14
|
|
$
|
—
|
|
$
|
209
|
|
$
|
(1
|
)
|
||||||
|
Mortgage-backed securities
|
1,484
|
|
(20
|
)
|
86
|
|
(3
|
)
|
1,570
|
|
(23
|
)
|
||||||||||||
|
Tax-exempt municipal securities
|
843
|
|
(3
|
)
|
52
|
|
(1
|
)
|
895
|
|
(4
|
)
|
||||||||||||
|
Mortgage-backed securities:
|
||||||||||||||||||||||||
|
Residential
|
2
|
|
—
|
|
4
|
|
—
|
|
6
|
|
—
|
|
||||||||||||
|
Commercial
|
626
|
|
(13
|
)
|
265
|
|
(28
|
)
|
891
|
|
(41
|
)
|
||||||||||||
|
Asset-backed securities
|
258
|
|
(2
|
)
|
—
|
|
—
|
|
258
|
|
(2
|
)
|
||||||||||||
|
Corporate debt securities
|
918
|
|
(45
|
)
|
63
|
|
(10
|
)
|
981
|
|
(55
|
)
|
||||||||||||
|
Total debt securities
|
$
|
4,326
|
|
$
|
(84
|
)
|
$
|
484
|
|
$
|
(42
|
)
|
$
|
4,810
|
|
$
|
(126
|
)
|
||||||
Approximately
98%
of our debt securities were investment-grade quality, with a weighted average credit rating of
AA
by S&P at
December 31, 2016
. Most of the debt securities that were below investment-grade were rated
BB
, the higher end of the below investment-grade rating scale. At
December 31, 2016
,
8%
of our tax-exempt municipal securities were pre-refunded, generally with U.S. government and agency securities. Tax-exempt municipal securities that were not pre-refunded were diversified among general obligation bonds of U.S. states and local municipalities as well as special revenue bonds. General obligation bonds, which are backed by the taxing power and full faith of the issuer, accounted for
46%
of the tax-exempt municipals that were not pre-refunded in the portfolio. Special revenue bonds, issued by a municipality to finance a specific public works project such as utilities, water and sewer, transportation, or education, and supported by the revenues of that project, accounted for the remaining
54%
of these municipals. Our general obligation bonds are diversified across the United States with no individual state exceeding
11%
. In addition,
4%
of our tax-exempt securities were insured by bond insurers and had an equivalent weighted average S&P credit rating of
AA
exclusive of the bond insurers’ guarantee. Our investment policy limits investments in a single issuer and requires diversification among various asset types.
103
Humana Inc.
NOTES TO CONSOLIDATED FINANCIAL STATEMENTS—(Continued)
Residential mortgage back securities comprised approximately
99%
of our agency mortgage-backed securities at
December 31, 2016
and
98%
at
December 31, 2015
.
The recoverability of our non-agency residential and commercial mortgage-backed securities is supported by factors such as seniority, underlying collateral characteristics and credit enhancements. These residential and commercial mortgage-backed securities at
December 31, 2016
primarily were composed of senior tranches having high credit support, with over
99%
of the collateral consisting of prime loans. The weighted average credit rating of all commercial mortgage-backed securities was
AA+
at
December 31, 2016
.
The percentage of corporate securities associated with the financial services industry was
23%
at
December 31, 2016
and
25%
at
December 31, 2015
.
Our unrealized loss from all securities was generated from approximately
990
positions out of a total of approximately
2,140
positions at
December 31, 2016
.
All issuers of securities we own that were trading at an unrealized loss at
December 31, 2016
remain current on all contractual payments. After taking into account these and other factors previously described, we believe these unrealized losses primarily were caused by an increase in market interest rates in the current markets than when the securities were purchased. At
December 31, 2016
, we did not intend to sell the securities with an unrealized loss position in accumulated other comprehensive income, and it is not likely that we will be required to sell these securities before recovery of their amortized cost basis. As a result, we believe that the securities with an unrealized loss were not other-than-temporarily impaired at
December 31, 2016
.
The detail of realized gains (losses) related to investment securities and included within investment income was as follows for the years ended
December 31, 2016
,
2015
, and
2014
:
|
2016
|
2015
|
2014
|
|||||||||
|
|
(in millions)
|
||||||||||
|
Gross realized gains
|
$
|
120
|
|
$
|
179
|
|
$
|
29
|
|
||
|
Gross realized losses
|
(24
|
)
|
(33
|
)
|
(9
|
)
|
|||||
|
Net realized capital gains
|
$
|
96
|
|
$
|
146
|
|
$
|
20
|
|
||
There were
no
material other-than-temporary impairments in
2016
,
2015
, or
2014
.
The contractual maturities of debt securities available for sale at
December 31, 2016
, regardless of their balance sheet classification, are shown below. Expected maturities may differ from contractual maturities because borrowers may have the right to call or prepay obligations with or without call or prepayment penalties.
|
Amortized
Cost |
Fair
Value |
||||||
|
|
(in millions)
|
||||||
|
Due within one year
|
$
|
635
|
|
$
|
635
|
|
|
|
Due after one year through five years
|
2,424
|
|
2,426
|
|
|||
|
Due after five years through ten years
|
1,938
|
|
1,893
|
|
|||
|
Due after ten years
|
2,691
|
|
2,734
|
|
|||
|
Mortgage and asset-backed securities
|
2,138
|
|
2,110
|
|
|||
|
Total debt securities
|
$
|
9,826
|
|
$
|
9,798
|
|
|
104
Humana Inc.
NOTES TO CONSOLIDATED FINANCIAL STATEMENTS—(Continued)
5. FAIR VALUE
Financial Assets
The following table summarizes our fair value measurements at
December 31, 2016
and
2015
, respectively, for financial assets measured at fair value on a recurring basis:
|
|
|
Fair Value Measurements Using
|
|||||||||||||
|
|
Fair Value
|
Quoted Prices
in Active Markets (Level 1) |
Other
Observable Inputs (Level 2) |
Unobservable
Inputs (Level 3) |
|||||||||||
|
|
(in millions)
|
||||||||||||||
|
December 31, 2016
|
|||||||||||||||
|
Cash equivalents
|
$
|
3,654
|
|
$
|
3,654
|
|
$
|
—
|
|
$
|
—
|
|
|||
|
Debt securities:
|
|||||||||||||||
|
U.S. Treasury and other U.S. government corporations and agencies:
|
|||||||||||||||
|
U.S. Treasury and agency obligations
|
786
|
|
—
|
|
786
|
|
—
|
|
|||||||
|
Mortgage-backed securities
|
1,637
|
|
—
|
|
1,637
|
|
—
|
|
|||||||
|
Tax-exempt municipal securities
|
3,305
|
|
—
|
|
3,302
|
|
3
|
|
|||||||
|
Mortgage-backed securities:
|
|||||||||||||||
|
Residential
|
9
|
|
—
|
|
9
|
|
—
|
|
|||||||
|
Commercial
|
304
|
|
—
|
|
304
|
|
—
|
|
|||||||
|
Asset-backed securities
|
160
|
|
—
|
|
160
|
|
—
|
|
|||||||
|
Corporate debt securities
|
3,597
|
|
—
|
|
3,593
|
|
4
|
|
|||||||
|
Total debt securities
|
9,798
|
|
—
|
|
9,791
|
|
7
|
|
|||||||
|
Total invested assets
|
$
|
13,452
|
|
$
|
3,654
|
|
$
|
9,791
|
|
$
|
7
|
|
|||
|
December 31, 2015
|
|||||||||||||||
|
Cash equivalents
|
$
|
2,229
|
|
$
|
2,229
|
|
$
|
—
|
|
$
|
—
|
|
|||
|
Debt securities:
|
|||||||||||||||
|
U.S. Treasury and other U.S. government corporations and agencies:
|
|||||||||||||||
|
U.S. Treasury and agency obligations
|
332
|
|
—
|
|
332
|
|
—
|
|
|||||||
|
Mortgage-backed securities
|
1,891
|
|
—
|
|
1,891
|
|
—
|
|
|||||||
|
Tax-exempt municipal securities
|
2,668
|
|
—
|
|
2,663
|
|
5
|
|
|||||||
|
Mortgage-backed securities:
|
|||||||||||||||
|
Residential
|
13
|
|
—
|
|
13
|
|
—
|
|
|||||||
|
Commercial
|
985
|
|
—
|
|
985
|
|
—
|
|
|||||||
|
Asset-backed securities
|
263
|
|
—
|
|
263
|
|
—
|
|
|||||||
|
Corporate debt securities
|
2,958
|
|
—
|
|
2,952
|
|
6
|
|
|||||||
|
Total debt securities
|
9,110
|
|
—
|
|
9,099
|
|
11
|
|
|||||||
|
Total invested assets
|
$
|
11,339
|
|
$
|
2,229
|
|
$
|
9,099
|
|
$
|
11
|
|
|||
There were
no
material transfers between Level 1 and Level 2 during
2016
or
2015
.
105
Humana Inc.
NOTES TO CONSOLIDATED FINANCIAL STATEMENTS—(Continued)
Our Level 3 assets had a fair value of
$7 million
at
December 31, 2016
, or
0.1%
of our total invested assets. During the years ended December 31,
2016
,
2015
, and
2014
, the changes in the fair value of the assets measured using significant unobservable inputs (Level 3) were comprised of the following:
|
|
For the years ended December 31,
|
||||||||||||||||||||||||||||||||||
|
|
2016
|
2015
|
2014
|
||||||||||||||||||||||||||||||||
|
|
Private
Placements |
Auction
Rate Securities |
Total
|
Private
Placements |
Auction
Rate Securities |
Total
|
Private
Placements |
Auction
Rate Securities |
Total
|
||||||||||||||||||||||||||
|
|
(in millions)
|
||||||||||||||||||||||||||||||||||
|
Beginning balance at January 1
|
$
|
6
|
|
$
|
5
|
|
$
|
11
|
|
$
|
24
|
|
$
|
8
|
|
$
|
32
|
|
$
|
24
|
|
$
|
13
|
|
$
|
37
|
|
||||||||
|
Total gains or losses:
|
|||||||||||||||||||||||||||||||||||
|
Realized in earnings
|
—
|
|
—
|
|
—
|
|
(1
|
)
|
—
|
|
(1
|
)
|
—
|
|
—
|
|
—
|
|
|||||||||||||||||
|
Unrealized in other
comprehensive income |
—
|
|
—
|
|
—
|
|
—
|
|
—
|
|
—
|
|
—
|
|
—
|
|
—
|
|
|||||||||||||||||
|
Purchases
|
—
|
|
—
|
|
—
|
|
—
|
|
—
|
|
—
|
|
—
|
|
—
|
|
—
|
|
|||||||||||||||||
|
Sales
|
—
|
|
—
|
|
—
|
|
(17
|
)
|
(3
|
)
|
(20
|
)
|
—
|
|
(5
|
)
|
(5
|
)
|
|||||||||||||||||
|
Settlements
|
(2
|
)
|
(2
|
)
|
(4
|
)
|
—
|
|
—
|
|
—
|
|
—
|
|
—
|
|
—
|
|
|||||||||||||||||
|
Balance at December 31
|
$
|
4
|
|
$
|
3
|
|
$
|
7
|
|
$
|
6
|
|
$
|
5
|
|
$
|
11
|
|
$
|
24
|
|
$
|
8
|
|
$
|
32
|
|
||||||||
Financial Liabilities
Our long-term debt, recorded at carrying value in our consolidated balance sheets, was
$3,792 million
at
December 31, 2016
and
$3,794 million
at
December 31, 2015
. The fair value of our long-term debt was
$4,004 million
at
December 31, 2016
and
$3,986 million
at
December 31, 2015
. The fair value of our long-term debt is determined based on Level 2 inputs, including quoted market prices for the same or similar debt, or if no quoted market prices are available, on the current prices estimated to be available to us for debt with similar terms and remaining maturities.
Due to the short-term nature, carrying value approximates fair value for our commercial paper borrowings.
Assets and Liabilities Measured at Fair Value on a Nonrecurring Basis
As disclosed in Note 3, we completed our acquisition of certain health and wellness related businesses during
2016
,
2015
, and
2014
. The values of net tangible assets acquired and the resulting goodwill and other intangible assets were recorded at fair value using Level 3 inputs. The majority of the related tangible assets acquired and liabilities assumed were recorded at their carrying values as of the respective dates of acquisition, as their carrying values approximated their fair values due to their short-term nature. The fair values of goodwill and other intangible assets acquired in these acquisitions were internally estimated primarily based on the income approach. The income approach estimates fair value based on the present value of the cash flows that the assets are expected to generate in the future. We developed internal estimates for the expected cash flows and discount rates in the present value calculations. Other than assets acquired and liabilities assumed in these acquisitions, there were no material assets or liabilities measured at fair value on a nonrecurring basis during
2016
,
2015
, or
2014
.
6. MEDICARE PART D
As discussed in Note 2, we cover prescription drug benefits in accordance with Medicare Part D under multiple contracts with CMS. The accompanying consolidated balance sheets include the following amounts associated with Medicare Part D as of
December 31, 2016
and
2015
. CMS subsidies/discounts in the table below include the reinsurance and low-income cost subsidies funded by CMS for which we assume no risk as well as brand name prescription drug discounts for Part D plan participants in the coverage gap funded by CMS and pharmaceutical manufacturers.
106
Humana Inc.
NOTES TO CONSOLIDATED FINANCIAL STATEMENTS—(Continued)
|
|
2016
|
2015
|
||||||||||||||
|
|
Risk
Corridor Settlement |
CMS
Subsidies/ Discounts |
Risk
Corridor Settlement |
CMS
Subsidies/ Discounts |
||||||||||||
|
|
(in millions)
|
|||||||||||||||
|
Other current assets
|
$
|
8
|
|
$
|
1,001
|
|
$
|
25
|
|
$
|
2,082
|
|
||||
|
Trade accounts payable and accrued expenses
|
(158
|
)
|
(128
|
)
|
(47
|
)
|
(63
|
)
|
||||||||
|
Net current (liability) asset
|
$
|
(150
|
)
|
$
|
873
|
|
$
|
(22
|
)
|
$
|
2,019
|
|
||||
7. HEALTH CARE REFORM
Operating results for our individual commercial medical business compliant with the Health Care Reform Law have been challenged primarily due to unanticipated modifications in the program subsequent to the passing of the Health Care Reform Law, resulting in higher covered population morbidity and the ensuing enrollment and claims issues causing volatility in claims experience.
We took a number of actions in 2015 that we believed would improve the profitability of our individual commercial medical business in 2016.
These actions were subject to regulatory restrictions in certain geographies and included premium increases for the 2016 coverage year related generally to the first half of 2015 claims experience, the discontinuation of certain products as well as exit of certain markets for 2016, network improvements, enhancements to claims and clinical processes and administrative cost control. Despite these actions, the deterioration in the second half of 2015 claims experience together with 2016 open enrollment results that included the retention of many high-utilizing members for 2016 resulted in a probable future loss. As a result of our assessment in the fourth quarter of 2015 of the profitability of our individual commercial medical policies compliant with the Health Care Reform Law, we recorded in that quarter a provision for probable future losses (premium deficiency reserve) for the 2016 coverage year of
$176 million
in benefits payable in our consolidated balance sheet with a corresponding increase in benefits expense in our consolidated statement of income. As noted in the table below, in the second quarter of 2016, we increased the premium deficiency reserve for the 2016 coverage year and recorded a change in estimate of
$208 million
with a corresponding increase in benefits expense in our condensed consolidated statement of income primarily as a result of currently and projected unfavorable claims experience.
Changes in the premium deficiency reserve for the 2016 coverage year for the
years ended December 31,
2016
and
2015
were as follows. There was no premium deficiency reserve in 2014.
|
Premium Deficiency Reserve For the years ended December 31,
|
|||||||
|
2016
|
2015
|
||||||
|
(in millions)
|
|||||||
|
Balance at January 1
|
176
|
|
$
|
—
|
|
||
|
Current period results applied to the PDR liability for the 2016 coverage year
|
(384
|
)
|
—
|
|
|||
|
Change in full year estimate recorded in benefits expense
|
208
|
|
176
|
|
|||
|
Balance at December 31
|
$
|
—
|
|
$
|
176
|
|
|
On November 10, 2016, the U.S. Court of Federal Claims ruled in favor of the government in one of a series of cases filed by insurers, unrelated to us, against HHS to collect risk corridor payments, rejecting all of the insurer’s statutory, contract and Constitutional claims for payment. On November 18, 2016, HHS issued a memorandum indicating a significant funding shortfall for the 2015 coverage year, the second consecutive year of significant shortfalls. Given the successful challenge of the risk corridor provisions in court, Congressional inquiries into the funding of the risk corridor program, and significant funding shortfalls under the first two years of the program, during the fourth quarter of 2016 we wrote-off
$583 million
in risk corridor receivables outstanding as of September 30, 2016, including
$415 million
associated with the 2014 and 2015 coverage years. From inception of the risk corridor program through December 31, 2016, we collected approximately
$36 million
from CMS for risk corridor receivables associated with
107
Humana Inc.
NOTES TO CONSOLIDATED FINANCIAL STATEMENTS—(Continued)
the 2014 coverage year funded by HHS in accordance with previous guidance, utilizing funds HHS collected from us and other carriers under the 2014 and 2015 risk corridor program.
On February 14, 2017, we announced we are exiting our individual commercial medical businesses January 1, 2018
. As discussed previously, we have worked over the past several years to address market and programmatic challenges in order to keep coverage options available wherever we could offer a viable product. This has included pursuing business changes, such as modifying networks, restructuring product offerings, reducing the company’s geographic footprint and increasing premiums.
All of these actions were taken with the expectation that our individual commercial medical business would stabilize to the point where we could continue to participate in the program. However, based on our initial analysis of data associated with our healthcare exchange membership following the 2017 open enrollment period, we are seeing further signs of an unbalanced risk pool. Therefore, we have decided that we cannot continue to offer this coverage for 2018.
The accompanying consolidated balance sheets include the following amounts associated with the 3Rs at
December 31, 2016
and
December 31, 2015
. Amounts classified as long-term represent settlements that we expect to exceed 12 months at
December 31, 2016
.
|
|
2016
|
2015
|
|||||||||||||||||||||||||
|
|
Risk Adjustment
Settlement |
Reinsurance
Recoverables |
Risk
Corridor Settlement |
Risk Adjustment
Settlement |
Reinsurance
Recoverables |
Risk
Corridor Settlement |
|||||||||||||||||||||
|
(in millions)
|
|||||||||||||||||||||||||||
|
Prior Coverage Years
|
|||||||||||||||||||||||||||
|
Premiums receivable
|
$
|
—
|
$
|
—
|
|
$
|
—
|
|
$
|
126
|
$
|
—
|
|
$
|
—
|
|
|||||||||||
|
Other current assets
|
—
|
54
|
|
—
|
|
—
|
610
|
|
—
|
|
|||||||||||||||||
|
Trade accounts payable and
accrued expenses |
—
|
—
|
|
—
|
|
(223
|
)
|
—
|
|
—
|
|
||||||||||||||||
|
Net current asset (liability)
|
—
|
54
|
|
—
|
|
(97
|
)
|
610
|
|
—
|
|
||||||||||||||||
|
Other long-term assets
|
—
|
—
|
|
—
|
|
10
|
—
|
|
459
|
|
|||||||||||||||||
|
Total prior coverage years' net asset (liability)
|
—
|
54
|
|
—
|
|
(87
|
)
|
610
|
|
459
|
|
||||||||||||||||
|
Current Coverage Year
|
|||||||||||||||||||||||||||
|
Premiums receivable
|
307
|
—
|
|
—
|
|
—
|
—
|
|
—
|
|
|||||||||||||||||
|
Other current assets
|
—
|
206
|
|
—
|
|
—
|
—
|
|
—
|
|
|||||||||||||||||
|
Trade accounts payable and
accrued expenses |
(117
|
)
|
—
|
|
—
|
|
—
|
—
|
|
—
|
|
||||||||||||||||
|
Net current asset
|
190
|
206
|
|
—
|
|
—
|
—
|
|
—
|
|
|||||||||||||||||
|
Other long-term assets
|
6
|
—
|
|
—
|
|
—
|
—
|
|
—
|
|
|||||||||||||||||
|
Total current coverage year net asset
|
196
|
206
|
|
—
|
|
—
|
—
|
|
—
|
|
|||||||||||||||||
|
Total net asset (liability)
|
$
|
196
|
$
|
260
|
|
$
|
—
|
|
$
|
(87
|
)
|
$
|
610
|
|
$
|
459
|
|
||||||||||
Changes in estimate of the risk adjustment and reinsurance receivables and payables for prior coverage years primarily result from the annual June 30 notification from CMS of risk adjustment and reinsurance settlement amounts. These changes in estimate were substantially offset by changes in estimate of risk corridor receivables that were subsequently written off in the fourth quarter of 2016 as discussed above.
During 2016, net collections under the 3Rs associated with prior coverage years were
$383 million
. We expect to collect the remaining
$54 million
of reinsurance recoverables related to prior coverage years in 2017.
108
Humana Inc.
NOTES TO CONSOLIDATED FINANCIAL STATEMENTS—(Continued)
To the extent certain provisions of the Health Care Reform Law are successfully challenged in court or there are changes in legislation or the application of legislation, there can be no guarantee that receivables established under the reinsurance or risk adjustment provisions of the Health Care Reform Law will ultimately be collected.
If we fail to effectively implement our operational and strategic initiatives with respect to the implementation of the Health Care Reform Law, our business may be materially adversely affected. Additionally, potential legislative changes, including activities to repeal or replace the Health Care Reform Law, creates uncertainty for our business, and we cannot predict when, or in what form, such legislative changes may occur.
In
2016
, we paid the federal government
$916 million
for the annual health insurance industry fee attributed to calendar year
2016
, compared to
$867 million
in
2015
and
$562 million
in
2014
, in accordance with the Health Care Reform Law. This fee is not deductible for tax purposes. The annual health insurance industry fee has been suspended for calendar year 2017 but is scheduled to resume in calendar year 2018.
8. PROPERTY AND EQUIPMENT, NET
Property and equipment was comprised of the following at
December 31, 2016
and
2015
.
|
2016
|
2015
|
|||||||
|
|
(in millions)
|
|||||||
|
Land
|
$
|
20
|
|
$
|
20
|
|
||
|
Buildings and leasehold improvements
|
681
|
|
633
|
|
||||
|
Equipment
|
750
|
|
645
|
|
||||
|
Computer software
|
1,744
|
|
1,424
|
|
||||
|
3,195
|
|
2,722
|
|
|||||
|
Accumulated depreciation
|
(1,690
|
)
|
(1,338
|
)
|
||||
|
Property and equipment, net
|
$
|
1,505
|
|
$
|
1,384
|
|
||
Depreciation expense was
$388 million
in
2016
,
$354 million
in
2015
, and
$328 million
in
2014
, including amortization expense for capitalized internally developed and purchased software of
$255 million
in
2016
,
$220 million
in
2015
, and
$191 million
in
2014
.
9. GOODWILL AND OTHER INTANGIBLE ASSETS
Changes in the carrying amount of goodwill for our reportable segments for the years ended December 31,
2016
and
2015
were as follows:
|
Retail
|
Group
|
Healthcare Services
|
Total
|
|||||||||||||
|
|
(in millions)
|
|||||||||||||||
|
Balance at January 1, 2015
|
$
|
1,069
|
|
$
|
385
|
|
$
|
1,777
|
|
$
|
3,231
|
|
||||
|
Acquisitions
|
—
|
|
—
|
|
35
|
|
35
|
|
||||||||
|
Dispositions
|
—
|
|
—
|
|
(1
|
)
|
(1
|
)
|
||||||||
|
Balance at December 31, 2015
|
1,069
|
|
385
|
|
1,811
|
|
3,265
|
|
||||||||
|
Acquisitions
|
—
|
|
—
|
|
7
|
|
7
|
|
||||||||
|
Balance at December 31, 2016
|
$
|
1,069
|
|
$
|
385
|
|
$
|
1,818
|
|
$
|
3,272
|
|
||||
Healthcare Services segment goodwill of
$480 million
associated with the sale of Concentra was included with assets-held-for sale as of January 1, 2015 and is excluded from the table above. This
$480 million
of goodwill was disposed of on June 1, 2015 with the completion of the sale of Concentra.
109
Humana Inc.
NOTES TO CONSOLIDATED FINANCIAL STATEMENTS—(Continued)
The following table presents details of our other intangible assets included in other long-term assets in the accompanying consolidated balance sheets at December 31,
2016
and
2015
.
|
|
Weighted
Average Life |
2016
|
2015
|
|||||||||||||||||||||||
|
|
Cost
|
Accumulated
Amortization |
Net
|
Cost
|
Accumulated
Amortization |
Net
|
||||||||||||||||||||
|
|
|
(in millions)
|
||||||||||||||||||||||||
|
Other intangible assets:
|
||||||||||||||||||||||||||
|
Customer contracts/relationships
|
9.8 years
|
$
|
566
|
|
$
|
347
|
|
$
|
219
|
|
$
|
566
|
|
$
|
292
|
|
$
|
274
|
|
|||||||
|
Trade names and technology
|
8.3 years
|
104
|
|
69
|
|
35
|
|
104
|
|
54
|
|
50
|
|
|||||||||||||
|
Provider contracts
|
14.7 years
|
51
|
|
29
|
|
22
|
|
51
|
|
24
|
|
27
|
|
|||||||||||||
|
Noncompetes and other
|
8.2 years
|
32
|
|
28
|
|
4
|
|
32
|
|
26
|
|
6
|
|
|||||||||||||
|
Total other intangible assets
|
9.9 years
|
$
|
753
|
|
$
|
473
|
|
$
|
280
|
|
$
|
753
|
|
$
|
396
|
|
$
|
357
|
|
|||||||
Amortization expense for other intangible assets was approximately
$77 million
in
2016
,
$93 million
in
2015
, and
$121 million
in
2014
. The following table presents our estimate of amortization expense for each of the five next succeeding fiscal years:
|
|
(in millions)
|
||
|
For the years ending December 31,
|
|||
|
2017
|
$
|
71
|
|
|
2018
|
63
|
|
|
|
2019
|
52
|
|
|
|
2020
|
48
|
|
|
|
2021
|
14
|
|
|
110
Humana Inc.
NOTES TO CONSOLIDATED FINANCIAL STATEMENTS—(Continued)
10. BENEFITS PAYABLE
On a consolidated basis, activity in benefits payable, excluding military services, was as follows for the years ended December 31,
2016
,
2015
and
2014
:
|
2016
|
2015
|
2014
|
||||||||||
|
|
(in millions)
|
|||||||||||
|
Balances at January 1
|
$
|
4,976
|
|
$
|
4,475
|
|
$
|
3,893
|
|
|||
|
Less: Premium deficiency reserve
|
(176
|
)
|
—
|
|
—
|
|
||||||
|
Less: Reinsurance recoverables
|
(85
|
)
|
(78
|
)
|
—
|
|
||||||
|
Balances at January 1, net
|
4,715
|
|
4,397
|
|
3,893
|
|
||||||
|
Incurred related to:
|
||||||||||||
|
Current year
|
45,318
|
|
44,397
|
|
38,641
|
|
||||||
|
Prior years
|
(582
|
)
|
(236
|
)
|
(518
|
)
|
||||||
|
Total incurred
|
44,736
|
|
44,161
|
|
38,123
|
|
||||||
|
Paid related to:
|
||||||||||||
|
Current year
|
(40,852
|
)
|
(39,802
|
)
|
(34,357
|
)
|
||||||
|
Prior years
|
(4,112
|
)
|
(4,041
|
)
|
(3,262
|
)
|
||||||
|
Total paid
|
(44,964
|
)
|
(43,843
|
)
|
(37,619
|
)
|
||||||
|
Premium deficiency reserve
|
—
|
|
176
|
|
—
|
|
||||||
|
Reinsurance recoverable
|
76
|
|
85
|
|
78
|
|
||||||
|
Balances at December 31
|
$
|
4,563
|
|
$
|
4,976
|
|
$
|
4,475
|
|
|||
Amounts incurred related to prior years vary from previously estimated liabilities as the claims ultimately are settled. Negative amounts reported for incurred related to prior years result from claims being ultimately settled for amounts less than originally estimated (favorable development).
As previously discussed, our reserving practice is to consistently recognize the actuarial best estimate of our ultimate liability for claims. Actuarial standards require the use of assumptions based on moderately adverse experience, which generally results in favorable reserve development, or reserves that are considered redundant. We experienced favorable medical claims reserve development related to prior fiscal years of
$582 million
in
2016
,
$236 million
in
2015
, and
$518 million
in
2014
. The table below details our favorable medical claims reserve development related to prior fiscal years by segment for
2016
,
2015
, and
2014
.
|
|
Favorable Medical Claims Reserve
Development |
||||||||||
|
|
2016
|
2015
|
2014
|
||||||||
|
|
|||||||||||
|
Retail Segment
|
$
|
(535
|
)
|
$
|
(228
|
)
|
$
|
(488
|
)
|
||
|
Group Segment
|
(46
|
)
|
(7
|
)
|
(29
|
)
|
|||||
|
Other Businesses
|
(1
|
)
|
(1
|
)
|
(1
|
)
|
|||||
|
Total
|
$
|
(582
|
)
|
$
|
(236
|
)
|
$
|
(518
|
)
|
||
The favorable medical claims reserve development for
2016
,
2015
, and
2014
primarily reflects the consistent application of trend and completion factors estimated using an assumption of moderately adverse conditions. Favorable prior period development in 2016 primarily resulted from our Medicare Advantage and individual commercial medical businesses. The decline in favorable prior period development in 2015
primarily was due to the impact of lower financial claim recoveries due in part to our gradual implementation during 2014 of inpatient authorization review prior to admission as opposed to post adjudication, as well as higher than expected flu associated claims from the fourth quarter of 2014 and continued volatility in claims associated with individual commercial medical products.
The favorable prior
111
Humana Inc.
NOTES TO CONSOLIDATED FINANCIAL STATEMENTS—(Continued)
period development during 2014 resulted from increased membership, better than originally expected utilization across most of our major business lines and increased financial recoveries. The increase in financial recoveries primarily resulted from claim audit process enhancements as well as increased volume of claim audits and expanded audit scope. All lines of business benefited from these improvements.
Benefits expense excluded from the previous table was as follows for the years ended December 31,
2016
,
2015
and
2014
:
|
2016
|
2015
|
2014
|
||||||||||
|
|
(in millions)
|
|||||||||||
|
Premium deficiency reserve for short-duration policies
|
$
|
(176
|
)
|
$
|
176
|
|
$
|
—
|
|
|||
|
Military services
|
8
|
|
12
|
|
11
|
|
||||||
|
Future policy benefits
|
439
|
|
(80
|
)
|
32
|
|
||||||
|
Total
|
$
|
271
|
|
$
|
108
|
|
$
|
43
|
|
|||
In the fourth quarter of 2015, we recognized a premium deficiency reserve for our individual commercial medical business compliant with the Health Care Reform Law associated with the 2016 coverage year as discussed in more detail in Note 7
.
Military services benefits expense for each year in the table above reflect expenses associated with our contracts with the Veterans Administration.
The higher benefits expense associated with future policy benefits payable during 2016 primarily relates to reserve strengthening for our closed block of long-term care insurance policies acquired in connection with the 2007 KMG America Corporation, or KMG, acquisition more fully described
in Note 18.
The decrease in benefits expense associated with future policy benefits payable in 2015 primarily reflects the release of reserves as individual commercial medical members transitioned to plans compliant with the Health Care Reform Law.
Incurred and Paid Claims Development
The following discussion provides information about incurred and paid claims development for our Retail and Group segments as of
December 31, 2016
, net of reinsurance, as well as cumulative claim frequency and the total of IBNR included within the net incurred claims amounts. The information about incurred and paid claims development for the years ended
December 31,
2014
and
2015
is presented as supplementary information.
For both our Retail and Group segments, claims frequency is measured as medical fee-for-service claims for each service encounter with a unique provider identification number. Our claims frequency measure includes claims covered by deductibles as well as claims under capitated arrangements. Claim counts may vary based on product mix and the percentage of delegated capitation arrangements.
112
Humana Inc.
NOTES TO CONSOLIDATED FINANCIAL STATEMENTS—(Continued)
Retail Segment
Activity in benefits payable for our Retail segment was as follows for the years ended December 31,
2016
,
2015
and
2014
:
|
2016
|
2015
|
2014
|
||||||||||
|
|
(in millions)
|
|||||||||||
|
Balances at January 1
|
$
|
4,296
|
|
$
|
3,879
|
|
$
|
3,268
|
|
|||
|
Less: Premium deficiency reserve
|
(176
|
)
|
—
|
|
—
|
|
||||||
|
Less: Reinsurance recoverables
|
(85
|
)
|
(78
|
)
|
—
|
|
||||||
|
Balances at January 1, net
|
4,035
|
|
3,801
|
|
3,268
|
|
||||||
|
Incurred related to:
|
||||||||||||
|
Current year
|
40,854
|
|
39,760
|
|
33,996
|
|
||||||
|
Prior years
|
(535
|
)
|
(228
|
)
|
(488
|
)
|
||||||
|
Total incurred
|
40,319
|
|
39,532
|
|
33,508
|
|
||||||
|
Paid related to:
|
||||||||||||
|
Current year
|
(36,967
|
)
|
(35,835
|
)
|
(30,305
|
)
|
||||||
|
Prior years
|
(3,487
|
)
|
(3,463
|
)
|
(2,670
|
)
|
||||||
|
Total paid
|
(40,454
|
)
|
(39,298
|
)
|
(32,975
|
)
|
||||||
|
Premium deficiency reserve
|
—
|
|
176
|
|
—
|
|
||||||
|
Reinsurance recoverable
|
76
|
|
85
|
|
78
|
|
||||||
|
Balances at December 31
|
$
|
3,976
|
|
$
|
4,296
|
|
$
|
3,879
|
|
|||
At December 31,
2016
, benefits payable for our Retail segment included IBNR of approximately
$2.9 billion
, primarily associated with claims incurred in
2016
. The cumulative number of reported claims as of December 31,
2016
was approximately
87.7 million
for claims incurred in
2016
,
88.8 million
for claims incurred in
2015
, and
74.3 million
for claims incurred in
2014
.
The following tables provide information about incurred and paid claims development for the Retail segment as of
December 31, 2016
, net of reinsurance.
|
Incurred Claims, Net of Reinsurance
|
||||||||||||
|
For the Years Ended December 31,
|
||||||||||||
|
Claims Incurred Year
|
2014
Unaudited |
2015
Unaudited |
2016
|
|||||||||
|
|
|
(in millions)
|
||||||||||
|
2014
|
$
|
33,996
|
|
$
|
33,800
|
|
$
|
33,749
|
|
|||
|
2015
|
—
|
|
39,760
|
|
39,289
|
|
||||||
|
2016
|
—
|
|
—
|
|
40,854
|
|
||||||
|
Total
|
$
|
113,892
|
|
|||||||||
113
Humana Inc.
NOTES TO CONSOLIDATED FINANCIAL STATEMENTS—(Continued)
|
|
|
Cumulative Paid Claims, Net of Reinsurance
|
||||||||||
|
|
|
For the Years Ended December 31,
|
||||||||||
|
Claims Incurred Year
|
|
2014
Unaudited |
|
2015
Unaudited |
|
2016
|
||||||
|
|
|
(in millions)
|
||||||||||
|
2014
|
|
$
|
30,305
|
|
|
$
|
33,704
|
|
|
$
|
33,740
|
|
|
2015
|
|
|
|
35,835
|
|
|
39,285
|
|
||||
|
2016
|
|
|
|
|
|
36,967
|
|
|||||
|
Total
|
|
|
|
|
|
$
|
109,992
|
|
||||
|
All outstanding benefit liabilities before 2014, net of reinsurance
|
|
N/A
|
|
|||||||||
|
Benefits payable, net of reinsurance
|
|
$
|
3,900
|
|
||||||||
Group Segment
Activity in benefits payable for our Group segment, excluding military services, was as follows for the years ended December 31,
2016
,
2015
and
2014
:
|
2016
|
2015
|
2014
|
||||||||||
|
|
(in millions)
|
|||||||||||
|
Balances at January 1
|
$
|
600
|
|
$
|
578
|
|
$
|
577
|
|
|||
|
Less: Reinsurance recoverables
|
—
|
|
—
|
|
—
|
|
||||||
|
Balances at January 1, net
|
600
|
|
578
|
|
577
|
|
||||||
|
Incurred related to:
|
||||||||||||
|
Current year
|
5,160
|
|
5,261
|
|
5,148
|
|
||||||
|
Prior years
|
(46
|
)
|
(7
|
)
|
(29
|
)
|
||||||
|
Total incurred
|
5,114
|
|
5,254
|
|
5,119
|
|
||||||
|
Paid related to:
|
||||||||||||
|
Current year
|
(4,605
|
)
|
(4,671
|
)
|
(4,574
|
)
|
||||||
|
Prior years
|
(546
|
)
|
(561
|
)
|
(544
|
)
|
||||||
|
Total paid
|
(5,151
|
)
|
(5,232
|
)
|
(5,118
|
)
|
||||||
|
Balances at December 31
|
$
|
563
|
|
$
|
600
|
|
$
|
578
|
|
|||
At December 31,
2016
, benefits payable for our Group segment included IBNR of approximately
$468 million
, primarily associated with claims incurred in
2016
. The cumulative number of reported claims as of December 31,
2016
was approximately
23.3 million
for claims incurred in
2016
,
29.1 million
for claims incurred in
2015
, and
27.3 million
for claims incurred in
2014
.
114
Humana Inc.
NOTES TO CONSOLIDATED FINANCIAL STATEMENTS—(Continued)
The following tables provide information about incurred and paid claims development for the Group segment as of
December 31, 2016
, net of reinsurance.
|
Incurred Claims, Net of Reinsurance
|
||||||||||||
|
For the Years Ended December 31,
|
||||||||||||
|
Claims Incurred Year
|
2014
Unaudited |
2015
Unaudited |
2016
|
|||||||||
|
|
|
(in millions)
|
||||||||||
|
2014
|
$
|
5,148
|
|
$
|
5,135
|
|
$
|
5,135
|
|
|||
|
2015
|
—
|
|
5,261
|
|
5,217
|
|
||||||
|
2016
|
—
|
|
—
|
|
5,160
|
|
||||||
|
Total
|
$
|
15,512
|
|
|||||||||
|
|
|
Cumulative Paid Claims, Net of Reinsurance
|
||||||||||
|
|
|
For the Years Ended December 31,
|
||||||||||
|
Claims Incurred Year
|
|
2014
Unaudited |
|
2015
Unaudited |
|
2016
|
||||||
|
|
|
(in millions)
|
||||||||||
|
2014
|
|
$
|
4,574
|
|
|
$
|
5,126
|
|
|
$
|
5,134
|
|
|
2015
|
|
|
|
4,671
|
|
|
5,210
|
|
||||
|
2016
|
|
|
|
|
|
4,605
|
|
|||||
|
Total
|
|
|
|
|
|
|
$
|
14,949
|
|
|||
|
All outstanding benefit liabilities before 2014, net of reinsurance
|
|
N/A
|
|
|||||||||
|
Benefits payable, net of reinsurance
|
|
$
|
563
|
|
||||||||
Reconciliation to Consolidated
The reconciliation of the net incurred and paid claims development tables to benefits payable in the consolidated statement of financial position is as follows:
|
December 31, 2016
|
|||
|
Net outstanding liabilities
|
|||
|
Retail
|
$
|
3,900
|
|
|
Group
|
563
|
|
|
|
Other insurance lines
|
24
|
|
|
|
Benefits payable, net of reinsurance
|
4,487
|
|
|
|
Reinsurance recoverable on unpaid claims
|
|||
|
Retail
|
76
|
|
|
|
Group
|
—
|
|
|
|
Other insurance lines
|
—
|
|
|
|
Total reinsurance recoverable on unpaid claims
|
76
|
|
|
|
Total benefits payable, gross
|
$
|
4,563
|
|
115
Humana Inc.
NOTES TO CONSOLIDATED FINANCIAL STATEMENTS—(Continued)
11. INCOME TAXES
The provision for income taxes consisted of the following for the years ended December 31,
2016
,
2015
and
2014
:
|
2016
|
2015
|
2014
|
|||||||||
|
|
(in millions)
|
||||||||||
|
Current provision:
|
|||||||||||
|
Federal
|
$
|
921
|
|
$
|
1,067
|
|
$
|
1,006
|
|
||
|
States and Puerto Rico
|
88
|
|
90
|
|
81
|
|
|||||
|
Total current provision
|
1,009
|
|
1,157
|
|
1,087
|
|
|||||
|
Deferred benefit
|
(71
|
)
|
(2
|
)
|
(64
|
)
|
|||||
|
Provision for income taxes
|
$
|
938
|
|
$
|
1,155
|
|
$
|
1,023
|
|
||
The provision for income taxes was different from the amount computed using the federal statutory rate for the years ended December 31,
2016
,
2015
and
2014
due to the following:
|
2016
|
2015
|
2014
|
|||||||||
|
|
(in millions)
|
||||||||||
|
Income tax provision at federal statutory rate
|
$
|
543
|
|
$
|
851
|
|
$
|
759
|
|
||
|
States, net of federal benefit, and Puerto Rico
|
41
|
|
44
|
|
48
|
|
|||||
|
Tax exempt investment income
|
(20
|
)
|
(24
|
)
|
(27
|
)
|
|||||
|
Health insurer fee
|
336
|
|
314
|
|
204
|
|
|||||
|
Nondeductible executive compensation
|
30
|
|
18
|
|
22
|
|
|||||
|
Concentra sale
|
—
|
|
(67
|
)
|
—
|
|
|||||
|
Other, net
|
8
|
|
19
|
|
17
|
|
|||||
|
Provision for income taxes
|
$
|
938
|
|
$
|
1,155
|
|
$
|
1,023
|
|
||
The provision for income taxes for
2016
,
2015
, and
2014
reflects a
$30 million
,
$18 million
, and
$22 million
, respectively, estimated impact from limitations on the deductibility of annual compensation in excess of
$500,000
per employee as mandated by the Health Care Reform Law. We do not have material uncertain tax positions reflected in our consolidated balance sheets.
Deferred income tax balances reflect the impact of temporary differences between the tax bases of assets or liabilities and their reported amounts in our consolidated financial statements, and are stated at enacted tax rates expected to be in effect when the reported amounts are actually recovered or settled. Principal components of our net deferred tax balances at December 31,
2016
and
2015
were as follows.
116
Humana Inc.
NOTES TO CONSOLIDATED FINANCIAL STATEMENTS—(Continued)
|
|
Assets (Liabilities)
|
||||||
|
|
2016
|
2015
|
|||||
|
|
(in millions)
|
||||||
|
Future policy benefits payable
|
$
|
355
|
|
$
|
200
|
|
|
|
Benefits payable
|
196
|
|
267
|
|
|||
|
Compensation and other accrued expenses
|
153
|
|
130
|
|
|||
|
Net operating loss carryforward
|
52
|
|
47
|
|
|||
|
Deferred acquisition costs
|
72
|
|
64
|
|
|||
|
Unearned revenues
|
18
|
|
22
|
|
|||
|
Investment securities
|
12
|
|
—
|
|
|||
|
Other
|
6
|
|
13
|
|
|||
|
Total deferred income tax assets
|
864
|
|
743
|
|
|||
|
Valuation allowance
|
(49
|
)
|
(42
|
)
|
|||
|
Total deferred income tax assets, net of valuation allowance
|
815
|
|
701
|
|
|||
|
Depreciable property and intangible assets
|
(363
|
)
|
(363
|
)
|
|||
|
Prepaid expenses
|
(53
|
)
|
(45
|
)
|
|||
|
Investment securities
|
—
|
|
(37
|
)
|
|||
|
Total deferred income tax liabilities
|
(416
|
)
|
(445
|
)
|
|||
|
Total net deferred income tax assets
|
$
|
399
|
|
$
|
256
|
|
|
|
Amounts recognized in the consolidated balance sheets:
|
|||||||
|
Other long-term assets
|
$
|
399
|
|
$
|
256
|
|
|
In November 2015, the FASB issued new guidance related to accounting for income taxes which changes the balance sheet classification of deferred taxes, requiring deferred tax liabilities and assets be classified as noncurrent in a classified statement of financial position.
We elected to early adopt the guidance and have classified all deferred tax liabilities and assets as noncurrent in our consolidated balance sheets at December 31, 2016 and 2015 to simplify their presentation.
At December 31,
2016
, we had approximately
$138 million
of net operating losses to carry forward related to prior acquisitions and our Puerto Rico subsidiaries. These net operating loss carryforwards, if not used to offset future taxable income, will expire from 2017 through
2033
. Due to limitations and uncertainty regarding our ability to use some of the carryforwards, a valuation allowance was established on
$126 million
of these net operating loss carryforwards and
$4 million
of other items related to Puerto Rico. For the remainder of the net operating loss carryforwards and other cumulative temporary differences, based on our historical record of producing taxable income and profitability, we have concluded that future operating income will be sufficient to give rise to tax expense to recover all deferred tax assets.
We provide for income taxes on the undistributed earnings of our Puerto Rico operations using that jurisdiction’s tax rate, which has been lower historically than the U.S. statutory tax rate. Permanent investment of these earnings has resulted in cumulative unrecognized deferred tax liabilities of approximately
$30 million
as of December 31,
2016
.
We file income tax returns in the United States and certain foreign jurisdictions. The U.S. Internal Revenue Service, or IRS, has completed its examinations of our consolidated income tax returns for 2014 and prior years. Our 2015 tax return is in the post-filing review period under the Compliance Assurance Process (CAP). Our 2016 tax return is under advance review by the IRS under CAP. With few exceptions, which are immaterial in the aggregate, we no longer are subject to state, local and foreign tax examinations for years before 2013. We are not aware of any material adjustments that may be proposed.
117
Humana Inc.
NOTES TO CONSOLIDATED FINANCIAL STATEMENTS—(Continued)
12. DEBT
The carrying value of long-term debt outstanding was as follows at December 31,
2016
and
2015
:
|
2016
|
2015
|
||||||
|
|
(in millions)
|
||||||
|
Long-term debt:
|
|||||||
|
Senior notes:
|
|||||||
|
$500 million, 7.20% due June 15, 2018
|
$
|
501
|
|
$
|
502
|
|
|
|
$300 million, 6.30% due August 1, 2018
|
304
|
|
307
|
|
|||
|
$400 million, 2.625% due October 1, 2019
|
398
|
|
398
|
|
|||
|
$600 million, 3.15% due December 1, 2022
|
595
|
|
595
|
|
|||
|
$600 million, 3.85% due October 1, 2024
|
595
|
|
595
|
|
|||
|
$250 million, 8.15% due June 15, 2038
|
264
|
|
263
|
|
|||
|
$400 million, 4.625% due December 1, 2042
|
396
|
|
396
|
|
|||
|
$750 million, 4.95% due October 1, 2044
|
739
|
|
738
|
|
|||
|
Total long-term debt
|
$
|
3,792
|
|
$
|
3,794
|
|
|
Senior Notes
In September 2014, we issued $400 million of 2.625% senior notes due October 1, 2019, $600 million of 3.85% senior notes due October 1, 2024 and $750 million of 4.95% senior notes due October 1, 2044.
Our net proceeds, reduced for the underwriters' discount and commission and offering expenses, were
$1.73 billion
.
We used a portion of the net proceeds to redeem the $500 million 6.45% senior unsecured notes as discussed below.
In October 2014, we redeemed the $500 million 6.45% senior unsecured notes due June 1, 2016, at
100%
of the principal amount plus applicable premium for early redemption and accrued and unpaid interest to the redemption date
, for cash totaling approximately
$560 million
.
We recognized a loss on extinguishment of debt of approximately
$37 million
in October 2014
for the redemption of these notes which is included in interest expense in the consolidated statement of income.
Our senior notes, which are unsecured, may be redeemed at our option at any time at
100%
of the principal amount plus accrued interest and a specified make-whole amount. The
7.20%
and
8.15%
senior notes are subject to an interest rate adjustment if the debt ratings assigned to the notes are downgraded (or subsequently upgraded). In addition, our senior notes (other than the
6.30%
senior notes) contain a change of control provision that may require us to purchase the notes under certain circumstances.
Prior to 2009, we were parties to interest-rate swap agreements that exchanged the fixed interest rate under our senior notes for a variable interest rate based on LIBOR. As a result, the carrying value of the senior notes was adjusted to reflect changes in value caused by an increase or decrease in interest rates. During 2008, we terminated all of our swap agreements. The cumulative adjustment to the carrying value of our senior notes was
$103 million
as of the termination date which is being amortized as a reduction to interest expense over the remaining term of the senior notes. In October 2014, the redemption of our
6.45%
senior notes reduced the unamortized carrying value adjustment by
$12 million
. The unamortized carrying value adjustment was
$23 million
as of December 31,
2016
and
$28 million
as of December 31,
2015
.
118
Humana Inc.
NOTES TO CONSOLIDATED FINANCIAL STATEMENTS—(Continued)
Credit Agreement
Our
5
-year
$1.0 billion
unsecured revolving credit agreement expires July 2018. Under the credit agreement, at our option, we can borrow on either a competitive advance basis or a revolving credit basis. The revolving credit portion bears interest at either LIBOR plus a spread or the base rate plus a spread. The LIBOR spread, currently
100
basis points, varies depending on our credit ratings ranging from
90
to
150
basis points. We also pay an annual facility fee regardless of utilization. This facility fee, currently
12.5
basis points, may fluctuate between
10
and
25
basis points, depending upon our credit ratings. The competitive advance portion of any borrowings will bear interest at market rates prevailing at the time of borrowing on either a fixed rate or a floating rate based on LIBOR, at our option.
The terms of the credit agreement include standard provisions related to conditions of borrowing, including a customary material adverse effect clause which could limit our ability to borrow additional funds. In addition, the credit agreement contains customary restrictive and financial covenants as well as customary events of default, including financial covenants regarding the maintenance of a minimum level of net worth of
$9.0 billion
at December 31,
2016
and a maximum leverage ratio of
3.0:1
. We are in compliance with the financial covenants, with actual net worth of
$10.7 billion
and an actual leverage ratio of
1.4:1
, as measured in accordance with the credit agreement as of December 31,
2016
. In addition, the credit agreement includes an uncommitted
$250 million
incremental loan facility.
At December 31,
2016
, we had
no
borrowings outstanding under the credit agreement and
no
letters of credit outstanding under the credit agreement
. Accordingly, as of December 31,
2016
, we had
$1 billion
of remaining borrowing capacity under the credit agreement, none of which would be restricted by our financial covenant compliance requirement. We have other customary, arms-length relationships, including financial advisory and banking, with some parties to the credit agreement.
Commercial Paper
In October 2014, we entered into a commercial paper program pursuant to which we may issue short-term, unsecured commercial paper notes privately placed on a discount basis through certain broker dealers. Amounts available under the program may be borrowed, repaid and re-borrowed from time to time, with the aggregate face or principal amount outstanding under the program at any time not to exceed
$1 billion
. The net proceeds of issuances have been and are expected to be used for general corporate purposes. The maximum principal amount outstanding at any one time during the
year ended
December 31, 2016
was
$475 million
, with
$300 million
outstanding at
December 31, 2016
, compared to
$299 million
outstanding at December 31,
2015
.
13. EMPLOYEE BENEFIT PLANS
Employee Savings Plan
We have defined contribution retirement savings plans covering eligible employees which include matching contributions based on the amount of our employees’ contributions to the plans. The cost of these plans amounted to approximately
$196 million
in
2016
,
$188 million
in
2015
, and
$176 million
in
2014
. The Company’s cash match is invested pursuant to the participant’s contribution direction. Based on the closing price of our common stock of
$204.03
on December 31,
2016
, approximately
13%
of the retirement and savings plan’s assets were invested in our common stock, or approximately
2.5 million
shares, representing
2%
of the shares outstanding as of December 31,
2016
. At December 31,
2016
, approximately
2.8 million
shares of our common stock were reserved for issuance under our defined contribution retirement savings plans.
Stock-Based Compensation
We have plans under which options to purchase our common stock and restricted stock units have been granted to executive officers, directors and key employees. For awards granted prior to July 2, 2015, our equity award agreements generally contain provisions whereby the awards automatically accelerate and vest upon change in control, including those granted to retirement-eligible participants described below. Awards granted on or after July 2, 2015 would generally require both a change in control and termination of employment within 2 years of the date of the change in control to accelerate the vesting, including those granted to retirement-eligible participants.
119
Humana Inc.
NOTES TO CONSOLIDATED FINANCIAL STATEMENTS—(Continued)
The terms and vesting schedules for stock-based awards vary by type of grant. Generally, the awards vest upon time-based conditions. We have also granted awards to certain employees that vest upon a combination of time and performance-based conditions. The stock awards of retirement-eligible participants granted prior to July 2, 2015 generally will continue to fully vest on the originally scheduled vest date upon retirement from the Company. For stock awards of retirement-eligible employees granted on or after July 2, 2015, awards are generally earned ratably over the service period for each tranche. Accordingly, upon retirement the earned portion of the current tranche will continue to vest on the originally scheduled vest date and any remaining unearned portion of the award will be forfeited. Our equity award program includes a retirement provision that generally treats employees with a combination of age and years of services with the Company totaling
65
or greater, with a minimum required age of
55
and a minimum requirement of
5
years of service, as retirement-eligible. Upon exercise, stock-based compensation awards are settled with authorized but unissued company stock or treasury stock.
The compensation expense that has been charged against income for these plans was as follows for the
years ended December 31,
2016
,
2015
, and
2014
:
|
2016
|
2015
|
2014
|
|||||||||
|
|
(in millions)
|
||||||||||
|
Stock-based compensation expense by type:
|
|||||||||||
|
Restricted stock
|
$
|
106
|
|
$
|
99
|
|
$
|
91
|
|
||
|
Stock options
|
9
|
|
10
|
|
7
|
|
|||||
|
Total stock-based compensation expense
|
115
|
|
109
|
|
98
|
|
|||||
|
Tax benefit recognized
|
(20
|
)
|
(26
|
)
|
(22
|
)
|
|||||
|
Stock-based compensation expense, net of tax
|
$
|
95
|
|
$
|
83
|
|
$
|
76
|
|
||
The tax benefit recognized in our consolidated financial statements is based on the amount of compensation expense recorded for book purposes, subject to limitations on the deductibility of annual compensation in excess of
$500,000
per employee as mandated by the Health Care Reform Law. The actual tax benefit realized in our tax return is based on the intrinsic value, or the excess of the market value over the exercise or purchase price, of stock options exercised and restricted stock vested during the period, subject to limitations on the deductibility of annual compensation in excess of
$500,000
per employee as mandated by the Health Care Reform Law. The actual tax benefit realized for the deductions taken on our tax returns from option exercises and restricted stock vesting totaled
$53 million
in
2016
,
$34 million
in
2015
, and
$30 million
in
2014
. There was no capitalized stock-based compensation expense during these years.
At December 31,
2016
, there were
16.4 million
shares reserved for stock award plans. These reserved shares included giving effect to, under the 2011 Plan,
7.1 million
shares of common stock available for future grants assuming all stock options were granted or
3.1 million
shares available for future grants assuming all restricted stock were granted. Shares may be issued from authorized but unissued company stock or treasury stock.
120
Humana Inc.
NOTES TO CONSOLIDATED FINANCIAL STATEMENTS—(Continued)
Restricted Stock
Restricted stock is granted with a fair value equal to the market price of our common stock on the date of grant and generally vests
three
years from the date of grant. Restricted stock granted on or after July 2, 2015, generally vests in equal annual tranches over a three year period from the date of grant. Certain of our restricted stock units also include performance-based conditions generally associated with strategic membership growth and return on invested capital. Restricted stock units have forfeitable dividend equivalent rights equal to the dividend paid on common stock. The weighted-average grant date fair value of our restricted stock was
$168.12
in
2016
,
$165.26
in
2015
, and
$103.57
in
2014
. Activity for our restricted stock was as follows for the year ended December 31,
2016
:
|
Shares
|
Weighted-
Average Grant-Date Fair Value |
|||||
|
|
(shares in thousands)
|
|||||
|
Nonvested restricted stock at December 31, 2015
|
3,365
|
|
$
|
104.58
|
|
|
|
Granted
|
656
|
|
168.12
|
|
||
|
Vested
|
(1,455
|
)
|
87.77
|
|
||
|
Forfeited
|
(74
|
)
|
135.32
|
|
||
|
Nonvested restricted stock at December 31, 2016
|
2,492
|
|
$
|
121.94
|
|
|
Approximately
27%
of the nonvested restricted stock at December 31,
2016
included performance-based conditions.
The fair value of shares vested was
$253 million
during
2016
,
$153 million
during
2015
, and
$99 million
during
2014
. Total compensation expense not yet recognized related to nonvested restricted stock was
$97 million
at December 31,
2016
. We expect to recognize this compensation expense over a weighted-average period of approximately
1.7
years. There are no other contractual terms covering restricted stock once vested.
Stock Options
Stock options are granted with an exercise price equal to the fair market value of the underlying common stock on the date of grant. Our stock plans, as approved by the Board of Directors and stockholders, define fair market value as the average of the highest and lowest stock prices reported on the composite tape by the New York Stock Exchange on a given date. Exercise provisions vary, but most options vest in whole or in part
1
to
3
years after grant and expire
7
years after grant.
The weighted-average fair value of each option granted during
2016
,
2015
, and
2014
is provided below. The fair value was estimated on the date of grant using the Black-Scholes pricing model with the weighted-average assumptions indicated below:
|
2016
|
2015
|
2014
|
|||||||||
|
Weighted-average fair value at grant date
|
$
|
37.12
|
|
$
|
36.91
|
|
$
|
22.45
|
|
||
|
Expected option life (years)
|
4.2 years
|
|
4.2 years
|
|
4.3 years
|
|
|||||
|
Expected volatility
|
27.6
|
%
|
27.4
|
%
|
27.6
|
%
|
|||||
|
Risk-free interest rate at grant date
|
1.1
|
%
|
1.4
|
%
|
1.3
|
%
|
|||||
|
Dividend yield
|
0.7
|
%
|
0.7
|
%
|
1.1
|
%
|
|||||
When valuing employee stock options, we stratify the employee population into three homogeneous groups that historically have exhibited similar exercise behaviors. These groups are executive officers, directors, and all other employees. We value the stock options based on the unique assumptions for each of these employee groups.
121
Humana Inc.
NOTES TO CONSOLIDATED FINANCIAL STATEMENTS—(Continued)
We calculate the expected term for our employee stock options based on historical employee exercise behavior and base the risk-free interest rate on a traded zero-coupon U.S. Treasury bond with a term substantially equal to the option’s expected term.
The volatility used to value employee stock options is based on historical volatility. We calculate historical volatility using a simple-average calculation methodology based on daily price intervals as measured over the expected term of the option.
Activity for our option plans was as follows for the year ended December 31,
2016
:
|
Shares Under
Option |
Weighted-Average
Exercise Price |
|||||
|
|
(shares in thousands)
|
|||||
|
Options outstanding at December 31, 2015
|
835
|
|
$
|
121.89
|
|
|
|
Granted
|
362
|
|
167.81
|
|
||
|
Exercised
|
(161
|
)
|
86.86
|
|
||
|
Forfeited
|
(14
|
)
|
163.94
|
|
||
|
Options outstanding at December 31, 2016
|
1,022
|
|
$
|
143.04
|
|
|
|
Options exercisable at December 31, 2016
|
342
|
|
$
|
111.28
|
|
|
As of December 31,
2016
, outstanding stock options, substantially all of which are expected to vest, had an aggregate intrinsic value of
$62 million
, and a weighted-average remaining contractual term of
4.9
years. As of December 31,
2016
, exercisable stock options had an aggregate intrinsic value of
$32 million
, and a weighted-average remaining contractual term of
3.8
years. The total intrinsic value of stock options exercised during
2016
was
$18 million
, compared with
$28 million
during
2015
and
$32 million
during
2014
. Cash received from stock option exercises totaled
$14 million
in
2016
,
$23 million
in
2015
, and
$52 million
in
2014
.
Total compensation expense not yet recognized related to nonvested options was
$14 million
at December 31,
2016
. We expect to recognize this compensation expense over a weighted-average period of approximately
1.7
years.
14. EARNINGS PER COMMON SHARE COMPUTATION
Detail supporting the computation of basic and diluted earnings per common share was as follows for the years ended December 31,
2016
,
2015
and
2014
:
|
2016
|
2015
|
2014
|
|||||||||
|
|
(dollars in millions, except per
common share results, number of shares/options in thousands) |
||||||||||
|
Net income available for common stockholders
|
$
|
614
|
|
$
|
1,276
|
|
$
|
1,147
|
|
||
|
Weighted-average outstanding shares of common stock used to
compute basic earnings per common share |
149,375
|
|
149,455
|
|
154,187
|
|
|||||
|
Dilutive effect of:
|
|||||||||||
|
Employee stock options
|
219
|
|
192
|
|
230
|
|
|||||
|
Restricted stock
|
1,323
|
|
1,495
|
|
1,457
|
|
|||||
|
Shares used to compute diluted earnings per common share
|
150,917
|
|
151,142
|
|
155,874
|
|
|||||
|
Basic earnings per common share
|
$
|
4.11
|
|
$
|
8.54
|
|
$
|
7.44
|
|
||
|
Diluted earnings per common share
|
$
|
4.07
|
|
$
|
8.44
|
|
$
|
7.36
|
|
||
|
Number of antidilutive stock options and restricted stock awards
excluded from computation |
748
|
|
415
|
|
320
|
|
|||||
122
Humana Inc.
NOTES TO CONSOLIDATED FINANCIAL STATEMENTS—(Continued)
15. STOCKHOLDERS’ EQUITY
As discussed in Note 2, we elected to early adopt new guidance related to accounting for employee share-based payments prospectively effective January 1, 2016. The adoption of this new guidance resulted in the recognition of approximately
$20 million
of tax benefits in net income in our consolidated statement of income for the three months ended March 31, 2016 that had previously been recorded as additional paid-in capital in our consolidated balance sheet.
Dividends
The following table provides details of dividend payments, excluding dividend equivalent rights, in
2014
,
2015
, and
2016
under our Board approved quarterly cash dividend policy:
|
Payment
Date |
Amount
per Share |
Total
Amount |
||
|
(in millions)
|
||||
|
2014
|
$1.10
|
$170
|
||
|
2015
|
$1.14
|
$170
|
||
|
2016
|
$1.16
|
$172
|
||
Under the terms of the Merger Agreement, we agreed with Aetna that our quarterly dividend would not exceed $0.29 per share prior to the closing or termination of the Merger.
On
October 26, 2016
, the Board declared a cash dividend of
$0.29
per share that was paid on
January 27, 2017
to stockholders of record on
January 12, 2017
, for an aggregate amount of
$43 million
.
On February 14, 2017, following the termination of the Merger Agreement, the Board declared a cash dividend of
$0.40
per share, to be paid on April 28, 2017, to the stockholders of record on March 31, 2017
.
Declaration and payment of future quarterly dividends is at the discretion of our Board and may be adjusted as business needs or market conditions change.
Stock Repurchases
In
September 2014
, our Board of Directors replaced a previous share repurchase authorization of up to
$1 billion
(of which
$816 million
remained unused) with an authorization for repurchases of up to
$2 billion
of our common shares exclusive of shares repurchased in connection with employee stock plans, which expired on
December 31, 2016
.
Under the share repurchase authorization, shares may have been purchased from time to time at prevailing prices in the open market, by block purchases, through plans designed to comply with Rule 10b5-1 under the Securities Exchange Act of 1934, as amended, or in privately-negotiated transactions (including pursuant to accelerated share repurchase agreements with investment banks), subject to certain regulatory restrictions on volume, pricing, and timing.
Pursuant to the Merger Agreement, after July 2, 2015, we were prohibited from repurchasing any of our outstanding securities without the prior written consent of Aetna, other than repurchases of shares of our common stock in connection with the exercise of outstanding stock options or the vesting or settlement of outstanding restricted stock awards. Accordingly, as announced on July 3, 2015, we suspended our share repurchase program.
123
Humana Inc.
NOTES TO CONSOLIDATED FINANCIAL STATEMENTS—(Continued)
On February 14, 2017, we and Aetna agreed to mutually terminate the Merger Agreement. We also announced that the Board had approved a new authorization for share repurchases of up to
$2.25 billion
of our common stock exclusive of shares repurchased in connection with employee stock plans, expiring on December 31, 2017.
Excluding shares acquired in connection with employee stock plans as well as
0.36 million
shares received in March 2015 upon final settlement of our accelerated share repurchase agreement, or ASR Agreement, described below, for which no cash was paid during the period, share repurchases were as follows during the years ended December 31,
2015
and
2014
. Excluding shares acquired in connection with employee stock plans, there were no share repurchases in 2016.
|
Year Ended December 31,
|
|||||||||||||||||||
|
2015
|
2014
|
||||||||||||||||||
|
Authorization Date
|
Purchase Not to Exceed
|
Shares
|
Cost
|
Shares
|
Cost
|
||||||||||||||
|
(in millions)
|
|||||||||||||||||||
|
September 2014
|
$
|
2,000
|
|
1.85
|
|
$
|
329
|
|
4.10
|
|
$
|
635
|
|
(a)
|
|||||
|
April 2014
|
1,000
|
|
—
|
|
—
|
|
1.50
|
|
184
|
|
|||||||||
|
April 2013
|
1,000
|
|
—
|
|
—
|
|
0.10
|
|
11
|
|
|||||||||
|
Total repurchases
|
1.85
|
|
$
|
329
|
|
5.70
|
|
$
|
830
|
|
|||||||||
(a) Includes
$100 million
held back by Goldman Sachs pending final settlement of the ASR
Agreement in March 2015 at which time we received an additional
0.36 million
shares which
are excluded from the table above.
On
November 7, 2014
, we announced that we had entered into an accelerated share repurchase agreement, or ASR Agreement, with Goldman, Sachs & Co., or Goldman Sachs, to repurchase
$500 million
of our common stock as part of the
$2 billion
share repurchase program authorized in
September 2014
.
Under the ASR Agreement, on
November 10, 2014
, we made a payment of
$500 million
to Goldman Sachs from available cash on hand and received an initial delivery of
3.06 million
shares of our common stock from Goldman Sachs based on the then current market price of Humana common stock.
The payment to Goldman Sachs was recorded as a reduction to stockholders’ equity, consisting of a
$400 million
increase in treasury stock, which reflected the value of the initial
3.06 million
shares received upon initial settlement, and a
$100 million
decrease in capital in excess of par value, which reflected the value of stock held back by Goldman Sachs pending final settlement of the ASR Agreement.
Upon settlement of the ASR on
March 13, 2015
, we received an additional
0.36 million
shares as determined by the average daily volume weighted-average share price of our common stock during the term of the ASR Agreement of
$146.21
,
bringing the total shares received under this program to
3.42 million
. In addition, upon settlement we reclassified the
$100 million
value of stock initially held back by Goldman Sachs from capital in excess of par value to treasury stock.
In connection with employee stock plans, we acquired
0.6 million
common shares for
$104 million
in
2016
,
0.3 million
common shares for
$56 million
in
2015
, and
0.4 million
common shares for
$42 million
in
2014
.
Regulatory Requirements
Certain of our subsidiaries operate in states that regulate the payment of dividends, loans, or other cash transfers to Humana Inc., our parent company, and require minimum levels of equity as well as limit investments to approved securities. The amount of dividends that may be paid to Humana Inc. by these subsidiaries, without prior approval by state regulatory authorities, or ordinary dividends, is limited based on the entity’s level of statutory income and statutory capital and surplus. In most states, prior notification is provided before paying a dividend even if approval is not required.
Although minimum required levels of equity are largely based on premium volume, product mix, and the quality of assets held, minimum requirements vary significantly at the state level. Our state regulated insurances subsidiaries had aggregate statutory capital and surplus of approximately
$7.7 billion
and
$6.6 billion
as of December 31,
2016
and
2015
,
respectively, which exceeded aggregate minimum regulatory requirements of
$4.8 billion
and
$4.6 billion
, respectively.
Subsidiary dividends are subject to state regulatory approval, the amount and timing of which could be
124
Humana Inc.
NOTES TO CONSOLIDATED FINANCIAL STATEMENTS—(Continued)
reduced or delayed.
Excluding Puerto Rico subsidiaries, the amount of ordinary dividends that may be paid to our parent company in
2017
is approximately
$850 million
in the aggregate. This compares to dividends that were paid to our parent company in
2016
of approximately
$763 million
.
Actual dividends paid may vary due to consideration of excess statutory capital and surplus and expected future surplus requirements related to, for example, premium volume and product mix.
16. COMMITMENTS, GUARANTEES AND CONTINGENCIES
Leases
We lease facilities, computer hardware, and other furniture and equipment under long-term operating leases that are noncancelable and expire on various dates through
2037
. We sublease facilities or partial facilities to third party tenants for space not used in our operations. Rent with scheduled escalation terms are accounted for on a straight-line basis over the lease term. Rent expense and sublease rental income, which are recorded net as an operating cost, for all operating leases were as follows for the years ended December 31,
2016
,
2015
and
2014
:
|
2016
|
2015
|
2014
|
|||||||||
|
|
(in millions)
|
||||||||||
|
Rent expense
|
$
|
179
|
|
$
|
201
|
|
$
|
226
|
|
||
|
Sublease rental income
|
(26
|
)
|
(25
|
)
|
(14
|
)
|
|||||
|
Net rent expense
|
$
|
153
|
|
$
|
176
|
|
$
|
212
|
|
||
Future annual minimum payments due subsequent to December 31,
2016
under all of our noncancelable operating leases with initial terms in excess of one year are as follows:
|
Minimum
Lease Payments |
Sublease
Rental Receipts |
Net Lease
Commitments |
|||||||||
|
|
(in millions)
|
||||||||||
|
For the years ending December 31,:
|
|||||||||||
|
2017
|
$
|
185
|
|
$
|
(19
|
)
|
$
|
166
|
|
||
|
2018
|
157
|
|
(18
|
)
|
139
|
|
|||||
|
2019
|
126
|
|
(14
|
)
|
112
|
|
|||||
|
2020
|
81
|
|
(11
|
)
|
70
|
|
|||||
|
2021
|
53
|
|
(8
|
)
|
45
|
|
|||||
|
Thereafter
|
95
|
|
(17
|
)
|
78
|
|
|||||
|
Total
|
$
|
697
|
|
$
|
(87
|
)
|
$
|
610
|
|
||
Purchase Obligations
We have agreements to purchase services, primarily information technology related services, or to make improvements to real estate, in each case that are enforceable and legally binding on us and that specify all significant terms, including: fixed or minimum levels of service to be purchased; fixed, minimum or variable price provisions; and the appropriate timing of the transaction. We have purchase obligation commitments of
$184 million
in
2017
,
$108 million
in
2018
,
$48 million
in
2019
,
$5 million
in
2020
, and
$3 million
thereafter. Purchase obligations exclude agreements that are cancelable without penalty.
Off-Balance Sheet Arrangements
As part of our ongoing business, we do not participate or knowingly seek to participate in transactions that generate relationships with unconsolidated entities or financial partnerships, such as entities often referred to as structured finance or special purpose entities, or SPEs, which would have been established for the purpose of facilitating off-balance sheet
125
Humana Inc.
NOTES TO CONSOLIDATED FINANCIAL STATEMENTS—(Continued)
arrangements or other contractually narrow or limited purposes. As of December 31,
2016
, we were not involved in any SPE transactions.
Guarantees and Indemnifications
Through indemnity agreements approved by the state regulatory authorities, certain of our regulated subsidiaries generally are guaranteed by Humana Inc., our parent company, in the event of insolvency for (1) member coverage for which premium payment has been made prior to insolvency; (2) benefits for members then hospitalized until discharged; and (3) payment to providers for services rendered prior to insolvency. Our parent also has guaranteed the obligations of our military services subsidiaries.
In the ordinary course of business, we enter into contractual arrangements under which we may agree to indemnify a third party to such arrangement from any losses incurred relating to the services they perform on behalf of us, or for losses arising from certain events as defined within the particular contract, which may include, for example, litigation or claims relating to past performance. Such indemnification obligations may not be subject to maximum loss clauses. Historically, payments made related to these indemnifications have been immaterial.
Government Contracts
Our Medicare products, which accounted for approximately
74%
of our total premiums and services revenue for the year ended December 31,
2016
, primarily consisted of products covered under the Medicare Advantage and Medicare Part D Prescription Drug Plan contracts with the federal government. These contracts are renewed generally for a calendar year term unless CMS notifies us of its decision not to renew by May 1 of the calendar year in which the contract would end, or we notify CMS of our decision not to renew by the first Monday in June of the calendar year in which the contract would end. All material contracts between Humana and CMS relating to our Medicare products have been renewed for
2017
, and all of our product offerings filed with CMS for
2017
have been approved.
CMS uses a risk-adjustment model which apportions premiums paid to Medicare Advantage, or MA, plans according to health severity of covered members. The risk-adjustment model, which CMS implemented pursuant to the Balanced Budget Act of 1997(BBA) and the Benefits Improvement and Protection Act of 2000 (BIPA), generally pays more where a plan's membership has higher expected costs. Under this model, rates paid to MA plans are based on actuarially determined bids, which include a process whereby our prospective payments are based on a comparison of our beneficiaries’ risk scores, derived from medical diagnoses, to those enrolled in the government’s traditional fee-for-service Medicare program (referred to as "Medicare FFS"). Under the risk-adjustment methodology, all MA plans must collect and submit the necessary diagnosis code information from hospital inpatient, hospital outpatient, and physician providers to CMS within prescribed deadlines. The CMS risk-adjustment model uses the diagnosis data to calculate the risk-adjusted premium payment to MA plans, which CMS adjusts for coding pattern differences between the health plans and the government fee-for-service program. We generally rely on providers, including certain providers in our network who are our employees, to code their claim submissions with appropriate diagnoses, which we send to CMS as the basis for our payment received from CMS under the actuarial risk-adjustment model. We also rely on these providers to document appropriately all medical data, including the diagnosis data submitted with claims. In addition, we conduct medical record reviews as part of our data and payment accuracy compliance efforts, to more accurately reflect diagnosis conditions under the risk adjustment model. These compliance efforts include the internal contract level audits described in more detail below.
CMS is phasing-in the process of calculating risk scores using diagnoses data from the Risk Adjustment Processing System, or RAPS, to diagnosis data from the Encounter Data System, or EDS. The RAPS process requires MA plans to apply a filter logic based on CMS guidelines and only submit those claims that pass the filtering logic. For submissions through EDS, CMS requires MA plans to submit all the claims data and CMS will apply the risk adjustment filtering logic to determine the risk adjustment data used to calculate risk scores. For 2016, 10% of the risk score was calculated from claims data submitted through EDS, increasing to 25% of the risk score calculated from claims data through EDS for 2017.
The phase-in from RAPS to EDS could result in different risk scores from each dataset as a result of plan processing issues, CMS processing issues, or filtering logic differences between RAPS and EDS, and could have a material adverse effect on our results of operations, financial position, or cash flows.
126
Humana Inc.
NOTES TO CONSOLIDATED FINANCIAL STATEMENTS—(Continued)
CMS is continuing to perform audits of various companies’ selected MA contracts related to this risk adjustment diagnosis data. We refer to these audits as Risk-Adjustment Data Validation Audits, or RADV audits. RADV audits review medical records in an attempt to validate provider medical record documentation and coding practices which influence the calculation of premium payments to MA plans.
In 2012, CMS released a “Notice of Final Payment Error Calculation Methodology for Part C Medicare Advantage Risk Adjustment Data Validation (RADV) Contract-Level Audits.” The payment error calculation methodology provides that, in calculating the economic impact of audit results for an MA contract, if any, the results of the audit sample will be extrapolated to the entire MA contract based upon a comparison to “benchmark” audit data in Medicare FFS (which we refer to as the "FFS Adjuster"). This comparison to the FFS Adjuster is necessary to determine the economic impact, if any, of audit results because the government program data set, including any attendant errors that are present in that data set, provides the basis for MA plans’ risk adjustment to payment rates. CMS already makes other adjustments to payment rates based on a comparison of coding pattern differences between MA plans and Medicare FFS data (such as for frequency of coding for certain diagnoses in MA plan data versus the government program data set).
The final methodology, including the first application of extrapolated audit results to determine audit settlements, is expected to be applied to RADV contract level audits conducted for contract year 2011 and subsequent years. CMS is currently conducting RADV contract level audits for contract years 2011, 2012, and 2013, in which two, five, and five of our Medicare Advantage plans are being audited, respectively. Per CMS guidance, selected MA contracts will be notified of an audit at some point after the close of the final reconciliation for the payment year being audited. The final reconciliation occurs in August of the calendar year following the payment year.
Estimated audit settlements are recorded as a reduction of premiums revenue in our consolidated statements of income, based upon available information. We perform internal contract level audits based on the RADV audit methodology prescribed by CMS. Included in these internal contract level audits is an audit of our Private Fee-For-Service business which we used to represent a proxy of the FFS Adjuster which has not yet been released. We based our accrual of estimated audit settlements for each contract year on the results of these internal contract level audits and update our estimates as each audit is completed. Estimates derived from these results were not material to our results of operations, financial position, or cash flows. However, as indicated, we are awaiting additional guidance from CMS regarding the FFS Adjuster. Accordingly, we cannot determine whether such RADV audits will have a material adverse effect on our results of operations, financial position, or cash flows.
In addition, CMS' comments in formalized guidance regarding “overpayments” to MA plans appear to be inconsistent with CMS' prior RADV audit guidance. These statements, contained in the preamble to CMS’ final rule release regarding Medicare Advantage and Part D prescription drug benefit program regulations for Contract Year 2015, appear to equate each Medicare Advantage risk adjustment data error with an “overpayment” without reconciliation to the principles underlying the FFS Adjuster referenced above. We will continue to work with CMS to ensure that MA plans are paid accurately and that payment model principles are in accordance with the requirements of the Social Security Act, which, if not implemented correctly could have a material adverse effect on our results of operations, financial position, or cash flows.
At December 31,
2016
, our military services business, which accounted for approximately
1%
of our total premiums and services revenue for the
year ended December 31, 2016
, primarily consisted of the TRICARE South Region contract. The current
5
-year South Region contract, which expires
March 31, 2017
, is subject to annual renewals on April 1 of each year during its term at the government’s option.
On March 30, 2016, we received notice the Defense Health Agency, or DHA, exercised its option to extend the TRICARE South Region contract through March 31, 2017. On July 21, 2016, we were notified by the DHA that we were awarded the contract for the new TRICARE East Region, which is a consolidation of the former North and South Regions, with delivery of health care services expected to commence on October 1, 2017. The next generation East Region and West Region contract awards are currently subject to protests by unsuccessful bidders in the U.S. Court of Federal Claims and before the DHA.
Our state-based Medicaid business accounted for approximately
5%
of our total premiums and services revenue for the
year ended December 31, 2016
. In addition to our state-based Temporary Assistance for Needy Families, or TANF, Medicaid contracts in Florida and Kentucky, we have contracts in Florida for Long Term Support Services
127
Humana Inc.
NOTES TO CONSOLIDATED FINANCIAL STATEMENTS—(Continued)
(LTSS), in Illinois and Virginia for stand-alone dual eligible demonstration programs serving individuals dually eligible for both the federal Medicare program and the applicable state-based Medicaid program as well as an Integrated Care Program, or ICP, Medicaid contract in Illinois.
The loss of any of the contracts above or significant changes in these programs as a result of legislative or regulatory action, including reductions in premium payments to us, regulatory restrictions on profitability, including by comparison of our Medicare Advantage profitability to our non-Medicare Advantage business profitability and a requirement that they remain within certain ranges of each other, or increases in member benefits without corresponding increases in premium payments to us, may have a material adverse effect on our results of operations, financial position, and cash flows.
Legal Proceedings and Certain Regulatory Matters
Florida Matters
On January 6, 2012, the Civil Division of the United States Attorney’s Office for the Southern District of Florida advised us that it is seeking documents and information from us and several of our affiliates relating to several matters including the coding of medical claims by one or more South Florida medical providers, and loans to physician practices. On May 1, 2014, the U.S. Attorney's Office filed a Notice of Non-Intervention in connection with a civil qui tam suit related to one of these matters captioned
United States of America ex rel. Olivia Graves v. Plaza Medical Centers, et al.
, and the Court ordered the complaint unsealed. Subsequently, the individual plaintiff amended the complaint and served the Company, opting to continue to pursue the action. The individual plaintiff has filed a fourth amended complaint which we answered on February 19, 2016. The Court has ordered trial to commence on March 6, 2017 if the matter is not resolved prior to trial. We continue to cooperate with and respond to information requests from the U.S. Attorney’s office. These matters could result in additional qui tam litigation.
As previously disclosed, the Civil Division of the United States Department of Justice had provided us with an information request, separate from but related to the Plaza Medical matter, concerning our Medicare Part C risk adjustment practices. The request relates to our oversight and submission of risk adjustment data generated by providers in our Medicare Advantage network, including the providers identified in the Plaza Medical matter, as well as to our business and compliance practices related to risk adjustment data generated by our providers and by us, including medical record reviews conducted as part of our data and payment accuracy compliance efforts, the use of health and well-being assessments, and our fraud detection efforts. We believe that this request for information is in connection with a wider review of Medicare Risk Adjustment generally that includes a number of Medicare Advantage plans, providers and vendors. We continue to cooperate with and voluntarily respond to the information requests from the Department of Justice and the U.S. Attorney’s Office. These matters are expected to result in additional qui tam litigation.
Litigation Related to the Merger
DOJ Action
On July 21, 2016, the United States government (acting under the U.S. Attorney General), along with the states of Delaware, Florida, Georgia, Illinois, Iowa and Ohio, the commonwealths of Pennsylvania and Virginia, and the District of Columbia, acting by and through their respective attorneys general, filed a civil complaint against us and Aetna in the U.S. District Court for the District of Columbia (we refer to this as the DOJ Action). The complaint alleges, among other things, that the proposed Merger would violate Section 7 of the Clayton Antitrust Act and seeks a permanent injunction to prevent the Merger. The trial commenced on December 5, 2016 and concluded on December 30, 2016. On January 23, 2017, the Court ruled in favor of the DOJ and granted a permanent injunction of the proposed transaction. On February 14, 2017, we and Aetna agreed to mutually terminate the Merger Agreement.
Shareholder Action
In connection with the Merger,
three
putative class action complaints were filed by purported Humana stockholders challenging the Merger,
two
in the Circuit Court of Jefferson County, Kentucky and
one
in the Court of Chancery of the State of Delaware. The complaints are captioned Solak v. Broussard et al., Civ. Act. No. 15CI03374 (Kentucky
128
Humana Inc.
NOTES TO CONSOLIDATED FINANCIAL STATEMENTS—(Continued)
state court), Litwin v. Broussard et al., Civ. Act. No. 15CI04054 (Kentucky state court) and Scott v. Humana Inc. et al., C.A. No. 11323-VCL (Delaware state court). The complaints named as defendants each member of Humana’s board of directors, Aetna, and, in the case of the Delaware complaint, Humana. The complaints generally alleged, among other things, that the individual members of our board of directors breached their fiduciary duties owed to our stockholders by entering into the Merger Agreement, approving the mergers as contemplated by the Merger Agreement, and failing to take steps to maximize the value of Humana to our stockholders, and that Aetna, and, in the case of the Delaware complaint, Humana aided and abetted such breaches of fiduciary duties. In addition, the complaints alleged that the merger undervalues Humana, that the process leading up to the execution of the Merger Agreement was flawed, that the members of our board of directors improperly placed their own financial interests ahead of those of our stockholders, and that certain provisions of the Merger Agreement improperly favor Aetna and impede a potential alternative transaction. Among other remedies, the complaints sought equitable relief rescinding the Merger Agreement and enjoining the defendants from completing the mergers as well as costs and attorneys’ fees. We refer to all these cases collectively in this report as the Merger Litigation. On August 20, 2015, the parties in the Kentucky state cases filed a stipulation and proposed order with the court to consolidate these cases into a single action captioned In re Humana Inc. Shareholder Litigation, Civ. Act. No. 15CI03374.
On October 9, 2015, solely to avoid the costs, risks, and uncertainties inherent in litigation, and without admitting any liability or wrongdoing, we and the other named defendants in the Merger Litigation signed a memorandum of understanding, which we refer to as the MOU, to settle the Merger Litigation. Subject to court approval and further definitive documentation in a stipulation of settlement that will be subject to customary conditions, the MOU resolved the claims brought in the Merger Litigation and provided that we would make certain additional disclosures related to the proposed mergers. The MOU further provided for, among other things, dismissal of the Merger Litigation with prejudice and a release and settlement by the purported class of our stockholders of all claims against the defendants and their affiliates and agents in connection with the Merger Agreement and transactions and disclosures related to the Merger Agreement. The asserted claims will not be released until such stipulation of settlement receives court approval. The foregoing terms and conditions will be defined by the stipulation of settlement, and class members will receive a separate notice describing the settlement terms and their rights in connection with the approval of the settlement. In connection with the settlement, the parties contemplate that plaintiffs’ counsel will file a petition for an award of attorneys’ fees and expenses. We will pay or cause to be paid any court awarded attorneys’ fees and expenses. There can be no assurance that the parties will ultimately enter into a stipulation of settlement or that a court will approve such settlement even if the parties were to enter into such stipulation. In such event, the proposed settlement as contemplated by the MOU may be terminated. Because the MOU contemplates that the Kentucky court will be asked to approve the settlement, the plaintiffs have already withdrawn the Delaware case.
Other Lawsuits and Regulatory Matters
Our current and past business practices are subject to review or other investigations by various state insurance and health care regulatory authorities and other state and federal regulatory authorities. These authorities regularly scrutinize the business practices of health insurance, health care delivery and benefits companies. These reviews focus on numerous facets of our business, including claims payment practices, statutory capital requirements, provider contracting, risk adjustment, competitive practices, commission payments, privacy issues, utilization management practices, pharmacy benefits, access to care, and sales practices, among others. Some of these reviews have historically resulted in fines imposed on us and some have required changes to some of our practices. We continue to be subject to these reviews, which could result in additional fines or other sanctions being imposed on us or additional changes in some of our practices.
We also are involved in various other lawsuits that arise, for the most part, in the ordinary course of our business operations, certain of which may be styled as class-action lawsuits. Among other matters, this litigation may include employment matters, claims of medical malpractice, bad faith, nonacceptance or termination of providers, anticompetitive practices, improper rate setting, provider contract rate disputes, failure to disclose network discounts and various other provider arrangements, general contractual matters, intellectual property matters, and challenges to subrogation practices. For example, a number of hospitals and other providers have asserted that, under their network provider contracts, we are not entitled to reduce Medicare Advantage payments to these providers in connection with changes in Medicare payment systems and in accordance with the Balanced Budget and Emergency Deficit Control
129
Humana Inc.
NOTES TO CONSOLIDATED FINANCIAL STATEMENTS—(Continued)
Act of 1985, as amended (commonly referred to as “sequestration”). Those challenges have led and could lead to arbitration demands or other litigation. Also, under state guaranty assessment laws, including those related to state cooperative failures in the industry, we may be assessed (up to prescribed limits) for certain obligations to the policyholders and claimants of insolvent insurance companies that write the same line or lines of business as we do. Penn Treaty is a financially distressed unaffiliated long-term care insurance company. A final court ruling on Penn Treaty's insolvency would trigger a guarantee fund assessment that would result in expense for us, based on current information, estimated at approximately
$30 million
.
As a government contractor, we may also be subject to qui tam litigation brought by individuals who seek to sue on behalf of the government, alleging that the government contractor submitted false claims to the government including, among other allegations, those resulting from coding and review practices under the Medicare risk adjustment model. Qui tam litigation is filed under seal to allow the government an opportunity to investigate and to decide if it wishes to intervene and assume control of the litigation. If the government does not intervene, the lawsuit is unsealed, and the individual may continue to prosecute the action on his or her own, on behalf of the government. We also are subject to other allegations of non-performance of contractual obligations to providers, members, and others, including failure to properly pay claims, improper policy terminations, challenges to our implementation of the Medicare Part D prescription drug program and other litigation.
A limited number of the claims asserted against us are subject to insurance coverage. Personal injury claims, claims for extracontractual damages, care delivery malpractice, and claims arising from medical benefit denials are covered by insurance from our wholly owned captive insurance subsidiary and excess carriers, except to the extent that claimants seek punitive damages, which may not be covered by insurance in certain states in which insurance coverage for punitive damages is not permitted. In addition, insurance coverage for all or certain forms of liability has become increasingly costly and may become unavailable or prohibitively expensive in the future.
We record accruals for the contingencies discussed in the sections above to the extent that we conclude it is probable that a liability has been incurred and the amount of the loss can be reasonably estimated. No estimate of the possible loss or range of loss in excess of amounts accrued, if any, can be made at this time regarding the matters specifically described above because of the inherently unpredictable nature of legal proceedings, which also may be exacerbated by various factors, including: (i) the damages sought in the proceedings are unsubstantiated or indeterminate; (ii) discovery is not complete; (iii) the proceeding is in its early stages; (iv) the matters present legal uncertainties; (v) there are significant facts in dispute; (vi) there are a large number of parties (including where it is uncertain how liability, if any, will be shared among multiple defendants); or (vii) there is a wide range of potential outcomes.
The outcome of any current or future litigation or governmental or internal investigations, including the matters described above, cannot be accurately predicted, nor can we predict any resulting judgments, penalties, fines or other sanctions that may be imposed at the discretion of federal or state regulatory authorities or as a result of actions by third parties. Nevertheless, it is reasonably possible that any such outcome of litigation, judgments, penalties, fines or other sanctions could be substantial, and the outcome of these matters may have a material adverse effect on our results of operations, financial position, and cash flows, and may also affect our reputation.
17. SEGMENT INFORMATION
We manage our business with
three
reportable segments: Retail, Group, and Healthcare Services. In addition, the Other Businesses category includes businesses that are not individually reportable because they do not meet the quantitative thresholds required by generally accepted accounting principles. These segments are based on a combination of the type of health plan customer and adjacent businesses centered on well-being solutions for our health plans and other customers, as described below. These segment groupings are consistent with information used by our Chief Executive Officer to assess performance and allocate resources.
The Retail segment consists of Medicare benefits, marketed to individuals or directly via group accounts, as well as individual commercial fully-insured medical and specialty health insurance benefits, including dental, vision, and other supplemental health and financial protection products. In addition, the Retail segment also includes our contract with CMS to administer the LI-NET prescription drug plan program and contracts with various states to provide Medicaid, dual eligible, and Long-Term Support Services benefits, collectively our state-based contracts. The Group
130
Humana Inc.
NOTES TO CONSOLIDATED FINANCIAL STATEMENTS—(Continued)
segment consists of employer group commercial fully-insured medical and specialty health insurance benefits, including dental, vision, and other supplemental health and voluntary insurance benefits, as well as administrative services only, or ASO products. In addition, our Group segment includes our health and wellness products (primarily marketed to employer groups) and military services business, primarily our TRICARE South Region contract. The Healthcare Services segment includes services offered to our health plan members as well as to third parties, including pharmacy solutions, provider services, home based services, and clinical programs, as well as services and capabilities to advance population health. We will continue to report under the category of Other Businesses those businesses which do not align with the reportable segments described above, primarily our closed-block long-term care insurance policies.
Our Healthcare Services intersegment revenues primarily relate to managing prescription drug coverage for members of our other segments through Humana Pharmacy Solutions
®
, or HPS, and includes the operations of Humana Pharmacy, Inc., our mail order pharmacy business. These revenues consist of the prescription price (ingredient cost plus dispensing fee), including the portion to be settled with the member (co-share) or with the government (subsidies), plus any associated administrative fees. Services revenues related to the distribution of prescriptions by third party retail pharmacies in our networks are recognized when the claim is processed and product revenues from dispensing prescriptions from our mail order pharmacies are recorded when the prescription or product is shipped. Our pharmacy operations, which are responsible for designing pharmacy benefits, including defining member co-share responsibilities, determining formulary listings, contracting with retail pharmacies, confirming member eligibility, reviewing drug utilization, and processing claims, act as a principal in the arrangement on behalf of members in our other segments. As principal, our Healthcare Services segment reports revenues on a gross basis including co-share amounts from members collected by third party retail pharmacies at the point of service.
In addition, our Healthcare Services intersegment revenues include revenues earned by certain owned providers derived from risk-based and non risk-based managed care agreements with our health plans. Under risk based agreements, the provider receives a monthly capitated fee that varies depending on the demographics and health status of the member, for each member assigned to these owned providers by our health plans. The owned provider assumes the economic risk of funding the assigned members’ healthcare services. Under non risk-based agreements, our health plans retain the economic risk of funding the assigned members' healthcare services. Our Healthcare Services segment reports provider services revenues associated with risk-based agreements on a gross basis, whereby capitation fee revenue is recognized in the period in which the assigned members are entitled to receive healthcare services. Provider services revenues associated with non risk-based agreements are presented net of associated healthcare costs.
We present our consolidated results of operations from the perspective of the health plans. As a result, the cost of providing benefits to our members, whether provided via a third party provider or internally through a stand-alone subsidiary, is classified as benefits expense and excludes the portion of the cost for which the health plans do not bear responsibility, including member co-share amounts and government subsidies of
$13.4 billion
in
2016
,
$12.3 billion
in
2015
, and
$9.7 billion
in
2014
. In addition, depreciation and amortization expense associated with certain businesses in our Healthcare Services segment delivering benefits to our members, primarily associated with our provider services and pharmacy operations, are included with benefits expense. The amount of this expense was
$111 million
in
2016
,
$92 million
in
2015
, and
$116 million
in
2014
.
Other than those described previously, the accounting policies of each segment are the same and are described in Note 2.
Transactions between reportable segments primarily consist of sales of services rendered by our Healthcare Services segment, primarily pharmacy, provider, and home based services as well as clinical programs, to our Retail and Group customers
.
Intersegment sales and expenses are recorded at fair value and eliminated in consolidation. Members served by our segments often use the same provider networks, enabling us in some instances to obtain more favorable contract terms with providers. Our segments also share indirect costs and assets. As a result, the profitability of each segment is interdependent. We allocate most operating expenses to our segments. Assets and certain corporate income and expenses are not allocated to the segments, including the portion of investment income not supporting segment operations, interest expense on corporate debt, and certain other corporate expenses. These items are managed at a corporate level. These corporate amounts are reported separately from our reportable segments and are included with intersegment eliminations
in the tables presenting segment results below.
131
Humana Inc.
NOTES TO CONSOLIDATED FINANCIAL STATEMENTS—(Continued)
Our segment results were as follows for the years ended December 31,
2016
,
2015
, and
2014
:
|
Retail
|
Group
|
Healthcare Services
|
Other Businesses
|
Eliminations/
Corporate |
Consolidated
|
||||||||||||||||||
|
|
(in millions)
|
||||||||||||||||||||||
|
2016
|
|||||||||||||||||||||||
|
Revenues—external customers
|
|||||||||||||||||||||||
|
Premiums:
|
|||||||||||||||||||||||
|
Individual Medicare Advantage
|
$
|
31,863
|
|
$
|
—
|
|
$
|
—
|
|
$
|
—
|
|
$
|
—
|
|
$
|
31,863
|
|
|||||
|
Group Medicare Advantage
|
4,283
|
|
—
|
|
—
|
|
—
|
|
—
|
|
4,283
|
|
|||||||||||
|
Medicare stand-alone PDP
|
4,009
|
|
—
|
|
—
|
|
—
|
|
—
|
|
4,009
|
|
|||||||||||
|
Total Medicare
|
40,155
|
|
—
|
|
—
|
|
—
|
|
—
|
|
40,155
|
|
|||||||||||
|
Fully-insured
|
3,492
|
|
5,405
|
|
—
|
|
—
|
|
—
|
|
8,897
|
|
|||||||||||
|
Specialty
|
259
|
|
1,020
|
|
—
|
|
—
|
|
—
|
|
1,279
|
|
|||||||||||
|
Medicaid and other
|
2,640
|
|
12
|
|
—
|
|
38
|
|
—
|
|
2,690
|
|
|||||||||||
|
Total premiums
|
46,546
|
|
6,437
|
|
—
|
|
38
|
|
—
|
|
53,021
|
|
|||||||||||
|
Services revenue:
|
|||||||||||||||||||||||
|
Provider
|
—
|
|
52
|
|
226
|
|
—
|
|
—
|
|
278
|
|
|||||||||||
|
ASO and other
|
8
|
|
642
|
|
—
|
|
10
|
|
—
|
|
660
|
|
|||||||||||
|
Pharmacy
|
—
|
|
—
|
|
31
|
|
—
|
|
—
|
|
31
|
|
|||||||||||
|
Total services revenue
|
8
|
|
694
|
|
257
|
|
10
|
|
—
|
|
969
|
|
|||||||||||
|
Total revenues—external customers
|
46,554
|
|
7,131
|
|
257
|
|
48
|
|
—
|
|
53,990
|
|
|||||||||||
|
Intersegment revenues
|
|||||||||||||||||||||||
|
Services
|
—
|
|
99
|
|
18,842
|
|
—
|
|
(18,941
|
)
|
—
|
|
|||||||||||
|
Products
|
—
|
|
—
|
|
5,993
|
|
—
|
|
(5,993
|
)
|
—
|
|
|||||||||||
|
Total intersegment revenues
|
—
|
|
99
|
|
24,835
|
|
—
|
|
(24,934
|
)
|
—
|
|
|||||||||||
|
Investment income
|
101
|
|
19
|
|
30
|
|
66
|
|
173
|
|
389
|
|
|||||||||||
|
Total revenues
|
46,655
|
|
7,249
|
|
25,122
|
|
114
|
|
(24,761
|
)
|
54,379
|
|
|||||||||||
|
Operating expenses:
|
|||||||||||||||||||||||
|
Benefits
|
40,143
|
|
5,122
|
|
—
|
|
617
|
|
(875
|
)
|
45,007
|
|
|||||||||||
|
Operating costs
|
5,339
|
|
1,778
|
|
23,926
|
|
16
|
|
(23,782
|
)
|
7,277
|
|
|||||||||||
|
Depreciation and amortization
|
236
|
|
92
|
|
129
|
|
1
|
|
(104
|
)
|
354
|
|
|||||||||||
|
Total operating expenses
|
45,718
|
|
6,992
|
|
24,055
|
|
634
|
|
(24,761
|
)
|
52,638
|
|
|||||||||||
|
Income (loss) from operations
|
937
|
|
257
|
|
1,067
|
|
(520
|
)
|
—
|
|
1,741
|
|
|||||||||||
|
Interest expense
|
—
|
|
—
|
|
—
|
|
—
|
|
189
|
|
189
|
|
|||||||||||
|
Income (loss) before income taxes
|
$
|
937
|
|
$
|
257
|
|
$
|
1,067
|
|
$
|
(520
|
)
|
$
|
(189
|
)
|
$
|
1,552
|
|
|||||
Premium and services revenues derived from our contracts with the federal government, as a percentage of our total premium and services revenues, was approximately
75%
for
2016
, compared to
73%
for
2015
, and
73%
for
2014
.
Premiums revenue for our Retail segment for 2016 includes a reduction of
$583 million
associated with the write-off of commercial risk corridor receivables as discussed more fully in Note 7.
Benefits expense for Other Businesses for 2016 includes
$505 million
for reserve strengthening associated with our closed block of long-term care insurance policies as discussed more fully in Note 18.
132
Humana Inc.
NOTES TO CONSOLIDATED FINANCIAL STATEMENTS—(Continued)
|
Retail
|
Group
|
Healthcare Services
|
Other Businesses
|
Eliminations/
Corporate |
Consolidated
|
||||||||||||||||||
|
|
(in millions)
|
||||||||||||||||||||||
|
2015
|
|||||||||||||||||||||||
|
Revenues—external customers
|
|||||||||||||||||||||||
|
Premiums:
|
|||||||||||||||||||||||
|
Individual Medicare Advantage
|
$
|
29,526
|
|
$
|
—
|
|
$
|
—
|
|
$
|
—
|
|
$
|
—
|
|
$
|
29,526
|
|
|||||
|
Group Medicare Advantage
|
5,588
|
|
—
|
|
—
|
|
—
|
|
—
|
|
5,588
|
|
|||||||||||
|
Medicare stand-alone PDP
|
3,846
|
|
—
|
|
—
|
|
—
|
|
—
|
|
3,846
|
|
|||||||||||
|
Total Medicare
|
38,960
|
|
—
|
|
—
|
|
—
|
|
—
|
|
38,960
|
|
|||||||||||
|
Fully-insured
|
4,243
|
|
5,493
|
|
—
|
|
—
|
|
—
|
|
9,736
|
|
|||||||||||
|
Specialty
|
261
|
|
1,055
|
|
—
|
|
—
|
|
—
|
|
1,316
|
|
|||||||||||
|
Medicaid and other
|
2,341
|
|
21
|
|
—
|
|
35
|
|
—
|
|
2,397
|
|
|||||||||||
|
Total premiums
|
45,805
|
|
6,569
|
|
—
|
|
35
|
|
—
|
|
52,409
|
|
|||||||||||
|
Services revenue:
|
|||||||||||||||||||||||
|
Provider
|
—
|
|
40
|
|
655
|
|
—
|
|
—
|
|
695
|
|
|||||||||||
|
ASO and other
|
9
|
|
658
|
|
—
|
|
14
|
|
—
|
|
681
|
|
|||||||||||
|
Pharmacy
|
—
|
|
—
|
|
30
|
|
—
|
|
—
|
|
30
|
|
|||||||||||
|
Total services revenue
|
9
|
|
698
|
|
685
|
|
14
|
|
—
|
|
1,406
|
|
|||||||||||
|
Total revenues—external customers
|
45,814
|
|
7,267
|
|
685
|
|
49
|
|
—
|
|
53,815
|
|
|||||||||||
|
Intersegment revenues
|
|||||||||||||||||||||||
|
Services
|
—
|
|
93
|
|
17,997
|
|
—
|
|
(18,090
|
)
|
—
|
|
|||||||||||
|
Products
|
—
|
|
—
|
|
4,923
|
|
—
|
|
(4,923
|
)
|
—
|
|
|||||||||||
|
Total intersegment revenues
|
—
|
|
93
|
|
22,920
|
|
—
|
|
(23,013
|
)
|
—
|
|
|||||||||||
|
Investment income
|
134
|
|
26
|
|
—
|
|
76
|
|
238
|
|
474
|
|
|||||||||||
|
Total revenues
|
45,948
|
|
7,386
|
|
23,605
|
|
125
|
|
(22,775
|
)
|
54,289
|
|
|||||||||||
|
Operating expenses:
|
|||||||||||||||||||||||
|
Benefits
|
39,708
|
|
5,266
|
|
—
|
|
87
|
|
(792
|
)
|
44,269
|
|
|||||||||||
|
Operating costs
|
5,118
|
|
1,769
|
|
22,481
|
|
14
|
|
(22,064
|
)
|
7,318
|
|
|||||||||||
|
Depreciation and amortization
|
192
|
|
93
|
|
143
|
|
—
|
|
(73
|
)
|
355
|
|
|||||||||||
|
Total operating expenses
|
45,018
|
|
7,128
|
|
22,624
|
|
101
|
|
(22,929
|
)
|
51,942
|
|
|||||||||||
|
Income from operations
|
930
|
|
258
|
|
981
|
|
24
|
|
154
|
|
2,347
|
|
|||||||||||
|
Gain on sale of business
|
—
|
|
—
|
|
—
|
|
—
|
|
270
|
|
270
|
|
|||||||||||
|
Interest expense
|
—
|
|
—
|
|
—
|
|
—
|
|
186
|
|
186
|
|
|||||||||||
|
Income before income taxes
|
$
|
930
|
|
$
|
258
|
|
$
|
981
|
|
$
|
24
|
|
$
|
238
|
|
$
|
2,431
|
|
|||||
Benefits expense for the Retail segment for
2015
includes
$176 million
for a provision for probable future losses (premium deficiency) for individual commercial medical business compliant with the Health Care Reform Law for the 2016 coverage year as discussed more fully in Note 7.
133
Humana Inc.
NOTES TO CONSOLIDATED FINANCIAL STATEMENTS—(Continued)
|
Retail
|
Group
|
Healthcare Services
|
Other Businesses
|
Eliminations/
Corporate |
Consolidated
|
||||||||||||||||||
|
|
(in millions)
|
||||||||||||||||||||||
|
2014
|
|||||||||||||||||||||||
|
Revenues—external customers
|
|||||||||||||||||||||||
|
Premiums:
|
|||||||||||||||||||||||
|
Individual Medicare Advantage
|
$
|
25,782
|
|
$
|
—
|
|
$
|
—
|
|
$
|
—
|
|
$
|
—
|
|
$
|
25,782
|
|
|||||
|
Group Medicare Advantage
|
5,490
|
|
—
|
|
—
|
|
—
|
|
—
|
|
5,490
|
|
|||||||||||
|
Medicare stand-alone PDP
|
3,404
|
|
—
|
|
—
|
|
—
|
|
—
|
|
3,404
|
|
|||||||||||
|
Total Medicare
|
34,676
|
|
—
|
|
—
|
|
—
|
|
—
|
|
34,676
|
|
|||||||||||
|
Fully-insured
|
3,265
|
|
5,339
|
|
—
|
|
—
|
|
—
|
|
8,604
|
|
|||||||||||
|
Specialty
|
256
|
|
1,098
|
|
—
|
|
—
|
|
—
|
|
1,354
|
|
|||||||||||
|
Medicaid and other
|
1,255
|
|
19
|
|
—
|
|
51
|
|
—
|
|
1,325
|
|
|||||||||||
|
Total premiums
|
39,452
|
|
6,456
|
|
—
|
|
51
|
|
—
|
|
45,959
|
|
|||||||||||
|
Services revenue:
|
|||||||||||||||||||||||
|
Provider
|
—
|
|
23
|
|
1,254
|
|
—
|
|
—
|
|
1,277
|
|
|||||||||||
|
ASO and other
|
39
|
|
740
|
|
—
|
|
9
|
|
—
|
|
788
|
|
|||||||||||
|
Pharmacy
|
—
|
|
—
|
|
99
|
|
—
|
|
—
|
|
99
|
|
|||||||||||
|
Total services revenue
|
39
|
|
763
|
|
1,353
|
|
9
|
|
—
|
|
2,164
|
|
|||||||||||
|
Total revenues—external customers
|
39,491
|
|
7,219
|
|
1,353
|
|
60
|
|
—
|
|
48,123
|
|
|||||||||||
|
Intersegment revenues
|
|||||||||||||||||||||||
|
Services
|
—
|
|
78
|
|
15,098
|
|
—
|
|
(15,176
|
)
|
—
|
|
|||||||||||
|
Products
|
—
|
|
—
|
|
3,749
|
|
—
|
|
(3,749
|
)
|
—
|
|
|||||||||||
|
Total intersegment revenues
|
—
|
|
78
|
|
18,847
|
|
—
|
|
(18,925
|
)
|
—
|
|
|||||||||||
|
Investment income
|
97
|
|
23
|
|
—
|
|
60
|
|
197
|
|
377
|
|
|||||||||||
|
Total revenues
|
39,588
|
|
7,320
|
|
20,200
|
|
120
|
|
(18,728
|
)
|
48,500
|
|
|||||||||||
|
Operating expenses:
|
|||||||||||||||||||||||
|
Benefits
|
33,508
|
|
5,130
|
|
—
|
|
102
|
|
(574
|
)
|
38,166
|
|
|||||||||||
|
Operating costs
|
4,576
|
|
1,936
|
|
19,307
|
|
17
|
|
(18,197
|
)
|
7,639
|
|
|||||||||||
|
Depreciation and amortization
|
165
|
|
103
|
|
155
|
|
—
|
|
(90
|
)
|
333
|
|
|||||||||||
|
Total operating expenses
|
38,249
|
|
7,169
|
|
19,462
|
|
119
|
|
(18,861
|
)
|
46,138
|
|
|||||||||||
|
Income from operations
|
1,339
|
|
151
|
|
738
|
|
1
|
|
133
|
|
2,362
|
|
|||||||||||
|
Interest expense
|
—
|
|
—
|
|
—
|
|
—
|
|
192
|
|
192
|
|
|||||||||||
|
Income (loss) before income taxes
|
$
|
1,339
|
|
$
|
151
|
|
$
|
738
|
|
$
|
1
|
|
$
|
(59
|
)
|
$
|
2,170
|
|
|||||
134
Humana Inc.
NOTES TO CONSOLIDATED FINANCIAL STATEMENTS—(Continued)
18. EXPENSES ASSOCIATED WITH LONG-DURATION INSURANCE PRODUCTS
Premiums associated with our long-duration insurance products accounted for approximately
1%
of our consolidated premiums and services revenue for the year ended December 31,
2016
. We use long-duration accounting for products such as long-term care, life insurance, annuities, and certain health and other supplemental policies sold to individuals because they are expected to remain in force for an extended period beyond one year and because premium received in the earlier years is intended to pay anticipated benefits to be incurred in future years
.
As a result, we defer policy acquisition costs, primarily consisting of commissions, and amortize them over the estimated life of the policies in proportion to premiums earned.
In addition, we establish reserves for future policy benefits in recognition of the fact that some of the premium received in the earlier years is intended to pay anticipated benefits to be incurred in future years. At policy issuance, these reserves are recognized on a net level premium method based on premium rate increase, interest rate, mortality, morbidity, persistency (the percentage of policies remaining in-force), and maintenance expense assumptions. The assumptions used to determine the liability for future policy benefits are established and locked in at the time each contract is issued and only change if our expected future experience deteriorates to the point that the level of the liability, together with the present value of future gross premiums, are not adequate to provide for future expected policy benefits and maintenance costs (i.e. the loss recognition date). As discussed in Note 2, beginning in 2014, health policies sold to individuals that conform to the Health Care Reform Law are accounted for under a short-duration model because premiums received in the current year are intended to pay anticipated benefits in that year
.
The table below presents deferred acquisition costs and future policy benefits payable associated with our long-duration insurance products for the years ended December 31,
2016
and
2015
.
|
|
2016
|
2015
|
|||||||||||||
|
|
Deferred
acquisition costs |
Future policy
benefits payable |
Deferred
acquisition costs |
Future policy
benefits payable |
|||||||||||
|
|
(in millions)
|
||||||||||||||
|
Other long-term assets
|
$
|
119
|
|
$
|
—
|
|
$
|
135
|
|
$
|
—
|
|
|||
|
Trade accounts payable and accrued expenses
|
—
|
|
(62
|
)
|
—
|
|
(64
|
)
|
|||||||
|
Long-term liabilities
|
—
|
|
(2,834
|
)
|
—
|
|
(2,151
|
)
|
|||||||
|
Total asset (liability)
|
$
|
119
|
|
$
|
(2,896
|
)
|
$
|
135
|
|
$
|
(2,215
|
)
|
|||
In addition, future policy benefits payable include amounts of
$201 million
at December 31,
2016
and
$205 million
at December 31,
2015
which are subject to
100%
coinsurance agreements as more fully described in Note 19.
In
2016
, we recorded a net increase in benefits expense of
$439 million
, including a net charge of
$505 million
associated with our closed block of long-term care insurance policies discussed further below, partially offset by the release of reserves as individual commercial medical members transitioned to plans compliant with the Health Care Reform Law. In
2015
, we recorded a net reduction in benefits expense of
$80 million
associated with future policy benefits primarily due to the release of reserves as individual commercial medical members transitioned to plans compliant with the Health Care Reform Law. Benefits expense associated with future policy benefits payable was
$32 million
in
2014
. Amortization of deferred acquisition costs included in operating costs was
$67 million
in
2016
,
$63 million
in
2015
, and
$39 million
in
2014
. The higher amortization in
2015
and
2016
primarily reflects the effect of existing previously underwritten members transitioning to policies compliant with the Health Care Reform Law with us and other carriers.
Future policy benefits payable include
$2.2 billion
at December 31,
2016
and
$1.5 billion
at December 31,
2015
associated with a non-strategic closed block of long-term care insurance policies acquired in connection with the 2007 acquisition of KMG.
Future policy benefits payable includes amounts charged to accumulated other comprehensive income for an additional liability that would exist on our closed-block of long-term care insurance policies if unrealized gains on the sale of the investments backing such products had been realized and the proceeds reinvested at then current
135
Humana Inc.
NOTES TO CONSOLIDATED FINANCIAL STATEMENTS—(Continued)
yields. There was a
$77 million
additional liability at December 31,
2016
and no additional liability at December 31,
2015
. Amounts charged to accumulated other comprehensive income are net of applicable deferred taxes.
Long-term care insurance policies provide nursing home and home health coverage for which premiums are collected many years in advance of benefits paid, if any. Therefore, our actual claims experience will emerge many years after assumptions have been established. The risk of a deviation of the actual premium rate increase, interest, morbidity, mortality, persistency, and maintenance expense assumptions from those assumed in our reserves are particularly significant to our closed block of long-term care insurance policies. We monitor the loss experience of these long-term care insurance policies and, when necessary, apply for premium rate increases through a regulatory filing and approval process in the jurisdictions in which such products were sold. To the extent premium rate increases, interest rates, and/or loss experience vary from our loss recognition date assumptions, material future adjustments to reserves could be required.
During 2016, we recorded a loss for a premium deficiency. The premium deficiency was based on current and anticipated experience that had deteriorated from our locked-in assumptions from the previous December 31, 2013 loss recognition date, particularly as they related to emerging experience indicating longer claims duration, a prolonged lower interest rate environment, and an increase in policyholder life expectancies. Based on this deterioration, we determined that our existing future policy benefits payable, together with the present value of future gross premiums, associated with our closed block of long-term care insurance policies were not adequate to provide for future policy benefits and maintenance costs under these policies; therefore we unlocked and modified our assumptions based on current expectations. Accordingly, during 2016 we recorded
$505 million
of additional benefits expense, with a corresponding increase in future policy benefits payable of
$659 million
partially offset by a related reinsurance recoverable of
$154 million
included in other long-term assets.
Deferred acquisition costs included
$16 million
and
$26 million
associated with our individual commercial medical policies at December 31,
2016
and December 31,
2015
, respectively. Future policy benefits payable associated with our individual commercial medical policies were
$86 million
at December 31,
2016
and
$180 million
at December 31,
2015
. The decline in deferred acquisition costs and future policy benefits payable primarily reflects the effect of existing previously underwritten members transitioning to policies compliant with the Health Care Reform Law with us and other carriers.
19. REINSURANCE
Certain blocks of insurance assumed in acquisitions, primarily life, long-term care, and annuities in run-off status, are subject to reinsurance where some or all of the underwriting risk related to these policies has been ceded to a third party. In addition, a large portion of our reinsurance takes the form of 100% coinsurance agreements where, in addition to all of the underwriting risk, all administrative responsibilities, including premium collections and claim payment, have also been ceded to a third party. We acquired these policies and related reinsurance agreements with the purchase of stock of companies in which the policies were originally written. We acquired these companies for business reasons unrelated to these particular policies, including the companies’ other products and licenses necessary to fulfill strategic plans.
A reinsurance agreement between two entities transfers the underwriting risk of policyholder liabilities to a reinsurer while the primary insurer retains the contractual relationship with the ultimate insured. As such, these reinsurance agreements do not completely relieve us of our potential liability to the ultimate insured. However, given the transfer of underwriting risk, our potential liability is limited to the credit exposure which exists should the reinsurer be unable to meet its obligations assumed under these reinsurance agreements.
Reinsurance recoverables represent the portion of future policy benefits payable and benefits payable that are covered by reinsurance. Amounts recoverable from reinsurers are estimated in a manner consistent with the methods used to determine future policy benefits payable as detailed in Note 2. Excluding reinsurance associated with the Health Care Reform Law discussed in Note 2, reinsurance recoverables, included in other current and long-term assets, were
$822 million
at December 31,
2016
and
$668 million
at December 31,
2015
. The percentage of these reinsurance recoverables resulting from
100%
coinsurance agreements was approximately
34%
at December 31,
2016
and approximately
43%
at December 31,
2015
. Premiums ceded were
$842 million
in
2016
,
$821 million
in
2015
and
$357
136
Humana Inc.
NOTES TO CONSOLIDATED FINANCIAL STATEMENTS—(Continued)
million
in
2014
. Benefits ceded were
$767 million
in
2016
,
$666 million
in
2015
, and
$272 million
in
2014
. Ceded premium and benefits reflect a July 1, 2014 amendment ceding all risk under a Medicaid contract to a third party reinsurer.
We evaluate the financial condition of these reinsurers on a regular basis. These reinsurers are well-known and well-established, as evidenced by the strong financial ratings at December 31,
2016
presented below:
|
Reinsurer
|
Total
Recoverable |
A.M. Best Rating
at December 31, 2016 |
||||
|
|
(in millions)
|
|
||||
|
Munich American Reassurance Company
|
$
|
248
|
|
A+ (superior)
|
||
|
Protective Life Insurance Company
|
182
|
|
A+ (superior)
|
|||
|
Employers Reassurance Corporation
|
130
|
|
A- (excellent)
|
|||
|
General Re Life Corporation
|
129
|
|
A++ (superior)
|
|||
|
All others
|
133
|
|
A+ to A- (superior to excellent)
|
|||
|
$
|
822
|
|
||||
The all other category represents
18
reinsurers with individual balances less than
$76 million
.
Three
of these reinsurers with recoverables of
$93 million
are subject to trust or funds withheld accounts, requiring amounts at least equal to the total recoverable from each of these reinsurers.
137
Report of Independent Registered Public Accounting Firm
To
the Board of Directors and Stockholders of Humana Inc.:
In our opinion, the consolidated balance sheets and the related consolidated statements of income, of comprehensive income, of stockholders’ equity and of cash flows present fairly, in all material respects, the financial position of Humana Inc. and its subsidiaries
at December 31,
2016
and
2015
, and the results of their operations and their cash flows for each of the three years in the period ended December 31,
2016
in conformity with accounting principles generally accepted in the United States of America. In addition, in our opinion, the financial statement schedules listed in the index appearing under Item 15(a)(2)
present fairly, in all material respects, the information set forth therein when read in conjunction with the related consolidated
financial statements. Also in our opinion, the Company maintained, in all material respects, effective internal control over financial reporting as of December 31,
2016
, based on criteria established in
Internal Control - Integrated Framework
(2013) issued by the Committee of Sponsoring Organizations of the Treadway Commission (COSO). The Company's management is responsible for these financial statements and financial statement schedules, for maintaining effective internal control over financial reporting and for its assessment of the effectiveness of internal control over financial reporting, included in Management's Report on Internal Control Over Financial Reporting appearing under Item 9A. Our responsibility is to express opinions on these financial statements, on the financial statement schedules, and on the Company's internal control over financial reporting based on our integrated audits. We conducted our audits in accordance with the standards of the Public Company Accounting Oversight Board (United States). Those standards require that we plan and perform the audits to obtain reasonable assurance about whether the financial statements are free of material misstatement and whether effective internal control over financial reporting was maintained in all material respects. Our audits of the financial statements included examining, on a test basis, evidence supporting the amounts and disclosures in the financial statements, assessing the accounting principles used and significant estimates made by management, and evaluating the overall financial statement presentation. Our audit of internal control over financial reporting included obtaining an understanding of internal control over financial reporting, assessing the risk that a material weakness exists, and testing and evaluating the design and operating effectiveness of internal control based on the assessed risk. Our audits also included performing such other procedures as we considered necessary in the circumstances. We believe that our audits provide a reasonable basis for our opinions.
A company’s internal control over financial reporting is a process designed to provide reasonable assurance regarding the reliability of financial reporting and the preparation of financial statements for external purposes in accordance with generally accepted accounting principles. A company’s internal control over financial reporting includes those policies and procedures that (i) pertain to the maintenance of records that, in reasonable detail, accurately and fairly reflect the transactions and dispositions of the assets of the company; (ii) provide reasonable assurance that transactions are recorded as necessary to permit preparation of financial statements in accordance with generally accepted accounting principles, and that receipts and expenditures of the company are being made only in accordance with authorizations of management and directors of the company; and (iii) provide reasonable assurance regarding prevention or timely detection of unauthorized acquisition, use, or disposition of the company’s assets that could have a material effect on the financial statements.
Because of its inherent limitations, internal control over financial reporting may not prevent or detect misstatements. Also, projections of any evaluation of effectiveness to future periods are subject to the risk that controls may become inadequate because of changes in conditions, or that the degree of compliance with the policies or procedures may deteriorate.
/s/ PricewaterhouseCoopers LLP
Louisville, Kentucky
February 17, 2017
138
Humana Inc.
QUARTERLY FINANCIAL INFORMATION
(Unaudited)
A summary of our quarterly unaudited results of operations for the years ended December 31,
2016
and
2015
follows:
|
2016
|
|||||||||||||||
|
|
First
|
Second
|
Third
|
Fourth (2)(3)
|
|||||||||||
|
|
(in millions, except per share results)
|
||||||||||||||
|
Total revenues
|
$
|
13,800
|
|
$
|
14,007
|
|
$
|
13,694
|
|
$
|
12,878
|
|
|||
|
Income (loss) before income taxes
|
500
|
|
636
|
|
902
|
|
(486
|
)
|
|||||||
|
Net income (loss)
|
254
|
|
311
|
|
450
|
|
(401
|
)
|
|||||||
|
Basic earnings (loss) per common share
|
$
|
1.70
|
|
$
|
2.08
|
|
$
|
3.01
|
|
$
|
(2.68
|
)
|
|||
|
Diluted earnings (loss) per common share
(1)
|
$
|
1.68
|
|
$
|
2.06
|
|
$
|
2.98
|
|
$
|
(2.68
|
)
|
|||
|
2015
|
|||||||||||||||
|
|
First
|
Second
|
Third
|
Fourth (4)
|
|||||||||||
|
|
(in millions, except per share results)
|
||||||||||||||
|
Total revenues
|
$
|
13,833
|
|
$
|
13,732
|
|
$
|
13,363
|
|
$
|
13,361
|
|
|||
|
Income before income taxes
|
744
|
|
793
|
|
648
|
|
246
|
|
|||||||
|
Net income
|
430
|
|
431
|
|
314
|
|
101
|
|
|||||||
|
Basic earnings per common share
|
$
|
2.86
|
|
$
|
2.88
|
|
$
|
2.11
|
|
$
|
0.68
|
|
|||
|
Diluted earnings per common share
(1)
|
$
|
2.82
|
|
$
|
2.85
|
|
$
|
2.09
|
|
$
|
0.67
|
|
|||
|
(1)
|
The calculation of diluted earnings per common share is based on the weighted average shares outstanding during each quarter and, accordingly, the sum may not equal the total for the year. In addition, for 2016, the sum of quarterly amounts does not equal full year results due to the anti-dilutive impact of a loss in the fourth quarter. The loss position in the fourth quarter required the use of basic weighted-average common shares outstanding in the calculation of diluted loss per share.
|
|
(2)
|
The fourth quarter of 2016 includes an expense of
$505 million
(
$318 million
after tax, or
2.11
per diluted common share) for reserve strengthening associated with our closed block of long-term care insurance policies.
|
|
(3)
|
Total revenue for 2016 includes a reduction of
$583 million
(
$367 million
after-tax, or
$2.43
per diluted common share) in premiums associated with the write-off of risk corridor receivables.
|
|
(4)
|
The fourth quarter of 2015 includes an expense of
$176 million
(
$112 million
after tax, or
$0.74
per diluted common share) for a premium deficiency reserve associated with our individual commercial medical policies compliant with the Health Care Reform Law associated with the 2016 coverage year.
|
139
Not applicable.
Management’s Responsibility for Financial Statements and Other Information
We are responsible for the preparation and integrity of the consolidated financial statements appearing in our Annual Report. The consolidated financial statements were prepared in conformity with accounting principles generally accepted in the United States and include amounts based on our estimates and judgments. All other financial information in this report has been presented on a basis consistent with the information included in the financial statements.
Our control environment is the foundation for our system of internal control over financial reporting and is embodied in our Code of Ethics and Business Conduct, which we currently refer to as the Humana Inc. Ethics Every Day. It sets the tone of our organization and includes factors such as integrity and ethical values. Our internal control over financial reporting is supported by formal policies and procedures which are reviewed, modified and improved as changes occur in business conditions and operations.
The Audit Committee of the Board of Directors, which is composed solely of independent outside directors, meets periodically with members of management, the internal auditors and our independent registered public accounting firm to review and discuss internal controls over financial reporting and accounting and financial reporting matters. Our independent registered public accounting firm and internal auditors report to the Audit Committee and accordingly have full and free access to the Audit Committee at any time.
Evaluation of Disclosure Controls and Procedures
We have established disclosure controls and procedures to ensure that material information relating to the Company, including its consolidated subsidiaries, is made known to members of senior management and the Board of Directors.
Based on our evaluation as of
December 31, 2016
, we as the principal executive officer and the principal financial officer and the principal accounting officer of the Company have concluded that the Company’s disclosure controls and procedures (as defined in the Securities Exchange Act of 1934) are effective to ensure that the information required to be disclosed by the Company in the reports that it files or submits under the Securities Exchange Act of 1934 is recorded, processed, summarized and reported as specified in Securities and Exchange Commission rules and forms.
Management’s Report on Internal Control Over Financial Reporting
We are responsible for establishing and maintaining effective internal control over financial reporting as defined in Rule 13a-15(f) under the Securities Exchange Act of 1934. The Company’s internal control over financial reporting is a process designed to provide reasonable assurance regarding the reliability of financial reporting and the preparation of financial statements for external purposes in accordance with generally accepted accounting principles. A company’s internal control over financial reporting includes those policies and procedures that (i) pertain to the maintenance of records that, in reasonable detail, accurately and fairly reflect the transactions and dispositions of the assets of the company; (ii) provide reasonable assurance that transactions are recorded as necessary to permit preparation of financial statements in accordance with generally accepted accounting principles, and that receipts and expenditures of the company are being made only in accordance with authorizations of management and directors of the company; and (iii) provide reasonable assurance regarding prevention or timely detection of unauthorized acquisition, use, or disposition of the company’s assets that could have a material effect on the financial statements.
Because of its inherent limitations, internal control over financial reporting may not prevent or detect misstatements. Also, projections of any evaluation of effectiveness to future periods are subject to the risk that controls may become inadequate or that the degree of compliance with the policies or procedures may deteriorate.
140
We assessed the effectiveness of the Company’s internal control over financial reporting as of
December 31, 2016
. In making this assessment, we used the criteria set forth by the Committee of Sponsoring Organizations of the Treadway Commission (COSO) in
Internal Control – Integrated Framework
(2013). Based on our assessment, we determined that, as of
December 31, 2016
, the Company’s internal control over financial reporting was effective based on those criteria.
The effectiveness of our internal control over financial reporting as of
December 31, 2016
has been audited by PricewaterhouseCoopers LLP, our independent registered public accounting firm, who also audited the Company’s consolidated financial statements included in our Annual Report on Form 10-K, as stated in their report which appears on page 140.
Changes in Internal Control over Financial Reporting
There have been no changes in the Company’s internal control over financial reporting during the quarter ended
December 31, 2016
that have materially affected, or are reasonably likely to materially affect, the Company’s internal control over financial reporting.
Bruce D. Broussard
President and Chief Executive Officer (Principal Executive Officer)
Brian A. Kane
Senior Vice President and Chief Financial Officer (Principal Financial Officer)
Cynthia H. Zipperle
Vice President, Chief Accounting Officer and Controller (Principal Accounting Officer)
None.
141
ITEM 10
.
DIRECTORS, EXECUTIVE OFFICERS AND CORPORATE GOVERNANCE
Directors
The information required by this Item is herein incorporated by reference from our Proxy Statement for the Annual Meeting of Stockholders scheduled to be held on
April 20, 2017
appearing under the caption “Proposal One: Election of Directors” in such Proxy Statement.
Executive Officers of the Registrant
Set forth below are names and ages of all of our current executive officers as of February 1, 2017, their positions, and the date first elected an officer:
|
Name
|
Age
|
Position
|
First
Elected
Officer
|
|
||||
|
Bruce D. Broussard
|
54
|
President and Chief Executive Officer, Director
|
12/11
|
(1)
|
||||
|
James E. Murray
|
63
|
Executive Vice President and Chief Operating Officer
|
08/90
|
(2)
|
||||
|
Roy A. Beveridge, M.D.
|
59
|
Senior Vice President and Chief Medical Officer
|
06/13
|
(3)
|
||||
|
Jody L. Bilney
|
55
|
Senior Vice President and Chief Consumer Officer
|
04/13
|
(4)
|
||||
|
Christopher H. Hunter
|
48
|
Senior Vice President and Chief Strategy Officer
|
01/14
|
(5)
|
||||
|
Timothy S. Huval
|
50
|
Senior Vice President and Chief Human Resources Officer
|
12/12
|
(6)
|
||||
|
Brian A. Kane
|
44
|
Senior Vice President and Chief Financial Officer
|
06/14
|
(7)
|
||||
|
Christopher Kay
|
51
|
Senior Vice President and Chief Innovation Officer
|
03/14
|
(8)
|
||||
|
Brian P. LeClaire
|
56
|
Senior Vice President and Chief Information Officer
|
08/11
|
(9)
|
||||
|
Heidi S. Margulis
|
63
|
Senior Vice President – Corporate Affairs
|
12/95
|
(10)
|
||||
|
Christopher M. Todoroff
|
54
|
Senior Vice President and General Counsel
|
08/08
|
(11)
|
||||
|
Cynthia H. Zipperle
|
54
|
Vice President, Chief Accounting Officer and Controller
|
12/14
|
(12)
|
||||
|
(1)
|
Mr. Broussard currently serves as Director, President and Chief Executive Officer (Principal Executive Officer), having held these positions since January 1, 2013. Mr. Broussard was elected President upon joining the Company in December 2011 and served in that capacity through December 2012. Prior to joining the Company, Mr. Broussard was Chief Executive Officer of McKesson Specialty/US Oncology, Inc. US Oncology was purchased by McKesson in December 2010. At US Oncology, Mr. Broussard served in a number of senior executive roles, including Chief Financial Officer, Chief Executive Officer, and Chairman of the Board.
|
|
(2)
|
Mr. Murray currently serves as Executive Vice President and Chief Operating Officer, having held this position since December 2011. Mr. Murray has held the position of Chief Operating Officer since February 2006, and was the Chief Operating Officer – Market and Business Segment Operations from September 2002 to February 2006. Mr. Murray joined the Company in December 1989. On February 8, 2017, the Company announced that Mr. Murray intends to retire from the position of Executive Vice President and Chief Operating Office effective March 31, 2017.
|
142
|
(3)
|
Dr. Beveridge currently serves as Senior Vice President and Chief Medical Officer, having held this position since joining the Company in June 2013. Prior to joining the Company, Dr. Beveridge served as Chief Medical Officer for McKesson Specialty Health from December 2010 until June 2013. Prior to McKesson’s acquisition of US Oncology, Dr. Beveridge served as the Executive Vice President and Medical Director at US Oncology from September 2009 through December 2010.
|
|
(4)
|
Ms. Bilney currently serves as Senior Vice President and Chief Consumer Officer, having held this position since joining the Company in April 2013. Prior to joining the Company, Ms. Bilney served as Executive Vice President and Chief Brand Officer for Bloomin’ Brands, Inc. from 2006 until April 2013.
|
|
(5)
|
Mr. Hunter currently serves as Senior Vice President and Chief Strategy Officer, having held this position since joining the Company in January 2014. Prior to joining the Company, Mr. Hunter served as President of Provider Markets at The TriZetto Group, Inc. from July 2012 until December 2013, and as Senior Vice President, Emerging Markets at BlueCross BlueShield of Tennessee from 2009 through July 2012. While at BlueCross BlueShield of Tennessee, Mr. Hunter was simultaneously President and Chief Executive Officer of Onlife Health, a national health and wellness subsidiary of BlueCross BlueShield of Tennessee.
|
|
(6)
|
Mr. Huval currently serves as Senior Vice President and Chief Human Resources Officer, having been elected to this position in December 2012. Prior to joining the Company, Mr. Huval spent 10 years at Bank of America in multiple senior-level roles, including Human Resources executive and Chief Information Officer for Global Wealth & Investment Management, as well as Human Resources executive for both Global Treasury Services and Technology & Global Operations.
|
|
(7)
|
Mr. Kane currently serves as Senior Vice President and Chief Financial Officer, having been elected to this position in June 2014. Prior to joining the Company, Mr. Kane spent nearly 17 years at Goldman, Sachs & Co. As a managing director, he was responsible for client relationships as well as for leading strategic and financing transactions for a number of companies in multiple industries.
|
|
(8)
|
Mr. Kay currently serves of Senior Vice President and Chief Innovation Officer, having been elected to this position in March 2014. Prior to joining the Company, Mr. Kay was most recently Managing Director and CEO of Citi Ventures, Citigroup’s global corporate venturing arm. Prior to joining Citi in 2007, Mr. Kay held several leadership positions at Target over a 12-year period.
|
|
(9)
|
Mr. LeClaire currently serves as Senior Vice President and Chief Information Officer, having held this position since January 2014. Prior to that, he served as Senior Vice President and Chief Service and Information Officer from August 2011 to January 2014, and as Chief Technology Officer from 2002 to August 2011. Mr. LeClaire joined the Company in August 1999.
|
|
(10)
|
Ms. Margulis currently serves as Senior Vice President – Corporate Affairs, having held this position since January 2000. Ms. Margulis joined the Company in November 1985.
|
|
(11)
|
Mr. Todoroff currently serves as Senior Vice President and General Counsel, having held this position since August 2008. Prior to joining the Company, Mr. Todoroff served as Vice President, Senior Corporate Counsel and Corporate Secretary for Aetna Inc. from 2006 through July 2008. Mr. Todoroff joined Aetna’s Legal Department in 1995 and held various positions of increasing responsibility.
|
|
(12)
|
Mrs. Zipperle currently serves as Vice President, Chief Accounting Officer and Controller, having held this position since December 2014. Mrs. Zipperle previously served as the Vice President - Finance from January 2013 until her election to her current role, and as the Assistant Controller from January 1998 until January 2013.
|
Executive officers are elected annually by our Board of Directors and serve until their successors are elected or until resignation or removal. There are no family relationships among any of our executive officers.
143
Section 16(a) Beneficial Ownership Reporting Compliance
The information required by this Item is herein incorporated by reference from our Proxy Statement for the Annual Meeting of Stockholders scheduled to be held on April 20, 2017 appearing under the caption “Section 16(a) Beneficial Ownership Reporting Compliance” of such Proxy Statement.
Code of Conduct for Chief Executive Officer and Senior Financial Officers
We have adopted a Code of Conduct for the Chief Executive Officer and Senior Financial Officers
,
violations of which should be reported to the Audit Committee. The code may be viewed through the Investor Relations section of our web site at www.humana.com. Any amendment to or waiver of the application of the Code of Conduct for the Chief Executive Officer and Senior Financial Officers will be promptly disclosed through the Investor Relations section of our web site at www.humana.com.
Code of Business Conduct and Ethics
Since 1995, we have operated under an omnibus Code of Ethics and Business Conduct, currently known as the Humana Inc. Ethics Every Day. All employees and directors are required to annually affirm in writing their acceptance of the code. The Humana Inc. Ethics Every Day was adopted by our Board of Directors in June 2014, replacing a previous iteration of our Code of Ethics and Business Conduct – the Humana Inc. Principles of Business Ethics – as the document to comply with the New York Stock Exchange Corporate Governance Standard 303A.10. The Humana Inc. Ethics Every Day is available on our web site at www.humana.com. Any waiver of the application of the Humana Inc. Principles of Business Ethics to directors or executive officers must be made by the Board of Directors and will be promptly disclosed on our web site at www.humana.com.
Corporate Governance Items
We have made available free of charge on or through the Investor Relations section of our web site at www.humana.com our annual reports on Form 10-K, quarterly reports on Form 10-Q, proxy statements, and all of our other reports, and, if applicable, amendments to those reports filed or furnished pursuant to Section 13(a) of the Exchange Act, as soon as reasonably practicable after we electronically file such material with, or furnish it to, the SEC. Also available on our Internet web site is information about our corporate governance, including:
|
•
|
a determination of independence for each member of our Board of Directors;
|
|
•
|
the name, membership, role, and charter of each of the various committees of our Board of Directors;
|
|
•
|
the name(s) of the directors designated as a financial expert under rules and regulations promulgated by the SEC;
|
|
•
|
the responsibility of the Company’s Lead Independent Director, if applicable, to convene, set the agenda for, and lead executive sessions of the non-management directors;
|
|
•
|
the pre-approval process of non-audit services provided by our independent accountants;
|
|
•
|
our by-laws and Certificate of Incorporation;
|
|
•
|
our Majority Vote policy;
|
|
•
|
our Related Persons Transaction Policy;
|
|
•
|
the process by which interested parties can communicate with directors;
|
|
•
|
the process by which stockholders can make director nominations (pursuant to our By-laws);
|
|
•
|
our Corporate Governance Guidelines;
|
|
•
|
our Policy Regarding Transactions in Company Securities, Inside Information and Confidentiality;
|
|
•
|
Stock Ownership Guidelines for directors and for executive officers;
|
|
•
|
the Humana Inc. Ethics Every Day and any waivers thereto; and
|
|
•
|
the Code of Conduct for the Chief Executive Officer and Senior Financial Officers and any waivers thereto.
|
144
Additional information about these items can be found in, and is incorporated by reference to, our Proxy Statement for the Annual Meeting of Stockholders scheduled to be held on April 20, 2017.
Material Changes to the Procedures by which Security Holders May Recommend Nominees to the Registrant’s Board of Directors
None.
Audit Committee Financial Expert
The information required by this Item is herein incorporated by reference from our Proxy Statement for the Annual Meeting of Stockholders scheduled to be held on April 20, 2017 appearing under the caption “Corporate Governance – Audit Committee” of such Proxy Statement.
Audit Committee Composition and Independence
The information required by this Item is herein incorporated by reference from our Proxy Statement for the Annual Meeting of Stockholders scheduled to be held on April 20, 2017 appearing under the caption “Corporate Governance – Committee Membership and Attendance” of such Proxy Statement.
Additional information required by this Item is incorporated herein by reference from our Proxy Statement for the Annual Meeting of Stockholders scheduled to be held on
April 20, 2017
appearing under the captions “Corporate Governance – Organization & Compensation Committee – Compensation Committee Interlocks and Insider Participation,” “Director Compensation,” “Compensation Discussion and Analysis,” “Organization & Compensation Committee Report,” and “Executive Compensation” of such Proxy Statement.
Equity compensation plan information
We maintain plans under which options to purchase our common stock and awards of restricted stock may be made to officers, directors, key employees, and consultants. Stock options are granted with an exercise price equal to the fair market value of the underlying common stock on the date of grant. Our stock plans, as approved by the Board of Directors and stockholders, define fair market value as the average of the highest and lowest stock prices reported on the composite tape by the New York Stock Exchange on a given date. Exercise provisions vary, but most options vest in whole or in part 1 to 3 years after grant and expire up to 7 years after grant.
Information concerning stock option awards and the number of securities remaining available for future issuance under our equity compensation plans in effect as of
December 31, 2016
follows:
|
Plan category
|
(a)
Number of securities
to be issued upon
exercise of outstanding
options, warrants
and rights
|
(b)
Weighted-average
exercise price of
outstanding
options, warrants
and rights
|
(c)
Number of securities remaining available for future issuance under equity compensation plans (excluding securities reflected in column(a)) |
|
|||||||
|
Equity compensation plans approved by
security holders (1)
|
1,021,590
|
|
$
|
143.043
|
|
7,052,923
|
|
(2)(3)
|
|||
|
Equity compensation plans not approved
by security holders
|
—
|
|
—
|
|
—
|
|
|
||||
|
Total
|
1,021,590
|
|
$
|
143.043
|
|
7,052,923
|
|
|
|||
|
(1)
|
The above table does not include awards of shares of restricted stock or restricted stock units. For information concerning these awards, see Note 13.
|
145
|
(2)
|
The Humana Inc. 2011 Stock Incentive Plan was approved by stockholders at the Annual Meeting held on April 21, 2011. On July 5, 2011, 18.5 million shares were registered with the Securities and Exchange Commission on Form S-8.
|
|
(3)
|
Of the number listed above,
3,079,879
can be issued as restricted stock at
December 31, 2016
(giving effect to the provision that one restricted share is equivalent to 2.29 stock options in the 2011 Plan).
|
The information under the captions “Security Ownership of Certain Beneficial Owners of Company Common Stock” and “Security Ownership of Directors and Executive Officers” in our Proxy Statement for the Annual Meeting of Stockholders scheduled to be held on April 20, 2017, is herein incorporated by reference.
The information required by this Item is herein incorporated by reference from our Proxy Statement for the Annual Meeting of Stockholders scheduled to be held on
April 20, 2017
appearing under the captions “Certain Transactions with Management and Others” and “Corporate Governance – Independent Directors” of such Proxy Statement.
The information required by this Item is herein incorporated by reference from our Proxy Statement for the Annual Meeting of Stockholders scheduled to be held on
April 20, 2017
appearing under the caption “Audit Committee Report” of such Proxy Statement.
146
|
(a)
|
|
The financial statements, financial statement schedules and exhibits set forth below are filed as part of this report.
|
||||||
|
(1)
|
|
Financial Statements – The response to this portion of Item 15 is submitted as Item 8 of Part II of this report.
|
||||||
|
(2)
|
|
The following Consolidated Financial Statement Schedules are included herein:
|
||||||
|
|
Schedule I
|
|
Parent Company Financial Information
|
|
||||
|
|
Schedule II
|
|
Valuation and Qualifying Accounts
|
|
||||
All other schedules have been omitted because they are not applicable.
|
(3)
|
Exhibits:
|
|
2.1
|
Agreement and Plan of Merger, dated as of July 2, 2015 among Aetna Inc., Echo Merger Sub, Inc., Echo Merger Sub, LLC and Humana Inc. (incorporated herein by reference to Exhibit 2.1 to Humana Inc.’s Current Report on Form 8-K filed on July 7, 2015).
|
|
2.2
|
Letter Agreement, dated as of December 21, 2016, between Aetna Inc., Echo Merger Sub, Inc., Echo Merger Sub, LLC and Humana Inc. (incorporated herein by reference to Exhibit 10.1 to Humana Inc.’s Current Report on Form 8-K filed on December 22, 2016).
|
|
2.3
|
Termination letter dated as of February 14, 2017, by and among Humana Inc., Aetna Inc., Echo Merger Sub, Inc. and Echo Merger Sub LLC (incorporated herein by reference to Exhibit 10.1 to Humana Inc.'s Current Report on Form 8-K filed on February 14, 2017).
|
|
3(a)
|
Restated Certificate of Incorporation of Humana Inc. filed with the Secretary of State of Delaware on November 9, 1989, as restated to incorporate the amendment of January 9, 1992, and the correction of March 23, 1992 (incorporated herein by reference to Exhibit 4(i) to Humana Inc.’s Post-Effective Amendment No.1 to the Registration Statement on Form S-8 (Reg. No. 33-49305) filed February 2, 1994).
|
|
(b)
|
By-Laws of Humana Inc., as amended on January 4, 2007 (incorporated herein by reference to Exhibit 3 to Humana Inc.’s Annual Report on Form 10-K for the year ended December 31, 2006).
|
|
4(a)
|
Indenture, dated as of August 5, 2003, by and between Humana Inc. and The Bank of New York, as trustee (incorporated herein by reference to Exhibit 4.1 to Humana Inc.’s Quarterly Report on Form 10-Q for the quarter ended September 30, 2003).
|
|
(b)
|
First Supplemental Indenture, dated as of August 5, 2003, by and between Humana Inc. and The Bank of New York, as trustee (incorporated herein by reference to Exhibit 4.2 to Humana Inc.’s Quarterly Report on Form 10-Q for the quarter ended September 30, 2003).
|
|
(c)
|
Second Supplemental Indenture, dated as of May 31, 2006, by and between Humana Inc. and The Bank of New York Trust Company, N.A., as trustee (incorporated herein by reference to Exhibit 4.1 to Humana Inc.’s Current Report on Form 8-K filed on May 31, 2006).
|
|
(d)
|
Third Supplemental Indenture, dated as of June 5, 2008, by and between Humana Inc. and The Bank of New York Trust Company, N.A., as trustee (incorporated herein by reference to Exhibit 4.1 to Humana Inc.’s Current Report on Form 8-K filed on June 5, 2008).
|
|
(e)
|
Fourth Supplemental Indenture, dated as of June 5, 2008, by and between Humana Inc. and The Bank of New York Trust Company, N.A., as trustee (incorporated herein by reference to Exhibit 4.3 to Humana Inc.’s Current Report on Form 8-K filed on June 5, 2008).
|
147
|
(f)
|
Indenture, dated as of March 30, 2006, by and between Humana Inc. and The Bank of New York Trust Company, N.A., as trustee (incorporated herein by reference to Exhibit 4.2 to Humana Inc.’s Registration Statement on Form S-3 filed on March 31, 2006).
|
|
(g)
|
There are no instruments defining the rights of holders with respect to long-term debt in excess of 10 percent of the total assets of Humana Inc. on a consolidated basis. Other long-term indebtedness of Humana Inc. is described herein in Note 12 to Consolidated Financial Statements. Humana Inc. agrees to furnish copies of all such instruments defining the rights of the holders of such indebtedness not otherwise filed as an Exhibit to this Annual Report on Form 10-K to the Commission upon request.
|
|
(h)
|
Fifth Supplemental Indenture, dated as of December 10, 2012, by and between Humana Inc. and The Bank of New York Mellon Trust Company, N.A., as trustee (incorporated herein by reference to Exhibit 4.1 to Humana Inc.’s Current Report on Form 8-K filed on December 10, 2012).
|
|
(i)
|
Sixth Supplemental Indenture, dated as of December 10, 2012, by and between Humana Inc. and The Bank of New York Mellon Trust Company, N.A., as trustee (incorporated herein by reference to Exhibit 4.3 to Humana Inc.’s Current Report on Form 8-K filed on December 10, 2012).
|
|
(j)
|
Seventh Supplemental Indenture, dated as of September 19, 2014, by and between Humana Inc. and The Bank of New York, Mellon Trust Company, N.A., as trustee (incorporated herein by reference to Exhibit 4.2 to Humana Inc.’s Current Report on Form 8-K filed on September 19, 2014).
|
|
(k)
|
Eighth Supplemental Indenture, dated as of September 19, 2014, by and between Humana Inc. and The Bank of New York Mellon Trust Company, N.A., as trustee (incorporated herein by reference to Exhibit 4.4 to Humana Inc.’s Current Report on Form 8-K filed on September 19, 2014).
|
|
(l)
|
Ninth Supplemental Indenture, dated as of September 19, 2014, by and between Humana Inc. and The Bank of New York Mellon Trust Company, N.A., as trustee (incorporated herein by reference to Exhibit 4.6 to Humana Inc.’s Current Report on Form 8-K filed on September 19, 2014).
|
|
10(a)*
|
Form of Company’s Restricted Stock Unit Agreement and Agreement not to Compete or Solicit under the 2011 Stock Incentive Plan (with retirement provisions) (incorporated herein by reference to Exhibit 10(a) to Humana Inc.’s Annual Report on Form 10-K for the fiscal year ended December 31, 2015).
|
|
(b)*
|
Form of Company’s Restricted Stock Unit Agreement and Agreement not to Compete or Solicit under the 2011 Stock Incentive Plan (without retirement provisions) (incorporated herein by reference to Exhibit 10(b) to Humana Inc.’s Annual Report on Form 10-K for the fiscal year ended December 31, 2015).
|
|
(c)*
|
Humana Inc. Amended and Restated 2003 Stock Incentive Plan (incorporated herein by reference to Appendix A to Humana Inc.’s Proxy Statement with respect to the Annual Meeting of Stockholders held on April 27, 2006).
|
|
(d)*
|
Humana Inc. Executive Management Incentive Compensation Plan, as amended and restated February 1, 2008 (incorporated herein by reference to Appendix A to Humana Inc.’s Proxy Statement with respect to the Annual Meeting of Stockholders held on April 24, 2008).
|
|
(e)*
|
Form of Change of Control Agreement (incorporated herein by reference to Exhibit 10.2 to Humana Inc.’s current report on Form 8-K filed on February 24, 2014).
|
|
(f)*
|
Trust under Humana Inc. Deferred Compensation Plans (incorporated herein by reference to Exhibit 10(p) to Humana Inc.’s Annual Report on Form 10-K for the fiscal year ended December 31, 1999).
|
|
(g)*
|
The Humana Inc. Deferred Compensation Plan for Non-Employee Directors (as amended on October 18, 2012) (incorporated herein by reference to Exhibit 10(m) to Humana Inc.’s Annual Report on Form 10-K for the fiscal year ended December 31, 2012).
|
|
(h)*
|
Severance policy as amended and restated on October 23, 2007 (incorporated herein by reference to Exhibit 10(r) to Humana Inc.’s Annual Report on Form 10-K for the fiscal year ended December 31, 2007).
|
|
(i)*
|
Humana Inc. Deferred Compensation Plan (incorporated herein by reference to Exhibit 4.1 to the Company’s Registration Statement on Form S-8 (Reg. No. 333-171616), filed on January 7, 2011).
|
148
|
(j)*
|
Humana Retirement Equalization Plan, as amended and restated as of January 1, 2011 (incorporated herein by reference to Exhibit 10(p) to Humana Inc.’s Annual Report on Form 10-K filed on February 17, 2011).
|
|
(k)*
|
Letter agreement with Humana Inc. officers concerning health insurance availability (incorporated herein by reference to Exhibit 10(mm) to Humana Inc.’s Annual Report on Form 10-K for the fiscal year ended December 31, 1994).
|
|
(l)*
|
Executive Long-Term Disability Program (incorporated herein by reference to Exhibit 10(a) to Humana Inc.’s Quarterly Report on Form 10-Q for the quarter ended September 30, 2004).
|
|
(m)*
|
Indemnity Agreement (incorporated herein by reference to Appendix B to Humana Inc.’s Proxy Statement with respect to the Annual Meeting of Stockholders held on January 8, 1987).
|
|
(n)* **
|
Form of Company’s Restricted Stock Unit Agreement with Time/Performance Vesting and Agreement not to Compete or Solicit, under the 2011 Stock Incentive Plan (incorporated herein by reference to Exhibit 10(t) to Humana Inc.’s Annual Report on Form 10-K/A filed on January 30, 2014).
|
|
(o)*
|
Form of Company’s Restricted Stock Unit Agreement and Agreement not to Solicit under the 2011 Stock Incentive Plan (with retirement provisions) (incorporated herein by reference to Exhibit 10(o) to Humana Inc.’s Annual Report on Form 10-K for the fiscal year ended December 31, 2015).
|
|
(p)*
|
Summary of the Company’s Financial Planning Program for our executive officers (incorporated herein by reference to Exhibit 10(v) to Humana’s Inc.’s Annual Report on Form 10-K filed on February 22, 2013.
|
|
(q)*
|
Form of Company’s Restricted Stock Unit Agreement and Agreement not to Solicit under the 2011 Stock Incentive Plan (without retirement provisions) (incorporated herein by reference to Exhibit 10(q) to Humana Inc.’s Annual Report on Form 10-K for the fiscal year ended December 31, 2015).
|
|
(r)
|
Five-Year Credit Agreement, dated as of July 9, 2013 (incorporated herein by reference to Exhibit 10 to Humana Inc.’s Current Report on Form 8-K filed on July 10, 2013).
|
|
(s)
|
Form of CMS Coordinated Care Plan Agreement (incorporated herein by reference to Exhibit 10.1 to Humana Inc.’s Quarterly Report on Form 10-Q for the quarter ended September 30, 2005).
|
|
(t)
|
Form of CMS Private Fee for Service Agreement (incorporated herein by reference to Exhibit 10.2 to Humana Inc.’s Quarterly Report on Form 10-Q for the quarter ended September 30, 2005).
|
|
(u)
|
Addendum to Agreement Providing for the Operation of a Medicare Voluntary Prescription Drug Plan (incorporated herein by reference to Exhibit 10.3 to Humana Inc.’s Quarterly Report on Form 10-Q for the quarter ended September 30, 2005).
|
|
(v)
|
Addendum to Agreement Providing for the Operation of an Employer/Union-only Group Medicare Advantage Prescription Drug Plan (incorporated herein by reference to Exhibit 10.4 to Humana Inc.’s Quarterly Report on Form 10-Q for the quarter ended September 30, 2005).
|
|
(w)
|
Addendum to Agreement Providing for the Operation of an Employer/Union-only Group Medicare Advantage-Only Plan (incorporated herein by reference to Exhibit 10.5 to Humana Inc.’s Quarterly Report on Form 10-Q for the quarter ended September 30, 2005).
|
|
(x)
|
Addendum to Agreement Providing for the Operation of a Medicare Advantage Regional Coordinated Care Plan (incorporated herein by reference to Exhibit 10.6 to Humana Inc.’s Quarterly Report on Form 10-Q for the quarter ended September 30, 2005).
|
|
(y)
|
Explanatory Note regarding Medicare Prescription Drug Plan Contracts between Humana and CMS (incorporated herein by reference to Exhibit 10(nn) to Humana Inc.’s Annual Report on Form 10-K for the fiscal year ended December 31, 2005).
|
|
(z)*
|
Humana Inc. 2011 Stock Incentive Plan (incorporated herein by reference to Appendix A to Humana Inc.’s Proxy Statement with respect to the Annual Meeting of Stockholders held on April 21, 2011).
|
149
|
(aa)*
|
Form of Company’s Stock Option Agreement under the 2011 Stock Incentive Plan (Non-Qualified Stock Options with Non-Compete/Non-Solicit) (incorporated herein by reference to Exhibit 10(oo) to Humana Inc.’s Annual Report on Form 10-K filed on February 24, 2012).
|
|
(bb)*
|
Form of Company’s Stock Option Agreement under the 2011 Stock Incentive Plan (Incentive Stock Options with Non-Compete/Non-Solicit) (incorporated herein by reference to Exhibit 10(pp) to Humana Inc.’s Annual Report on Form 10-K filed on February 24, 2012).
|
|
(cc)*
|
Form of Company’s Restricted Stock Unit Agreement and Agreement not to Compete or Solicit under the 2011 Stock Incentive Plan (incorporated herein by reference to Exhibit 10(rr) to Humana Inc.’s Annual Report on Form 10-K filed on February 24, 2012).
|
|
(dd)*
|
Amended and Restated Employment Agreement, dated as of February 27, 2014, by and between Humana Inc. and Bruce D. Broussard (incorporated herein by reference to Exhibit 10.1 to Humana Inc.’s current report on Form 8-K filed on February 28, 2014).
|
|
(ee)*
|
Amendment to the Amended and Restated Employment Agreement between Humana Inc. and Bruce D. Broussard, dated July 2, 2015 (incorporated herein by reference to Exhibit 10.1 to Humana Inc.’s current report on Form 8-K filed on July 9, 2015).
|
|
(ff)**
|
Agreement between the United States Department of Defense and Humana Military Healthcare Services, Inc., a wholly owned subsidiary of Humana Inc., dated as March 3, 2011 (incorporated herein by reference to Exhibit 10(mm) to Humana Inc.’s Annual Report on Form 10-K filed on February 24, 2012).
|
|
(gg)*
|
Form of Amendment to Change of Control Agreement between Humana Inc. and various executive officers (incorporated herein by reference to Exhibit 10.1 to Humana Inc.’s current report on Form 8-K filed on February 24, 2014).
|
|
(hh)
|
Form of Commercial Paper Dealer Agreement between Humana Inc., as Issuer, and the Dealer party thereto (incorporated herein by reference to Exhibit 10.1 to Humana Inc.’s current report on Form 8-K filed on October 6, 2014).
|
|
(ii)
|
Master Confirmation by and between Humana Inc. and Goldman, Sachs & Co., dated November 7, 2014 (incorporated herein by reference to Humana Inc.’s current report on Form 8-K filed on November 10, 2014).
|
|
(jj)*
|
Form of Company's Stock Option Agreement under the 2011 Stock Incentive Plan (Incentive Stock Options) (incorporated herein by reference to Exhibit 10(jj) to Humana Inc.’s Annual Report on Form 10-K for the fiscal year ended December 31, 2015).
|
|
(kk)*
|
Form of Company's Stock Option Agreement under the 2011 Stock Incentive Plan (Non-Qualified Stock Options with Non-Compete/Non-Solicit) (incorporated herein by reference to Exhibit 10(kk) to Humana Inc.’s Annual Report on Form 10-K for the fiscal year ended December 31, 2015).
|
|
12 †
|
Computation of ratio of earnings to fixed charges.
|
|
14
|
Code of Conduct for Chief Executive Officer & Senior Financial Officers (incorporated herein by reference to Exhibit 14 to Humana Inc.’s Annual Report on Form 10-K for the fiscal year ended December 31, 2003).
|
|
21 †
|
List of subsidiaries.
|
|
23 †
|
Consent of PricewaterhouseCoopers LLP.
|
|
31.1 †
|
CEO certification pursuant to Rule 13a-14(a)/15d-14(a).
|
|
31.2 †
|
CFO certification pursuant to Rule 13a-14(a)/15d-14(a).
|
|
32 †
|
Certification pursuant to 18 U.S.C. Section 1350, as adopted pursuant to Section 906 of the Sarbanes – Oxley Act of 2002.
|
|
101
|
The following materials from Humana Inc.'s Annual Report on Form 10-K formatted in XBRL (Extensible Business Reporting Language): (i) the Consolidated Balance Sheets at
December 31, 2016
and
2015
; (ii) the
|
150
Consolidated Statements of Income for the years ended
December 31, 2016
,
2015
and
2014
; (iii) the Consolidated Statements of Comprehensive Income for the years ended
December 31, 2016
,
2015
and
2014
; (iv) the Consolidated Statements of Stockholders’ Equity as of
December 31, 2016
,
2015
, and
2014
; (v) the Consolidated Statements of Cash Flows for the years ended
December 31, 2016
,
2015
and
2014
; and (vi) Notes to Consolidated Financial Statements.
*Exhibits 10(a) through and including 10(q) and 10(z) through and including 10(ee),10(gg),10(jj) and 10(ii) are compensatory plans or management contracts.
**Pursuant to Rule 24b-2 of the Securities Exchange Act of 1934, as amended, confidential portions of this exhibit have been omitted and filed separately with the Securities and Exchange Commission pursuant to a request for confidential treatment.
†Submitted electronically with this report.
151
Humana Inc.
SCHEDULE I—PARENT COMPANY FINANCIAL INFORMATION
CONDENSED BALANCE SHEETS
|
|
December 31,
|
||||||
|
|
2016
|
2015
|
|||||
|
|
(in millions, except share
amounts) |
||||||
|
ASSETS
|
|||||||
|
Current assets:
|
|||||||
|
Cash and cash equivalents
|
$
|
1,710
|
|
$
|
1,389
|
|
|
|
Investment securities
|
300
|
|
256
|
|
|||
|
Receivable from operating subsidiaries
|
1,136
|
|
1,124
|
|
|||
|
Other current assets
|
122
|
|
224
|
|
|||
|
Total current assets
|
3,268
|
|
2,993
|
|
|||
|
Property and equipment, net
|
1,086
|
|
1,011
|
|
|||
|
Investments in subsidiaries
|
15,276
|
|
14,276
|
|
|||
|
Other long-term assets
|
374
|
|
410
|
|
|||
|
Total assets
|
$
|
20,004
|
|
$
|
18,690
|
|
|
|
LIABILITIES AND STOCKHOLDERS’ EQUITY
|
|||||||
|
Current liabilities:
|
|||||||
|
Payable to operating subsidiaries
|
$
|
4,107
|
|
$
|
3,322
|
|
|
|
Current portion of notes payable to operating subsidiaries
|
28
|
|
28
|
|
|||
|
Book overdraft
|
38
|
|
38
|
|
|||
|
Short-term borrowings
|
300
|
|
299
|
|
|||
|
Other current liabilities
|
708
|
|
572
|
|
|||
|
Total current liabilities
|
5,181
|
|
4,259
|
|
|||
|
Long-term debt
|
3,792
|
|
3,794
|
|
|||
|
Notes payable to operating subsidiaries
|
9
|
|
9
|
|
|||
|
Other long-term liabilities
|
337
|
|
282
|
|
|||
|
Total liabilities
|
9,319
|
|
8,344
|
|
|||
|
Commitments and contingencies
|
|||||||
|
Stockholders’ equity:
|
|||||||
|
Preferred stock, $1 par; 10,000,000 shares authorized; none issued
|
—
|
|
—
|
|
|||
|
Common stock, $0.16 2/3 par; 300,000,000 shares authorized;
198,495,007 shares issued at December 31, 2016 and 198,372,059 shares issued at December 31, 2015 |
33
|
|
33
|
|
|||
|
Capital in excess of par value
|
2,562
|
|
2,530
|
|
|||
|
Retained earnings
|
11,454
|
|
11,017
|
|
|||
|
Accumulated other comprehensive income
|
(66
|
)
|
58
|
|
|||
|
Treasury stock, at cost, 49,189,811 shares at December 31, 2016
and 50,084,043 shares at December 31, 2015 |
(3,298
|
)
|
(3,292
|
)
|
|||
|
Total stockholders’ equity
|
10,685
|
|
10,346
|
|
|||
|
Total liabilities and stockholders’ equity
|
$
|
20,004
|
|
$
|
18,690
|
|
|
See accompanying notes to the parent company financial statements.
152
Humana Inc.
SCHEDULE I—PARENT COMPANY FINANCIAL INFORMATION
CONDENSED STATEMENTS OF INCOME
|
|
For the year ended December 31,
|
||||||||||
|
|
2016
|
2015
|
2014
|
||||||||
|
|
(in millions)
|
||||||||||
|
Revenues:
|
|||||||||||
|
Management fees charged to operating subsidiaries
|
$
|
1,683
|
|
$
|
1,469
|
|
$
|
1,509
|
|
||
|
Investment and other income, net
|
42
|
|
5
|
|
4
|
|
|||||
|
1,725
|
|
1,474
|
|
1,513
|
|
||||||
|
Expenses:
|
|||||||||||
|
Operating costs
|
1,623
|
|
1,370
|
|
1,434
|
|
|||||
|
Depreciation
|
302
|
|
252
|
|
212
|
|
|||||
|
Interest
|
189
|
|
186
|
|
192
|
|
|||||
|
2,114
|
|
1,808
|
|
1,838
|
|
||||||
|
Loss before gain on sale of business, income taxes and equity in net earnings of subsidiaries
|
(389
|
)
|
(334
|
)
|
(325
|
)
|
|||||
|
Gain on sale of business
|
—
|
|
270
|
|
—
|
|
|||||
|
Loss before income taxes and equity in net earnings of subsidiaries
|
(389
|
)
|
(64
|
)
|
(325
|
)
|
|||||
|
Benefit for income taxes
|
(107
|
)
|
(70
|
)
|
(81
|
)
|
|||||
|
Income (loss) before equity in net earnings of subsidiaries
|
(282
|
)
|
6
|
|
(244
|
)
|
|||||
|
Equity in net earnings of subsidiaries
|
896
|
|
1,270
|
|
1,391
|
|
|||||
|
Net income
|
$
|
614
|
|
$
|
1,276
|
|
$
|
1,147
|
|
||
See accompanying notes to the parent company financial statements.
153
Humana Inc.
SCHEDULE I—PARENT COMPANY FINANCIAL INFORMATION
CONDENSED STATEMENTS OF COMPREHENSIVE INCOME
|
|
For the year ended December 31,
|
||||||||||
|
|
2016
|
2015
|
2014
|
||||||||
|
|
(in millions)
|
||||||||||
|
Net income
|
$
|
614
|
|
$
|
1,276
|
|
$
|
1,147
|
|
||
|
Other comprehensive (loss) income:
|
|||||||||||
|
Change in gross unrealized investment gains/losses
|
(101
|
)
|
(114
|
)
|
122
|
|
|||||
|
Effect of income taxes
|
38
|
|
42
|
|
(44
|
)
|
|||||
|
Total change in unrealized investment
gains/losses, net of tax |
(63
|
)
|
(72
|
)
|
78
|
|
|||||
|
Reclassification adjustment for net realized
gains included in investment income |
(96
|
)
|
(146
|
)
|
(20
|
)
|
|||||
|
Effect of income taxes
|
35
|
|
53
|
|
7
|
|
|||||
|
Total reclassification adjustment, net of tax
|
(61
|
)
|
(93
|
)
|
(13
|
)
|
|||||
|
Other comprehensive (loss) income, net of tax
|
(124
|
)
|
(165
|
)
|
65
|
|
|||||
|
Comprehensive income
|
$
|
490
|
|
$
|
1,111
|
|
$
|
1,212
|
|
||
See accompanying notes to the parent company financial statements.
154
Humana Inc.
SCHEDULE I—PARENT COMPANY FINANCIAL INFORMATION
CONDENSED STATEMENTS OF CASH FLOWS
|
|
For the year ended December 31,
|
||||||||||
|
|
2016
|
2015
|
2014
|
||||||||
|
|
(in millions)
|
||||||||||
|
Net cash provided by operating activities
|
$
|
1,848
|
|
$
|
953
|
|
$
|
1,499
|
|
||
|
Cash flows from investing activities:
|
|||||||||||
|
Proceeds from sale of business
|
—
|
|
1,055
|
|
—
|
|
|||||
|
Capital contributions to operating subsidiaries
|
(895
|
)
|
(833
|
)
|
(442
|
)
|
|||||
|
Purchases of investment securities
|
(151
|
)
|
(507
|
)
|
(629
|
)
|
|||||
|
Proceeds from sale of investment securities
|
25
|
|
18
|
|
606
|
|
|||||
|
Maturities of investment securities
|
143
|
|
108
|
|
149
|
|
|||||
|
Purchases of property and equipment, net
|
(382
|
)
|
(378
|
)
|
(380
|
)
|
|||||
|
Net cash used in investing activities
|
(1,260
|
)
|
(537
|
)
|
(696
|
)
|
|||||
|
Cash flows from financing activities:
|
|||||||||||
|
Proceeds from issuance of senior notes, net
|
—
|
|
—
|
|
1,733
|
|
|||||
|
Proceeds from issuance of commercial paper, net
|
(2
|
)
|
298
|
|
—
|
|
|||||
|
Repayment of long-term debt
|
—
|
|
—
|
|
(500
|
)
|
|||||
|
Change in book overdraft
|
5
|
|
(16
|
)
|
(5
|
)
|
|||||
|
Common stock repurchases
|
(104
|
)
|
(385
|
)
|
(872
|
)
|
|||||
|
Dividends paid
|
(177
|
)
|
(172
|
)
|
(172
|
)
|
|||||
|
Tax benefit from stock-based compensation
|
—
|
|
15
|
|
12
|
|
|||||
|
Proceeds from stock option exercises and other
|
11
|
|
22
|
|
51
|
|
|||||
|
Net cash (used in) provided by financing activities
|
(267
|
)
|
(238
|
)
|
247
|
|
|||||
|
Increase in cash and cash equivalents
|
321
|
|
178
|
|
1,050
|
|
|||||
|
Cash and cash equivalents at beginning of year
|
1,389
|
|
1,211
|
|
161
|
|
|||||
|
Cash and cash equivalents at end of year
|
$
|
1,710
|
|
$
|
1,389
|
|
$
|
1,211
|
|
||
See accompanying notes to the parent company financial statements.
155
Humana Inc.
SCHEDULE I—PARENT COMPANY FINANCIAL INFORMATION
NOTES TO CONDENSED FINANCIAL STATEMENTS
1. BASIS OF PRESENTATION
Parent company financial information has been derived from our consolidated financial statements and excludes the accounts of all operating subsidiaries. This information should be read in conjunction with our consolidated financial statements.
Related Party
Refer to Note 2 of the notes to consolidated financial statements in this Annual Report on Form 10-K for a description of our related party transactions. A related party note receivable is included with other long-term assets in our condensed balance sheet at December 31,
2016
and December 31, 2015 in the amount of
$314 million
and
$284 million
, respectively. The related interest income of
$30 million
for
2016
is included in investment and other income in our condensed statement of income.
2. TRANSACTIONS WITH SUBSIDIARIES
Management Fee
Through intercompany service agreements approved, if required, by state regulatory authorities, Humana Inc., our parent company, charges a management fee for reimbursement of certain centralized services provided to its subsidiaries including information systems, disbursement, investment and cash administration, marketing, legal, finance, and medical and executive management oversight.
Dividends
Cash dividends received from subsidiaries and included as a component of net cash provided by operating activities were
$763 million
in
2016
,
$493 million
in
2015
, and
$927 million
in
2014
.
Guarantee
Through indemnity agreements approved by state regulatory authorities, certain of our regulated subsidiaries generally are guaranteed by our parent company in the event of insolvency for: (1) member coverage for which premium payment has been made prior to insolvency; (2) benefits for members then hospitalized until discharged; and (3) payment to providers for services rendered prior to insolvency. Our parent has also guaranteed the obligations of our military services subsidiaries.
Notes Receivables from Operating Subsidiaries
We funded certain subsidiaries with surplus note agreements. These notes are generally non-interest bearing and may not be entered into or repaid without the prior approval of the applicable Departments of Insurance or other state regulatory authorities.
Notes Payable to Operating Subsidiaries
We borrowed funds from certain subsidiaries with notes generally collateralized by real estate. These notes, which have various payment and maturity terms, bear interest ranging from
1.93%
to
6.65%
and are payable in
2017
and
2019
. We recorded interest expense of
$1 million
related to these notes for each of the years ended December 31,
2016
,
2015
and
2014
.
156
Humana Inc.
SCHEDULE I—PARENT COMPANY FINANCIAL INFORMATION
NOTES TO CONDENSED FINANCIAL STATEMENTS—(Continued)
3. REGULATORY REQUIREMENTS
Certain of our subsidiaries operate in states that regulate the payment of dividends, loans, or other cash transfers to Humana Inc., our parent company, and require minimum levels of equity as well as limit investments to approved securities. The amount of dividends that may be paid to Humana Inc. by these subsidiaries, without prior approval by state regulatory authorities, or ordinary dividends, is limited based on the entity’s level of statutory income and statutory capital and surplus. In most states, prior notification is provided before paying a dividend even if approval is not required.
Although minimum required levels of equity are largely based on premium volume, product mix, and the quality of assets held, minimum requirements vary significantly at the state level. Our state regulated insurances subsidiaries had aggregate statutory capital and surplus of approximately
$7.7 billion
and
$6.6 billion
as of December 31,
2016
and
2015
,
respectively, which exceeded aggregate minimum regulatory requirements of
$4.8 billion
and
$4.6 billion
, respectively.
Subsidiary dividends are subject to state regulatory approval, the amount and timing of which could be reduced or delayed.
Excluding Puerto Rico subsidiaries, the amount of ordinary dividends that may be paid to our parent company in
2017
is approximately
$850 million
in the aggregate. This compares to dividends that were paid to our parent company in
2016
of approximately
$763 million
.
Actual dividends paid may vary due to consideration of excess statutory capital and surplus and expected future surplus requirements related to, for example, premium volume and product mix.
Our parent company funded a subsidiary capital contribution of approximately
$535 million
in the first quarter of 2017 for reserve strengthening associated with our closed block of long-term care insurance policies discussed further in Note 18 of the notes to consolidated financial statements in this Annual Report on Form 10-K.
Our use of operating cash flows derived from our non-insurance subsidiaries, such as in our Healthcare Services segment, is generally not restricted by state departments of insurance (or comparable state regulators).
4. ACQUISITIONS AND DIVESTITURES
Refer to Note 3 of the notes to consolidated financial statements in this Annual Report on Form 10-K for a description of certain acquisitions and divestitures. On June 1, 2015, we completed the sale of our wholly owned subsidiary, Concentra Inc. During
2016
,
2015
and
2014
, we funded certain non-regulated subsidiary acquisitions with contributions from Humana Inc., our parent company, included in capital contributions in the condensed statement of cash flows.
5. INCOME TAXES
Refer to Note 11 of the notes to consolidated financial statements included in this Annual Report on Form 10-K for a description of income taxes.
6. DEBT
Refer to Note 12 of the notes to consolidated financial statements included in this Annual Report on Form 10-K for a description of debt.
7. STOCKHOLDER’S EQUITY
Refer to Note 15 of the notes to consolidated financial statements included in this Annual Report on Form 10-K for a description of stockholders’ equity, including stock repurchases and stockholder dividends.
157
Humana Inc.
SCHEDULE II—VALUATION AND QUALIFYING ACCOUNTS
For the Years Ended December 31,
2016
,
2015
, and
2014
(in millions)
|
|
|
|
Additions
|
|
|
|||||||||||||||||||
|
|
Balance at
Beginning of Period |
Acquired/(Disposed)
Balances |
Charged
(Credited) to Costs and Expenses |
Charged to
Other Accounts (1) |
Deductions
or Write-offs |
Balance at
End of Period |
||||||||||||||||||
|
Allowance for loss on receivables:
|
||||||||||||||||||||||||
|
2016
|
$
|
101
|
|
$
|
—
|
|
$
|
39
|
|
$
|
19
|
|
$
|
(41
|
)
|
$
|
118
|
|
||||||
|
2015
|
137
|
|
(39
|
)
|
61
|
|
(7
|
)
|
(51
|
)
|
101
|
|
||||||||||||
|
2014
|
118
|
|
—
|
|
32
|
|
28
|
|
(41
|
)
|
137
|
|
||||||||||||
|
Deferred tax asset valuation allowance:
|
||||||||||||||||||||||||
|
2016
|
(42
|
)
|
—
|
|
(7
|
)
|
—
|
|
—
|
|
(49
|
)
|
||||||||||||
|
2015
|
(48
|
)
|
—
|
|
6
|
|
—
|
|
—
|
|
(42
|
)
|
||||||||||||
|
2014
|
(28
|
)
|
—
|
|
(20
|
)
|
—
|
|
—
|
|
(48
|
)
|
||||||||||||
|
(1)
|
Represents changes in retroactive membership adjustments to premiums revenue and contractual allowances adjustments to services revenue as more fully described in Note 2 to the consolidated financial statements included in this annual report on Form 10-K.
|
158
SIGNATURES
Pursuant to the requirements of Sections 13 or 15(d) of the Securities Exchange Act of 1934, the Company has duly caused this report to be signed on its behalf by the undersigned, thereto duly authorized.
|
H
UMANA
I
NC
.
|
|||
|
By:
|
|
/s/ BRIAN A. KANE
|
|
|
|
Brian A. Kane
|
||
|
|
Senior Vice President and Chief Financial Officer
(Principal Financial Officer)
|
||
|
Date:
|
|
February 17, 2017
|
|
Pursuant to the requirements of the Securities Exchange Act of 1934, this report has been signed below by the following persons on behalf of the Company and in the capacities and on the date indicated.
|
Signature
|
|
Title
|
|
Date
|
|
/s/ BRIAN A. KANE
|
Senior Vice President and Chief Financial Officer
(Principal Financial Officer) |
February 17, 2017
|
||
|
Brian A. Kane
|
||||
|
/s/ CYNTHIA H. ZIPPERLE
|
Vice President, Chief Accounting Officer
and Controller (Principal Accounting Officer)
|
February 17, 2017
|
||
|
Cynthia H. Zipperle
|
||||
|
/s/ BRUCE D. BROUSSARD
|
|
President and Chief Executive Officer,
Director (Principal Executive Officer)
|
|
February 17, 2017
|
|
Bruce D. Broussard
|
|
|
||
|
/s/ KURT J. HILZINGER
|
|
Chairman of the Board
|
|
February 17, 2017
|
|
Kurt J. Hilzinger
|
|
|
||
|
/s/ FRANK A. D’AMELIO
|
|
Director
|
|
February 17, 2017
|
|
Frank A. D’Amelio
|
|
|
||
|
/s/ W. ROY DUNBAR
|
|
Director
|
|
February 17, 2017
|
|
W. Roy Dunbar
|
|
|
||
|
/s/ DAVID A. JONES, JR.
|
|
Director
|
|
February 17, 2017
|
|
David A. Jones, Jr.
|
|
|
||
|
/s/ WILLIAM J. MCDONALD
|
|
Director
|
|
February 17, 2017
|
|
William J. McDonald
|
|
|
||
|
/s/ WILLIAM E. MITCHELL
|
|
Director
|
|
February 17, 2017
|
|
William E. Mitchell
|
|
|
||
|
/s/ DAVID B. NASH, M.D.
|
|
Director
|
|
February 17, 2017
|
|
David B. Nash, M.D.
|
|
|
||
|
/s/ JAMES J. O’BRIEN
|
|
Director
|
|
February 17, 2017
|
|
James J. O’Brien
|
|
|
||
|
/s/ MARISSA T. PETERSON
|
|
Director
|
|
February 17, 2017
|
|
Marissa T. Peterson
|
|
|
||
159
TABLE OF CONTENTS
Part IItem 1. BusinessItem 1A. Risk FactorsItem 1B. Unresolved Staff CommentsItem 2. PropertiesItem 3. Legal ProceedingsItem 4. Mine Safety DisclosuresPart IIItem 5. Market For The Registrant S Common Equity, Related Stockholder Matters and Issuer Purchases Of Equity SecuritiesItem 6. Selected Financial DataItem 7. Management S Discussion and Analysis Of Financial Condition and Results Of OperationsItem 7A. Quantitative and Qualitative Disclosures About Market RiskItem 8. Financial Statements and Supplementary DataItem 9. Changes in and Disagreements with Accountants on Accounting and Financial DisclosureItem 9A. Controls and ProceduresItem 9B. Other InformationPart IIIItem 10. Directors, Executive Officers and Corporate GovernanceItem 11. Executive CompensationItem 12. Security Ownership Of Certain Beneficial Owners and Management and Related Stockholder MattersItem 13. Certain Relationships and Related Transactions, and Director IndependenceItem 14. Principal Accounting Fees and ServicesPart IVItem 15. Exhibits, Financial Statement Schedules