HAVERTY FURNITURE COMPANIES INC
10-Ks and 10-Qs
|
|
|
|
|
|
|
|
|
|
|
|
|
|
|
|
|
|
|
|
|
|
|
|
|
|
|
|
|
|
|
|
|
|
|
|
|
|
|
|
|
|
|
|
|
|
|
|
|
|
|
|
|
UNITED STATES SECURITIES AND EXCHANGE COMMISSION
Washington, D.C. 20549
FORM 10-K
(Mark One)
| ☒ |
ANNUAL REPORT PURSUANT TO SECTION 13 OR 15(d)OF THE SECURITIES EXCHANGE ACT OF 1934
For the fiscal year ended December 31, 2017
|
OR
| ☐ |
TRANSITION REPORT PURSUANT TO SECTION 13 OR 15(d) OF THE SECURITIES EXCHANGE ACT OF 1934
For the transition period from to
|
Commission file number:
1-14445

HAVERTY FURNITURE COMPANIES, INC.
(Exact name of registrant as specified in its charter)
|
Maryland
|
58-0281900
|
|
(State of Incorporation)
|
(IRS Employer Identification Number)
|
|
780 Johnson Ferry Road, Suite 800
Atlanta, Georgia
|
30342
|
|
(Address of principal executive offices)
|
(Zip Code)
|
|
(404) 443-2900
|
|
|
(Registrant's telephone number, including area code)
|
|
Securities registered pursuant to Section 12(b) of the Act:
|
Title of each Class
|
Name of each exchange on which registered
|
|
Common Stock ($1.00 Par Value)
|
New York Stock Exchange, Inc.
|
|
Class A Common Stock ($1.00 Par Value)
|
New York Stock Exchange, Inc.
|
Securities registered pursuant to Section 12(g) of the Act:
None.
Indicate by check mark if the registrant is a well-known seasoned issuer, as defined in Rule 405 of the Securities Act. Yes
☐
No
☒
Indicate by check mark if the registrant is not required to file reports pursuant to Section 13 or Section 15(d) of the Exchange Act.
Yes
☐
No
☒
Indicate by check mark whether the registrant (1) has filed all reports required to be filed by Section 13 or 15(d) of the Securities Exchange Act of 1934 during the preceding 12 months (or for such shorter period that the registrant was required to file such reports), and (2) has been subject to such filing requirements for the past 90 days. Yes
☒
No
☐
Indicate by check mark whether the registrant has submitted electronically and posted on its corporate Web site, if any, every Interactive Data File required to be submitted and posted pursuant to Rule 405 of Regulation S-T (§232.405 of this chapter) during the preceding 12 months (or for such shorter period that the registrant was required to submit and post such files).
Yes
☒
No
☐
Indicate by check mark if disclosure of delinquent filers pursuant to Item 405 of Regulation S-K (
§229.405 of this chapter)
is not contained herein, and will not be contained, to the best of registrant's knowledge, in definitive proxy or information statements incorporated by reference in Part III of this Form 10-K or any amendment to this Form 10-K.
☒
Indicate by check mark whether the registrant is a large accelerated filer, an accelerated filer, a non-accelerated filer, a smaller reporting company or emerging growth company. See the definitions of "large accelerated filer," "accelerated filer," "smaller reporting company," and "emergency growth company" in Rule 12b-2 of the Exchange Act.
|
Large accelerated filer
☐
|
Accelerated filer
☒
|
|
Non-accelerated filer
☐
(Do not check if a smaller reporting company)
|
Smaller reporting company
☐
Emerging growth company
☐
|
Indicate by check mark whether the registrant is a shell company (as defined in Rule 12b-2 of the Exchange Act). Yes
☐
No
☒
As of June 30, 2017, the aggregate market value of the registrant's common stock held by non-affiliates of the registrant was $477,498,547 (based on the closing sale prices of the registrant's two classes of common stock as reported by the New York Stock Exchange).
There were 19,427,144 shares of common stock and 1,767,296 shares of Class A common stock, each with a par value of $1.00 per share outstanding at February 27, 2018.
DOCUMENTS INCORPORATED BY REFERENCE
Portions of the registrant's Proxy Statement for the Annual Meeting of Stockholders to be held May 7, 2018 are incorporated by reference in Part III.
HAVERTY FURNITURE COMPANIES, INC.
Annual Report on Form 10-K for the year ended December 31, 2017
Table of Contents
FORWARD-LOOKING STATEMENTS
This document contains "forward-looking statements" – that is, statements related to future, not past, events. In this context, forward-looking statements often address our expected future business and financial performance and financial condition. These statements are within the meaning of Section 27A of the Securities Act of 1933 and Section 21F of the Securities Exchange Act of 1934.
Forward-looking statements include, but are not limited to:
|
·
|
projections of sales or comparable store sales, gross profit, SG&A expenses, capital expenditures or other financial measures;
|
|
·
|
descriptions of anticipated plans or objectives of our management for operations or products;
|
|
·
|
forecasts of performance; and
|
|
·
|
assumptions regarding any of the foregoing.
|
Because these statements involve anticipated events or conditions, forward-looking statements often include words such as "anticipate," "believe," "estimate," "expect," "intend," "plan," "project," "target," "can," "could," "may," "should," "will," "would," or similar expressions.
These forward-looking statements are based upon assessments and assumptions of management in light of historical results and trends, current conditions and potential future developments that often involve judgment, estimates, assumptions and projections. Forward-looking statements reflect current views about our plans, strategies and prospects, which are based on information currently available.
Although we believe that our plans, intentions and expectations as reflected in or suggested by any forward-looking statements are reasonable, they are not guarantees. Actual results may differ materially from our anticipated results described or implied in our forward-looking statements, and such differences may be due to a variety of factors. Our business could also be affected by additional factors that are presently unknown to us or that we currently believe to be immaterial to our business.
Discussed elsewhere in further detail in this report are some important risks, uncertainties and
contingencies which could cause our actual results, performance or achievements to be materially different from any forward-looking statements made or implied in this report.
Forward-looking statements are only as of the date they are made and they might not be updated to reflect changes as they occur after the forward-looking statements are made. We assume no obligations to update publicly any forward-looking statements, whether as a result of new information, future events or otherwise. In evaluating forward-looking statements, you should consider these risks and uncertainties, together with the other risks described from time to time in our other reports and documents filed with the Securities and Exchange Commission, or SEC, and you should not place undue reliance on those statements.
We intend for any forward-looking statements to be covered by, and we claim the protection under, the safe harbor provisions for forward-looking statements contained in the Private Securities Litigation Reform Act of 1995.
1
Unless otherwise indicated by the context, we use the terms "Havertys," "we," "our," or "us" when referring to the consolidated operations of Haverty Furniture Companies, Inc.
Overview
Havertys is a specialty retailer of residential furniture and accessories. Our founder, J.J. Haverty began the business in 1885 in Atlanta, Georgia with one store and made deliveries using horse-drawn wagons. The Company grew to 18 stores and accessed additional capital for growth through its initial public offering in October 1929.
Havertys has grown to 124 stores in 16 states in the Southern and Midwest regions. All of our retail locations are operated using the Havertys name and we do not franchise our stores. Our customers are generally college educated women in middle to upper-middle income households. Our brand recognition is very high in the markets we serve and consumer surveys indicate Havertys is associated with a high level of quality, fashion, value and service.
Merchandise and Revenues
We develop our merchandise selection with the tastes of the diverse "on trend" consumer in mind. A wide range of styles from traditional to contemporary are in our core assortment and most of the furniture merchandise we carry bears the Havertys brand. We also tailor our product offerings to the needs and tastes of the local markets we serve emphasizing more "coastal," "western" or "urban" looks as appropriate. Our custom upholstery programs and eclectic looks are an important part of our product mix and allow the on trend consumer more self-expression.
We have avoided offering lower quality, promotional price-driven merchandise favored by many regional and national chains, which we believe would devalue the Havertys brand with the consumer. We carry nationally well-known mattress product lines such as Sealy®, Tempur-Pedic®, Serta®, Stearns & Foster®, and Beautyrest Black®.
Our customers use varying methods to purchase or finance their sales. As an added convenience to our customers, we offer financing by a third-party finance company or through an internal revolving charge credit plan. Sales financed by the third-party provider are not Havertys' receivables; accordingly, we do not have any credit risk or servicing responsibility for these accounts, and there is no credit or collection recourse to Havertys. The most popular programs offered through the third-party provider for 2017 were no interest offers requiring monthly payments over periods of 18 to 36 months. The fees we pay to the third-party are included in SG&A as a selling expense. We also maintain a small in-house financing program for our customers with the offer most frequently chosen carrying no interest for 12 months and requiring equal monthly payments. This program generates very minor credit revenue and is for credit worthy customers who prefer financing with the retailer directly or who are not able to quickly establish sufficient credit with other providers on comparable terms.
2
The following summarizes the different purchasing methods used as a percent of amount due from customers including sales tax:
|
|
Year Ended December 31,
|
|||||||||||
|
2017
|
2016
|
2015
|
||||||||||
|
Cash or check
|
8.8
|
%
|
8.5
|
%
|
9.7
|
%
|
||||||
|
Credit or debit cards
|
59.8
|
58.0
|
56.3
|
|||||||||
|
Third-party financed
|
30.8
|
32.5
|
32.6
|
|||||||||
|
Havertys financed
|
0.6
|
1.0
|
1.4
|
|||||||||
|
100.0
|
%
|
100.0
|
%
|
100.0
|
%
|
|||||||
Stores
As of December 31, 2017, we operated 124 stores serving 84 cities in 16 states with approximately 4.5 million retail square feet. Our stores range in size from 19,000 to 66,000 selling square feet with the average being approximately 35,000 square feet. We strive to have our stores reflect the distinctive style and comfort consumers expect to find when purchasing their home furnishings. The store's curb appeal is important to the type of middle to upper-middle income consumer that we target and our use of classical facades and attractive landscaping complements the quality and style of our merchandise. Interior details are also important for a pleasant and inviting shopping experience. We are very intentional in having open shopping spaces and our disciplined merchandise display ensures uniformity of presentations in-store, online and in our advertising.
Virtually all of our stores have undergone a major refresh or are newly opened. As part of the store improvements, selling space for clearance items was removed or reduced. A dedicated clearance store was opened late in December 2016 near our largest distribution center.
We currently have no plans to expand outside our distribution footprint and there are a limited number of markets that we do not currently serve that are expansion candidates. We are evaluating certain existing stores for relocation or closure. We expect a slight decrease of approximately 1.4% in our retail square footage in 2018.
Internet
We know that most consumers use the internet to pre-shop and we strive for havertys.com to be an extension of our stores and brand. Our website features a variety of helpful tools including a design center with 3D room planners, upholstery customization, and inspired accessories to create shareable "Idea Boards." We also provide information on which showroom has an item and delivery availability. A large number of product reviews written by our customers is also provided which some consumers find important in the decision-making process. Our site allows consumers to place orders online, and set delivery of their purchases. We limit online sales of our furniture to within our delivery network, and accessories to the continental United States. Sales placed through our website increased 10.0% in 2017 compared to 2016 and currently are approximately at the level of a mid-sized market.
Our sales associates also use havertys.com in the store as a tool to further engage the customer while she is in the store and extend her shopping experience when she returns home. We believe that a direct-to-customer business complements our retail store operations by building brand awareness.
3
Suppliers
We buy our merchandise from numerous foreign and domestic manufacturers and importers, the largest ten of which accounted for approximately 55% of our product purchases during 2017. Most of our wood products, or "case goods," are imported from Asia. Upholstered items are largely produced domestically, with the exception of our leather products which are primarily imported from Asia or Mexico.
We purchase our furniture merchandise produced in Asia through sourcing companies and also buy direct from manufacturers. We have developed a growing direct import program which works with industry designers and manufacturers in some of the best factories throughout Asia. We have dedicated quality control specialists on-site during production to ensure the items meet our specifications. Approximately 34% of our case goods sales in 2017 were generated by our direct imports.
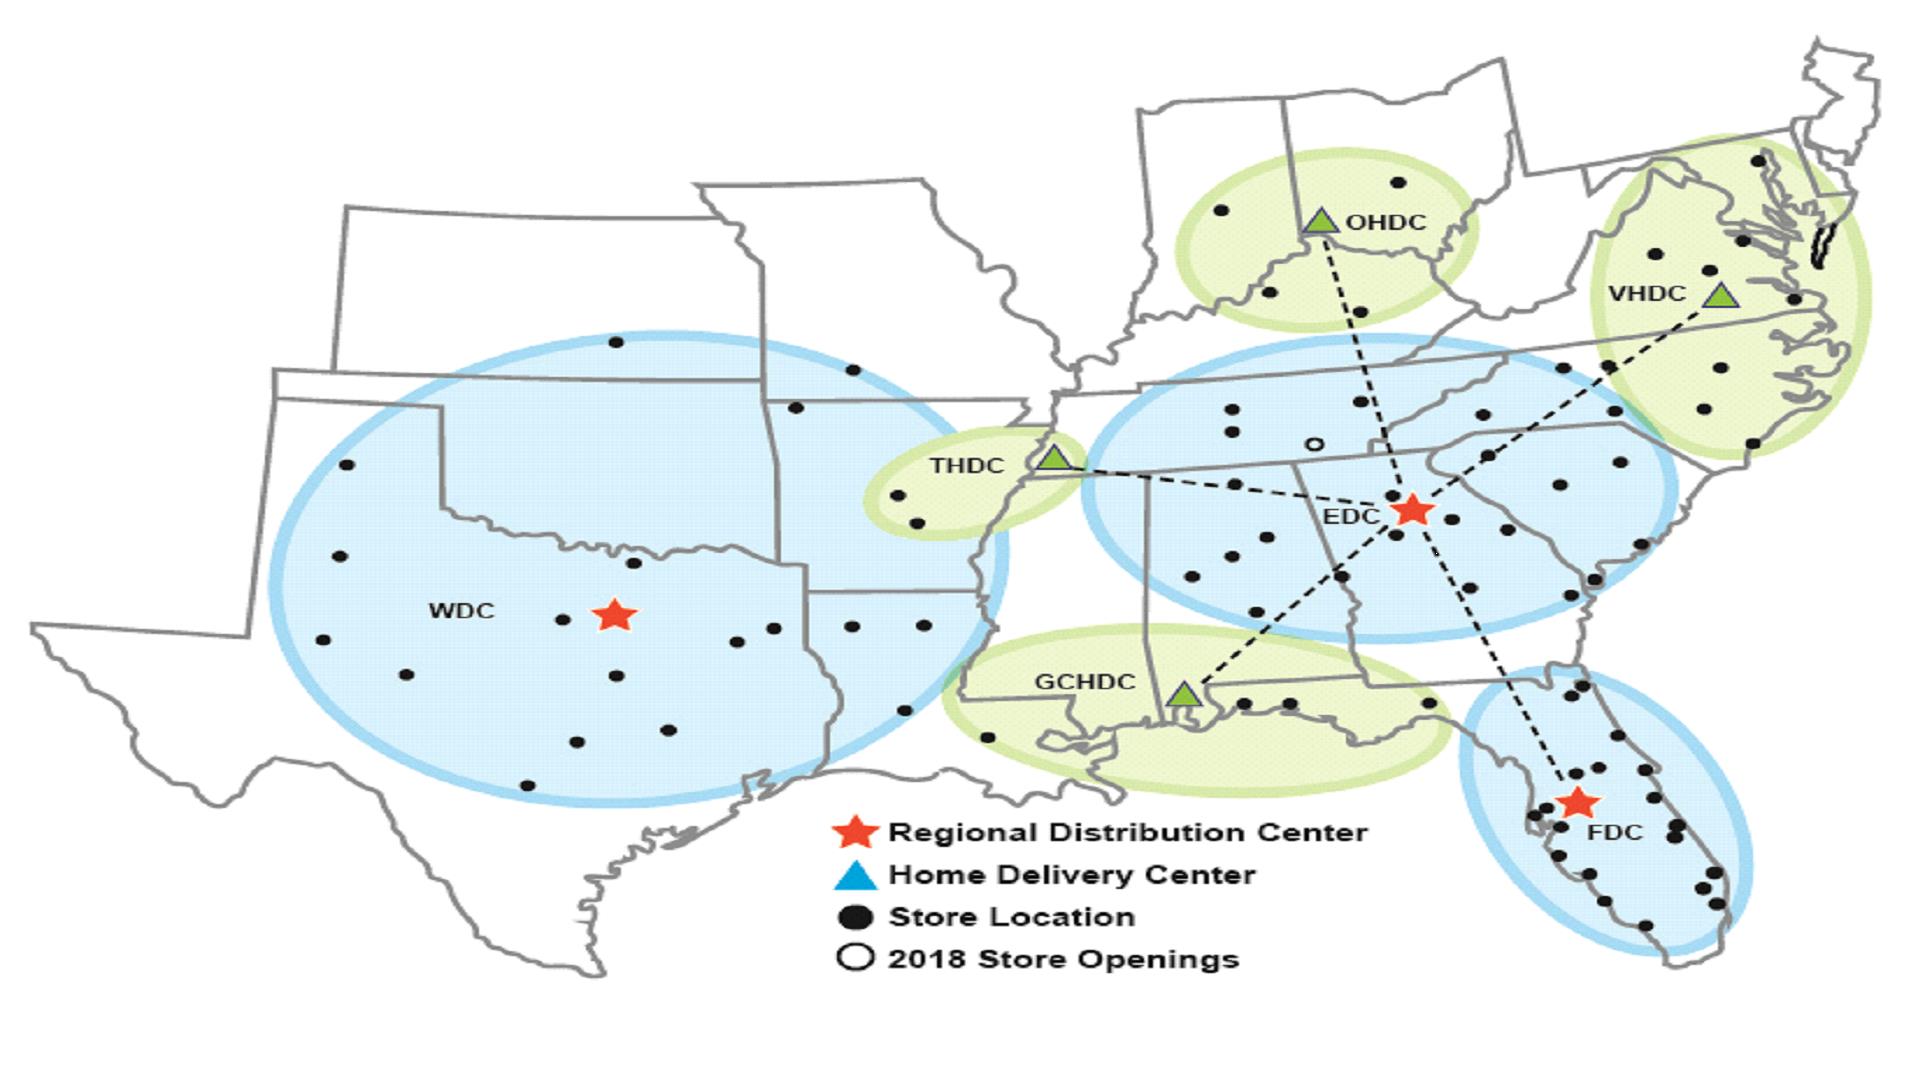
Supply Chain and Distribution
The longer lead times required for deliveries from overseas factories and the production of merchandise exclusively for Havertys makes it imperative for us to have both warehousing capabilities and end-to-end supply chain visibility. Our merchandising team provides input to the automated procurement process in an effort to maintain overall inventory levels within an appropriate range and reduce the amount of written sales awaiting product delivery. We use real-time information to closely follow our import orders from the manufacturing plant through each stage of transit and using this data can more accurately set customer delivery dates prior to receipt of product.
Our distribution system uses a combination of three distribution centers (DCs) and four home delivery centers (HDCs). The DCs receive both domestic product and containers of imported merchandise. A warehousing management system using radio frequency scanners tracks each piece of inventory in real time and allows for random storage in the warehouse and efficient scheduling and changing of the workflow. The DCs are also designed to shuttle prepped merchandise up to 250 miles for next day home deliveries and serve HDCs within a 500-mile radius. The HDCs provide service to markets within an additional 200 miles. We use a third-party to handle over-the-road delivery of product from the DCs to the HDCs and market areas. We use Havertys employees for executing home delivery, and branded this service "Top Drawer Delivery," an important function serving as the last contact with our customers in the purchase process. Operating standards in our warehouse and delivery functions provide measurements for determining staffing needs and increasing productivity. We believe that our distribution and delivery system is the best in the retail furniture industry and provides us with a significant competitive advantage.
4
Competition
The retail sale of home furnishings is a highly fragmented and competitive business. The degree and sources of competition vary by geographic area. We compete with numerous individual retail furniture stores as well as chains. Retail stores opened by furniture manufacturers in an effort to control and protect the distribution prospects of their branded merchandise compete with us in certain markets. Mass merchants, certain department stores, and some electronics and appliance retailers also have limited furniture product offerings. There has been growth in the e-commerce channel both from internet only retailers and those with a brick-and-mortar presence.
We believe Havertys is uniquely positioned in the marketplace, with a targeted mix of merchandise that appeals to customers who are somewhat more affluent than those of promotional price-oriented furniture stores. Our online presence provides most elements of a seamless omni-channel approach that many of our competitors do not have or cannot replicate. We consider the expansion of our custom order capabilities, free in-home design service, the tailoring of merchandise on a local market basis, and the ability to make prompt delivery of orders through maintenance of inventory, significant competitive advantages.
5
Employees
As of December 31, 2017, we had 3,551 employees: 2,193 in individual retail store operations, 194 in our corporate and credit operations, 67 in our customer-service call centers, and 1,097 in our warehouse and delivery points. None of our employees is a party to any union contract.
Trademarks and Domain Names
We have registered our various logos, trademarks and service marks. We believe that our trademark position is adequately protected in all markets in which we do business. In addition, we have registered and maintain numerous internet domain names including "havertys.com." Collectively, the trademarks, service marks and domain names that we hold are of material importance to us.
Available Information
Filings with the SEC
As a public company, we regularly file reports and proxy statements with the Securities and Exchange Commission. These reports are available on our website as soon as reasonably practicable after they are filed with, or furnished to, the SEC.
Our internet address is www.havertys.com and contains, among other things, our annual report on Form 10-K, proxy statement, quarterly reports on Form 10-Q and current reports on Form 8-K, which may be accessed free of charge. These reports are reached via the "Investors" tab on the home page and then "SEC filings."
The information on the website listed above is not and should not be considered part of this annual report on Form 10-K and is not incorporated by reference in this document.
The following discussion of risk factors contains forward-looking statements. These risk factors may be important to understanding any statement in this annual report on Form 10-K or elsewhere. The following information should be read in conjunction with Part II, Item 7. "Management's Discussion and Analysis of Financial Condition and Results of Operations" (MD&A), and the consolidated financial statements and related notes in Part II, Item 8. "Financial Statements and Supplementary Data" of this Form 10-K.
We routinely encounter and address risks, some of which may cause our future results to be different – sometimes materially different – than we presently anticipate. The following factors, as well as others described elsewhere in this report or in our other filings with the SEC, that could materially affect our business, financial condition or operating results should be carefully considered. Below, we describe certain important operational and strategic risks and uncertainties, but they are not the only risks we face. Our reactions to material future developments, as well as our competitors' reactions to those developments, may also impact our business operations or financial results. If any of the following risks actually occur, our business, financial condition or operating results may be adversely affected.
Changes in economic conditions could adversely affect demand for our products.
A large portion of our sales represent discretionary spending by our customers. Demand for our products is generally affected by a number of economic factors including, but not limited to: interest rates, housing starts, sales of new and existing homes, housing values, the level of mortgage refinancing, consumer confidence, debt levels and retail trends. Declining stock market values, rising food and energy costs, and higher personal taxes adversely affect demand. A decline in economic activity and conditions in the markets in which we operate would adversely affect our financial condition and results of operations.
6
We face significant competition from national, regional and local retailers of home furnishings.
The retail market for home furnishings is highly fragmented and intensely competitive. We currently compete against a diverse group of retailers, including regional or independent specialty stores, dedicated franchises of furniture manufacturers and national department stores. National mass merchants and electronics and appliance retailers also have limited product offerings. We also compete with retailers that market products through store catalogs and the internet. In addition, there are few barriers to entry into our current and contemplated markets, and new competitors may enter our current or future markets at any time. Our existing competitors or new entrants into our industry may use a number of different strategies to compete against us, including aggressive advertising, pricing and marketing, and extension of credit to customers on terms more favorable than we offer.
Competition from any of these sources could cause us to lose market share, revenues and customers, increase expenditures or reduce prices, any of which could have a material adverse effect on our results of operations.
If we fail to anticipate changes in consumer preferences, our sales may decline.
Our products must appeal to our target consumers whose preferences cannot be predicted with certainty and are subject to change. Our success depends upon our ability to anticipate and respond in a timely manner to fashion trends relating to home furnishings. If we fail to identify and respond to these changes, our sales of these products may decline.
We import a substantial portion of our merchandise from foreign sources. This exposes us to certain risks that include political and economic conditions. Recently, political discourse in the United States has increasingly focused on ways to discourage U.S. corporations from outsourcing manufacturing and production activities to foreign jurisdictions. Proposals to address this concern include the possibility of imposing tariffs or other penalties on goods manufactured outside the United States to attempt to discourage these practices. It has also been suggested that the United States may materially modify or withdraw from some of its existing trade agreements. Any of these actions, if ultimately enacted, could negatively impact our ability to source products from foreign jurisdictions and could adversely affect results of operations or profitability.
Based on product costs, approximately 66% of our total furniture purchases (which exclude mattresses) in 2017 were for goods not produced domestically. All our purchases are denominated in U.S. dollars. As exchange rates between the U.S. dollar and certain other currencies become unfavorable, the likelihood of price increases from our vendors increases. Some of the products we purchase are also subject to tariffs. If tariffs are imposed on additional products or the tariff rates are increased our vendors may increase their prices. Such changes, if they occur, could have one or more of the following impacts:
|
·
|
we could be forced to raise retail prices so high that we are unable to sell the products at current unit volumes;
|
|
·
|
if we are unable to raise retail prices commensurately with the cost increases, gross profit as recognized under our LIFO inventory accounting method could be negatively impacted; or
|
|
·
|
we may be forced to find alternative sources of comparable product, which may be more expensive than the current product, of lower quality, or the vendor may be unable to meet our requirements for quality, quantities, delivery schedules or other key terms.
|
7
Significant fluctuations and volatility in the cost of raw materials and components could adversely affect our profits
.
The primary materials our vendors use to produce and manufacture our products are various woods and wood products, resin, steel, leather, cotton, and certain oil based products. On a global and regional basis, the sources and prices of those materials and components are susceptible to significant price fluctuations due to supply/demand trends, transportation costs, government regulations and tariffs, changes in currency exchange rates, price controls, the economic and political climate, and other unforeseen circumstances. Significant increases in these and other costs in the future could materially affect our vendors' costs and our profits as discussed above.
We are dependent upon the ability of our third-party producers, many of whom are located in foreign countries, to meet our requirements; any failures by these producers to meet our requirements, or the unavailability of suitable producers at reasonable prices or limitations on our ability to source from certain third-party producers may negatively impact our ability to deliver quality products to our customers on a timely basis or result in higher costs or reduced net sales.
We source substantially all of our products from non-exclusive, third-party producers, many of which are located in foreign countries. Although we have long-term relationships with many of our suppliers, we must compete with other companies for the production capacity of these independent manufacturers. We regularly depend upon the ability of third-party producers to secure a sufficient supply of raw materials, a skilled workforce, adequately finance the production of goods ordered and maintain sufficient manufacturing and shipping capacity. Although we monitor production and quality in many third party manufacturing locations, we cannot be certain that we will not experience operational difficulties with our manufacturers, such as the reduction of availability of production capacity, errors in complying with product specifications, insufficient quality control, failures to meet production deadlines or increases in manufacturing costs. Such difficulties may negatively impact our ability to deliver quality products to our customers on a timely basis, which may, in turn, have a negative impact on our customer relationships and result in lower net sales.
We also require third-party producers to meet certain standards in terms of working conditions, environmental protection and other matters before placing business with them. As a result of costs relating to compliance with these standards, we may pay higher prices than some of our competitors for products. In addition, failure by our independent manufacturers to adhere to labor or other laws or business practices accepted as ethical, and the potential litigation, negative publicity and political pressure relating to any of these events, could disrupt our operations or harm our reputation.
Our vendors might fail in meeting our quality control standards or reacting to changes to the legislative or regulatory framework regarding product safety.
All of our vendors must comply with applicable product safety laws and regulations, and we are dependent on them to ensure that the products we buy comply with all safety standards. Any actual, potential or perceived product safety concerns could expose us to government enforcement action or private litigation and result in recalls and other liabilities. These could harm our brand's image and negatively affect our business and operating results.
Our revenue could be adversely affected by risks in our supply chain.
Optimal product flow is dependent on demand planning and forecasting, production to plan by suppliers, and timely transportation. We often make commitments to purchase products from our vendors in advance of proposed production dates. Significant deviation from the projected demand for products that we sell may have an adverse effect on our results of operations and financial condition, either from lost sales or lower margins due to the need to reduce prices to dispose of excess inventory.
Disruptions to our supply chain could result in late arrivals of product. This could negatively affect sales due to increased levels of out-of-stock merchandise and loss of confidence by customers in our ability to deliver goods as promised.
8
The rise of oil and gasoline prices could affect our profitability.
A significant increase in oil and gasoline prices could adversely affect our profitability. We deliver substantially all of our customers' purchases to their homes. Our distribution system, which utilizes three DCs and multiple home delivery centers is very transportation dependent to reach the 21 states we deliver to from our stores across 16 Southern and Midwestern states.
If transportation costs exceed amounts we are able to effectively pass on to the consumer, either by higher prices and/or higher delivery charges, then our profitability will suffer.
Because of our limited number of distribution centers, should one become damaged, our operating results could suffer.
We utilize three large distribution centers to flow our merchandise from the vendor to the consumer. This system is very efficient for reducing inventory requirements, but makes us operationally vulnerable should one of these facilities become damaged.
Our information technology infrastructure is vulnerable to damage that could harm our business.
Our ability to operate our business from day to day, in particular our ability to manage our point-of-sale, distribution system and credit operations, largely depends on the efficient operation of our computer hardware and software systems. We use management information systems to communicate customer information, provide real-time inventory information, manage our credit portfolio and to handle all facets of our distribution system from receipt of goods in the DCs to delivery to our customers' homes.
The failure of these systems to operate effectively, problems with integrating various data sources, challenges in transitioning to upgraded or replacement systems, difficulty in integrating new systems, or a breach in security of these systems could adversely impact the operations of our business.
Cyber threats are rapidly evolving and those threats and the means for obtaining access to information in digital and other storage media are becoming increasingly sophisticated. Cyber threats and cyber-attackers can be sponsored by countries or sophisticated criminal organizations or be the work of single "hackers" or small groups of "hackers."
We invest in industry standard security technology to protect the Company's data and business processes against risk of data security breach and cyber attack. Our data security management program includes identity, trust, vulnerability and threat management business processes as well as adoption of standard data protection policies. We measure our data security effectiveness through industry accepted methods. We are continuously installing new and upgrading existing information technology systems. We use employee awareness training around phishing, malware, and other cyber risks to ensure that the Company is protected, to the greatest extent possible, against cyber risks and security breaches. We are regularly the target of attempted cyber and other security threats and must continuously monitor and develop our information technology networks and infrastructure to prevent, detect, address and mitigate the risk of unauthorized access, misuse, computer viruses and other events that could have a security impact. Insider or employee cyber and security threats are increasingly a concern for all companies, including ours. Additionally, we certify our major technology suppliers and any outsourced services through accepted security certification standards.
9
Nevertheless, as cyber threats evolve, change and become more difficult to detect and successfully defend against, one or more cyber-attacks might defeat our or a third-party service provider's security measures in the future and obtain the personal information of customers or employees. Employee error or other irregularities may also result in a defeat of security measures and a breach of information systems. Moreover, hardware, software or applications we use may have inherent defects of design, manufacture or operations or could be inadvertently or intentionally implemented or used in a manner that could compromise information security. A security breach and loss of information may not be discovered for a significant period of time after it occurs. While we have no knowledge of a material security breach to date, any compromise of data security could result in a violation of applicable privacy and other laws or standards, the loss of valuable business data, or a disruption of our business. A security breach involving the misappropriation, loss or other unauthorized disclosure of sensitive or confidential information could give rise to unwanted media attention, materially damage to our customer relationships and reputation, and result in fines, fees, or liabilities, which may not be covered by our insurance policies.
Not applicable.
Stores
Our retail store space at December 31, 2017 totaled approximately 4.5 million square feet for 124 stores. The following table sets forth the number of stores we operated at December 31, 2017 by state:
|
State
|
Number of Stores
|
State
|
Number of Stores
|
|
|
Florida
|
29
|
Louisiana
|
4
|
|
|
Texas
|
24
|
Maryland
|
4
|
|
|
Georgia
|
18
|
Arkansas
|
3
|
|
|
North Carolina
|
9
|
Kentucky
|
2
|
|
|
Virginia
|
8
|
Ohio
|
2
|
|
|
South Carolina
|
7
|
Indiana
|
1
|
|
|
Alabama
|
6
|
Kansas
|
1
|
|
|
Tennessee
|
5
|
Missouri
|
1
|
The 43 retail locations which we owned at December 31, 2017 had a net book value for land and buildings of $85.5 million. Additionally, we had 19 leased locations open whose properties have a net book value of $57.7 million which, due to financial accounting rules, are included on our balance sheets. The remaining 62 locations are leased by us with various termination dates through 2032 plus renewal options.
Distribution Facilities
We lease or own regional distribution facilities in the following locations:
|
Location
|
Owned or Leased
|
Approximate Square Footage
|
|
Braselton, Georgia
|
Leased
|
808,000
|
|
Coppell, Texas
|
Owned
|
238,000
|
|
Lakeland, Florida
|
Owned
|
335,000
|
|
Colonial Heights, Virginia
|
Owned
|
129,000
|
|
Fairfield, Ohio
|
Leased
|
50,000
|
|
Theodore, Alabama
|
Leased
|
42,000
|
|
Memphis, Tennessee
|
Leased
|
30,000
|
10
Corporate Facilities
Our executive and administrative offices are located at 780 Johnson Ferry Road, Suite 800, Atlanta, Georgia. We lease approximately 48,000 square feet of office space on two floors of a suburban mid-rise office building. We also lease 3,100 square feet of office space in Chattanooga, Tennessee for our credit operations.
For additional information, see "Management's Discussion and Analysis of Financial Condition and Results of Operations" included in this report under Item 7 of Part II.
There are no material pending legal proceedings to which we are a party or of which any of our properties is the subject.
Not applicable.
11
EXECUTIVE OFFICERS OF THE REGISTRANT
The following are the names, ages and current positions of our executive officers and, if they have not held those positions for the past five years, their former positions during that period with Havertys or other companies.
|
Name, age and office (at December 31, 2017) and year elected to office
|
Principal occupation during last five years other than office of the Company currently held
|
||||
|
Clarence H. Smith
|
67
|
Chairman of the Board
President and Chief Executive
Officer
Director
|
2012
2002
1989
|
President and Chief Executive Officer
|
|
|
Steven G. Burdette
|
56
|
Executive Vice President,
Operations
|
2017
|
Executive Vice President, Stores, 2008-2017
|
|
|
J. Edward Clary
|
57
|
Executive Vice President,
and Chief Information Officer
|
2015
|
Senior Vice President, Distribution and Chief Information Officer
2008-2015
|
|
|
Allan J. DeNiro
|
64
|
Senior Vice President, Chief
People Officer
|
2010
|
Has held this position for the last five years
|
|
|
Richard D. Gallagher
|
56
|
Executive Vice President,
Merchandising
|
2014
|
Senior Vice President, Merchandising, 2009-2014
|
|
|
Richard B. Hare
|
51
|
Executive Vice President and Chief Financial Officer
|
2017
|
Senior Vice President,
Finance, Treasurer and Chief Financial Officer of Carmike Cinemas, Inc., 2006-2016
|
|
|
Rawson Haverty, Jr.
|
61
|
Senior Vice President, Real
Estate and Development
Director
|
1988
1992
|
Has held this position for the last five years
|
|
|
Jenny Hill Parker
|
59
|
Senior Vice President, Finance,
Secretary and Treasurer
|
2010
|
Has held this position for the last five years
|
|
|
Janet E. Taylor
|
56
|
Senior Vice President,
General Counsel
|
2010
|
Has held this position for the last five years
|
|
Rawson Haverty, Jr. and Clarence H. Smith are first cousins.
Our executive officers are elected or appointed annually by the Board of Directors for terms of one year or until their successors are elected and qualified, subject to removal by the Board at any time.
12
PART II
| ITEM 5. |
MARKET FOR THE REGISTRANT'S COMMON EQUITY, RELATED STOCKHOLDER MATTERS AND ISSUER PURCHASES OF EQUITY SECURITIES
|
Our two classes of common stock trade on The New York Stock Exchange ("NYSE"). The trading symbol for the common stock is HVT and for Class A common stock is HVT.A. The table below sets forth the high and low sales prices per share as reported on the NYSE and the dividends declared for the last two years:
|
2017
|
||||||||||||||||||||||||
|
Common Stock
|
Class A Common Stock
|
|||||||||||||||||||||||
|
Quarter Ended |
High |
Low |
Dividend
Declared |
High |
Low |
Dividend
Declared |
||||||||||||||||||
|
March 31
|
$
|
25.50
|
$
|
21.05
|
$
|
0.1200
|
$
|
25.40
|
$
|
21.45
|
$
|
0.1125
|
||||||||||||
|
June 30
|
26.30
|
22.90
|
0.1200
|
26.05
|
22.70
|
0.1125
|
||||||||||||||||||
|
September 30
|
26.60
|
21.05
|
0.1500
|
26.40
|
21.20
|
0.1425
|
||||||||||||||||||
|
December 31
|
27.23
|
22.60
|
0.1500
|
27.10
|
23.00
|
0.1425
|
||||||||||||||||||
|
2016
|
||||||||||||||||||||||||
|
Common Stock
|
Class A Common Stock
|
|||||||||||||||||||||||
|
Quarter Ended |
High |
Low |
Dividend
Declared |
High |
Low |
Dividend
Declared |
||||||||||||||||||
|
March 31
|
$
|
21.76
|
$
|
17.42
|
$
|
0.10
|
$
|
21.73
|
$
|
17.52
|
$
|
0.0950
|
||||||||||||
|
June 30
|
21.48
|
16.65
|
0.10
|
20.92
|
16.90
|
0.0950
|
||||||||||||||||||
|
September 30
|
22.33
|
17.61
|
0.12
|
21.72
|
18.33
|
0.1125
|
||||||||||||||||||
|
December 31
|
24.50
|
16.58
|
1.12
|
24.40
|
17.04
|
1.0625
|
||||||||||||||||||
Stockholders
Based on the number of individual participants represented by security position listings, there are approximately 3,564 holders of our common stock and 163 holders of our Class A common stock as of February 28, 2018.
Dividends
The payment of dividends and the amount are determined by the Board of Directors and depend upon, among other factors, our earnings, operations, financial condition, capital requirements and general business outlook at the time such dividend is considered. We have paid a cash dividend in each year since 1935. A special dividend of $1.00 for common stock and $0.95 for Class A common stock was paid in the fourth quarter of 2016.
Equity Compensation Plans
Information concerning the Company's equity compensation plans is set forth under the Company's definitive Proxy Statement for the Annual Meeting of Stockholders to be held on May 7, 2018, to be filed with the Securities and Exchange Commission (the "Company's 2018 Proxy Statement) and is incorporated herein by reference.
13
Stock Repurchase Program
The board of directors has authorized management, at its discretion, to purchase and retire limited amounts of our common stock and Class A common stock. On August 9, 2016, the board authorized the Company to purchase up to $10.0 million of its common and Class A common stock after the balance of an immaterial amount from a previous authorization is utilized. In addition to utilizing cash flow for profitable growth and the payment of dividends, opportunistic repurchases during periods of favorable market conditions is another way to enhance stockholder value.
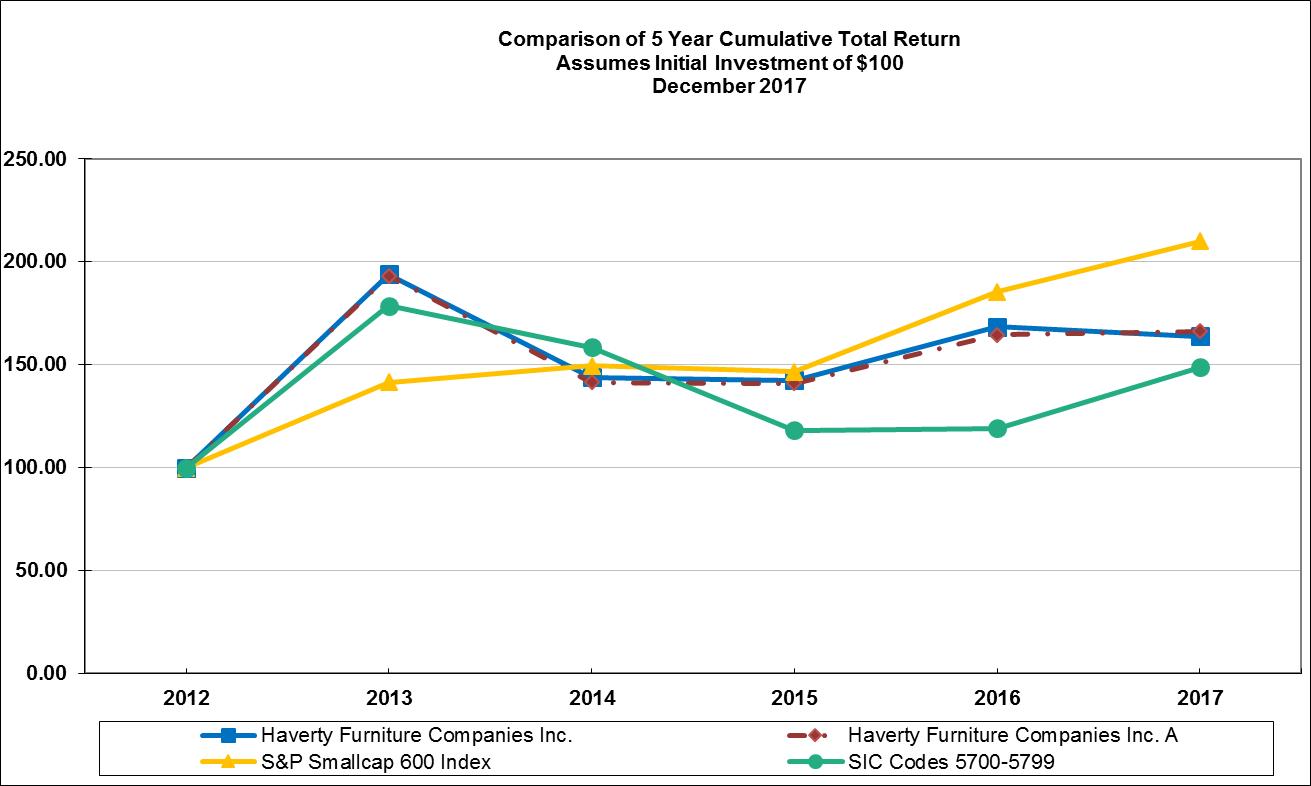
Stock Performance Graph
The following graph compares the performance of Havertys' common stock and Class A common stock against the cumulative return of the NYSE/AMEX/Nasdaq Home Furnishings & Equipment Stores Index (SIC Codes 5700 – 5799) and the S&P Smallcap 600 Index for the period of five years commencing December 31, 2012 and ended December 31, 2017. The graph assumes an initial investment of $100 on January 1, 2012 and reinvestment of dividends.
|
2012
|
2013
|
2014
|
2015
|
2016
|
2017
|
|||||||||||||||||||
|
HVT
|
$
|
100.00
|
$
|
193.79
|
$
|
143.97
|
$
|
142.48
|
$
|
168.48
|
$
|
163.73
|
||||||||||||
|
HVT-A
|
$
|
100.00
|
$
|
193.25
|
$
|
141.48
|
$
|
140.86
|
$
|
164.39
|
$
|
166.22
|
||||||||||||
|
S&P Smallcap 600 Index
|
$
|
100.00
|
$
|
141.31
|
$
|
149.45
|
$
|
146.50
|
$
|
185.40
|
$
|
209.94
|
||||||||||||
|
SIC Codes 5700-5799
|
$
|
100.00
|
$
|
178.54
|
$
|
158.54
|
$
|
118.16
|
$
|
119.04
|
$
|
148.65
|
||||||||||||
14
The following selected financial data and non-GAAP financial measures should be read in conjunction with "Management's Discussion and Analysis of Financial Condition and Results of Operations" included in Item 7 below and the "Consolidated Financial Statements and Notes thereto" included in Item 8 below.
|
Year ended December 31,
|
||||||||||||||||||||
|
(Dollars in thousands, except per share data)
|
2017
|
2016
|
2015
|
2014
|
2013
|
|||||||||||||||
|
Results of Operations
|
||||||||||||||||||||
|
Net sales
|
$
|
819,866
|
$
|
821,571
|
$
|
804,870
|
$
|
768,409
|
$
|
746,090
|
||||||||||
|
Net sales change over prior year
|
(0.2
|
)%
|
2.1
|
%
|
4.7
|
%
|
3.0
|
%
|
11.3
|
%
|
||||||||||
|
Comp-store sales change over prior year
|
(1.3
|
)%
|
2.1
|
%
|
2.5
|
%
|
3.6
|
%
|
11.0
|
%
|
||||||||||
|
Gross profit
|
444,923
|
443,337
|
430,776
|
412,366
|
401,496
|
|||||||||||||||
|
Percent of net sales
|
54.3
|
%
|
54.0
|
%
|
53.5
|
%
|
53.7
|
%
|
53.8
|
%
|
||||||||||
|
Selling, general and administrative expenses
|
402,884
|
399,236
|
384,801
|
364,654
|
348,599
|
|||||||||||||||
|
Percent of net sales
|
49.1
|
%
|
48.6
|
%
|
47.8
|
%
|
47.5
|
%
|
46.7
|
%
|
||||||||||
|
Income before income taxes
(1)
|
43,223
|
45,821
|
45,275
|
25,257
|
52,487
|
|||||||||||||||
|
Net income
(1)(2)
|
21,075
|
28,356
|
27,789
|
8,589
|
32,265
|
|||||||||||||||
|
Share Data
|
||||||||||||||||||||
|
Diluted earnings per share
|
||||||||||||||||||||
|
Common Stock
|
$
|
0.98
|
$
|
1.30
|
$
|
1.22
|
$
|
0.37
|
$
|
1.41
|
||||||||||
|
Class A Common Stock
|
0.94
|
1.27
|
1.17
|
0.33
|
1.35
|
|||||||||||||||
|
Adjusted diluted earnings per share:
(3)
|
||||||||||||||||||||
|
Common Stock
|
$
|
0.98
|
$
|
1.30
|
$
|
1.22
|
$
|
0.37
|
$
|
1.41
|
||||||||||
|
Impact of Tax Act in December 2017
|
0.27
|
—
|
—
|
—
|
—
|
|||||||||||||||
|
Pension settlement expense
(1)
|
—
|
—
|
—
|
0.90
|
—
|
|||||||||||||||
|
Out-of-period adjustment
(4)
|
—
|
—
|
—
|
—
|
(0.02
|
)
|
||||||||||||||
|
Adjusted diluted earnings per common share
(3)
|
$
|
1.25
|
$
|
1.30
|
$
|
1.22
|
$
|
1.28
|
$
|
1.39
|
||||||||||
|
Cash dividends – amount per share:
|
||||||||||||||||||||
|
Common Stock
(5)
|
$
|
0.540
|
$
|
1.440
|
$
|
0.360
|
$
|
1.320
|
$
|
0.240
|
||||||||||
|
Class A Common Stock
(5)
|
$
|
0.510
|
$
|
1.365
|
$
|
0.340
|
$
|
1.250
|
$
|
0.225
|
||||||||||
|
Shares outstanding (in thousands):
|
||||||||||||||||||||
|
Common Stock
|
19,452
|
19,287
|
20,124
|
20,568
|
20,122
|
|||||||||||||||
|
Class A Common Stock
|
1,767
|
1,818
|
2,032
|
2,081
|
2,393
|
|||||||||||||||
|
Total shares
|
21,219
|
21,104
|
22,156
|
22,649
|
22,515
|
|||||||||||||||
|
Financial Position
|
||||||||||||||||||||
|
Inventories
|
$
|
103,437
|
$
|
102,020
|
$
|
108,896
|
$
|
107,139
|
$
|
91,483
|
||||||||||
|
Capital expenditures
|
$
|
24,465
|
$
|
29,838
|
$
|
27,143
|
$
|
30,882
|
$
|
20,202
|
||||||||||
|
Depreciation/amortization expense
|
30,516
|
29,045
|
25,756
|
22,613
|
21,450
|
|||||||||||||||
|
Total assets
|
$
|
461,329
|
$
|
454,505
|
$
|
471,251
|
$
|
460,987
|
$
|
417,855
|
||||||||||
|
Total debt
(6)
|
54,591
|
55,474
|
53,125
|
49,065
|
17,155
|
|||||||||||||||
|
Stockholders' equity
|
294,142
|
281,871
|
301,739
|
292,083
|
298,264
|
|||||||||||||||
|
Debt to total capital
|
15.7
|
%
|
16.4
|
%
|
15.0
|
%
|
14.4
|
%
|
5.4
|
%
|
||||||||||
|
Net cash provided by operating activities
|
52,457
|
60,054
|
52,232
|
55,454
|
55,889
|
|||||||||||||||
|
Other Supplemental Data:
|
||||||||||||||||||||
|
Employees
|
3,551
|
3,656
|
3,596
|
3,388
|
3,266
|
|||||||||||||||
|
Retail sq. ft. (in thousands) at year end
|
4,517
|
4,494
|
4,380
|
4,283
|
4,259
|
|||||||||||||||
|
Annual retail net sales per weighted average sq. ft.
|
$
|
185
|
$
|
188
|
$
|
185
|
$
|
183
|
$
|
176
|
||||||||||
|
Average sale per written ticket
|
$
|
2,091
|
$
|
2,048
|
$
|
2,002
|
$
|
1,912
|
$
|
1,860
|
||||||||||
Due to rounding amounts may not add to totals.
|
(1)
|
Includes for 2014 the impact of the settlement of the pension plan of a $21.6 million increase in expense and a tax benefit of $0.9 million, for a total impact of $20.7 million after tax or $0.90 per share.
|
|
(2)
|
We reduced the valuation allowance and recorded a benefit to income taxes of $1.2 million in 2012 and $1.4 million in 2013.
|
|
(3)
|
Adjusted diluted earnings per share is a non-GAAP financial measure.
|
|
(4)
|
We recorded an out-of-period adjustment in 2013 related to certain vendors' pricing allowances. The non-cash adjustment increased gross profit by $0.8 million or $0.02 per diluted share.
|
|
(5)
|
Includes special dividends of $1.00 for Common Stock and $0.95 for Class A Common Stock paid in the third quarter of 2014 and in the fourth quarter of 2016.
|
|
(6)
|
Debt is comprised completely of lease obligations.
|
15
Overview
Industry
The retail residential furniture industry's results are influenced by the overall strength of the economy, new and existing housing sales, consumer confidence, spending on large ticket items, interest rates, and availability of credit. These factors remain tempered by rising consumer debt, home inventory constraints, and tight access to home mortgage credit, all of which provide impediments to industry growth.
Our Business
We sell home furnishings in our retail stores and via our website and record revenue when the products are delivered to our customer. Our products are selected to appeal to a middle to upper-middle income consumer across a variety of styles. Our commissioned sales associates receive a high level of product training and are provided a number of tools with which to serve our customers. We also have over 100 in-home designers serving most of our stores. These individuals work with our sales associates to provide customers additional confidence and inspiration in their furniture purchase journey. We do not outsource the delivery function, something common in the industry, but instead ensure that the "last contact" is handled by a customer-oriented Havertys delivery team. We are recognized as a provider of high quality fashionable products and exceptional service in the markets we serve.
2017 Highlights
Sales were slightly lower in 2017 than in 2016, falling 0.2% or $1.7 million. Our average ticket increased 2% but store traffic was down mid-single digits. Gross profit as a percent of net sales increased 30 basis points in spite of a negative 33 basis points impact from LIFO. SG&A costs increased less than 1% but with less leverage increased 50 basis points as a percent of sales. Our pre-tax income was $43.2 million, a decrease of 5.7% or $2.6 million. Our fourth quarter results were pre-tax income of $14.1 million down from $17.3 million in the prior year period. We made $24.5 million in important capital expenditure investments in our business and paid $11.4 million in dividends in 2017.
Management Objectives
Management is focused on capturing more market share and increasing sales per square foot of showroom space. This organic growth will be driven by concentrating our efforts on our customers with improved interactions highlighted by new products, services, enhanced stores and better technology. The Company's strategies for profitability include targeted marketing initiatives, productivity and process improvements, and efficiency and cost-saving measures. Our focus is to serve our customers better and distinguish ourselves in the marketplace.
Key Performance Indicators
We evaluate our performance based on several key metrics which include net sales, comparable store sales, sales per square foot, gross profit, operating costs as a percentage of sales, EBITDA, cash flow, total debt to total capital, and earnings per share. The goal of utilizing these measurements is to provide tools in economic decision-making such as store growth, capital allocation and product pricing. We also employ metrics that are customer focused (customer satisfaction score, on-time-delivery and quality), and internal effectiveness and efficiency metrics (sales per employee, average sale per ticket, closing ratios per customer store visit, inventory out-of-stock, exceptions per deliveries, and lost time incident rate). These measurements aid us in determining areas of our operations that are in need of additional attention but are not evaluated in isolation from others, so as not to conflict with our company goals.
16
Net Sales
Comparable-store or "comp-store" sales is a measure which indicates the performance of our existing stores by comparing the growth in sales for these stores for a particular period over the corresponding period in the prior year. Stores are considered non-comparable if open for less than 12 full calendar months or if the selling square footage has been changed significantly during the past 12 full calendar months. Large clearance sales events from warehouses or temporary locations are also excluded from comparable store sales, as are periods when stores are closed or being remodeled. As a retailer, comp‑store sales is an indicator of relative customer spending and store performance.
Total sales decreased $1.7 million or 0.2% in 2017 and increased $16.7 million or 2.1% in 2016. Comparable store sales decreased 1.3% or $10.9 million in 2017 and increased 2.1% or $16.2 million in 2016. The remaining $9.2 million in 2017 and $0.5 million in 2016 of the changes were from closed, new and otherwise non-comparable stores.
The following outlines our sales and comp-store sales increases and decreases for the periods indicated. (Amounts and percentages may not always add to totals due to rounding.)
|
December 31,
|
|||||||||||||||||||||||||||||||||||||
|
2017
|
2016
|
2015
|
|||||||||||||||||||||||||||||||||||
|
Net Sales
|
Comp-Store Sales
|
Net Sales
|
Comp-Store Sales
|
Net Sales
|
Comp-Store Sales
|
||||||||||||||||||||||||||||||||
|
Period
Ended |
Dollars
in millions |
%
Increase
(decrease) over prior period |
% Increase
(decrease) over prior period |
Dollars
in millions |
% Increase
(decrease) over prior period |
% Increase
(decrease) over prior period |
Dollars
in millions |
% Increase
(decrease) over prior period |
%
Increase
(decrease) over prior period |
||||||||||||||||||||||||||||
|
Q1
|
$
|
200.4
|
3.0
|
%
|
1.6
|
%
|
$
|
194.5
|
1.7
|
%
|
0.9
|
%
|
$
|
191.3
|
5.3
|
%
|
3.8
|
%
|
|||||||||||||||||||
|
Q2
|
196.8
|
1.1
|
(0.2
|
)
|
194.8
|
3.8
|
3.8
|
187.7
|
7.2
|
4.8
|
|||||||||||||||||||||||||||
|
Q3
|
207.6
|
(1.9
|
)
|
(2.9
|
)
|
211.7
|
0.8
|
1.2
|
209.9
|
5.7
|
3.0
|
||||||||||||||||||||||||||
|
Q4
|
215.0
|
(2.6
|
)
|
(3.5
|
)
|
220.6
|
2.2
|
2.5
|
215.9
|
1.4
|
(0.9
|
)
|
|||||||||||||||||||||||||
|
Year
|
$
|
819.9
|
(0.2
|
)%
|
(1.3
|
)%
|
$
|
821.6
|
2.1
|
%
|
2.1
|
%
|
$
|
804.9
|
4.7
|
%
|
2.5
|
%
|
|||||||||||||||||||
Sales in 2017 declined slightly as the level of our store traffic weakened throughout the year. Our average ticket increased 2.1% allowing our sales results to not moderate at the same pace as traffic. Our in-home designers were part of 20.6% of our sales, with their average ticket twice the overall average.
Sales in 2016 began slowly as first quarter consumer spending remained at its sluggish end of 2015 pace. Throughout 2016 our business became more concentrated around holidays and we adjusted our advertising cadence accordingly. Our average ticket increased 2.3% and our in-home designers were part of 19.7% of our sales.
Sales in 2015 increased at a modest pace during the first nine months of the year. We did have some product availability issues during the first quarter resulting from the impact of the West Coast port slowdown. We experienced a softening in our business in the fourth quarter, more prevalent in Texas but also across many of our markets. Our average ticket increased 4.7% as our custom upholstery sales increased 11.8% over 2014 as more business involved a member of our in-home design team.
2018 Outlook
We believe as the general economy improves and consumer spending and the housing market strengthens, our business will benefit. We have upgraded stores, offer appealing merchandise and expanded special order and service offerings which will be important drivers for our 2018 sales results. We expect our retail square footage will remain relatively flat in 2018.
17
Gross Profit
Our cost of goods sold consists primarily of the purchase price of the merchandise together with inbound freight, handling within our distribution centers and transportation costs to the local markets we serve. Our gross profit is primarily dependent upon vendor pricing, the mix of products sold and promotional pricing activity. Substantially all of our occupancy and home delivery costs are included in selling, general and administrative expenses as is a portion of our warehousing expenses. Accordingly, our gross profit may not be comparable to those entities that include some of these expenses in cost of goods sold.
Year-to-Year Comparisons
Gross profit as a percentage of net sales was 54.3% in 2017 compared to 54.0% in 2016. We use the LIFO inventory valuation method and the impact of changes in the LIFO reserve generated a $2.7 million or 33 basis points negative impact in 2017 over 2016. Our execution on product mix and pricing was able to offset this impact and deliver an overall improvement of 63 basis points. Our Havertys branded merchandise provides a strong value and fashion statement to consumers. The increasing sales generated by our in‑home designers have boosted higher margin mix opportunities through custom upholstery and accessories sales.
Gross profit as a percentage of net sales was 54.0% in 2016 compared to 53.5% in 2015. The use of the LIFO method generated a $1.9 million or 23 basis points positive impact in 2016 over 2015.
2018 Outlook
Our expectations for 2018 are for annual gross profit margins of approximately 54.7%. This increase is based on anticipated changes to our product mix and lower markdowns. We do not plan to increase the level of our promotional pricing.
Selling, General and Administrative Expenses
SG&A expenses are comprised of five categories: selling, occupancy, delivery and certain warehousing costs, advertising, and administrative. Selling expenses primarily are comprised of compensation of sales associates and sales support staff, and fees paid to credit card and third-party finance companies. Occupancy costs include rents, depreciation charges, insurance and property taxes, repairs and maintenance expense and utility costs. Delivery costs include personnel, fuel costs, and depreciation and rental charges for rolling stock. Warehouse costs include supplies, depreciation, and rental charges for equipment. Advertising expenses are primarily media production and space, direct mail costs, market research expenses and agency fees. Administrative expenses are comprised of compensation costs for store personnel exclusive of sales associates, information systems, executive, accounting, merchandising, advertising, supply chain, real estate and human resource departments.
We classify our SG&A expenses as either variable or fixed and discretionary. Our variable expenses include the costs in the selling and delivery categories and certain warehouse expenses as these amounts will generally move in tandem with our level of sales. The remaining categories and expenses are classified as fixed and discretionary because these costs do not fluctuate with sales. The following table outlines our SG&A expenses by classification:
|
2017
|
2016
|
2015
|
||||||||||||||||||||||
|
(In thousands)
|
% of
Net Sales
|
% of
Net Sales
|
% of
Net Sales
|
|||||||||||||||||||||
|
Variable
|
$
|
149,694
|
18.2
|
%
|
$
|
149,299
|
18.2
|
%
|
$
|
143,861
|
17.9
|
%
|
||||||||||||
|
Fixed and discretionary
|
253,190
|
30.9
|
249,937
|
30.4
|
240,940
|
29.9
|
||||||||||||||||||
|
$
|
402,884
|
49.1
|
%
|
$
|
399,236
|
48.6
|
%
|
$
|
384,801
|
47.8
|
%
|
|||||||||||||
18
Year-to-Year Comparisons
Our SG&A as a percent of sales increased 50 basis points to 49.1% from 48.6% in 2016. The fixed and discretionary expenses increased $3.3 million or 1.3% in 2017 over 2016. This change was primarily due to increases in advertising and marketing expenses of $2.9 million and higher depreciation, rent, and other occupancy costs totaling $3.7 million. These increases were partly offset by $3.0 million in lower administrative costs driven by lower medical costs. Our variable expenses increased slightly due to continued growth generated by our in-home designers and increases in delivery costs.
Our SG&A costs as a percent of sales increased 80 basis points to 48.6% from 47.8% in 2015. The fixed and discretionary expenses increased $9.0 million or 3.7% in 2016 over 2015. This change was primarily due to a $6.5 million rise in administrative costs driven by increases in medical insurance and compensation expense. Our depreciation expense increased $3.3 million offset partly by a reduction of $1.3 million in all other occupancy costs. Our variable expenses increased 30 basis points as our in-home design business grew and due to slightly higher delivery costs.
2018 Outlook
Fixed and discretionary type expenses within SG&A are expected to be in the $258 to $260 million range for 2018, up approximately 2.3% over those same costs in 2017. The increase is largely due to increased marketing expenses, higher occupancy costs from new and relocated stores, increases in employee group medical costs, higher employee compensation and benefits expense, and inflation. Fixed and discretionary type expenses in total should average approximately $65.3 million per quarter excluding the second quarter which is expected to be $2.0 million lower. For 2017 these expenses averaged $64.0 million per quarter in all but the second quarter which was $60.9 million.
Variable costs within SG&A for 2018 are expected to be 18.5% as a percent of sales, somewhat higher than in 2017 due to increases in personnel costs.
Interest Expense
Our interest expense for the years 2015 to 2017 is primarily driven by amounts related to our lease obligations. For leases accounted for as capital and financing lease obligations, we record straight-line rent expense for the land portion in occupancy costs in SG&A along with amortization on the additional asset recorded. Rental payments are recognized as a reduction of the obligations and as interest expense. The number of stores, including those under construction, which are accounted for in this manner has increased from 17 in 2015 to 19 in 2017. We expect interest expense for lease obligations will be $2.3 million in 2018.
Provision for Income Taxes
The Tax Cuts and Jobs Act (the "Tax Act") was signed into law on December 22, 2017. The Tax Act significantly revises the U.S. corporate income tax by lowering the statutory corporate tax rate from 35% to 21%. It also eliminates certain deductions and enhances and extends through 2026 the option to claim accelerated depreciation deductions on qualified property. We have not completed our determination of the accounting implications of the Tax Act. However, we have reasonably estimated the effects of the Tax Act and recorded provisional amounts in our financial statements as of December 31, 2017 of approximately $10.6 million. This amount is primarily comprised of the determination and remeasurement of net deferred tax assets related to depreciation. As we complete our analysis of the Tax Act, collect and prepare necessary data, and interpret any additional guidance issued by the IRS, U.S. Treasury Department, and other standard-setting bodies, we may make adjustments to the provisional amounts.
We also recognized a tax benefit of $4.7 million for the re-measurement of deferred tax assets and liabilities for which our accounting is complete. The total of these adjustments was additional deferred tax expense of $5.9 million and is what we believe is the impact of the Tax Act.
19
Our effective tax rate was 51.2% in 2017, 38.1% in 2016, and 38.6% in 2015. The 2016 and 2015 rate varies from the 35% U.S. federal statutory rate primarily due to state income taxes. The 2017 rate is impacted by the negative effect of $5.9 million for the Tax Act.
Liquidity and Capital Resources
Overview of Liquidity
Our primary cash requirements include working capital needs, contractual obligations, benefit plan contributions, income tax obligations and capital expenditures. We have funded these requirements exclusively through cash generated from operations and have not used our credit facility since 2008. We believe funds generated from our expected results of operations and available cash and cash equivalents will be sufficient to fund our primary obligations and complete projects that we have underway or currently contemplate for the next fiscal and foreseeable future years.
At December 31, 2017, our cash and cash equivalents balance was $79.5 million, an increase of $16.0 million compared to December 31, 2016. This change in cash primarily resulted from strong operating results offset by purchases of property and equipment and dividends paid to stockholders. Additional discussion of our cash flow results, including the comparison of 2017 activity to 2016, is set forth in the
Analysis of Cash Flows
section.
At December 31, 2017, our outstanding indebtedness was $54.6 million in lease obligations required to be recorded on our balance sheet. We had no amounts outstanding and $47.4 million available under our revolving credit facility.
Capital Expenditures
Our primary capital requirements have been focused on our stores, distribution centers, and the development of both proprietary and purchased information systems. We have successfully concluded our store remodeling program and in 2017 we completed the expansion of our Florida Distribution Center and began a similar project in our Western Distribution Center. Our capital expenditures were $24.5 million in 2017, $5.4 million less than in 2016.
Our future capital requirements will depend in large part on the number of and timing for new stores we open within a given year, the investments we make for the maintenance of our existing stores, and our investment in new information systems to support our key strategies. In 2018, we anticipate that our capital expenditures will be approximately $20.0 million, refer to our
Store Expansion and Capital Expenditures
discussion below.
Analysis of Cash Flows
The following table illustrates the main components of our cash flows (in thousands):
|
Year Ended December 31,
|
||||||||||||
|
2017
|
2016
|
2015
|
||||||||||
|
Net cash provided by operating activities
|
$
|
52,457
|
$
|
60,054
|
$
|
52,232
|
||||||
|
Capital expenditures
|
(24,465
|
)
|
(29,838
|
)
|
(27,143
|
)
|
||||||
|
Free cash flow
|
$
|
27,992
|
$
|
30,216
|
$
|
25,089
|
||||||
|
Net cash used in investing activities
|
$
|
(21,608
|
)
|
$
|
(13,187
|
)
|
$
|
(28,355
|
)
|
|||
|
Net cash used in financing activities
|
$
|
(14,839
|
)
|
$
|
(54,045
|
)
|
$
|
(18,699
|
)
|
|||
20
Cash flows from operating activities.
During 2017, net cash provided by operating activities was $52.5 million. The primary components of the changes in operating assets and liabilities are listed below:
|
·
|
Increase in inventories of $2.1 million as we increased stocking levels in the distribution centers in advance of Chinese New Year when suppliers are closed and added a new store.
|
|
·
|
Increase in prepaid expenses of $2.5 million primarily from the timing of the payment of taxes and computer maintenance agreements.
|
|
·
|
Increase in customer deposits of $2.9 million.
|
|
·
|
Decrease in accounts payable of $5.2 million.
|
|
·
|
Decrease in accrued liabilities of $4.3 million primarily from the timing of payments for compensation and real estate and property taxes.
|
During 2016, net cash provided by operating activities was $60.1 million. The primary components of the changes in operating assets and liabilities are listed below:
|
·
|
Decrease in inventories of $6.9 million as we operated with leaner quantities in our distribution centers.
|
|
·
|
Increase in other assets of $2.5 million, resulting from increased prepaid maintenance contracts and assets held under a non-qualified deferred compensation plan.
|
|
·
|
Increase in prepaid expenses of $2.7 million primarily from the timing of the payment of payroll taxes and computer maintenance agreements.
|
|
·
|
Decrease in accounts payable of $2.2 million.
|
|
·
|
Increase in customer deposits of $3.9 million.
|
During 2015, net cash provided by operating activities was $52.2 million. The primary components of the changes in operating assets and liabilities are listed below:
|
·
|
Increase in inventories of $2.3 million, mainly due to the increase in showrooms, reduced $0.5 million for the inventory in our Lubbock store that was destroyed.
|
|
·
|
Decrease in other current assets of $1.7 million, resulting from a $3.3 million decrease in receivables for tenant incentives, partially offset by a casualty claim of $1.3 million.
|
|
·
|
Decrease in other assets of $2.7 million mainly due to the maturities of certain certificates of deposit.
|
|
·
|
Increase in accounts payable of $3.7 million.
|
|
·
|
Decrease in customer deposits of $2.7 million as our business was down in the fourth quarter of 2015 versus the comparable period of 2014.
|
Cash flows used in investing activities.
Net cash used in investing activities was $21.6 million, $13.2 million and $28.4 million for 2017, 2016 and 2015, respectively. In each of these years, the amounts of cash used in investing activities consisted principally of capital expenditures related to store construction and improvements, distribution, and information technology projects, refer to our
Store Expansion and Capital Expenditures
discussion below. During 2017, we received approximately $2.0 million in insurance proceeds to offset costs of rebuilding and repairing two stores. During 2016, partly offsetting the expenditures for new stores and the expansion of the Florida distribution center we had $12.7 million of investments which matured and received $3.0 million in insurance proceeds for the destroyed Lubbock store.
Cash flows used in financing activities.
Net cash used in financing activities was $14.8 million for 2017, $54.0 million for 2016 and $18.7 million for 2015. During 2017 we paid $11.4 million in dividends. During 2016 we purchased $21.3 million in treasury stock, paid $9.4 million in dividends, and paid $21.0 million as a special dividend. During 2015 we purchased $14.0 million in treasury stock and paid $8.1 million in dividends. We also received $6.7 million in construction allowances.
21
Long-Term Debt
In March 2016 Havertys entered into an Amended and Restated Credit Agreement (the "Credit Agreement")
with a bank. Refer to Note 5 of the Notes to Consolidated Financial Statements for information about our Credit Agreement.
Off-Balance Sheet Arrangements
We have not entered into agreements which meet the SEC's definition of an off-balance sheet arrangement other than operating leases and have made no financial commitments to or guarantees with respect to any unconsolidated entities or financial partnerships or special purpose entities.
Contractual Obligations
The following summarizes our contractual obligations and commercial commitments as of
December 31, 2017 (in thousands):
|
Payments Due or Expected by Period
|
||||||||||||||||||||
|
Total
|
Less than
1 Year
|
1-3
Years
|
3-5
Years
|
After 5
Years
|
||||||||||||||||
|
Lease obligations
(1)
|
$
|
69,885
|
$
|
6,087
|
$
|
12,263
|
$
|
10,736
|
$
|
40,799
|
||||||||||
|
Operating leases
|
153,474
|
31,643
|
55,126
|
35,502
|
31,203
|
|||||||||||||||
|
Purchase orders
|
88,426
|
88,426
|
—
|
—
|
—
|
|||||||||||||||
|
Total contractual obligations
(2)
|
$
|
311,785
|
$
|
126,156
|
$
|
67,389
|
$
|
46,238
|
$
|
72,002
|
||||||||||
|
(1)
|
These amounts are for our lease obligations recorded in our consolidated balance sheets, including interest amounts. For additional information about our leases, refer to Note 8 of the Notes to the Consolidated Financial Statements.
|
|
(2)
|
The contractual obligations do not include any amounts related to retirement benefits. For additional information about our plans, refer to Note 10 of the Notes to the Consolidated Financial Statements.
|
Store Expansion and Capital Expenditures
We have entered new markets and made continued improvements and relocations of our store base. The following outlines the change in our selling square footage for each of the three years ended December 31 (square footage in thousands):
|
2017
|
2016
|
2015
|
||||||||||||||||||||||
|
Store Activity:
|
#
of Stores |
Square
Footage
|
#
of Stores |
Square
Footage
|
#
of Stores |
Square
Footage
|
||||||||||||||||||
|
Opened
|
3
|
100
|
4
|
146
|
4
|
159
|
||||||||||||||||||
|
Closed
|
3
|
85
|
1
|
33
|
2
|
73
|
||||||||||||||||||
|
Year end balances
|
124
|
4,517
|
124
|
4,494
|
121
|
4,380
|
||||||||||||||||||
We also had major remodeling projects in a Tampa, Florida store in 2015.
22
The following table summarizes our store activity in 2017 and plans for 2018. Our store in Lubbock, Texas sustained significant damage from a blizzard at the end of December 2015. We operated in a temporary location during the rebuilding process. For additional information about the gain associated with this event, refer to Note 1, Other Income, of the Notes to the Consolidated Financial Statements.
|
Location
|
Opening (Closing) Quarter
Actual or Planned
|
Category
|
|
Lubbock, TX
|
Q-1-17
|
Replacement
|
|
Greensboro, NC
|
Q-2-17
|
New Market
|
|
Columbia, SC
|
Q-2-17
|
Replacement
|
|
Birmingham, AL
|
(Q-4-17)
|
Closure
|
|
Columbia, SC
|
(Q-1-18)
|
Closure
|
|
To be announced
|
(Q-2-18)
|
Closure
|
|
To be announced
|
Q-4-18
|
New Market
|
|
To be announced
|
(Q-4-18)
|
Closure
|
These plans and other changes should decrease net selling space in 2018 by approximately 1.4% assuming the new stores open and existing stores close as planned.
Our investing activities in stores and operations in 2017, 2016 and 2015 and planned outlays for 2018 are categorized in the table below. Capital expenditures for stores in the years noted do not necessarily coincide with the years in which the stores open.
|
(Approximate in thousands)
|
Proposed 2018
|
2017
|
2016
|
2015
|
||||||||||||
|
Stores:
|
||||||||||||||||
|
New or replacement stores
|
$
|
1,100
|
$
|
6,300
|
$
|
6,800
|
$
|
7,800
|
||||||||
|
Remodels/expansions
|
2,000
|
5,300
|
3,900
|
8,900
|
||||||||||||
|
Other improvements
|
3,900
|
3,600
|
4,200
|
3,700
|
||||||||||||
|
Total stores
|
7,000
|
15,200
|
14,900
|
20,400
|
||||||||||||
|
Distribution
|
11,000
|
6,500
|
9,200
|
2,800
|
||||||||||||
|
Information technology
|
2,000
|
2,800
|
5,700
|
3,900
|
||||||||||||
|
Total
|
$
|
20,000
|
$
|
24,500
|
$
|
29,800
|
$
|
27,100
|
||||||||
Critical Accounting Estimates and Assumptions
Our discussion and analysis is based upon our consolidated financial statements, which have been prepared in accordance with U.S. generally accepted accounting principles. The preparation of these financial statements requires us to make estimates and judgments that affect the reported amounts of assets, liabilities, revenues and expenses, and related disclosures. On an on-going basis, we evaluate our estimates, including those related to self-insurance and income taxes. We base our estimates on historical experience and on various other assumptions that are believed to be reasonable under the circumstances, the results of which form the basis for making judgments about the carrying values of assets and liabilities that are not readily apparent from other sources. Actual results may differ from these estimates under different assumptions or conditions.
An accounting policy is deemed to be critical if it requires an accounting estimate to be made based on assumptions about matters that are highly uncertain at the time the estimate is made, and if different estimates that reasonably could have been used or changes in the accounting estimate that are reasonably likely to occur could materially change the financial statements.
We believe the following critical accounting policies reflect our more significant estimates and assumptions used in the preparation of our consolidated financial statements:
23
Self-Insurance
. We are self-insured for certain losses related to worker's compensation, general liability and vehicle claims for amounts up to a deductible per occurrence. Our reserve is developed based on historical claims data and contains an actuarially developed incurred but not reported component. The resulting estimate is discounted and recorded as a liability. Our actuarial assumptions and discount rates are reviewed periodically and compared with actual claims experience and external benchmarks to ensure appropriateness. A one-percentage-point change in the actuarial assumption for the discount rate would impact 2017 expense for insurance by approximately $85,000, a 1.1% change.
We are primarily self-insured for employee group health care claims. We have purchased insurance coverage in order to establish certain limits to our exposure on a per claim basis. We record an accrual for the estimated amount of self-insured health care claims incurred by all participants but not yet reported (IBNR) using an actuarial method of applying a development factor to the reported monthly claims amounts. The Company's risk management and accounting management utilize a consistent methodology which involves various assumptions, judgment and other factors. The most significant factors which impact the determination of a required accrual are the historical pattern of the timeliness of claims processing, any changes in the nature or types of benefit plans, changes in the plan benefit designs, and medical trends and inflation. Historical experience is continually monitored, and accruals are adjusted when warranted by changes in facts and circumstances. The Company believes that the total health care cost accruals are reasonable and adequate to cover future payments on incurred claims.
Income Taxes.
The Tax Act was signed into law on December 22, 2017 and we are required to recognize the effect of the tax law changes in the period of enactment, such as remeasuring our deferred tax assets and liabilities. In December 2017, the Securities and Exchange Commission (SEC) staff issued Staff Accounting Bulletin No. 118, Income Tax Accounting Implications of the Tax Cuts and Jobs Act (SAB 118), which allows us to record provisional amounts during a measurement period not to extend beyond one year of the enactment date. Since the Tax Act was passed late in the fourth quarter of 2017, and ongoing guidance and accounting interpretation are expected over the next 12 months, we consider the accounting for certain deferred taxes and the related deferred tax re-measurements to be provisional due to the forthcoming guidance and our ongoing analysis of final year-end data and tax positions. We expect to complete our analysis within the measurement period in accordance with SAB 118.
At December 31, 2017, we have made a reasonable estimate of the effects of the Tax Act on our existing deferred tax balances and recorded additional provisional tax expense of $10.6 million. This provisional amount is primarily related to depreciation deductions. We also recognized a tax benefit of $4.7 million for the remeasurement of deferred tax assets and liabilities for which our accounting is complete.
Market risk represents the potential loss arising from adverse changes in the value of financial instruments. The risk of loss is assessed based on the likelihood of adverse changes in fair values, cash flows or future earnings.
In the ordinary course of business, we are exposed to various market risks, including fluctuations in interest rates. To manage the exposure related to this risk, we may use various derivative transactions. As a matter of policy, we do not engage in derivatives trading or other speculative activities. Moreover, we enter into financial instruments transactions with either major financial institutions or high credit-rated counterparties, thereby limiting exposure to credit and performance-related risks.
We have exposure to floating interest rates through our Credit Agreement. Therefore, interest expense will fluctuate with changes in LIBOR and other benchmark rates. We do not believe a 100 basis point change in interest rates would have a significant adverse impact on our operating results or financial position.
24
The report of our independent registered public accounting firm, the Consolidated Financial Statements of Havertys and the Notes to Consolidated Financial Statements, and the supplementary financial information called for by this Item 8, are set forth on pages F-1 to F-24 of this report. Specific financial statements and supplementary data can be found at the pages listed in the following index:
|
Index
|
Page
|
|
Financial Statements
|
|
|
Report of Independent Registered Public Accounting Firm on the Consolidated
Financial Statements
|
F-1
|
|
Consolidated Balance Sheets
|
F-3
|
|
Consolidated Statements of Comprehensive Income
|
F-4
|
|
Consolidated Statements of Stockholders' Equity
|
F-5
|
|
Consolidated Statements of Cash Flows
|
F-6
|
|
Notes to Consolidated Financial Statements
|
F-7
|
|
Schedule II – Valuation and Qualifying Accounts
|
F-24
|
Not Applicable.
25
(a) Disclosure Controls and Procedures.
Our management has evaluated, with the participation of our Chief Executive Officer ("CEO") and Chief Financial Officer ("CFO"), the effectiveness of the design and operation of the Company's "disclosure controls and procedures" (as defined in Rules 13a-15(e) and 15d-15(e) under the Securities Exchange Act of 1934, as amended) as of the end of the period covered by this report. Based on that evaluation, our CEO and CFO concluded that our disclosure controls and procedures were effective for the purpose of providing reasonable assurance that the information we must disclose in reports that we file or submit under the Securities Exchange Act (i) is recorded, processed, summarized and reported within the time periods specified in the SEC's rules and forms and (ii) is accumulated and communicated to the Company's management, including its CEO and CFO, as appropriate to allow timely decisions regarding required disclosures.
(b) Management's Annual Report on Internal Control over Financial Reporting.
Our management is responsible for establishing and maintaining adequate internal control over financial reporting, as such term is defined in Rule 13a-15(f) of the Exchange Act. Under the supervision and with the participation of our management, including our CEO and CFO, we conducted an evaluation of the effectiveness of our internal control over financial reporting based upon the framework in
Internal Control – Integrated Framework
issued by the Committee of Sponsoring Organizations of the Treadway Commission (2013 framework). Based on that evaluation, our management concluded that our internal control over financial reporting is effective as of December 31, 2017.
Attestation Report of the Independent Registered Public Accounting Firm
.
Grant Thornton LLP, an independent registered public accounting firm, has audited the consolidated financial statements included in this Annual Report on Form 10-K and, as part of their audit, has issued their report, included herein, on the effectiveness of our internal control over financial reporting.
(c) Changes in Internal Control over Financial Reporting.
During the fourth quarter of 2017, there were no changes in our internal control over financial reporting that have affected, or are reasonably likely to materially affect, our internal control over financial reporting.
26
Report of Independent Registered Public Accounting Firm
The Board of Directors and Stockholders
Haverty Furniture Companies, Inc.
Opinion on internal control over financial reporting
We have audited the internal control over financial reporting of Haverty Furniture Companies, Inc. (a Maryland corporation) and subsidiary (the "Company") as of December 31, 2017, based on criteria established in the 2013 Internal Control—Integrated Framework issued by the Committee of Sponsoring Organizations of the Treadway Commission (COSO). In our opinion, the Company maintained, in all material respects, effective internal control over financial reporting as of December 31, 2017, based on criteria established in the 2013 Internal Control—Integrated Framework issued by COSO.
We also have audited, in accordance with the standards of the Public Company Accounting Oversight Board (United States) ("PCAOB"), the consolidated financial statements of the Company as of and for the year ended December 31, 2017, and our report dated March 2, 2018 expressed an unqualified opinion on those financial statements.
Basis for opinion
The Company's management is responsible for maintaining effective internal control over financial reporting and for its assessment of the effectiveness of internal control over financial reporting, included in the accompanying Management's Annual Report on Internal Control over Financial Reporting. Our responsibility is to express an opinion on the Company's internal control over financial reporting based on our audit. We are a public accounting firm registered with the PCAOB and are required to be independent with respect to the Company in accordance with the U.S. federal securities laws and the applicable rules and regulations of the Securities and Exchange Commission and the PCAOB.
We conducted our audit in accordance with the standards of the PCAOB. Those standards require that we plan and perform the audit to obtain reasonable assurance about whether effective internal control over financial reporting was maintained in all material respects. Our audit included obtaining an understanding of internal control over financial reporting, assessing the risk that a material weakness exists, testing and evaluating the design and operating effectiveness of internal control based on the assessed risk, and performing such other procedures as we considered necessary in the circumstances. We believe that our audit provides a reasonable basis for our opinion.
Definition and limitations of internal control over financial reporting
A company's internal control over financial reporting is a process designed to provide reasonable assurance regarding the reliability of financial reporting and the preparation of financial statements for external purposes in accordance with generally accepted accounting principles. A company's internal control over financial reporting includes those policies and procedures that (1) pertain to the maintenance of records that, in reasonable detail, accurately and fairly reflect the transactions and dispositions of the assets of the company; (2) provide reasonable assurance that transactions are recorded as necessary to permit preparation of financial statements in accordance with generally accepted accounting principles, and that receipts and expenditures of the company are being made only in accordance with authorizations of management and directors of the company; and (3) provide reasonable assurance regarding prevention or timely detection of unauthorized acquisition, use, or disposition of the company's assets that could have a material effect on the financial statements.
Because of its inherent limitations, internal control over financial reporting may not prevent or detect misstatements. Also, projections of any evaluation of effectiveness to future periods are subject to the risk that controls may become inadequate because of changes in conditions, or that the degree of compliance with the policies or procedures may deteriorate.
/s/ GRANT THORNTON LLP
Atlanta, GA
March 2, 2018
27
Not applicable.
PART III
We have adopted a Code of Conduct (the "Code") for our directors, officers (including our principal executive officer, and principal financial and accounting officer) and employees. The Code is available on our website at www.havertys.com. In the event we amend or waive any provisions of the Code applicable to our principal executive officer or principal financial and accounting officer, we will disclose the same by filing a Form 8-K. The information contained on or connected to our Internet website is not incorporated by reference into this Form 10-K and should not be considered part of this or any other report that we file or furnish to the SEC.
We provide some information about our executive officers in Part I of this report under the heading "Executive Officers and Certain Significant Employees of the Registrant." The remaining information called for by this item is incorporated by reference to "Election of Directors," "Corporate Governance," "Board and Committees" and "Other Information – Section 16(a) Beneficial Ownership Reporting Compliance" in our 2018 Proxy Statement.
The information contained in our 2018 Proxy Statement with respect to executive compensation and transactions under the heading "Compensation Discussion and Analysis" is incorporated herein by reference in response to this item.
ITEM 12. SECURITY OWNERSHIP OF CERTAIN BENEFICIAL OWNERS AND MANAGEMENT AND RELATED STOCKHOLDER MATTERS
The information contained in our 2018 Proxy Statement with respect to the ownership of common stock and Class A common stock by certain beneficial owners and management, and with respect to our compensation plans under which equity securities are authorized for issuance under the headings "Ownership of Company Stock by Directors and Management" and "Equity Compensation Plan Information," is incorporated herein by reference in response to this item.
For purposes of determining the aggregate market value of our common stock and Class A common stock held by non-affiliates, shares held by all directors and executive officers have been excluded. The exclusion of such shares is not intended to, and shall not, constitute a determination as to which persons or entities may be "affiliates" as defined under the Securities Exchange Act of 1934.
The information contained in our 2018 Proxy Statement with respect to certain relationships, related party transactions and director independence under the headings "Certain Relationships and Related Transactions" and "Corporate Governance – Director Independence" is incorporated herein by reference in response to this item.
The information under the heading "Audit Fees and Related Matters" in our 2018 Proxy Statement is incorporated herein by reference to this item.
28
PART IV
(a) (1)
Financial Statements.
The following documents are filed as part of this report:
Consolidated Balance Sheets – December 31, 2017 and 2016
Consolidated Statements of Comprehensive Income – Years ended December 31, 2017, 2016 and 2015
Consolidated Statements of Stockholders' Equity – Years ended December 31, 2017, 2016 and 2015
Consolidated Statements of Cash Flows – Years ended December 31, 2017, 2016 and 2015
Notes to Consolidated Financial Statements
(2)
Financial Statement Schedule.
The following financial statement schedule of Haverty Furniture Companies, Inc. is filed as part of this Report and should be read in conjunction with the Consolidated Financial Statements:
Schedule II – Valuation and Qualifying Accounts
All other schedules have been omitted because they are inapplicable or the required information is included in the Consolidated Financial Statements or notes thereto.
(3) Exhibits:
Reference is made to Item 15(b) of this Report.
Each exhibit identified below is filed as part of this report. Exhibits not incorporated by reference to a prior filing are designated by an "*"; all exhibits not so designated are incorporated herein by reference to a prior filing as indicated. Exhibits designated with a "+" constitute a management contract or compensatory plan or arrangement. Our SEC File Number is 1-14445 for all exhibits filed with the Securities Exchange Act reports.
29
|
Exhibit No.
|
Exhibit
|
30
|
Exhibit No.
|
Exhibit
|
31
|
Exhibit No.
|
Exhibit
|
|
*32.1
|
|
|
*101
|
The following financial information from our Report on Form 10-K for the year ended December 31 2017, formatted in XBRL (eXtensible Business Reporting Language): (i) Consolidated Balance Sheets for the years ended December 31, 2017 and 2016, (ii) Consolidated Statements of Comprehensive Income for the years ended December 31, 2017, 2016 and 2015, (iii) Consolidated Statements of Stockholders' Equity for the years ended December 31, 2017, 2016 and 2015, (iv) Consolidated Statements of Cash Flow for the years ended December 31, 2017, 2016 and 2015, and (v) the Notes to Consolidated Financial Statements.
|
32
SIGNATURES
Pursuant to the requirements of Section 13 or 15(d) of the Securities and Exchange Act of 1934, the registrant has duly caused this Report to be signed on its behalf by the undersigned, thereunto duly authorized, on March 2, 2018.
|
HAVERTY FURNITURE COMPANIES, INC.
|
||
|
By:
|
/s/ CLARENCE H. SMITH
|
|
|
Clarence H. Smith
|
||
|
Chairman of the Board, President and
Chief Executive Officer
|
||
Pursuant to the requirements of the Securities Exchange Act of 1934, this Report has been signed below by the following persons on behalf of the Registrant and in the capacities indicated, on March 2, 2018.
|
/s/ CLARENCE H. SMITH
|
/s/ RICHARD B. HARE
|
|||
|
Clarence H. Smith
Chairman of the Board, President and
Chief Executive Officer
(principal executive officer)
|
Richard B. Hare
Executive Vice President and
Chief Financial Officer
(principal financial and accounting officer)
|
|||
|
/s/ L. ALLISON DUKES
|
/s/ MYLLE H. MANGUM
|
|||
|
L. Allison Dukes
Director
|
Mylle H. Mangum
Director
|
|||
|
/s/ JOHN T. GLOVER
|
/s/ VICKI R. PALMER
|
|||
|
John T. Glover
Lead Director
|
Vicki R. Palmer
Director
|
|||
|
/s/ RAWSON HAVERTY, JR.
|
/s/ FRED L. SCHUERMANN
|
|||
|
Rawson Haverty, Jr.
Director
|
Fred L. Schuermann
Director
|
|||
|
/s/ L. PHILLIP HUMANN
|
/s/ AL TRUJILLO
|
|||
|
L. Phillip Humann
Director
|
Al Trujillo
Director
|
33
Report of Independent Registered Public Accounting Firm
The Board of Directors and Stockholders
Haverty Furniture Companies, Inc.
Opinion on the financial statements
We have audited the accompanying consolidated balance sheets of Haverty Furniture Companies, Inc. (a Maryland corporation) and subsidiary (the "Company") as of December 31, 2017 and 2016, the related consolidated statements of comprehensive income, changes in stockholders' equity, and cash flows for each of the two years in the period ended December 31, 2017, and the related notes and schedules (collectively referred to as the "financial statements"). In our opinion, the financial statements present fairly, in all material respects, the financial position of the Company as of December 31, 2017 and 2016, and the results of its operations and its cash flows for each of the two years in the period ended December 31, 2017, in conformity with accounting principles generally accepted in the United States of America.
We also have audited, in accordance with the standards of the Public Company Accounting Oversight Board (United States) ("PCAOB"), the Company's internal control over financial reporting as of December 31, 2017, based on criteria established in the 2013 Internal Control—Integrated Framework issued by the Committee of Sponsoring Organizations of the Treadway Commission ("COSO"), and our report dated March 2, 2018 expressed an unqualified opinion.
Basis for opinion
These financial statements are the responsibility of the Company's management. Our responsibility is to express an opinion on the Company's financial statements based on our audits. We are a public accounting firm registered with the PCAOB and are required to be independent with respect to the Company in accordance with the U.S. federal securities laws and the applicable rules and regulations of the Securities and Exchange Commission and the PCAOB.
We conducted our audits in accordance with the standards of the PCAOB. Those standards require that we plan and perform the audit to obtain reasonable assurance about whether the financial statements are free of material misstatement, whether due to error or fraud. Our audits included performing procedures to assess the risks of material misstatement of the financial statements, whether due to error or fraud, and performing procedures that respond to those risks. Such procedures included examining, on a test basis, evidence supporting the amounts and disclosures in the financial statements. Our audits also included evaluating the accounting principles used and significant estimates made by management, as well as evaluating the overall presentation of the financial statements. We believe that our audits provide a reasonable basis for our opinion.
/s/ GRANT THORNTON LLP
We have served as the Company's auditor since 2016.
Atlanta, GA
March 2, 2018
F-1
Report of Independent Registered Public Accounting Firm
The Board of Directors and Stockholders of
Haverty Furniture Companies, Inc.
We have audited the accompanying consolidated statements of comprehensive income, stockholders' equity and cash flows of Haverty Furniture Companies, Inc. ("the Company") for the year ended December 31, 2015. Our audit also included the financial statement schedule listed in the Index at Item 15(a). These financial statements and schedule are the responsibility of the Company's management. Our responsibility is to express an opinion on these financial statements and schedule based on our audit.
We conducted our audit in accordance with the standards of the Public Company Accounting Oversight Board (United States). Those standards require that we plan and perform the audit to obtain reasonable assurance about whether the financial statements are free of material misstatement. An audit includes examining, on a test basis, evidence supporting the amounts and disclosures in the financial statements. An audit also includes assessing the accounting principles used and significant estimates made by management, as well as evaluating the overall financial statement presentation. We believe that our audit provides a reasonable basis for our opinion.
In our opinion, the financial statements referred to above present fairly, in all material respects, the consolidated results of operations and cash flows of the Company for the year ended December 31, 2015, in conformity with U.S. generally accepted accounting principles. Also, in our opinion, the related financial statement schedule, when considered in relation to the basic financial statements taken as a whole, presents fairly in all material respects the information set forth therein.
/s/ Ernst & Young LLP
Atlanta, Georgia
March 4, 2016
F-2
Haverty Furniture Companies, Inc.
Consolidated
Balance Sheets
|
December 31,
|
||||||||
|
(In thousands, except per share data)
|
2017
|
2016
|
||||||
|
Assets
|
||||||||
|
Current assets
|
||||||||
|
Cash and cash equivalents
|
$
|
79,491
|
$
|
63,481
|
||||
|
Restricted cash and cash equivalents
|
8,115
|
8,034
|
||||||
|
Accounts receivable, net
|
2,408
|
4,244
|
||||||
|
Inventories
|
103,437
|
102,020
|
||||||
|
Prepaid expenses
|
11,314
|
8,836
|
||||||
|
Other current assets
|
5,922
|
7,500
|
||||||
|
Total current assets
|
210,687
|
194,115
|
||||||
|
Accounts receivable, long-term, net
|
254
|
462
|
||||||
|
Property and equipment
|
229,215
|
233,667
|
||||||
|
Deferred income taxes
|
12,375
|
18,376
|
||||||
|
Other assets
|
8,798
|
7,885
|
||||||
|
Total assets
|
$
|
461,329
|
$
|
454,505
|
||||
|
Liabilities and Stockholders' Equity
|
||||||||
|
Current liabilities
|
||||||||
|
Accounts payable
|
$
|
20,501
|
$
|
25,662
|
||||
|
Customer deposits
|
27,813
|
24,923
|
||||||
|
Accrued liabilities
|
37,582
|
41,904
|
||||||
|
Current portion of lease obligations
|
3,788
|
3,461
|
||||||
|
Total current liabilities
|
89,684
|
95,950
|
||||||
|
Lease obligations, less current portion
|
50,803
|
52,013
|
||||||
|
Other liabilities
|
26,700
|
24,671
|
||||||
|
Total liabilities
|
167,187
|
172,634
|
||||||
|
Stockholders' equity
|
||||||||
|
Capital Stock, par value $1 per share
|
||||||||
|
Preferred Stock, Authorized – 1,000 shares; Issued: None
|
||||||||
|
Common Stock, Authorized – 50,000 shares; Issued: 2017 – 28,950; 2016 –28,793
|
28,950
|
28,793
|
||||||
|
Convertible Class A Common Stock, Authorized – 15,000 shares; Issued: 2017 – 2,290; 2016 – 2,340
|
2,290
|
2,340
|
||||||
|
Additional paid-in capital
|
88,978
|
86,273
|
||||||
|
Retained earnings
|
287,390
|
277,707
|
||||||
|
Accumulated other comprehensive income (loss)
|
(2,144
|
)
|
(1,830
|
)
|
||||
|
Less treasury stock at cost – Common Stock (2017 – 9,498; 2016 – 9,506) and Convertible Class A Common Stock (2017 and 2016 – 522)
|
(111,322
|
)
|
(111,412
|
)
|
||||
|
Total stockholders' equity
|
294,142
|
281,871
|
||||||
|
Total liabilities and stockholders' equity
|
$
|
461,329
|
$
|
454,505
|
||||
The accompanying notes are an integral part of these consolidated financial statements.
F-3
Haverty Furniture Companies, Inc.
Consolidated Statements of
Comprehensive Income
|
Year Ended December 31,
|
||||||||||||
|
(In thousands, except per share data)
|
2017
|
2016
|
2015
|
|||||||||
|
Net sales
|
$
|
819,866
|
$
|
821,571
|
$
|
804,870
|
||||||
|
Cost of goods sold
|
374,943
|
378,234
|
374,094
|
|||||||||
|
Gross profit
|
444,923
|
443,337
|
430,776
|
|||||||||
|
Credit service charges
|
161
|
229
|
286
|
|||||||||
|
Gross profit and other revenue
|
445,084
|
443,566
|
431,062
|
|||||||||
|
Expenses:
|
||||||||||||
|
Selling, general and administrative
|
402,884
|
399,236
|
384,801
|
|||||||||
|
Provision for doubtful accounts
|
224
|
383
|
314
|
|||||||||
|
Other income, net
|
(3,358
|
)
|
(4,107
|
)
|
(1,617
|
)
|
||||||
|
Total expenses
|
399,750
|
395,512
|
383,498
|
|||||||||
|
Income before interest and income taxes
|
45,334
|
48,054
|
47,564
|
|||||||||
|
Interest expense, net
|
2,111
|
2,233
|
2,289
|
|||||||||
|
Income before income taxes
|
43,223
|
45,821
|
45,275
|
|||||||||
|
Income tax expense
|
22,148
|
17,465
|
17,486
|
|||||||||
|
Net income
|
$
|
21,075
|
$
|
28,356
|
$
|
27,789
|
||||||
|
Other comprehensive (loss) income, net of tax:
|
||||||||||||
|
Defined benefit pension plans adjustments; net of
tax expense (benefit) of $105, $66 and $141
|
$
|
(314
|
)
|
$
|
108
|
$
|
230
|
|||||
|
Comprehensive income
|
$
|
20,761
|
$
|
28,464
|
$
|
28,019
|
||||||
|
Basic earnings per share:
|
||||||||||||
|
Common Stock
|
$
|
1.00
|
$
|
1.32
|
$
|
1.24
|
||||||
|
Class A Common Stock
|
$
|
0.95
|
$
|
1.27
|
$
|
1.18
|
||||||
|
Diluted earnings per share:
|
||||||||||||
|
Common Stock
|
$
|
0.98
|
$
|
1.30
|
$
|
1.22
|
||||||
|
Class A Common Stock
|
$
|
0.94
|
$
|
1.27
|
$
|
1.17
|
||||||
The accompanying notes are an integral part of these consolidated financial statements.
F-4
Haverty Furniture Companies, Inc.
Consolidated Statements of
Stockholders' Equity
|
|
Year Ended December 31,
|
|||||||||||||||||||||||
|
(In thousands, except share and per share data)
|
2017
|
2016
|
2015
|
|||||||||||||||||||||
|
Shares
|
Dollars
|
Shares
|
Dollars
|
Shares
|
Dollars
|
|||||||||||||||||||
|
COMMON STOCK:
|
||||||||||||||||||||||||
|
Beginning balance
|
28,792,735
|
$
|
28,793
|
28,485,758
|
$
|
28,486
|
28,326,770
|
$
|
28,327
|
|||||||||||||||
|
Conversion of Class A Common Stock
|
50,353
|
50
|
214,400
|
214
|
48,951
|
49
|
||||||||||||||||||
|
Stock compensation transactions, net
|
107,149
|
107
|
92,577
|
93
|
110,037
|
110
|
||||||||||||||||||
|
Ending balance
|
28,950,237
|
28,950
|
28,792,735
|
28,793
|
28,485,758
|
28,486
|
||||||||||||||||||
|
CLASS A COMMON STOCK:
|
||||||||||||||||||||||||
|
Beginning balance
|
2,340,059
|
2,340
|
2,554,459
|
2,554
|
2,603,410
|
2,603
|
||||||||||||||||||
|
Conversion to Common Stock
|
(50,353
|
)
|
(50
|
)
|
(214,400
|
)
|
(214
|
)
|
(48,951
|
)
|
(49
|
)
|
||||||||||||
|
Ending balance
|
2,289,706
|
2,290
|
2,340,059
|
2,340
|
2,554,459
|
2,554
|
||||||||||||||||||
|
TREASURY STOCK:
|
||||||||||||||||||||||||
|
Beginning balance (includes 522,410 shares Class A Stock for each of the years presented; remainder are Common Stock)
|
(10,028,315
|
)
|
(111,412
|
)
|
(8,884,024
|
)
|
(90,302
|
)
|
(8,281,277
|
)
|
(76,436
|
)
|
||||||||||||
|
Directors' Compensation Plan
|
7,812
|
90
|
16,248
|
172
|
14,274
|
136
|
||||||||||||||||||
|
Purchases
|
—
|
—
|
(1,160,539
|
)
|
(21,282
|
)
|
(617,021
|
)
|
(14,002
|
)
|
||||||||||||||
|
Ending balance
|
(10,020,503
|
)
|
(111,322
|
)
|
(10,028,315
|
)
|
(111,412
|
)
|
(8,884,024
|
)
|
(90,302
|
)
|
||||||||||||
|
ADDITIONAL PAID-IN CAPITAL:
|
||||||||||||||||||||||||
|
Beginning balance
|
86,273
|
83,179
|
79,726
|
|||||||||||||||||||||
|
Stock option and restricted stock issuances
|
(1,662
|
)
|
(975
|
)
|
(1,312
|
)
|
||||||||||||||||||
|
Tax (cost) benefit related to stock-based plans
|
—
|
(121
|
)
|
253
|
||||||||||||||||||||
|
Directors' Compensation Plan
|
549
|
318
|
479
|
|||||||||||||||||||||
|
Amortization of restricted stock
|
3,818
|
3,872
|
4,033
|
|||||||||||||||||||||
|
Ending balance
|
88,978
|
86,273
|
83,179
|
|||||||||||||||||||||
|
RETAINED EARNINGS:
|
||||||||||||||||||||||||
|
Beginning balance
|
277,707
|
279,760
|
260,031
|
|||||||||||||||||||||
|
Net income
|
21,075
|
28,356
|
27,789
|
|||||||||||||||||||||
|
Cash dividends
(Common Stock: 2017 – $ 0.54;
2016 - $1.44; and 2015 - $0.36 per share
Class A Common Stock: 2017- $0.51;
2016 -$1.365 and 2015 - $0.34 per share)
|
(11,392
|
)
|
(30,409
|
)
|
(8,060
|
)
|
||||||||||||||||||
|
Ending balance
|
287,390
|
277,707
|
279,760
|
|||||||||||||||||||||
|
ACCUMULATED OTHER COMPREHENSIVE INCOME (LOSS):
|
||||||||||||||||||||||||
|
Beginning balance
|
(1,830
|
)
|
(1,938
|
)
|
(2,168
|
)
|
||||||||||||||||||
|
Pension liabilities adjustment, net of taxes
|
(314
|
)
|
108
|
230
|
||||||||||||||||||||
|
Ending balance
|
(2,144
|
)
|
(1,830
|
)
|
(1,938
|
)
|
||||||||||||||||||
|
TOTAL STOCKHOLDERS' EQUITY
|
$
|
294,142
|
$
|
281,871
|
$
|
301,739
|
||||||||||||||||||
The accompanying notes are an integral part of these consolidated financial statements
F-5
Haverty Furniture Companies, Inc.
Consolidated Statements of
Cash flows
|
Year ended December 31,
|
||||||||||||
|
(In thousands)
|
2017
|
2016
|
2015
|
|||||||||
|
Cash Flows from Operating Activities
|
||||||||||||
|
Net income
|
$
|
21,075
|
$
|
28,356
|
$
|
27,789
|
||||||
|
Adjustments to reconcile net income to net cash
provided by operating activities: |
||||||||||||
|
Depreciation and amortization
|
30,516
|
29,045
|
25,756
|
|||||||||
|
Gain on insurance recovery
|
(2,848
|
)
|
(3,338
|
)
|
—
|
|||||||
|
Proceeds from insurance recovery received for business interruption and destroyed inventory
|
2,867
|
2,599
|
—
|
|||||||||
|
Stock-based compensation expense
|
3,818
|
3,872
|
4,033
|
|||||||||
|
Excess tax benefit from stock-based plans
|
—
|
(80
|
)
|
(397
|
)
|
|||||||
|
Deferred income taxes
|
5,559
|
(1,120
|
)
|
(3,019
|
)
|
|||||||
|
Provision for doubtful accounts
|
224
|
383
|
314
|
|||||||||
|
Other
|
82
|
(400
|
)
|
(160
|
)
|
|||||||
|
Changes in operating assets and liabilities:
|
||||||||||||
|
Accounts receivable
|
1,820
|
1,514
|
960
|
|||||||||
|
Inventories
|
(2,112
|
)
|
6,876
|
(2,305
|
)
|
|||||||
|
Customer deposits
|
2,890
|
3,887
|
(2,650
|
)
|
||||||||
|
Other assets and liabilities
|
(932
|
)
|
(9,508
|
)
|
(590
|
)
|
||||||
|
Accounts payable and accrued liabilities
|
(10,502
|
)
|
(2,032
|
)
|
2,501
|
|||||||
|
Net Cash Provided by Operating Activities
|
52,457
|
60,054
|
52,232
|
|||||||||
|
Cash Flows from Investing Activities
|
||||||||||||
|
Capital expenditures
|
(24,465
|
)
|
(29,838
|
)
|
(27,143
|
)
|
||||||
|
Maturities of investments
|
—
|
12,725
|
7,250
|
|||||||||
|
Purchase of commercial paper and certificates of deposit
|
—
|
—
|
(9,975
|
)
|
||||||||
|
Proceeds from insurance for destroyed property and equipment
|
1,987
|
3,011
|
—
|
|||||||||
|
Other investing activities
|
870
|
915
|
1,513
|
|||||||||
|
Net Cash Used in Investing Activities
|
(21,608
|
)
|
(13,187
|
)
|
(28,355
|
)
|
||||||
|
Cash Flows from Financing Activities
|
||||||||||||
|
Proceeds from borrowings under revolving credit facilities
|
—
|
—
|
—
|
|||||||||
|
Payments of borrowings under revolving credit facilities
|
—
|
—
|
—
|
|||||||||
|
Net change in borrowings under revolving credit facilities
|
—
|
—
|
—
|
|||||||||
|
Construction allowance receipts
|
1,590
|
1,574
|
6,701
|
|||||||||
|
Payments on lease obligations
|
(3,482
|
)
|
(3,125
|
)
|
(2,534
|
)
|
||||||
|
Excess tax benefit from stock-based plans
|
—
|
80
|
397
|
|||||||||
|
Dividends paid
|
(11,392
|
)
|
(30,409
|
)
|
(8,060
|
)
|
||||||
|
Common stock repurchased
|
—
|
(21,282
|
)
|
(14,002
|
)
|
|||||||
|
Taxes on vested restricted shares
|
(1,555
|
)
|
(883
|
)
|
(1,201
|
)
|
||||||
|
Net Cash Used In Financing Activities
|
(14,839
|
)
|
(54,045
|
)
|
(18,699
|
)
|
||||||
|
Increase (Decrease) in cash and Cash Equivalents
|
16,010
|
(7,178
|
)
|
5,178
|
||||||||
|
Cash and Cash Equivalents at Beginning of Year
|
63,481
|
70,659
|
65,481
|
|||||||||
|
Cash and Cash Equivalents at End of Year
|
$
|
79,491
|
$
|
63,481
|
$
|
70,659
|
||||||
The accompanying notes are an integral part of these consolidated financial statements
F-6
Notes To Consolidated Financial Statements
Business:
Haverty Furniture Companies, Inc. ("Havertys," "we," "our," or "us") is a retailer of a broad line of residential furniture in the middle to upper-middle price ranges. We have 124 showrooms in 16 states at December 31, 2017. All of our stores are operated using the Havertys name and we do not franchise our stores. We offer financing through a third-party finance company as well as an internal revolving charge credit plan.
Basis of Presentation:
The consolidated financial statements include the accounts of Havertys and its wholly-owned subsidiary. All significant intercompany accounts and transactions have been eliminated in consolidation.
Use of Estimates:
The preparation of financial statements in conformity with United States of America generally accepted accounting principles ("US GAAP") requires management to make estimates and assumptions that affect the amounts reported in the financial statements and accompanying notes. Actual results could differ from those estimates.
Cash and Cash Equivalents:
Cash and cash equivalents includes all liquid investments with a maturity date of less than three months when purchased. Cash equivalents also include amounts due from third-party financial institutions for credit and debit card transactions which typically settle within five days.
Restricted Cash and Cash Equivalents:
Our insurance carrier requires us to collateralize a portion of our workers' compensation obligations. These funds are investments in money market funds held by an agent. The agreement with our carrier governing these funds is on an annual basis expiring on December 31.
Inventories:
Inventories are stated at the lower of cost or market. Cost is determined using the last-in, first-out (LIFO) method.
Property and Equipment:
Property and equipment are stated at cost less accumulated depreciation and amortization. Depreciation is provided over the estimated useful lives of the assets using the straight-line method. Leasehold improvements and buildings under lease are amortized over the shorter of the estimated useful life or the lease term of the related asset. Amortization of buildings under lease is included in depreciation expense.
Estimated useful lives for financial reporting purposes are as follows:
|
Buildings
|
25 – 33 years
|
|
Improvements
|
5 – 15 years
|
|
Furniture and Fixtures
|
3 – 15 years
|
|
Equipment
|
3 – 15 years
|
|
Buildings under lease
|
15 years
|
Customer Deposits:
Customer deposits consist of cash collections on sales of undelivered merchandise, customer advance payments, and deposits on credit sales for undelivered merchandise.
F-7
Revenue Recognition:
We recognize revenue from merchandise sales and related service fees, net of sales taxes, upon delivery to the customer. A reserve for merchandise returns and customer allowances is estimated based on our historical returns and allowance experience and current sales levels.
We typically offer our customers an opportunity for us to deliver their purchases and most choose this service. Delivery fees of approximately $25,728,000, $25,467,000 and $27,650,000 were charged to customers in 2017, 2016 and 2015, respectively, and are included in net sales. The costs associated with deliveries are included in selling, general and administrative expenses and were approximately $39,582,000, $39,222,000 and $37,730,000 in 2017, 2016 and 2015, respectively.
Credit service charges are recognized as revenue as assessed to customers according to contract terms. The costs associated with credit approval, account servicing and collections are included in selling, general and administrative expenses.
Cost of Goods Sold:
Our cost of goods sold includes the direct costs of products sold, warehouse handling and transportation costs.
Selling, General and Administrative Expenses:
Our selling, general and administrative ("SG&A") expenses are comprised of advertising, selling, occupancy, delivery and administrative costs as well as certain warehouse expenses. The costs associated with our purchasing, warehousing, delivery and other distribution costs included in SG&A expense were approximately $77,368,000, $77,266,000 and $73,803,000 in 2017, 2016 and 2015, respectively.
Leases:
In the case of certain leased stores, we may be extensively involved in the construction or major structural modifications of the leased properties. As a result of this involvement, we are deemed the "owner" for accounting purposes during the construction period, and are required to capitalize the total fair market value of the portion of the leased property we use, excluding land, on our consolidated balance sheet. Following construction completion, we perform an analysis under ASC 840, "
Leases
," to determine if we can apply sale-leaseback accounting. We have determined that each of the leases remaining on our consolidated balance sheet did not qualify for such accounting treatment. In conjunction with these leases, we also record financing obligations equal to the landlord reimbursements and fair market value of the assets. We do not report rent expense for the properties which are owned for accounting purposes. Rather, rental payments under the lease are recognized as a reduction of the financing obligation and interest expense. Depreciation expense is also recognized on the leased asset.
Deferred Escalating Minimum Rent and Lease Incentives:
Certain of our operating leases contain predetermined fixed escalations of the minimum rentals during the term of the lease. For these leases, we recognize the related rental expense on a straight-line basis over the life of the lease, beginning with the point at which we obtain control and possession of the leased properties, and record the difference between the amounts charged to operations and amounts paid as accrued liabilities. The liability for deferred escalating minimum rent approximated $8,565,000 and $8,797,000 at December 31, 2017 and 2016, respectively. Any operating lease incentives we receive are deferred and subsequently amortized on a straight-line basis over the life of the lease as a reduction of rent expense. The liability for lease incentives approximated $1,139,000 and $676,000 at December 31, 2017 and 2016, respectively.
Advertising Expense:
Advertising costs, which include television, radio, newspaper, digital, and other media advertising, are expensed upon first showing. The total amount of prepaid advertising costs included in other current assets was approximately $602,000 and $324,000 at December 31, 2017 and 2016, respectively. We incurred approximately $47,921,000, $45,132,000 and $45,784,000 in advertising expense during 2017, 2016 and 2015, respectively.
F-8
Interest Expense, net:
Interest expense is comprised of amounts incurred related to our debt and lease obligations recorded on our balance sheet, net of interest income. The total amount of interest expense was approximately $2,512,000, $2,568,000 and $2,615,000 during 2017, 2016 and 2015, respectively.
Other Income, net:
Other income, net includes any gains or losses on sales of property and equipment and miscellaneous income or expense items outside of core operations. We had a store receive significant damage on December 27, 2015 from a blizzard. We reduced the value of the property and its contents at December 31, 2015 to zero and recorded an insurance recovery receivable. During 2016, we recorded $2,228,000 in gains for the insurance recovery on the building and $1,110,000 for inventory, business interruption and other expenses. We received additional amounts in 2017 for the remaining full replacement value of the building as construction was completed and recognized a gain of $1,351,000. During 2017 we also recorded $1,500,000 in gains from insured losses related to a store damaged by a faulty underground sprinkler line and losses from Hurricane Irma. The sale of former retail locations also generated gains of $525,000 in 2017 and $700,000 in 2016. Other income, net for the year ended December 31, 2015 includes proceeds received of $800,000 for the settlement related to credit card litigation.
Self-Insurance:
We are self-insured, for amounts up to a deductible per occurrence, for losses related to general liability, workers' compensation and vehicle claims. We are primarily self-insured for employee group health care claims. We have purchased insurance coverage in order to establish certain limits to our exposure on a per claim basis. We maintain an accrual for these costs based on claims filed and an estimate of claims incurred but not reported or paid, based on historical data and actuarial estimates. The current portion of these self-insurance reserves is included in accrued liabilities and the non-current portion is included in other liabilities. These reserves totaled $8,975,000 and $9,095,000 at December 31, 2017 and 2016, respectively.
Fair Values of Financial Instruments:
The fair values of our cash and cash equivalents, restricted cash and cash equivalents, accounts receivable, accounts payable and customer deposits approximate their carrying amounts due to their short-term nature. The assets that are related to our self-directed, non-qualified deferred compensation plans for certain executives and employees are valued using quoted market prices, a Level 1 valuation technique. The assets totaled approximately $5,986,000 and $4,410,000 at December 31, 2017 and 2016, respectively, and are included in other assets. The related liability of the same amount is included in other liabilities.
Impairment of Long-Lived Assets:
We review long-lived assets for impairment when circumstances indicate the carrying amount of an asset may not be recoverable. If an indicator of impairment is identified, we evaluate the long-lived assets at the individual property or store level, which is the lowest level at which individual cash flows can be identified. When evaluating these assets for potential impairment, we first compare the carrying amount of the asset to the store's estimated future cash flows (undiscounted and without interest charges). If the estimated future cash flows are less than the carrying amount of the asset, an impairment loss calculation is prepared. The impairment loss calculation compares the carrying amount of the asset to the store's assets' estimated fair value, which is determined on the basis of fair value for similar assets or future cash flows (discounted and with interest charges). If required, an impairment loss is recorded in SG&A expense for the difference in the asset's carrying value and the asset's estimated fair value. No such losses were recorded in 2017, 2016 or 2015.
F-9
Earnings Per Share:
We report our earnings per share using the two class method. The income per share for each class of common stock is calculated assuming 100% of our earnings are distributed as dividends to each class of common stock based on their contractual rights. See Note 13 for the computational components of basic and diluted earnings per share.
Accumulated Other Comprehensive Income (Loss):
Accumulated other comprehensive income (loss) ("AOCI"), net of income taxes, was comprised of unrecognized retirement liabilities totaling approximately $2,144,000 and $1,830,000 at December 31, 2017 and 2016, respectively. See Note 11 for the amounts reclassified out of AOCI to SG&A expense related to our supplemental executive retirement plan.
Recently Issued and Adopted Accounting Pronouncement:
Changes to GAAP are established by the Financial Accounting Standards Board (FASB) in the form of accounting standards updates (ASU's) to the FASB's Accounting Standards Codification (ASC). We considered the applicability and impact of all ASU's. ASU's not listed below were assessed and determined to be either not applicable or are expected to have minimal impact on our consolidated financial position or results of operations.
Share-based Payments.
In March 2016, the FASB issued ASU 2016-09 a new standard that changes the accounting for certain aspects of share-based payments to employees. The new guidance requires excess tax benefits and tax deficiencies to be recorded in the income statement when the awards vest or are settled. In addition, cash flows related to excess tax benefits will no longer be separately classified as a financing activity apart from the other income tax cash flows. The standard also allows the Company to repurchase more of an employee's shares for tax withholding purposes without triggering liability accounting, clarifies that all cash payments made on an employee's behalf for withheld shares should be presented as a financing activity on our cash flow statements, and provides an accounting policy election to account for forfeitures as they occur. We adopted ASU 2016-09 on January 1, 2017 and applied it prospectively or retrospectively, depending on the area covered by this standard. Excess tax (costs) benefits of ($121,000) in 2016 and $253,000 in 2015 were recorded to additional paid-in capital that would have increased income tax expense in 2016 and reduced income tax expense in 2015, if this new guidance had been adopted as of the respective dates. We chose to adopt the provisions related to the cash flow presentation of excess benefits prospectively and prior periods have not been adjusted. We have elected to recognize forfeitures as they occur. The new standard did not have a significant impact on our financial statements except as described above.
Revenue Recognition.
In May 2014, the FASB issued ASU 2014-09, which supersedes previous revenue recognition guidance. The new standard requires that a company recognize revenue when it transfers promised goods or services to customers in an amount that reflects the consideration the company expects to receive in exchange for those goods or services. Additional disclosures will be required to help users of financial statements understand the nature, amount and timing of revenue and cash flows arising from contracts.
The FASB has issued several amendments to the revenue standard, including clarification on accounting for principal versus agent considerations (i.e., reporting gross versus net). These amendments do not change the core principle of the standard, but provide clarity and implementation guidance.
This standard is effective for Havertys beginning January 1, 2018 and will not have a material effect on Havertys' financial condition, results of operations or liquidity. We sell home furnishings and recognize revenue at delivery and this will not change under the new standard. We have substantially completed our comprehensive implementation plan, including the implementation of new controls and processes designed to comply with ASU 2014-09. We will use the modified retrospective (or cumulative-effect) adoption method. We will recognize an inventory asset related to product returns and a related liability for returns and allowances and adjust our existing reserve and deferred income tax assets with the impact increasing retained earnings approximately $130,000.
F-10
Leases.
In February 2016, the FASB issued ASU 2016-02 which amends various aspects of existing guidance for leases. ASU 2016-02 requires an entity to recognize assets and liabilities arising from a lease for both financing and operating leases, along with additional qualitative and quantitative disclosures. The main difference between previous U.S. GAAP and the amended standard is the recognition of lease assets and lease liabilities by lessees on the balance sheet for those leases classified as operating leases under previous U.S. GAAP. As a result, we will have to recognize a liability representing our lease payments and a right-of-use asset representing our right to use the underlying asset for the lease term on the balance sheet. ASU 2016-02 is effective for Havertys beginning with the first quarter 2019 and we expect to adopt using the modified retrospective method. We are assessing the changes to processes and internal controls to meet the standard's reporting and disclosure requirements. For example, software has been evaluated that will assist in recognition of additional assets and liabilities to be included on the balance sheet related to operating leases with durations greater than twelve months, with certain allowable exceptions. We continue to evaluate the expected financial impact of this standard on our consolidated financial position and results of operations.
Segment Information
We operate within a single reportable segment. The following table presents the net sales of each major product category and service for each of the last three years:
|
Year Ended December 31,
|
||||||||||||||||||||||||
|
(In thousands)
|
2017
|
2016
|
2015
|
|||||||||||||||||||||
|
Net Sales
|
% of
Net Sales
|
Net Sales
|
% of
Net Sales
|
Net Sales
|
% of Net Sales
|
|||||||||||||||||||
|
Merchandise:
|
||||||||||||||||||||||||
|
Case Goods
|
||||||||||||||||||||||||
|
Bedroom Furniture
|
$
|
132,484
|
16.2
|
%
|
$
|
132,250
|
16.1
|
%
|
$
|
135,855
|
16.9
|
%
|
||||||||||||
|
Dining Room Furniture
|
92,921
|
11.3
|
94,918
|
11.5
|
92,966
|
11.6
|
||||||||||||||||||
|
Occasional
|
75,909
|
9.2
|
81,996
|
10.0
|
79,219
|
9.8
|
||||||||||||||||||
|
301,314
|
36.7
|
309,164
|
37.6
|
308,040
|
38.3
|
|||||||||||||||||||
|
Upholstery
|
330,340
|
40.3
|
328,903
|
40.0
|
321,484
|
39.9
|
||||||||||||||||||
|
Mattresses
|
88,311
|
10.8
|
86,659
|
10.6
|
84,897
|
10.6
|
||||||||||||||||||
|
Accessories and Other
(1)
|
99,901
|
12.2
|
96,845
|
11.8
|
90,449
|
11.2
|
||||||||||||||||||
|
$
|
819,866
|
100.0
|
%
|
$
|
821,571
|
100.0
|
%
|
$
|
804,870
|
100.0
|
%
|
|||||||||||||
(1)
Includes delivery charges and product protection.
F-11
Amounts financed under our in-house credit programs, as a percent of net sales including sales tax, were approximately 0.6% in 2017, 1.0% in 2016 and 1.4% in 2015. The credit program selected most often by our customers is "12 months no interest with equal monthly payments." The terms of the other programs vary as to payment terms (30 days to three years) and interest rates (0% to 21%). The receivables are collateralized by the merchandise sold.
Accounts receivable balances resulting from certain credit promotions have scheduled payment amounts which extend beyond one year. These receivable balances have been historically collected earlier than the scheduled dates. The amounts due per the scheduled payment dates approximate as follows: $2,604,000 in 2018, $273,000 in 2019, $39,000 in 2020 and $16,000 in 2021 for receivables outstanding at December 31, 2017.
Accounts receivable are shown net of the allowance for doubtful accounts of approximately $270,000 and $360,000 at December 31, 2017 and 2016, respectively. We provide an allowance utilizing a methodology which considers the balances in problem and delinquent categories of accounts, historical write-offs, existing economic conditions and management judgment. We assess the adequacy of the allowance account at the end of each quarter. Interest assessments are continued on past-due accounts but no "interest on interest" is recorded. Delinquent accounts are generally written off automatically after the passage of nine months without receiving a full scheduled monthly payment. Accounts are written off sooner in the event of a discharged bankruptcy or other circumstances that make further collections unlikely.
We believe that the carrying value of existing customer receivables, net of allowances, approximates fair value because of their short average maturity. Concentrations of credit risk with respect to customer receivables are limited due to the large number of customers comprising our account base and their dispersion across 16 states.
Inventories are measured using the last-in, first-out (LIFO) method of valuation because it results in a better matching of current costs and revenues. The excess of current costs over our carrying value of inventories was approximately $19,177,000 and $17,946,000 at December 31, 2017 and 2016, respectively. The use of the LIFO valuation method as compared to the FIFO method had a negative impact on our cost of goods sold of approximately $1,231,000 in 2017 and $438,000 in 2015 and a positive impact of approximately $1,448,000 in 2016. During 2016, inventory quantities declined resulting in liquidations of LIFO inventory layers. The effect of the liquidations (included in the preceding LIFO impact amounts) decreased cost of goods sold by an immaterial amount. We believe this information is meaningful to the users of these consolidated financial statements for analyzing the effects of price changes, for better understanding our financial position and for comparing such effects with other companies.
F-12
Property and equipment are summarized as follows:
|
(In thousands)
|
2017
|
2016
|
||||||
|
Land and improvements
|
$
|
47,804
|
$
|
48,264
|
||||
|
Buildings and improvements
|
279,209
|
270,156
|
||||||
|
Furniture and fixtures
|
103,695
|
115,263
|
||||||
|
Equipment
|
48,745
|
47,222
|
||||||
|
Buildings under lease
|
56,902
|
55,894
|
||||||
|
Construction in progress
|
7,124
|
3,876
|
||||||
|
543,479
|
540,675
|
|||||||
|
Less accumulated depreciation
|
(295,491
|
)
|
(292,003
|
)
|
||||
|
Less accumulated lease amortization
|
(18,773
|
)
|
(15,005
|
)
|
||||
|
Property and equipment, net
|
$
|
229,215
|
$
|
233,667
|
||||
In March 2016 we entered into the First Amendment to Amended and Restated Credit Agreement (the "Credit Agreement") with a bank. The Credit Agreement amends our revolving credit facility to increase the aggregate commitments from $50.0 million to $60.0 million, extend the maturity date to March 31, 2021 from September 1, 2016, lower the commitment fees on unused amounts, reduce the applicable margin for interest rates on borrowings, modify the borrowing base calculation, and change the collateral reporting requirements. We have not had any borrowings under the revolving credit facility since its origination in 2008.
The $60.0 million revolving credit facility is secured by inventory, accounts receivable, cash and certain other personal property. Our Credit Agreement includes negative covenants that limit our ability to, among other things (a) incur, assume or permit to exist additional indebtedness or guarantees; (b) incur liens and engage in sale leaseback transactions or real estate sales in excess of $100.0 million; (c) pay dividends or redeem or repurchase capital stock; (d) engage in certain transactions with affiliates; and (e) alter the business that the Company conducts.
Availability fluctuates under a borrowing base calculation and is reduced by outstanding letters of credit. The borrowing base was $53.4 million and there were no outstanding letters of credit at December 31, 2017. Amounts available are based on the lesser of the borrowing base or the $60.0 million line amount and reduced by $6.0 million since a fixed charge coverage ratio test was not met for the immediately preceding twelve months, resulting in a net availability of $47.4 million. There were no borrowed amounts outstanding under the Credit Agreement at December 31, 2017.
F-13
Accrued liabilities and other liabilities consist of the following:
|
(In thousands)
|
2017
|
2016
|
||||||
|
Accrued liabilities:
|
||||||||
|
Employee compensation, related taxes and benefits
|
$
|
13,527
|
$
|
15,024
|
||||
|
Taxes other than income and withholding
|
8,677
|
10,856
|
||||||
|
Self-insurance reserves
|
5,962
|
5,945
|
||||||
|
Other
|
9,416
|
10,079
|
||||||
|
$
|
37,582
|
$
|
41,904
|
|||||
|
Other liabilities:
|
||||||||
|
Straight-line lease liability
|
$
|
8,565
|
$
|
8,797
|
||||
|
Self-insurance reserves
|
3,013
|
3,150
|
||||||
|
Other
|
15,122
|
12,724
|
||||||
|
$
|
26,700
|
$
|
24,671
|
|||||
On December 22, 2017, the President signed into Public Law No. 115-97, commonly referred to as the Tax Cuts and Jobs Act (the "Tax Act"). The Tax Act contains significant changes to corporate taxes, including a permanent reduction of the corporate tax rate from 35% to 21% effective January 1, 2018. The Tax Act's other major changes applicable to Havertys include the elimination of certain deductions and an enhanced and extended option to claim accelerated depreciation deductions on qualified property.
In December 2017, the Securities and Exchange Commission (SEC) staff issued Staff Accounting Bulletin No. 118,
Income Tax Accounting Implications of the Tax Cuts and Jobs Act
(SAB 118), which allows us to record provisional amounts during a measurement period not to extend beyond one year of the enactment date.
We remeasured certain deferred tax assets and liabilities based on the rates at which they are expected to reverse in the future, which is generally 25%. However, we are still analyzing certain aspects of the Tax Act and refining our calculations, which could potentially affect the measurement of some of these balances or potentially give rise to new deferred tax amounts. At December 31, 2017, we have made a reasonable estimate of the effects on our existing deferred tax balances. The provisional amount recorded related to the remeasurement of our deferred tax balance was an additional expense of $10,639,000. As we complete our analysis of the Tax Act, collect and prepare necessary data, and interpret any additional guidance issued by the IRS and other standard-setting bodies, we may make adjustments to the provisional amounts. We recognized a tax benefit of $4,771,000 for the remeasurement of deferred tax assets and liabilities for which our accounting is complete.
F-14
Income tax expense (benefit) consists of the following:
|
(In thousands)
|
2017
|
2016
|
2015
|
|||||||||
|
Current
|
||||||||||||
|
Federal
|
$
|
14,239
|
$
|
16,259
|
$
|
17,598
|
||||||
|
State
|
2,350
|
2,326
|
2,907
|
|||||||||
|
16,589
|
18,585
|
20,505
|
||||||||||
|
Deferred
|
||||||||||||
|
Federal
|
5,829
|
(690
|
)
|
(2,476
|
)
|
|||||||
|
State
|
(270
|
)
|
(430
|
)
|
(543
|
)
|
||||||
|
5,559
|
(1,120
|
)
|
(3,019
|
)
|
||||||||
|
$
|
22,148
|
$
|
17,465
|
$
|
17,486
|
|||||||
The differences between income tax expense in the accompanying Consolidated Financial Statements and the amount computed by applying the statutory Federal income tax rate are as follows:
|
(In thousands)
|
2017
|
2016
|
2015
|
|||||||||
|
Statutory rates applied to income before income taxes
|
$
|
15,129
|
$
|
16,037
|
$
|
15,846
|
||||||
|
State income taxes, net of Federal tax benefit
|
1,306
|
1,494
|
1,487
|
|||||||||
|
Net permanent differences
|
95
|
99
|
(11
|
)
|
||||||||
|
Other
|
(250
|
)
|
(165
|
)
|
164
|
|||||||
|
Tax Act, net impact
|
5,868
|
—
|
—
|
|||||||||
|
$
|
22,148
|
$
|
17,465
|
$
|
17,486
|
|||||||
Deferred income taxes reflect the net tax effects of temporary differences between the carrying amounts of assets and liabilities for financial reporting purposes and the amounts used for income tax purposes. The amounts in the following table are grouped based on broad categories of items that generate the deferred tax assets and liabilities.
|
(In thousands)
|
2017
|
2016
|
||||||
|
Deferred tax assets:
|
||||||||
|
Accounts receivable
|
$
|
433
|
$
|
808
|
||||
|
Property and equipment
|
6,434
|
10,276
|
||||||
|
Leases
|
4,356
|
5,913
|
||||||
|
Accrued liabilities
|
8,171
|
12,217
|
||||||
|
Retirement benefits
|
492
|
513
|
||||||
|
Other
|
62
|
69
|
||||||
|
Total deferred tax assets
|
19,948
|
29,796
|
||||||
|
Deferred tax liabilities:
|
||||||||
|
Inventory
|
7,034
|
10,082
|
||||||
|
Other
|
539
|
1,338
|
||||||
|
Total deferred tax liabilities
|
7,573
|
11,420
|
||||||
|
Net deferred tax assets
|
$
|
12,375
|
$
|
18,376
|
||||
F-15
We review our deferred tax assets to determine the need for a valuation allowance. Based on evidence we conclude that it is more-likely-than-not that our deferred tax assets will be realized and therefore a valuation allowance is not required.
We file income tax returns in the U.S. federal jurisdiction and various state and local jurisdictions. With respect to U.S. federal, state and local jurisdictions, with limited exceptions, we are no longer subject to income tax audits for years before 2014.
Uncertain Tax Positions
No uncertain tax positions were identified for the years currently open under statute of limitations. Interest and penalties associated with uncertain tax positions, if any, are recognized as components of income tax expense.
Long-term debt and lease obligations are summarized as follows:
|
(In thousands)
|
2017
|
2016
|
||||||
|
Revolving credit notes
(a)
|
$
|
—
|
$
|
—
|
||||
|
Lease obligations
(b)
|
54,591
|
55,474
|
||||||
|
54,591
|
55,474
|
|||||||
|
Less portion classified as current
|
(3,788
|
)
|
(3,461
|
)
|
||||
|
$
|
50,803
|
$
|
52,013
|
|||||
(a) We have a revolving credit agreement as described in Note 5.
(b) These obligations are related to properties under lease with aggregate net book values of approximately $38,129,000 and $40,889,000 at December 31, 2017 and 2016, respectively.
The approximate aggregate maturities of these lease obligations during the five years subsequent to December 31, 2017 and thereafter are as follows: 2018 - $3,788,000; 2019 - $4,018,000,
2020 - $4,222,000; 2021 - $3,672,000; 2022 - $3,776,000 and $35,115,000 thereafter. These maturities are net of imputed interest of approximately $15,294,000 at December 31, 2017.
Common Stock has a preferential dividend rate of at least 105% of the dividend paid on Class A Common Stock. Class A Common Stock has greater voting rights which include: voting as a separate class for the election of 75% of the total number of directors and on all other matters subject to shareholder vote, each share of Class A Common Stock has ten votes and votes with the Common Stock as a single class. Class A Common Stock is convertible at the holder's option at any time into Common Stock on a 1-for-1 basis; Common Stock is not convertible into Class A Common Stock.
A special cash dividend of $1.00 for Common Stock and $0.95 for Class A Common Stock was paid in the fourth quarter of 2016. Aggregate dividends paid on Common Stock was $10,473,000, $27,674,000 and $7,358,000 in 2017, 2016 and 2015, respectively. Aggregate dividends paid on Class A Common Stock was $919,000, $2,735,000 and $702,000 in 2017, 2016 and 2015, respectively.
We have a non-qualified, non-contributory supplemental executive retirement plan (the "SERP") for employees whose retirement benefits are reduced due to their annual compensation levels. The SERP provides annual benefits amounting to 55% of final average earnings less benefits payable from Social Security benefits and our former pension plan which was settled in 2014. The SERP limits the total amount of annual retirement benefits that may be paid to a participant from all sources (former pension plan, Social Security and the SERP) to $125,000. The SERP is not funded so we pay benefits directly to participants. The SERP was frozen as of December 31, 2015 and no additional benefits were accrued after that date.
F-16
The following table summarizes information about our SERP.
|
(In thousands)
|
2017
|
2016
|
||||||
|
Change in benefit obligation:
|
||||||||
|
Benefit obligation at beginning of the year
|
$
|
7,674
|
$
|
7,719
|
||||
|
Interest cost
|
321
|
341
|
||||||
|
Actuarial losses (gains)
|
509
|
(72
|
)
|
|||||
|
Benefits paid
|
(305
|
)
|
(314
|
)
|
||||
|
Benefit obligation at end of year
|
8,199
|
7,674
|
||||||
|
Change in plan assets:
|
||||||||
|
Employer contribution
|
305
|
314
|
||||||
|
Benefits paid
|
(305
|
)
|
(314
|
)
|
||||
|
Fair value of plan assets at end of year
|
—
|
—
|
||||||
|
Funded status of the plan – (underfunded)
|
$
|
(8,199
|
)
|
$
|
(7,674
|
)
|
||
|
Accumulated benefit obligations
|
$
|
8,199
|
$
|
7,674
|
||||
Amounts recognized in the consolidated balance sheets consist of:
|
(In thousands)
|
2017
|
2016
|
||||||
|
Current liabilities
|
$
|
(365
|
)
|
$
|
(369
|
)
|
||
|
Noncurrent liabilities
|
(7,834
|
)
|
(7,305
|
)
|
||||
|
$
|
(8,199
|
)
|
$
|
(7,674
|
)
|
|||
The net actuarial loss recognized in accumulated other comprehensive income (loss) before the effect of income taxes was $1,968,000 in 2017 and $1,550,000 in 2016.
Net pension cost included the following components:
|
SERP
|
||||||||||||
|
(In thousands)
|
2017
|
2016
|
2015
|
|||||||||
|
Service cost-benefits earned during the period
|
$
|
—
|
$
|
—
|
$
|
129
|
||||||
|
Interest cost on projected benefit obligation
|
321
|
341
|
314
|
|||||||||
|
Amortization of prior service cost
|
—
|
—
|
210
|
|||||||||
|
Amortization of actuarial loss
|
90
|
102
|
169
|
|||||||||
|
Curtailment loss recognized
|
—
|
—
|
222
|
|||||||||
|
Net pension costs
|
$
|
411
|
$
|
443
|
$
|
1,044
|
||||||
The net periodic benefit cost for the SERP for the year ended December 31, 2015, includes the impact of freezing the plan as of December 31, 2015, which resulted in fully recognizing the outstanding prior service cost basis at that date. The estimated amount that will be amortized from accumulated other comprehensive loss into net periodic cost in 2018 is approximately $143,000 for the SERP.
F-17
Assumptions
We use a measurement date of December 31 for our SERP plan. Assumptions used to determine net periodic benefit cost for years ended December 31 are as follows:
|
SERP
|
||||||||||||
|
2017
|
2016
|
2015
|
||||||||||
|
Discount rate
|
4.30
|
%
|
4.58
|
%
|
4.09
|
%
|
||||||
|
Rate of compensation increase
|
n/a
|
n/a
|
3.50
|
%
|
||||||||
Assumptions used to determine benefit obligations at December 31 for the SERP are as follows:
|
2017
|
2016
|
|||||||
|
Discount rate
|
3.68
|
%
|
4.30
|
%
|
||||
|
Rate of compensation increase
|
n/a
|
n/a
|
||||||
Cash Flows
The following schedule outlines the expected benefit payments related to the SERP in future years. These expected benefits were estimated based on the same actuarial assumptions used to determine benefit obligations at December 31, 2017.
|
(In thousands)
|
2018
|
2019
|
2020
|
2021
|
2022
|
2023-2027
|
||||||||||||||||||
|
Benefit Payments
|
$
|
365
|
$
|
376
|
$
|
404
|
$
|
431
|
$
|
431
|
$
|
2,437
|
||||||||||||
Other Plans
We have an employee savings/retirement (401(k)) plan to which substantially all our employees may contribute. We match employee contributions 100% of the first 1% of eligible pay and 50% of the next 5% contributed by participants. We expensed matching employer contributions of approximately $3,932,000, $3,884,000 and $3,661,000 in 2017, 2016 and 2015, respectively.
We offer no post-retirement benefits other than the plans discussed above and no significant post-employment benefits.
The following summarizes the changes in the balance and the reclassifications out of accumulated other comprehensive income (loss) on our Consolidated Balance Sheets to the Consolidated Statements of Comprehensive Income (amounts in thousands):
|
Year Ended December 31,
|
||||||||||||
|
2017
|
2016
|
2015
|
||||||||||
|
Beginning balance
|
$
|
(1,830
|
)
|
$
|
(1,938
|
)
|
$
|
(2,168
|
)
|
|||
|
Other comprehensive income (loss)
|
||||||||||||
|
Defined benefit pension plan:
|
||||||||||||
|
Net loss (gain) during year
|
(509
|
)
|
72
|
(230
|
)
|
|||||||
|
Amortization of prior service cost
(1)
|
—
|
—
|
432
|
|||||||||
|
Amortization of net loss
(1)
|
90
|
102
|
169
|
|||||||||
|
(419
|
)
|
174
|
371
|
|||||||||
|
Tax expense (benefit)
|
(105
|
)
|
66
|
141
|
||||||||
|
Total other comprehensive income (loss)
|
(314
|
)
|
108
|
230
|
||||||||
|
Ending balance
|
$
|
(2,144
|
)
|
$
|
(1,830
|
)
|
$
|
(1,938
|
)
|
|||
F-18
| (1) |
These amounts are included in the computation of net periodic pension costs and were reclassified to selling, general and administrative costs. For 2015, this includes $222,000 in curtailment loss on the SERP.
|
We have issued and outstanding awards for Common Stock under two employee compensation plans, the 2014 Long Term Incentive Plan (the "2014 LTIP Plan") and the 2004 Long Term Incentive Plan (the "2004 LTIP Plan"). No new awards may be granted under the 2004 LTIP Plan. As of December 31, 2017, approximately 842,000 shares were available for awards and options under the 2014 LTIP Plan.
The following table summarizes our equity award activity during the years ended December 31, 2017, 2016 and 2015:
|
Restricted Stock Award
|
Stock-Settled
Appreciation Rights
|
|||||||||||||||
|
|
Shares or
Units
|
Weighted-Average
Award Price
|
Rights
|
Weighted-Average
Award Price
|
||||||||||||
|
Outstanding at December 31, 2014
|
321,322
|
$
|
20.49
|
129,975
|
$
|
16.04
|
||||||||||
|
Granted
|
176,135
|
23.97
|
—
|
|||||||||||||
|
Restrictions lapsed or exercised
(1)
|
(147,595
|
)
|
18.94
|
(29,100
|
)
|
8.74
|
||||||||||
|
Forfeited or expired
|
(5,372
|
)
|
24.84
|
—
|
||||||||||||
|
Outstanding at December 31, 2015
|
344,490
|
$
|
22.87
|
100,875
|
$
|
18.14
|
||||||||||
|
Granted
|
209,394
|
18.80
|
—
|
|||||||||||||
|
Restrictions lapsed or exercised
|
(140,864
|
)
|
20.55
|
—
|
||||||||||||
|
Forfeited or expired
|
(15,700
|
)
|
20.45
|
—
|
||||||||||||
|
Outstanding at December 31, 2016
|
397,320
|
$
|
21.64
|
100,875
|
$
|
18.14
|
||||||||||
|
Granted
|
199,382
|
22.00
|
—
|
|||||||||||||
|
Restrictions lapsed or exercised
(1)
|
(157,406
|
)
|
22.02
|
(43,875
|
)
|
18.14
|
||||||||||
|
Forfeited or expired
|
(5,032
|
)
|
20.09
|
—
|
||||||||||||
|
Outstanding at December 31, 2017
|
434,264
|
$
|
21.69
|
57,000
|
$
|
18.14
|
||||||||||
|
Exercisable at December 31, 2017
|
57,000
|
$
|
18.14
|
|||||||||||||
|
Restricted units expected to vest
|
417,590
|
$
|
21.71
|
|||||||||||||
|
Exercisable at December 31, 2016
|
74,875
|
$
|
18.14
|
|||||||||||||
|
Exercisable at December 31, 2015
|
48,875
|
$
|
18.14
|
|||||||||||||
|
(1)
|
The total intrinsic value of stock-settled appreciation rights exercised was approximately $457,000 in 2015 and $284,000 in 2017.
|
The fair value for stock-settled appreciation rights were estimated at the date of grant using a Black‑Scholes pricing model. The aggregate intrinsic value of vested and outstanding stock-settled appreciation rights at December 31, 2017 was approximately $257,000.
The total fair value of restricted common stock shares that vested in 2017, 2016 and 2015 was approximately $3,972,000, $2,577,000 and $3,097,000, respectively. The aggregate intrinsic value of outstanding restricted stock awards was $9,836,000 at December 31, 2017.
Grants of restricted common stock, restricted units, performance units and stock-settled appreciation rights have been made to certain officers and key employees under the 2004 and the 2014 LTIP Plan. The restrictions on the restricted units generally lapse or vest annually, primarily over four year periods. The performance units are based on one-year performance periods but cliff vest in three years from grant date. The compensation for all awards is being charged to selling, general and administrative expense over the respective grants' vesting periods, primarily on a straight-line basis, and was approximately $3,818,000, $3,872,000 and $4,033,000 in 2017, 2016 and 2015, respectively. The tax benefit recognized related to all awards was approximately $1,451,000, $1,471,000 and $1,533,000 in 2017, 2016 and 2015, respectively. As of December 31, 2017, the total compensation cost related to unvested equity awards was approximately $4,486,000 and is expected to be recognized over a weighted-average period of 2.3 years.
F-19
The following is a reconciliation of the income (loss) and number of shares used in calculating the diluted earnings per share for Common Stock and Class A Common Stock (amounts in thousands except per share data):
|
Numerator:
|
2017
|
2016
|
2015
|
|||||||||
|
Common:
|
||||||||||||
|
Distributed earnings
|
$
|
10,473
|
$
|
27,674
|
$
|
7,358
|
||||||
|
Undistributed earnings
|
8,896
|
(1,869
|
)
|
17,995
|
||||||||
|
Basic
|
19,369
|
25,805
|
25,353
|
|||||||||
|
Class A Common earnings
|
1,706
|
2,551
|
2,436
|
|||||||||
|
Diluted
|
$
|
21,075
|
$
|
28,356
|
$
|
27,789
|
||||||
|
Class A Common:
|
||||||||||||
|
Distributed earnings
|
$
|
919
|
$
|
2,735
|
$
|
702
|
||||||
|
Undistributed earnings
|
787
|
(184
|
)
|
1,734
|
||||||||
|
$
|
1,706
|
$
|
2,551
|
$
|
2,436
|
|||||||
|
Denominator:
|
2017
|
2016
|
2015
|
|||||||||
|
Common:
|
||||||||||||
|
Weighted average shares outstanding - basic
|
19,381
|
19,492
|
20,430
|
|||||||||
|
Assumed conversion of Class A Common Stock
|
1,801
|
2,014
|
2,067
|
|||||||||
|
Dilutive options, awards and common stock equivalents
|
417
|
341
|
301
|
|||||||||
|
Total weighted average diluted Common Stock
|
21,599
|
21,847
|
22,798
|
|||||||||
|
Class A Common:
|
||||||||||||
|
Weighted average shares outstanding
|
1,801
|
2,014
|
2,067
|
|||||||||
|
Basic net earnings per share
|
||||||||||||
|
Common Stock
|
$
|
1.00
|
$
|
1.32
|
$
|
1.24
|
||||||
|
Class A Common Stock
|
$
|
0.95
|
$
|
1.27
|
$
|
1.18
|
||||||
|
Diluted net earnings per share
|
||||||||||||
|
Common Stock
|
$
|
0.98
|
$
|
1.30
|
$
|
1.22
|
||||||
|
Class A Common Stock
|
$
|
0.94
|
$
|
1.27
|
$
|
1.17
|
||||||
F-20
We lease certain property and equipment under operating leases. Initial lease terms range from 5 years to 30 years and certain leases contain renewal options ranging from one to 25 years or provide for options to purchase the related property at fair market value or at predetermined purchase prices. The leases generally require us to pay all maintenance, property taxes and insurance costs.
The following schedule outlines the future minimum lease payments and rentals under operating leases:
|
(In thousands)
|
Operating Leases
|
|||
|
2018
|
$
|
31,643
|
||
|
2019
|
28,862
|
|||
|
2020
|
26,264
|
|||
|
2021
|
21,074
|
|||
|
2022
|
14,428
|
|||
|
Subsequent to 2022
|
31,203
|
|||
|
Total minimum lease payments
|
$
|
153,474
|
||
Step rent and other lease concessions (free rent periods) are taken into account in computing lease expense on a straight-line basis. Landlord allowances for capital improvements have not been significant, but are recorded as a reduction of expense over the term of the lease. Net rental expense applicable to operating leases consisted of the following for the years ended December 31:
|
(In thousands)
|
2017
|
2016
|
2015
|
|||||||||
|
Property
|
||||||||||||
|
Minimum
|
$
|
27,543
|
$
|
26,594
|
$
|
27,211
|
||||||
|
Additional rentals based on sales
|
21
|
4
|
27
|
|||||||||
|
Sublease income
|
(90
|
)
|
(58
|
)
|
(206
|
)
|
||||||
|
27,474
|
26,540
|
27,032
|
||||||||||
|
Equipment
|
3,084
|
3,031
|
2,943
|
|||||||||
|
$
|
30,558
|
$
|
29,571
|
$
|
29,975
|
|||||||
|
(In thousands)
|
2017
|
2016
|
2015
|
|||||||||
|
Cash paid for income taxes
|
18,763
|
$
|
26,574
|
$
|
13,509
|
|||||||
|
Income tax refunds received
|
9
|
100
|
5
|
|||||||||
|
Cash paid for interest
|
2,486
|
2,540
|
2,583
|
|||||||||
|
Noncash financing and investing activity:
|
||||||||||||
|
Fixed assets acquired (adjusted) related to capital lease and financing obligations
|
1,009
|
3,890
|
3,176
|
|||||||||
|
Increase in financing obligations
|
2,598
|
5,474
|
6,594
|
|||||||||
F-21
The following is a summary of the unaudited quarterly results of operations for the years ended December 31, 2017 and 2016 (in thousands, except per share data):
|
2017 Quarter Ended
|
||||||||||||||||
|
March 31
|
June 30
|
September 30
|
December 31
|
|||||||||||||
|
Net sales
|
$
|
200,427
|
$
|
196,829
|
$
|
207,647
|
$
|
214,962
|
||||||||
|
Gross profit
|
109,596
|
107,119
|
112,015
|
116,193
|
||||||||||||
|
Credit service charges
|
45
|
42
|
38
|
35
|
||||||||||||
|
Income before taxes
|
9,740
|
9,694
|
9,719
|
14,070
|
||||||||||||
|
Net income
|
5,986
|
6,185
|
5,983
|
2,921
|
||||||||||||
|
Basic net earnings per share:
|
||||||||||||||||
|
Common
|
0.28
|
0.29
|
0.28
|
0.14
|
||||||||||||
|
Class A Common
|
0.27
|
0.28
|
0.27
|
0.13
|
||||||||||||
|
Diluted net earnings per share:
|
||||||||||||||||
|
Common
|
0.28
|
0.29
|
0.28
|
0.13
|
||||||||||||
|
Class A Common
|
0.27
|
0.27
|
0.27
|
0.13
|
||||||||||||
The fourth quarter includes $1.9 million of other income primarily from gains on insurance recoveries of $1.3 million. The fourth quarter also includes additional income tax expense of $5.9 million due to the Tax Act.
|
2016 Quarter Ended
|
||||||||||||||||
|
March 31
|
June 30
|
September 30
|
December 31
|
|||||||||||||
|
Net sales
|
$
|
194,511
|
$
|
194,774
|
$
|
211,690
|
$
|
220,595
|
||||||||
|
Gross profit
|
104,419
|
104,160
|
113,737
|
121,020
|
||||||||||||
|
Credit service charges
|
65
|
54
|
54
|
56
|
||||||||||||
|
Income before taxes
|
7,587
|
8,762
|
12,125
|
17,347
|
||||||||||||
|
Net income
|
4,669
|
5,374
|
7,336
|
10,947
|
||||||||||||
|
Basic net earnings per share:
|
||||||||||||||||
|
Common
|
0.21
|
0.25
|
0.35
|
0.52
|
||||||||||||
|
Class A Common
|
0.20
|
0.24
|
0.33
|
0.50
|
||||||||||||
|
Diluted net earnings per share:
|
||||||||||||||||
|
Common
|
0.21
|
0.24
|
0.34
|
0.51
|
||||||||||||
|
Class A Common
|
0.20
|
0.23
|
0.33
|
0.51
|
||||||||||||
Because of rounding the amounts will not necessarily add to the totals computed for the year. Also because of rounding and the use of the two class method in calculating per share data, the quarterly per share data will not necessarily add to the annual totals.
F-22
Schedule II – Valuation and Qualifying Accounts
Haverty Furniture Companies, Inc.
|
Column A
|
Column B
|
Column C
|
Column D
|
Column E
|
||||||||||||
|
(In thousands)
|
Balance at
beginning of
period
|
Additions
charged to costs
and expenses
|
Deductions
Describe (1)(2)
|
Balance at
end of period
|
||||||||||||
|
Year ended December 31, 2017:
|
||||||||||||||||
|
Allowance for doubtful accounts
|
$
|
360
|
$
|
314
|
$
|
404
|
$
|
270
|
||||||||
|
Reserve for cancelled sales and allowances
|
$
|
1,772
|
$
|
11,601
|
$
|
11,909
|
$
|
1,464
|
||||||||
|
Year ended December 31, 2016:
|
||||||||||||||||
|
Allowance for doubtful accounts
|
$
|
395
|
$
|
418
|
$
|
453
|
$
|
360
|
||||||||
|
Reserve for cancelled sales and allowances
|
$
|
1,659
|
$
|
11,402
|
$
|
11,289
|
$
|
1,772
|
||||||||
|
Year ended December 31, 2015:
|
||||||||||||||||
|
Allowance for doubtful accounts
|
$
|
350
|
$
|
269
|
$
|
224
|
$
|
395
|
||||||||
|
Reserve for cancelled sales and allowances
|
$
|
1,627
|
$
|
11,466
|
$
|
11,434
|
$
|
1,659
|
||||||||
|
(1)
|
Allowance for doubtful accounts: uncollectible accounts written off, net of recoveries.
|
|
(2)
|
Reserve for cancelled sales and allowances: impact of sales cancelled after delivery plus amount of allowance given to customers.
|
F-23
TABLE OF CONTENTS
Item 1. BusinessItem 1A. Risk FactorsItem 1B. Unresolved Staff CommentsItem 2. PropertiesItem 3. Legal ProceedingsItem 4. Mine Safety DisclosuresPart IIItem 5. Market For The Registrant's Common Equity, Related Stockholder Matters and Issuer Purchases Of Equity SecuritiesItem 6. Selected Financial DataItem 7. Management's Discussion and Analysis Of Financial Condition and Results Of OperationsItem 7A. Quantitative and Qualitative Disclosures About Market RiskItem 8. Financial Statements and Supplementary DataItem 9. Changes in and Disagreements with Accountants on Accounting and Financial DisclosureItem 9A. Controls and ProceduresItem 9B. Other InformationPart IIIItem 10. Directors, Executive Officers and Corporate GovernanceItem 11. Executive CompensationItem 12. Security Ownership Of Certain Beneficial Owners and Management and Related Stockholder MattersItem 13. Certain Relationships and Related Transactions, and Director IndependenceItem 14. Principal Accounting Fees and ServicesPart IVItem 15. Exhibits, Financial Statement SchedulesNote 1, Description Of Business and Summary Of Significant Accounting Policies:Note 2, Accounts Receivable:Note 3, Inventories :Note 3, InventoriesNote 4, Property and Equipment:Note 5, Credit Arrangement:Note 6, Accrued Liabilities and Other Liabilities:Note 7, Income Taxes:Note 8, Long-term Debt and Lease Obligations:Note 9, Stockholders' Equity:Note 10, Benefit Plans:Note 11, Accumulated Other Comprehensive Income (loss):Note 12, Stock-based Compensation Plans:Note 13, Earnings Per Share:Note 14, Commitments:Note 15, Supplemental Cash Flow Information:Note 16, Selected Quarterly Financial Data (unaudited):