HAWKINS INC
10-Ks and 10-Qs
|
|
|
|
|
|
|
|
|
|
|
|
|
|
|
|
|
|
|
|
|
|
|
|
|
|
|
|
|
|
|
|
|
|
|
|
|
|
|
|
|
|
|
|
|
|
|
|
|
|
|
|
|
|
|
|
|
|
|
UNITED STATES
SECURITIES AND EXCHANGE COMMISSION
Washington, D.C. 20549
|
Form 10-K
|
||
|
ANNUAL REPORT PURSUANT TO SECTION 13 OR 15(d) OF THE
|
||
|
SECURITIES EXCHANGE ACT OF 1934
|
||
|
For the Fiscal Year Ended April 1, 2018
|
||
|
Commission File No. 0-7647
|
||
HAWKINS, INC.
(Exact Name of Registrant as Specified in its Charter)
|
Minnesota
|
|
41-0771293
|
|
(State of Incorporation)
|
|
(I.R.S. Employer
Identification No.)
|
|
2381 Rosegate, Roseville, Minnesota
|
|
55113
|
|
(Address of Principal Executive Offices)
|
|
(Zip Code)
|
(Registrant’s Telephone Number, Including Area Code)
|
Securities registered pursuant to Section 12(b) of the Act:
|
|
Common Stock, par value $.05 per share
|
||
|
Name of exchange on which registered:
|
|
Nasdaq Stock Market LLC
|
||
|
Securities registered pursuant to Section 12(g) of the Act:
|
|
None
|
||
Indicate by check mark if the registrant is a well-known seasoned issuer, as defined in Rule 405 of the Securities Act. Yes
¨
No
þ
Indicate by check mark if the registrant is not required to file reports pursuant to Section 13 or Section 15(d) of the Act. Yes
¨
No
þ
Indicate by check mark whether the Registrant (1) has filed all reports required to be filed by Section 13 or 15(d) of the Securities Exchange Act of 1934 during the preceding twelve months (or for such shorter period that the Registrant was required to file such reports) and (2) has been subject to such filing requirements for the past 90 days. Yes
þ
No
¨
Indicate by check mark whether the registrant has submitted electronically and posted on its corporate Web site, if any, every Interactive Data File required to be submitted and posted pursuant to Rule 405 of Regulation S-T during the preceding 12 months (or for such shorter period that the Registrant was required to submit and post such files). Yes
þ
No
¨
Indicate by check mark if disclosure of delinquent filers pursuant to Item 405 of Regulation S-K is not contained herein, and will not be contained, to the best of the Registrant’s knowledge, in definitive proxy or information statements incorporated by reference in Part III of this Form 10-K or any amendment to this Form 10-K.
¨
Indicate by check mark whether the registrant is a large accelerated filer, an accelerated filer, a non-accelerated filer, or a smaller reporting company. See the definitions of “large accelerated filer,” “accelerated filer” and “smaller reporting company” in Rule 12b-2 of the Exchange Act. (Check one):
|
Large accelerated filer
|
¨
|
|
Non-accelerated filer
|
¨
|
Accelerated filer
|
þ
|
Smaller reporting company
|
o
|
||
|
Emerging growth company
|
o
|
|||||||||
If an emerging growth company, indicate by check mark if the registrant has elected not to use the extended transition period for complying with any new or revised financial accounting standards provided pursuant to Section 13(a) of the Exchange Act.
¨
Indicate by check mark whether the registrant is a shell company (as defined in Rule 12b-2 of the Exchange Act). Yes
¨
No
þ
The aggregate market value of voting stock held by non-affiliates of the Registrant on
October 1, 2017
(the last business day of the Registrant’s most recently completed second fiscal quarter) was approximately
$391.3 million
based upon the closing sale price for the Registrant’s common stock on that date as reported by The Nasdaq Stock Market LLC, excluding all shares held by officers and directors of the Registrant and by the Trustees of the Registrant’s Employee Stock Ownership Plan and Trust.
As of
May 25, 2018
, the Registrant had
10,683,514
shares of common stock outstanding.
DOCUMENTS INCORPORATED BY REFERENCE
Portions of our definitive Proxy Statement for the annual meeting of shareholders to be held August 2, 2018, are incorporated by reference in Part III of this Annual Report on Form 10-K
FORWARD-LOOKING STATEMENTS
The information presented in this Annual Report on Form 10-K contains forward-looking statements within the meaning of Section 21E of the Securities Exchange Act of 1934, as amended (the “Exchange Act”). These forward-looking statements have been made pursuant to the provisions of the Private Securities Litigation Reform Act of 1995. These statements are not historical facts, but rather are based on our current expectations, estimates and projections, and our beliefs and assumptions. Words such as “anticipate,” “expect,” “intend,” “plan,” “believe,” “seek,” “estimate,” “will” and similar expressions may identify forward-looking statements. These statements are not guarantees of future performance and are subject to certain risks, uncertainties and other factors, some of which are beyond our control and are difficult to predict. These factors could cause actual results to differ materially from those expressed or forecasted in the forward-looking statements. These risks and uncertainties are described in the risk factors and elsewhere in this Annual Report on Form 10-K. We caution you not to place undue reliance on these forward-looking statements, which reflect our management’s view only as of the date of this Annual Report on Form 10-K. We are not obligated to update these statements or publicly release the result of any revisions to them to reflect events or circumstances after the date of this Annual Report on Form 10-K or to reflect the occurrence of unanticipated events.
As used in this Annual Report on Form 10-K, except where otherwise stated or indicated by the context, “Hawkins,” “we,” “us,” “the Company,” “our,” or “the Registrant” means Hawkins, Inc. References to “fiscal
2019
” means our fiscal year ending
March 31, 2019
, “fiscal
2018
” means our fiscal year ended
April 1, 2018
, “fiscal
2017
” means our fiscal year ended
April 2, 2017
, “fiscal
2016
” means our fiscal year ended
April 3, 2016
, “fiscal 2015” means our fiscal year ended March 29, 2015, and “fiscal 2014” means our fiscal year ended March 30, 2014.
ii
Hawkins, Inc.
Annual Report on Form 10-K
For the Fiscal Year Ended
April 1, 2018
|
|
|
Page
|
|
PART I
|
||
|
ITEM 1.
|
||
|
ITEM 1A.
|
||
|
ITEM 1B.
|
||
|
ITEM 2.
|
||
|
ITEM 3.
|
||
|
ITEM 4.
|
||
|
PART II
|
||
|
ITEM 5.
|
||
|
ITEM 6.
|
||
|
ITEM 7.
|
||
|
ITEM 7A.
|
||
|
ITEM 8.
|
||
|
ITEM 9.
|
||
|
ITEM 9A.
|
||
|
ITEM 9B.
|
||
|
PART III
|
||
|
ITEM 10.
|
||
|
ITEM 11.
|
||
|
ITEM 12.
|
||
|
ITEM 13.
|
||
|
ITEM 14.
|
||
|
PART IV
|
||
|
ITEM 15.
|
||
|
ITEM 16.
|
||
iii
ITEM 1.
BUSINESS
Hawkins, Inc. distributes, blends and manufactures chemicals and specialty ingredients for our customers in a wide variety of industries. We began our operations primarily as a distributor of bulk chemicals with a strong customer focus. Over the years, we have maintained our strong customer focus and have expanded our business by increasing our sales of value-added chemical products and specialty ingredients, including manufacturing, blending and repackaging certain products. We believe that we create value for our customers through superb service and support, quality products, personalized applications and trustworthy, creative employees.
We currently conduct our business in three segments: Industrial, Water Treatment, and Health and Nutrition. Our Health and Nutrition segment was established as a result of our acquisition of Stauber Performance Ingredients (“Stauber”) in December 2015. Financial information regarding these segments is reported in Item 7 and note 13 of Item 8 of this Annual Report on Form 10-K.
Industrial Segment.
Our Industrial Group specializes in providing industrial chemicals, products and services to industries such as agriculture, chemical processing, electronics, energy, food, pharmaceutical and plating. This group’s principal products are acids, alkalis and industrial and food-grade salts.
The Industrial Group:
|
•
|
Receives, stores and distributes various chemicals in bulk quantities, including liquid caustic soda, sulfuric acid, hydrochloric acid, urea, phosphoric acid, aqua ammonia and potassium hydroxide;
|
|
•
|
Manufactures sodium hypochlorite (bleach), agricultural products and certain food-grade products, including liquid phosphates, lactates and other blended products;
|
|
•
|
Repackages water treatment chemicals for our Water Treatment Group and bulk industrial chemicals to sell in smaller quantities to our customers;
|
|
•
|
Performs custom blending of chemicals according to customer formulas and specifications; and
|
|
•
|
Performs contract and private label bleach packaging.
|
The group’s sales are concentrated primarily in Illinois, Iowa, Kentucky, Minnesota, Missouri, Nebraska, North Dakota, South Dakota, Tennessee and Wisconsin, while the group’s products sold into the food and pharmaceutical markets are sold nationally. The Industrial Group relies on a specially trained sales staff that works directly with customers on their specific needs. The group conducts its business primarily through distribution centers and terminal operations. Agricultural sales within this group tend to be seasonal, with higher sales due to the application of fertilizer during the planting season of March through June given the regions of the country where we are located.
Water Treatment Segment.
Our Water Treatment Group specializes in providing chemicals, equipment and solutions for potable water, municipal and industrial wastewater, industrial process water and non-residential swimming pool water. This group has the resources and flexibility to treat systems ranging in size from a single small well to a multi-million-gallon-per-day facility.
The group utilizes delivery routes operated by our employees who typically serve as route driver, salesperson and trained technician to deliver our products and diagnose our customers’ water treatment needs. We believe that the high level of service provided by these individuals allows us to serve as the trusted water treatment expert for many of the municipalities and other customers that we serve. We also believe that there are significant synergies between our Water Treatment and Industrial Groups in that we are able to obtain a competitive cost position on many of the chemicals sold by the Water Treatment Group due to the volumes of these chemicals purchased by our Industrial Group. In addition, our Industrial and Water Treatment groups share certain facilities, which leverage fixed costs across both groups.
The group operates out of warehouses in 29 cities supplying products and services to customers primarily in Arkansas, Florida, Illinois, Indiana, Iowa, Kansas, Kentucky, Minnesota, Missouri, Montana, Nebraska, North Dakota, Ohio, Oklahoma, South Dakota, Wisconsin and Wyoming. We expect to invest in existing and new branches to expand the group’s geographic coverage. Our Water Treatment Group has historically experienced higher sales during April to September, primarily due to a seasonal increase in chemicals used by municipal water treatment facilities.
1
Health and Nutrition Segment.
We established the Health and Nutrition segment of our business in December 2015 through our acquisition of Stauber. Through sales of our manufactured products and distributed products, our Health and Nutrition Group specializes in providing ingredient distribution, processing and formulation solutions to manufacturers of nutraceutical, functional food and beverage, personal care, dietary supplement and other nutritional food, health and wellness products. This group offers a diverse product portfolio including minerals, botanicals and herbs, vitamins and amino acids, excipients, joint products, sweeteners and enzymes.
The Health and Nutrition Group relies on a specially trained sales and product development staff that works directly with customers on their specific needs. The group’s extensive product portfolio combined with value-added services, including product formulation, sourcing and distribution, processing and blending and quality control and compliance, positions this group as a one-stop ingredient solutions provider to its customers. The group operates out of facilities in California and New York and its products are sold nationally and, in certain cases, internationally.
Raw Materials.
We have numerous suppliers, including many of the major chemical producers in the United States. We source our health and nutrition ingredients from a wide array of domestic and international vendors. We typically have distributorship agreements or supply contracts with our suppliers
that are periodically renewed. We believe that most of the products we purchase can be obtained from alternative sources should existing relationships be terminated. We are dependent upon the availability of our raw materials. While we believe that we have adequate sources of supply for our raw material and product requirements, we cannot be sure that supplies will be consistently available in the future. In the event that certain raw materials become generally unavailable, suppliers may extend lead times or limit or cut off the supply of materials to us. As a result, we may not be able to supply or manufacture products for our customers.
Intellectual Property.
Our intellectual property portfolio is of economic importance to our business. When appropriate, we have pursued, and we will continue to pursue, patents covering our products. We also have obtained certain trademarks for our products to distinguish them from our competitors’ products. We regard much of the formulae, information and processes that we generate and use in the conduct of our business as proprietary and protectable under applicable copyright, patent, trademark, trade secret and unfair competition laws.
Customer Concentration.
In fiscal 2018, none of our customers accounted for 10% or more of our total sales. Sales to our largest customer, which is in our Industrial segment, represented approximately 4-5% of our total sales in each of fiscal 2018, 2017 and 2016. Aggregate sales to our five largest customers, four
of which are in our Industrial segment and one of which is in our Health and Nutrition segment, represented approximately 12% of our total sales in fiscal 2018 and 2017 and 14% of our total sales in fiscal 2016. No other customer represented more than 2% of our total sales in fiscal 2018. The loss of any of our largest customers, or a substantial portion of their business, could have a material adverse effect on our results of operations.
Competition.
We operate in a competitive industry and compete with many producers, distributors and sales agents offering products equivalent to substantially all of the products we offer. Many of our competitors are larger than we are and may have greater financial resources, although no one competitor is dominant in the markets we serve. We compete by offering quality products at competitive prices coupled with outstanding customer service and value-added services or product formulation where needed. Because of our long-standing relationships with many of our suppliers, we are often able to leverage those relationships to obtain products when supplies are scarce or to obtain competitive pricing.
Geographic Information.
Substantially all of our revenues are generated by sales to customers within, and long-lived assets are located in, the United States. Approximately 2% of our total revenues were from sales to customers located outside of the U.S. in fiscal 2018 and 2017, and approximately 1% of our revenues were from sales to customers located outside of the U.S. in fiscal 2016.
Working Capital.
Due to the nature of our operations, which includes purchases of large quantities of bulk chemicals, the timing of purchases can result in significant changes in working capital and the resulting operating cash flow. Historically, our cash requirements for working capital increase during the period from April through November as caustic soda inventory levels increase with most of the barges received during this period. Additionally, due to seasonality of the Water Treatment business, our accounts receivable balance is generally higher during the period of April through September.
Employees.
We had 653 employees as of April 1, 2018, including 58 covered by collective bargaining agreements.
About Us.
Hawkins, Inc. was founded in 1938 and incorporated in Minnesota in 1955. We became a publicly-traded company in 1972. Our principal executive offices are located at 2381 Rosegate, Roseville, Minnesota.
2
Available Information.
We have made available, free of charge, through our Internet website (http://www.hawkinsinc.com), our Annual Reports on Form 10-K, Quarterly Reports on Form 10-Q, Current Reports on Form 8-K, and, if applicable, amendments to those reports, as soon as reasonably practicable after we electronically file these materials with, or furnish them to, the Securities and Exchange Commission. Reports of beneficial ownership filed by our directors and executive officers pursuant to Section 16(a) of the Exchange Act are also available on our website. We are not including the information contained on our website as part of, or incorporating it by reference into, this Annual Report on Form 10-K.
3
ITEM 1A.
RISK FACTORS
You should consider carefully the following risks when reading the information,
including the financial information, contained in this Annual Report on
Form 10-K.
We operate in a highly competitive environment and face significant competition and
price pressure.
We operate in a highly competitive industry and compete with producers, manufacturers, distributors and sales agents offering products equivalent to substantially all of the products we offer. Competition is based on several key criteria, including product price, product performance, product quality, product availability and security of supply, breadth of product offerings, geographic reach, responsiveness of product development in cooperation with customers, technical expertise and customer service. Many of our competitors are larger than we are and may have greater financial resources, more product offerings and a broader geographic reach. As a result, these competitors may be able to offer a broader array of products to a larger geographic area and may be better able than us to withstand changes in conditions within our industry, changes in the prices and availability of raw materials and changes in general economic conditions as well as be able to introduce innovative products that reduce demand for or the profit of our products. Additionally, competitors’ pricing decisions could compel us to decrease our prices, which could adversely affect our margins and profitability. Our ability to maintain or increase our profitability would be dependent upon our ability to offset competitive decreases in the prices and margins of our products by improving production efficiency, investing in infrastructure to reduce freight costs, identifying and selling higher margin products, providing higher levels of technical expertise and customer service, and improving existing products through innovation and research and development. If we are unable to maintain our profitability or competitive position, we could lose market share to our competitors and experience reduced profitability.
Fluctuations in the prices and availability of our raw materials, which may be
cyclical in nature, could have a material adverse effect on our operations and the
margins we receive on sales of our products.
We experience regular and recurring fluctuations in the pricing of our raw materials. Those fluctuations can be significant and occur rapidly. The cyclicality of commodity markets, such as caustic soda, primarily results from changes in the balance between supply and demand and the level of general economic activity. We cannot predict whether the markets for our raw materials will favorably impact or negatively impact the margins we can realize.
Our principal chemical raw materials are generally purchased under supply contracts. The prices we pay under these contracts generally lag the market prices of the underlying raw material and the cost of inventory we have on hand, particularly inventories of our bulk commodity chemicals where we have significant volumes stored at our facilities, generally will lag the current market pricing of such inventory.
The pricing within our supply contracts generally adjusts quarterly or monthly. While we attempt to maintain competitive pricing and stable margin dollars, the potential variance in our cost of inventory from the current market pricing can cause significant volatility in our margins realized. We do not engage in futures or other derivatives contracts to hedge against fluctuations in future prices. We may enter into sales contracts where the selling prices for our products are fixed for a period of time, exposing us to volatility in raw materials prices that we acquire on a spot market or short-term contractual basis. We attempt to pass commodity pricing changes to our customers, but we may be unable to or be delayed in doing so. Our inability to pass through price increases or any limitation or delay in our passing through price increases could adversely affect our profit margins.
We are also dependent upon the availability of our raw materials. In the event that raw materials are in short supply or unavailable, raw material suppliers may extend lead times or limit or cut off supplies. As a result, we may not be able to supply or manufacture products for some or all of our customers. Constraints on the supply or delivery of critical raw materials could disrupt our operations and adversely affect the performance of our businesses.
Demand for our products is affected by general economic conditions and by the
cyclical nature of many of the industries we serve, which could cause significant
fluctuations in our sales volumes and results.
Demand for our products is affected by general economic conditions. A decline in general economic or business conditions in the industries served by our customers could have a material adverse effect on our businesses. Although we sell to areas traditionally considered non-cyclical, such as water treatment, food products and health and nutritional ingredients, many of our customers are in businesses that are cyclical in nature, such as the industrial manufacturing and energy industries which include the ethanol and agriculture industries. Downturns in these industries could adversely affect our sales and our financial results by affecting demand for and pricing of our products.
4
Changes in our customers’ needs or failure of our products to meet customers’
specifications could adversely affect our sales and profitability.
Our products are used for a broad range of applications by our customers. Changes in our customers’ product needs or processes, or reductions in demand for their end products, may enable our customers to reduce or eliminate consumption of the products that we provide. Customers may also find alternative materials or processes that no longer require our products. Consequently, it is important that we develop new products to replace the sales of products that mature and decline in use.
Our products provide important performance attributes to our customers’ products. If our products fail to meet the customers’ specifications, perform in a manner inconsistent with the customers’ expectations or have a shorter useful life than required, a customer could seek replacement of the product or damages for costs incurred as a result of the product failure. A successful claim or series of claims against us could have a material adverse effect on our financial condition and results of operations and could result in a loss of one or more customers. Reductions in demand for our products could adversely affect our sales and financial results and result in facility closures.
Our business is subject to hazards common to chemical businesses, any of which could
interrupt our production and adversely affect our results of operations.
Our business is subject to hazards common to chemical manufacturing, blending, storage, handling and transportation, including explosions, fires, severe weather, natural disasters, mechanical failure, unscheduled downtime, transportation interruptions, traffic accidents involving our delivery vehicles, chemical spills, discharges or releases of toxic or hazardous substances or gases and other risks. These hazards could cause personal injury and loss of life, severe damage to or destruction of property and equipment, and environmental contamination. In addition, the occurrence of material operating problems at any of our facilities due to any of these hazards may make it impossible for us to make sales to our customers and may result in a negative public or political reaction. Many of our facilities are near significant residential populations which increases the risk of negative public or political reaction should an environmental issue occur and could lead to adverse zoning or other regulatory actions that could limit our ability to operate our business in those locations. Accordingly, these hazards and their consequences could have a material adverse effect on our operations as a whole, including our results of operations and cash flows, both during and after the period of operational difficulties.
We are highly dependent upon transportation infrastructure to ship and receive our products and delays in these shipments could adversely affect our results of operations.
Although we maintain a number of owned trucks and trailers, we rely heavily upon transportation provided by third parties (including common carriers, barge companies, rail companies and trans-ocean cargo companies) to deliver products to us and to our customers. Our access to third-party transportation is not guaranteed, and we may be unable to transport our products in a timely manner, or at all, in certain circumstances, or at economically attractive rates. Disruptions in transportation are common, are often out of our control, and can happen suddenly and without warning. Rail limitations, such as limitations in rail capacity, availability of railcars and adverse weather conditions have disrupted or delayed rail shipments in the past and we expect they will continue into the future. Barge shipments are delayed or impossible under certain circumstances, including during times of high or low water levels, when waterways are frozen and when locks and dams are inoperable. Truck transportation has been negatively impacted by a number of factors, including limited availability of qualified drivers and equipment, and limitations on drivers’ hours of service. The volumes handled by, and operating challenges at, ocean ports have at times been volatile and can delay the receipt of goods, or cause the cost of shipping goods to be more expensive. Our failure to ship or receive products in a timely and efficient manner could have a material adverse effect on our financial condition and results of operations.
Environmental, health and safety, transportation and storage laws and regulations cause us to incur substantial
costs and may subject us to future liabilities and risks.
We are subject to numerous federal, state and local environmental, health and safety laws and regulations in the jurisdictions in which we operate, including the management, storage, transportation and disposal of chemicals and wastes; product regulation; air water and soil contamination; and the investigation and cleanup of any spills or releases that may result from our management, handling, storage, sale, or transportation of chemicals and other products. The nature of our business exposes us to risks of liability under these laws and regulations. Ongoing compliance with such laws and regulations is an important consideration for us and we invest substantial capital and incur significant operating costs in our compliance efforts. In addition, societal concerns regarding the safety of chemicals in commerce and their potential impact on the environment have resulted in a growing trend towards increasing levels of product safety and environmental protection regulations. These concerns have led to, and could continue to result in, more stringent regulatory intervention by governmental authorities. In addition, these concerns could influence public
5
perceptions, impact the commercial viability of the products we sell and increase the costs to comply with increasingly complex regulations, which could have a negative impact on our business, financial condition and results of operations.
In addition, we operate a fleet of more than 150 vehicles, primarily in our Water Treatment Group, which are highly regulated, including by the U.S. Department of Transportation (“DOT”). The DOT governs transportation matters including authorization to engage in motor carrier service, including the necessary permits to conduct our businesses, equipment operation, and safety. We are audited periodically by the DOT to ensure that we are in compliance with various safety, hours-of-service, and other rules and regulations. If we were found to be out of compliance, the DOT could severely restrict or otherwise impact our operations, which could have a material adverse effect on our operations as a whole, including our results of operations and cash flows.
If we violate applicable laws or regulations, in addition to being required to correct such violations, we could be held liable in administrative, civil or criminal proceedings for substantial fines and other sanctions that could disrupt, limit or halt our operations, which could have a material adverse effect on our operations as a whole, including our results of operations and cash flows. Liabilities associated with the investigation and cleanup of releases of hazardous substances, as well as personal injury, property damages or natural resource damages arising out of such releases of hazardous substances, may be imposed in many situations without regard to violations of laws or regulations or other fault, and may also be imposed jointly and severally (so that a responsible party may be held liable for more than its share of the losses involved, or even the entire loss). Such liabilities can be difficult to identify and the extent of any such liabilities can be difficult to predict. We use, and in the past have used, hazardous substances at many of our facilities, and have generated, and continue to generate, hazardous wastes at a number of our facilities. We have in the past been, and may in the future be, subject to claims relating to exposure to hazardous materials and the associated liabilities may be material.
Environmental problems at one of our facilities could result in significant unexpected costs.
We are subject to federal, state and local environmental regulations regarding the ownership of real property and the operations conducted on real property. Under various federal, state and local laws, ordinances and regulations, we may own or operate real property or may have arranged for the disposal or treatment of hazardous or toxic substances at a property and, therefore, may become liable for the costs of removal or remediation of certain hazardous substances released on or in our property or disposed of by us, as well as certain other potential costs which could relate to hazardous or toxic substances (including governmental fines and injuries to persons and property). Such liability may be imposed whether or not we knew of, or were responsible for, the presence of these hazardous or toxic substances. Further, future changes in environmental laws or regulations may require additional investment in capital equipment or the implementation of additional compliance programs in the future. The cost of investigation, remediation or removal of such substances may be substantial.
In the conduct of our operations, we have handled and do handle materials that are considered hazardous, toxic or volatile under federal, state and local laws. The accidental release of such products cannot be completely eliminated. In addition, we operate or own facilities located on or near real property that was formerly owned and operated by others. These properties were used in ways that involved hazardous materials. Contaminates may migrate from, within or through any such property, which may give rise to claims against us. Third parties who are responsible for contamination may not have funds, or may not make funds available when needed, to pay remediation costs imposed upon us jointly with them under environmental laws and regulations.
We are aware that soil and groundwater contamination exists on one of our facilities. The primary contaminate of concern is trichloroethylene. In fiscal 2018, we reserved $0.6 million for estimated expenses related to remediating this contamination. Given the many uncertainties involved in assessing environmental claims, our reserves may prove to be insufficient. Increases in these estimated environmental expenses could have a material adverse effect on our business, financial condition and results of operations.
Our food, pharmaceutical and nutritional products are subject to government regulation, both in the United States and abroad, which could increase our costs significantly and limit or prevent the sale of such products.
The manufacture, packaging, labeling, advertising, promotion, distribution and sale of our food, pharmaceutical and nutritional products are subject to regulation by numerous national and local governmental agencies in the United States and other countries. The primary regulatory bodies in the United States are the Food and Drug Administration (the “FDA”), the United States Department of Agriculture and the Federal Trade Commission, and we are also subject to similar regulators in other countries. Failure to comply with these regulatory requirements may result in various types of penalties or fines. These include injunctions, product withdrawals, recalls, product seizures, fines and criminal prosecutions. Individual states also regulate dietary supplements. A state may interpret claims or products presumptively valid under federal law as illegal under that state’s regulations. Approvals or licensing may be conditioned on reformulation of products or may be unavailable with respect to certain products or product ingredients. Any of
6
these government agencies, as well as legislative bodies, can change existing regulations, or impose new ones, or could take aggressive measures, causing or contributing to a variety of negative consequences, including:
|
•
|
requirements for the reformulation of certain or all products to meet new standards,
|
|
•
|
the recall or discontinuance of certain or all products,
|
|
•
|
additional record-keeping requirements,
|
|
•
|
expanded documentation of the properties of certain or all products,
|
|
•
|
expanded or different labeling,
|
|
•
|
adverse event tracking and reporting, and
|
|
•
|
additional scientific substantiation.
|
In particular, the FDA’s current good manufacturing practices (“GMPs”) describe policies and procedures designed to ensure that nutraceuticals, pharmaceuticals and dietary supplements are produced in a quality manner, do not contain contaminants or impurities, and are accurately labeled and cover the manufacturing, packaging, labeling and storing of supplements, with requirements for quality control, design and construction of manufacturing plants, testing of ingredients and final products, record keeping, and complaints processes. Those who manufacture, package or store dietary supplements must comply with current GMPs. If we or our suppliers fail to comply with current GMPs, the FDA may take enforcement action against us or our suppliers.
Any or all of the potential negative consequences described above could have a material adverse effect on us or substantially increase the cost of doing business in this area. There can be no assurance that the regulatory environment in which we operate will not change or that such regulatory environment, or any specific action taken against us, will not result in a material adverse effect on us.
Our businesses expose us to potential product liability claims and recalls, which could adversely affect our financial condition and performance.
The repackaging, blending, mixing and distribution of products by us, including chemical products and products used in food or food ingredients or with medical, pharmaceutical or dietary supplement applications, involve an inherent risk of exposure to product liability claims, product recalls, product seizures and related adverse publicity, including, without limitation, claims for exposure to our products, spills or escape of our products, personal injuries, food-related claims and property damage or environmental claims. A product liability claim, judgment or recall against our customers could also result in substantial and unexpected expenditures for us, affect consumer confidence in our products and divert management’s attention from other responsibilities. Although we maintain product liability insurance, there can be no assurance that the type or level of coverage is adequate or that we will be able to continue to maintain our existing insurance or obtain comparable insurance at a reasonable cost, if at all. A product recall or a partially or completely uninsured judgment against us could have a material adverse effect on our business, financial condition and results of operations.
Demand for our food and nutritional products is highly dependent upon consumers’ perception of the safety and quality of our products, our customers’ products as well as similar products distributed by other companies, and adverse publicity and negative public perception regarding particular ingredients or products or the nutraceuticals industry in general could limit our ability to increase revenue and grow that portion of our business.
Purchasing decisions made by consumers of products that contain our ingredients may be affected by adverse publicity or negative public perception regarding particular ingredients or products or the nutraceuticals industry in general. This negative public perception may include publicity regarding the legality or quality of particular ingredients or products in general or of other companies or our products or ingredients specifically. Negative public perception may also arise from regulatory investigations, regardless of whether those investigations involve us. We are highly dependent upon consumers’ perception of the safety and quality of products that contain our ingredients as well as similar products distributed by other companies. Thus, the mere publication of reports asserting that such products may be harmful could have a material adverse effect on us, regardless of whether these reports are scientifically supported. Publicity related to dietary supplements may also result in increased regulatory scrutiny of our industry. Adverse publicity may have a material adverse effect on our business, financial condition, results of operations and cash flows. There can be no assurance of future favorable scientific results and media attention or of the absence of unfavorable or inconsistent findings.
7
Our Water Treatment Group and our agricultural product sales within our Industrial Group are subject to seasonality and
weather conditions, which could adversely affect our results of operations.
Our Water Treatment Group has historically experienced higher sales during April to September, primarily due to a seasonal increase in chemicals used by municipal water treatment facilities. Our agricultural product sales are also seasonal, primarily corresponding with the planting and harvesting seasons. Demand in both of these areas is also affected by weather conditions, as either higher or lower than normal precipitation or temperatures may affect water usage and the timing and the amount of consumption of our products. We cannot assure you that seasonality or fluctuating weather conditions will not have a material adverse effect on our results of operations.
The insurance that we maintain may not fully cover all potential exposures.
We maintain property, business interruption and casualty insurance, but such insurance may not cover all risks associated with the hazards of our businesses and is subject to limitations, including deductibles and limits on the liabilities covered. We may incur losses beyond the limits or outside the coverage of our insurance policies, including liabilities for environmental remediation and product liability. In addition, from time to time, various types of insurance for companies in the chemical or food and nutritional products industry have not been available on commercially acceptable terms or, in some cases, have not been available at all. In the future, we may not be able to obtain coverage at current levels, and our premiums may increase significantly on coverage that we maintain.
We are party to a credit facility, and failure to comply with the covenants thereunder may have a material adverse effect.
We are party to a credit agreement (the “Credit Agreement”) with U.S. Bank National Association and other lenders from time to time party thereto (collectively, the “Lenders”), which included senior secured credit facilities (the “Credit Facility”) totaling $165.0 million, consisting of (i) a $100.0 million senior secured term loan credit facility (the “Term Loan Facility”) and (ii) a $65.0 million senior secured revolving loan credit facility (the “Revolving Loan Facility”). The Revolving Loan Facility includes a $5.0 million letter of credit subfacility and $8.0 million swingline subfacility. Loans under the Term Loan Facility are to be repaid in quarterly installments on the last day of each fiscal quarter, with $5.0 million paid in year one, $7.5 million paid in year two, and $10.0 million to be paid in years three through five. As of April 1, 2018, we had $85.0 million outstanding under the Term Loan Facility and $16.0 million outstanding under the Revolving Loan Facility. The remaining outstanding balance on these credit facilities will be repaid in full after five years.
If we are unable to generate sufficient cash flow or otherwise obtain funds necessary to make required payments on the Credit Facility, we will be in default. We are also required to comply with several financial covenants under the Credit Agreement. Our ability to comply with such financial covenants may be affected by events beyond our control, which could result in a default under the Credit Agreement; such default may have a material adverse effect on our business, financial condition, operating results or cash flows.
The Credit Agreement also contains other customary affirmative and negative covenants, including covenants that restrict the ability of the Company and its subsidiaries to incur additional indebtedness, dispose of significant assets, make certain investments, including any acquisitions other than permitted acquisitions, make certain payments, enter into sale and leaseback transactions, grant liens on its assets or rate management transactions, subject to certain limitations. These restrictions may adversely affect our business.
Impairment to the carrying value of our goodwill or other intangible assets could adversely affect our financial condition and consolidated results of operations.
Goodwill represents the excess of the cost of acquired businesses over the fair value of identifiable tangible net assets and identifiable intangible assets purchased. Goodwill is tested at least annually for impairment, and is tested for impairment more frequently if events or changes in circumstances indicate that the asset might be impaired. Our annual test for impairment is as of the first day of our fourth fiscal quarter, or January 1, 2018 for fiscal 2018. Goodwill impairment testing is at the reporting unit level. For our Industrial and Water Treatment reporting units, we performed an analysis of qualitative factors to determine if it is more likely than not that the fair value of a reporting unit is less than its carrying amount. If that qualitative analysis indicates that an impairment may exist, then we would calculate the amount of the impairment by comparing the fair value of the assets and liabilities to the fair value of the reporting unit. For our Health and Nutrition reporting unit, we performed a quantitative goodwill impairment analysis, which required us to estimate the fair value of this reporting unit and compare the fair value to the reporting unit’s carrying value. The fair value of the reporting unit in excess of the value of the assets and liabilities is the implied fair value of the goodwill. If this amount is less than the carrying amount of goodwill, impairment is recognized for the difference. As of January 1, 2018,
8
the carrying value of our Health and Nutrition reporting unit exceeded its fair value by $39.1 million, requiring us to record an impairment of goodwill for that amount. A significant amount of judgment is involved in determining if an indication of impairment exists. Factors may include, among others: a significant decline in our expected future cash flows; a sustained, significant decline in our stock price and market capitalization; a significant adverse change in the business climate; unanticipated competition; and slower growth rates. An adverse change in these factors may have a significant impact on the recoverability of the net assets recorded, and any resulting impairment charge in the future could have a material adverse effect on our financial condition and consolidated results of operations.
We evaluate the useful lives of our intangible assets to determine if they are definite- or indefinite-lived. Reaching a determination on useful life requires significant judgments and assumptions regarding the future effects of obsolescence, demand, competition, other economic factors (such as the stability of the industry, legislative action that results in an uncertain or changing regulatory environment, and expected changes in distribution channels), and the expected lives of other related groups of assets.
We cannot accurately predict the amount and timing of any impairment of goodwill and other intangible assets. Should the value of these assets become impaired, there could be a material adverse effect on our financial condition and consolidated results of operations.
If we are unable to retain key personnel or attract new skilled personnel, it could
have an adverse impact on our businesses.
Because of the specialized and technical nature of our businesses, our future performance is dependent on the continued service of, and on our ability to attract and retain, qualified management, scientific, technical and support personnel. The unanticipated departure of key members of our management team could have an adverse impact on our business.
We may not be able to successfully consummate future acquisitions or integrate
acquisitions into our business, which could result in unanticipated expenses and
losses.
As part of our business growth strategy, we have acquired businesses and may pursue acquisitions in the future. Our ability to pursue this strategy will be limited by our ability to identify appropriate acquisition candidates and our financial resources, including available cash and borrowing capacity. The expense incurred in consummating acquisitions, the time it takes to integrate an acquisition or our failure to integrate businesses successfully could result in unanticipated expenses and losses. Furthermore, we may not be able to realize the anticipated benefits from acquisitions.
The process of integrating acquired operations into our existing operations may result in unforeseen operating difficulties and may require significant financial resources that would otherwise be available for the ongoing development or expansion of existing operations. The risks associated with the integration of acquisitions include potential disruption of our ongoing businesses and distraction of management, unforeseen claims, liabilities, adjustments, charges and write-offs, difficulty in conforming the acquired business’ standards, processes, procedures and controls with our operations, and challenges arising from the increased scope, geographic diversity and complexity of the expanded operations.
Our businesses are subject to risks stemming from natural disasters or other
extraordinary events outside of our control, which could interrupt our production and
adversely affect our results of operations.
Natural disasters have the potential of interrupting our operations and damaging our properties, which could adversely affect our businesses. Flooding of the Mississippi River has temporarily shifted the Company’s terminal operations out of its buildings three times since the spring of 2010. We can give no assurance that flooding or other natural disasters will not recur or that there will not be material damage or interruption to our operations in the future from such disasters.
Chemical-related assets may be at greater risk of future terrorist attacks than other possible targets in the United States. Federal law imposes site security requirements, specifically on chemical facilities, which have increased our overhead expenses. Federal regulations have also been adopted to increase the security of the transportation of hazardous chemicals in the United States. We ship and receive materials that are classified as hazardous and we believe we have met these requirements, but additional federal and local regulations that limit the distribution of hazardous materials are being considered. Bans on movement of hazardous materials through certain cities could adversely affect the efficiency of our logistical operations. Broader restrictions on hazardous material movements could lead to additional investment and could change where and what products we provide.
The occurrence of extraordinary events, including future terrorist attacks and the outbreak or escalation of hostilities, cannot be predicted, but their occurrence can be expected to negatively affect the economy in general, and specifically the markets for our products. The resulting damage from a direct attack on our assets, or assets used by us, could include loss of life and property
9
damage. In addition, available insurance coverage may not be sufficient to cover all of the damage incurred or, if available, may be prohibitively expensive.
We may not be able to renew our leases of land where four of our operations
facilities reside.
We lease the land where our three main terminals are located and where another significant manufacturing plant is located. We do not have guaranteed lease renewal options and may not be able to renew our leases in the future. Our current lease renewal periods extend out to 2023, 2028, 2029 and 2034. The failure to secure extended lease terms on any one of these facilities may have a material adverse impact on our business, as they are where a portion of our chemicals are manufactured and where the majority of our bulk chemicals are stored. While we can make no assurances, based on historical experience and anticipated future needs, we intend to extend these leases and believe that we will be able to renew our leases as the renewal periods expire. If we are unable to renew three of our leases (two relate to terminals and one to manufacturing) any property remaining on the land becomes the property of the lessor, and the lessor has the option to either maintain the property or remove the property at our expense. The fourth lease provides that we turn any property remaining on the land over to the lessor for them to maintain or remove at their expense. The cost to relocate our operations could have a material adverse effect on our results of operations and financial condition.
ITEM 1B.
UNRESOLVED STAFF COMMENTS
None.
10
ITEM 2.
PROPERTIES
Our corporate office is located in Roseville, Minnesota, where we lease approximately 40,000 square feet with an initial term through December 31, 2021. We own our principal manufacturing, warehousing, and distribution location in Minneapolis, Minnesota, which consists of approximately 11 acres of land, with six buildings containing a total of 177,000 square feet of office and warehouse space primarily used by our Industrial Group. We have installed sprinkler systems in substantially all of our warehouse facilities for fire protection. We believe that we carry customary levels of insurance covering the replacement of damaged property.
In addition to those facilities, our other facilities are described below. We believe that these facilities, together with those described above, are adequate and suitable for the purposes they serve. Unless noted, each facility is owned by us and is primarily used as office and warehouse space.
|
Group
|
Location
|
Approx.
Square Feet
|
||
|
Industrial
|
Camanche, IA
|
95,000
|
||
|
Centralia, IL (1)
|
77,000
|
|||
|
Dupo, IL (2)
|
64,000
|
|||
|
St. Paul, MN (3)
|
32,000
|
|||
|
Rosemount, MN (4)
|
63,000
|
|||
|
St Louis, MO
|
6,000
|
|||
|
Water Treatment
|
Ft. Smith, AR (5)
|
17,000
|
||
|
Apopka, FL
|
32,100
|
|||
|
Big Pine Key, FL (5)
|
4,200
|
|||
|
Hollywood, FL
|
5,400
|
|||
|
LaBelle, FL
|
8,200
|
|||
|
Thomasville, GA (5)
|
35,800
|
|||
|
Brooker, FL
|
4,640
|
|||
|
Tarrytown, FL
|
6,500
|
|||
|
Swainsboro, GA
|
57,000
|
|||
|
Eldridge, IA
|
6,000
|
|||
|
Slater, IA
|
12,000
|
|||
|
Centralia, IL
|
39,000
|
|||
|
Havana, IL
|
16,000
|
|||
|
Peotone, IL (5)
|
18,000
|
|||
|
Muncie, IN
|
12,000
|
|||
|
Garnett, KS
|
18,000
|
|||
|
Frankfort, KY
|
20,000
|
|||
|
Columbia, MO (5)
|
14,000
|
|||
|
Billings, MT
|
9,000
|
|||
|
Fargo, ND
|
20,000
|
|||
|
Washburn, ND
|
14,000
|
|||
|
Lincoln, NE (5)
|
16,000
|
|||
|
Tulsa, OK
|
7,300
|
|||
|
Sioux Falls, SD
|
27,000
|
|||
|
Rapid City, SD
|
9,000
|
|||
|
Fond du Lac, WI
|
24,000
|
|||
|
Superior, WI
|
17,000
|
|||
|
Industrial and Water Treatment
|
St. Paul, MN (6)
|
59,000
|
||
|
Memphis, TN
|
41,000
|
|||
|
Health and Nutrition
|
Fullerton, CA (7)
|
55,800
|
||
|
Florida, NY (8)
|
107,000
|
|||
11
|
(1)
|
This facility includes 10 acres of land located in Centralia, Illinois owned by the Company. The facility includes manufacturing capacity and primarily serves our food-grade products and agriculture businesses.
|
|
(2)
|
The land for this manufacturing and packaging facility is leased from a third party, with the lease expiring in May 2023.
|
|
(3)
|
Our terminal operations, located at two sites on opposite sides of the Mississippi River, are made up of three buildings, outside storage tanks for the storage of liquid bulk chemicals, including caustic soda, as well as numerous smaller tanks for storing and mixing chemicals. The land is leased from the Port Authority of the City of St. Paul, Minnesota. One of the applicable leases runs through 2028, while the other one runs through 2034.
|
|
(4)
|
This facility includes 28 acres of land owned by the Company. This manufacturing facility was constructed by us and has outside storage tanks for the storage of bulk chemicals, as well as numerous smaller tanks for storing and mixing chemicals.
|
|
(5)
|
This facility is leased from a third party and is warehouse space.
|
|
(6)
|
Our Red Rock facility, which consists of a 59,000 square-foot building located on approximately 10 acres of land, has outside storage capacity for liquid bulk chemicals, as well as numerous smaller tanks for storing and mixing chemicals. The land is leased from the Port Authority of the City of St. Paul, Minnesota and the lease runs until 2029.
|
|
(7)
|
This is a leased facility comprising administrative offices and a distribution facility. The lease runs through January 2021.
|
|
(8)
|
This is comprised of a 79,000 square foot manufacturing plant which sits on approximately 16 acres, as well as a leased 28,000 square foot warehouse located in close proximity.
|
ITEM 3.
LEGAL PROCEEDINGS
There are no material pending legal proceedings, other than ordinary routine litigation incidental to the business, to which we or any of our subsidiaries are a party or of which any of our property is the subject.
ITEM 4.
MINE SAFETY DISCLOSURES
Not applicable.
12
ITEM 5.
MARKET FOR THE COMPANY’S COMMON EQUITY, RELATED SHAREHOLDER MATTERS, AND ISSUER PURCHASES OF EQUITY SECURITIES
|
Quarterly Stock Prices
|
Cash Dividends
|
|||||||||||||||
|
High
|
Low
|
Declared
|
Paid
|
|||||||||||||
|
Fiscal 2018
|
||||||||||||||||
|
4
th
Quarter
|
$
|
38.00
|
|
$
|
31.95
|
|
$
|
0.44
|
|
—
|
|
|||||
|
3
rd
Quarter
|
42.60
|
|
34.20
|
|
—
|
|
$
|
0.44
|
|
|||||||
|
2
nd
Quarter
|
47.90
|
|
35.15
|
|
$
|
0.44
|
|
—
|
|
|||||||
|
1
st
Quarter
|
53.50
|
|
43.10
|
|
—
|
|
$
|
0.42
|
|
|||||||
|
Fiscal 2017
|
||||||||||||||||
|
4th Quarter
|
$
|
54.80
|
|
$
|
46.55
|
|
$
|
0.42
|
|
—
|
|
|||||
|
3rd Quarter
|
54.50
|
|
38.60
|
|
—
|
|
$
|
0.42
|
|
|||||||
|
2nd Quarter
|
45.50
|
|
40.62
|
|
$
|
0.42
|
|
—
|
|
|||||||
|
1st Quarter
|
45.65
|
|
35.44
|
|
—
|
|
$
|
0.40
|
|
|||||||
Our common stock is listed on the Nasdaq Global Select Market under the symbol “HWKN.” The price information represents sales prices as reported by The Nasdaq Stock Market LLC. As of
May 25, 2018
, shares of our common stock were held by approximately
406
s
hareholders of record.
We first started paying cash dividends in 1985 and have continued to do so since. Future dividend levels will be dependent upon our consolidated results of operations, financial position, cash flows and other factors, and are subject to approval by our Board of Directors.
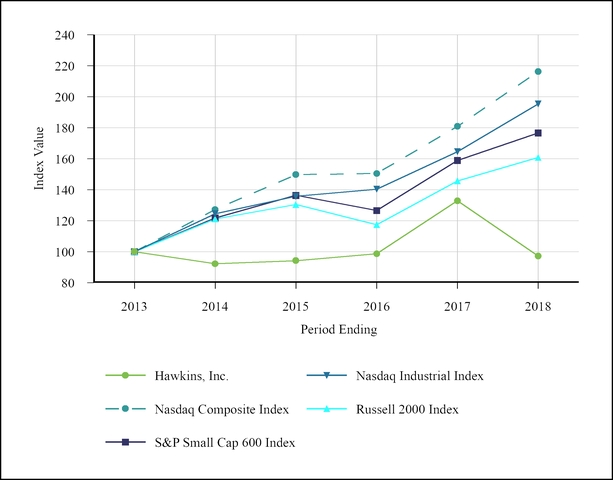
The following graph compares the cumulative total shareholder return on our common shares with the cumulative total returns of the Nasdaq Industrial Index, the Nasdaq Composite Index, the Russell 2000 Index and the Standard & Poor’s (“S&P”) Small Cap 600 Index for our last five completed fiscal years. The graph assumes the investment of $100 in our stock and each of those indices on April 1, 2013, and reinvestment of all dividends.
13
14
ITEM 6.
SELECTED FINANCIAL DATA
Selected financial data for the Company is presented in the table below and should be read in conjunction with Management’s Discussion and Analysis of Financial Condition and Results of Operations included in Item 7 and the Company’s Financial Statements and Notes to Financial Statements included in Item 8 of this Annual Report on Form 10-K. Total assets shown below are for the Company’s total operations.
|
|
Fiscal Year
|
||||||||||||||||||||
|
|
2018
|
2017
|
2016
|
2015
|
2014
|
||||||||||||||||
|
|
(In thousands, except per share data)
|
||||||||||||||||||||
|
Sales
|
$
|
504,169
|
|
$
|
483,593
|
|
$
|
413,976
|
|
$
|
364,023
|
|
$
|
348,263
|
|
||||||
|
Gross profit
|
86,760
|
|
98,073
|
|
80,257
|
|
65,791
|
|
61,600
|
|
|||||||||||
|
Net (loss) income
(1)
|
(9,177
|
)
|
22,555
|
|
18,143
|
|
19,214
|
|
18,094
|
|
|||||||||||
|
Basic (loss) earnings per common share
(1)
|
(0.87
|
)
|
2.14
|
|
1.72
|
|
1.82
|
|
1.72
|
|
|||||||||||
|
Diluted (loss) earnings per common share
(1)
|
(0.86
|
)
|
2.13
|
|
1.72
|
|
1.81
|
|
1.71
|
|
|||||||||||
|
Cash dividends declared per common share
|
0.88
|
|
0.84
|
|
0.80
|
|
0.76
|
|
0.72
|
|
|||||||||||
|
Cash dividends paid per common share
|
0.86
|
|
0.82
|
|
0.78
|
|
0.74
|
|
0.70
|
|
|||||||||||
|
Total assets
|
$
|
390,991
|
|
$
|
418,584
|
|
$
|
436,491
|
|
$
|
248,462
|
|
$
|
237,193
|
|
||||||
(1) - Net loss and basic and diluted loss per share for fiscal 2018 include a goodwill impairment charge of $39.1 million, or $3.68 per diluted share, related to our Health & Nutrition reporting unit and a one-time tax benefit of $13.9 million, or $1.31 per diluted share, related to the revaluation of our net deferred tax liabilities associated with the change in the U.S. corporate tax rate from 35% to 21% effective January 1, 2018 due to the Tax Cuts and Jobs Act of 2017.
We acquired Stauber Performance Ingredients near the end of the third quarter of fiscal 2016, and we acquired substantially all the assets of Davis Supply, Inc. near the end of the second quarter of fiscal 2016 and The Dumont Company, Inc. in the third quarter of fiscal 2015. The results of these operations since the acquisition dates are included in our consolidated results of operations.
ITEM 7.
MANAGEMENT’S DISCUSSION AND ANALYSIS OF FINANCIAL CONDITION AND RESULTS OF OPERATIONS
The following is a discussion and analysis of our financial condition and results of operations for fiscal 2018, 2017 and 2016. Fiscal 2016 was a 53-week year, whereas fiscal 2018 and 2017 were 52-week years. This discussion should be read in conjunction with the consolidated Financial Statements and Notes to Consolidated Financial Statements included in Item 8 of this Annual Report on Form 10-K.
Overview
We derive substantially all of our revenues from the sale of chemicals and specialty ingredients to our customers in a wide variety of industries. We began our operations primarily as a distributor of bulk chemicals with a strong customer focus. Over the years, we have maintained the strong customer focus and have expanded our business by increasing our sales of value-added chemical products and specialty ingredients, including manufacturing, blending and repackaging certain products.
Acquisitions and Business Expansion
Near the end of the third quarter of fiscal 2016, we acquired Stauber Performance Ingredients (“Stauber”) for $157.0 million on a cash-free, debt-free basis, subject to a customary working capital adjustment. The total consideration for the acquisition was $158.2 million ($156.7 million net of cash acquired). Stauber operates out of facilities in New York and California and blends and distributes specialty products and ingredients to manufacturers of nutraceutical, functional food and beverage, personal care, dietary supplement, and other nutritional food, health and wellness products. The acquisition expanded our portfolio of value-added specialty products within new markets. The results of operations since the acquisition date, and the assets, including the goodwill associated with the acquisition, are reported in our Health and Nutrition operating segment that we established as a result of this acquisition, starting with our results for the fourth quarter of fiscal 2016. Direct costs of $3.3 million related to this acquisition,
15
consisting mainly of professional and consulting fees, were expensed as incurred during fiscal 2016, and were classified as selling, general and administrative expenses in our consolidated statement of income.
In the second quarter of fiscal 2016, we acquired substantially all the assets of Davis Supply, Inc. (“Davis”) for $4.5 million under the terms of an asset purchase agreement with Davis and its shareholders. Davis was a water treatment chemical distribution company operating in Florida, and upon acquisition we integrated this business into our existing Florida locations. The results of operations after the date of acquisition and the acquired assets are included in our Water Treatment Segment.
In addition to the acquisitions discussed above, we opened two new branches for our Water Treatment Group in fiscal 2016. We expect to continue to invest in existing and new branches to expand our Water Treatment Group’s geographic coverage. The cost of any one of these expansion branches is not expected to be material. In addition, during fiscal 2017 and 2016, we proactively added route sales and other support personnel to Water Treatment Group branch offices within our existing geographic coverage area. While these additions add costs in the near term, we expect these investments to better position us for future growth.
Goodwill Impairment
During the fourth quarter of fiscal 2018, we recorded an impairment charge of $39.1 million in our Health and Nutrition operating segment. The impairment charge was a result of changes in expectations for future growth as part of our fourth quarter long-term strategic planning process to align with historical experience in recent periods and expected changes in future product mix.
Share Repurchase Program
In fiscal 2015, our Board of Directors authorized the repurchase of up to 300,000 shares of our outstanding common stock. The shares may be repurchased on the open market or in privately negotiated transactions subject to applicable securities laws and regulations. The primary objective of the share repurchase program is to offset the impact of dilution from issuances relating to employee and director equity grants and our employee stock purchase program. No shares were repurchased during fiscal 2018 or 2017. During fiscal 2016, we repurchased 127,852 shares of common stock with an aggregate purchase price of $4.8 million. As of April 1, 2018, the remaining balance of shares available to be purchased under the share repurchase program was 112,546 shares.
Financial Overview
An overview of our financial performance in fiscal
2018
is provided below:
|
•
|
Sales of
$504.2 million
, a
4.3%
increase
from fiscal
2017
;
|
|
•
|
Gross profit of
$86.8 million
, a
decrease
of
$11.3 million
, or 11.5% from fiscal
2017
;
|
|
•
|
Selling, general and administrative (“SG&A”) expenses held flat year over year, and down 50 basis points as a percentage of sales from fiscal 2017;
|
|
•
|
Goodwill impairment charge of $39.1 million; and
|
|
•
|
Net cash provided by operating activities of
$27.3 million
as compared to $44.9 million for fiscal 2017.
|
We focus on total profitability dollars when evaluating our financial results as opposed to profitability as a percentage of sales, as sales dollars tend to fluctuate, particularly in our Industrial and Water Treatment segments, as raw material prices rise and fall. Prices for certain of our raw materials can rise or fall rapidly, causing fluctuations in gross profit as a percentage of sales.
We use the last in, first out (“LIFO”) method of valuing the majority of our inventory, which causes the most recent product costs to be recognized in our income statement. The valuation of LIFO inventory for interim periods is based on our estimates of fiscal year-end inventory levels and costs. The LIFO inventory valuation method and the resulting cost of sales are consistent with our business practices of pricing to current chemical raw material prices.
We disclose the sales of our bulk commodity products as a percentage of total sales dollars for our Industrial and Water Treatment segments. Our definition of bulk commodity products includes products that we do not modify in any way, but receive, store, and ship from our facilities, or direct ship to our customers in large quantities. We review our sales reporting on a periodic basis to ensure we are including all products that meet this definition. The disclosures in this document referring to sales of bulk commodity products have been updated for all periods presented based on the most recent review.
16
Results of Operations
The following table sets forth certain items from our statement of income as a percentage of sales from period to period:
|
Fiscal 2018
|
Fiscal 2017
|
Fiscal 2016
|
|||||||
|
Sales
|
100.0
|
%
|
100.0
|
%
|
100.0
|
%
|
|||
|
Cost of sales
|
(82.8
|
)%
|
(79.7
|
)%
|
(80.6
|
)%
|
|||
|
Gross profit
|
17.2
|
%
|
20.3
|
%
|
19.4
|
%
|
|||
|
Selling, general and administrative expenses
|
(11.8
|
)%
|
(12.3
|
)%
|
(11.9
|
)%
|
|||
|
Goodwill impairment
|
(7.8
|
)%
|
—
|
%
|
—
|
%
|
|||
|
Operating (loss) income
|
(2.3
|
)%
|
8.0
|
%
|
7.5
|
%
|
|||
|
Interest (expense) income, net
|
(0.7
|
)%
|
(0.5
|
)%
|
(0.2
|
)%
|
|||
|
(Loss) income before income taxes
|
(3.0
|
)%
|
7.5
|
%
|
7.3
|
%
|
|||
|
Income tax provision
|
1.2
|
%
|
(2.8
|
)%
|
(3.0
|
)%
|
|||
|
Net (loss) income
|
(1.8
|
)%
|
4.7
|
%
|
4.4
|
%
|
|||
Fiscal 2018 Compared to Fiscal 2017
Sales
Sales
increased
$20.6 million
, or
4.3%
, to
$504.2 million
for fiscal
2018
, as compared to sales of
$483.6 million
for fiscal
2017
. Sales increased year over year in all segments.
Industrial Segment.
Industrial segment sales
increased
$8.8 million
, or
3.7%
, to
$247.4 million
for fiscal
2018
. Sales of bulk commodity products in the Industrial segment were approximately 20% of sales dollars in fiscal 2018 and 19% in fiscal 2017. Overall sales volumes decreased slightly, while sales dollars increased as a result of more sales of certain specialty products with higher per-unit selling prices, as well as higher selling prices on certain products resulting from increased costs on one of our major commodities.
Water Treatment Segment.
Water Treatment segment sales
increased
$9.5 million
, or
7.4%
, to
$138.5 million
for fiscal
2018
. Sales of bulk commodity products in the Water Treatment segment were approximately 15% of sales dollars in both fiscal 2018 and 2017. Sales dollars increased as a result of increased sales across many product lines.
Health and Nutrition Segment.
Sales for our Health and Nutrition increased $2.2 million, or 1.9%, to $118.3 million for fiscal 2018. Increased sales of distributed products more than offset decreased sales of our manufactured products. The decline in sales of our manufactured products was due to reduced demand from certain customers and refocused efforts as we made investments to upgrade the facility.
Gross Profit
Gross profit was
$86.8 million
, or
17.2%
of sales, for fiscal
2018
, a decrease of
$11.3 million
from
$98.1 million
, or
20.3%
of sales, for fiscal
2017
. As a result of raw material price increases and increases in year-end inventory levels of certain products, the LIFO reserve increased, and gross profits decreased, by $4.1 million during fiscal 2018. During fiscal 2017, a reduction in inventory costs per unit and lower volumes of certain inventory on hand resulted in a decrease to the LIFO reserve, and increased gross profits, of $2.7 million. In addition to this $6.8 million year-over-year negative impact, the decrease in gross profit during fiscal 2018 was due to planned increases in personnel and other investments to drive future growth, including accelerated depreciation of $0.7 million, a $0.6 million environmental liability charge associated with trichloroethylene contamination at our Minneapolis facility, as well as a $0.5 million reclassification from SG&A expenses, product mix changes and continued competitive pricing pressures.
Industrial Segment.
Gross profit for the Industrial segment was
$29.6 million
, or
12.0%
of sales, for fiscal
2018
, a decrease of
$9.3 million
from
$38.9 million
, or
16.3%
of sales, for fiscal
2017
. As a result of raw material price increases and increases in year-end inventory levels of certain products, the LIFO reserve increased, and gross profits decreased, by $3.3 million during fiscal 2018. During fiscal 2017, a reduction in inventory costs per unit and lower volumes of certain inventory on hand resulted in a decrease to the LIFO reserve, and increased gross profits, of $2.0 million. In addition to this $5.3 million negative year-over-
17
year impact, the decrease in gross profit and gross profit as a percentage of sales was driven by increased operating costs as we invested for future growth and to comply with increased regulatory requirements, a $0.6 million environmental liability charge associated with trichloroethylene contamination at our Minneapolis facility, as well as lower margins on certain commodity products with rising material costs, driven by competitive pricing pressures. The impact was offset somewhat by higher profits on sales of certain specialty products with higher per-unit margins.
Water Treatment Segment.
Gross profit for the Water Treatment segment increased
$0.3 million
to
$36.3 million
, or
26.2%
of sales, for fiscal
2018
, as compared to
$36.0 million
, or
27.9%
of sales, for fiscal
2017
. As a result of raw material price increases and increases in year-end inventory levels of certain products, the LIFO reserve increased, and gross profits decreased, by $0.8 million during fiscal 2018. During fiscal 2017, a reduction in inventory costs per unit and lower volumes of certain inventory on hand resulted in a decrease to the LIFO reserve, and increased gross profits, of $0.7 million. In spite of the $1.5 million negative year-over-year LIFO impact, gross profit increased as a result of increased sales volumes compared to a year ago. Gross profit as a percentage of sales decreased compared to a year ago due to the negative year-over-year LIFO impact as well as a product mix shift.
Health and Nutrition Segment.
Gross profit for our Health and Nutrition segment decreased $2.4 million to $20.9 million, or 17.6% of sales, for fiscal 2018, as compared to $23.2 million, or 20.0% of sales, for fiscal 2017. Decreased sales of our manufactured products, which carry higher per-unit margins, was the primary cause of the decline in gross profit and gross profit as a percentage of sales. The decrease in gross profit and gross profit as a percentage of sales was also driven by planned cost increases including accelerated depreciation expense of $0.7 million related to manufacturing equipment that we removed to make upgrades to current equipment and to make room for more efficient equipment, as well as the reclassification of $0.5 million of costs that were recorded as SG&A expenses in the prior year to operating overhead in the current year to conform to our presentation.
Selling, General and Administrative Expenses
SG&A expenses were
$59.4 million
, or
11.8%
of sales, for fiscal
2018
, and
$59.4 million
, or
12.3%
of sales, for fiscal
2017
. SG&A costs were positively impacted in all segments as a result of management efforts to control costs, including delaying or suspending the filling of open positions as well as a decline in certain other variable expenses, resulting in a decline in SG&A costs in our Industrial and Water Treatment segments. However, SG&A costs in our Health and Nutrition segment increased $1.0 million year over year, in spite of the reclassification of $0.5 million of expenses from SG&A to operating overhead to conform to our presentation, largely as a result of bad debt expense recorded due to a customer bankruptcy as well as severance expense.
Goodwill Impairment
In fiscal 2018, we recorded a $39.1 million impairment of goodwill relating to our Health and Nutrition segment. The impairment charge was a result of changes in expectations for future growth as part of our fourth quarter long-term strategic planning process to align with historical experience in recent periods and expected changes in future product mix. Management is focused on key growth areas in this business segment.
Operating (Loss) Income
Operating loss was
$11.8 million
, or
(2.3)%
of sales, for fiscal
2018
, as compared to operating income of
$38.7 million
, or
8.0%
of sales, for fiscal
2017
due to the combined impact of the factors discussed above.
Interest Expense, Net
Interest expense increased by $0.7 million to $3.3 million in fiscal 2018 compared to $2.6 million for fiscal 2017, due primarily to higher interest rates in fiscal 2018 as compared to fiscal 2017.
Income Tax Provision
On December 22, 2017, the Tax Cuts and Jobs Act of 2017 (the “Tax Act”), was signed into law. The Tax Act includes a number of provisions, including lowering of the U.S. corporate tax rate from 35% to 21% effective January 1, 2018. Because our fiscal 2018 ended April 1, 2018, our tax provision for the current year was calculated utilizing a blended statutory federal rate of 31.5%. In future years, we expect our statutory federal rate to be 21%. Under GAAP, deferred tax assets and liabilities are required to be revalued during the period in which the new tax legislation is enacted. As such, during the fiscal year-end ended April 1, 2018 we revalued our net deferred tax liabilities to reflect the impact of the Tax Act and recorded a one-time benefit of $13.9 million. Our effective tax rate for fiscal 2018 was also impacted by the $39.1 million goodwill impairment charge which was recorded for book
18
purposes but was not deductible for tax purposes. Our effective income tax rate was
39.1%
for fiscal
2018
compared to
37.4%
for fiscal
2017
.
Fiscal 2017 Compared to Fiscal 2016
Sales
Sales increased $69.6 million, or 16.8%, to $483.6 million for fiscal 2017, as compared to sales of $414.0 million for fiscal 2016. Fiscal 2017 includes a full year of operating results for our Health and Nutrition segment whereas fiscal 2016 included only one quarter of Health and Nutrition segment results due to the timing of the Stauber acquisition.
Industrial Segment
. Industrial segment sales decreased $13.2 million, or 5.2%, to $238.6 million for fiscal 2017. Sales of bulk commodity products in the Industrial segment were approximately 19% of sales in fiscal 2017 compared to 20% in fiscal 2016. Sales volumes were down year over year, largely driven by the 53rd week in the prior year. These lower volumes, together with lower raw material costs on certain products which drove lower selling prices, resulted in the decrease in sales dollars.
Water Treatment Segment.
Water Treatment segment sales increased $0.6 million, or 0.5%, to $129.0 million for fiscal 2017. Sales of bulk commodity products in the Water Treatment segment were approximately 15% of sales in fiscal 2017 compared to 16% in fiscal 2016. Sales dollars increased slightly, despite the inclusion of the 53rd week in fiscal 2016, due to the business we acquired late in the second quarter of fiscal 2016 and increased volumes of specialized products.
Health and Nutrition Segment.
Sales for our Health and Nutrition segment were $116.1 million in fiscal 2017, compared to $33.9 million for fiscal 2016, as the prior year included only one quarter of activity due to the timing of the Stauber acquisition. This compares to pro forma sales of $121.6 million for the comparable prior full-year period, which included the 53rd week.
Gross Profit
Gross profit was $98.1 million, or 20.3% of sales, for fiscal 2017, an increase of $17.8 million from $80.3 million, or 19.4% of sales, for fiscal 2016. Fiscal 2017 included a full year of operating results for our Health and Nutrition segment as opposed to just one quarter of Health and Nutrition segment results in the prior year due to the timing of the Stauber acquisition. We estimated the total gross profit impact of the 53rd week in fiscal 2016 year to be approximately $2.1 million of additional gross profit in that year. The LIFO method of valuing inventory increased gross profit by $2.7 million for fiscal 2017, and increased gross profit by $1.4 million for fiscal 2016.
Industrial Segment.
Gross profit for the Industrial segment was $38.9 million, or 16.3% of sales, for fiscal 2017, an increase of $0.9 million from $38.0 million, or 15.1% of sales, for fiscal 2016. The LIFO method of valuing inventory increased gross profit by $2.0 million in fiscal 2017 and $1.0 million in the prior year. We estimated the gross profit impact of the 53rd week in our Industrial segment in fiscal 2016 to be approximately $1.0 million of additional gross profit in that year. Despite lower sales volumes, driven largely by the 53rd week in the prior year, gross profit dollars increased due to improved per-unit margins from certain of our specialized products, and the year-over-year impact from LIFO. Gross profit as a percentage of sales improved over the prior year because of the same drivers noted above in addition to lower selling prices in the current year driven by lower raw material costs on certain products.
Water Treatment Segment.
Gross profit for the Water Treatment segment increased $0.5 million to $36.0 million, or 27.9% of sales, for fiscal 2017, as compared to $35.5 million, or 27.6% of sales, for fiscal 2016. The LIFO method of valuing inventory increased gross profit by $0.7 million in fiscal 2017 and $0.4 million in the prior year. We estimated the gross profit impact of the 53rd week in fiscal 2016 to be approximately $0.6 million of additional gross profit in that year. Gross profit increased due to increased sales volumes of specialized products that have higher per-unit margins as well as profits from the business we acquired late in the second quarter of fiscal 2016.
Health and Nutrition Segment.
Gross profit for our Health and Nutrition segment was $23.2 million, or 20.0% of sales, in fiscal 2017, compared to $6.8 million, or 20.1% of sales, for fiscal 2016, as the prior year included only one quarter of activity due to the timing of the Stauber acquisition. Inventories in this segment are valued using the first-in, first-out (“FIFO”) method. We estimated the gross profit impact of the 53rd week in fiscal 2016 to be approximately $0.5 million of additional gross profit in that year.
19
Selling, General and Administrative Expenses
Selling, general and administrative (“SG&A”) expenses increased $10.3 million to $59.4 million, or 12.3% of sales, for fiscal 2017, as compared to $49.1 million, or 11.9% of sales, for fiscal 2016. We estimated the total impact to SG&A expenses of the 53rd week in fiscal 2016 to be approximately $0.9 million of additional expense in that year. We allocate certain corporate expenses to our operating segments, and we began allocating a portion of these costs to the Health and Nutrition segment in fiscal 2017. Corporate costs allocated to Health and Nutrition were $1.9 million for fiscal 2017; these costs would have been allocated to Industrial (approximately $1.2 million) and Water Treatment (approximately $0.7 million) in past years. Excluding the impact of corporate allocations, SG&A expenses in our Health and Nutrition segment increased by $8.1 million in fiscal 2017 as compared to fiscal 2016. Fiscal 2016 included only one quarter of activity due to the timing of the Stauber acquisition, and included $3.3 million of non-recurring costs directly related to the Stauber acquisition. SG&A expenses in our Health and Nutrition segment include $4.8 million of amortization expense on acquired intangible assets in fiscal 2017 and $1.2 million in fiscal 2016. SG&A expenses incurred elsewhere in the company increased by $2.2 million compared to the prior year, largely due to the addition of sales and support personnel in our Industrial and Water Treatment segments.
Operating Income
Operating income was $38.7 million, or 8.0% of sales, for fiscal 2017, as compared to $31.2 million, or 7.5% of sales, for fiscal 2016. Operating income reported in our segments is impacted by corporate allocations of certain SG&A costs. After corporate allocations, operating income in our Health and Nutrition segment was $5.5 million for fiscal 2017, compared to a loss of $0.9 million for fiscal 2016, which included only one quarter of operations and included $3.3 million of expenses related to our acquisition of Stauber. Operating income in our Industrial segment increased by $1.2 million primarily as a result of the gross profit improvement discussed above. Operating income for the Water Treatment segment was flat compared to the prior year as the increase in gross profit was offset by increased SG&A expenses.
Interest (Expense) Income, Net
Interest expense increased by $1.8 million for fiscal 2017 due to the interest costs on the debt added at the end of the third quarter of fiscal 2016 to partially fund the Stauber acquisition.
Income Tax Provision
Our effective income tax rate was 37.4% for fiscal 2017 compared to 40.2% for fiscal 2016. Our effective tax rate for fiscal 2016 was negatively impacted by income tax expense of approximately $0.5 million associated with $1.4 million of Stauber acquisition related expenditures which were not deductible for tax purposes and were recorded as discrete items during fiscal 2016. Our effective tax rate for 2016 was also negatively impacted by $0.2 million related to a preliminary audit finding by a state income tax jurisdiction covering multiple years. The effective tax rate is generally impacted by projected levels of taxable income, permanent items, and state taxes.
Liquidity and Capital Resources
Cash provided by operating activities in fiscal
2018
was
$27.3 million
compared to
$44.9 million
in fiscal
2017
and
$36.3 million
in fiscal
2016
. The decrease in cash provided by operating activities in fiscal 2018 as compared to fiscal 2017 was primarily driven by lower operating income and a year-over-year decrease in the amount of cash provided by accounts receivables as well as a year-over-year increase in the amount of cash utilized to purchase inventory during fiscal 2018 as compared to fiscal 2017. The large increase in inventory during fiscal 2018 was primarily due to an increase in on-hand and in-transit inventory, along with an increase in the per-unit cost of one of our major commodities. The decision to increase inventory was driven largely by expectations of future cost increases. The increase in cash provided by operating activities in fiscal 2017 as compared to fiscal 2016 was primarily due to the added operating activity of the Health and Nutrition segment established near the end of the third quarter of fiscal 2016. Due to the nature of our operations, which includes purchases of large quantities of bulk chemicals, the timing of purchases can result in significant changes in working capital and the resulting operating cash flow. Historically, our cash requirements for working capital increase during the period from April through November as caustic soda inventory levels increase as most of our barges are received during this period.
Cash used in investing activities was
$19.3 million
in fiscal
2018
compared to
$23.5 million
in fiscal
2017
and
$151.4 million
in fiscal
2016
. Capital expenditures were
$19.7 million
in fiscal
2018
,
$21.6 million
in fiscal
2017
and
$24.2 million
in fiscal
2016
. Capital expenditures in fiscal
2018
included $8.7 million related to facility improvements, replacement equipment, new and replacement containers and Water Treatment trucks, and $7.7 million related to business expansion, inventory storage and process
20
improvements, including the purchase of three of our previously-leased Florida locations. Total capital spending in fiscal 2019 is currently expected to be at or below fiscal 2018 capital spending levels. We paid $2.2 million of additional purchase price for Stauber as closing cash, debt, and working capital balances were finalized early in fiscal 2017. In fiscal 2016, we expended $159.0 million, net of cash acquired, to complete the Stauber and Davis acquisitions. Net cash of $31.7 million was provided by sales of investments during fiscal 2016 as we liquidated our investments to partially fund the Stauber acquisition.
Cash used in financing activities was
$9.9 million
in fiscal
2018
, as compared to cash used in financing activities of
$34.5 million
in fiscal
2017
and cash provided by financing activities of
$116.4 million
in fiscal
2016
. In addition to dividend payments discussed below, included in cash used in financing activities for fiscal 2018 were debt repayments of $8.1 million on our Term Loan Facility (as defined below) and net borrowings of $6.0 million on our Revolving Loan Facility (as defined below). During fiscal 2017 we repaid $5.6 million on our Term Loan Facility and $21 million on our Revolving Loan Facility. During fiscal 2016, we received $131.0 million in connection with the credit facility we entered into to fund the Stauber acquisition. We paid out cash dividends of $9.2 million in fiscal 2018, $8.7 million in fiscal 2017 and $8.3 million in fiscal 2016. We used $4.8 million in fiscal 2016 for share repurchases under our board-authorized share repurchase program. We did not repurchase any shares under the program in fiscal 2018 or 2017.
Our cash balance was
$5.0 million
at
April 1,
2018
, a decrease of
$1.9 million
as compared with
April 2,
2017
as we continued to pay down our debt. Cash flows generated by operations during fiscal 2018 were offset by debt repayments, capital expenditures and dividend payments.
In December 2015, in connection with the Stauber acquisition described more fully in Note 2 to the consolidated financial statements, we entered into Credit Agreement with U.S. Bank as Sole Lead Arranger and Sole Book Runner and Lenders from time to time party thereto, whereby U.S. Bank is also serving as Administrative Agent. The Credit Agreement included a Credit Facility totaling $165.0 million, consisting of a $100.0 million Term Loan Facility and a $65.0 million Revolving Loan Facility. The Revolving Loan Facility includes a letter of credit subfacility in the amount of $5.0 million and a swingline subfacility in the amount of $8.0 million. The Term Loan facility requires mandatory quarterly repayments as outlined in Note 7 to the consolidated financial statements, with the balance due at maturity. The Credit Facility is scheduled to terminate on December 23, 2020. The Credit Facility is secured by substantially all our personal property assets and those of our subsidiaries.
Borrowings under the Credit Facility bear interest at a rate per annum equal to one of the following, plus, in both cases, an applicable margin based upon our leverage ratio: (a) LIBOR for an interest period of one, two, three or six months as selected by us, reset at the end of the selected interest period, or (b) a base rate determined by reference to the highest of (1) U.S. Bank’s prime rate, (2) the Federal Funds Effective Rate plus 0.5%, or (3) one-month LIBOR for U.S. dollars plus 1.0%. The LIBOR margin is 1.125%, 1.25% or 1.5%, depending on our leverage ratio. The base rate margin is 0.125%, 0.25% or 0.5%, depending on our leverage ratio. At April 1, 2018, the effective interest rate on our borrowings was approximately 3.4%, up from 2.2% at April 2, 2017.
On September 20, 2016, we entered into an interest rate swap agreement to manage the risk associated with a portion of our variable-rate debt. We do not utilize derivative instruments for speculative purposes. The interest rate swap involves the exchange of fixed-rate and variable-rate payments without the exchange of the underlying notional amount on which the interest payments are calculated. The new swap agreement began September 1, 2017 and will terminate concurrently with the expiration of our credit facility on December 23, 2020. The notional amount of the swap agreement is $40 million from September 1, 2017 through August 31, 2018, $30 million from September 1, 2018 through August 31, 2019 and $20 million from September 1, 2019 through December 23, 2020. We have designated this swap as a cash flow hedge and have determined that it qualifies for hedge accounting treatment. For so long as the hedge is effective, changes in fair value of the cash flow hedge are recorded in other comprehensive loss (net of tax) until income or loss from the cash flows of the hedged item is realized.
In addition to paying interest on the outstanding principal under the Credit Facility, we are required to pay a commitment fee on the unutilized commitments thereunder. The commitment fee is 0.25% to 0.3%, depending on our leverage ratio.
Debt issuance costs of $0.7 million paid to lenders are reflected as a reduction of long-term debt and are being amortized as interest expense over the term of the credit facility. As of April 1, 2018, the unamortized balance of these costs was $0.4 million, and is reflected as a reduction of debt on our consolidated balance sheet.
The Credit Agreement requires us to maintain (a) a minimum fixed charge coverage ratio of 1.15 to 1.00 and (b) a maximum total cash flow leverage ratio of 3.0 to 1.0. The Credit Agreement also contains other customary affirmative and negative covenants, including covenants that restrict our ability to incur additional indebtedness, dispose of significant assets, make certain investments, including any acquisitions other than permitted acquisitions, make certain payments, enter into sale and leaseback transactions, grant liens on our assets or enter into rate management transactions, subject to certain limitations. We are permitted to make
21
distributions, pay dividends and repurchase shares so long as no default or event of default exists or would exist as a result thereof. As of April 1, 2018, we were in compliance with all required covenants.
The Credit Agreement contains customary events of default, including failure to make payments under the Term Loan Facility, failure to comply with covenants in the Credit Agreement and other loan documents, cross default to other material indebtedness, failure by us to pay or discharge material judgments, bankruptcy, and change of control. The occurrence of an event of default would permit the lenders to terminate their commitments and accelerate loans under the Credit Facility.
As part of our growth strategy, we have acquired businesses and may pursue acquisitions or other strategic relationships in the future that we believe will complement or expand our existing businesses or increase our customer base. We believe we could borrow additional funds under our current or new credit facilities or sell equity for strategic reasons or to further strengthen our financial position.
Off-Balance Sheet Arrangements
We do not have any off-balance sheet arrangements.
Contractual Obligations and Commercial Commitments
The following table provides aggregate information about our contractual payment obligations and the periods in which payments are due:
|
|
Payments Due by Fiscal Period
|
|||||||||||||||||||||||||||
|
Contractual Obligation
|
2019
|
2020
|
2021
|
2022
|
2023
|
More than
5 Years
|
Total
|
|||||||||||||||||||||
|
|
(In thousands)
|
|||||||||||||||||||||||||||
|
Senior secured term loan (1)
|
$
|
10,000
|
|
$
|
10,000
|
|
$
|
65,000
|
|
$
|
—
|
|
$
|
—
|
|
$
|
—
|
|
$
|
85,000
|
|
|||||||
|
Senior secured revolver (2)
|
$
|
—
|
|
$
|
—
|
|
$
|
16,000
|
|
$
|
—
|
|
$
|
—
|
|
$
|
—
|
|
$
|
16,000
|
|
|||||||
|
Interest payments (3)
|
$
|
3,388
|
|
$
|
3,050
|
|
$
|
1,784
|
|
$
|
—
|
|
$
|
—
|
|
$
|
—
|
|
$
|
8,222
|
|
|||||||
|
Operating lease obligations
|
$
|
2,699
|
|
$
|
2,493
|
|
$
|
2,058
|
|
$
|
1,127
|
|
$
|
564
|
|
$
|
2,434
|
|
$
|
11,375
|
|
|||||||
|
Pension withdrawal liability (4)
|
$
|
467
|
|
$
|
467
|
|
$
|
467
|
|
$
|
467
|
|
$
|
467
|
|
$
|
4,906
|
|
$
|
7,241
|
|
|||||||
|
(1)
|
Represents principal payments only. See Note 7 of our consolidated Financial Statements for further information.
|
|
(2)
|
Represents balance outstanding as of
April 1, 2018
, and assumes such amount remains outstanding until its maturity date. See Note 7 of our consolidated Financial Statements for further information.
|
(3) Represents interest payments and commitment fees payable on outstanding balances under our term loan and revolver, and assumes interest rates remain unchanged from the rate as of
April 1, 2018
.
|
(4)
|
This relates to our withdrawal from a multiemployer pension plan. Payments on this obligation began in the fiscal year ended March 30, 2014 and will continue through 2034.
|
Critical Accounting Policies
In preparing the financial statements, we follow U.S. generally accepted accounting principles (“GAAP”). The preparation of these financial statements requires us to make estimates and judgments that affect the reported amounts of assets, liabilities, sales and expenses, and related disclosure of contingent assets and liabilities. We re-evaluate our estimates on an on-going basis. Our estimates are based on historical experience and on various other assumptions that are believed to be reasonable under the circumstances. Actual results may differ from these estimates under different assumptions and conditions. We consider the following policies to involve the most judgment in the preparation of our financial statements.
Goodwill and Infinite-life Intangible Assets
-
Goodwill represents the excess of the cost of acquired businesses over the fair value of identifiable tangible net assets and identifiable intangible assets purchased. Goodwill is tested at least annually for impairment, and is tested for impairment more frequently if events or changes in circumstances indicate that the asset might be impaired. Our annual test for impairment is as of the first day of our fourth fiscal quarter, or January 1, 2018 for fiscal 2018. For our Industrial and Water Treatment reporting units, we performed an analysis of qualitative factors to determine whether it is more likely than not that the fair value of either of these reporting units is less than its carrying amount as a basis for determining whether it is necessary to perform a quantitative goodwill impairment test. Based on management’s analysis of qualitative factors, we determined that it was not necessary to perform a quantitative goodwill impairment test for either of these reporting units.
22
For our Health and Nutrition reporting unit, we performed a quantitative goodwill impairment analysis, which required us to estimate the fair value of this reporting unit and compare the fair value to the reporting unit’s carrying value. We determined the fair value of this reporting unit using a discounted cash flow approach, guideline company market approach and reference transaction market approach. The discounted cash flow approach calculates the present value of projected future cash flows using appropriate discount rates. The guideline company market approach provides indications of value based on market multiples (enterprise value divided by earnings before interest, taxes, depreciation and amortization “EBITDA”) for selected public companies involved in similar lines of business, and the reference transaction market approach provides indications of value based on multiples paid for recent selected acquisitions by companies in similar lines of business. The fair values derived from these valuation methods are then weighted to determine an estimated fair value for the reporting unit, which is compared to the carrying value of the reporting unit to determine whether impairment exists. We then compared the total fair values for all reporting units to our overall market capitalization as a test of the reasonableness of this approach. For this comparison, the fair value of the Industrial and Water Treatment reporting units was estimated based on a multiple of EBITDA.
We early adopted ASU 2017-04, which simplifies the accounting for goodwill impairment. This new guidance removes step two of the goodwill impairment test, which required a hypothetical purchase price allocation. Instead, to the extent a reporting unit’s carrying amount exceeds its fair value, the reporting unit’s goodwill is considered impaired, and we must recognize an impairment charge for the amount by which the carrying amount exceeds the reporting unit’s fair value.
In determining the fair value of our Health and Nutrition reporting unit using the discounted cash flow approach, we considered our projected operating results and then made a number of assumptions. These assumptions included future business plans, economic projections and market data as well as management estimates regarding future cash flows and operating results. The key assumptions we used in preparing our discounted cash flow analysis are (1) projected cash flows, (2) risk adjusted discount rate, and (3) expected long term growth rate.
The resulting fair values for each method were weighted using 33.3% for the discounted cash flow method and both of the market approaches, to determine a concluded enterprise value for the Health and Nutrition reporting unit. Equal weighting was used for each of the approaches as we believe all three approaches are equally relevant and do not consider one to be more reflective of the views of a potential purchaser of the reporting unit. All three methods yielded similar indications of value. The estimated fair value of our Health and Nutrition reporting unit was less than its carrying value and we therefore recorded an impairment charge of $39.1 million in the fourth quarter of fiscal 2018. The impairment charge was a result of changes in expectations for future growth as part of our fourth quarter long-term strategic planning process to align with historical rates and expected changes in future product mix.
Business Acquisitions -
We account for acquired businesses using the acquisition method of accounting which requires that the assets acquired and liabilities assumed be recorded at the date of acquisition at their respective fair values. The judgments made in determining the estimated fair value assigned to each class of assets acquired and liabilities assumed, as well as asset lives, can materially impact net income. Accordingly, for significant items, we typically obtain assistance from a third-party valuation expert.
There are several methods that can be used to determine the fair value of assets acquired and liabilities assumed in a business combination. For intangible assets, we normally utilize one or more forms of the “income method.” This method starts with a forecast of all of the expected future net cash flows attributable to the subject intangible asset. These cash flows are then adjusted to present value by applying an appropriate discount rate that reflects the risk factors associated with the cash flow streams. Some of the more significant estimates and assumptions inherent in the income method (or other methods) include the projected future cash flows (including timing) and the discount rate reflecting the risks inherent in the future cash flows.
Estimating the useful life of an intangible asset also requires judgment. For example, different types of intangible assets will have different useful lives, influenced by the nature of the asset, competitive environment, and rate of change in the industry. Certain assets may even be considered to have indefinite useful lives. All of these judgments and estimates can significantly impact the determination of the amortization period of the intangible asset, and thus net income.
Recently Issued Accounting Pronouncements
In March 2016, the FASB issued ASU 2016-02 which provides new accounting guidance requiring lessees to recognize most leases as assets and liabilities on the balance sheet. This guidance will be effective for interim periods beginning after December 15, 2018 (our fiscal year ending March 30, 2020).
While we are still in the process of evaluating the effect of adoption on our consolidated financial statements and are currently assessing our leases, t
he core principal of the guidance is that an entity should recognize assets and liabilities arising from a lease for both financing and operating leases, along with additional qualitative and quantitative disclosures. As part of our assessment, we will need to determine the impact of lease extension provisions provided in our facility leases which will impact the amount of the right of use asset and lease liability recorded under the ASU.
23
In January 2016, the FASB issued ASU 2016-01 which provides guidance that addresses certain aspects of recognition, measurement, presentation, and disclosure of financial instruments. This guidance will be effective for annual reporting periods beginning after December 15, 2017 (our fiscal year ending March 31, 2019), and interim periods within those annual periods. Early adoption is not permitted. We are currently evaluating the impact that this guidance will have on our results of operations and financial position.
In May 2014, the FASB issued ASU 2014-09, which provides accounting requirements for recognition of revenue from contracts with customers.
In August 2015, the FASB issued ASU 2015-14,
Revenue from Contracts with Customers (Topic 606): Deferral of the Effective Date,
which deferred the effective date of ASU 2014-09 for all entities by one year.
The requirements of the new standard will be effective for annual reporting periods beginning after December 15, 2017 (our fiscal year ending March 31, 2019), and interim periods within those annual periods. We have completed our evaluation of the effect of adoption and determined there were no changes required to our reported revenues as a result of the adoption. The majority of our revenue arrangements generally consist of a single performance obligation to transfer promised good or services. In limited circumstances, we manufacture products for customers that are unique to their specifications.
Based on our evaluation process and review of our contracts with customers, the timing and amount of revenue recognized based on ASU 2015-14 is consistent with our revenue recognition policy under previous guidance. We will adopt the new standard effective April 2, 2018, using the modified retrospective approach, and will expand our consolidated financial statement disclosures in order to comply with the ASU. We have determined the adoption of ASU 2015-14 will not have a material impact on our results of operations, cash flows, or financial position.
See Item 8, “Note 1 - Nature of Business and Significant Accounting Policies” of the Notes to Consolidated Financial Statements for information regarding recently adopted accounting standards.
ITEM 7A.
QUANTITATIVE AND QUALITATIVE DISCLOSURE ABOUT MARKET RISK
We are subject to the risk inherent in the cyclical nature of commodity chemical prices. However, we do not currently purchase forward contracts or otherwise engage in hedging activities with respect to the purchase of commodity chemicals. We attempt to pass changes in the cost of our materials on to our customers; however, there are no assurances that we will be able to pass on the increases in the future.
We are exposed to market risks related to interest rates. Our exposure to changes in interest rates is limited to borrowings under our credit facility. A 25 basis point change in interest rates on the variable-rate portion of debt not covered by the interest rate swap would potentially increase or decrease annual interest expense by approximately $0.1 million. Other types of market risk, such as foreign currency risk, do not arise in the normal course of our business activities.
24
ITEM 8.
FINANCIAL STATEMENTS AND SUPPLEMENTARY DATA
Report of Independent Registered Public Accounting Firm
The Board of Directors and Stockholders of Hawkins, Inc.:
We have audited the accompanying consolidated balance sheets of Hawkins, Inc. and subsidiaries (the Company) as of April 1, 2018 and April 2, 2017, and the related consolidated statements of (loss) income, comprehensive (loss) income, shareholders’ equity, and cash flows for each of the years in the three-year period then ended and the related notes and financial statement schedule II (collectively, the consolidated financial statements).
We also have audited the Company’s internal control over financial reporting as of April 1, 2018, based on criteria established in
Internal Control - Integrated Framework
(2013)
issued by the Committee of Sponsoring Organizations of the Treadway Commission.
In our opinion, the consolidated financial statements referred to above present fairly, in all material respects, the financial position of the Company as of April 1, 2018 and April 2, 2017, and the results of its operations and its cash flows for each of the years in the three-year period ended April 1, 2018, in conformity with U.S. generally accepted accounting principles. Also in our opinion, the Company maintained, in all material respects, effective internal control over financial reporting as of April 1, 2018, based on criteria established in
Internal Control - Integrated Framework (2013)
issued by the Committee of Sponsoring Organizations of the Treadway Commission.
Basis for Opinions
The Company’s management is responsible for these consolidated financial statements, for maintaining effective internal control over financial reporting, and for its assessment of the effectiveness of internal control over financial reporting, included in the accompanying Management’s Report on Internal Control Over Financial Reporting. Our responsibility is to express an opinion on the Company’s consolidated financial statements and an opinion on the Company’s internal control over financial reporting based on our audits. We are a public accounting firm registered with the Public Company Accounting Oversight Board (United States) (PCAOB) and are required to be independent with respect to the Company in accordance with the U.S. federal securities laws and the applicable rules and regulations of the Securities and Exchange Commission and the PCAOB.
We conducted our audits in accordance with the standards of the PCAOB. Those standards require that we plan and perform the audits to obtain reasonable assurance about whether the consolidated financial statements are free of material misstatement, whether due to error or fraud, and whether effective internal control over financial reporting was maintained in all material respects.
Our audits of the consolidated financial statements included performing procedures to assess the risks of material misstatement of the consolidated financial statements, whether due to error or fraud, and performing procedures that respond to those risks. Such procedures included examining, on a test basis, evidence regarding the amounts and disclosures in the consolidated financial statements. Our audits also included evaluating the accounting principles used and significant estimates made by management, as well as evaluating the overall presentation of the consolidated financial statements. Our audit of internal control over financial reporting included obtaining an understanding of internal control over financial reporting, assessing the risk that a material weakness exists, and testing and evaluating the design and operating effectiveness of internal control based on the assessed risk. Our audits also included performing such other procedures as we considered necessary in the circumstances. We believe that our audits provide a reasonable basis for our opinions.
Definition and Limitations of Internal Control Over Financial Reporting
A company’s internal control over financial reporting is a process designed to provide reasonable assurance regarding the reliability of financial reporting and the preparation of financial statements for external purposes in accordance with generally accepted accounting principles. A company’s internal control over financial reporting includes those policies and procedures that (1) pertain to the maintenance of records that, in reasonable detail, accurately and fairly reflect the transactions and dispositions of the assets of the company; (2) provide reasonable assurance that transactions are recorded as necessary to permit preparation of financial statements in accordance with generally accepted accounting principles, and that receipts and expenditures of the company are being made only in accordance with authorizations of management and directors of the company; and (3) provide reasonable assurance regarding prevention or timely detection of unauthorized acquisition, use, or disposition of the company’s assets that could have a material effect on the financial statements.
25
Because of its inherent limitations, internal control over financial reporting may not prevent or detect misstatements. Also, projections of any evaluation of effectiveness to future periods are subject to the risk that controls may become inadequate because of changes in conditions, or that the degree of compliance with the policies or procedures may deteriorate.
/s/ KPMG LLP
We have served as the Company’s auditor since fiscal 2010.
Minneapolis, Minnesota
May 31, 2018
26
HAWKINS, INC.
(In thousands, except share and per-share data)
|
April 1, 2018
|
April 2, 2017
|
|||||||
|
ASSETS
|
||||||||
|
CURRENT ASSETS:
|
||||||||
|
Cash and cash equivalents
|
$
|
4,990
|
|
$
|
6,861
|
|
||
|
Trade receivables less allowance for doubtful accounts of $942 for 2018 and $468 for 2017
|
63,507
|
|
57,298
|
|
||||
|
Inventories
|
59,736
|
|
51,249
|
|
||||
|
Income taxes receivable
|
2,643
|
|
1,273
|
|
||||
|
Prepaid expenses and other current assets
|
4,106
|
|
4,238
|
|
||||
|
Total current assets
|
134,982
|
|
120,919
|
|
||||
|
PROPERTY, PLANT, AND EQUIPMENT:
|
||||||||
|
Land
|
9,540
|
|
9,097
|
|
||||
|
Buildings and improvements
|
96,105
|
|
89,840
|
|
||||
|
Machinery and equipment
|
89,324
|
|
82,910
|
|
||||
|
Transportation equipment
|
26,790
|
|
24,398
|
|
||||
|
Office furniture and equipment including computer systems
|
16,406
|
|
15,273
|
|
||||
|
238,165
|
|
221,518
|
|
|||||
|
Less accumulated depreciation
|
114,339
|
|
99,978
|
|
||||
|
Net property, plant, and equipment
|
123,826
|
|
121,540
|
|
||||
|
OTHER ASSETS:
|
||||||||
|
Goodwill
|
58,440
|
|
97,556
|
|
||||
|
Intangible assets, net
|
71,179
|
|
76,883
|
|
||||
|
Other
|
2,564
|
|
1,686
|
|
||||
|
Total other assets
|
132,183
|
|
176,125
|
|
||||
|
Total assets
|
$
|
390,991
|
|
$
|
418,584
|
|
||
|
LIABILITIES AND SHAREHOLDERS’ EQUITY
|
||||||||
|
CURRENT LIABILITIES:
|
||||||||
|
Accounts payable — trade
|
$
|
33,424
|
|
$
|
29,756
|
|
||
|
Dividends payable
|
4,704
|
|
4,466
|
|
||||
|
Accrued payroll and employee benefits
|
8,399
|
|
9,979
|
|
||||
|
Current portion of long-term debt
|
9,864
|
|
7,989
|
|
||||
|
Due to sellers of acquired business
|
—
|
|
341
|
|
||||
|
Container deposits
|
1,241
|
|
1,174
|
|
||||
|
Other current liabilities
|
2,935
|
|
1,967
|
|
||||
|
Total current liabilities
|
60,567
|
|
55,672
|
|
||||
|
LONG-TERM DEBT, LESS CURRENT PORTION
|
90,762
|
|
94,626
|
|
||||
|
PENSION WITHDRAWAL LIABILITY
|
5,646
|
|
5,968
|
|
||||
|
OTHER LONG-TERM LIABILITIES
|
4,386
|
|
2,450
|
|
||||
|
DEFERRED INCOME TAXES
|
27,383
|
|
42,040
|
|
||||
|
Total liabilities
|
188,744
|
|
200,756
|
|
||||
|
COMMITMENTS AND CONTINGENCIES
|
—
|
|
—
|
|
||||
|
SHAREHOLDERS’ EQUITY:
|
||||||||
|
Common stock; authorized: 30,000,000 shares of $0.05 par value; 10,631,992 and 10,582,596 shares issued and outstanding for 2018 and 2017, respectively
|
532
|
|
529
|
|
||||
|
Additional paid-in capital
|
53,877
|
|
51,104
|
|
||||
|
Retained earnings
|
147,242
|
|
165,897
|
|
||||
|
Accumulated other comprehensive income
|
596
|
|
298
|
|
||||
|
Total shareholders’ equity
|
202,247
|
|
217,828
|
|
||||
|
Total liabilities and shareholders’ equity
|
$
|
390,991
|
|
$
|
418,584
|
|
||
See accompanying notes to consolidated financial statements.
27
HAWKINS, INC.
(In thousands, except share and per-share data)
|
|
Fiscal Year Ended
|
|||||||||||
|
|
April 1, 2018
|
April 2, 2017
|
April 3, 2016
|
|||||||||
|
Sales
|
$
|
504,169
|
|
$
|
483,593
|
|
$
|
413,976
|
|
|||
|
Cost of sales
|
(417,409
|
)
|
(385,520
|
)
|
(333,719
|
)
|
||||||
|
Gross profit
|
86,760
|
|
98,073
|
|
80,257
|
|
||||||
|
Selling, general and administrative expenses
|
(59,403
|
)
|
(59,381
|
)
|
(49,086
|
)
|
||||||
|
Goodwill impairment
|
(39,116
|
)
|
—
|
|
—
|
|
||||||
|
Operating (loss) income
|
(11,759
|
)
|
38,692
|
|
31,171
|
|
||||||
|
Interest expense, net
|
(3,317
|
)
|
(2,644
|
)
|
(805
|
)
|
||||||
|
(Loss) income before income taxes
|
(15,076
|
)
|
36,048
|
|
30,366
|
|
||||||
|
Income tax (expense) benefit
|
5,899
|
|
(13,493
|
)
|
(12,223
|
)
|
||||||
|
Net (loss) income
|
$
|
(9,177
|
)
|
$
|
22,555
|
|
$
|
18,143
|
|
|||
|
Weighted average number of shares outstanding-basic
|
10,607,422
|
|
10,536,347
|
|
10,524,730
|
|
||||||
|
Weighted average number of shares outstanding-diluted
|
10,643,719
|
|
10,596,110
|
|
10,578,042
|
|
||||||
|
|
||||||||||||
|
Basic (loss) earnings per share
|
$
|
(0.87
|
)
|
$
|
2.14
|
|
$
|
1.72
|
|
|||
|
Diluted (loss) earnings per share
|
$
|
(0.86
|
)
|
$
|
2.13
|
|
$
|
1.72
|
|
|||
|
Cash dividends declared per common share
|
$
|
0.88
|
|
$
|
0.84
|
|
$
|
0.80
|
|
|||
See accompanying notes to consolidated financial statements.
28
HAWKINS, INC.
CONSOLIDATED STATEMENTS OF COMPREHENSIVE (LOSS) INCOME
(In thousands)
|
|
Fiscal Year Ended
|
||||||||||
|
April 1, 2018
|
|
April 2, 2017
|
|
April 3, 2016
|
|
||||||
|
Net (loss) income
|
$
|
(9,177
|
)
|
$
|
22,555
|
|
$
|
18,143
|
|
||
|
Other comprehensive income, net of tax:
|
|||||||||||
|
Unrealized gain on available-for-sale investments
|
—
|
|
—
|
|
25
|
|
|||||
|
Unrealized gain on interest rate swap
|
296
|
|
301
|
|
—
|
|
|||||
|
Unrealized gain on post-retirement liability
|
2
|
|
2
|
|
2
|
|
|||||
|
Total other comprehensive income
|
298
|
|
303
|
|
27
|
|
|||||
|
Total comprehensive (loss) income
|
$
|
(8,879
|
)
|
$
|
22,858
|
|
$
|
18,170
|
|
||
See accompanying notes to consolidated financial statements.
29
HAWKINS, INC.
CONSOLIDATED STATEMENTS OF SHAREHOLDERS’ EQUITY
(In thousands, except share data)
|
|
Common Stock
|
Additional
Paid-in
Capital
|
Retained
Earnings
|
Accumulated Other Comprehensive Income (Loss)
|
Total
Shareholders’
Equity
|
||||||||||||||||||
|
Shares
|
Amount
|
||||||||||||||||||||||
|
BALANCE — March 29, 2015
|
10,564,949
|
|
$
|
528
|
|
$
|
50,901
|
|
$
|
142,567
|
|
$
|
(32
|
)
|
$
|
193,964
|
|
||||||
|
Cash dividends declared
|
|
|
|
(8,445
|
)
|
|
(8,445
|
)
|
|||||||||||||||
|
Share-based compensation expense
|
|
|
1,706
|
|
|
|
1,706
|
|
|||||||||||||||
|
Tax benefit on share-based compensation plans
|
|
|
(1
|
)
|
|
|
(1
|
)
|
|||||||||||||||
|
Vesting of restricted stock
|
60,658
|
|
3
|
|
(3
|
)
|
|
|
—
|
|
|||||||||||||
|
Shares surrendered for payroll taxes
|
(18,834
|
)
|
(1
|
)
|
(698
|
)
|
|
|
(699
|
)
|
|||||||||||||
|
ESPP shares issued
|
33,550
|
|
2
|
|
1,079
|
|
|
|
1,081
|
|
|||||||||||||
|
Shares repurchased
|
(127,852
|
)
|
(6
|
)
|
(4,795
|
)
|
|
|
(4,801
|
)
|
|||||||||||||
|
Other comprehensive income, net of tax
|
|
|
|
|
27
|
|
27
|
|
|||||||||||||||
|
Net income
|
|
|
|
18,143
|
|
|
18,143
|
|
|||||||||||||||
|
BALANCE — April 3, 2016
|
10,512,471
|
|
$
|
526
|
|
$
|
48,189
|
|
$
|
152,265
|
|
$
|
(5
|
)
|
$
|
200,975
|
|
||||||
|
Cash dividends declared
|
|
|
|
(8,923
|
)
|
|
(8,923
|
)
|
|||||||||||||||
|
Share-based compensation expense
|
|
|
2,127
|
|
|
|
2,127
|
|
|||||||||||||||
|
Tax benefit on share-based compensation plans
|
|
|
131
|
|
|
|
131
|
|
|||||||||||||||
|
Vesting of restricted stock
|
44,113
|
|
2
|
|
(2
|
)
|
|
|
—
|
|
|||||||||||||
|
Shares surrendered for payroll taxes
|
(12,974
|
)
|
(1
|
)
|
(630
|
)
|
|
|
(631
|
)
|
|||||||||||||
|
ESPP shares issued
|
38,986
|
|
2
|
|
1,289
|
|
|
|
1,291
|
|
|||||||||||||
|
Other comprehensive income, net of tax
|
|
|
|
|
|
|
|
303
|
|
303
|
|
||||||||||||
|
Net income
|
|
|
|
|
|
|
22,555
|
|
|
22,555
|
|
||||||||||||
|
BALANCE — April 2, 2017
|
10,582,596
|
|
$
|
529
|
|
$
|
51,104
|
|
$
|
165,897
|
|
$
|
298
|
|
$
|
217,828
|
|
||||||
|
Cash dividends declared
|
|
|
|
(9,400
|
)
|
|
(9,400
|
)
|
|||||||||||||||
|
Share-based compensation expense
|
|
|
1,371
|
|
|
|
1,371
|
|
|||||||||||||||
|
Vesting of restricted stock
|
8,092
|
|
1
|
|
(1
|
)
|
|
|
—
|
|
|||||||||||||
|
ESPP shares issued
|
41,304
|
|
2
|
|
1,403
|
|
|
|
1,405
|
|
|||||||||||||
|
Other comprehensive income, net of tax
|
|
|
|
|
|
|
(78
|
)
|
298
|
|
220
|
|
|||||||||||
|
Net loss
|
|
|
|
|
|
|
(9,177
|
)
|
|
(9,177
|
)
|
||||||||||||
|
BALANCE — April 1, 2018
|
10,631,992
|
|
$
|
532
|
|
$
|
53,877
|
|
$
|
147,242
|
|
$
|
596
|
|
$
|
202,247
|
|
||||||
See accompanying notes to consolidated financial statements.
30
HAWKINS, INC.
(In thousands)
|
|
Fiscal Year Ended
|
|||||||||||
|
|
April 1, 2018
|
April 2, 2017
|
April 3, 2016
|
|||||||||
|
CASH FLOWS FROM OPERATING ACTIVITIES:
|
||||||||||||
|
Net (loss) income
|
$
|
(9,177
|
)
|
$
|
22,555
|
|
$
|
18,143
|
|
|||
|
Reconciliation to cash flows:
|
||||||||||||
|
Depreciation and amortization
|
22,390
|
|
20,875
|
|
15,511
|
|
||||||
|
Amortization of debt issuance costs
|
136
|
|
136
|
|
34
|
|
||||||
|
Gain on deferred compensation assets
|
(92
|
)
|
—
|
|
—
|
|
||||||
|
Loss on disposal of investments
|
—
|
|
—
|
|
104
|
|
||||||
|
Goodwill Impairment
|
39,116
|
|
—
|
|
—
|
|
||||||
|
Deferred income taxes
|
(14,757
|
)
|
(525
|
)
|
1,103
|
|
||||||
|
Share-based compensation expense
|
1,371
|
|
2,127
|
|
1,706
|
|
||||||
|
(Gain) loss from property disposals
|
(46
|
)
|
322
|
|
(33
|
)
|
||||||
|
Changes in operating accounts (using) providing cash, net of effects of acquisition:
|
||||||||||||
|
Trade receivables
|
(6,164
|
)
|
2,259
|
|
(2,950
|
)
|
||||||
|
Inventories
|
(8,487
|
)
|
(3,529
|
)
|
(322
|
)
|
||||||
|
Accounts payable
|
4,157
|
|
562
|
|
3,831
|
|
||||||
|
Accrued liabilities
|
1,674
|
|
(416
|
)
|
242
|
|
||||||
|
Income taxes
|
(1,711
|
)
|
569
|
|
(701
|
)
|
||||||
|
Other
|
(1,061
|
)
|
(80
|
)
|
(335
|
)
|
||||||
|
Net cash provided by operating activities
|
27,349
|
|
44,855
|
|
36,333
|
|
||||||
|
CASH FLOWS FROM INVESTING ACTIVITIES:
|
||||||||||||
|
Additions to property, plant, and equipment
|
(19,703
|
)
|
(21,616
|
)
|
(24,183
|
)
|
||||||
|
Purchases of investments
|
—
|
|
—
|
|
(6,091
|
)
|
||||||
|
Sale and maturities of investments
|
—
|
|
—
|
|
37,763
|
|
||||||
|
Proceeds from property disposals
|
364
|
|
324
|
|
358
|
|
||||||
|
Acquisitions, net of cash acquired
|
—
|
|
(2,199
|
)
|
(159,199
|
)
|
||||||
|
Net cash used in investing activities
|
(19,339
|
)
|
(23,491
|
)
|
(151,352
|
)
|
||||||
|
CASH FLOWS FROM FINANCING ACTIVITIES:
|
||||||||||||
|
Cash dividends paid
|
(9,161
|
)
|
(8,683
|
)
|
(8,257
|
)
|
||||||
|
New shares issued
|
1,405
|
|
1,291
|
|
1,081
|
|
||||||
|
Excess tax benefit from share-based compensation
|
—
|
|
131
|
|
(1
|
)
|
||||||
|
Shares surrendered for payroll taxes
|
—
|
|
(631
|
)
|
(699
|
)
|
||||||
|
Shares repurchased
|
—
|
|
—
|
|
(4,801
|
)
|
||||||
|
Payments on senior secured term loan
|
(8,125
|
)
|
(5,625
|
)
|
(1,250
|
)
|
||||||
|
Payments on senior secured revolving credit facility
|
(21,000
|
)
|
(21,000
|
)
|
—
|
|
||||||
|
Payments for debt issuance costs
|
—
|
|
—
|
|
(679
|
)
|
||||||
|
Proceeds from long-term borrowings
|
—
|
|
—
|
|
100,000
|
|
||||||
|
Proceeds from revolver borrowings
|
27,000
|
|
—
|
|
31,000
|
|
||||||
|
Net cash (used in) provided by financing activities
|
(9,881
|
)
|
(34,517
|
)
|
116,394
|
|
||||||
|
NET (DECREASE) INCREASE IN CASH AND CASH EQUIVALENTS
|
(1,871
|
)
|
(13,153
|
)
|
1,375
|
|
||||||
|
CASH AND CASH EQUIVALENTS - beginning of year
|
6,861
|
|
20,014
|
|
18,639
|
|
||||||
|
CASH AND CASH EQUIVALENTS - end of year
|
$
|
4,990
|
|
$
|
6,861
|
|
$
|
20,014
|
|
|||
|
SUPPLEMENTAL DISCLOSURES OF CASH FLOW INFORMATION-
|
||||||||||||
|
Cash paid during the year for income taxes
|
$
|
10,232
|
|
$
|
13,421
|
|
$
|
11,811
|
|
|||
|
Cash paid for interest
|
3,025
|
|
2,341
|
|
702
|
|
||||||
|
Noncash investing activities - Capital expenditures in accounts payable
|
468
|
|
958
|
|
1,884
|
|
||||||
|
Acquisition consideration accrued but not paid
|
—
|
|
—
|
|
2,200
|
|
||||||
See accompanying notes to consolidated financial statements.
31
HAWKINS, INC.
NOTES TO CONSOLIDATED FINANCIAL STATEMENTS
Nature of Business -
We have
three
reportable segments: Industrial, Water Treatment and Health and Nutrition. The Industrial Group specializes in providing industrial chemicals, products and services to industries such as agriculture, chemical processing, electronics, energy, food, pharmaceutical, plating and power generation. This group also manufactures and sells certain food-grade products, including liquid phosphates, lactates and other blended products. The Water Treatment Group specializes in providing chemicals, equipment and solutions for potable water, municipal and industrial wastewater, industrial process water and non-residential swimming pool water. This group has the resources and flexibility to treat systems ranging in size from a single small well to a multi-million-gallon-per-day facility. We established the Health and Nutrition segment of our business in December 2015 through our acquisition of Stauber Performance Ingredients (“Stauber”). Our Health and Nutrition Group specializes in providing ingredient distribution, processing and formulation solutions to manufacturers of nutraceutical, functional food and beverage, personal care, dietary supplement and other nutritional food and health and wellness products. This group offers a diverse product portfolio including minerals, botanicals and herbs, vitamins and amino acids, excipients, joint products, sweeteners and enzymes.
Fiscal Year -
Our fiscal year is a 52 or 53-week year ending on the Sunday closest to March 31. Our fiscal years ended April 1, 2018 (“fiscal 2018”) and April 2, 2017 (“fiscal 2017”) were 52 weeks. Our fiscal year ended April 3, 2016 (“fiscal 2016”) was 53 weeks. The fiscal year ending March 31, 2019 (“fiscal 2019”) will be 52 weeks.
Principles of Consolidation -
The consolidated financial statements include the accounts of Hawkins, Inc. and its wholly-owned subsidiaries. All intercompany transactions and accounts have been eliminated.
Estimates
-
The preparation of financial statements in conformity with U.S. generally accepted accounting principles (“GAAP”) requires management to make estimates and assumptions that affect the reported amounts of assets and liabilities and disclosure of contingent assets and liabilities at the date of the financial statements and the reported amounts of revenues and expenses during the reported period. Actual results could differ from those estimates.
Revenue Recognition -
We recognize revenue when there is evidence that the customer has agreed to purchase the product, the price and terms of the sale are fixed, the product has shipped and title has passed to our customer, performance has occurred, and collection of the receivable is reasonably assured.
Shipping and Handling -
All shipping and handling amounts billed to customers are included in revenues. Costs incurred related to the shipping and the handling of products are included in cost of sales.
Fair Value Measurements -
The financial assets and liabilities that are re-measured and reported at fair value for each reporting period are an interest rate swap and marketable securities. There are no fair value measurements with respect to nonfinancial assets or liabilities that are recognized or disclosed at fair value in our consolidated financial statements on a recurring basis.
Assets and liabilities measured at fair value are classified using the following hierarchy, which is based upon the transparency of inputs to the valuation as of the measurement date:
Level 1:
Valuation is based on observable inputs such as quoted market prices (unadjusted) for identical assets or liabilities in active markets.
Level 2:
Valuation is based on inputs such as quoted market prices for similar assets or liabilities in active markets or other inputs that are observable for the asset or liability, either directly or indirectly, for substantially the full term of the financial instrument.
Level 3:
Valuation is based upon other unobservable inputs that are significant to the fair value measurement.
In making fair value measurements, observable market data must be used when available. When inputs used to measure fair value fall within different levels of the hierarchy, the level within which the fair value measurement is categorized is based on the lowest level input that is significant to the fair value measurement.
Cash Equivalents -
Cash equivalents include all liquid debt instruments (primarily cash funds and money market accounts) purchased with an original maturity of three months or less. The balances maintained at financial institutions may, at times, exceed
32
HAWKINS, INC.
NOTES TO CONSOLIDATED FINANCIAL STATEMENTS
— (Continued)
federally insured limits. Our cash balances are held at two separate financial institutions where the cash balances may exceed federally insured limits. The institutions are two of the largest commercial banking institutions in the country and both have maintained strong credit ratings.
Trade Receivables and Concentrations of Credit Risk -
Financial instruments, which potentially subject us to a concentration of credit risk, principally consist of trade receivables. We sell our principal products to a large number of customers in many different industries. There are no concentrations of credit risk with a single customer from a particular service or geographic area that would significantly impact us in the near term. To reduce credit risk, we routinely assess the financial strength of our customers. We record an allowance for doubtful accounts to reduce our receivables to an amount we estimate is collectible from our customers. Estimates used in determining the allowance for doubtful accounts are based on historical collection experience, current trends, aging of accounts receivable and periodic evaluations of our customers’ financial condition.
Inventories -
Inventories, consisting primarily of finished goods, are primarily valued at the lower of cost or net realizable value, with cost for approximately
67%
of our inventory determined using the last-in, first-out (“LIFO”) method. Cost for the other
33%
of our total inventory is determined using the first-in, first-out (“FIFO”) method.
Property, Plant and Equipment -
Property is stated at cost and depreciated or amortized over the lives of the assets, using the straight-line method. Estimated lives are:
10
to
40
years for buildings and improvements;
3
to
20
years for machinery and equipment; and
3
to
10
years for transportation equipment and office furniture and equipment including computer systems. Leasehold improvements are depreciated over the lesser of their estimated useful lives or the remaining lease term.
Significant improvements that add to productive capacity or extend the lives of properties are capitalized. Costs for repairs and maintenance are charged to expense as incurred. When property is retired or otherwise disposed of, the cost and related accumulated depreciation or amortization are removed from the accounts and any related gains or losses are included in income.
We review the recoverability of long-lived assets to be held and used, such as property, plant and equipment, when events or changes in circumstances occur that indicate the carrying value of the asset group may not be recoverable, such as prolonged industry downturn or significant reductions in projected future cash flows. The assessment of possible impairment is based on our ability to recover the carrying value of the asset group from the expected future pre-tax cash flows (undiscounted) of the related operations. If these cash flows are less than the carrying value of such asset group, an impairment loss would be measured by the amount the carrying value exceeds the fair value of the long-lived asset group. The measurement of impairment requires us to estimate future cash flows and the fair value of long-lived assets. No long-lived assets were determined to be impaired during fiscal years
2018
,
2017
or
2016
.
Goodwill and Identifiable Intangible Assets -
Goodwill represents the excess of the cost of acquired businesses over the fair value of identifiable tangible net assets and identifiable intangible assets purchased. Goodwill is tested at least annually for impairment, and is tested for impairment more frequently if events or changes in circumstances indicate that the asset might be impaired. Our annual test for impairment is as of the first day of our fourth fiscal quarter. As of January 1, 2018, we performed an analysis of qualitative factors for our Industrial and Water Treatment reporting units to determine whether it is more likely than not that the fair value of either of these reporting units was less than its carrying amount as a basis for determining whether it is necessary to perform a quantitative goodwill impairment test. Based on management’s analysis of qualitative factors, we determined that it was not necessary to perform a quantitative goodwill impairment test for either the Industrial or Water Treatment reporting units.
We performed a quantitative goodwill impairment test for our Health and Nutrition reporting unit. This test, used to identify potential impairment, compares the fair value of the reporting unit with its carrying amount, including indefinite-lived intangible assets. If the fair value exceeds the carrying amount, the goodwill is not considered impaired. If the carrying amount exceeds the fair value, the reporting unit’s goodwill is considered impaired, and we must recognize an impairment charge for the amount by which the carrying amount exceeds the reporting unit’s fair value. The fair value of our Health and Nutrition reporting was less than the carrying value as of January 1, 2018, and accordingly we recorded an impairment charge of
$39.1 million
in the fourth quarter of fiscal 2018. The impairment charge was a result of changes in expectations for future growth as part of our fourth quarter long-term strategic planning process to align with historical experience in recent periods and expected changes in future product mix.
Our primary identifiable intangible assets include customer lists, trade secrets, non-competition agreements, trademarks and trade names acquired in previous business acquisitions. Identifiable intangible assets with finite lives are amortized whereas identifiable intangible assets with indefinite lives are not amortized. The values assigned to the intangible assets with finite lives are being amortized on average over approximately
14 years
. Identifiable intangible assets that are subject to amortization are evaluated for
33
HAWKINS, INC.
NOTES TO CONSOLIDATED FINANCIAL STATEMENTS
— (Continued)
impairment whenever events or changes in circumstances indicate that the carrying amount may not be recoverable. Identifiable intangible assets not subject to amortization are tested for impairment annually or more frequently if events warrant. The impairment test consists of a qualitative assessment to determine whether it is more likely than not that the asset is impaired. Based on management’s analysis of qualitative factors, we determined that it was not necessary to perform a quantitative impairment test for fiscal
2018
for our Industrial and Water Treatment reporting units. We completed a quantitative assessment for our Health and Nutrition reporting unit during the fourth quarter of fiscal 2018 and concluded that no impairment was required because the expected future pre-tax cash flows (undiscounted) from the asset group exceed the carrying value of the assets.
Impairment assessments were also completed in the fourth quarters of fiscal
2017
and
2016
, which resulted in no impairment charges for either of these fiscal years.
Income Taxes -
The Company accounts for income taxes under the asset and liability method, which requires the recognition of deferred tax assets and liabilities for the expected future tax consequences of events that have been included in the financial statements. Under this method, deferred tax assets and liabilities are determined on the basis of the differences between the financial statements and tax basis of assets and liabilities using enacted tax rates in effect for the year in which the differences are expected to reverse. The effect of a change in tax rates on deferred tax assets and liabilities is recognized in income tax expense in the period that includes the enactment date. The deferred tax assets and liabilities are analyzed regularly and management assesses the likelihood that deferred tax assets will be recovered from future taxable income. We record any interest and penalties related to income taxes as income tax expense in the consolidated statements of income.
The effects of income tax positions are recognized only if those positions are more likely than not of being sustained. Changes in recognition or measurement are made as facts and circumstances change. See note 12 for further information regarding the recording of a liability and offsetting receivable regarding an uncertain tax position taken by Stauber prior to its acquisition by us.
Stock-Based Compensation -
We account for stock-based compensation on a fair value basis. The estimated grant date fair value of each stock-based award is recognized in expense over the requisite service period (generally the vesting period). Non-vested share awards are recorded as expense over the requisite service periods based on the market value on the date of grant.
Earnings Per Share -
Basic earnings per share (“EPS”) are computed by dividing net income by the weighted-average number of common shares outstanding. Diluted EPS are computed by dividing net income by the weighted-average number of common shares outstanding including the incremental shares assumed to be issued as performance units and restricted stock. Basic and diluted EPS were calculated using the following:
|
April 1, 2018
|
April 2, 2017
|
April 3, 2016
|
|||||||
|
Weighted average common shares outstanding — basic
|
10,607,422
|
|
10,536,347
|
|
10,524,730
|
|
|||
|
Dilutive impact of stock performance units and restricted stock
|
36,297
|
|
59,763
|
|
53,312
|
|
|||
|
Weighted average common shares outstanding — diluted
|
10,643,719
|
|
10,596,110
|
|
10,578,042
|
|
|||
There were no shares or stock options excluded from the calculation of weighted average common shares for diluted EPS for fiscal 2018, 2017, or 2016.
Derivative Instruments and Hedging Activities -
We are subject to interest rate risk associated with our variable rate debt. During fiscal 2017, we entered into an interest rate swap which was has been designated as a cash flow hedge, the purpose of which is to eliminate the cash flow impact of interest rate changes on a portion of our variable-rate debt starting in September 2017. The hedge was measured at fair value on the contract date and subsequently remeasured to fair value at each reporting date. Changes in the fair value of a derivative that is highly effective, and that is designated and qualifies as a cash flow hedge, are recorded in other comprehensive income, until the consolidated statement of income is affected by the variability in cash flows of the designated hedged item. To the extent that the hedge is ineffective, changes in the fair value are recognized in the Statement of Income.
Recently Adopted Accounting Pronouncements
In February 2018, the Financial Accounting Standards Board (“FASB”) issued ASU 2018-02 which allows a reclassification from accumulated other comprehensive income to retained earnings for stranded tax effects resulting from the Tax Cuts and Jobs Act of 2017 (the “Tax Act”). Hawkins early adopted this standard during the fourth quarter of fiscal 2018 and reclassified approximately $0.1 million from other comprehensive income to retained earnings.
34
HAWKINS, INC.
NOTES TO CONSOLIDATED FINANCIAL STATEMENTS
— (Continued)
In December 2017, the Securities and Exchange Commission (“SEC”) staff issued Staff Accounting Bulletin No. 118 (“SAB 118”) to address the application of U.S. GAAP related to the enactment of the Tax Act. This guidance was adopted in the third quarter of fiscal 2018. Additional information regarding our adoption of this guidance is contained in Note 12.
In March 2016, the FASB issued ASU 2016-09, which provides accounting guidance intended to improve the accounting for share-based payment transactions. This guidance outlines new provisions intended to simplify various aspects related to accounting for share-based payments and their presentation in the financial statements. We adopted this guidance in the first quarter of fiscal 2018. We will continue to estimate forfeitures as we determine compensation cost each period. The primary impact on our consolidated financial statements is the recognition of excess tax benefits in the provision for income taxes rather than additional paid-in capital, which may result in increased volatility in the reported amounts of income tax expense and net income.
In July 2015, the FASB issued ASU 2015-11, which requires companies to change the measurement principal for inventory measured using the first-in, first-out (“FIFO”) or average cost method from the lower of cost or market to the lower of cost and net realizable value. Treatment of inventory valued under the last-in, last-out (“LIFO”) method is unchanged by this guidance. We adopted this guidance in the first quarter of fiscal 2018 and there was no impact to our financial position or results of operations.
In January 2017, the FASB issued ASU 2017-04 which simplifies the accounting for goodwill impairment. The guidance removes step two of the goodwill impairment test, which required a hypothetical purchase price allocation. We adopted this guidance in the fourth quarter of fiscal 2017.
Acquisition of Stauber Performance Ingredients:
On December 23, 2015, we acquired Stauber for
$157.0 million
on a cash-free, debt-free basis subject to a customary working capital adjustment. The total consideration for the acquisition was
$158.2 million
(
$156.7 million
net of cash acquired). We paid
$156.0 million
in cash at closing and paid an additional
$2.2 million
in early fiscal 2017 based upon closing cash, debt and working capital balances. The purchase was funded with
$131.0 million
of proceeds from the credit facility described more fully in Note 7 as well as cash on hand.
The results of operations since the acquisition date, and the assets, including the goodwill associated with the acquisition, are included in our Health and Nutrition operating segment, which we established as a result of this acquisition. Direct acquisition costs of
$3.3 million
, consisting mainly of professional and consulting fees, were expensed as incurred during fiscal 2016, and are classified as selling, general, and administrative expenses in our consolidated statement of income, and are reported in our Health and Nutrition segment.
The acquisition was accounted for under the acquisition method of accounting. Accordingly, the cost to acquire Stauber was allocated to the underlying net assets in proportion to estimates of their respective fair values. The final valuation of assets acquired and liabilities assumed was completed in the third quarter of fiscal 2017. The following table summarizes the fair value measurement of the assets acquired and liabilities assumed as of the acquisition date:
35
HAWKINS, INC.
NOTES TO CONSOLIDATED FINANCIAL STATEMENTS
— (Continued)
|
(In thousands)
|
Amount
|
|||
|
Cash and cash equivalents (a)
|
$
|
1,502
|
|
|
|
Trade receivables
|
16,023
|
|
||
|
Inventories
|
10,207
|
|
||
|
Other assets
|
900
|
|
||
|
Property, plant, and equipment
|
10,989
|
|
||
|
Intangible assets
|
71,459
|
|
||
|
Accounts payable
|
(5,398
|
)
|
||
|
Accrued expenses and other current liabilities (a)
|
(2,925
|
)
|
||
|
Deferred income taxes
|
(28,565
|
)
|
||
|
Other non-current liabilities
|
(77
|
)
|
||
|
Net assets acquired
|
74,115
|
|
||
|
Goodwill
|
84,061
|
|
||
|
Total preliminary purchase price
|
158,176
|
|
||
|
Less acquired cash
|
(1,502
|
)
|
||
|
Preliminary purchase price, net of cash acquired
|
$
|
156,674
|
|
|
(a) In addition to these balances,
$7.3 million
of cash and current accrued liabilities were recorded that relate to stock and other acquisition-related compensation payments, which were recorded by Stauber as of the acquisition date but were paid subsequent to the acquisition date.
The following pro forma information has been prepared as if the Stauber acquisition and the borrowing to finance the acquisition had occurred as of the beginning of the fiscal year presented. The unaudited pro forma information is not necessarily indicative of what our consolidated results of operations actually would have been had the acquisition occurred at the beginning of the earliest fiscal year presented, nor is it indicative of our future operational results.
|
|
Fiscal year ended April 3, 2016
|
||||||||||
|
(In thousands, except per share data)
|
As reported
|
Pro Forma Stauber Adjustments
|
Combined Pro Forma Results
|
||||||||
|
Pro forma net sales
|
$
|
413,976
|
|
$
|
87,691
|
|
$
|
501,667
|
|
||
|
Pro forma net income
|
18,143
|
|
4,809
|
|
22,952
|
|
|||||
|
|
|||||||||||
|
Pro forma basic earnings per share
|
$
|
1.72
|
|
$
|
0.46
|
|
$
|
2.18
|
|
||
|
Pro forma diluted earnings per share
|
$
|
1.72
|
|
$
|
0.45
|
|
$
|
2.17
|
|
||
The unaudited pro forma financial information above is adjusted to reflect the following: (a) interest expense, including amortization of debt issuance costs, related to the
$131.0 million
of debt used to fund the acquisition; (b) amortization expense related to the
$71.5 million
of identifiable intangible assets recognized in conjunction with the acquisition; (c) elimination of amortization of intangibles and interest expense previously reflected on Stauber’s financial statements; (d) elimination of stock and other acquisition-related compensation recorded by Stauber, and transaction-related expenses recorded by us; and (e) recording income taxes at an estimated combined federal and state statutory rate of approximately
38%
on these pre-tax adjustments.
Acquisition of Davis Supply, Inc.
:
On September 18, 2015, we acquired substantially all of the assets of Davis Supply, Inc. (“Davis”) under the terms of an asset purchase agreement with Davis and its shareholders. We paid
$4.5 million
in cash at closing, using available cash on hand to fund the acquisition. Davis was a water treatment chemical distribution company operating in Florida with revenues of approximately
$5.0 million
in calendar year 2014. We have integrated this business into our existing Florida locations. The results of operations after the date of acquisition and the acquired assets are included in our Water Treatment Segment.
36
HAWKINS, INC.
NOTES TO CONSOLIDATED FINANCIAL STATEMENTS
— (Continued)
In fiscal 2017, we entered into an interest rate swap agreement to manage the risk associated with a portion of our variable-rate debt. We do not utilize derivative instruments for speculative purposes. The interest rate swap involves the exchange of fixed-rate and variable-rate payments without the exchange of the underlying notional amount on which the interest payments are calculated. The swap agreement began September 1, 2017, and will terminate concurrently with the expiration of our credit facility on December 23, 2020. The notional amount of the swap agreement is
$40 million
from September 1, 2017 through August 31, 2018,
$30 million
from September 1, 2018 through August 31, 2019 and
$20 million
from September 1, 2019 through December 23, 2020. We have designated this swap as a cash flow hedge and have determined that it qualifies for hedge accounting treatment. For so long as the hedge is effective, changes in fair value of the cash flow hedge are recorded in other comprehensive loss (net of tax) until income or loss from the cash flows of the hedged item is realized.
For each of the years ended April 1, 2018 and April 2, 2017, we recorded
$0.3 million
in other comprehensive income related to unrealized gains (net of tax) on the cash flow hedge. Included in other long-term assets on our condensed consolidated balance sheet was
$0.8 million
as of April 1, 2018 and
$0.5 million
as of April 2, 2017.
No
amounts were reflected in other comprehensive income related to cash flow hedges for the fiscal year ended April 3, 2016 or on the condensed consolidated balance sheet as of April 3, 2016, as we did not hold any derivative instruments at that time.
By their nature, derivative instruments are subject to market risk. Derivative instruments are also subject to credit risk associated with counterparties to the derivative contracts. Credit risk associated with derivatives is measured based on the replacement cost should the counterparty with a contract in a gain position to us fail to perform under the terms of the contract. We do not anticipate nonperformance by the counterparty.
Our financial assets and liabilities are measured at fair value as the price that would be received to sell an asset or paid to transfer a liability in an orderly transaction between market participants at the measurement date (exit price). The carrying value of cash equivalents, accounts receivable, accounts payable, and accrued expenses approximate fair value because of the short-term nature of these instruments. Because of the variable-rate nature of our debt under our credit facility, our debt also approximates fair value. We classify the inputs used to measure fair value into the following hierarchy:
|
|
|
|
|
Level 1:
|
|
Quoted prices in active markets for identical assets or liabilities.
|
|
Level 2:
|
|
Quoted prices in active markets for similar assets or liabilities, or quoted prices for identical or similar assets or liabilities in markets that are not active, or inputs other than quoted prices that are observable or can be corroborated by observable market data for the asset or liability.
|
|
Level 3:
|
|
Unobservable inputs for the asset or liability that are supported by little or no market activity. These fair values are determined using pricing models for which the assumptions utilize management’s estimates or market participant assumptions.
|
Assets and Liabilities Measured at Fair Value on a Recurring Basis.
The fair value hierarchy requires the use of observable market data when available. In instances where inputs used to measure fair value fall into different levels of the fair value hierarchy, the fair value measurement has been determined based on the lowest level input that is significant to the fair value measurement in its entirety. Our assessment of the significance of a particular item to the fair value measurement in its entirety requires judgment, including the consideration of inputs specific to the asset or liability.
Our financial assets that are measured at fair value on a recurring basis are an interest rate swap and assets held in a deferred compensation retirement plan. Both of these assets are classified as other long-term assets on our balance sheet, with the portion of the deferred compensation retirement plan assets expected to be paid within twelve months reclassified to current assets. The fair value of the interest rate swap is determined by the respective counterparties based on interest rate changes. Interest rate swaps are valued based on observable interest rate yield curves for similar instruments. The deferred compensation plan assets relate to contributions made to a non-qualified compensation plan, established in fiscal 2017, on behalf of certain employees who are classified as “highly compensated employees” as determined by IRS guidelines. The assets are part of a rabbi trust and the funds are held in mutual funds. The fair value of the deferred compensation is based on the quoted market prices for the mutual funds at the end of the period.
37
HAWKINS, INC.
NOTES TO CONSOLIDATED FINANCIAL STATEMENTS
— (Continued)
The following table summarizes the balances of assets or liabilities measured at fair value on a recurring basis as of April 1, 2018 and April 2, 2017.
0
|
April 1, 2018
|
||||||||||||
|
(In thousands)
|
Level 1
|
Level 2
|
Level 3
|
|||||||||
|
Interest rate swap
|
—
|
|
$
|
819
|
|
—
|
|
|||||
|
Deferred compensation plan assets
|
$
|
1,392
|
|
—
|
|
—
|
|
|||||
|
April 2, 2017
|
|||||||||||
|
(In thousands)
|
Level 1
|
Level 2
|
Level 3
|
||||||||
|
Interest rate swap
|
—
|
|
$
|
502
|
|
—
|
|
||||
|
Deferred compensation plan assets
|
—
|
|
—
|
|
—
|
|
|||||
Inventories at
April 1, 2018
and
April 2, 2017
consisted of the following:
|
2018
|
2017
|
|||||||
|
(In thousands)
|
|
|
||||||
|
Inventory (FIFO basis)
|
$
|
65,322
|
|
$
|
52,735
|
|
||
|
LIFO reserve
|
(5,586
|
)
|
(1,486
|
)
|
||||
|
Net inventory
|
$
|
59,736
|
|
$
|
51,249
|
|
||
The FIFO value of inventories accounted for under the LIFO method was
$44.0 million
at
April 1, 2018
and
$37.0
million at
April 2, 2017
. The remainder of the inventory was valued and accounted for under the FIFO method.
We increased the LIFO reserve by
$4.1 million
in fiscal
2018
due to an increase in per-unit inventory costs of certain bulk commodity products and higher volumes of certain inventory on hand. In fiscal
2017
, the LIFO reserve decreased by
$2.7 million
due to an overall reduction in inventory costs per unit and lower volumes of certain inventory on hand.
The changes in the carrying amount of goodwill for each of our
three
reportable segments were as follows:
|
(In thousands)
|
Industrial
|
Water Treatment
|
Health and Nutrition
|
Total
|
||||||||
|
Balance as of April 3, 2016
|
$
|
6,495
|
|
$
|
7,000
|
|
$
|
84,229
|
|
$
|
97,724
|
|
|
Final purchase price adjustment for prior-year acquisition
|
—
|
|
—
|
|
(168
|
)
|
(168
|
)
|
||||
|
Balance as of April 2, 2017
|
6,495
|
|
7,000
|
|
84,061
|
|
97,556
|
|
||||
|
Impairment
|
—
|
|
—
|
|
(39,116
|
)
|
(39,116
|
)
|
||||
|
Balance as of April 1, 2018
|
$
|
6,495
|
|
$
|
7,000
|
|
$
|
44,945
|
|
$
|
58,440
|
|
|
|
||||||||||||
38
HAWKINS, INC.
NOTES TO CONSOLIDATED FINANCIAL STATEMENTS
— (Continued)
The following is a summary of our identifiable intangible assets as of
April 1, 2018
and
April 2, 2017
:
|
|
2018
|
|||||||||||
|
|
Gross Amount
|
Accumulated
Amortization
|
Net carrying value
|
|||||||||
|
(In thousands)
|
|
|
|
|||||||||
|
Finite-life intangible assets:
|
||||||||||||
|
Customer relationships
|
$
|
78,383
|
|
$
|
(12,419
|
)
|
$
|
65,964
|
|
|||
|
Trademarks and trade names
|
6,045
|
|
(2,490
|
)
|
3,555
|
|
||||||
|
Other finite-life intangible assets
|
3,648
|
|
(3,215
|
)
|
433
|
|
||||||
|
Total finite-life intangible assets
|
88,076
|
|
(18,124
|
)
|
69,952
|
|
||||||
|
Indefinite-life intangible assets
|
1,227
|
|
—
|
|
1,227
|
|
||||||
|
Total intangible assets, net
|
$
|
89,303
|
|
$
|
(18,124
|
)
|
$
|
71,179
|
|
|||
|
|
2017
|
|||||||||||
|
|
Gross Amount
|
Accumulated
Amortization
|
Net carrying value
|
|||||||||
|
(In thousands)
|
|
|
|
|||||||||
|
Finite-life intangible assets:
|
||||||||||||
|
Customer relationships
|
$
|
78,383
|
|
$
|
(7,854
|
)
|
$
|
70,529
|
|
|||
|
Trademarks and trade names
|
6,045
|
|
(1,790
|
)
|
4,255
|
|
||||||
|
Other finite-life intangible assets
|
3,648
|
|
(2,776
|
)
|
872
|
|
||||||
|
Total finite-life intangible assets
|
88,076
|
|
(12,420
|
)
|
75,656
|
|
||||||
|
Indefinite-life intangible assets
|
1,227
|
|
—
|
|
1,227
|
|
||||||
|
Total intangible assets, net
|
$
|
89,303
|
|
$
|
(12,420
|
)
|
$
|
76,883
|
|
|||
Intangible asset amortization expense was
$5.7 million
during fiscal
2018
,
$6.1 million
during fiscal
2017
, and
$2.4 million
during fiscal
2016
.
The estimated future amortization expense for identifiable intangible assets during the next five years is as follows:
|
(In thousands)
|
2019
|
2020
|
2021
|
2022
|
2023
|
|||||||||||||||
|
Estimated amortization expense
|
$
|
5,454
|
|
$
|
5,073
|
|
$
|
5,028
|
|
$
|
4,891
|
|
$
|
4,891
|
|
|||||
In December 2015, in connection with the Stauber acquisition described more fully in Note 2, we entered into a credit agreement (the “Credit Agreement”) with U.S. Bank National Association (“U.S. Bank”), as Lead Arranger, and Sole Bookrunner, and other lenders from time to time party thereto (collectively, the “Lenders”), whereby U.S. Bank is also serving as Administrative Agent. The Credit Agreement included senior secured credit facilities (the “Credit Facility”) totaling
$165.0 million
, consisting of a
$100.0 million
senior secured term loan credit facility (the “Term Loan Facility”) and a
$65.0 million
senior secured revolving loan credit facility (the “Revolving Loan Facility”). The Revolving Loan Facility includes a letter of credit subfacility in the amount of
$5.0 million
and a swingline subfacility in the amount of
$8.0 million
. The Term Loan facility requires mandatory quarterly repayments as outlined in the table below with the remainder of the loan due at maturity. The Credit Facility is scheduled to terminate on December 23, 2020. The Credit Facility is secured by substantially all of our personal property assets and those of our subsidiaries.
Borrowings under the Credit Facility bear interest at a rate per annum equal to one of the following, plus, in both cases, an applicable margin based upon our leverage ratio: (a) LIBOR for an interest period of one, two, three or six months as selected by us, reset at the end of the selected interest period, or (b) a base rate determined by reference to the highest of (1) U. S. Bank’s prime rate, (2) the Federal Funds Effective Rate plus
0.5%
, or (3) one-month LIBOR for U.S. dollars plus
1.0%
. The LIBOR margin is
1.125%
,
1.25%
or
1.5%
, depending on our leverage ratio. The base rate margin is
0.125%
,
0.25%
or
0.5%
, depending on our leverage ratio. At
April 1, 2018
, the effective interest rate on our borrowings was approximately
3.8%
.
39
HAWKINS, INC.
NOTES TO CONSOLIDATED FINANCIAL STATEMENTS
— (Continued)
We used
$131.0 million
of the proceeds from the Credit Facility to fund our acquisition of Stauber. We may use the remaining
$34.0 million
for working capital, capital expenditures, restricted payments and acquisitions permitted under the Credit Facility, and other general corporate purposes.
In addition to paying interest on the outstanding principal under the Credit Facility, we are required to pay a commitment fee on the unutilized commitments thereunder. The commitment fee is
0.25%
to
0.3%
, depending on our leverage ratio.
Debt issuance costs of
$0.7 million
paid to the lenders are reflected as a reduction of debt and are being amortized on a straight line basis over the term of the credit facility. Amortization of debt issuance costs was
$0.1 million
for each of fiscal 2018 and fiscal 2017 and immaterial for fiscal 2016. As of
April 1, 2018
and April 2, 2017,
$0.4 million
and
$0.5 million
of debt issuance costs were reflected as a reduction of debt on our balance sheet.
The Credit Agreement requires us to maintain (a) a minimum fixed charge coverage ratio of
1.15
to
1.00
and (b) a maximum total cash flow leverage ratio of
3.0
to
1.0
. The Credit Agreement also contains other customary affirmative and negative covenants, including covenants that restrict our ability to incur additional indebtedness, dispose of significant assets, make certain investments, including any acquisitions other than permitted acquisitions, make certain payments, enter into sale and leaseback transactions, grant liens on our assets or enter into rate management transactions, subject to certain limitations. We are permitted to make distributions, pay dividends and repurchase shares so long as no default or event of default exists or would exist as a result thereof. As of April 1, 2018, we were in compliance with all required covenants.
Debt at
April 1, 2018
and
April 2, 2017
consisted of the following:
|
(In thousands)
|
April 1, 2018
|
April 2, 2017
|
||||||
|
Senior secured term loan
|
$
|
85,000
|
|
$
|
93,125
|
|
||
|
Senior secured revolver
|
16,000
|
|
10,000
|
|
||||
|
Total debt
|
101,000
|
|
103,125
|
|
||||
|
Less: unamortized debt issuance costs
|
(374
|
)
|
(510
|
)
|
||||
|
Total debt, net of debt issuance costs
|
100,626
|
|
102,615
|
|
||||
|
Less: current portion of long-term debt, net of current unamortized debt issuance costs
|
(9,864
|
)
|
(7,989
|
)
|
||||
|
Total long-term debt
|
$
|
90,762
|
|
$
|
94,626
|
|
||
Scheduled annual maturities of debt as of
April 1, 2018
are as follows:
|
Fiscal year ending
|
(In thousands)
|
|||
|
2019
|
$
|
10,000
|
|
|
|
2020
|
10,000
|
|
||
|
2021
|
81,000
|
|
||
|
$
|
101,000
|
|
||
Performance-Based Restricted Stock Units.
Our Board of Directors has approved a performance-based equity compensation arrangement for our executive officers. This performance-based arrangement provides for the grant of performance-based restricted stock units that represent a possible future issuance of restricted shares of our common stock based on our pre-tax income target for the applicable fiscal year. The actual number of restricted shares to be issued to each executive officer will be determined when our final financial information becomes available after the applicable fiscal year and will be between
zero
shares and
52,920
shares in the aggregate for fiscal
2018
. The restricted shares issued will fully vest
two
years after the last day of the fiscal year on which the performance is based. We are recording the compensation expense for the outstanding performance share units and then-converted restricted stock over the life of the awards.
40
HAWKINS, INC.
NOTES TO CONSOLIDATED FINANCIAL STATEMENTS
— (Continued)
The following table represents the restricted stock activity for fiscal 2017 and
2018
:
|
|
Shares
|
Weighted-
Average Grant
Date Fair Value
|
|||||
|
Outstanding at beginning of fiscal 2017
|
37,309
|
|
$
|
40.89
|
|
||
|
Granted
|
28,853
|
|
43.10
|
|
|||
|
Vested
|
(37,309
|
)
|
40.89
|
|
|||
|
Forfeited or expired
|
—
|
|
—
|
|
|||
|
Outstanding at end of fiscal 2017
|
28,853
|
|
$
|
43.10
|
|
||
|
Granted
|
35,075
|
|
47.50
|
|
|||
|
Vested
|
—
|
|
—
|
|
|||
|
Forfeited or expired
|
(12,785
|
)
|
46.02
|
|
|||
|
Outstanding at end of fiscal 2018
|
51,143
|
|
$
|
45.39
|
|
||
The weighted average grant date fair value of performance-based restricted shares issued in fiscal
2018
was
$47.50
, fiscal
2017
was
$43.10
and fiscal
2016
was
$40.89
. We recorded compensation expense on performance-based restricted stock of approximately
$0.7 million
for fiscal
2018
,
$1.4 million
for fiscal
2017
and
$1.2 million
for fiscal
2016
, substantially all of which was recorded in selling, general and administrative (“SG&A”) expense in the Consolidated Statements of Income. There were no performance-based restricted stock units that vested in fiscal
2018
. The total fair value of performance-based restricted stock units vested in fiscal
2017
was
$1.5 million
compared to
$2.0 million
in fiscal
2016
.
Until the performance-based restricted stock units result in the issuance of restricted stock, the amount of expense recorded each period is dependent upon our estimate of the number of shares that will ultimately be issued and our then current common stock price. Upon issuance of restricted stock, we record compensation expense over the remaining vesting period using the award date closing price. Unrecognized compensation expense related to non-vested restricted stock and non-vested restricted share units as of
April 1, 2018
was
$0.5 million
and is expected to be recognized over a weighted average period of
0.7 years
.
Prior to the adoption of ASU 2016-09 in fiscal 2018, the benefits of tax deductions that varied from the recognized compensation costs from share-based compensation were recorded as a change in additional paid-in capital rather than a reduction in earnings. The amount of excess tax benefit recognized and recorded in additional paid-in capital resulting from share-based compensation cost was
$0.1 million
in fiscal
2017
and nominal in fiscal
2016
.
Restricted Stock Awards.
As part of their retainer, our non-employee directors receive restricted stock for their Board services. The restricted stock awards are expensed over the requisite vesting period, which begins on the date of issuance and ends on the date of the next Annual Meeting of Shareholders, based on the market value on the date of grant. The following table represents the Board’s restricted stock activity for fiscal 2017 and
2018
:
|
|
Shares
|
Weighted-
Average Grant
Date Fair Value
|
|||||
|
Outstanding at beginning of fiscal 2017
|
6,804
|
|
$
|
36.00
|
|
||
|
Granted
|
8,092
|
|
43.24
|
|
|||
|
Vested
|
(6,804
|
)
|
36.00
|
|
|||
|
Forfeited or expired
|
—
|
|
—
|
|
|||
|
Outstanding at end of fiscal 2017
|
8,092
|
|
$
|
43.24
|
|
||
|
Granted
|
8,484
|
|
41.25
|
|
|||
|
Vested
|
(8,092
|
)
|
43.24
|
|
|||
|
Forfeited or expired
|
—
|
|
—
|
|
|||
|
Outstanding at end of fiscal 2018
|
8,484
|
|
$
|
41.25
|
|
||
Annual expense related to the value of restricted stock was
$0.3 million
in fiscal
2018
,
$0.3 million
in fiscal
2017
and
$0.2 million
in fiscal
2016
, all of which was recorded in SG&A expense in the Consolidated Statements of Income. Unrecognized compensation expense related to non-vested restricted stock awards as of
April 1, 2018
was
$0.1 million
and is expected to be recognized over a weighted average period of
0.4
years.
41
HAWKINS, INC.
NOTES TO CONSOLIDATED FINANCIAL STATEMENTS
— (Continued)
Our board of directors has authorized the repurchase of up to
300,000
shares of our outstanding common stock for cash on the open market or in privately negotiated transactions subject to applicable securities laws and regulations. Upon repurchase of the shares, we reduce our common stock for the par value of the shares with the excess applied against additional paid-in capital.
No
shares were repurchased during fiscal 2018 or fiscal 2017. We repurchased
127,852
of common stock at an aggregate purchase price of
$4.8 million
during fiscal 2016. As of
April 1, 2018
, the number of shares available to be purchased under the share repurchase program was
112,546
.
Company Sponsored Plans
.
The majority of our non-bargaining unit employees are eligible to participate in a company-sponsored profit sharing plan. Contributions are made at our discretion subject to a maximum amount allowed under the Internal Revenue Code (“IRC”). The profit sharing plan contribution level for each employee depends upon date of hire, with those employees hired after April 1, 2012 eligible to receive a contribution that is
50%
of the contribution made for employees hired on or before April 1, 2012. Our contribution to the profit sharing plan for fiscal 2018, fiscal 2017 and fiscal 2016 was
5%
of each employee’s eligible compensation for employees hired on or before April 1, 2012. In addition to the discretionary employer contribution described above, the profit sharing plan includes a 401(k) plan that allows employees to contribute pre-tax earnings up to the maximum amount allowed under the IRC, with an employer match of up to
5%
of the employee’s eligible compensation.
We have an employee stock ownership plan (“ESOP”) covering the majority of our non-bargaining unit employees. Contributions are made at our discretion subject to a maximum amount allowed under the IRC. The ESOP contribution level for each employee depends upon date of hire, with those employees hired after April 1, 2012 eligible to receive a contribution that is
50%
of the contribution made for employees hired on or before April 1, 2012. Our contribution to the ESOP for fiscal 2018, fiscal 2017 and fiscal 2016 was
5%
of each employee’s eligible compensation for employees hired on or before April 1, 2012.
During fiscal 2017, we established a nonqualified deferred compensation plan covering employees who are classified as “highly compensated employees” as determined by IRS guidelines for the plan year and who were hired on or before April 1, 2012. Employees who are eligible for the nonqualified deferred compensation plan for any plan year are not eligible for the profit sharing plan contribution or the ESOP contributions described above for that plan year. Our contribution to the nonqualified deferred compensation plan for fiscal 2018 and 2017 was
10%
of each employee’s eligible compensation, subject to the maximum amount allowed under the IRC.
We have an employee stock purchase plan (“ESPP”) covering substantially all of our employees. The ESPP allows employees to purchase newly-issued shares of the Company’s common stock at a discount from market. The number of new shares issued under the ESPP was
41,304
in fiscal
2018
,
38,986
in fiscal
2017
and
33,550
in fiscal
2016
.
In March 2013, concurrent with our withdrawal from a multiemployer pension plan described below, we established a retirement plan and ESOP for our collective bargaining unit employees. Each of these plans is subject to a maximum amount allowed under the IRC. The retirement plan provides for a contribution of
5%
of each employee’s eligible wages annually for employees who were eligible to enter the plan on March 1, 2013, and a contribution of
2.5%
of each employee’s eligible wages annually for employees who entered the plan after March 1, 2013. Additionally, the retirement plan includes a 401(k) plan that allows employees to contribute pre-tax earnings up to the maximum amount allowed under the IRC, with an employer match of up to
5%
of the employee’s eligible compensation. The ESOP provides for contributions of
5%
of each employee’s eligible wages annually for employees who were eligible to enter the plan on March 1, 2013, and a contribution of
2.5%
of each employee’s eligible wages annually for employees who enter the plan after March 1, 2013.
42
HAWKINS, INC.
NOTES TO CONSOLIDATED FINANCIAL STATEMENTS
— (Continued)
The following represents the contribution expense for the company sponsored profit sharing, ESOP, ESPP and 401(k) plans for fiscal 2018, 2017 and 2016:
|
(In thousands)
|
2018
|
2017
|
2016
|
||||||||||
|
Non-bargaining unit employee plans:
|
|||||||||||||
|
Profit sharing
|
$
|
779
|
|
$
|
741
|
|
$
|
1,393
|
|
||||
|
401(k) matching contributions
|
2,143
|
|
1,996
|
|
1,586
|
|
|||||||
|
ESOP
|
779
|
|
741
|
|
1,393
|
|
|||||||
|
Nonqualified deferred compensation plan
|
1,258
|
|
1,383
|
|
—
|
|
|||||||
|
Bargaining unit employee plans
|
496
|
|
509
|
|
444
|
|
|||||||
|
ESPP - all employees
|
364
|
|
364
|
|
274
|
|
|||||||
|
Total contribution expense
|
$
|
5,819
|
|
$
|
5,734
|
|
$
|
5,090
|
|
||||
Multiemployer Pension Plan
. In the fiscal year ended March 31, 2013, we concluded negotiations with
two
collective bargaining units to discontinue our participation in the Central States, Southeast and Southwest Areas Pension Fund (“CSS” or “the plan”), a collectively bargained multiemployer pension plan. Payment of our share of the unfunded vested benefit liability is being made over
20 years
and is subject to a cap. At the end of the 20-year period we will have no further liability, even if our share of the unfunded vested benefit liability has not yet been paid in full. The cash payments to be made total approximately
$9.3 million
, or
$467,000
per year. Our payments began in the fiscal year ended March 30, 2014.
Leases.
We have various operating leases for buildings and land on which some of our operations are located as well as trucks utilized for deliveries in certain branches. Future minimum lease payments due under operating leases with an initial term of one year or more at
April 1, 2018
are as follows:
|
(In thousands)
|
2019
|
2020
|
2021
|
2022
|
2023
|
Thereafter
|
||||||||||||||||||
|
Minimum lease payment
|
$
|
2,699
|
|
$
|
2,493
|
|
$
|
2,058
|
|
$
|
1,127
|
|
$
|
564
|
|
$
|
2,434
|
|
||||||
Total rental expense for fiscal years
2018
,
2017
and
2016
was as follows:
|
2018
|
2017
|
2016
|
||||||||||
|
(In thousands)
|
|
|
|
|||||||||
|
Minimum rentals
|
$
|
2,959
|
|
$
|
3,283
|
|
$
|
2,890
|
|
|||
|
Contingent rentals
|
26
|
|
28
|
|
21
|
|
||||||
|
Total rental expense
|
$
|
2,985
|
|
$
|
3,311
|
|
$
|
2,911
|
|
|||
Litigation.
As of
April 1, 2018
, there were no material pending legal proceedings, other than ordinary routine litigation incidental to the business, to which we or any of our subsidiaries are a party or of which any of our property is the subject. Legal fees associated with such matters are expensed as incurred.
Environmental Remediation
:
During fiscal 2018, we recorded a liability of
$0.6 million
related to estimated remediation expenses associated with existing trichloroethylene contamination at our Minneapolis facility. The liability is not discounted as management expects to incur these expenses during fiscal 2019. Given the many uncertainties involved in assessing environmental claims, our reserves may prove to be insufficient. While it is possible that additional expenses related to remediation will be incurred in future periods if currently unknown issues arise, we are unable to estimate the extent of any further financial impact.
Asset Retirement Obligations.
We have
three
leases of land which contain terms that state that at the end of the lease term, we have a specified amount of time to remove the property and buildings. These leases expire in 2023, 2028 and 2034. At that time, anything that remains on the land becomes the property of the lessor, and the lessor has the option to either maintain the property or remove the property at our expense. We have not been able to reasonably estimate the fair value of the asset retirement obligations, primarily due to the combination of the following factors: The leases do not expire in the near future; we have a history of extending the leases with the lessors and currently intend to do so at expiration of the lease periods; the lessors do not have a history of terminating leases with their tenants; and because it is more likely than not that the buildings will have value at the end of the lease life and therefore, may not be removed by either the lessee or the lessor. Therefore, in accordance with accounting guidance related to asset retirement and environmental obligations, we have not recorded an asset retirement obligation as of
April 1, 2018
. We will
43
HAWKINS, INC.
NOTES TO CONSOLIDATED FINANCIAL STATEMENTS
— (Continued)
continue to monitor the factors surrounding the requirement to record an asset retirement obligation and will recognize the fair value of a liability in the period in which it is incurred and a reasonable estimate can be made.
On December 22, 2017, the Tax Act, was signed into law. The Tax Act includes a number of provisions, including lowering of the U.S. corporate tax rate from
35%
to
21%
effective January 1, 2018. Because our fiscal 2018 ended April 1, 2018, our tax provision for the current year was calculated utilizing a blended statutory federal rate of
31.5%
. In future years, we expect our statutory federal rate to be
21%
. Under GAAP, deferred tax assets and liabilities are required to be revalued during the period in which the new tax legislation is enacted. As such, during the fiscal year-end ended April 1, 2018 we revalued our net deferred tax liabilities to reflect the impact of the Tax Act and recorded a one-time benefit of
$13.9 million
. Pursuant to SAB 118 (regarding the application of ASC 740 associated with the enactment of the Tax Act), the tax benefit we recorded in the current fiscal year is provisional. The final impact of the Tax Act may differ due to and among other things, changes in interpretations, assumptions made by the Company and the issuance of additional guidance that may be provided. Specifically, no adjustment was recorded related to the impact of the Tax Act on state taxes, as we could not reasonably estimate the impact and do not expect any such impact to be material to our financial statements.
The provisions for income taxes for fiscal
2018
,
2017
and
2016
were as follows:
|
2018
|
2017
|
2016
|
||||||||||
|
(In thousands)
|
|
|
||||||||||
|
Federal — current
|
$
|
7,024
|
|
$
|
11,472
|
|
$
|
8,761
|
|
|||
|
State — current
|
1,834
|
|
2,546
|
|
2,238
|
|
||||||
|
Total current
|
8,858
|
|
14,018
|
|
10,999
|
|
||||||
|
Federal — deferred
|
(14,393
|
)
|
(431
|
)
|
1,027
|
|
||||||
|
State — deferred
|
(364
|
)
|
(94
|
)
|
197
|
|
||||||
|
Total deferred
|
(14,757
|
)
|
(525
|
)
|
1,224
|
|
||||||
|
Total provision
|
$
|
(5,899
|
)
|
$
|
13,493
|
|
$
|
12,223
|
|
|||
Reconciliations of the provisions for income taxes to the applicable federal statutory income tax rate for fiscal 2018, 2017 and 2016 are listed below.
|
2018
|
2017
|
2016
|
|||||||
|
Statutory federal income tax
|
31.5
|
%
|
35.0
|
%
|
35.0
|
%
|
|||
|
State income taxes, net of federal deduction
|
(8.3
|
)%
|
4.8
|
%
|
5.0
|
%
|
|||
|
ESOP dividend deduction on allocated shares
|
1.4
|
%
|
(0.7
|
)%
|
(0.7
|
)%
|
|||
|
Domestic production deduction
|
2.7
|
%
|
(1.5
|
)%
|
(1.5
|
)%
|
|||
|
Goodwill impairment
|
(81.7
|
)%
|
—
|
%
|
—
|
%
|
|||
|
Revaluation of net deferred tax liabilities
|
92.5
|
%
|
—
|
%
|
—
|
%
|
|||
|
Non-deductible acquisition costs
|
—
|
%
|
—
|
%
|
1.6
|
%
|
|||
|
Assessment related to state tax audit
|
—
|
%
|
—
|
%
|
0.6
|
%
|
|||
|
Other — net
|
1.0
|
%
|
(0.2
|
)%
|
0.2
|
%
|
|||
|
Total
|
39.1
|
%
|
37.4
|
%
|
40.2
|
%
|
|||
44
HAWKINS, INC.
NOTES TO CONSOLIDATED FINANCIAL STATEMENTS
— (Continued)
The tax effects of items comprising our net deferred tax liability as of
April 1, 2018
and
April 2, 2017
are as follows:
|
(In thousands)
|
2018
|
2017
|
||||||
|
Deferred tax assets:
|
||||||||
|
Trade receivables
|
$
|
254
|
|
$
|
187
|
|
||
|
Stock compensation accruals
|
593
|
|
616
|
|
||||
|
Pension withdrawal liability
|
1,611
|
|
2,513
|
|
||||
|
Other
|
1,619
|
|
1,639
|
|
||||
|
Total deferred tax assets
|
$
|
4,077
|
|
$
|
4,955
|
|
||
|
Deferred tax liabilities:
|
||||||||
|
Inventories
|
$
|
(3,047
|
)
|
$
|
(4,006
|
)
|
||
|
Prepaid
|
(756
|
)
|
(1,095
|
)
|
||||
|
Excess of tax over book depreciation
|
(9,811
|
)
|
(14,169
|
)
|
||||
|
Intangibles
|
(17,625
|
)
|
(27,524
|
)
|
||||
|
Unrealized gain on interest rate swap
|
(221
|
)
|
(201
|
)
|
||||
|
Total deferred tax liabilities
|
$
|
(31,460
|
)
|
$
|
(46,995
|
)
|
||
|
Net deferred tax liabilities
|
$
|
(27,383
|
)
|
$
|
(42,040
|
)
|
||
As of
April 1, 2018
, the Company has determined that it is more likely than not that the deferred tax assets at
April 1, 2018
will be realized either through future taxable income or reversals of taxable temporary differences.
During fiscal 2016, we recorded a gross unrecognized tax benefit of
$1.9 million
in other long-term liabilities on our consolidated balance sheet as a result of uncertain income tax positions taken by Stauber on its tax returns for periods prior to our acquisition. We had
no
unrecognized tax benefits prior to the Stauber acquisition. The Stauber acquisition agreement provides the Company with indemnification from the prior owners for any tax liabilities relating to pre-acquisition tax returns. Accordingly, we also recorded an offsetting, long-term receivable for
$1.9 million
as of April 3, 2016, and as such any change in the unrecognized tax benefit will not impact our effective tax rate in future periods. During fiscal 2018 and 2017, the unrecognized tax benefit and the offsetting receivable were reduced to
$0.2 million
and
$0.8 million
, respectively, due to the expiration of the statute of limitations for certain of the taxable periods.
We are subject to U.S. federal income tax as well as income tax of multiple state jurisdictions. The tax years prior to our fiscal year ended April 3, 2016 are closed to examination by the Internal Revenue Service. Our federal tax return filed for our fiscal year ended March 29, 2015 was examined by the Internal Revenue Service with
no
adjustments. For state and local income tax jurisdictions, the tax years prior to our fiscal year ended March 29, 2015 are closed to examination, with few exceptions.
We have
three
reportable segments: Industrial, Water Treatment and Health and Nutrition. Our Health and Nutrition segment was established as a result of our acquisition of Stauber near the end of the third quarter of fiscal 2016. The accounting policies of the segments are the same as those described in the summary of significant accounting policies. Product costs and expenses for each segment are based on actual costs incurred along with cost allocations of shared and centralized functions.
We evaluate performance based on profit or loss from operations before income taxes not including nonrecurring gains and losses. Reportable segments are defined primarily by product and type of customer. Segments are responsible for the sales, marketing and development of their products and services. Other than our Health and Nutrition segment, the segments do not have separate accounting, administration, customer service or purchasing functions. We allocate certain corporate expenses to our operating segments, and we began allocating a portion of these costs to the Health and Nutrition segment in fiscal 2017. Corporate costs allocated to Health and Nutrition were
$2.1 million
in fiscal 2018 and
$1.9 million
in fiscal 2017; these costs would have been allocated to Industrial (approximately
$1.3 million
and
$1.2 million
in fiscal 2018 and 2017 respectively) and Water Treatment (approximately
$0.8 million
and
$0.7 million
in fiscal 2018 and 2017 respectively) in past years. There are
no
intersegment sales and
no
operating segments have been aggregated.
No
single customer’s revenues amounted to 10% or more of our total revenue. Sales are primarily within the United States and all assets are located within the United States.
45
HAWKINS, INC.
NOTES TO CONSOLIDATED FINANCIAL STATEMENTS
— (Continued)
|
Reportable Segments
|
Industrial
|
Water
Treatment
|
Health and Nutrition
|
Total
|
||||||||||||
|
(In thousands)
|
|
|
|
|||||||||||||
|
Fiscal Year Ended April 1, 2018:
|
||||||||||||||||
|
Sales
|
$
|
247,374
|
|
$
|
138,465
|
|
$
|
118,330
|
|
$
|
504,169
|
|
||||
|
Gross profit
|
29,619
|
|
36,268
|
|
20,873
|
|
86,760
|
|
||||||||
|
Selling, general, and administrative expenses
|
21,159
|
|
19,426
|
|
18,818
|
|
59,403
|
|
||||||||
|
Goodwill impairment
|
—
|
|
—
|
|
39,116
|
|
39,116
|
|
||||||||
|
Operating (loss) income
|
8,460
|
|
16,842
|
|
(37,061
|
)
|
(11,759
|
)
|
||||||||
|
Identifiable assets*
|
$
|
165,052
|
|
$
|
58,513
|
|
$
|
153,123
|
|
$
|
376,688
|
|
||||
|
Capital Expenditures
|
$
|
10,265
|
|
$
|
7,228
|
|
$
|
2,210
|
|
$
|
19,703
|
|
||||
|
Fiscal Year Ended April 2, 2017:
|
||||||||||||||||
|
Sales
|
$
|
238,555
|
|
$
|
128,954
|
|
$
|
116,084
|
|
$
|
483,593
|
|
||||
|
Gross profit
|
38,886
|
|
35,962
|
|
23,225
|
|
98,073
|
|
||||||||
|
Selling, general, and administrative expenses
|
21,818
|
|
19,798
|
|
17,765
|
|
59,381
|
|
||||||||
|
Operating income
|
17,068
|
|
16,164
|
|
5,460
|
|
38,692
|
|
||||||||
|
Identifiable assets*
|
$
|
159,032
|
|
$
|
53,445
|
|
$
|
192,047
|
|
$
|
404,524
|
|
||||
|
Capital Expenditures
|
$
|
10,529
|
|
$
|
7,777
|
|
$
|
3,310
|
|
$
|
21,616
|
|
||||
|
Fiscal Year Ended April 3, 2016:
|
||||||||||||||||
|
Sales
|
$
|
251,749
|
|
$
|
128,312
|
|
$
|
33,915
|
|
$
|
413,976
|
|
||||
|
Gross profit
|
37,967
|
|
35,470
|
|
6,820
|
|
80,257
|
|
||||||||
|
Selling, general, and administrative expenses
|
22,137
|
|
19,261
|
|
7,688
|
|
49,086
|
|
||||||||
|
Operating income (loss)
|
15,830
|
|
16,209
|
|
(868
|
)
|
31,171
|
|
||||||||
|
Identifiable assets*
|
$
|
158,015
|
|
$
|
50,013
|
|
$
|
195,939
|
|
$
|
403,967
|
|
||||
|
Capital Expenditures
|
$
|
17,712
|
|
$
|
6,306
|
|
$
|
165
|
|
$
|
24,183
|
|
||||
*
Unallocated assets, consisting primarily of cash and cash equivalents, investments and prepaid expenses, were
$14.3 million
at
April 1, 2018
,
$13.1 million
at
April 2, 2017
and
$32.8 million
at
April 3, 2016
.
In fiscal 2016, operating profit for the Health and Nutrition segment was negatively impacted by
$3.3 million
(pre-tax) of non-recurring SG&A expenses directly related to the acquisition by Hawkins.
46
HAWKINS, INC.
NOTES TO CONSOLIDATED FINANCIAL STATEMENTS
— (Continued)
|
(In thousands, except per share data)
|
Fiscal 2018
|
|||||||||||||||
|
|
First
|
Second
|
Third
|
Fourth
|
||||||||||||
|
Sales
|
$
|
133,731
|
|
$
|
125,395
|
|
$
|
118,053
|
|
$
|
126,990
|
|
||||
|
Gross profit
|
25,999
|
|
24,115
|
|
18,840
|
|
17,806
|
|
||||||||
|
Selling, general, and administrative expenses
|
15,766
|
|
14,828
|
|
14,139
|
|
14,670
|
|
||||||||
|
Goodwill impairment
|
—
|
|
—
|
|
—
|
|
39,116
|
|
||||||||
|
Operating (loss) income
|
10,233
|
|
9,287
|
|
4,701
|
|
(35,980
|
)
|
||||||||
|
Net (loss) income
|
5,831
|
|
5,210
|
|
17,143
|
|
(37,361
|
)
|
||||||||
|
Basic (loss) earnings per share
|
$
|
0.55
|
|
$
|
0.49
|
|
$
|
1.62
|
|
$
|
(3.51
|
)
|
||||
|
Diluted (loss) earnings per share
|
$
|
0.55
|
|
$
|
0.49
|
|
$
|
1.61
|
|
$
|
(3.50
|
)
|
||||
|
|
Fiscal 2017
|
|||||||||||||||
|
|
First
|
Second
|
Third
|
Fourth
|
||||||||||||
|
Sales
|
$
|
131,374
|
|
$
|
121,250
|
|
$
|
112,351
|
|
$
|
118,618
|
|
||||
|
Gross profit
|
28,216
|
|
27,032
|
|
20,912
|
|
21,913
|
|
||||||||
|
Selling, general, and administrative expenses
|
15,126
|
|
14,871
|
|
14,916
|
|
14,468
|
|
||||||||
|
Operating income
|
13,090
|
|
12,161
|
|
5,996
|
|
7,445
|
|
||||||||
|
Net income
|
7,604
|
|
7,190
|
|
3,551
|
|
4,210
|
|
||||||||
|
Basic earnings per share
|
$
|
0.72
|
|
$
|
0.68
|
|
$
|
0.34
|
|
$
|
0.40
|
|
||||
|
Diluted earnings per share
|
$
|
0.72
|
|
$
|
0.68
|
|
$
|
0.34
|
|
$
|
0.40
|
|
||||
47
ITEM 9.
CHANGES IN AND DISAGREEMENTS WITH ACCOUNTANTS ON ACCOUNTING AND FINANCIAL DISCLOSURE
None.
ITEM 9A.
CONTROLS AND PROCEDURES
Evaluation of Disclosure Controls and Procedures
As of the end of the period covered by this Annual Report on Form 10-K, we conducted an evaluation, under supervision and with the participation of management, including the chief executive officer and chief financial officer, of the effectiveness of the design and operation of our disclosure controls and procedures pursuant to Rules 13a-15(f) and 15d-15(f) of the Exchange Act. Based upon that evaluation, our chief executive officer and chief financial officer concluded that our disclosure controls and procedures are effective. Disclosure controls and procedures are defined by Rules 13a-15(e) and 15d-15(e) of the Exchange Act as controls and other procedures that are designed to ensure that information required to be disclosed by us in reports filed with the SEC under the Exchange Act is recorded, processed, summarized and reported within the time periods specified in the SEC’s rules and forms. Disclosure controls and procedures include, without limitation, controls and procedures designed to ensure that information required to be disclosed by us in reports filed under the Exchange Act is accumulated and communicated to our management, including our principal executive and principal financial officers, or person performing similar functions, as appropriate to allow timely decisions regarding required disclosure.
Management’s Report on Internal Control Over Financial Reporting
Our management is responsible for establishing and maintaining adequate internal control over financial reporting as defined in Rules 13a-15(f) and 15d-15(f) of the Securities Exchange Act. Our internal control over financial reporting is designed to provide reasonable assurance regarding the reliability of financial reporting and the preparation of financial statements for external purposes in accordance with generally accepted accounting principles. Our internal control over financial reporting includes those policies and procedures that (1) pertain to maintenance of records that, in reasonable detail, accurately and fairly reflect the transactions and dispositions of our assets; (2) provide reasonable assurance that transactions are recorded as necessary to permit preparation of the financial statements in accordance with generally accepted accounting principles, and that our receipts and expenditures are being made only in accordance with authorizations of our management and directors; and (3) provide reasonable assurance regarding prevention or timely detection of unauthorized acquisition, use or disposition of our assets that could have a material effect on the financial statements.
Because of its inherent limitations, internal control over financial reporting may not prevent or detect misstatements. Projections of any evaluation of the effectiveness of internal control over financial reporting to future periods are subject to the risk that the controls may become inadequate because of changes in conditions, or that the degree of compliance with the policies or procedures may deteriorate.
Management assessed the effectiveness of our internal control over financial reporting as of
April 1, 2018
, based on the criteria described in
Internal
Control - Integrated Framework (2013)
issued by the Committee of Sponsoring Organizations of the Treadway Commission. Based on this assessment, management believes that our internal control over financial reporting was effective as of
April 1, 2018
.
Our independent registered public accounting firm has issued an attestation report on our internal control over financial reporting for
April 1, 2018
which is included in the Report of Independent Registered Public Accounting Firm in Item 8 of this Annual Report on 10-K.
Attestation Report of Registered Public Accounting Firm
The attestation report required under this Item 9A is contained in Item 8 of this Annual Report on 10-K under the caption “Report of Independent Registered Public Accounting Firm.”
Changes in Internal Control Procedures
There was no change in our internal control over financial reporting during the
fourth quarter
of fiscal
2018
that has materially affected, or is reasonably likely to materially affect, our internal control over financial reporting.
ITEM 9B.
OTHER INFORMATION
None.
48
Certain information required by Part III is incorporated by reference from Hawkins’ definitive Proxy Statement for the Annual Meeting of Shareholders to be held on August 2, 2018 (the “
2018
Proxy Statement”). Except for those portions specifically incorporated in this Form 10-K by reference to the
2018
Proxy Statement, no other portions of the
2018
Proxy Statement are deemed to be filed as part of this Form 10-K.
ITEM 10.
DIRECTORS, EXECUTIVE OFFICERS, AND CORPORATE GOVERNANCE
Our current executive officers, their ages and offices held, are set forth below:
|
Name
|
Age
|
Office
|
||
|
Patrick H. Hawkins
|
47
|
Chief Executive Officer and President
|
||
|
Jeffrey P. Oldenkamp
|
45
|
Vice President, Chief Financial Officer, and Treasurer
|
||
|
Richard G. Erstad
|
54
|
Vice President, General Counsel and Secretary
|
||
|
Thomas J. Keller
|
58
|
Vice President — Water Treatment Group
|
||
|
Steven D. Matthews II
|
47
|
Vice President — Operations
|
||
|
Theresa R. Moran
|
55
|
Vice President — Purchasing, Logistics and Sales Support
|
||
|
John R. Sevenich
|
60
|
Vice President — Industrial Group
|
||
|
Daniel J. Stauber
|
56
|
Vice President — Health and Nutrition
|
||
Patrick H. Hawkins
has been our Chief Executive Officer and President and member of our board since March 2011. He has held the position of President since March 2010. He joined the Company in 1992 and served as the Business Director - Food and Pharmaceuticals, a position he held from 2009 to 2010. Previously he served as Business Manager - Food and Co-Extrusion Products from 2007 to 2009 and Sales Representative - Food Ingredients from 2002 to 2007. He previously served the Company in various other capacities, including Plant Manager, Quality Director and Technical Director.
Jeffrey P. Oldenkamp
joined Hawkins in May 2017 and assumed the role of Chief Financial Officer, Vice President and Treasurer in June 2017. Prior to joining Hawkins, Mr. Oldenkamp was with MTS Systems Corporation, a supplier of high-performance test systems and sensors, where he served as Chief Financial Officer since January 2015 and Vice President of Finance for the MTS Test business from January 2014 to January 2015, and with Nilfisk-Advance, Inc., a global manufacturer of professional cleaning equipment, where he served as Americas Operations Chief Financial Officer and Vice President from January 2012 to January 2014.
Richard G. Erstad
has been our Vice President, General Counsel and Secretary since November 2008. He was General Counsel and Secretary of BUCA, Inc., a restaurant company, from 2005 to 2008. Mr. Erstad had previously been an attorney with the corporate group of Faegre & Benson LLP, a law firm, from 1996 to 2005, where his practice focused on securities law and mergers and acquisitions. He is a member of the Minnesota Bar.
Thomas J. Keller
has been our Vice President - Water Treatment Group since April 2012. Prior to attaining this position, Mr. Keller held various positions since joining the Company in 1980, most recently as its Water Treatment General Manager, a position he held since June 2011. Previously, Mr. Keller served as a Regional Manager of the Water Treatment Group from 2002 to 2011.
Steven D. Matthews II
has been our Vice President - Operations since December 2013. He was a Regional General Manager in the Paperboard Converting Division of Newark Recycled Paperboard Solutions, a producer of recycled paperboard, from 2012 to 2013. Previously, he spent a total of fifteen years during two different periods at General Electric in a variety of engineering, Six Sigma, supply chain and plant leadership positions in the Plastics, Aircraft Engines, Lighting and Water divisions. From 2005-2008, he was a Corporate Supply Chain Engagement Leader with Ingersoll Rand, a global diversified industrial company.
Theresa R. Moran
has been our Vice President - Purchasing, Logistics and Sales Support since June 2017. Since joining the Company in 1981, Ms. Moran has served the Company in a variety of positions, including Administration Operations Manager from 1999 to 2007, Director - Process Improvement from 2007 until 2010 and most recently as Vice President - Quality and Support, a position she held from 2010 until her current role.
John R. Sevenich
has been our Vice President - Industrial Group since May 2000. He was the Business Unit Manager of Manufacturing from 1998 to 2000 and was a Sales Representative with the Company from 1989 to 1998.
49
Daniel J. Stauber
was named Vice President - Health and Nutrition in February 2018. He had held the position of Chief Brand Officer of Stauber since we acquired it in December 2015 until being named Vice President. Previously, he was Chief Executive Officer of Stauber from 1998 until our acquisition.
The disclosure under the headings “Election of Directors,” “Corporate Governance,” and “Section 16(a) Beneficial Ownership Reporting Compliance” of the 2018 Proxy Statement is incorporated herein by reference.
Steven D. Matthews II filed a bankruptcy petition related to the dissolution of a small family business of which Mr. Matthews was an owner and guarantor. The bankruptcy was discharged in 2009.
We have adopted a Code of Business Conduct and Ethics that applies to all of our directors and employees, including our principal executive officer, principal financial officer, controller and other persons performing similar functions. We have posted the Code of Business Conduct and Ethics on our website located at http://www.hawkinsinc.com. Hawkins’ Code of Business Conduct and Ethics is also available in print to any shareholder who requests it in writing from our Corporate Secretary. We intend to post on our website any amendment to, or waiver from, a provision of our Code of Business Conduct and Ethics that applies to our principal executive officer, principal financial officer, controller and other persons performing similar functions within four business days following the date of such amendment or waiver. We are not including the information contained on our website as part of, or incorporating it by reference into, this report.
ITEM 11.
EXECUTIVE COMPENSATION
“Compensation of Executive Officers and Directors” of the
2018
Proxy Statement is incorporated herein by this reference.
ITEM 12.
SECURITY OWNERSHIP OF CERTAIN BENEFICIAL OWNERS AND MANAGEMENT AND RELATED STOCKHOLDER MATTERS
The disclosure under the headings “Security Ownership of Management and Beneficial Ownership” and “Equity Compensation Plan Information” of the
2018
Proxy Statement is incorporated herein by this reference.
ITEM 13.
CERTAIN RELATIONSHIPS AND RELATED TRANSACTIONS, AND DIRECTOR INDEPENDENCE
The disclosure under the headings “Election of Directors” and “Related Party Transactions” of the
2018
Proxy Statement is incorporated herein by this reference.
ITEM 14.
PRINCIPAL ACCOUNTANT FEES AND SERVICES
The disclosure under the heading “Independent Registered Public Accounting Firm’s Fees” of the
2018
Proxy Statement is incorporated herein by this reference.
50
ITEM 15.
EXHIBITS AND FINANCIAL STATEMENT SCHEDULES
|
(a)(1)
|
|
FINANCIAL STATEMENTS OF THE COMPANY
|
|
|
The following financial statements of Hawkins, Inc. are filed as part of this Annual Report on Form 10-K:
|
|
|
|
Report of Independent Registered Public Accounting Firm.
|
|
|
|
Consolidated Balance Sheets at April 1, 2018 and April 2, 2017.
|
|
|
|
Consolidated Statements of Income for the fiscal years ended April 1, 2018, April 2, 2107 and April 3, 2016.
|
|
|
|
Consolidated Statements of Comprehensive Income for the fiscal years ended April 1, 2018, April 2, 2017 and April 3, 2016.
|
|
|
|
Consolidated Statements of Shareholders’ Equity for the fiscal years ended April 1, 2018, April 2, 2017 and April 3, 2016.
|
|
|
|
Consolidated Statements of Cash Flows for the fiscal years ended April 1, 2018, April 2, 2017 and April 3, 2016.
|
|
|
|
Notes to Consolidated Financial Statements.
|
|
|
(a)(2)
|
|
FINANCIAL STATEMENT SCHEDULES OF THE COMPANY
|
|
|
The additional financial data listed below is included as a schedule to this Annual Report on Form 10-K and should be read in conjunction with the financial statements presented in Part II, Item 8. Schedules not included with this additional financial data have been omitted because they are not required or the required information is included in the financial statements or the notes.
|
|
|
|
The following financial statement schedule for the fiscal years 2018, 2017 and 2016.
|
|
|
|
Schedule II — Valuation and Qualifying Accounts.
|
|
|
(a)(3)
|
|
EXHIBITS
|
51
Exhibit Index
Unless otherwise indicated, all documents incorporated into this Annual Report on Form 10-K by reference to a document filed with the SEC are located under file number 0-7647.
|
Exhibit
|
|
|
Description
|
|
Method of Filing
|
|
2.1
|
|
Incorporated by Reference
|
|||
|
3.1
|
|
|
|
Incorporated by Reference
|
|
|
3.2
|
|
|
|
Incorporated by Reference
|
|
|
10.1*
|
|
|
|
Incorporated by Reference
|
|
|
10.2*
|
|
|
|
Incorporated by Reference
|
|
|
10.3*
|
|
|
|
Incorporated by Reference
|
|
|
10.4*
|
|
|
|
Incorporated by Reference
|
|
|
10.5*
|
|
|
|
Incorporated by Reference
|
|
|
10.6*
|
|
|
|
Incorporated by Reference
|
|
|
10.7
|
|
|
|
Incorporated by Reference
|
|
|
10.8
|
|
|
|
Incorporated by Reference
|
|
|
21
|
|
Filed Electronically
|
|||
|
23.1
|
|
|
|
Filed Electronically
|
|
|
31.1
|
|
|
|
Filed Electronically
|
|
|
31.2
|
|
|
|
Filed Electronically
|
|
|
32.1
|
|
|
|
Filed Electronically
|
|
|
32.2
|
|
|
|
Filed Electronically
|
|
|
101
|
|
|
Financial statements from the Annual Report on Form 10-K of Hawkins, Inc. for the period ended April 1, 2018, filed with the SEC on May 31, 2018, formatted in Extensible Business Reporting Language (XBRL): (i) the Consolidated Balance Sheets at April 1, 2018 and April 2, 2017, (ii) the Consolidated Statements of Income for the fiscal years ended April 1, 2018, April 2, 2017 and April 3, 2016, (iii) the Consolidated Statements of Comprehensive Income for the fiscal years ended April 1, 2018, April 2, 2017 and April 3, 2016, (iv) the Consolidated Statements of Shareholders’ Equity for the fiscal years ended April 1, 2018, April 2, 2017 and April 3, 2016, (v) Consolidated Statements of Cash Flows for the fiscal years ended April 1, 2018, April 2, 2017 and April 3, 2016, and (iv) Notes to Consolidated Financial Statements.
|
|
Filed Electronically
|
|
*
|
Management contract or compensation plan or arrangement required to be filed as an exhibit to this Annual Report on Form 10-K.
|
|
(1)
|
Incorporated by reference to Exhibit 2.1 on the Company’s Current Report on Form 8-K dated November 23, 2015.
|
|
(2)
|
Incorporated by reference to Exhibit 3.1 to the Company’s Quarterly Report on Form 10-Q for the quarterly period ended June 30, 2010.
|
|
(3)
|
Incorporated by reference to Exhibit 3.1 to the Company’s Current Report on Form 8-K dated October 28, 2009 and filed November 3, 2009.
|
|
(4)
|
Incorporated by reference to Appendix B to the Company’s Proxy Statement for the 2004 Annual Meeting of Shareholders filed July 23, 2004.
|
|
(5)
|
Incorporated by reference to Exhibit 10.1 to the Company’s Quarterly Report on Form 10-Q for the quarterly period ended June 30, 2008.
|
|
(6)
|
Incorporated by reference to Exhibit 10.1 to the Company’s Registration Statement on Form S-8 filed June 6, 2011 (file no. 333-174735).
|
|
(7)
|
Incorporated by reference to Exhibit 10.1 to the Company’s Quarterly Report on Form 10-Q for the quarterly period ended June 30, 2010.
|
|
(8)
|
Incorporated by reference to Exhibit 10.2 to the Company’s Quarterly Report on Form 10-Q for the quarterly period ended June 30, 2010.
|
|
(9)
|
Incorporated by reference to Exhibit 10.1 to the Company’s Quarterly Report on Form 10-Q for the quarterly period ended July 3, 2011.
|
|
(10)
|
Incorporated by reference to Exhibit 10.1 to the Company’s Current Report on Form 8-K dated November 23, 2015
|
|
(11)
|
Incorporated by reference to Exhibit 10.1 to the Company’s Current Report on Form 8-K dated December 23, 2015.
|
None
SIGNATURES
Pursuant to the requirements of Section 13 or 15(d) of the Securities Exchange Act of 1934, the Company has duly caused this report to be signed on its behalf by the undersigned, thereunto duly authorized.
|
|
|
HAWKINS, INC.
|
|||
|
Date:
|
May 31, 2018
|
|
By
|
|
/s/ Patrick H. Hawkins
|
|
|
|
Patrick H. Hawkins,
Chief Executive Officer and President
|
|||
Pursuant to the requirements of the Securities Exchange Act of 1934, this report has also been signed below by the following persons on behalf of the Company and in the capacities indicated on the date set forth beside their signature.
|
/s/ Patrick H. Hawkins
|
|
Date:
|
May 31, 2018
|
|
Patrick H. Hawkins, Chief Executive Officer and
President (Principal Executive Officer) and Director
|
|
||
|
/s/ Jeffrey P. Oldenkamp
|
|
Date:
|
May 31, 2018
|
|
Jeffrey P. Oldenkamp, Vice President, Chief Financial Officer, and Treasurer (Principal Financial Officer and Principal Accounting Officer)
|
|
||
|
/s/ John S. McKeon
|
|
Date:
|
May 31, 2018
|
|
John S. McKeon, Director, Chairman of the Board
|
|
||
|
/s/ Daniel J. Stauber
|
|
Date:
|
May 31, 2018
|
|
Daniel J. Stauber, Director
|
|
||
|
/s/ Duane M. Jergenson
|
|
Date:
|
May 31, 2018
|
|
Duane M. Jergenson, Director
|
|
||
|
/s/ Daryl I. Skaar
|
|
Date:
|
May 31, 2018
|
|
Daryl I. Skaar, Director
|
|
||
|
/s/ James A. Faulconbridge
|
|
Date:
|
May 31, 2018
|
|
James A. Faulconbridge, Director
|
|
||
|
/s/ James T. Thompson
|
|
Date:
|
May 31, 2018
|
|
James T. Thompson, Director
|
|
||
|
/s/ Jeffrey L. Wright
|
|
Date:
|
May 31, 2018
|
|
Jeffrey L. Wright, Director
|
|
||
|
/s/ Mary J. Schumacher
|
|
Date:
|
May 31, 2018
|
|
Mary J. Schumacher, Director
|
|
||
SCHEDULE II
HAWKINS, INC.
VALUATION AND QUALIFYING ACCOUNTS
FOR THE FISCAL YEARS ENDED APRIL 1, 2018, APRIL 2, 2017 AND APRIL 3, 2016
|
|
|
Additions
|
|
|
||||||||||||||||
|
Description
|
Balance at
Beginning
of Year
|
Charged to
Costs and
Expenses
|
Charged to
Other
Accounts
|
Deductions
Write-Offs
|
Balance at
End of Year
|
|||||||||||||||
|
|
(In thousands)
|
|||||||||||||||||||
|
Reserve deducted from asset to which it applies:
|
||||||||||||||||||||
|
Year Ended April 1, 2018:
|
||||||||||||||||||||
|
Allowance for doubtful accounts
|
468
|
|
509
|
|
—
|
|
35
|
|
942
|
|
||||||||||
|
Year Ended April 2, 2017:
|
|
|||||||||||||||||||
|
Allowance for doubtful accounts
|
$
|
602
|
|
$
|
79
|
|
$
|
—
|
|
$
|
213
|
|
$
|
468
|
|
|||||
|
Year Ended April 3, 2016:
|
||||||||||||||||||||
|
Allowance for doubtful accounts
|
$
|
445
|
|
$
|
272
|
|
$
|
—
|
|
$
|
115
|
|
$
|
602
|
|
|||||
TABLE OF CONTENTS
Part IItem 1. BusinessItem 1A. Risk FactorsItem 1B. Unresolved Staff CommentsItem 2. PropertiesItem 3. Legal ProceedingsItem 4. Mine Safety DisclosuresPart IIItem 5. Market For The Company S Common Equity, Related Shareholder Matters, and Issuer Purchases Of Equity SecuritiesItem 6. Selected Financial DataItem 7. Management S Discussion and Analysis Of Financial Condition and Results Of OperationsItem 7A. Quantitative and Qualitative Disclosure About Market RiskItem 8. Financial Statements and Supplementary DataNote 1 Nature Of Business and Significant Accounting PoliciesNote 2 Business CombinationsNote 3 Derivative InstrumentsNote 4 Fair Value MeasurementsNote 5 InventoriesNote 6 Goodwill and Other Identifiable Intangible AssetsNote 7 DebtNote 8 Share-based CompensationNote 9 Share Repurchase ProgramNote 10 Profit Sharing, Employee Stock Ownership, Employee Stock Purchase and Pension PlansNote 11 Commitments and ContingenciesNote 12 Income TaxesNote 13 Segment InformationNote 14 Selected Quarterly Financial Data (unaudited)Item 9. Changes in and Disagreements with Accountants on Accounting and Financial DisclosureItem 9A. Controls and ProceduresItem 9B. Other InformationPart IIIItem 10. Directors, Executive Officers, and Corporate GovernanceItem 11. Executive CompensationItem 12. Security Ownership Of Certain Beneficial Owners and Management and Related Stockholder MattersItem 13. Certain Relationships and Related Transactions, and Director IndependenceItem 14. Principal Accountant Fees and ServicesPart IVItem 15. Exhibits and Financial Statement SchedulesItem 16. Form 10-k Summary