INTERCONTINENTAL EXCHANGE, INC.
10-Ks and 10-Qs
|
|
|
|
|
|
|
|
|
|
|
|
|
|
|
|
|
|
|
|
|
|
|
|
|
|
|
|
|
|
|
|
|
|
|
|
|
|
|
|
|
|
|
|
|
|
|
UNITED STATES SECURITIES AND EXCHANGE COMMISSION
Washington, D.C. 20549
Form 10-K
|
(Mark One)
|
|
|
þ
|
ANNUAL REPORT PURSUANT TO SECTION 13 OR 15(d)
OF THE SECURITIES EXCHANGE ACT OF 1934 |
|
For the fiscal year ended December 31, 2017
|
|
|
Or
|
|
|
¨
|
TRANSITION REPORT PURSUANT TO SECTION 13 OR 15(d)
OF THE SECURITIES EXCHANGE ACT OF 1934 |
|
For the transition period from to
|
|
Commission File Number 001-36198
Intercontinental Exchange, Inc.
(Exact name of registrant as specified in its charter)
|
Delaware
|
46-2286804
|
|
(State or other jurisdiction of
incorporation or organization)
|
(IRS Employer
Identification Number)
|
|
5660 New Northside Drive,
Atlanta, Georgia
|
30328
(Zip Code)
|
|
(Address of principal executive offices)
|
|
(770) 857-4700
Registrant’s telephone number, including area code
Securities registered pursuant to Section 12(b) of the Act:
|
Title of Each Class
|
Name of Each Exchange on Which Registered
|
|
Common Stock, $0.01 par value per share
|
New York Stock Exchange
|
Securities registered pursuant to Section 12(g) of the Act:
None
Indicate by check mark if the registrant is a well-known seasoned issuer, as defined in Rule 405 of the Securities Act. Yes
þ
No
¨
Indicate by check mark if the registrant is not required to file reports pursuant to Section 13 or Section 15(d) of the Exchange Act. Yes
¨
No
þ
Indicate by check mark whether the registrant: (1) has filed all reports required to be filed by Section 13 or 15(d) of the Exchange Act during the preceding 12 months (or for such shorter period that the registrant was required to file such reports), and (2) has been subject to such filing requirements for the past 90 days. Yes
þ
No
¨
Indicate by check mark whether the registrant has submitted electronically and posted on its corporate Web site, if any, every Interactive Data File required to be submitted and posted pursuant to Rule 405 of Regulation S-T during the preceding 12 months (or for such shorter period that the registrant was required to submit and post such files). Yes
þ
No
¨
Indicate by check mark if disclosure of delinquent filers pursuant to Item 405 of Regulation S-K is not contained herein, and will not be contained, to the best of the registrant’s knowledge, in definitive proxy or information statements incorporated by reference in Part III of this Form 10-K or any amendment to this Form 10-K.
þ
Indicate by check mark whether the registrant is a large accelerated filer, an accelerated filer, a non-accelerated filer, a smaller reporting company, or an emerging growth company. See the definitions of “large accelerated filer,” “accelerated filer,” “smaller reporting company,” and “emerging growth company” in Rule 12b-2 of the Exchange Act.
|
Large accelerated filer
þ
|
Accelerated filer
¨
|
|
Non-accelerated filer
¨
(Do not check if a smaller reporting company)
|
Smaller reporting company
¨
|
|
Emerging growth company
¨
|
|
If an emerging growth company, indicate by check mark if the registrant has elected not to use the extended transition period for complying with any new or revised financial accounting standards provided pursuant to Section 13(a) of the Exchange Act.
¨
Indicate by check mark whether the registrant is a shell company (as defined in Rule 12b-2 of the Exchange Act). Yes
¨
No
þ
The aggregate market value of the registrant’s voting and non-voting common equity held by non-affiliates computed by reference to the price at which the common equity was last sold as of the last business day of the registrant’s most recently completed second fiscal quarter was $38,484,678,440. As of February 5, 2018, the number of shares of the registrant’s Common Stock outstanding was 582,294,307 shares.
DOCUMENTS INCORPORATED BY REFERENCE
Certain information contained in the registrant’s Proxy Statement for the 2018 Annual Meeting of Stockholders is incorporated herein by reference in Part III of this Annual Report on Form 10-K. The Proxy Statement will be filed with the Securities and Exchange Commission within 120 days after the end of the registrant’s fiscal year to which this report relates.
Intercontinental Exchange, Inc.
ANNUAL REPORT ON FORM 10-K
For the Fiscal Year Ended December 31, 2017
TABLE OF CONTENTS
|
Item
Number
|
Page
Number
|
|
|
PART I
|
||
|
1.
|
||
|
1(A).
|
||
|
1(B).
|
||
|
2.
|
||
|
3.
|
||
|
4.
|
||
|
PART II
|
||
|
5.
|
||
|
6.
|
||
|
7.
|
||
|
7(A).
|
||
|
8.
|
||
|
9.
|
||
|
9(A).
|
||
|
9(B).
|
||
|
PART III
|
||
|
10.
|
||
|
11.
|
||
|
12.
|
||
|
13.
|
||
|
14.
|
||
|
PART IV
|
||
|
15.
|
||
|
16.
|
||
In this Annual Report on Form 10-K, or Annual Report, and unless otherwise indicated, the terms “Intercontinental Exchange,” “ICE,” “we,” “us,” “our,” “our company,” and “our business” refer to Intercontinental Exchange, Inc. together with its consolidated subsidiaries. References to “ICE products” mean products listed on one or more of our markets.
The following discussion should be read in conjunction with our consolidated financial statements and related notes included elsewhere in this Annual Report. Due to rounding, figures in tables may not sum exactly. All references to “options” or “options contracts” in the context of our futures products refer to options on futures contracts.
Forward-Looking Statements
This Annual Report, including the sections entitled “Business,” “Legal Proceedings,” “Risk Factors” and “Management’s Discussion and Analysis of Financial Condition and Results of Operations,” contains forward-looking statements that are based on our beliefs and assumptions and information currently available to us. You can identify these statements by terminology such as “may,” “will,” “should,” “could,” “would,” “target,” “goal,” “expect,” “intend,” “plan,” “anticipate,” “believe,” “estimate,” “predict,” “potential,” “continue,” or the antonyms of these terms or other comparable terminology.
Forward-looking statements relate to future events or our future financial performance and involve known and unknown risks, uncertainties and other factors that may cause our results, levels of activity, performance, cash flows, financial position or achievements to differ materially from those expressed or implied by these statements. Although we believe that the expectations reflected in the forward-looking statements are reasonable, we cannot guarantee future results, levels of activity, performance or achievements. Accordingly, we caution you not to place undue reliance on any forward-looking statements we may make.
Factors that may affect our performance and the accuracy of any forward-looking statements include, but are not limited to, those listed below:
|
•
|
conditions in global financial markets and domestic and international economic, political and social conditions;
|
|
•
|
the impact of the introduction of or any changes in laws, regulations, rules or government policies with respect to financial markets, increased regulatory scrutiny or enforcement actions and our ability to comply with these requirements;
|
|
•
|
volatility in commodity prices, equity prices, and price volatility of financial benchmarks and instruments such as interest rates, credit spreads, equity indices and foreign exchange rates;
|
|
•
|
the business environment in which we operate and trends in our industry, including trading volumes, clearing, data services, fees, changing regulations, competition and consolidation;
|
|
•
|
the success of our clearing houses and our ability to minimize the risks associated with operating clearing houses in multiple jurisdictions;
|
|
•
|
the success of our equity and options exchanges and the exchanges’ compliance with their respective regulatory and oversight responsibilities;
|
|
•
|
the resilience of our electronic platforms and soundness of our business continuity and disaster recovery plans;
|
|
•
|
continued high renewal rates of subscription-based data revenues;
|
|
•
|
our ability to identify and effectively pursue, implement and integrate acquisitions and strategic alliances;
|
|
•
|
our ability to complete and realize the synergies and benefits of our acquisitions within the expected time frame, and to integrate acquired operations with our business;
|
|
•
|
our ability to effectively maintain our growth;
|
|
•
|
the performance and reliability of our other technologies and those of third-party service providers, including our ability to keep pace with technological developments and to ensure that the technology we utilize is not vulnerable to security risks or other disruptive events;
|
|
•
|
our ability to identify trends and adjust our business to benefit from such trends;
|
|
•
|
the accuracy of our cost and other financial estimates and our belief that cash flows from operations will be sufficient to service our debt and to fund our operational and capital expenditure needs;
|
2
|
•
|
our ability to maintain existing market participants and data customers, and to attract new ones, and to offer additional products and services, leverage our risk management capabilities and enhance our technology in a timely and cost-effective fashion;
|
|
•
|
our ability to attract and retain key talent;
|
|
•
|
our ability to protect our intellectual property rights and to operate our business without violating the intellectual property rights of others; and
|
|
•
|
potential adverse results of threatened or pending litigation and regulatory actions and proceedings.
|
These risks and other factors include, among others, those set forth in Item 1(A) under the caption “Risk Factors” and elsewhere in this Annual Report, as well as in other filings we make with the Securities and Exchange Commission, or SEC. Due to the uncertain nature of these factors, management cannot assess the impact of each factor on the business or the extent to which any factor, or combination of factors, may cause actual results to differ materially from those contained in any forward-looking statements.
Any forward-looking statement speaks only as of the date on which such statement is made, and we undertake no obligation to update any of these statements to reflect events or circumstances occurring after the date of this Annual Report. New factors may emerge and it is not possible to predict all factors that may affect our business and prospects.
3
ITEM 1.
BUSINESS
Introduction
We are a leading global operator of regulated exchanges, clearing houses and listings venues, and a provider of data services for commodity, fixed income and equity markets. We operate regulated marketplaces for listing, trading and clearing of a broad array of derivatives and securities contracts across major asset classes, including energy and agricultural commodities, interest rates, equities, equity derivatives, exchange traded funds, credit derivatives, bonds and currencies. We also offer end-to-end data services and solutions to support the trading, investment, risk management and connectivity needs of customers around the world across major asset classes.
Our Global Execution, Clearing and Data Businesses


Our business is currently conducted as two reportable business segments: our Trading and Clearing segment and our Data and Listings segment. The majority of our identifiable assets are located in the United States, or U.S., and the United Kingdom, or U.K. For a summary of our revenues, net assets and net property and equipment by geographic region, see note 17 to our consolidated financial statements included in this Annual Report.
Trading and Clearing Segment
Our Trading and Clearing segment includes revenues generated by our execution venues and our clearing services, as well as other revenues. Our exchanges include derivative exchanges in the U.S., U.K., European Union, or EU, Canada and Singapore, and cash equities, equity options and bond exchanges in the U.S. We also operate over-the-counter, or OTC, markets for physical energy and credit default swaps, or CDS, trade execution as well as two electronic fixed income alternative trading systems, or ATSs. To serve global derivatives markets, we operate central counterparty clearing houses in the U.S., U.K., EU, Canada and Singapore. Our Trading and Clearing segment generated revenues of $2.1 billion in 2017 and accounted for 46% of our consolidated revenues.
Derivatives Exchanges:
Our regulated futures and options exchanges provide a means for trading and managing risks associated with price volatility, securing physical delivery of certain commodities, as well as enabling investment, asset allocation and diversification. Futures and options on futures contracts are cleared through one of our seven central clearing houses. We conduct our derivatives markets through the following regulated exchanges:
|
•
|
ICE Futures Europe
is a leading exchange for futures and options contracts based on energy and agricultural commodities, interest rates, equity derivatives and emissions. ICE Clear Europe clears contracts traded on ICE Futures Europe.
|
|
•
|
ICE Futures U.S.
is a leading exchange that lists futures and options contracts for agricultural and energy commodities, equity indices, currencies, credit and precious metals. ICE Clear Europe clears select energy contracts traded on ICE Futures U.S. and ICE Clear U.S. clears all other contracts traded on ICE Futures U.S.
|
|
•
|
ICE Futures Canada
is Canada’s leading agricultural futures and options exchange. ICE Clear Canada clears contracts traded on ICE Futures Canada.
|
|
•
|
ICE Endex
is a leading continental European energy exchange providing regulated markets for natural gas and power derivatives, gas balancing markets and gas storage services and is based in Amsterdam, the Netherlands. ICE Clear Europe provides clearing for ICE Endex.
|
4
|
•
|
Natural Gas Exchange, Inc., or NGX,
is a Canadian exchange which provides electronic execution, clearing and data services to the North American natural gas, electricity and oil markets.
|
|
•
|
ICE Futures Singapore
lists futures contracts for energy, gold and foreign exchange commodities. ICE Clear Singapore provides clearing for ICE Futures Singapore.
|
|
•
|
NYSE American Options
, formerly known as NYSE Amex Options, is a U.S. equity options exchange that offers order execution through a hybrid model, with both electronic trading and open outcry on our floor adjoining the New York Stock Exchange, or the NYSE.
|
|
•
|
NYSE Arca Options
is also a U.S. equity options exchange that offers order execution through a hybrid model, with execution services conducted on our trading floor in San Francisco, California.
|
Some of the key products offered on our derivatives exchanges include:
•
Energy Futures Contracts:
We operate regulated markets for energy futures contracts and options on those contracts through our subsidiaries: ICE Futures Europe, ICE Futures U.S., NGX, and ICE Futures Singapore. Our core products include contracts based on crude and refined oil, natural gas, power, emissions, coal, freight, iron ore and natural gas liquids. In aggregate, we offer approximately 2,000 energy futures contracts in our markets. Our largest energy contract is the ICE Brent crude futures contract. The contract is a deliverable contract based on an Exchange for Physical, or EFP, delivery mechanism with an option to cash settle against the ICE Brent Index price on the last trading day of the futures contract. The Brent complex, which includes ICE Brent crude futures, is a group of related benchmarks used to price a range of traded oil products, including approximately two-thirds of the world’s internationally-traded crude oil. The ICE Low Sulphur Gasoil futures contract is a European diesel oil contract that offers physical delivery and serves as a middle distillate pricing benchmark for refined oil products, particularly in Europe and Asia. We also operate the world’s second largest market for trading in WTI crude oil futures, as measured by the volume of contracts traded in 2017 according to the Futures Industry Association. The WTI crude futures contract is the benchmark for pricing U.S. crude oil. ICE also operates markets for North American natural gas and power futures contracts, as well as global coal and European and U.K. natural gas, power and emissions contracts.
•
Agricultural Futures Contracts:
Our agricultural commodity contracts are offered on ICE Futures U.S., ICE Futures Europe and ICE Futures Canada. The prices for our agricultural contracts serve as global benchmarks for the physical commodity markets, including Sugar No. 11
®
(world raw sugar), white sugar, Coffee “C”
®
(Arabica coffee), robusta coffee, Cotton No. 2
®
(cotton), U.S. and London cocoa and frozen concentrated orange juice. ICE Futures Canada is a regulated commodity futures exchange in Canada and it facilitates markets for futures and options on futures contracts for canola.
•
Financial Futures Contracts:
ICE Futures Europe provides markets for a range of financial futures and options on futures contracts, including interest rate, equity indices, and currency derivative products. Core products are short-term interest rate, or STIR, contracts, with ICE Futures Europe’s STIR contracts principally-based on implied forward rates denominated in euro and pound sterling, such as Euribor, short-term Sterling, SONIA (based on the Sterling Overnight Index Average) and Gilt contracts, as well as U.S. rates including Eurodollar and GCF repo futures. ICE Futures U.S. offers financial futures and options on futures contracts in currency, equity index and credit index markets, including contracts on certain MSCI indices, most notably the Emerging Markets and EAFE indices and the benchmark U.S. Dollar Index (USDX®) futures contract.
•
Equity Options:
We provide markets for trading securities options. NYSE American Options trades options on more than 2,600 equity securities (including exchange traded funds, or ETFs) and NYSE Arca Options trades options on more than 2,200 equity securities.
OTC Markets:
Our OTC markets include both regulated and unregulated platforms for the execution of cleared and bilateral, or non-cleared, CDS instruments and energy contracts. Through our brokerage services, including those offered through the recently acquired Shorcan Energy Brokers, Inc., or Shorcan Energy, we provide OTC brokerage services to the North American energy markets. And through ICE Swap Trade, which operates our swap execution facility, we provide execution services to the global credit default swap market. We are the leading venue for OTC clearing of CDS as measured by cleared notional value.
Key products offered on our OTC venues include:
•
Credit Default Swaps:
We offer electronic trade execution for CDS instruments through Creditex U.S. and U.K., and through ICE Swap Trade, the operator of our Commodity Futures Trading Commission, or CFTC, registered swap execution facility, or SEF. We offer clearing services for the CDS markets through ICE Clear Europe and ICE Clear Credit. Both CDS clearing houses are open-access and therefore accept qualifying trades for clearing that are executed on other venues or bilaterally.
5
We also operate ICE Link, which is an automated trade workflow and electronic connectivity platform for affirming credit derivatives transactions. It also provides connectivity between industry participants, facilitating straight-through processing between trading venues, trade repositories, swap data repositories or trade warehousing and legal confirmation platforms, or to a clearing house for CDS transactions that are clearing eligible.
•
OTC Energy Products:
Our OTC energy markets comprise bilaterally-traded energy contracts. We operate our financially settled bilateral energy markets through ICE Swap Trade and we offer electronic trading of contracts based on physically settled natural gas, power and refined oil contracts through ICE U.S. OTC Commodity Markets. As of December 31, 2017, approximately 1,000 OTC energy contracts were listed on our electronic trading platform for bilateral trading. A substantial portion of our OTC volume relates to approximately 70 contracts in North American natural gas and power, and global oil.
Alternative Trading Systems:
Through Creditex Securities Corporation, we operate two ATSs, serving the fixed income markets. ICE Credit Trade, which is our dealer-to-dealer venue, offers electronic corporate bond trading solutions. BondPoint, which we acquired from Virtu Financial on January 2, 2018, offers dealer-to-client electronic execution services across an array of fixed income securities including corporate, municipal and government bonds.
Clearing Services:
We operate seven clearing houses, each of which acts as a central counterparty that becomes the buyer to every seller and the seller to every buyer for its clearing members. Through this central counterparty function, the clearing houses provide financial security for each transaction for the duration of the position by limiting counterparty credit risk. Our clearing houses are responsible for providing clearing services to each of our futures exchanges and certain of our clearing houses clear contracts traded outside of our execution venues. Our clearing houses are:
|
•
|
ICE Clear Europe:
clears ICE Futures Europe and ICE Endex futures and options contracts for interest rates, equity indices, energy and agriculture contracts, as well as ICE Futures U.S. futures and options contracts for energy and OTC European CDS instruments;
|
|
•
|
ICE Clear U.S.:
clears ICE Futures U.S. soft commodity, currency, metals, credit and equity index futures contracts;
|
|
•
|
NGX:
offers electronic execution and clearing to the North American natural gas, electricity and oil markets;
|
|
•
|
ICE Clear Credit:
clears North American, European, Asian-Pacific and Emerging Market CDS instruments;
|
|
•
|
ICE Clear Canada:
clears ICE Futures Canada agricultural futures contracts;
|
|
•
|
ICE Clear Netherlands:
offers clearing for Dutch equity options; and
|
|
•
|
ICE Clear Singapore:
clears ICE Futures Singapore commodity and foreign exchange contracts, or FX.
|
Our clearing houses have never experienced an incident of a clearing member default which has required the use of the guaranty funds of non-defaulting clearing members or the assets of the clearing house. We have extensive risk management procedures and governance in place to ensure we protect the interests of our clearing members and clearing houses. Each of our clearing houses has instituted a multi-layered risk management system of rules, policies and procedures to protect itself in the event of a clearing member default, starting with membership criteria and continuing to powers of assessment (other than for NGX) in the event of a clearing member default, generally as follows:
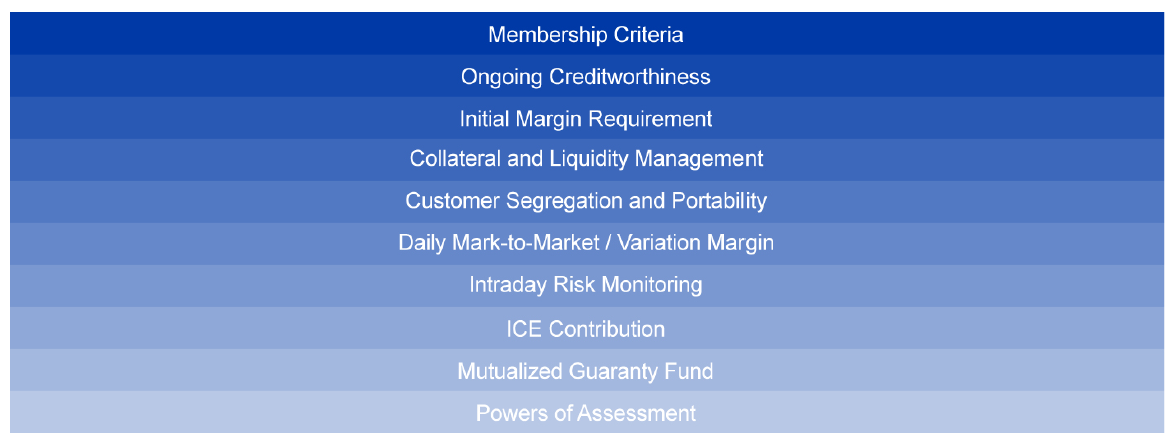
To ensure performance, our clearing houses maintain extensive technology and quantitative risk management systems, as well as financial and operational requirements for clearing members and minimum margin requirements for our cleared products. Our clearing houses use software based on industry standard margining conventions and on our proprietary models uniquely
6
customized to our products to determine the appropriate margin requirements for each clearing member by simulating the possible gains and losses of complex portfolios based on price movements. Our clearing houses’ margin methodologies are independently validated on an annual basis.
In the event of a payment default by a member, the default procedures specified in the rules of that clearing house would apply. In general, the clearing houses would first apply assets of the defaulting member to cover the obligation. These include original/initial margin, variation margin, positions held at the clearing house and, other than for NGX, guaranty fund deposits of the clearing member. In addition, the clearing houses could make a demand for payment pursuant to any available guaranty provided by the parent or affiliate of the defaulting clearing member. If that is not sufficient, the clearing houses would use any designated contributions held by the clearing house itself, as applicable, the guaranty fund contributions of other non-defaulting members and funds collected through an assessment against all other non-defaulting members, to satisfy the remaining deficit, if any. As part of the powers and procedures designed to backstop financial obligations in the event of a default, each of our clearing houses may levy assessments on all of its clearing members if there are insufficient funds available to cover a deficit following the depletion of all assets in the guaranty fund.
Our risk management framework that applies to the clearing services for the CDS markets through ICE Clear Credit and ICE Clear Europe is separate from that of our futures and options or non-CDS clearing operations. ICE Clear Credit only offers clearing services with respect to the CDS markets. With respect to the ICE Clear Europe CDS clearing offering, we have established separate CDS risk pools that feature a separate guaranty fund and separate margin accounts, meaning that the CDS positions are not combined with futures and options positions. The CDS clearing houses have risk management systems that are designed specifically for CDS instruments and have independent governance structures. Our CDS clearing houses are open-access, consistent with regulatory requirements, and we accept qualifying trades for clearing that are executed on other venues. As of December 31, 2017, our CDS clearing houses collectively clear 499 single name instruments and 145 CDS indexes.
Other than for NGX, which we acquired on December 14, 2017 and which provides electronic execution, clearing and data services to the North American natural gas, electricity and oil markets, our clearing houses require that each clearing member make deposits to the guaranty fund. The amounts in the guaranty fund serve to secure the obligations of the clearing members to the clearing house. The amounts in the guaranty fund are mutualized in that a clearing member’s deposit serves to secure both its own obligation to the clearing house as well as the other clearing members’ obligations to the clearing house.
In addition, we contribute a limited amount of our capital to the guaranty fund of each of our clearing houses. This capital contribution is commonly referred to as clearing house "Skin-In-The-Game". As of
December 31, 2017
, we have made combined contributions to our clearing houses’ guaranty funds of
$254 million
. ICE Clear Europe has contributed
$100 million
of its own cash as part of its futures and options guaranty fund as of
December 31, 2017
and has also contributed
$50 million
of its own cash as part of its CDS guaranty fund as of
December 31, 2017
. ICE Clear Credit has contributed
$50 million
of its own cash as part of its CDS guaranty fund as of
December 31, 2017
and ICE Clear U.S. has contributed
$50 million
of its own cash as part of its futures and options guaranty fund as of
December 31, 2017
. ICE Clear Canada, ICE Clear Netherlands and ICE Clear Singapore have each also contributed a combined $
4 million
in cash to their respective guaranty funds. Each of these amounts are reflected as long-term restricted cash in the consolidated balance sheet.
NGX maintains a guaranty fund utilizing a $100 million letter of credit that has been entered into with a major Canadian chartered bank and backed by a default insurance policy underwritten by Export Development Corporation, or EDC, a Canadian government agency. In the event of a participant default, where a participant’s collateral becomes depleted, any remaining shortfall would be covered by a draw down on the letter of credit following which NGX would pay the first $15 million in losses per its deductible and recover additional losses under the insurance policy up to $100 million. We have provided a parent guaranty of $100 million in favor of the major Canadian chartered bank and we voluntarily reserved $100 million of our Amended Credit Facility (defined below) to backstop that parent guaranty.
To provide a tool to address the liquidity needs of our clearing houses and manage the liquidation of margin and guaranty fund deposits held in the form of cash and high quality sovereign debt, ICE Clear Europe, ICE Clear Credit and ICE Clear US have entered into Committed Repurchase Agreement Facilities, or Committed Repo. Additionally, ICE Clear Credit has entered into Committed FX Facilities to support these liquidity needs. As of
December 31, 2017
the following facilities were in place:
ICE Clear Europe: $1.05 billion in Committed Repo to finance U.S. dollar, euro and pound sterling deposits.
|
ICE Clear Credit:
|
$300 million in Committed Repo to finance U.S. dollar and euro deposits, €500 million in Committed Repo to finance euro deposits, and €1.9 billion in Committed FX Facilities to finance euro payment obligations.
|
ICE Clear US: $250 million in Committed Repo to finance U.S. dollar deposits.
7
Securities Exchanges:
We currently operate three securities exchanges for cash equity securities, including ETFs as well as fixed income securities. One of the primary functions of these markets is to ensure that orders to purchase and sell securities are executed in a fair, orderly and efficient manner. In addition, through our listings operations, we offer corporate and ETF issuers access to the U.S. capital markets. We currently conduct our securities trading and listings business through the following exchanges and marketplaces:
|
•
|
The New York Stock Exchange
is a leading global cash equity exchange. It is the leading equity exchange for initial public offerings, or IPOs, globally, and enables companies seeking to raise capital to become publicly listed through the IPO process upon meeting exchange listing standards. In addition to common stocks, preferred stocks and warrants, the NYSE lists structured products, such as capital securities and mandatory convertible securities. In addition, NYSE operates NYSE Bonds, an electronic trading platform with transparent pricing for debt securities, including corporate bonds.
|
|
•
|
NYSE American
, formerly NYSE MKT, became part of NYSE Group, Inc., or NYSE Group, in 2008. NYSE American supports emerging growth companies by providing a listing venue for a broad range of companies that may not qualify for listing on the New York Stock Exchange.
|
|
•
|
NYSE Arca
lists approximately 1,500 securities, including listings on the NYSE, Nasdaq, Inc., or Nasdaq, and BATS Global Markets, Inc., or BATS. NYSE Arca is the leading listing and trading platform for ETFs and exchange traded notes. NYSE Arca also lists and trades securities options.
|
On January 31, 2017, we acquired
100%
of National Stock Exchange, Inc., now named NYSE National. The acquisition gives the NYSE Group a fourth U.S. exchange license. NYSE National is distinct from NYSE Group’s three listings exchanges because NYSE National will only be a trading venue and will not be a listings market. NYSE Group’s three listings exchanges, NYSE, NYSE American and NYSE Arca, have unique market models designed for corporate and ETF issuers. After closing the transaction, NYSE National ceased operations on February 1, 2017. Subject to regulatory approvals, NYSE Group anticipates re-launching operations on NYSE National, Inc. in the second quarter of 2018.
Data and Listings Segment
Our Data and Listings segment includes a range of data services for global financial and commodity markets, including pricing and reference data, indices, exchange data, analytics, consolidated feeds, desktops and connectivity solutions as well as corporate and ETF listing services on our cash equity exchanges. Our Data and Listings segment generated revenues of $2.5 billion in 2017 and accounted for 54% of our consolidated revenues. Revenues in our Data and Listings segment are largely subscription-based and recurring in nature.
Data Services:
ICE Data Services offers a broad range of data, analytics and connectivity solutions across global commodity, equity and fixed income markets. ICE Data Services provides our customers comprehensive, flexible information services and solutions to meet their operational, compliance and risk management needs. The diversity and quality of the data we distribute, together with our technology and connectivity services, are crucial to supporting liquidity, price discovery, trading and investing, risk management, compliance, reporting and other operational activities across global financial markets. We intend to continue to invest to expand our data distribution offerings across asset classes, data types and services to serve the evolving needs of our global customer base.
We have defined our data business in three main categories of services: Pricing and Analytics; Exchange Data; and Desktops and Connectivity.
•
Pricing and Analytics:
ICE Data Services’ Pricing and Analytics service provides global securities evaluations, reference data, risk analytics, derivative pricing and other information designed to meet our customers’ risk management, reporting and regulatory compliance needs. For example, we provide fixed income valuations including independent evaluated pricing services on over 2.7 million fixed income securities and other hard-to-value financial instruments. Our evaluated pricing spans approximately 145 countries and covers a wide range of financial instruments including sovereign, corporate and municipal bonds, structured products, leveraged loans, and our Fair Value Information Services for international equities, options, futures and fixed income products. Our reference data complements our evaluated pricing services by offering our clients a broad range of descriptive information, covering over 11 million financial instruments across 210 markets. This data is used by clients to enhance risk management, support compliance needs and improve operational efficiency. We also offer a range of multi-asset class analytics which provide valuation services for OTC derivatives and structured products, best execution, liquidity indicators and fixed income and equity portfolio analytics to help analyze risk and return exposures. These offerings are delivered over our secure technology platforms and are used by investment professionals to simulate various market environments to help forecast performance, construct portfolios, validate investment strategies, conduct stress testing, generate dynamic risk measures, analyze asset cash flows and support regulatory compliance requirements. ICE Data Services also
8
designs and distributes many of today’s leading indices and benchmarks across equities, fixed income and derivatives markets. Following the acquisition of the Bank of America Merrill Lynch, or BofAML indices in October 2017, we are the second largest fixed income index provider with nearly $1 trillion of assets under management, or AUM, benchmarked to our indices. Our ETF Valuations and Index Construction offering provides clients with independent and objective operational outsourcing, including design, support, maintenance, calculation and distribution of indices across fixed income instruments, currencies, equities, and commodities. ICE Benchmark Administration, or IBA, is the regulated administrator of a range of benchmarks including LIBOR, the ICE Swap Rate, the LBMA Gold and Silver Price, and the ISDA SIMM Crowdsourcing Utility. IBA has implemented processes, governance, systems and technology that enhance the transparency and security of benchmarks and services relied upon globally.
•
Exchange Data:
Our exchange data business provides unique real-time and historical pricing, order book and transaction information related to our exchanges across global commodity and financial markets. We publish a broad range of prices and other transaction data and related content from our electronic futures trading platform. The data is disseminated directly and through data vendors to market participants. In addition, we develop unique equity market data solutions, which is known as proprietary data. We package this exchange proprietary market data as real-time products and as historical products, which are used for analysis by market participants and observers. These products are proprietary, and we do not share the revenues that they generate with other markets. Proprietary data that provides real-time quoting or trading information from our securities exchanges is filed with the SEC and the pricing for these market data products is subject to review by the SEC. Finally, we receive a share of revenue from the National Market System Plan, or NMS Plan, consolidated data products. All SEC-registered securities exchanges send their trades and top-of-book quotes in exchange listed securities to a central consolidator, which then distributes the data pursuant to SEC requirements. The majority of our market data revenue from consolidated data products is for trades and quotes in NYSE-listed, NYSE American-listed, and NYSE-Arca securities traded on our securities exchanges. We also receive a share of the consolidated market data revenues from trades and quotes in Nasdaq-listed securities.
•
Desktops and Connectivity:
Our Desktop and Connectivity business provides the connection to our exchanges, clearing houses and data centers and facilitates the distribution of our ICE Data Services data as well as data from a broad array of trading venues and news feeds through our consolidated feeds offering. Our Desktop service offers a range of products and services to support commodity and energy traders, financial advisors, wealth managers, Investor Relations Officers and Chief Financial Officers. These applications deliver real-time financial market information and decision-support tools to help clients analyze financial markets and make investment decisions. Similarly, our web-based financial information solutions consist of market data, decision-support tools and hosting services. Our robust instant messaging, or IM, system protects the privacy of clients’ business information while allowing collaboration with other market participants in the industry through a secure, compliant channel. In 2017, we launched the ICE Connect Platform. ICE Connect provides integrated access to global markets and price discovery solutions. ICE Connect provides integrated access to trading, messaging, news, data and analytics, with single sign-on functionality to streamline workflow and leverage data.
We also offer connectivity solutions to access markets and data through highly secure, resilient and low latency network options, as well as global colocation services, and Direct Market Access to over 150 venues and 600 market data and news feeds. Our consolidated feeds solution provides cost-effective access to a range of real-time data sources to over 17 million instruments and over 1,000 entitlement options. Clients who have agreements with any of over 600 global exchanges, trading venues and data sources covering listed and OTC securities can receive consolidated real-time and/or delayed feeds of such financial data. Our Consolidated Feed service is complemented by our Tick History service, which provides access to tick and trade data for global securities to assist clients with “best execution” requirements, transaction cost analysis and advanced charting applications. Our connectivity solutions provide secure, purpose-built, private multi-participant connectivity to global exchanges and content service providers via dedicated data circuits with a design that ensures no single point of failure exists across the platform. We operate purpose-built data centers in Basildon and Essex in the U.K. and Mahwah, New Jersey, and we manage systems in a third-party data center in Illinois to meet the needs of a largely electronic customer base. We offer server colocation space at our data centers for market participants to house their servers and applications on equivalent terms. The acquisition of TMX Atrium and our announced partnership with Go West, once launched, will mean our Secure Financial Transaction Infrastructure, or SFTI, wireless networks will offer the most extensive ultra-low latency network connectivity solutions among the New York, Chicago, Toronto and Tokyo metro areas. We are already experiencing customer interest in our Go West partnership and expect to go live in the first half of 2018.
Listings:
Through our listings services, we offer corporate and ETF issuers access to the U.S. capital markets. Our listing venues allow companies to list domestic and international equity securities, corporate structured products, convertible bonds, trackers and debt securities. In 2017, the NYSE was the global leader in capital raised for the seventh consecutive year, with $128 billion raised in total IPO proceeds and follow-on offerings from 454 transactions, almost twice the capital raised by any other exchange in the world.
9
Product Development
We leverage our customer relationships, global distribution, technology infrastructure and software development capabilities to diversify our products and services. New product development is an ongoing process, and we are continually developing, evaluating and testing new products for introduction into our markets to better serve our client base. The majority of our product development relates to evaluating new contracts or new markets based on customer demand. New contracts often must be reviewed and approved by relevant regulators. Outside of third-party licensing costs, we typically do not incur separate, material costs for the development of new products - such costs are embedded in our normal costs of operation.
While we have historically developed our products and services internally, we also periodically evaluate and enter into strategic partnerships and licensing arrangements to develop meaningful new products and services.
Technology
Technology is a key component of our business strategy, and we regard effective execution of our technology initiatives as crucial to our success. Where feasible, we design and build our software systems and believe that having control over our technology allows us to be more responsive to the needs of our customers, better support the dynamic nature of our business and deliver the highest quality markets and data. Our proprietary systems are built using state-of-the-art technology. A significant number of our employees work in technology, including product management, project management, system architecture, software development, network engineering, information security, performance, systems analysis, quality assurance, database administration and customer technical support.
ICE Trading Platform and Technology
The ICE trading platform supports trading in our cleared futures and options markets as well as our bilateral OTC markets. We also offer voice brokers a facility for submitting block trades for products that are eligible for clearing.
Speed, reliability, scalability and capacity are critical performance criteria for electronic trading platforms. Connectivity to our trading platform for our markets is available through our web-based front-end, as well as multiple independent software vendors, or ISVs, and application programming interfaces, or APIs.
NYSE Trading Platforms and Related Technology
The NYSE electronic trading platform features an open system architecture that allows users to access our system via one of the many front-end trading applications developed by ISVs. For equity options, we offer a hybrid model of electronic and open outcry trading through NYSE American Options and NYSE Arca Options. We have developed a new integrated trading platform and matching engine known as NYSE Pillar and have migrated NYSE Arca Equities and NYSE American to this platform. In the future, we will complete the migration for the remaining U.S. cash equities and equity options markets which currently operate on distinct platforms. The single specification will improve performance and reduce the cost and complexity of operating multiple equity and options trading systems.
ICE Data Services Technology
ICE Data Services technology supports solutions for mission-critical information, analytics and connectivity. Our technology centers on integrated platforms for the capture, maintenance and synthesis of information. This platform includes a single configurable data capture mechanism, a common data model and a flexible multi-format delivery capability. The platform enables real-time processing and delivery of information, accelerates new product development, improves production reliability, and yields operating and cost efficiencies as the pre-existing heterogeneous environment is retired. Our information is delivered via real-time messaging protocols, files, web services and other on-demand facilities and state-of-the-art front-ends.
Clearing Technology
A broad range of trade management and clearing services are offered through the integrated technology infrastructure that serves our clearing houses. ICE Clearing Systems encompass a number of integrated systems, including post-trade position management, risk management, settlement and treasury and reporting functions.
A core component of our derivatives clearing houses is the risk management of clearing firm members. Our extensive technology and rules-based risk system provide analytical tools to determine margin, to determine credit risk, and to monitor risk of the clearing members. The risk system also monitors trading activities of the clearing members.
10
Cybersecurity
Cybersecurity is critical to our operations. We employ a defense-in-depth strategy, with leading-edge security technology and processes including encryption, firewalls, virus prevention, intrusion prevention and detection systems and secured servers. Where our services are accessible via the Internet, we have implemented additional restrictions to limit access to specific approved networks. We also maintain insurance coverage that may, subject to the terms and conditions of the policy and payment of significant deductibles, cover certain aspects of cybersecurity issues. We monitor physical threats in addition to cyber threats and continuously review and update physical security and environmental controls to secure our office and data center locations.
Business Continuity Planning and Disaster Recovery
We maintain comprehensive business continuity and disaster recovery plans and facilities to provide nearly continuous availability of our markets in the event of a business disruption or disaster. We maintain incident and crisis management plans that address responses to disruptive events at any of our locations worldwide.
Intellectual Property
We rely on a wide range of intellectual property, both owned and licensed, for our electronic platforms. We own the rights to a large number of trademarks, service marks, domain names and trade names in the U.S., Europe and in other parts of the world. We have registered many of our trademarks in the U.S. and in certain other countries. We hold the rights to a number of patents and have made a number of patent applications in the U.S. and other countries. We also own the copyright to a variety of material. Those copyrights, some of which are registered, include software code, printed and online publications, websites, advertisements, educational material, graphic presentations and other literature, both textual and electronic. We attempt to protect our intellectual property rights by relying on trademarks, patents, copyrights, database rights, trade secrets, restrictions on disclosure and other methods.
This Annual Report also includes references to third party trademarks, trade names and service marks. Our use or display of any such trademarks, trade names or service marks is not an endorsement or sponsorship and does not indicate any relationship between us and the parties who own such marks and names.
Employees
As of
December 31, 2017
, we had a total of 4,952 employees, with 1,627 employees in New York, 884 employees in Atlanta, 713 employees in the U.K. and a total of 1,728 employees across our other offices around the world. Of our total employee base, less than 1% is subject to collective bargaining arrangements, and such relations are considered to be good.
11
Our History
Our Competitive Strengths and Competition
Competitive Strengths
We operate global markets in the asset classes in which we compete, including futures, cash equities, equity options, fixed income and OTC markets. We believe our key strengths include our:
|
•
|
diverse liquid, global derivatives, fixed income and equities markets across 12 regulated exchanges as well as OTC and ATS venues;
|
|
•
|
secure central counterparty clearing and risk management for global derivatives markets through seven clearing houses in five jurisdictions;
|
|
•
|
global data services including pricing and analytics, desktop and connectivity services across multiple asset classes serving commodity, fixed income and equity markets; and
|
|
•
|
widely-distributed, leading edge technology for trading, clearing, data and trade processing.
|
We are a leading global operator of regulated exchanges, clearing houses and listings venues and a provider of data services for commodity, fixed income and equity markets. Our global data services business consists of unique information derived from our various execution venues and clearing houses, as well as analytics, valuation services, reference data, desktops, indices and connectivity solutions. Our acquisitions of the BofAML Indices, SuperDerivatives, Interactive Data, Securities Evaluations and Credit Market Analysis have served to expand our data services based on rising demand for independent, real-time information, which is being driven by regulation, market fragmentation, passive investing and indexation, and increased automation. We provide data to global financial institutions and asset managers, commercial hedgers, corporates, traders and consumers across virtually all asset classes. We believe our data services are relevant to our clients’ business operations regardless of market volatility and price levels due to the need for continuous information and analysis.
12
Our regulated exchanges and our trading and clearing platforms offer qualified participants access to our markets and risk management services, covering a range of asset classes, including interest rates, equities, bonds, energy, agriculture, metals, equity indices, environmental, currencies, CDS and equity options. By operating several markets and offering thousands of products we provide our participants with flexibility to implement their trading and risk management strategies on a common technology with integrated clearing and data solutions.
Many of our futures contracts serve as global benchmarks for managing risk relating to exposure to price movements in the underlying products, including financial, energy and agricultural commodities. For example, we operate the leading market for ICE Brent crude oil futures, as measured by the volume of contracts traded in 2017 according to the Futures Industry Association. The ICE Brent Crude futures contract is the benchmark for pricing light, sweet crude oil produced and consumed outside of the U.S. It is part of the Brent complex, which forms the price reference for approximately two-thirds of the world’s internationally-traded physical oil. Our oil complex has expanded since its inception in 1988 to include more than 500 contracts for hedging related oil products. In addition, we operate a leading market for short-term European interest rates contracts, with our principal contracts based on implied forward rates on European Money Markets Institute Euribor rates and a short-term Sterling contract based on the ICE LIBOR rate, as well as Gilts and the Sonia contract, based on the Sterling Overnight Index Average as published each business day. We also offer markets in soft commodity benchmark contracts, including sugar, cocoa, cotton, coffee and canola, which serve as global price benchmarks.
We offer a range of central clearing and related risk management services to promote the liquidity and security of our markets in jurisdictions around the world to meet local regulatory and operational needs in key financial market centers. The credit and performance assurance provided by our clearing houses to clearing members is designed to substantially reduce counterparty risk and is a critical component of our exchanges’ identities as reliable and secure marketplaces for global transactions. We believe the range of products cleared and the risk management services offered by our clearing houses are a competitive advantage and attract market participants. Our clearing houses are designed to protect the financial integrity of our markets by maintaining strong governance and rules, managing collateral, facilitating payments and collections, enhancing capital efficiency and limiting counterparty credit risk.
We operate the leading global listings and trading exchanges for equities and ETFs, and offer our customers access to the U.S. capital markets. Our listing venues allow companies to list domestic and international equity securities, corporate structured products, convertible bonds, trackers and debt securities. In 2017, the NYSE was the global leader in capital raised for the seventh consecutive year, with $128 billion raised in total IPO proceeds and follow-on offerings.
Competition
The execution markets in which we operate are global and highly competitive. We face competition in all aspects of our business from a number of different enterprises, both domestic and international, including traditional exchanges, electronic trading platforms, data vendors and voice brokers. We believe we compete on the basis of a number of factors, including:
•
depth and liquidity of markets;
•
price transparency;
•
reliability and speed of trade execution and processing;
•
technological capabilities and innovation;
•
breadth of products and services;
•
rate and quality of new product developments;
•
quality of services;
•
stability of services;
•
distribution and ease of connectivity;
•
mid- and back-office service offerings, including differentiated and value-added services;
•
transaction costs; and
•
reputation.
We believe that we compete favorably with respect to these factors, and that our deep, liquid markets, breadth of product offerings, new product development, customer relationships and efficient, secure settlement, clearing and support services distinguish
13
us from our competitors. We believe that in order to maintain our competitive position, we must continue to develop new and innovative products and services, enhance our technology infrastructure, maintain liquidity and offer competitive costs.
In our derivatives markets, certain exchanges replicate our futures contracts. For example, CME Group lists our futures on agricultural and energy commodities, currency and equity index contracts. Nasdaq Futures, Inc., or NFX, an energy platform operated by Nasdaq has also listed certain of our energy contracts. We compete in European interest rates and equity derivatives with Eurex, which is the derivatives exchange operated by Deutsche Börse and Curve Global, a consortium of banks and exchanges that lists interest rate futures. In the European utilities markets, we compete with the European Energy Exchange.
In addition to venues that offer futures products, we also face competition from electronic trading systems, third-party clearing houses and technology firms. Additional ventures could form, or have been formed, to provide services that could potentially compete with certain services that we provide.
We compete with voice brokers active in the credit derivatives markets, other electronic trading platforms for derivatives, clearing houses and market data vendors. ICE Swap Trade and Creditex compete with other swap execution facilities and large inter-dealer brokers in the credit derivatives market.
We face significant competition with respect to equities trading, and this competition is expected to remain intense. Our current and prospective competitors include regulated markets, dark pools and other ATS, market makers and other execution venues. We also face competition from large brokers and customers that may assume the role of principal and act as counterparty to orders originating from retail customers, or by matching their respective order flows through bilateral trading arrangements, including through internalization of order flow.
Our principal competitor for listings in the U.S. is Nasdaq. For ETF listings, we compete with Nasdaq and CBOE Global Markets. We also face competition for foreign issuer listings from a number of stock exchanges outside the U.S., including the London Stock Exchange, Deutsche Börse, Euronext and stock exchanges in Hong Kong and Toronto. As other liquidity venues seek exchange status, we may face more competition for listings.
NYSE Arca and NYSE American Options face considerable competition in the equity options markets. Their principal U.S. competitors are the CBOE and Nasdaq.
Our fixed income trading venues, which include ICE Credit Trade, BondPoint and NYSE Bonds, compete with other electronic trading venues such as those offered by Bloomberg, TradeWeb and MarketAxess. Our platforms also compete for volume traded bilaterally or trading activity that is not done through an electronic venue.
ICE Data Services operates in a competitive environment for all of its constituent parts. Our Exchange Data products compete with similar offerings by other exchange groups. That competition and the competition for order flow among the exchange groups creates a competitive pricing environment for our proprietary data products. Pricing and Analytics competes with information obtained from informal industry relationships and sources, such as broker quotes. It, along with the Desktop and Connectivity business, competes with purchased third-party information and services from large global suppliers of financial market data, such as Bloomberg, Thomson Reuters Corporation and IHS Markit. One of the many offerings in our Connectivity business, SFTI competes with other extranet providers such as CenturyLink and Colt Technology Services. Our ICE Data Indices business competes with a number of other index providers with significant index offerings including Bloomberg, IHS Markit, MSCI, FTSE Russell, and Standard & Poor’s.
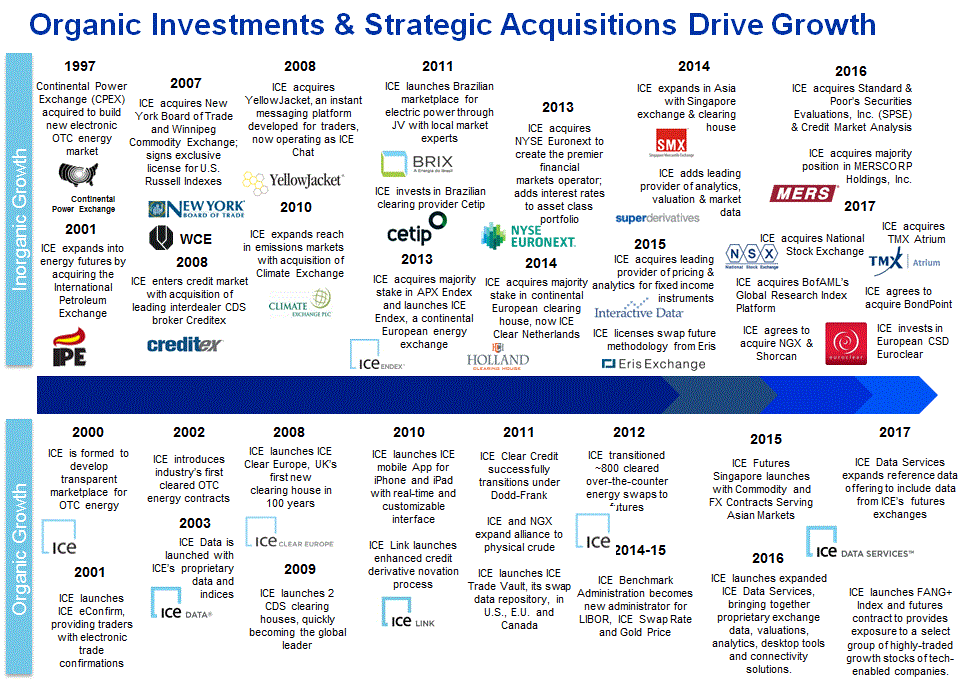
Our Growth Strategy
Throughout our history, we have expanded our core execution, clearing and data businesses both organically and through acquisitions, developed innovative new products for global markets, and provided services to a larger and more diverse participant base. In addition, we have completed a number of strategic alliances to leverage our core strengths and grow our business. We seek to advance our leadership position in our markets by focusing our efforts on the following key strategies for growth:
|
•
|
expand our data offerings to address the rising demand for information;
|
|
•
|
expand on our extensive trading, clearing and risk management capabilities;
|
|
•
|
maintain leadership in our listing businesses;
|
|
•
|
enhance our technology infrastructure and increase distribution; and
|
|
•
|
pursue select acquisitions and strategic relationships that maximize customer and shareholder benefits.
|
The record consolidated revenues and trading volume we achieved in 2017 reflect our focus on the implementation and execution of our long-term growth strategy.
14
Expand our Data Offerings to Address the Rising Demand for Information
With the growth of our ICE derivatives markets and NYSE equity markets, we have strengthened and enhanced our data services due to demand for more data solutions. This has been driven by many factors, such as increased automation, regulation and demand for independent, secure, real-time information. To build on our exchange data and connectivity business, we have acquired multiple assets in the past two years, including Interactive Data, Securities Evaluations, Credit Market Analysis, TMX Atrium, and on October 20, 2017, BofAML’s Global Research division’s index business. The BofAML indices are the second largest group of fixed income indices as measured by AUM globally. The AUM benchmarked against our combined fixed income indices is nearly $1 trillion, and the indices have been re-branded as the ICE BofAML indices.
These assets are now part of ICE Data Services, supporting our growth strategy by expanding the markets we serve and adding new data, connectivity and valuation services to our platform. This allows us to serve the full trade life cycle from pre-trade, through-trading to post-trade activities through content such as more than 2.7 million fixed income evaluated prices and reference data on more than 11 million securities, which all help to power an array of multi-asset class analytics, indices and various reporting and performance tools. We also provide ultra-low latency network connectivity solutions. By bringing together a wide range of data and analytics as well as delivery mechanisms through our desktops and connectivity business, we offer customers a comprehensive and flexibile solution to address the need for more transparency, efficiency and information across their respective workflows.
We will continue to look for strategic opportunities to grow our data offerings and will also continue to pursue opportunities in markets we do not currently serve but where it expands the ways in which we can serve our customers. These new markets and demands have allowed us to grow using a balanced approach including new products and services, increased consumption, new customers, mergers and acquisitions, and pricing changes. This is supported by a general market growth in demand for these types of services including portfolio management and analytics, exchange data, real time and trading data, pricing, reference and valuation data.
Expand on our Extensive Trading, Clearing and Risk Management Capabilities
Our derivatives customer base has grown and diversified as a result of several drivers, including adding new markets and products, the move toward increased risk management and counterparty credit management, mark-to-market and margining services, and regulatory requirements. We continue to add new participants to our markets, which bring additional demand for new products and services. Our markets support price transparency and risk management, particularly in times of volatility and in many markets for products where there is less liquidity. In addition, the use of hedging, trading and risk management programs by commercial enterprises continues to rise based on the availability of technology to deliver more products, as well as the security and the capital efficiencies offered by clearing. We develop new products, but have also increased our capabilities through licenses and acquisitions of companies and intellectual property. Further, by acquiring, building and maintaining our own geographically diverse clearing operations, we are able to respond to market demand for central clearing and related risk management services across diverse geographic and regulatory jurisdictions. As new markets evolve, we intend to leverage our domain knowledge to meet additional demand for cleared products and related risk management solutions.
As requirements for regulatory compliance and capital efficiencies grow, the use of clearing, data and related post-trade services such as independent data providers and benchmark services also continues to grow. We intend to continue to expand our customer base by leveraging our existing relationships and our global sales and marketing team to promote participation in our markets, and by expanding our range of products and services.
On January 2, 2018, we acquired 100% of BondPoint from Virtu Financial, Inc. for $400 million in cash. BondPoint is a leading provider of electronic fixed income trading solutions for the buy-side and sell-side offering access to centralized liquidity and automated trade execution services through its ATS and provides trading services to more than 500 financial services firms.
On October 24, 2017, we acquired a
4.7%
stake in Euroclear for
€275 million
in cash (
$327 million
based on the euro/U.S. dollar exchange rate of 1.1903 as of October 24, 2017). During December 2017, we reached an agreement to buy an additional
5.1%
stake in Euroclear for
€243 million
in cash (
$292 million
based on the euro/U.S. dollar exchange rate of 1.2003 as of December 31, 2017) and expect to receive necessary regulatory approval during the first quarter of 2018. Upon closing, we will own a 9.8% stake in Euroclear for a total investment of €518 million ($619 million based on the exchange rates above). Euroclear is a leading provider of post-trade services, including settlement, central securities depositories and related services for cross-border transactions across asset classes.
On December 14, 2017, we sold Trayport to TMX Group for £550 million ($733 million based on the pound sterling/U.S. dollar exchange rate of 1.3331 as of December 14, 2017). The proceeds of the sale included a combination of cash and our acquisitions of NGX and Shorcan Energy, both wholly-owned subsidiaries of TMX Group, for £200 million ($267 million). NGX, headquartered in Calgary, provides electronic execution, central counterparty clearing and data services to the North American natural gas, electricity and oil markets. Shorcan Energy offers brokerage services for the North American crude oil markets. We recognized a gain of $110
15
million upon the closing of this transaction, equal to the gross proceeds received from TMX Group, less the adjusted carrying value and the costs to sell Trayport.
Maintain Leadership in our Listing Businesses
The following chart depicts 2017 global capital proceeds raised on various listings venues, in billions:
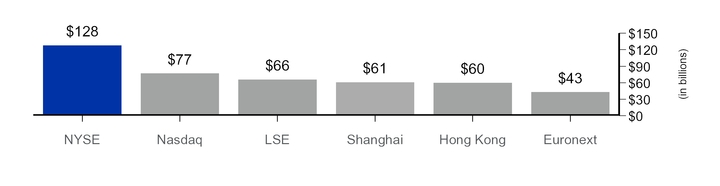
In our NYSE listings business, we will continue to focus on enhancing our product offerings and services to retain and attract companies of all sizes and industries to our listing venues. In 2017, demand for our listing services continued to be strong in terms of new listings and secondary offerings. A total of 464 new issuers listed on NYSE markets in 2017 and there are over 2,200 total companies listed on NYSE and NYSE American. NYSE was the leader in capital raised in 2017 with $128 billion raised in 454 transactions. NYSE listed 88 IPOs in 2017 raising total IPO proceeds of $31 billion, including the five largest U.S. IPOs of 2017. The NYSE has listed all 32 of the last 32 IPOs greater than $700 million in proceeds.
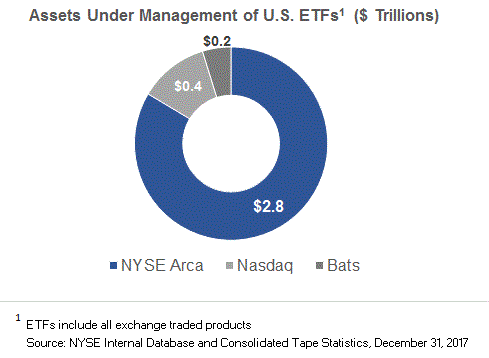
In ETFs, as of December 31, 2017, NYSE Arca’s listed ETFs had over $2.8 trillion in AUM representing nearly 83% of all U.S. listed ETFs. We strive to maintain our leadership position by offering ETF issuers:
|
•
|
guidance through the complete listings process, including expert consultations around regulatory and legal items;
|
|
•
|
over a decade of experience in listing more than 2,700 ETFs across a wide range of asset classes and investment strategies;
|
|
•
|
a focus on customer service from experienced ETF professionals;
|
|
•
|
the highest liquidity of any exchange and some of the narrowest quoted bid / ask spreads; and
|
|
•
|
Lead Market Maker, or LMM, and incentive programs.
|
16
Enhance Our Technology Infrastructure and Increase Distribution
We develop and maintain our own infrastructure, electronic trading platform, clearing systems and data and analytics platforms to ensure scalability and the delivery of technology that meets our expanding customer base’s demands for price transparency, reliability, risk management and transaction efficiency. We intend to continue to increase ease of access and connectivity with our existing and prospective market participants. We develop and maintain our trading and clearing systems, as well as our data solutions and many post-trade systems such as ICE Link and ICE Trade Vault, among others. We have developed and have begun rolling out a new integrated trading platform and matching engine known as NYSE Pillar that will eventually serve each of our U.S. cash equities and equity options markets to improve performance and reduce the cost and complexity of operating multiple trading systems. We also own and operate two data centers and offer connectivity solutions to global exchanges and content service providers via dedicated data circuits.
On May 1, 2017, we acquired 100% of TMX Atrium, a global extranet and wireless services business, from TMX Group. TMX Atrium provides low-latency access to markets and market data across 12 countries, more than 30 major trading venues, and ultra-low latency wireless connectivity to access markets and market data in the Toronto, New Jersey and Chicago metro areas. The wireless assets consist of microwave and millimeter networks that transport market data and provide private bandwidth. TMX Atrium is now part of ICE Data Services and is being integrated with our connectivity services.
Pursue Select Acquisitions and Strategic Relationships that Maximize Customer and Shareholder Benefits
As an early consolidator in global markets to build out our markets and services for customers, we intend to continue to explore and pursue acquisitions and other strategic opportunities to strengthen our competitive position globally, broaden our product offerings and service, and support the growth of our company while maximizing shareholder value as measured by return on invested capital, earnings and cash flow growth. We may enter into business combinations, make acquisitions or enter into strategic partnerships, joint ventures or alliances, any of which may be material. In addition to growing our business, we may enter into these transactions for a variety of additional reasons, including leveraging our existing strengths to enter new markets, expanding our products and services, addressing underserved markets, advancing our technology, anticipating or responding to regulatory change or potential changes in our industry.
17
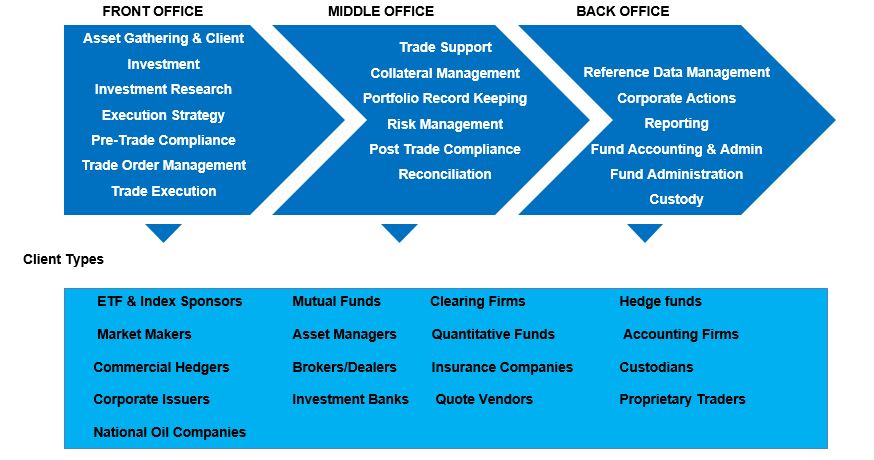
Our Customer Base
Executive Officers of the Registrant
Information relating to our executive officers is included under “Executive Officers” in Part III, Item 10, “Directors, Executive Officers and Corporate Governance” of this Annual Report.
Regulation
Our markets are primarily subject to the jurisdiction of regulatory agencies in the U.S., U.K., EU, Canada and Singapore. Failure to satisfy regulatory requirements can or may give rise to sanctions by the applicable regulator.
Regulation of our Derivatives Business
Our regulated derivatives markets and clearing houses are based primarily in the U.S., U.K., EU, Canada and Singapore. Our U.S. futures exchange is subject to extensive regulation by the CFTC under the Commodity Exchange Act, or CEA. The CEA generally requires that futures trading in the U.S. be conducted on a commodity exchange registered as a Designated Contract Market, or DCM. As a registered DCM, ICE Futures U.S. is a self-regulatory organization, or SRO, that has instituted rules and procedures to comply with the core principles applicable to it under the CEA. In the U.K., ICE Futures Europe is a Recognized Investment Exchange, or RIE, in accordance with the Financial Services and Markets Act 2000, or FSMA. Like U.S. regulated derivatives markets, RIEs are SROs with surveillance and compliance responsibilities. ICE Clear Credit, ICE Clear U.S. and NGX are regulated by the CFTC as Derivatives Clearing Organizations, or DCOs. DCOs are subject to extensive regulation by the CFTC under the CEA. ICE Clear Europe, which is primarily regulated in the U.K. by the Bank of England as a Recognized Clearing House, or RCH, is also subject to regulation by the CFTC as a DCO. Both ICE Clear Credit and ICE Clear Europe are also regulated by the SEC as clearing agencies because they clear security-based swaps.
The Financial Stability Oversight Council, or FSOC, has designated ICE Clear Credit as a systemically important financial market utility under Title VIII of the Dodd-Frank Wall Street Reform and Consumer Protection Act, or the Dodd-Frank Act. As such, ICE Clear Credit has access to the Federal Reserve System and holds deposits of $
18.5 billion
of its U.S. dollar cash in its cash accounts at the Federal Reserve as of
December 31, 2017
.
Regulation of our Securities Business
In our cash equities and options markets, NYSE, NYSE Arca, NYSE American and NYSE National are national securities exchanges and, as such, are SROs and subject to oversight by the SEC. Accordingly, our U.S. securities exchanges are regulated by
18
the SEC and, in turn, are the regulators of their members. As national securities exchanges, NYSE, NYSE Arca, NYSE American and NYSE National must comply with, and enforce compliance by their members with, the Securities Exchange Act of 1934, or the Exchange Act.
In our fixed income markets, Creditex Securities Corporation, which also includes the recently acquired BondPoint business, is a broker-dealer and ATS operator, and, as such, is subject to oversight by the SEC. Creditex Securities Corporation is also a member of the Financial Industry Regulatory Authority, or FINRA, and is registered with the Municipal Securities Rulemaking Board, self-regulatory organizations that regulate broker-dealers in the U.S.
Regulation of our Data Business
As a result of our evaluated pricing operations, we have U.S. subsidiaries that are registered with the SEC under the Investment Advisers Act of 1940, or the Investment Advisers Act, for their evaluated pricing services. The Investment Advisers Act imposes numerous regulatory obligations on registered investment advisers, including those relating to products and services, record-keeping, compliance management, operational and marketing requirements, disclosure obligations and prohibitions on fraudulent activities. Investment advisers also are subject to certain state securities laws and regulations. Interactive Data (Australia) Pty. Ltd. is licensed by the Australian Securities and Investment Commission, or ASIC, and provides certain financial services in Australia. Interactive Data Desktop Solutions (Europe) Limited is regulated by the Financial Conduct Authority, or FCA, and provides certain financial services in the European Economic Area.
Regulatory Reform
Domestic and foreign policy makers have undertaken ongoing reviews of their legal frameworks governing financial markets following the 2009 financial crisis, and have either passed new laws and regulations, or are in the process of debating and/or enacting new laws and regulations that apply to our business and to our customers’ businesses. Our key areas of focus on these evolving efforts are:
|
•
|
The harmonization of regulations globally. Global regulations have not been fully harmonized and several of the Markets in Financial Instruments Directive II’s, or MiFID II, regulations are inconsistent with U.S. rules. In addition, in 2017, the CFTC announced its new agenda calling for regulatory simplification and the reduction of regulatory burdens. The CFTC is looking to restructure its rules by moving back to a more principles-based approach. As a result, there is potential for further divergence between MiFID II and U.S. rules if the U.S. makes changes to financial regulations while the EU continues with MiFID implementation.
|
|
•
|
The harmonization of regulations relating to trading venues in the U.S. and EU. In December 2017, the CFTC adopted an order exempting certain multilateral trading facilities, or MTFs, and organized trading facilities, or OTFs, authorized within the EU from the CFTC registration requirements as Swap Execution Facilities, or SEFs. The European Commission also announced in December 2017 an equivalence determination of CFTC-authorized trading venues including SEFs and DCMs. The equivalence decision allows transactions conducted on EU and U.S. trading venues to be recognized as equivalent.
|
|
•
|
The proposed revisions to the regulatory structure of non-EU clearing houses. In June 2017, the European Commission published a proposal to revise the current regulatory structure for non-EU clearing houses. The nature and extent of the regulation would depend on the “impact” of a non-EU clearing house’s business in the EU. Details on the classification of non-EU clearing will be established by the European Commission in cooperation with the European Securities and Markets Authority, or ESMA, and the European System of Central Banks. The proposal will undergo legislative review by the European Parliament and the EU Member States, and is subject to change. The proposal could have an impact on our non-EU clearing houses to the extent they are deemed to be doing business in Europe which might involve change to clearing house regulation and/or supervision.
|
|
•
|
The non-discriminatory access provisions of MiFID II as currently drafted, would require our European exchanges and CCPs to offer access to third parties on commercially reasonable terms. In addition, MiFID II could require our European exchanges to allow participants to trade and/or clear at other venues, which may encourage competing venues to offer our products. In June 2016, the EU approved a twelve-month postponement of MiFID II implementation and compliance to January 1, 2018. On January 3, 2018, we received a deferral from the FCA and the Bank of England, which delays the non-discriminatory access provision of MiFID II for a period of 30 months.
|
|
•
|
The implementation of capital charges in Basel III, particularly the Supplemental Leverage Ratio with respect to certain clearing members of central counterparties. These new standards may impose burdensome capital requirements on our clearing members and customers that may disincentivize clearing.
|
|
•
|
The adoption and implementation of position limit rules in the U.S. and EU, which could have an impact on our commodities business if comparable trading venues in foreign jurisdictions are not subject to equivalent rules. P
osition limits became effective in Europe beginning January 2018 under MiFID II.
The FCA has published certain position limits for commodity
|
19
contracts. In certain cases, the position limits are lower than on U.S. trading venues and in certain cases position limits are higher than U.S. equivalent contracts. The FCA is actively reviewing the recently issued position limits. Conversely, in December 2016, the CFTC re-proposed the position limit rules as opposed to finalizing the rule.
|
•
|
The proposed European financial transaction taxes are uncertain. Although a number of Member States participating in the financial transaction tax have reached a broad political agreement on instituting the tax, many details are left to be concluded, including how to assess the tax at a member state level. Implementation of a financial transaction tax could have a negative impact on our European operations if adopted.
|
|
•
|
The EU Benchmark Regulation, or BMR, was adopted in June 2016 and applies from January 2018. Under the BMR, benchmarks provided by a third country benchmark administrator may be used by EU supervised entities provided that the European Commission has adopted an equivalence decision or the administrator has been recognized or endorsed and the benchmarks are listed on the register established by ESMA. The BMR provides for a transition period which applies from January 1, 2018, when the BMR enters into force, until January 1, 2020. During this period ICE Data Indices, LLC plans to apply to the UK FCA for recognition, and benchmarks provided by ICE Data Indices, LLC may continue to be used by supervised entities.
|
|
•
|
Brexit timing and implications. In March 2017, the U.K. officially triggered Article 50 and notified the EU of its intention of leaving the EU following the U.K.’s June 2016 referendum vote to leave the EU (commonly known as Brexit). The triggering of Article 50 begins the process of withdrawal from the EU, which will last two years unless extended by the unanimous decision of member states. We are monitoring the impact to our business of the U.K. leaving the EU. The impact to our business and corresponding regulatory changes are uncertain at this time, and may not be known in the near future.
|
See the discussion below and Item 1(A) “- Risk Factors” in this Annual Report for additional description of regulatory and legislative risks and uncertainties.
Corporate Citizenship
We strive to create long-term value for our shareholders and maintain high ethical and business standards. We are active in the communities where we operate and support charitable organizations through a combination of financial resources and through employee participation. We also operate the ICE NYSE Foundation that has a commitment to supporting our communities, financial literacy and veterans’ programs. We also host programs for our issuers on governance topics to provide a forum for advancing their efforts on environmental, social and governance matters. In 2018, we will engage in a survey of our employees to further monitor how as a company we are living up to our core values and to find additional ways to improve our employees’ work experience.
We provide additional information in our Corporate Responsibility Report, which can be located in the Corporate Citizenship section of our website.
With regard to environmental markets, we own Climate Exchange PLC and are today the leading operator of global emissions and environmental products markets, which enabled us to expand and support the development of emissions markets. We have invested further to develop new environmental products on our exchanges, including carbon emissions, aviation allowances, renewable energy certificate contracts, California carbon allowance contracts and biofuel products related to renewable identification numbers.
Available Information
Our principal executive offices are located at 5660 New Northside Drive, 3rd Floor, Atlanta, Georgia 30328. Our main telephone number is 1-770-857-4700, and our website is www.intercontinentalexchange.com.
We are required to file reports and other information with the SEC. A copy of this Annual Report on Form 10-K, as well as any future Quarterly Reports on Form 10-Q, Current Reports on Form 8-K and any amendments to such reports are available free of charge, on our website (www.theice.com) as soon as reasonably practicable after we file such reports with, or furnish such reports to, the SEC. A copy of these filings is also available at the SEC’s website (www.sec.gov). The reference to our website address and to the SEC’s website address do not constitute incorporation by reference of the information contained on the website and should not be considered part of this report. You may read and copy any documents filed by us at the SEC’s Public Reference Room at 100 F Street, N.E., Washington, D.C. 20549. Please call the SEC at 1-800-SEC-0330 for further information on the Public Reference Room.
In addition, we have posted on our website the charters for our (i) Audit Committee, (ii) Compensation Committee, (iii) Nominating and Corporate Governance Committee and (iv) Risk Committee, as well as our Code of Business Conduct and Ethics, which includes information regarding our whistleblower hotline information, Board of Directors Governance Principles and Board Communication Policy. We will provide a copy of these documents without charge to stockholders upon request.
20
The risks and uncertainties described below are those that we currently believe may materially affect us. Other risks and uncertainties that we do not presently consider to be material or of which we are not presently aware may become important factors that affect us in the future. If any of the risks discussed below actually occur, our business, financial condition, operating results or cash flows could be materially adversely affected. Accordingly, you should carefully consider the following risk factors, as well as other information contained in or incorporated by reference in this Annual Report.
Global economic, political, financial market and social events or conditions may negatively impact our business.
Global economic conditions will impact our business. Adverse macroeconomic conditions, including recessions, inflation, high unemployment, currency fluctuations, actual or anticipated large-scale defaults or failures, or slowdown of global trade could decrease consumer and corporate confidence and reduce consumer, government and corporate spending. If our customers reduce spending, workforce, trading activity or demand for financial data as a result of challenges in the prevailing economic markets, our revenues will decline. Further, NYSE’s revenue increases when more companies are willing to go public and stagnation or a decline in the IPO market could have an adverse effect on our revenues. A prolonged decrease in the number of IPOs could also negatively impact the growth of our transaction revenues since initial public offerings are typically actively traded following the offering date. The number of public companies in the U.S. has decreased significantly over the last twenty years.
A significant portion of our revenues are derived from fees for transactions executed and cleared in our markets. We derived 42%, 43% and 56% of our consolidated revenues, less transaction-based expenses, from our transaction-based business in 2017, 2016 and 2015, respectively. In particular, we derive a significant percentage of the consolidated revenues from our transaction-based business from trading in ICE Brent Crude futures and options contracts, North American natural gas futures and options contracts, sugar futures and options contracts, equity transactions and short-term interest rates contracts, including the Euribor and Short Sterling futures and options contracts. The trading volumes in our markets could decline substantially if our market participants reduce their level of trading activity for any reason, including:
|
•
|
a reduction in the number of market participants that use our platform;
|
|
•
|
a reduction in trading demand by customers or a decision to curtail or cease hedging or speculative trading;
|
|
•
|
regulatory or legislative changes impacting our customers and financial markets;
|
|
•
|
a prolonged decrease in volatility in the financial markets;
|
|
•
|
heightened capital requirements or mandated reductions in leverage resulting from new regulation;
|
|
•
|
defaults by clearing or exchange members or the inability of participants to pay out contractual obligations;
|
|
•
|
changes to our contract specifications that are not viewed favorably by our market participants; or
|
|
•
|
reduced access to or availability of capital required to fund trading activities.
|
A reduction in our overall trading volume could render our markets less attractive to market participants as a source of liquidity, which could result in further loss of trading volume and associated transaction-based revenues. A reduction in trading volumes could also result in a corresponding decrease in the demand for our market data, which would further reduce our overall revenue.
In addition, uncertainty in various markets throughout the world have resulted or may result in decreased revenues or growth rates. For example, the uncertainty surrounding the terms of the U.K.’s exit from the EU could negatively impact markets and cause weaker macroeconomic conditions that could continue for the foreseeable future. Such economic weakness and uncertainty may adversely affect demand for our products and services.
Our businesses and those of many of our clients have been and continue to be subject to increased legislation and regulatory scrutiny, and we face the risk of changes to this regulatory environment and business in the future.
We are and will continue to be subject to extensive regulation in many jurisdictions around the world, and in particular in the U.S. and the U.K. where the largest portions of our operations are conducted. We face the risk of significant actions by regulatory and taxing authorities in all jurisdictions in which we conduct our businesses and hold investments that may affect our business, the activity of our market participants, and as a consequence, our results. Among other things, as a result of regulators and tax authorities enforcing existing laws and regulations, we could be censured, fined, prohibited from engaging in some of our business activities, subjected to limitations or conditions on our business activities, including fair, reasonable and nondiscriminatory pricing restrictions, also known as FRAND, or subjected to new or substantially higher taxes or other governmental charges in connection
21
with the conduct of our business or with respect to our employees, including settlement payments, interest payments and penalty payments. In many cases, our activities may be subject to overlapping and divergent regulation in different jurisdictions.
There is also the risk that new laws or regulations or changes in enforcement practices applicable to our businesses or those of our clients could be imposed. This could adversely affect our ability to compete effectively with other institutions that are not affected in the same way or impact our clients’ overall trading volume through our exchanges and demand for our market data and other services. In addition, regulation imposed on financial institutions or market participants generally, such as enhanced regulatory capital requirements, could adversely impact levels of market activity and price volatility more broadly, and thus impact our businesses. The U.S. government has indicated a goal of reforming many aspects of existing financial services regulations, however, it is unknown at this time to what extent new legislation will be passed into law or pending or new regulatory proposals will be adopted or modified, or the effect that such passage, adoption or modification will have, positively or negatively, on our industry or on us.
These developments could impact our profitability in the affected jurisdictions, or even make it uneconomical for us to continue to conduct all or certain of our businesses in such jurisdictions, or could cause us to incur significant costs associated with changing our business practices, restructuring our businesses, or moving all or certain of our businesses and our employees to other jurisdictions, including liquidating assets or raising capital in a manner that adversely increases our funding costs or otherwise adversely affects our stockholders and creditors. For example, the adoption and implementation of position limit rules in the U.S. and the EU could have an impact on our commodities business if comparable trading venues in foreign jurisdictions are not subject to equivalent rules. Position limits became effective in the EU beginning January 2018 and in certain cases the position limits are lower than U.S. equivalent contracts and in other cases position limits are higher than U.S. equivalent contracts. These divergent regulations may cause us to move products from one jurisdiction to another as a result of business risks and competitive challenges and could significantly increase the regulatory compliance costs for our customers, which could have a negative impact on our business.
U.S. and EU legal and regulatory developments in response to the global financial crisis, in particular the Dodd-Frank Act, EMIR, MiFID II and the benchmark regulation, have significantly altered and propose to further alter the regulatory framework within which we operate and may adversely affect our competitive position and profitability. The enacted and proposed legal and regulatory changes most likely to affect our businesses are: position limit rules in the U.S. and the EU, non-discriminatory access provisions of MiFID II, interoperability and margin rules in EMIR, enhanced regulatory capital liquidity and leverage rules in Basel III and Capital Requirements Directive IV, access rules under the benchmark regulation, the non-harmonization of margin requirements, implementation of a financial transaction tax, access to our benchmarks and maintaining our exchanges’ abilities to operate as SROs with related immunity for the discharge of their regulatory functions. As the operator of global businesses, the lack of harmonization in international financial reform efforts could impact our business as our clearing houses and exchanges are subject to regulation in multiple jurisdictions.
The Dodd-Frank Act established enhanced regulatory requirements for non-bank financial institutions designated as “systemically important” by the FSOC. ICE Clear Credit has been designated as a systemically important financial market utility by the FSOC and as a result, is subject to additional oversight by the CFTC.
U.S. income tax reform efforts could have a material impact on our business. On December 22, 2017, the Tax Cuts and Jobs Act, or TCJA, was signed into law. The TCJA enacts broad changes to the existing U.S. federal income tax code, including reducing the federal corporate income tax rate from 35% to 21%, amongst many other complex provisions. The ultimate impact of such tax reforms may differ from our current estimates due to changes in interpretations and assumptions made by us as well as the issuance of any further regulations or guidance that may alter the operation of the U.S. federal income tax code. Various uncertainties also exist in terms of how U.S. states and any foreign countries within which we operate will react to these U.S. federal income tax reforms, which could have additional impacts on our business.
The European Commission has approved a data protection regulation, known as the General Data Protection Regulation, or GDPR, which has been finalized and comes into effect in May 2018. The GDPR will create a range of new compliance obligations for companies that receive or process personal data of residents of the EU that are different than the compliance obligations currently in place in the EU, and will include significant penalties for non-compliance.
Other enacted and proposed legal and regulatory changes not discussed above may also adversely affect our competitive position and profitability. See Item 1 “- Business - Regulation” above for additional information regarding the current and proposed laws and regulations that impact our business, including risks to our business associated with these laws and regulations.
22
Systems failures in the derivatives and securities trading industry could negatively impact us.
High-profile system failures in the derivatives and securities trading industry could negatively impact our business and result in regulatory investigations, fines and penalties. Further, regulators have imposed new requirements for trading platforms that have been costly for us to implement, or that could result in a decrease in demand for some of our services. In particular, the SEC’s Regulation Systems Compliance and Integrity, or Regulation SCI, and the CFTC’s system safeguards regulations subject portions of our securities and derivatives trading platforms and other technological systems related to our clearing houses, trade repositories and the U.S. Swap Execution Facility, or SEF, to more extensive regulation and oversight. Ensuring our compliance with the requirements of Regulation SCI and the CFTC’s system safeguards regulations requires significant implementation costs as well as increased ongoing administrative expenses and burdens. If system failures in the industry continue to occur, it is also possible that investor confidence in the trading industry could diminish, leading to decreased trading volume and revenue. Whether or not any of our own systems experience material failures, any of these developments could adversely affect our business, financial condition and operating results.
Our business is subject to the impact of financial markets volatility, including the prices and interest rates underlying our derivative products, due to conditions that are beyond our control.
Trading volume in our markets and products is largely driven by the degree of volatility - the magnitude and frequency of fluctuations - in prices and levels of the underlying commodities, securities, indices, financial benchmarks or other instruments. Volatility increases the need to hedge price risk and creates opportunities for investment and speculative or arbitrage trading. Were there to be a sustained period of stability in the prices or levels of the underlying commodities, securities, indices, benchmarks or other instruments of our products, we could experience lower trading volumes, slower growth or declines in revenues.
Factors that are particularly likely to affect price and interest rate levels and volatility, and thus trading volumes, include:
|
•
|
global and domestic economic, political and market conditions;
|
|
•
|
concerns over inflation, deflation, legislative and regulatory changes, government fiscal and monetary policy - including actions by the Federal Reserve, other foreign monetary units governing bodies, and investor and consumer confidence levels;
|
|
•
|
weather conditions including hurricanes and other significant events, natural and other unnatural disasters like large oil spills that impact the production of commodities, and, in the case of energy commodities, production, refining and distribution facilities for oil and natural gas;
|
|
•
|
war, acts of terrorism and any unforeseen market closures or disruptions in trading;
|
|
•
|
real and perceived changes in the supply and demand of commodities underlying our products, particularly energy and agricultural products, including changes as a result of technological improvements or the development of alternative energy sources; and
|
|
•
|
credit quality of market participants, the availability of capital and the levels of assets under management.
|
Any one or more of these factors, which are beyond our control, may reduce trading activity, which could make our markets less attractive as a source of liquidity, and in turn could further discourage existing and potential market participants and thus accelerate a decline in the level of trading activity and potentially related services such as data or clearing. Further, lower market volatility could also result in more exchanges competing for trading volumes to maintain their growth. If any of these unfavorable conditions were to persist over a lengthy period of time and trading volumes were to decline substantially and for a long enough period, the critical mass of transaction volume necessary to support viable markets could be jeopardized. Because our cost structure is largely fixed, if demand for our current products and services decline for any reason, we may not be able to adjust our cost structure to counteract the associated decline in revenues, which would cause our net income to decline.
Owning clearing houses exposes us to risks, including risk related to defaults by clearing members, risks related to investing margin and guaranty funds, and the cost of operating the clearing houses.
There are risks inherent in operating a clearing house, including exposure to the market and counterparty risk of clearing members, market liquidity risks, defaults by clearing members and risks associated with custody and investing margin or guaranty fund assets provided by clearing members to our clearing houses, which could subject our business to substantial losses. For example, clearing members have transferred an aggregate amount of cash in ICE Clear Europe relating to margin and guaranty funds of $22.8 billion as of
December 31, 2017
and a total of $50.5 billion for all of our clearing houses as of
December 31, 2017
. ICE Clear Europe and ICE Clear U.S. use third party investment managers for investment of cash assets and may add or change the investment managers from time to time. To the extent available, ICE Clear Credit holds the U.S. dollar cash and U.S. Treasuries that clearing members transfer to satisfy their original margin and guaranty fund requirements at its account at the
23
Federal Reserve. With respect to other clearing member cash posted, ICE Clear Credit currently self-manages and uses external investment managers to invest such cash margin and guaranty fund deposits.
We have an obligation to return margin payments and guaranty fund contributions to clearing members to the extent that the relevant member’s risk based on its open contracts to the clearing house is reduced. If a number of clearing members substantially reduce their open interest or default, the concentration of risks within our clearing houses will be spread among a smaller pool of clearing members, which would make it more difficult to absorb and manage risk in the event of a further clearing member’s default. Further, following our acquisition of the BondPoint business in January 2018, Creditex Securities Corporation intends to seek regulatory approval to be a clearing firm so that it can clear trades in fixed income securities executed on the Creditex platforms. Self-clearing exposes our business to additional settlement and counterparty risk.
Although our clearing houses have policies and procedures to help ensure that clearing members can satisfy their obligations, such policies and procedures may not succeed in preventing losses after a member or a counterparty’s default. In addition, although we believe that we have carefully analyzed the process for setting margins and our financial safeguards, it is a complex process and there is no guarantee that our procedures will adequately protect us from the risks of clearing these products. We cannot assure you that these measures and safeguards will be sufficient to protect us from a default or that we will not be materially and adversely affected in the event of a significant default. We have contributed our own capital to the guaranty fund of the clearing houses that could be used in the event of a default. Furthermore, the default of any one of the clearing members could subject our business to substantial losses and cause our customers to lose confidence in the guaranty of our clearing houses.
A decline in the value of securities held as margin or guaranty fund contributions by our clearing houses or default by a sovereign government issuer could pose additional risks of default by clearing members.
Our clearing houses hold a substantial amount of assets as margin or guaranty fund contributions, which comprise U.S. and other sovereign treasury securities. As of
December 31, 2017
, our clearing houses held $39.5 billion of non-cash margin or guaranty fund contributions in U.S. and other sovereign treasury securities: $29.1 billion of this amount was comprised of U.S. Treasury securities, $1.7 billion of French Treasury securities, $1.5 billion of German Treasury securities, $1.3 billion of Italian Treasury securities, $1.2 billion of U.K. Treasury securities, and $4.6 billion of other European, Japanese and Tri-Party Treasury securities. Sovereign treasury securities have historically been viewed as one of the safest and most liquid securities for clearing houses to hold due to the perceived credit worthiness of major governments, although the markets for such securities have experienced significant volatility during the past decade and as of late due to on-going financial challenges in some of the major European countries and the U.S. government’s negotiations regarding taxation, spending cuts and raising the debt ceiling, which is the maximum amount of debt that the U.S. government can legally incur. In addition, if there is a collapse of the euro, our clearing houses would face significant expenses in changing their systems and such an event could cause a credit contraction and major swings in asset prices and exchange rates. To mitigate this risk, our clearing houses currently apply a discount or “haircut” to the market values for all sovereign securities held as margin or guaranty fund contributions; however, market conditions could change more quickly than we adjust the amount of the haircuts and the haircuts could be insufficient in the event of a sudden market event.
Notwithstanding the current intraday margin and valuation checks conducted by our clearing houses and our policies and practices to limit exposures, our clearing houses will need to continue to monitor the volatility and value of sovereign treasury securities. If the value of these securities declines significantly, our clearing houses will need to collect additional margin or guaranty fund contributions from their clearing members, which may be difficult for the members to supply in a time of financial stress affected by an actual or threatened default by a sovereign government. In addition, our clearing houses may be required to impose a more significant discount on the value of sovereign treasury securities posted as margin or guaranty fund contributions if there is uncertainty regarding the future value of these securities, which would trigger the need for additional margin or guaranty fund contributions by the clearing members. If a clearing member cannot supply the additional margin or guaranty fund contributions, which may include cash in a currency acceptable to the clearing house, the clearing house would deem the clearing member in default. If any clearing members default as a result of the reduction in the value of margin or guaranty fund contributions, our clearing houses and trading business could suffer substantial losses as a result of the loss of any capital that has been contributed to the clearing house’s guaranty funds and a loss of confidence by clearing members in the clearing house, resulting in a reduction in volumes of future cleared transactions.
Further, our clearing houses invest large sums through reverse repo transactions in connection with their clearing operations and may hold sovereign securities as security in connection with such investment transactions. Our clearing houses may also make time deposits with banks that are secured only to the value of FDIC insurance or other national deposit guarantee schemes, which is small, and therefore, the deposits may in significant part be lost in the event one of these banks becomes insolvent.
24
Owning and operating equity and options exchanges exposes us to additional risks, including the regulatory responsibilities to which these businesses are subject.
Owning and operating equity and options exchanges for which the revenues are primarily derived from market data, listing fees and trading activity, exposes us to additional risks. Adverse economic conditions and regulatory changes similar to those discussed above, including changes to the number of exchanges that are permitted to conduct closing auctions, could result in decreased trading volume on our exchanges, discourage market participants from listing on our equity and options exchanges or cause them to forgo new offerings. Any of these could reduce our revenues, including market data revenue.
Our exchanges are operated as for-profit businesses but have certain regulatory responsibilities that must be fulfilled. Specifically, our exchanges are responsible for enforcing listed company compliance with applicable listing standards, overseeing regulatory policy determinations, rule interpretation and regulation-related rule development, and conducting trading reviews. Any failure by one of our exchanges with self-regulatory responsibility to comply with, and enforce compliance by their members, with exchange rules and securities laws could significantly harm our reputation, prompt regulatory scrutiny, result in the payment of fines or penalties and adversely affect our business, financial condition and operating results.
We must allocate significant resources to fulfill our self-regulatory responsibilities. The for-profit exchanges’ goal of maximizing stockholder value might contradict the exchanges’ self-regulatory responsibilities. The listing of our common stock on the NYSE could potentially create a conflict between the exchange’s regulatory responsibilities to vigorously oversee the listing and trading of securities, on the one hand, and our commercial and economic interest, on the other hand. While we have structural protections to minimize these potential conflicts, we cannot be sure that such measures will be successful.
Further, changes in the rules and operations of our securities markets must be reviewed and approved by the SEC. Approval of such changes by the SEC cannot be guaranteed and the SEC could delay either the approval process or the initiation of the public comment process. Any denial or delay in approving changes could have an adverse effect on our business, financial condition and operating results.
Our compliance and risk management methods, as well as our fulfillment of our regulatory obligations, might not be effective, which could lead to enforcement actions by our regulators.
Our ability to comply with complex and changing laws and rules is largely dependent on our establishment and maintenance of compliance, audit and reporting systems that can quickly adapt and respond, as well as our ability to attract and retain qualified compliance and other risk management personnel. While we have policies and procedures to identify, monitor and manage our risks and regulatory obligations, we cannot assure you that our policies and procedures will always be effective or that we will always be successful in monitoring or evaluating the risks to which we are or may be exposed. Regulators periodically review our exchanges’ ability to self-regulate and our compliance with a variety of laws and regulations including self-regulatory standards. In particular, certain of our businesses acquired in the NYSE acquisition are subject to public notice procedures prior to making changes in operations, policies and procedures. If we fail to comply with any of these obligations, regulators could take a variety of actions that could impair our ability to conduct our business.
Our acquisitions expose us to new regulatory requirements. For example, as a result of our acquisitions of Interactive Data and Securities Evaluations, we operate two SEC registered investment advisers. Investment advisers are subject to significant regulatory obligations under the Investment Advisers Act. Prior to these acquisitions, none of our businesses were registered under the Investment Advisers Act. Compliance with the Investment Advisers Act and other regulatory requirements gives rise to costs and expenses that may be material. In addition, our acquisition of the BondPoint ATS in January 2018 exposes us to increased exposure to regulatory scrutiny from the SEC and FINRA.
Our regulators have broad enforcement powers to censure, fine, issue cease-and-desist orders or prohibit us from engaging in some of our businesses. For example, we paid a $5 million penalty to the SEC in 2014 and a $3 million penalty to the CFTC in 2015 as a result of enforcement actions brought by these regulators. In December 2015, NYSE received an inquiry from the enforcement staff of the SEC regarding a July 8, 2015 outage on the NYSE markets, during which trading was suspended for approximately 3.5 hours in all symbols. The investigation proceeded throughout 2016 and on December 29, 2016, NYSE received a Wells Notice stating that the staff made a preliminary determination to recommend that the SEC file an enforcement action in connection with how NYSE responded to the circumstances leading up to the suspension of trading. For this matter and other SEC investigations, we have recorded an aggregate of $14 million in expense accruals as of December 31, 2017. The specific results of the Wells Notice and these enforcement actions are unknown at this time.
We will continue to face the risk of significant intervention by regulatory authorities, including extensive examination and surveillance activity. Any such matters may result in material adverse consequences to our financial condition, operating results or
25
ability to conduct our business, including adverse judgments, settlements, fines, penalties, injunctions, restrictions on our business activities or other relief. Our involvement in any such matters, even if the matters are ultimately determined in our favor, could also cause significant harm to our reputation and divert management attention from the operation of our business. Further, any settlement, consent order or adverse judgment in connection with any formal or informal proceeding or investigation by government or regulatory agencies may result in additional litigation, investigations or proceedings as other litigants and government or regulatory agencies begin independent reviews of the same businesses or activities. Finally, the implementation of new legislation or regulations, or changes in or unfavorable interpretations of existing regulations by courts or regulatory bodies, could require us to incur significant compliance costs and impede our ability to remain competitive and grow our business.
We face intense competition.
We face intense competition in all aspects of our business and our competitors, both domestic and international, are numerous. We currently compete with:
|
•
|
regulated, diversified futures exchanges globally that offer trading in a variety of asset classes similar to those offered by us, such as energy, agriculture, equity and equity index, credit, and interest rate derivatives markets and foreign exchange;
|
|
•
|
exchanges offering listing and trading of cash equities, ETFs, closed-end funds and other structured products similar to those offered by us;
|
|
•
|
market data and information vendors;
|
|
•
|
interdealer brokers active in the global credit derivatives markets;
|
|
•
|
existing and newly formed electronic trading platforms, service providers and other exchanges;
|
|
•
|
other clearing houses; and
|
|
•
|
consortiums of our customers, members or market participants that may pool their trading activity to establish new exchanges, trading platforms or clearing facilities.
|
Trends towards the globalization of capital markets have resulted in greater mobility of capital, greater international participation in markets and increased competition among markets in different geographical areas. Competition in the market for derivatives trading and clearing and in the market for cash equity listings, trading and execution have intensified as a result of consolidation, as the markets become more global in connection with the increase in electronic trading platforms and the desire by existing exchanges to diversify their product offerings. Finally, many of our competitors are our largest customers or are owned by our customers and may prioritize their internalization and ATS businesses ahead of their exchange-based market making business.
We also face pricing competition in many areas of our business. A decline in our fees due to competitive pressure, the inability to successfully launch new products or the loss of customers due to competition could lower our revenues, which would adversely affect our profitability. For example, Interactive Data’s business has benefited from a high renewal rate in its subscription based business but we cannot assure you that this will continue. We also cannot assure you that we will be able to continue to expand our product offerings, or that we will be able to retain our current customers or attract new customers. If we are not able to compete successfully our business could be materially impacted, including our ability to remain as an operating entity.
In our listings business, the legal and regulatory environment in the U.S., and the market perceptions about that environment, may make it difficult for our U.S. equity exchanges to compete with non-U.S. equity exchanges for listings. For example, negative perceptions regarding compliance costs associated with adherence to corporate governance requirements and risks of litigation have and may continue to discourage listings on U.S. equity exchanges by both U.S. and foreign private issuers. Any failure by our exchanges to successfully compete for any reason could adversely impact our revenue derived from listing fees and the associated trading, execution and market data fees.
We may have difficulty maintaining our growth effectively.
We have achieved a tremendous amount of growth since becoming a public company in 2005. Our growth is highly dependent on customer demand for our core products and services, favorable economic conditions and our ability to invest in our personnel, facilities, infrastructure and financial and management systems and controls. Adverse economic conditions could reduce customer demand for our products and services, which may place a significant strain on our management and resources and could force us to defer existing or future planned opportunities. In addition, we may not be successful in executing on our strategies to support our growth organically or through acquisitions, other investments or strategic alliances.
26
Our systems and those of our third party service providers may be vulnerable to security risks, hacking and cyber-attacks, especially in light of our role in the global financial marketplace, which could result in wrongful use of our information or that of a third party, or which could make our participants reluctant to use our electronic platform.
The secure transmission of confidential information and the ability to reliably transact on our electronic platforms and provide financial data services are critical elements of our operations. Some of our products and services involve the storage and transmission of proprietary information and sensitive or confidential client data, including client portfolio information. If anyone gains improper access to our electronic platforms, networks or databases, they may be able to steal, publish, delete or modify our confidential information or that of a third party. Breaches of our cybersecurity measures or the accidental loss, inadvertent disclosure or unapproved dissemination of proprietary information or sensitive or confidential data about us, our clients or our customers, including the potential loss or disclosure of such information or data could expose us, our customers or the individuals affected to a risk of loss or misuse of this information, result in litigation, regulatory action and potential liability for us, damage our brand and reputation or otherwise harm our business. Our networks and those of our participants, third party service providers and external market infrastructures may be vulnerable to compromise, security technology failure, social engineering, denial of service attacks, or other security failures resulting in loss of data integrity, information disclosure, unavailability, or fraud. The financial services industry has been targeted for purposes of political protest, activism and fraud. Further, former employees of certain companies in the financial sector have misappropriated trade secrets or stolen source code in the past, and we could be a target for such illegal acts in the future. There also may be system or network disruptions if new or upgraded systems are defective or not tested and installed properly.
Although we have not been the victim of cyber-attacks or other cyber incidents that have had a material impact on our operations or financial condition, we have from time to time experienced cybersecurity events including distributed denial of service attacks, malware infections, phishing, web attacks and other information technology incidents that are typical for a financial services company of our size. For example, we experienced a distributed denial of service attack against our website in November 2016 that activated automated mitigation response and was reportable to regulatory authorities. While we operate an Information Security program that is designed to prevent, detect, track, and mitigate cyber incidents and that has detected and mitigated such incidents in the past, we cannot assure you that these measures will be sufficient to protect our business against attacks, losses or reduced trading volume in our markets as a result of any security breach, hacking or cyber-attack. Any such attacks could result in reputational damage, cause system failures or delays that could cause us to lose customers, cause us to experience lower current and future trading volumes or incur significant liabilities, or have a negative impact on our competitive position. In addition, given the increasing complexity and sophistication of the techniques used to obtain unauthorized access or disable or degrade systems, such intrusions may be difficult to detect for periods of time, we may not anticipate these acts or respond adequately or timely. Additionally, as threats continue to evolve and increase, and as the regulatory environment related to information security, data collection and use, and privacy becomes increasingly rigorous, including as a result of the European Commission’s approval of GDPR, we may be required to devote significant additional resources to modify and enhance our security controls and to identify and remediate any security vulnerabilities, which could adversely impact our net income.
We may not be successful in offering new products or technologies or in identifying opportunities.
We intend to launch new products and continue to explore and pursue other opportunities to strengthen our business and grow our company. We may spend substantial time and money developing new product offerings or improving current product offerings. If these offerings are not successful, we may miss a potential market opportunity and not be able to recover the costs of such initiatives. Obtaining any required regulatory approval associated with these offerings may also result in delays or restrictions on our ability to fully benefit from these offerings. Further, we may enter into or increase our presence in markets that already possess established competitors who may enjoy the protection of high barriers to entry. Attracting customers in certain countries may also be subject to a number of risks, including currency exchange rate risk, difficulties in enforcing agreements or collecting receivables, longer payment cycles, compliance with the laws or regulations of these countries, and political and regulatory uncertainties.
In addition, in light of consolidation in the exchange, data services and clearing sectors and competition for opportunities, we may be unable to identify strategic opportunities or we may be unable to negotiate or finance any future acquisition successfully. Our competitors could merge, making it more difficult for us to find appropriate entities to acquire or merge with and making it more difficult to compete in our industry due to the increased resources of our merged competitors. Also, offering new products and pursuing acquisitions requires substantial time and attention of our management team, which could prevent them from successfully overseeing other initiatives that are necessary for our success.
We have made substantial progress toward developing and deploying new technology platforms to improve our equity exchange business and data services business. We may experience disruptions or encounter unexpected challenges in deploying these new systems. Further, the costs to complete the remaining work may exceed our current expectations. Any significant cost
27
increases or disruptions to product quality, sales effectiveness or client service or to our other business operations could have an adverse effect on our business, financial condition and operating results.
If we are unable to keep up with rapid changes in technology and client preferences, we may not be able to compete effectively.
To remain competitive, we must continue to enhance and improve the responsiveness, functionality, accessibility and reliability of our electronic platforms and our proprietary and acquired technology. The financial services industry is characterized by rapid technological change, change in use patterns, change in client preferences, frequent product and service introductions and the emergence of new industry standards and practices. These changes could render our existing proprietary technology uncompetitive or obsolete. We are in the process of implementing a new trading technology system at NYSE and if there are trading disruptions or if the new system has inadequate performance, we could suffer material losses, incur reputational damage or be subject to heightened regulatory scrutiny.
Further, we use some open-source software in our technology, most often as small components within a larger product or service, to augment algorithms, functionalities or libraries we create, and we may use more open-source software in the future. Open-source code is also contained in some third-party software we rely on. We could be subject to suits by parties claiming breach of the terms of the license for such open-source software. The terms of many open-source licenses are ambiguous and have not been interpreted by U.S. or other courts, and these licenses could be construed in a manner that imposes unanticipated conditions or restrictions on our ability to commercialize our products and services.
We cannot assure you that we will successfully implement new technologies or adapt our proprietary technology to our clients’ requirements or emerging industry standards in a timely and cost-effective manner. Any failure to remain abreast of industry standards in technology and to be responsive to client preferences could cause our market share to decline and negatively impact our revenues.
Our business may be harmed by computer and communications systems failures and delays.
Our business depends on the integrity, reliability and security of our computer and communication systems. We support and maintain many of the systems that comprise our electronic platforms and our failure to monitor or maintain these systems, or to find replacements for defective components within a system in a timely and cost-effective manner when necessary, could have a material adverse effect on our ability to conduct our business. Our customers rely on us for the delivery of time-sensitive, up-to-date and high-quality financial market data, analytics, and related solutions. Our timely, reliable delivery of high-quality products and services is subject to an array of technical production processes that enable our delivery platforms to leverage an extensive range of content databases. Our redundant systems or disaster recovery plans may prove to be inadequate in the event of a systems failure or cybersecurity breach. Our systems, or those of our third party providers, may fail or be shut down or, due to capacity constraints, may operate slowly, causing one or more of the following:
|
•
|
unanticipated disruption in service to our participants;
|
|
•
|
slower response time and delays in our participants’ trade execution and processing;
|
|
•
|
failed settlement by participants to whom we provide trade confirmation or clearing services;
|
|
•
|
incomplete or inaccurate accounting, recording or processing of trades;
|
|
•
|
failure to complete the clearing house margin settlement process resulting in significant financial risk;
|
|
•
|
distribution of inaccurate or untimely market data to participants who rely on this data in their trading activity; and
|
|
•
|
financial loss.
|
We could experience system failures due to power or telecommunications failures, human error on our part or on the part of our vendors or participants, natural disasters, fire, sabotage, hardware or software malfunctions or defects, computer viruses, cyber-attacks, intentional acts of vandalism or terrorism and similar events. If any one or more of these situations were to arise, they could result in damage to our business reputation and participant dissatisfaction with our electronic platform, which could prompt participants to trade elsewhere or expose us to litigation or regulatory sanctions. As a consequence, our business, financial condition and operating results could suffer materially.
Our regulated business operations generally require that our trade execution and communications systems be able to handle anticipated present and future peak trading volume. Heavy use of computer systems during peak trading times or at times of unusual market volatility could cause those systems to operate slowly or even to fail for periods of time. However, we cannot
28
assure you that our estimates of future trading volume will be accurate or that our systems will always be able to accommodate actual trading volume without failure or degradation of performance.
Although many of our systems are designed to accommodate additional volume and products and services without redesign or replacement, we will need to continue to make significant investments in additional hardware and software and telecommunications infrastructure to accommodate the increases in volume of order and trading transaction traffic and to provide processing and clearing services to third parties. If we cannot increase the capacity and capabilities of our systems to accommodate an increasing volume of transactions and to execute our business strategy, our ability to maintain or expand our businesses would be adversely affected.
We currently have a substantial amount of outstanding indebtedness which could restrict our ability to engage in additional transactions or incur additional indebtedness.
As of December 31, 2017, we had $6.1 billion of outstanding debt. This level of indebtedness could have important consequences to our business, including making it more difficult to satisfy our debt obligations, increasing our vulnerability to general adverse economic and industry conditions, limiting our flexibility in planning for, or reacting to, changes in our business and the industry in which we operate and restricting us from pursuing certain business opportunities. As we use our available resources to reduce and refinance our consolidated debt, our flexibility in planning for, or reacting to, changes in our business and the industry in which we operate and our ability to pursue future business opportunities may be further restrained. In addition, the terms of our debt facilities contain affirmative and negative covenants, including a leverage ratio test and certain limitations on the incurrence of additional debt or the creation of liens and other matters. Further, a significant portion of our outstanding debt has been in commercial paper, which is subject to interest rate changes. Rising interest rates will result in an increase in our interest expense.
Our long-term debt is currently rated by Moody’s Investor Services and Standard & Poor’s. These ratings agencies regularly evaluate us and our credit ratings based on a number of quantitative and qualitative factors, including our financial strength and conditions affecting the financial services industry generally. Our credit ratings remain subject to change at any time, and it is possible that a ratings agency may take action to downgrade our credit ratings in the future. In particular, our inability to sustain reduced debt on a consolidated basis may result in a downgrade of our credit ratings. A significant downgrade of our credit ratings could impact customers’ willingness to use our clearing houses, make parties less willing to do business with us, and could negatively impact our ability to access the capital markets and increase the cost of any future debt funding we may obtain.
Failure to evolve our benchmarks and indices in a manner that maintains the relevance of the benchmark or index, damage to our reputation resulting from our administration of LIBOR or other benchmarks and indices and the potential replacement of LIBOR could adversely affect our business.
We operate multiple global benchmark products and indices across our asset classes and a significant portion of our volume is based on these products. To ensure continued trading in our benchmark products and indices, we must be able to demonstrate that our products are not readily subject to manipulation and we must continue to evolve our products to maintain their relevance. Our subsidiary, IBA, is the administrator for various benchmarks, including LIBOR. IBA’s administration of LIBOR is the result of the LIBOR scandal, which was a series of fraudulent actions taken by banks that were submitting false LIBOR rates to profit from trades, or to give the impression that the banks were more creditworthy than they were. Any failures or negative publicity resulting from our administration of LIBOR or other benchmarks could result in a loss of confidence in the administration of these benchmarks and could harm our business and our reputation.
In July 2017, the FCA announced the desire to phase out the use of LIBOR by the end of 2021. At this time, it is not possible to predict the effect of any such changes, any establishment of alternative references rates or any other reforms to LIBOR that may be enacted in the U.K. or elsewhere. The elimination of LIBOR or any other changes or reforms to the determination or supervision of LIBOR could have an adverse impact on our business, financial condition and operating results.
We may fail to complete or realize the anticipated cost savings, growth opportunities and synergies and other benefits anticipated from our recent acquisitions and future acquisitions, which could adversely affect the value of our common stock.
We have completed many acquisitions and plan to continue to pursue acquisitions and joint ventures. The success of our acquisitions will depend, in part, on our ability to integrate these businesses into our existing operations and realize anticipated cost savings, revenue synergies and growth opportunities. We generally set aggressive timelines for realizing savings,
which assumes we successfully undertake a variety of actions (including, but not limited to, integrating technology, eliminating redundancies and effecting organizational restructurings) that are themselves subject to a variety of risks and may be subject to regulatory approvals
29
that we do not control. The process of integrating acquired companies is time consuming and could disrupt each company’s ongoing businesses, produce unforeseen regulatory and operating difficulties (including inconsistencies in standards, controls, procedures and policies that adversely affect relationships with market participants, regulators and others), require substantial resources and expenditures, and divert the attention of management from the ongoing operation of the business.
There is a risk, however, that we may not integrate these acquired companies in a manner that permits our expected cost savings and revenue synergies to be fully realized in the time periods expected, or at all. In addition, a variety of factors, including but not limited to regulatory conditions, governmental competition approvals, currency fluctuations, and difficulty integrating technology platforms, may adversely affect our ability to complete our acquisitions or realize our anticipated cost savings and synergies. For example, the U.K. Competition and Markets Authority, or CMA, ordered a divestment of Trayport and such divestment was completed in December 2017.
We may also not realize anticipated growth opportunities and other benefits from strategic investments or strategic joint ventures or alliances that we have entered into or may enter into for a number of reasons, including regulatory or government approvals or changes, global market changes, contractual obligations, competing products and, in some instances, our lack of or limited control over the management of the business. Further, strategic initiatives that have historically been successful may not continue to be successful due to competitive threats, changing market conditions or the inability for the parties to extend the relationship into the future.
As a result of any future acquisition, we may issue additional shares of our common stock that dilute our stockholders’ ownership interest, expend cash, incur debt, assume actual and contingent liabilities, inherit existing or pending litigation or create additional expenses related to amortizing intangible assets. Further, we cannot assure you that any such financing or equity investments will be available with terms that will be favorable to us, or available at all.
Fluctuations in foreign currency exchange rates may adversely affect our financial results.
Since we conduct operations in several different countries, including the U.S., U.K., EU and Canada, substantial portions of our revenues, expenses, assets and liabilities are denominated in U.S. dollars, pounds sterling, euros and Canadian dollars. Because our consolidated financial statements are presented in U.S. dollars, we must translate non-U.S. dollar denominated revenues, income and expenses, as well as assets and liabilities, into U.S. dollars at exchange rates in effect during or at the end of each reporting period. Therefore, increases or decreases in the value of the U.S. dollar against the other currencies may affect our net operating revenues, operating income and the value of balance sheet items denominated in foreign currencies.
External events such as Brexit, the negotiations regarding the terms of the U.K.’s exit from the EU, the outcome of the U.S. presidential election and the passage of U.S. taxation reform legislation each have caused, and may continue to cause, significant volatility in currency exchange rates, especially among the U.S. dollar, the British pound sterling and the euro. If global economic and market conditions, or economic conditions in the U.K., EU, the U.S. or other key markets remain uncertain or deteriorate further, the value of the pound sterling and euro and the global credit markets may further weaken. General financial instability in countries in the EU could have a contagion effect on the region and contribute to the general instability and uncertainty in the EU. Events that adversely affect our U.K. and EU clients and suppliers could in turn have a materially adverse effect on our international business results and our operating results.
For additional information on our foreign currency exchange rate risk, refer to “- Foreign Currency Exchange Rate Risk” in Item 7A “- Quantitative and Qualitative Disclosures About Market Risk, which is included in this Annual Report.”
We may be required to recognize impairments of our goodwill, other intangible assets or investments.
The determination of the value of goodwill and other intangible assets requires the use of estimates and assumptions that affect our consolidated financial statements. As of
December 31, 2017
, we had goodwill of $
12.2 billion
and net other intangible assets of $
10.3 billion
relating to our acquisitions and our purchase of trademarks and Internet domain names from various third parties. We recorded a $33 million impairment loss on our Creditex customer relationship intangible assets during 2016, primarily due to the sale of our Creditex U.S. voice broker operations and the discontinuance of our Creditex U.K. voice brokerage operations in 2016.
As of
December 31, 2016
, we had $432 million in long-term investments relating to our equity security investment in Cetip, S.A., or Cetip. In 2017, we sold our equity security investment in Cetip and recognized a realized net investment gain of $167 million.
30
On October 24, 2017, we acquired a
4.7%
stake in Euroclear for
€275 million
in cash (
$327 million
based on the euro/U.S. dollar exchange rate of 1.1903 as of October 24, 2017). During December 2017, we reached an agreement to buy an additional
5.1%
stake in Euroclear for
€243 million
in cash (
$292 million
based on the euro/U.S. dollar exchange rate of 1.2003 as of December 31, 2017) and expect to receive necessary regulatory approval during the first quarter of 2018. Upon closing, we will own a 9.8% stake in Euroclear for a total investment of €518 million ($619 million based on the exchange rates above). Euroclear is a leading provider of post-trade services, including settlement, central securities depositories and related services for cross-border transactions across asset classes.
The Financial Accounting Standards Board, or FASB, has issued Accounting Standards Update, or ASU, No. 2016-01, which provides updated guidance for the recognition, measurement, presentation, and disclosure of certain financial assets and liabilities, including the requirement that equity investments (except those accounted for under the equity method of accounting or those that result in consolidation of the investee) are to be measured at fair value with changes in fair value recognized in net income. We were required to adopt ASU 2016-01 on January 1, 2018. Our cost method investments, including our investment in Euroclear and our 1.8% stake in Coinbase Global, Inc., among others, will be impacted by our adoption of ASU 2016-01 beginning in the first quarter of 2018. These companies do not currently have readily determinable fair market values as they are not publicly listed companies. Therefore, in accordance with ASU 2016-01, we will only adjust the fair value of these investments if and when there is an observable price change in an orderly transaction, and any change in the fair value will be recognized in net income.
We cannot assure you that we will not experience future events that may result in asset impairments. An impairment of the value of our existing goodwill, other intangible assets and other investments and assets could have a significant negative impact on our future operating results.
For additional information on our goodwill, other intangible assets and investments including the impairment and realized investment gain, refer to notes 3, 6 and 8 to our consolidated financial statements and “- Critical Accounting Policies - Goodwill and Other Identifiable Intangible Assets” in Item 7 “- Management’s Discussion and Analysis of Financial Condition and Results of Operations,” which are included in this Annual Report.
We may face liability for content contained in our data products and services.
We may be subject to claims for breach of contract, defamation, libel, copyright or trademark infringement, fraud or negligence, or based on other theories of liability, in each case relating to the data, articles, commentary, ratings, information or other content we distribute in our financial data services. If such data or other content or information that we distribute has errors, is delayed or has design defects, we could be subject to liability or our reputation could suffer. We could also be subject to claims based upon the content that is accessible from our corporate website or those websites that we own and operate through links to other websites. Use of our products and services as part of the investment process creates the risk that clients, or the parties whose assets are managed by our clients, may pursue claims against us for significant amounts. Any such claim, even if the outcome were ultimately favorable to us, could involve a significant commitment of our management, personnel, financial and other resources. Such claims and lawsuits could have a material adverse effect on our business, financial condition and operating results, and a negative impact on our reputation.
In addition, we license and redistribute data and content from various third parties and the terms of these licenses change frequently. Our third party data and content suppliers may audit our use of and our clients’ use of and payment for data and content from time to time in the ordinary course of business, including audits currently underway. Such third party data and content suppliers may assert that we or our clients owe additional amounts under the terms of the applicable license agreements, that we inappropriately distributed the third party data or that we or our clients used the data or content in a manner that exceeded the scope of the applicable license agreement. We have and expect to continue to spend and allocate resources to develop and acquire the use of technology and other intellectual property rights to manage these risks and track third party data usage, but we cannot be assured that we will not incur liability. We may incur costs to investigate any allegations and may be required to pay damages to or make unexpected settlement payments to these data and content suppliers and these costs and payments could be material.
A failure to protect our intellectual property rights, or allegations that we have infringed the intellectual property rights of others, could adversely affect our business.
Our business is dependent on proprietary technology and other intellectual property that we own or license from third parties, including trademarks, service marks, trade names, trade secrets, copyrights and patents. We cannot assure you that the steps that we have taken or will take in the future will prevent misappropriation of our proprietary technology or intellectual property. Additionally, we may be unable to detect the misappropriation or unauthorized use of our proprietary technology and intellectual property. Our failure to adequately protect our proprietary technology and intellectual property could harm our reputation and
31
affect our ability to compete effectively. Further, we may need to resort to litigation to enforce our intellectual property rights, which may require significant financial and managerial resources. As a result, we may choose not to enforce our infringed intellectual property rights, depending on our strategic evaluation and judgment regarding the best use of our resources, the relative strength of our intellectual property portfolio and the recourse available to us.
In addition, our competitors, as well as other companies and individuals, may have obtained, and may be expected to obtain in the future, patent rights related to the types of products and services we offer or plan to offer. We cannot assure you that we are or will be aware of all patents that may pose a risk of infringement by our products and services. As a result, we may face allegations that we have infringed the intellectual property rights of third parties which may be costly for us to defend against. If one or more of our products or services is found to infringe patents held by others, we may be required to stop developing or marketing the products or services, obtain licenses to develop and market the products or services from the holders of the patents or redesign the products or services in such a way as to avoid infringing the patents. We also could be required to pay damages if we were found to infringe patents held by others, which could materially adversely affect our business, financial condition and operating results. We cannot assess the extent to which we may be required in the future to obtain licenses with respect to patents held by others, whether such licenses would be available or, if available, whether we would be able to obtain such licenses on commercially reasonable terms. If we were unable to obtain such licenses, we may not be able to redesign our products or services at a reasonable cost to avoid infringement, which could materially adversely affect our business, financial condition and operating results.
We rely on third party providers and other suppliers for a number of services that are important to our business. An interruption or cessation of an important service, data or content supplied by any third party, or the loss of an exclusive license, could have a material adverse effect on our business.
We depend on a number of suppliers, such as online service providers, hosting service and software providers, data processors, software and hardware vendors, banks, local and regional utility providers, and telecommunications companies, for elements of our trading, clearing, data services and other systems. We rely on access to certain data used in our business through licenses with third parties, and we rely on a large international telecommunications company for the provision of hosting services. We also depend on third-party suppliers for data and content, including data received from certain competitors, clients, various government and public record services and financial institutions, used in our products and services. Some of this data is exclusive to particular suppliers and may not be obtained from other suppliers. In addition, our data suppliers could enter into exclusive contracts with our competitors without our knowledge. The general trend toward industry consolidation may increase the risk that these services may not be available to us in the future. If these companies were to discontinue providing services to us for any reason or fail to provide the type of service agreed to, we would likely experience significant disruption to our business and may be subject to litigation by our clients or increased regulatory scrutiny or regulatory fines. Our third party data suppliers perform audits on us from time to time in the ordinary course of business to determine if data we license for redistribution has been properly accounted for in accordance with the terms of the applicable license agreement. As a result of these audits, we may incur additional expenses.
Many of our clients also rely on third parties to provide them with systems necessary to access our trading platform. If these companies were to discontinue providing services to our clients for any reason, we may experience a loss of revenue associated with our clients’ inability to transact with our businesses. We hold exclusive licenses to list various index futures and contracts. In the future, litigation or regulatory action may limit the right of owners to grant exclusive licenses for index futures and contracts trading to a single exchange, and our competitors may succeed in providing economically similar products in a manner or jurisdiction not otherwise covered by our exclusive license. MiFID II introduced a harmonized approach to the licensing of services relating to commodity derivatives across Europe and the legislation requires open access to any benchmarks (a benchmark is an index or other measure used to determine the value of a financial instrument, for example, LIBOR or the S&P 500) used in Europe. If unlicensed trading of any index product where we hold an exclusive license were permitted, we could lose trading volume for these products which would adversely affect our revenues associated with the license and the related index products.
We are subject to significant litigation and liability risks.
Many aspects of our business, and the businesses of our participants, involve substantial risks of liability. These risks include, among others, potential liability from disputes over terms of a trade and the claim that a system failure or delay caused monetary loss to a participant or that an unauthorized trade occurred. For example, dissatisfied market participants that have traded on our electronic platform or those on whose behalf such participants have traded, may make claims regarding the quality of trade execution, or allege improperly confirmed or settled trades, abusive trading practices, security and confidentiality breaches, mismanagement or even fraud against us or our participants. In addition, because of the ease and speed with which sizable trades can be executed on our electronic platform, participants can lose substantial amounts by inadvertently entering trade orders or by
32
entering them inaccurately. A large number of significant error trades could result in participant dissatisfaction and a decline in participant willingness to trade in our electronic markets.
In addition, we are subject to on-going legal disputes that could result in the payment of fines, penalties or damages and could expose us to additional liability in the future. For example, on December 19, 2017, the U.S. Court of Appeals for the Second Circuit, or the Second Circuit, issued its decision in City of Providence v. BATS Global Markets et al. Two of our subsidiaries, New York Stock Exchange LLC and NYSE Arca, Inc., are defendants in this case. In vacating the district court’s dismissal of this lawsuit and remanding for further proceedings, the Second Circuit concluded in part that the defendant securities exchanges are not immune from the claims in this case because absolute immunity is available to a self-regulatory organization, like the New York Stock Exchange LLC and NYSE Arca, Inc., only when they carry out regulatory functions. Although our exchanges will continue to have other defenses available to them in securities litigation cases (including in this matter), limitations on the doctrine of absolute immunity could result in an increased exposure to litigation, and to increased liability and/or other legal expenses.
Further, we could incur significant expenses defending claims, even those without merit, which could adversely affect our business, financial condition and operating results. An adverse resolution of any lawsuit or claim against us, including those we are involved with due to acquisition activity, may require us to pay substantial damages or impose restrictions on how we conduct business, either of which could adversely affect our business, financial condition and operating results. In addition, we may have to establish accruals for those matters in circumstances when a loss contingency is considered probable and the related amount is reasonably estimable. Any such accruals may be adjusted as circumstances change. See note 14 to our consolidated financial statements and related notes, which are included elsewhere in this Annual Report, for a summary of our legal proceedings and claims.
We may be at greater risk from terrorism than other companies.
Given our prominence in the global securities industry and the location of many of our properties and personnel in U.S. and European financial centers, including lower Manhattan, we may be more likely than other companies to be a direct target of, or an indirect casualty of, attacks by terrorists or terrorist organizations, or other extremist organizations that employ threatening or harassing means to achieve their social or political objectives.
It is impossible to predict the likelihood or impact of any terrorist attack on the securities industry generally or on our business. In the event of an attack or a threat of an attack, our security measures and contingency plans may be inadequate to prevent significant disruptions in our business, technology or access to the infrastructure necessary to maintain our business. Damage to our facilities due to terrorist attacks may be significantly in excess of insurance coverage, and we may not be able to insure against some damage at a reasonable price or at all. The threat of terrorist attacks may also negatively affect our ability to attract and retain employees. In addition, terrorist attacks may cause instability or decreased trading in the securities markets, including trading on exchanges. Any of these events could adversely affect our business, financial condition and operating results.
Damage to our reputation could damage our business.
Our business is highly competitive and our customers typically have options on where to conduct their business. Our management team and business operations benefit from being highly regarded in our industry. Maintaining our reputation is critical to attracting and retaining customers and investors and for maintaining our relationships with our regulators. Negative publicity regarding our company or actual, alleged or perceived issues regarding our products or services, operations, risk management, compliance with regulations or management team could give rise to reputational risk which could significantly harm our existing business and business prospects.
Owning and operating voice broker and electronic fixed income brokerage businesses exposes us to additional risk, and these businesses are largely dependent on general market conditions.
Our voice broker business provides brokerage services to clients in the form of agency transactions in commodity products. In agency transactions, customers pay transaction fees for trade execution services in which we connect buyers and sellers who settle their transactions directly. In connection with our fixed income business, our broker-dealers operate in both an agency and in a matched principal capacity (also known as “risk-less principal”). When trading as matched principal, we agree to buy instruments from one customer and sell them to another customer. The amount of the fee generally depends on the spread between the buy and sell price of the security that is brokered. With respect to matched principal transactions, a counterparty to a matched principal transaction may fail to fulfill its obligations, or we may face liability for an unmatched trade. We also face the risk of not being able to collect transaction or processing fees charged to customers for brokerage services and processing services we provide.
33
We are a holding company and depend on our subsidiaries for dividends, distributions and other payments.
We are a legal entity separate and distinct from our operating subsidiaries. Our principal source of cash flow, including cash flow to pay dividends to our stockholders and principal and interest on our outstanding debt, is dividends from our subsidiaries. There are statutory and regulatory limitations on the payment of dividends by certain of our subsidiaries to us. If our subsidiaries are unable to make dividend payments to us and sufficient cash or liquidity is not otherwise available, we may not be able to make dividend payments to our stockholders, principal and interest payments on our outstanding debt or repurchase shares of our common stock, which could have a material adverse effect on our business, financial condition and operating results.
Provisions of our organizational documents and Delaware law may delay or deter a change of control of ICE.
Our organizational documents contain provisions that may have the effect of discouraging, delaying or preventing a change of control of, or unsolicited acquisition proposals for, ICE. These provisions make a change of control less likely, which may be contrary to the desires of certain of our stockholders. Many of these provisions are required by relevant regulators in connection with our ownership and operation of U.S. and European equity exchanges. For example, our organizational documents include provisions that generally restrict any person (either alone or together with its related persons) from (i) voting or causing the voting of shares of stock representing more than 10% of our outstanding voting capital stock (including as a result of any agreement by any other persons not to vote shares of stock) or (ii) beneficially owning shares of stock representing more than 20% of the outstanding shares of any class or series of our capital stock. Further, our organizational documents generally limit the ability of stockholders to call special stockholders’ meetings or act by written consent, and generally authorize our board of directors, without stockholder approval, to issue and fix the rights and preferences of one or more series of preferred stock. In addition, provisions of Delaware law may have a similar effect, such as provisions limiting the ability of certain interested stockholders, as defined under Delaware law, from causing the merger or acquisition of a corporation against the wishes of the board of directors.
None.
ITEM 2.
PROPERTIES
The net book value of our property was $
1.2 billion
as of
December 31, 2017
. Our intellectual property is described under the heading in Item 1 “- Business -Technology.” In addition to our intellectual property, our other primary assets include buildings, computer equipment, corporate aircraft, software, and internally developed software. We own an array of computers and related equipment.
Our headquarters and principal executive offices are located in Atlanta, Georgia and New York, New York. We currently occupy 270,000 square feet of office space in Atlanta in a building that we own that serves as our Atlanta headquarters. Our New York headquarters are located at 11 Wall Street, where we occupy 370,000 square feet of office space in a building we own. In total, we maintain 2.5 million square feet in offices primarily throughout the U.S., U.K., EU, Asia, Israel and Canada. Generally, our properties are not earmarked for use by a particular business segment. Our principal offices consist of the properties described below.
34
|
Location
|
Owned/Leased
|
Lease Expiration
|
Approximate Size
|
||||||||
|
5660 New Northside Drive
Atlanta, Georgia
|
Owned
|
N/A
|
270,000 sq. ft.
|
||||||||
|
11 Wall Street
New York, New York
|
Owned
|
N/A
|
370,000 sq. ft.
|
|
|||||||
|
Basildon, U.K.
|
Owned
|
N/A
|
539,000 sq. ft.
|
||||||||
|
Mahwah, New Jersey
|
Leased
|
2029
|
395,000 sq. ft.
|
||||||||
|
60 Codman Hill Road Boxborough, Massachusetts
|
Leased
|
2018
|
100,000 sq. ft.
|
||||||||
|
55 East 52
nd
Street
New York, New York
|
Leased
|
2028
|
93,000 sq. ft.
|
|
|||||||
|
32 Crosby Drive Bedford, Massachusetts
|
Leased
|
2026
|
82,000 sq. ft.
|
||||||||
|
Milton Gate London, U.K.
|
Leased
|
2024
|
70,000 sq. ft.
|
||||||||
|
Fitzroy House London, U.K.
|
Leased
|
2025
|
65,000 sq. ft.
|
||||||||
|
100 Church Street New York, New York
|
Leased
|
2024
|
65,000 sq. ft.
|
||||||||
|
353 North Clark Street Chicago, Illinois
|
Leased
|
2027
|
57,000 sq. ft.
|
||||||||
In addition to the above, we currently lease an aggregate of 367,000 square feet of administrative, sales and disaster preparedness facilities in various cities around the word. We believe that our facilities are adequate for our current operations and that we will be able to obtain additional space as and when it is needed.
ITEM 3.
LEGAL PROCEEDINGS
We are subject to legal proceedings, claims and investigations that arise in the ordinary course of our business. We establish accruals for those matters in circumstances when a loss contingency is considered probable and the related amount is reasonably estimable. Any such accruals may be adjusted as circumstances change. Assessments of losses are inherently subjective and involve unpredictable factors. We do not believe that the resolution of these legal matters, including the matters described below, will have a material adverse effect on our consolidated financial condition, results of operations, or liquidity. It is possible, however, that future results of operations for any particular quarterly or annual period could be materially and adversely affected by any developments relating to the legal proceedings, claims and investigations. See note 14 to the consolidated financial statements in Part II, Item 8 of this Annual Report for a summary of our legal proceedings and claims.
ITEM 4.
MINE SAFETY DISCLOSURES
Not applicable.
|
ITEM 5.
|
MARKET FOR REGISTRANT’S COMMON EQUITY, RELATED STOCKHOLDER MATTERS
AND ISSUER PURCHASES OF EQUITY SECURITIES |
Approximate Number of Holders of Common Stock
As of February 5, 2018, there were approximately 538 holders of record of our common stock.
Dividends
The declaration of dividends is subject to the discretion of our board of directors, and may be affected by various factors, including our future earnings, financial condition, capital requirements, share repurchase activity, levels of indebtedness, credit ratings and other considerations our board of directors deem relevant. Our board of directors has adopted a quarterly dividend declaration policy providing that the declaration of any dividends will be determined quarterly by the board or audit committee of the board of directors taking into account such factors as our evolving business model, prevailing business conditions and our financial results and capital requirements, without a predetermined annual net income payout ratio. During the year ended
December 31, 2017
, we paid dividends of $0.80 per share of our common stock in the aggregate, including quarterly dividend for each quarter in 2017 of $0.20 per
35
share, for an aggregate payout of $476 million in
2017
. Refer to note 11 to our consolidated financial statements and related notes, which are included elsewhere in this Annual Report, for details on the amounts of our quarterly dividend payouts for the last three years. For the first quarter of 2018, we announced a $0.24 per share dividend, which is a 20% increase over the prior dividend, which is payable on March 29, 2018 to shareholders of record as of March 15, 2018.
As a holding company, we have no operations and rely upon dividends from our subsidiaries in order to provide liquidity necessary to service our debt obligations and make dividend payments to our shareholders. We and our subsidiaries are all required to comply with legal and regulatory restrictions, including restrictions contained in applicable general corporate laws, regarding the declaration and payment of dividends. These laws may limit our or our subsidiaries’ ability to declare and pay dividends from time to time.
None of the indentures governing our and our subsidiaries’ outstanding indebtedness contain specific covenants restricting our ability, or the ability of our subsidiaries, to pay dividends absent a default on such indebtedness. Our senior unsecured revolving credit facility in the aggregate amount of
$3.4 billion
, however, limits our ability to declare and make dividend payments, and other distributions of our cash, property or assets, if a default under the applicable facility has occurred and is continuing, or would occur as a result of our declaration and payment of any dividend or other distribution. Our senior unsecured revolving credit facility contains customary financial and operating covenants that place restrictions on our operations, including our maintenance of specified total leverage and interest coverage ratios, which could indirectly affect our ability to pay dividends. Refer to note 10 to our consolidated financial statements and related notes, which are included elsewhere in this Annual Report, for more information on our debt facilities.
Price Range of Common Stock
Our common stock trades on the New York Stock Exchange under the ticker symbol “ICE.” On February 5, 2018, our common stock traded at a high of $74.47 per share and a low of $71.27 per share. The following table sets forth the quarterly high and low sale prices for the periods indicated for our common stock on the New York Stock Exchange.
|
Common Stock Market
Price |
|||||||
|
High
|
Low
|
||||||
|
Year Ended December 31, 2016
|
|||||||
|
First Quarter
|
$
|
53.78
|
|
$
|
45.79
|
|
|
|
Second Quarter
|
$
|
54.39
|
|
$
|
45.88
|
|
|
|
Third Quarter
|
$
|
57.40
|
|
$
|
50.18
|
|
|
|
Fourth Quarter
|
$
|
59.86
|
|
$
|
52.27
|
|
|
|
Year Ended December 31, 2017
|
|||||||
|
First Quarter
|
$
|
61.98
|
|
$
|
55.80
|
|
|
|
Second Quarter
|
$
|
66.73
|
|
$
|
57.91
|
|
|
|
Third Quarter
|
$
|
68.88
|
|
$
|
63.22
|
|
|
|
Fourth Quarter
|
$
|
72.99
|
|
$
|
64.91
|
|
|
Equity Compensation Plan Information
The following table provides information about our common stock that has been or may be issued under our equity compensation plans as of
December 31, 2017
:
•
Intercontinental Exchange, Inc. 2017 Omnibus Employee Incentive Plan
•
Intercontinental Exchange, Inc. 2013 Omnibus Employee Incentive Plan
•
Intercontinental Exchange, Inc. 2013 Omnibus Non-Employee Director Incentive Plan
•
Intercontinental Exchange, Inc. 2009 Omnibus Incentive Plan
•
Intercontinental Exchange, Inc. 2003 Restricted Stock Deferral Plan for Outside Directors
•
Intercontinental Exchange, Inc. 2000 Stock Option Plan
•
NYSE Omnibus Incentive Plan As Amended and Restated
The 2000 Stock Option Plan was retired on May 14, 2009 when our shareholders approved the 2009 Omnibus Incentive Plan. The 2009 Omnibus Incentive Plan was retired on May 17, 2013 when our shareholders approved the 2013 Omnibus Employee Incentive Plan. The 2013 Omnibus Employee Incentive Plan was retired on May 19, 2017 when our shareholders approved the 2017 Omnibus Employee Incentive Plan. No future grants will be made from the retired plans. No future grants will be made to legacy NYSE employees under the NYSE Omnibus Incentive Plan. All future grants to employees will be made under the Intercontinental Exchange, Inc. 2017 Omnibus Employee Incentive Plan and all future grants to directors will be made under the Intercontinental Exchange, Inc. 2013 Omnibus Non-Employee Director Incentive Plan.
36
|
Plan Category
|
Number of
securities to be issued upon exercise of outstanding options and rights (a) |
Weighted average
exercise price of outstanding options (b) |
Number of securities
available for future issuance under equity compensation plans (excluding securities reflected in column (a)) (c) |
||||||
|
Equity compensation plans approved by security holders
(1)
|
10,650,500
|
|
(1)
|
$
|
41.13
|
|
(1)
|
39,660,237
|
|
|
Equity compensation plans not approved by security holders
(2)
|
88,930
|
|
(2)
|
—
|
|
(2)
|
—
|
|
|
|
TOTAL
|
10,739,430
|
|
$
|
41.13
|
|
39,660,237
|
|
||
|
(1)
|
The 2000 Stock Option Plan was approved by our stockholders in June 2000. The 2009 Omnibus Incentive Plan was approved by our stockholders on May 14, 2009. The 2013 Omnibus Employee Incentive Plan and the 2013 Omnibus Non-Employee Director Incentive Plan were approved by our stockholders in May 2013. The shareholders of NYSE approved the NYSE Amended and Restated Omnibus Incentive Plan on April 25, 2013. The 2017 Omnibus Employee Incentive Plan was approved by our shareholders on May 19, 2017. Of the 10,650,500 securities to be issued upon exercise of outstanding options and rights, 4,013,388 are options with a weighted average exercise price of $41.13 and the remaining 6,637,112 securities are restricted stock shares that do not have an exercise price. Of the 6,637,112 restricted stock shares to be issued, 106,105 shares were originally granted under the NYSE Amended and Restated Omnibus Incentive Plan.
|
|
(2)
|
This category includes the 2003 Restricted Stock Deferral Plan for Outside Directors. All of the 88,930 securities to be issued are restricted stock shares that do not have an exercise price. For more information concerning these plans, see note 11 to our consolidated financial statements and related notes, which are included elsewhere in this Annual Report.
|
Stock Repurchases
The table below sets forth the information with respect to purchases made by or on behalf of ICE or any “affiliated purchaser” (as defined in Rule 10b-18(a)(3) under the Exchange Act) of our common stock during the three months ended December 31, 2017.
|
Period
(2017)
|
Total number of
shares purchased
|
Average price
paid per share
|
Total number of
shares purchased as
part of publicly
announced plans or
programs(1)
|
Approximate dollar
value of shares that
may yet be
purchased under the
plans or programs
(in millions)(1)
|
|
October 1 - October 31
|
1,227,656
|
$68.01
|
13,599,618
|
$158
|
|
November 1 - November 30
|
1,192,278
|
$67.39
|
14,791,896
|
$78
|
|
December 1 - December 31
|
1,077,640
|
$70.75
|
15,869,536
|
$1
|
|
Total
|
3,497,574
|
$68.62
|
15,869,536
|
$1
|
|
(1)
|
In September 2017, our board of directors approved an aggregate of $1.2 billion for future repurchases of our common stock with no fixed expiration date that became effective on January 1, 2018. Refer to note 11 to our consolidated financial statements and related notes, which are included elsewhere in this Annual Report, for additional details on our stock repurchase plans.
|
ITEM 6.
SELECTED FINANCIAL DATA
The following tables present our selected consolidated financial data as of and for the dates and periods indicated. We derived the selected consolidated financial data set forth below for the years ended
December 31, 2017
,
2016
and
2015
and as of
December 31, 2017
and
2016
from our audited consolidated financial statements, which are included elsewhere in this Annual Report. We derived the selected consolidated financial data set forth below for the years ended December 31, 2014 and 2013 and as of December 31, 2015, 2014 and 2013 from our audited consolidated financial statements, which are not included in this Annual Report. The selected consolidated financial data presented below is not indicative of our future results for any period. The selected consolidated financial data set forth below should be read in conjunction with our consolidated financial statements and related notes and Item 7, “- Management’s Discussion and Analysis of Financial Condition and Results of Operations” included elsewhere in this Annual Report.
37
|
Year Ended December 31,
|
|||||||||||||||||||
|
2017
|
2016
|
2015
|
2014
|
2013
|
|||||||||||||||
|
(In millions, except for per share data)
|
|||||||||||||||||||
|
Consolidated Statement of Income Data
(1)
|
|||||||||||||||||||
|
Revenues:
|
|||||||||||||||||||
|
Transaction and clearing, net
(2)
|
$
|
3,131
|
|
$
|
3,384
|
|
$
|
3,228
|
|
$
|
3,144
|
|
$
|
1,393
|
|
||||
|
Data services
|
2,084
|
|
1,978
|
|
871
|
|
691
|
|
246
|
|
|||||||||
|
Listings
|
417
|
|
419
|
|
405
|
|
367
|
|
33
|
|
|||||||||
|
Other revenues
|
202
|
|
177
|
|
178
|
|
150
|
|
58
|
|
|||||||||
|
Total revenues
|
5,834
|
|
5,958
|
|
4,682
|
|
4,352
|
|
1,730
|
|
|||||||||
|
Transaction-based expenses
(2)
|
1,205
|
|
1,459
|
|
1,344
|
|
1,260
|
|
132
|
|
|||||||||
|
Total revenues, less transaction-based expenses
|
4,629
|
|
4,499
|
|
3,338
|
|
3,092
|
|
1,598
|
|
|||||||||
|
Operating expenses:
|
|||||||||||||||||||
|
Compensation and benefits
|
937
|
|
945
|
|
611
|
|
592
|
|
302
|
|
|||||||||
|
Professional services
|
121
|
|
137
|
|
139
|
|
181
|
|
54
|
|
|||||||||
|
Acquisition-related transaction and integration costs
(3)
|
36
|
|
80
|
|
88
|
|
129
|
|
143
|
|
|||||||||
|
Technology and communication
|
397
|
|
374
|
|
203
|
|
188
|
|
63
|
|
|||||||||
|
Rent and occupancy
|
69
|
|
70
|
|
57
|
|
78
|
|
39
|
|
|||||||||
|
Selling, general and administrative
|
155
|
|
116
|
|
116
|
|
143
|
|
51
|
|
|||||||||
|
Depreciation and amortization
|
535
|
|
610
|
|
374
|
|
333
|
|
156
|
|
|||||||||
|
Total operating expenses
|
2,250
|
|
2,332
|
|
1,588
|
|
1,644
|
|
808
|
|
|||||||||
|
Operating income
|
2,379
|
|
2,167
|
|
1,750
|
|
1,448
|
|
790
|
|
|||||||||
|
Other income (expense), net
(4)
|
138
|
|
(138
|
)
|
(97
|
)
|
(41
|
)
|
(286
|
)
|
|||||||||
|
Income from continuing operations before income tax expense (benefit)
|
2,517
|
|
2,029
|
|
1,653
|
|
1,407
|
|
504
|
|
|||||||||
|
Income tax expense (benefit)
(5)
|
(25
|
)
|
580
|
|
358
|
|
402
|
|
184
|
|
|||||||||
|
Income from continuing operations
|
2,542
|
|
1,449
|
|
1,295
|
|
1,005
|
|
320
|
|
|||||||||
|
Income (loss) from discontinued operations, net of tax
(6)
|
—
|
|
—
|
|
—
|
|
11
|
|
(50
|
)
|
|||||||||
|
Net income
|
$
|
2,542
|
|
$
|
1,449
|
|
$
|
1,295
|
|
$
|
1,016
|
|
$
|
270
|
|
||||
|
Net income attributable to non-controlling interest
|
(28
|
)
|
(27
|
)
|
(21
|
)
|
(35
|
)
|
(16
|
)
|
|||||||||
|
Net income attributable to ICE
(7)
|
$
|
2,514
|
|
$
|
1,422
|
|
$
|
1,274
|
|
$
|
981
|
|
$
|
254
|
|
||||
|
Basic earnings (loss) per share attributable to ICE common shareholders:
|
|||||||||||||||||||
|
Continuing operations
(7)
|
$
|
4.27
|
|
$
|
2.39
|
|
$
|
2.29
|
|
$
|
1.70
|
|
$
|
0.78
|
|
||||
|
Discontinued operations
(6)
|
—
|
|
—
|
|
—
|
|
0.02
|
|
(0.13
|
)
|
|||||||||
|
Basic earnings per share
|
$
|
4.27
|
|
$
|
2.39
|
|
$
|
2.29
|
|
$
|
1.72
|
|
$
|
0.65
|
|
||||
|
Basic weighted average common shares outstanding
(8)
|
589
|
|
595
|
|
556
|
|
570
|
|
392
|
|
|||||||||
|
Diluted earnings (loss) per share attributable to ICE common shareholders:
|
|||||||||||||||||||
|
Continuing operations
(7)
|
$
|
4.23
|
|
$
|
2.37
|
|
$
|
2.28
|
|
$
|
1.69
|
|
$
|
0.77
|
|
||||
|
Discontinued operations
(6)
|
—
|
|
—
|
|
—
|
|
0.02
|
|
(0.13
|
)
|
|||||||||
|
Diluted earnings per share
|
$
|
4.23
|
|
$
|
2.37
|
|
$
|
2.28
|
|
$
|
1.71
|
|
$
|
0.64
|
|
||||
|
Diluted weighted average common shares outstanding
(8)
|
594
|
|
599
|
|
559
|
|
573
|
|
396
|
|
|||||||||
|
Dividend per share
|
$
|
0.80
|
|
$
|
0.68
|
|
$
|
0.58
|
|
$
|
0.52
|
|
$
|
0.13
|
|
||||
|
(1)
|
We acquired several companies during the periods presented and have included the financial results of these companies in our consolidated financial statements effective from the respective acquisition dates. Refer to note 3 to our consolidated financial statements and related notes, which are included elsewhere in this Annual Report, for more information on these acquisitions.
|
|
(2)
|
Our transaction and clearing fees are presented net of rebates paid to our customers. We also report transaction-based expenses relating to Section 31 fees and payments made for routing services and to certain U.S. equities liquidity providers. For a discussion of these rebates, see Item 7 “- Management’s Discussion and Analysis of Financial Condition and Results of Operations - Segment Reporting - Trading and Clearing Segment” included elsewhere in this Annual Report.
|
38
|
(3)
|
Acquisition-related transaction and integration costs relate to acquisitions and other strategic opportunities. The acquisition-related transaction costs include fees for investment banking advisors, lawyers, accountants, tax advisors and public relations firms, deal-related bonuses to certain of our employees, as well as costs associated with credit facilities and other external costs directly related to the transactions. We also incurred integration costs during the years ended December 31, 2017, 2016 and 2015 relating to our Interactive Data acquisition and during the years ended December 31, 2016, 2015, 2014 and 2013 relating to our NYSE acquisition, primarily related to employee termination costs, lease terminations costs, costs incurred relating to the IPO of Euronext, transaction-related bonuses and professional services costs incurred relating to the integrations.
|
|
(4)
|
Other income (expense), net during the year ended December 31, 2017 includes a $167 million realized net investment gain in connection with our sale of Cetip and a $110 million net gain on our divestiture of Trayport, and other income (expense), net during the year ended December 31, 2013 includes a $190 million impairment loss on our Cetip investment and a $51 million expense relating to the early payoff of outstanding debt. Refer to notes 3 and 6 to our consolidated financial statements and related notes, which are included elsewhere in this Annual Report, for more information on the 2017 gains relating to the sales of Cetip and Trayport.
|
|
(5)
|
The income tax benefit or lower income tax expense for the years ended December 31, 2017 and 2015 are primarily due to the deferred tax benefit associated with future U.S. income tax rate reductions of $764 million for the year ended December 31, 2017 and the deferred tax benefit associated with future U.K. income tax rate reductions along with certain favorable settlements with various taxing authorities of $75 million for the year ended December 31, 2015. See Item 7 “- Management’s Discussion and Analysis of Financial Condition and Results of Operations - Consolidated Income Tax Provision” included elsewhere in this Annual Report for more information on these items.
|
|
(6)
|
During the year ended December 31, 2014, we sold 100% of our wholly-owned subsidiary, Euronext, in connection with Euronext’s IPO, and we sold our entire interest in
three
companies that comprised the former NYSE Technologies (NYFIX, Metabit and Wombat). We treated the sale of these entities as discontinued operations for all periods presented from their acquisition on November 13, 2013 to their dispositions.
|
|
(7)
|
Our results include certain items that are not reflective of our cash operations and core business performance. Excluding these items, net of taxes, net income attributable to ICE for the year ended
December 31, 2017
would have been
$1.8 billion
; and, basic earnings per share and diluted earnings per share attributable to ICE common shareholders would have been
$2.97
and
$2.95
, respectively. See Item 7 “- Management’s Discussion and Analysis of Financial Condition and Results of Operations - Non-GAAP Financial Measures” included elsewhere in this Annual Report for more information on these items and the Non-GAAP results for the other years.
|
(8) The weighted average common shares outstanding increased in 2016 primarily due to the stock issued for the Interactive Data and Trayport acquisitions and increased in 2014 primarily due to stock issued for the NYSE acquisition. We issued
211.9 million
shares of our common stock to NYSE stockholders,
32.3 million
shares of our common stock to Interactive Data stockholders and
12.6 million
shares of our common stock to Trayport stockholders, weighted to show these additional shares outstanding for all periods after the respective acquisition dates.
|
As of December 31,
|
|||||||||||||||||||
|
2017
|
2016
|
2015
|
2014
|
2013
|
|||||||||||||||
|
(In millions)
|
|||||||||||||||||||
|
Consolidated Balance Sheet Data
|
|||||||||||||||||||
|
Cash and cash equivalents
|
$
|
535
|
|
$
|
407
|
|
$
|
627
|
|
$
|
652
|
|
$
|
961
|
|
||||
|
Margin deposits, guaranty funds and delivery contracts receivable
(2)
|
51,222
|
|
55,150
|
|
51,169
|
|
47,458
|
|
42,216
|
|
|||||||||
|
Total current assets
|
53,562
|
|
57,133
|
|
53,313
|
|
50,232
|
|
44,269
|
|
|||||||||
|
Goodwill and other intangible assets, net
(1)
|
22,485
|
|
22,711
|
|
22,837
|
|
16,315
|
|
18,512
|
|
|||||||||
|
Total assets
|
78,264
|
|
82,003
|
|
77,987
|
|
68,254
|
|
64,422
|
|
|||||||||
|
Margin deposits, guaranty funds and delivery contracts payable
(2)
|
51,222
|
|
55,150
|
|
51,169
|
|
47,458
|
|
42,216
|
|
|||||||||
|
Total current liabilities
|
54,171
|
|
58,617
|
|
54,743
|
|
50,436
|
|
44,321
|
|
|||||||||
|
Short-term and long-term debt
(1)
|
6,100
|
|
6,364
|
|
7,308
|
|
4,277
|
|
5,058
|
|
|||||||||
|
Equity
(1)
|
16,952
|
|
15,754
|
|
14,840
|
|
12,392
|
|
12,381
|
|
|||||||||
|
(1)
|
The increases in our equity, goodwill and other intangible assets, and debt as of December 31, 2015 primarily relates to our acquisition of Interactive Data. Refer to notes 3, 8 and 10 to our consolidated financial statements and related notes, which are included elsewhere in this Annual Report, for more information on these items.
|
39
|
(2)
|
Clearing members of our clearing houses are required to deposit original margin and variation margin and for our clearing houses other than NGX, to make deposits to a guaranty fund. The cash deposits made to these margin accounts and to the guaranty fund are recorded in the consolidated balance sheet as current assets with corresponding current liabilities to the clearing members that deposited them. We also account for the physical delivery of our energy contracts for NGX following its acquisition in December 2017. Refer to note 13 to our consolidated financial statements and related notes, which are included elsewhere in this Annual Report, for more information on these items.
|
|
ITEM 7.
|
MANAGEMENT’S DISCUSSION AND ANALYSIS OF FINANCIAL CONDITION AND RESULTS OF OPERATIONS
|
The following discussion contains forward-looking statements that involve risks and uncertainties. Our actual results could differ materially from those anticipated in these forward-looking statements for many reasons. See the factors set forth under the heading
“
Forward Looking Statements” at the beginning of Part 1 of this Annual Report and in Item 1(A) under the heading “Risk Factors.” The following discussion is qualified in its entirety by, and should be read in conjunction with, the more detailed information contained in Item 6 “Selected Financial Data” and our consolidated financial statements and related notes included elsewhere in this Annual Report.
Overview
We are a leading global operator of regulated exchanges, clearing houses and listings venues, and a provider of data services for commodity, fixed income and equity markets. We operate regulated marketplaces for listing, trading and clearing of a broad array of derivatives and securities contracts across major asset classes, including energy and agricultural commodities, interest rates, equities, equity derivatives, ETFs, credit derivatives, bonds and currencies. We also offer end-to-end data services and solutions to support the trading, investment, risk management and connectivity needs of customers around the world across all major asset classes.
Our exchanges include derivative exchanges in the U.S., U.K., EU, Canada and Singapore, and cash equities, equity options and bond exchanges in the U.S. We also operate OTC markets for physical energy and CDS trade execution. To serve global derivatives markets, we operate central counterparty clearing houses in the U.S., U.K., EU, Canada and Singapore. We offer a range of data services for global financial and commodity markets, including pricing and reference data, exchange data, analytics, feeds, desktops and connectivity solutions. Through our markets, clearing houses, listings and market data services, we provide end-to-end solutions for our customers through liquid markets, benchmark products, access to capital markets, and related services to support their ability to manage risk and raise capital. Our business is currently conducted as two reportable business segments, our Trading and Clearing segment and our Data and Listings segment, and the majority of our identifiable assets are located in the U.S. and U.K.
Recent Developments
U.S. Tax Cuts and Jobs Act
On December 22, 2017, the Tax Cuts and Jobs Act, or TCJA, was signed into law. The TCJA reduced the U.S. corporate income tax rate from
35%
to
21%
effective January 1, 2018. We are required to revalue our U.S. deferred tax assets and liabilities at the new federal corporate income tax rate as of the date of enactment of the TCJA and to include the rate change effect in the tax provision for the period ended December 31, 2017. As a result, we recognized a
$764 million
deferred tax benefit based on a reasonable estimate of the deferred tax assets and liabilities as of December 22, 2017. This significantly reduced the effective tax rate for the period ended December 31, 2017 in comparison to the effective tax rates for the last two comparable periods. As part of U.S. international tax reform, the TCJA imposes a transition tax on certain accumulated foreign earnings aggregated across all non-U.S. subsidiaries, net of foreign deficits. As we are in an aggregate net foreign deficit position for U.S. tax purposes, we are not liable for the transition tax. See “- Consolidated Income Tax Provision” below.
Divestiture of Trayport and the Acquisitions of NGX and Shorcan Energy
On December 11, 2015, we acquired
100%
of Trayport in a stock transaction. The total purchase price was
$620 million
, comprised of
12.6 million
shares of our common stock. Trayport is a software company that licenses its technology to serve exchanges, OTC brokers and traders to facilitate electronic and hybrid trade execution primarily in the energy markets.
The CMA undertook a review of our acquisition of Trayport under the merger control laws of the U.K. In October 2016, the CMA issued its findings and ordered a divestment of Trayport to remedy what the CMA determined to be a substantial lessening of competition. In November 2016, we filed an appeal with the U.K. Competition Appeal Tribunal, or the CAT, to challenge the CMA’s decision. In March 2017, the CAT upheld the CMA decision that we should divest Trayport. Following the CAT’s judgment, we asked for leave to appeal the CAT’s decision at the U.K. Court of Appeals. In May 2017, the U.K. Court of Appeals denied our request for leave to appeal and we were obligated to sell Trayport by January 2018.
40
On December 14, 2017, we sold Trayport to TMX Group for
£550 million
(
$733 million
based on the pound sterling/U.S. dollar exchange rate of
1.3331
as of December 14, 2017). We recognized a net gain of
$110 million
on the divestiture of Trayport, which was recorded as other income within our Data and Listings segment in the consolidated statements of income for the year ended
December 31, 2017
. The net gain is equal to the
$733 million
in gross proceeds received less the adjusted carrying value of Trayport’s net assets of
$607 million
(which is equal to the
$531 million
carrying value of Trayport plus
$76 million
in accumulated other comprehensive loss from foreign currency translation) and less
$16 million
in costs to sell Trayport.
The gross proceeds included a combination of
£350 million
($466 million) in cash and
£200 million
($267 million) in value relating to our acquisitions of NGX and Shorcan Energy, both wholly-owned subsidiaries of TMX Group. Trayport was included in our Data and Listings segment and NGX and Shorcan Energy are included in our Trading and Clearing segment. NGX, headquartered in Calgary, provides electronic execution, central counterparty clearing and data services to the North American natural gas, electricity and oil markets. Shorcan Energy offers brokerage services for the North American crude oil markets.
The functional currency of Trayport was the pound sterling, as this was the currency in which Trayport operated. The
$620 million
in Trayport net assets were recorded on our December 11, 2015 opening balance sheet at a pound sterling/U.S. dollar exchange rate of
1.5218
(
£407 million
). Because our consolidated financial statements are presented in U.S. dollars, we translated the Trayport net assets into U.S. dollars at the exchange rates in effect at the end of each reporting period. Therefore, increases or decreases in the value of the U.S. dollar against the pound sterling affected the value of the Trayport balance sheet, with gains or losses included in the cumulative translation adjustment account, a component of equity. As a result of the decrease in the pound sterling/U.S. dollar exchange rate to
1.3331
as of December 14, 2017, the portion of our equity attributable to the Trayport net assets in accumulated other comprehensive loss from foreign currency translation was
$76 million
. In connection with the divestiture on December 14, 2017, the
$76 million
in the Trayport foreign currency translation loss was reclassified out of accumulated other comprehensive loss and recognized as part of the net gain on the divestiture as discussed above.
As of June 30, 2017, we classified Trayport as held for sale and ceased depreciation and amortization of the property and equipment and other intangible assets. Subsequent to its divestiture on December 14, 2017, there are no longer any Trayport assets and liabilities classified as held for sale.
Acquisition of BondPoint
On January 2, 2018, we acquired
100%
of BondPoint from Virtu Financial, Inc. for
$400 million
in cash. BondPoint is a leading provider of electronic fixed income trading solutions for the buy-side and sell-side offering access to centralized liquidity and automated trade execution services through its ATS and provides trading services to more than 500 financial services firms.
Investment in Euroclear
On October 24, 2017, we acquired a
4.7%
stake in Euroclear for
€275 million
in cash (
$327 million
based on the euro/U.S. dollar exchange rate of 1.1903 as of October 24, 2017). During December 2017, we reached an agreement to buy an additional
5.1%
stake in Euroclear for
€243 million
in cash (
$292 million
based on the euro/U.S. dollar exchange rate of 1.2003 as of December 31, 2017) and expect to receive necessary regulatory approval during the first quarter of 2018. Upon closing, we will own a 9.8% stake in Euroclear for a total investment of €518 million ($619 million based on the exchange rates above). Euroclear is a leading provider of post-trade services, including settlement, central securities depositories and related services for cross-border transactions across asset classes.
Acquisition of Global Research Division
’
s Index Business from BofAML
On October 20, 2017, we acquired BofAML’s Global Research division’s index business. BofAML indices are the second largest group of fixed income indices as measured by AUM globally. The AUM benchmarked against our combined fixed income indices is nearly
$1 trillion
, and the indices have been re-branded as the ICE BofAML indices.
Purchase of Minority Interests
During June 2017, we purchased both N.V. Nederlandse Gasunie’s, or Gasunie,
21%
minority ownership interest in ICE Endex and ABN AMRO Clearing Bank N.V.’s, or ABN AMRO Clearing,
25%
minority ownership interest in ICE Clear Netherlands. Subsequent to these acquisitions, we own
100%
of ICE Endex and ICE Clear Netherlands and will no longer include any non-controlling interest amounts for ICE Endex and ICE Clear Netherlands in our consolidated financial statements. During the year ended December 31, 2017, we purchased
12.6%
of the net profit sharing interest in our CDS clearing subsidiaries from several non-ICE limited partners and the remaining non-ICE limited partners hold a
29.9%
net profit sharing interest in our CDS clearing subsidiaries as of December 31, 2017. See “- Consolidated Non-Operating Income (Expense)” below.
41
Divestiture of NYSE Governance Services
On June 1, 2017, we sold NYSE Governance Services to Marlin Heritage, L.P. NYSE Governance Services provides governance and compliance analytics and education solutions for organizations and their boards of directors through dynamic learning solutions. We recognized a net loss of
$6 million
on the divestiture of NYSE Governance Services, which was recorded as amortization expense within our Data and Listings segment in the accompanying consolidated statements of income for the year ended
December 31, 2017
.
Acquisition of TMX Atrium
On May 1, 2017, we acquired
100%
of TMX Atrium, a global extranet and wireless services business, from TMX Group. TMX Atrium provides low-latency access to markets and market data across
12
countries, more than
30
major trading venues, and ultra-low latency wireless connectivity to access markets and market data in the Toronto, New Jersey and Chicago metro areas. The wireless assets consist of microwave and millimeter networks that transport market data and provide private bandwidth. TMX Atrium is now part of ICE Data Services and is being integrated with our connectivity services.
Divestiture of Interactive Data Managed Solutions
On March 31, 2017, we sold Interactive Data Managed Solutions, or IDMS, a unit of Interactive Data, to FactSet. IDMS is a managed solutions and portal provider for the global wealth management industry. There was
no
gain or loss recognized on the sale of IDMS.
Cetip Investment Gain
Until March 29, 2017, we held a 12% ownership interest in Cetip, which we classified as an available-for-sale long-term investment. On March 29, 2017, Cetip and BM&FBOVESPA S.A. finalized a merger agreement. BM&FBOVESPA S.A., which changed its name to B3 S.A. - Brasil, Bolsa, Balcao, or B3, following the merger with Cetip, is a stock exchange and operator of registration, clearing, custodial and settlement services for equities, financial securities, indices, rates, commodities and currencies and is located in São Paulo, Brazil. The merger valued our Cetip investment at $500 million. We received the proceeds in cash and in B3 common stock.
The cash component was valued at $319 million, which was subject to Brazilian capital gains tax of $28 million that was remitted to the Brazilian tax authorities in March 2017. We received net cash proceeds in April 2017 of $286 million, which is net of a foreign exchange loss of $6 million that was incurred in April 2017. We received 29,623,756 B3 common shares valued at their quoted market price of $181 million. In April 2017, we sold the B3 common shares for net proceeds of $152 million, which is net of a capital gain tax of $26 million that was remitted to the Brazilian tax authorities and further transaction expenses of $3 million that were incurred in April 2017. We used the $438 million in net cash and stock proceeds received from the merger and sale of B3 shares to pay down amounts outstanding under our U.S. dollar commercial paper program, or the Commercial Paper Program, and for share repurchases.
The $500 million fair value of our investment in Cetip included an accumulated unrealized gain of $176 million, based on the $324 million cost basis. In connection with the sale of our equity investment in Cetip, the $176 million accumulated unrealized gain was reclassified out of accumulated other comprehensive income and was recognized in other income as a realized investment gain in the consolidated statement of income for the year ended December 31, 2017. Refer to note 6 to our consolidated financial statements and related notes, which are included elsewhere in this Annual Report, for more information on the Cetip investment gain.
Acquisition of National Stock Exchange
On January 31, 2017, we acquired
100%
of National Stock Exchange, Inc., now named NYSE National. The acquisition gives the NYSE Group a fourth U.S. exchange license. NYSE National is distinct from NYSE Group’s three listings exchanges because NYSE National will only be a trading venue and will not be a listings market. NYSE Group’s three listings exchanges, NYSE, NYSE American and NYSE Arca, have unique market models designed for corporate and ETF issuers. After closing the transaction, NYSE National ceased operations on February 1, 2017. Subject to regulatory approvals, NYSE Group anticipates re-launching operations on NYSE National, Inc. in the second quarter of 2018.
42
Consolidated Financial Highlights
The following charts and table summarize our results and significant changes in our consolidated financial performance for the periods presented (dollars in millions, except per share amounts):
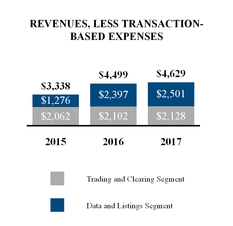

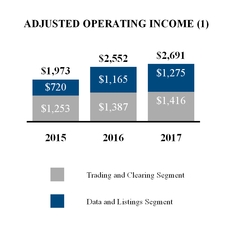
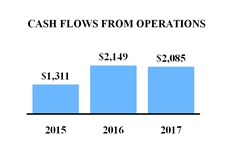
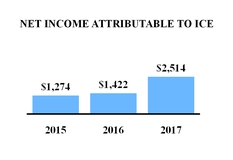
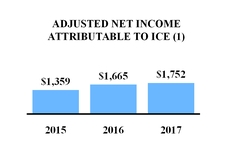
|
Year Ended December 31,
|
Year Ended December 31,
|
||||||||||||||||||||
|
2017
|
2016
|
Change
|
2016
|
2015
|
Change
|
||||||||||||||||
|
Revenues, less transaction-based expenses
|
$
|
4,629
|
|
$
|
4,499
|
|
3
|
%
|
$
|
4,499
|
|
$
|
3,338
|
|
35
|
%
|
|||||
|
Operating expenses
|
$
|
2,250
|
|
$
|
2,332
|
|
(3
|
)%
|
$
|
2,332
|
|
$
|
1,588
|
|
47
|
%
|
|||||
|
Adjusted operating expenses
(1)
|
$
|
1,938
|
|
$
|
1,947
|
|
—
|
%
|
$
|
1,947
|
|
$
|
1,365
|
|
43
|
%
|
|||||
|
Operating income
|
$
|
2,379
|
|
$
|
2,167
|
|
10
|
%
|
$
|
2,167
|
|
$
|
1,750
|
|
24
|
%
|
|||||
|
Adjusted operating income
(1)
|
$
|
2,691
|
|
$
|
2,552
|
|
5
|
%
|
$
|
2,552
|
|
$
|
1,973
|
|
29
|
%
|
|||||
|
Operating margin
|
51
|
%
|
48
|
%
|
3 pts
|
|
48
|
%
|
52
|
%
|
(4 pts)
|
|
|||||||||
|
Adjusted operating margin
(1)
|
58
|
%
|
57
|
%
|
1 pt
|
|
57
|
%
|
59
|
%
|
(2 pts)
|
|
|||||||||
|
Other income (expense), net
|
$
|
138
|
|
(138
|
)
|
n/a
|
|
(138
|
)
|
(97
|
)
|
42
|
%
|
||||||||
|
Income tax expense (benefit)
|
$
|
(25
|
)
|
$
|
580
|
|
n/a
|
|
$
|
580
|
|
$
|
358
|
|
62
|
%
|
|||||
|
Effective tax rate
|
(1
|
)%
|
29
|
%
|
(30 pts)
|
|
29
|
%
|
22
|
%
|
7 pts
|
|
|||||||||
|
Net income attributable to ICE
|
$
|
2,514
|
|
$
|
1,422
|
|
77
|
%
|
$
|
1,422
|
|
$
|
1,274
|
|
12
|
%
|
|||||
|
Adjusted net income attributable to ICE
(1)
|
$
|
1,752
|
|
$
|
1,665
|
|
5
|
%
|
$
|
1,665
|
|
1,359
|
|
23
|
%
|
||||||
|
Diluted earnings per share attributable to ICE common shareholders
|
$
|
4.23
|
|
$
|
2.37
|
|
78
|
%
|
$
|
2.37
|
|
$
|
2.28
|
|
4
|
%
|
|||||
|
Adjusted diluted earnings per share attributable to ICE common shareholders
(1)
|
$
|
2.95
|
|
$
|
2.78
|
|
6
|
%
|
$
|
2.78
|
|
$
|
2.43
|
|
14
|
%
|
|||||
|
Cash flows from operating activities
|
$
|
2,085
|
|
$
|
2,149
|
|
(3
|
)%
|
$
|
2,149
|
|
$
|
1,311
|
|
64
|
%
|
|||||
(1)
The adjusted numbers in the charts and table above are calculated by excluding items that are not reflective of our cash operations and core business performance, and for adjusted net income attributable to ICE and adjusted diluted earnings per share attributable to ICE common shareholders, are presented net of taxes. As a result, these adjusted numbers are not calculated in accordance with GAAP. See “- Non-GAAP Financial Measures” below.
|
•
|
Revenues, less transaction-based expenses, increased $130 million for the year ended
December 31, 2017
, from the comparable period in
2016
. See “- Trading and Clearing Segment” and “Data and Listings Segment” below for a discussion of the significant changes in our revenues. The increase in revenues includes $22 million in unfavorable foreign exchange effects
|
43
arising from the strengthening U.S. dollar for the year ended
December 31, 2017
, from the comparable period in
2016
. See Item 7(A) “- Quantitative and Qualitative Disclosures About Market Risk - Foreign Currency Exchange Rate Risk” below for additional information on the impact of currency fluctuations.
|
•
|
Revenues, less transaction-based expenses, increased $1.2 billion for the year ended December 31, 2016, from the comparable period in 2015, primarily due to our acquisitions of Interactive Data, Trayport, Securities Evaluations and Credit Market Analysis, and to a lesser extent, revenue increases in our exchange-related data services and Brent crude and agricultural transaction and clearing. We recognized $1.1 billion in Interactive Data, Trayport, Securities Evaluations and Credit Market Analysis data services revenues for the year ended December 31, 2016, compared to $50 million in Interactive Data and Trayport data services revenues for the year ended December 31, 2015, subsequent to their acquisitions in December 2015. The increase in revenues includes $59 million in unfavorable foreign exchange effects arising from the strengthening U.S. dollar for the year ended December 31, 2016, from the comparable period in 2015.
|
|
•
|
Operating expenses decreased $82 million for the year ended
December 31, 2017
, from the comparable period in
2016
. During the year ended December 31,
2016
, we recorded a $33 million Creditex customer relationship intangible asset impairment. See “- Consolidated Operating Expenses” below for a discussion of the other significant changes in our operating expenses. The decrease in operating expenses includes $14 million in favorable foreign exchange effects arising from the strengthening U.S. dollar for the year ended
December 31, 2017
, from the comparable period in
2016
.
|
|
•
|
Operating expenses increased $744 million for the year ended December 31, 2016, from the comparable period in
2015
, primarily due to increased operating expenses relating to Interactive Data, Trayport, Securities Evaluations and Credit Market Analysis and $33 million relating to the Creditex customer relationship intangible asset impairment recorded in September 2016. Excluding acquisition-related transaction and integration costs, we recognized $812 million in Interactive Data, Trayport, Securities Evaluations and Credit Market Analysis operating expenses for the year ended December 31, 2016, compared to $39 million in Interactive Data and Trayport operating expenses for the year ended December 31, 2015, subsequent to their acquisitions in December 2015. These increases were partially offset by decreases in professional services expenses and selling, general and administrative expenses for the year ended December 31, 2016, from the comparable period in 2015. Also partially offsetting the operating expense increases were favorable foreign exchange effects of $40 million arising from the strengthening U.S. dollar for the year ended December 31, 2016, from the comparable period in
2015
.
|
|
•
|
In connection with Cetip’s merger with BM&FBOVESPA S.A., now B3, we recognized a $167 million net realized investment gain in other income, net for the year ended
December 31, 2017
. We also recognized a net gain of $110 million in connection with our divestiture of Trayport in other income (expense), net for the year ended
December 31, 2017
. See “- Recent Developments” above.
|
|
•
|
The lower effective tax rates and income tax expense (benefit) for the years ended December 31, 2017 and 2015 are primarily due to the deferred tax benefit associated with future U.S. income tax rate reductions of $764 million for the year ended December 31, 2017 and the deferred tax benefit associated with future U.K. income tax rate reductions along with certain favorable settlements with various taxing authorities of $75 million for the year ended December 31, 2015. See “- Consolidated Income Tax Provision” below.
|
Business Environment and Market Trends
Our business environment has been characterized by industry consolidation and increasing competition among global markets for trading, clearing and listings; the globalization of exchanges, customers and competitors; market participants’ rising demand for speed, data capacity and connectivity, which requires ongoing investment in technology; evolving and disparate regulation across multiple jurisdictions; and increasing focus on capital and cost efficiencies.
Price volatility increases the need to hedge risk and creates demand among market participants for the exchange of risk through trading and clearing. Market liquidity is one of the primary market attributes for attracting and maintaining customers and is an important indicator of a market’s strength. In addition, the ability to evolve existing products to serve emerging needs, develop new products and respond to competitive dynamics in pricing, exclusivity and consolidation is important to our business. Changes in these and other factors could cause our revenues to fluctuate from period to period and these fluctuations may affect the reliability of period to period comparisons of our revenues and operating results. For additional information regarding the factors that affect our results of operations, see Item 1(A) “- Risk Factors” included elsewhere in this Annual Report.
The implementation of new laws or regulations or the uncertainty around potential changes may impact participation in our markets, or the demand for our clearing and data services either favorably or unfavorably. Many of the recent changes with regard to global financial reform have emphasized the importance of transparent markets, centralized clearing and access to data, all of which are important aspects of our product offering. However, some of the proposed rules have yet to be implemented and some rules that have already been partially implemented on January 3, 2018 are being reconsidered. In addition, some of the global regulations have
44
not been fully harmonized and several of the MiFID II regulations are inconsistent with U.S. rules. As this is established, legislative and regulatory actions may change the way we conduct our business and may create uncertainty for market participants, which could affect trading volumes or demand for market data. As a result, it is difficult to predict all of the effects that the legislation and its implementing regulations will have on us. As discussed more fully in Item 1 “- Business - Regulation” included elsewhere in this Annual Report, the implementation of MiFID II and other regulations may result in operational, regulatory and/or business risk.
In recent years, low interest rates and uncertainty in the financial markets continued to reflect the impact of a relatively slow or yet to occur global economic recovery. Lower growth in Asia and the EU may also continue to affect global financial markets. In addition, economic and regulatory uncertainty, coupled with periods of high market volatility around geopolitical events, low interest rates and low natural gas prices, has affected our clients’ activities in recent years. The duration of these trends will determine the continued impact on our business across trading and listings. We have diversified our business so that we are not dependent on volatility or trading activity in any one asset class. In addition, we have increased our portion of non-transaction and clearing revenues from 21% in 2013 to 58% in 2017. This non-transaction revenue includes data services, listings and other revenues. We continue to focus on our strategy to grow each of our revenue streams, as well as on our company-wide expense reduction initiatives and our synergies in connection with our acquisitions in order to mitigate these uncertainties and to build on our growth opportunities by leveraging our proprietary data, clearing and markets.
Many of the data products and services we sell are required for our clients’ business operations regardless of market volatility or shifts in business profitability levels. We anticipate that there will continue to be growth in the financial information services sector driven by a number of global trends, including the following: increasing global regulatory demands; greater use of fair value accounting standards and reliance on independent valuations; greater emphasis on risk management; market fragmentation driven by regulatory changes; the move to passive investing and indexation; ongoing growth in the size and diversity of financial markets; increased electronification of fixed income and other less automated markets; the development of new data products; the demand for greater data capacity and connectivity; new entrants; and increasing demand for outsourced services by financial institutions. We contract with clients through data fixed-fee subscriptions, variable fees based on usage or a combination of fixed-fee subscription and usage-based fees. In addition, some of our data services generate one-time or non-recurring revenue, such as one-time purchases of historical data, set-up services or implementation fees.
Segment Reporting
We operate two business segments: our Trading and Clearing segment and our Data and Listings segment. This presentation is reflective of how our chief operating decision maker reviews and operates our business. Our Trading and Clearing segment comprises our transaction-based execution and clearing businesses. Our Data and Listings segment comprises our subscription-based data services and securities listings businesses. Our chief operating decision maker does not review total assets, intersegment revenues/expenses or statements of income below operating income by segments; therefore, such information is not presented below.
While revenues are allocated directly to segments, a significant portion of our operating expenses are not solely related to a specific segment because the expenses serve functions that are necessary for the operation of both segments. Because these expenses do not relate to a single segment, we have employed a reasonable allocation method to allocate expenses between the segments for presentation purposes. We have elected to use a pro-rata revenue approach as the allocation method for the expenses that do not relate solely to one segment. Further, precise allocation of expenses to specific revenue streams within these segments is not reasonably possible. Accordingly, we did not allocate expenses to specific revenue streams within the segments.
Certain prior year’s segment expenses for 2016 have been reclassified to conform to our current year’s segment financial statement presentation. This reclassification increased the operating expenses for the Data and Listings segment by $55 million, while decreasing the operating expenses for the Trading and Clearing segment by the same amount.
45
Trading and Clearing Segment
The following charts and table present our selected statements of income data for our Trading and Clearing segment (dollars in millions):
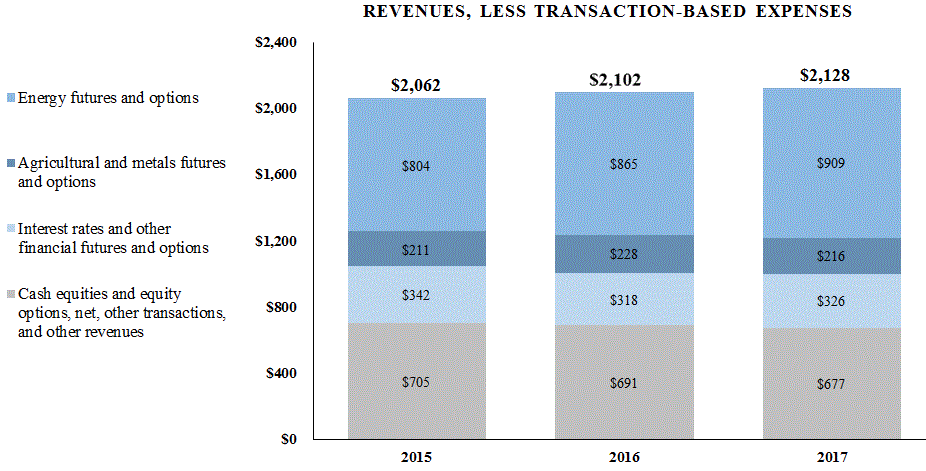
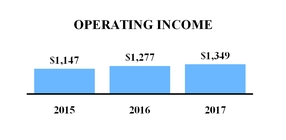
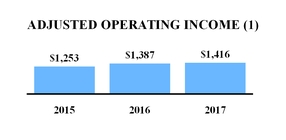
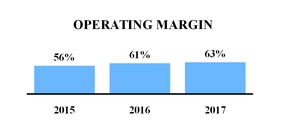
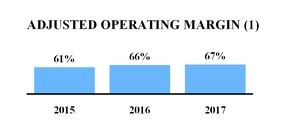
(1)
The adjusted numbers in the charts above are calculated by excluding items that are not reflective of our cash operations and core business performance. As a result, these adjusted numbers are not calculated in accordance with U.S. GAAP. See “- Non-GAAP Financial Measures” below.
46
|
Year Ended December 31,
|
Year Ended December 31,
|
||||||||||||||||||||
|
2017
|
2016
|
Change
|
2016
|
2015
|
Change
|
||||||||||||||||
|
Revenues:
|
|||||||||||||||||||||
|
Energy futures and options contracts
|
$
|
909
|
|
$
|
865
|
|
5
|
%
|
$
|
865
|
|
$
|
804
|
|
7
|
%
|
|||||
|
Agricultural and metals futures and options contracts
|
216
|
|
228
|
|
(5
|
)
|
228
|
|
211
|
|
8
|
|
|||||||||
|
Interest rates and other financial futures and options contracts
|
326
|
|
318
|
|
2
|
|
318
|
|
342
|
|
(6
|
)
|
|||||||||
|
Cash equities and equity options
|
1,491
|
|
1,780
|
|
(16
|
)
|
1,780
|
|
1,676
|
|
6
|
|
|||||||||
|
Other transactions
|
189
|
|
193
|
|
(1
|
)
|
193
|
|
195
|
|
(1
|
)
|
|||||||||
|
Transaction and clearing, net
|
3,131
|
|
3,384
|
|
(7
|
)
|
3,384
|
|
3,228
|
|
5
|
|
|||||||||
|
Other revenues
|
202
|
|
177
|
|
14
|
|
177
|
|
178
|
|
—
|
|
|||||||||
|
Revenues
|
3,333
|
|
3,561
|
|
(6
|
)
|
3,561
|
|
3,406
|
|
5
|
|
|||||||||
|
Transaction-based expenses
|
1,205
|
|
1,459
|
|
(17
|
)
|
1,459
|
|
1,344
|
|
9
|
|
|||||||||
|
Revenues, less transaction-based expenses
|
2,128
|
|
2,102
|
|
1
|
%
|
2,102
|
|
2,062
|
|
2
|
%
|
|||||||||
|
Other operating expenses
|
590
|
|
571
|
|
3
|
%
|
571
|
|
670
|
|
(15
|
)%
|
|||||||||
|
Acquisition-related transaction and integration costs
|
2
|
|
10
|
|
(83
|
)%
|
10
|
|
28
|
|
(64
|
)%
|
|||||||||
|
Depreciation and amortization (including impairment)
|
187
|
|
244
|
|
(23
|
)%
|
244
|
|
217
|
|
12
|
%
|
|||||||||
|
Operating expenses
|
779
|
|
825
|
|
(6
|
)%
|
825
|
|
915
|
|
(10
|
)%
|
|||||||||
|
Operating income
|
$
|
1,349
|
|
$
|
1,277
|
|
6
|
%
|
$
|
1,277
|
|
$
|
1,147
|
|
11
|
%
|
|||||
Transaction and Clearing Revenues
Overview
Our transaction and clearing revenues are reported on a net basis, except for the NYSE transaction-based expenses discussed below, and consist of fees collected from our derivatives, cash equities and equity options trading and derivatives clearing. In our derivatives markets, we earn transaction and clearing revenues from both counterparties to each contract that is traded and/or cleared, and in our equity and equity options markets, we receive trade execution fees as well as routing fees related to orders in our markets which are routed to other markets for execution.
Rates per-contract are driven by the number of contracts or securities traded and the fees charged per contract, net of certain rebates. Our per-contract transaction and clearing revenues will depend upon many factors, including, but not limited to, market conditions, transaction and clearing volume, product mix, pricing, applicable revenue sharing and market making agreements, and new product introductions. Because transaction and clearing revenues are generally assessed on a per-contract basis, revenues and profitability fluctuate with changes in contract volume and due to product mix.
For the years ended
December 31, 2017
,
2016
and
2015
, 20%, 19% and 20%, respectively, of our Trading and Clearing segment revenues, less transaction-based expenses, were billed in pounds sterling or euros. As the pound sterling or euro exchange rate changes, the U.S. equivalent of revenues denominated in foreign currencies changes accordingly. Due to the weakening of the pound sterling and euro the last two years compared to the U.S. dollar, our Trading and Clearing segment revenues, less transaction-based expenses, were lower by $14 million for the year ended
December 31, 2017
from the comparable period in
2016
, and were lower by $35 million for the year ended
December 31, 2016
from the comparable period in
2015
. See Item 7(A) “- Quantitative and Qualitative Disclosures About Market Risk - Foreign Currency Exchange Rate Risk” below for additional information on the impact of currency fluctuations.
Our transaction and clearing fees are presented net of rebates. We recorded rebates of $749 million, $674 million and $563 million for the years ended
December 31, 2017
,
2016
and
2015
, respectively. We offer rebates in certain of our markets primarily to support market liquidity and trading volume by providing qualified participants in those markets a discount to the applicable commission rate. Such rebates are calculated based on volumes traded. The increase in the rebates is due primarily to an increase in the number of participants in the rebate programs offered on various contracts, an increase in our traded volume and an increase in the number of rebate programs.
Commodities Markets
We operate global crude oil and refined oil futures markets, including the ICE Brent, ICE WTI and ICE Gasoil futures and options contracts, as well as over 500 refined oil futures products that relate to our benchmark futures contracts and other key price benchmarks. The ICE Brent crude contract is relied upon by a broad range of global market participants, including oil producing nations and multinational companies, to price and hedge their crude oil production and consumption. ICE Gasoil is a key refined
47
oil benchmark in Europe and Asia. Total oil volume and revenues increased 14% and 12%, respectively, for the year ended
December 31, 2017
, from the comparable period in
2016
, and increased 12% and 10%, respectively, for the year ended
December 31, 2016
, from the comparable period in
2015
. Crude oil revenues grew at a slightly lower rate due to customer and product mix.
In
2017
, ICE Brent crude futures and options contracts were traded at record levels for the twenty-first consecutive year. ICE Brent crude futures and options volume increased 15% for the year ended
December 31, 2017
, from the comparable period in
2016
, and increased 15% for the year ended
December 31, 2016
, from the comparable period in
2015
. ICE WTI crude futures and options volume increased 14% for the year ended
December 31, 2017
, from the comparable period in
2016
, and increased 16% for the year ended
December 31, 2016
, from the comparable period in
2015
. ICE Brent crude and ICE WTI crude futures and options volume increased primarily due to increased oil price volatility related to shifting supply and demand dynamics globally; broader market volatility in oil products, equities and foreign exchange rates; acts of central governments; outcomes of elections; and uncertainty around the Organization of Petroleum Exporting Countries, or OPEC, policy.
Our global natural gas futures and options volume declined 1% and revenues decreased 1% for the year ended
December 31, 2017
, from the comparable period in
2016
, respectively, and volume declined 2% and revenues increased 4% for the year ended
December 31, 2016
, from the comparable period in
2015
, respectively. Global natural gas revenues decreased in 2017 primarily due to the impact of foreign currency translation in our European natural gas products. Global natural gas volume declined in 2016 primarily due to lower price volatility related to high natural gas supplies but revenues increased due to geographic product mix.
Total volume and revenues in our agricultural and metals futures and options markets decreased 7% and 5%, respectively, for the year ended
December 31, 2017
, from the comparable period in
2016
, and increased 11% and 8%, respectively, for the year ended
December 31, 2016
, from the comparable period in
2015
. The decreases in agricultural volume in 2017 were primarily driven by the reduced price volatility in 2017 compared to the higher price volatility in 2016. The increases in agricultural volume in 2016 were primarily driven by increased price volatility due to changing supply and demand expectations largely related to weather and production levels.
Financial Markets
Interest rates and other financial futures and options volume and revenues increased 15% and 2%, respectively, for the year ended
December 31, 2017
, from the comparable period in
2016
, and volume increased 10% and revenues decreased 6%, respectively, for the year ended
December 31, 2016
, from the comparable period in
2015
. Interest rate futures and options volume increased in 2017 primarily due to expectations for heightened central bank activity during 2017, and volume increased in 2016 primarily due to uncertainty around central bank actions, economic data during 2016, and the U.K.’s decision to exit the EU. Interest rate futures and options revenues increased less than traded volumes in 2017 and in 2016 primarily due to the impact of foreign currency translation and increased market making rebates that apply at higher volume levels.
Cash equities handled volume decreased 17% for the year ended
December 31, 2017
, from the comparable period in
2016
, primarily due to a reduction in U.S. equities market volatility during 2017 compared to the prior year. Cash equities handled volume increased 6% for the year ended
December 31, 2016
, from the comparable period in
2015
, primarily due to increased market volatility throughout 2016. Cash equities revenues, net of transaction-based expenses, were $196 million, $223 million and $220 million for the years ended
December 31, 2017
,
2016
and
2015
, respectively.
Equity options volume decreased 13% for the year ended
December 31, 2017
, compared to the same period in
2016
, and decreased 5% for the year ended
December 31, 2016
, from the comparable period in
2015
. Equity options revenues, net of transaction-based expenses, were $90 million, $98 million and $112 million for the years ended
December 31, 2017
,
2016
and
2015
, respectively. Equity options volume and revenues decreased the last several years primarily due to lower U.S. equity market volatility in 2017 and the restructuring of the NYSE American Options business. While revenues declined the last several years, the overall financial contribution of equity options was consistent with the prior years due to the retention of a higher percentage of profits from NYSE American Options driven by our repurchase of the equity in the exchange from the minority shareholders.
CDS clearing revenues were $113 million, $107 million and $100 million for the years ended
December 31, 2017
,
2016
and
2015
, respectively. The notional value of CDS cleared during the same periods were $11.5 trillion, $11.5 trillion and $11.9 trillion, respectively. Buy-side participation at our U.S. CDS clearing house, ICE Clear Credit, reached record levels in terms of number of participants and notional cleared due to increased participation from both U.S. and European buy-side customers due to greater regulatory certainty, the breadth of products offered, and cost efficient margining in the U.S. relative to Europe.
CDS trade execution revenues were $27 million, $36 million and $49 million for the years ended
December 31, 2017
,
2016
and
2015
, respectively. CDS trading remains muted due to financial reform and lower volatility in corporate credit markets. The
48
decrease in the CDS trade execution revenues for the year ended
December 31, 2017
is also impacted by the sale and discontinuance of our U.S. and U.K. CDS voice brokerage operations in the third quarter of 2016.
Other Revenues
Other revenues primarily include interest income on certain clearing margin deposits, regulatory penalties and fines, fees for use of our facilities, regulatory fees charged to member organizations of our U.S. securities exchanges, designated market maker service fees, exchange membership fees and agricultural grading and certification fees. The increase in other revenues for the year ended
December 31, 2017
, from the comparable period in 2016, is primarily due to a $6 million breakup fee received in the third quarter of 2017 related to the termination of the derivatives clearing agreement with Euronext, under which ICE Clear Netherlands was to provide clearing of Euronext’s financial and commodity derivatives.
Selected Operating Data
The following charts and table present trading activity in our futures and options markets by commodity type based on the total number of contracts traded, as well as futures and options rate per contract (in millions, except for percentages and rate per contract amounts):
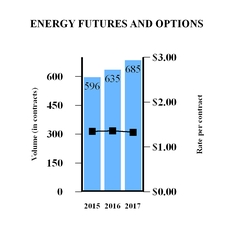
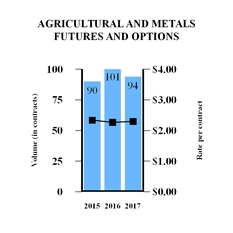
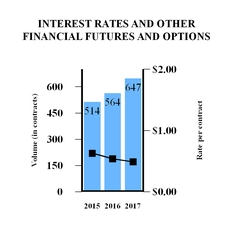
|
Volume and Rate per Contract
|
||||
|
Year Ended
December 31, |
Year Ended
December 31, |
||||||||||||||||||||
|
2017
|
2016
|
Change
|
2016
|
2015
|
Change
|
||||||||||||||||
|
Number of contracts traded:
|
|||||||||||||||||||||
|
Energy futures and options
|
685
|
|
635
|
|
8
|
%
|
635
|
|
596
|
|
7
|
%
|
|||||||||
|
Agricultural and metals futures and options
|
94
|
|
101
|
|
(7
|
)
|
101
|
|
90
|
|
11
|
|
|||||||||
|
Interest rates and other financial futures and options
|
647
|
|
564
|
|
15
|
|
564
|
|
514
|
|
10
|
|
|||||||||
|
Total
|
1,426
|
|
1,300
|
|
10
|
%
|
1,300
|
|
1,200
|
|
8
|
%
|
|||||||||
|
Rate per contract:
|
|||||||||||||||||||||
|
Energy futures and options
|
$
|
1.33
|
|
$
|
1.36
|
|
(2
|
)%
|
$
|
1.36
|
|
$
|
1.35
|
|
1
|
%
|
|||||
|
Agricultural and metals futures and options
|
$
|
2.30
|
|
$
|
2.27
|
|
1
|
%
|
$
|
2.27
|
|
$
|
2.34
|
|
(3
|
)%
|
|||||
|
Interest rates and other financial futures and options
|
$
|
0.49
|
|
$
|
0.54
|
|
(10
|
)%
|
$
|
0.54
|
|
$
|
0.63
|
|
(14
|
)%
|
|||||
Open interest is the aggregate number of contracts (long or short) that clearing members hold either for their own account or on behalf of their clients. Open interest refers to the total number of contracts that are currently open — in other words, contracts that have been traded but not yet liquidated by either an offsetting trade, exercise, expiration or assignment. Open interest is also a measure of the future activity remaining to be closed out in terms of the number of contracts that members and their clients continue to hold in the particular contract and by the number of contracts held for each contract month listed by the exchange. The following charts and table presents our year-end open interest for our futures and options contracts (in thousands, except for
49
percentages).
|
Open Interest
|
||||
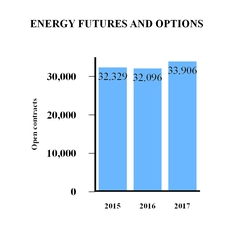
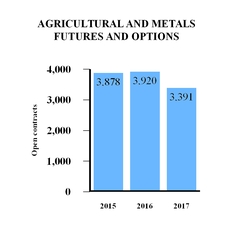
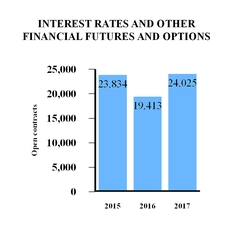
|
As of December 31,
|
As of December 31,
|
||||||||||||||||
|
2017
|
2016
|
Change
|
2016
|
2015
|
Change
|
||||||||||||
|
Open interest — in thousands of contracts:
|
|||||||||||||||||
|
Energy futures and options
|
33,906
|
|
32,096
|
|
6
|
%
|
32,096
|
|
32,329
|
|
(1
|
)%
|
|||||
|
Agricultural and metals futures and options
|
3,391
|
|
3,920
|
|
(14
|
)%
|
3,920
|
|
3,878
|
|
1
|
|
|||||
|
Interest rates and other financial futures and options
|
24,025
|
|
19,413
|
|
24
|
%
|
19,413
|
|
23,834
|
|
(19
|
)
|
|||||
|
Total
|
61,322
|
|
55,429
|
|
11
|
%
|
55,429
|
|
60,041
|
|
(8
|
)%
|
|||||
The following charts and table present selected cash and equity options trading data. All trading volume below is presented as net daily trading volume and is single counted.

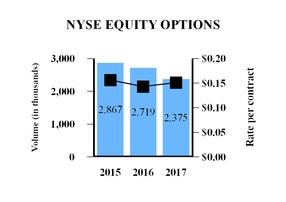
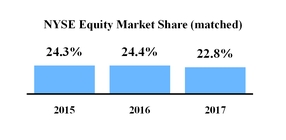
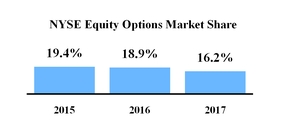
50
|
Year Ended December 31,
|
Year Ended December 31,
|
||||||||||||||||
|
2017
|
2016
|
Change
|
2016
|
2015
|
Change
|
||||||||||||
|
Cash products (shares in millions):
|
|||||||||||||||||
|
NYSE listed (Tape A) issues:
|
|||||||||||||||||
|
Handled volume
|
1,086
|
|
1,269
|
|
(14
|
)%
|
1,269
|
|
1,203
|
|
5
|
%
|
|||||
|
Matched volume
|
1,077
|
|
1,256
|
|
(14
|
)%
|
1,256
|
|
1,185
|
|
6
|
%
|
|||||
|
Total NYSE listed consolidated volume
|
3,434
|
|
3,918
|
|
(12
|
)%
|
3,918
|
|
3,685
|
|
6
|
%
|
|||||
|
Share of total matched consolidated volume
|
31.4
|
%
|
32.1
|
%
|
(0.7) pts
|
|
32.1
|
%
|
32.2
|
%
|
(0.1) pts
|
|
|||||
|
NYSE Arca, NYSE American and regional listed (Tape B) issues:
|
|||||||||||||||||
|
Handled volume
|
289
|
|
372
|
|
(22
|
)%
|
372
|
|
310
|
|
20
|
%
|
|||||
|
Matched volume
|
281
|
|
360
|
|
(22
|
)%
|
360
|
|
296
|
|
22
|
%
|
|||||
|
Total NYSE Arca, NYSE American and regional listed consolidated volume
|
1,188
|
|
1,536
|
|
(23
|
)%
|
1,536
|
|
1,355
|
|
13
|
%
|
|||||
|
Share of total matched consolidated volume
|
23.7
|
%
|
23.4
|
%
|
0.2 pts
|
|
23.4
|
%
|
21.8
|
%
|
1.6 pts
|
|
|||||
|
Nasdaq listed (Tape C) issues:
|
|||||||||||||||||
|
Handled volume
|
145
|
|
186
|
|
(22
|
)%
|
186
|
|
217
|
|
(14
|
)%
|
|||||
|
Matched volume
|
136
|
|
177
|
|
(23
|
)%
|
177
|
|
206
|
|
(14
|
)%
|
|||||
|
Total Nasdaq listed consolidated volume
|
1,921
|
|
1,907
|
|
1
|
%
|
1,907
|
|
1,894
|
|
1
|
%
|
|||||
|
Share of total matched consolidated volume
|
7.1
|
%
|
9.3
|
%
|
(2.2) pts
|
|
9.3
|
%
|
10.9
|
%
|
(1.6) pts
|
|
|||||
|
Total cash volume handled
|
1,521
|
|
1,828
|
|
(17
|
)%
|
1,828
|
|
1,730
|
|
6
|
%
|
|||||
|
Total cash market share matched
|
22.8
|
%
|
24.4
|
%
|
(1.5) pts
|
|
24.4
|
%
|
24.3
|
%
|
0.1 pts
|
|
|||||
|
Equity options (contracts in thousands):
|
|||||||||||||||||
|
NYSE equity options
|
2,375
|
|
2,719
|
|
(13
|
)%
|
2,719
|
|
2,867
|
|
(5
|
)%
|
|||||
|
Total equity options volume
|
14,697
|
|
14,391
|
|
2
|
%
|
14,391
|
|
14,793
|
|
(3
|
)%
|
|||||
|
NYSE share of total equity options
|
16.2
|
%
|
18.9
|
%
|
(2.7) pts
|
|
18.9
|
%
|
19.4
|
%
|
(0.5) pts
|
|
|||||
|
Revenue capture or rate per contract:
|
|||||||||||||||||
|
Cash products revenue capture (per 100 shares)
|
$0.051
|
$0.049
|
6
|
%
|
$0.049
|
$0.050
|
(4
|
)%
|
|||||||||
|
Equity options rate per contract
|
$0.151
|
$0.143
|
5
|
%
|
$0.143
|
$0.156
|
(8
|
)%
|
|||||||||
Handled volume represents the total number of shares of equity securities, ETFs and crossing session activity internally matched on our exchanges or routed to and executed on an external market center. Matched volume represents the total number of shares of equity securities, ETFs and crossing session activity executed on our exchanges.
For NYSE cash equities, market share declined during 2017 due to historically low volatility driving more trading to off-exchange trading venues, particularly dark pools. For NYSE equity options, market share decreased due to a strategic focus on maximizing revenues in an extremely competitive environment.
Transaction-Based Expenses
Our equities and equity options markets pay fees to the SEC pursuant to Section 31 of the Exchange Act. Section 31 fees are recorded on a gross basis as a component of transaction and clearing fee revenue. These Section 31 fees are designed to recover the government’s costs of supervising and regulating the securities markets and securities professionals. We, in turn, collect activity assessment fees, which are included in transaction and clearing revenues in our consolidated statements of income, from member organizations clearing or settling trades on the equities and options exchanges and recognize these amounts when invoiced. The activity assessment fees are designed so that they are equal to the Section 31 fees that are included in transaction-based expenses in our consolidated statements of income. As a result, activity assessment fees and the corresponding Section 31 fees do not have an impact on our net income. Activity assessment fees received are included in cash at the time of receipt and, as required by law, the amount due to the SEC is remitted semi-annually and recorded as an accrued liability until paid. As of
December 31, 2017
, the accrued liability related to the un-remitted SEC Section 31 fees was $128 million.
We also incur liquidity payments made to cash and options trading customers and routing charges made to other exchanges that are included in transaction-based expenses. We incur routing charges when we do not have the best bid or offer in the market
51
for a security that a customer is trying to buy or sell on one of our securities exchanges. In that case, we route the customer’s order to the external market center that displays the best bid or offer. The external market center charges us a fee per share (denominated in tenths of a cent per share) for routing to its system. We record routing charges on a gross basis as a component of transaction and clearing fee revenue.
Operating Expenses, Operating Income and Operating Margin
Our Trading and Clearing segment operating expenses decreased $46 million for the year ended
December 31, 2017
, from the comparable period in
2016
, and decreased $90 million for the year ended
December 31, 2016
, from the comparable period in
2015
(with the 2016 decrease being partially offset by the $33 million Creditex customer relationship intangible asset impairment expense recorded in September 2016). See “- Consolidated Operating Expenses” below for a discussion of the significant changes in our operating expenses.
Our Trading and Clearing segment operating income increased $72 million for the year ended
December 31, 2017
, from the comparable period in
2016
, and increased $130 million for the year ended
December 31, 2016
, from the comparable period in
2015
. Trading and Clearing segment operating margins were
63%
,
61%
and
56%
for the years ended
December 31, 2017
,
2016
and
2015
, respectively. The operating income and operating margin increases the last two years were driven by the revenue increases discussed above and operating expense decreases discussed below.
Our Trading and Clearing segment adjusted operating expenses were
$712 million
,
$715 million
and
$809 million
for the years ended
December 31, 2017
,
2016
and
2015
, respectively. Our Trading and Clearing segment adjusted operating income was
$1.4 billion
,
$1.4 billion
and
$1.3 billion
for the years for the years ended
December 31, 2017
,
2016
and
2015
, respectively. Our Trading and Clearing segment adjusted operating margins were
67%
,
66%
and
61%
for the years for the years ended
December 31, 2017
,
2016
and
2015
, respectively. See “- Non-GAAP Financial Measures” below.
Data and Listings Segment
The following presents our selected statements of income data for our Data and Listings segment (dollars in millions):
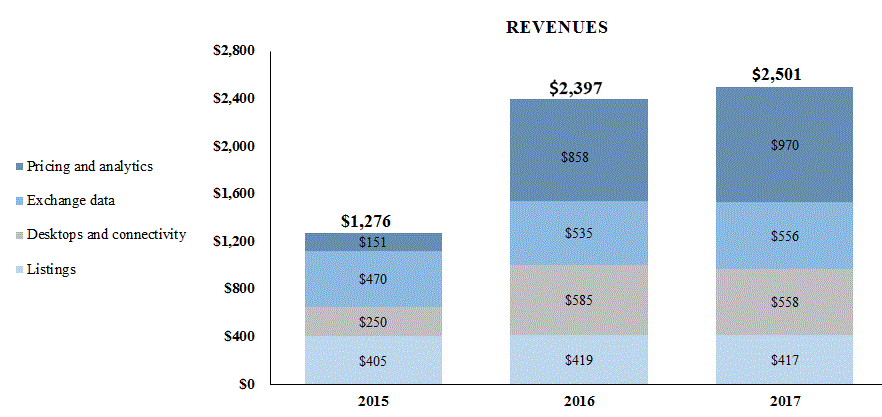
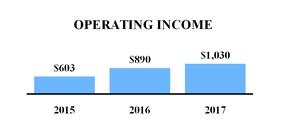
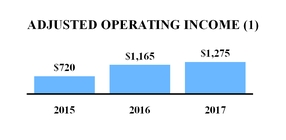
52
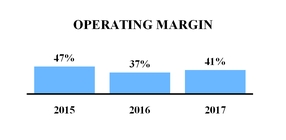
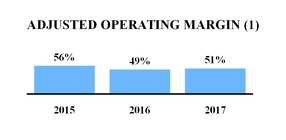
(1)
The adjusted numbers in the charts above are calculated by excluding items that are not reflective of our cash operations and core business performance. As a result, these adjusted numbers are not calculated in accordance with U.S. GAAP. See “- Non-GAAP Financial Measures” below.
|
Year Ended December 31,
|
Year Ended December 31,
|
||||||||||||||||||||
|
2017
|
2016
|
Change
|
2016
|
2015
|
Change
|
||||||||||||||||
|
Revenues:
|
|||||||||||||||||||||
|
Pricing and analytics
|
$
|
970
|
|
$
|
858
|
|
13
|
%
|
$
|
858
|
|
$
|
151
|
|
469
|
%
|
|||||
|
Exchange data
|
556
|
|
535
|
|
4
|
|
535
|
|
470
|
|
14
|
|
|||||||||
|
Desktops and connectivity
|
558
|
|
585
|
|
(5
|
)
|
585
|
|
250
|
|
134
|
|
|||||||||
|
Data services
|
2,084
|
|
1,978
|
|
5
|
|
1,978
|
|
871
|
|
127
|
|
|||||||||
|
Listings
|
417
|
|
419
|
|
—
|
|
419
|
|
405
|
|
4
|
|
|||||||||
|
Revenues
|
2,501
|
|
2,397
|
|
4
|
|
2,397
|
|
1,276
|
|
88
|
|
|||||||||
|
Other operating expenses
|
1,089
|
|
1,071
|
|
2
|
|
1,071
|
|
456
|
|
135
|
|
|||||||||
|
Acquisition-related transaction and integration costs
|
34
|
|
70
|
|
(52
|
)
|
70
|
|
60
|
|
17
|
|
|||||||||
|
Depreciation and amortization
|
348
|
|
366
|
|
(5
|
)
|
366
|
|
157
|
|
134
|
|
|||||||||
|
Operating expenses
|
1,471
|
|
1,507
|
|
(2
|
)
|
1,507
|
|
673
|
|
124
|
|
|||||||||
|
Operating income
|
$
|
1,030
|
|
$
|
890
|
|
16
|
%
|
$
|
890
|
|
$
|
603
|
|
48
|
%
|
|||||
The Data and Listings segment represents subscription-based, or recurring, revenues from data services and listings services offered across our trading and clearing businesses and ICE Data Services. Through ICE Data Services, we generate revenues from a range of market data services, including the dissemination of our exchange and evaluated pricing data and analytics, desktops, connectivity and market data. Through NYSE, NYSE American and NYSE Arca, we generate listings revenue related to the provision of listings services for public companies and ETFs, and related corporate actions for listed companies.
For the years ended
December 31, 2017
,
2016
and
2015
, 10%, 12% and 4%, respectively, of our Data and Listings segment revenues were billed in pounds sterling or euros (all relating to our data services revenues). As the pound sterling or euro exchange rate changes, the U.S. equivalent of revenues denominated in foreign currencies changes accordingly. Due to the weakening of the pound sterling and euro the last two years compared to the U.S. dollar, our data services revenues were lower by $8 million for the year ended
December 31, 2017
from the comparable period in
2016
, and were lower by $24 million for the year ended
December 31, 2016
from the comparable period in
2015
.
Data Services Revenues
Our pricing and analytics services consist of an extensive set of independent evaluated pricing services focused primarily on fixed income and international equity securities, valuation services, reference data, market data, end of day pricing, fixed income, equity portfolio analytics and risk management analytics. We also serve as an administrator of regulated benchmarks. Our index services offer a range of products across fixed income, energy, equities, ETFs and other asset classes to provide the methodology, pricing and licensing of indices and benchmarks.
Our exchange data revenues primarily represent subscription fees for the provision of our market data that is created from activity on our exchanges, which is driven by the products and technology we develop to deliver real-time views of markets and related information. In our derivatives markets, exchange data revenues relate to subscription fees charged for customer and license access from third party data vendors, or quote vendors such as Thomson Reuters Corporation and Bloomberg, and from end users, as well as view-only data access, direct access services, terminal access, daily indices, forward curves, and end of day reports.
We also earn exchange data revenues relating to our cash equity and options markets, and related data services. We collect cash trading market data fees principally for consortium-based data products and, to a lesser extent, for NYSE proprietary data
53
products. Consortium-based data fees are determined by the securities industry plans and are charged to vendors based on their redistribution of data. Consortium-based data revenues (net of administrative costs) are distributed to participating securities markets on the basis of a formula set by the SEC under Regulation NMS. Last trade prices and quotes in NYSE-listed, NYSE American-listed, and NYSE Arca-listed securities are disseminated through “Tape A” and “Tape B,” which constitute the majority of our revenues from consortium-based market data revenues.
Our desktop and connectivity services comprise technology-based information platforms, feeds and connectivity solutions. These include trading applications, desktop solutions, data feeds and infrastructure to support trading, voice brokers and investment functions. Our desktop and web-based applications deliver real-time market information, analytical and decision support tools to support trading and investment decisions. Through our consolidated feeds, clients receive market data from global exchanges, trading venues, news and data sources for exchange-traded and OTC markets. Our services offer clients a secure, resilient, private multi-participant network that provides access to global exchanges and content service providers. Our infrastructure managed services solution also offers colocation space, direct exchange access, proximity hosting and support services that enable access to real-time exchange data, and facilitates low latency, secure electronic market access.
Our data services revenues increased the last two years primarily due to the strong retention rate of existing customers, the addition of new customers, increased purchases by existing customers, the development of new and enhanced products serving the need for an expanded range of data, regulatory compliance and analytics solutions, and our acquisitions of Interactive Data and Trayport in December 2015 and of Securities Evaluations and Credit Market Analysis in October 2016. These increases were partially offset by the impact of foreign currency translation and the divestitures of IDMS and Trayport in our desktop and connectivity business. We recognized $1.1 billion in data services revenues for Interactive Data, Trayport, Securities Evaluations and Credit Market Analysis during the year ended
December 31, 2016
, compared to $50 million in data services revenues for Interactive Data and Trayport from the comparable period in
2015
, subsequent to their acquisitions dates.
Organic Annual Subscription Value
Organic Annual Subscription Value, or ASV, represents, at a point in time, the data services revenues subscribed for the succeeding twelve months. ASV does not include new sales, contract terminations or price changes that may occur during that twelve-month period. ASV also does not include certain data services revenue streams that are not subscription-based. ASV is adjusted for material acquisitions, divestitures or discontinued businesses to provide an organic view of comparable performance on a year over year basis at a beginning of the quarter. Thus, while it is an indicative forward-looking metric, it does not provide a growth forecast of the next twelve months of data services revenues.
As of
December 31, 2017
, ASV was $1.8 billion, a 6% increase compared to ASV of $1.7 billion as of
December 31, 2016
. Underpinning this growth is strength in both our pricing and analytics business and our connectivity services.
Listings Revenues
We recognize listings revenues in our securities markets from fees applicable to companies listed on our cash equities exchanges - original listing fees and annual listing fees. Original listing fees consist of two components: initial listing fees and fees related to corporate actions. Initial listing fees, subject to a minimum and maximum amount, are based on the number of shares that a company initially lists. Initial listing fees are recognized as revenue on a straight-line basis over estimated service periods of nine years for NYSE and five years for NYSE Arca and NYSE American. U.S. companies pay annual fees based on the number of outstanding shares the company has and non-U.S. companies pay annual fees based on the number of outstanding shares the company has issued or held in the U.S. Annual fees are recognized as revenue on a pro rata basis over the calendar year, and generally received as cash in the first quarter of the year.
In addition, we earn corporate actions-related listing fees in connection with actions involving the issuance of new shares, such as stock splits, rights issues and sales of additional securities, as well as mergers and acquisitions. Corporate actions-related listing fees are recognized as revenue on a straight-line basis over estimated service periods of six years for NYSE and three years for NYSE Arca and NYSE American. Unamortized balances are recorded as deferred revenue in our consolidated balance sheet.
Operating Expenses, Operating Income and Operating Margin
Our Data and Listings segment operating expenses decreased $36 million for the year ended
December 31, 2017
, from the comparable period in
2016
, and increased $834 million for the year ended
December 31, 2016
, from the comparable period in
2015
. The increase in 2016 primarily relates to $812 million in operating expenses recognized relating to Interactive Data, Trayport, Securities Evaluations and Credit Market Analysis for the year ended
December 31, 2016
, compared to $39 million in operating expenses recognized relating to Interactive Data, Trayport, Securities Evaluations and Credit Market Analysis for the comparable period in 2015 (both excluding acquisition-related transaction and integration costs). See “- Consolidated Operating
54
Expenses” below for further details on the Interactive Data, Trayport, Securities Evaluations and Credit Market Analysis operating expenses and for a discussion of the other significant changes in our operating expenses.
Our Data and Listings segment operating income increased $140 million for the year ended
December 31, 2017
, from the comparable period in
2016
, and increased $287 million for the year ended
December 31, 2016
, from the comparable period in
2015
. Data and Listings segment operating margins were
41%
,
37%
and
47%
for the years ended
December 31, 2017
,
2016
and
2015
, respectively. The operating income and operating margin increases in 2017 were driven by the revenue increases discussed above and operating expense decreases discussed below.
Our Data and Listings segment adjusted operating expenses were
$1.2 billion
,
$1.2 billion
and
$556 million
for the years ended
December 31, 2017
,
2016
and
2015
, respectively. Our Data and Listings segment adjusted operating income was
$1.3 billion
,
$1.2 billion
and
$720 million
for the years ended
December 31, 2017
,
2016
and
2015
, respectively. Our Data and Listings segment adjusted operating margins were
51%
,
49%
and
56%
for the years for the years ended
December 31, 2017
,
2016
and
2015
, respectively. See “- Non-GAAP Financial Measures” below.
Consolidated Operating Expenses
The majority of our operating expenses do not vary directly with changes in our volume and revenues, except for certain technology and communication expenses and a portion of our compensation expense that is tied directly to our data sales or overall financial performance, as discussed below. The following chart and table present our consolidated operating expenses (dollars in millions):
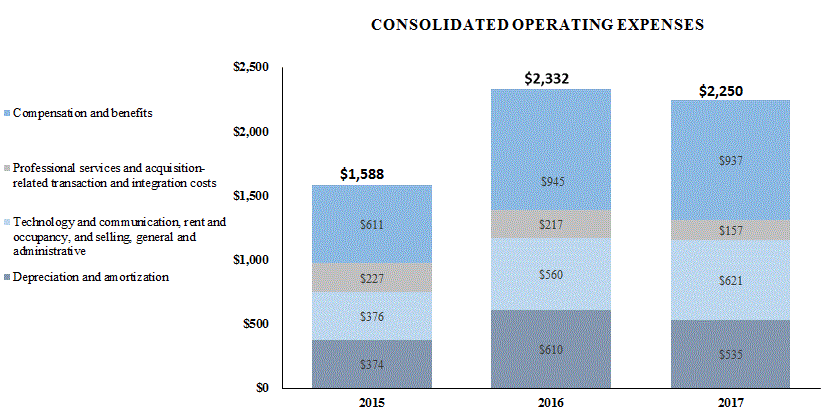
|
Year Ended
December 31, |
Year Ended
December 31, |
||||||||||||||||||||
|
2017
|
2016
|
Change
|
2016
|
2015
|
Change
|
||||||||||||||||
|
Compensation and benefits
|
$
|
937
|
|
$
|
945
|
|
(1
|
)%
|
$
|
945
|
|
$
|
611
|
|
55
|
%
|
|||||
|
Professional services
|
121
|
|
137
|
(12
|
)
|
137
|
139
|
(1
|
)
|
||||||||||||
|
Acquisition-related transaction and integration costs
|
36
|
|
80
|
(56
|
)
|
80
|
88
|
(9
|
)
|
||||||||||||
|
Technology and communication
|
397
|
|
374
|
6
|
|
374
|
203
|
84
|
|
||||||||||||
|
Rent and occupancy
|
69
|
|
70
|
(1
|
)
|
70
|
57
|
21
|
|
||||||||||||
|
Selling, general and administrative
|
155
|
|
116
|
34
|
|
116
|
116
|
—
|
|
||||||||||||
|
Depreciation and amortization
|
535
|
|
610
|
(12
|
)
|
610
|
374
|
63
|
|
||||||||||||
|
Total operating expenses
|
$
|
2,250
|
|
$
|
2,332
|
|
(3
|
)%
|
$
|
2,332
|
|
$
|
1,588
|
|
47
|
%
|
|||||
55
We expect our operating expenses to increase in absolute terms in future periods in connection with our acquisitions and growth of our business, and to vary from year to year based on the type and level of our acquisitions, our integrations and other investments.
For the years ended
December 31, 2017
,
2016
and
2015
, 14%, 18% and 12%, respectively, of our consolidated operating expenses were incurred in pounds sterling or euros. As the pound sterling or euro exchange rate changes, the U.S. equivalent of operating expenses denominated in foreign currencies changes accordingly. Due to the weakening of the pound sterling and euro the last two years compared to the U.S. dollar, our consolidated operating expenses were lower by $14 million for the year ended
December 31, 2017
from the comparable period in
2016
, and were lower by $40 million for the year ended
December 31, 2016
from the comparable period in
2015
. See Item 7(A) “- Quantitative and Qualitative Disclosures About Market Risk - Foreign Currency Exchange Rate Risk” below for additional information on the impact of currency fluctuations.
Compensation and Benefits Expenses
Compensation and benefits expense is our most significant operating expense and includes non-capitalized employee wages, bonuses, non-cash or stock compensation, certain severance costs, benefits and employer taxes. The bonus component of our compensation and benefits expense is based on both our financial performance and the individual employee performance and the performance-based restricted stock compensation expense is also based on our financial performance. Therefore, our compensation and benefits expense will vary year to year based on our financial performance and fluctuations in the number of employees.
As of
December 31, 2017
we had 4,952 employees, compared to 5,631 employees as of
December 31, 2016
and 5,549 employees as of December 31, 2015. Our employee headcount decreased as of December 31, 2017 primarily due to the divestitures in 2017 of IDMS, Trayport and NYSE Governance Services, and employee terminations in connection with our integration of Interactive Data, partially offset by the acquisitions of NGX and TMX Atrium in 2017. Our employee headcount increased as of December 31, 2016 and 2015 primarily due to acquisitions of Securities Evaluations, Credit Market Analysis, Interactive Data and Trayport during 2016 and 2015, converting contractor roles to employees at NYSE, and hiring for clearing, technology, regulation and compliance. See “- Recent Developments” above.
Compensation and benefits expenses increased for the year ended
December 31, 2016
, from the comparable period in 2015, primarily due to the increases in our employee headcount. We recognized $342 million in compensation and benefits expenses relating to the Interactive Data, Trayport, Securities Evaluations and Credit Market Analysis acquisitions during the year ended
December 31, 2016
, compared to $17 million in compensation and benefits expenses relating to the Interactive Data and Trayport acquisitions during the year ended December 31, 2015, subsequent to their acquisitions.
We recorded $17 million, $33 million and $20 million in NYSE and Interactive Data employee severance costs during the years ended
December 31, 2017
,
2016
and
2015
, respectively, with such costs included in the acquisition-related transaction and integration costs discussed below and primarily related to executive departures. In addition, we incurred non-acquisition-related employee severance costs of $21 million, $10 million and $3 million for the years ended
December 31, 2017
,
2016
and
2015
, respectively.
Non-cash compensation expenses recognized in our consolidated financial statements for employee stock options and restricted stock were $135 million, $123 million and $111 million for the years ended
December 31, 2017
,
2016
and
2015
, respectively. The increase in non-cash compensation expenses in 2017 primarily relates to the integration of the Interactive Data employees into the ICE non-cash incentive plans, and the increase in 2016 primarily relates to a greater number of employees receiving non-cash awards due to the headcount increases discussed above.
Professional Services Expenses
This expense includes fees for consulting services received on strategic and technology initiatives, temporary labor, as well as regulatory, legal and accounting fees. This expense may fluctuate as a result of changes in consulting and technology services, temporary labor, and regulatory, accounting and legal proceedings.
Professional services expenses decreased the last two years primarily due to the continued reduction in professional services and contractors at NYSE. We eliminated or replaced certain contractor positions with full-time employees at NYSE in 2016 and 2015. In addition, during the year ended
December 31, 2016
, we recorded a credit from a third party service provider related to fees charged during 2015, and we incurred lower legal fees during the year ended
December 31, 2016
, from the comparable period in 2015. Legal fees, which are included in professional services expenses, primarily related to class action lawsuits in which NYSE is a defendant. These decreases were partially offset by professional services expenses incurred by Interactive Data, Trayport, Securities Evaluations and Credit Market Analysis following their acquisitions in 2016 and 2015.
Acquisition-Related Transaction and Integration Costs
We incurred
$36 million
in acquisition-related transaction and integration costs during the year ended
December 31, 2017
, primarily relating to our integrations of Interactive Data, Securities Evaluations and Credit Market Analysis and our acquisitions of
56
BondPoint, TMX Atrium, BofAML indices and NYSE National. Of this amount, $11 million was primarily related to the acquisitions. We incurred $25 million for Interactive Data, Securities Evaluations and Credit Market Analysis integration costs during the year ended
December 31, 2017
, primarily relating to employee and lease termination costs and professional services costs.
We incurred $80 million in acquisition-related transaction and integration costs during the year ended December 31, 2016, primarily relating to our integrations of Interactive Data and NYSE, legal and professional fees related to the Trayport CMA review, our investment in MERSCORP Holdings, Inc., owner of Mortgage Electronic Registrations Systems, Inc., or collectively MERS, our acquisitions of Securities Evaluations and Credit Market Analysis, and various other potential and discontinued acquisitions. Of this amount, $41 million was primarily related to the acquisitions and other transaction costs. We incurred $39 million for Interactive Data and NYSE integration costs during the year ended December 31, 2016, primarily relating to employee and lease termination costs and professional services costs. As of December 31, 2016, the integration of NYSE has been completed and we will no longer include any NYSE integration costs in the future.
We incurred $88 million in acquisition-related transaction and integration costs during the year ended December 31, 2015, primarily relating to our acquisitions of Interactive Data and Trayport and the integration of NYSE. Of this amount, $46 million was primarily related to the acquisition costs. We incurred $42 million for NYSE integration costs during the year ended December 31, 2015, primarily relating to employee and lease termination costs and professional services costs.
We expect to continue to explore and pursue various potential acquisitions and other strategic opportunities to strengthen our competitive position and support our growth. As a result, we may incur acquisition-related transaction costs in future periods. See “- Non-GAAP Financial Measures” below.
Technology and Communication Expenses
Technology support services consist of costs for running our wholly-owned data centers, hosting costs paid to third-party data centers, and maintenance of our computer hardware and software required to support our technology. These costs are driven by system capacity, functionality and redundancy requirements. Communication expenses consist of costs for network connection for our electronic platforms, telecommunications costs, and fees paid for access to external market data. This expense also includes licensing and other fee agreement expenses which may be impacted by growth in electronic contract volume, our capacity requirements, changes in the number of telecommunications hubs and connections with customers to access our electronic platforms directly.
Technology and communications expenses increased the last two years primarily due to technology expenses incurred by Interactive Data, Trayport, Securities Evaluations and Credit Market Analysis following their acquisitions in 2016 and 2015. In addition, during the last two years, we incurred increased hardware and software support costs related to our trading and clearing platforms and our data services.
Rent and Occupancy Expenses
This expense consists of costs related to leased and owned property including rent, maintenance, real estate taxes, utilities and other related costs. We have significant operations located in and around Atlanta, New York and London with smaller offices located throughout the world. See Item 2 “- Properties” above for additional information regarding our leased and owned property.
The increase in rent and occupancy expenses for the year ended
December 31, 2016
, from the comparable period in 2015, is primarily due to rent and occupancy expenses relating to Interactive Data, Trayport, Securities Evaluations and Credit Market Analysis subsequent to their acquisitions. Excluding the impact of the acquisitions, rent and occupancy expenses decreased the last two years primarily due to reduced rent and occupancy costs realized due to the continued consolidation of our Atlanta, New York and London office locations.
Selling, General and Administrative Expenses
This expense relates to expenses from marketing, advertising, public relations, insurance, bank service charges, dues and subscriptions, travel and entertainment, non-income taxes and other general and administrative costs.
Selling, general and administrative expenses increased for the year ended
December 31, 2017
, from the comparable period in 2016, primarily due to the acquisitions of Securities Evaluations and Credit Market Analysis and $14 million in accruals relating to ongoing investigations and inquiries during the year ended
December 31, 2017
. Refer to note 14 to our consolidated financial statements and related notes, which are included elsewhere in this Annual Report, for more information on the ongoing investigations and inquiries. Selling, general and administrative expenses increased for the year ended
December 31, 2016
, from the comparable period in 2015, primarily due to selling, general and administrative expenses incurred by Interactive Data, Trayport, Securities Evaluations and Credit Market Analysis following their acquisitions in 2016 and 2015. Excluding the impact of the acquisitions, selling, general and administrative expenses decreased the last two years primarily due to the release of non-income tax-related reserves and lower marketing expenses.
57
Depreciation and Amortization Expenses
Depreciation and amortization expense results from depreciation of long-lived assets such as buildings, leasehold improvements, planes, furniture, fixtures and equipment over their estimated useful lives. This expense includes amortization of intangible assets obtained in our acquisitions of businesses, as well as on various licensing agreements, over their estimated useful lives. Intangible assets subject to amortization consist primarily of customer relationships, trading products with finite lives and technology. This expense also includes amortization of internally developed and purchased software over their estimated useful lives.
We recorded amortization expenses on the intangible assets acquired as part of our acquisitions, as well as on the other intangible assets, of $272 million, $323 million and $160 million for the years ended
December 31, 2017
,
2016
and
2015
, respectively. The decrease in the amortization expenses recorded on the intangible assets for the year ended
December 31, 2017
, from the comparable period in 2016, is primarily due to a reduction in amortization expenses recorded on intangible assets which became fully amortized (primarily related to certain of the NYSE intangible assets) and the divestitures of Trayport and NYSE Governance Services, partially offset by amortization expenses recorded on the Securities Evaluations, Credit Market Analysis, NGX and TMX Atrium intangible assets. The increase in the amortization expenses recorded on the intangible assets for the year ended
December 31, 2016
, from the comparable period in 2015, is primarily due to amortization expenses recorded on the Interactive Data, Trayport, Securities Evaluations and Credit Market Analysis intangible assets, following their acquisitions.
In addition, we recognized a net loss of $6 million on the sale of NYSE Governance Services, which was recorded in depreciation and amortization expenses for the year ended December 31, 2017 (see “- Recent Developments” above), and we recorded an impairment of the Creditex customer relationship intangible asset of $33 million, which was recorded in depreciation and amortization expenses for the year ended December 31, 2016. In August 2016, we sold certain of Creditex’s U.S. voice brokerage operations to Tullett Prebon. During the third quarter of 2016, we discontinued Creditex’s U.K. voice brokerage operations. We continue to operate Creditex’s electronically traded markets and systems, post-trade connectivity platforms and intellectual property. In connection with the divestiture of the voice brokerage business, it was determined that the carrying value of the CDS Creditex customer relationship intangible asset was not fully recoverable and an impairment of the asset was recorded in September 2016 for $33 million.
We recorded depreciation expenses on our fixed assets of $257 million, $254 million and $213 million for the years ended
December 31, 2017
,
2016
and
2015
, respectively, with the increase in 2016 primarily relating to our acquisitions of Interactive Data, Trayport, Securities Evaluations and Credit Market Analysis.
Consolidated Non-Operating Income (Expenses)
Income and expenses incurred through activities outside of our core operations are considered non-operating. The following tables present our non-operating income (expenses) (dollars in millions):
|
Year Ended
December 31, |
Year Ended
December 31, |
||||||||||||||||||||
|
2017
|
2016
|
Change
|
2016
|
2015
|
Change
|
||||||||||||||||
|
Other income (expense):
|
|||||||||||||||||||||
|
Interest expense
|
$
|
(187
|
)
|
$
|
(178
|
)
|
5
|
%
|
$
|
(178
|
)
|
$
|
(97
|
)
|
83
|
%
|
|||||
|
Other income, net
|
325
|
|
40
|
|
n/a
|
|
40
|
|
—
|
|
n/a
|
|
|||||||||
|
Total other income (expense), net
|
$
|
138
|
|
$
|
(138
|
)
|
n/a
|
|
$
|
(138
|
)
|
$
|
(97
|
)
|
42
|
%
|
|||||
|
Net income attributable to non-controlling interest
|
$
|
(28
|
)
|
$
|
(27
|
)
|
5
|
%
|
$
|
(27
|
)
|
$
|
(21
|
)
|
28
|
%
|
|||||
Interest expense increased for the year ended
December 31, 2017
, from the comparable period in
2016
, primarily due to interest expense that we recognized relating to the $1.0 billion in senior notes issued in August 2017, partially offset by the repayment of $850 million of the 2.00% senior unsecured fixed rate notes due in October 2017, or the NYSE Notes, in September 2017. Interest expense increased for the year ended
December 31, 2016
, from the comparable period in 2015, primarily due to the interest expense we recognized on the additional debt incurred to finance the Interactive Data acquisition in December 2015. See “- Debt” below.
On December 14, 2017, we sold Trayport to TMX Group for
£550 million
(
$733 million
based on the pound sterling/U.S. dollar exchange rate of
1.3331
as of December 14, 2017). We recognized a net gain of
$110 million
on the divestiture of Trayport, which was recorded as other income for the year ended
December 31, 2017
. See “- Recent Developments - Divestiture of Trayport and the Acquisitions of NGX and Shorcan Energy” above.
In connection with Cetip’s merger with BM&FBOVESPA S.A., now B3, and its subsequent sale, we recognized a $176 million realized investment gain in other income for the year ended
December 31, 2017
and we recognized $9 million in foreign exchange losses and transaction expenses in other expense for the year ended
December 31, 2017
. See “- Recent Developments - Cetip
58
Investment Gain” above. We recognized dividend income received relating to our investment in Cetip in other income, which was $5 million, $17 million and $16 million for the years ended
December 31, 2017
,
2016
and
2015
, respectively. We no longer receive any dividends from Cetip subsequent to its sale in the first quarter of 2017.
We account for our investments in MERS and The Options Clearing Corporation, or OCC, as equity method investments. We recognized $36 million, $25 million and $6 million in equity income related to these investments during the years ended
December 31, 2017
,
2016
and
2015
, respectively, as other income.
We incurred foreign currency transaction losses of $4 million, $1 million and $14 million for the years ended
December 31, 2017
,
2016
and
2015
, respectively. This was primarily attributable to the fluctuations of the pound sterling and euro relative to the U.S. dollar. Foreign currency gains and losses are recorded in other income (expense) and relate to the settlement of foreign currency assets, liabilities and payables that occur through our foreign operations that are received in non-functional currencies due to the increase or decrease in the period-end foreign currency exchange rates between periods. See Item 7A “- Quantitative and Qualitative Disclosures About Market Risk - Foreign Currency Exchange Rate Risk” included elsewhere in this Annual Report for more information on these items.
We recognized interest income on our investments of $8 million, $3 million and $6 million during the years ended
December 31, 2017
,
2016
and
2015
, respectively, which were recorded as other income. During the year ended
December 31, 2015
, we incurred $15 million in settlements and accruals for various outstanding legal matters (net of insurance proceeds), which was recorded in other expense.
For consolidated subsidiaries in which our ownership is less than 100%, and for which we have control over the assets, liabilities and management of the entity, the outside stockholders’ interests are shown as non-controlling interest in our consolidated financial statements. As of December 31, 2016, non-controlling interest included those related to the operating results of our CDS clearing subsidiaries in which non-ICE limited partners held a 42.5% net profit sharing interest; ICE Endex in which Gasunie held a 21% ownership interest; and ICE Clear Netherlands in which ABN AMRO Clearing held a 25% ownership interest. For both ICE Endex and ICE Clear Netherlands, in addition to the non-controlling interest reported in the consolidated statements of income, we reported redeemable non-controlling interest in the consolidated balance sheets which represents the minority interest redemption fair value for each company.
During June 2017, we purchased both Gasunie’s
21%
minority ownership interest in ICE Endex and ABN AMRO Clearing’s
25%
minority ownership interest in ICE Clear Netherlands. Subsequent to these acquisitions, we own
100%
of ICE Endex and ICE Clear Netherlands and will no longer include any non-controlling interest amounts for ICE Endex and ICE Clear Netherlands in our consolidated financial statements. During the year ended December 31, 2017, we purchased
12.6%
of the net profit sharing interest in our CDS clearing subsidiaries from several non-ICE limited partners and the remaining non-ICE limited partners hold a
29.9%
net profit sharing interest in our CDS clearing subsidiaries as of December 31, 2017.
Consolidated Income Tax Provision
Consolidated income tax expense (benefit) was
$(25) million
,
$580 million
and
$358 million
for the years ended
December 31, 2017
,
2016
and
2015
, respectively. The change in consolidated income tax expense (benefit) between years is primarily due to the tax impact of changes in our pre-tax income and the changes in our effective tax rate each year. Our effective tax rate was
(1)%
,
29%
and
22%
for the years ended
December 31, 2017
,
2016
and
2015
, respectively. The effective tax rates for the years ended
December 31, 2017
,
2016
and
2015
are lower than the federal statutory rate primarily due to favorable U.S. and U.K. tax law changes and favorable foreign income tax rate differentials, partially offset by state income taxes. Favorable foreign income tax rate differentials result primarily from lower income tax rates in the U.K. and various other lower tax jurisdictions as compared to the historical income tax rates in the U.S.
During the fourth quarter of 2015, the U.K. reduced their corporate income tax rate from
20%
to
19%
effective April 1, 2017 and to
18%
effective April 1, 2020. During the third quarter of 2016, the U.K. further reduced their corporate income tax rate from
18%
to
17%
effective April 1, 2020. During December 2017, the TCJA reduced the U.S. corporate income tax rate from
35%
to
21%
effective January 1, 2018. See “- Recent Developments” above. The reduction in U.S. and U.K. corporate income tax rates resulted in deferred tax benefits in the respective periods of enactment. The impact of the deferred tax benefits for the U.S. and U.K. corporate income tax rate reductions for the years ended
December 31, 2017
,
2016
and
2015
lowered the effective tax rates by
30%
,
2%
and
4%
, respectively, and resulted in deferred tax benefits of
$764 million
,
$34 million
and
$60 million
, respectively.
The decrease in the effective tax rate for the year ended
December 31, 2017
, from the comparable period in
2016
, is primarily due to the deferred tax benefit associated with the future U.S. income tax rate reduction and tax benefits associated with a divestiture in the second quarter of 2017, partially offset by the deferred tax benefit from the U.K. corporate income tax reduction in the third quarter of 2016, additional tax expense from an Illinois corporate income tax rate increase enacted in the third quarter of 2017, and an income tax expense increase due to a relatively higher U.S. mix of income in 2017. The increase in the effective tax rate for the year ended
December 31, 2016
, from the comparable period in
2015
, is primarily due to the tax impact of foreign versus U.S. based pre-tax income, lower deferred tax benefits associated with the future U.K. income tax rate reductions, and greater favorable settlements with
59
various taxing authorities in 2015, partially offset by a tax benefit from the early adoption of ASU 2016-09 in 2016. See note 12 to our consolidated financial statements and related notes, which are included elsewhere is this Annual Report, for additional information on these tax items.
Quarterly Results of Operations
The following quarterly unaudited consolidated statements of income data has been prepared on substantially the same basis as our audited consolidated financial statements and includes all adjustments, consisting only of normal recurring adjustments, necessary for the fair presentation of our consolidated results of operations for the quarters presented. The historical results for any quarter do not necessarily indicate the results expected for any future period. This unaudited condensed consolidated quarterly data should be read together with our consolidated financial statements and related notes included elsewhere in this Annual Report. The following table sets forth quarterly consolidated statements of income data (in millions):
|
Three Months Ended,
|
|||||||||||||||||||||||||||||||
|
December 31,
2017 |
September 30, 2017
|
June 30, 2017
|
March 31, 2017
|
December 31,
2016 |
September 30, 2016
|
June 30, 2016
|
March 31, 2016
|
||||||||||||||||||||||||
|
Revenues:
|
|||||||||||||||||||||||||||||||
|
Energy futures and options contracts
|
$
|
227
|
|
$
|
223
|
|
$
|
231
|
|
$
|
228
|
|
$
|
224
|
|
$
|
199
|
|
$
|
212
|
|
$
|
230
|
|
|||||||
|
Agricultural and metals futures and options contracts
|
49
|
|
49
|
|
62
|
|
56
|
|
47
|
|
52
|
|
67
|
|
62
|
|
|||||||||||||||
|
Interest rates and other financial futures and options contracts
|
72
|
|
82
|
|
89
|
|
83
|
|
74
|
|
70
|
|
80
|
|
94
|
|
|||||||||||||||
|
Cash equities and equity options
|
365
|
|
355
|
|
390
|
|
381
|
|
426
|
|
410
|
|
454
|
|
490
|
|
|||||||||||||||
|
Other transactions
|
45
|
|
49
|
|
45
|
|
50
|
|
47
|
|
46
|
|
47
|
|
53
|
|
|||||||||||||||
|
Total transaction and clearing, net
|
758
|
|
758
|
|
817
|
|
798
|
|
818
|
|
777
|
|
860
|
|
929
|
|
|||||||||||||||
|
Pricing and analytics
|
248
|
|
242
|
|
242
|
|
238
|
|
234
|
|
209
|
|
211
|
|
204
|
|
|||||||||||||||
|
Exchange data
|
140
|
|
136
|
|
142
|
|
138
|
|
132
|
|
136
|
|
139
|
|
128
|
|
|||||||||||||||
|
Desktops and connectivity
|
137
|
|
140
|
|
137
|
|
144
|
|
149
|
|
144
|
|
147
|
|
145
|
|
|||||||||||||||
|
Total data services
|
525
|
|
518
|
|
521
|
|
520
|
|
515
|
|
489
|
|
497
|
|
477
|
|
|||||||||||||||
|
Listings
|
102
|
|
102
|
|
107
|
|
106
|
|
105
|
|
106
|
|
105
|
|
103
|
|
|||||||||||||||
|
Other revenues
|
54
|
|
54
|
|
49
|
|
45
|
|
46
|
|
44
|
|
42
|
|
45
|
|
|||||||||||||||
|
Total revenues
|
1,439
|
|
1,432
|
|
1,494
|
|
1,469
|
|
1,484
|
|
1,416
|
|
1,504
|
|
1,554
|
|
|||||||||||||||
|
Transaction-based expenses
|
295
|
|
289
|
|
316
|
|
305
|
|
346
|
|
338
|
|
375
|
|
400
|
|
|||||||||||||||
|
Total revenues, less transaction-based expenses
|
1,144
|
|
1,143
|
|
1,178
|
|
1,164
|
|
1,138
|
|
1,078
|
|
1,129
|
|
1,154
|
|
|||||||||||||||
|
Compensation and benefits
|
227
|
|
231
|
|
234
|
|
245
|
|
237
|
|
236
|
|
236
|
|
236
|
|
|||||||||||||||
|
Professional services
|
27
|
|
30
|
|
32
|
|
32
|
|
36
|
|
32
|
|
37
|
|
32
|
|
|||||||||||||||
|
Acquisition-related transaction and integration costs
|
9
|
|
4
|
|
9
|
|
14
|
|
19
|
|
14
|
|
20
|
|
27
|
|
|||||||||||||||
|
Technology and communication
|
103
|
|
99
|
|
97
|
|
98
|
|
97
|
|
93
|
|
92
|
|
92
|
|
|||||||||||||||
|
Rent and occupancy
|
17
|
|
17
|
|
17
|
|
18
|
|
18
|
|
17
|
|
17
|
|
18
|
|
|||||||||||||||
|
Selling, general and administrative
|
38
|
|
38
|
|
38
|
|
41
|
|
33
|
|
31
|
|
30
|
|
22
|
|
|||||||||||||||
|
Depreciation and amortization
(1)
|
131
|
|
128
|
|
142
|
|
134
|
|
140
|
|
181
|
|
146
|
|
143
|
|
|||||||||||||||
|
Total operating expenses
|
552
|
|
547
|
|
569
|
|
582
|
|
580
|
|
604
|
|
578
|
|
570
|
|
|||||||||||||||
|
Operating income
|
592
|
|
596
|
|
609
|
|
582
|
|
558
|
|
474
|
|
551
|
|
584
|
|
|||||||||||||||
|
Other income (expense), net
(2)
|
77
|
|
(36
|
)
|
(44
|
)
|
141
|
|
(28
|
)
|
(31
|
)
|
(35
|
)
|
(44
|
)
|
|||||||||||||||
|
Income tax expense (benefit)
(3)
|
(562
|
)
|
185
|
|
139
|
|
213
|
|
171
|
|
93
|
|
153
|
|
163
|
|
|||||||||||||||
|
Net income
|
$
|
1,231
|
|
$
|
375
|
|
$
|
426
|
|
$
|
510
|
|
$
|
359
|
|
$
|
350
|
|
$
|
363
|
|
$
|
377
|
|
|||||||
|
Net income attributable to non-controlling interest
|
(6
|
)
|
(6
|
)
|
(8
|
)
|
(8
|
)
|
(7
|
)
|
(6
|
)
|
(6
|
)
|
(8
|
)
|
|||||||||||||||
|
Net income attributable to ICE
|
$
|
1,225
|
|
$
|
369
|
|
$
|
418
|
|
$
|
502
|
|
$
|
352
|
|
$
|
344
|
|
$
|
357
|
|
$
|
369
|
|
|||||||
(1)
The increase in the depreciation and amortization expenses for the three months ended September 30, 2016 is primarily due to the $33 million Creditex customer relationship intangible asset impairment. See “- Consolidated Operating Expenses” above.
(2)
Other income (expense), net for the three months ended December 31, 2017 includes a $110 million gain on our sale of Trayport, and for the three months ended March 31, 2017, includes a $176 million realized investment gain in connection with the sale of our investment in Cetip. See “- Recent Developments” above.
(3)
The decrease in the income tax expenses for the three months ended December 31, 2017 is primarily due to a $764 million deferred tax benefit associated with future U.S. income tax reductions, the decrease for the three months ended June 30, 2017 is primarily due to the tax benefit associated with a divestiture, and the decrease for the three months ended September 30, 2016 is primarily due to a deferred tax benefit associated with future U.K. income tax rate reductions. See “- Consolidated Income Tax Provision” above.
60
Liquidity and Capital Resources
Below are charts that reflect our capital allocation. The acquisition and integration costs in the chart below includes both the net cash paid for the acquisitions and the acquisition-related transaction and integration costs in each year.
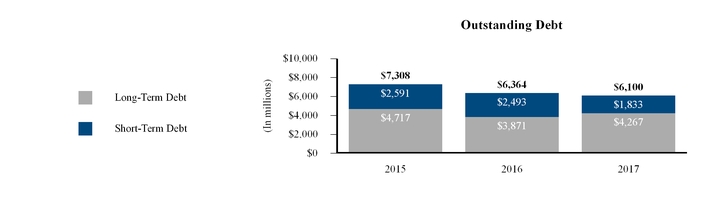
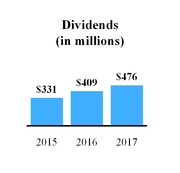
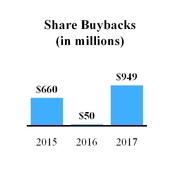
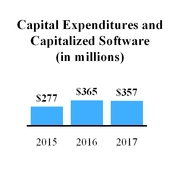
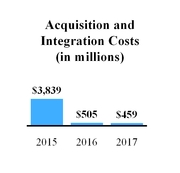
We have financed our operations, growth and cash needs primarily through income from operations and borrowings under our various debt facilities. Our principal capital requirements have been to fund capital expenditures, working capital, strategic acquisitions and investments, stock repurchases, dividends to our shareholders and the continued development of our technology platforms that support our businesses. We believe that our cash on hand and cash flows from operations will be sufficient to repay our outstanding debt as it matures. In the future, we may need to incur additional debt or issue additional equity securities, which we may be unable to do or to do on favorable terms. See “- Future Capital Requirements” below.
Our Commercial Paper Program enables us to borrow efficiently at reasonable short-term interest rates and provides us with the flexibility to de-lever using our strong annual cash flows from operating activities whenever our leverage becomes elevated as a result of investment or acquisition activities. We reduced our outstanding commercial paper during the year ended
December 31, 2017
by $409 million, primarily using net cash proceeds received from the sale of our investment in Cetip, the sale of Trayport and cash flows from operations, partially offset by acquisitions and investments we made in 2017. See “- Debt” below.
See “- Recent Developments” above for a discussion of the acquisitions and investments that we made during the year ended
December 31, 2017
. These cash acquisitions and investments were funded from borrowing under our Commercial Paper Program, cash flows from operations and a portion of the proceeds received from our divestitures during the year ended
December 31, 2017
.
Upon maturity of old issuances of commercial paper and to the extent old issuances are not repaid by cash on hand, we are exposed to the rollover risk of not being able to issue new commercial paper. To mitigate the rollover risk, we maintain an undrawn back-stop bank revolving credit facility for an aggregate amount equaling at any time the amount issued under our Commercial Paper Program. If we were not able to issue new commercial paper, we have the option of drawing on the back-stop revolving facility, however electing to do so would result in higher interest expense. See “- Debt” below.
Consolidated cash and cash equivalents were
$535 million
and
$407 million
as of
December 31, 2017
and
2016
, respectively. We had
$1.0 billion
and
$943 million
in short-term and long-term restricted cash and cash equivalents as of
December 31, 2017
and
2016
, respectively and
$432 million
in long-term investments as of December 31, 2016 (relating to our investment in Cetip, which was sold in 2017). We consider all short-term, highly-liquid investments with original maturity dates of three months or less to be cash equivalents. We classify all investments with original maturity dates in excess of three months but less than one year as short-term investments and all investments that we intend to hold for more than one year as long-term investments. Cash and investments that are
61
not available for general use, either due to regulatory requirements or through restrictions in specific agreements, are classified as restricted cash and investments.
As of
December 31, 2017
, the amount of unrestricted cash held by our non-U.S. subsidiaries was $325 million. While we consider our non-U.S. earnings to be indefinitely reinvested overseas, if these cash balances are needed for our operations in the U.S., any repatriation by way of dividend may be subject to both U.S. federal and state income taxes, as adjusted for any non-U.S. tax credits. Such dividends may not be subject to U.S. federal tax under the TCJA and we will continue to monitor both federal and state interpretations, guidance and regulations concerning U.S. tax reform. However, we do not have any current needs or foreseeable future needs or other plans to repatriate cash by way of dividends from our non-U.S. subsidiaries. We will continue to evaluate our indefinite reinvestment assertion in light of any further U.S. tax reform developments.
Our cash and cash equivalents and financial investments are managed as a global treasury portfolio of non-speculative financial instruments that are readily convertible into cash, such as overnight deposits, term deposits, money market funds, mutual funds for treasury investments, short duration fixed income investments and other money market instruments, thus ensuring high liquidity of financial assets. We may invest a portion of our cash in excess of short-term operating needs in investment-grade marketable debt securities, including government or government-sponsored agencies and corporate debt securities.
Certain of these investments, with an original maturity of greater than three months, will be classified as available-for-sale in accordance with relevant accounting standards. Available-for-sale investments are carried at their fair values with unrealized gains and losses, reported as a component of accumulated other comprehensive income. Realized gains and losses, and declines in value deemed to be other-than-temporary on available-for-sale investments, are recognized currently in earnings. We do not have any investments classified as held-to-maturity or trading.
During the years ended
December 31, 2017
,
2016
and
2015
, we repurchased
14,966,616
shares,
902,920
shares and
14,343,845
shares, respectively, of our outstanding common stock at a cost of
$949 million
,
$50 million
and
$660 million
, respectively. The shares repurchased are held in treasury stock. These repurchases were completed on the open market and under our Rule 10b5-1 trading plan. In connection with our acquisition of Interactive Data during the fourth quarter of 2015, we suspended our stock repurchase plan for a period of time. The timing and extent of future repurchases that are not made pursuant to a Rule 10b5-1 trading plan will be at our discretion and will depend upon many conditions. Our management periodically reviews whether or not to be active in repurchasing our stock. In making a determination regarding any stock repurchases, we consider multiple factors. The factors may include: overall stock market conditions, our common stock price movements, the remaining amount authorized for repurchases by our board of directors, the potential impact of a stock repurchase program on our corporate debt ratings, our expected free cash flow and working capital needs, our current and future planned strategic growth initiatives, and other potential uses of our cash and capital resources.
In August 2016, our board of directors approved an aggregate of
$1.0 billion
for future repurchases of our common stock with no fixed expiration date. In September 2017, our board of directors approved an aggregate of
$1.2 billion
for future repurchases of our common stock with no fixed expiration date that becomes effective as of January 1, 2018. We expect funding for any share repurchases to come from our operating cash flow or borrowings under our debt facilities or our Commercial Paper Program.
Repurchases may be made from time to time on the open market, through established trading plans, in privately-negotiated transactions or otherwise, in accordance with all applicable securities laws, rules and regulations. We have entered into a Rule 10b5-1 trading plan, as authorized by our board of directors, to govern some or all of the repurchases of our shares of common stock. We may discontinue the stock repurchases at any time and may amend or terminate the Rule 10b5-1 trading plan at any time. The approval of our board of directors for the share repurchases does not obligate us to acquire any particular amount of our common stock. In addition, our board of directors may increase or decrease the amount of capacity we have for repurchases from time to time.
Cash Flow
The following presents the major components of net increases (decreases) in cash, cash equivalents, and restricted cash and cash equivalents (in millions):
62
|
Year Ended December 31,
|
|||||||||||
|
2017
|
2016
|
2015
|
|||||||||
|
Net cash provided by (used in):
|
|||||||||||
|
Operating activities
|
$
|
2,085
|
|
$
|
2,149
|
|
$
|
1,311
|
|
||
|
Investing activities
|
92
|
|
(860
|
)
|
(3,004
|
)
|
|||||
|
Financing activities
|
(1,971
|
)
|
(1,462
|
)
|
1,976
|
|
|||||
|
Effect of exchange rate changes
|
12
|
|
(24
|
)
|
(14
|
)
|
|||||
|
Net increase (decrease) in cash, cash equivalents, and restricted cash and cash equivalents
|
$
|
218
|
|
$
|
(197
|
)
|
$
|
269
|
|
||
The FASB has issued ASU 2016-18,
Statement of Cash Flows: Restricted Cash,
that requires entities to show the changes in the total of cash, cash equivalents, restricted cash and cash equivalents in the statement of cash flows. As a result, entities will no longer present transfers between cash and cash equivalents and restricted cash and cash equivalents in the statement of cash flows. In the fourth quarter of 2017, we adopted ASU 2016-18 and reclassified changes in restricted cash from cash flow provided by (used in) investing activities to the total change in beginning-of-year and end-of-year total amounts shown on the consolidated statements of cash flows for the years ended December 31, 2017, 2016 and 2015. This new standard is a change in cash flow statement presentation only. Refer to note 2 to our consolidated financial statements and related notes, which are included elsewhere in this Annual Report, for more information on the impact of the adoption of ASU 2016-18.
Operating Activities
Net cash provided by operating activities primarily consists of net income adjusted for certain non-cash items, including depreciation and amortization and the effects of changes in working capital. Fluctuations in net cash provided by operating activities are primarily attributable to increases and decreases in our net income between periods and due to fluctuations in working capital.
The $64 million decrease in net cash provided by operating activities for the year ended
December 31, 2017
, from the comparable period in
2016
, is primarily due to a $136 million contribution that was made to our pension plan in September 2017, compared to a $10 million contribution that was made to our pension plan in September 2016. The pension contribution in September 2017 allowed us to reach 99% funding of our pension obligation and allowed us to immunize the liability against future market fluctuations. For additional information on our pension plan, refer to note 15 to our consolidated financial statements and related notes, which are included elsewhere in this Annual Report.
The $838 million increase in net cash provided by operating activities for the year ended
December 31, 2016
, from the comparable period in
2015
, is primarily due to $393 million in cash provided by operating activities for Interactive Data, Trayport, Securities Evaluations and Credit Market Analysis for the year ended
December 31, 2016
, increase in the net income of our historical income statement excluding the acquisitions, and other fluctuations in working capital (including the impact of the increase in cash paid for income taxes in 2015).
Investing Activities
Consolidated net cash provided by (used in) investing activities for the years ended
December 31, 2017
,
2016
and
2015
primarily relates to cash paid for acquisitions, cash received from divestitures, net cash received from the sale of our investment in Cetip, purchases of cost and equity method investments, proceeds from term deposits, and changes in the capital expenditures and capitalized software development costs.
We paid cash for acquisitions, net of cash acquired, of $423 million, $425 million and $3.8 billion, respectively, for the years ended
December 31, 2017
,
2016
and
2015
, primarily relating to the NGX, Shorcan Energy, BofAML indices and TMX Atrium acquisitions during the year ended
December 31, 2017
, the Securities Evaluations and Credit Market Analysis acquisitions during the year ended December 31, 2016, and the Interactive Data acquisition during the year ended December 31, 2015. We received cash from our divestitures of $761 million during the year ended
December 31, 2017
, relating to the sales of Trayport, IDMS and NYSE Governance Services. We received net cash proceeds from the sale of our investment in Cetip of $438 million. We made purchases of cost and equity method investments of $327 million, $70 million and $60 million during the years ended
December 31, 2017
,
2016
and
2015
, respectively, relating to our investments in Euroclear, MERS and OCC. See “- Recent Developments” above for more details on these acquisitions, divestitures and investments. We received proceeds from term deposits of $1.1 billion during the year ended December 31, 2015 relating to the repayments of outstanding debt.
Capital expenditures were $220 million, $250 million and $190 million for the years ended
December 31, 2017
,
2016
and
2015
, respectively, and we had capitalized software development expenditures of $137 million, $115 million and $87 million for the years ended
December 31, 2017
,
2016
and
2015
, respectively. The capital expenditures primarily relate to hardware purchases to continue the development and expansion of our electronic platforms, data services and clearing houses and leasehold improvements associated
63
with the new and renovated office spaces in Atlanta, New York and London. The software development expenditures primarily relate to the continued development and expansion of our electronic trading platforms, data services and clearing houses.
Financing Activities
Consolidated net cash used in financing activities for the year ended
December 31, 2017
primarily relates to $984 million in net proceeds from the 2022 Senior Notes and 2027 Senior Notes offerings, $850 million in repayments of the NYSE Notes, $409 million in net repayments under our Commercial Paper Program, $949 million in repurchases of common stock, $476 million in dividend payments to our shareholders, $174 million in acquisitions of non-controlling interest and redeemable non-controlling interest and $88 million in cash payments related to treasury shares received for restricted stock tax payments and stock options exercises. See “- Recent Developments” above and “- Debt” below.
Consolidated net cash used in financing activities for the year ended
December 31, 2016
primarily relates to $949 million in net repayments under our Commercial Paper Program, $409 million in dividend payments to our shareholders, $54 million in cash payments related to treasury shares received for restricted stock tax payments and stock options exercises and $50 million in repurchases of common stock.
Consolidated net cash provided by financing activities for the year ended December 31, 2015 primarily relates to $2.5 billion in net proceeds received in connection with the offering of new senior notes and $1.7 billion in net borrowings under our commercial paper program, partially offset by $1.0 billion in net repayments under our debt facilities, $660 million in repurchases of common stock, $331 million in dividend payments to our shareholders, $128 million for the purchase of subsidiary shares from non-controlling interest holders and $45 million in cash payments related to treasury shares received for restricted stock tax payments and stock options exercises.
Our total debt, including short-term and long-term debt, consisted of the following as of
December 31, 2017
and
2016
(in millions):
|
As of December 31,
|
|||||||
|
2017
|
2016
|
||||||
|
Debt:
|
|||||||
|
Short-term debt:
|
|||||||
|
Commercial Paper
|
$
|
1,233
|
|
$
|
1,642
|
|
|
|
2018 Senior Notes (2.50% senior unsecured notes due October 15, 2018)
|
600
|
|
—
|
|
|||
|
NYSE Notes (2.00% senior unsecured notes due October 5, 2017)
|
—
|
|
851
|
|
|||
|
Total short-term debt
|
1,833
|
|
2,493
|
|
|||
|
Long-term debt:
|
|||||||
|
2018 Senior Notes (2.50% senior unsecured notes due October 15, 2018)
|
—
|
|
598
|
|
|||
|
2020 Senior Notes (2.75% senior unsecured notes due December 1, 2020)
|
1,244
|
|
1,242
|
|
|||
|
2022 Senior Notes (2.35% senior unsecured notes due September 15, 2022)
|
495
|
|
—
|
|
|||
|
2023 Senior Notes (4.00% senior unsecured notes due October 15, 2023)
|
791
|
|
790
|
|
|||
|
2025 Senior Notes (3.75% senior unsecured notes due December 1, 2025)
|
1,242
|
|
1,241
|
|
|||
|
2027 Senior Notes (3.10% senior unsecured notes due September 15, 2027)
|
495
|
|
—
|
|
|||
|
Total long-term debt
|
4,267
|
|
3,871
|
|
|||
|
Total debt
|
$
|
6,100
|
|
$
|
6,364
|
|
|
Amended Credit Facility
We had previously entered into a $
3.4 billion
senior unsecured revolving credit facility, or the Credit Facility, with a maturity date of November 13, 2020, pursuant to a credit agreement with Wells Fargo Bank, N.A., or Wells Fargo, as administrative agent, issuing lender and swing-line lender, Bank of America, N.A., as syndication agent, backup administrative agent and swing-line lender, and the lenders party thereto. On August 18, 2017, we agreed with the lenders to, amongst other items, extend the maturity date to August 18, 2022, herein referred to as the Amended Credit Facility. The Amended Credit Facility includes an option for us to propose an increase in the aggregate amount available for borrowing by up to $
975 million
, subject to the consent of the lenders funding the increase and certain other conditions.
64
Other amendments within the Amended Credit Facility include, but are not limited to, (i) eliminating the step-up in the commitment fee ratings-based grid that was scheduled to take effect in April 2019, (ii) removing ICE Europe Parent Limited as a party to the credit agreement, (iii) removing the guaranty by ICE in respect of ICE Europe Parent Limited, (iv) increasing the maximum leverage ratio to
3.50
:1.00, and (v) up to
two
times, increasing the maximum leverage ratio from
3.50
:1.00 to
4.00
:1.00 for a period of one year following a material acquisition.
No
amounts were outstanding under the Amended Credit Facility as of
December 31, 2017
. Amounts borrowed under the Amended Credit Facility may be prepaid at any time without premium or penalty. The Amended Credit Facility provides for a
$3.4 billion
multi-currency revolving facility, with sub-limits for non-dollar borrowings and letters of credit and with a swing-line facility available on a same-day basis. Of the
$3.4 billion
that is currently available for borrowing under the Amended Credit Facility, $
1.2 billion
is required to back-stop the amount outstanding under our Commercial Paper Program as of
December 31, 2017
and $100 million is required to support certain subsidiary clearing house commitments. The amount required to back-stop the amounts outstanding under the Commercial Paper Program will fluctuate as we increase or decrease our commercial paper borrowings. The remaining $
2.1 billion
available under the Amended Credit Facility as of
December 31, 2017
is available to us to use for working capital and general corporate purposes including, but not limited to, acting as a back-stop to future increases in the amounts outstanding under the Commercial Paper Program.
Borrowings under the Amended Credit Facility will bear interest on the principal amount outstanding at either (a) LIBOR plus an applicable margin rate or (b) a “base rate” plus an applicable margin rate; provided, however, that all loans denominated in a foreign currency will bear interest at LIBOR plus an applicable margin rate. The “base rate” equals the higher of (i) Wells Fargo’s prime rate, (ii) the federal funds rate plus
0.50%
, or (iii) the one-month LIBOR rate plus
1.00%
. The applicable margin rate is based upon our public long-term debt ratings and ranges from
0.875%
to
1.50%
on LIBOR borrowings and from
0.00%
to
0.50%
on base rate borrowings.
The Amended Credit Facility includes an unutilized revolving credit commitment fee that is equal to the unused maximum revolver amount, multiplied by an applicable commitment fee rate and is payable in arrears on a quarterly basis. The applicable commitment fee rate ranges from
0.08%
to
0.20%
and is determined based on our long-term debt rating. As of
December 31, 2017
, the applicable commitment fee rate was
0.125%
based on our current long-term debt ratings.
Senior Notes
On August 17, 2017, we issued
$1.0 billion
in aggregate senior notes, including
$500 million
principal amount of
2.35%
senior unsecured fixed rate notes due September 2022, or the 2022 Senior Notes, and
$500 million
principal amount of
3.10%
senior unsecured fixed rate notes due September 2027, or the 2027 Senior Notes. We used the majority of the net proceeds from the 2022 Senior Notes and 2027 Senior Notes offering to fund the redemption of the NYSE Notes.
In November 2015, we issued
$2.5 billion
in aggregate senior notes, including
$1.25 billion
principal amount of
2.75%
senior unsecured fixed rate notes due November 2020, or the 2020 Senior Notes, and
$1.25 billion
principal amount of
3.75%
senior unsecured fixed rate notes due November 2025, or the 2025 Senior Notes. We used the net proceeds from the 2020 Senior Notes and 2025 Senior Notes offering, together with
$1.6 billion
of borrowings under our Commercial Paper Program, to finance the
$4.1 billion
cash portion of the purchase price of the acquisition of Interactive Data.
Commercial Paper Program
We have entered into our Commercial Paper Program, which is currently backed by the borrowing capacity available under the Amended Credit Facility, equal to the amount of the commercial paper that is issued and outstanding at any given point in time. The effective interest rate of commercial paper issuances does not materially differ from short-term interest rates (such as USD LIBOR). The fluctuation of these rates due to market conditions may impact our interest expense.
We repaid
$409 million
of net notes outstanding under the Commercial Paper Program during the year ended
December 31, 2017
primarily using net cash proceeds received from the sale of our investment in Cetip and the sale of Trayport. These repayments were partially offset by notes issued under the Commercial Paper Program during the year ended
December 31, 2017
for the cash acquisitions and investments and to repurchase our common stock. We used net proceeds from notes issued under the Commercial Paper Program during the year ended December 31, 2016 to finance part of the cash purchase price of the Securities Evaluations and Credit Market Analysis acquisitions and for general corporate purposes. We used net proceeds from notes issued under the Commercial Paper Program during the year ended December 31, 2015 to finance part of the cash portion of the purchase price of the Interactive Data acquisition and to pay related fees and expenses, to repurchase our common stock, and for general corporate purposes. We repaid a portion of the amounts outstanding under the Commercial Paper Program during the years ended December 31, 2017, 2016 and 2015 with cash flows from operations.
Commercial paper notes of $
1.2 billion
with original maturities ranging from
two
to
64
days were outstanding as of
December 31, 2017
under our Commercial Paper Program. As of
December 31, 2017
, the weighted average interest rate on the $
1.2 billion
outstanding under our Commercial Paper Program was
1.49%
per annum, with a weighted average maturity of
18
days.
65
Commercial paper notes of
$1.6 billion
with original maturities ranging from
three
to
68
days were outstanding as of December 31, 2016 under the Commercial Paper Program. As of December 31, 2016, the weighted average interest rate on the
$1.6 billion
outstanding under the Commercial Paper Program was
0.74%
per annum, with a weighted average maturity of
18
days.
NYSE Notes
The $
850 million
,
2.00%
senior unsecured fixed rate NYSE Notes were due in October 2017. We redeemed the NYSE Notes in full in September 2017 using the majority of the proceeds from the 2022 Senior Notes and 2027 Senior Notes offering.
Refer to note 10 to our consolidated financial statements and related notes, which are included elsewhere in this Annual Report, for additional information on our debt and debt facilities.
Future Capital Requirements
Our future capital requirements will depend on many factors, including the rate of growth across our Trading and Clearing and Data and Listings segments, strategic plans and acquisitions, available sources for financing activities, required technology and clearing initiatives, regulatory requirements, the timing and introduction of new products and enhancements to existing products, the geographic mix of our business, potential stock repurchases, and the continuing market acceptance of our electronic trading and clearing platforms. We currently expect to make aggregate capital expenditures (including operational and real estate capital expenditures) and to incur capitalized software development costs ranging between $300 million and $330 million for the year ended December 31, 2018, which we believe will support the enhancement of our technology, business integration and the continued growth of our businesses.
Our board of directors has adopted a quarterly dividend declaration policy providing that the declaration of any dividends will be determined quarterly by the board of directors or the audit committee of the board of directors taking into account such factors as our evolving business model, prevailing business conditions and our financial results and capital requirements, without a predetermined annual net income payout ratio. During the year ended
December 31, 2017
, we paid cash dividends of $0.80 per share of our common stock in the aggregate, including
2017
quarterly dividends of $0.20 per share, for an aggregate payout of $476 million in
2017
, which includes the payment of dividend equivalents on unvested employee restricted stock units. Refer to note 11 to our consolidated financial statements and related notes, which are included elsewhere in this Annual Report, for details on the amounts of our quarterly dividend payouts for the last three years. For the first quarter of 2018, we announced a $0.24 per share dividend, which is a 20% increase over the prior dividend, which is payable on March 29, 2018 to shareholders of record as of March 15, 2018.
As of
December 31, 2017
, we had
$6.1 billion
in outstanding debt. We currently have a $
3.4 billion
Amended Credit Facility. After factoring in the $
1.2 billion
required to back-stop the Commercial Paper Program as of
December 31, 2017
and $100 million that is required to support certain subsidiary clearing house commitments, $
2.1 billion
of our Amended Credit Facility is currently available for general corporate purposes. The Amended Credit Facility and our Commercial Paper Program are currently the only significant agreements or arrangements that we have with third parties for liquidity and capital resources. In the event of any strategic acquisitions, mergers or investments, or if we are required to raise capital for any reason or desire to return capital to our stockholders, we may incur additional debt, issue additional equity to raise necessary funds, repurchase additional shares of our common stock or pay a dividend. However, we cannot provide assurance that such financing or transactions will be available or successful, or that the terms of such financing or transactions will be favorable to us. See “- Debt” above.
Non-GAAP Financial Measures
We use non-GAAP measures internally to evaluate our performance and in making financial and operational decisions. When viewed in conjunction with our GAAP results and the accompanying reconciliation, we believe that our presentation of these measures provides investors with greater transparency and a greater understanding of factors affecting our financial condition and results of operations than GAAP measures alone. In addition, we believe the presentation of these measures is useful to investors for period-to-period comparison of results because the items described below as adjustments to GAAP are not reflective of our core business performance. These financial measures are not in accordance with, or an alternative to, GAAP financial measures and may be different from non-GAAP measures used by other companies. We use these adjusted results because we believe they more clearly highlight trends in our business that may not otherwise be apparent when relying solely on GAAP financial measures, since these measures eliminate from our results specific financial items that have less bearing on our core operating performance. We strongly recommend that investors review the GAAP financial measures included in this Annual Report, including our consolidated financial statements and the notes thereto.
Adjusted operating expenses, adjusted operating income, adjusted operating margin, adjusted net income attributable to ICE common shareholders and adjusted earnings per share for the periods presented below are calculated by adding or subtracting the adjustments described below, which are not reflective of our cash operations and core business performance, and their related income tax effect and other tax adjustments (in millions, except for percentages and per share amounts):
66
|
Trading and Clearing Segment
|
Data and Listings Segment
|
Consolidated
|
|||||||||||||||||||||||||||||||||
|
Year Ended December 31,
|
Year Ended December 31,
|
Year Ended December 31,
|
|||||||||||||||||||||||||||||||||
|
2017
|
2016
|
2015
|
2017
|
2016
|
2015
|
2017
|
2016
|
2015
|
|||||||||||||||||||||||||||
|
Total revenues, less transaction-based expenses
|
$
|
2,128
|
|
$
|
2,102
|
|
$
|
2,062
|
|
$
|
2,501
|
|
$
|
2,397
|
|
$
|
1,276
|
|
$
|
4,629
|
|
$
|
4,499
|
|
$
|
3,338
|
|
||||||||
|
Operating expenses
|
779
|
|
825
|
|
915
|
|
1,471
|
|
1,507
|
|
673
|
|
2,250
|
|
2,332
|
|
1,588
|
|
|||||||||||||||||
|
Less: Interactive Data and NYSE transaction and integration costs and acquisition-related success fees
|
—
|
|
1
|
|
24
|
|
31
|
|
45
|
|
59
|
|
31
|
|
46
|
|
83
|
|
|||||||||||||||||
|
Less: Impairment on divestiture of NYSE Governance Services
|
—
|
|
—
|
|
—
|
|
6
|
|
—
|
|
—
|
|
6
|
|
—
|
|
—
|
|
|||||||||||||||||
|
Less: Accruals relating to ongoing investigations and inquiries
|
14
|
|
—
|
|
—
|
|
—
|
|
—
|
|
—
|
|
14
|
|
—
|
|
—
|
|
|||||||||||||||||
|
Less: Employee severance costs related to Creditex U.K. brokerage operations
|
—
|
|
4
|
|
—
|
|
—
|
|
—
|
|
—
|
|
—
|
|
4
|
|
—
|
|
|||||||||||||||||
|
Less: Creditex customer relationship intangible asset impairment
|
—
|
|
33
|
|
—
|
|
—
|
|
—
|
|
—
|
|
—
|
|
33
|
|
—
|
|
|||||||||||||||||
|
Less: Amortization of acquisition-related intangibles
|
53
|
|
72
|
|
82
|
|
208
|
|
230
|
|
58
|
|
261
|
|
302
|
|
140
|
|
|||||||||||||||||
|
Adjusted operating expenses
|
$
|
712
|
|
$
|
715
|
|
$
|
809
|
|
$
|
1,226
|
|
$
|
1,232
|
|
$
|
556
|
|
$
|
1,938
|
|
$
|
1,947
|
|
$
|
1,365
|
|
||||||||
|
Operating income
|
$
|
1,349
|
|
$
|
1,277
|
|
$
|
1,147
|
|
$
|
1,030
|
|
$
|
890
|
|
$
|
603
|
|
$
|
2,379
|
|
$
|
2,167
|
|
$
|
1,750
|
|
||||||||
|
Adjusted operating income
|
$
|
1,416
|
|
$
|
1,387
|
|
$
|
1,253
|
|
$
|
1,275
|
|
$
|
1,165
|
|
$
|
720
|
|
$
|
2,691
|
|
$
|
2,552
|
|
$
|
1,973
|
|
||||||||
|
Operating margin
|
63
|
%
|
61
|
%
|
56
|
%
|
41
|
%
|
37
|
%
|
47
|
%
|
51
|
%
|
48
|
%
|
52
|
%
|
|||||||||||||||||
|
Adjusted operating margin
|
67
|
%
|
66
|
%
|
61
|
%
|
51
|
%
|
49
|
%
|
56
|
%
|
58
|
%
|
57
|
%
|
59
|
%
|
|||||||||||||||||
|
Net income attributable to ICE
|
$
|
2,514
|
|
$
|
1,422
|
|
$
|
1,274
|
|
||||||||||||||||||||||||||
|
Add: Interactive Data and NYSE transaction and integration costs and acquisition-related success fees
|
31
|
|
46
|
|
83
|
|
|||||||||||||||||||||||||||||
|
Add: Impairment on divestiture of NYSE Governance Services
|
6
|
|
—
|
|
—
|
|
|||||||||||||||||||||||||||||
|
Add: Accruals relating to ongoing investigations and inquiries
|
14
|
|
—
|
|
—
|
|
|||||||||||||||||||||||||||||
|
Add: Employee severance costs related to Creditex U.K. brokerage operations
|
—
|
|
4
|
|
—
|
|
|||||||||||||||||||||||||||||
|
Add: Creditex customer relationship intangible asset impairment
|
—
|
|
33
|
|
—
|
|
|||||||||||||||||||||||||||||
|
Add: Amortization of acquisition-related intangibles
|
261
|
|
302
|
|
140
|
|
|||||||||||||||||||||||||||||
|
Add: Litigation settlements and accruals, net
|
—
|
|
—
|
|
15
|
|
|||||||||||||||||||||||||||||
|
Add: Pre-acquisition interest expense on debt issued for Interactive Data acquisition
|
—
|
|
—
|
|
5
|
|
|||||||||||||||||||||||||||||
|
Less: Gain on divestiture of Trayport, net
|
(110
|
)
|
—
|
|
—
|
|
|||||||||||||||||||||||||||||
|
Less: Cetip investment gain, net
|
(167
|
)
|
—
|
|
—
|
|
|||||||||||||||||||||||||||||
|
Less: Income tax effect related to the items above
|
(43
|
)
|
(143
|
)
|
(83
|
)
|
|||||||||||||||||||||||||||||
|
Less: Tax adjustments on U.S. tax reform
|
(764
|
)
|
—
|
|
—
|
|
|||||||||||||||||||||||||||||
|
Add/(Less): Deferred tax adjustments on acquisition-related intangibles
|
10
|
|
(22
|
)
|
(82
|
)
|
|||||||||||||||||||||||||||||
|
Add: Other tax adjustments
|
—
|
|
23
|
|
7
|
|
|||||||||||||||||||||||||||||
|
Adjusted net income attributable to ICE
|
$
|
1,752
|
|
$
|
1,665
|
|
$
|
1,359
|
|
||||||||||||||||||||||||||
|
Basic earnings per share
|
$
|
4.27
|
|
$
|
2.39
|
|
$
|
2.29
|
|
||||||||||||||||||||||||||
|
Diluted earnings per share
|
$
|
4.23
|
|
$
|
2.37
|
|
$
|
2.28
|
|
||||||||||||||||||||||||||
|
Adjusted basic earnings per share
|
$
|
2.97
|
|
$
|
2.80
|
|
$
|
2.44
|
|
||||||||||||||||||||||||||
|
Adjusted diluted earnings per share
|
$
|
2.95
|
|
$
|
2.78
|
|
$
|
2.43
|
|
||||||||||||||||||||||||||
|
Basic weighted average common shares outstanding
|
589
|
|
595
|
|
556
|
|
|||||||||||||||||||||||||||||
|
Diluted weighted average common shares outstanding
|
594
|
|
599
|
|
559
|
|
|||||||||||||||||||||||||||||
Acquisition-related transaction costs are included as part of our core business expenses, except for those that are directly related to the announcement, closing, financing or termination of a transaction. However, the acquisition-related transaction and integration costs relating to Interactive Data and NYSE are included in non-GAAP adjustments given the sizes of these acquisitions. As of June 30, 2016, the integration of NYSE has been completed and we will no longer include any NYSE integration costs as non-GAAP
67
adjustments following this date. Amortization of acquisition-related intangibles are included in non-GAAP adjustments as excluding these non-cash expenses provides greater clarity regarding our financial strength and stability of cash operating results.
During the year ended December 31, 2017, we include as non-GAAP adjustments the Cetip realized investment gain and the foreign exchange loss and transaction expenses on the sale of our investment in Cetip, as the sale of our investment in Cetip is not part of our core business operations. During the year ended December 31, 2017, we include as non-GAAP adjustments the net gain on the divestiture of Trayport, the accruals relating to ongoing investigations and inquiries, and the NYSE Governance Services net loss on its divestiture, as they are non-recurring items. During the year ended December 31, 2016, we include as non-GAAP adjustments the Creditex U.K. voice brokerage severance costs related to its discontinuance and the Creditex customer relationship intangible asset impairment expense, as they are non-recurring items. During the year ended December 31, 2015, we include as non-GAAP adjustments various litigation settlements and accruals and the interest expense on the senior notes and commercial paper we issued for the Interactive Data acquisition (from the issuance date of the new senior notes on November 24, 2015 and on the issuance dates of the commercial paper in early December 2015 to the acquisition date of Interactive Data on December 14, 2015), as they are not part of our core business operations or represent non-recurring items.
The income tax effects relating to the items above are included in non-GAAP adjustments as well as deferred tax adjustments on acquisition-related intangibles and other tax adjustments. The tax items in non-GAAP adjustments are either the tax impacts of the pre-tax non-GAAP adjustments or are tax items as described below that are not in the normal course of business and are not indicative of our core business performance.
The income tax effects of the pre-tax non-GAAP adjustments for the year ended December 31, 2017 include tax benefits associated with the divestiture of NYSE Governance Services. The tax adjustments on U.S. tax reform mainly include the $764 million deferred tax benefit as a result of the enactment of TCJA in the last quarter of 2017, which reduces the corporate income tax rate from 35% to 21%. Deferred tax adjustments on acquisition-related intangibles include the impact of U.S. state tax law and apportionment changes which resulted in deferred tax expense of $10 million, deferred tax expense of $12 million, and deferred tax benefits of $22 million for the years ended December 31, 2017, 2016, and 2015, respectively. In addition, deferred tax adjustments on acquisition-related intangibles include $34 million and $60 million deferred tax benefits due to U.K. corporate income tax rate reductions for the years ended December 31, 2016 and 2015, respectively. Other tax adjustments for the year ended December 31, 2016 relate to a $15 million valuation allowance on Singapore pre-acquisition net operating losses and other deferred tax assets and an $8 million deferred tax adjustment with respect to our OCC equity method investment. Other tax adjustments for the year ended December 31, 2015 represents a $7 million uncertain tax position relating to a retrospective foreign tax law change for a pre-acquisition period.
For additional information on these items, refer to our consolidated financial statements and related notes, which are included elsewhere in this Annual Report and “- Recent Developments,” “- Consolidated Operating Expenses”, “- Consolidated Non-Operating Income (Expenses)” and “- Consolidated Income Tax Provision” above.
Off-Balance Sheet Arrangements
Except for certain clearing house collateral that is reported off-balance sheet, we do not have any relationships with unconsolidated entities or financial partnerships, often referred to as structured finance or special purpose entities, which have been established for the purpose of facilitating off-balance sheet arrangements or other contractually narrow or limited purposes. Refer to note 13 to our consolidated financial statements and related notes, which are included elsewhere in this Annual Report, for more information on our clearing houses’ collateral.
Contractual Obligations and Commercial Commitments
The following table presents, for the periods indicated, our contractual obligations (which we intend to fund from our existing cash as well as cash flow from operations) and commercial commitments as of
December 31, 2017
(in millions):
|
Payments Due by Period
|
|||||||||||||||||||
|
Total
|
Less Than
1 Year |
1-3 Years
|
4-5 Years
|
After
5 Years |
|||||||||||||||
|
Contractual Obligations:
|
|||||||||||||||||||
|
Short-term and long-term debt and interest
|
$
|
7,036
|
|
$
|
1,993
|
|
$
|
1,637
|
|
$
|
1,500
|
|
$
|
1,906
|
|
||||
|
Operating lease obligations
|
521
|
|
78
|
|
218
|
|
63
|
|
162
|
|
|||||||||
|
Purchase obligations
|
188
|
|
101
|
|
76
|
|
11
|
|
—
|
|
|||||||||
|
Total contractual cash obligations
|
$
|
7,745
|
|
$
|
2,172
|
|
$
|
1,931
|
|
$
|
1,574
|
|
$
|
2,068
|
|
||||
Purchase obligations include our estimate of the minimum outstanding obligations under agreements to purchase goods or services that we believe are enforceable and legally binding and that specify all significant terms, including: fixed or minimum
68
quantities to be purchased; fixed, minimum or variable price provisions; and the approximate timing of the transaction. Purchase obligations exclude agreements that are cancellable at any time without penalty.
We have excluded from the contractual obligations and commercial commitments table above $51.2 billion in cash margin deposits, guaranty funds and delivery contracts payable. Clearing members of our clearing houses are required to deposit original margin and variation margin and to make deposits to a guaranty fund. The cash deposits made to these margin accounts and to the guaranty fund are recorded in the consolidated balance sheet as current assets with corresponding current liabilities to the clearing members that deposited them. NGX administers the physical delivery of energy trading contracts. It has an equal and offsetting claim to and from their respective participants on opposite sides of the physically settled contract. This balance is reflected as a delivery contract receivable with an offsetting delivery contract payable. See note 13 to our consolidated financial statements and related notes that are included elsewhere in this Annual Report for additional information on our clearing houses and the margin deposits, guaranty funds and delivery contracts payable.
We have also excluded unrecognized tax benefits, or UTBs, from the contractual obligations and commercial commitments table above. As of
December 31, 2017
, our cumulative UTBs were $115 million. Interest and penalties related to UTBs were $35 million as of
December 31, 2017
. We are under examination by various tax authorities. We are unable to make a reasonable estimate of the periods of cash settlement because it is not possible to reasonably predict the amount of tax, interest and penalties, if any, that might be assessed by a tax authority or the timing of an assessment or payment. It is also not possible to reasonably predict whether or not the applicable statutes of limitations might expire without us being examined by any particular tax authority. See note 12 to our consolidated financial statements and related notes that are included elsewhere in this Annual Report for additional information on our UTBs.
As of
December 31, 2017
, in connection with our acquisition of NYSE, we have obligations related to our pension and other benefit programs. The date of payment under these obligations cannot be determined and have been excluded from the table above. See note 15 to our consolidated financial statements and related notes that are included elsewhere in this Annual Report for additional information on our pension and other benefit programs.
We have a 40% ownership in OCC. Under the OCC’s capital plan, the OCC shareholders have committed to contribute up to $200 million in equity capital if certain capital thresholds are breached, including up to $80 million to be contributed by NYSE, which has also been excluded from the table above.
New and Recently Adopted Accounting Pronouncements
Refer to Note 2 to our consolidated financial statements and related notes included elsewhere in this Annual Report for information on the new and recently adopted accounting pronouncements that are applicable to us.
Critical Accounting Policies
We have identified the policies below as critical to our business operations and the understanding of our results of operations. The impact of, and any associated risks related to, these policies on our business operations is discussed throughout “- Management’s Discussion and Analysis of Financial Condition and Results of Operations.” For a detailed discussion on the application of these and other accounting policies, see note 2 to our consolidated financial statements and related notes included elsewhere in this Annual Report. Our discussion and analysis of our financial condition and results of operations are based upon our consolidated financial statements, which have been prepared in accordance with U.S. GAAP. The preparation of financial statements in conformity with these accounting principles requires us to make estimates and assumptions that affect the reported amount of assets and liabilities, and the disclosure of contingent assets and liabilities, at the date of our financial statements and the reported amounts of revenues and expenses during the reporting period.
We evaluate our estimates and judgments on an ongoing basis, including those related to the accounting matters described below. We base our estimates and judgments on our historical experience and other factors that we believe to be reasonable under the circumstances when we make these estimates and judgments. Based on these factors, we make estimates and judgments about, among other things, the carrying values of assets and liabilities that are not readily apparent from market prices or other independent sources and about the recognition and characterization of our revenues and expenses. The values and results based on these estimates and judgments could differ significantly under different assumptions or conditions and could change materially in the future.
We believe that the following critical accounting policies, among others, affect our more significant judgments and estimates used in the preparation of our consolidated financial statements and could materially increase or decrease our reported results, assets and liabilities.
Goodwill and Other Identifiable Intangible Assets
69
We have significant intangible assets related to goodwill and other acquired intangible assets. In connection with our acquisitions, assets acquired and liabilities assumed are recorded at their estimated fair values. Goodwill represents the excess of the purchase price of our acquisitions over the fair value of identifiable net assets acquired, including other identified intangible assets. We recognize specifically identifiable intangibles when a specific right or contract is acquired. Our determination of the fair value of the intangible assets and whether or not these assets are impaired requires us to make significant judgments and requires us to use significant estimates and assumptions regarding estimated future cash flows. If we change our strategy or if market conditions shift, our judgments may change, which may result in adjustments to recorded asset balances. As of
December 31, 2017
, we had goodwill of $12.2 billion and net other intangible assets of $10.3 billion relating to our acquisitions and our purchase of trademarks and Internet domain names from various third parties. We do not amortize goodwill or other intangible assets with indefinite useful lives. Intangible assets with finite useful lives are amortized over their estimated useful lives.
In performing the purchase price allocation, we consider, among other factors, the intended future use of acquired assets, analysis of historical financial performance and estimates of future performance of the acquired business. At the acquisition date, a preliminary allocation of the purchase price is recorded based upon a preliminary valuation. We continue to review and validate estimates, assumptions and valuation methodologies underlying the preliminary valuation during the measurement period. Accordingly, these estimates and assumptions are subject to change, which could have a material impact on our consolidated financial statements. The measurement period ends as soon as we receive the information about facts and circumstances that existed as of the acquisition date or we learn that more information is not obtainable, which usually does not exceed one year from the date of acquisition.
Our goodwill and other indefinite-lived intangible assets are evaluated for impairment annually in our fiscal fourth quarter or more frequently if conditions exist that indicate that the value may be impaired. We test our goodwill for impairment at the reporting unit level. These impairment evaluations are performed by comparing the carrying value of the goodwill of the reporting unit or other indefinite-lived intangibles to its estimated fair value. We allocate goodwill to reporting units based on the reporting unit expected to benefit from the business combination. We have identified four reporting units: our Futures reporting unit, our Data and Listings reporting unit, our Cash Equities reporting unit, and our CDS reporting unit.
Goodwill impairment testing consists of a two-step methodology. The initial step requires us to determine the fair value of each reporting unit and compare it to the carrying value, including goodwill and other intangible assets, of such reporting unit. If the fair value exceeds the carrying value, no impairment loss is recognized and the second step, which is a calculation of the impairment, is not performed. However, if the carrying value of the reporting unit exceeds its fair value, an impairment charge is recorded equal to the extent that the carrying amount of goodwill exceeds its implied fair value. For annual goodwill impairment testing, we have the option to first perform a qualitative assessment to determine whether it is more likely than not that the fair value of a reporting unit is less than its carrying amount, including goodwill and other intangible assets. If we conclude that this is the case, we must perform the two-step methodology described above. Otherwise, we can skip the two-step methodology and do not need to perform any further testing. For annual indefinite-lived intangible asset impairment testing, we also have the option to first perform a qualitative assessment to determine whether it is more likely than not that the fair value of the indefinite-lived intangible assets is less than its carrying amount.
Application of the impairment test requires judgment, including the identification of reporting units, assignment of assets and liabilities to reporting units, assignment of goodwill to reporting units, and determination of the fair value of each reporting unit. We have historically determined the fair value of our reporting units based on various valuation techniques, including discounted cash flow analysis and a multiple of earnings approach. In assessing whether goodwill and other intangible assets are impaired, we must make estimates and assumptions regarding future cash flows, long-term growth rates of our business, operating margins, discount rates, weighted average cost of capital and other factors to determine the fair value of our assets. These estimates and assumptions require management’s judgment, and changes to these estimates and assumptions, as a result of changing economic and competitive conditions, could materially affect the determination of fair value and/or impairment. The cash flows employed in the discounted cash flow analysis are based on our most recent budgets and business plans and, when applicable, various growth rates have been assumed for years beyond the current business plan period. Future events could cause us to conclude that indicators of impairment exist for goodwill or other intangible assets. Impairment may result from, among other things, deterioration in the performance of our business, adverse market conditions, adverse changes in applicable laws and regulations, competition, or the sale or disposition of a reporting unit. Any resulting impairment loss could have a material adverse impact on our financial condition and results of operations. Our impairment analysis has not resulted in any impairment of goodwill through
December 31, 2017
.
We are also required to evaluate other finite-lived intangible assets and property and equipment for impairment by first determining whether events or changes in circumstances indicate that the carrying value of these assets to be held and used may not be recoverable. If impairment indicators are present, then an estimate of undiscounted future cash flows produced by these long-lived assets is compared to the carrying value of those assets to determine if the asset is recoverable. If an asset is not recoverable, the loss is measured as the difference between fair value and carrying value of the impaired asset. Fair value of these assets is based on various valuation techniques, including discounted cash flow analysis.
70
In August 2016, we sold certain of Creditex’s U.S. voice brokerage operations to Tullett Prebon. During the third quarter of 2016, we discontinued Creditex’s U.K. voice brokerage operations. We continue to operate Creditex’s electronically traded markets and systems, post-trade connectivity platforms and intellectual property. After the sale and the discontinuance of the voice brokerage operations, it was determined that the carrying value of the CDS Creditex customer relationship intangible asset was not fully recoverable and an impairment of the asset was recorded in September 2016 for $33 million. The impairment was recorded as amortization expense in the consolidated statements of income for the year ended December 31, 2016.
Income Taxes
We are subject to income taxes in the U.S., U.K. and other foreign jurisdictions where we operate. The determination of our provision for income taxes and related accruals, deferred tax assets and liabilities requires significant judgment, the use of estimates, and the interpretation and application of complex tax laws. We recognize a current tax liability or tax asset for the estimated taxes payable or refundable on tax returns for the current year. We recognize deferred tax assets and liabilities for the expected future tax consequences of temporary differences between the financial statement carrying amounts and the tax bases of our assets and liabilities. We establish valuation allowances if we believe that it is more likely than not that some or all of our deferred tax assets will not be realized. Deferred tax assets and liabilities are measured using current enacted tax rates in effect for the years in which those temporary differences and carryforwards are expected to reverse.
SEC Staff Accounting Bulletin No. 118, or SAB 118, has provided guidance for companies that have not completed their accounting for the income tax effects of the TCJA in the period of enactment, allowing for a measurement period of up to one year after the enactment date to finalize the recording of the related tax impacts. As of December 31, 2017, we have not completed our accounting for the tax effects of the enactment of the TCJA, however, we have made a reasonable estimate of the effects on our deferred tax balances and in relation to the transition tax. In other cases, we have not been able to make a reasonable estimate and will continue to analyze the TCJA in order to finalize any related impacts within the measurement period. The FASB Staff also provided additional guidance to address the accounting for the effects of the provisions related to the taxation of Global Intangible Low-Taxed Income, or GILTI, noting that companies should make an accounting policy election to recognize deferred taxes for temporary basis differences expected to reverse as GILTI in future years or to include the tax expense in the year it is incurred. We have not completed our analysis of the effects of the GILTI provisions and will further consider the accounting policy election within the measurement period as provided for under SAB 118.
We do not recognize a tax benefit unless we conclude that it is more likely than not that the benefit will be sustained on audit by the taxing authority based solely on the technical merits of the associated tax position. If the recognition threshold is met, we recognize a tax benefit measured at the largest amount of the tax benefit that, in our judgment, is greater than 50 percent likely to be realized. We recognize accrued interest and penalties related to uncertain income tax positions as income tax expense in the consolidated statements of income.
We operate within multiple domestic and foreign taxing jurisdictions and are subject to audit in these jurisdictions by domestic and foreign tax authorities. These audits include questions regarding our tax filing positions, including the timing and amount of deductions taken and the allocation of income among various tax jurisdictions. We record accruals for the estimated outcomes of these audits, and the accruals may change in the future due to new developments in each matter. At any point in time, many tax years are subject to or in the process of being audited by various taxing authorities. To the extent our estimates of settlements change or the final tax outcome of these matters is different from the amounts recorded, such differences will impact the income tax provision in the period in which such determinations are made. Our income tax expense includes changes in our estimated liability for exposures associated with our various tax filing positions. Determining the income tax expense for these potential assessments requires management to make assumptions that are subject to factors such as proposed assessments by tax authorities, changes in facts and circumstances, issuance of new regulations, and resolution of tax audits.
We believe the judgments and estimates discussed above are reasonable. However, if actual results are not consistent with our estimates or assumptions, we may be exposed to losses or gains that could be material.
As a result of our operating and financing activities, we are exposed to market risks such as interest rate risk, foreign currency exchange rate risk and credit risk. We have implemented policies and procedures designed to measure, manage, monitor and report risk exposures, which are regularly reviewed by the appropriate management and supervisory bodies.
Interest Rate Risk
We have exposure to market risk for changes in interest rates relating to our cash and cash equivalents, short-term investments, short-term and long-term restricted cash and investments, and indebtedness. As of
December 31, 2017
and
2016
, our cash and cash equivalents, short-term investments and short-term and long-term restricted cash and cash equivalents were $1.6 billion and $1.4 billion, respectively, of which $293 million and $272 million, respectively, were denominated in pounds sterling, euros or Canadian
71
dollars. The remaining cash and cash equivalents, short-term investments and short-term and long-term restricted cash and cash equivalents are denominated in U.S. dollars. We do not use our investment portfolio for trading or other speculative purposes. A hypothetical decrease in long-term interest rates to zero basis points would decrease annual pre-tax earnings by $8 million as of
December 31, 2017
, assuming no change in the amount or composition of our cash and cash equivalents, short-term investments and short-term and long-term restricted cash and cash equivalents.
As of
December 31, 2017
, we had
$6.1 billion
in outstanding debt, of which $4.9 billion relates to our senior notes, which bear interest at fixed interest rates. The remaining amount outstanding of $1.2 billion relates to the Commercial Paper Program, which bears interest at fluctuating rates and, therefore, subjects us to interest rate risk. A hypothetical 100 basis point increase in long-term interest rates relating to the amounts outstanding under the Commercial Paper Program as of
December 31, 2017
would decrease annual pre-tax earnings by $12 million, assuming no change in the volume or composition of our outstanding indebtedness and no hedging activity. See Item 7 “- Management’s Discussion and Analysis of Financial Condition and Results of Operations - Debt” included elsewhere in this Annual Report.
The interest rates on our Commercial Paper Program are currently evaluated based upon current maturities and market conditions. The weighted average interest rate on our Commercial Paper Program increased from 0.74% as of December 31, 2016 to 1.49% as of December 31, 2017. The increase in the Commercial Paper Program weighted average interest rate was primarily due to the decisions by the U.S. Federal Reserve in March 2017, in June 2017 and in December 2017 to increase the federal funds short-term interest rate by an aggregate 75 basis points to 1.50%. The Federal Reserve also signaled that they intend to continue to increase the federal fund short-term interest rate over the next several years, and if this occurs, this will continue to increase the weighted average interest rate on our Commercial Paper Program.
Foreign Currency Exchange Rate Risk
As an international business, we are subject to foreign currency exchange rate risk. We may experience gains or losses from foreign currency transactions in the future given that a significant part of our assets, liabilities, revenues and expenses are recorded in pounds sterling or euros. Certain assets, liabilities, revenues and expenses of foreign subsidiaries are denominated in the local functional currency of such subsidiaries. Our exposure to foreign denominated earnings for the years ended
December 31, 2017
and
2016
is presented by primary foreign currency in the following table (dollars in millions, except exchange rates):
|
|
Year Ended December 31, 2017
|
Year Ended December 31, 2016
|
|||||||||||||
|
|
Pound Sterling
|
|
Euro
|
Pound Sterling
|
|
Euro
|
|||||||||
|
Average exchange rate to the U.S. dollar
|
$
|
1.2890
|
|
|
$
|
1.1297
|
|
$
|
1.3603
|
|
|
$
|
1.1075
|
|
|
|
Average exchange rate to the U.S. dollar for the prior year
|
$
|
1.3603
|
|
|
$
|
1.1075
|
|
$
|
1.5292
|
|
|
$
|
1.1117
|
|
|
|
Average exchange rate change from prior year
|
(5
|
)%
|
2
|
%
|
(11
|
)%
|
—
|
%
|
|||||||
|
Foreign denominated percentage of:
|
|
|
|
|
|
|
|||||||||
|
Revenues, less transaction-based expenses
|
10
|
%
|
|
4
|
%
|
10
|
%
|
|
5
|
%
|
|||||
|
Operating expenses
|
12
|
%
|
|
3
|
%
|
14
|
%
|
|
4
|
%
|
|||||
|
Operating income
|
9
|
%
|
|
6
|
%
|
7
|
%
|
|
7
|
%
|
|||||
|
Impact of the currency fluctuations
(1)
on:
|
|
|
|
|
|||||||||||
|
Revenues, less transaction-based expenses
|
$
|
(26
|
)
|
|
$
|
4
|
|
$
|
(58
|
)
|
|
$
|
(1
|
)
|
|
|
Operating expenses
|
$
|
(14
|
)
|
|
$
|
1
|
|
$
|
(40
|
)
|
|
$
|
—
|
|
|
|
Operating income
|
$
|
(12
|
)
|
|
$
|
3
|
|
$
|
(18
|
)
|
|
$
|
(1
|
)
|
|
|
(1)
|
Represents the impact of currency fluctuation for the year compared to the same period in the prior year.
|
We have a significant part of our assets, liabilities, revenues and expenses recorded in pounds sterling or euros. For the years ended
December 31, 2017
, 2016 and 2015, 15%, 15% and 15%, respectively, of our consolidated revenues, less transaction-based expenses, were denominated in pounds sterling or euros, and 14%, 18%, and 12%, respectively, of our consolidated operating expenses were denominated in pounds sterling or euros. As the pound sterling or euro exchange rate changes, the U.S. equivalent of revenues and expenses denominated in foreign currencies changes accordingly.
We have foreign currency transaction risk related to the settlement of foreign currency denominated assets, liabilities and payables that occur through our operations, which are received in or paid in pounds sterling or euros, due to the increase or decrease in the foreign currency exchange rates between periods. We had foreign currency transaction losses of $4 million, $1 million and $14 million for the years ended
December 31, 2017
,
2016
and
2015
, respectively. The foreign currency transactions losses were primarily attributable to the fluctuations of the pound sterling and euro relative to the U.S. dollar. A 10% adverse change in the underlying foreign currency exchange rates as of
December 31, 2017
would result in a foreign currency transaction loss of $3 million, assuming no change in the composition of the foreign currency denominated assets, liabilities and payables and assuming no hedging activity.
72
We entered into foreign currency hedging transactions during years ended
December 31, 2017
,
2016
and
2015
as economic hedges to help mitigate a portion of our foreign exchange risk exposure and may enter into additional hedging transactions in the future to help mitigate our foreign exchange risk exposure. Although we may enter into additional hedging transactions in the future to help mitigate our foreign exchange risk exposure, these hedging arrangements may not be effective, particularly in the event of imprecise forecasts of the levels of our non-U.S. denominated assets and liabilities.
We have foreign currency translation risk equal to our net investment in our foreign subsidiaries. The financial statements of these subsidiaries are translated into U.S. dollars using a current rate of exchange, with gains or losses included in the cumulative translation adjustment account, a component of equity. Our exposure to the net investment in foreign currencies is presented by primary foreign currencies in the table below (in millions):
|
|
As of December 31, 2017
|
||||||||||
|
|
Position in pounds sterling
|
|
Position in Canadian dollars
|
Position in euros
|
|||||||
|
Assets
|
£
|
829
|
|
|
C$
|
1,654
|
|
€
|
145
|
|
|
|
of which goodwill represents
|
268
|
|
|
162
|
|
43
|
|
||||
|
Liabilities
|
96
|
|
|
1,026
|
|
42
|
|
||||
|
Net currency position
|
£
|
733
|
|
|
C$
|
628
|
|
€
|
103
|
|
|
|
Impact on consolidated equity of a 10% decrease in foreign currency exchange rates
|
$
|
99
|
|
|
$
|
50
|
|
$
|
12
|
|
|
As of
December 31, 2017
and
2016
, the portion of our equity attributable to accumulated other comprehensive loss from foreign currency translation was $136 million and $345 million, respectively. As of
December 31, 2017
, we had net exposure of pounds sterling, Canadian dollars and euros of £733 million ($990 million), C$628 million ($500 million), and €103 million ($124 million), respectively. Based on these
December 31, 2017
net currency positions, a hypothetical 10% decrease of pound sterling against U.S. dollar would negatively impact our equity by $99 million, a hypothetical 10% decrease of Canadian dollar against U.S. dollar would negatively impact our equity by $50 million, and a hypothetical 10% decrease of euro against U.S. dollar would negatively impact our equity by $12 million. For the years ended
December 31, 2017
,
2016
and
2015
, currency exchange rate differences had a positive/(negative) impact of $209 million, ($300 million) and ($58 million), respectively, on our consolidated equity. The increase for the year ended
December 31, 2017
is primarily due to the increase in the pound sterling/U.S. dollar exchange rate to 1.3510 as of December 31, 2017 (from 1.2336 as of December 31, 2016) due to the strengthening pound sterling. The decrease for the year ended December 31, 2016 is primarily due to the decrease in the pound sterling/U.S. dollar exchange rate to 1.2336 as of December 31, 2016 (from 1.4868 as of December 31, 2015) due to the weakening pound sterling. The pound sterling decreased starting in June 2016 following the U.K. referendum that resulted in a vote for the U.K. to leave the EU. The future impact on our business relating to the U.K. leaving the EU and the corresponding regulatory changes are uncertain at this time, including future impacts on currency exchange rates.
Credit Risk
We are exposed to credit risk in our operations in the event of a counterparty default. We limit our exposure to credit risk by rigorously selecting the counterparties with which we make our investments and execute agreements.
Clearing House Cash Deposit Risks
Our clearing houses hold material amounts of clearing member cash deposits which are held or invested primarily to provide security of capital while minimizing credit, market and liquidity risks. Refer to note 13 to our consolidated financial statements, which are included elsewhere in this Annual Report, for more information about clearing house cash deposits and delivery contracts, which were
$51.2 billion
as of
December 31, 2017
. While we seek to achieve a reasonable rate of return which may generate interest income for our clearing members, we are primarily concerned with preservation of capital and managing the risks associated with these deposits. As the clearing houses may pass on interest revenues (minus costs) to the members, this could include negative or reduced yield due to market conditions. The following is a summary of the risks associated with these deposits and how these risks are mitigated.
Credit Risk
When a clearing house has the ability to hold cash collateral at a central bank, the clearing house utilizes its access to the central bank system to minimize credit risk exposures. Credit risk is monitored by using exposure limits reflecting a number of factors including ratings assigned by rating agencies, CDS spreads and internal ratings, as well as the nature and maturity of transactions. We seek to substantially mitigate credit risk associated with investments by ensuring financial assets are placed with governments, well-capitalized financial institutions and other creditworthy counterparties.
73
An ongoing review is performed to evaluate changes in the financial status of counterparties. In addition to the intrinsic creditworthiness of counterparties, our policies require diversification of counterparties (banks, financial institutions, bond issuers and funds) to avoid a concentration of risk.
Liquidity Risk
Liquidity risk is the risk a clearing house may not be able to meet its payment obligations in the right currency, in the right place and the right time. To mitigate this risk, the clearing houses monitor liquidity requirements closely and maintain funds and assets in a manner which minimizes the risk of loss or delay in the access by the clearing house to such funds and assets. For example, holding funds with a central bank where possible or making only short term investments such as overnight reverse repurchase agreements serves to reduce liquidity risks.
Interest Rate Risk
Interest rate risk is the risk that interest rates rise causing the value of purchased securities to decline. If we were required to sell securities prior to maturity, and interest rates had risen, the sale of the securities might be made at a loss relative to the latest market price. Our clearing houses seek to manage this risk by making short term investments of cash deposits. For example, where possible and in accordance with regulatory requirements, the clearing houses invest cash pursuant to overnight reverse repurchase agreements or term reverse repurchase agreements with short dated maturities. In addition, the clearing house investment guidelines allow for direct purchases of high quality sovereign debt (for example, U.S. Treasury securities) and supranational debt instruments (Euro cash deposits only) with short dated maturities.
Security Issuer Risk
Security issuer risk is the risk that an issuer of a security defaults on its payment when the security matures. This risk is mitigated by limiting allowable investments under the reverse repurchase agreements to high quality sovereign or government agency debt and limiting any direct investments to high quality sovereign debt instruments.
Investment Counterparty Risk
Investment counterparty risk is the risk that a reverse repurchase agreement counterparty might become insolvent and, thus, fail to meet its obligations to our clearing houses. We mitigate this risk by only engaging in transactions with high credit quality reverse repurchase agreement counterparties and by limiting the acceptable collateral under the repurchase agreement to high quality issuers. When engaging in reverse repurchase agreements, our clearing houses take delivery of the underlying reverse repurchase securities in custody accounts under clearing house control. Additionally, the securities purchased subject to reverse repurchase have a market value greater than the reverse repurchase amount. The typical haircut received for high quality sovereign debt is 2% of the reverse repurchase amount. Thus, in the event that a reverse repurchase counterparty defaults on its obligation to repurchase the underlying reverse repurchase securities, our clearing house will have possession of a security with a value potentially greater than the reverse repurchase counterparty’s obligation to the clearing house.
Our clearing houses may use third party investment advisors who make investments subject to the guidelines provided to them by the clearing house. Such investment advisors do not hold clearing member cash deposits or the underlying investments. Clearing house property is held in custody accounts under clearing house control. Clearing house property is held with credit worthy custodians including JPMorgan Chase Bank N.A., Citibank N.A., BNY Mellon, BMO Harris N.A. and Euroclear Bank Brussels (for non-U.S. dollar deposits). Each clearing house employs (or may employ) multiple investment advisors and custodians to ensure that in the event a single investment advisor or custodian is unable to fulfill its role, additional investment advisors or custodians are available as alternatives.
Cross-Currency Margin Deposit Risk
Each of our clearing houses, pursuant to their rules, may permit posting of cross-currency collateral to satisfy margin requirements (for example, accepting margin deposits denominated in U.S. dollars to secure a Euro margin obligation). The clearing houses mitigate the risk of a decline in currency value by applying a “haircut” to the currency posted as margin at a level sufficient to provide financial protection during periods of high currency volatility. Cross-currency balances are marked-to-market on a daily basis. Should the currency posted to satisfy margin requirements decline in value, the clearing member is required to increase its margin deposit on a same-day basis.
Impact of Inflation
We have not been adversely affected by inflation as technological advances and competition have generally caused prices for the hardware and software that we use for our electronic platforms to remain constant. In the event of inflation, we believe that we will be able to pass on any price increases to our participants, as the prices that we charge are not governed by long-term contracts.
74
ITEM 8.
FINANCIAL STATEMENTS AND SUPPLEMENTARY DATA
INDEX TO CONSOLIDATED FINANCIAL STATEMENTS
|
Page
|
|
|
Intercontinental Exchange, Inc. and Subsidiaries:
|
|
|
Report of Management on Internal Control over Financial Reporting
|
|
|
Report of Independent Registered Public Accounting Firm on Internal Control Over Financial Reporting
|
|
|
Report of Independent Registered Public Accounting Firm on Financial Statements
|
|
|
Consolidated Balance Sheets as of December 31, 2017 and 2016
|
|
|
Consolidated Statements of Income for the Years Ended December 31, 2017, 2016 and 2015
|
|
|
Consolidated Statements of Comprehensive Income for the Years Ended December 31, 2017, 2016 and 2015
|
|
|
Consolidated Statements of Changes in Equity, Accumulated Other Comprehensive Income (Loss) and Redeemable Non-Controlling Interest for the Years Ended December 31, 2017, 2016 and 2015
|
|
|
Consolidated Statements of Cash Flows for the Years Ended December 31, 2017, 2016 and 2015
|
|
|
Notes to Consolidated Financial Statements
|
|
75
REPORT OF MANAGEMENT ON INTERNAL CONTROL OVER FINANCIAL REPORTING
Our management is responsible for the preparation and integrity of the consolidated financial statements appearing in our Annual Report on Form 10-K. The financial statements were prepared in conformity with generally accepted accounting principles appropriate in the circumstances and, accordingly, include certain amounts based on our best judgments and estimates.
Our management is responsible for establishing and maintaining adequate internal control over financial reporting as such term is defined in Rule 13a-15(f) and 15d-a5(f) under the Securities Exchange Act of 1934 (“Exchange Act”). Our internal control over financial reporting is designed to provide reasonable assurance regarding the reliability of financial reporting and the preparation of the consolidated financial statements. Our internal control over financial reporting is supported by a program of internal audits and appropriate reviews by management, written policies and guidelines, careful selection and training of qualified personnel and a written Global Code of Business Conduct adopted by our Board of Directors, applicable to all of our directors and all officers and all of our employees.
Because of its inherent limitations, internal control over financial reporting may not prevent or detect misstatements and even when determined to be effective, can only provide reasonable assurance with respect to financial statement preparation and presentation. Also, projections of any evaluation of effectiveness to future periods are subject to the risk that controls may become inadequate because of changes in conditions, or that the degree of compliance with the policies or procedures may deteriorate.
Management assessed the effectiveness of our internal control over financial reporting as of December 31, 2017. In making this assessment, management used the criteria set forth by the Committee of Sponsoring Organizations of the Treadway Commission (“COSO”) in Internal Control - Integrated Framework (2013 framework). Based on our assessment, management believes that we maintained effective internal control over financial reporting as of December 31, 2017.
As permitted by SEC regulations, our management has excluded Natural Gas Exchange Inc. from its assessment of internal control over financial reporting as of December 31, 2017 since Natural Gas Exchange Inc. was acquired in a purchase business combination on December 14, 2017. Natural Gas Exchange Inc. is a wholly-owned subsidiary and had total and net assets not subject to our assessment of internal controls of $1.1 billion and $301 million, respectively, as of December 31, 2017.
Our independent auditors, Ernst & Young LLP, a registered public accounting firm, are appointed by the Audit Committee, subject to ratification by our shareholders. Ernst & Young LLP has audited and reported on our consolidated financial statements and the effectiveness of our internal control over financial reporting. The reports of our independent registered public accounting firm are contained in this Annual Report.
|
/s/ Jeffrey C. Sprecher
|
/s/ Scott A. Hill
|
|
|
Jeffrey C. Sprecher
|
Scott A. Hill
|
|
|
Chairman of the Board and
|
Chief Financial Officer
|
|
|
Chief Executive Officer
|
||
|
February 7, 2018
|
February 7, 2018
|
|
76
REPORT OF INDEPENDENT REGISTERED PUBLIC ACCOUNTING FIRM
ON INTERNAL CONTROL OVER FINANCIAL REPORTING
To the Shareholders and the Board of Directors of Intercontinental Exchange, Inc.
Opinion on Internal Control Over Financial Reporting
We have audited Intercontinental Exchange, Inc. and Subsidiaries’ internal control over financial reporting as of December 31, 2017, based on criteria established in Internal Control-Integrated Framework issued by the Committee of Sponsoring Organizations of the Treadway Commission (2013 framework) (the COSO criteria). In our opinion, Intercontinental Exchange, Inc. and Subsidiaries’ (the Company) maintained, in all material respects, effective internal control over financial reporting as of December 31, 2017, based on the COSO criteria.
As indicated in the accompanying “Report of Management on Internal Control over Financial Reporting”, management’s assessment of and conclusion on the effectiveness of internal control over financial reporting did not include the internal controls of Natural Gas Exchange Inc., which is included in the 2017 consolidated financial statements of the Company and constituted $1.1 billion and $301 million of total and net assets, respectively, as of December 31, 2017. Our audit of internal control over financial reporting of the Company also did not include an evaluation of the internal control over financial reporting of Natural Gas Exchange Inc.
We also have audited, in accordance with the standards of the Public Company Accounting Oversight Board (United States) (PCAOB), the consolidated balance sheets of Intercontinental Exchange, Inc. and Subsidiaries as of December 31, 2017 and 2016, and the related consolidated statements of income, comprehensive income, changes in equity, accumulated other comprehensive income (loss) and redeemable non-controlling interest, and cash flows for each of the three years in the period ended December 31, 2017 of the Company, and our report dated February 7, 2018 expressed an unqualified opinion thereon.
Basis for Opinion
The Company’s management is responsible for maintaining effective internal control over financial reporting and for its assessment of the effectiveness of internal control over financial reporting included in the accompanying “Report of Management on Internal Control Over Financial Reporting”. Our responsibility is to express an opinion on the Company’s internal control over financial reporting based on our audit. We are a public accounting firm registered with the PCAOB and are required to be independent with respect to the Company in accordance with the U.S. federal securities laws and the applicable rules and regulations of the Securities and Exchange Commission and the PCAOB.
We conducted our audit in accordance with the standards of the PCAOB. Those standards require that we plan and perform the audit to obtain reasonable assurance about whether effective internal control over financial reporting was maintained in all material respects.
Our audit included obtaining an understanding of internal control over financial reporting, assessing the risk that a material weakness exists, testing and evaluating the design and operating effectiveness of internal control based on the assessed risk, and performing such other procedures as we considered necessary in the circumstances. We believe that our audit provides a reasonable basis for our opinion.
Definition and Limitations of Internal Control Over Financial Reporting
A company’s internal control over financial reporting is a process designed to provide reasonable assurance regarding the reliability of financial reporting and the preparation of financial statements for external purposes in accordance with generally accepted accounting principles. A company’s internal control over financial reporting includes those policies and procedures that (1) pertain to the maintenance of records that, in reasonable detail, accurately and fairly reflect the transactions and dispositions of the assets of the company; (2) provide reasonable assurance that transactions are recorded as necessary to permit preparation of financial statements in accordance with generally accepted accounting principles, and that receipts and expenditures of the company are being made only in accordance with authorizations of management and directors of the company; and (3) provide reasonable assurance regarding prevention or timely detection of unauthorized acquisition, use, or disposition of the company’s assets that could have a material effect on the financial statements.
Because of its inherent limitations, internal control over financial reporting may not prevent or detect misstatements. Also, projections of any evaluation of effectiveness to future periods are subject to the risk that controls may become inadequate because of changes in conditions, or that the degree of compliance with the policies or procedures may deteriorate.
/s/ Ernst & Young LLP
Atlanta, Georgia
February 7, 2018
77
REPORT OF INDEPENDENT REGISTERED PUBLIC ACCOUNTING FIRM
ON FINANCIAL STATEMENTS
To the Shareholders and the Board of Directors of Intercontinental Exchange, Inc.
Opinion on the Financial Statements
We have audited the accompanying consolidated balance sheets of Intercontinental Exchange, Inc. and Subsidiaries (the Company) as of December 31, 2017 and 2016, and the related consolidated statements of income, comprehensive income, changes in equity, accumulated other comprehensive income (loss) and redeemable non-controlling interest, and cash flows for each of the three years in the period ended December 31, 2017, and the related notes (collectively referred to as the “financial statements”). In our opinion, the financial statements present fairly, in all material respects, the consolidated financial position of the Company at December 31, 2017 and 2016, and the consolidated results of its operations and its cash flows for each of the three years in the period ended December 31, 2017, in conformity with U.S. generally accepted accounting principles.
We also have audited, in accordance with the standards of the Public Company Accounting Oversight Board (United States) (PCAOB), the Company’s internal control over financial reporting as of December 31, 2017, based on criteria established in Internal Control-Integrated Framework issued by the Committee of Sponsoring Organizations of the Treadway Commission (2013 Framework), and our report dated February 7, 2018 expressed an unqualified opinion thereon.
Basis for Opinion
These financial statements are the responsibility of the Company’s management. Our responsibility is to express an opinion on the Company’s financial statements based on our audits. We are a public accounting firm registered with the PCAOB and are required to be independent with respect to the Company in accordance with the U.S. federal securities laws and the applicable rules and regulations of the Securities and Exchange Commission and the PCAOB.
We conducted our audits in accordance with the standards of the PCAOB. Those standards require that we plan and perform the audit to obtain reasonable assurance about whether the financial statements are free of material misstatement, whether due to error or fraud. Our audits included performing procedures to assess the risks of material misstatement of the financial statements, whether due to error or fraud, and performing procedures that respond to those risks. Such procedures included examining, on a test basis, evidence regarding the amounts and disclosures in the financial statements. Our audits also included evaluating the accounting principles used and significant estimates made by management, as well as evaluating the overall presentation of the financial statements. We believe that our audits provide a reasonable basis for our opinion.
/s/ Ernst & Young LLP
We have served as the Company’s auditor since 2002.
Atlanta, Georgia
February 7, 2018
78
Intercontinental Exchange, Inc. and Subsidiaries
(In millions, except per share amounts)
|
As of December 31,
|
|||||||
|
2017
|
2016
|
||||||
|
Assets:
|
|||||||
|
Current assets:
|
|||||||
|
Cash and cash equivalents
|
$
|
535
|
|
$
|
407
|
|
|
|
Short-term restricted cash and cash equivalents
|
769
|
|
679
|
|
|||
|
Short-term investments
|
16
|
|
23
|
|
|||
|
Customer accounts receivable, net of allowance for doubtful accounts of $6 and $7 at December 31, 2017 and 2016, respectively
|
903
|
|
777
|
|
|||
|
Margin deposits, guaranty funds and delivery contracts receivable
|
51,222
|
|
55,150
|
|
|||
|
Prepaid expenses and other current assets
|
117
|
|
97
|
|
|||
|
Total current assets
|
53,562
|
|
57,133
|
|
|||
|
Property and equipment, net
|
1,246
|
|
1,129
|
|
|||
|
Other non-current assets:
|
|||||||
|
Goodwill
|
12,216
|
|
12,291
|
|
|||
|
Other intangible assets, net
|
10,269
|
|
10,420
|
|
|||
|
Long-term restricted cash and cash equivalents
|
264
|
|
264
|
|
|||
|
Long-term investments
|
—
|
|
432
|
|
|||
|
Other non-current assets
|
707
|
|
334
|
|
|||
|
Total other non-current assets
|
23,456
|
|
23,741
|
|
|||
|
Total assets
|
$
|
78,264
|
|
$
|
82,003
|
|
|
|
Liabilities and Equity:
|
|||||||
|
Current liabilities:
|
|||||||
|
Accounts payable and accrued liabilities
|
$
|
462
|
|
$
|
388
|
|
|
|
Section 31 fees payable
|
128
|
|
131
|
|
|||
|
Accrued salaries and benefits
|
227
|
|
230
|
|
|||
|
Deferred revenue
|
121
|
|
114
|
|
|||
|
Short-term debt
|
1,833
|
|
2,493
|
|
|||
|
Margin deposits, guaranty funds and delivery contracts payable
|
51,222
|
|
55,150
|
|
|||
|
Other current liabilities
|
178
|
|
111
|
|
|||
|
Total current liabilities
|
54,171
|
|
58,617
|
|
|||
|
Non-current liabilities:
|
|||||||
|
Non-current deferred tax liability, net
|
2,283
|
|
2,958
|
|
|||
|
Long-term debt
|
4,267
|
|
3,871
|
|
|||
|
Accrued employee benefits
|
243
|
|
430
|
|
|||
|
Other non-current liabilities
|
348
|
|
337
|
|
|||
|
Total non-current liabilities
|
7,141
|
|
7,596
|
|
|||
|
Total liabilities
|
61,312
|
|
66,213
|
|
|||
|
Commitments and contingencies
|
|
|
|
|
|||
|
Redeemable non-controlling interest
|
—
|
|
36
|
|
|||
|
Equity:
|
|||||||
|
Intercontinental Exchange, Inc. shareholders’ equity:
|
|||||||
|
Preferred stock, $0.01 par value; 100 shares authorized; no shares issued or outstanding at December 31, 2017 and 2016
|
—
|
|
—
|
|
|||
|
Common stock, $0.01 par value; 1,500 shares authorized; 600 and 583 shares issued and outstanding at December 31, 2017, respectively, and 596 and 595 shares issued and outstanding at December 31, 2016, respectively
|
6
|
|
6
|
|
|||
|
Treasury stock, at cost; 17 and 1 shares at December 31, 2017 and 2016, respectively
|
(1,076
|
)
|
(40
|
)
|
|||
|
Additional paid-in capital
|
11,392
|
|
11,306
|
|
|||
|
Retained earnings
|
6,825
|
|
4,789
|
|
|||
|
Accumulated other comprehensive loss
|
(223
|
)
|
(344
|
)
|
|||
|
Total Intercontinental Exchange, Inc. shareholders’ equity
|
16,924
|
|
15,717
|
|
|||
|
Non-controlling interest in consolidated subsidiaries
|
28
|
|
37
|
|
|||
|
Total equity
|
16,952
|
|
15,754
|
|
|||
|
Total liabilities and equity
|
$
|
78,264
|
|
$
|
82,003
|
|
|
See accompanying notes.
79
Intercontinental Exchange, Inc. and Subsidiaries
(In millions, except per share amounts)
|
Year Ended December 31,
|
|||||||||||
|
2017
|
2016
|
2015
|
|||||||||
|
Revenues:
|
|||||||||||
|
Transaction and clearing, net
|
$
|
3,131
|
|
$
|
3,384
|
|
$
|
3,228
|
|
||
|
Data services
|
2,084
|
|
1,978
|
|
871
|
|
|||||
|
Listings
|
417
|
|
419
|
|
405
|
|
|||||
|
Other revenues
|
202
|
|
177
|
|
178
|
|
|||||
|
Total revenues
|
5,834
|
|
5,958
|
|
4,682
|
|
|||||
|
Transaction-based expenses:
|
|||||||||||
|
Section 31 fees
|
372
|
|
389
|
|
349
|
|
|||||
|
Cash liquidity payments, routing and clearing
|
833
|
|
1,070
|
|
995
|
|
|||||
|
Total revenues, less transaction-based expenses
|
4,629
|
|
4,499
|
|
3,338
|
|
|||||
|
Operating expenses:
|
|||||||||||
|
Compensation and benefits
|
937
|
|
945
|
|
611
|
|
|||||
|
Professional services
|
121
|
|
137
|
|
139
|
|
|||||
|
Acquisition-related transaction and integration costs
|
36
|
|
80
|
|
88
|
|
|||||
|
Technology and communication
|
397
|
|
374
|
|
203
|
|
|||||
|
Rent and occupancy
|
69
|
|
70
|
|
57
|
|
|||||
|
Selling, general and administrative
|
155
|
|
116
|
|
116
|
|
|||||
|
Depreciation and amortization
|
535
|
|
610
|
|
374
|
|
|||||
|
Total operating expenses
|
2,250
|
|
2,332
|
|
1,588
|
|
|||||
|
Operating income
|
2,379
|
|
2,167
|
|
1,750
|
|
|||||
|
Other income (expense):
|
|||||||||||
|
Interest expense
|
(187
|
)
|
(178
|
)
|
(97
|
)
|
|||||
|
Other income, net
|
325
|
|
40
|
|
—
|
|
|||||
|
Other income (expense), net
|
138
|
|
(138
|
)
|
(97
|
)
|
|||||
|
Income before income tax expense (benefit)
|
2,517
|
|
2,029
|
|
1,653
|
|
|||||
|
Income tax expense (benefit)
|
(25
|
)
|
580
|
|
358
|
|
|||||
|
Net income
|
$
|
2,542
|
|
$
|
1,449
|
|
$
|
1,295
|
|
||
|
Net income attributable to non-controlling interest
|
(28
|
)
|
(27
|
)
|
(21
|
)
|
|||||
|
Net income attributable to Intercontinental Exchange, Inc.
|
$
|
2,514
|
|
$
|
1,422
|
|
$
|
1,274
|
|
||
|
Earnings per share attributable to Intercontinental Exchange, Inc. common shareholders:
|
|||||||||||
|
Basic
|
$
|
4.27
|
|
$
|
2.39
|
|
$
|
2.29
|
|
||
|
Diluted
|
$
|
4.23
|
|
$
|
2.37
|
|
$
|
2.28
|
|
||
|
Weighted average common shares outstanding:
|
|||||||||||
|
Basic
|
589
|
|
595
|
|
556
|
|
|||||
|
Diluted
|
594
|
|
599
|
|
559
|
|
|||||
|
Dividend per share
|
$
|
0.80
|
|
$
|
0.68
|
|
$
|
0.58
|
|
||
See accompanying notes.
80
Intercontinental Exchange, Inc. and Subsidiaries
Consolidated Statements of Comprehensive Income
(In millions)
|
Year Ended December 31,
|
|||||||||||
|
2017
|
2016
|
2015
|
|||||||||
|
Net income
|
$
|
2,542
|
|
$
|
1,449
|
|
$
|
1,295
|
|
||
|
Other comprehensive income (loss):
|
|||||||||||
|
Foreign currency translation adjustments, net of tax benefit of ($6), ($22) and ($4) for the years ended December 31, 2017, 2016 and 2015, respectively
|
133
|
|
(300
|
)
|
(58
|
)
|
|||||
|
Change in fair value of available-for-sale securities
|
68
|
|
134
|
|
(81
|
)
|
|||||
|
Reclassification of realized gain on available-for-sale investment to other income
|
(176
|
)
|
—
|
|
—
|
|
|||||
|
Reclassification of foreign currency translation loss on sale of Trayport to other expense
|
76
|
|
—
|
|
—
|
|
|||||
|
Comprehensive income from equity method investment
|
—
|
|
—
|
|
2
|
|
|||||
|
Employee benefit plan net gains (losses), net of tax expense of $8 and $7 for the years ended December 31, 2017 and 2016, respectively
|
20
|
|
10
|
|
(5
|
)
|
|||||
|
Other comprehensive income (loss)
|
121
|
|
(156
|
)
|
(142
|
)
|
|||||
|
Comprehensive income
|
$
|
2,663
|
|
$
|
1,293
|
|
$
|
1,153
|
|
||
|
Comprehensive income attributable to non-controlling interest
|
(28
|
)
|
(27
|
)
|
(21
|
)
|
|||||
|
Comprehensive income attributable to Intercontinental Exchange, Inc.
|
$
|
2,635
|
|
$
|
1,266
|
|
$
|
1,132
|
|
||
See accompanying notes.
81
Intercontinental Exchange, Inc. and Subsidiaries
Consolidated Statements of Changes in Equity, Accumulated Other Comprehensive Income (Loss)
and Redeemable Non-Controlling Interest
(In millions)
|
Intercontinental Exchange, Inc. Shareholders' Equity
|
Non-
Controlling
Interest in
Consolidated
Subsidiaries
|
Total
Equity
|
Redeemable Non-controlling Interest
|
||||||||||||||||||||||||||||||||||
|
Common
Stock
|
Treasury Stock
|
Additional
Paid-in
Capital
|
Retained
Earnings
|
Accumulated
Other
Comprehensive
Income (Loss)
|
|||||||||||||||||||||||||||||||||
|
Shares
|
Value
|
Shares
|
Value
|
||||||||||||||||||||||||||||||||||
|
Balance, as of January 1, 2015
|
579
|
|
$
|
6
|
|
(19
|
)
|
$
|
(743
|
)
|
$
|
9,933
|
|
$
|
3,210
|
|
$
|
(46
|
)
|
$
|
32
|
|
$
|
12,392
|
|
$
|
165
|
|
|||||||||
|
Other comprehensive loss
|
—
|
|
—
|
|
—
|
|
—
|
|
—
|
|
—
|
|
(142
|
)
|
—
|
|
(142
|
)
|
—
|
|
|||||||||||||||||
|
Stock consideration issued for Interactive Data and Trayport acquisitions
|
45
|
|
—
|
|
—
|
|
—
|
|
2,197
|
|
—
|
|
—
|
|
—
|
|
2,197
|
|
—
|
|
|||||||||||||||||
|
Exercise of common stock options
|
—
|
|
—
|
|
—
|
|
—
|
|
19
|
|
—
|
|
—
|
|
—
|
|
19
|
|
—
|
|
|||||||||||||||||
|
Repurchases of common stock
|
—
|
|
—
|
|
(14
|
)
|
(660
|
)
|
—
|
|
—
|
|
—
|
|
—
|
|
(660
|
)
|
—
|
|
|||||||||||||||||
|
Payments relating to treasury shares
|
—
|
|
—
|
|
(1
|
)
|
(45
|
)
|
—
|
|
—
|
|
—
|
|
—
|
|
(45
|
)
|
—
|
|
|||||||||||||||||
|
Stock-based compensation
|
—
|
|
—
|
|
—
|
|
—
|
|
122
|
|
—
|
|
—
|
|
—
|
|
122
|
|
—
|
|
|||||||||||||||||
|
Issuance of restricted stock
|
4
|
|
—
|
|
—
|
|
—
|
|
—
|
|
—
|
|
—
|
|
—
|
|
—
|
|
—
|
|
|||||||||||||||||
|
Tax benefits from stock option plans
|
—
|
|
—
|
|
—
|
|
—
|
|
19
|
|
—
|
|
—
|
|
—
|
|
19
|
|
—
|
|
|||||||||||||||||
|
Adjustment to redemption value
|
—
|
|
—
|
|
—
|
|
—
|
|
—
|
|
(5
|
)
|
—
|
|
—
|
|
(5
|
)
|
4
|
|
|||||||||||||||||
|
Distributions of profits
|
—
|
|
—
|
|
—
|
|
—
|
|
—
|
|
—
|
|
—
|
|
(16
|
)
|
(16
|
)
|
(11
|
)
|
|||||||||||||||||
|
Dividends paid to shareholders
|
—
|
|
—
|
|
—
|
|
—
|
|
—
|
|
(331
|
)
|
—
|
|
—
|
|
(331
|
)
|
—
|
|
|||||||||||||||||
|
Purchase of subsidiary shares
|
—
|
|
—
|
|
—
|
|
—
|
|
—
|
|
—
|
|
—
|
|
—
|
|
—
|
|
(128
|
)
|
|||||||||||||||||
|
Net income attributable to non-controlling interest
|
—
|
|
—
|
|
—
|
|
—
|
|
—
|
|
(21
|
)
|
—
|
|
16
|
|
(5
|
)
|
5
|
|
|||||||||||||||||
|
Net income
|
—
|
|
—
|
|
—
|
|
—
|
|
—
|
|
1,295
|
|
—
|
|
—
|
|
1,295
|
|
—
|
|
|||||||||||||||||
|
Balance, as of December 31, 2015
|
628
|
|
6
|
|
(34
|
)
|
(1,448
|
)
|
12,290
|
|
4,148
|
|
(188
|
)
|
32
|
|
14,840
|
|
35
|
|
|||||||||||||||||
|
Other comprehensive loss
|
—
|
|
—
|
|
—
|
|
—
|
|
—
|
|
—
|
|
(156
|
)
|
—
|
|
(156
|
)
|
—
|
|
|||||||||||||||||
|
Exercise of common stock options
|
1
|
|
—
|
|
—
|
|
—
|
|
22
|
|
—
|
|
—
|
|
—
|
|
22
|
|
—
|
|
|||||||||||||||||
|
Treasury shares retired in connection with stock split
|
(35
|
)
|
—
|
|
35
|
|
1,512
|
|
(1,142
|
)
|
(370
|
)
|
—
|
|
—
|
|
—
|
|
—
|
|
|||||||||||||||||
|
Repurchases of common stock
|
—
|
|
—
|
|
(1
|
)
|
(50
|
)
|
—
|
|
—
|
|
—
|
|
—
|
|
(50
|
)
|
—
|
|
|||||||||||||||||
|
Payments relating to treasury shares
|
—
|
|
—
|
|
(1
|
)
|
(54
|
)
|
—
|
|
—
|
|
—
|
|
—
|
|
(54
|
)
|
—
|
|
|||||||||||||||||
|
Stock-based compensation
|
—
|
|
—
|
|
—
|
|
—
|
|
136
|
|
—
|
|
—
|
|
—
|
|
136
|
|
—
|
|
|||||||||||||||||
|
Issuance of restricted stock
|
2
|
|
—
|
|
—
|
|
—
|
|
—
|
|
—
|
|
—
|
|
—
|
|
—
|
|
—
|
|
|||||||||||||||||
|
Adjustment to redemption value
|
—
|
|
—
|
|
—
|
|
—
|
|
—
|
|
(2
|
)
|
—
|
|
—
|
|
(2
|
)
|
1
|
|
|||||||||||||||||
|
Distributions of profits
|
—
|
|
—
|
|
—
|
|
—
|
|
—
|
|
—
|
|
—
|
|
(19
|
)
|
(19
|
)
|
(3
|
)
|
|||||||||||||||||
|
Dividends paid to shareholders
|
—
|
|
—
|
|
—
|
|
—
|
|
—
|
|
(409
|
)
|
—
|
|
—
|
|
(409
|
)
|
—
|
|
|||||||||||||||||
|
Net income attributable to non-controlling interest
|
—
|
|
—
|
|
—
|
|
—
|
|
—
|
|
(27
|
)
|
—
|
|
24
|
|
(3
|
)
|
3
|
|
|||||||||||||||||
|
Net income
|
—
|
|
—
|
|
—
|
|
—
|
|
—
|
|
1,449
|
|
—
|
|
—
|
|
1,449
|
|
—
|
|
|||||||||||||||||
|
Balance, as of December 31, 2016
|
596
|
|
6
|
|
(1
|
)
|
(40
|
)
|
11,306
|
|
4,789
|
|
(344
|
)
|
37
|
|
15,754
|
|
36
|
|
|||||||||||||||||
|
Other comprehensive income
|
—
|
|
—
|
|
—
|
|
—
|
|
—
|
|
—
|
|
121
|
|
—
|
|
121
|
|
—
|
|
|||||||||||||||||
|
Exercise of common stock options
|
—
|
|
—
|
|
—
|
|
—
|
|
17
|
|
—
|
|
—
|
|
—
|
|
17
|
|
—
|
|
|||||||||||||||||
|
Repurchases of common stock
|
—
|
|
—
|
|
(15
|
)
|
(949
|
)
|
—
|
|
—
|
|
—
|
|
—
|
|
(949
|
)
|
—
|
|
|||||||||||||||||
|
Payments relating to treasury shares
|
—
|
|
—
|
|
(1
|
)
|
(88
|
)
|
—
|
|
—
|
|
—
|
|
—
|
|
(88
|
)
|
—
|
|
|||||||||||||||||
|
Stock-based compensation
|
—
|
|
—
|
|
—
|
|
—
|
|
152
|
|
—
|
|
—
|
|
—
|
|
152
|
|
—
|
|
|||||||||||||||||
|
Issuance of restricted stock
|
4
|
|
—
|
|
—
|
|
1
|
|
(1
|
)
|
—
|
|
—
|
|
—
|
|
—
|
|
—
|
|
|||||||||||||||||
|
Acquisition of non-controlling interest
|
—
|
|
—
|
|
—
|
|
—
|
|
(82
|
)
|
—
|
|
—
|
|
(10
|
)
|
(92
|
)
|
—
|
|
|||||||||||||||||
|
Distributions of profits
|
—
|
|
—
|
|
—
|
|
—
|
|
—
|
|
—
|
|
—
|
|
(26
|
)
|
(26
|
)
|
—
|
|
|||||||||||||||||
|
Dividends paid to shareholders
|
—
|
|
—
|
|
—
|
|
—
|
|
—
|
|
(476
|
)
|
—
|
|
—
|
|
(476
|
)
|
—
|
|
|||||||||||||||||
|
Acquisition of redeemable non-controlling interest
|
—
|
|
—
|
|
—
|
|
—
|
|
—
|
|
(2
|
)
|
—
|
|
—
|
|
(2
|
)
|
(37
|
)
|
|||||||||||||||||
|
Net income attributable to non-controlling interest
|
—
|
|
—
|
|
—
|
|
—
|
|
—
|
|
(28
|
)
|
—
|
|
27
|
|
(1
|
)
|
1
|
|
|||||||||||||||||
|
Net income
|
—
|
|
—
|
|
—
|
|
—
|
|
—
|
|
2,542
|
|
—
|
|
—
|
|
2,542
|
|
—
|
|
|||||||||||||||||
|
Balance, as of December 31, 2017
|
600
|
|
$
|
6
|
|
(17
|
)
|
$
|
(1,076
|
)
|
$
|
11,392
|
|
$
|
6,825
|
|
$
|
(223
|
)
|
$
|
28
|
|
$
|
16,952
|
|
$
|
—
|
|
|||||||||
See accompanying notes.
82
Intercontinental Exchange, Inc. and Subsidiaries
Consolidated Statements of Changes in Equity, Accumulated Other Comprehensive Income (Loss)
and Redeemable Non-Controlling Interest — (Continued)
(In millions)
|
As of December 31,
|
|||||||||||
|
2017
|
2016
|
2015
|
|||||||||
|
Accumulated other comprehensive income (loss) was as follows:
|
|||||||||||
|
Foreign currency translation adjustments
|
$
|
(136
|
)
|
$
|
(345
|
)
|
$
|
(45
|
)
|
||
|
Fair value of available-for-sale securities
|
—
|
|
108
|
|
(26
|
)
|
|||||
|
Comprehensive income from equity method investment
|
2
|
|
2
|
|
2
|
|
|||||
|
Employee benefit plans adjustments
|
(89
|
)
|
(109
|
)
|
(119
|
)
|
|||||
|
Accumulated other comprehensive loss
|
$
|
(223
|
)
|
$
|
(344
|
)
|
$
|
(188
|
)
|
||
See accompanying notes.
83
Intercontinental Exchange, Inc. and Subsidiaries
(In millions)
|
Year Ended December 31,
|
|||||||||||
|
2017
|
2016
|
2015
|
|||||||||
|
Operating activities
|
|||||||||||
|
Net income
|
$
|
2,542
|
|
$
|
1,449
|
|
$
|
1,295
|
|
||
|
Adjustments to reconcile net income to net cash provided by operating activities:
|
|||||||||||
|
Depreciation and amortization
|
535
|
|
610
|
|
374
|
|
|||||
|
Stock-based compensation
|
135
|
|
124
|
|
111
|
|
|||||
|
Deferred taxes
|
(651
|
)
|
114
|
|
(108
|
)
|
|||||
|
Cetip realized investment gain, net
|
(114
|
)
|
—
|
|
—
|
|
|||||
|
Trayport gain, net
|
(110
|
)
|
—
|
|
—
|
|
|||||
|
Amortization of fair market value premium on NYSE Notes
|
—
|
|
—
|
|
(23
|
)
|
|||||
|
Other
|
(22
|
)
|
(6
|
)
|
(17
|
)
|
|||||
|
Changes in assets and liabilities:
|
|||||||||||
|
Customer accounts receivable
|
(135
|
)
|
(65
|
)
|
(45
|
)
|
|||||
|
Other current and non-current assets
|
(24
|
)
|
7
|
|
(5
|
)
|
|||||
|
Section 31 fees payable
|
(2
|
)
|
14
|
|
(21
|
)
|
|||||
|
Deferred revenue
|
17
|
|
42
|
|
27
|
|
|||||
|
Other current and non-current liabilities
|
(86
|
)
|
(140
|
)
|
(277
|
)
|
|||||
|
Total adjustments
|
(457
|
)
|
700
|
|
16
|
|
|||||
|
Net cash provided by operating activities
|
2,085
|
|
2,149
|
|
1,311
|
|
|||||
|
Investing activities
|
|||||||||||
|
Capital expenditures
|
(220
|
)
|
(250
|
)
|
(190
|
)
|
|||||
|
Capitalized software development costs
|
(137
|
)
|
(115
|
)
|
(87
|
)
|
|||||
|
Proceeds from sale of Cetip, net
|
438
|
|
—
|
|
—
|
|
|||||
|
Cash paid for acquisitions, net of cash acquired
|
(423
|
)
|
(425
|
)
|
(3,751
|
)
|
|||||
|
Cash received from divestitures
|
761
|
|
—
|
|
—
|
|
|||||
|
Purchases of cost and equity method investments
|
(327
|
)
|
(70
|
)
|
(60
|
)
|
|||||
|
Proceeds from term deposits
|
—
|
|
—
|
|
1,089
|
|
|||||
|
Other
|
—
|
|
—
|
|
(5
|
)
|
|||||
|
Net cash provided by (used in) investing activities
|
92
|
|
(860
|
)
|
(3,004
|
)
|
|||||
|
Financing activities
|
|||||||||||
|
Proceeds from debt facilities, net
|
984
|
|
—
|
|
2,472
|
|
|||||
|
Repayments of debt facilities
|
(850
|
)
|
—
|
|
(1,028
|
)
|
|||||
|
Proceeds from (repayments of) commercial paper, net
|
(409
|
)
|
(949
|
)
|
1,686
|
|
|||||
|
Dividends to shareholders
|
(476
|
)
|
(409
|
)
|
(331
|
)
|
|||||
|
Repurchases of common stock
|
(949
|
)
|
(50
|
)
|
(660
|
)
|
|||||
|
Payments relating to treasury shares received for restricted stock tax payments and stock option exercises
|
(88
|
)
|
(54
|
)
|
(45
|
)
|
|||||
|
Acquisition of non-controlling interest and redeemable non-controlling interest
|
(174
|
)
|
—
|
|
—
|
|
|||||
|
Purchase of subsidiary shares from non-controlling interest
|
—
|
|
—
|
|
(128
|
)
|
|||||
|
Other
|
(9
|
)
|
—
|
|
10
|
|
|||||
|
Net cash provided by (used in) financing activities
|
(1,971
|
)
|
(1,462
|
)
|
1,976
|
|
|||||
|
Effect of exchange rate changes on cash, cash equivalents, and restricted cash and cash equivalents
|
12
|
|
(24
|
)
|
(14
|
)
|
|||||
|
Net increase (decrease) in cash, cash equivalents, and restricted cash and cash equivalents
|
218
|
|
(197
|
)
|
269
|
|
|||||
|
Cash, cash equivalents, and restricted cash and cash equivalents at beginning of year
|
1,350
|
|
1,547
|
|
1,278
|
|
|||||
|
Cash, cash equivalents, and restricted cash and cash equivalents at end of year
|
$
|
1,568
|
|
$
|
1,350
|
|
$
|
1,547
|
|
||
|
Supplemental cash flow disclosure
|
|||||||||||
|
Cash paid for income taxes
|
$
|
594
|
|
$
|
460
|
|
$
|
542
|
|
||
|
Cash paid for interest
|
$
|
171
|
|
$
|
170
|
|
$
|
123
|
|
||
|
Supplemental non-cash investing and financing activities
|
|||||||||||
|
Common stock and vested stock options issued for acquisitions
|
$
|
—
|
|
$
|
—
|
|
$
|
2,197
|
|
||
|
Treasury stock retirement
|
$
|
—
|
|
$
|
1,512
|
|
$
|
—
|
|
||
See accompanying notes.
84
Intercontinental Exchange, Inc. and Subsidiaries
Notes to Consolidated Financial Statements
|
1.
|
Description of Business
|
Nature of Business and Organization
We are a leading global operator of regulated exchanges, clearing houses and listings venues, and a provider of data services for commodity, fixed income and equity markets. We operate regulated marketplaces for listing, trading and clearing of a broad array of derivatives and securities contracts across major asset classes, including energy and agricultural commodities, interest rates, equities, equity derivatives, exchange traded funds, credit derivatives, bonds and currencies. We also offer end-to-end data services and solutions to support the trading, investment, risk management and connectivity needs of customers around the world across all major asset classes.
Our exchanges include derivative exchanges in the United States, or U.S., United Kingdom, or U.K., European Union or EU, Canada and Singapore, and cash equities, equity options and bond exchanges in the U.S. We also operate over-the-counter, or OTC, markets for physical energy and credit default swaps, or CDS, trade execution. To serve global derivatives markets, we operate central counterparty clearing houses in the U.S., U.K., EU, Canada and Singapore (Note 13). We offer a range of data services for global financial and commodity markets, including pricing and reference data, exchange data, analytics, feeds, desktops and connectivity solutions. Through our markets, clearing houses, listings and market data services, we provide end-to-end solutions for our customers through liquid markets, benchmark products, access to capital markets, and related services to support their ability to manage risk and raise capital.
|
2.
|
Summary of Significant Accounting Policies
|
Basis of Presentation
The accompanying consolidated financial statements are presented in accordance with U.S. generally accepted accounting principles, or U.S. GAAP. The consolidated financial statements include our wholly-owned and controlled subsidiaries. All intercompany balances and transactions between our wholly-owned and controlled subsidiaries have been eliminated in consolidation. As discussed in Note 3, we completed several acquisitions during the years ended
December 31, 2017
,
2016
and
2015
and have included the financial results of these companies in the consolidated financial statements effective from the respective acquisition dates. Also as discussed in Note 3, we completed the dispositions of several companies during the year ended
December 31, 2017
and have included the financial results of these companies in the consolidated financial statements up to the respective disposition dates.
Use of Estimates
The preparation of financial statements in conformity with U.S. GAAP requires our management to make estimates and assumptions that affect the reported amounts of assets and liabilities and disclosure of contingent assets and liabilities at the date of the financial statements. Estimates also affect the reported amounts of revenues and expenses during the reporting period. Actual amounts could differ from those estimates.
Comprehensive Income
Other comprehensive income includes changes in unrealized gains and losses on financial instruments classified as available-for-sale, changes in fair value of net investment hedges, foreign currency translation adjustments, comprehensive income from equity method investments, and amortization of the difference in the projected benefit obligation and the accumulated benefit obligation associated with benefit plan liabilities, net of tax.
Non-controlling Interest
For consolidated subsidiaries in which our ownership is less than 100% and for which we have control over the assets and liabilities and the management of the entity, the outside stockholders’ interests are shown as non-controlling interests. For instances where outside stockholders’ hold an option to require us to repurchase the outside stockholders’ interest, these interests are shown as redeemable non-controlling interests.
Segment and Geographic Information
We operate
two
business segments: our Trading and Clearing segment and our Data and Listings segment. This presentation is reflective of how our chief operating decision maker reviews and operates our business. Our Trading and Clearing segment comprises our transaction-based execution and clearing businesses. Our Data and Listings segment comprises our subscription-based data services and securities listings businesses. The majority of our identifiable assets are located in the U.S. and U.K.
85
Cash and Cash Equivalents
We consider all short-term, highly liquid investments with original maturities at the purchase date of three months or less to be cash equivalents.
Short-Term and Long-Term Restricted Cash and Cash Equivalents
We classify all cash and cash equivalents and investments that are not available for immediate or general business use by us as restricted in the accompanying consolidated balance sheets (Note 5). The restricted cash includes cash set aside due to regulatory requirements, earmarked for specific purposes, or restricted by specific agreements.
Short-Term and Long-Term Investments
We periodically invest a portion of our cash in excess of short-term operating needs in term deposits and investment-grade marketable debt securities, including government or government sponsored agencies and corporate debt securities (Note 6). These investments are classified as available-for-sale in accordance with U.S. GAAP. We do not have any investments classified as held-to-maturity or trading. Additionally, we classify equity and fixed income mutual funds, held for the purpose of providing future payments for the supplemental executive savings plan and a component of the supplemental executive retirement plan, as available-for-sale securities. Available-for-sale investments are carried at their fair value using primarily quoted prices in active markets for identical securities, with unrealized gains and losses, net of deferred income taxes, reported as a component of accumulated other comprehensive income. Realized gains and losses, and declines in value deemed to be other-than-temporary on available-for-sale investments, are recognized in earnings. The cost of securities sold is based on the specific identification method. Investments that we intend to hold for more than one year are classified as long-term investments in the accompanying consolidated balance sheets.
Cost and Equity Method Investments
We use the cost method to account for a non-marketable equity investment in an entity that we do not control and for which we do not have the ability to exercise significant influence over the entity’s operating and financial policies. When we do not have a controlling financial interest in an entity but exercise significant influence over the entity’s operating and financial policies, such investment is accounted for using the equity method. We account for our investments in MERSCORP Holdings, Inc., owner of Mortgage Electronic Registrations Systems, Inc., or collectively MERS, and Options Clearing Corporation, or OCC, as equity method investments. We recognized
$36 million
,
$25 million
and
$6 million
in equity income related to these investments during the years ended
December 31, 2017
,
2016
and
2015
, respectively, as other income. We recognize dividend income when declared as a reduction in the carrying value of our equity method investments. Cost and equity method investments were
$563 million
and
$208 million
as of
December 31, 2017
and
2016
, respectively, and are classified as other non-current assets in the accompanying consolidated balance sheets. The increase in the cost and equity method investments during the year ended December 31, 2017 is primarily due to our investment in Euroclear plc, or Euroclear, and during the year ended December 31, 2016 is primarily due to our investment in MERS (Note 3). See “Recently Adopted and New Accounting Pronouncements” below for the new financial instruments accounting standard and its impact on the accounting for our investments.
Margin Deposits, Guaranty Funds and Delivery Contracts Receivable and Payable
Original margin, variation margin and, with the exception of Natural Gas Exchange Inc., or NGX, guaranty funds held by our clearing houses for clearing members may be in the form of cash, government obligations, certain agency and corporate debt, letters of credit or gold (Note 13). Government, agency and corporate securities held for margin purposes are recorded at an amount that approximates fair value. Cash original margin, variation margin and guaranty fund deposits are reflected in the accompanying consolidated balance sheets as current assets and current liabilities. The amount of margin deposits on hand will fluctuate over time as a result of, among other things, the extent of open positions held at any point in time by market participants in contracts and the margin rates then in effect for such contracts. Changes in our margin accounts are not reflected in our consolidated statements of cash flows. Non-cash original margin and guaranty fund deposits are not reflected in the accompanying consolidated balance sheets as the risks and rewards of these assets remain with the clearing members unless the clearing houses have sold or re-pledged the assets or in the event of a clearing member default, where the clearing member is no longer entitled to redeem the assets. Any income, gain or loss accrues to the clearing members.
NGX, which we acquired in December 2017, owns a clearing house which administers the physical delivery of energy trading contracts. NGX serves as an intermediary counter-party to both the buyer and seller. When physical delivery has occurred and/or settlement amounts have been determined, an asset is recorded as a delivery contract receivable for the fair value of the contract due from the buying participant, and an equal and offsetting delivery contract payable is recorded for the amount owed to
86
the selling participant. Amounts recorded at period end represent receivables and payables for deliveries that have occurred but for which payment has not been received or made. There is no impact on our consolidated statements of income as an equal amount is recognized as both an asset and a liability. NGX also records unsettled variation margin equal to the fair value of open energy trading contracts as of the balance sheet date.
Property and Equipment
Property and equipment is recorded at cost, reduced by accumulated depreciation (Note 7). Depreciation and amortization expense related to property and equipment is computed using the straight-line method based on estimated useful lives of the assets, or in the case of leasehold improvements, the shorter of the initial lease term or the estimated useful life of the improvement. We review the remaining estimated useful lives of our property and equipment at each balance sheet date and will make adjustments to the estimated remaining useful lives whenever events or changes in circumstances indicate that the remaining useful lives have changed. Gains on disposals of property and equipment are included in other income and losses on disposals of property and equipment are included in depreciation expense. Maintenance and repair costs are expensed as incurred.
Allowance for Doubtful Accounts
The allowance for doubtful accounts is maintained at a level that we believe to be sufficient to absorb probable losses in our accounts receivable portfolio. The allowance is based on several factors, including a continuous assessment of the collectability of each account. In circumstances where a specific customer’s inability to meet its financial obligations is known, we record a specific provision for bad debts against amounts due to reduce the receivable to the amount we reasonably believe will be collected. Accounts receivable are written off against the allowance for doubtful accounts when collection efforts cease. A reconciliation of the beginning and ending amount of allowance for doubtful accounts is as follows for the years ended
December 31, 2017
,
2016
and
2015
(in millions):
|
Year Ended December 31,
|
|||||||||||
|
2017
|
2016
|
2015
|
|||||||||
|
Beginning balance of allowance for doubtful accounts
|
$
|
7
|
|
$
|
2
|
|
$
|
1
|
|
||
|
Bad debt expense
|
4
|
|
5
|
|
2
|
|
|||||
|
Charge-offs
|
(5
|
)
|
—
|
|
(1
|
)
|
|||||
|
Ending balance of allowance for doubtful accounts
|
$
|
6
|
|
$
|
7
|
|
$
|
2
|
|
||
Bad debt expense in the table above is based on our historical collection experiences and our assessment of the collectability of specific accounts. Charge-offs in the table above represent the write-off of uncollectible receivables, net of recoveries. These amounts also include the impact of foreign currency translation adjustments.
Software Development Costs
We capitalize costs, both internal and external direct and incremental costs, related to software developed or obtained for internal use in accordance with U.S. GAAP
.
Software development costs incurred during the preliminary or maintenance project stages are expensed as incurred, while costs incurred during the application development stage are capitalized and are amortized using the straight-line method over the useful life of the software, not to exceed
three
years (except for Interactive Data’s and NYSE’s new platforms, which have
eight
year useful lives). Amortization of these capitalized costs begins only when the software becomes ready for its intended use. General and administrative costs related to developing or obtaining such software are expensed as incurred.
Accrued Employee Benefits
We have a defined benefit pension plan and other postretirement benefit plans, or collectively the “benefit plans,” covering certain of our U.S. operations. The benefit accrual for the pension plan is frozen. We recognize the funded status of the benefit plans in the consolidated balance sheets, measure the fair value of plan assets and benefit obligations as of the date of our fiscal year-end, and provide additional disclosures in the footnotes to the consolidated financial statements (Note 15).
Benefit plan costs and liabilities are dependent on assumptions used in calculating such amounts. These assumptions include discount rates, health care cost trend rates, benefits earned, interest cost, expected return on assets, mortality rates and other factors. Actual results that differ from the assumptions are accumulated and amortized over future periods and, therefore, generally affect recognized expense and the recorded obligation in future periods. We immediately recognize in the consolidated statements of income certain of these unrecognized amounts when triggering events occur, such as when a settlement of pension obligations in
87
excess of total interest and service costs occurs. While we believe that the assumptions used are appropriate, differences in actual experience or changes in assumptions may affect our pension and other post-retirement obligations and future expense recognized.
Goodwill and Indefinite-Lived Intangible Assets
Goodwill represents the excess of the purchase price of our acquisitions over the fair value of identifiable net assets acquired, including other identified intangible assets (Note 8). We recognize specifically identifiable intangibles when a specific right or contract is acquired. Goodwill has been allocated to reporting units for purposes of impairment testing based on the portion of synergy, cost savings and other expected future cash flows expected to benefit the reporting units at the time of the acquisition. We test our goodwill for impairment at the reporting unit level. The reporting units identified for our goodwill testing are the Futures, Data and Listings, Cash Equities and Credit Default Swap reporting units. Goodwill impairment testing is performed annually in the fiscal fourth quarter or more frequently if conditions exist that indicate that the asset may be impaired.
We also evaluate indefinite-lived intangible assets for impairment annually in our fiscal fourth quarter or more frequently if conditions exist that indicate that the asset may be impaired. Such evaluation includes either applying the optional qualitative screen to determine if it is not more likely than not that the fair value of the asset continues to exceed its carrying value or determining the fair value of the asset and comparing the fair value of the asset to its carrying value. If the fair value of the indefinite-lived intangible asset is less than its carrying value, an impairment loss is recognized in earnings in an amount equal to the difference.
For both goodwill and indefinite lived impairment testing, we have the option to first perform a qualitative assessment to determine whether it is more likely than not that the fair value of a reporting unit or indefinite lived intangible asset is less than its carrying amount. If we conclude that this is the case, we must perform additional testing of the asset or reporting unit. Otherwise, no further testing is necessary.
Other than for the divestiture of NYSE Governance Services as discussed in Note 3, we did not record an impairment charge related to goodwill or indefinite lived intangible assets during the years ended
December 31, 2017
,
2016
or
2015
.
Impairment of Long-Lived Assets and Finite-Lived Intangible Assets
We review our property and equipment and finite-lived intangible assets for impairment whenever events or changes in circumstances indicate that the carrying amount may not be fully recoverable. To analyze recoverability, we project undiscounted net future cash flows over the remaining life of such assets. If these projected cash flows are less than the carrying amount, an impairment indicator would exist. The impairment loss is measured based upon the difference between the carrying amount and the fair value of the assets. Finite-lived intangible assets are generally amortized on a straight-line basis or using an accelerated method over the lesser of their contractual or estimated useful lives.
During the third quarter of 2016, we discontinued Creditex’s U.K. voice brokerage operations and an impairment of the asset was recorded as amortization expense in September 2016 for
$33 million
(Note 8).
Derivatives and Hedging Activity
We may use derivative instruments to limit exposure to changes in foreign currency exchange rates. All derivatives are required to be recorded at fair value in the accompanying consolidated balance sheets. Changes in the fair value of such derivative financial instruments are recognized in net income as they are not designated as hedges under U.S. GAAP.
From time to time, we may hedge the foreign currency translation of certain net investments by designating all or a portion of certain financial liabilities denominated in the same currency in accordance with U.S. GAAP. We entered into foreign currency hedging transactions during years ended
December 31, 2017
,
2016
and
2015
as economic hedges to help mitigate a portion of our foreign exchange risk exposure.
Intellectual Property
All costs related to internally developed patents and trademarks are expensed as incurred. All costs related to purchased patents, trademarks and internet domain names are recorded as other intangible assets and are amortized on a straight-line basis over their estimated useful lives. All costs related to licensed patents are capitalized and amortized on a straight-line basis over the term of the license.
88
Income Taxes
We recognize income taxes under the liability method. We recognize a current tax liability or tax asset for the estimated taxes payable or refundable on tax returns for the current year. We recognize deferred tax assets and liabilities for the expected future tax consequences of temporary differences between the financial statement carrying amounts and the tax bases of assets and liabilities. We establish valuation allowances if we believe that it is more likely than not that some or all of our deferred tax assets will not be realized. Deferred tax assets and liabilities are measured using current enacted tax rates in effect.
SEC Staff Accounting Bulletin No. 118, or SAB 118, has provided guidance for companies that have not completed their accounting for the income tax effects of the Tax Cuts and Jobs Act, or TCJA, in the period of enactment, allowing for a measurement period of up to one year after the enactment date to finalize the recording of the related tax impacts. As of December 31, 2017, we have not completed our accounting for the tax effects of the enactment of the TCJA, however, we have made a reasonable estimate of the effects on our deferred tax balances and in relation to the transition tax. In other cases, we have not been able to make a reasonable estimate and will continue to analyze the TCJA in order to finalize any related impacts within the measurement period. The Financial Accounting Standards Board, or FASB, Staff also provided additional guidance to address the accounting for the effects of the provisions related to the taxation of Global Intangible Low-Taxed Income, or GILTI, noting that companies should make an accounting policy election to recognize deferred taxes for temporary basis differences expected to reverse as GILTI in future years or to include the tax expense in the year it is incurred. We have not completed our analysis of the effects of the GILTI provisions and will further consider the accounting policy election within the measurement period as provided for under SAB 118.
We do not recognize a tax benefit unless we conclude that it is more likely than not that the benefit will be sustained on audit by the taxing authority based solely on the technical merits of the associated tax position. If the recognition threshold is met, we recognize a tax benefit measured at the largest amount of the tax benefit that, in our judgment, is greater than 50 percent likely to be realized. We recognize accrued interest and penalties related to uncertain tax positions as a component of income tax expense.
We are subject to tax in numerous domestic and foreign jurisdictions primarily based on our operations in these jurisdictions. Significant judgment is required in assessing the future tax consequences of events that have been recognized in our financial statements or tax returns. Fluctuations in the actual outcome of these future tax consequences could have a material impact on our financial position or results of operations.
Revenue Recognition
We recognize revenue when persuasive evidence of an arrangement exists, delivery has occurred, the sale price is fixed or determinable and collectability is reasonably assured. Our revenues primarily consist of transaction and clearing fee revenues for transactions executed and/or cleared through our global electronic derivatives trading and clearing platforms and cash equities trading and revenues related to our data services fees and listing fees. We also evaluate all contracts in order to determine appropriate gross versus net revenue reporting.
Derivatives trading and clearing revenues are recognized over the period in which the services are provided, which is typically the date the transactions are executed or are cleared, except for a portion of clearing revenues related to cleared contracts which have an ongoing clearing obligation that extends beyond the execution date. The transaction and clearing fee revenues are determined on the basis of the transaction and clearing fee charged for each contract traded on the exchanges. Derivatives transaction and clearing fees are recorded net of rebates of
$749 million
,
$674 million
and
$563 million
for the years ended
December 31, 2017
,
2016
and
2015
, respectively. We offer rebates in certain of our markets primarily to support market liquidity and trading volume by providing qualified participants in those markets a discount to the applicable commission rate. Such rebates are calculated based on volumes traded. The increase in the rebates is due primarily to an increase in the number of participants in the rebate programs offered on various contracts, an increase in our traded volume and an increase in the number of rebate programs.
Cash trading fee revenues are paid by organizations based on their trading activity. Fees are assessed on a per share basis for trading in equity securities. The fees are applicable to all transactions that take place on any of our equity trading venues, and the fees vary based on the size and type of trade that is consummated and trading venue. The equity trading venues earn transaction fees for customer orders of equity securities matched internally, as well as for customer orders routed to other exchanges. Cash trading fees are recognized as earned, which is generally upon execution of the trade. Cash trading fees are recorded gross of liquidity rebates and routing charges. Liquidity payments made to cash and options trading customers and routing charges made to other exchanges are included in transaction-based expenses in the consolidated statements of income.
Listings revenues consist of original listing fees paid by issuers to list the initial securities on the various cash markets, other listing fees related to other corporate actions (including stock splits, sales of additional securities and merger and acquisitions), annual listing fees paid by companies whose financial instruments are listed on the cash markets, and other services provided to our listed companies and other companies. Original listing fees are assessed primarily based on the number of shares that the issuer
89
initially lists. Original listing fees are recognized as revenue on a straight-line basis over the estimated service periods of
5
years for NYSE Arca and NYSE American and
9
years for NYSE. Other corporate action listing fees are recognized as revenue on a straight-line basis over the estimated service periods of
3
years for NYSE Arca and NYSE American and
6
years for NYSE. The service periods are determined separately for each of our listing venues (Note 9). Annual listing fees are billed at the beginning of the year and are recognized on a pro rata basis over the calendar year.
Data services revenues include market data access fees charged to customers that trade on the electronic platform. The market data access amount for each company is based on the number of users at each company trading on the electronic platform. For our bilateral OTC data services, monthly trading commissions are recognized as transaction and clearing fee revenues. Any customer’s market data access fees in excess of that customer’s commissions on trading activity are recognized as market data access revenues. Data services revenues in our derivatives markets also include terminal and license fees received from data vendors in exchange for the provision of real-time futures price information and market data access fees. Market data fees are charged to data vendors on a monthly basis based on the number and type of terminals they have providing futures data. Some of our data vendors also pay an annual license fee, which is deferred and recognized as revenue ratably over the period of the annual license.
We collect market data revenues from our cash equity and options consortium-based data products and, to a lesser extent, for New York Stock Exchange proprietary data products. Consortium-based data fees are determined by securities industry plans. Consortium-based data revenues that coordinated market data distribution generates (net of administration costs) are distributed to participating markets on the basis of the Regulation NMS formula. We collect fees from vendors for the right to distribute market data to third parties and a service fee from vendors for direct connection to market data. These fees are recognized as revenue as services are rendered.
We also charge customers for accessing our data services through Secure Financial Transaction Infrastructure, or SFTI, and colocation services. SFTI is a physical network infrastructure that connects our markets and other major market centers with market participants and allows those participants to receive data feeds. We also offer data analytics services which include a number of products such as forward curves, index and valuation services.
Revenue for subscription based contracts is recognized ratably over the life of the contract and revenue for usage based contracts is recognized in the month that the products/services are provided. Certain of our businesses collect fees for installation/set-up services which, if deemed a separate deliverable with standalone value, are recognized upon delivery as long as the remaining criteria for recognition of revenue have been achieved. Revenue for installation/set-up services, that do not meet the criteria for separation, is recognized ratably either over the contractual term or the expected client relationship life. Revenue for professional services is recognized as the services are provided. Revenue for hardware is recognized when installation is completed and the related services go-live.
Other revenues primarily consist of various fees for services provided to our customers, including interest income on certain clearing margin deposits, regulatory penalties and fines, fees for use of our facilities, regulatory fees charged to member organizations of our U.S. securities exchanges, designated market maker service fees, exchange membership fees and agricultural grading and certification fees. These fees are recognized as revenue as services are rendered.
On January 1, 2018, we were required to adopt ASC 606,
Revenue from Contracts with Customers,
and ASC 340-40,
Other Assets and Deferred Costs- Contracts with Customers
. The new guidance requires enhanced disclosures, including revenue recognition policies to identify performance obligations to customers and significant judgments in measurement and recognition. See “Recently Adopted and New Accounting Pronouncements,” and Note 4 where discussed further.
Activity Assessment Fees and Section 31 Fees
We pay the Securities and Exchange Commission, or SEC, fees pursuant to Section 31 of the Securities Exchange Act of 1934 for transactions executed on our U.S. equities and options exchanges. These Section 31 fees are designed to recover the costs to the government for supervising and regulating the securities markets and securities professionals. We (or the OCC on our behalf), in turn, collect activity assessment fees, which are included in transaction and clearing fees in the accompanying consolidated statements of income, from member organizations clearing or settling trades on the U.S. equities and options exchanges and recognize these amounts as revenue when invoiced. Fees received are included in cash at the time of receipt and, as required by law, the amount due to the SEC is remitted semi-annually and recorded as an accrued liability until paid. The activity assessment fees are designed so that they are equal to the Section 31 fees paid by us to the SEC. As a result, Section 31 fees do not have an impact on our net income.
90
Stock-Based Compensation
We currently sponsor employee and director stock option and restricted stock plans (Note 11). U.S. GAAP requires the measurement and recognition of compensation expenses for all share-based payment awards made to employees and directors, including employee stock options and restricted stock, based on estimated fair values. U.S. GAAP requires companies to estimate the fair value of stock option awards on the date of grant using an option-pricing model. The value of the portion of the award that is ultimately expected to vest is recognized as stock-based compensation expense over the requisite service period in our consolidated financial statements.
We use the Black-Scholes option pricing model for purposes of valuing stock option awards. Our determination of fair value of stock option awards on the date of grant using the Black-Scholes option pricing model is affected by our stock price as well as assumptions regarding a number of subjective variables. These variables include interest rates, our expected dividend yield, our expected share price volatility over the term of the awards and actual and projected employee stock option exercise behavior.
Treasury Stock
We record treasury stock activities under the cost method whereby the cost of the acquired stock is recorded as treasury stock (Note 11). We retired all of our outstanding treasury shares effective October 27, 2016, the record date of our 5-for-1 stock split (which has already been reflected in our results retroactively). Our accounting policy upon the formal retirement of treasury stock is to deduct the par value from common stock and to reflect any excess of cost over par value as a deduction from additional paid-in capital (to the extent created by previous issuances of the shares) and retained earnings.
Credit Risk and Significant Customers
Our clearing houses have credit risk for maintaining certain of the clearing member cash deposits at various financial institutions (Note 13). Cash deposit accounts are established at larger money center banks and structured to restrict the rights of offset or liens by the banks. Our clearing houses monitor the cash deposits and mitigate credit risk by keeping such deposits in several financial institutions, ensuring that its overall credit risk exposure to any individual financial institution remains within acceptable concentration limits, and by ensuring that the financial institutions have high investment grade ratings. We also limit our risk of loss by holding the majority of the cash deposits in cash accounts at the Federal Reserve Bank of Chicago, high quality short-term sovereign debt reverse repurchase agreements with several different counterparty banks or direct investments in short-term high quality sovereign and supranational debt issues. While we seek to achieve a reasonable rate of return which may generate interest income for our clearing members, we are primarily concerned with preservation of capital and managing the risks associated with these deposits. As the clearing houses may pass on interest revenues, minus costs, to the members, this could include negative or reduced yield due to market conditions.
When engaging in reverse repurchase agreements, our clearing houses take delivery of the underlying securities in custody accounts under clearing house control. Additionally, the securities purchased subject to reverse repurchase have a market value greater than the reverse repurchase amount. The typical haircut received for high quality sovereign debt is
2%
of the reverse repurchase amount. Thus, in the event that a reverse repurchase counterparty defaults on its obligation to repurchase the underlying reverse repurchase securities, our clearing house will have possession of securities with a value potentially greater than the reverse repurchase counterparty’s obligation to the clearing house.
ICE Clear Credit, a systemically important financial market utility as designated by the Financial Stability Oversight Council, held
$18.5 billion
of its U.S. dollar cash margin in cash accounts at the Federal Reserve Bank of Chicago as of December 31, 2017. ICE Clear Europe has established a Euro-denominated account at the De Nederlandsche Bank, or DNB, the central bank of the Netherlands. This account provides the flexibility for ICE Clear Europe to place Euro-denominated cash margin securely at a national bank, in particular during periods when liquidity in the Euro repo markets may temporarily become contracted, such as over a quarter or year end. As of December 31, 2017, ICE Clear Europe held
€3.3 billion
(
$4.0 billion
based on the euro/U.S. dollar exchange rate of
1.2003
as of December 31, 2017) at DNB. Such accounts are intended to decrease ICE Clear Credit and ICE Clear Europe’s custodial, liquidity and operational risk as compared to alternative custodial and investment arrangements.
Our futures businesses have minimal credit risk as the majority of their transaction revenues are currently cleared through our clearing houses. Our accounts receivable related to market data revenues, cash trading, listing revenues, technology revenues, CDS transaction revenues and bilateral over-the-counter energy transaction revenues subjects us to credit risk, as we do not require these customers to post collateral. We limit our risk of loss by terminating access to trade to entities with delinquent accounts. The concentration of risk on accounts receivable is also mitigated by the large number of entities comprising our customer base.
Our accounts receivable are stated at cost. Excluding clearing members, there were no individual accounts receivable balances greater than 10% of total consolidated accounts receivable as of
December 31, 2017
or
December 31, 2016
. No single
91
customer accounted for more than 10% of total consolidated revenues during any of the years ended
December 31, 2017
,
2016
or
2015
.
Leases
We expense rent from non-cancellable operating leases, net of sublease income, on a straight-line basis based on future minimum lease payments. The net costs are included in rent and occupancy expenses and technology and communication expenses in the accompanying consolidated statements of income (Note 14).
Acquisition-Related Transaction and Integration Costs
We incurred incremental direct acquisition-related transaction costs relating to various completed and potential acquisitions and other strategic opportunities to strengthen our competitive position and support growth. The acquisition-related transaction costs include fees for investment banking advisors, lawyers, accountants, tax advisors and public relations firms, deal-related bonuses to certain of our employees, as well as costs associated with credit facilities and other external costs directly related to the proposed or closed transactions. We also incurred integration costs during the years ended December 31, 2017 and 2016 relating to our integration of Interactive Data and during the years ended December 31, 2016 and 2015 relating to our integration of NYSE. Integration costs primarily related to employee termination costs, deal related bonuses, lease termination costs and professional services costs incurred relating to the integrations. As of June 30, 2016, the integration of NYSE has been completed.
The acquisition-related transaction and integration costs incurred during the year ended December 31, 2017 primarily relate to costs incurred for our Interactive Data integration, legal and professional fees related to the Trayport CMA review, and various other costs incurred for our other acquisitions that closed during 2017. The acquisition-related transaction and integration costs incurred during the year ended December 31, 2016 primarily relate to costs incurred for our Interactive Data and NYSE integrations, legal and professional fees related to the Trayport CMA review, our investment in MERS, our acquisition of Securities Evaluations and Credit Market Analysis, and various other potential and discontinued acquisitions. The acquisition-related transaction and integration costs incurred during the year ended December 31, 2015 primarily relate to the integration costs incurred for our NYSE integration and the acquisition-related transaction costs related to our Interactive Data and Trayport acquisitions. See Note 3 for additional information on our acquisitions.
Fair Value of Financial Instruments
We apply fair value accounting for all financial assets and liabilities and non-financial assets and liabilities that are recognized or disclosed at fair value in the financial statements on a recurring basis (Note 16). Fair value is the price that would be received from selling an asset or paid to transfer a liability (an exit price) in the principal or most advantageous market for the asset or liability in an orderly transaction between market participants at the measurement date. Our financial instruments consist primarily of cash and cash equivalents, short-term and long-term restricted cash and investments, short-term and long-term investments, customer accounts receivable, margin deposits and guaranty funds, short-term and long-term debt and other short-term assets and liabilities.
Foreign Currency Translation Adjustments and Foreign Currency Transaction Gains and Losses
Our functional and reporting currency is the U.S. dollar. We have foreign currency translation risk equal to our net investment in certain U.K., continental European, Asian and Canadian subsidiaries. The revenues, expenses and financial results of these subsidiaries are recorded in the functional currency of the countries that these subsidiaries are located in, which are primarily pounds sterling and euros. The financial statements of these subsidiaries are translated into U.S. dollars using a current rate of exchange, with gains or losses, net of tax as applicable, included in the cumulative translation adjustment account, a component of equity. As of
December 31, 2017
and
2016
, the portion of our equity attributable to accumulated other comprehensive loss from foreign currency translation adjustments was
$136 million
and
$345 million
, respectively.
We have foreign currency transaction gains and losses related to the settlement of foreign currency denominated assets, liabilities and payables that occur through our operations. The transaction gain and losses are due to the increase or decrease in the foreign currency exchange rates between periods. Forward contracts on foreign currencies are entered into to manage the foreign currency exchange rate risk. Gains and losses from foreign currency transactions are included in other income (expense) in the accompanying consolidated statements of income and resulted in net losses of
$4 million
,
$1 million
and
$14 million
for the years ended
December 31, 2017
,
2016
and
2015
, respectively.
92
Earnings Per Common Share
Basic earnings per common share is calculated using the weighted average common shares outstanding during the year. Common equivalent shares from stock options and restricted stock awards, using the treasury stock method, are included in the diluted per share calculations unless the effect of inclusion would be antidilutive (Note 18).
Recently Adopted and New Accounting Pronouncements
ASC 606 provides guidance outlining a single comprehensive model for entities to use in accounting for revenue arising from contracts with customers that supersedes most current revenue recognition guidance. This guidance requires us to recognize revenue when we transfer promised goods or services to customers in an amount that reflects the consideration to which the entity expects to be entitled in exchange for those goods or services. The new guidance requires enhanced disclosures, including revenue recognition policies to identify performance obligations to customers and significant judgments in measurement and recognition. The new guidance may be applied retrospectively to each prior period presented or retrospectively with the cumulative effect recognized as of the date of adoption. We will apply the guidance retrospectively to each prior period presented, and provide the relevant disclosures beginning in the first interim period (March 31, 2018 quarterly results) and annual period (December 31, 2018 annual results) in which we adopt the guidance.
The adoption accelerated the timing of recognition of a portion of original listing fees related to our New York Stock Exchange, or NYSE, businesses, which prior to adoption have been deferred over an estimated customer life of up to nine years. Revenue recognition related to our trading, clearing and data businesses remains substantially unchanged.
Adoption of the standard related to ASC 606 will impact our reported results as follows, driven primarily by the accelerated recognition of listings fee revenue in our NYSE business (in millions, except earnings per share):
|
|
As Reported
|
New Revenue Standard Adjustment
|
As Adjusted*
|
||||||
|
Year ended December 31, 2017
|
|||||||||
|
Total revenues
|
$
|
5,834
|
|
$
|
10
|
|
$
|
5,844
|
|
|
Total revenues, less transaction-based expenses
|
4,629
|
|
10
|
|
4,639
|
|
|||
|
Income tax benefit**
|
(25
|
)
|
(2
|
)
|
(27
|
)
|
|||
|
Net income attributable to Intercontinental Exchange, Inc.
|
2,514
|
|
12
|
|
2,526
|
|
|||
|
Diluted earnings per share
|
$
|
4.23
|
|
$
|
0.02
|
|
$
|
4.25
|
|
|
|
As Reported
|
New Revenue Standard Adjustment
|
As Adjusted*
|
||||||
|
Year ended December 31, 2016
|
|||||||||
|
Total revenues
|
$
|
5,958
|
|
$
|
12
|
|
$
|
5,970
|
|
|
Total revenues, less transaction-based expenses
|
4,499
|
|
12
|
|
4,511
|
|
|||
|
Income tax expense
|
580
|
|
5
|
|
585
|
|
|||
|
Net income attributable to Intercontinental Exchange, Inc.
|
1,422
|
|
7
|
|
1,429
|
|
|||
|
Diluted earnings per share
|
$
|
2.37
|
|
$
|
0.01
|
|
$
|
2.38
|
|
|
|
As Reported
|
New Revenue Standard Adjustment
|
As Adjusted*
|
||||||
|
Year ended December 31, 2015
|
|||||||||
|
Total revenues
|
$
|
4,682
|
|
$
|
19
|
|
$
|
4,701
|
|
|
Total revenues, less transaction-based expenses
|
3,338
|
|
19
|
|
3,357
|
|
|||
|
Income tax expense
|
358
|
|
8
|
|
366
|
|
|||
|
Net income attributable to Intercontinental Exchange, Inc.
|
1,274
|
|
11
|
|
1,285
|
|
|||
|
Diluted earnings per share
|
$
|
2.28
|
|
$
|
0.02
|
|
$
|
2.30
|
|
93
|
|
As Reported
|
New Revenue Standard Adjustment
|
As Adjusted*
|
||||||
|
As of December 31, 2017
|
|||||||||
|
Deferred revenue, current
|
$
|
121
|
|
$
|
(2
|
)
|
$
|
119
|
|
|
Deferred revenue, non-current
|
143
|
|
(45
|
)
|
98
|
|
|||
|
Net deferred tax liabilities
|
2,280
|
|
13
|
|
2,293
|
|
|||
|
Retained earnings
|
6,825
|
|
34
|
|
6,859
|
|
|||
|
|
As Reported
|
New Revenue Standard Adjustment
|
As Adjusted*
|
||||||
|
As of December 31, 2016
|
|||||||||
|
Deferred revenue, current
|
$
|
114
|
|
$
|
1
|
|
$
|
115
|
|
|
Deferred revenue, non-current
|
123
|
|
(38
|
)
|
85
|
|
|||
|
Net deferred tax liabilities
|
2,954
|
|
15
|
|
2,969
|
|
|||
|
Retained earnings
|
4,789
|
|
22
|
|
4,811
|
|
|||
*We were required to adopt ASC 606 on January 1, 2018. Adjusted figures in the tables above do not impact the 2017 financial results included in this report. The adjustments will be retrospectively reflected in the financial results beginning with the quarter ending March 31, 2018.
**The 2017 income tax benefit adjustment in the table above includes a
$6 million
deferred tax benefit resulting from the U.S. corporate income tax reduction as part of the TCJA enactment in the fourth quarter of 2017.
Additional disclosures related to our future adoption of ASC 606 are disclosed in Note 4.
The FASB has issued Accounting Standards Update No. 2016-01,
Financial Instruments - Overall (Subtopic 825-10): Recognition and Measurement of Financial Assets and Financial Liabilities,
or ASU 2016-01. ASU 2016-01 provides updated guidance for the recognition, measurement, presentation, and disclosure of certain financial assets and liabilities, including the requirement that equity investments (except those accounted for under the equity method of accounting or those that result in consolidation of the investee) are to be measured at fair value with changes in fair value recognized in net income. We were required to adopt ASU 2016-01 on January 1, 2018. Our cost method investments, including our investment in Euroclear (Note 3) and our 1.8% stake in Coinbase Global, Inc., among others, will be impacted by our adoption of ASU 2016-01 beginning in the first quarter of 2018. These companies do not currently have readily determinable fair market values as they are not publicly listed companies. Therefore, in accordance with ASU 2016-01, we will only adjust the fair value of these investments if and when there is an observable price change in an orderly transaction, and any change in the fair value will be recognized in net income.
The FASB has issued Accounting Standards Update No. 2016-02,
Leases,
or ASU 2016-02.
ASU 2016-02 requires an entity to recognize both assets and liabilities arising from financing and operating leases, along with additional qualitative and quantitative disclosures. A lessee should recognize in its balance sheet a liability to make lease payments (the lease liability) and a right-of-use asset representing its right to use the underlying asset for the lease term. In transition, lessees and lessors are required to recognize and measure leases at the beginning of the earliest period presented using a modified retrospective approach. ASU 2016-02 is required to be adopted at the beginning of our first quarter of fiscal 2019, with early adoption permitted. We will not adopt ASU 2016-02 early, but we are currently evaluating this guidance to determine the potential impact on our consolidated financial statements.
The FASB has issued Accounting Standards Update No. 2016-18,
Statement of Cash Flows: Restricted Cash
, or ASU 2016-18, that requires entities to show the changes in the total of cash, cash equivalents, restricted cash and restricted cash equivalents in the statement of cash flows. As a result, entities will no longer present transfers between cash and cash equivalents and restricted cash and restricted cash equivalents in the statement of cash flows. When cash, cash equivalents, restricted cash and restricted cash equivalents are presented in more than one line item on the balance sheet, the new guidance requires a reconciliation of the totals in the statement of cash flows to the related captions in the balance sheet. This reconciliation can be presented either on the face of the statement of cash flows or in the notes to the financial statements. Entities also have to disclose the nature of their restricted cash and restricted cash equivalent balances. ASU 2016-18 is required to be adopted at the beginning of our first quarter of fiscal 2018, with early adoption permitted. The standard is required to be applied retrospectively when adopted, and to provide the relevant disclosures in the first interim and annual periods in which we adopt the guidance. In the fourth quarter of 2017, we early adopted ASU 2016-18 and reclassified changes in restricted cash from cash flow provided by (used in) investing activities to the total change in beginning-of-year and end-of-year total amounts shown on the consolidated
94
statements of cash flows for the years ended December 31, 2017, 2016 and 2015. The impact of adopting this new standard only resulted in a change in cash flow statement presentation and related disclosures. See Note 5 for additional details on our restricted cash balances. The following table provides a reconciliation of cash and cash equivalents, short-term restricted cash and cash equivalents, and long-term restricted cash and cash equivalents reported within our consolidated balance sheets that sum to the total of the same such amounts shown in our consolidated statements of cash flows (in millions).
|
As of December 31,
|
|||||||||||
|
2017
|
2016
|
2015
|
|||||||||
|
Cash and cash equivalents
|
$
|
535
|
|
$
|
407
|
|
$
|
627
|
|
||
|
Short-term restricted cash and cash equivalents
|
769
|
|
679
|
|
657
|
|
|||||
|
Long-term restricted cash and cash equivalents
|
264
|
|
264
|
|
263
|
|
|||||
|
Total cash, cash equivalents and restricted cash and cash equivalents shown in our statements of cash flows
|
$
|
1,568
|
|
$
|
1,350
|
|
$
|
1,547
|
|
||
The FASB has issued Accounting Standards Update No. 2017-07,
Compensation-Retirement Benefits (Topic 715): Improving the Presentation of Net Periodic Pension Cost and Net Periodic Postretirement Benefit Cost,
or ASU 2017-07. The amendments in this update require that an employer disaggregate the service cost component from the other components of net benefit cost. The amendments also provide explicit guidance on how to present the service cost component in the same line item as other related compensation costs, and the other components of net benefit cost in the income statement outside of operating income. The guidance only allows the service cost component of net benefit cost to be eligible for capitalization. We were required to adopt ASU 2017-07 on January 1, 2018. We will apply the guidance retrospectively to each prior period presented when adopted, and provide the relevant disclosures in the first interim period (March 31, 2018 quarterly results) and annual period (December 31, 2018 annual results) in which we adopt the guidance. We have a pension plan, a U.S. nonqualified supplemental executive retirement plan, and post-retirement defined benefit plans that are all impacted by the guidance. Each of the plans are frozen and do not have a service cost component, which means the expense or benefit recognized under each plan represents other components of net benefit cost as defined in the guidance. The combined net periodic benefit of these plans are
$9 million
and
$8 million
for the years ended December 31, 2017 and 2016, respectively, and are reported as a reduction to compensation and benefits expenses in the accompanying consolidated statements of income. These amounts will be reported as other income, net in the consolidated statements of income when applying the guidance retroactively. See Note 15 for further discussion of our pension and other benefit programs.
|
3.
|
Acquisitions, Investments and Divestitures
|
Divestiture of Trayport and the Acquisitions of Natural Gas Exchange Inc. and Shorcan Energy Brokers Inc.
On December 11, 2015, we acquired
100%
of Trayport in a stock transaction. The total purchase price was
$620 million
, comprised of
12.6 million
shares of our common stock. Trayport is a software company that licenses its technology to serve exchanges, OTC brokers and traders to facilitate electronic and hybrid trade execution primarily in the energy markets.
The U.K. Competition and Markets Authority, or the CMA, undertook a review of our acquisition of Trayport under the merger control laws of the U.K. In October 2016, the CMA issued its findings and ordered a divestment of Trayport to remedy what the CMA determined to be a substantial lessening of competition. In November 2016, we filed an appeal with the Competition Appeal Tribunal, or the CAT, to challenge the CMA’s decision. In March 2017, the CAT upheld the CMA decision that we should divest Trayport. Following the CAT’s judgment, we asked for leave to appeal the CAT’s decision at the U.K. Court of Appeals. In May 2017, the U.K. Court of Appeals denied our request for leave to appeal and we were obligated to sell Trayport by January 2018.
On December 14, 2017, we sold Trayport to TMX Group for
£550 million
(
$733 million
based on the pound sterling/U.S. dollar exchange rate of
1.3331
as of December 14, 2017). We recognized a net gain of
$110 million
on the divestiture of Trayport, which was recorded as other income within our Data and Listings segment in the accompanying consolidated statements of income for the year ended
December 31, 2017
. The net gain is equal to the
$733 million
in gross proceeds received less the adjusted carrying value of Trayport’s net assets of
$607 million
(which is equal to the
$531 million
carrying value of Trayport plus
$76 million
in accumulated other comprehensive loss from foreign currency translation) and less
$16 million
in costs to sell Trayport. See Note 8 for information on the Trayport goodwill and other intangibles assets.
The gross proceeds included a combination of
£350 million
(
$466 million
) in cash and
£200 million
(
$267 million
) in value relating to our acquisitions of Natural Gas Exchange, Inc., or NGX, and Shorcan Energy Brokers Inc., or Shorcan Energy, both wholly-owned subsidiaries of TMX Group. Trayport was included in our Data and Listings segment and NGX and Shorcan Energy are included in our Trading and Clearing segment. NGX, headquartered in Calgary, provides electronic execution, central counterparty
95
clearing and data services to the North American natural gas, electricity and oil markets. Shorcan Energy offers brokerage services for the North American crude oil markets.
The NGX and Shorcan Energy purchase price was allocated to the preliminary net tangible and identifiable intangible assets and liabilities based on their estimated fair values as of December 14, 2017. The preliminary identifiable intangible assets acquired were
$202 million
, including exchange registrations and licenses for
$143 million
, which have been assigned an indefinite useful life, and customer relationship intangible assets for
$53 million
, which have been assigned useful lives of
20
years. The excess of the purchase price over the preliminary net tangible and identifiable intangible assets was
$121 million
and was recorded as goodwill. See Note 13 for discussion of NGX margin and delivery contracts receivables and payables. We have not yet obtained all of the information related to the fair value of the acquired assets and liabilities related to the acquisition to finalize the purchase price allocation. The primary areas of the preliminary purchase price allocation that are not yet finalized relate to the valuation of the identifiable intangible assets, income taxes and certain other tangible assets and liabilities.
The functional currency of Trayport was the pound sterling, as this was the currency in which Trayport operated. The
$620 million
in Trayport net assets were recorded on our December 11, 2015 opening balance sheet at a pound sterling/U.S. dollar exchange rate of
1.5218
(
£407 million
). Because our consolidated financial statements are presented in U.S. dollars, we translated the Trayport net assets into U.S. dollars at the exchange rates in effect at the end of each reporting period. Therefore, increases or decreases in the value of the U.S. dollar against the pound sterling affected the value of the Trayport balance sheet, with gains or losses included in the cumulative translation adjustment account, a component of equity. As a result of the decrease in the pound sterling/U.S. dollar exchange rate to
1.3331
as of December 14, 2017, the portion of our equity attributable to the Trayport net assets in accumulated other comprehensive loss from foreign currency translation was
$76 million
. In connection with the divestiture on December 14, 2017, the
$76 million
in the Trayport foreign currency translation loss was reclassified out of accumulated other comprehensive loss and recognized as part of the net gain on the divestiture as discussed above.
As of June 30, 2017, we classified Trayport as held for sale and ceased depreciation and amortization of the property and equipment and other intangible assets. Subsequent to its divestiture on December 14, 2017, there are no longer any Trayport assets and liabilities classified as held for sale.
Acquisition of Interactive Data
On December 14, 2015, we acquired
100%
of Interactive Data in a stock and cash transaction. The total purchase price was
$5.6 billion
comprised of cash consideration of
$4.1 billion
and
32.3 million
shares of our common stock. The cash consideration is gross of
$301 million
of cash held by Interactive Data on the date of the acquisition. The fair value of the shares issued was
$1.6 billion
based on the average share price of our common stock of
$48.90
per share on December 14, 2015. The cash consideration was funded from
$2.5 billion
of net proceeds received on November 24, 2015 in connection with the offering of new senior notes and
$1.6 billion
of borrowing under our commercial paper program. The Interactive Data acquisition was included in our Data and Listings segment.
The financial information in the table below summarizes the combined results of operations of ICE and Interactive Data, on a pro forma basis, as though the companies had been combined as of the beginning of the period presented. The pro forma financial information combines the historical results for us and Interactive Data for the year ended December 31, 2015 in the following table (in millions, except per share amounts).
|
Year Ended December 31, 2015
|
|||
|
Total revenues, less transaction-based expenses
|
$
|
4,231
|
|
|
Operating income
|
1,977
|
|
|
|
Net income attributable to Intercontinental Exchange, Inc.
|
1,364
|
|
|
|
Earnings per share attributable to Intercontinental Exchange, Inc. common shareholders:
|
|||
|
Basic
|
$
|
2.41
|
|
|
Diluted
|
$
|
2.39
|
|
Other Acquisitions
On January 2, 2018, we acquired
100%
of BondPoint from Virtu Financial, Inc. for
$400 million
in cash. BondPoint is a leading provider of electronic fixed income trading solutions for the buy-side and sell-side offering access to centralized liquidity and automated trade execution services through its alternative trading system, or ATS, and provides trading services to more than
500
financial services firms. The BondPoint acquisition will be included in our Trading and Clearing segment starting in the first quarter of 2018.
96
On October 20, 2017, we acquired Bank of America Merrill Lynch, or BofAML’s, Global Research division’s index business. BofAML indices are the second largest group of fixed income indices as measured by assets under management, or AUM, globally. The AUM benchmarked against our combined fixed income indices is nearly
$1 trillion
, and the indices have been re-branded as the ICE BofAML indices. The BofAML acquisition was included in our Data and Listings segment.
On May 1, 2017, we acquired
100%
of TMX Atrium, a global extranet and wireless services business, from TMX Group. TMX Atrium provides low-latency access to markets and market data across
12
countries, more than
30
major trading venues, and ultra-low latency wireless connectivity to access markets and market data in the Toronto, New Jersey and Chicago metro areas. The wireless assets consist of microwave and millimeter networks that transport market data and provide private bandwidth. The TMX Atrium acquisition was included in our Data and Listings segment.
On January 31, 2017, we acquired
100%
of National Stock Exchange, Inc., now named NYSE National. The acquisition gives the NYSE Group a fourth U.S. exchange license. NYSE National is distinct from NYSE Group’s
three
listings exchanges because NYSE National will only be a trading venue and will not be a listings market. NYSE Group’s
three
listings exchanges, NYSE, NYSE American and NYSE Arca, have unique market models designed for corporate and exchange traded fund, or ETF, issuers. After closing the transaction, NYSE National ceased operations on February 1, 2017. Subject to regulatory approvals, NYSE Group anticipates re-launching operations on NYSE National, Inc. in the second quarter of 2018. The NYSE National acquisition was included in our Trading and Clearing segment.
On October 3, 2016, we acquired from S&P Global
100%
of Standard & Poor’s Securities Evaluations, Inc., or SPSE, and
100%
of Credit Market Analysis for
$431 million
in cash. The cash consideration was funded from borrowings under our commercial paper program. SPSE, which has been renamed Securities Evaluations, is a provider of fixed income evaluated pricing and Credit Market Analysis is a provider of independent data for the OTC markets, including credit derivatives and bonds. The SPSE and Credit Market Analysis purchase price was allocated to the net tangible and identifiable intangible assets and liabilities based on their estimated fair values as of October 3, 2016. The identifiable intangible assets acquired were
$171 million
, including customer relationship intangible assets for
$135 million
, which have been assigned useful lives of
15
to
20
years, and data/databases intangible assets for
$29 million
, which have been assigned useful lives of
5
to
10
years. The excess of the purchase price over the net tangible and identifiable intangible assets was
$312 million
and was recorded as goodwill and was recorded in our Data and Listings segment.
Investments and Divestitures
On October 24, 2017, we acquired a
4.7%
stake in Euroclear for
€275 million
in cash (
$327 million
based on the euro/U.S. dollar exchange rate of
1.1903
as of October 24, 2017). During December 2017, we reached an agreement to buy an additional
5.1%
stake in Euroclear for
€243 million
in cash (
$292 million
based on the euro/U.S. dollar exchange rate of
1.2003
as of December 31, 2017) and expect to receive necessary regulatory approval during the first quarter of 2018. Upon closing, we will own a
9.8%
stake in Euroclear for a total investment of
€518 million
(
$619 million
based on the exchange rates above). Euroclear is a leading provider of post-trade services, including settlement, central securities depositories and related services for cross-border transactions across asset classes. We account for our investment in Euroclear as a cost method investment and we classify it as an other non-current asset in the accompanying consolidated balance sheet as of December 31, 2017. As discussed in Note 2, subsequent to the adoption of ASU 2016-01 on January 1, 2018, we would only adjust the fair value of our investment in Euroclear if there is an observable price change in an orderly Euroclear transaction and any change in the fair value will be recognized in net income.
For consolidated subsidiaries in which our ownership is less than
100%
and for which we have control over the assets, liabilities and management of the entity, the outside stockholders’ interests are shown as non-controlling interest in our consolidated financial statements. As of December 31, 2016, non-controlling interest included those related to the operating results of our CDS clearing subsidiaries in which non-ICE limited partners held a
42.5%
net profit sharing interest; ICE Endex in which Gasunie held a
21%
ownership interest; and ICE Clear Netherlands in which ABN AMRO Clearing Bank N.V. held a
25%
ownership interest. For both ICE Endex and ICE Clear Netherlands, in addition to the non-controlling interest reported in the consolidated statements of income, we reported redeemable non-controlling interest in the consolidated balance sheets which represents the minority interest redemption fair value for each company.
During June 2017, we purchased both Gasunie’s
21%
minority ownership interest in ICE Endex and ABN AMRO Clearing Bank N.V.’s
25%
minority ownership interest in ICE Clear Netherlands. Subsequent to these acquisitions, we own
100%
of ICE Endex and ICE Clear Netherlands and will no longer include any non-controlling interest amounts for ICE Endex and ICE Clear Netherlands in our consolidated financial statements. During the year ended December 31, 2017, we purchased
12.6%
of the net profit sharing interest in our CDS clearing subsidiaries from several non-ICE limited partners and the remaining non-ICE limited partners hold a
29.9%
net profit sharing interest in our CDS clearing subsidiaries as of December 31, 2017.
On June 1, 2017, we sold NYSE Governance Services to Marlin Heritage, L.P. NYSE Governance Services provides governance and compliance analytics and education solutions for organizations and their boards of directors through dynamic learning solutions.
97
We recognized a net loss of
$6 million
on the divestiture of NYSE Governance Services, which was recorded as amortization expense within our Data and Listings segment in the accompanying consolidated statements of income for the year ended
December 31, 2017
.
On March 31, 2017, we sold Interactive Data Managed Solutions, or IDMS, a unit of Interactive Data, to FactSet. IDMS is a managed solutions and portal provider for the global wealth management industry. There was
no
gain or loss recognized on the sale of IDMS.
On June 30, 2016, we acquired a majority equity position in MERS. MERS is a privately held, member-based organization that owns and manages the MERS® System and is made up of thousands of lenders, servicers, sub-servicers, investors and government institutions. In addition, we have entered into a software development agreement to rebuild the MERS® System to benefit the U.S. residential mortgage finance market. The MERS® System is a national electronic registry that tracks the changes in servicing rights and beneficial ownership interests in U.S.-based mortgage loans. The terms of the MERS acquisition include a right for us to purchase all of the remaining equity interests of MERS after we satisfy our deliverables under the software development agreement. In addition, the MERS equity holders may exercise a put option to require us to purchase all of the remaining equity interests of MERS. Each of these terms is subject to certain price provisions. Because we do not have the ability to control MERS’ operations, we have recorded the purchase as an equity method investment and our ratable share of net income (loss) in MERS in future periods will be recorded in our consolidated statements of income as equity earnings of our unconsolidated subsidiaries, below operating income in other income (loss).
|
4.
|
Revenue Recognition (Disclosures related to the adoption of ASC 606 on January 1, 2018)
|
In Note 2, we disclose the accounting policies associated with our material revenue streams that are applied in our consolidated financial statements. On January 1, 2018, we were required to adopt ASC 606 on a full retrospective basis and beginning in the first quarter of 2018 will restate each prior reporting period presented as if ASC 606 had always been applied. The adoption of ASC 606 does not have a material impact on the measurement or recognition of revenue in any prior or current reporting periods; however, additional disclosures required by ASC 606 are provided below for comparability purposes. Our adoption of ASC 606 was subject to the same internal controls over financial reporting that we apply to our consolidated financial statements. Terms as used below relate to how they are defined in ASC 606.
Substantially all of our revenues are considered to be revenues from contracts with customers. The related accounts receivable balances are recorded in our balance sheets as customer accounts receivable. We do not have obligations for warranties, returns or refunds to customers, other than the rebates discussed further below, which are settled each period and therefore do not result in variable consideration. We do not have significant revenue recognized from performance obligations that were satisfied in prior periods, and we do not have any transaction price allocated to unsatisfied performance obligations other than in our deferred revenue. Deferred revenue represents our contract liabilities related to our annual, original and other listings revenues as well as certain data services, clearing services and other revenues. Deferred revenue is the only significant contract asset or liability impacted by our adoption of ASC 606. See Note 9 for our discussion on deferred revenue balances, activity, and expected timing of recognition. We have elected not to provide disclosures about transaction price allocated to unsatisfied performance obligations if contract durations are less than one-year, or if we are not required to estimate the transaction price. For all of our contracts with customers, except for listings and certain data and clearing services, our performance obligations are short term in nature and there is no significant variable consideration. See below for further descriptions of our revenue contracts. In addition, we have elected the practical expedient of excluding sales taxes from transaction prices. We have assessed the costs incurred to obtain or fulfill a contract with a customer and determined them to be immaterial.
Certain judgments and estimates were used in the identification and timing of satisfaction of performance obligations and the related allocation of transaction price. We believe that these represent a faithful depiction of the transfer of services to our customers.
Our primary revenue contract classifications are described below. Though we discuss additional revenue details in our “Management Discussion and Analysis of Financial Condition and Results of Operations,” the categories below best represent those that depict similar economic characteristics of the nature, amount, timing and uncertainty of our revenues and cash flows.
|
•
|
Transaction and clearing, net
- Transaction and clearing revenues represent fees charged for the performance obligations of derivatives trading and clearing, and from our cash trading and equity options exchanges. The derivatives trading and clearing fees contain
two
performance obligations: 1) trade execution/clearing novation and 2) risk management of open interest. We allocate the transaction price between these
two
performance obligations; however both of these generally occur almost simultaneously, therefore, no significant deferral results as we have no further obligation to the customer at that time. Cash trading and equity options fees contain
one
performance obligation related to trade execution. Trade execution occurs instantaneously, therefore, there is no need to allocate the transaction price and no deferral results as we have no further obligation to the customer at that time. Our transaction and clearing revenues are reported net of rebates, except for the NYSE transaction-based expenses. Transaction and clearing fees can be variable based on trade volume discounts used in the determination of rebates, however virtually all volume discounts are calculated and recorded on a monthly basis. Transaction
|
98
and clearing fees, as well as any volume discounts rebated to our customers, are calculated and billed monthly in accordance with our published fee schedules. We make liquidity payments to certain customers in our NYSE business and recognize those payments as a cost of revenue. In addition, we pay NYSE regulatory oversight fees to the SEC and collect equal amounts from our customers. These are also considered a cost of revenue, and both of these NYSE-related fees are included in transaction-based expenses. Transaction and clearing revenues and the related transaction-based expenses are all recognized in our Trading and Clearing segment.
|
•
|
Data services
- Data service revenues
represent the following:
|
|
◦
|
Pricing and analytics services consisting of an extensive set of independent evaluated pricing services focused primarily on fixed income and international equity securities, valuation services, reference data, market data, end of day pricing, fixed income equity portfolio analytics and risk management analytics.
|
|
◦
|
Desktop and connectivity services which comprise technology-based information platforms, feeds and connectivity. These include trading applications, desktop solutions and data feeds to support trading, voice brokers and investment functions.
|
|
◦
|
Exchange data services which represent subscription fees for the provision of our market data that is created from activity in our Trading and Clearing segment.
|
The nature and timing of each contract type for the data services above are similar in nature. Data services revenues are primarily subscription-based, billed monthly, quarterly or annually in advance and recognized ratably over time as our performance obligations of data delivery are met consistently throughout the period. Considering these contracts primarily consist of single performance obligations with fixed prices, there is no variable consideration and no need to allocate the transaction price. In certain of our data contracts, where third parties are involved, we arrange for the third party to transfer the services to our customers; in these arrangements we are acting as an agent and revenue is recorded net. All data services fees are included in our Data and Listings segment.
|
•
|
Listings -
Listing revenues include original, annual, and other corporate action fees. Under ASC 606, each distinct listing fee is allocated to multiple performance obligations including original and incremental listing and investor relations services, as well as a customer’s material right to renew the option to list on our exchanges. In performing this allocation, the standalone selling price of the listing services is based on the original and annual listing fees and the standalone selling price of the investor relation services is based on its market value. All listings fees are billed upfront and the identified performance obligations are satisfied over time. Upon our adoption of the ASC 606 framework, the amount of revenue related to the investor relations performance obligation is recognized ratably over a
two
-year period, with the remaining revenue recognized ratably over time as customers continue to list on our exchanges, which is generally estimated to be over a period of up to
9
years for NYSE and
5
years for NYSE Arca and NYSE American. Listings fees related to other corporate actions are considered contract modifications of our listing contracts and are recognized ratably over time as customers continue to list on our exchanges, which is generally estimated to be a period of
6
years for NYSE and
3
years for NYSE Arca and NYSE American. All listings fees are recognized in our Data & Listings segment.
|
|
•
|
Other revenues -
Other revenue
primarily includes interest income on certain clearing margin deposits, regulatory penalties and fines, fees for use of our facilities, regulatory fees charged to member organizations of our U.S. securities exchanges, designated market maker service fees, exchange membership fees and agricultural grading and certification fees. Other revenues are recognized either in our Trading and Clearing segment or Data and Listings segment based on the nature of the revenue. Generally, fees for other revenues contain one performance obligation. Services for other revenues are primarily satisfied at a point in time, therefore, there is no need to allocate the fee and no deferral results as we have no further obligation to the customer at that time.
|
The following table depicts the disaggregation of our revenue according to business line and segment (in millions) prior to our adoption of ASC 606; as such, the segment totals here are consistent with the segment totals in Note 17:
99
|
|
Trading & Clearing Segment
|
Data & Listings Segment
|
Total Consolidated
|
||||||
|
Year ended December 31, 2017
|
|||||||||
|
Transaction and clearing, net
|
$
|
3,131
|
|
$
|
—
|
|
$
|
3,131
|
|
|
Data services
|
—
|
|
2,084
|
|
2,084
|
|
|||
|
Listings
|
—
|
|
417
|
|
417
|
|
|||
|
Other revenues
|
202
|
|
—
|
|
202
|
|
|||
|
Total revenues
|
3,333
|
|
2,501
|
|
5,834
|
|
|||
|
Transaction-based expenses
|
1,205
|
|
—
|
|
1,205
|
|
|||
|
Total revenues, less transaction-based expenses
|
$
|
2,128
|
|
$
|
2,501
|
|
$
|
4,629
|
|
|
Timing of Revenue Recognition
|
|||||||||
|
Services transferred at a point in time
|
$
|
1,897
|
|
$
|
—
|
|
$
|
1,897
|
|
|
Services transferred over time
|
231
|
|
2,501
|
|
2,732
|
|
|||
|
Total revenues, less transaction-based expenses
|
$
|
2,128
|
|
$
|
2,501
|
|
$
|
4,629
|
|
|
|
Trading & Clearing Segment
|
Data & Listings Segment
|
Total Consolidated
|
||||||
|
Year ended December 31, 2016
|
|||||||||
|
Transaction and clearing, net
|
$
|
3,384
|
|
$
|
—
|
|
$
|
3,384
|
|
|
Data services
|
—
|
|
1,978
|
|
1,978
|
|
|||
|
Listings
|
—
|
|
419
|
|
419
|
|
|||
|
Other revenues
|
177
|
|
—
|
|
177
|
|
|||
|
Total revenues
|
3,561
|
|
2,397
|
|
5,958
|
|
|||
|
Transaction-based expenses
|
1,459
|
|
—
|
|
1,459
|
|
|||
|
Total revenues, less transaction-based expenses
|
$
|
2,102
|
|
$
|
2,397
|
|
$
|
4,499
|
|
|
Timing of Revenue Recognition
|
|||||||||
|
Services transferred at a point in time
|
$
|
1,874
|
|
$
|
—
|
|
$
|
1,874
|
|
|
Services transferred over time
|
228
|
|
2,397
|
|
2,625
|
|
|||
|
Total revenues, less transaction-based expenses
|
$
|
2,102
|
|
$
|
2,397
|
|
$
|
4,499
|
|
|
|
Trading & Clearing Segment
|
Data & Listings Segment
|
Total Consolidated
|
||||||
|
Year ended December 31, 2015
|
|||||||||
|
Transaction and clearing, net
|
$
|
3,228
|
|
$
|
—
|
|
$
|
3,228
|
|
|
Data services
|
—
|
|
871
|
|
871
|
|
|||
|
Listings
|
—
|
|
405
|
|
405
|
|
|||
|
Other revenues
|
178
|
|
—
|
|
178
|
|
|||
|
Total revenues
|
3,406
|
|
1,276
|
|
4,682
|
|
|||
|
Transaction-based expenses
|
1,344
|
|
—
|
|
1,344
|
|
|||
|
Total revenues, less transaction-based expenses
|
$
|
2,062
|
|
$
|
1,276
|
|
$
|
3,338
|
|
|
Timing of Revenue Recognition
|
|||||||||
|
Services transferred at a point in time
|
$
|
1,841
|
|
$
|
—
|
|
$
|
1,841
|
|
|
Services transferred over time
|
221
|
|
1,276
|
|
1,497
|
|
|||
|
Total revenues, less transaction-based expenses
|
$
|
2,062
|
|
$
|
1,276
|
|
$
|
3,338
|
|
|
5.
|
Short-Term and Long-Term Restricted Cash and Cash Equivalents
|
We own ICE Futures Europe, which operates as a U.K. Recognized Investment Exchange. As a U.K. Recognized Investment Exchange, ICE Futures Europe is required by the Financial Conduct Authority in the U.K. to restrict the use of the equivalent of
six
months of operating expenditures, subject to certain deductions, in cash or cash equivalents or investments at all times. As of both
100
December 31, 2017
and
2016
, this amount for ICE Futures Europe was
$77 million
. Such amounts are reflected as short-term restricted cash and cash equivalents in the accompanying consolidated balance sheets.
As a U.K. Recognized Clearing House, ICE Clear Europe is required by the Bank of England and the European Market Infrastructure Regulation, or EMIR, to restrict as cash, cash equivalents or investments an amount to reflect an estimate of the capital required to wind down or restructure the activities of the clearing house, cover operational, legal and business risks and to reserve capital to meet credit, counterparty and market risks not covered by the members margin and guaranty funds. As such, it is calculated taking into account the operating expenditures, revenues and credit exposures associated with the assets and investments. As of
December 31, 2017
and
2016
, the regulatory capital restricted cash for ICE Clear Europe was
$423 million
and
$352 million
, respectively, and was reflected as short-term restricted cash and cash equivalents in the accompanying consolidated balance sheets. The increase in the regulatory capital restricted cash at ICE Clear Europe as of
December 31, 2017
was primarily due to additional costs incurred due to the growth of our clearing businesses and the consequential additional regulatory capital buffers required by the Bank of England. ICE Clear Europe, in addition to being regulated by the Bank of England, is also regulated by the Commodity Futures Trading Commission, or CFTC, as a U.S. Derivatives Clearing Organizations, or DCO. The regulatory capital available to ICE Clear Europe, as described above, exceeds the CFTC requirements.
Our CFTC regulated U.S. Designated Contract Market, or DCM, ICE Futures U.S., our CFTC regulated U.S. DCOs, ICE Clear U.S. and ICE Clear Credit, our CFTC regulated U.S. Swap Data Repository, or SDR, ICE Trade Vault, and our U.S. Swap Execution Facility, or SEF, ICE Swap Trade, are required to maintain financial resources with a value at least equal to the amount that would cover certain operating costs for a
one
-year period, including maintaining cash or a committed line of credit, subject to certain deductions, to satisfy at least six months of such operating costs at all times. As of
December 31, 2017
and
2016
, the financial resources reserved necessary to satisfy CFTC financial resource requirements for the DCM, U.S. DCOs, SDR and SEF were
$193 million
and
$192 million
, respectively, and was reflected as short-term restricted cash and cash equivalents in the accompanying consolidated balance sheets. For our U.S. DCOs, ICE Clear U.S. and ICE Clear Credit, these amounts include voluntarily-held additional reserves consistent with the EMIR requirements to cover operational, legal and business risks and to reserve capital to meet credit, counterparty and market risks not covered by the member margin and guaranty funds.
Our clearing houses, other than NGX, require that each clearing member make deposits to a fund known as the guaranty fund. The amounts in the guaranty fund will serve to secure the obligations of a clearing member to our clearing houses and may be used to cover losses in excess of the margin and clearing firm accounts sustained by our clearing houses in the event of a default of a clearing member. As of
December 31, 2017
and
2016
; ICE Clear Europe has contributed
$100 million
of its own cash as part of its futures and options guaranty fund; ICE Clear Europe has contributed
$50 million
as part of its CDS guaranty fund; ICE Clear Credit has contributed
$50 million
as part of its CDS guaranty fund; ICE Clear U.S. has contributed
$50 million
as part of its futures and options guaranty fund; and ICE Clear Canada, ICE Clear Netherlands and ICE Clear Singapore have each also contributed a combined
$4 million
in cash to their respective guaranty funds. These cash contributions to the guaranty funds are reflected as long-term restricted cash and cash equivalents in the accompanying consolidated balance sheets as of
December 31, 2017
and
2016
. See Note 13 for additional information on the guaranty funds and our contributions of cash to our clearing houses guaranty funds.
As of
December 31, 2017
and
2016
, there is
$64 million
and
$44 million
, respectively, of additional combined cash reflected as short-term restricted cash and cash equivalents in the accompanying consolidated balance sheets related to other regulated entities and exchanges, including ICE Benchmark Administration, ICE Clear Netherlands, ICE Clear Canada, ICE Trade Vault U.K., ICE Endex, ICE Clear Singapore and NGX. The increase in the regulatory capital restricted cash as of
December 31, 2017
was primarily due to additional costs incurred due to the growth of these businesses and the acquisition of NGX in December 2017 (Note 3).
As of
December 31, 2017
and
2016
, there is
$22 million
and
$24 million
, respectively, of additional restricted cash, primarily related to escrow for recent acquisitions and was reflected as short-term or long-term restricted cash and cash equivalents in the accompanying consolidated balance sheets.
|
6.
|
Short-Term and Long-Term Investments
|
As of
December 31, 2017
, our short-term investments consist of available-for-sale securities as follows (in millions):
|
Cost
|
Gross
Unrealized
Gains
|
Gross
Unrealized
Losses
|
Estimated
Fair Value
|
||||||||||||
|
Mutual funds
|
$
|
16
|
|
$
|
—
|
|
$
|
—
|
|
$
|
16
|
|
|||
As of
December 31, 2016
, our short-term and long-term investments consist of available-for-sale securities as follows (in millions):
101
|
Cost
|
Gross
Unrealized
Gains
|
Gross
Unrealized
Losses
|
Estimated
Fair Value
|
||||||||||||
|
Cetip equity securities
|
$
|
324
|
|
$
|
108
|
|
$
|
—
|
|
$
|
432
|
|
|||
|
Mutual funds
|
23
|
|
—
|
|
—
|
|
23
|
|
|||||||
|
Total available-for-sale securities
|
$
|
347
|
|
$
|
108
|
|
$
|
—
|
|
$
|
455
|
|
|||
Until March 29, 2017, we held a
12%
ownership interest in Cetip, S.A., or Cetip, which we classified as an available-for-sale long-term investment. Cetip was recorded at its fair value using its quoted market price. Changes in the fair value of available-for-sale securities are reflected in accumulated other comprehensive income, and include the effects of both stock price and foreign currency translation fluctuations. The unrealized holding gains and losses are excluded from earnings and reported in other comprehensive income until realized. Realized gains and losses, and declines in value deemed to be other-than-temporary, are recognized in earnings.
We acquired the common stock of Cetip for an aggregate consideration of
$514 million
in cash in July 2011. During the year ended December 31, 2013, we recognized an impairment loss on our Cetip investment of
$190 million
, primarily due to unfavorable foreign exchange rate changes, which was equal to the difference between the
$324 million
fair value as of December 31, 2013 and the original investment cost of
$514 million
. The
$324 million
fair value of the Cetip investment as of December 31, 2013 became our new cost basis. The long-term investment in equity securities as of December 31, 2016 represents our investment in Cetip, which was valued at
$432 million
, including a
$108 million
accumulated unrealized gain.
On March 29, 2017, Cetip and BM&FBOVESPA S.A. finalized a merger agreement. BM&FBOVESPA S.A., which changed its name to B3 S.A. - Brasil, Bolsa, Balcao, or B3, following the merger with Cetip, is a stock exchange and operator of registration, clearing, custodial and settlement services for equities, financial securities, indices, rates, commodities and currencies and is located in São Paulo, Brazil. The merger valued our Cetip investment at
$500 million
. We received the proceeds in cash and in B3 common stock.
The cash component was valued at
$319 million
, which was subject to Brazilian capital gains tax of
$28 million
that was remitted to the Brazilian tax authorities in March 2017. We received net cash proceeds in April 2017 of
$286 million
, which is net of a foreign exchange loss of
$6 million
that was incurred in April 2017. We received
29,623,756
B3 common shares valued at their quoted market price of
$181 million
. In April 2017, we sold the B3 common shares for net proceeds of
$152 million
, which is net of a capital gain tax of
$26 million
that was remitted to the Brazilian tax authorities and further transaction expenses of
$3 million
that were incurred in April 2017. We used the
$438 million
in net cash and stock proceeds received from the merger and sale of B3 shares to pay down amounts outstanding under our Commercial Paper Program and for share repurchases.
The
$500 million
fair value of our investment in Cetip included an accumulated unrealized gain of
$176 million
, based on the
$324 million
cost basis. In connection with the sale of our equity investment in Cetip, the
$176 million
, accumulated unrealized gain was reclassified out of accumulated other comprehensive income and was recognized in other income as a realized investment gain in the accompanying consolidated statement of income for the year ended December 31, 2017.
Equity and fixed income mutual funds are held for the purpose of providing future payments for the supplemental executive savings plan and the supplemental executive retirement plan (Note 15) and are classified as available-for-sale securities.
|
7.
|
Property and Equipment
|
Property and equipment consisted of the following as of
December 31, 2017
and
2016
(in millions, except years):
|
As of December 31,
|
Depreciation
Period
(Years)
|
||||||||
|
2017
|
2016
|
||||||||
|
Software and internally developed software
|
$
|
766
|
|
$
|
600
|
|
1 to 8
|
||
|
Computer and network equipment
|
575
|
|
483
|
|
1 to 5
|
||||
|
Land
|
137
|
|
136
|
|
N/A
|
||||
|
Buildings and building improvements
|
289
|
|
259
|
|
2.5 to 40
|
||||
|
Leasehold improvements
|
234
|
|
216
|
|
1 to 17
|
||||
|
Equipment, aircraft and office furniture
|
275
|
|
242
|
|
1 to 12
|
||||
|
2,276
|
|
1,936
|
|
||||||
|
Less accumulated depreciation and amortization
|
(1,030
|
)
|
(807
|
)
|
|||||
|
Property and equipment, net
|
$
|
1,246
|
|
$
|
1,129
|
|
|||
102
For the years ended
December 31, 2017
,
2016
and
2015
, amortization of software and internally developed software was
$135 million
,
$113 million
and
$89 million
, respectively, and depreciation of all other property and equipment was
$122 million
,
$142 million
and
$124 million
, respectively. The unamortized software and internally developed software balances were
$269 million
and
$207 million
as of
December 31, 2017
and
2016
, respectively.
|
8.
|
Goodwill and Other Intangible Assets
|
The following is a summary of the activity in the goodwill balance for the years ended
December 31, 2017
and
2016
(in millions):
|
Goodwill balance at January 1, 2016
|
$
|
12,079
|
|
|
Acquisitions
|
307
|
|
|
|
Foreign currency translation
|
(135
|
)
|
|
|
Other activity, net
|
40
|
|
|
|
Goodwill balance at December 31, 2016
|
12,291
|
|
|
|
Acquisitions
|
211
|
|
|
|
Divestitures
|
(344
|
)
|
|
|
Foreign currency translation
|
63
|
|
|
|
Other activity, net
|
(5
|
)
|
|
|
Goodwill balance at December 31, 2017
|
$
|
12,216
|
|
The following is a summary of the activity in the other intangible assets balance for the years ended
December 31, 2017
and
2016
(in millions):
|
Other intangible assets balance at January 1, 2016
|
$
|
10,758
|
|
|
Acquisitions
|
180
|
|
|
|
Foreign currency translation
|
(155
|
)
|
|
|
Creditex customer relationship intangible asset impairment
|
(33
|
)
|
|
|
Amortization of other intangible assets
|
(323
|
)
|
|
|
Other activity, net
|
(7
|
)
|
|
|
Other intangible assets balance at December 31, 2016
|
10,420
|
|
|
|
Acquisitions
|
274
|
|
|
|
Divestitures
|
(216
|
)
|
|
|
Foreign currency translation
|
69
|
|
|
|
Amortization of other intangible assets
|
(272
|
)
|
|
|
Other activity, net
|
(6
|
)
|
|
|
Other intangible assets balance at December 31, 2017
|
$
|
10,269
|
|
We completed the acquisitions of NGX, Shorcan Energy, the BofAML indices, TMX Atrium and NYSE National and sold Trayport, NYSE Governance Services and IDMS during the year ended
December 31, 2017
and completed the acquisitions of Securities Evaluations and Credit Market Analysis during the year ended
December 31, 2016
(Note 3). The changes in other activity, net in the tables above primarily relate to adjustments to the fair value of the net tangible and identifiable intangible assets and liabilities relating to the acquisitions, with a corresponding adjustment to goodwill.
The foreign currency translation adjustments in the tables above resulted from a portion of our goodwill and other intangible assets being held at our U.K., EU and Canadian subsidiaries, some of whose functional currencies are not the U.S. dollar. The foreign currency translation decrease for the year ended
December 31, 2016
is primarily due to certain of our goodwill and intangible assets being recorded in pound sterling, which decreased in value due to the weakening pound sterling exchange rate following the U.K. referendum vote in June 2016 to leave the EU.
In 2016, we sold certain of Creditex’s U.S. voice brokerage operations to Tullett Prebon and we discontinued Creditex’s U.K. voice brokerage operations. We continue to operate Creditex’s electronically traded markets and systems, post-trade connectivity platforms and intellectual property. Based on an analysis of these factors, it was determined that the carrying value of the Creditex customer relationship intangible asset was not fully recoverable and an impairment of the asset was recorded in September 2016 for
$33 million
based on a discounted cash flow calculation. The impairment was recorded as amortization expense within our Trading and Clearing segment in the accompanying consolidated statement of income for the year ended
December 31, 2016
.
103
Other intangible assets and the related accumulated amortization consisted of the following as of
December 31, 2017
and
2016
(in millions, except years):
|
As of December 31,
|
Useful Life
(Years)
|
||||||||
|
2017
|
2016
|
||||||||
|
Customer relationships
|
$
|
3,923
|
|
$
|
4,063
|
|
3 to 25
|
||
|
Technology
|
461
|
|
438
|
|
2.5 to 11
|
||||
|
Trading products with finite lives
|
237
|
|
237
|
|
20
|
||||
|
Russell licensing rights
|
—
|
|
184
|
|
10
|
||||
|
Data/databases
|
150
|
|
145
|
|
4 to 10
|
||||
|
Market data provider relationships
|
11
|
|
11
|
|
20
|
||||
|
Non-compete agreements
|
38
|
|
38
|
|
1 to 5
|
||||
|
Other
|
33
|
|
31
|
|
1 to 5
|
||||
|
4,853
|
|
5,147
|
|
||||||
|
Less accumulated amortization
|
(1,200
|
)
|
(1,220
|
)
|
|||||
|
Total finite-lived intangible assets, net
|
3,653
|
|
3,927
|
|
|||||
|
Exchange registrations, licenses and contracts with indefinite lives
|
6,243
|
|
6,083
|
|
|||||
|
Trade names and trademarks with indefinite lives
|
280
|
|
294
|
|
|||||
|
In-process research and development
|
85
|
|
108
|
|
|||||
|
Other
|
8
|
|
8
|
|
|||||
|
Total indefinite-lived intangible assets
|
6,616
|
|
6,493
|
|
|||||
|
Total other intangible assets, net
|
$
|
10,269
|
|
$
|
10,420
|
|
|||
We previously held an exclusive license arrangement to list futures and options contracts on the Russell indexes, including the Russell 2000®, Russell 1000® and other related indexes. That license terminated during 2017 and the related intangible asset for Russell licensing rights was fully amortized.
For the years ended
December 31, 2017
,
2016
and
2015
, amortization of other intangible assets was
$272 million
,
$323 million
and
$160 million
, respectively. Collectively, the remaining weighted average useful lives of the finite-lived intangible assets is
19.1
years as of
December 31, 2017
. We expect future amortization expense from the finite-lived intangible assets as of
December 31, 2017
to be as follows (in millions):
|
2018
|
$
|
260
|
|
|
2019
|
254
|
|
|
|
2020
|
216
|
|
|
|
2021
|
205
|
|
|
|
2022
|
200
|
|
|
|
Thereafter
|
2,518
|
|
|
|
$
|
3,653
|
|
|
|
9.
|
Deferred Revenue
|
Deferred revenue represents cash received that is yet to be recognized as revenue. Total deferred revenue was
$264 million
as of
December 31, 2017
, including
$121 million
in current deferred revenue and
$143 million
in non-current deferred revenue. Total deferred revenue was
$237 million
as of
December 31, 2016
, including
$114 million
in current deferred revenue and
$123 million
in non-current deferred revenue. See Note 2 for a description of our annual listing, original listing, other listings and data services revenues and the revenue recognition policy for each of these revenue streams. The changes in our deferred revenue during the years
104
ended
December 31, 2017
and
2016
are as follows (in millions):
|
Annual Listing Revenue
|
Original Listing Revenues
|
Other Listing Revenues
|
Data Services and Other Revenues
|
Total
|
|||||||||||||||
|
Deferred revenue balance at January 1, 2016
|
$
|
—
|
|
$
|
50
|
|
$
|
59
|
|
$
|
81
|
|
$
|
190
|
|
||||
|
Additions
|
363
|
|
25
|
|
71
|
|
467
|
|
926
|
|
|||||||||
|
Amortization
|
(363
|
)
|
(9
|
)
|
(47
|
)
|
(460
|
)
|
(879
|
)
|
|||||||||
|
Deferred revenue balance at December 31, 2016
|
—
|
|
66
|
|
83
|
|
88
|
|
237
|
|
|||||||||
|
Additions
|
368
|
|
22
|
|
54
|
|
421
|
|
865
|
|
|||||||||
|
Amortization
|
(368
|
)
|
(11
|
)
|
(39
|
)
|
(421
|
)
|
(839
|
)
|
|||||||||
|
Acquisitions, net of divestitures (Note 3)
|
—
|
|
—
|
|
—
|
|
1
|
|
1
|
|
|||||||||
|
Deferred revenue balance at December 31, 2017
|
$
|
—
|
|
$
|
77
|
|
$
|
98
|
|
$
|
89
|
|
$
|
264
|
|
||||
Included in the amortization recognized in 2017,
$114 million
relates to the deferred revenue balance as of January 1, 2017. Included in the amortization recognized in 2016,
$98 million
relates to the deferred revenue balance as of January 1, 2016. As of
December 31, 2017
, we estimate that our deferred revenue will be recognized in the following years (in millions):
|
|
Original Listing Revenues
|
|
Other Listing Revenues
|
|
Data Services and Other Revenues
|
|
Total
|
||||||||
|
2018
|
$
|
14
|
|
|
$
|
24
|
|
|
$
|
83
|
|
|
$
|
121
|
|
|
2019
|
12
|
|
|
28
|
|
|
5
|
|
|
45
|
|
||||
|
2020
|
12
|
|
|
21
|
|
|
1
|
|
|
34
|
|
||||
|
2021
|
11
|
|
|
14
|
|
|
—
|
|
|
25
|
|
||||
|
2022
|
10
|
|
|
9
|
|
|
—
|
|
|
19
|
|
||||
|
Thereafter
|
18
|
|
|
2
|
|
|
—
|
|
|
20
|
|
||||
|
Total
|
$
|
77
|
|
|
$
|
98
|
|
|
$
|
89
|
|
|
$
|
264
|
|
|
10.
|
Debt
|
Our total debt, including short-term and long-term debt, consisted of the following as of
December 31, 2017
and
2016
(in millions):
|
As of December 31,
|
|||||||
|
2017
|
2016
|
||||||
|
Debt:
|
|||||||
|
Short-term debt:
|
|||||||
|
Commercial Paper
|
$
|
1,233
|
|
$
|
1,642
|
|
|
|
2018 Senior Notes (2.50% senior unsecured notes due October 15, 2018)
|
600
|
|
—
|
|
|||
|
NYSE Notes (2.00% senior unsecured notes due October 5, 2017)
|
—
|
|
851
|
|
|||
|
Total short-term debt
|
1,833
|
|
2,493
|
|
|||
|
Long-term debt:
|
|||||||
|
2018 Senior Notes (2.50% senior unsecured notes due October 15, 2018)
|
—
|
|
598
|
|
|||
|
2020 Senior Notes (2.75% senior unsecured notes due December 1, 2020)
|
1,244
|
|
1,242
|
|
|||
|
2022 Senior Notes (2.35% senior unsecured notes due September 15, 2022)
|
495
|
|
—
|
|
|||
|
2023 Senior Notes (4.00% senior unsecured notes due October 15, 2023)
|
791
|
|
790
|
|
|||
|
2025 Senior Notes (3.75% senior unsecured notes due December 1, 2025)
|
1,242
|
|
1,241
|
|
|||
|
2027 Senior Notes (3.10% senior unsecured notes due September 15, 2027)
|
495
|
|
—
|
|
|||
|
Total long-term debt
|
4,267
|
|
3,871
|
|
|||
|
Total debt
|
$
|
6,100
|
|
$
|
6,364
|
|
|
Amended Credit Facility
We had previously entered into a $
3.4 billion
senior unsecured revolving credit facility, or the Credit Facility, with a maturity date of November 13, 2020, pursuant to a credit agreement with Wells Fargo Bank, N.A., or Wells Fargo, as administrative agent,
105
issuing lender and swing-line lender, Bank of America, N.A., as syndication agent, backup administrative agent and swing-line lender, and the lenders party thereto. On August 18, 2017, we agreed with the lenders to, amongst other items, extend the maturity date to August 18, 2022, herein referred to as the Amended Credit Facility. The Amended Credit Facility includes an option for us to propose an increase in the aggregate amount available for borrowing by up to $
975 million
, subject to the consent of the lenders funding the increase and certain other conditions.
Other amendments within the Amended Credit Facility include, but are not limited to, (i) eliminating the step-up in the commitment fee ratings-based grid that was scheduled to take effect in April 2019, (ii) removing ICE Europe Parent Limited as a party to the credit agreement, (iii) removing the guaranty by ICE in respect of ICE Europe Parent Limited, (iv) increasing the maximum leverage ratio to
3.50
:1.00, and (v) up to
two
times, increasing the maximum leverage ratio from
3.50
:1.00 to
4.00
:1.00 for a period of one year following a material acquisition.
No
amounts were outstanding under the Amended Credit Facility as of
December 31, 2017
. We incurred debt issuance costs of
$5 million
relating to the Amended Credit Facility and they are presented in the accompanying consolidated balance sheet as other non-current assets and will be amortized over the life of the Amended Credit Facility.
Amounts borrowed under the Amended Credit Facility may be prepaid at any time without premium or penalty. The Amended Credit Facility provides for a
$3.4 billion
multi-currency revolving facility, with sub-limits for non-dollar borrowings and letters of credit and with a swing-line facility available on a same-day basis. Of the
$3.4 billion
that is currently available for borrowing under the Amended Credit Facility, $
1.2 billion
is required to back-stop the amount outstanding under our Commercial Paper Program as of
December 31, 2017
and
$100 million
is required to support certain subsidiary clearing house commitments (Note 13). The amount required to back-stop the amounts outstanding under the Commercial Paper Program will fluctuate as we increase or decrease our commercial paper borrowings. The remaining $
2.1 billion
available under the Amended Credit Facility as of
December 31, 2017
is available to us to use for working capital and general corporate purposes including, but not limited to, acting as a back-stop to future increases in the amounts outstanding under the Commercial Paper Program.
Borrowings under the Amended Credit Facility will bear interest on the principal amount outstanding at either (a) LIBOR plus an applicable margin rate or (b) a “base rate” plus an applicable margin rate; provided, however, that all loans denominated in a foreign currency will bear interest at LIBOR plus an applicable margin rate. The “base rate” equals the higher of (i) Wells Fargo’s prime rate, (ii) the federal funds rate plus
0.50%
, or (iii) the one-month LIBOR rate plus
1.00%
. The applicable margin rate is based upon our public long-term debt ratings and ranges from
0.875%
to
1.50%
on LIBOR borrowings and from
0.00%
to
0.50%
on base rate borrowings.
The Amended Credit Facility includes an unutilized revolving credit commitment fee that is equal to the unused maximum revolver amount, multiplied by an applicable commitment fee rate and is payable in arrears on a quarterly basis. The applicable commitment fee rate ranges from
0.08%
to
0.20%
and is determined based on our long-term debt rating. As of
December 31, 2017
, the applicable commitment fee rate was
0.125%
based on our current long-term debt ratings.
The Amended Credit Facility contains customary representations and warranties, covenants and events of default, including a leverage ratio, as well as limitations on liens on our assets, indebtedness of non-obligor subsidiaries, the sale of all or substantially all of our assets, and other matters.
Senior Notes
On August 17, 2017, we issued
$1.0 billion
in aggregate senior notes, including
$500 million
principal amount of
2.35%
senior unsecured fixed rate notes due September 2022, or the 2022 Senior Notes, and
$500 million
principal amount of
3.10%
senior unsecured fixed rate notes due September 2027, or the 2027 Senior Notes. We used the majority of the net proceeds from the 2022 Senior Notes and 2027 Senior Notes offering to fund the redemption of the NYSE Notes.
We incurred debt issuance costs of
$8 million
relating to the issuance of the 2022 Senior Notes and the 2027 Senior Notes and they are presented in the accompanying consolidated balance sheet as a deduction from the carrying amount of the related debt liability and will be amortized over the life of the 2022 Senior Notes and the 2027 Senior Notes. The 2022 Senior Notes and 2027 Senior Notes contain affirmative and negative covenants, including, but not limited to, certain redemption rights, limitations on liens and indebtedness and limitations on certain mergers, sales, dispositions and lease-back transactions.
In November 2015, we issued
$2.5 billion
in aggregate senior notes, including
$1.25 billion
principal amount of
2.75%
senior unsecured fixed rate notes due November 2020, or the 2020 Senior Notes, and
$1.25 billion
principal amount of
3.75%
senior unsecured fixed rate notes due November 2025, or the 2025 Senior Notes. We used the net proceeds from the 2020 Senior Notes and 2025 Senior Notes offering, together with
$1.6 billion
of borrowings under our Commercial Paper Program, to finance the
$4.1 billion
cash portion of the purchase price of the acquisition of Interactive Data. The 2020 Senior Notes and 2025 Senior Notes contain affirmative and negative covenants, including, but not limited to, certain redemption rights, limitations on liens and indebtedness, limitations on certain mergers, sales, dispositions and lease-back transactions.
106
Commercial Paper Program
We have entered into a U.S. dollar commercial paper program, or the Commercial Paper Program. Our Commercial Paper Program is currently backed by the borrowing capacity available under the Amended Credit Facility, equal to the amount of the commercial paper that is issued and outstanding at any given point in time. The effective interest rate of commercial paper issuances does not materially differ from short-term interest rates (such as USD LIBOR). The fluctuation of these rates due to market conditions may impact our interest expense.
We repaid
$409 million
of net notes outstanding under the Commercial Paper Program during the year ended
December 31, 2017
primarily using net cash proceeds received from the sale of our investment in Cetip and the sale of Trayport. These repayments were partially offset by notes issued under the Commercial Paper Program during the year ended
December 31, 2017
for the cash acquisitions and investments and to repurchase our common stock. See Note 3 for a discussion of our 2017 acquisitions, investments and divestitures. We used net proceeds from notes issued under the Commercial Paper Program during the year ended December 31, 2016 to finance part of the cash purchase price of the Securities Evaluations and Credit Market Analysis acquisitions and for general corporate purposes. We used net proceeds from notes issued under the Commercial Paper Program during the year ended December 31, 2015 to finance part of the cash portion of the purchase price of the Interactive Data acquisition and to pay related fees and expenses, to repurchase our common stock, and for general corporate purposes. We repaid a portion of the amounts outstanding under the Commercial Paper Program during the years ended December 31, 2017, 2016 and 2015 with cash flows from operations.
Commercial paper notes of $
1.2 billion
with original maturities ranging from
two
to
64
days were outstanding as of
December 31, 2017
under our Commercial Paper Program. As of
December 31, 2017
, the weighted average interest rate on the $
1.2 billion
outstanding under our Commercial Paper Program was
1.49%
per annum, with a weighted average maturity of
18
days. Commercial paper notes of
$1.6 billion
with original maturities ranging from
three
to
68
days were outstanding as of December 31, 2016 under the Commercial Paper Program. As of December 31, 2016, the weighted average interest rate on the
$1.6 billion
outstanding under the Commercial Paper Program was
0.74%
per annum, with a weighted average maturity of
18
days.
NYSE Notes
The $
850 million
,
2.00%
senior unsecured fixed rate NYSE Notes were due in October 2017. We redeemed the NYSE Notes in full in September 2017 using the majority of the proceeds from the 2022 Senior Notes and 2027 Senior Notes offering.
We previously provided condensed consolidating financial statements for Intercontinental Exchange, Inc., or ICE (Parent), NYSE Holdings LLC and the subsidiary non-guarantors in a footnote to our consolidated financial statements. However, in connection with the NYSE Notes being redeemed in full in September 2017, all guarantees between ICE and NYSE Holdings LLC were terminated and we are no longer required to include a condensed consolidating financial statements footnote in our quarterly and annual filings.
Debt Repayment Schedule
As of
December 31, 2017
, the outstanding debt repayment schedule is as follows (in millions):
|
2018
|
$
|
1,835
|
|
|
2019
|
—
|
|
|
|
2020
|
1,250
|
|
|
|
2021
|
—
|
|
|
|
2022
|
500
|
|
|
|
Thereafter
|
2,550
|
|
|
|
Principal amounts repayable
|
6,135
|
|
|
|
Debt issuance costs
|
(27
|
)
|
|
|
Unamortized balance of fair value adjustments and discounts on bonds, net
|
(8
|
)
|
|
|
Total debt outstanding
|
$
|
6,100
|
|
|
11.
|
Equity
|
We currently sponsor employee and director stock option and restricted stock plans. Employee and director stock-based compensation expenses recognized for both stock options and restricted stock in the accompanying consolidated statements of income was
$135 million
,
$123 million
and
$111 million
for the years ended
December 31, 2017
,
2016
and
2015
, respectively. The amount expensed for the years ended
December 31, 2017
,
2016
and
2015
is net of
$18 million
,
$13 million
and
$11 million
, respectively, of stock-based compensation that was capitalized as software development costs.
107
In March 2016, we early adopted Accounting Standards Update No. 2016-09, Stock Compensation
(Topic 718) - Improvements to Employee Share-Based Payment Accounting
, or ASU 2016-09, on a prospective basis. Under the requirements of ASU 2016-09, we recognized
$15 million
in excess tax benefits for tax deductions in excess of cumulative compensation expenses for financial reporting purposes for the year ended
December 31, 2016
through our consolidated statement of income. For the year ended December 31, 2015, we recognized excess tax benefits of
$19 million
as an increase to the additional paid-in capital balance.
As of
December 31, 2017
, we had
39.7 million
shares in total under various equity plans that are available for future issuance as stock option and restricted stock awards.
Stock Option Plans
Stock options are granted at the discretion of the compensation committee of the board of directors. All stock options are granted at an exercise price equal to the fair value of the common stock on the date of grant. The grant date fair value is based on the closing stock price on the date of grant as well as certain other assumptions. The fair value of the stock options on the date of grant is recognized as expense ratably over the vesting period, net of estimated forfeitures. We may grant, under provisions of the plans, both incentive stock options and nonqualified stock options. The options generally vest over
three
years, but can vest at different intervals based on the compensation committee’s determination and the terms of the equity plans. Generally, options may be exercised up to
ten
years after the date of grant, but expire either
14
or
60
days after termination of employment unless an employee’s employment agreement specifies otherwise. The shares of common stock issued under our stock option plans are made available from authorized and unissued common stock or treasury shares. The following is a summary of stock options for the years ended
December 31, 2017
,
2016
and
2015
:
|
Number of Options
|
Weighted Average
Exercise Price per Option |
|||||
|
Outstanding at January 1, 2015
|
3,814,335
|
|
$
|
27.21
|
|
|
|
Granted
|
882,335
|
|
41.59
|
|
||
|
Exercised
|
(823,915
|
)
|
20.40
|
|
||
|
Outstanding at December 31, 2015
|
3,872,755
|
|
31.93
|
|
||
|
Granted
|
751,615
|
|
50.01
|
|
||
|
Exercised
|
(745,665
|
)
|
28.73
|
|
||
|
Outstanding at December 31, 2016
|
3,878,705
|
|
36.05
|
|
||
|
Granted
|
730,913
|
|
57.34
|
|
||
|
Exercised
|
(596,230
|
)
|
27.97
|
|
||
|
Outstanding at December 31, 2017
|
4,013,388
|
|
41.13
|
|
||
Details of stock options outstanding as of
December 31, 2017
are as follows:
|
Number of Options
|
Weighted Average
Exercise Price |
Weighted Average
Remaining Contractual Life (Years) |
Aggregate
Intrinsic Value (In millions) |
|||||||||
|
Vested or expected to vest
|
4,013,388
|
|
$
|
41.13
|
|
6.6
|
$
|
118
|
|
|||
|
Exercisable
|
2,989,950
|
|
$
|
36.36
|
|
5.8
|
$
|
102
|
|
|||
The total intrinsic value of stock options exercised during the years ended
December 31, 2017
,
2016
and
2015
was
$22 million
,
$18 million
and
$22 million
, respectively. As of
December 31, 2017
, there was
$8 million
in total unrecognized compensation costs related to stock options. These costs are expected to be recognized over a weighted average period of
1.7
years as the stock options vest.
Of the options outstanding at
December 31, 2017
,
2,989,950
were exercisable at a weighted-average exercise price of
$36.36
. Of the options outstanding at
December 31, 2016
,
2,787,525
were exercisable at a weighted-average exercise price of
$31.61
. Of the options outstanding at
December 31, 2015
,
2,699,865
were exercisable at a weighted-average exercise price of
$27.87
.
We use the Black-Scholes option pricing model for purposes of valuing stock option awards. During the years ended
December 31, 2017
,
2016
and
2015
, we used the assumptions in the table below to compute the value of all options for shares of common stock granted to employees:
108
|
Year Ended December 31,
|
||||||||||||
|
Assumptions
|
2017
|
2016
|
2015
|
|||||||||
|
Risk-free interest rate
|
1.84
|
%
|
1.51
|
%
|
1.08
|
%
|
||||||
|
Expected life in years
|
5.0
|
|
5.0
|
|
5.0
|
|
||||||
|
Expected volatility
|
21
|
%
|
24
|
%
|
24
|
%
|
||||||
|
Expected dividend yield
|
1.40
|
%
|
1.36
|
%
|
1.25
|
%
|
||||||
|
Estimated fair value of options granted per share
|
$
|
10.50
|
|
$
|
9.88
|
|
$
|
8.19
|
|
|||
The risk-free interest rate is based on the zero-coupon U.S. Treasury yield curve in effect at the time of grant. The expected life computation is derived from historical exercise patterns and anticipated future patterns. Expected volatilities are based on historical volatility of our stock.
Restricted Stock Plans
Restricted stock units are granted at the discretion of the compensation committee of the board of directors. We granted
3,274,358
,
3,251,017
and
3,457,590
time-based and performance-based restricted stock units during the years ended
December 31, 2017
,
2016
and
2015
, respectively, including
2,364,288
,
2,325,985
and
1,871,785
time-based restricted stock units during the years ended
December 31, 2017
,
2016
and
2015
, respectively. The grant date fair value of each award is based on the closing stock price at the date of grant. The fair value of the time-based restricted stock units on the date of grant is recognized as expense ratably over the vesting period, which is typically
three
years, net of forfeitures. Granted but unvested shares are generally forfeited upon termination of employment. When restricted stock is forfeited, compensation costs previously recognized for unvested shares are reversed. Until the shares vest and are issued, the participants have no voting or dividend rights and the shares may not be sold, assigned, transferred, pledged or otherwise encumbered. Unvested restricted stock earns dividend equivalents which are paid in cash on the vesting date.
We recognize compensation costs, net of forfeitures, using an accelerated attribution method over the vesting period for awards with performance conditions. Compensation costs for such awards are recognized only if it is probable that the condition will be satisfied. If we initially determine that it is not probable that the performance condition will be satisfied and later determine that it is probable that the performance condition will be satisfied, or vice versa, the effect of the change in estimate is accounted for in the period of change by recording a cumulative catch-up adjustment to retroactively apply the new estimate. We recognize the remaining compensation costs over the remaining vesting period. Our compensation committee, pursuant to the terms of the equity plans and the authority delegated to it by our board of directors, can make equitable adjustments to the performance condition in recognition of unusual or non-recurring events.
In January
2017
, we reserved a maximum of
1,534,218
restricted shares for potential issuance as performance-based restricted shares for certain of our employees. These restricted shares were subject to a market condition that could have reduced the number of shares that were awarded if our
2017
total shareholder return fell below that of the
2017
return of the S&P 500 Index and if we achieved above target financial performance level. Our total shareholder return for the year ended
December 31, 2017
was higher than the
2017
return of the S&P 500 Index. Therefore, no share reduction was required. Based on our actual
2017
financial performance as compared to the
2017
financial performance level thresholds,
767,109
restricted shares were awarded, which resulted in
$43 million
in compensation expenses that will be expensed over the
three
-year accelerated vesting period, including
$26 million
that was expensed during the year ended
December 31, 2017
.
The grant date fair values of the awards with a market condition were estimated based on our stock price on the grant date, the valuation of historical awards with market conditions, the relatively low likelihood that the market condition will affect the number of shares granted (as the market condition only affects shares granted in excess of certain financial performance targets), and our expectation of achieving the financial performance targets. The grant date fair value of the awards, when considering the impact of the market condition on fair value, was determined to not be materially different from our stock price on the respective grant dates.
Restricted shares are used as an incentive to attract and retain qualified employees and to increase shareholder returns with actual performance linked to both short and long-term shareholder return. Our equity plans include a change in control provision that may accelerate vesting on both the time-based and performance-based restricted shares if the awards are not assumed by an acquirer in the case of a change in control. The following is a summary of the nonvested restricted shares under all plans discussed above for the years ended
December 31, 2017
,
2016
and
2015
:
109
|
Number of
Restricted Stock Shares |
Weighted Average
Grant-Date Fair Value per Share |
||||
|
Nonvested at January 1, 2015
|
5,354,975
|
$
|
35.36
|
|
|
|
Granted
|
3,457,590
|
42.09
|
|
||
|
Vested
|
(2,182,805)
|
31.98
|
|
||
|
Forfeited
|
(358,585)
|
33.90
|
|
||
|
Nonvested at December 31, 2015
|
6,271,175
|
39.99
|
|
||
|
Granted
|
3,251,017
|
50.06
|
|
||
|
Vested
|
(2,640,640)
|
38.05
|
|
||
|
Forfeited
|
(445,681)
|
45.51
|
|
||
|
Nonvested at December 31, 2016
|
6,435,871
|
45.86
|
|
||
|
Granted
|
3,274,358
|
57.61
|
|
||
|
Vested
|
(3,508,814)
|
44.64
|
|
||
|
Forfeited
|
(448,211)
|
52.38
|
|
||
|
Nonvested at December 31, 2017
|
5,753,204
|
52.78
|
|
||
Restricted stock shares granted in the table above include both time-based and performance-based grants. Performance-based shares have been presented to reflect the actual shares to be issued based on the achievement of past performance targets, also considering the impact of any market conditions. Non-vested performance-based restricted shares granted are presented in the table above at the maximum number of restricted shares that would vest if the maximum performance targets are met. As of
December 31, 2017
, there were
$142 million
in total unrecognized compensation costs related to the time-based restricted stock and the performance-based restricted stock. These costs are expected to be recognized over a weighted-average period of
1.3
years as the restricted stock vests. During the years ended
December 31, 2017
,
2016
and
2015
, the total fair value of restricted stock vested under all restricted stock plans was
$206 million
,
$130 million
and
$96 million
, respectively.
Treasury Stock
During the years ended
December 31, 2017
,
2016
and
2015
, we received
1,503,453
shares,
1,074,162
shares and
979,295
shares, respectively, of common stock from certain of our employees related to tax withholdings made by us on our employee’s behalf for restricted stock and stock option exercises. We recorded the receipt of the shares as treasury stock. Treasury stock activity is presented in the accompanying consolidated statements of changes in equity, accumulated other comprehensive income (loss) and redeemable non-controlling interest.
In connection with the record date for a
5
-for-1 stock split on October 27, 2016, all shares of common stock held by us as treasury shares were canceled and extinguished. Therefore, as of the close of market on October 27, 2016, all
35,273,515
outstanding treasury stock shares were retired. In connection with the retirement, of the
$1.5 billion
value assigned to the treasury stock shares,
$1.1 billion
was allocated to additional paid-in capital and
$370 million
was allocated to retained earnings. The amount allocated to additional paid-in capital was determined based on the paid-in capital per share generated from the historical issuances of these treasury shares.
Stock Repurchase Program
During the years ended
December 31, 2017
,
2016
and
2015
, we repurchased
14,966,616
shares,
902,920
shares and
14,343,845
shares, respectively, of our outstanding common stock at a cost of
$949 million
,
$50 million
and
$660 million
, respectively. The shares repurchased are held in treasury stock. These repurchases were completed on the open market and under our 10b5-1 trading plan. In connection with our acquisition of Interactive Data during the fourth quarter of 2015, we suspended our stock repurchase plan for a period of time. The timing and extent of future repurchases that are not made pursuant to a Rule 10b5-1 trading plan will be at our discretion and will depend upon many conditions. Our management periodically reviews whether or not to be active in repurchasing our stock. In making a determination regarding any stock repurchases, we consider multiple factors. The factors may include: overall stock market conditions, our common stock price movements, the remaining amount authorized for repurchases by our board of directors, the potential impact of a stock repurchase program on our corporate debt ratings, our expected free cash flow and working capital needs, our current and future planned strategic growth initiatives, and other potential uses of our cash and capital resources.
In August 2016, our board of directors approved an aggregate of
$1.0 billion
for future repurchases of our common stock with no fixed expiration date. In September 2017, our board of directors approved an aggregate of
$1.2 billion
for future repurchases of our common stock with no fixed expiration date that became effective on January 1, 2018. We expect funding for any share repurchases to come from our operating cash flow or borrowings under our debt facilities or commercial paper program.
110
Repurchases may be made from time to time on the open market, through established trading plans, in privately-negotiated transactions or otherwise, in accordance with all applicable securities laws, rules and regulations. We have entered into a Rule 10b5-1 trading plan, as authorized by our board of directors, to govern some or all of the repurchases of our shares of common stock. We may discontinue the stock repurchases at any time and may amend or terminate the Rule 10b5-1 trading plan at any time. The approval of our board of directors for the share repurchases does not obligate us to acquire any particular amount of our common stock. In addition, our board of directors may increase or decrease the amount of capacity we have for repurchases from time to time. We repurchased shares of our common stock in the open market during the periods presented as follows:
|
Number of Shares
|
Average Repurchase Price Per Share
|
Amount
(in millions)
|
||||||||
|
2017
|
||||||||||
|
Fourth quarter
|
3,497,574
|
|
$
|
68.62
|
|
$
|
240
|
|
||
|
Third quarter
|
3,641,529
|
|
65.90
|
|
240
|
|
||||
|
Second quarter
|
3,916,487
|
|
61.28
|
|
240
|
|
||||
|
First quarter
|
3,911,026
|
|
58.49
|
|
229
|
|
||||
|
Total open market common stock repurchases
|
14,966,616
|
|
$
|
949
|
|
|||||
|
2016
|
||||||||||
|
Fourth quarter
|
902,920
|
|
$
|
55.42
|
|
$
|
50
|
|
||
|
Third quarter
|
—
|
|
—
|
|
—
|
|
||||
|
Second quarter
|
—
|
|
—
|
|
—
|
|
||||
|
First quarter
|
—
|
|
—
|
|
—
|
|
||||
|
Total open market common stock repurchases
|
902,920
|
|
$
|
50
|
|
|||||
|
2015
|
||||||||||
|
Fourth quarter
|
1,163,975
|
|
$
|
47.14
|
|
$
|
56
|
|
||
|
Third quarter
|
4,455,675
|
|
46.27
|
|
206
|
|
||||
|
Second quarter
|
4,362,695
|
|
46.44
|
|
202
|
|
||||
|
First quarter
|
4,361,500
|
|
45.06
|
|
196
|
|
||||
|
Total open market common stock repurchases
|
14,343,845
|
|
$
|
660
|
|
|||||
Dividends
The declaration of dividends is subject to the discretion of our board of directors, and may be affected by various factors, including our future earnings, financial condition, capital requirements, levels of indebtedness, credit ratings and other considerations our board of directors deem relevant. Our board of directors has adopted a quarterly dividend declaration policy providing that the declaration of any dividends will be determined quarterly by the board or audit committee of the board of directors taking into account such factors as our evolving business model, prevailing business conditions and our financial results and capital requirements, without a predetermined annual net income payout ratio. We declared and paid cash dividends per share during the periods presented as follows:
111
|
Dividends Per Share
|
Amount
(in millions)
|
||||||
|
2017
|
|||||||
|
Fourth quarter
|
$
|
0.20
|
|
$
|
118
|
|
|
|
Third quarter
|
0.20
|
|
119
|
|
|||
|
Second quarter
|
0.20
|
|
119
|
|
|||
|
First quarter
|
0.20
|
|
120
|
|
|||
|
Total cash dividends declared and paid
|
0.80
|
|
$
|
476
|
|
||
|
2016
|
|||||||
|
Fourth quarter
|
$
|
0.17
|
|
$
|
102
|
|
|
|
Third quarter
|
0.17
|
|
102
|
|
|||
|
Second quarter
|
0.17
|
|
103
|
|
|||
|
First quarter
|
0.17
|
|
102
|
|
|||
|
Total cash dividends declared and paid
|
$
|
0.68
|
|
$
|
409
|
|
|
|
2015
|
|||||||
|
Fourth quarter
|
$
|
0.15
|
|
$
|
90
|
|
|
|
Third quarter
|
0.15
|
|
83
|
|
|||
|
Second quarter
|
0.15
|
|
85
|
|
|||
|
First quarter
|
0.13
|
|
73
|
|
|||
|
Total cash dividends declared and paid
|
$
|
0.58
|
|
$
|
331
|
|
|
|
12.
|
Income Taxes
|
Income before income taxes and the income tax provision consisted of the following for the years ended
December 31, 2017
,
2016
and
2015
(in millions):
|
Year Ended December 31,
|
|||||||||||
|
2017
|
2016
|
2015
|
|||||||||
|
Income before income taxes
|
|||||||||||
|
Domestic
|
$
|
1,299
|
|
$
|
1,043
|
|
$
|
824
|
|
||
|
Foreign
|
1,218
|
|
986
|
|
829
|
|
|||||
|
$
|
2,517
|
|
$
|
2,029
|
|
$
|
1,653
|
|
|||
|
Income tax provision
|
|||||||||||
|
Current tax expense:
|
|||||||||||
|
Federal
|
$
|
266
|
|
$
|
258
|
|
$
|
250
|
|
||
|
State
|
92
|
|
5
|
|
46
|
|
|||||
|
Foreign
|
268
|
|
203
|
|
170
|
|
|||||
|
$
|
626
|
|
$
|
466
|
|
$
|
466
|
|
|||
|
Deferred tax expense (benefit):
|
|||||||||||
|
Federal
|
$
|
(674
|
)
|
$
|
65
|
|
$
|
(7
|
)
|
||
|
State
|
33
|
|
76
|
|
(40
|
)
|
|||||
|
Foreign
|
(10
|
)
|
(27
|
)
|
(61
|
)
|
|||||
|
$
|
(651
|
)
|
$
|
114
|
|
$
|
(108
|
)
|
|||
|
Total income tax expense (benefit)
|
$
|
(25
|
)
|
$
|
580
|
|
$
|
358
|
|
||
112
A reconciliation of the statutory U.S. federal income tax rate to our effective income tax rate for the years ended
December 31, 2017
,
2016
and
2015
is as follows:
|
Year Ended December 31,
|
||||||||
|
2017
|
2016
|
2015
|
||||||
|
Statutory federal income tax rate
|
35
|
%
|
35
|
%
|
35
|
%
|
||
|
State and local income taxes, net of federal benefit
|
3
|
|
3
|
|
2
|
|
||
|
Foreign tax rate differential
|
(7
|
)
|
(7
|
)
|
(7
|
)
|
||
|
Deferred tax benefit due to tax law changes
|
(30
|
)
|
(2
|
)
|
(4
|
)
|
||
|
Uncertain tax positions
|
—
|
|
—
|
|
(3
|
)
|
||
|
Other
|
(2
|
)
|
—
|
|
(1
|
)
|
||
|
Total provision for income taxes
|
(1
|
)%
|
29
|
%
|
22
|
%
|
||
The effective tax rates for the years ended
December 31, 2017
,
2016
and
2015
are lower than the federal statutory rate primarily due to favorable U.S. and U.K. tax law changes and favorable foreign income tax rate differentials, partially offset by state income taxes. Favorable foreign income tax rate differentials result primarily from lower income tax rates in the U.K. and various other lower tax jurisdictions as compared to the historical income tax rates in the U.S.
On December 22, 2017, the TCJA was signed into law (Note 2). The TCJA reduced the U.S. corporate income tax rate from
35%
to
21%
effective January 1, 2018. We are required to revalue our U.S. deferred tax assets and liabilities at the new federal corporate income tax rate as of the date of enactment of the TCJA and to include the rate change effect in the tax provision for the period ended December 31, 2017. As a result, we recognized a
$764 million
deferred tax benefit based on a reasonable estimate of the deferred tax assets and liabilities as of December 22, 2017. This significantly reduced the effective tax rate for the period ended December 31, 2017 in comparison to the effective tax rates for the last two comparable periods.
During the fourth quarter of 2015, the U.K. reduced the corporate income tax rate from
20%
to
19%
effective April 1, 2017 and to
18%
effective April 1, 2020. During the third quarter of 2016, the U.K. further reduced their corporate income tax rate from
18%
to
17%
effective April 1, 2020. The reduction in the future U.S. and U.K. corporate income tax rates resulted in deferred tax benefits. The impact of the deferred tax benefits for the U.S. and U.K. corporate income tax rate reductions for the years ended
December 31, 2017
,
2016
and
2015
collectively lowered the effective tax rates by
30%
,
2%
and
4%
, respectively, and resulted in deferred tax benefits of
$764 million
,
$34 million
and
$60 million
, respectively.
The decrease in the effective tax rate for the year ended
December 31, 2017
, from the comparable period in
2016
, is primarily due to the deferred tax benefit associated with the TCJA and tax benefits associated with a divestiture in the second quarter of 2017, partially offset by the deferred tax benefit from the U.K. corporate income tax reduction in the third quarter of 2016, additional tax expense from an Illinois corporate income tax rate increase enacted in the third quarter of 2017, and an income tax expense increase due to a relatively higher U.S. mix of income in 2017. The increase in the effective tax rate for the year ended
December 31, 2016
, from the comparable period in
2015
, is primarily due to the tax impact of foreign versus U.S. based pre-tax income, lower deferred tax benefits associated with the future U.K. income tax rate reductions, and greater favorable settlements with various taxing authorities in 2015, partially offset by a tax benefit from the early adoption of ASU 2016-09 in 2016.
Deferred income taxes reflect the net tax effects of temporary differences between the carrying amounts of assets and liabilities for financial reporting purposes and the amounts used for income tax purposes. As a result of the enactment of TCJA on December 22, 2017, we revalued the U.S. deferred tax assets and liabilities at the new federal corporate income tax rate of 21%, for the period ended December 31, 2017. Therefore, the ending balance of the net deferred tax liability for that period is significantly lower compared to the prior periods’ balances. The following table summarizes the significant components of our deferred tax liabilities and assets as of
December 31, 2017
and
2016
(in millions):
113
|
December 31,
|
|||||||
|
2017
|
2016
|
||||||
|
Deferred tax assets:
|
|||||||
|
Deferred and stock-based compensation
|
$
|
105
|
|
$
|
166
|
|
|
|
Pension
|
16
|
|
89
|
|
|||
|
Liability reserve
|
37
|
|
52
|
|
|||
|
Tax credits
|
12
|
|
64
|
|
|||
|
Loss carryforward
|
147
|
|
127
|
|
|||
|
Deferred revenue
|
39
|
|
38
|
|
|||
|
Other
|
42
|
|
47
|
|
|||
|
Total
|
398
|
|
583
|
|
|||
|
Valuation allowance
|
(126
|
)
|
(122
|
)
|
|||
|
Total deferred tax assets, net of valuation allowance
|
$
|
272
|
|
$
|
461
|
|
|
|
Deferred tax liabilities:
|
|||||||
|
Property and equipment
|
$
|
(99
|
)
|
$
|
(113
|
)
|
|
|
Acquired intangibles
|
(2,453
|
)
|
(3,302
|
)
|
|||
|
Total deferred tax liabilities
|
$
|
(2,552
|
)
|
$
|
(3,415
|
)
|
|
|
Net deferred tax liabilities
|
$
|
(2,280
|
)
|
$
|
(2,954
|
)
|
|
|
Reported as:
|
|||||||
|
Net non-current deferred tax assets
|
$
|
3
|
|
$
|
4
|
|
|
|
Net non-current deferred tax liabilities
|
(2,283
|
)
|
(2,958
|
)
|
|||
|
Net deferred tax liabilities
|
$
|
(2,280
|
)
|
$
|
(2,954
|
)
|
|
A reconciliation of the beginning and ending amount of deferred income tax valuation allowance is as follows for the years ended
December 31, 2017
,
2016
and
2015
(in millions):
|
Year Ended December 31,
|
|||||||||||
|
2017
|
2016
|
2015
|
|||||||||
|
Beginning balance of deferred income tax valuation allowance
|
$
|
122
|
|
$
|
72
|
|
$
|
75
|
|
||
|
Increases charged to income tax expense
|
—
|
|
28
|
|
1
|
|
|||||
|
Charges against goodwill
|
15
|
|
22
|
|
1
|
|
|||||
|
Decreases
|
(11
|
)
|
—
|
|
(5
|
)
|
|||||
|
Ending balance of deferred income tax valuation allowance
|
$
|
126
|
|
$
|
122
|
|
$
|
72
|
|
||
We recognize valuation allowances on deferred tax assets if, based on the weight of the evidence, we believe that it is more likely than not that some or all of the deferred tax assets will not be realized. We recorded a valuation allowance for deferred tax assets of
$126 million
and
$122 million
as of
December 31, 2017
and
2016
, respectively. Increases charged to income tax expense primarily relate to deferred tax assets on foreign net operating and capital losses that we do not expect to be realizable in future periods. Increases charged against goodwill primarily relate to deferred tax assets arising on the 2017 acquisition of National Stock Exchange and the 2016 acquisition of a foreign branch that we do not expect to be realizable in future periods. Decreases for the year ended December 31, 2017 relate to the U.S. corporate income tax rate reduction from
35%
to 21% and the net impact from divestitures of Trayport and IDMS. Decreases for the year ended December 31, 2015 relate to net operating loss carryforwards that we determined would be available to offset income in future periods.
As part of U.S. tax reform, the TCJA imposes a transition tax on certain accumulated foreign earnings aggregated across all non-U.S. subsidiaries, net of foreign deficits, as computed under U.S. tax principles. As we are in an aggregate net foreign deficit position for U.S. tax purposes, we are not liable for the transition tax.
Our non-U.S. subsidiaries had
$4.5 billion
in cumulative undistributed earnings as of
December 31, 2017
. This amount represents the post-income tax earnings under U.S. GAAP principles. The earnings from our non-U.S. subsidiaries are considered to be indefinitely reinvested. Accordingly, no provision for U.S. federal and state income taxes has been made in the accompanying consolidated financial statements. Further, a determination of the unrecognized deferred tax liability is not practicable.
Any future distribution by way of dividend of these non-U.S. earnings may subject us to both U.S. federal and state income taxes, as adjusted for non-U.S. tax credits, and withholding taxes payable to various non-U.S. countries. Such dividends may not be
114
subject to U.S. federal tax under the TCJA and we will continue to monitor both federal and state interpretations, guidance and regulations concerning U.S. tax reform. We will continue to evaluate our indefinite reinvestment assertion in light of any further developments.
SAB 118 has provided guidance for companies that have not completed their accounting for the income tax effects of the TCJA in the period of enactment, allowing for a measurement period of up to one year after the enactment date to finalize the recording of the related tax impacts. As of December 31, 2017, we have not completed our accounting for the tax effects of the enactment of the TCJA, however, we have made a reasonable estimate of the effects on our deferred tax balances and in relation to the transition tax. In other cases, we have not been able to make a reasonable estimate and will continue to analyze the TCJA in order to finalize any related impacts within the measurement period. The FASB Staff also provided additional guidance to address the accounting for the effects of the provisions related to the taxation of GILTI, noting that companies should make an accounting policy election to recognize deferred taxes for temporary basis differences expected to reverse as GILTI in future years or to include the tax expense in the year it is incurred. We have not completed our analysis of the effects of the GILTI provisions and will further consider the accounting policy election within the measurement period as provided for under SAB 118 (Note 2).
As of
December 31, 2017
and
2016
, we have gross U.S. federal net operating loss carryforwards of
$89 million
and
$59 million
, respectively, and gross state and local net operating loss carryforwards of
$353 million
and
$293 million
, respectively. The increases for U.S federal and state and local net operating loss carryforwards is primarily due to acquisitions during 2017. The majority of the new additions are not expected to be realizable in future periods and have related valuation allowance. The remaining carryforwards are available to offset future taxable income until they begin to expire in 2019. In addition, as of
December 31, 2017
and
2016
, we have gross foreign net operating loss carryforwards of
$253 million
and
$116 million
, respectively. The majority of gross foreign net operating losses are not expected to be realizable in future periods and have related valuation allowances.
A reconciliation of the beginning and ending amount of unrecognized tax benefits is as follows for the years ended
December 31, 2017
,
2016
and
2015
(in millions):
|
Year Ended December 31,
|
|||||||||||
|
2017
|
2016
|
2015
|
|||||||||
|
Beginning balance of unrecognized tax benefits
|
$
|
112
|
|
$
|
107
|
|
$
|
145
|
|
||
|
Additions related to acquisitions
|
—
|
|
22
|
|
7
|
|
|||||
|
Additions based on tax positions taken in current year
|
10
|
|
9
|
|
9
|
|
|||||
|
Additions based on tax positions taken in prior years
|
9
|
|
—
|
|
34
|
|
|||||
|
Reductions based on tax positions taken in prior years
|
—
|
|
(1
|
)
|
(51
|
)
|
|||||
|
Reductions resulting from statute of limitation lapses
|
(8
|
)
|
(3
|
)
|
(12
|
)
|
|||||
|
Reductions related to settlements with taxing authorities
|
(8
|
)
|
(22
|
)
|
(25
|
)
|
|||||
|
Ending balance of unrecognized tax benefits
|
$
|
115
|
|
$
|
112
|
|
$
|
107
|
|
||
As of
December 31, 2017
and
2016
, the balance of unrecognized tax benefits which would, if recognized, affect our effective tax rate was
$77 million
and
$76 million
, respectively. It is reasonably possible, as a result of settlements of ongoing audits or statute of limitations expirations, unrecognized tax benefits could increase as much as
$10 million
and decrease as much as
$39 million
within the next twelve months. Of the
$115 million
in unrecognized tax benefits as of
December 31, 2017
,
$69 million
is recorded as other non-current liabilities and
$47 million
is recorded as other current liabilities in the accompanying consolidated balance sheet.
We recognize interest accrued on income tax uncertainties and accrued penalties as a component of income tax expense. For the years ended
December 31, 2017
,
2016
and
2015
, we recognized
$1 million
,
$1 million
and
$12 million
, respectively, of income tax benefit for interest and penalties. Accrued interest and penalties were
$35 million
as of both
December 31, 2017
and
2016
. Of the
$35 million
in accrued interest and penalties as of
December 31, 2017
,
$25 million
is recorded as other non-current liabilities and
$10 million
is recorded as other current liabilities in the accompanying consolidated balance sheet.
We or one of our subsidiaries files income tax returns in the U.S. federal jurisdiction and various state and foreign jurisdictions. The following table summarizes open tax years by major jurisdiction:
|
Jurisdiction
|
Open Tax Years
|
|
U.S. Federal
|
2014 - 2017
|
|
U.S. States
|
2007 - 2017
|
|
U.K.
|
2015 - 2017
|
|
Netherlands
|
2012 - 2017
|
Although the outcome of tax audits is always uncertain, we believe that adequate amounts of tax, including interest and penalties, have been provided for any adjustments expected to result from open tax years.
115
|
13.
|
Clearing Organizations
|
We operate regulated central counterparty clearing houses for the settlement and clearance of derivative contracts. The clearing houses include ICE Clear Europe, ICE Clear Credit, ICE Clear U.S., ICE Clear Canada, ICE Clear Netherlands, ICE Clear Singapore and NGX (referred to herein collectively as the “ICE Clearing Houses”).
|
•
|
ICE Clear Europe performs the clearing and settlement for all futures and options contracts traded through ICE Futures Europe and ICE Endex, for energy futures and options contracts trading through ICE Futures U.S., and for CDS contracts submitted for clearing in Europe.
|
|
•
|
ICE Clear Credit performs the clearing and settlement for CDS contracts submitted for clearing in North America.
|
|
•
|
ICE Clear U.S. performs the clearing and settlement of agricultural, metals, currencies and financial futures and options contracts traded through ICE Futures U.S.
|
|
•
|
ICE Clear Canada performs the clearing and settlement for all futures and options contracts traded through ICE Futures Canada.
|
|
•
|
ICE Clear Netherlands offers clearing for Dutch equity options.
|
|
•
|
ICE Clear Singapore performs the clearing and settlement for all futures and options contracts traded through ICE Futures Singapore.
|
|
•
|
NGX performs clearing and settlement for North American natural gas, electricity and oil markets and was acquired in December 2017 (Note 3).
|
Each of the ICE Clearing Houses requires all clearing members or participants to maintain cash on deposit or pledge certain assets, which may include government obligations, non-government obligations, letters of credit or gold to guarantee performance of the clearing members’ or participants’ open positions. Such amounts in total are known as “original margin.” The ICE Clearing Houses may make intraday original margin calls in circumstances where market conditions require additional protection. The daily profits and losses from and to the ICE Clearing Houses due to the marking-to-market of open contracts is known as “variation margin.” With the exception of NGX’s physical natural gas and physical power products, the ICE Clearing Houses mark all outstanding contracts to market, and therefore pay and collect variation margin, at least once daily, and in some cases multiple times throughout the day. For NGX’s physical natural gas and power products, NGX marks all outstanding contracts to market daily, but only collects variation margin when a participant’s open position falls outside a specified percentage of its pledged collateral. Marking-to-market allows the ICE Clearing Houses to identify any clearing members or participants that may be unable to satisfy the financial obligations resulting from changes in the prices of their open contracts before those financial obligations become exceptionally large and jeopardize the ability of the ICE Clearing Houses to ensure financial performance of clearing members’ or participants’ open positions.
With the exception of NGX, each of the ICE Clearing Houses requires that each clearing member make deposits into a fund known as a “guaranty fund,” which is maintained by the relevant ICE Clearing House. These amounts serve to secure the obligations of a clearing member to the ICE Clearing House to which it has made the guaranty fund deposit and may be used to cover losses sustained by the respective ICE Clearing House in the event of a default of a clearing member. NGX maintains a guaranty fund utilizing a
$100 million
letter of credit that has been entered into with a major Canadian chartered bank and backed by a default insurance policy underwritten by Export Development Corporation, or EDC, a Canadian government agency. In event of a participant default, where a participant’s collateral becomes depleted, any remaining shortfall would be covered by a draw down on the letter of credit following which NGX would pay the first
$15 million
in losses per its deductible and recover additional losses under the insurance policy up to
$100 million
. We have provided a parent guaranty of
$100 million
in favor of the major Canadian chartered bank and we voluntarily reserved
$100 million
of our Amended Credit Facility to backstop that parent guaranty (Note 11).
We have contributed cash of
$150 million
,
$50 million
and
$50 million
to the guaranty funds of ICE Clear Europe, ICE Clear Credit and ICE Clear US, respectively, as of
December 31, 2017
, and such amounts are at risk and could be used in the event of a clearing member default where the amount of the defaulting clearing member’s original margin and guaranty fund deposits are insufficient. We have also contributed
$4 million
in cash in total to the guaranty funds of ICE Clear Canada, ICE Clear Netherlands and ICE Clear Singapore. The
$254 million
combined contributions to the guaranty funds as of
December 31, 2017
and
2016
are included in long-term restricted cash and cash equivalents in the accompanying consolidated balance sheets (Note 5).
For ICE Clear Europe, if a futures and options clearing member’s deposits are depleted and a default occurs, then a
$100 million
contribution made by us to the ICE Clear Europe guaranty fund would be utilized after the available funds of the defaulting clearing member but before all other amounts within the guaranty fund. The
$100 million
is solely available in the event of an ICE Clear Europe futures and options clearing member default. We have contributed
$50 million
to the ICE Clear Europe CDS guaranty fund and it would be utilized after the available funds of the defaulting CDS clearing member but before all other amounts within the CDS guaranty fund. The
$50 million
contribution to the ICE Clear U.S. guaranty fund and the
$50 million
contribution to the ICE Clear Credit guaranty fund would be utilized after the available funds of the defaulting clearing member but before all other amounts within the guaranty fund.
116
Each of the ICE Clearing Houses has equal and offsetting claims to and from their respective clearing members or participants on opposite sides of each cleared contract. This arrangement allows the ICE Clearing Houses to serve as the central financial counterparty on every cleared contract. Each ICE Clearing House bears financial counterparty credit risk in the event that market movements create conditions that lead to its clearing members or participants failing to meet their financial obligations to that ICE Clearing House. Accordingly, the ICE Clearing Houses account for this central counterparty guarantee as a performance guarantee. Given that each contract is margined and marked-to-market or settled at least once daily for each clearing member, or in the case of NGX, collateralized for each participant, the ICE Clearing Houses’ maximum estimated exposure for this guarantee, excluding the effects of original and variation margin requirements and mandatory deposits to the applicable guaranty fund by clearing members and collateral from its participants, is
$78.3 billion
as of
December 31, 2017
, which represents the maximum estimated value by the ICE Clearing Houses of a hypothetical one day movement in pricing of the underlying unsettled contracts. This amount is based on calculations determined using proprietary risk management software that simulates gains and losses based on historical market prices, volatility and other factors present at that point in time for those particular unsettled contracts. Future actual market price volatility could result in the exposure being significantly different than the amount estimated by the ICE Clearing Houses. The net notional value of unsettled contracts was
$2.6 trillion
as of
December 31, 2017
. We performed calculations to determine the fair value of our counterparty performance guarantee taking into consideration factors such as daily settlement of contracts, margining and collateral requirements, other elements of our risk management program, historical evidence of default payments, and estimated probability of potential default payouts by the ICE Clearing Houses. Based on these analyses, the estimated counterparty performance guaranty liability was determined to be nominal and no liability was recorded as of
December 31, 2017
and
2016
.
The ICE Clearing Houses seek to reduce their exposure through a risk management program that includes initial and ongoing financial standards for clearing member and participant admission and continued membership, original and variation margin and collateral requirements, and mandatory deposits to the guaranty fund. The amounts that the clearing members and participants are required to maintain in the original margin, guaranty fund and collateral accounts are determined by standardized parameters established by the risk management departments and reviewed by the risk committees and the boards of directors of each of the ICE Clearing Houses and may fluctuate over time. As of
December 31, 2017
and
2016
, the ICE Clearing Houses have received or have been pledged
$92.6 billion
and
$95.7 billion
, respectively, in cash and non-cash collateral in original margin and guaranty fund deposits to cover price movements of underlying contracts for both periods. With the exception of NGX, the ICE Clearing Houses also have powers of assessment that provide the ability to collect additional funds from their clearing members to cover a defaulting member’s remaining obligations up to the limits established under the respective rules of each ICE Clearing House.
Should a particular clearing member or participant fail to deposit original margin, provide collateral, or fail to make a variation margin payment, when and as required, the relevant ICE Clearing House may liquidate or hedge the clearing member’s or participant’s open positions and use their original margin and guaranty fund deposits to make up any amount owed. In the event that those deposits are not sufficient to pay the amount owed in full, the ICE Clearing Houses may utilize the respective guaranty fund deposits of their respective clearing members on a pro-rata basis for that purpose.
NGX administers the physical delivery of energy trading contracts. It has an equal and offsetting claim to and from their respective participants on opposite sides of the physically settled contract. The balance related to delivered but unpaid contracts is reflected as a delivery contract net receivable with an offsetting delivery contract net payable in the accompanying consolidated balance sheet as of
December 31, 2017
. NGX also records unsettled variation margin equal to the fair value of open energy trading contracts as of the balance sheet date. Fair value is determined based on the difference between the trade price when the contract was entered into and the settlement price and is considered a Level 2 fair value measurement. There is no impact to the consolidated statements of income for either delivery contracts receivable/payable and unsettled variation margin, as an equivalent amount is recognized in both the assets and liabilities.
In connection with the NGX physical delivery of the energy trading contracts, we maintain a daylight liquidity facility with a major Canadian chartered bank in the amount of
C$300 million
. This facility may be used on settlement day to effect payments through the settlement accounts and it is intended to cover any intra-day shortfalls due to timing of payments and receipts. In the event that amounts drawn on settlement day do not clear to zero by the end of the day, we must repay the deficiency on the following business day. In addition, a
C$20 million
overdraft facility is in place with the same major Canadian chartered bank and is available to repay the daylight liquidity facility on the business day following a settlement day.
As of
December 31, 2017
, our cash margin deposits, unsettled variation margin, guaranty fund and delivery contracts receivable/payable are as follows for the ICE Clearing Houses (in millions):
117
|
ICE Clear
Europe |
ICE Clear
Credit |
ICE Clear U.S.
|
NGX
|
Other ICE Clearing Houses
|
Total
|
||||||||||||||||||
|
Original margin
|
$
|
19,792
|
|
$
|
20,703
|
|
$
|
3,898
|
|
$
|
—
|
|
$
|
126
|
|
$
|
44,519
|
|
|||||
|
Unsettled variation margin, net
|
—
|
|
—
|
|
—
|
|
227
|
|
1
|
|
228
|
|
|||||||||||
|
Guaranty fund
|
3,037
|
|
2,607
|
|
299
|
|
—
|
|
23
|
|
5,966
|
|
|||||||||||
|
Delivery contracts receivable/payable, net
|
—
|
|
—
|
|
—
|
|
509
|
|
—
|
|
509
|
|
|||||||||||
|
Total
|
$
|
22,829
|
|
$
|
23,310
|
|
$
|
4,197
|
|
$
|
736
|
|
$
|
150
|
|
$
|
51,222
|
|
|||||
As of
December 31, 2016
, our cash margin deposits and guaranty fund are as follows for the ICE Clearing Houses (in millions):
|
ICE Clear
Europe |
ICE Clear
Credit |
ICE Clear U.S.
|
Other ICE Clearing Houses
|
Total
|
|||||||||||||||
|
Original margin
|
$
|
27,046
|
|
$
|
16,833
|
|
$
|
6,184
|
|
$
|
107
|
|
$
|
50,170
|
|
||||
|
Guaranty fund
|
2,444
|
|
2,135
|
|
316
|
|
85
|
|
4,980
|
|
|||||||||
|
Total
|
$
|
29,490
|
|
$
|
18,968
|
|
$
|
6,500
|
|
$
|
192
|
|
$
|
55,150
|
|
||||
We have recorded these cash deposits and amounts due in the accompanying consolidated balance sheets as current assets with corresponding current liabilities to the clearing members of the relevant ICE Clearing House. All cash, securities and amounts due are available only to meet the financial obligations of that clearing member to the relevant ICE Clearing House. ICE Clear Europe, ICE Clear Credit, ICE Clear US, ICE Clear Canada, ICE Clear Netherlands, ICE Clear Singapore and NGX are separate legal entities and are not subject to the liabilities of the other ICE Clearing Houses or the obligations of the members of the other ICE Clearing Houses. The amount of these cash deposits and amounts due may fluctuate due to the types of margin collateral choices available to clearing members and the change in the amount of deposits required. As a result, these assets and corresponding liabilities may vary significantly over time.
Of the cash held by the ICE Clearing Houses, as of
December 31, 2017
,
$24.7 billion
is secured in reverse repurchase agreements with primarily overnight maturities or direct investment in government securities. ICE Clear Credit, as a systemically important financial market utility as designated by the Financial Stability Oversight Council, held
$18.5 billion
of its U.S. dollar cash in the guaranty fund and in original margin in cash accounts at the Federal Reserve Bank of Chicago as of
December 31, 2017
. During the quarter ended September 30, 2017, ICE Clear Europe established a Euro-denominated account at the De Nederlandsche Bank, or DNB, the central bank of the Netherlands. This account provides the flexibility for ICE Clear Europe to place Euro-denominated cash margin securely at a national bank, in particular during periods when liquidity in the Euro repo markets may temporarily become contracted, such as over a quarter or year end. As of
December 31, 2017
, ICE Clear Europe held
€3.3 billion
(
$4.0 billion
based on the euro/U.S. dollar exchange rate of
1.2003
as of December 31, 2017) at DNB. The remaining cash deposits at the ICE Clearing Houses are held in demand deposit accounts at large, highly rated financial institutions and direct investments primarily in U.S. Treasury securities with original maturities of less than three months, plus certain U.S. Treasury Securities that extend beyond 12-months which we consider to be Level 1 securities. The carrying value of these securities approximates their fair value due to the short-term nature of the instruments and repurchase agreements.
Of the
$22.8 billion
of ICE Clear Europe cash deposits as of
December 31, 2017
, which are primarily held in U.S. dollars, euros and pounds sterling,
$18.5 billion
relates to futures and options products and
$4.3 billion
relates to cleared OTC European CDS instruments. ICE Clear Europe offers a separate clearing platform, risk model and risk pool for futures and options products that is distinct from those associated with cleared OTC European CDS instruments.
In addition to the cash deposits for original margin and the guaranty fund, the ICE Clearing Houses have also received other assets from clearing members, which include government obligations, and may include other non-cash collateral such as certain agency and corporate debt, letters of credit or gold to mitigate credit risk. These assets are not reflected in the accompanying consolidated balance sheets as the risks and rewards of these assets remain with the clearing members unless the ICE Clearing Houses have sold or re-pledged the assets or in the event of a clearing member default, where the clearing member is no longer entitled to redeem the assets. Any income, gain or loss accrues to the clearing member. For certain non-cash deposits, the ICE Clearing Houses may impose discount or “haircut” rates to ensure adequate collateral levels to account for fluctuations in the market value of these deposits.
NGX requires participants to maintain cash or letters of credit to serve as collateral in the event of a participant default. The cash is maintained in a segregated bank account which is subject to a collateral agreement between the bank, the participant and NGX. Per the agreement, NGX serves in the capacity of a trustee. The cash is held by NGX in trust for and on behalf of the participant; however, the cash remains the property of the participant and may only be accessed by NGX if there is evidence of default. The rules governing when the cash can be accessed by NGX are listed in the Contracting Party Agreement, a standardized agreement signed by each
118
participant that also allows for netting of positive and negative exposure. Since the cash is held in trust and remains the property of the participant, it is not included in the accompanying consolidated balance sheet.
As of
December 31, 2017
and
2016
, the assets pledged by the clearing members as original margin, which includes cash deposits held in trust at NGX, and guaranty fund deposits for each of the ICE Clearing Houses are detailed below (in millions):
|
As of December 31, 2017
|
As of December 31, 2016
|
||||||||||||||||||||||||||||||||||
|
ICE Clear
Europe |
ICE Clear
Credit |
ICE Clear U.S.
|
NGX
|
Other ICE Clearing Houses
|
ICE Clear
Europe |
ICE Clear
Credit |
ICE Clear U.S.
|
Other ICE Clearing Houses
|
|||||||||||||||||||||||||||
|
Original margin:
|
|||||||||||||||||||||||||||||||||||
|
Government securities at face value
|
$
|
23,496
|
|
$
|
5,699
|
|
$
|
9,581
|
|
$
|
—
|
|
$
|
18
|
|
$
|
22,961
|
|
$
|
6,013
|
|
$
|
10,542
|
|
$
|
37
|
|
||||||||
|
Letters of credit
|
—
|
|
—
|
|
—
|
|
1,663
|
|
—
|
|
—
|
|
—
|
|
—
|
|
—
|
|
|||||||||||||||||
|
NGX cash deposits
|
—
|
|
—
|
|
—
|
|
233
|
|
—
|
|
—
|
|
—
|
|
—
|
|
—
|
|
|||||||||||||||||
|
Other
|
—
|
|
—
|
|
—
|
|
—
|
|
—
|
|
—
|
|
—
|
|
—
|
|
368
|
|
|||||||||||||||||
|
Total
|
$
|
23,496
|
|
$
|
5,699
|
|
$
|
9,581
|
|
$
|
1,896
|
|
$
|
18
|
|
$
|
22,961
|
|
$
|
6,013
|
|
$
|
10,542
|
|
$
|
405
|
|
||||||||
|
Guaranty fund:
|
|||||||||||||||||||||||||||||||||||
|
Government securities at face value
|
$
|
323
|
|
$
|
176
|
|
$
|
169
|
|
$
|
—
|
|
$
|
2
|
|
$
|
217
|
|
$
|
178
|
|
$
|
147
|
|
$
|
40
|
|
||||||||
|
14.
|
Commitments and Contingencies
|
Leases
We lease office space, equipment facilities and certain computer equipment under lease agreements that expire at various dates through 2028. Our leases typically contain terms which may include renewal options, rent escalations, rent holidays and leasehold improvement incentives. We had no capital leases as of
December 31, 2017
and
2016
. Rental expense under these leases, included in the accompanying consolidated statements of income in rent and occupancy and technology and communication expenses, totaled
$65 million
,
$65 million
and
$53 million
for the years ended
December 31, 2017
,
2016
, and
2015
, respectively. As of
December 31, 2017
, future minimum lease payments under these non-cancelable operating agreements are as follows (in millions):
|
2018
|
$
|
78
|
|
|
2019
|
75
|
|
|
|
2020
|
72
|
|
|
|
2021
|
71
|
|
|
|
2022
|
63
|
|
|
|
Thereafter
|
162
|
|
|
|
Total
|
$
|
521
|
|
Redeemable Non-controlling Interest
As part of the ICE Endex purchase agreement, Gasunie had a put option to sell to us, and we had a call option to purchase from Gasunie, Gasunie’s entire
21%
remaining ownership in ICE Endex at fair market value. As part of the ICE Clear Netherlands acquisition, ABN AMRO Clearing Bank N.V. had a put option to sell to us, and we had a call option to purchase from ABN AMRO, ABN AMRO’s entire remaining
25%
ownership in ICE Clear Netherlands at fair market value. Since the likelihood of us acquiring both of the non-controlling interests in the future was probable, we recorded the full redemption fair value of
$36 million
as of
December 31, 2016
relating to ICE Endex and ICE Clear Netherlands as mezzanine equity and classified the related balance as “redeemable non-controlling interest” in our accompanying consolidated balance sheet and the proportionate share of profits was recorded as net income attributable to non-controlling interest in our consolidated statements of income. Changes in the redemption value of the non-controlling interest are recorded to the redeemable non-controlling interest balance in full as they occur. During June 2017, we purchased both Gasunie’s
21%
minority ownership interest in ICE Endex and ABN AMRO Clearing Bank N.V.’s
25%
minority ownership interest in ICE Clear Netherlands. Subsequent to these acquisitions, we own
100%
of ICE Endex and ICE Clear Netherlands and will no longer include any non-controlling interest amounts for ICE Endex and ICE Clear Netherlands in our consolidated financial statements.
Prior to the our acquisition of NYSE, NYSE completed the sale of a significant equity interest in NYSE American Options, one of our
two
U.S. options exchanges, to
seven
external investors. Under the terms of the sale, the external investors had the option to require us to repurchase a portion of the equity interest on an annual basis. In June 2015 we repurchased the remaining
16%
of the interest for
$128 million
in cash. Effective from July 1, 2015, all of the profits from NYSE American Options are retained by us as we now own
100%
of NYSE American Options.
119
Legal Proceedings
We are subject to legal proceedings, claims and investigations that arise in the ordinary course of our business. We establish accruals for those matters in circumstances when a loss contingency is considered probable and the related amount is reasonably estimable. Any such accruals may be adjusted as circumstances change. Assessments of losses are inherently subjective and involve unpredictable factors. We do not believe that the resolution of these legal matters, including the matters described below, will have a material adverse effect on our consolidated financial condition, results of operations, or liquidity. It is possible, however, that future results of operations for any particular quarterly or annual period could be materially and adversely affected by any developments relating to the legal proceedings, claims and investigations. The matters described below all relate to our operation of NYSE. A range of possible losses related to the cases below cannot be reasonably estimated at this time, except as otherwise disclosed below.
In April 2014, New York Stock Exchange LLC and NYSE Arca, Inc., two of our subsidiaries, were among more than
40
financial institutions and exchanges named as defendants in
four
purported class action lawsuits filed in the U.S. District Court for the Southern District of New York, or the Southern District, by the City of Providence, Rhode Island, and other plaintiffs. In subsequent consolidated amended complaints, the plaintiffs asserted claims against the exchange defendants and Barclays PLC, or Barclays, a subsidiary of which operates an alternative trading system known as Barclays LX, on behalf of a class of “all public investors” who bought or sold stock from April 18, 2009 to the present on the U.S.-based equity exchanges operated by the exchange defendants or on Barclays LX.
In August 2015, the court issued an opinion and order granting the defendants’ motions to dismiss and dismissing the second amended complaint in its entirety with prejudice. The court held that the plaintiffs had failed to sufficiently state a claim against the defendants under Sections 10(b) and 6(b) of the Exchange Act, and additionally that some of the claims against the exchanges were barred by the doctrine of self-regulatory organization immunity. In September 2015, the plaintiffs filed a notice of appeal of the dismissal of the lawsuit to the U.S. Court of Appeals for the Second Circuit, or the Second Circuit. The appeal was briefed and argued during 2016.
On December 19, 2017, the Second Circuit issued a decision vacating the dismissal and remanding the case to the district court for further proceedings. The Second Circuit held that the claims against the exchanges were not barred by the doctrine of self-regulatory organization immunity because (according to the Second Circuit) the exchanges were not carrying out regulatory functions while operating their markets and engaging in the challenged conduct at issue, and that the plaintiffs had adequately pleaded claims against the defendants under Section 10(b) of the Exchange Act. The Second Circuit directed that, on remand, the district court should address and rule upon various other defenses raised by the exchanges in their motion to dismiss (which the district court did not address in its prior opinion and order). The exchanges disagree with various aspects of the Second Circuit’s decision, and on January 31, 2018, filed a petition for rehearing and/or rehearing
en banc
.
In May 2014,
three
purported class action lawsuits were filed (and later amended) in the Southern District by Harold Lanier against the securities exchanges that are participants in each of the three national market system data distribution plans - the Consolidated Tape Association/Consolidated Quotation Plan, the Nasdaq UTP Plan, and the Options Price Reporting Authority, or the Plans, - which are established under the Exchange Act and regulated by the SEC. New York Stock Exchange LLC, NYSE Arca, Inc. and NYSE American (NYSE American was formerly known as NYSE MKT), which are our subsidiaries, were among the defendants named in one or more of the suits, in which Lanier claimed to sue on behalf of himself and all other similarly situated subscribers to the market data disseminated by the Plans. Lanier’s allegations included that the exchange participants in the Plans breached agreements with subscribers by disseminating market data in a discriminatory manner in that other “preferred” customers allegedly received their data faster than the proposed class. In September 2014, the defendants moved to dismiss the amended complaints, and in April 2015, the court issued an opinion and order granting the motion and dismissing the
three
lawsuits with prejudice. In September 2016, the Second Circuit entered an order affirming the dismissal of the lawsuits. In November 2016, the Second Circuit denied a petition filed by Lanier, relating only to the lawsuit involving the Options Price Reporting Authority plan, seeking a rehearing by the panel of judges that decided the appeal or, in the alternative, for review by the full Second Circuit. Lanier has not sought review of these matters by the U.S. Supreme Court and we consider this matter closed.
In December 2015, our subsidiaries New York Stock Exchange LLC and NYSE American received an inquiry from the Enforcement staff of the New York regional office, or the Staff, of the SEC regarding a July 8, 2015 outage on the NYSE markets, during which trading was suspended for approximately 3.5 hours in all symbols. The Staff’s investigation proceeded throughout 2016. On December 29, 2016, NYSE received a Wells Notice stating that the Staff have made a preliminary determination to recommend that the SEC file an enforcement action in connection with how NYSE responded on July 8, 2015 to the circumstances leading into the suspension of trading that day. NYSE disputes the appropriateness of the proposed charges, believes there are substantial defenses, and has made a written submission to the Staff in response to the Wells Notice setting forth such points. If the Staff determines to maintain its recommendation contained in the Wells Notice, the Commissioners of the SEC will need to determine whether to authorize the filing of an enforcement action. For this matter and other SEC investigative matters, we have recorded an aggregate of
$14 million
in expense accruals during the year ended December 31, 2017.
120
Tax Audits
We are engaged in ongoing discussions and audits with taxing authorities on various tax matters, the resolutions of which are uncertain. Currently, there are matters that may lead to assessments involving us or one of our subsidiaries, some of which may not be resolved for several years. Based on currently available information, we believe we have adequately provided for any assessments that could result from those proceedings where it is more likely than not that we will be assessed. We continuously review our positions as these matters progress.
|
15.
|
Pension and Other Benefit Programs
|
Defined Benefit Pension Plan
We have a pension plan covering certain of our U.S. operations. The benefit accrual for the pension plan is frozen. Retirement benefits are derived from a formula, which is based on length of service and compensation. Based on this calculation, we may contribute to our pension plan to the extent such contributions may be deducted for income tax purposes.
During the year ended
December 31, 2017
, in connection with our de-risking strategy, we contributed
$136 million
to our pension plan. At the same time, we changed the plan’s target allocation from
65%
equity securities and
35%
fixed income securities, to
5%
equity securities and
95%
fixed income securities. The fixed income allocation includes corporate bonds of companies from diversified industries and U.S. government bonds. As a result of this contribution and change in investment policy, we anticipate that there will be less need for pension contributions in future years, and the pension plan will not be required to pay the Pension Benefit Guaranty Corporation variable rate premiums. Income is expected to be lower than it was in prior periods because the expected return on plan assets is lower.
During the years ended
December 31, 2016
and
2015
, we contributed
$10 million
each year to our pension plan. During the year ended December 31, 2018, we do not expect to make contributions to the pension plan. We will continue to monitor the plan’s funded status, and we will consider modifying the plan’s investment policy based on the actuarial and funding characteristics of the retirement plan, the demographic profile of plan participants, and our business objectives. Our long-term objective is to keep the plan at or near full funding, while minimizing the risk inherent in pension plans.
Based on the valuation techniques described in Note 16, the fair values of our pension plan assets as of
December 31, 2017
, by asset category, are as follows (in millions):
|
Fair Value Measurements
|
|||||||||||||||
|
Asset Category
|
Quoted Prices
in Active
Markets for
Identical Assets
(Level 1)
|
Significant
Observable
Inputs
(Level 2)
|
Significant
Unobservable
Inputs
(Level 3)
|
Total
|
|||||||||||
|
Cash
|
$
|
164
|
|
$
|
—
|
|
$
|
—
|
|
$
|
164
|
|
|||
|
Equity securities:
|
|||||||||||||||
|
U.S. large-cap
|
—
|
|
30
|
|
—
|
|
30
|
|
|||||||
|
U.S. small-cap
|
—
|
|
8
|
|
—
|
|
8
|
|
|||||||
|
International
|
—
|
|
15
|
|
—
|
|
15
|
|
|||||||
|
Fixed income securities
|
335
|
|
314
|
|
3
|
|
652
|
|
|||||||
|
Total
|
$
|
499
|
|
$
|
367
|
|
$
|
3
|
|
$
|
869
|
|
|||
The fair values of our pension plan assets as of
December 31, 2016
, by asset category, are as follows (in millions):
|
Fair Value Measurements
|
|||||||||||||||
|
Asset Category
|
Quoted Prices
in Active
Markets for
Identical Assets
(Level 1)
|
Significant
Observable
Inputs
(Level 2)
|
Significant
Unobservable
Inputs
(Level 3)
|
Total
|
|||||||||||
|
Cash
|
$
|
21
|
|
$
|
—
|
|
$
|
—
|
|
$
|
21
|
|
|||
|
Equity securities:
|
|
|
|
|
|||||||||||
|
U.S. large-cap
|
—
|
|
247
|
|
—
|
|
247
|
|
|||||||
|
U.S. small-cap
|
—
|
|
68
|
|
—
|
|
68
|
|
|||||||
|
International
|
—
|
|
134
|
|
—
|
|
134
|
|
|||||||
|
Fixed income securities
|
106
|
|
102
|
|
3
|
|
211
|
|
|||||||
|
Total
|
$
|
127
|
|
$
|
551
|
|
$
|
3
|
|
$
|
681
|
|
|||
121
The measurement dates for the pension plan are
December 31, 2017
and
2016
. The following table provides a summary of the changes in the pension plan’s benefit obligations and the fair value of assets as of
December 31, 2017
and
2016
and a statement of funded status of the pension plan as of
December 31, 2017
and
2016
(in millions):
|
As of December 31,
|
|||||||
|
2017
|
2016
|
||||||
|
Change in benefit obligation:
|
|
||||||
|
Benefit obligation at beginning of year
|
$
|
853
|
|
$
|
861
|
|
|
|
Interest cost
|
27
|
|
27
|
|
|||
|
Actuarial loss
|
44
|
|
14
|
|
|||
|
Benefits paid
|
(49
|
)
|
(49
|
)
|
|||
|
Benefit obligation at year end
|
$
|
875
|
|
$
|
853
|
|
|
|
Change in plan assets:
|
|
||||||
|
Fair value of plan assets at beginning of year
|
$
|
681
|
|
$
|
666
|
|
|
|
Actual return on plan assets
|
101
|
|
54
|
|
|||
|
Contributions
|
136
|
|
10
|
|
|||
|
Benefits paid
|
(49
|
)
|
(49
|
)
|
|||
|
Fair value of plan assets at end of year
|
$
|
869
|
|
$
|
681
|
|
|
|
Funded status
|
$
|
(6
|
)
|
$
|
(172
|
)
|
|
|
Accumulated benefit obligation
|
$
|
875
|
|
$
|
853
|
|
|
|
Amounts recognized in the accompanying consolidated balance sheets:
|
|
||||||
|
Accrued employee benefits
|
$
|
(6
|
)
|
$
|
(172
|
)
|
|
The components of the pension plan expense (benefit) in the accompanying consolidated statements of income are set forth below for the years ended
December 31, 2017
,
2016
and
2015
(in millions):
|
Year Ended December 31,
|
|||||||||||
|
2017
|
2016
|
2015
|
|||||||||
|
Interest cost
|
$
|
27
|
|
$
|
27
|
|
$
|
34
|
|
||
|
Estimated return on plan assets
|
(44
|
)
|
(44
|
)
|
(46
|
)
|
|||||
|
Amortization of loss
|
2
|
|
1
|
|
2
|
|
|||||
|
Aggregate pension benefit
|
$
|
(15
|
)
|
$
|
(16
|
)
|
$
|
(10
|
)
|
||
We use a market-related value of plan assets when determining the estimated return on plan assets. Gains/losses on plan assets are amortized over a
four
year period and accumulate in other comprehensive income. We recognize deferred gains and losses in future net income based on a “corridor” approach, where the corridor is equal to
10%
of the greater of the benefit obligation or the market-related value of plan assets at the beginning of the year.
The following table shows the projected payments for the pension plan based on actuarial assumptions (in millions):
|
2018
|
$
|
50
|
|
|
2019
|
50
|
|
|
|
2020
|
49
|
|
|
|
2021
|
49
|
|
|
|
2022
|
49
|
|
|
|
Next 5 years
|
247
|
|
|
Supplemental Executive Retirement Plan
We have a U.S. nonqualified supplemental executive retirement plan, or SERP, which provides supplemental retirement benefits for certain employees. The future benefit accrual of the SERP plan is frozen. To provide for the future payments of these benefits, we have purchased insurance on the lives of certain of the participants through company-owned policies. As of
December 31, 2017
and
2016
, the cash surrender value of such policies was
$55 million
and
$53 million
, respectively, and is included in other non-current assets in the accompanying consolidated balance sheets. We also acquired a SERP through the NGX acquisition. The following table provides a summary of the changes in the SERP benefit obligations (in millions):
122
|
As of December 31,
|
|||||||
|
2017
|
2016
|
||||||
|
Change in benefit obligation:
|
|||||||
|
Benefit obligation at beginning of year
|
$
|
54
|
|
$
|
61
|
|
|
|
Interest cost
|
1
|
|
1
|
|
|||
|
Actuarial loss
|
2
|
|
1
|
|
|||
|
Benefits paid
|
(8
|
)
|
(9
|
)
|
|||
|
Benefit obligation at year end
|
$
|
49
|
|
$
|
54
|
|
|
|
Funded status
|
$
|
(49
|
)
|
$
|
(54
|
)
|
|
|
Amounts recognized in the accompanying consolidated balance sheets:
|
|
|
|
|
|||
|
Other current liabilities
|
$
|
(7
|
)
|
$
|
(8
|
)
|
|
|
Accrued employee benefits
|
(42
|
)
|
(46
|
)
|
|||
SERP plan expense in the accompanying consolidated statements of income was
$1 million
,
$1 million
and
$2 million
for the years ended
December 31, 2017
,
2016
and
2015
, respectively, and primarily consisted of interest cost. The following table shows the projected payments for the SERP plan based on the actuarial assumptions (in millions):
|
Projected SERP Plan Payments
|
|||
|
2018
|
$
|
7
|
|
|
2019
|
5
|
|
|
|
2020
|
5
|
|
|
|
2021
|
5
|
|
|
|
2022
|
5
|
|
|
|
Next 5 years
|
15
|
|
|
Pension and SERP Plans Assumptions
The weighted-average assumptions used to develop the actuarial present value of the projected benefit obligation and net periodic pension/SERP costs for years ended
December 31, 2017
,
2016
and
2015
are set forth below:
|
Year Ended December 31,
|
|||||
|
2017
|
2016
|
2015
|
|||
|
Weighted-average discount rate for determining benefit obligations (pension/SERP plans)
|
3.4%/3.1%
|
3.9%/3.4%
|
4.0%/3.4%
|
||
|
Weighted-average discount rate for determining interest costs (pension/SERP plans)
|
3.2%/2.6%
|
3.3%/2.5%
|
3.8%/3.2%
|
||
|
Expected long-term rate of return on plan assets (pension/SERP plans)
|
6.5%/N/A
|
6.5%/N/A
|
6.5%/N/A
|
||
|
Rate of compensation increase
|
N/A
|
N/A
|
N/A
|
||
The assumed discount rate reflects the market rates for high-quality corporate bonds currently available. The discount rate was determined by considering the average of pension yield curves constructed on a large population of high quality corporate bonds. The resulting discount rates reflect the matching of plan liability cash flows to yield curves. To develop the expected long-term rate of return on assets assumption, we considered the historical returns and the future expectations for returns for each asset class as well as the target asset allocation of the pension portfolio.
The determination of the interest cost component utilizes a full yield curve approach by applying the specific spot rates along the yield curve used in the determination of the benefit obligation to each year’s discounted cash flow.
Post-retirement Benefit Plans
Our defined benefit plans provide certain health care and life insurance benefits for certain eligible retired NYSE U.S. employees. These post-retirement benefit plans, which may be modified in accordance with their terms, are fully frozen. The net periodic post-retirement benefit costs were
$5 million
,
$7 million
and
$8 million
for the years ended
December 31, 2017
,
2016
and
2015
, respectively. The defined benefit plans are unfunded and we currently do not expect to fund the post-retirement benefit plans. The weighted-average discount rate for determining the benefit obligation as of
December 31, 2017
and
2016
is
3.4%
and
3.9%
, respectively. The weighted-average discount rate for determining the interest cost as of
December 31, 2017
and
2016
is
3.2%
and
3.3%
, respectively. The following table shows the actuarial determined benefit obligation, interest costs, employee contributions, actuarial (gain) loss, benefits paid during the periods and the accrued employee benefits (in millions):
123
|
As of December 31,
|
|||||||
|
2017
|
2016
|
||||||
|
Benefit obligation at the end of year
|
$
|
179
|
|
$
|
200
|
|
|
|
Interest cost
|
5
|
|
7
|
|
|||
|
Actuarial gain
|
(16
|
)
|
(20
|
)
|
|||
|
Employee contributions
|
3
|
|
3
|
|
|||
|
Benefits paid
|
(14
|
)
|
(14
|
)
|
|||
|
Amounts recognized in the accompanying consolidated balance sheets:
|
|||||||
|
Other current liabilities
|
$
|
(11
|
)
|
$
|
(11
|
)
|
|
|
Accrued employee benefits
|
(168
|
)
|
(189
|
)
|
|||
The following table shows the payments projected for our post-retirement benefit plans (net of expected Medicare subsidy receipts of
$10 million
in aggregate over the next ten fiscal years) based on actuarial assumptions (in millions):
|
2018
|
$
|
11
|
|
|
2019
|
11
|
|
|
|
2020
|
11
|
|
|
|
2021
|
11
|
|
|
|
2022
|
11
|
|
|
|
Next 5 years
|
54
|
|
|
For measurement purposes, we assumed a
7.7%
annual rate of increase in the per capita cost of covered health care benefits in
2017
which will decrease on a graduated basis to
4.5%
in the year 2038 and thereafter. The following table shows the effect of a
one
-percentage-point increase and decrease in assumed health care cost trend rates (in millions):
|
Assumed Health Care Cost Trend Rate
|
1% Increase
|
1% Decrease
|
|||||
|
Effect of post-retirement benefit obligation
|
$
|
20
|
|
$
|
(17
|
)
|
|
|
Effect on total of service and interest cost components
|
1
|
|
(1
|
)
|
|||
Accumulated Other Comprehensive Loss
The accumulated other comprehensive loss, after tax, as of
December 31, 2017
, consisted of the following amounts that have not yet been recognized in net periodic benefit cost (in millions):
|
Pension Plans
|
SERP Plans
|
Post-retirement
Benefit Plans
|
Total
|
||||||||||||
|
Unrecognized net actuarial losses (gains), after tax
|
$
|
93
|
|
$
|
4
|
|
$
|
(8
|
)
|
$
|
89
|
|
|||
The amount of prior actuarial loss included in accumulated other comprehensive income related to the pension, SERP and postretirement plans as of
December 31, 2017
, which are expected to be recognized in net periodic benefit cost in the coming year, is estimated to be (in millions):
|
Pension Plans
|
SERP Plans
|
Post-retirement
Benefit Plans
|
Total
|
||||||||||||
|
Loss recognition
|
$
|
4
|
|
$
|
—
|
|
$
|
—
|
|
$
|
4
|
|
|||
Other Benefit Plans and Defined Contribution Plans
Our U.S. employees are eligible to participate in 401(k) and profit sharing plans and our non-U.S. employees are eligible to participate in defined contribution pension plans. Total contributions under the 401(k), profit sharing and defined contribution pension plans were
$38 million
,
$31 million
and
$21 million
for the years ended
December 31, 2017
,
2016
and
2015
, respectively. No discretionary or profit sharing contributions were made during the years ended
December 31, 2017
,
2016
or
2015
.
|
16.
|
Fair Value Measurements
|
124
Our financial instruments consist primarily of cash and cash equivalents, short-term and long-term restricted cash and cash equivalents, short-term and long-term investments, customer accounts receivable, margin deposits and guaranty funds, cost and equity method investments, short-term and long-term debt and certain other short-term assets and liabilities. The fair value of our financial instruments are measured based on a three-level hierarchy:
|
•
|
Level 1 inputs — quoted prices for identical assets or liabilities in active markets.
|
|
•
|
Level 2 inputs — observable inputs other than Level 1 inputs such as quoted prices for similar assets and liabilities in active markets or inputs other than quoted prices that are directly observable.
|
|
•
|
Level 3 inputs — unobservable inputs supported by little or no market activity and that are significant to the fair value of the assets or liabilities.
|
We use Level 1 inputs to determine fair value. The Level 1 assets consist of U.S. Treasury and other foreign government securities, equity and other securities listed in active markets, and investments in publicly traded mutual funds held for the purpose of providing future payments of the SERP and SESP plans.
Financial assets and liabilities recorded in the accompanying consolidated balance sheets as of
December 31, 2017
and
2016
are classified in their entirety based on the lowest level of input that is significant to the asset or liability’s fair value measurement. Financial instruments measured at fair value on a recurring basis as of
December 31, 2017
are as follows (in millions):
|
Level 1
|
Level 2
|
Level 3
|
Total
|
||||||||||||
|
Assets at fair value:
|
|||||||||||||||
|
U.S. Treasury and Other Foreign Government Securities
|
$
|
734
|
|
$
|
—
|
|
$
|
—
|
|
$
|
734
|
|
|||
|
Mutual Funds
|
16
|
|
—
|
|
—
|
|
16
|
|
|||||||
|
Total assets at fair value
|
$
|
750
|
|
$
|
—
|
|
$
|
—
|
|
$
|
750
|
|
|||
Financial instruments measured at fair value on a recurring basis as of
December 31, 2016
are as follows (in millions):
|
Level 1
|
Level 2
|
Level 3
|
Total
|
||||||||||||
|
Assets at fair value:
|
|||||||||||||||
|
Long-term Investment in Equity Securities
|
$
|
432
|
|
$
|
—
|
|
$
|
—
|
|
$
|
432
|
|
|||
|
U.S. Treasury and Other Foreign Government Securities
|
500
|
|
—
|
|
—
|
|
500
|
|
|||||||
|
Mutual Funds
|
23
|
|
—
|
|
—
|
|
23
|
|
|||||||
|
Total assets at fair value
|
$
|
955
|
|
$
|
—
|
|
$
|
—
|
|
$
|
955
|
|
|||
As of
December 31, 2017
, we held
$734 million
in U.S. Treasury and other foreign government securities which are considered cash equivalents. Of these securities,
$534 million
were recorded as short-term restricted cash and cash equivalents and
$200 million
were recorded as long-term restricted cash and cash equivalents in the accompanying consolidated balance sheet as of
December 31, 2017
. As of
December 31, 2016
, we held
$500 million
in U.S. Treasury and other foreign government securities. Of these securities, $
350 million
were recorded as short-term restricted cash and cash equivalents and $
150 million
were recorded as long-term restricted cash and cash equivalents in the accompanying consolidated balance sheet as of
December 31, 2016
. We account for the U.S. Treasury securities held using the available-for-sale method.
The long-term investment in equity securities as of
December 31, 2016
represents our investment in Cetip, recorded at its fair value using its quoted market price. Cetip was sold in March 2017 (Note 6). Mutual funds represent equity and fixed income mutual funds held for the purpose of providing future payments for the SERP and SESP and are classified as available-for-sale securities (Note 15).
We did not use Level 3 inputs to determine the fair value of assets or liabilities measured at fair value on a recurring basis as of
December 31, 2017
and
2016
. We measure certain assets, such as intangible assets and cost and equity method investments, at fair value on a non-recurring basis. These assets are recognized at fair value if they are deemed to be impaired. As of
December 31, 2017
and
2016
, none of these assets were required to be recorded at fair value since no impairments were recorded. See Note 13 for the fair value considerations related to our margin deposits, guaranty funds and delivery contracts receivable.
As of
December 31, 2017
, the fair value of our
$495 million
2027 Senior Notes was
$500 million
, the fair value of our
$1.24 billion
2025 Senior Notes was
$1.32 billion
, the fair value of our
$791 million
2023 Senior notes was
$842 million
, the fair value of our
$495 million
2022 Senior Notes was
$495 million
, the fair value of our
$1.24 billion
2020 Senior Notes was
$1.26 billion
, and the fair value of our
$600 million
2018 Senior Notes was
$601 million
. The fair values of these fixed rate notes were estimated using quoted market prices for these instruments. The fair value of our commercial paper approximates the carrying value since the rates of
125
interest on this short-term debt approximate market rates as of
December 31, 2017
. Excluding our cost and equity method investments, all other financial instruments are determined to approximate carrying value due to the short period of time to their maturities.
|
17.
|
Segment Reporting
|
We operate
two
business segments: our Trading and Clearing segment and our Data and Listings segment. This presentation is reflective of how our chief operating decision maker reviews and operates our business. Our Trading and Clearing segment comprises our transaction-based execution and clearing businesses. Our Data and Listings segment comprises our subscription-based data services and securities listings businesses. Our chief operating decision maker does not review total assets or statements of income below operating income by segments; therefore, such information is not presented below. Our
two
segments do not engage in intersegment transactions.
Certain prior year’s segment expenses for the year ended December 31, 2016 have been reclassified to conform to our current year’s segment financial statement presentation. This reclassification increased the operating expenses for the Data and Listings segment by
$55 million
, while decreasing the operating expenses for the Trading and Clearing segment by the same amount.
Financial data for our business segments is as follows for the years ended
December 31, 2017
,
2016
and
2015
(in millions):
|
Trading and Clearing Segment
|
Data and Listings Segment
|
Consolidated
|
|||||||||
|
Year Ended December 31, 2017
|
|||||||||||
|
Revenues, less transaction-based expenses
|
$
|
2,128
|
|
$
|
2,501
|
|
$
|
4,629
|
|
||
|
Operating expenses
|
779
|
|
1,471
|
|
2,250
|
|
|||||
|
Operating income
|
1,349
|
|
1,030
|
|
2,379
|
|
|||||
|
Year Ended December 31, 2016
|
|||||||||||
|
Revenues, less transaction-based expenses
|
$
|
2,102
|
|
$
|
2,397
|
|
$
|
4,499
|
|
||
|
Operating expenses
|
825
|
|
1,507
|
|
2,332
|
|
|||||
|
Operating income
|
1,277
|
|
890
|
|
2,167
|
|
|||||
|
Year Ended December 31, 2015
|
|||||||||||
|
Revenues, less transaction-based expenses
|
$
|
2,062
|
|
$
|
1,276
|
|
$
|
3,338
|
|
||
|
Operating expenses
|
915
|
|
673
|
|
1,588
|
|
|||||
|
Operating income
|
1,147
|
|
603
|
|
1,750
|
|
|||||
Revenue from
two
clearing members of the Trading and Clearing segment comprised a combined
$477 million
or
22%
of our Trading and Clearing revenues for the year ended
December 31, 2017
and revenue from
one
clearing member of the Trading and Clearing segment comprised
$221 million
or
11%
of our Trading and Clearing revenues for the year ended
December 31, 2016
. Clearing members are primarily intermediaries and represent a broad range of principal trading firms. If a clearing member ceased its operations, we believe that the trading firms would continue to conduct transactions and would clear those transactions through another clearing member firm. No additional customers or clearing members accounted for more than
10%
of our segment revenues or consolidated revenues for the years ended
December 31, 2017
,
2016
and
2015
.
126
Geographical Information
The following represents our revenues, less transaction-based expenses, net assets and net property and equipment based on the geographic location (in millions):
|
United States
|
Foreign Countries
|
Total
|
|||||||||
|
Revenues, less transaction-based expenses:
|
|||||||||||
|
Year ended December 31, 2017
|
$
|
2,794
|
|
$
|
1,835
|
|
$
|
4,629
|
|
||
|
Year ended December 31, 2016
|
$
|
2,744
|
|
$
|
1,755
|
|
$
|
4,499
|
|
||
|
Year ended December 31, 2015
|
$
|
1,973
|
|
$
|
1,365
|
|
$
|
3,338
|
|
||
|
Net assets:
|
|||||||||||
|
As of December 31, 2017
|
$
|
9,124
|
|
$
|
7,828
|
|
$
|
16,952
|
|
||
|
As of December 31, 2016
|
$
|
7,877
|
|
$
|
7,913
|
|
$
|
15,790
|
|
||
|
Property and equipment, net:
|
|||||||||||
|
As of December 31, 2017
|
$
|
1,134
|
|
$
|
112
|
|
$
|
1,246
|
|
||
|
As of December 31, 2016
|
$
|
1,009
|
|
$
|
120
|
|
$
|
1,129
|
|
||
The foreign countries category above primarily relates to the U.K. and to a lesser extent, EU, Israel, Canada and Singapore.
|
18.
|
Earnings Per Common Share
|
The following is a reconciliation of the numerators and denominators of the basic and diluted earnings per common share computations for the years ended
December 31, 2017
,
2016
and
2015
(in millions, except per share amounts):
|
Year Ended December 31,
|
|||||||||||
|
2017
|
2016
|
2015
|
|||||||||
|
Basic:
|
|||||||||||
|
Net income attributable to Intercontinental Exchange, Inc.
|
$
|
2,514
|
|
$
|
1,422
|
|
$
|
1,274
|
|
||
|
Weighted average common shares outstanding
|
589
|
|
595
|
|
556
|
|
|||||
|
Basic earnings per common share
|
$
|
4.27
|
|
$
|
2.39
|
|
$
|
2.29
|
|
||
|
Diluted:
|
|||||||||||
|
Weighted average common shares outstanding
|
589
|
|
595
|
|
556
|
|
|||||
|
Effect of dilutive securities - stock options and restricted stock
|
5
|
|
4
|
|
3
|
|
|||||
|
Diluted weighted average common shares outstanding
|
594
|
|
599
|
|
559
|
|
|||||
|
Diluted earnings per common share
|
$
|
4.23
|
|
$
|
2.37
|
|
$
|
2.28
|
|
||
Basic earnings per common share is calculated using the weighted average common shares outstanding during the periods. The weighted average common shares outstanding decreased for the year ended
December 31, 2017
, from the prior year period, primarily due to stock repurchases during 2017 (Note 11). The weighted average common shares outstanding increased for the year ended
December 31, 2016
, over the prior year period, primarily due to stock issued for the Interactive Data and Trayport acquisitions, partially offset by stock repurchases. We issued
32.3 million
shares of our common stock to Interactive Data stockholders and
12.6 million
shares of our common stock to Trayport stockholders, which are weighted to show these additional shares outstanding for periods after the respective acquisition dates (Note 3).
Common equivalent shares from stock options and restricted stock awards, using the treasury stock method, are included in the diluted per share calculations unless the effect of their inclusion would be antidilutive. During the years ended
December 31, 2017
,
2016
and 2015,
694,343
,
724,918
and
836,405
outstanding stock options, respectively, were not included in the computation of diluted earnings per common share, because to do so would have had an antidilutive effect. As of
December 31, 2017
and
2016
, there were
88,930
and
110,265
restricted stock units, respectively, that were vested but have not been issued that are included in the computation of basic and diluted earnings per share. Certain figures in the table above may not recalculate due to rounding.
127
19.
Quarterly Financial Data (Unaudited)
The following table has been prepared from our financial records and reflects all adjustments that are necessary for a fair presentation of the results of operations for the interim periods presented (in millions, except per share amounts):
|
1
st
Qtr
|
2
nd
Qtr
|
3
rd
Qtr
|
4
th
Qtr
|
||||||||||||
|
Year Ended December 31, 2017
|
|||||||||||||||
|
Revenues, less transaction-based expenses
|
$
|
1,164
|
|
$
|
1,178
|
|
$
|
1,143
|
|
$
|
1,144
|
|
|||
|
Operating income
|
582
|
|
609
|
|
596
|
|
592
|
|
|||||||
|
Net income attributable to Intercontinental Exchange, Inc.
(a)
|
502
|
|
418
|
|
369
|
|
1,225
|
|
|||||||
|
Earnings per common share
(b)
:
|
|||||||||||||||
|
Basic
|
$
|
0.84
|
|
$
|
0.71
|
|
$
|
0.63
|
|
$
|
2.10
|
|
|||
|
Diluted
|
$
|
0.84
|
|
$
|
0.70
|
|
$
|
0.62
|
|
$
|
2.08
|
|
|||
|
Year Ended December 31, 2016
|
|||||||||||||||
|
Revenues, less transaction-based expenses
|
$
|
1,154
|
|
$
|
1,129
|
|
$
|
1,078
|
|
$
|
1,138
|
|
|||
|
Operating income
|
584
|
|
551
|
|
474
|
|
558
|
|
|||||||
|
Net income attributable to Intercontinental Exchange, Inc.
|
369
|
|
357
|
|
344
|
|
352
|
|
|||||||
|
Earnings per common share
(b)
:
|
|||||||||||||||
|
Basic
|
$
|
0.62
|
|
$
|
0.60
|
|
$
|
0.58
|
|
$
|
0.59
|
|
|||
|
Diluted
|
$
|
0.62
|
|
$
|
0.60
|
|
$
|
0.57
|
|
$
|
0.59
|
|
|||
|
(a)
|
We recognized a
$176 million
realized investment gain on our sale of Cetip in other income for the three months ended March 31, 2017 (Note 6), we recognized a
$764 million
gain relating to the deferred tax benefit associated with future U.S. income tax rate reductions for the three months ended December 31, 2017 (Note 12), and we recognized a
$110 million
gain on our sale of Trayport in other income for the three months ended December 31, 2017 (Note 3).
|
|
(b)
|
The annual earnings per common share may not equal the sum of the individual quarter’s earnings per common share due to rounding.
|
|
20.
|
Subsequent Events
|
We have evaluated subsequent events and determined that no events or transactions met the definition of a subsequent event for purposes of recognition or disclosure in the accompanying consolidated financial statements except those events disclosed in Note 3.
128
ITEM 9.
CHANGES IN AND DISAGREEMENTS WITH ACCOUNTANTS ON ACCOUNTING AND
FINANCIAL DISCLOSURE
FINANCIAL DISCLOSURE
None.
(a)
Evaluation of Disclosure Controls and Procedures.
As of the end of the period covered by this report, an evaluation was carried out by our management, with the participation of our Chief Executive Officer and Chief Financial Officer, of the effectiveness of our disclosure controls and procedures (as defined in Rule 13a-15(e) under the Securities Exchange Act of 1934). Based upon that evaluation, our Chief Executive Officer and Chief Financial Officer concluded that these disclosure controls and procedures were effective as of the end of the period covered by this report.
(b)
Management’s Annual Report on Internal Control over Financial Reporting and the Attestation Report of the Independent Registered Public Accounting Firm.
Management’s report on its assessment of the effectiveness of our internal control over financial reporting as of December 31, 2017 and the attestation report of Ernst & Young LLP on our internal control over financial reporting are set forth in Part II, Item 8 of this Annual Report.
(c)
Changes in Internal Controls over Financial Reporting.
Except as described below, there were no changes in our internal controls over financial reporting that occurred during our most recent fiscal quarter that have materially affected, or are reasonably likely to materially affect, our internal controls over financial reporting. As a result, no corrective actions were taken. During the quarter ended December 31, 2017, we acquired NGX and are in the process of integrating the acquired business into our overall internal control over financial reporting process. As permitted under applicable regulations, we have excluded NGX from the assessment of internal control over financial reporting as of December 31, 2017.
Not applicable.
ITEM 10.
DIRECTORS, EXECUTIVE OFFICERS AND CORPORATE GOVERNANCE
Information relating to our Board of Directors set forth under the caption “Item 1 — Election of Directors — Nominees for Election as Directors at the 2017 Annual Meeting” in our Proxy Statement for our 2018 Annual Meeting of Stockholders (“2018 Proxy Statement”) is incorporated herein by reference. Information relating to our executive officers is, pursuant to Instruction 3 of Item 401(b) of Regulation S-K and General Instruction G(3) of Form 10-K, set forth below under the caption “Executive Officers.” Information regarding compliance by our directors and executive officers and owners of more than ten percent of our Common Stock with the reporting requirements of Section 16(a) of the Exchange Act (Item 405 of Regulation S-K), set forth under the caption “Section 16(a) of the Securities Exchange Act Beneficial Ownership Reporting Compliance” in the 2018 Proxy Statement is incorporated herein by reference. Information relating to our financial expert serving on our Audit Committee (Item 407(d)(5) of Regulation S-K), our Nominating and Corporate Governance Committee (Item 407(c)(3) of Regulation S-K), and our Audit Committee (Item 407(d)(4) of Regulation S-K) is set forth under the caption “Meetings and Committees of the Board of Directors” in our 2018 Proxy Statement and is incorporated herein by reference.
Executive Officers
Set forth below, in accordance with General Instruction G(3) of Form 10-K and Instruction 3 to Item 401(b) of Regulation S-K, is information regarding our executive officers:
|
Name
|
Age
|
Title
|
|
Jeffrey C. Sprecher
|
62
|
Chairman of the Board and Chief Executive Officer
|
|
Charles A. Vice
|
54
|
Vice Chairman
|
|
Scott A. Hill
|
50
|
Chief Financial Officer
|
|
Benjamin R. Jackson
|
45
|
President
|
|
David S. Goone
|
57
|
Chief Strategy Officer
|
|
Johnathan H. Short
|
52
|
General Counsel and Corporate Secretary
|
|
Mark P. Wassersug
|
48
|
Chief Operating Officer
|
|
Thomas W. Farley
|
42
|
President of NYSE
|
129
Jeffrey C. Sprecher.
Mr. Sprecher has been a director and our Chief Executive Officer since our inception and has served as Chairman of our Board of Directors since November 2002. As our Chief Executive Officer, he is responsible for our strategic direction, operational and financial performance. Mr. Sprecher acquired Continental Power Exchange, or CPEX, our predecessor company, in 1997. Prior to acquiring CPEX, Mr. Sprecher held a number of positions, including President, over a fourteen-year period with Western Power Group, Inc., a developer, owner and operator of large central-station power plants. While with Western Power, he was responsible for a number of significant financings. Mr. Sprecher holds a B.S. degree in Chemical Engineering from the University of Wisconsin and an MBA from Pepperdine University.
Charles A. Vice.
Mr. Vice has served as Vice Chairman since November 2017. Previously, he served as Chief Operating Officer from July 2001 to November 2017 and President from October 2005 to November 2017. As Vice Chairman, Mr. Vice oversees global technology, information security and operations.
For over 25 years, he has been a leader in the application of information technology in the energy and financial services industries. Prior to the founding of ICE in 2000, Mr. Vice was a Director at CPEX, an electronic market for trading electric power. Before joining the CPEX startup in 1994, he was a Principal at Energy Management Associates, where he provided consulting services to the electric power and natural gas industries. Mr. Vice earned a BS degree in Mechanical Engineering from the University of Alabama and an MBA from the Owen Graduate School of Management at Vanderbilt University. He serves on the Board of Visitors at the Owen School and the Leadership Board of the University of Alabama College of Engineering where he is a Distinguished Engineering Fellow.
Scott A. Hill.
Mr. Hill has served as Chief Financial Officer since May 2007. As our Chief Financial Officer, he is responsible for overseeing all aspects of our finance and accounting functions, including treasury, tax, cash management and investor relations. In addition, Mr. Hill oversees our global clearing operations. Prior to joining us, Mr. Hill spent 16 years as an international finance executive for IBM. He oversaw IBM’s worldwide financial forecasts and measurements from 2006 through 2007, working alongside the Chief Financial Officer of IBM and with all of the company’s global business units. Prior to that, Mr. Hill was Vice President and Controller of IBM Japan’s multi-billion dollar business operation from 2003 through 2005. He currently serves on the Board of Directors of VVC Exploration Corporation and serves on the Audit Committee. Mr. Hill earned his BBA in Finance from the University of Texas at Austin and his MBA from New York University.
Benjamin R. Jackson.
Mr. Jackson has served as President since November 2017. Mr. Jackson is responsible for coordinating our global futures and OTC trading businesses. Additionally, he leads the integration planning and execution of our acquisitions and joint ventures. He also serves on the Commodity Futures Trading Commission Energy and Environmental Markets Advisory Committee. Mr. Jackson previously served as Chief Commercial Officer, and prior to that President and Chief Operating Officer of ICE Futures U.S. Mr. Jackson joined us in July 2011 from SunGard, a leading software and technology provider to commodity market participants. At SunGard, he led the company’s energy and commodities business segment as Senior Executive Vice President. Prior to that, Mr. Jackson served as President of SunGard’s Kiodex commodity risk management platform. Mr. Jackson earned a Bachelor of Science degree in economics from John Carroll University with supporting studies at the London School of Economics and Political Science.
David S. Goone.
Mr. Goone has served as Chief Strategy Officer since March 2001. He is responsible for all aspects of our product line, including futures products and capabilities for ICE’s electronic platform. Mr. Goone is a Director of Maroon Holding LLC, the governing Board of MERSCORP Holdings, Inc., where we have a majority ownership. Mr. Goone also represents us on industry boards including the Options Clearing Corporation, National Futures Association and the Depository Trust & Clearing Corporation. Prior to joining us, Mr. Goone served as the Managing Director and Head of Product Development and Sales at the Chicago Mercantile Exchange where he worked for nine years. From 1989 through 1992, Mr. Goone was Vice President at Indosuez Carr Futures, where he developed institutional and corporate business. Prior to joining Indosuez, Mr. Goone worked at Chase Manhattan Bank, where he developed and managed their exchange-traded foreign currency options operation at the Chicago Mercantile Exchange. Mr. Goone holds a B.S. degree in Accountancy from the University of Illinois at Urbana-Champaign.
Johnathan H. Short
. Mr. Short has served as General Counsel and Corporate Secretary since June 2004. In his role as General Counsel, he is responsible for managing our legal, regulatory and government affairs. As Corporate Secretary, he is also responsible for a variety of our corporate governance matters. Prior to joining us, Mr. Short was a partner at McKenna Long & Aldridge LLP, a national law firm now known as Dentons. Mr. Short practiced in the corporate law group of McKenna, Long & Aldridge from November 1994 until he joined us in June 2004. From April 1991 until October 1994, he practiced in the commercial litigation department of the law firm. Mr. Short holds a J.D. degree from the University of Florida, College of Law, and a B.S. in Accounting from the University of Florida, Fisher School of Accounting.
Mark P. Wassersug.
Mr. Wassersug has served as Chief Operating Officer since November 2017. Mr. Wassersug leads operations, including IT infrastructure, data networks, data centers and engineering. Previously Mr. Wassersug was SVP, Operations. Prior to joining us in 2001, Mr. Wassersug worked as a strategic planning and technology consultant in Internet infrastructure and ecommerce for Exodus Communication. Mr. Wassersug earned a Bachelor of Science degree in Civil Engineering from Lehigh University and completed a Master of Business Administration at the Goizueta Business School at Emory University.
130
Thomas W. Farley.
Mr. Farley has served as President of the NYSE since May 2014. He joined the NYSE as Chief Operating Officer following the closing of the NYSE Euronext acquisition in November 2013. Prior to this role, Mr. Farley served as our Senior Vice President of Financial Markets from June 2012 to November 2013 where he oversaw the development of initiatives within our OTC financial markets. Mr. Farley joined Intercontinental Exchange, Inc. in February 2007 as President of ICE Futures U.S., a position that he held until June 2012. Mr. Farley also represents us on the Options Clearing Corporation Board of Directors. From July 2006 to January 2007, Mr. Farley was President of SunGard Kiodex, a risk management technology provider to the commodity derivatives markets. From October 2000 to July 2006, Mr. Farley served as Kiodex’s Chief Financial Officer and he also served as Kiodex’s Chief Operating Officer from January 2003 to July 2006. Prior to Kiodex, Mr. Farley held positions in investment banking and private equity. Mr. Farley holds a B.A. in Political Science from Georgetown University and is a Chartered Financial Analyst.
Code of Ethics
We have adopted a Global Code of Business Conduct that applies to all of our employees, officers and directors. Our Global Code of Business Conduct meets the requirements of a “code of ethics” as defined by Item 406 of Regulation S-K, and applies to our Chief Executive Officer and Chief Financial Officer (who is the principal financial officer), as well as all other employees, as indicated above. Our Global Code of Business Conduct also meets the requirements of a code of ethics and business conduct under the New York Stock Exchange listing standards. Our Global Code of Business Conduct is available on our website at
www.theice.com
under the heading “About ICE,” “Investors” then “Governance.” We will also provide a copy of the Global Code of Business Conduct to stockholders at no charge upon written request.
ITEM 11.
EXECUTIVE COMPENSATION
Information relating to executive compensation set forth under the captions “Item 1 — Election of Directors — Non-Employee Directors Compensation,” “Compensation Discussion & Analysis,” “Compensation Committee Report,” and “Compensation Committee Interlocks and Insider Participation” in our 2018 Proxy Statement is incorporated herein by reference.
ITEM 12.
SECURITY OWNERSHIP OF CERTAIN BENEFICIAL OWNERS AND MANAGEMENT AND RELATED STOCKHOLDER MATTERS
Information regarding ownership of our common stock by certain persons as set forth under the caption “Security Ownership of Certain Beneficial Owners and Management” in our 2018 Proxy Statement is incorporated herein by reference. In addition, information in tabular form relating to securities authorized for issuance under our equity compensation plans is set forth under the caption “Equity Compensation Plan Information” in this Annual Report and “Equity” and “Pension and Other Benefit Programs” as described in Notes 11 and 15 to our consolidated financial statements in this Annual Report.
ITEM 13.
CERTAIN RELATIONSHIPS AND RELATED TRANSACTIONS, AND DIRECTOR INDEPENDENCE
Information regarding certain relationships and transactions between our company and certain of our affiliates as set forth under the caption “Certain Relationships and Related Transactions” in our 2018 Proxy Statement is incorporated herein by reference. In addition, information regarding our directors’ independence (Item 407(a) of Regulation S-K) as set forth under the caption “Item 1 — Election of Directors — Nominees for Election as Directors at the 2018 Annual Meeting” in our 2018 Proxy Statement is incorporated herein by reference.
ITEM 14.
PRINCIPAL ACCOUNTANT FEES AND SERVICES
Information regarding principal accountant fees and services of our independent registered public accounting firm, Ernst & Young LLP, is set forth under the caption “Information About the Company’s Independent Registered Public Accounting Firm Fees and Services” in our 2018 Proxy Statement and is incorporated herein by reference.
ITEM 15.
EXHIBITS, FINANCIAL STATEMENT SCHEDULES
|
(a)
|
Documents Filed as Part of this Report.
|
|
(1)
|
Financial Statements
|
131
Our consolidated financial statements and the related reports of management and our independent registered public accounting firm which are required to be filed as part of this Report are included in this Annual Report on Form 10-K. These consolidated financial statements are as follows:
|
•
|
Consolidated Balance Sheets as of December 31, 2017 and 2016.
|
|
•
|
Consolidated Statements of Income for the years ended December 31, 2017, 2016 and 2015.
|
|
•
|
Consolidated Statements of Comprehensive Income for the years ended December 31, 2017, 2016 and 2015.
|
|
•
|
Consolidated Statements of Changes in Equity, Accumulated Other Comprehensive Income (Loss) and Redeemable Non-Controlling Interest for the years ended December 31, 2017, 2016 and 2015.
|
|
•
|
Consolidated Statements of Cash Flows for the years ended December 31, 2017, 2016 and 2015.
|
|
•
|
Notes to Consolidated Financial Statements.
|
|
(2)
|
Financial Statement Schedules
|
Schedules have been omitted because they are not applicable or the required information is included in the consolidated financial statements or notes, thereto.
|
(3)
|
Exhibits
|
See (b) below.
|
(b)
|
Exhibits
|
The exhibits listed below under “Index to Exhibits” are filed with or incorporated by reference in this Report. Where such filing is made by incorporation by reference to a previously filed registration statement or report, such registration statement or report is identified in parentheses. We will furnish any exhibit upon request to Investor Relations, 5660 New Northside Drive, Atlanta, Georgia 30328.
ITEM 16.
FORM 10-K SUMMARY
Not applicable.
INDEX TO EXHIBITS
The following exhibits are filed with this Report. We will furnish any exhibit upon request to Intercontinental Exchange, Inc., Investor Relations, 5660 New Northside Drive, Third Floor, Atlanta, Georgia 30328.
|
Exhibit
Number
|
Description of Document
|
|
|
2.1
|
—
|
|
|
2.2
|
||
|
3.1
|
—
|
|
|
3.2
|
—
|
|
|
4.1
|
—
|
|
132
|
4.2
|
—
|
|
|
4.3
|
—
|
|
|
4.4
|
—
|
|
|
4.5
|
—
|
|
|
4.6
|
—
|
|
|
4.7
|
—
|
|
|
4.8
|
—
|
|
|
4.9
|
—
|
|
|
4.10
|
—
|
|
|
4.11
|
—
|
|
|
10.1
|
—
|
|
|
10.2
|
—
|
|
|
10.3
|
—
|
|
|
10.4
|
—
|
|
|
10.5
|
—
|
|
|
10.6
|
—
|
|
|
10.7
|
—
|
|
|
10.8
|
—
|
|
|
10.9
|
—
|
|
133
|
10.10
|
—
|
|
|
10.11
|
—
|
|
|
10.12
|
—
|
|
|
10.13
|
—
|
|
|
10.14
|
||
|
10.15
|
—
|
|
|
10.16
|
—
|
|
|
10.17
|
—
|
|
|
10.18
|
—
|
|
|
10.19
|
—
|
|
|
10.20
|
—
|
|
|
10.21
|
—
|
|
|
10.22
|
—
|
|
|
10.23
|
—
|
|
|
10.24
|
—
|
|
|
10.25
|
—
|
|
|
10.26
|
—
|
|
134
|
10.27
|
—
|
|
|
10.28
|
—
|
|
|
10.29
|
—
|
|
|
10.30
|
—
|
|
|
12.1
|
—
|
|
|
21.1
|
—
|
|
|
23.1
|
—
|
|
|
24.1
|
—
|
|
|
31.1
|
—
|
|
|
31.2
|
—
|
|
|
32.1
|
—
|
|
|
32.2
|
—
|
|
|
101
|
—
|
The following materials from Intercontinental Exchange, Inc.’s Annual Report on Form 10-K for the year ended December 31, 2017 formatted in XBRL (Extensible Business Reporting Language): (i) the Consolidated Balance Sheets, (ii) the Consolidated Statements of Income, (iii) the Consolidated Statements of Changes in Equity, Accumulated Other Comprehensive Income (Loss) and Redeemable Non-Controlling Interest, (iv) the Consolidated Statements of Comprehensive Income, (v) Consolidated Statements of Cash Flows and (vi) Notes to Consolidated Financial Statements, tagged as blocks of text.**
|
|
*
|
Certain exhibits and similar attachments to this agreement have been omitted in accordance with Item 601(b)(2) of Regulation S-K. A copy of any omitted exhibit or other attachment will be furnished supplementally to the Securities and Exchange Commission upon request.
|
|
**
|
As provided in Rule 406T of Regulation S-T, this information is “furnished” and not “filed” for purposes of Sections 11 and 12 of the Securities Act of 1933 and Section 18 of the Securities Exchange Act of 1934. Such exhibit will not be deemed to be incorporated by reference into any filing under the Securities Act of 1933 or the Securities Exchange Act of 1934 unless Intercontinental Exchange, Inc. specifically incorporates it by reference.
|
135
SIGNATURES
Pursuant to the requirements of Section 13 or 15(d) of the Securities Exchange Act of 1934, the Registrant has duly caused this Report to be signed on its behalf by the undersigned, thereunto duly authorized.
|
Intercontinental Exchange, Inc.
(Registrant)
|
|||
|
Date: February 7, 2018
|
By:
|
/s/ Jeffrey C. Sprecher
|
|
|
Jeffrey C. Sprecher
|
|||
|
Chief Executive Officer
|
|||
KNOW ALL MEN BY THESE PRESENTS, that each person whose signature appears below constitutes and appoints Jeffrey C. Sprecher and Scott A. Hill, and each of them his or her true and lawful attorneys-in-fact and agents, with full power of substitution and resubstitution, for him or her and in his or her name, place and stead, in any and all capacities, to sign any and all amendments to this Annual Report for the calendar year ended December 31, 2017 and to file the same, with all exhibits thereto and other documents in connection therewith, with the Securities and Exchange Commission, granting unto said attorneys-in-fact and agents, and each of them, full power and authority to do and perform each and every act and thing requisite or necessary to be done, as fully to all intents and purposes as he might or could do in person, hereby ratifying and confirming all that said attorneys-in-fact and agents or any of them, or their or his substitute or substitutes, may lawfully do or cause to be done by virtue hereof.
Pursuant to the requirements of the Securities Exchange Act of 1934, this Report has been signed below by the following persons on behalf of the Registrant and in the capacities indicated as of the date indicated.
|
Signatures
|
Title
|
Date
|
|
/s/ Jeffrey C. Sprecher
|
Chairman of the Board and Chief
|
February 7, 2018
|
|
Jeffrey C. Sprecher
|
Executive Officer
(principal executive officer)
|
|
|
/s/ Scott A. Hill
|
Chief Financial Officer
(principal financial officer) |
February 7, 2018
|
|
Scott A. Hill
|
||
|
/s/ Dean S. Mathison
|
Chief Accounting Officer and Corporate Controller (principal accounting officer)
|
February 7, 2018
|
|
Dean S. Mathison
|
||
|
/s/ Sharon Y. Bowen
|
Director
|
February 7, 2018
|
|
/s/ Sharon Y. Bowen
|
||
|
/s/ Ann M. Cairns
|
Director
|
February 7, 2018
|
|
Ann M. Cairns
|
||
|
/s/ Charles R. Crisp
|
Director
|
February 7, 2018
|
|
Charles R. Crisp
|
||
|
/s/ Duriya M. Farooqui
|
Director
|
February 7, 2018
|
|
Duriya M. Farooqui
|
||
|
/s/ Jean-Marc Forneri
|
Director
|
February 7, 2018
|
|
Jean-Marc Forneri
|
||
|
/s/ Fredrick W. Hatfield
|
Director
|
February 7, 2018
|
|
Fredrick W. Hatfield
|
||
136
|
/s/ Lord Hague of Richmond
|
Director
|
February 7, 2018
|
|
The Rt. Hon. the Lord Hague of Richmond
|
||
|
/s/ Thomas E. Noonan
|
Director
|
February 7, 2018
|
|
Thomas E. Noonan
|
||
|
/s/ Frederic V. Salerno
|
Director
|
February 7, 2018
|
|
Frederic V. Salerno
|
||
|
/s/ Judith A. Sprieser
|
Director
|
February 7, 2018
|
|
Judith A. Sprieser
|
||
|
/s/ Vincent Tese
|
Director
|
February 7, 2018
|
|
Vincent Tese
|
||
137
TABLE OF CONTENTS
Part IItem 1. BusinessItem 1(a). Risk FactorsItem 1(a)Item 1 (b). Unresolved Staff CommentsItem 1 (b)Item 2. PropertiesItem 3. Legal ProceedingsItem 4. Mine Safety DisclosuresPart IIItem 5. Market For Registrant S Common Equity, Related Stockholder Matters and Issuer Purchases Of Equity SecuritiesItem 6. Selected Financial DataItem 7. Management S Discussion and Analysis Of Financial Condition and Results Of OperationsItem 7 (a). Quantitative and Qualitative Disclosures About Market RiskItem 7 (a)Item 8. Financial Statements and Supplementary DataItem 9. Changes in and Disagreements with Accountants on Accounting and Financial DisclosureItem 9 (a). Controls and ProceduresItem 9 (a)Item 9 (b). Other InformationItem 9 (b)Part IIIItem 10. Directors, Executive Officers and Corporate GovernanceItem 11. Executive CompensationItem 12. Security Ownership Of Certain Beneficial Owners and Management and Related Stockholder MattersItem 13. Certain Relationships and Related Transactions, and Director IndependenceItem 14. Principal Accountant Fees and ServicesPart IVItem 15. Exhibits, Financial Statement SchedulesItem 16. Form 10-k Summary