INTERCONTINENTAL EXCHANGE, INC.
10-Ks and 10-Qs
|
|
|
|
|
|
|
|
|
|
|
|
|
|
|
|
|
|
|
|
|
|
|
|
|
|
|
|
|
|
|
|
|
|
|
|
|
|
|
|
|
|
|
|
|
|
|
UNITED STATES SECURITIES AND EXCHANGE COMMISSION
Washington, D.C. 20549
Form 10-Q
|
(Mark One)
|
|
|
þ
|
Quarterly Report Pursuant to Section 13 or 15(d) of the Securities Exchange Act of 1934
|
|
For the quarterly period ended September 30, 2018
|
|
|
Or
|
|
|
¨
|
Transition Report Pursuant to Section 13 or 15(d) of the Securities Exchange Act of 1934
|
|
For the transition period from to
|
|
Commission File Number 001-36198
INTERCONTINENTAL EXCHANGE, INC.
(Exact name of registrant as specified in its charter)
|
Delaware
|
46-2286804
|
|
(State or other jurisdiction of
incorporation or organization)
|
(IRS Employer
Identification Number)
|
|
5660 New Northside Drive,
Atlanta, Georgia
|
30328
(Zip Code)
|
|
(Address of principal executive offices)
|
|
(770) 857-4700
Registrant’s telephone number, including area code
Indicate by check mark whether the registrant: (1) has filed all reports required to be filed by Section 13 or 15(d) of the Exchange Act during the preceding 12 months (or for such shorter period that the registrant was required to file such reports), and (2) has been subject to such filing requirements for the past 90 days. Yes
þ
No
¨
Indicate by check mark whether the registrant has submitted electronically every Interactive Data File required to be submitted pursuant to Rule 405 of Regulation S-T during the preceding 12 months (or for such shorter period that the registrant was required to submit such files). Yes
þ
No
¨
Indicate by check mark whether the registrant is a large accelerated filer, an accelerated filer, a non-accelerated filer, a smaller reporting company or an emerging growth company. See definitions of “large accelerated filer,” “accelerated filer,” “smaller reporting company” and “emerging growth company” in Rule 12b-2 of the Exchange Act.
|
Large accelerated filer
þ
|
Accelerated filer
¨
|
Non-accelerated filer
¨
|
Smaller reporting company
¨
|
Emerging growth company
¨
|
If an emerging growth company, indicate by check mark if the registrant has elected not to use the extended transition period for complying with any new or revised financial accounting standards provided pursuant to Section 13(a) of the Exchange Act.
¨
Indicate by check mark whether the registrant is a shell company (as defined in Rule 12b-2 of the Exchange Act). Yes
¨
No
þ
As of October 26, 2018, the number of shares of the registrant’s Common Stock outstanding was 569,583,956 shares.
INTERCONTINENTAL EXCHANGE, INC.
Form 10-Q
Quarterly Period Ended
September 30, 2018
TABLE OF CONTENTS
|
PART I.
|
Financial Statements
|
|
|
Item 1.
|
||
|
Consolidated Balance Sheets as of September 30, 2018 and December 31, 2017
|
||
|
Consolidated Statements of Income for the nine and three months ended September 30, 2018 and 2017
|
||
|
Consolidated Statements of Comprehensive Income for the nine and three months ended September 30, 2018 and 2017
|
||
|
Consolidated Statements of Changes in Equity, Accumulated Other Comprehensive Loss and Redeemable Non-Controlling Interest for the nine months ended September 30, 2018 and for the year ended December 31, 2017
|
||
|
Consolidated Statements of Cash Flows for the nine months ended September 30, 2018 and 2017
|
||
|
Item 2.
|
||
|
Item 3.
|
||
|
Item 4.
|
||
|
PART II.
|
Other Information
|
|
|
Item 1.
|
||
|
Item 1A.
|
||
|
Item 2.
|
||
|
Item 3.
|
||
|
Item 4.
|
||
|
Item 5.
|
||
|
Item 6.
|
||
Intercontinental Exchange, Inc. and Subsidiaries
(In millions, except per share amounts)
(Unaudited)
|
As of
|
As of
|
||||||
|
September 30, 2018
|
December 31, 2017
|
||||||
|
Assets:
|
|||||||
|
Current assets:
|
|||||||
|
Cash and cash equivalents
|
$
|
515
|
|
$
|
535
|
|
|
|
Short-term restricted cash and cash equivalents
|
817
|
|
769
|
|
|||
|
Customer accounts receivable, net of allowance for doubtful accounts of $7 and $6 at September 30, 2018 and December 31, 2017, respectively
|
1,020
|
|
903
|
|
|||
|
Margin deposits, guaranty funds and delivery contracts receivable
|
58,764
|
|
51,222
|
|
|||
|
Prepaid expenses and other current assets
|
179
|
|
133
|
|
|||
|
Total current assets
|
61,295
|
|
53,562
|
|
|||
|
Property and equipment, net
|
1,206
|
|
1,246
|
|
|||
|
Other non-current assets:
|
|||||||
|
Goodwill
|
12,934
|
|
12,216
|
|
|||
|
Other intangible assets, net
|
10,445
|
|
10,269
|
|
|||
|
Long-term restricted cash and cash equivalents
|
330
|
|
264
|
|
|||
|
Other non-current assets
|
1,032
|
|
707
|
|
|||
|
Total other non-current assets
|
24,741
|
|
23,456
|
|
|||
|
Total assets
|
$
|
87,242
|
|
$
|
78,264
|
|
|
|
Liabilities and Equity:
|
|||||||
|
Current liabilities:
|
|||||||
|
Accounts payable and accrued liabilities
|
$
|
486
|
|
$
|
462
|
|
|
|
Section 31 fees payable
|
21
|
|
128
|
|
|||
|
Accrued salaries and benefits
|
217
|
|
227
|
|
|||
|
Deferred revenue
|
249
|
|
125
|
|
|||
|
Short-term debt
|
1,198
|
|
1,833
|
|
|||
|
Margin deposits, guaranty funds and delivery contracts payable
|
58,764
|
|
51,222
|
|
|||
|
Other current liabilities
|
130
|
|
178
|
|
|||
|
Total current liabilities
|
61,065
|
|
54,175
|
|
|||
|
Non-current liabilities:
|
|||||||
|
Non-current deferred tax liability, net
|
2,275
|
|
2,298
|
|
|||
|
Long-term debt
|
6,488
|
|
4,267
|
|
|||
|
Accrued employee benefits
|
235
|
|
243
|
|
|||
|
Other non-current liabilities
|
325
|
|
296
|
|
|||
|
Total non-current liabilities
|
9,323
|
|
7,104
|
|
|||
|
Total liabilities
|
70,388
|
|
61,279
|
|
|||
|
Commitments and contingencies
|
|
|
|
|
|||
|
Equity:
|
|||||||
|
Intercontinental Exchange, Inc. stockholders’ equity:
|
|||||||
|
Preferred stock, $0.01 par value; 100 shares authorized; no shares issued or outstanding at September 30, 2018 and December 31, 2017
|
—
|
|
—
|
|
|||
|
Common stock, $0.01 par value; 1,500 shares authorized; 603 and 600 shares issued at September 30, 2018 and December 31, 2017, respectively, and 571 and 583 shares outstanding at September 30, 2018 and December 31, 2017, respectively
|
6
|
|
6
|
|
|||
|
Treasury stock, at cost; 32 and 17 shares at September 30, 2018 and December 31, 2017, respectively
|
(2,213
|
)
|
(1,076
|
)
|
|||
2
|
Additional paid-in capital
|
11,495
|
|
11,392
|
|
|||
|
Retained earnings
|
7,818
|
|
6,858
|
|
|||
|
Accumulated other comprehensive loss
|
(274
|
)
|
(223
|
)
|
|||
|
Total Intercontinental Exchange, Inc. stockholders’ equity
|
16,832
|
|
16,957
|
|
|||
|
Non-controlling interest in consolidated subsidiaries
|
22
|
|
28
|
|
|||
|
Total equity
|
16,854
|
|
16,985
|
|
|||
|
Total liabilities and equity
|
$
|
87,242
|
|
$
|
78,264
|
|
|
See accompanying notes.
3
Intercontinental Exchange, Inc. and Subsidiaries
(In millions, except per share amounts)
(Unaudited)
|
Nine Months Ended
September 30, |
Three Months Ended September 30,
|
||||||||||||||
|
2018
|
2017
|
2018
|
2017
|
||||||||||||
|
Revenues:
|
|||||||||||||||
|
Transaction and clearing, net
|
$
|
2,522
|
|
$
|
2,373
|
|
$
|
760
|
|
$
|
758
|
|
|||
|
Data services
|
1,576
|
|
1,559
|
|
530
|
|
518
|
|
|||||||
|
Listings
|
332
|
|
322
|
|
112
|
|
105
|
|
|||||||
|
Other revenues
|
169
|
|
148
|
|
61
|
|
54
|
|
|||||||
|
Total revenues
|
4,599
|
|
4,402
|
|
1,463
|
|
1,435
|
|
|||||||
|
Transaction-based expenses:
|
|||||||||||||||
|
Section 31 fees
|
272
|
|
275
|
|
61
|
|
92
|
|
|||||||
|
Cash liquidity payments, routing and clearing
|
656
|
|
635
|
|
202
|
|
197
|
|
|||||||
|
Total revenues, less transaction-based expenses
|
3,671
|
|
3,492
|
|
1,200
|
|
1,146
|
|
|||||||
|
Operating expenses:
|
|||||||||||||||
|
Compensation and benefits
|
732
|
|
717
|
|
251
|
|
234
|
|
|||||||
|
Professional services
|
91
|
|
94
|
|
32
|
|
30
|
|
|||||||
|
Acquisition-related transaction and integration costs
|
33
|
|
27
|
|
6
|
|
4
|
|
|||||||
|
Technology and communication
|
320
|
|
294
|
|
107
|
|
99
|
|
|||||||
|
Rent and occupancy
|
50
|
|
52
|
|
17
|
|
17
|
|
|||||||
|
Selling, general and administrative
|
109
|
|
117
|
|
37
|
|
38
|
|
|||||||
|
Depreciation and amortization
|
429
|
|
404
|
|
148
|
|
128
|
|
|||||||
|
Total operating expenses
|
1,764
|
|
1,705
|
|
598
|
|
550
|
|
|||||||
|
Operating income
|
1,907
|
|
1,787
|
|
602
|
|
596
|
|
|||||||
|
Other income (expense):
|
|||||||||||||||
|
Interest expense
|
(173
|
)
|
(137
|
)
|
(66
|
)
|
(47
|
)
|
|||||||
|
Other income, net
|
48
|
|
205
|
|
18
|
|
14
|
|
|||||||
|
Other income (expense), net
|
(125
|
)
|
68
|
|
(48
|
)
|
(33
|
)
|
|||||||
|
Income before income tax expense
|
1,782
|
|
1,855
|
|
554
|
|
563
|
|
|||||||
|
Income tax expense
|
381
|
|
540
|
|
89
|
|
186
|
|
|||||||
|
Net income
|
$
|
1,401
|
|
$
|
1,315
|
|
$
|
465
|
|
$
|
377
|
|
|||
|
Net income attributable to non-controlling interest
|
(24
|
)
|
(22
|
)
|
(7
|
)
|
(6
|
)
|
|||||||
|
Net income attributable to Intercontinental Exchange, Inc.
|
$
|
1,377
|
|
$
|
1,293
|
|
$
|
458
|
|
$
|
371
|
|
|||
|
Earnings per share attributable to Intercontinental Exchange, Inc. common stockholders:
|
|||||||||||||||
|
Basic
|
$
|
2.39
|
|
$
|
2.19
|
|
$
|
0.80
|
|
$
|
0.63
|
|
|||
|
Diluted
|
$
|
2.37
|
|
$
|
2.17
|
|
$
|
0.79
|
|
$
|
0.63
|
|
|||
|
Weighted average common shares outstanding:
|
|||||||||||||||
|
Basic
|
577
|
|
591
|
|
572
|
|
588
|
|
|||||||
|
Diluted
|
581
|
|
595
|
|
576
|
|
592
|
|
|||||||
|
Dividend per share
|
$
|
0.72
|
|
$
|
0.60
|
|
$
|
0.24
|
|
$
|
0.20
|
|
|||
See accompanying notes.
4
Intercontinental Exchange, Inc. and Subsidiaries
Consolidated Statements of Comprehensive Income
(In millions)
(Unaudited)
|
Nine Months Ended
September 30, |
Three Months Ended September 30,
|
||||||||||||||
|
2018
|
2017
|
2018
|
2017
|
||||||||||||
|
Net income
|
$
|
1,401
|
|
$
|
1,315
|
|
$
|
465
|
|
$
|
377
|
|
|||
|
Other comprehensive income (loss):
|
|||||||||||||||
|
Foreign currency translation adjustments, net of tax benefit (expense) of $1 and ($11) for the nine months ended September 30, 2018 and 2017, respectively, and ($4) for the three months ended September 30, 2017
|
(51
|
)
|
130
|
|
(9
|
)
|
45
|
|
|||||||
|
Change in fair value of available-for-sale securities
|
—
|
|
68
|
|
—
|
|
—
|
|
|||||||
|
Reclassification of realized gain on available-for-sale investment to other income
|
—
|
|
(176
|
)
|
—
|
|
—
|
|
|||||||
|
Other comprehensive income (loss)
|
(51
|
)
|
22
|
|
(9
|
)
|
45
|
|
|||||||
|
Comprehensive income
|
$
|
1,350
|
|
$
|
1,337
|
|
$
|
456
|
|
$
|
422
|
|
|||
|
Comprehensive income attributable to non-controlling interest
|
(24
|
)
|
(22
|
)
|
(7
|
)
|
(6
|
)
|
|||||||
|
Comprehensive income attributable to Intercontinental Exchange, Inc.
|
$
|
1,326
|
|
$
|
1,315
|
|
$
|
449
|
|
$
|
416
|
|
|||
See accompanying notes.
5
Intercontinental Exchange, Inc. and Subsidiaries
Consolidated Statements of Changes in Equity, Accumulated Other Comprehensive Loss
and Redeemable Non-Controlling Interest
(In millions)
(Unaudited)
|
Intercontinental Exchange, Inc. Stockholders’ Equity
|
Non-
Controlling
Interest in
Consolidated
Subsidiaries
|
Total
Equity
|
Redeemable Non-Controlling Interest
|
||||||||||||||||||||||||||||||||||
|
Common
Stock
|
Treasury Stock
|
Additional
Paid-in
Capital
|
Retained
Earnings
|
Accumulated
Other
Comprehensive
Loss
|
|||||||||||||||||||||||||||||||||
|
Shares
|
Value
|
Shares
|
Value
|
||||||||||||||||||||||||||||||||||
|
Balance, as of December 31, 2016
|
596
|
|
$
|
6
|
|
(1
|
)
|
$
|
(40
|
)
|
$
|
11,306
|
|
$
|
4,810
|
|
$
|
(344
|
)
|
$
|
37
|
|
$
|
15,775
|
|
$
|
36
|
|
|||||||||
|
Other comprehensive income
|
—
|
|
—
|
|
—
|
|
—
|
|
—
|
|
—
|
|
121
|
|
—
|
|
121
|
|
—
|
|
|||||||||||||||||
|
Exercise of common stock options
|
—
|
|
—
|
|
—
|
|
—
|
|
17
|
|
—
|
|
—
|
|
—
|
|
17
|
|
—
|
|
|||||||||||||||||
|
Repurchases of common stock
|
—
|
|
—
|
|
(15
|
)
|
(949
|
)
|
—
|
|
—
|
|
—
|
|
—
|
|
(949
|
)
|
—
|
|
|||||||||||||||||
|
Payments relating to treasury shares
|
—
|
|
—
|
|
(1
|
)
|
(88
|
)
|
—
|
|
—
|
|
—
|
|
—
|
|
(88
|
)
|
—
|
|
|||||||||||||||||
|
Stock-based compensation
|
—
|
|
—
|
|
—
|
|
—
|
|
152
|
|
—
|
|
—
|
|
—
|
|
152
|
|
—
|
|
|||||||||||||||||
|
Issuance of restricted stock
|
4
|
|
—
|
|
—
|
|
1
|
|
(1
|
)
|
—
|
|
—
|
|
—
|
|
—
|
|
—
|
|
|||||||||||||||||
|
Acquisition of non-controlling interest
|
—
|
|
—
|
|
—
|
|
—
|
|
(82
|
)
|
—
|
|
—
|
|
(10
|
)
|
(92
|
)
|
—
|
|
|||||||||||||||||
|
Distributions of profits
|
—
|
|
—
|
|
—
|
|
—
|
|
—
|
|
—
|
|
—
|
|
(26
|
)
|
(26
|
)
|
—
|
|
|||||||||||||||||
|
Dividends paid to stockholders
|
—
|
|
—
|
|
—
|
|
—
|
|
—
|
|
(476
|
)
|
—
|
|
—
|
|
(476
|
)
|
—
|
|
|||||||||||||||||
|
Acquisition of redeemable non-controlling interest
|
—
|
|
—
|
|
—
|
|
—
|
|
—
|
|
(2
|
)
|
—
|
|
—
|
|
(2
|
)
|
(37
|
)
|
|||||||||||||||||
|
Net income attributable to non-controlling interest
|
—
|
|
—
|
|
—
|
|
—
|
|
—
|
|
(28
|
)
|
—
|
|
27
|
|
(1
|
)
|
1
|
|
|||||||||||||||||
|
Net income
|
—
|
|
—
|
|
—
|
|
—
|
|
—
|
|
2,554
|
|
—
|
|
—
|
|
2,554
|
|
—
|
|
|||||||||||||||||
|
Balance, as of December 31, 2017
|
600
|
|
6
|
|
(17
|
)
|
(1,076
|
)
|
11,392
|
|
6,858
|
|
(223
|
)
|
28
|
|
16,985
|
|
—
|
|
|||||||||||||||||
|
Other comprehensive loss
|
—
|
|
—
|
|
—
|
|
—
|
|
—
|
|
—
|
|
(51
|
)
|
—
|
|
(51
|
)
|
—
|
|
|||||||||||||||||
|
Exercise of common stock options
|
—
|
|
—
|
|
—
|
|
—
|
|
19
|
|
—
|
|
—
|
|
—
|
|
19
|
|
—
|
|
|||||||||||||||||
|
Repurchases of common stock
|
—
|
|
—
|
|
(14
|
)
|
(1,059
|
)
|
—
|
|
—
|
|
—
|
|
—
|
|
(1,059
|
)
|
—
|
|
|||||||||||||||||
|
Payments relating to treasury shares
|
—
|
|
—
|
|
(1
|
)
|
(78
|
)
|
—
|
|
—
|
|
—
|
|
—
|
|
(78
|
)
|
—
|
|
|||||||||||||||||
|
Stock-based compensation
|
—
|
|
—
|
|
—
|
|
—
|
|
107
|
|
—
|
|
—
|
|
—
|
|
107
|
|
—
|
|
|||||||||||||||||
|
Issuance of restricted stock
|
3
|
|
—
|
|
—
|
|
—
|
|
—
|
|
—
|
|
—
|
|
—
|
|
—
|
|
—
|
|
|||||||||||||||||
|
Acquisition of non-controlling interest
|
—
|
|
—
|
|
—
|
|
—
|
|
(23
|
)
|
—
|
|
—
|
|
(2
|
)
|
(25
|
)
|
—
|
|
|||||||||||||||||
|
Distributions of profits
|
—
|
|
—
|
|
—
|
|
—
|
|
—
|
|
—
|
|
—
|
|
(28
|
)
|
(28
|
)
|
—
|
|
|||||||||||||||||
|
Dividends paid to stockholders
|
—
|
|
—
|
|
—
|
|
—
|
|
—
|
|
(417
|
)
|
—
|
|
—
|
|
(417
|
)
|
—
|
|
|||||||||||||||||
|
Net income attributable to non-controlling interest
|
—
|
|
—
|
|
—
|
|
—
|
|
—
|
|
(24
|
)
|
—
|
|
24
|
|
—
|
|
—
|
|
|||||||||||||||||
|
Net income
|
—
|
|
—
|
|
—
|
|
—
|
|
—
|
|
1,401
|
|
—
|
|
—
|
|
1,401
|
|
—
|
|
|||||||||||||||||
|
Balance, as of September 30, 2018
|
603
|
|
$
|
6
|
|
(32
|
)
|
$
|
(2,213
|
)
|
$
|
11,495
|
|
$
|
7,818
|
|
$
|
(274
|
)
|
$
|
22
|
|
$
|
16,854
|
|
$
|
—
|
|
|||||||||
|
As of
|
As of
|
||||||
|
September 30, 2018
|
December 31, 2017
|
||||||
|
Accumulated other comprehensive loss was as follows:
|
|||||||
|
Foreign currency translation adjustments
|
$
|
(187
|
)
|
$
|
(136
|
)
|
|
|
Comprehensive income from equity method investment
|
2
|
|
2
|
|
|||
|
Employee benefit plans adjustments
|
(89
|
)
|
(89
|
)
|
|||
|
Accumulated other comprehensive loss
|
$
|
(274
|
)
|
$
|
(223
|
)
|
|
See accompanying notes.
6
Intercontinental Exchange, Inc. and Subsidiaries
(In millions)
(Unaudited)
|
Nine Months Ended
September 30, |
|||||||
|
2018
|
2017
|
||||||
|
Operating activities:
|
|||||||
|
Net income
|
$
|
1,401
|
|
$
|
1,315
|
|
|
|
Adjustments to reconcile net income to net cash provided by operating activities:
|
|||||||
|
Depreciation and amortization
|
429
|
|
404
|
|
|||
|
Stock-based compensation
|
93
|
|
102
|
|
|||
|
Deferred taxes
|
(2
|
)
|
58
|
|
|||
|
Cetip realized investment gain, net
|
—
|
|
(114
|
)
|
|||
|
Other
|
(11
|
)
|
(13
|
)
|
|||
|
Changes in assets and liabilities:
|
|||||||
|
Customer accounts receivable
|
(119
|
)
|
(153
|
)
|
|||
|
Other current and non-current assets
|
(24
|
)
|
(29
|
)
|
|||
|
Section 31 fees payable
|
(117
|
)
|
(99
|
)
|
|||
|
Deferred revenue
|
124
|
|
129
|
|
|||
|
Other current and non-current liabilities
|
(39
|
)
|
(190
|
)
|
|||
|
Total adjustments
|
334
|
|
95
|
|
|||
|
Net cash provided by operating activities
|
1,735
|
|
1,410
|
|
|||
|
Investing activities:
|
|||||||
|
Capital expenditures
|
(49
|
)
|
(136
|
)
|
|||
|
Capitalized software development costs
|
(112
|
)
|
(104
|
)
|
|||
|
Proceeds from sale of Cetip, net
|
—
|
|
438
|
|
|||
|
Cash paid for acquisitions, net of cash received for divestiture
|
(1,151
|
)
|
9
|
|
|||
|
Purchases of investments
|
(305
|
)
|
—
|
|
|||
|
Net cash provided by (used in) investing activities
|
(1,617
|
)
|
207
|
|
|||
|
Financing activities:
|
|||||||
|
Proceeds from debt facilities
|
2,213
|
|
985
|
|
|||
|
Repayments of debt facilities
|
(600
|
)
|
(850
|
)
|
|||
|
Repayments of commercial paper, net
|
(35
|
)
|
(445
|
)
|
|||
|
Repurchases of common stock
|
(1,059
|
)
|
(709
|
)
|
|||
|
Dividends to stockholders
|
(417
|
)
|
(358
|
)
|
|||
|
Payments relating to treasury shares received for restricted stock tax payments and stock option exercises
|
(78
|
)
|
(85
|
)
|
|||
|
Acquisition of non-controlling interest and redeemable non-controlling interest
|
(35
|
)
|
(55
|
)
|
|||
|
Other
|
(8
|
)
|
(17
|
)
|
|||
|
Net cash used in financing activities
|
(19
|
)
|
(1,534
|
)
|
|||
|
Effect of exchange rate changes on cash, cash equivalents and restricted cash and cash equivalents
|
(5
|
)
|
9
|
|
|||
|
Net increase in cash, cash equivalents, and restricted cash and cash equivalents
|
94
|
|
92
|
|
|||
|
Cash, cash equivalents, and restricted cash and cash equivalents, beginning of period
|
1,568
|
|
1,350
|
|
|||
|
Cash, cash equivalents, and restricted cash and cash equivalents, end of period
|
$
|
1,662
|
|
$
|
1,442
|
|
|
|
Supplemental cash flow disclosure:
|
|||||||
|
Cash paid for income taxes
|
$
|
424
|
|
$
|
511
|
|
|
|
Cash paid for interest
|
$
|
136
|
|
$
|
99
|
|
|
See accompanying notes.
7
Intercontinental Exchange, Inc. and Subsidiaries
Notes to Consolidated Financial Statements
(Unaudited)
|
1.
|
Description of Business
|
We are a leading global operator of regulated exchanges, clearing houses and listings venues, and a provider of data services for commodity, fixed income and equity markets. We operate regulated marketplaces for listing, trading and clearing a broad array of derivatives and securities contracts across all major asset classes, including energy and agricultural commodities, interest rates, equities, equity derivatives, exchange-traded funds, or ETFs, credit derivatives, bonds and currencies. We also offer end-to-end data services and solutions to support the trading, investment, risk management and connectivity needs of customers around the world across all major asset classes.
Our exchanges include derivative exchanges in the United States, or U.S., United Kingdom, or U.K., European Union, or EU, Canada and Singapore, and cash equities, equity options and bond exchanges in the U.S. We also operate over-the-counter, or OTC, markets for physical energy, fixed income and credit default swaps, or CDS, trade execution. To serve global derivatives markets, we operate central counterparty clearing houses, or CCPs, in the U.S., U.K., EU, Canada and Singapore (Note 10). We offer a range of data services for global financial and commodity markets, including pricing and reference data, exchange data, analytics, feeds, index services, desktops and connectivity solutions. Through our markets, clearing houses, listings and data services, we provide end-to-end solutions for our customers through liquid markets, benchmark products, access to capital markets, and related services to support their ability to manage risk and raise capital. Our business is currently conducted as
two
reportable business segments, our Trading and Clearing segment and our Data and Listings segment, and the majority of our identifiable assets are located in the U.S., U.K. and Canada (Note 13).
2. Summary of Significant Accounting Policies
Basis of Presentation
The accompanying unaudited consolidated financial statements have been prepared by us in accordance with U.S. generally accepted accounting principles, or U.S. GAAP, pursuant to the rules and regulations of the Securities and Exchange Commission, or SEC, regarding interim financial reporting. Accordingly, the unaudited consolidated financial statements do not include all of the information and footnotes required by U.S. GAAP for complete financial statements and should be read in conjunction with our audited consolidated financial statements and related notes thereto for the year ended
December 31, 2017
. The accompanying unaudited consolidated financial statements reflect all adjustments that are, in our opinion, necessary for a fair presentation of results for the interim periods presented. We believe that these adjustments are of a normal recurring nature.
Preparing financial statements requires us to make certain estimates and assumptions that affect the amounts that are reported in the consolidated financial statements and accompanying disclosures. Actual results may be different from these estimates. The results of operations for the
nine and three months ended
September 30, 2018
are not necessarily indicative of the results to be expected for any future period or the full fiscal year.
The accompanying unaudited consolidated financial statements include our accounts and those of our wholly-owned and controlled subsidiaries. All intercompany balances and transactions between us and our wholly-owned and controlled subsidiaries have been eliminated in the consolidation. For those consolidated subsidiaries in which our ownership is less than 100% and for which we have control over the assets and liabilities and the management of the entity, the outside stockholders’ interests are shown as non-controlling interests.
Reclassifications
Certain prior period amounts have been reclassified to conform to the current period’s financial statement presentation. See
"Recently Adopted Accounting Pronouncements"
below for a discussion of our adoption of new accounting standards.
Recently Adopted Accounting Pronouncements
On January 1, 2018, we adopted Accounting Standards Codification, or ASC, Topic 606,
Revenue from Contracts with Customers
, and ASC 340-40,
Other Assets and Deferred Costs - Contracts with Customers
, collectively referred to as ASC 606. ASC 606 provides guidance outlining a single comprehensive model for entities to use in accounting for revenue arising from contracts with customers. ASC 606 superseded most revenue recognition guidance and requires us to recognize revenue when we transfer promised goods or services to customers in an amount that reflects the consideration to which the entity expects to be entitled in exchange for those goods or services. ASC 606 requires enhanced disclosures, including (i) revenue recognition policies used to identify performance obligations to customers and (ii) the use of significant judgments in measurement and recognition. We adopted ASC 606 retrospectively and restated each prior period presented to reflect our adoption thereof. The impacts of our
8
adoption of ASC 606 on our results for the years ended December 31, 2017, 2016 and 2015, respectively, were disclosed in our 2017 Form 10-K.
The adoption of ASC 606 accelerated the timing of recognition of a portion of original listing fees related to our New York Stock Exchange, or NYSE, businesses. In addition, and to a lesser extent, the adoption decelerated the timing of recognition of a portion of clearing fee revenues. Revenue recognition related to all other trading, clearing and data businesses remains unchanged.
Our adoption of ASC 606 had the following impact on our reported results for the prior periods presented, driven primarily by the accelerated recognition of listings fee revenue in our NYSE businesses (in millions, except earnings per share):
|
|
As Reported
|
New Revenue Standard Adjustment
|
As Adjusted
|
||||||||
|
Nine months ended September 30, 2017
|
|||||||||||
|
Total revenues
|
$
|
4,395
|
|
$
|
7
|
|
$
|
4,402
|
|
||
|
Total revenues, less transaction-based expenses
|
3,485
|
|
7
|
|
3,492
|
|
|||||
|
Income tax expense
|
537
|
|
3
|
|
540
|
|
|||||
|
Net income attributable to Intercontinental Exchange, Inc.
|
1,289
|
|
4
|
|
1,293
|
|
|||||
|
Basic earnings per share
|
$
|
2.18
|
|
$
|
0.01
|
|
$
|
2.19
|
|
||
|
Diluted earnings per share
|
$
|
2.17
|
|
$
|
—
|
|
$
|
2.17
|
|
||
|
|
As Reported
|
New Revenue Standard Adjustment
|
As Adjusted
|
||||||||
|
Three months ended September 30, 2017
|
|||||||||||
|
Total revenues
|
$
|
1,432
|
|
$
|
3
|
|
$
|
1,435
|
|
||
|
Total revenues, less transaction-based expenses
|
1,143
|
|
3
|
|
1,146
|
|
|||||
|
Income tax expense
|
185
|
|
1
|
|
186
|
|
|||||
|
Net income attributable to Intercontinental Exchange, Inc.
|
369
|
|
2
|
|
371
|
|
|||||
|
Basic earnings per share
|
$
|
0.63
|
|
$
|
—
|
|
$
|
0.63
|
|
||
|
Diluted earnings per share
|
$
|
0.62
|
|
$
|
0.01
|
|
$
|
0.63
|
|
||
|
|
As Reported
|
New Revenue Standard Adjustment
|
As Adjusted
|
||||||||
|
As of December 31, 2017
|
|||||||||||
|
Deferred revenue, current
|
$
|
121
|
|
$
|
4
|
|
$
|
125
|
|
||
|
Deferred revenue, non-current
|
143
|
|
(52
|
)
|
91
|
|
|||||
|
Net deferred tax liabilities
|
2,280
|
|
15
|
|
2,295
|
|
|||||
|
Retained earnings
|
6,825
|
|
33
|
|
6,858
|
|
|||||
Additional disclosures related to our adoption of ASC 606 are provided in Note 4.
The Financial Accounting Standards Board, or FASB, has issued Accounting Standards Update, or ASU, No. 2017-07,
Compensation-Retirement Benefits (Topic 715): Improving the Presentation of Net Periodic Pension Cost and Net Periodic Postretirement Benefit Cost,
or ASU 2017-07. The amendments in ASU 2017-07 require that an employer disaggregate the service cost component from the other components of net benefit cost. The amendments also provide explicit guidance on how to present the service cost component in the same line item as other related compensation costs, and the other components of net benefit cost in the income statement outside of operating income. The guidance only allows the service cost component of net benefit cost to be eligible for capitalization. We adopted ASU 2017-07 on January 1, 2018 and applied it retrospectively to each prior period presented. We have a pension plan, a U.S. nonqualified supplemental executive retirement plan, and post-retirement defined benefit plans that are all impacted by the guidance. Each of the foregoing plans are frozen and do not have a service cost component, which means the expense or benefit recognized under each plan represents other components of net benefit cost as defined in the guidance. The combined net periodic (expense) benefit of these plans was (
$6 million
) and
$6 million
for the nine months ended September 30, 2018 and 2017, respectively, and ($
2 million
) and
$2 million
for the three months ended September 30, 2018 and 2017, respectively, and was previously reported as an adjustment to compensation and benefits expenses in the accompanying consolidated statements of income. Following our adoption of ASU 2017-07, these amounts were reclassified to be
9
included in other income, net, in the accompanying consolidated statements of income, and these adjustments had no impact on net income.
The FASB has issued ASU No. 2016-01,
Financial Instruments - Overall (Subtopic 825-10): Recognition and Measurement of Financial Assets and Financial Liabilities,
or ASU 2016-01. ASU 2016-01 provides updated guidance for the recognition, measurement, presentation, and disclosure of certain financial assets and liabilities, including the requirement that equity investments (except (i) those accounted for under the equity method of accounting or (ii) those that result in consolidation of the investee) are to be measured at fair value with changes in fair value recognized in net income. We adopted ASU 2016-01 on January 1, 2018. Our equity investments, including our investments in Euroclear plc, or Euroclear (Note 3), and Coinbase Global, Inc., or Coinbase, among others, are now subject to valuation under ASU 2016-01. These investments do not currently have readily determinable fair market values as they are not publicly-listed companies. ASU 2016-01 permits a policy election to only adjust the fair value of such investments if and when there is an observable price change in an orderly transaction of a similar or identical investment occurring after adoption, with any change in fair value recognized in net income. We have made this policy election for all of our equity investments without readily determinable fair values, and our adoption of ASU 2016-01 did not result in any fair value adjustments as of September 30, 2018.
In December 2017, the SEC staff issued Staff Accounting Bulletin No. 118, or SAB 118, which provided guidance for companies that have not completed their accounting for the income tax effects of the Tax Cuts and Jobs Act of 2017, or TCJA, in the period of enactment, allowing for a measurement period of up to one year after the enactment date to finalize the recording of the related tax impacts. We are applying the guidance in SAB 118 when accounting for the enactment-date effects of the TCJA. As of September 30, 2018, our estimates recorded as of December 31, 2017 for the tax effects of the TCJA, are not final. Our estimates recorded as of December 31, 2017 and as of September 30, 2018 may be affected due to changes in interpretations of the legislation, changes in accounting standards or related interpretations in response to the TCJA. We have also made reasonable estimates of the TCJA’s impact on state income tax. Our estimates are based on the best available information as of September 30, 2018 and our interpretation of the TCJA and related state tax implications as currently enacted. Our estimates do not include any potential federal or state administrative and/or legislative adjustments to certain provisions of the TCJA and related state provisions. We will continue to analyze the TCJA in order to finalize related federal and state impacts within the measurement period.
In January 2018, the FASB staff issued Question & Answer Topic 740, No. 5,
Accounting for Global Intangible Low-Taxed Income
, stating that a company may either elect to treat taxes due on future inclusions of its non-U.S. income in its U.S. taxable income under the newly enacted Global Intangible Low-Taxed Income provisions as a current period expense when incurred, or factor them into the company’s measurement of its deferred taxes. As of September 30, 2018, we have completed our analysis of the two different accounting policies and have made an election to recognize such taxes as a current period expense when incurred.
In the fourth quarter of 2017, we adopted ASU 2016-18,
Statement of Cash Flows: Restricted Cash
, or ASU 2016-18, which requires us to show the changes in the total of cash, cash equivalents and restricted cash and cash equivalents in the statement of cash flows. As a result, we no longer present transfers between cash, cash equivalents and restricted cash and cash equivalents in the statement of cash flows. We have reclassified changes in restricted cash from cash flows provided by (used in) investing activities, to the total change in beginning and end-of-period balances. Our statements of cash flows for the nine months ended September 30, 2018 and 2017 reflect this change.
Accounting Pronouncements Not Yet Adopted
The FASB has issued ASU No. 2016-02,
Leases,
or ASU 2016-02.
ASU 2016-02 requires an entity to recognize both assets and liabilities arising from finance and operating leases, along with additional qualitative and quantitative disclosures. It requires a lessee to recognize a liability in its balance sheet to make lease payments (the lease liability) and a right-of-use asset representing its right to use the underlying asset for the lease term. In transition, lessees and lessors are required to recognize and measure leases at the beginning of the earliest period presented using a modified retrospective approach. ASU 2016-02 is required to be adopted at the beginning of our first quarter of fiscal year 2019, with early adoption permitted. We do not expect to adopt ASU 2016-02 early and we expect to record a material right-of-use asset and offsetting lease liability on our adoption date of January 1, 2019, primarily related to our leased office space and data center facilities. We expect that we will elect the alternative transition approach allowed under ASU 2016-02, under which we will record a cumulative effect adjustment to retained earnings on January 1, 2019, and will not restate prior periods. We expect to implement new accounting policies as well as to elect certain practical expedients available to us under ASU 2016-02, including those related to capitalization thresholds, leases with terms of less than 12-months and our application of discount rates. We are continuing to evaluate this guidance to determine the actual impact on our consolidated financial statements. Our implementation of the amended lease guidance is subject to the same internal controls over financial reporting that we apply to our consolidated financial statements.
10
The FASB has issued ASU No. 2016-13,
Financial Instruments - Measurement of Credit Losses on Financial Instruments,
or ASU 2016-13. ASU 2016-13 applies to all financial instruments carried at amortized cost including held-to-maturity debt securities as well as trade receivables. ASU 2016-13 requires financial assets carried at amortized cost to be presented at the net amount expected to be collected and available-for-sale debt securities to record credit losses through an allowance for credit losses. ASU 2016-13 is required to be adopted at the beginning of our first quarter of fiscal year 2020, with early adoption permitted. We do not expect to adopt ASU 2016-13 early and we are currently evaluating this guidance to determine the potential impact on our consolidated financial statements.
The FASB has issued ASU No. 2018-02,
Reclassification of Certain Tax Effects from Accumulative Other Comprehensive Income,
or ASU 2018-02. ASU 2018-02 gives entities the option to reclassify certain tax effects related to items in accumulated other comprehensive income, or OCI, that have been stranded in OCI as a result of the enactment of the TCJA to retained earnings. The guidance is effective for fiscal years beginning after December 15, 2018 with early adoption permitted. As of September 30, 2018 we have not adopted ASU 2018-02 early and we currently expect our adoption of ASU 2018-02 to result in a balance sheet reclassification from OCI to retained earnings of approximately
$26 million
. We are continuing to evaluate this guidance to determine the final impact on our consolidated financial statements.
|
3.
|
Acquisitions and Investments
|
Acquisitions
On January 2, 2018, we acquired BondPoint from Virtu Financial, Inc. for
$400 million
in cash. BondPoint is a provider of electronic fixed income trading solutions for the buy-side and sell-side, offering access to centralized liquidity and automated trade execution services through its alternative trading system, or ATS, and provides trading services to more than
500
financial services firms. BondPoint is primarily included in our Trading and Clearing segment. The BondPoint purchase price was allocated to the preliminary net tangible and identifiable intangible assets and liabilities based on their estimated fair values as of January 2, 2018. The identifiable intangible assets acquired were
$130 million
and included (i) customer relationships of
$123 million
, which have been assigned a useful life of
15
years, and (ii) developed technology of
$7 million
, which has been assigned a life of
three
years. The excess of the purchase price over the preliminary net tangible and identifiable intangible assets was
$267 million
and was recorded as goodwill.
On July 18, 2018, we acquired CHX Holdings, Inc., the parent company of the Chicago Stock Exchange, or CHX, a full-service stock exchange, including trading, data and corporate listings services. CHX operates as a registered national securities exchange, and is primarily included in our Trading and Clearing segment.
On July 23, 2018, we acquired TMC Bonds, LLC, or TMC Bonds, for
$701 million
in cash. The cash consideration is gross of
$14 million
cash held by TMC Bonds on the date of acquisition. TMC Bonds is an electronic fixed income marketplace, supporting anonymous trading across multiple protocols in various asset classes, including municipals, corporates, treasuries, agencies and certificates of deposit. TMC Bonds is primarily included in our Trading and Clearing segment. The purchase price of TMC Bonds was allocated to the preliminary net tangible and identifiable intangible assets and liabilities based on their estimated fair values as of July 23, 2018. The identifiable intangible assets acquired were
$261 million
and primarily included (i) customer relationships of
$253 million
, which have been assigned a useful life of
15
years, and (ii) developed technology of
$7 million
, which has been assigned a useful life of
three
years. The excess of the purchase price over the preliminary net tangible and identifiable intangible assets was
$423 million
and was recorded as goodwill.
On July 20, 2018, we exercised our option to purchase all of the remaining equity interests of MERSCORP Holdings, Inc., owner of Mortgage Electronic Registrations Systems, Inc., or collectively, MERS, as a result of satisfying our deliverables under the software development agreement to rebuild the MERS® System to benefit the U.S. residential mortgage finance market. As of September 30, 2018, we owned a majority stake in MERS, which we treated as an equity investment since we did not have the ability to control the operations of MERS. On October 3, 2018, we completed the purchase of all remaining interests and accordingly, own
100%
of MERS. On that date, we gained control of MERS and began to include MERS's results as part of our consolidated operations. In connection with the purchase and upon consolidation, we expect to record a
$110 million
gain on our initial investment value, which would be included in other non-operating income on October 3, 2018. MERS is included in our Trading and Clearing segment.
Investment in Euroclear
During the year ended December 31, 2017, we purchased a
4.7%
stake in Euroclear valued at
€276 million
(
$327 million
). Upon purchasing this stake, we agreed to participate on the Euroclear Board of Directors. During the same period, we negotiated an additional purchase which closed on February 21, 2018 following regulatory approval. This provided us with an additional
5.1%
stake in Euroclear for a purchase price of
€246 million
in cash (
$304 million
). As of
September 30, 2018
, we owned a
9.8%
stake in
11
Euroclear for a total investment of
$631 million
. Euroclear is a provider of post-trade services, including settlement, central securities depositories and related services for cross-border transactions across asset classes.
We classify our investment in Euroclear as an equity investment included in other non-current assets in the accompanying consolidated balance sheets. As discussed in Note 2, we adopted ASU 2016-01 on January 1, 2018. Under ASU 2016-01, for equity investments without a readily determinable fair value, we may elect to measure them at cost, less any impairment, plus or minus changes resulting from observable price changes in orderly transactions in similar or identical investments. We have elected to use this approach to estimate the value of the Euroclear investment. During the
nine and three months ended
September 30, 2018
, there were no downward or upward adjustments made to the carrying amount of our investment in Euroclear.
Purchase of Non-Controlling Interest
For consolidated subsidiaries in which our ownership is less than 100% and for which we have control over the assets, liabilities and management of the entity, the outside stockholders’ interests are shown as non-controlling interest in our consolidated financial statements. As of December 31, 2017, non-controlling interest consisted of the operating results of our CDS clearing subsidiaries in which non-ICE limited partners held a
29.9%
ownership interest. During September 2018, we purchased
3.2%
of the ownership interest from a non-ICE limited partner and the remaining non-ICE limited partners hold a
26.7%
ownership interest as of September 30, 2018.
|
4.
|
Revenue Recognition
|
We adopted ASC 606 on January 1, 2018 on a full retrospective basis and have restated the prior reporting periods presented as if ASC 606 had always been applied (Note 2). Our adoption of ASC 606 did not have a material impact on the measurement or recognition of revenue in any prior or current reporting periods. Our adoption of ASC 606 was subject to the same internal controls over financial reporting that we apply to our consolidated financial statements.
Substantially all of our revenues are considered to be revenues from contracts with customers. The related accounts receivable balances are recorded in our balance sheets as customer accounts receivable. We do not have obligations for warranties, returns or refunds to customers, other than the rebates discussed below, which are settled each period and therefore do not result in variable consideration. We do not have significant revenue recognized from performance obligations that were satisfied in prior periods and we do not have any transaction price allocated to unsatisfied performance obligations other than in our deferred revenue. Deferred revenue represents our contract liabilities related to our annual, original and other listings revenues as well as certain data services, clearing services and other revenues. Deferred revenue is the only significant contract asset or liability impacted by our adoption of ASC 606. See Note 6 for our discussion of deferred revenue balances, activity, and expected timing of recognition. As permitted by ASC 606, we have elected not to provide disclosures about transaction price allocated to unsatisfied performance obligations if contract durations are less than one year, or if we are not required to estimate the transaction price. For all of our contracts with customers, except for listings and certain data and clearing services, our performance obligations are short-term in nature and there is no significant variable consideration. See the bullets below for further descriptions of our revenue contracts. In addition, we have elected the practical expedient of excluding sales taxes from transaction prices. We have assessed the costs incurred to obtain or fulfill a contract with a customer and determined them to be immaterial.
Certain judgments and estimates were used in the identification and timing of satisfaction of performance obligations and the related allocation of transaction price. We believe that these represent a faithful depiction of the transfer of services to our customers.
Our primary revenue contract classifications are described below. Although we discuss additional revenue details in our “Management’s Discussion and Analysis of Financial Condition and Results of Operations,” the categories below best represent those that depict similar economic characteristics of the nature, amount, timing and uncertainty of our revenues and cash flows.
|
•
|
Transaction and clearing, net
- Transaction and clearing revenues represent fees charged for the performance obligations of derivatives trading and clearing, and from our cash trading, equity options and fixed income exchanges. The derivatives trading and clearing fees contain
two
performance obligations: (1) trade execution/clearing novation and (2) risk management of open interest. We allocate the transaction price between these
two
performance obligations; however, both of these generally occur almost simultaneously and no significant deferral results. The impact of our adoption of ASC 606 on our performance obligations in our clearing business was minimal. Cash trading, equity options and fixed income fees contain
one
performance obligation related to trade execution which occurs instantaneously. Our transaction and clearing revenues are reported net of rebates, except for the NYSE transaction-based expenses. Transaction and clearing fees can be variable based on trade volume discounts used in the determination of rebates; however, virtually all volume discounts are calculated and recorded on a monthly basis. Transaction and clearing fees, as well as any volume discounts rebated to our customers, are calculated and billed monthly in accordance with our published fee schedules. We make liquidity payments to certain customers in our NYSE businesses and recognize those payments as a cost of revenue. In addition, we pay NYSE regulatory
|
12
oversight fees to the SEC and collect equal amounts from our customers. These are also considered a cost of revenue, and both of these NYSE-related fees are included in transaction-based expenses. Transaction and clearing revenues and the related transaction-based expenses are all recognized in our Trading and Clearing segment.
|
•
|
Data services
- Data service revenues
represent the following:
|
|
◦
|
Pricing and analytics services consist of an extensive set of independent continuous and end-of-day evaluated pricing services focused primarily on fixed income and international equity securities, valuation services, reference data, index services and multi-asset class portfolio and risk management analytics.
|
|
◦
|
Desktops and connectivity services comprise hosting, colocation, infrastructure, technology-based information platforms, workstations, feeds and connectivity solutions through the ICE Global Network.
|
|
◦
|
Exchange data services represent subscription fees for the provision of our market data that is created from activity in our Trading and Clearing segment.
|
The nature and timing of each contract type for the data services above are similar in nature. Data services revenues are primarily subscription-based, billed monthly, quarterly or annually in advance and recognized ratably over time as our performance obligations of data delivery are met consistently throughout the period. Because these contracts primarily consist of single performance obligations with fixed prices, there is no variable consideration and no need to allocate the transaction price. In certain of our data contracts, where third parties are involved, we arrange for the third party to transfer the services to our customers. In these arrangements we are acting as an agent and revenue is recorded net. All data services fees are recognized in our Data and Listings segment.
|
•
|
Listings -
Listings revenues include original and annual listing fees, and other corporate action fees. Under ASC 606, each distinct listing fee is allocated to multiple performance obligations including original and incremental listing and investor relations services, as well as a customer’s material right to renew the option to list on our exchanges. In performing this allocation, the standalone selling price of the listing services is based on the original and annual listing fees and the standalone selling price of the investor relations services is based on its market value. All listings fees are billed upfront and the identified performance obligations are satisfied over time. Upon our adoption of the ASC 606 framework, the amount of revenue related to the investor relations performance obligation is recognized ratably over a
two
-year period, with the remaining revenue recognized ratably over time as customers continue to list on our exchanges, which is generally estimated to be over a period of up to
nine
years for NYSE and up to
five
years for NYSE Arca and NYSE American. Listings fees related to other corporate actions are considered contract modifications of our listing contracts and are recognized ratably over time as customers continue to list on our exchanges, which is generally estimated to be a period of
six
years for NYSE and
three
years for NYSE Arca and NYSE American. All listings fees are recognized in our Data and Listings segment.
|
|
•
|
Other revenues -
Other revenues
primarily include interest income on certain clearing margin deposits, regulatory penalties and fines, fees for use of our facilities, regulatory fees charged to member organizations of our U.S. securities exchanges, designated market maker service fees, exchange membership fees and agricultural grading and certification fees. Generally, fees for other revenues contain one performance obligation. Because these contracts primarily consist of single performance obligations with fixed prices, there is no variable consideration and no need to allocate the transaction price. Services for other revenues are primarily satisfied at a point in time. Therefore, there is no need to allocate the fee and no deferral results as we have no further obligation to the customer at that time. Other revenues are recognized in our Trading and Clearing segment.
|
The following table depicts the disaggregation of our revenue according to business line and segment (in millions). Segment totals are consistent with the segment totals in Note 13:
13
|
|
Trading and Clearing Segment
|
Data and Listings Segment
|
Total Consolidated
|
||||||||
|
Nine months ended September 30, 2018
|
|||||||||||
|
Transaction and clearing, net
|
$
|
2,522
|
|
$
|
—
|
|
$
|
2,522
|
|
||
|
Data services
|
—
|
|
1,576
|
|
1,576
|
|
|||||
|
Listings
|
—
|
|
332
|
|
332
|
|
|||||
|
Other revenues
|
169
|
|
—
|
|
169
|
|
|||||
|
Total revenues
|
2,691
|
|
1,908
|
|
4,599
|
|
|||||
|
Transaction-based expenses
|
928
|
|
—
|
|
928
|
|
|||||
|
Total revenues, less transaction-based expenses
|
$
|
1,763
|
|
$
|
1,908
|
|
$
|
3,671
|
|
||
|
Timing of Revenue Recognition
|
|||||||||||
|
Services transferred at a point in time
|
$
|
1,507
|
|
$
|
—
|
|
$
|
1,507
|
|
||
|
Services transferred over time
|
256
|
|
1,908
|
|
2,164
|
|
|||||
|
Total revenues, less transaction-based expenses
|
$
|
1,763
|
|
$
|
1,908
|
|
$
|
3,671
|
|
||
|
|
Trading and Clearing Segment
|
Data and Listings Segment
|
Total Consolidated
|
||||||||
|
Nine months ended September 30, 2017
|
|||||||||||
|
Transaction and clearing, net
|
$
|
2,373
|
|
$
|
—
|
|
$
|
2,373
|
|
||
|
Data services
|
—
|
|
1,559
|
|
1,559
|
|
|||||
|
Listings
|
—
|
|
322
|
|
322
|
|
|||||
|
Other revenues
|
148
|
|
—
|
|
148
|
|
|||||
|
Total revenues
|
2,521
|
|
1,881
|
|
4,402
|
|
|||||
|
Transaction-based expenses
|
910
|
|
—
|
|
910
|
|
|||||
|
Total revenues, less transaction-based expenses
|
$
|
1,611
|
|
$
|
1,881
|
|
$
|
3,492
|
|
||
|
Timing of Revenue Recognition
|
|||||||||||
|
Services transferred at a point in time
|
$
|
1,373
|
|
$
|
—
|
|
$
|
1,373
|
|
||
|
Services transferred over time
|
238
|
|
1,881
|
|
2,119
|
|
|||||
|
Total revenues, less transaction-based expenses
|
$
|
1,611
|
|
$
|
1,881
|
|
$
|
3,492
|
|
||
|
|
Trading and Clearing Segment
|
Data and Listings Segment
|
Total Consolidated
|
||||||||
|
Three months ended September 30, 2018
|
|||||||||||
|
Transaction and clearing, net
|
$
|
760
|
|
$
|
—
|
|
$
|
760
|
|
||
|
Data services
|
—
|
|
530
|
|
530
|
|
|||||
|
Listings
|
—
|
|
112
|
|
112
|
|
|||||
|
Other revenues
|
61
|
|
—
|
|
61
|
|
|||||
|
Total revenues
|
821
|
|
642
|
|
1,463
|
|
|||||
|
Transaction-based expenses
|
263
|
|
—
|
|
263
|
|
|||||
|
Total revenues, less transaction-based expenses
|
$
|
558
|
|
$
|
642
|
|
$
|
1,200
|
|
||
|
Timing of Revenue Recognition
|
|||||||||||
|
Services transferred at a point in time
|
$
|
477
|
|
$
|
—
|
|
$
|
477
|
|
||
|
Services transferred over time
|
81
|
|
642
|
|
723
|
|
|||||
|
Total revenues, less transaction-based expenses
|
$
|
558
|
|
$
|
642
|
|
$
|
1,200
|
|
||
14
|
|
Trading and Clearing Segment
|
Data and Listings Segment
|
Total Consolidated
|
||||||||
|
Three months ended September 30, 2017
|
|||||||||||
|
Transaction and clearing, net
|
$
|
758
|
|
$
|
—
|
|
$
|
758
|
|
||
|
Data services
|
—
|
|
518
|
|
518
|
|
|||||
|
Listings
|
—
|
|
105
|
|
105
|
|
|||||
|
Other revenues
|
54
|
|
—
|
|
54
|
|
|||||
|
Total revenues
|
812
|
|
623
|
|
1,435
|
|
|||||
|
Transaction-based expenses
|
289
|
|
—
|
|
289
|
|
|||||
|
Total revenues, less transaction-based expenses
|
$
|
523
|
|
$
|
623
|
|
$
|
1,146
|
|
||
|
Timing of Revenue Recognition
|
|||||||||||
|
Services transferred at a point in time
|
$
|
445
|
|
$
|
—
|
|
$
|
445
|
|
||
|
Services transferred over time
|
78
|
|
623
|
|
701
|
|
|||||
|
Total revenues, less transaction-based expenses
|
$
|
523
|
|
$
|
623
|
|
$
|
1,146
|
|
||
The Trading and Clearing segment revenues above include
$184 million
and
$172 million
for the nine months ended September 30, 2018 and 2017, respectively, and
$56 million
and
$56 million
for the three months ended September 30, 2018 and 2017, respectively, for services transferred over time related to risk management of open interest performance obligations. A majority of these performance obligations are performed over a short period of time of
one month
or less.
|
5.
|
Goodwill and Other Intangible Assets
|
The following is a summary of the activity in the goodwill balance for the
nine months ended
September 30, 2018
(in millions):
|
Goodwill balance at December 31, 2017
|
$
|
12,216
|
|
|
Acquisitions
|
721
|
|
|
|
Foreign currency translation
|
(20
|
)
|
|
|
Other activity, net
|
17
|
|
|
|
Goodwill balance at September 30, 2018
|
$
|
12,934
|
|
The following is a summary of the activity in the other intangible assets balance for the
nine months ended
September 30, 2018
(in millions):
|
Other intangible assets balance at December 31, 2017
|
$
|
10,269
|
|
|
Acquisitions
|
435
|
|
|
|
Foreign currency translation
|
(25
|
)
|
|
|
Amortization of other intangible assets
|
(215
|
)
|
|
|
Other activity, net
|
(19
|
)
|
|
|
Other intangible assets balance at September 30, 2018
|
$
|
10,445
|
|
We completed our acquisitions of BondPoint, CHX Holdings, Inc. and TMC Bonds during the
nine months ended
September 30, 2018
(Note 3). The foreign currency translation adjustments in the tables above result from a portion of our goodwill and other intangible assets being held at our U.K., EU and Canadian subsidiaries, whose functional currencies are not the U.S. dollar. The changes in other activity, net, in the tables above primarily relate to adjustments to the fair value of the net tangible assets and intangible assets relating to the acquisitions, with a corresponding adjustment to goodwill. Amortization of other intangible assets in the table above includes an impairment charge of
$4 million
recorded during the nine months ended
September 30, 2018
on the remaining value of exchange registration intangible assets in connection with the July 2018 closure of ICE Futures Canada and ICE Clear Canada (Note 10). We did not recognize any other impairment losses on goodwill or other intangible assets during the
nine and three months ended
September 30, 2018
and
2017
.
|
6.
|
Deferred Revenue
|
Our contract liabilities, or deferred revenue, represent consideration received that is yet to be recognized as revenue. Total deferred revenue was
$339 million
as of
September 30, 2018
, including
$249 million
in current deferred revenue and
$90 million
in non-current deferred revenue. The changes in our deferred revenue during the
nine months ended
September 30, 2018
are as
15
follows (in millions), adjusted to reflect the adoption of ASC 606 as discussed in Note 2:
|
Annual Listings Revenues
|
Original Listings Revenues
|
Other Listings Revenues
|
Data Services and Other Revenues
|
Total
|
|||||||||||||||
|
Deferred revenue balance at December 31, 2017
|
$
|
—
|
|
$
|
25
|
|
$
|
98
|
|
$
|
93
|
|
$
|
216
|
|
||||
|
Additions
|
383
|
|
17
|
|
36
|
|
291
|
|
727
|
|
|||||||||
|
Amortization
|
(288
|
)
|
(17
|
)
|
(27
|
)
|
(272
|
)
|
(604
|
)
|
|||||||||
|
Deferred revenue balance at September 30, 2018
|
$
|
95
|
|
$
|
25
|
|
$
|
107
|
|
$
|
112
|
|
$
|
339
|
|
||||
The changes in our deferred revenue during the
nine months ended
September 30, 2017
are as follows (in millions), adjusted to reflect the adoption of ASC 606 as discussed in Note 2:
|
Annual Listings Revenues
|
Original Listings Revenues
|
Other Listings Revenues
|
Data Services and Other Revenues
|
Total
|
|||||||||||||||
|
Deferred revenue balance at December 31, 2016
|
$
|
—
|
|
$
|
23
|
|
$
|
83
|
|
$
|
92
|
|
$
|
198
|
|
||||
|
Additions
|
367
|
|
17
|
|
49
|
|
307
|
|
740
|
|
|||||||||
|
Amortization
|
(276
|
)
|
(15
|
)
|
(31
|
)
|
(286
|
)
|
(608
|
)
|
|||||||||
|
Divestitures
|
—
|
|
—
|
|
—
|
|
(10
|
)
|
(10
|
)
|
|||||||||
|
Deferred revenue balance at September 30, 2017
|
$
|
91
|
|
$
|
25
|
|
$
|
101
|
|
$
|
103
|
|
$
|
320
|
|
||||
Adjustments for divestitures in the table above resulted from our June 2017 divestiture of NYSE Governance Services and our March 2017 divestiture of Interactive Data Managed Solutions, or IDMS, as well as our classification of Trayport deferred revenue as held for sale during the nine months ended September 30, 2017. Included in the amortization recognized for the
nine months ended
September 30, 2018
, is
$98 million
related to the deferred revenue balance as of January 1, 2018. Included in the amortization recognized for the
nine months ended
September 30, 2017
, is
$87 million
related to the deferred revenue balance as of January 1, 2017. As of
September 30, 2018
, we estimate that our deferred revenue will be recognized in the following years (in millions):
|
Annual Listings Revenues
|
Original Listings Revenues
|
Other Listings Revenues
|
Data Services and Other Revenues
|
Total
|
|||||||||||||||
|
Remainder of 2018
|
$
|
95
|
|
$
|
8
|
|
$
|
8
|
|
$
|
68
|
|
$
|
179
|
|
||||
|
2019
|
—
|
|
15
|
|
34
|
|
39
|
|
88
|
|
|||||||||
|
2020
|
—
|
|
2
|
|
27
|
|
3
|
|
32
|
|
|||||||||
|
2021
|
—
|
|
—
|
|
19
|
|
2
|
|
21
|
|
|||||||||
|
2022
|
—
|
|
—
|
|
13
|
|
—
|
|
13
|
|
|||||||||
|
Thereafter
|
—
|
|
—
|
|
6
|
|
—
|
|
6
|
|
|||||||||
|
Total
|
$
|
95
|
|
$
|
25
|
|
$
|
107
|
|
$
|
112
|
|
$
|
339
|
|
||||
|
7.
|
|
Our total debt, including short-term and long-term debt, consisted of the following as of
September 30, 2018
and
December 31, 2017
(in millions):
16
|
As of
September 30, 2018 |
As of
December 31, 2017 |
||||||
|
Debt:
|
|||||||
|
Short-term debt:
|
|||||||
|
Commercial Paper
|
$
|
1,198
|
|
$
|
1,233
|
|
|
|
2018 Senior Notes (2.50% senior unsecured notes due October 15, 2018)
|
—
|
|
600
|
|
|||
|
Total short-term debt
|
1,198
|
|
1,833
|
|
|||
|
Long-term debt:
|
|||||||
|
2020 Senior Notes (2.75% senior unsecured notes due December 1, 2020)
|
1,245
|
|
1,244
|
|
|||
|
2022 Senior Notes (2.35% senior unsecured notes due September 15, 2022)
|
496
|
|
495
|
|
|||
|
2023 Senior Notes (3.45% senior unsecured notes due September 21, 2023)
|
397
|
|
—
|
|
|||
|
2023 Senior Notes (4.00% senior unsecured notes due October 15, 2023)
|
793
|
|
791
|
|
|||
|
2025 Senior Notes (3.75% senior unsecured notes due December 1, 2025)
|
1,243
|
|
1,242
|
|
|||
|
2027 Senior Notes (3.10% senior unsecured notes due September 15, 2027)
|
495
|
|
495
|
|
|||
|
2028 Senior Notes (3.75% senior unsecured notes due September 21, 2028)
|
591
|
|
—
|
|
|||
|
2048 Senior Notes (4.25% senior unsecured notes due September 21, 2048)
|
1,228
|
|
—
|
|
|||
|
Total long-term debt
|
6,488
|
|
4,267
|
|
|||
|
Total debt
|
$
|
7,686
|
|
$
|
6,100
|
|
|
Amended Credit Facility
We have a
$3.4 billion
senior unsecured revolving credit facility, or the Credit Facility, pursuant to a credit agreement with Wells Fargo Bank, N.A., as primary administrative agent, issuing lender and swing-line lender, Bank of America, N.A., as syndication agent, backup administrative agent and swing-line lender, and the lenders party thereto. On August 9, 2018, we agreed with the lenders to extend the final maturity date of the Credit Facility from August 18, 2022 to August 9, 2023 and make certain other changes, herein referred to as the Amended Credit Facility. We incurred debt issuance costs of
$2 million
relating to the Amended Credit Facility and these costs are included in the accompanying consolidated balance sheet as other non-current assets and will be amortized over the life of the Amended Credit Facility.
The Amended Credit Facility includes an option for us to propose an increase in the aggregate amount available for borrowing by up to
$975 million
, subject to the consent of the lenders funding the increase, and certain other conditions.
No
amounts were outstanding under the Amended Credit Facility as of
September 30, 2018
. As of
September 30, 2018
, of the
$3.4 billion
that is currently available for borrowing under the Amended Credit Facility,
$1.2 billion
is required to back-stop the amount outstanding under our Commercial Paper Program and
$105 million
is required to support certain broker-dealer subsidiary commitments.
The amount required to back-stop the amounts outstanding under the Commercial Paper Program will fluctuate as we increase or decrease our commercial paper borrowings. The remaining
$2.1 billion
available under the Amended Credit Facility as of
September 30, 2018
is available for us to use for working capital and general corporate purposes including, but not limited to, acting as a back-stop to future increases in the amounts outstanding under the Commercial Paper Program.
Commercial Paper Program
We have entered into a U.S. dollar commercial paper program, or the Commercial Paper Program. Our Commercial Paper Program is currently backed by the borrowing capacity available under the Amended Credit Facility, equal to the amount of the commercial paper that is issued and outstanding at any given point in time. The effective interest rate of commercial paper issuances does not materially differ from short-term interest rates (such as USD LIBOR). The fluctuation of these rates due to market conditions may impact our interest expense. During the
nine months ended
September 30, 2018
, we repaid a net amount of $
35 million
of outstanding Commercial Paper.
Commercial paper notes of
$1.2 billion
with original maturities ranging from
one
to
81
days were outstanding as of
September 30, 2018
under our Commercial Paper Program. As of
September 30, 2018
, the weighted average interest rate on the
$1.2 billion
outstanding under our Commercial Paper Program was
2.15%
per annum, with a weighted average maturity of
23
days.
Senior Notes
On August 13, 2018, we issued
$2.25 billion
in new aggregate senior notes. The senior notes comprise
$400 million
in aggregate principal amount of
3.45%
senior notes due in 2023, or the 2023 Senior Notes,
$600 million
in aggregate principal amount of
3.75%
senior notes due in 2028, or the 2028 Senior Notes, and
$1.25 billion
in aggregate principal amount of
4.25%
senior notes due in 2048, or the 2048 Senior Notes, and together with the 2023 Senior Notes and the 2028 Senior Notes, the Newly-Issued Senior Notes. We
17
used the net proceeds from the offering of the Newly-Issued Senior Notes for general corporate purposes, including to fund the redemption of the
$600 million
aggregate principal amount of
2.50%
Senior Notes due October 2018 and to refinance all of our issuances under our Commercial Paper Program that resulted from acquisitions and investments in the last nine months.
We incurred debt issuance costs of
$21 million
relating to the issuance of the Newly-Issued Senior Notes and they are presented in the accompanying consolidated balance sheet as a deduction from the carrying amount of the related debt liability and will be amortized over their respective lives. The Newly-Issued Senior Notes contain affirmative and negative covenants, including, but not limited to, certain redemption rights, limitations on liens and indebtedness and limitations on certain mergers, sales, dispositions and lease-back transactions.
|
8.
|
Equity
|
We currently sponsor employee and director stock option and restricted stock plans. Stock options and restricted stock are granted at the discretion of the Compensation Committee of the Board of Directors. All stock options and restricted stock awards are granted at an exercise price equal to the fair value of the common stock on the date of grant. The grant date fair value is based on the closing stock price on the date of grant. The fair value of the stock options and restricted stock on the date of grant is recognized as expense over the vesting period, net of forfeitures. The non-cash compensation expenses recognized in our consolidated statements of income for stock options and restricted stock were $
93 million
and $
102 million
for the
nine months ended September 30, 2018
and
2017
, respectively, and
$32 million
and
$34 million
for the
three months ended September 30, 2018
and
2017
, respectively.
Stock Option Plans
The following is a summary of stock option activity for the
nine months ended September 30, 2018
:
|
Number of Options
|
Weighted Average
Exercise Price per Option |
|||||
|
Outstanding at December 31, 2017
|
4,013,388
|
|
$
|
41.13
|
|
|
|
Granted
|
534,576
|
|
67.23
|
|
||
|
Exercised
|
(604,345
|
)
|
31.58
|
|
||
|
Forfeited
|
(18,340
|
)
|
55.07
|
|
||
|
Outstanding at September 30, 2018
|
3,925,279
|
|
46.09
|
|
||
Details of stock options outstanding as of
September 30, 2018
are as follows:
|
Number of Options
|
Weighted Average
Exercise Price |
Weighted Average
Remaining Contractual Life (Years) |
Aggregate
Intrinsic Value (In millions) |
|||||||||
|
Vested or expected to vest
|
3,925,279
|
|
$
|
46.09
|
|
6.4
|
$
|
113
|
|
|||
|
Exercisable
|
2,842,961
|
|
$
|
40.14
|
|
5.6
|
$
|
99
|
|
|||
The total intrinsic value of stock options exercised was $
25 million
and $
15 million
for the
nine months ended September 30, 2018
and
2017
, respectively, and
$6 million
and $
8 million
for the
three months ended September 30, 2018
and
2017
, respectively. As of
September 30, 2018
, there were
$10 million
in total unrecognized compensation costs related to stock options. These costs are expected to be recognized over a weighted average period of
1.8
years as the stock options vest.
We use the Black-Scholes option pricing model for purposes of valuing stock option awards. During the
nine months ended September 30, 2018
and
2017
, we used the weighted-average assumptions in the table below to compute the value of all options for shares of common stock granted to employees:
18
|
Nine Months Ended September 30,
|
|||||||
|
Assumptions:
|
2018
|
2017
|
|||||
|
Risk-free interest rate
|
2.67
|
%
|
1.84
|
%
|
|||
|
Expected life in years
|
6.0
|
|
5.0
|
|
|||
|
Expected volatility
|
20
|
%
|
21
|
%
|
|||
|
Expected dividend yield
|
1.43
|
%
|
1.40
|
%
|
|||
|
Estimated weighted-average fair value of options granted per share
|
$
|
14.08
|
|
$
|
10.50
|
|
|
The risk-free interest rate is based on the zero-coupon U.S. Treasury yield curve in effect at the time of grant. The expected life computation is derived from historical exercise patterns and anticipated future patterns. Expected volatilities are based on historical volatility of our stock.
Restricted Stock Plans
In February 2018, we reserved a maximum of
1,303,151
restricted shares for potential issuance as performance-based restricted shares to certain of our employees. The number of shares that will ultimately be granted under this award will be based on our actual financial performance as compared to financial performance targets set by our Board of Directors and the Compensation Committee of the Board of Directors for the year ending December 31, 2018, as well as our 2018 total stockholder return, or TSR, as compared to that of the S&P 500 Index. The maximum compensation expense to be recognized under these performance-based restricted shares is
$84 million
if the maximum financial performance target is met and all
1,303,151
shares vest. The compensation expense to be recognized under these performance-based restricted shares will be
$42 million
if the target financial performance is met, which would result in
651,576
shares vesting. We recognize expense on an accelerated basis over the
three
-year vesting period based on our quarterly assessment of the probable
2018
actual financial performance as compared to the
2018
financial performance targets. As of
September 30, 2018
, we determined that it is probable that the financial performance level will be at target for
2018
. Based on this assessment, we recorded non-cash compensation expense of $
18 million
and
$7 million
for the
nine and three months ended
September 30, 2018
, respectively, related to these shares and the remaining
$24 million
in non-cash compensation expense will be recorded on an accelerated basis over the remaining vesting period, including
$5 million
of which will be recorded over the remainder of
2018
.
The following is a summary of the non-vested restricted share activity for the
nine months ended
September 30, 2018
:
|
Number of
Restricted Stock Shares |
Weighted Average
Grant-Date Fair Value per Share |
||||
|
Non-vested at December 31, 2017
|
5,748,408
|
$
|
52.78
|
|
|
|
Granted
|
1,873,785
|
67.70
|
|
||
|
Vested
|
(2,751,637)
|
49.95
|
|
||
|
Forfeited
|
(379,218)
|
57.97
|
|
||
|
Non-vested at September 30, 2018
|
4,491,338
|
60.30
|
|
||
Restricted stock shares granted in the table above include both time-based and performance-based grants. Performance-based restricted shares have been presented to reflect the actual shares to be issued based on the achievement of past performance targets. Non-vested performance-based restricted shares granted are presented in the table above at the target number of restricted shares that would vest if the performance targets are met. As of
September 30, 2018
, there were
$148 million
in total unrecognized compensation costs related to time-based and performance-based restricted stock. These costs are expected to be recognized over a weighted-average period of
1.4
years as the restricted stock vests. These unrecognized compensation costs assume that a target performance level will be met on the performance-based restricted shares granted in February 2018. During the
nine months ended
September 30, 2018
and
2017
, the total fair value of restricted stock vested under all restricted stock plans was
$201 million
and
$199 million
, respectively.
Employee Stock Purchase Plan
In May 2018, our stockholders approved our Employee Stock Purchase Plan, or ESPP, under which we have reserved and may sell up to
25,000,000
shares of our common stock to employees. The ESPP grants participating employees the right to acquire our stock in increments of
1%
of eligible pay, with a maximum contribution of
25%
of eligible pay, subject to applicable annual Internal Revenue Service, or IRS, limitations. Under our ESPP, participating employees are limited to
$25,000
of common stock annually, and a maximum of
1,250
shares of common stock each offering period. There will be
two
offering periods each year, which will run from January 1
st
(or the first trading day thereafter) through June 30
th
(or the last trading day prior to such date) and from July 1
st
(or the first trading day thereafter) through December 31
st
(or the last trading day prior to such date). The first offering period began on July 2, 2018 and will run through December 31, 2018. The purchase price per share of common stock will be
85%
of the lesser of the fair
19
market value of the stock on the first or the last trading day of each offering period, and the price on the first day of the current trading period was
$73.73
per share. We recorded compensation expenses of
$2 million
during the three months ended
September 30, 2018
related to the
15%
discount that is given to our participating employees.
Stock Repurchase Program
In September 2017, our Board of Directors approved an aggregate of
$1.2 billion
for future repurchases of our common stock with no fixed expiration date that became effective on January 1, 2018. During the
nine months ended
September 30, 2018
, we repurchased
14,394,028
shares of our outstanding common stock at a cost of $
1.1 billion
, excluding shares withheld upon vesting of equity awards. The shares repurchased are held in treasury stock and were completed on the open market and under our Rule 10b5-1 trading plan. The timing and extent of future repurchases, if any, will depend upon many conditions. Our management periodically reviews whether to be active in repurchasing our stock. In making a determination regarding any stock repurchases, we consider multiple factors. The factors may include: overall stock market conditions, our common stock price movements, the remaining amount authorized for repurchases by our Board of Directors, the potential impact of a stock repurchase program on our corporate debt ratings, our expected free cash flow and working capital needs, our current and future planned strategic growth initiatives, and other potential uses of our cash and capital resources.
As of
September 30, 2018
, up to $
141 million
remains from the board authorization for repurchases of our common stock. In September 2018, our Board of Directors approved an aggregate of
$2.0 billion
for future repurchases of our common stock with no fixed expiration date that becomes effective January 1, 2019. We expect funding for any stock repurchases to come from our operating cash flow or borrowings under our debt facilities or our Commercial Paper Program. Repurchases may be made from time to time on the open market, through established trading plans, in privately-negotiated transactions or otherwise in accordance with all applicable securities laws, rules and regulations. We have entered into a Rule 10b5-1 trading plan, as authorized by our Board of Directors, to govern some or all of the repurchases of our shares of common stock. We may discontinue the stock repurchases at any time and may amend or terminate the Rule 10b5-1 trading plan at any time. The approval of our Board of Directors for the share repurchases does not obligate us to acquire any particular amount of our common stock. In addition, our Board of Directors may increase or decrease the amount available for repurchases from time to time.
Dividends
During the
nine months ended
September 30, 2018
and
2017
, we paid cash dividends per share of
$0.72
and
$0.60
, respectively, for an aggregate payout of
$417 million
and
$358 million
, respectively. The declaration of dividends is subject to the discretion of our Board of Directors, and may be affected by various factors, including our future earnings, financial condition, capital requirements, levels of indebtedness, credit ratings and other considerations which our Board of Directors deem relevant. Our Board of Directors has adopted a quarterly dividend declaration policy providing that the declaration of any dividends will be determined quarterly by the Board of Directors or the Audit Committee of the Board of Directors taking into account such factors as our evolving business model, prevailing business conditions and our financial results and capital requirements, without a predetermined annual net income payout ratio.
|
9.
|
Income Taxes
|
Our effective tax rate was
21%
and
29%
for the
nine months ended September 30, 2018
and
2017
, respectively, and
16%
and
33%
for the
three months ended September 30, 2018
and
2017
, respectively. The effective tax rates for the
nine and three months ended
September 30, 2018
are lower than the effective tax rates for the comparable periods in 2017 primarily due to the enactment of the TCJA on December 22, 2017, which reduced the U.S. federal corporate income tax rate from 35% to 21%, effective January 1, 2018. In addition, for the
three months ended September 30, 2018
, the effective tax rate was further reduced due to deferred tax benefits associated with the U.S. tax rate reduction resulting from changes in estimates, along with additional tax benefits associated with our sale of Trayport in 2017.
We recorded our income tax provision based on the TCJA as enacted as of
September 30, 2018
. We have also made reasonable estimates of the TCJA’s impact on state income tax. Our estimates are based on the best available information as of
September 30, 2018
and our interpretation of the TCJA and related state tax implications, as currently enacted. Our estimates do not include any potential federal or state administrative and/or legislative adjustments to certain provisions of the TCJA and related state provisions.
SAB 118 provides guidance for companies that have not completed their accounting for income tax effects of the TCJA in the period of enactment, allowing for a measurement period of up to
one
year after the enactment date to finalize the recording of the related tax impacts. As of
September 30, 2018
, we have not completed our accounting for the tax effects of the enactment of the TCJA. We will continue to analyze the TCJA in order to finalize its enactment-date effects within the measurement period.
As of
September 30, 2018
, we have adopted an accounting policy regarding the treatment of taxes due on future inclusion of non-U.S. income in U.S. taxable income under the Global Intangible Low-Taxed Income provisions as a current period expense when incurred. Therefore, no deferred tax related to these provisions has been recorded as of
September 30, 2018
.
20
|
10.
|
Clearing Organizations
|
We operate regulated CCPs for the settlement and clearance of derivative contracts. The clearing houses include ICE Clear Europe, ICE Clear Credit, ICE Clear U.S., ICE Clear Netherlands, ICE Clear Singapore and ICE NGX (referred to herein collectively as the “ICE Clearing Houses”).
We previously operated ICE Clear Canada, which performed the clearing and settlement for all futures and options contracts traded through ICE Futures Canada. On July 30, 2018, we transitioned the trading and clearing of our canola contracts from ICE Futures Canada and ICE Clear Canada to ICE Futures U.S. and ICE Clear U.S., respectively. Following the transition, ICE Futures Canada and ICE Clear Canada ceased operations.
|
•
|
ICE Clear Europe performs the clearing and settlement for all futures and options contracts traded through ICE Futures Europe and ICE Endex, for energy futures and options contracts trading through ICE Futures U.S., and for CDS contracts submitted for clearing in Europe.
|
|
•
|
ICE Clear Credit performs the clearing and settlement for CDS contracts submitted for clearing in North America.
|
|
•
|
ICE Clear U.S. performs the clearing and settlement of agricultural, metals, currencies and financial futures and options contracts traded through ICE Futures U.S.
|
|
•
|
ICE Clear Netherlands has received regulatory approval to offer clearing of Dutch equity options traded through ICE Endex.
|
|
•
|
ICE Clear Singapore performs the clearing and settlement for all futures and options contracts traded through ICE Futures Singapore.
|
|
•
|
ICE NGX performs clearing and settlement for physical North American natural gas, electricity and oil markets.
|
Each of the ICE Clearing Houses requires all clearing members or participants to maintain cash on deposit or pledge certain assets, which may include government obligations, non-government obligations, letters of credit or gold to guaranty performance of the clearing members’ or participants’ open positions. Such amounts in total are known as “original margin.” The ICE Clearing Houses may make intraday original margin calls in circumstances where market conditions require additional protection. The daily profits and losses from and to the ICE Clearing Houses due to the marking-to-market of open contracts are known as “variation margin.” With the exception of ICE NGX’s physical natural gas and physical power products, the ICE Clearing Houses mark all outstanding contracts to market, and therefore pay and collect variation margin, at least once daily and, in some cases, multiple times throughout the day. For ICE NGX’s physical natural gas and power products, ICE NGX marks all outstanding contracts to market daily, but only collects variation margin when a clearing member's or participant’s open position falls outside a specified percentage of its pledged collateral. Marking-to-market allows the ICE Clearing Houses to identify any clearing members or participants that may be unable to satisfy the financial obligations resulting from changes in the prices of their open contracts before those financial obligations become exceptionally large and jeopardize the ability of the ICE Clearing Houses to ensure financial performance of clearing members’ or participants’ open positions.
With the exception of ICE NGX, each of the ICE Clearing Houses requires that each clearing member make deposits into a fund known as a “guaranty fund,” which is maintained by the relevant ICE Clearing House. These amounts serve to secure the obligations of a clearing member to the ICE Clearing House to which it has made the guaranty fund deposit and may be used to cover losses sustained by the respective ICE Clearing House in the event of a default of a clearing member. Because it is not our policy to guaranty credit facilities of our clearing houses which maintain contingent liquidity facilities secured by high quality liquid assets, we eliminated a
$100 million
guaranty that we had previously provided ICE NGX in February 2018. As of
September 30, 2018
, ICE NGX maintains a guaranty fund utilizing a
$100 million
letter of credit that has been entered into with a major Canadian chartered bank and backed by a default insurance policy underwritten by Export Development Corporation, or EDC, a Canadian government agency. In the event of a participant default, where a participant’s collateral becomes depleted, the remaining shortfall would be covered by a draw down on the letter of credit following which ICE NGX would pay the first
$15 million
in losses per its deductible and recover additional losses under the insurance policy of up to
$100 million
.
We have contributed cash of
$150 million
,
$50 million
and
$50 million
to the guaranty funds of ICE Clear Europe, ICE Clear Credit and ICE Clear U.S., respectively, as of
September 30, 2018
, and such amounts are at risk and could be used in the event of a clearing member default where the amount of the defaulting clearing member’s original margin and guaranty fund deposits are insufficient. We have also contributed
$3 million
in cash in total to the guaranty funds of ICE Clear Netherlands and ICE Clear Singapore. The
$253 million
combined contributions to the guaranty funds as of
September 30, 2018
and
December 31, 2017
are included in long-term restricted cash and cash equivalents in the accompanying consolidated balance sheets.
In addition, beginning in March 2018, certain of our exchanges are now required to make similar contributions to those made by the clearing houses to be utilized pro rata along with the clearing contributions in the event of the default of any clearing member. The contribution is calculated per exchange based on average guaranty fund contributions, subject to a minimum contribution of
$10 million
for each exchange. As of
September 30, 2018
, ICE Futures Europe, ICE Futures U.S. and our ICE
21
Endex exchanges have contributed a combined
$67 million
in cash to the guaranty funds of ICE Clear Europe and ICE Clear U.S. These contributions are also included in long-term restricted cash and cash equivalents in the accompanying consolidated balance sheet.
The ICE Clearing Houses seek to reduce their exposure through a risk management program that includes initial and ongoing financial standards for clearing member and participant admission and continued membership, original and variation margin and collateral requirements, and mandatory deposits to the guaranty fund. The amounts that the clearing members and participants are required to maintain in the original margin, guaranty fund and collateral accounts are determined by standardized parameters established by the risk management department of the respective ICE Clearing House and reviewed by the risk committees and the boards of directors of each of the ICE Clearing Houses and may fluctuate over time. As of
September 30, 2018
and
December 31, 2017
, the ICE Clearing Houses have received or have been pledged
$107.9 billion
and
$92.6 billion
, respectively, in cash and non-cash collateral in original margin and guaranty fund deposits to cover price movements of underlying contracts for both periods. With the exception of ICE NGX, the ICE Clearing Houses also have the ability to collect additional funds from their clearing members to cover a defaulting member’s remaining obligations up to the limits established under the respective rules of each ICE Clearing House.
Should a particular clearing member or participant fail to deposit its original margin, provide its collateral, or fail to make a variation margin payment, when and as required, the relevant ICE Clearing House may liquidate or hedge the clearing member’s or participant’s open positions and use their original margin and guaranty fund deposits to make up any amount owed. In the event that those deposits are not sufficient to pay the amount owed in full, the ICE Clearing Houses may utilize the respective guaranty fund deposits of their respective clearing members on a pro-rata basis for that purpose.
ICE NGX administers the physical delivery of energy trading contracts. It has an equal and offsetting claim to and from the respective participants on opposite sides of the physically settled contract. The balance related to delivered but unpaid contracts is reflected as a delivery contract net receivable with an offsetting delivery contract net payable in the accompanying consolidated balance sheets. ICE NGX also records unsettled variation margin equal to the fair value of open energy trading contracts as of the balance sheet date. Fair value is determined based on the difference between the trade price when the contract was entered into and the settlement price. There is no impact to the consolidated statements of income for either delivery contracts receivable/payable or unsettled variation margin, as an equivalent amount is recognized as both an asset and a liability.
As of
September 30, 2018
, our cash and cash equivalents margin deposits, unsettled variation margin, guaranty fund and delivery contracts receivable/payable, net, are as follows for the ICE Clearing Houses (in millions):
|
ICE Clear
Europe |
ICE Clear
Credit |
ICE Clear U.S.
|
ICE NGX
|
Other ICE Clearing Houses
|
Total
|
||||||||||||||||||
|
Original margin
|
$
|
26,452
|
|
$
|
19,415
|
|
$
|
6,020
|
|
$
|
—
|
|
$
|
4
|
|
$
|
51,891
|
|
|||||
|
Unsettled variation margin, net
|
—
|
|
—
|
|
—
|
|
250
|
|
—
|
|
250
|
|
|||||||||||
|
Guaranty fund
|
3,424
|
|
2,343
|
|
454
|
|
—
|
|
6
|
|
6,227
|
|
|||||||||||
|
Delivery contracts receivable/payable, net
|
—
|
|
—
|
|
—
|
|
396
|
|
—
|
|
396
|
|
|||||||||||
|
Total
|
$
|
29,876
|
|
$
|
21,758
|
|
$
|
6,474
|
|
$
|
646
|
|
$
|
10
|
|
$
|
58,764
|
|
|||||
As of
December 31, 2017
, our cash margin deposits, unsettled variation margin, guaranty fund and delivery contracts receivable/payable, net, were as follows for the ICE Clearing Houses (in millions):
|
ICE Clear
Europe |
ICE Clear
Credit |
ICE Clear U.S.
|
ICE NGX
|
Other ICE Clearing Houses
|
Total
|
||||||||||||||||||
|
Original margin
|
$
|
19,792
|
|
$
|
20,703
|
|
$
|
3,898
|
|
$
|
—
|
|
$
|
126
|
|
$
|
44,519
|
|
|||||
|
Unsettled variation margin, net
|
—
|
|
—
|
|
—
|
|
227
|
|
1
|
|
228
|
|
|||||||||||
|
Guaranty fund
|
3,037
|
|
2,607
|
|
299
|
|
—
|
|
23
|
|
5,966
|
|
|||||||||||
|
Delivery contracts receivable/payable, net
|
—
|
|
—
|
|
—
|
|
509
|
|
—
|
|
509
|
|
|||||||||||
|
Total
|
$
|
22,829
|
|
$
|
23,310
|
|
$
|
4,197
|
|
$
|
736
|
|
$
|
150
|
|
$
|
51,222
|
|
|||||
We have recorded these cash and cash equivalent deposits and amounts due in the accompanying consolidated balance sheets as current assets with corresponding current liabilities to the clearing members of the relevant ICE Clearing House. All cash, securities and amounts due are available only to meet the financial obligations of that clearing member to the relevant ICE Clearing House. Each of the ICE Clearing Houses are separate legal entities and are not subject to the liabilities of the other ICE Clearing Houses or the obligations of the members of the other ICE Clearing Houses. The amount of these cash deposits may
22
fluctuate due to the types of margin collateral choices available to clearing members and the change in the amount of deposits required. As a result, these assets and corresponding liabilities may vary significantly over time.
Of the cash held by the ICE Clearing Houses, as of
September 30, 2018
, $
34.8 billion
is secured in reverse repurchase agreements or direct investment in government securities. We engage in tri-party reverse repurchase agreements with large, highly-rated financial institutions with primarily overnight maturities. ICE Clear Credit, as a systemically important financial market utility, or SIFMU, as designated by the Financial Stability Oversight Council, or FSOC, held $
16.5 billion
of its U.S. dollar cash in the guaranty fund and in original margin in cash accounts at the Federal Reserve Bank of Chicago as of
September 30, 2018
. ICE Clear Europe maintains a euro-denominated account at the De Nederlandsche Bank, or DNB, the central bank of the Netherlands, as well as a pounds sterling-denominated account at the Bank of England, or BOE, the central bank of the U.K. These accounts provide the flexibility for ICE Clear Europe to place euro- and pounds sterling-denominated cash margin securely at national banks, in particular during periods when liquidity in the euro and pounds sterling repo markets may temporarily become contracted. As of
September 30, 2018
, ICE Clear Europe held
€2.5 billion
(
$2.9 billion
based on the euro/U.S. dollar exchange rate of
1.1604
as of
September 30, 2018
) at DNB, and
£500 million
(
$652 million
based on the pound sterling/U.S. dollar exchange rate of
1.3030
as of
September 30, 2018
) at the BOE. The remaining cash deposits at the ICE Clearing Houses are held in demand deposit accounts at large, highly-rated financial institutions and are directly invested primarily in U.S. Treasury securities with original maturities of less than three months, plus certain U.S. Treasury securities that extend beyond 12 months which we consider to be Level 1 securities. The carrying value of these securities with original maturities of less than three months approximates their fair value due to the short-term nature of the instruments and repurchase agreements.
In addition to the cash deposits for original margin and the guaranty fund, the ICE Clearing Houses have also received other assets from clearing members, which include government obligations, and may include other non-cash collateral such as certain agency and corporate debt, letters of credit or gold to mitigate credit risk. These assets are not reflected in the accompanying consolidated balance sheets as the risks and rewards of these assets remain with the clearing members unless the ICE Clearing Houses have sold or re-pledged the assets or in the event of a clearing member default, where the clearing member is no longer entitled to redeem the assets. Any income, gain or loss accrues to the clearing member. For certain non-cash deposits, the ICE Clearing Houses may impose discount or “haircut” rates to ensure adequate collateral levels to account for fluctuations in the market value of these deposits.
ICE NGX requires participants to maintain cash or letters of credit to serve as collateral in the event of a participant default. The cash is maintained in a segregated bank account that is subject to a collateral agreement between the bank and ICE NGX. Per the agreement, ICE NGX serves in the capacity of a trustee. The cash is held by ICE NGX in trust for and on behalf of the participant; however, the cash remains the property of the participant and may only be accessed by ICE NGX if there is evidence of default. The rules governing when the cash can be accessed by ICE NGX are listed in the Contracting Party Agreement, a standardized agreement signed by each participant that also allows for netting of positive and negative exposure. Since the cash is held in trust and remains the property of the participant, it is not included in our accompanying consolidated balance sheets.
As of
September 30, 2018
and
December 31, 2017
, the assets pledged by the clearing members as original margin, which includes cash deposits held in trust by ICE NGX, and non-cash collateral guaranty fund deposits for each of the ICE Clearing Houses not included in the accompanying consolidated balance sheets are detailed below (in millions):
|
|
As of September 30, 2018
|
||||||||||||||||||||||
|
ICE Clear
Europe |
ICE Clear
Credit |
ICE Clear U.S.
|
ICE NGX
|
Other ICE Clearing Houses
|
Total
|
||||||||||||||||||
|
Original margin:
|
|||||||||||||||||||||||
|
Government securities at face value
|
$
|
23,797
|
|
$
|
12,415
|
|
$
|
9,997
|
|
$
|
—
|
|
$
|
—
|
|
$
|
46,209
|
|
|||||
|
Letters of credit
|
—
|
|
—
|
|
—
|
|
1,637
|
|
—
|
|
1,637
|
|
|||||||||||
|
ICE NGX cash deposits
|
—
|
|
—
|
|
—
|
|
299
|
|
—
|
|
299
|
|
|||||||||||
|
Total
|
$
|
23,797
|
|
$
|
12,415
|
|
$
|
9,997
|
|
$
|
1,936
|
|
$
|
—
|
|
$
|
48,145
|
|
|||||
|
Guaranty fund:
|
|||||||||||||||||||||||
|
Government securities at face value
|
$
|
605
|
|
$
|
175
|
|
$
|
259
|
|
$
|
—
|
|
$
|
—
|
|
$
|
1,039
|
|
|||||
23
|
As of December 31, 2017
|
|||||||||||||||||||||||
|
ICE Clear
Europe |
ICE Clear
Credit |
ICE Clear U.S.
|
ICE NGX
|
Other ICE Clearing Houses
|
Total
|
||||||||||||||||||
|
Original margin:
|
|||||||||||||||||||||||
|
Government securities at face value
|
$
|
23,496
|
|
$
|
5,699
|
|
$
|
9,581
|
|
$
|
—
|
|
$
|
18
|
|
$
|
38,794
|
|
|||||
|
Letters of credit
|
—
|
|
—
|
|
—
|
|
1,663
|
|
—
|
|
1,663
|
|
|||||||||||
|
ICE NGX cash deposits
|
—
|
|
—
|
|
—
|
|
233
|
|
—
|
|
233
|
|
|||||||||||
|
Total
|
$
|
23,496
|
|
$
|
5,699
|
|
$
|
9,581
|
|
$
|
1,896
|
|
$
|
18
|
|
$
|
40,690
|
|
|||||
|
Guaranty fund:
|
|||||||||||||||||||||||
|
Government securities at face value
|
$
|
323
|
|
$
|
176
|
|
$
|
169
|
|
$
|
—
|
|
$
|
2
|
|
$
|
670
|
|
|||||
11. Legal Proceedings
We are subject to legal proceedings, claims and investigations that arise in the ordinary course of our business. These include the matters described in Part I, Item 3 “Legal Proceedings” and Note 14 to the consolidated financial statements in Part II, Item 8 of our 2017 Form 10-K. We establish accruals for those matters in circumstances when a loss contingency is considered probable and the related amount is reasonably estimable. Any such accruals may be adjusted as circumstances change. Assessments of losses are inherently subjective and involve unpredictable factors. We do not believe that the resolution of these legal matters, including the matters described below, will have a material adverse effect on our consolidated financial condition, results of operations, or liquidity. It is possible, however, that future results of operations for any particular quarterly or annual period could be materially and adversely affected by any developments relating to the legal proceedings, claims and investigations.
During the year ended December 31, 2017, we recorded an aggregate of
$14 million
in expense accruals relating to SEC investigations and inquiries. On March 6, 2018, NYSE and affiliated exchanges reached a settlement with the SEC of the various matters under investigation and agreed to pay a
$14 million
civil monetary penalty, together with certain non-monetary relief. For further details about the settlement and underlying matters that were under investigation, please refer to
Order Instituting Administrative and Cease-and-Desist Proceedings Pursuant to Section 8A of the Securities Act of 1933, Sections 19(h)(1) and 21C of the Securities Exchange Act of 1934, Making Findings, and Imposing Remedial Sanctions and a Cease-and-Desist Order
, Administrative Proceeding File No. 3-18388 (In the Matter of New York Stock Exchange LLC, NYSE American LLC, and NYSE Arca, Inc.) entered into on March 6, 2018.
Our 2017 Form 10-K included a description of the purported class action lawsuit against two of our subsidiary NYSE exchanges, and other U.S. exchanges, by the City of Providence, Rhode Island and other plaintiffs. As reported in our 2017 Form 10-K, the defendant exchanges filed a petition for rehearing and/or rehearing
en banc
of the U.S. Court of Appeals for the Second Circuit’s, or Second Circuit, December 2017 decision vacating the dismissal of this case and on March 13, 2018, the Second Circuit denied our petition. On August 10, 2018, the defendant exchanges filed a petition in the U.S. Supreme Court seeking review of the Second Circuit’s December 2017 decision. On October 9, 2018, the Supreme Court denied the petition. Additionally, the parties are awaiting a decision on a motion to dismiss filed by the defendant exchanges in the district court seeking dismissal on grounds other than those considered by the Second Circuit in its December 2017 decision.
12. Fair Value Measurements
Our financial instruments consist primarily of cash and cash equivalents, short-term and long-term restricted cash and cash equivalents, short-term investments, customer accounts receivable, margin deposits and guaranty funds, equity investments, short-term and long-term debt and certain other short-term assets and liabilities. The fair value of our financial instruments are measured based on a three-level hierarchy:
|
•
|
Level 1 inputs — quoted prices for identical assets or liabilities in active markets.
|
|
•
|
Level 2 inputs — observable inputs other than Level 1 inputs such as quoted prices for similar assets and liabilities in active markets or inputs other than quoted prices that are directly observable.
|
|
•
|
Level 3 inputs — unobservable inputs supported by little or no market activity and that are significant to the fair value of the assets or liabilities.
|
24
We use Level 1 inputs to determine fair value. The Level 1 assets consist of U.S. Treasury and other foreign government securities, and investments in publicly-traded mutual funds held for the purpose of providing future payments of the supplemental executive retirement and the supplemental executive savings plans.
Financial assets and liabilities recorded in the accompanying consolidated balance sheets as of
September 30, 2018
and
December 31, 2017
are classified in their entirety based on the lowest level of input that is significant to the asset or liability’s fair value measurement. Financial instruments measured at fair value on a recurring basis as of
September 30, 2018
and
December 31, 2017
are as follows (in millions):
|
As of September 30, 2018
|
As of December 31, 2017
|
||||||||||||||||||||||
|
Level 1
|
Level 2 and 3
|
Total
|
Level 1
|
Level 2 and 3
|
Total
|
||||||||||||||||||
|
Assets at fair value:
|
|||||||||||||||||||||||
|
U.S. Treasury and other foreign government securities
|
$
|
902
|
|
$
|
—
|
|
$
|
902
|
|
$
|
734
|
|
$
|
—
|
|
$
|
734
|
|
|||||
|
Mutual funds
|
14
|
|
—
|
|
14
|
|
16
|
|
—
|
|
16
|
|
|||||||||||
|
Total assets at fair value
|
$
|
916
|
|
$
|
—
|
|
$
|
916
|
|
$
|
750
|
|
$
|
—
|
|
$
|
750
|
|
|||||
As of
September 30, 2018
, we held
$902 million
in U.S. Treasury and other foreign government securities which are considered cash equivalents and for which the carrying amount approximates fair value. Of these securities,
$635 million
were recorded as short-term restricted cash and cash equivalents and
$267 million
were recorded as long-term restricted cash and cash equivalents in the accompanying consolidated balance sheet as of
September 30, 2018
.
Mutual funds are equity and fixed income mutual funds held for the purpose of providing future payments for the supplemental executive savings plan and the supplemental executive retirement plan and are classified as equity investments.
We did not use Level 2 or 3 inputs to determine the fair value of assets or liabilities measured at fair value on a recurring basis as of
September 30, 2018
or
December 31, 2017
. We measure certain assets, such as intangible assets, at fair value on a non-recurring basis. These assets are recognized at fair value if they are deemed to be impaired. As of
September 30, 2018
, except for the fair value adjustment related to our
$4 million
impairment of exchange registration intangible assets associated with the closure of ICE Futures Canada and ICE Clear Canada (Note 5), none of our intangible assets were required to be recorded at fair value since no other impairments were recorded. Our equity investments without a readily determinable fair value, including our investments in Euroclear and Coinbase, are only measured at fair value on a non-recurring basis when a certain trigger event occurs in accordance with ASU 2016-01, as discussed in Notes 2 and 3. We did not have any such investments measured at fair value on a non-recurring basis as of
September 30, 2018
. See Note 10 for the fair value considerations related to our margin deposits, guaranty funds and delivery contracts receivable.
As of
September 30, 2018
, (i) the fair value of our
$1.23 billion
2048 Senior Notes was
$1.23 billion
, (ii) the fair value of our
$591 million
2028 Senior Notes was
$595 million
, (iii) the fair value of our
$495 million
2027 Senior Notes was
$473 million
, (iv) the fair value of our
$1.24 billion
2025 Senior Notes was
$1.25 billion
, (v) the fair value of our
$793 million
October 2023 Senior Notes was
$818 million
, (vi) the fair value of our
$397 million
September 2023 Senior Notes was
$399 million
, (vii) the fair value of our
$496 million
2022 Senior Notes was
$480 million
, and (viii) the fair value of our
$1.25 billion
2020 Senior Notes was
$1.24 billion
. The fair values of these fixed rate notes were estimated using quoted market prices for these instruments. The fair value of our commercial paper approximates the carrying value since the rates of interest on this short-term debt approximate market rates as of
September 30, 2018
.
Excluding our equity investments without a readily determinable fair value, all other financial instruments are determined to approximate carrying value due to the short period of time to their maturities.
|
13.
|
Segment Reporting
|
We operate
two
business segments: our Trading and Clearing segment and our Data and Listings segment. This presentation is reflective of how our chief operating decision maker reviews and operates our business. Our Trading and Clearing segment comprises our transaction-based execution and clearing businesses. Our Data and Listings segment comprises our subscription-based data services and securities listings businesses. Our chief operating decision maker does not review total assets or statements of income below operating income by segments; therefore, such information is not presented below. Our
two
segments do not engage in intersegment transactions.
Certain segment expenses for the
nine and three months ended
September 30, 2017
have been reclassified to conform to our current periods' segment financial statement presentation. This reclassification increased the operating expenses for the Data and Listings segment by
$50 million
and
$17 million
for the
nine and three months ended
September 30, 2017
, respectively, while
25
decreasing the operating expenses for the Trading and Clearing segment by the same amounts. Financial data for our business segments is as follows for the
nine and three months ended
September 30, 2018
and
2017
(in millions):
|
Nine Months Ended September 30, 2018
|
Nine Months Ended September 30, 2017
|
||||||||||||||||||||||
|
Trading and Clearing Segment
|
Data and Listings Segment
|
Consolidated
|
Trading and Clearing Segment
|
Data and Listings Segment
|
Consolidated
|
||||||||||||||||||
|
Revenues:
|
|||||||||||||||||||||||
|
Energy futures and options contracts
|
$
|
708
|
|
$
|
—
|
|
$
|
708
|
|
$
|
682
|
|
$
|
—
|
|
$
|
682
|
|
|||||
|
Agricultural and metals futures and options contracts
|
197
|
|
—
|
|
197
|
|
167
|
|
—
|
|
167
|
|
|||||||||||
|
Interest rates and other financial futures and options contracts
|
262
|
|
—
|
|
262
|
|
254
|
|
—
|
|
254
|
|
|||||||||||
|
Cash equities and equity options
|
1,162
|
|
—
|
|
1,162
|
|
1,126
|
|
—
|
|
1,126
|
|
|||||||||||
|
OTC and other transactions
|
193
|
|
—
|
|
193
|
|
144
|
|
—
|
|
144
|
|
|||||||||||
|
Pricing and analytics
|
—
|
|
779
|
|
779
|
|
—
|
|
722
|
|
722
|
|
|||||||||||
|
Exchange data
|
—
|
|
433
|
|
433
|
|
—
|
|
416
|
|
416
|
|
|||||||||||
|
Desktops and connectivity
|
—
|
|
364
|
|
364
|
|
—
|
|
421
|
|
421
|
|
|||||||||||
|
Listings
|
—
|
|
332
|
|
332
|
|
—
|
|
322
|
|
322
|
|
|||||||||||
|
Other revenues
|
169
|
|
—
|
|
169
|
|
148
|
|
—
|
|
148
|
|
|||||||||||
|
Revenues
|
2,691
|
|
1,908
|
|
4,599
|
|
2,521
|
|
1,881
|
|
4,402
|
|
|||||||||||
|
Transaction-based expenses
|
928
|
|
—
|
|
928
|
|
910
|
|
—
|
|
910
|
|
|||||||||||
|
Revenues, less transaction-based expenses
|
1,763
|
|
1,908
|
|
3,671
|
|
1,611
|
|
1,881
|
|
3,492
|
|
|||||||||||
|
Operating expenses
|
655
|
|
1,109
|
|
1,764
|
|
595
|
|
1,110
|
|
1,705
|
|
|||||||||||
|
Operating income
|
$
|
1,108
|
|
$
|
799
|
|
$
|
1,907
|
|
$
|
1,016
|
|
$
|
771
|
|
$
|
1,787
|
|
|||||
|
Three Months Ended September 30, 2018
|
Three Months Ended September 30, 2017
|
||||||||||||||||||||||
|
Trading and Clearing Segment
|
Data and Listings Segment
|
Consolidated
|
Trading and Clearing Segment
|
Data and Listings Segment
|
Consolidated
|
||||||||||||||||||
|
Revenues:
|
|||||||||||||||||||||||
|
Energy futures and options contracts
|
$
|
223
|
|
$
|
—
|
|
$
|
223
|
|
$
|
223
|
|
$
|
—
|
|
$
|
223
|
|
|||||
|
Agricultural and metals futures and options contracts
|
58
|
|
—
|
|
58
|
|
49
|
|
—
|
|
49
|
|
|||||||||||
|
Interest rates and other financial futures and options contracts
|
77
|
|
—
|
|
77
|
|
82
|
|
—
|
|
82
|
|
|||||||||||
|
Cash equities and equity options
|
335
|
|
—
|
|
335
|
|
355
|
|
—
|
|
355
|
|
|||||||||||
|
OTC and other transactions
|
67
|
|
—
|
|
67
|
|
49
|
|
—
|
|
49
|
|
|||||||||||
|
Pricing and analytics
|
—
|
|
263
|
|
263
|
|
—
|
|
242
|
|
242
|
|
|||||||||||
|
Exchange data
|
—
|
|
146
|
|
146
|
|
—
|
|
136
|
|
136
|
|
|||||||||||
|
Desktops and connectivity
|
—
|
|
121
|
|
121
|
|
—
|
|
140
|
|
140
|
|
|||||||||||
|
Listings
|
—
|
|
112
|
|
112
|
|
—
|
|
105
|
|
105
|
|
|||||||||||
|
Other revenues
|
61
|
|
—
|
|
61
|
|
54
|
|
—
|
|
54
|
|
|||||||||||
|
Revenues
|
821
|
|
642
|
|
1,463
|
|
812
|
|
623
|
|
1,435
|
|
|||||||||||
|
Transaction-based expenses
|
263
|
|
—
|
|
263
|
|
289
|
|
—
|
|
289
|
|
|||||||||||
|
Revenues, less transaction-based expenses
|
558
|
|
642
|
|
1,200
|
|
523
|
|
623
|
|
1,146
|
|
|||||||||||
|
Operating expenses
|
230
|
|
368
|
|
598
|
|
198
|
|
352
|
|
550
|
|
|||||||||||
|
Operating income
|
$
|
328
|
|
$
|
274
|
|
$
|
602
|
|
$
|
325
|
|
$
|
271
|
|
$
|
596
|
|
|||||
26
Revenue from
one
clearing member of the Trading and Clearing segment comprised
$300 million
, or
17%
and
$89 million
, or
16%
, of our Trading and Clearing revenues for the
nine and three months ended
September 30, 2018
, respectively. Revenue from
two
clearing members of the Trading and Clearing segment comprised
$364 million
, or
23%
, and
$121 million
, or
23%
, of our Trading and Clearing revenues for the
nine and three months ended
September 30, 2017
, respectively. Clearing members are primarily intermediaries and represent a broad range of principal trading firms. If a clearing member ceased its operations, we believe that the trading firms would continue to conduct transactions and would clear those transactions through another clearing member firm. No additional customers or clearing members accounted for more than
10%
of our segment revenues or consolidated revenues for the
nine and three months ended
September 30, 2018
and
2017
.
|
14.
|
Earnings Per Common Share
|
The following is a reconciliation of the numerators and denominators of the basic and diluted earnings per common share computations for the
nine and three months ended
September 30, 2018
and
2017
(in millions, except per share amounts):
|
Nine Months Ended
September 30, |
Three Months Ended September 30,
|
||||||||||||||
|
2018
|
2017
|
2018
|
2017
|
||||||||||||
|
Basic:
|
|||||||||||||||
|
Net income attributable to Intercontinental Exchange, Inc.
|
$
|
1,377
|
|
$
|
1,293
|
|
$
|
458
|
|
$
|
371
|
|
|||
|
Weighted average common shares outstanding
|
577
|
|
591
|
|
572
|
|
588
|
|
|||||||
|
Basic earnings per common share
|
$
|
2.39
|
|
$
|
2.19
|
|
$
|
0.80
|
|
$
|
0.63
|
|
|||
|
Diluted:
|
|||||||||||||||
|
Weighted average common shares outstanding
|
577
|
|
591
|
|
572
|
|
588
|
|
|||||||
|
Effect of dilutive securities - stock options and restricted shares
|
4
|
|
4
|
|
4
|
|
4
|
|
|||||||
|
Diluted weighted average common shares outstanding
|
581
|
|
595
|
|
576
|
|
592
|
|
|||||||
|
Diluted earnings per common share
|
$
|
2.37
|
|
$
|
2.17
|
|
$
|
0.79
|
|
$
|
0.63
|
|
|||
Basic earnings per common share is calculated using the weighted average common shares outstanding during the period. Common equivalent shares from stock options and restricted stock awards, using the treasury stock method, are included in the diluted per share calculations unless the effect of their inclusion would be antidilutive. During the
nine months ended
September 30, 2018
and
2017
,
450,613
and
682,019
outstanding stock options, respectively, were not included in the computation of diluted earnings per common share since the inclusion would have had an antidilutive effect because the outstanding stock option exercise prices were greater than the average market price of the common shares during the relevant periods. Certain figures in the table above may not recalculate due to rounding.
|
15.
|
Subsequent Events
|
We have evaluated subsequent events and determined that no events or transactions, except the event disclosed in Note 3, met the definition of a subsequent event for purposes of recognition or disclosure in the accompanying consolidated financial statements.
27
|
ITEM 2.
|
MANAGEMENT’S DISCUSSION AND ANALYSIS OF FINANCIAL CONDITION AND RESULTS OF OPERATIONS
|
This Quarterly Report on Form 10-Q, including the sections entitled “Notes to Consolidated Financial Statements,” “Legal Proceedings” and “Management’s Discussion and Analysis of Financial Condition and Results of Operations,” contains “forward-looking statements” as defined in the Private Securities Litigation Reform Act of 1995. Any statements contained herein that are not statements of historical fact may be forward-looking statements. Any forward looking statements are based on our present beliefs and assumptions as well as the information currently available to us. Forward-looking statements may be introduced by or contain terminology such as “may,” “will,” “should,” “could,” “would,” “targets,” “goal,” “expect,” “intend,” “plan,” “anticipate,” “believe,” “estimate,” “predict,” “potential,” “continue,” or the antonyms of these terms or other comparable terminology. These statements relate to future events or our future financial performance and involve known and unknown risks, uncertainties and other factors that may cause our results, levels of activity, performance, cash flows, financial position or achievements to differ materially from those expressed or implied by these forward-looking statements. These risks and other factors include those set forth in Item 1(A) under the caption “Risk Factors” in our Annual Report on Form 10-K for the year ended
December 31, 2017
, or our 2017 Form 10-K, as filed with the SEC on February 7, 2018.
Forward-looking statements and other risks and factors that may affect our performance include, but are not limited to: conditions in global financial markets and domestic and international economic, political and social conditions; the impact of the introduction of or any changes in laws, regulations, rules or government policy with respect to financial markets, increased regulatory scrutiny or enforcement actions and our ability to comply with these requirements; volatility in commodity prices, equity prices, and price volatility of financial benchmarks and instruments such as interest rates, credit spreads, equity indices and foreign exchange rates; the business environment in which we operate and trends in our industry, including trading volumes, clearing, data services, fees, changing regulations, competition and consolidation; the success of our clearing houses and our ability to minimize the risks associated with operating clearing houses in multiple jurisdictions; the success of our equity and derivative exchanges and the exchanges’ compliance with their respective regulatory and oversight responsibilities; the resilience of our electronic platforms and soundness of our business continuity and disaster recovery plans; continued high renewal rates of subscription-based data revenues; our ability to identify and effectively pursue, implement and integrate acquisitions and strategic alliances; our ability to complete and realize the synergies and benefits of our acquisitions within the expected time frame, and to integrate acquired operations with our business; our ability to effectively maintain our growth; the performance and reliability of our other technologies and those of third party service providers, including our ability to keep pace with technological developments and ensure that the technology we utilize is not vulnerable to security risks or other disruptive events; our ability to identify trends and adjust our business to benefit from such trends; the accuracy of our cost and other financial estimates and our belief that cash flows from operations will be sufficient to service our debt and fund our operational and capital expenditure needs; our ability to maintain existing market participants and data customers, and attract new ones, and to offer additional products and services, leverage our risk management capabilities and enhance our technology in a timely and cost-effective fashion; our ability to attract and retain key talent; our ability to protect our intellectual property rights and to operate our business without violating the intellectual property rights of others; and potential adverse results of threatened or pending litigation and regulatory actions and proceedings.
We caution you not to place undue reliance on any forward-looking statements as they speak only as of the date on which such statements were made, and we undertake no obligation to update any forward-looking statement or to reflect the occurrence of an unanticipated event. New factors may emerge and it is not possible to predict all factors that may affect our business and prospects. Further, management cannot assess the impact of each factor on the business or the extent to which any factor, or combination of factors, may cause actual results to differ materially from those contained in any forward-looking statements.
In this Quarterly Report on Form 10-Q, unless otherwise indicated, the terms “Intercontinental Exchange,” “ICE,” “we,” “us,” “our,” “our company” and “our business” refer to Intercontinental Exchange, Inc., together with its consolidated subsidiaries. Due to rounding, figures may not sum exactly.
Overview
We are a leading global operator of regulated exchanges, clearing houses and listings venues, and a provider of data services for commodity, fixed income and equity markets. We operate regulated marketplaces for listing, trading and clearing a broad array of derivatives and securities contracts across all major asset classes, including energy and agricultural commodities, interest rates, equities, equity derivatives, ETFs, credit derivatives, bonds and currencies. We also offer end-to-end data services and solutions to support the trading, investment, risk management and connectivity needs of customers around the world across all major asset classes.
Our exchanges include derivative exchanges in the U.S., U.K., EU, Canada and Singapore, and cash equities, equity options and bond exchanges in the U.S. We also operate OTC markets for physical energy, fixed income and CDS trade execution. To
28
serve global derivatives markets, we operate CCPs in the U.S., U.K., EU, Canada and Singapore. We offer a range of data services for global financial and commodity markets, including pricing and reference data, exchange data, analytics, feeds, index services, desktops and connectivity solutions. Through our markets, clearing houses, listings and data services, we provide end-to-end solutions for our customers through liquid markets, benchmark products, access to capital markets, and related services to support their ability to manage risk and raise capital. Our business is currently conducted as two reportable business segments, our Trading and Clearing segment and our Data and Listings segment, and the majority of our identifiable assets are located in the U.S., U.K. and Canada.
Recent Developments
U.S. Tax Cuts and Jobs Act of 2017, or TCJA
On December 22, 2017, the TCJA was signed into law. The TCJA reduced the U.S. federal corporate income tax rate from
35%
to
21%
effective January 1, 2018. Many of the tax provisions under the TCJA became effective January 1, 2018, including the new federal 21% corporate income tax rate and complex international tax provisions. Given the complexity of these international provisions and certain potential unintended consequences that are under debate at both the federal and state level, certain federal and state guidance has been issued and further guidance is anticipated, but the likelihood and timing of such guidance remains uncertain.
Acquisitions
On January 2, 2018, we acquired BondPoint from Virtu Financial, Inc. for
$400 million
in cash. BondPoint is a provider of electronic fixed income trading solutions for the buy-side and sell-side, offering access to centralized liquidity and automated trade execution services through its ATS, and provides trading services to more than
500
financial services firms.
On July 18, 2018, we acquired CHX Holdings, Inc., the parent company of CHX, a full-service stock exchange, including trading, data and corporate listings services. CHX operates as a registered national securities exchange.
On July 23, 2018, we acquired TMC Bonds for $701 million in cash. The cash consideration is gross of $14 million cash held by TMC Bonds on the date of acquisition. TMC Bonds is an electronic fixed income marketplace, supporting anonymous trading across multiple protocols in various asset classes, including municipals, corporates, treasuries, agencies and certificates of deposit.
On July 20, 2018, we exercised our option to purchase all of the remaining equity interests of MERS as a result of satisfying our deliverables under the software development agreement to rebuild the MERS® System to benefit the U.S. residential mortgage finance market. As of September 30, 2018, we owned a majority stake in MERS, which we treated as an equity investment since we did not have the ability to control the operations of MERS. On October 3, 2018, we completed the purchase of all remaining interests and accordingly, own 100% of MERS. On that date, we gained control of MERS and began to include MERS's results as part of our consolidated operations. In connection with the purchase and upon consolidation, we expect to record a $110 million gain on our initial investment value, which would be included in other non-operating income on October 3, 2018.
Launch of Bakkt
On August 3, 2018, we announced our plans to form a new company, Bakkt, LLC, or Bakkt, along with a group of organizations to create an integrated platform that enables consumers and institutions to transact in digital assets. The Bakkt ecosystem will include federally-regulated trading, clearing and warehousing of digital assets, which will be supported by ICE Futures U.S. and ICE Clear U.S. The first traded contract will be a Bakkt Bitcoin physically delivered daily futures contract to provide price discovery, expected to launch during the fourth quarter of 2018, subject to the review and approval of the Commodity Futures Trading Commission, or CFTC. The addition of the warehouse will establish new protocols for managing the specific security and settlement requirements of digital currencies. In addition, there will be a separate guaranty fund that will be funded by ICE Futures U.S. and Bakkt. It is also expected that Bakkt will offer additional solutions starting in 2019 to expand the range of uses for digital assets.
Investment in Euroclear
During the year ended December 31, 2017, we purchased a
4.7%
stake in Euroclear valued at
€276 million
(
$327 million
). Upon purchasing this stake, we agreed to participate on the Euroclear Board of Directors. During the same period, we negotiated an additional purchase which closed on February 21, 2018 following regulatory approval. This provided us with an additional
5.1%
stake in Euroclear for a purchase price of
€246 million
in cash (
$304 million
). As of
September 30, 2018
, we owned a
9.8%
stake in Euroclear for a total investment of
$631 million
. Euroclear is a provider of post-trade services, including settlement, central securities depositories and related services for cross-border transactions across asset classes.
29
Purchase of Non-Controlling Interest
For consolidated subsidiaries in which our ownership is less than 100% and for which we have control over the assets, liabilities and management of the entity, the outside stockholders’ interests are shown as non-controlling interest in our consolidated financial statements. As of December 31, 2017, non-controlling interest consisted of the operating results of our CDS clearing subsidiaries in which non-ICE limited partners held a 29.9% ownership interest. During September 2018, we purchased a 3.2% ownership interest from a non-ICE limited partner and the remaining non-ICE limited partners hold a 26.7% ownership interest as of September 30, 2018.
Regulation
Our markets are primarily subject to the jurisdiction of regulatory agencies in the U.S., U.K., EU, Canada and Singapore. Global policy makers have undertaken reviews of their existing legal framework governing financial markets in connection with regulatory reform, and have either passed new laws and regulations, or are in the process of debating and/or enacting new laws and regulations that apply to our business and to our customers’ businesses. Legislative and regulatory actions may impact the way in which we or our customers conduct business and may create uncertainty, which could affect trading volumes or demand for market data. See Part 1, Item 1 “Business - Regulation” included in our 2017 Form 10-K for a discussion of the primary regulations applicable to our business. As discussed in Part 1, Item 1 of our 2017 Form 10-K, the implementation of the Markets in Financial Instruments Directive II and associated regulation, or MiFID II, and the European Market Infrastructure Regulation, or EMIR, may result in operational, regulatory and/or business risk. Our key areas of focus on these evolving efforts are:
|
•
|
Following the implementation of MiFID II in January 2018, the European Securities and Markets Authority, or ESMA, and the national regulatory authorities continue to review the calibration of certain aspects of the framework that are relevant to the markets operated by ICE Futures Europe and ICE Endex, including position limits and the determination of pre-trade and post-trade transparency parameters for financial instruments.
|
|
•
|
The proposed revisions of the regulatory structure could have an impact on our non-EU clearing houses to the extent they are deemed to be doing business in the EU, which might involve changes to clearing house regulations and/or supervision. In 2017, the European Commission published a proposal to revise the current regulatory structure for non-EU clearing houses. The nature and extent of the regulation would depend on the “impact” of a non-EU clearing house’s business in the EU. Details on the classification of non-EU clearing will be established by the European Commission in cooperation with ESMA and the European System of Central Banks. The proposal will undergo legislative review by the European Parliament and the EU Member States, and is subject to change.
|
|
•
|
The non-discriminatory access provisions of MiFID II, as currently drafted, would require our European exchanges and CCPs, to offer access to third parties on commercially reasonable terms. In addition, MiFID II could require our European exchanges and CCPs to allow participants to trade and/or clear at other venues, which may encourage competing venues to offer lookalikes of our products. In June 2016, the EU approved a twelve-month postponement of MiFID II implementation and compliance to January 3, 2018. On January 3, 2018, ICE Futures Europe and ICE Clear Europe received a deferral from the U.K. Financial Conduct Authority, or FCA, and the BOE, respectively, which delays the non-discriminatory access provision of MiFID II until July 3, 2020.
|
|
•
|
The adoption and implementation of position limit rules in the U.S. and the EU could have an impact on our commodities business if comparable trading venues in foreign jurisdictions are not subject to equivalent rules. Position limits became effective in the EU beginning January 2018 under MiFID II. The FCA has published certain position limits for commodity contracts. In certain cases, the position limits are lower than on U.S. trading venues and in certain cases position limits are higher than U.S. equivalent contracts. The FCA is actively reviewing the recently issued position limits. Conversely, in December 2016, the CFTC re-proposed the position limit rules as opposed to finalizing the rule. There is potential for further divergence between MiFID II and U.S. position limit rules if the U.S. makes changes to the financial regulations while the EU does not review MiFID II.
|
|
•
|
The implementation of capital charges in Basel III, particularly the Supplemental Leverage Ratio with respect to certain clearing members of central counterparties, may impose burdensome capital requirements on our clearing members and customers that may disincentivize clearing. The Federal Reserve Board and Office of the Comptroller of the Currency have proposed rule changes to the leverage ratio requirements but these regulations still may have an impact on our clearing members.
|
30
|
•
|
If the SEC approves the proposed two-year Transaction Fee Pilot, it could make our securities exchanges, including NYSE, less competitive with off-exchange trading venues by limiting the transaction fees charged and rebates paid by these exchanges.
|
|
•
|
The U.K. and EU continue to negotiate the exit of the U.K. from the EU. The impact to our business and corresponding regulatory changes are uncertain at this time. We are monitoring the impact to our business as a result of these discussions.
|
Consolidated Financial Highlights
The following summarizes our results and significant changes in our consolidated financial performance for the periods presented (dollars in millions, except per share amounts, and YTD represents the nine-month periods ended September 30th):
31
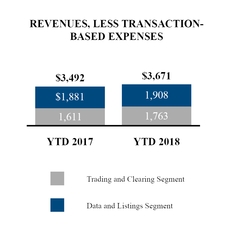


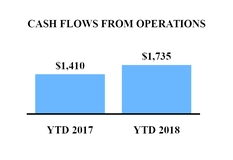
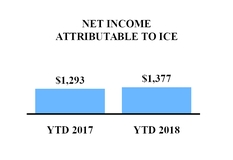
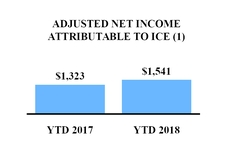
|
Nine Months Ended
September 30, |
Three Months Ended
September 30, |
||||||||||||||||||
|
2018
|
2017
|
Change
|
2018
|
2017
|
Change
|
||||||||||||||
|
Revenues, less transaction-based expenses
|
$
|
3,671
|
|
$
|
3,492
|
|
5 %
|
$
|
1,200
|
|
$
|
1,146
|
|
5 %
|
|||||
|
Operating expenses
|
$
|
1,764
|
|
$
|
1,705
|
|
4 %
|
$
|
598
|
|
$
|
550
|
|
9 %
|
|||||
|
Adjusted operating expenses
(1)
|
$
|
1,518
|
|
$
|
1,466
|
|
4 %
|
$
|
521
|
|
$
|
479
|
|
9 %
|
|||||
|
Operating income
|
$
|
1,907
|
|
$
|
1,787
|
|
7 %
|
$
|
602
|
|
$
|
596
|
|
1 %
|
|||||
|
Adjusted operating income
(1)
|
$
|
2,153
|
|
$
|
2,026
|
|
6%
|
$
|
679
|
|
$
|
667
|
|
2%
|
|||||
|
Operating margin
|
52
|
%
|
51
|
%
|
1 pt
|
50
|
%
|
52
|
%
|
(2) pts
|
|||||||||
|
Adjusted operating margin
(1)
|
59
|
%
|
58
|
%
|
1 pt
|
57
|
%
|
58
|
%
|
(1) pt
|
|||||||||
|
Other income (expense), net
|
$
|
(125
|
)
|
$
|
68
|
|
n/a
|
$
|
(48
|
)
|
$
|
(33
|
)
|
44 %
|
|||||
|
Income tax expense
|
$
|
381
|
|
$
|
540
|
|
(29) %
|
$
|
89
|
|
$
|
186
|
|
(52) %
|
|||||
|
Effective tax rate
|
21
|
%
|
29
|
%
|
(8) pts
|
16
|
%
|
33
|
%
|
(17) pts
|
|||||||||
|
Net income attributable to ICE
|
$
|
1,377
|
|
$
|
1,293
|
|
6 %
|
$
|
458
|
|
$
|
371
|
|
24 %
|
|||||
|
Adjusted net income attributable to ICE
(1)
|
$
|
1,541
|
|
$
|
1,323
|
|
16 %
|
$
|
491
|
|
$
|
432
|
|
13%
|
|||||
|
Diluted earnings per share attributable to ICE common stockholders
|
$
|
2.37
|
|
$
|
2.17
|
|
9 %
|
$
|
0.79
|
|
$
|
0.63
|
|
25 %
|
|||||
|
Adjusted diluted earnings per share attributable to ICE common stockholders
(1)
|
$
|
2.65
|
|
$
|
2.22
|
|
19 %
|
$
|
0.85
|
|
$
|
0.73
|
|
16 %
|
|||||
|
Cash flows from operating activities
|
$
|
1,735
|
|
$
|
1,410
|
|
23 %
|
||||||||||||
(1)
The adjusted numbers in the charts and table above are calculated by excluding items that are not reflective of our cash operations and core business performance, and for adjusted net income attributable to ICE and adjusted diluted earnings per share attributable to ICE common stockholders, are presented net of taxes. As a result, these adjusted numbers are not calculated in accordance with GAAP. See “- Non-GAAP Financial Measures” below.
|
•
|
Revenues, less transaction-based expenses, increased $179 million and $54 million for the
nine and three months ended
September 30, 2018
, respectively, from the comparable periods in
2017
. See “- Trading and Clearing Segment” and “- Data and Listings Segment” below for a discussion of the significant changes in our revenues. The increase in revenues during the
nine and three months ended
September 30, 2018
includes $31 million favorable and $1 million unfavorable, respectively, foreign exchange effects arising from changes in the value of the U.S. dollar from the comparable periods in
|
32
2017
. See Item 3 “Quantitative and Qualitative Disclosures About Market Risk - Foreign Currency Exchange Rate Risk” below for additional information on the impact of currency fluctuations. Excluding the $31 million favorable and $1 million in unfavorable foreign exchange effects for the
nine and three months ended
September 30, 2018
, respectively, our revenues, less transaction-based expenses, would have been $3.6 billion and $1.2 billion for the
nine and three months ended
September 30, 2018
, respectively, an increase of 4% and 5%, respectively, from the comparable periods in
2017
.
|
•
|
Operating expenses increased $59 million and $48 million for the
nine and three months ended
September 30, 2018
, respectively, from the comparable periods in
2017
. See “- Consolidated Operating Expenses” below for a discussion of the significant changes in our operating expenses. The increase in operating expenses for the
nine months ended September 30, 2018
from the comparable period in
2017
, includes $14 million in unfavorable foreign exchange effects arising from the weakening U.S. dollar during that period. There was no significant foreign exchange impact on our operating expenses for the
three months ended September 30, 2018
from the comparable period in
2017
. Excluding the $14 million in unfavorable foreign exchange effects for the
nine months ended September 30, 2018
, our operating expenses would have been $1.8 billion, an increase of 3% from the comparable period in 2017.
|
|
•
|
In connection with the merger of Cetip, S.A., or Cetip, with BM&FBOVESPA S.A., which changed its name to B3 S.A. - Brasil, Bolsa, Balcão, or B3, on March 29, 2017, we recognized a
$176 million
realized investment gain in other income (expense), net for the
nine months ended
September 30, 2017
and $9 million in foreign exchange losses and transaction expenses in other income (expense), net for the
nine months ended
September 30, 2017
. See “- Consolidated Non-Operating Income (Expense)” below.
|
Variability in Quarterly Comparisons
The business environments in which we operate directly affect our results of operations. Our results have been and will continue to be affected by many factors, including, without limitation, market volatility and the level of trading activity in our markets, which during any period is significantly influenced by general market conditions; legislative and regulatory changes as well as fulfillment of our regulatory obligations; competition; demand for our market data services and our market share; our system reliability; our ability to offer new products; acquisition and divestiture activity and the pace of industry consolidation; broad trends in the data and finance industry; the number and financial health of companies listed on our cash markets; geopolitical events; real and perceived supply and demand imbalance; changing technology in the financial services industry; and our reputation, among other factors. Our business environment has been characterized by industry consolidation and increasing competition among global markets for trading, clearing and listings; the globalization of exchanges, customers and competitors; market participants’ rising demand for speed, data capacity and connectivity, which requires ongoing investment in technology; evolving and disparate regulation across multiple jurisdictions; and increasing focus on capital and cost efficiencies.
Price volatility increases the need to hedge risk and creates demand among market participants for the exchange of risk through trading and clearing. Market liquidity is one of the primary market attributes for attracting and maintaining customers and is an important indicator of a market’s strength. In addition, the ability to evolve existing products to serve emerging needs, develop new products and respond to competitive dynamics in pricing, exclusivity and consolidation is important to our business. Changes in these and other factors could cause our revenues to fluctuate from period to period and these fluctuations may affect the reliability of period to period comparisons of our revenues and operating results. For additional information regarding the factors that affect our results of operations, see Item 1(A) “Risk Factors” included in our 2017 Form 10-K.
Segment Reporting
We operate two business segments: our Trading and Clearing segment and our Data and Listings segment. This presentation is reflective of how our chief operating decision maker reviews and operates our business. Our Trading and Clearing segment comprises our transaction-based execution and clearing businesses. Our Data and Listings segment comprises our subscription-based data services and securities listings businesses. Our chief operating decision maker does not review total assets or statements of income below operating income by segments; therefore, such information is not presented below. Our two segments do not engage in intersegment transactions.
While revenues are allocated directly to segments, a significant portion of our operating expenses are not solely related to a specific segment because the expenses serve functions that are necessary for the operation of both segments. Because these expenses do not relate to a single segment, we have employed a reasonable allocation method to allocate expenses between the segments for presentation purposes. We have elected to use a pro-rata revenue approach as the allocation method for the expenses that do not relate solely to one segment. Further, precise allocation of expenses to specific revenue streams within these segments is not reasonably possible. Accordingly, we did not allocate expenses to specific revenue streams within the segments.
33
Certain segment expenses for the
nine and three months ended
September 30, 2017
have been reclassified to conform to our current period’s segment financial statement presentation. This reclassification increased the operating expenses for the Data and Listings segment by
$50 million
and
$17 million
for the
nine and three months ended
September 30, 2017
, respectively, while decreasing the operating expenses for the Trading and Clearing segment by the same amount.
Trading and Clearing Segment
The following charts and table present our selected statements of income data for our Trading and Clearing segment (dollars in millions and YTD represents the nine-month periods ended September 30th):


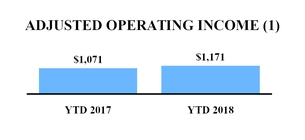
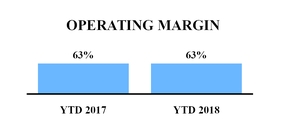

(1)
The adjusted numbers in the charts above are calculated by excluding items that are not reflective of our cash operations and core business performance. As a result, these adjusted numbers are not calculated in accordance with U.S. GAAP. See “- Non-GAAP Financial Measures” below.
34
|
Nine Months Ended
September 30, |
Three Months Ended September 30,
|
||||||||||||||||||||
|
2018
|
2017
|
Change
|
2018
|
2017
|
Change
|
||||||||||||||||
|
Revenues:
|
|||||||||||||||||||||
|
Energy futures and options contracts
|
$
|
708
|
|
$
|
682
|
|
4
|
%
|
$
|
223
|
|
$
|
223
|
|
—
|
%
|
|||||
|
Agricultural and metals futures and options contracts
|
197
|
|
167
|
|
18
|
|
58
|
|
49
|
|
17
|
|
|||||||||
|
Interest rates and other financial futures and options contracts
|
262
|
|
254
|
|
3
|
|
77
|
|
82
|
|
(6
|
)
|
|||||||||
|
Cash equities and equity options
|
1,162
|
|
1,126
|
|
3
|
|
335
|
|
355
|
|
(6
|
)
|
|||||||||
|
OTC and other transactions
|
193
|
|
144
|
|
35
|
|
67
|
|
49
|
|
40
|
|
|||||||||
|
Transaction and clearing, net
|
2,522
|
|
2,373
|
|
6
|
|
760
|
|
758
|
|
—
|
|
|||||||||
|
Other revenues
|
169
|
|
148
|
|
14
|
|
61
|
|
54
|
|
13
|
|
|||||||||
|
Revenues
|
2,691
|
|
2,521
|
|
7
|
|
821
|
|
812
|
|
1
|
|
|||||||||
|
Transaction-based expenses
|
928
|
|
910
|
|
2
|
|
263
|
|
289
|
|
(9
|
)
|
|||||||||
|
Revenues, less transaction-based expenses
|
1,763
|
|
1,611
|
|
9
|
|
558
|
|
523
|
|
7
|
|
|||||||||
|
Other operating expenses
|
492
|
|
452
|
|
9
|
|
171
|
|
153
|
|
11
|
|
|||||||||
|
Depreciation and amortization
|
155
|
|
142
|
|
9
|
|
53
|
|
44
|
|
21
|
|
|||||||||
|
Acquisition-related transaction and integration costs
|
8
|
|
1
|
|
n/a
|
|
6
|
|
1
|
|
n/a
|
|
|||||||||
|
Operating expenses
|
655
|
|
595
|
|
10
|
|
230
|
|
198
|
|
17
|
|
|||||||||
|
Operating income
|
$
|
1,108
|
|
$
|
1,016
|
|
9
|
%
|
$
|
328
|
|
$
|
325
|
|
1
|
%
|
|||||
Transaction and Clearing Revenues
Overview
Our transaction and clearing revenues are reported on a net basis, except for the NYSE transaction-based expenses discussed below, and consist of fees collected from our derivatives, fixed income, cash equities and equity options trading and derivatives clearing. In our derivatives markets, we earn transaction and clearing revenues from both counterparties to each contract that is traded and/or cleared, and in our equity and equity options markets, we receive trade execution fees as well as routing fees related to orders in our markets which are routed to other markets for execution.
Rates per-contract, or RPC, are driven by the number of contracts or securities traded and the fees charged per contract, net of certain rebates. Our per-contract transaction and clearing revenues will depend upon many factors, including, but not limited to, market conditions, transaction and clearing volume, product mix, pricing, applicable revenue sharing and market making agreements, and new product introductions. Because transaction and clearing revenues are generally assessed on a per-contract basis, revenues and profitability fluctuate with changes in contract volume and due to product mix.
For both the
nine months ended
September 30, 2018
and
2017
, 20% of our Trading and Clearing segment revenues, less transaction-based expenses, were billed in pounds sterling or euros and for the
three months ended
September 30, 2018
and
2017
, 19% and 21%, respectively, were billed in pounds sterling or euros. As the pound sterling or euro exchange rate changes, the U.S. equivalent of revenues denominated in foreign currencies changes accordingly. The weakening of the U.S. dollar compared to the pound sterling and euro resulted in an increase to our Trading and Clearing segment revenues, less transaction-based expenses, by $24 million for the
nine months ended
September 30, 2018
, from the comparable period in
2017
and there was no significant impact for the
three months ended
September 30, 2018
from the comparable period in 2017. See Item 3 “- Quantitative and Qualitative Disclosures About Market Risk - Foreign Currency Exchange Rate Risk” below for additional information on the impact of currency fluctuations.
Our transaction and clearing revenues are presented net of rebates. We recorded rebates of $615 million and $576 million for the
nine months ended
September 30, 2018
and
2017
, respectively, and $183 million and $184 million for the
three months ended
September 30, 2018
and
2017
, respectively. We offer rebates in certain of our markets primarily to support market liquidity and trading volume by providing qualified participants in those markets a discount to the applicable commission rate. Such rebates are calculated based on volumes traded. The increase in the rebates is due primarily to an increase in the number of participants in the rebate programs offered on various contracts, an increase in our traded volume and an increase in the number of rebate programs.
35
Energy Futures and Options Contracts
Total energy volume decreased 3% and revenues increased 4% for the
nine months ended
September 30, 2018
from the comparable period in
2017
. Total energy volume decreased 6% and revenues were flat for the three months ended
September 30, 2018
from the comparable period in
2017
. Revenues increased despite volume declines because of a higher mix of gasoil and emissions volumes, which have a higher average RPC than other energy products. We operate global crude oil and refined oil futures markets, including the ICE Brent, ICE WTI and ICE Gasoil futures and options contracts, as well as over 500 refined oil futures products that relate to our benchmark futures contracts and other key price benchmarks. The ICE Brent crude contract is relied upon by a broad range of global market participants, including oil producing nations and multinational companies, to price and hedge their crude oil production and consumption. The Brent complex, which includes ICE Brent crude futures, is a group of related benchmarks used to price an array of traded oil products, including approximately two-thirds of the world’s internationally-traded crude oil. The ICE Low Sulphur Gasoil contract is a European diesel oil contract that offers physical delivery and serves as the leading middle distillate pricing benchmark for refined oil products, particularly in Europe and Asia.
Total oil volume was flat for the
nine months ended
September 30, 2018
from the comparable period in
2017
. Total oil volume decreased 9% for the three months ended
September 30, 2018
from the comparable period in
2017
due to a more pronounced seasonality impact than in the comparable period in
2017
, coupled with strong volumes in the prior year period driven by shifting supply-demand dynamics. ICE Brent crude futures and options volume decreased 2% and 8% during the
nine and three months ended
September 30, 2018
, respectively, from the comparable periods in
2017
. ICE WTI crude futures and options volume increased 1% and decreased 14% for the
nine and three months ended
September 30, 2018
, respectively, from the comparable periods in
2017
. Gasoil futures and options volume increased 7% for the
nine months ended
September 30, 2018
from the comparable period in
2017
, primarily driven by increasing demand for distillates and strong economic activity in Europe and Asia. Gasoil futures and options volume decreased 13% for the three months ended
September 30, 2018
driven by a more pronounced seasonality impact than in the comparable period in
2017
.
Our global natural gas futures and options volume decreased 9% and 2% for the
nine and three months ended
September 30, 2018
, respectively, from the comparable periods in
2017
. Volume decreased primarily due to lower U.S. price volatility reducing our commercial customers' need to hedge the Henry Hub contract, and depressed gas prices driven by a continued surplus of natural gas during the
nine months ended
September 30, 2018
as compared to the same period in
2017
. Our Henry Hub natural gas volume decrease was partially offset by increased volumes in our North American basis market and European natural gas products.
Agricultural and Metals Futures and Options Contracts
Total volume and revenues in our agricultural and metals futures and options markets increased 15% and 18% for the
nine months ended
September 30, 2018
, respectively, from the comparable period in
2017
, and increased 16% and 17% for the three months ended
September 30, 2018
, respectively, from the comparable period in
2017
. Volume in our largest agricultural contract, sugar futures and options, increased 17% and 21% for the
nine and three months ended
September 30, 2018
, respectively, from the comparable periods in
2017
, and other agricultural and metal futures and options volume increased 13% and 12% for the
nine and three months ended
September 30, 2018
, respectively, from the comparable periods in
2017
. The increases in agricultural volumes in 2018 as compared to 2017 were primarily resulting from price volatility driven by shifting supply and demand dynamics.
Interest Rates and Other Financial Futures and Options Contracts
Interest rates futures and options volume and revenue increased 7% and 14%, respectively, for the
nine months ended
September 30, 2018
from the comparable period in
2017
, and increased 4% and was flat, respectively, for the three months ended
September 30, 2018
from the comparable period in
2017
. Interest rate futures and options volume increased during the
nine and three months ended
September 30, 2018
primarily due to expectations for heightened central bank activity during 2018 coupled with geopolitical risk in the U.K. and Europe. Interest rate futures and options revenues increased more than traded volumes, compared to the prior year periods, primarily due to the impact of foreign currency translation and fewer market making rebates. Other financial futures and options volume decreased 18% and 19%, respectively, for the
nine and three months ended
September 30, 2018
from the comparable periods in
2017
, primarily due to the 2017 termination of our exclusive license to list futures and options contracts on the Russell indices. Excluding the futures and options contracts on the Russell indices, other financial futures and options volume increased 11% and 4%, respectively, for the
nine and three months ended
September 30, 2018
from the comparable periods in
2017
.
Cash Equities and Equity Options
Cash equities handled volume increased 4% and 7% for the
nine and three months ended
September 30, 2018
, respectively, from the comparable periods in
2017
primarily due to higher total U.S. equity volumes coupled with the May 2018 commencement of trading of NYSE National and the July 2018 acquisition of CHX Holdings, Inc. Cash equities revenues, net of transaction-based expenses, were $157 million for the
nine months ended
September 30, 2018
, an increase of 4% from $149 million for the
nine months
36
ended
September 30, 2017
and $47 million for the three months ended
September 30, 2018
, an increase of 2% from $46 million for the three months ended
September 30, 2017
.
Equity options volume increased 42% and 31% for the
nine and three months ended
September 30, 2018
, respectively, from the comparable periods in
2017
, primarily due to greater equities market volatility during the
nine and three months ended
September 30, 2018
compared to the prior year periods. Equity options revenues, net of transaction-based expenses, were $77 million for the
nine months ended
September 30, 2018
, an increase of 13% from $67 million for the
nine months ended
September 30, 2017
and $25 million for the three months ended
September 30, 2018
, an increase of 13% from $20 million for the three months ended
September 30, 2017
.
OTC and Other Transactions
CDS clearing revenues were $105 million and $86 million for the
nine months ended
September 30, 2018
and
2017
, respectively, and $32 million and $30 million for the three months ended
September 30, 2018
and
2017
, respectively. The notional value of CDS cleared was $12.1 trillion and $8.9 trillion for the
nine months ended
September 30, 2018
and
2017
, respectively, and $3.6 trillion and $3.3 trillion for the
three months ended
September 30, 2018
and
2017
, respectively. The increase in CDS clearing revenues was driven by record buy-side clearing during the
nine months ended
September 30, 2018
. OTC revenues also include revenues from ICE Bonds, which includes BondPoint, TMC Bonds and ICE Credit Trade, our OTC energy business, and other trade confirmation services.
Other Revenues
Other revenues primarily include interest income on certain clearing margin deposits, regulatory penalties and fines, fees for use of our facilities, regulatory fees charged to member organizations of our U.S. securities exchanges, designated market maker service fees, exchange membership fees and agricultural grading and certification fees. The increase in other revenues for the
nine and three months ended
September 30, 2018
from the comparable periods in 2017, is primarily due to increased interest income earned on certain clearing margin deposits, as well as a $5 million settlement received by NYSE Regulation from ING Financial Markets, LLC, or ING, following an investigation into improper conduct by ING's lending desk from 2007 to 2015. The increase was partially offset by a $6 million breakup fee received in August 2017 related to the termination of the derivatives clearing agreement with Euronext Group N.V.'s, or Euronext, under which ICE Clear Netherlands was to provide clearing of Euronext's financial and commodity derivatives.
Selected Operating Data
The following charts and table present trading activity in our futures and options markets by commodity type based on the total number of contracts traded, as well as futures and options rate per contract (in millions, except for percentages and rate per contract amounts and YTD represents the nine month periods ended September 30th):
37
|
Volume and Rates per Contract
|
||||

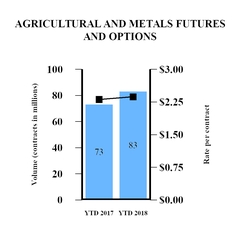

|
Nine Months Ended
September 30, |
Three Months Ended September 30,
|
||||||||||||||||||||
|
2018
|
2017
|
Change
|
2018
|
2017
|
Change
|
||||||||||||||||
|
Number of contracts traded (in millions):
|
|||||||||||||||||||||
|
Energy futures and options
|
507
|
|
520
|
|
(3
|
)%
|
155
|
|
165
|
|
(6
|
)%
|
|||||||||
|
Agricultural and metals futures and options
|
83
|
|
73
|
|
15
|
|
25
|
|
21
|
|
16
|
|
|||||||||
|
Interest rates and other financial futures and options
|
519
|
|
508
|
|
2
|
|
150
|
|
151
|
|
—
|
|
|||||||||
|
Total
|
1,109
|
|
1,101
|
|
1
|
%
|
330
|
|
337
|
|
(2
|
)%
|
|||||||||
|
Rate per contract:
|
|||||||||||||||||||||
|
Energy futures and options
|
$
|
1.40
|
|
$
|
1.31
|
|
7
|
%
|
$
|
1.44
|
|
$
|
1.35
|
|
7
|
%
|
|||||
|
Agricultural and metals futures and options
|
$
|
2.37
|
|
$
|
2.31
|
|
2
|
%
|
$
|
2.34
|
|
$
|
2.32
|
|
1
|
%
|
|||||
|
Interest rates and other financial futures and options
|
$
|
0.49
|
|
$
|
0.48
|
|
2
|
%
|
$
|
0.50
|
|
$
|
0.53
|
|
(6
|
)%
|
|||||
Open interest is the aggregate number of contracts (long or short) that clearing members hold either for their own account or on behalf of their clients. Open interest refers to the total number of contracts that are currently "open,"– in other words, contracts that have been traded but not yet liquidated by either an offsetting trade, exercise, expiration, or assignment. Open interest is also a measure of the future activity remaining to be closed out in terms of the number of contracts that members and their clients continue to hold in the particular contract and by the number of contracts held for each contract month listed by the exchange. The following charts and table present our quarter-end open interest for our futures and options contracts (in thousands, except for percentages):
|
Open Interest
|
||||

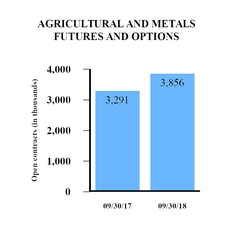

38
|
As of September 30,
|
||||||||
|
2018
|
2017
|
Change
|
||||||
|
Open interest — in thousands of contracts:
|
||||||||
|
Energy futures and options
|
36,312
|
|
35,263
|
|
3
|
%
|
||
|
Agricultural and metals futures and options
|
3,856
|
|
3,291
|
|
17
|
|
||
|
Interest rates and other financial futures and options
|
28,601
|
|
27,531
|
|
4
|
|
||
|
Total
|
68,769
|
|
66,085
|
|
4
|
%
|
||
The following charts and table present selected cash and equity options trading data (all trading volume below is
presented as average net daily trading volume and is single counted and YTD represents the nine-month periods ended September 30th):
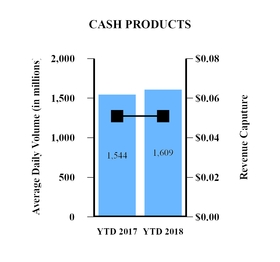


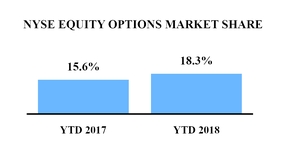
39
|
Nine Months Ended
September 30, |
Three Months Ended September 30,
|
||||||||||||||||
|
2018
|
2017
|
Change
|
2018
|
2017
|
Change
|
||||||||||||
|
Cash products (shares in millions):
|
|||||||||||||||||
|
NYSE listed (Tape A) issues:
|
|||||||||||||||||
|
Handled volume
|
1,095
|
|
1,101
|
|
—
|
%
|
985
|
|
1,014
|
|
(3
|
)%
|
|||||
|
Matched volume
|
1,086
|
|
1,091
|
|
—
|
%
|
976
|
|
1,006
|
|
(3
|
)%
|
|||||
|
Total NYSE listed consolidated volume
|
3,500
|
|
3,463
|
|
1
|
%
|
3,144
|
|
3,194
|
|
(2
|
)%
|
|||||
|
Share of total matched consolidated volume
|
31.0
|
%
|
31.5
|
%
|
(0.5 pts)
|
|
31.0
|
%
|
31.5
|
%
|
(0.4 pts)
|
|
|||||
|
NYSE Arca, NYSE American and regional listed (Tape B) issues:
|
|||||||||||||||||
|
Handled volume
|
324
|
|
298
|
|
9
|
%
|
308
|
|
256
|
|
20
|
%
|
|||||
|
Matched volume
|
315
|
|
290
|
|
9
|
%
|
301
|
|
250
|
|
20
|
%
|
|||||
|
Total NYSE Arca, NYSE American and regional listed consolidated volume
|
1,293
|
|
1,222
|
|
6
|
%
|
1,149
|
|
1,030
|
|
12
|
%
|
|||||
|
Share of total matched consolidated volume
|
24.4
|
%
|
23.7
|
%
|
0.6 pts
|
|
26.2
|
%
|
24.2
|
%
|
1.9 pts
|
|
|||||
|
Nasdaq listed (Tape C) issues:
|
|||||||||||||||||
|
Handled volume
|
190
|
|
145
|
|
31
|
%
|
219
|
|
140
|
|
57
|
%
|
|||||
|
Matched volume
|
178
|
|
136
|
|
31
|
%
|
206
|
|
132
|
|
56
|
%
|
|||||
|
Total Nasdaq listed consolidated volume
|
2,156
|
|
1,913
|
|
13
|
%
|
2,067
|
|
1,841
|
|
12
|
%
|
|||||
|
Share of total matched consolidated volume
|
8.3
|
%
|
7.1
|
%
|
1.2 pts
|
|
9.9
|
%
|
7.2
|
%
|
2.8 pts
|
|
|||||
|
Total cash handled volume
|
1,609
|
|
1,544
|
|
4
|
%
|
1,512
|
|
1,409
|
|
7
|
%
|
|||||
|
Total cash market share matched
|
22.7
|
%
|
23.0
|
%
|
(0.3 pts)
|
|
23.3
|
%
|
22.9
|
%
|
0.4 pts
|
|
|||||
|
Equity options (contracts in thousands):
|
|||||||||||||||||
|
NYSE equity options volume
|
3,226
|
|
2,269
|
|
42
|
%
|
3,070
|
|
2,348
|
|
31
|
%
|
|||||
|
Total equity options volume
|
17,657
|
|
14,505
|
|
22
|
%
|
16,505
|
|
14,098
|
|
17
|
%
|
|||||
|
NYSE share of total equity options
|
18.3
|
%
|
15.6
|
%
|
2.6 pts
|
|
18.6
|
%
|
16.7
|
%
|
1.9 pts
|
|
|||||
|
Revenue capture or rate per contract:
|
|||||||||||||||||
|
Cash products revenue capture (per 100 shares)
|
$0.051
|
$0.051
|
0
|
%
|
$0.048
|
$0.051
|
(6
|
)%
|
|||||||||
|
Equity options rate per contract
|
$0.13
|
$0.16
|
(21
|
)%
|
$0.12
|
$0.14
|
(14
|
)%
|
|||||||||
Handled volume represents the total number of shares of equity securities, ETFs, and crossing session activity internally matched on our exchanges or routed to and executed on an external market center. Matched volume represents the total number of shares of equity securities, ETFs and crossing session activity executed on our exchanges.
Transaction-Based Expenses
Our equities and equity options markets pay fees to the SEC pursuant to Section 31 of the Securities Exchange Act of 1934, or the Exchange Act. Section 31 fees are recorded on a gross basis as a component of transaction and clearing fee revenue. These Section 31 fees are designed to recover the government’s costs of supervising and regulating the securities markets and securities professionals. We, in turn, collect activity assessment fees, which are included in transaction and clearing revenues in our consolidated statements of income, from member organizations clearing or settling trades on the equities and options exchanges and recognize these amounts when invoiced. The activity assessment fees are designed so that they are equal to the Section 31 fees that are included in transaction-based expenses in our consolidated statements of income. As a result, activity assessment fees and the corresponding Section 31 fees do not have an impact on our net income. Activity assessment fees received are included in cash at the time of receipt and, as required by law, the amount due to the SEC is remitted semi-annually and recorded as an accrued liability until paid. As of
September 30, 2018
, the accrued liability related to the un-remitted Section 31 fees was $21 million.
We also incur liquidity payments made to cash and options trading customers and routing charges made to other exchanges that are included in transaction-based expenses. We incur routing charges when we do not have the best bid or offer in the market for a security that a customer is trying to buy or sell on one of our securities exchanges. In that case, we route the customer’s order to the external market center that displays the best bid or offer. The external market center charges us a fee per share (denominated in tenths of a cent per share) for routing to its system. We record routing charges on a gross basis as a component of transaction and clearing fee revenue.
40
Operating Expenses, Operating Income and Operating Margin
Our Trading and Clearing segment operating expenses increased $60 million and $32 million for the
nine and three months ended
September 30, 2018
, respectively, from the comparable periods in
2017
. See “- Consolidated Operating Expenses” below for a discussion of the significant changes in our operating expenses. Our Trading and Clearing segment operating income increased $92 million and $3 million for the
nine and three months ended
September 30, 2018
, respectively, from the comparable periods in
2017
. Trading and Clearing segment operating margins were
63%
for both the
nine months ended
September 30, 2018
and
2017
and
59%
and
62%
for the
three months ended
September 30, 2018
and
2017
, respectively.
Our Trading and Clearing segment adjusted operating expenses were
$592 million
and
$540 million
for the
nine months ended
September 30, 2018
and
2017
, respectively. Our Trading and Clearing segment adjusted operating expenses were
$206 million
and
$181 million
for the
three months ended
September 30, 2018
and
2017
, respectively. Our Trading and Clearing segment adjusted operating income was
$1.2 billion
and
$1.1 billion
for the
nine months ended
September 30, 2018
and
2017
, respectively. Our Trading and Clearing segment adjusted operating income was
$352 million
and
$342 million
for the
three months ended
September 30, 2018
and
2017
, respectively. Our Trading and Clearing segment adjusted operating margins were
66%
for both the
nine months ended
September 30, 2018
and
2017
. Our Trading and Clearing segment adjusted operating margins were
63%
and
65%
for the
three months ended
September 30, 2018
and
2017
, respectively, and the decrease from the prior year period is primarily related to our acquisitions during the
three months ended
September 30, 2018
. See “- Non-GAAP Financial Measures” below.
Data and Listings Segment
The following charts and table present our selected statements of income data for our Data and Listings segment (dollars in millions and YTD represents the nine-month periods ended September 30th):


41


(1)
The adjusted numbers in the charts above are calculated by excluding items that are not reflective of our cash operations and core business performance. As a result, these adjusted numbers are not calculated in accordance with U.S. GAAP. See “- Non-GAAP Financial Measures” below.
|
Nine Months Ended
September 30, |
Three Months Ended September 30,
|
||||||||||||||||||||
|
2018
|
2017
|
Change
|
2018
|
2017
|
Change
|
||||||||||||||||
|
Revenues:
|
|||||||||||||||||||||
|
Pricing and analytics
|
$
|
779
|
|
$
|
722
|
|
8
|
%
|
$
|
263
|
|
$
|
242
|
|
9
|
%
|
|||||
|
Exchange data
|
433
|
|
416
|
|
4
|
|
146
|
|
136
|
|
7
|
|
|||||||||
|
Desktops and connectivity
|
364
|
|
421
|
|
(13
|
)
|
121
|
|
140
|
|
(13
|
)
|
|||||||||
|
Data services
|
1,576
|
|
1,559
|
|
1
|
|
530
|
|
518
|
|
2
|
|
|||||||||
|
Listings
|
332
|
|
322
|
|
3
|
|
112
|
|
105
|
|
7
|
|
|||||||||
|
Revenues
|
1,908
|
|
1,881
|
|
1
|
|
642
|
|
623
|
|
3
|
|
|||||||||
|
Other operating expenses
|
810
|
|
822
|
|
(1
|
)
|
273
|
|
265
|
|
3
|
|
|||||||||
|
Acquisition-related transaction and integration costs
|
25
|
|
26
|
|
(8
|
)
|
—
|
|
3
|
|
n/a
|
|
|||||||||
|
Depreciation and amortization
|
274
|
|
262
|
|
5
|
|
95
|
|
84
|
|
12
|
|
|||||||||
|
Operating expenses
|
1,109
|
|
1,110
|
|
—
|
|
368
|
|
352
|
|
5
|
|
|||||||||
|
Operating income
|
$
|
799
|
|
$
|
771
|
|
4
|
%
|
$
|
274
|
|
$
|
271
|
|
1
|
%
|
|||||
Our Data and Listings segment represents subscription-based, or recurring, revenues from data services and listings services offered across our trading and clearing businesses and ICE Data Services. Through ICE Data Services, we generate revenues from a range of global financial and commodity markets, including pricing and reference data, exchange data, analytics, feeds, index services, desktops and connectivity solutions. Through NYSE, NYSE American and NYSE Arca, we generate listings revenue related to the provision of listings services for public companies and ETFs, and related corporate actions for listed companies.
For the
nine months ended
September 30, 2018
and
2017
, 7% and 10%, respectively, of our Data and Listings segment revenues were billed in pounds sterling or euros and for the
three months ended
September 30, 2018
and
2017
, 7% and 10%, respectively, were billed in pounds sterling or euros (all relating to our data services revenues). As the pound sterling or euro exchange rate changes, the U.S. equivalent of revenues denominated in foreign currencies changes accordingly. Due to the weakening of the U.S. dollar compared to the pound sterling and euro, our Data and Listings segment revenues were $9 million higher for the
nine months ended
September 30, 2018
, from the comparable period in
2017
and there was no significant impact for the
three months ended
September 30, 2018
from the comparable period in
2017
.
Data Services Revenues
Our pricing and analytics services consist of an extensive set of independent continuous and end-of-day evaluated pricing services focused primarily on fixed income and international equity securities, valuation services, reference data, and multi-asset class portfolio and risk management analytics. We also serve as an administrator of regulated benchmarks. Our index services offer a range of products across fixed income, energy, equities, ETFs and other asset classes to provide the methodology, pricing and licensing of indices and benchmarks.
Our exchange data revenues primarily represent subscription fees for the provision of our market data that is created from activity on our exchanges, which is driven by the products and technology we develop to deliver real-time views of markets and related information. In our derivatives markets, exchange data revenues relate to subscription fees charged for customer and license access from third party data vendors, or quote vendors, and from end users, as well as view-only data access, direct access services, terminal access, daily indices, forward curves, and end-of-day reports.
42
We also earn exchange data revenues relating to our cash equity and options markets, and related data services. We collect cash trading market data fees principally for consortium-based data products and, to a lesser extent, for NYSE proprietary data products. Consortium-based data fees are determined by the securities industry plans and are charged to vendors based on their redistribution of data. Consortium-based data revenues (net of administrative costs) are distributed to participating securities markets on the basis of a formula set by the SEC under Regulation National Market System, or Regulation NMS. Last trade prices and quotes in NYSE-listed, NYSE American-listed, and NYSE Arca-listed securities are disseminated through “Tape A” and “Tape B,” which constitute the majority of our revenues from consortium-based market data revenues.
Our desktops and connectivity services comprise technology-based information platforms, feeds and connectivity solutions. These include trading applications, desktop solutions, data feeds and infrastructure to support trading, voice brokers and investment functions through our ICE Global Network. Our desktop and web-based applications deliver real-time market information, analytical and decision support tools to support trading and investment decisions. Through our consolidated feeds, clients receive market data from global exchanges, trading venues, news and data sources for exchange-traded and OTC markets. Our connectivity service, ICE Global Network, offers clients a secure, resilient, private multi-participant network that provides access to global exchanges and content service providers. Our infrastructure managed services solution also offers colocation space, direct exchange access, proximity hosting and support services that enable access to real-time exchange data, and facilitates low latency, secure electronic market access.
Our data services revenues increased 1% for the
nine months ended
September 30, 2018
and increased 2% for the
three months ended
September 30, 2018
, respectively, from the comparable periods in
2017
, primarily due to the strong retention rate of existing customers, the addition of new customers, increased purchases by existing customers, our acquisitions of TMX Atrium in May 2017 and Bank of America Merrill Lynch's, or BofAML, Global Research Division’s index business in October 2017 and the impact of foreign currency translation. These increases were offset by the divestitures of IDMS in March 2017 and Trayport in December 2017 in our desktop and connectivity business.
Annual Subscription Value
Annual Subscription Value, or ASV, represents, at a point in time, the data services revenues subscribed for the succeeding 12 months. ASV does not include new sales, contract terminations or price changes that may occur during that twelve-month period. ASV also does not include certain data services revenue streams that are not subscription-based. Revenue from ASV businesses has historically represented approximately 90% of our data revenues. Organic ASV is adjusted for acquisitions, divestitures or discontinued businesses to provide an organic view of comparable performance on a year-over-year basis at the beginning of the quarter, and is calculated using the current spot rate. Prior period comparisons have been adjusted to use the current period spot rates for both the pound sterling and the euro. Thus, while it is an indicative forward-looking metric, it does not provide a growth forecast of the next 12 months of data services revenues.
As of
September 30, 2018
, ASV was $1.902 billion. Organic ASV was $1.863 billion, which increased 6.6% compared to the organic ASV as of
September 30, 2017
. Underpinning this growth is strength in both our pricing and analytics business and our connectivity services.
Listings Revenues
We recognize listings revenues in our securities markets from fees applicable to companies listed on our cash equities exchanges – original listing fees and annual listing fees. Original listing fees consist of two components: initial listing fees and fees related to corporate actions. Initial listing fees, subject to a minimum and maximum amount, are based on the number of shares that a company initially lists. All listings fees are billed upfront and the identified performance obligations are satisfied over time. Upon our January 1, 2018 adoption of the ASC 606 accounting framework, revenue related to the investor relations performance obligation is recognized ratably over a
two
-year period, with the remaining revenue recognized ratably over time as customers continue to list on our exchanges, which is generally estimated to be over a period of up to
nine
years for NYSE and up to
five
years for NYSE Arca and NYSE American.
In addition, we earn corporate actions-related listing fees in connection with actions involving the issuance of new shares, such as stock splits, rights issues and sales of additional securities, as well as mergers and acquisitions. Listings fees related to other corporate actions are considered contract modifications of our listing contracts and are recognized ratably over time as customers continue to list on our exchanges, which is generally estimated to be a period of
six
years for NYSE and
three
years for NYSE Arca and NYSE American.
Operating Expenses, Operating Income and Operating Margin
Our Data and Listings segment operating expenses decreased $1 million and increased $16 million for the
nine and three months ended
September 30, 2018
, respectively, from the comparable periods in
2017
. See “- Consolidated Operating Expenses” below for a discussion of the significant changes in our operating expenses. Our Data and Listings segment operating income increased $28
43
million and $3 million for the
nine and three months ended
September 30, 2018
, respectively, from the comparable periods in
2017
. Our Data and Listings segment operating margins were
42%
and
41%
for the
nine months ended
September 30, 2018
and
2017
, respectively, and
43%
for both the
three months ended
September 30, 2018
and
2017
. The operating income and operating margin increases were driven by the revenue increases discussed above.
Our Data and Listings segment adjusted operating expenses were
$926 million
for both the
nine months ended
September 30, 2018
and
2017
and
$315 million
and
$298 million
for the
three months ended
September 30, 2018
and
2017
, respectively. Our Data and Listings segment adjusted operating income was
$982 million
and
$955 million
for the
nine months ended
September 30, 2018
and
2017
, respectively, and
$327 million
and
$325 million
for the
three months ended
September 30, 2018
and
2017
, respectively. Data and Listings segment adjusted operating margins were
51%
for both the
nine months ended
September 30, 2018
and
2017
, and
51%
and
52%
for the
three months ended
September 30, 2018
and
2017
, respectively. See “- Non-GAAP Financial Measures” below.
Consolidated Operating Expenses
The following chart and table present our consolidated operating expenses (dollars in millions and YTD represents the nine-month periods ended September 30th):
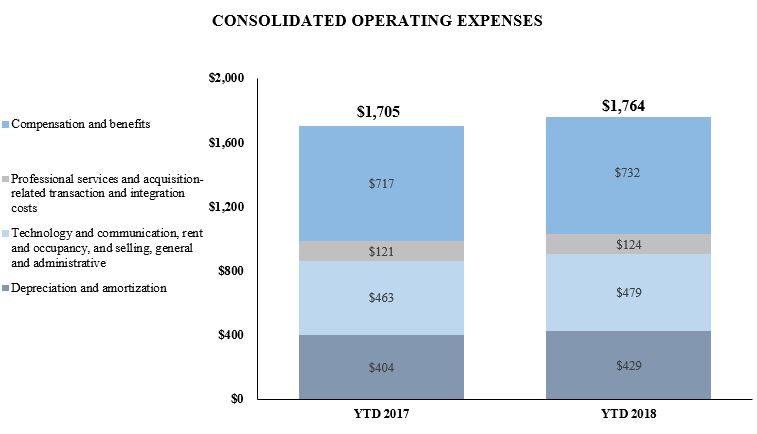
|
Nine Months Ended
September 30, |
Three Months Ended September 30,
|
||||||||||||||||||||
|
2018
|
2017
|
Change
|
2018
|
2017
|
Change
|
||||||||||||||||
|
Compensation and benefits
|
$
|
732
|
|
$
|
717
|
|
2
|
%
|
$
|
251
|
|
$
|
234
|
|
7
|
%
|
|||||
|
Professional services
|
91
|
|
94
|
|
(3
|
)
|
32
|
|
30
|
|
8
|
|
|||||||||
|
Acquisition-related transaction and integration costs
|
33
|
|
27
|
|
23
|
|
6
|
|
4
|
|
74
|
|
|||||||||
|
Technology and communication
|
320
|
|
294
|
|
9
|
|
107
|
|
99
|
|
9
|
|
|||||||||
|
Rent and occupancy
|
50
|
|
52
|
|
(4
|
)
|
17
|
|
17
|
|
(2
|
)
|
|||||||||
|
Selling, general and administrative
|
109
|
|
117
|
|
(7
|
)
|
37
|
|
38
|
|
(3
|
)
|
|||||||||
|
Depreciation and amortization
|
429
|
|
404
|
|
6
|
|
148
|
|
128
|
|
15
|
|
|||||||||
|
Total operating expenses
|
$
|
1,764
|
|
$
|
1,705
|
|
4
|
%
|
$
|
598
|
|
$
|
550
|
|
9
|
%
|
|||||
44
For the
nine months ended
September 30, 2018
and
2017
, 13% and 15%, respectively, of our consolidated operating expenses were incurred in pounds sterling or euros and 13% and 14%, respectively, for the
three months ended
September 30, 2018
and
2017
were billed in pounds sterling or euros. As the pound sterling or euro exchange rate changes, the U.S. equivalent of operating expenses denominated in foreign currencies changes accordingly. Due to the weakening of the U.S. dollar compared to the pound sterling and euro, our consolidated operating expenses increased $14 million and were flat, for the
nine months ended
and the
three months ended
September 30, 2018
, respectively, from the comparable periods in
2017
. See Item 3 “- Quantitative and Qualitative Disclosures About Market Risk - Foreign Currency Exchange Rate Risk” below for additional information on the impact of currency fluctuations.
As of
September 30, 2018
, we had 5,042 employees and as of
September 30, 2017
, we had 5,100 employees. Our employee headcount decreased over the last year primarily due to employee departures in connection with the divestiture of Trayport in December 2017 and continued employee terminations associated with our integration of Interactive Data. These decreases in our employee headcount were partially offset by new employees related to the acquisitions of CHX Holdings, Inc. and TMC Bonds in July 2018, BondPoint in January 2018, ICE NGX in December 2017 and BofAML’s Global Research Division’s index business in October 2017. Non-cash compensation expenses recognized in our consolidated financial statements for employee stock options and restricted stock were
$93 million
and
$102 million
for the
nine months ended
September 30, 2018
and
2017
, respectively, and
$32 million
and
$34 million
for the
three months ended
September 30, 2018
and
2017
, respectively. We incurred employee severance and retention costs of $30 million and $16 million for the
nine months ended
September 30, 2018
and
2017
, respectively, and $13 million and $8 million for the
three months ended
September 30, 2018
and
2017
, respectively.
Our compensation and benefits expenses increased during the
nine and three months ended
September 30, 2018
from the comparable periods in 2017 primarily due to employee severance and retention costs, partially offset by the net decrease in our employee headcount and a decrease in non-cash compensation expense.
We incurred acquisition-related transaction and integration costs of
$33 million
and
$27 million
during the
nine months ended
September 30, 2018
, and
2017
respectively, and
$6 million
and
$4 million
during the
three months ended
September 30, 2018
and
2017
, respectively, primarily relating to employee termination, lease termination and professional services costs resulting from our 2018 acquisitions, as well as a $5 million banker success fee in connection with our acquisition of TMC Bonds.
Technology and communication expenses, which also include licensing and other fee agreement expenses, increased for the
nine and three months ended
September 30, 2018
, from the comparable periods in
2017
, primarily due to increased hosting costs, maintenance costs related to our recent acquisitions and higher fees related to revenue sharing agreements.
Selling, general and administrative expenses decreased for the
nine and three months ended
September 30, 2018
, from the comparable periods in
2017
, primarily due to $14 million and $4 million in accruals made during the
nine and three months ended
September 30, 2017
, respectively, relating to SEC investigations and inquiries. See Part II, Item 1 “- Legal Proceedings” below for additional information on the accruals for these matters.
We recorded depreciation expenses on our fixed assets of $214 million and $192 million for the
nine months ended
September 30, 2018
and
2017
, respectively, and $75 million and $64 million for the
three months ended
September 30, 2018
and
2017
, respectively. The increase in depreciation expense recorded during the
nine and three months ended
September 30, 2018
, from the comparable periods in
2017
is primarily due to depreciation resulting from increased software development.
We recorded amortization expenses on the intangible assets acquired as part of our acquisitions, as well as on other intangible assets, of $211 million and $206 million for the
nine months ended
September 30, 2018
and
2017
, respectively, and $73 million and $64 million for the
three months ended
September 30, 2018
and
2017
, respectively. Amortization expenses recorded for the
nine months ended
September 30, 2018
, include a $4 million impairment loss on exchange registration intangible assets related to our closure of ICE Futures Canada and ICE Clear Canada. Amortization expense increased during the
nine and three months ended
September 30, 2018
from the same prior year periods as a result of ICE NGX, BondPoint, TMC Bonds, BofAML Indices and TMX Atrium intangible assets. This increase in amortization expense was partially offset by a decrease in amortization recorded on our Russell license intangible assets during the
nine and three months ended
September 30, 2018
from the same prior year periods because they became fully amortized, as well as amortization expense recorded for the
nine months ended
September 30, 2017
as a result of the net loss of $6 million on the sale of NYSE Governance Services.
45
Consolidated Non-Operating Income (Expense)
Income and expenses incurred through activities outside of our core operations are considered non-operating. The following table presents our non-operating income (expenses) (dollars in millions):
|
Nine Months Ended
September 30, |
Three Months Ended September 30,
|
||||||||||||||||||||
|
2018
|
2017
|
Change
|
2018
|
2017
|
Change
|
||||||||||||||||
|
Other income (expense):
|
|||||||||||||||||||||
|
Interest expense
|
$
|
(173
|
)
|
$
|
(137
|
)
|
26
|
%
|
$
|
(66
|
)
|
$
|
(47
|
)
|
39
|
%
|
|||||
|
Other income, net
|
48
|
|
205
|
|
(77)
|
18
|
|
14
|
|
26
|
|||||||||||
|
Total other income (expense), net
|
$
|
(125
|
)
|
$
|
68
|
|
n/a
|
|
$
|
(48
|
)
|
$
|
(33
|
)
|
44
|
%
|
|||||
|
Net income attributable to non-controlling interest
|
$
|
(24
|
)
|
$
|
(22
|
)
|
11
|
%
|
$
|
(7
|
)
|
$
|
(6
|
)
|
14
|
%
|
|||||
Interest expense increased for the
nine and three months ended
September 30, 2018
from the comparable periods in
2017
, primarily due to a rise in short-term interest rates impacting our Commercial Paper Program, along with interest expense related to our bond refinancing in August 2017 and August 2018.
We recognized equity income relating to our ownership in MERS, and The Options Clearing Corporation, or OCC, in other income, which was $27 million and $23 million for the
nine months ended
September 30, 2018
and
2017
, respectively, and $13 million and $10 million for the
three months ended
September 30, 2018
and
2017
, respectively. We account for these investments as equity investments.
In connection with Cetip’s merger with B3 on March 29, 2017, we recognized a $176 million realized investment gain in other income for the
nine months ended
September 30, 2017
and we recognized $9 million in foreign exchange losses and transaction expenses in other expense for the
nine months ended
September 30, 2017
. We recognized dividend income received relating to our investment in Cetip in other income of $5 million for the
nine months ended
September 30, 2017
. We no longer receive any dividends from Cetip subsequent to its sale in the first quarter of 2017.
In connection with our equity investment in Euroclear, we recognized dividend income of $15 million for the
nine months ended
September 30, 2018
, which is included in other income.
In connection with our adoption of ASU 2017-07, we are recognizing the other components of net benefit cost of our defined benefit plans in the income statement outside of operating income on a full retrospective basis. The combined net periodic (expense) benefit of these plans was (
$6 million
) and
$6 million
for the nine months ended September 30, 2018 and 2017, respectively, and ($
2 million
) and
$2 million
for the three months ended September 30, 2018 and 2017, respectively.
We incurred foreign currency transaction losses of
$1 million
and
$2 million
for the
nine months ended
September 30, 2018
and
2017
, respectively, and
$1 million
for the
three months ended
September 30, 2017. There was no significant foreign currency transaction impact for the
three months ended
September 30, 2018
. Foreign currency gains and losses are recorded in other income, net, when the settlement of foreign currency assets, liabilities and payables that occur through our foreign operations are received in non-functional currencies due to the increase or decrease in the period-end foreign currency exchange rates between periods.
For consolidated subsidiaries in which our ownership is less than 100%, and for which we have control over the assets, liabilities and management of the entity, the outside stockholders’ interests are shown as non-controlling interest in our consolidated financial statements. As of
September 30, 2018
, non-controlling interest includes those related to the operating results of our CDS clearing subsidiaries in which non-ICE limited partners held an ownership interest in our CDS clearing subsidiaries. During September 2018, we purchased 3.2% of ownership interest of a non-ICE limited partner, and the remaining non-ICE limited partners hold a 26.7% ownership interest as of September 30, 2018.
Consolidated Income Tax Provision
Consolidated income tax expense was
$381 million
and
$540 million
for the
nine months ended
September 30, 2018
and
2017
, respectively, and
$89 million
and
$186 million
for the
three months ended
September 30, 2018
and
2017
, respectively. The change in consolidated income tax expense between periods is primarily due to the tax impact of changes in our pre-tax income and the changes in our effective tax rate each period. Our effective tax rate was
21%
and
29%
for the
nine months ended
September 30, 2018
and
2017
, respectively, and
16%
and
33%
for the
three months ended September 30, 2018
and
2017
, respectively. The effective tax rates for the
nine and three months ended
September 30, 2018
as compared to the same periods in
2017
were lower primarily due to the enactment of the TCJA in December 2017, which reduced the U.S. federal corporate income tax rate from 35% to 21% effective January 1, 2018. In addition, for the
three months ended September 30, 2018
, the effective tax rate was further reduced due to deferred
46
tax benefits associated with the U.S. tax rate reduction resulting from changes in estimates, along with additional tax benefits associated with our sale of Trayport in 2017.
We recorded our income tax provision based on the TCJA and related state provisions, as enacted as of
September 30, 2018
. Any potential federal or state administrative and/or legislative adjustments to certain provisions in the TCJA and related state provisions have not been taken into consideration.
Quarterly Results of Operations
The following quarterly unaudited consolidated statements of income data have been prepared on substantially the same basis as our audited consolidated financial statements and include all adjustments, consisting only of normal recurring adjustments, necessary for the fair presentation of our consolidated results of operations for the quarters presented. The historical results for any quarter do not necessarily indicate the results expected for any future period. The following table sets forth quarterly consolidated statements of income data (in millions):
|
Three Months Ended,
|
|||||||||||||||||||
|
September 30, 2018
|
June 30, 2018
|
March 31, 2018
|
December 31,
2017 |
September 30, 2017
|
|||||||||||||||
|
Revenues:
|
|||||||||||||||||||
|
Energy futures and options contracts
|
$
|
223
|
|
$
|
250
|
|
$
|
235
|
|
$
|
227
|
|
$
|
223
|
|
||||
|
Agricultural and metals futures and options contracts
|
58
|
|
74
|
|
65
|
|
49
|
|
49
|
|
|||||||||
|
Interest rates and other financial futures and options contracts
|
77
|
|
94
|
|
91
|
|
72
|
|
82
|
|
|||||||||
|
Cash equities and equity options
|
335
|
|
389
|
|
438
|
|
365
|
|
355
|
|
|||||||||
|
OTC and other transactions
|
67
|
|
57
|
|
69
|
|
45
|
|
49
|
|
|||||||||
|
Total transaction and clearing, net
|
760
|
|
864
|
|
898
|
|
758
|
|
758
|
|
|||||||||
|
Pricing and analytics
|
263
|
|
262
|
|
254
|
|
248
|
|
242
|
|
|||||||||
|
Exchange data
|
146
|
|
144
|
|
143
|
|
140
|
|
136
|
|
|||||||||
|
Desktops and connectivity
|
121
|
|
120
|
|
123
|
|
137
|
|
140
|
|
|||||||||
|
Total data services
|
530
|
|
526
|
|
520
|
|
525
|
|
518
|
|
|||||||||
|
Listings
|
112
|
|
111
|
|
109
|
|
104
|
|
105
|
|
|||||||||
|
Other revenues
|
61
|
|
55
|
|
53
|
|
54
|
|
54
|
|
|||||||||
|
Total Revenues
|
1,463
|
|
1,556
|
|
1,580
|
|
1,441
|
|
1,435
|
|
|||||||||
|
Transaction-based expenses
|
263
|
|
310
|
|
355
|
|
295
|
|
289
|
|
|||||||||
|
Total revenues, less transaction-based expenses
|
1,200
|
|
1,246
|
|
1,225
|
|
1,146
|
|
1,146
|
|
|||||||||
|
Compensation and benefits
|
251
|
|
241
|
|
240
|
|
229
|
|
234
|
|
|||||||||
|
Professional services
|
32
|
|
29
|
|
30
|
|
27
|
|
30
|
|
|||||||||
|
Acquisition-related transaction and integration costs
|
6
|
|
15
|
|
12
|
|
9
|
|
4
|
|
|||||||||
|
Technology and communication
|
107
|
|
108
|
|
105
|
|
103
|
|
99
|
|
|||||||||
|
Rent and occupancy
|
17
|
|
16
|
|
17
|
|
17
|
|
17
|
|
|||||||||
|
Selling, general and administrative
|
37
|
|
39
|
|
33
|
|
38
|
|
38
|
|
|||||||||
|
Depreciation and amortization
|
148
|
|
143
|
|
138
|
|
131
|
|
128
|
|
|||||||||
|
Total operating expenses
|
598
|
|
591
|
|
575
|
|
554
|
|
550
|
|
|||||||||
|
Operating income
|
602
|
|
655
|
|
650
|
|
592
|
|
596
|
|
|||||||||
|
Other income (expense), net
(1)
|
(48
|
)
|
(44
|
)
|
(33
|
)
|
79
|
|
(33
|
)
|
|||||||||
|
Income tax expense (benefit)
(2)
|
89
|
|
149
|
|
143
|
|
(568
|
)
|
186
|
|
|||||||||
|
Net income
|
$
|
465
|
|
$
|
462
|
|
$
|
474
|
|
$
|
1,239
|
|
$
|
377
|
|
||||
|
Net income attributable to non-controlling interest
|
(7
|
)
|
(7
|
)
|
(10
|
)
|
(6
|
)
|
(6
|
)
|
|||||||||
|
Net income attributable to Intercontinental, Exchange, Inc.
|
$
|
458
|
|
$
|
455
|
|
$
|
464
|
|
$
|
1,233
|
|
$
|
371
|
|
||||
(1)
Other income (expense), net, for the three months ended December 31, 2017 includes a $110 million gain on our sale of Trayport.
(2)
The decrease in the income tax expenses for the three months ended December 31, 2017 is primarily due to a $764 million deferred tax benefit associated with future U.S. income tax reductions.
47
Liquidity and Capital Resources
Below are charts that reflect our capital allocation. The acquisition and integration costs in the chart below includes cash paid for acquisitions, net of cash received for divestitures, cash paid for investments, cash paid for non-controlling interest and redeemable non-controlling interest, and the acquisition-related transaction and integration costs in each period (YTD represents the nine-month periods ended September 30th):

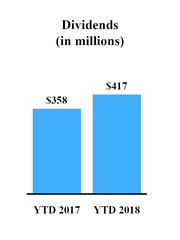
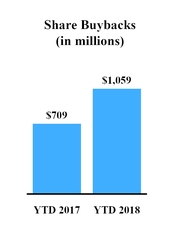


We have financed our operations, growth and cash needs primarily through income from operations and borrowings under our various debt facilities. Our principal capital requirements have been to fund capital expenditures, working capital, strategic acquisitions and investments, stock repurchases, dividends to our stockholders and the continued development of our technology platforms that support our businesses. We believe that our cash on hand and cash flows from operations will be sufficient to repay our outstanding debt but we may also need to incur additional debt or issue additional equity securities in the future. See “- Future Capital Requirements” below.
Our Commercial Paper Program enables us to borrow efficiently at reasonable short-term interest rates and provides us with the flexibility to de-lever using our strong annual cash flows from operating activities whenever our leverage becomes elevated as a result of investment or acquisition activities. During the
nine months ended
September 30, 2018
, we repaid a net amount of $
35 million
under our Commercial Paper Program. See “- Debt” below.
See “- Recent Developments” above for a discussion of the acquisitions and investments that we made during and subsequent to the
nine months ended
September 30, 2018
. These cash acquisitions and investments were funded primarily from borrowing under our Commercial Paper Program along with cash flows from operations.
Upon maturity of old issuances of commercial paper and to the extent old issuances are not repaid by cash on hand, we are exposed to the rollover risk of not being able to issue new commercial paper. To mitigate the rollover risk, we maintain an undrawn back-stop bank revolving credit facility for an aggregate amount equaling at any time the amount issued under our Commercial Paper Program. If we were not able to issue new commercial paper, we have the option of drawing on the back-stop revolving facility. However electing to do so would result in higher interest expense. See “- Debt” below.
48
Consolidated cash and cash equivalents were
$515 million
and
$535 million
as of
September 30, 2018
and
December 31, 2017
, respectively, and short-term and long-term restricted cash and cash equivalents were $
1.1 billion
and $
1.0 billion
as of
September 30, 2018
and
December 31, 2017
, respectively. As of
September 30, 2018
, the amount of cash and cash equivalents held by our non-U.S. subsidiaries was $292 million.
In September 2017, our Board of Directors approved an aggregate of $1.2 billion for future repurchases of our common stock with no fixed expiration date that became effective on January 1, 2018. We expect funding for any stock repurchases to come from our operating cash flow or borrowings under our debt facilities or our Commercial Paper Program. During the
nine months ended
September 30, 2018
, we repurchased
14,394,028
shares of our outstanding common stock at a cost of $
1.1 billion
, excluding shares withheld upon vesting of equity awards. These repurchases are held in treasury stock and were completed on the open market and under our Rule 10b5-1 trading plan. As of
September 30, 2018
, the remaining board authorization permits repurchases of up to $
141 million
of our common stock. In September 2018, our Board of Directors approved an aggregate of $2.0 billion for future repurchases of our common stock with no fixed expiration date that becomes effective January 1, 2019. Refer to Note 8 to our consolidated financial statements and related notes, which are included elsewhere in this Quarterly Report, for more information on our stock repurchase program.
Cash Flows
The following tables present the major components of net increases (decreases) in cash, cash equivalents, and restricted cash and cash equivalents (in millions):
|
Nine Months Ended September 30,
|
|||||||
|
2018
|
2017
|
||||||
|
Net cash provided by (used in):
|
|||||||
|
Operating activities
|
$
|
1,735
|
|
$
|
1,410
|
|
|
|
Investing activities
|
(1,617
|
)
|
207
|
|
|||
|
Financing activities
|
(19
|
)
|
(1,534
|
)
|
|||
|
Effect of exchange rate changes
|
(5
|
)
|
9
|
|
|||
|
Net increase in cash, cash equivalents and restricted cash and cash equivalents
|
$
|
94
|
|
$
|
92
|
|
|
In the fourth quarter of 2017, we adopted ASU 2016-18, which requires us to show the changes in the total of cash, cash equivalents, and restricted cash and cash equivalents in the statement of cash flows. As a result, we no longer present transfers between cash and cash equivalents and restricted cash and cash equivalents in the statement of cash flows. We have reclassified changes in restricted cash from cash flows provided by (used in) investing activities, to the total change in beginning and end-of-year total changes. Our statements of cash flows for the
nine months ended
September 30, 2018
and
2017
reflect this change.
Operating Activities
Net cash provided by operating activities primarily consists of net income adjusted for certain non-cash items, including depreciation and amortization and the effects of changes in working capital. The $325 million increase in net cash provided by operating activities during the
nine months ended
September 30, 2018
as compared to the prior period in
2017
is primarily a result of the increase in our net income excluding our net non-cash gain on the sale of our Cetip investment of $114 million during the
nine months ended
September 30, 2017
, fluctuations in our working capital and less cash paid for income taxes during the
nine months ended
September 30, 2018
than in the comparable prior year period, and a $136 million contribution that was made to our pension plan in September 2017.
Investing Activities
Consolidated net cash provided by (used in) investing activities for the
nine months ended
September 30, 2018
and
2017
primarily relates to purchases of equity investments, net cash proceeds from our sale of Cetip, cash paid for acquisitions (net of cash received for divestitures) including our January 2018 acquisition of BondPoint for $400 million and our July 2018 acquisition of TMC Bonds for $701 million, and capital expenditures and capitalized software development costs. See “- Recent Developments” above. We received net cash proceeds from the sale of Cetip of
$438 million
during the
nine months ended
September 30, 2017
.
We purchased an additional 5.1% stake in Euroclear for €246 million in cash ($304 million). We received cash from the divestitures of IDMS and NYSE Governance Services, net of the cash paid for the TMX Atrium acquisition, of $
9 million
for the
nine months ended
September 30, 2017
. We had capital expenditures of $49 million and $136 million for the
nine months ended
September 30, 2018
and
2017
, respectively, and we had capitalized software development expenditures of $112 million and $104 million for the
nine months ended
September 30, 2018
and
2017
, respectively. The capital expenditures primarily relate to hardware/software purchases to continue the development and expansion of our electronic platforms, data services and clearing houses and
49
leasehold improvements associated with the renovated office spaces in Atlanta, New York and London. The software development expenditures primarily relate to the continued development and expansion of our electronic trading platforms, data services and clearing houses.
Financing Activities
Consolidated net cash used in financing activities for the
nine months ended
September 30, 2018
primarily relates to $
1.1 billion
in repurchases of common stock,
$600 million
in repayments of the October 2018 Senior Notes, $
417 million
in dividend payments to our stockholders, $
35 million
in net repayments under our Commercial Paper Program, and $
78 million
in cash payments related to treasury shares received for restricted stock tax payments and stock options exercises, partially offset by
$2.2 billion
in net proceeds from the Newly-Issued Senior Notes, See “- Debt” below.
Consolidated net cash used in financing activities for the
nine months ended
September 30, 2017
primarily relates to $
445 million
in net repayments under our Commercial Paper Program,
$850 million
in repayments of 2.00% senior unsecured fixed rate NYSE Notes that were due in October 2017, $
709 million
in repurchases of common stock, $
358 million
in dividend payments to our stockholders, and $
85 million
in cash payments related to treasury shares received for restricted stock tax payments and stock options exercises, partially offset by
$985 million
in net proceeds from the 2022 Senior Notes and 2027 Senior Notes offering.
Debt
Our total debt, including short-term and long-term debt, consisted of the following as of
September 30, 2018
and
December 31, 2017
(in millions):
|
As of
September 30, 2018 |
As of
December 31, 2017 |
||||||
|
Debt:
|
|||||||
|
Short-term debt:
|
|||||||
|
Commercial Paper
|
$
|
1,198
|
|
$
|
1,233
|
|
|
|
2018 Senior Notes (2.50% senior unsecured notes due October 15, 2018)
|
—
|
|
600
|
|
|||
|
Total short-term debt
|
1,198
|
|
1,833
|
|
|||
|
Long-term debt:
|
|||||||
|
2020 Senior Notes (2.75% senior unsecured notes due December 1, 2020)
|
1,245
|
|
1,244
|
|
|||
|
2022 Senior Notes (2.35% senior unsecured notes due September 15, 2022)
|
496
|
|
495
|
|
|||
|
2023 Senior Notes (3.45% senior unsecured notes due September 21, 2023)
|
397
|
|
—
|
|
|||
|
2023 Senior Notes (4.00% senior unsecured notes due October 15, 2023)
|
793
|
|
791
|
|
|||
|
2025 Senior Notes (3.75% senior unsecured notes due December 1, 2025)
|
1,243
|
|
1,242
|
|
|||
|
2027 Senior Notes (3.10% senior unsecured notes due September 15, 2027)
|
495
|
|
495
|
|
|||
|
2028 Senior Notes (3.75% senior unsecured notes due September 21, 2028)
|
591
|
|
—
|
|
|||
|
2048 Senior Notes (4.25% senior unsecured notes due September 21, 2048)
|
1,228
|
|
—
|
|
|||
|
Total long-term debt
|
6,488
|
|
4,267
|
|
|||
|
Total debt
|
$
|
7,686
|
|
$
|
6,100
|
|
|
Amended Credit Facility
We have a
$3.4 billion
senior unsecured revolving credit facility pursuant to a credit agreement with Wells Fargo Bank, N.A., as primary administrative agent, issuing lender and swing-line lender, Bank of America, N.A., as syndication agent, backup administrative agent and swing-line lender, and the lenders party thereto. On August 9, 2018, we agreed with the lenders to extend the final maturity date of the Amended Credit Facility from August 18, 2022 to August 9, 2023, and to make certain other changes.
The Amended Credit Facility includes an option for us to propose an increase in the aggregate amount available for borrowing by up to
$975 million
, subject to the consent of the lenders funding the increase, and certain other conditions.
No
amounts were outstanding under the Amended Credit Facility as of
September 30, 2018
. As of
September 30, 2018
, of the
$3.4 billion
that is currently available for borrowing under the Amended Credit Facility,
$1.2 billion
is required to back-stop the amount outstanding under our Commercial Paper Program and $105 million is required to support certain broker-dealer subsidiary commitments.
The amount required to back-stop the amounts outstanding under the Commercial Paper Program will fluctuate as we increase or decrease our commercial paper borrowings. The remaining
$2.1 billion
available under the Amended Credit Facility as of
September 30, 2018
is available to us to use for working capital and general corporate purposes including, but not limited to, acting as a back-stop to future increases in the amounts outstanding under the Commercial Paper Program.
50
Commercial Paper Program
We have entered into a U.S. dollar Commercial Paper Program. Our Commercial Paper Program is currently backed by the borrowing capacity available under the Amended Credit Facility, equal to the amount of the commercial paper that is issued and outstanding at any given point in time. The effective interest rate of commercial paper issuances does not materially differ from short-term interest rates (such as USD LIBOR). The fluctuation of these rates due to market conditions may impact our interest expense. During the
nine months ended
September 30, 2018
, we repaid a net amount of $
35 million
of outstanding commercial paper.
Commercial paper notes of
$1.2 billion
with original maturities ranging from
one
to
81
days were outstanding as of
September 30, 2018
under our Commercial Paper Program. As of
September 30, 2018
, the weighted average interest rate on the
$1.2 billion
outstanding under our Commercial Paper Program was
2.15%
per annum, with a weighted average maturity of
23
days.
Senior Notes
On August 13, 2018, we issued
$2.25 billion
in new aggregate senior notes. The senior notes comprise
$400 million
in aggregate principal amount of 3.45% 2023 Senior Notes,
$600 million
in aggregate principal amount of 3.750% 2028 Senior Notes, and
$1.25 billion
in aggregate principal amount of 4.250% 2048 Senior Notes. We used the net proceeds from the offering of the Newly-Issued Senior Notes for general corporate purposes, including to fund the redemption of the
$600 million
aggregate principal amount of 2.50% Senior Notes due October 2018 and to refinance all of our issuances under our Commercial Paper Program that resulted from acquisitions and investments in the last nine months.
Committed Contingent Liquidity Facilities
To provide a tool to address the liquidity needs of the ICE Clearing Houses and manage the liquidation of margin and guaranty fund deposits held in the form of cash and high quality sovereign debt, ICE Clear Europe, ICE Clear Credit and ICE Clear U.S. have entered into Committed Repurchase Agreement Facilities, or Committed Repo. Additionally, ICE Clear Credit has entered into Committed FX Facilities to support these liquidity needs. As of
September 30, 2018
the following facilities were in place:
ICE Clear Europe: $1.05 billion in Committed Repo to finance U.S. dollar, euro and pound sterling deposits.
|
ICE Clear Credit:
|
$300 million in Committed Repo to finance U.S. dollar and euro deposits, €250 million in Committed Repo to finance euro deposits, and €1.9 billion in Committed FX Facilities to finance euro payment obligations.
|
ICE Clear U.S.: $250 million in Committed Repo to finance U.S. dollar deposits.
ICE NGX maintains a guaranty fund utilizing a $100 million letter of credit that has been entered into with a major Canadian chartered bank and backed by a default insurance policy underwritten by EDC, a Canadian government agency. In the event of a participant default, where a participant’s collateral becomes depleted, any remaining shortfall would be covered by a draw down on the letter of credit following which ICE NGX would pay the first $15 million in losses per its deductible and recover additional losses under the insurance policy up to $100 million. Separately, because it is not our policy to guaranty credit facilities of the ICE Clearing Houses which maintain contingent liquidity facilities secured by high quality liquid assets, during the three months ended March 31, 2018, we eliminated a $100 million guaranty that we had previously provided ICE NGX.
Future Capital Requirements
Our future capital requirements will depend on many factors, including the rate of growth across our Trading and Clearing and Data and Listings segments, strategic plans and acquisitions, available sources for financing activities, required technology and clearing initiatives, regulatory requirements, the timing and introduction of new products and enhancements to existing products, the geographic mix of our business and potential stock repurchases. We currently expect to make aggregate capital expenditures (including operational and real estate capital expenditures) and to incur capitalized software development costs ranging between $270 million and $290 million for the year ended December 31, 2018, which we believe will support the enhancement of our technology, business integration and the continued growth of our businesses.
Our Board of Directors has adopted a quarterly dividend declaration policy providing that the declaration of any dividends will be approved quarterly by the Board of Directors or the Audit Committee of the Board of Directors taking into account such factors as our evolving business model, prevailing business conditions and our financial results and capital requirements, without a predetermined annual net income payout ratio. During the third quarter of 2018, we paid a quarterly dividend of $0.24 per share of our common stock for an aggregate payout of $138 million. On October 31, 2018, we announced a $0.24 per share dividend for the fourth quarter of 2018 with the dividend payable on December 31, 2018 to stockholders of record as of December 14, 2018.
As of
September 30, 2018
, we had
$7.7 billion
in outstanding debt. We currently have our $3.4 billion Amended Credit Facility. After factoring in the
$1.2 billion
required to backstop our Commercial Paper Program and the $105 million required to support
51
certain broker-dealer subsidiary commitments as of
September 30, 2018
, $
2.1 billion
of our Amended Credit Facility is currently available for general corporate purposes. Other than the facilities discussed above for the ICE Clearing Houses, the Amended Credit Facility and our Commercial Paper Program are currently the only significant agreements or arrangements that we have with third parties for liquidity and capital resources. In the event of any strategic acquisitions, mergers or investments, or if we are required to raise capital for any reason or desire to return capital to our stockholders, we may incur additional debt, issue additional equity to raise necessary funds, repurchase additional shares of our common stock or pay a dividend. However, we cannot provide assurance that such financing or transactions will be available or successful, or that the terms of such financing or transactions will be favorable to us. See “- Debt” above.
Non-GAAP Financial Measures
We use non-GAAP measures internally to evaluate our performance and in making financial and operational decisions. When viewed in conjunction with our GAAP results and the accompanying reconciliation, we believe that our presentation of these measures provides investors with greater transparency and a greater understanding of factors affecting our financial condition and results of operations than GAAP measures alone. In addition, we believe the presentation of these measures is useful to investors for period-to-period comparison of results because the items described below as adjustments to GAAP are not reflective of our core business performance. These financial measures are not in accordance with, or an alternative to, GAAP financial measures and may be different from non-GAAP measures used by other companies. We use these adjusted results because we believe they more clearly highlight trends in our business that may not otherwise be apparent when relying solely on GAAP financial measures, since these measures eliminate from our results specific financial items that have less bearing on our core operating performance. We strongly recommend that investors review the GAAP financial measures included in this Quarterly Report, including our consolidated financial statements and the notes thereto.
Adjusted operating expenses, adjusted operating income, adjusted operating margin, adjusted net income attributable to ICE common stockholders and adjusted earnings per share for the periods presented below are calculated by adding or subtracting the adjustments described below, which are not reflective of our cash operations and core business performance, and their related income tax effect and other tax adjustments (in millions, except for percentages and per share amounts):
52
|
Trading and Clearing Segment
|
Data and Listings Segment
|
Consolidated
|
|||||||||||||||||||||
|
Nine Months Ended
September 30, |
Nine Months Ended
September 30, |
Nine Months Ended
September 30, |
|||||||||||||||||||||
|
2018
|
2017
|
2018
|
2017
|
2018
|
2017
|
||||||||||||||||||
|
Total revenues, less transaction-based expenses
|
$
|
1,763
|
|
$
|
1,611
|
|
$
|
1,908
|
|
$
|
1,881
|
|
$
|
3,671
|
|
$
|
3,492
|
|
|||||
|
Operating expenses
|
655
|
|
595
|
|
1,109
|
|
1,110
|
|
$
|
1,764
|
|
$
|
1,705
|
|
|||||||||
|
Less: Interactive Data transaction and integration costs and
acquisition-related success fees |
5
|
|
—
|
|
24
|
|
23
|
|
29
|
|
23
|
|
|||||||||||
|
Less: Amortization of acquisition-related intangibles
|
50
|
|
41
|
|
159
|
|
155
|
|
209
|
|
196
|
|
|||||||||||
|
Less: Impairment of exchange registration intangible assets on closure of ICE Futures Canada and ICE Clear Canada
|
4
|
|
—
|
|
—
|
|
—
|
|
4
|
|
—
|
|
|||||||||||
|
Less: Impairment on divestiture of NYSE Governance Services
|
—
|
|
—
|
|
—
|
|
6
|
|
—
|
|
6
|
|
|||||||||||
|
Less: Accruals relating to investigations and inquiries
|
—
|
|
14
|
|
—
|
|
—
|
|
—
|
|
14
|
|
|||||||||||
|
Less: Employee severance costs related to ICE Futures Canada and ICE Clear Canada operations
|
4
|
|
—
|
|
—
|
|
—
|
|
4
|
|
—
|
|
|||||||||||
|
Adjusted operating expenses
|
$
|
592
|
|
$
|
540
|
|
$
|
926
|
|
$
|
926
|
|
$
|
1,518
|
|
$
|
1,466
|
|
|||||
|
Operating income
|
$
|
1,108
|
|
$
|
1,016
|
|
$
|
799
|
|
$
|
771
|
|
$
|
1,907
|
|
$
|
1,787
|
|
|||||
|
Adjusted operating income
|
$
|
1,171
|
|
$
|
1,071
|
|
$
|
982
|
|
$
|
955
|
|
$
|
2,153
|
|
$
|
2,026
|
|
|||||
|
Operating margin
|
63
|
%
|
63
|
%
|
42
|
%
|
41
|
%
|
52
|
%
|
51
|
%
|
|||||||||||
|
Adjusted operating margin
|
66
|
%
|
66
|
%
|
51
|
%
|
51
|
%
|
59
|
%
|
58
|
%
|
|||||||||||
|
Net income attributable to ICE common stockholders
|
$
|
1,377
|
|
$
|
1,293
|
|
|||||||||||||||||
|
Add: Interactive Data transaction and integration costs and acquisition-related success fees
|
29
|
|
23
|
|
|||||||||||||||||||
|
Add: Adjustment to reduce net gain on Trayport divestiture
|
1
|
|
—
|
|
|||||||||||||||||||
|
Add: Amortization of acquisition-related intangibles
|
209
|
|
196
|
|
|||||||||||||||||||
|
Add: Impairment of exchange registration intangible assets on closure of ICE Futures Canada and ICE Clear Canada
|
4
|
|
—
|
|
|||||||||||||||||||
|
Add: Employee severance costs related to ICE Futures Canada and ICE Clear Canada operations
|
4
|
|
—
|
|
|||||||||||||||||||
|
Add: Impairment on divestiture of NYSE Governance Services
|
—
|
|
6
|
|
|||||||||||||||||||
|
Add: Accruals relating to investigations and inquiries
|
—
|
|
14
|
|
|||||||||||||||||||
|
Less: Cetip investment gain
|
—
|
|
(176
|
)
|
|||||||||||||||||||
|
Add: Foreign exchange loss and transaction expenses on sale of Cetip
|
—
|
|
9
|
|
|||||||||||||||||||
|
Less: Income tax effect for the above items
|
(63
|
)
|
(54
|
)
|
|||||||||||||||||||
|
Less: Deferred tax adjustment from U.S. tax rate reduction
|
(12
|
)
|
—
|
|
|||||||||||||||||||
|
Add: Deferred tax adjustment on acquisition-related intangibles
|
5
|
|
12
|
|
|||||||||||||||||||
|
Less: Other tax adjustments
|
(13
|
)
|
—
|
|
|||||||||||||||||||
|
Adjusted net income attributable to ICE common stockholders
|
$
|
1,541
|
|
$
|
1,323
|
|
|||||||||||||||||
|
Basic earnings per share attributable to ICE common stockholders
|
$
|
2.39
|
|
$
|
2.19
|
|
|||||||||||||||||
|
Diluted earnings per share attributable to ICE common stockholders
|
$
|
2.37
|
|
$
|
2.17
|
|
|||||||||||||||||
|
Adjusted basic earnings per share attributable to ICE common stockholders
|
$
|
2.67
|
|
$
|
2.24
|
|
|||||||||||||||||
|
Adjusted diluted earnings per share attributable to ICE common stockholders
|
$
|
2.65
|
|
$
|
2.22
|
|
|||||||||||||||||
53
|
Trading and Clearing Segment
|
Data and Listings Segment
|
Consolidated
|
|||||||||||||||||||||
|
Three Months Ended
September 30, |
Three Months Ended
September 30, |
Three Months Ended
September 30, |
|||||||||||||||||||||
|
2018
|
2017
|
2018
|
2017
|
2018
|
2017
|
||||||||||||||||||
|
Total revenues, less transaction-based expenses
|
$
|
558
|
|
$
|
523
|
|
$
|
642
|
|
$
|
623
|
|
$
|
1,200
|
|
$
|
1,146
|
|
|||||
|
Operating expenses
|
230
|
|
198
|
|
368
|
|
352
|
|
$
|
598
|
|
$
|
550
|
|
|||||||||
|
Less: Interactive Data transaction and integration costs and
acquisition-related success fees |
5
|
|
—
|
|
—
|
|
3
|
|
5
|
|
3
|
|
|||||||||||
|
Less: Amortization of acquisition-related intangibles
|
19
|
|
13
|
|
53
|
|
51
|
|
72
|
|
64
|
|
|||||||||||
|
Less: Accruals relating to investigations and inquiries
|
—
|
|
4
|
|
—
|
|
—
|
|
—
|
|
4
|
|
|||||||||||
|
Adjusted operating expenses
|
$
|
206
|
|
$
|
181
|
|
$
|
315
|
|
$
|
298
|
|
$
|
521
|
|
$
|
479
|
|
|||||
|
Operating income
|
$
|
328
|
|
$
|
325
|
|
$
|
274
|
|
$
|
271
|
|
$
|
602
|
|
$
|
596
|
|
|||||
|
Adjusted operating income
|
$
|
352
|
|
$
|
342
|
|
$
|
327
|
|
$
|
325
|
|
$
|
679
|
|
$
|
667
|
|
|||||
|
Operating margin
|
59
|
%
|
62
|
%
|
43
|
%
|
43
|
%
|
50
|
%
|
52
|
%
|
|||||||||||
|
Adjusted operating margin
|
63
|
%
|
65
|
%
|
51
|
%
|
52
|
%
|
57
|
%
|
58
|
%
|
|||||||||||
|
Net income attributable to ICE common stockholders
|
$
|
458
|
|
$
|
371
|
|
|||||||||||||||||
|
Add: Interactive Data transaction and integration costs and
acquisition-related success fees |
5
|
|
3
|
|
|||||||||||||||||||
|
Add: Amortization of acquisition-related intangibles
|
72
|
|
64
|
|
|||||||||||||||||||
|
Add: Accruals relating to investigations and inquiries
|
—
|
|
4
|
|
|||||||||||||||||||
|
Less: Income tax effect for the above items
|
(19
|
)
|
(22
|
)
|
|||||||||||||||||||
|
Less: Deferred tax adjustment from U.S. tax rate reduction
|
(12
|
)
|
—
|
|
|||||||||||||||||||
|
Add: Deferred tax adjustment on acquisition-related intangibles
|
—
|
|
12
|
|
|||||||||||||||||||
|
Less: Other tax adjustments
|
(13
|
)
|
—
|
|
|||||||||||||||||||
|
Adjusted net income attributable to ICE common stockholders
|
$
|
491
|
|
$
|
432
|
|
|||||||||||||||||
|
Basic earnings per share attributable to ICE common stockholders
|
$
|
0.80
|
|
$
|
0.63
|
|
|||||||||||||||||
|
Diluted earnings per share attributable to ICE common stockholders
|
$
|
0.79
|
|
$
|
0.63
|
|
|||||||||||||||||
|
Adjusted basic earnings per share attributable to ICE common stockholders
|
$
|
0.86
|
|
$
|
0.73
|
|
|||||||||||||||||
|
Adjusted diluted earnings per share attributable to ICE common stockholders
|
$
|
0.85
|
|
$
|
0.73
|
|
|||||||||||||||||
Acquisition-related transaction costs are included as part of our core business expenses, except for those that are directly related to the announcement, closing, financing or termination of a transaction. However, the acquisition-related transaction and integration costs relating to Interactive Data are included in non-GAAP adjustments given the size of this acquisition. Amortization of acquisition-related intangibles are included in non-GAAP adjustments as excluding these non-cash expenses provides greater clarity regarding our financial strength and stability of cash operating results.
During the
nine months ended
September 30, 2018
, we include as a non-GAAP adjustment the reduction of the gain on our December 2017 sale of Trayport as it represents a non-recurring item. During the
nine months ended
September 30, 2017
, we include as non-GAAP adjustments the Cetip net realized investment gain and the foreign exchange loss and transaction expenses on the sale of Cetip, as the sale of Cetip is not part of our core business operations. During the
nine and three months ended
September 30, 2017
, we include as a non-GAAP adjustment the accrual relating to investigations and inquiries as it is a nonrecurring item. During the
nine months ended
September 30, 2018
, we include as non-GAAP adjustments the impairment loss on exchange registration intangible assets and employee severance costs related to the closure of ICE Futures Canada and ICE Clear Canada as they are non-recurring items. During the
nine months ended
September 30, 2017
, we include as a non-GAAP adjustment the NYSE Governance Services net loss on divestiture as it is a non-recurring item. The income tax effects relating to the items above as well as deferred tax adjustments on acquisition-related intangibles are included in our non-GAAP adjustments. During the
nine and three months ended
September 30, 2018
, we include a $12 million non-GAAP adjustment from deferred tax benefits associated with the U.S. tax rate reduction resulting from changes in estimates. Other tax adjustments during the
nine and three months ended
September 30, 2018
include a $17 million tax benefit on the sale of Trayport offset by an audit settlement for a pre-acquisition period in connection with our acquisition of NYSE in 2013.
For additional information on these items, refer to our consolidated financial statements and related notes, which are included elsewhere in this Quarterly Report and “- Recent Developments,” “- Consolidated Operating Expenses,” “- Consolidated Non-Operating Income (Expense)” and Part II, Item 1 “- Legal Proceedings.”
54
Contractual Obligations and Commercial Commitments
In the
third quarter
of
2018
, there were no significant changes to our contractual obligations and commercial commitments from those disclosed in the section “Management’s Discussion and Analysis of Financial Condition and Results of Operations” in our
2017
Form 10-K.
Off-Balance Sheet Arrangements
As described in Note 10 to our consolidated financial statements and related notes, which are included elsewhere in this Quarterly Report, certain clearing house collateral is reported off-balance sheet. We do not have any relationships with unconsolidated entities or financial partnerships, often referred to as structured finance or special purpose entities.
New and Recently Adopted Accounting Pronouncements
Refer to Note 2 to our consolidated financial statements for information on the new and recently adopted accounting pronouncements that are applicable to us.
Critical Accounting Policies and Estimates
In the
third quarter
of
2018
, there were no significant changes to our critical accounting policies and estimates from those disclosed in the section “Management’s Discussion and Analysis of Financial Condition and Results of Operations” in our
2017
Form 10-K.
ITEM 3.
QUANTITATIVE AND QUALITATIVE DISCLOSURES ABOUT MARKET RISK
As a result of our operating and financing activities, we are exposed to market risks such as interest rate risk, foreign currency exchange rate risk and credit risk. We have implemented policies and procedures designed to measure, manage, monitor and report risk exposures, which are regularly reviewed by the appropriate management and supervisory bodies.
Interest Rate Risk
We have exposure to market risk for changes in interest rates relating to our cash and cash equivalents, short-term investments, short-term and long-term restricted cash and investments, and indebtedness. As of
September 30, 2018
and
December 31, 2017
, our cash and cash equivalents, short-term investments and short-term and long-term restricted cash and cash equivalents were $
1.7 billion
and $
1.6 billion
, respectively, of which $308 million and $293 million, respectively, were denominated in pounds sterling, euros or Canadian dollars. The remaining cash and cash equivalents, short-term investments, and short-term and long-term restricted cash and cash equivalents are denominated in U.S. dollars. We do not use our investment portfolio for trading or other speculative purposes. A hypothetical decrease in long-term interest rates to zero basis points would decrease annual pre-tax earnings by $21 million as of
September 30, 2018
, assuming no change in the amount or composition of our cash and cash equivalents, short-term investments, and short-term and long-term restricted cash and cash equivalents.
As of
September 30, 2018
, we had $
7.7 billion
in outstanding debt, of which $
6.5 billion
relates to our senior notes, which bear interest at fixed interest rates. The remaining amount outstanding of $1.2 billion relates to the Commercial Paper Program, which bears interest at fluctuating rates and, therefore, subjects us to interest rate risk. A hypothetical 100 basis point increase in long-term interest rates relating to the amounts outstanding under the Commercial Paper Program as of
September 30, 2018
would decrease annual pre-tax earnings by $12 million, assuming no change in the volume or composition of our outstanding indebtedness and no hedging activity. See Item 2 “- Management’s Discussion and Analysis of Financial Condition and Results of Operations - Debt” included elsewhere in this Quarterly Report.
The interest rates on our Commercial Paper Program are currently evaluated based upon current maturities and market conditions. The weighted average interest rate on our Commercial Paper Program increased from 1.23% and 1.49% as of
September 30, 2017
and
December 31, 2017
, respectively, to 2.15% as of
September 30, 2018
. The increases in the Commercial Paper Program weighted average interest rates were primarily due to the decisions by the U.S. Federal Reserve in December 2017, March 2018, June 2018 and September 2018 to increase the federal funds short-term interest rate by an aggregate 100 basis points to 2.25%. The effective interest rate of commercial paper issuance will continue to fluctuate based on the movement in short-term interest rates along with shifts in supply and demand within the commercial paper market.
Foreign Currency Exchange Rate Risk
As an international business, we are subject to foreign currency exchange rate risk. We may experience gains or losses from foreign currency transactions in the future given that a significant part of our assets and liabilities are recorded in pounds sterling, Canadian dollars or euros, and a significant portion of our revenues and expenses are recorded in pounds sterling or euros. Certain
55
assets, liabilities, revenues and expenses of foreign subsidiaries are denominated in the local functional currency of such subsidiaries. Our exposure to foreign denominated earnings for the
nine and three months ended
September 30, 2018
is presented by primary foreign currency in the following table (dollars in millions, except exchange rates):
|
|
Nine Months Ended
September 30, 2018 |
Three Months Ended
September 30, 2018 |
Nine Months Ended
September 30, 2017 |
Three Months Ended
September 30, 2017 |
|||||||||||||||||||||||||||
|
|
Pound sterling
|
Euro
|
Pound sterling
|
Euro
|
Pound sterling
|
Euro
|
Pound sterling
|
Euro
|
|||||||||||||||||||||||
|
Average exchange rate to the U.S. dollar in the current year period
|
1.3520
|
|
1.1947
|
|
1.3037
|
|
1.1631
|
|
1.2760
|
1.1136
|
|
1.3091
|
|
1.1752
|
|
||||||||||||||||
|
Average exchange rate to the U.S. dollar in the same period in the prior year
|
1.2760
|
|
1.1136
|
|
1.3091
|
|
1.1752
|
|
1.3938
|
1.1164
|
|
1.3135
|
|
1.1160
|
|
||||||||||||||||
|
Average exchange rate increase (decrease)
|
6
|
%
|
7
|
%
|
—
|
%
|
(1
|
)%
|
(8
|
)%
|
—
|
%
|
—
|
%
|
5
|
%
|
|||||||||||||||
|
Foreign denominated percentage of:
|
|
|
|
|
|||||||||||||||||||||||||||
|
Revenues, less transaction-based expenses
|
9
|
%
|
5
|
%
|
8
|
%
|
4
|
%
|
10
|
%
|
4
|
%
|
10
|
%
|
5
|
%
|
|||||||||||||||
|
Operating expenses
|
11
|
%
|
2
|
%
|
11
|
%
|
2
|
%
|
12
|
%
|
3
|
%
|
12
|
%
|
2
|
%
|
|||||||||||||||
|
Operating income
|
7
|
%
|
7
|
%
|
6
|
%
|
7
|
%
|
9
|
%
|
6
|
%
|
9
|
%
|
7
|
%
|
|||||||||||||||
|
Impact of the currency fluctuations
(1)
on:
|
|
|
|
|
|
|
|||||||||||||||||||||||||
|
Revenues, less transaction-based expenses
|
$
|
20
|
|
$
|
11
|
|
$
|
—
|
|
$
|
(1
|
)
|
$
|
(34
|
)
|
$
|
—
|
|
$
|
—
|
|
$
|
3
|
|
|||||||
|
Operating expenses
|
$
|
11
|
|
$
|
3
|
|
$
|
—
|
|
$
|
—
|
|
$
|
(19
|
)
|
$
|
—
|
|
$
|
—
|
|
$
|
1
|
|
|||||||
|
Operating income
|
$
|
9
|
|
$
|
8
|
|
$
|
—
|
|
$
|
(1
|
)
|
$
|
(15
|
)
|
$
|
—
|
|
$
|
—
|
|
$
|
2
|
|
|||||||
(1)
Represents the impact of currency fluctuation for the
nine and three months ended
September 30, 2018
and
September 30, 2017
compared to the same periods in the prior year.
A significant part of our revenues and expenses are recorded in pounds sterling or euros. For the
nine and three months ended
September 30, 2018
, 14% and 12%, respectively, of our consolidated revenues, less transaction-based expenses, were denominated in pounds sterling or euros. For both the
nine and three months ended
September 30, 2018
, 13% of our consolidated expenses were denominated in pounds sterling or euros. As the pound sterling or euro exchange rate changes, the U.S. equivalent of revenues and expenses denominated in foreign currencies changes accordingly.
Foreign currency transaction risk related to the settlement of foreign currency denominated assets, liabilities and payables occur through our operations, which are received in or paid in pounds sterling, Canadian dollars or euros, due to the increase or decrease in the foreign currency exchange rates between periods. We incurred foreign currency transaction losses of
$1 million
and
$2 million
for the
nine months ended
September 30, 2018
and
2017
, respectively, and
$1 million
for the
three months ended
September 30, 2017, primarily attributable to the fluctuations of the pound sterling and euro relative to the U.S. dollar. There was no significant foreign currency transaction impact for the
three months ended
September 30, 2018
. A 10% adverse change in the underlying foreign currency exchange rates as of
September 30, 2018
would result in a foreign currency transaction loss of $2 million, assuming no change in the composition of the foreign currency denominated assets, liabilities and payables and assuming no hedging activity.
We entered into foreign currency hedging transactions during the
nine and three months ended
September 30, 2018
as economic hedges to help mitigate a portion of our foreign exchange risk exposure and may enter into additional hedging transactions in the future to help mitigate our foreign exchange risk exposure. Although we may enter into additional hedging transactions in the future to help mitigate our foreign exchange risk exposure, these hedging arrangements may not be effective, particularly in the event of imprecise forecasts of the levels of our non-U.S. denominated assets and liabilities.
56
We have foreign currency translation risk equal to our net investment in our foreign subsidiaries. The financial statements of these subsidiaries are translated into U.S. dollars using a current rate of exchange, with gains or losses included in the cumulative translation adjustment account, a component of equity. Our exposure to the net investment in foreign currencies is presented by primary foreign currencies in the table below (in millions):
|
|
As of September 30, 2018
|
||||||||||
|
|
Position in pounds sterling
|
|
Position in Canadian dollars
|
Position in euros
|
|||||||
|
Assets
|
£
|
830
|
|
|
C$
|
1,356
|
|
€
|
150
|
|
|
|
of which goodwill and intangible assets represent
|
639
|
|
|
417
|
|
93
|
|
||||
|
Liabilities
|
84
|
|
|
957
|
|
40
|
|
||||
|
Net currency position
|
£
|
746
|
|
|
C$
|
399
|
|
€
|
110
|
|
|
|
Impact on consolidated equity of a 10% decrease in foreign currency exchange rates
|
$
|
97
|
|
|
$
|
31
|
|
$
|
13
|
|
|
As of
September 30, 2018
and
December 31, 2017
, the portion of our equity attributable to accumulated other comprehensive loss from foreign currency translation was $187 million and $136 million, respectively. As of
September 30, 2018
, we had net exposure of pounds sterling, Canadian dollars and euros of £746 million ($973 million), C$399 million ($309 million), and €110 million ($128 million), respectively. Based on these
September 30, 2018
net currency positions, a hypothetical 10% decrease of pound sterling against U.S. dollar would negatively impact our equity by $97 million, a hypothetical 10% decrease of Canadian dollar against U.S. dollar would negatively impact our equity by $31 million, and a hypothetical 10% decrease of euro against U.S. dollar would negatively impact our equity by $13 million. For the
nine and three months ended
September 30, 2018
, currency exchange rate differences had a negative impact of $51 million and $9 million, respectively, on our consolidated equity, primarily due to the decrease in the pound sterling/U.S. dollar exchange rate to 1.3030 as of
September 30, 2018
(from 1.3510 as of December 31, 2017).
Credit Risk
We are exposed to credit risk in our operations in the event of a counterparty default. We limit our exposure to credit risk by rigorously selecting the counterparties with which we make our investments and execute agreements. Credit risk is monitored by using exposure limits depending on ratings assigned by rating agencies as well as the nature and maturity of transactions. Our investment objective is to invest in securities that preserve principal while maximizing yields, without significantly increasing risk. We seek to substantially mitigate credit risk associated with investments by ensuring that these financial assets are placed with governments, well-capitalized financial institutions and other creditworthy counterparties.
An ongoing review is performed to evaluate changes in the status of counterparties. In addition to the intrinsic creditworthiness of counterparties, our policies require diversification of counterparties (banks, financial institutions, bond issuers and funds) so as to avoid a concentration of risk.
The ICE Clearing Houses hold material amounts of clearing member cash deposits which are held or invested primarily to provide security of capital while minimizing credit, market and liquidity risks. Refer to Note 10 to our consolidated financial statements, which are included elsewhere in this Quarterly Report, for more information on the ICE Clearing Houses' cash deposits, which were $
58.8 billion
as of
September 30, 2018
. While we seek to achieve a reasonable rate of return which may generate interest income for our clearing members, we are primarily concerned with preservation of capital and managing the risks associated with these deposits. As the ICE Clearing Houses may pass on interest revenues (minus costs) to the clearing members, this could include negative or reduced yield due to market conditions. For a summary of the risks associated with this investment activity and how these risks are mitigated, see Part II, Item 7(A) “Quantitative and Qualitative Disclosures About Market Risk” in our 2017 Form 10-K.
ITEM 4.
CONTROLS AND PROCEDURES
(a)
Evaluation of Disclosure Controls and Procedures.
As of the end of the period covered by this report, an evaluation was carried out by our management, with the participation of our Chief Executive Officer and Chief Financial Officer, of the effectiveness of our disclosure controls and procedures (as defined in Rule 13a-15(e) under the Exchange Act). Based upon that evaluation, our Chief Executive Officer and Chief Financial Officer concluded that these disclosure controls and procedures were effective as of the end of the period covered by this report.
(b)
Changes in Internal Controls over Financial Reporting.
There were no changes in our internal controls over financial reporting that occurred during our most recent fiscal quarter that have materially affected, or are reasonably likely to materially affect, our internal controls over financial reporting. As a result, no corrective actions were taken.
57
ITEM 1.
LEGAL PROCEEDINGS
We are subject to legal proceedings, claims and investigations that arise in the ordinary course of our business. These include the matters described in Part I, Item 3 “Legal Proceedings” in our
2017
Form 10-K and Note 11 to the consolidated financial statements and related notes, which are included elsewhere in this Quarterly Report, and which should be referred to for further discussion. We establish accruals for those matters in circumstances when a loss contingency is considered probable and the related amount is reasonably estimable. Any such accruals may be adjusted as circumstances change. Assessments of losses are inherently subjective and involve unpredictable factors. We do not believe that the resolution of these legal matters will have a material adverse effect on our consolidated financial conditions, results of operations or liquidity. It is possible, however, that future results of operations for any particular quarterly or annual period may be materially and adversely affected by any developments in legal proceedings, claims and investigations.
In the
third quarter
of
2018
, there were no significant new risk factors from those disclosed in Part 1, Item 1A, “Risk Factors” in our
2017
Form 10-K. In addition to the other information set forth in this Quarterly Report, including the information in the "- Regulation" section of Item 2 - Management’s Discussion and Analysis of Financial Condition and Results of Operations, you should carefully consider the factors discussed under “Risk Factors” and the regulation discussion under “Business - Regulation” in our
2017
Form 10-K. These risks could materially and adversely affect our business, financial condition and results of operations. The risks and uncertainties in our
2017
Form 10-K are not the only ones facing us. Additional risks and uncertainties not presently known to us or that we currently believe to be immaterial may also adversely affect our business.
ITEM 2.
UNREGISTERED SALES OF EQUITY SECURITIES AND USE OF PROCEEDS
Stock Repurchases
The table below sets forth the information with respect to purchases made by or on behalf of ICE or any “affiliated purchaser” (as defined in Rule 10b-18(a)(3) under the Exchange Act) of our common stock during the
three months ended
September 30, 2018
.
|
Period
(2018)
|
Total number of
shares purchased
|
Average price
paid per share
|
Total number of
shares purchased as
part of publicly
announced plans or
programs(1)
|
Approximate dollar
value of shares that
may yet be
purchased under the
plans or programs
(in millions)(1)
|
|
July 1 - July 31
|
1,311,675
|
$75.05
|
11,714,921
|
$343
|
|
August 1 - August 31
|
1,507,471
|
$73.72
|
13,222,392
|
$232
|
|
September 1 - September 30
|
1,171,636
|
$77.18
|
14,394,028
|
$141
|
|
Total
|
3,990,782
|
$75.17
|
14,394,028
|
$141
|
|
(1)
|
Refer to Note 8 to our consolidated financial statements and related notes, which are included elsewhere in this Quarterly Report, for details on our stock repurchase plans.
|
ITEM 3.
DEFAULTS UPON SENIOR SECURITIES
None.
ITEM 4.
MINE SAFETY DISCLOSURES
Not applicable.
ITEM 5.
OTHER INFORMATION
Not applicable.
58
ITEM 6.
EXHIBITS
|
Exhibit Number
|
|
Description of Document
|
|
4.1
|
—
|
|
|
4.2
|
—
|
|
|
4.3
|
—
|
|
|
4.4
|
—
|
|
|
4.5
|
—
|
|
|
10.1
|
—
|
|
|
31.1
|
—
|
|
|
31.2
|
—
|
|
|
32.1
|
—
|
|
|
32.2
|
—
|
|
|
101
|
—
|
The following materials from Intercontinental Exchange, Inc.’s Quarterly Report on Form 10-Q for the quarter ended September 30, 2018, formatted in XBRL (Extensible Business Reporting Language): (i) the Consolidated Balance Sheets, (ii) the Consolidated Statements of Income, (iii) the Consolidated Statements of Comprehensive Income, (iv) the Consolidated Statements of Changes in Equity, Accumulated Other Comprehensive Loss and Redeemable Non-Controlling Interest (v) Consolidated Statements of Cash Flows and (vi) Notes to Consolidated Financial Statements, tagged as blocks of text.*
|
|
*
|
As provided in Rule 406T of Regulation S-T, this information is “furnished” and not “filed” for purposes of Sections 11 and 12 of the Securities Act of 1933 and Section 18 of the Securities Exchange Act of 1934. Such exhibit will not be deemed to be incorporated by reference into any filing under the Securities Act of 1933 or the Securities Exchange Act of 1934 unless Intercontinental Exchange, Inc. specifically incorporates it by reference.
|
59
SIGNATURES
Pursuant to the requirements of Section 13 or 15(d) of the Securities Exchange Act of 1934, the Registrant has duly caused this Report to be signed on its behalf by the undersigned, thereunto duly authorized.
|
Intercontinental Exchange, Inc.
(Registrant)
|
|||
|
Date: October 31, 2018
|
By:
|
/s/ Scott A. Hill
|
|
|
Scott A. Hill
|
|||
|
Chief Financial Officer
|
|||
|
(Principal Financial Officer)
|
|||
60
TABLE OF CONTENTS
Part I. Financial StatementsItem 1. Consolidated Financial Statements (unaudited)Item 2. Management S Discussion and Analysis Of Financial Condition and Results Of OperationsItem 3. Quantitative and Qualitative Disclosures About Market RiskItem 4. Controls and ProceduresPart II. Other InformationItem 1. Legal ProceedingsItem 1(a). Risk FactorsItem 1(a)Item 2. Unregistered Sales Of Equity Securities and Use Of ProceedsItem 3. Defaults Upon Senior SecuritiesItem 4. Mine Safety DisclosuresItem 5. Other InformationItem 6. Exhibits