INTERCONTINENTAL EXCHANGE, INC.
10-Ks and 10-Qs
|
|
|
|
|
|
|
|
|
|
|
|
|
|
|
|
|
|
|
|
|
|
|
|
|
|
|
|
|
|
|
|
|
|
|
|
|
|
|
|
|
|
|
|
|
|
|
UNITED STATES SECURITIES AND EXCHANGE COMMISSION
Washington, D.C. 20549
Form 10-Q
|
(Mark One)
|
|
|
þ
|
QUARTERLY REPORT PURSUANT TO SECTION 13 OR 15(d) OF THE SECURITIES EXCHANGE ACT OF 1934
|
|
For the quarterly period ended March 31, 2019
|
|
|
Or
|
|
|
¨
|
TRANSITION REPORT PURSUANT TO SECTION 13 OR 15(d)
OF THE SECURITIES EXCHANGE ACT OF 1934 |
|
For the transition period from to
|
|
Commission File Number 001-36198
INTERCONTINENTAL EXCHANGE, INC.
(Exact name of registrant as specified in its charter)
|
Delaware
|
46-2286804
|
|
(State or other jurisdiction of
incorporation or organization)
|
(IRS Employer
Identification Number)
|
|
5660 New Northside Drive,
Atlanta, Georgia
|
30328
(Zip Code)
|
|
(Address of principal executive offices)
|
|
(770) 857-4700
Registrant’s telephone number, including area code
Securities registered pursuant to Section 12(b) of the Act:
|
Title of Each Class
|
Trading Symbol(s)
|
Name of Each Exchange on Which Registered
|
|
Common Stock, $0.01 par value per share
|
ICE
|
New York Stock Exchange
|
Securities registered pursuant to Section 12(g) of the Act:
None
Indicate by check mark whether the registrant: (1) has filed all reports required to be filed by Section 13 or 15(d) of the Exchange Act during the preceding 12 months (or for such shorter period that the registrant was required to file such reports), and (2) has been subject to such filing requirements for the past 90 days. Yes
þ
No
¨
Indicate by check mark whether the registrant has submitted electronically every Interactive Data File required to be submitted pursuant to Rule 405 of Regulation S-T during the preceding 12 months (or for such shorter period that the registrant was required to submit such files). Yes
þ
No
¨
Indicate by check mark whether the registrant is a large accelerated filer, an accelerated filer, a non-accelerated filer, a smaller reporting company or an emerging growth company. See definitions of “large accelerated filer,” “accelerated filer,” “smaller reporting company” and “emerging growth company” in Rule 12b-2 of the Exchange Act.
|
Large accelerated filer
þ
|
Accelerated filer
¨
|
|
Non-accelerated filer
¨
|
Smaller reporting company
¨
|
|
Emerging growth company
¨
|
|
If an emerging growth company, indicate by check mark if the registrant has elected not to use the extended transition period for complying with any new or revised financial accounting standards provided pursuant to Section 13(a) of the Exchange Act.
¨
Indicate by check mark whether the registrant is a shell company (as defined in Rule 12b-2 of the Exchange Act). Yes
¨
No
þ
As of April 29, 2019, the number of shares of the registrant’s Common Stock outstanding was 563,865,016 shares.
INTERCONTINENTAL EXCHANGE, INC.
Form 10-Q
Quarterly Period Ended
March 31, 2019
TABLE OF CONTENTS
|
PART I.
|
Financial Statements
|
|
|
Item 1.
|
||
|
Consolidated Balance Sheets as of March 31, 2019 and December 31, 2018
|
||
|
Consolidated Statements of Income for the three months ended March 31, 2019 and 2018
|
||
|
Consolidated Statements of Comprehensive Income for the three months ended March 31, 2019 and 2018
|
||
|
Consolidated Statements of Changes in Equity and Redeemable Non-Controlling Interest for the three months ended March 31, 2019 and 2018
|
||
|
Consolidated Statements of Cash Flows for the three months ended March 31, 2019 and 2018
|
||
|
Item 2.
|
||
|
Item 3.
|
||
|
Item 4.
|
||
|
PART II.
|
Other Information
|
|
|
Item 1.
|
||
|
Item 1A.
|
||
|
Item 2.
|
||
|
Item 3.
|
||
|
Item 4.
|
||
|
Item 5.
|
||
|
Item 6.
|
||
PART I. Financial Statements
Item 1. Consolidated Financial Statements (Unaudited)
Intercontinental Exchange, Inc. and Subsidiaries
Consolidated Balance Sheets
(In millions, except per share amounts)
(Unaudited)
|
As of
|
As of
|
||||||
|
March 31, 2019
|
December 31, 2018
|
||||||
|
Assets:
|
|||||||
|
Current assets:
|
|||||||
|
Cash and cash equivalents
|
$
|
653
|
|
$
|
724
|
|
|
|
Short-term restricted cash and cash equivalents
|
868
|
|
818
|
|
|||
|
Customer accounts receivable, net of allowance for doubtful accounts of $7 at March 31, 2019 and December 31, 2018
|
1,181
|
|
953
|
|
|||
|
Margin deposits, guaranty funds and delivery contracts receivable
|
64,564
|
|
63,955
|
|
|||
|
Prepaid expenses and other current assets
|
219
|
|
242
|
|
|||
|
Total current assets
|
67,485
|
|
66,692
|
|
|||
|
Property and equipment, net
|
1,538
|
|
1,241
|
|
|||
|
Other non-current assets:
|
|||||||
|
Goodwill
|
13,098
|
|
13,085
|
|
|||
|
Other intangible assets, net
|
10,406
|
|
10,462
|
|
|||
|
Long-term restricted cash and cash equivalents
|
370
|
|
330
|
|
|||
|
Other non-current assets
|
960
|
|
981
|
|
|||
|
Total other non-current assets
|
24,834
|
|
24,858
|
|
|||
|
Total assets
|
$
|
93,857
|
|
$
|
92,791
|
|
|
|
Liabilities and Equity:
|
|||||||
|
Current liabilities:
|
|||||||
|
Accounts payable and accrued liabilities
|
$
|
509
|
|
$
|
521
|
|
|
|
Section 31 fees payable
|
70
|
|
105
|
|
|||
|
Accrued salaries and benefits
|
125
|
|
280
|
|
|||
|
Deferred revenue
|
479
|
|
135
|
|
|||
|
Short-term debt
|
1,005
|
|
951
|
|
|||
|
Margin deposits, guaranty funds and delivery contracts payable
|
64,564
|
|
63,955
|
|
|||
|
Other current liabilities
|
283
|
|
161
|
|
|||
|
Total current liabilities
|
67,035
|
|
66,108
|
|
|||
|
Non-current liabilities:
|
|||||||
|
Non-current deferred tax liability, net
|
2,308
|
|
2,337
|
|
|||
|
Long-term debt
|
6,492
|
|
6,490
|
|
|||
|
Accrued employee benefits
|
203
|
|
204
|
|
|||
|
Operating lease liability-non-current
|
306
|
|
—
|
|
|||
|
Other non-current liabilities
|
312
|
|
350
|
|
|||
|
Total non-current liabilities
|
9,621
|
|
9,381
|
|
|||
|
Total liabilities
|
76,656
|
|
75,489
|
|
|||
|
Commitments and contingencies
|
|
|
|
|
|||
|
Redeemable non-controlling interest in consolidated subsidiaries
|
71
|
|
71
|
|
|||
|
Equity:
|
|||||||
|
Intercontinental Exchange, Inc. stockholders’ equity:
|
|||||||
|
Preferred stock, $0.01 par value; 100 shares authorized; no shares issued or outstanding at March 31, 2019 and December 31, 2018
|
—
|
|
—
|
|
|||
2
|
Common stock, $0.01 par value; 1,500 shares authorized; 606 and 604 shares issued at March 31, 2019 and December 31, 2018, respectively, and 565 and 569 shares outstanding at March 31, 2019 and December 31, 2018, respectively
|
6
|
|
6
|
|
|||
|
Treasury stock, at cost; 41 and 35 shares at March 31, 2019 and December 31, 2018, respectively
|
(2,851
|
)
|
(2,354
|
)
|
|||
|
Additional paid-in capital
|
11,597
|
|
11,547
|
|
|||
|
Retained earnings
|
8,644
|
|
8,317
|
|
|||
|
Accumulated other comprehensive loss
|
(290
|
)
|
(315
|
)
|
|||
|
Total Intercontinental Exchange, Inc. stockholders’ equity
|
17,106
|
|
17,201
|
|
|||
|
Non-controlling interest in consolidated subsidiaries
|
24
|
|
30
|
|
|||
|
Total equity
|
17,130
|
|
17,231
|
|
|||
|
Total liabilities and equity
|
$
|
93,857
|
|
$
|
92,791
|
|
|
See accompanying notes.
3
Intercontinental Exchange, Inc. and Subsidiaries
Consolidated Statements of Income
(In millions, except per share amounts)
(Unaudited)
|
Three Months Ended March 31,
|
||||||||
|
2019
|
2018
|
|||||||
|
Revenues:
|
||||||||
|
Transaction and clearing, net
|
$
|
862
|
|
$
|
898
|
|
||
|
Data services
|
546
|
|
520
|
|
||||
|
Listings
|
111
|
|
109
|
|
||||
|
Other revenues
|
64
|
|
53
|
|
||||
|
Total revenues
|
1,583
|
|
1,580
|
|
||||
|
Transaction-based expenses:
|
||||||||
|
Section 31 fees
|
69
|
|
121
|
|
||||
|
Cash liquidity payments, routing and clearing
|
244
|
|
234
|
|
||||
|
Total revenues, less transaction-based expenses
|
1,270
|
|
1,225
|
|
||||
|
Operating expenses:
|
||||||||
|
Compensation and benefits
|
248
|
|
240
|
|
||||
|
Professional services
|
33
|
|
30
|
|
||||
|
Acquisition-related transaction and integration costs
|
—
|
|
12
|
|
||||
|
Technology and communication
|
107
|
|
105
|
|
||||
|
Rent and occupancy
|
17
|
|
17
|
|
||||
|
Selling, general and administrative
|
42
|
|
33
|
|
||||
|
Depreciation and amortization
|
158
|
|
138
|
|
||||
|
Total operating expenses
|
605
|
|
575
|
|
||||
|
Operating income
|
665
|
|
650
|
|
||||
|
Other income (expense):
|
||||||||
|
Interest income
|
9
|
|
4
|
|
||||
|
Interest expense
|
(71
|
)
|
(52
|
)
|
||||
|
Other income, net
|
23
|
|
15
|
|
||||
|
Other income (expense), net
|
(39
|
)
|
(33
|
)
|
||||
|
Income before income tax expense
|
626
|
|
617
|
|
||||
|
Income tax expense
|
134
|
|
143
|
|
||||
|
Net income
|
$
|
492
|
|
$
|
474
|
|
||
|
Net income attributable to non-controlling interest
|
(8
|
)
|
(10
|
)
|
||||
|
Net income attributable to Intercontinental Exchange, Inc.
|
$
|
484
|
|
$
|
464
|
|
||
|
Earnings per share attributable to Intercontinental Exchange, Inc. common stockholders:
|
||||||||
|
Basic
|
$
|
0.85
|
|
$
|
0.80
|
|
||
|
Diluted
|
$
|
0.85
|
|
$
|
0.79
|
|
||
|
Weighted average common shares outstanding:
|
||||||||
|
Basic
|
568
|
|
582
|
|
||||
|
Diluted
|
570
|
|
586
|
|
||||
See accompanying notes.
4
Intercontinental Exchange, Inc. and Subsidiaries
Consolidated Statements of Comprehensive Income
(In millions)
(Unaudited)
|
Three Months Ended March 31,
|
||||||||
|
2019
|
2018
|
|||||||
|
Net income
|
$
|
492
|
|
$
|
474
|
|
||
|
Other comprehensive income (loss):
|
||||||||
|
Foreign currency translation adjustments, net of tax benefit (expense) of $0 and ($1) for the three months ended March 31, 2019 and 2018, respectively
|
26
|
|
33
|
|
||||
|
Change in equity method investment
|
(1
|
)
|
—
|
|
||||
|
Other comprehensive income
|
25
|
|
33
|
|
||||
|
Comprehensive income
|
$
|
517
|
|
$
|
507
|
|
||
|
Comprehensive income attributable to non-controlling interest
|
(8
|
)
|
(10
|
)
|
||||
|
Comprehensive income attributable to Intercontinental Exchange, Inc.
|
$
|
509
|
|
$
|
497
|
|
||
See accompanying notes.
5
Intercontinental Exchange, Inc. and Subsidiaries
Consolidated Statements of Changes in Equity and Redeemable Non-Controlling Interest
(In millions)
(Unaudited)
|
Intercontinental Exchange, Inc. Stockholders’ Equity
|
Non-
Controlling
Interest in
Consolidated
Subsidiaries
|
Total
Equity
|
Redeemable Non-Controlling Interest
|
||||||||||||||||||||||||||||||||||
|
Common
Stock
|
Treasury Stock
|
Additional
Paid-in
Capital
|
Retained
Earnings
|
Accumulated
Other
Comprehensive
Loss
|
|||||||||||||||||||||||||||||||||
|
Shares
|
Value
|
Shares
|
Value
|
||||||||||||||||||||||||||||||||||
|
Balance, as of December 31, 2018
|
604
|
|
6
|
|
(35
|
)
|
(2,354
|
)
|
11,547
|
|
8,317
|
|
(315
|
)
|
30
|
|
17,231
|
|
71
|
|
|||||||||||||||||
|
Other comprehensive income
|
—
|
|
—
|
|
—
|
|
—
|
|
—
|
|
—
|
|
25
|
|
—
|
|
25
|
|
—
|
|
|||||||||||||||||
|
Exercise of common stock options
|
—
|
|
—
|
|
—
|
|
—
|
|
5
|
|
—
|
|
—
|
|
—
|
|
5
|
|
—
|
|
|||||||||||||||||
|
Repurchases of common stock
|
—
|
|
—
|
|
(6
|
)
|
(440
|
)
|
—
|
|
—
|
|
—
|
|
—
|
|
(440
|
)
|
—
|
|
|||||||||||||||||
|
Payments relating to treasury shares
|
—
|
|
—
|
|
—
|
|
(57
|
)
|
—
|
|
—
|
|
—
|
|
—
|
|
(57
|
)
|
—
|
|
|||||||||||||||||
|
Stock-based compensation
|
—
|
|
—
|
|
—
|
|
—
|
|
33
|
|
—
|
|
—
|
|
—
|
|
33
|
|
—
|
|
|||||||||||||||||
|
Issuance under the employee stock purchase plan
|
—
|
|
—
|
|
—
|
|
—
|
|
12
|
|
—
|
|
—
|
|
—
|
|
12
|
|
—
|
|
|||||||||||||||||
|
Issuance of restricted stock
|
2
|
|
—
|
|
—
|
|
—
|
|
—
|
|
—
|
|
—
|
|
—
|
|
—
|
|
—
|
|
|||||||||||||||||
|
Distributions of profits
|
—
|
|
—
|
|
—
|
|
—
|
|
—
|
|
—
|
|
—
|
|
(14
|
)
|
(14
|
)
|
—
|
|
|||||||||||||||||
|
Dividends paid to stockholders
|
—
|
|
—
|
|
—
|
|
—
|
|
—
|
|
(157
|
)
|
—
|
|
—
|
|
(157
|
)
|
—
|
|
|||||||||||||||||
|
Net income attributable to non-controlling interest
|
—
|
|
—
|
|
—
|
|
—
|
|
—
|
|
(8
|
)
|
—
|
|
8
|
|
—
|
|
—
|
|
|||||||||||||||||
|
Net income
|
—
|
|
—
|
|
—
|
|
—
|
|
—
|
|
492
|
|
—
|
|
—
|
|
492
|
|
—
|
|
|||||||||||||||||
|
Balance, as of March 31, 2019
|
606
|
|
$
|
6
|
|
(41
|
)
|
$
|
(2,851
|
)
|
$
|
11,597
|
|
$
|
8,644
|
|
$
|
(290
|
)
|
$
|
24
|
|
$
|
17,130
|
|
$
|
71
|
|
|||||||||
|
Intercontinental Exchange, Inc. Stockholders’ Equity
|
Non-
Controlling
Interest in
Consolidated
Subsidiaries
|
Total
Equity
|
Redeemable Non-Controlling Interest
|
||||||||||||||||||||||||||||||||||
|
Common
Stock
|
Treasury Stock
|
Additional
Paid-in
Capital
|
Retained
Earnings
|
Accumulated
Other
Comprehensive
Loss
|
|||||||||||||||||||||||||||||||||
|
Shares
|
Value
|
Shares
|
Value
|
||||||||||||||||||||||||||||||||||
|
Balance, as of December 31, 2017
|
600
|
|
6
|
|
(17
|
)
|
(1,076
|
)
|
11,392
|
|
6,858
|
|
(223
|
)
|
28
|
|
16,985
|
|
—
|
|
|||||||||||||||||
|
Other comprehensive income
|
—
|
|
—
|
|
—
|
|
—
|
|
—
|
|
—
|
|
33
|
|
—
|
|
33
|
|
—
|
|
|||||||||||||||||
|
Exercise of common stock options
|
—
|
|
—
|
|
—
|
|
—
|
|
4
|
|
—
|
|
—
|
|
—
|
|
4
|
|
—
|
|
|||||||||||||||||
|
Repurchases of common stock
|
—
|
|
—
|
|
(4
|
)
|
(300
|
)
|
—
|
|
—
|
|
—
|
|
—
|
|
(300
|
)
|
—
|
|
|||||||||||||||||
|
Payments relating to treasury shares
|
—
|
|
—
|
|
(1
|
)
|
(72
|
)
|
—
|
|
—
|
|
—
|
|
—
|
|
(72
|
)
|
—
|
|
|||||||||||||||||
|
Stock-based compensation
|
—
|
|
—
|
|
—
|
|
—
|
|
32
|
|
—
|
|
—
|
|
—
|
|
32
|
|
—
|
|
|||||||||||||||||
|
Issuance of restricted stock
|
3
|
|
—
|
|
—
|
|
—
|
|
—
|
|
—
|
|
—
|
|
—
|
|
—
|
|
—
|
|
|||||||||||||||||
|
Distributions of profits
|
—
|
|
—
|
|
—
|
|
—
|
|
—
|
|
—
|
|
—
|
|
(10
|
)
|
(10
|
)
|
—
|
|
|||||||||||||||||
|
Dividends paid to stockholders
|
—
|
|
—
|
|
—
|
|
—
|
|
—
|
|
(140
|
)
|
—
|
|
—
|
|
(140
|
)
|
—
|
|
|||||||||||||||||
|
Net income attributable to non-controlling interest
|
—
|
|
—
|
|
—
|
|
—
|
|
—
|
|
(10
|
)
|
—
|
|
10
|
|
—
|
|
—
|
|
|||||||||||||||||
|
Net income
|
—
|
|
—
|
|
—
|
|
—
|
|
—
|
|
474
|
|
—
|
|
—
|
|
474
|
|
—
|
|
|||||||||||||||||
|
Balance, as of March 31, 2018
|
603
|
|
$
|
6
|
|
(22
|
)
|
$
|
(1,448
|
)
|
$
|
11,428
|
|
$
|
7,182
|
|
$
|
(190
|
)
|
$
|
28
|
|
$
|
17,006
|
|
$
|
—
|
|
|||||||||
See accompanying notes.
6
Intercontinental Exchange, Inc. and Subsidiaries
Consolidated Statements of Cash Flows
(In millions)
(Unaudited)
|
Three Months Ended
March 31, |
|||||||
|
2019
|
2018
|
||||||
|
Operating activities:
|
|||||||
|
Net income
|
$
|
492
|
|
$
|
474
|
|
|
|
Adjustments to reconcile net income to net cash provided by operating activities:
|
|||||||
|
Depreciation and amortization
|
158
|
|
138
|
|
|||
|
Stock-based compensation
|
29
|
|
29
|
|
|||
|
Deferred taxes
|
(28
|
)
|
(6
|
)
|
|||
|
Other
|
(21
|
)
|
1
|
|
|||
|
Changes in assets and liabilities:
|
|||||||
|
Customer accounts receivable
|
(227
|
)
|
(259
|
)
|
|||
|
Other current and non-current assets
|
15
|
|
(32
|
)
|
|||
|
Section 31 fees payable
|
(35
|
)
|
(8
|
)
|
|||
|
Deferred revenue
|
347
|
|
343
|
|
|||
|
Other current and non-current liabilities
|
(76
|
)
|
(107
|
)
|
|||
|
Total adjustments
|
162
|
|
99
|
|
|||
|
Net cash provided by operating activities
|
654
|
|
573
|
|
|||
|
Investing activities:
|
|||||||
|
Capital expenditures
|
(26
|
)
|
(14
|
)
|
|||
|
Capitalized software development costs
|
(39
|
)
|
(37
|
)
|
|||
|
Cash paid for acquisitions
|
(19
|
)
|
(400
|
)
|
|||
|
Return of capital from equity method investment
|
44
|
|
—
|
|
|||
|
Purchases of investments
|
—
|
|
(304
|
)
|
|||
|
Net cash used in investing activities
|
(40
|
)
|
(755
|
)
|
|||
|
Financing activities:
|
|||||||
|
Proceeds from commercial paper, net of repayments
|
54
|
|
789
|
|
|||
|
Repurchases of common stock
|
(440
|
)
|
(300
|
)
|
|||
|
Dividends to stockholders
|
(157
|
)
|
(140
|
)
|
|||
|
Payments relating to treasury shares received for restricted stock tax payments and stock option exercises
|
(57
|
)
|
(72
|
)
|
|||
|
Other
|
4
|
|
(7
|
)
|
|||
|
Net cash provided by (used in) financing activities
|
(596
|
)
|
270
|
|
|||
|
Effect of exchange rate changes on cash, cash equivalents and restricted cash and cash equivalents
|
1
|
|
2
|
|
|||
|
Net increase in cash, cash equivalents, and restricted cash and cash equivalents
|
19
|
|
90
|
|
|||
|
Cash, cash equivalents, and restricted cash and cash equivalents, beginning of period
|
1,872
|
|
1,568
|
|
|||
|
Cash, cash equivalents, and restricted cash and cash equivalents, end of period
|
$
|
1,891
|
|
$
|
1,658
|
|
|
|
Supplemental cash flow disclosure:
|
|||||||
|
Cash paid for income taxes
|
$
|
78
|
|
$
|
144
|
|
|
|
Cash paid for interest
|
$
|
79
|
|
$
|
27
|
|
|
See accompanying notes.
7
Intercontinental Exchange, Inc. and Subsidiaries
Notes to Consolidated Financial Statements
(Unaudited)
|
1.
|
Description of Business
|
Nature of Business and Organization
We are a leading global operator of regulated exchanges, clearing houses and listings venues, and a provider of data services for commodity, financial, fixed income and equity markets. We operate regulated marketplaces for listing, trading and clearing a broad array of derivatives contracts and securities across major asset classes, including energy and agricultural commodities, metals, interest rates, equities, exchange-traded funds, or ETFs, credit derivatives, bonds and currencies. We also offer comprehensive data services to support the trading, investment, risk management, mortgage service and connectivity needs of customers around the world and across asset classes.
Our exchanges include derivative exchanges in the United States, or U.S., United Kingdom, or U.K., European Union, or EU, Canada and Singapore, and cash equities, equity options and bond trading venues in the U.S. We also operate over-the-counter, or OTC, markets for physical energy, fixed income and credit default swaps, or CDS, trade execution. To serve global derivatives markets, we operate central counterparty clearing houses, or CCPs, in the U.S., U.K., EU, Canada and Singapore (Note 11). We offer a range of data services for global financial and commodity markets, including pricing and reference data, exchange data, analytics, feeds, index services, desktops and connectivity solutions. Through our markets, clearing houses, listings and data services, we provide comprehensive solutions for our customers through liquid markets, benchmark products, access to capital markets and related services to support their ability to manage risk and raise capital. Our business is conducted as
two
reportable business segments, our Trading and Clearing segment and our Data and Listings segment, and the majority of our identifiable assets are located in the U.S. and U.K. (Note 14).
2. Summary of Significant Accounting Policies
Basis of Presentation
The accompanying unaudited consolidated financial statements have been prepared by us in accordance with U.S. generally accepted accounting principles, or U.S. GAAP, pursuant to the rules and regulations of the Securities and Exchange Commission, or SEC, regarding interim financial reporting. Accordingly, the unaudited consolidated financial statements do not include all of the information and footnotes required by U.S. GAAP for complete financial statements and should be read in conjunction with our audited consolidated financial statements and related notes thereto for the year ended
December 31, 2018
. The accompanying unaudited consolidated financial statements reflect all adjustments that are, in our opinion, necessary for a fair presentation of results for the interim periods presented. We believe that these adjustments are of a normal recurring nature.
Preparing financial statements requires us to make certain estimates and assumptions that affect the amounts that are reported in our consolidated financial statements and accompanying disclosures. Actual amounts could differ from those estimates. The results of operations for the
three months ended
March 31, 2019
are not necessarily indicative of the results to be expected for any future period or the full fiscal year.
These statements include the accounts of our wholly-owned and controlled subsidiaries. All intercompany balances and transactions between us and our wholly-owned and controlled subsidiaries have been eliminated in consolidation. For consolidated subsidiaries in which our ownership is less than 100% and for which we have control over the assets and liabilities and the management of the entity, the outside stockholders’ interests are shown as non-controlling interests.
8
Recently Adopted Accounting Pronouncements
|
Standard/Description
|
Effective Date and Adoption Considerations
|
Effect on Financial Statements
|
|
ASU No. 2016-02,
Leases
. Entities are required to recognize both assets and liabilities arising from finance and operating leases, along with additional qualitative and quantitative disclosures.
|
We adopted ASU No. 2016-02 on January 1, 2019.
|
Further disclosures and details on our adoption of ASU 2016-02 are discussed below.
|
Accounting Pronouncements Not Yet Adopted
|
Standard/Description
|
Effective Date and Adoption Considerations
|
Effect on Financial Statements
|
|
ASU No. 2016-13,
Financial Instruments - Measurement of Credit Losses on Financial Instruments
. Applies to all financial instruments carried at amortized cost including held-to-maturity debt securities and trade receivables. Requires financial assets carried at amortized cost to be presented at the net amount expected to be collected and requires entities to record credit losses through an allowance for credit losses on available-for-sale debt securities.
|
Effective at the beginning of our first quarter of fiscal year 2020, with early adoption permitted. We do not expect to early adopt.
|
We are currently evaluating this guidance to determine the potential impact on our consolidated financial statements.
|
Adoption of ASU 2016-02, "Leases"
On January 1, 2019, we adopted ASU 2016-02, Leases, or ASU 2016-02. This standard requires recognition of both assets and liabilities arising from finance and operating leases, along with additional qualitative and quantitative disclosures. ASU 2016-02 requires lessees to recognize a right-of-use, or ROU, asset representing a right to use the underlying asset over the lease term, and a corresponding lease liability on the balance sheet. Our operating leases primarily relate to our leased office space and data center facilities, and we do not have any leases classified as finance leases.
We adopted ASU 2016-02 using the modified retrospective transition method and did not restate prior periods. Using the modified retrospective approach, we applied the provisions of ASU 2016-02 beginning in the period of adoption, and elected the package of practical expedients available to us. There was no impact to the opening balance of retained earnings as a result of a cumulative-effect adjustment on the adoption date. We elected the practical expedient to not reassess lease classifications, but alternatively to carry forward our historical classifications. In addition, we elected the practical expedient of not separating lease and non-lease components as our lease arrangements are not highly dependent on other underlying assets. Our implementation of the amended lease guidance was subject to the same internal controls over financial reporting that we apply to our consolidated financial statements.
At lease inception, we review the service arrangement and components of a contract to identify if a lease or embedded lease arrangement exists. An indicator of a contract containing a lease is when we have the right to control and use an identified asset over a period of time in exchange for consideration. Operating lease ROU assets and liabilities are recognized at the commencement date based on the present value of lease payments over the lease term, using our estimated incremental borrowing rate. We made the policy election to not record leases with a term of 12 months or less on the balance sheet, and to recognize lease expense on a straight-line basis over the lease term for those leases, the impact of which is nominal. We have also made policy elections related to capitalization thresholds and discount rates. We have elected to use a portfolio approach in consideration of our incremental borrowing rate to our population of lease agreements. Our incremental borrowing rate was determined based on our recent debt issuances that we believe are reflective of current borrowing rates. Certain lease agreements include options to extend, renew or terminate the lease agreement. As of
March 31, 2019
, the weighted-average remaining lease term was
7.2
years and the weighted average discount rate was
3.6%
. Our lease agreements do not contain any residual value guarantees.
9
Upon adoption of ASU 2016-02, we recorded
$357 million
in operating lease liabilities, of which
$52 million
is included in other current liabilities and
$305 million
is included in operating lease liability-non-current within our accompanying consolidated balance sheet. We also recorded
$308 million
in operating lease ROU assets that are included as a component of property and equipment, net, in our balance sheet and are recorded in an amount equal to our lease liability, adjusted for any remaining unamortized lease incentives such as our deferred rent balances. As part of our adoption, we eliminated
$49 million
in deferred rent liabilities, of which
$2 million
had previously been included in other current liabilities and
$47 million
had been included in other non-current liabilities on our balance sheet. On the date of adoption, deferred rent liabilities were reclassified and presented as a reduction to the ROU asset, included in property and equipment, net on our consolidated balance sheet. Our adoption did not have an impact on our consolidated income statement.
We recognize rent expense monthly on a straight-line basis for each respective operating leases, as a reduction to both the ROU asset and the lease liability. For the
three months ended
March 31, 2019
, we recognized
$10 million
of rent expense for office space as rent and occupancy expense and
$5 million
of rent expense for data center facilities as technology and communication expense within our consolidated income statement. We do not have any significant variable lease costs related to building and maintenance costs, real estate taxes, or other charges.
Details of our lease asset and liability balances are as follows (in millions):
|
As of March 31, 2019
|
As of January 1, 2019
|
|||||
|
Right-of-use lease assets
|
$308
|
$308
|
||||
|
Operating lease liability-current
|
53
|
|
52
|
|
||
|
Operating lease liability-non-current
|
306
|
|
305
|
|
||
|
Total operating lease liability
|
$359
|
$357
|
||||
As of
March 31, 2019
, we estimate that our operating lease liabilities will be recognized in the following years (in millions):
|
Remainder of 2019
|
$
|
49
|
|
|
2020
|
63
|
|
|
|
2021
|
61
|
|
|
|
2022
|
59
|
|
|
|
2023
|
43
|
|
|
|
Thereafter
|
134
|
|
|
|
Lease liability amounts repayable
|
409
|
|
|
|
Interest costs
|
50
|
|
|
|
Total operating lease liability
|
$
|
359
|
|
Supplemental cash flow information and non-cash activity related to our operating leases are as follows:
|
Three Months Ended
March 31, 2019 |
|||
|
Cash paid for amounts included in the measurement of operating lease liabilities
|
$
|
15
|
|
|
Right-of-use assets obtained in exchange for operating lease obligations
|
$
|
372
|
|
|
3.
|
Investments
|
Our equity investments, including our investments in Euroclear plc, or Euroclear, and Coinbase Global, Inc., among others, are subject to valuation under ASU 2016-01,
Financial Instruments- Overall (Subtopic 825-10): Recognition and Measurement of Financial Assets and Financial Liabilities
. See Note 13 for a discussion of our determination of fair value of our financial instruments.
In addition, we own a
40%
interest in the Options Clearing Corporation, or OCC, through a direct investment by NYSE that we treat as an equity method investment. OCC serves as a clearing house for securities options, security futures, commodity futures and options on futures traded on various independent exchanges. OCC clears securities options traded on NYSE Arca and NYSE Amex Options, along with other non-affiliated exchanges, and is regulated by the SEC as a registered clearing
10
agency and by the Commodity Futures Trading Commission, or CFTC, as a derivatives clearing organization. Under equity method accounting, each reporting period we adjust the carrying value of our OCC investment on our balance sheet by recognizing our pro-rata
40%
share of the earnings or losses of OCC, with a corresponding adjustment in our statement of income to other income, after eliminating any intra-entity income or expenses. In addition, if and when OCC issues cash dividends to us, we deduct the amount of these dividends from the carrying amount of our investment.
OCC adopted a new capital plan during the first quarter of 2015, which raised
$150 million
in equity capital from OCC's shareholders, including
$60 million
contributed by us. Pursuant to the terms of the capital plan, in exchange for the contributions of equity capital from its shareholders, OCC was required, subject to determination by its board of directors and compliance with legal requirements, to pay an annual dividend to its shareholders on a pro rata basis. The dividend was intended to be equal to the amount (i) of after-tax income of OCC, in excess of the amount required to maintain its target capital requirement and satisfy other capital requirements, and (ii) remaining after refunds to its clearing members equal to 50% of distributable earnings before tax. Related to that capital plan, from 2015-2017 we received a total of
$31 million
in dividends from OCC.
Subsequent to our
$60 million
investment, aggrieved parties petitioned the SEC to review its approval, by delegated authority, of the capital plan. As a result of such petition, the SEC's approval of the capital plan was automatically stayed and OCC halted further implementation of the capital plan pending further SEC action. In September 2015, the SEC lifted the stay. During the fourth quarter of 2015, the OCC capital plan was implemented.
In February 2016, after the SEC approved the rule change establishing the OCC capital plan, certain industry participants appealed that approval in the U.S. Court of Appeals. In August 2017, the Court of Appeals remanded the case to the SEC and on February 13, 2019, the SEC disapproved the OCC capital plan established in 2015. The OCC returned
$44 million
of our original
$60 million
contribution during the
three months ended
March 31, 2019
as a result of the disapproval. The remaining
$16 million
will be returned at a future date, when returning the funds will allow the OCC to maintain target capital requirements.
Following the SEC disapproval, the OCC also announced they will not be providing a refund to clearing members or declaring a dividend to shareholders for the year ended December 31, 2018, which resulted in higher reported OCC 2018 net income than we had estimated. Therefore, during the
three months ended
March 31, 2019
, we adjusted equity earnings in OCC by recording an additional
$19 million
earnings in other income to reflect our share of OCC's 2018 net income. In addition, during the
three months ended
March 31, 2019
, we recognized
$8 million
of equity earnings as our share of OCC's estimated 2019 profits, which is also included in other income.
|
4.
|
Revenue Recognition
|
Substantially all of our revenues are considered to be revenues from contracts with customers. The related accounts receivable balances are recorded in our balance sheets as customer accounts receivable. We do not have obligations for warranties, returns or refunds to customers, other than the rebates discussed below, which are settled each period and therefore do not result in variable consideration. We do not have significant revenue recognized from performance obligations that were satisfied in prior periods, and we do not have any transaction price allocated to unsatisfied performance obligations other than in our deferred revenue. Deferred revenue represents our contract liabilities related to our annual, original and other listings revenues as well as certain data services, clearing services and other revenues. See Note 6 for our discussion of deferred revenue balances, activity, and expected timing of recognition. As permitted by U.S. GAAP, we have elected not to provide disclosures about transaction price allocated to unsatisfied performance obligations if contract durations are less than one year, or if we are not required to estimate the transaction price. For all of our contracts with customers, except for listings and certain data and clearing services, our performance obligations are short-term in nature and there is no significant variable consideration. See the bullets below for further descriptions of our revenue contracts. In addition, we have elected the practical expedient of excluding sales taxes from transaction prices. We have assessed the costs incurred to obtain or fulfill a contract with a customer and determined them to be immaterial.
Certain judgments and estimates were used in the identification and timing of satisfaction of performance obligations and the related allocation of transaction price. We believe that these represent a faithful depiction of the transfer of services to our customers.
Our primary revenue contract classifications are described below. These categories best represent those with similar economic characteristics of the nature, amount, timing and uncertainty of revenues and cash flows.
|
•
|
Transaction and clearing, net
- Transaction and clearing revenues represent fees charged for the performance obligations of derivatives trading and clearing, and from our cash trading, equity options, mortgage services and fixed income exchanges. The derivatives trading and clearing fees contain
two
performance obligations: (1) trade execution/clearing novation and (2) risk management of open interest. While we allocate the transaction price between these
two
performance obligations, since they generally are satisfied almost simultaneously there is no significant deferral
|
11
of revenue. Cash trading, equity options, mortgage services and fixed income fees contain
one
performance obligation related to trade execution which occurs instantaneously and the revenue is recorded at the point in time of the trade execution. Our transaction and clearing revenues are reported net of rebates, except for the NYSE transaction-based expenses. Rebates were
$215 million
and
$220 million
for the
three months ended
March 31, 2019
and
2018
, respectively. Transaction and clearing fees can be variable based on trade volume discounts used in the determination of rebates, however virtually all volume discounts are calculated and recorded on a monthly basis. Transaction and clearing fees, as well as any volume discounts rebated to our customers, are calculated and billed monthly in accordance with our published fee schedules. We make liquidity payments to certain customers in our NYSE businesses and recognize those payments as a cost of revenue. In addition, we pay NYSE regulatory oversight fees to the SEC and collect equal amounts from our customers. These are also considered a cost of revenue, and both of these NYSE-related fees are included in transaction-based expenses. Transaction and clearing revenues and the related transaction-based expenses are all recognized in our Trading and Clearing segment.
|
•
|
Data services
- Data service revenues
represent the following:
|
|
◦
|
Pricing and analytics services provide global securities evaluations, reference data, market indices, risk analytics, derivatives pricing and other information designed to meet our customers' portfolio management, trading, risk management, reporting and regulatory compliance needs.
|
|
◦
|
Exchange data and feeds services provide real-time, historical and derived pricing data, order book and transaction information related to our trading venues as well as data from a broad array of third-party trading venues and news feeds.
|
|
◦
|
Desktops and connectivity services provide the connection to our exchanges, clearing houses and data centers and comprise hosting, colocation, infrastructure, technology-based information platforms, workstations and connectivity solutions through the ICE Global Network.
|
The nature and timing of each contract type for the data services above are similar in nature. Data services revenues are primarily subscription-based, billed monthly, quarterly or annually in advance and recognized ratably over time as our performance obligations of data delivery are met consistently throughout the period. Considering these contracts primarily consist of single performance obligations with fixed prices, there is no variable consideration and no need to allocate the transaction price. In certain of our data contracts, where third parties are involved, we arrange for the third party to transfer the services to our customers; in these arrangements we are acting as an agent and revenue is recorded net. All data services fees are included in our Data and Listings segment.
|
•
|
Listings
-
Listings revenues include original and annual listings fees, and other corporate action fees. Each distinct listing fee is allocated to multiple performance obligations including original and incremental listing and investor relations services, as well as a customer’s material right to renew the option to list on our exchanges. In performing this allocation, the standalone selling price of the listing services is based on the original and annual listing fees and the standalone selling price of the investor relations services is based on its market value. All listings fees are billed upfront and the identified performance obligations are satisfied over time. Revenue related to the investor relations performance obligation is recognized ratably over a
two
-year period, with the remaining revenue recognized ratably over time as customers continue to list on our exchanges, which is generally estimated to be over a period of up to
nine
years for NYSE and up to
five
years for NYSE Arca and NYSE American. Listings fees related to other corporate actions are considered contract modifications of our listing contracts and are recognized ratably over time as customers continue to list on our exchanges, which is generally estimated to be a period of
six
years for NYSE and
three
years for NYSE Arca and NYSE American. All listings fees are recognized in our Data and Listings segment.
|
|
•
|
Other revenues
-
Other revenues
primarily include interest income on certain clearing margin deposits, regulatory penalties and fines, fees for use of our facilities, regulatory fees charged to member organizations of our U.S. securities exchanges, designated market maker service fees, exchange membership fees and agricultural grading and certification fees. Generally, fees for other revenues contain one performance obligation. Because these contracts primarily consist of single performance obligations with fixed prices, there is no variable consideration and no need to allocate the transaction price. Services for other revenues are primarily satisfied at a point in time. Therefore, there is no need to allocate the fee and no deferral results as we have no further obligation to the customer at that time. Other revenues are recognized in our Trading and Clearing segment.
|
The following table depicts the disaggregation of our revenue according to business line and segment (in millions). Segment totals here are consistent with the segment totals in Note 14:
12
|
|
Trading and Clearing Segment
|
Data and Listings Segment
|
Total Consolidated
|
||||||||
|
Three months ended March 31, 2019
|
|||||||||||
|
Transaction and clearing, net
|
$
|
862
|
|
$
|
—
|
|
$
|
862
|
|
||
|
Data services
|
—
|
|
546
|
|
546
|
|
|||||
|
Listings
|
—
|
|
111
|
|
111
|
|
|||||
|
Other revenues
|
64
|
|
—
|
|
64
|
|
|||||
|
Total revenues
|
926
|
|
657
|
|
1,583
|
|
|||||
|
Transaction-based expenses
|
313
|
|
—
|
|
313
|
|
|||||
|
Total revenues, less transaction-based expenses
|
$
|
613
|
|
$
|
657
|
|
$
|
1,270
|
|
||
|
Timing of Revenue Recognition
|
|||||||||||
|
Services transferred at a point in time
|
$
|
528
|
|
$
|
—
|
|
$
|
528
|
|
||
|
Services transferred over time
|
85
|
|
657
|
|
742
|
|
|||||
|
Total revenues, less transaction-based expenses
|
$
|
613
|
|
$
|
657
|
|
$
|
1,270
|
|
||
|
|
Trading and Clearing Segment
|
Data and Listings Segment
|
Total Consolidated
|
||||||||
|
Three months ended March 31, 2018
|
|||||||||||
|
Transaction and clearing, net
|
$
|
898
|
|
$
|
—
|
|
$
|
898
|
|
||
|
Data services
|
—
|
|
520
|
|
520
|
|
|||||
|
Listings
|
—
|
|
109
|
|
109
|
|
|||||
|
Other revenues
|
53
|
|
—
|
|
53
|
|
|||||
|
Total revenues
|
951
|
|
629
|
|
1,580
|
|
|||||
|
Transaction-based expenses
|
355
|
|
—
|
|
355
|
|
|||||
|
Total revenues, less transaction-based expenses
|
$
|
596
|
|
$
|
629
|
|
$
|
1,225
|
|
||
|
Timing of Revenue Recognition
|
|||||||||||
|
Services transferred at a point in time
|
$
|
509
|
|
$
|
—
|
|
$
|
509
|
|
||
|
Services transferred over time
|
87
|
|
629
|
|
716
|
|
|||||
|
Total revenues, less transaction-based expenses
|
$
|
596
|
|
$
|
629
|
|
$
|
1,225
|
|
||
The Trading and Clearing segment revenues above include
$60 million
and
$63 million
for the
three months ended
March 31, 2019
and
2018
, respectively, for services transferred over time related to risk management of open interest performance obligations. A majority of these performance obligations are performed over a short period of time of
one month
or less.
|
5.
|
Goodwill and Other Intangible Assets
|
The following is a summary of the activity in the goodwill balance for the
three months ended
March 31, 2019
(in millions):
|
Goodwill balance at December 31, 2018
|
$
|
13,085
|
|
|
Foreign currency translation
|
11
|
|
|
|
Other activity, net
|
2
|
|
|
|
Goodwill balance at March 31, 2019
|
$
|
13,098
|
|
13
The following is a summary of the activity in the other intangible assets balance for the
three months ended
March 31, 2019
(in millions):
|
Other intangible assets balance at December 31, 2018
|
$
|
10,462
|
|
|
Acquisitions
|
9
|
|
|
|
Foreign currency translation
|
12
|
|
|
|
Amortization of other intangible assets
|
(77
|
)
|
|
|
Other intangible assets balance at March 31, 2019
|
$
|
10,406
|
|
Foreign currency translation adjustments result from a portion of our goodwill and other intangible assets being held at our U.K., EU and Canadian subsidiaries, whose functional currencies are not the U.S. dollar. We did not recognize any impairment losses on goodwill or other intangible assets during the
three months ended
March 31, 2019
and
2018
. The change in other activity, net, in the goodwill table above primarily relates to adjustments to the fair value of the net tangible assets relating to the acquisition of CHX Holdings, Inc., or CHX, with a corresponding adjustment to goodwill.
|
6.
|
Deferred Revenue
|
Our contract liabilities, or deferred revenue, represent consideration received that is yet to be recognized as revenue. Total deferred revenue was
$565 million
as of
March 31, 2019
, including
$479 million
in current deferred revenue and
$86 million
in non-current deferred revenue. The changes in our deferred revenue during the
three months ended
March 31, 2019
are as follows (in millions):
|
Annual Listings Revenues
|
Original Listings Revenues
|
Other Listings Revenues
|
Data Services and Other Revenues
|
Total
|
|||||||||||||||
|
Deferred revenue balance at December 31, 2018
|
$
|
—
|
|
$
|
25
|
|
$
|
100
|
|
$
|
92
|
|
$
|
217
|
|
||||
|
Additions
|
382
|
|
3
|
|
20
|
|
139
|
|
544
|
|
|||||||||
|
Amortization
|
(96
|
)
|
(6
|
)
|
(9
|
)
|
(85
|
)
|
(196
|
)
|
|||||||||
|
Deferred revenue balance at March 31, 2019
|
$
|
286
|
|
$
|
22
|
|
$
|
111
|
|
$
|
146
|
|
$
|
565
|
|
||||
The changes in our deferred revenue during the
three months ended
March 31, 2018
are as follows (in millions):
|
Annual Listings Revenues
|
Original Listings Revenues
|
Other Listings Revenues
|
Data Services and Other Revenues
|
Total
|
|||||||||||||||
|
Deferred revenue balance at December 31, 2017
|
$
|
—
|
|
$
|
25
|
|
$
|
98
|
|
$
|
93
|
|
$
|
216
|
|
||||
|
Additions
|
380
|
|
7
|
|
15
|
|
147
|
|
549
|
|
|||||||||
|
Amortization
|
(95
|
)
|
(6
|
)
|
(8
|
)
|
(96
|
)
|
(205
|
)
|
|||||||||
|
Deferred revenue balance at March 31, 2018
|
$
|
285
|
|
$
|
26
|
|
$
|
105
|
|
$
|
144
|
|
$
|
560
|
|
||||
Included in the amortization recognized during the
three months ended
March 31, 2019
is
$45 million
related to the deferred revenue balance as of January 1, 2019. Included in the amortization recognized for the three months ended March 31, 2018 is
$49 million
related to the deferred revenue balance as of January 1, 2018. As of
March 31, 2019
, the remaining deferred revenue balance for original listings revenue, other listings revenue and data services and other revenues will be recognized over the period of time we satisfy our performance obligations as described in Note 4.
|
7.
|
Debt
|
Our total debt, including short-term and long-term debt, consisted of the following as of
March 31, 2019
and
December 31, 2018
(in millions):
14
|
As of
March 31, 2019 |
As of
December 31, 2018 |
||||||
|
Debt:
|
|||||||
|
Short-term debt:
|
|||||||
|
Commercial Paper
|
$
|
1,005
|
|
$
|
951
|
|
|
|
Total short-term debt
|
1,005
|
|
951
|
|
|||
|
Long-term debt:
|
|||||||
|
2020 Senior Notes (2.75% senior unsecured notes due December 1, 2020)
|
1,247
|
|
1,246
|
|
|||
|
2022 Senior Notes (2.35% senior unsecured notes due September 15, 2022)
|
496
|
|
496
|
|
|||
|
2023 Senior Notes (3.45% senior unsecured notes due September 21, 2023)
|
397
|
|
397
|
|
|||
|
2023 Senior Notes (4.00% senior unsecured notes due October 15, 2023)
|
793
|
|
793
|
|
|||
|
2025 Senior Notes (3.75% senior unsecured notes due December 1, 2025)
|
1,243
|
|
1,243
|
|
|||
|
2027 Senior Notes (3.10% senior unsecured notes due September 15, 2027)
|
496
|
|
496
|
|
|||
|
2028 Senior Notes (3.75% senior unsecured notes due September 21, 2028)
|
592
|
|
591
|
|
|||
|
2048 Senior Notes (4.25% senior unsecured notes due September 21, 2048)
|
1,228
|
|
1,228
|
|
|||
|
Total long-term debt
|
6,492
|
|
6,490
|
|
|||
|
Total debt
|
$
|
7,497
|
|
$
|
7,441
|
|
|
Credit Facility
We have a
$3.4 billion
senior unsecured revolving credit facility, or the Credit Facility, with a maturity date of August 9, 2023. The Credit Facility includes an option for us to propose an increase in the aggregate amount available for borrowing by up to
$975 million
, subject to the consent of the lenders funding the increase and certain other conditions.
No
amounts were outstanding under the Credit Facility as of
March 31, 2019
.
As of
March 31, 2019
, of the
$3.4 billion
that is currently available for borrowing under the Credit Facility,
$1.0 billion
is required to back-stop the amount outstanding under our Commercial Paper Program and
$105 million
is required to support certain broker-dealer subsidiary commitments. The amount required to back-stop the amounts outstanding under the Commercial Paper Program will fluctuate as we increase or decrease our commercial paper borrowings. The remaining
$2.3 billion
is available for working capital and general corporate purposes including, but not limited to, acting as a back-stop to future increases in the amounts outstanding under the Commercial Paper Program.
Commercial Paper Program
We have a U.S. dollar commercial paper program, or the Commercial Paper Program. It is currently backed by the borrowing capacity available under the Credit Facility, as described above. The effective interest rate of commercial paper issuances does not materially differ from short-term interest rates (such as USD LIBOR) which fluctuate due to market conditions and as a result may impact our interest expense. During the
three months ended
March 31, 2019
, we had net issuances of
$54 million
under the Commercial Paper Program, the proceeds of which were used for general corporate purposes.
Commercial paper notes of
$1.0 billion
with original maturities ranging from
one
to
88
days were outstanding as of
March 31, 2019
under our Commercial Paper Program, with a weighted average interest rate of
2.54%
per annum and a weighted average maturity of
22
days.
|
8.
|
Share-Based Compensation
|
We currently sponsor employee and director stock option, restricted stock and employee stock purchase plans. Stock options and restricted stock are granted at the discretion of the Compensation Committee of our Board of Directors based on estimated fair value on the date of grant. The fair value of the stock options and restricted stock on the date of grant is recognized as expense over the vesting period, net of forfeitures. The non-cash compensation expenses recognized in our consolidated statements of income for stock options, restricted stock and under our employee stock purchase plan were
$29 million
for both the
three months ended March 31, 2019
and
2018
.
Stock Option Plans
The following is a summary of stock option activity for the
three months ended March 31, 2019
:
15
|
Number of Options
(in thousands)
|
Weighted Average
Exercise Price per Option |
|||||
|
Outstanding at December 31, 2018
|
3,610
|
|
$
|
46.44
|
|
|
|
Granted
|
493
|
|
76.16
|
|
||
|
Exercised
|
(172
|
)
|
29.07
|
|
||
|
Outstanding at March 31, 2019
|
3,931
|
|
50.93
|
|
||
Details of stock options outstanding as of
March 31, 2019
are as follows:
|
Number of Options
(in thousands)
|
Weighted Average
Exercise Price |
Weighted Average
Remaining Contractual Life (Years) |
Aggregate
Intrinsic Value (In millions) |
|||||||||
|
Vested or expected to vest
|
3,931
|
|
$
|
50.93
|
|
6.6
|
$
|
99
|
|
|||
|
Exercisable
|
2,848
|
|
$
|
43.98
|
|
5.7
|
$
|
92
|
|
|||
The total intrinsic value of stock options exercised was
$8 million
and
$9 million
for the
three months ended March 31, 2019
and
2018
, respectively. As of
March 31, 2019
, there were
$7 million
in total unrecognized compensation costs related to stock options. These costs are expected to be recognized over a weighted average period of
2.1
years as the stock options vest.
We use the Black-Scholes option pricing model to value our stock option awards. During the
three months ended March 31, 2019
and
2018
, we used the weighted-average assumptions in the table below to compute the value of all options for shares of common stock granted to employees:
|
Three Months Ended March 31,
|
|||||||
|
Assumptions:
|
2019
|
2018
|
|||||
|
Risk-free interest rate
|
2.49
|
%
|
2.66
|
%
|
|||
|
Expected life in years
|
5.9
|
|
6.0
|
|
|||
|
Expected volatility
|
20
|
%
|
20
|
%
|
|||
|
Expected dividend yield
|
1.44
|
%
|
1.43
|
%
|
|||
|
Estimated weighted-average fair value of options granted per share
|
$
|
15.45
|
|
$
|
13.98
|
|
|
The risk-free interest rate is based on the zero-coupon U.S. Treasury yield curve in effect at the date of grant. The expected life is derived from historical and anticipated future exercise patterns. Expected volatility is based on historical volatility data of our stock.
Restricted Stock Plans
Our restricted shares have vesting conditions based on company performance linked to both short-term and long-term stockholder return as well as retention objectives. The grant date fair value of our restricted stock awards is based on the closing stock price on the date of grant.
In February 2019, we reserved a maximum of
1.1 million
restricted shares for potential issuance as performance-based restricted shares to certain of our employees. The number of shares that will ultimately be granted under this award will be based on our actual financial performance as compared to financial performance targets set by our Board of Directors and the Compensation Committee of the Board of Directors for the year ending December 31, 2019, as well as our 2019 total stockholder return, or TSR, as compared to that of the S&P 500 Index. The maximum compensation expense to be recognized under these performance-based restricted shares is
$82 million
if the maximum financial performance target is met and all
1.1 million
shares vest. The compensation expense to be recognized under these performance-based restricted shares will be
$41 million
if the target financial performance is met, which would result in
0.6 million
shares vesting. We recognize expense on an accelerated basis over the
three
-year vesting period based on our quarterly assessment of the probable
2019
actual financial performance as compared to the
2019
financial performance targets. As of
March 31, 2019
, we determined that it is probable that the financial performance level will be at target for
2019
. Based on this assessment, we recorded non-cash compensation expense of
$3 million
for the
three months ended
March 31, 2019
related to these shares and the remaining
$38 million
in non-cash compensation expense will be recorded on an accelerated basis over the remaining vesting period, including
$19 million
of which will be recorded over the remainder of
2019
.
16
The following is a summary of the non-vested restricted share activity for the
three months ended
March 31, 2019
:
|
Number of
Restricted Stock Shares
(in thousands)
|
Weighted Average
Grant-Date Fair Value per Share |
||||
|
Non-vested at December 31, 2018
|
4,470
|
$
|
60.56
|
|
|
|
Granted
|
1,569
|
76.19
|
|
||
|
Vested
|
(1,991)
|
57.14
|
|
||
|
Forfeited
|
(73)
|
64.06
|
|
||
|
Non-vested at March 31, 2019
|
3,975
|
68.38
|
|
||
The shares granted include
0.9 million
time-based and the remainder are performance-based. Performance-based restricted shares have been presented to reflect the actual shares to be issued based on the achievement of past performance targets, also considering the impact of any market conditions. Non-vested performance-based restricted shares granted are presented in the table above at the target number of restricted shares that would vest if the performance targets are met. As of
March 31, 2019
, there were
$188 million
in total unrecognized compensation costs related to time-based and performance-based restricted stock. These costs are expected to be recognized over a weighted-average period of
1.8
years as the restricted stock vests. These unrecognized compensation costs assume that a target performance level will be met on the performance-based restricted shares granted in February 2019. During the
three months ended
March 31, 2019
and
2018
, the total fair value of restricted stock vested under all restricted stock plans was
$149 million
and
$182 million
, respectively.
Bakkt Incentive Units
We own a majority of Bakkt Holdings, LLC, or Bakkt, and consolidate its operations. In February 2019, our Board approved the adoption of the Bakkt Equity Incentive Plan to issue various Bakkt equity unit awards. Under this plan, on February 28, 2019, Bakkt issued
86 million
,
4 million
and
1 million
of its preferred, common and phantom incentive units, respectively, to certain employees and a member of its Board. The issued units are unvested at the issuance date, are subject to the vesting terms in the award agreements and upon vesting are converted into Bakkt equity or cash. With the assistance of third-party valuation experts and based on our assumptions as of the issuance date, we estimate that approximately
$41 million
of compensation expense will be recognized over an
eight
-year period associated with these awards.
|
9.
|
Equity
|
Stock Repurchase Program
In September 2018, our Board of Directors approved an aggregate of
$2.0 billion
for repurchases of our common stock with no fixed expiration date that became effective January 1, 2019. During the
three months ended
March 31, 2019
, we repurchased
4.6 million
shares of our outstanding common stock at a cost of
$340 million
under our Rule 10b5-1 trading plan and
1.3 million
shares at a cost of
$100 million
on the open market. As of
March 31, 2019
, up to $
1.6 billion
remains from the board authorization for repurchases of our common stock. We expect to fund repurchases from our operating cash flow or borrowings under our debt facilities or our Commercial Paper Program. Repurchases may be made from time to time on the open market, through established trading plans, in privately-negotiated transactions or otherwise, in accordance with all applicable securities laws, rules and regulations. We have entered into a Rule 10b5-1 trading plan, as authorized by our Board, to govern some of the repurchases of our shares of common stock. We may discontinue the stock repurchases at any time and may amend or terminate the Rule 10b5-1 trading plan at any time. The approval of our Board for the share repurchases does not obligate us to acquire any particular amount of our common stock. In addition, our Board of Directors may increase or decrease the amount available for repurchases from time to time.
Dividends
During the
three months ended
March 31, 2019
and
2018
, we declared and paid cash dividends per share of
$0.275
and
$0.24
, respectively, for an aggregate payout of
$157 million
and
$140 million
, respectively. The declaration of dividends is subject to the discretion of our Board, and may be affected by various factors, including our future earnings, financial condition, capital requirements, levels of indebtedness, credit ratings and other considerations which our Board of Directors deem relevant. Our Board has adopted a quarterly dividend declaration policy providing that the declaration of any dividends will be determined quarterly by the Board or its Audit Committee, taking into account such factors as our evolving business model, prevailing business conditions and our financial results and capital requirements, without a predetermined annual net income payout ratio.
17
Accumulated Other Comprehensive Income (Loss)
The following tables present changes in the accumulated balances for each component of other comprehensive income (loss):
|
Changes in Accumulated Other Comprehensive Income (Loss) by Component
|
||||||||||||||||
|
Balance, as of December 31, 2018
|
$
|
(227
|
)
|
$
|
2
|
|
$
|
(90
|
)
|
$
|
(315
|
)
|
||||
|
Other comprehensive income (loss)
|
26
|
|
(1
|
)
|
—
|
|
25
|
|
||||||||
|
Income tax benefit (expense)
|
—
|
|
—
|
|
—
|
|
—
|
|
||||||||
|
Net current period other comprehensive income (loss)
|
26
|
|
|
(1
|
)
|
|
—
|
|
|
25
|
|
|||||
|
Balance, as of March 31, 2019
|
$
|
(201
|
)
|
|
$
|
1
|
|
|
$
|
(90
|
)
|
|
$
|
(290
|
)
|
|
|
Changes in Accumulated Other Comprehensive Income (Loss) by Component
|
||||||||||||||||
|
Balance, as of December 31, 2017
|
$
|
(136
|
)
|
$
|
2
|
|
$
|
(89
|
)
|
$
|
(223
|
)
|
||||
|
Other comprehensive income
|
34
|
|
—
|
|
—
|
|
34
|
|
||||||||
|
Income tax benefit (expense)
|
(1
|
)
|
—
|
|
—
|
|
(1
|
)
|
||||||||
|
Net current period other comprehensive income
|
33
|
|
—
|
|
—
|
|
33
|
|
||||||||
|
Balance, as of March 31, 2018
|
$
|
(103
|
)
|
$
|
2
|
|
$
|
(89
|
)
|
$
|
(190
|
)
|
||||
10.
Income Taxes
Our effective tax rate was
21%
and
23%
for the
three months ended March 31, 2019
and
2018
, respectively. The effective tax rate for the
three months ended
March 31, 2019
was lower than the effective tax rate for the comparable period in
2018
primarily due to reduced U.S. federal and state income taxes on our non-U.S. income under certain international tax provisions enacted as part of the Tax Cuts and Jobs Act, or TCJA, and deferred tax benefits related to state apportionment changes. The reduced U.S. federal and state income taxes are a result of clarifications provided by subsequent federal and state legislative or administrative guidance to those international provisions of the TCJA and related state provisions.
11.
Clearing Operations
We operate
six
clearing houses, each of which acts as a central counterparty that becomes the buyer to every seller and the seller to every buyer for its clearing members. Through this central counterparty function, the clearing houses provide financial security for each transaction for the duration of the position by limiting counterparty credit risk.
Our clearing houses are responsible for providing clearing services to each of our futures exchanges, and in some cases outside of our execution venues, and are as follows, referred to herein collectively as "the ICE Clearing Houses":
|
ICE Portion of Guaranty Fund Contribution
|
||||||||||||
|
(in millions)
|
||||||||||||
|
Clearing House
|
Products Cleared
|
Exchange where Executed
|
Location
|
As of
March 31, 2019 |
As of
December 31, 2018 |
|||||||
|
ICE Clear Europe
|
Energy, agricultural, interest rates and equity index futures and options contracts and OTC European CDS instruments
|
ICE Futures Europe, ICE Futures U.S., ICE Endex and third-party venues
|
U.K.
|
$233
|
$206
|
|||||||
|
ICE Clear US
|
Agricultural, metals, FX and equity index futures and options contracts
|
ICE Futures U.S.
|
U.S.
|
68
|
|
61
|
|
|||||
|
ICE Clear Credit
|
North American, European, Asian-Pacific and Emerging Market CDS instruments
|
Creditex and third-party venues
|
U.S.
|
50
|
|
50
|
|
|||||
|
ICE Clear Netherlands
|
Derivatives on equities and equity indices traded on regulated markets
|
ICE Endex
|
The Netherlands
|
2
|
|
2
|
|
|||||
|
ICE Clear Singapore
|
Energy, metals and financial futures products
|
ICE Futures Singapore
|
Singapore
|
1
|
|
1
|
|
|||||
|
ICE NGX
|
Physical North American natural gas, electricity and oil futures
|
ICE NGX
|
Canada
|
N/A
|
|
N/A
|
|
|||||
|
Total
|
$354
|
$320
|
||||||||||
18
As of
March 31, 2019
, ICE NGX maintains a guaranty fund utilizing a
$100 million
letter of credit and a default insurance policy discussed below.
Original & Variation Margin
Each of the ICE Clearing Houses generally require all clearing members or participants to deposit collateral in cash or certain pledged assets. The collateral deposits are known as “original margin.” In addition, the ICE Clearing Houses may make intraday original margin calls in circumstances where market conditions require additional protection. The daily profits and losses to and from the ICE Clearing Houses due to the marking-to-market of open contracts is known as “variation margin.” With the exception of ICE NGX’s physical natural gas and physical power products discussed separately below, the ICE Clearing Houses mark all outstanding contracts to market, and therefore pay and collect variation margin, at least once daily.
The amounts that the clearing members and participants are required to maintain are determined by proprietary risk models established by each ICE Clearing House and reviewed by the relevant regulators, independent model validators, risk committees and the boards of directors of the respective ICE Clearing House. The amounts required may fluctuate over time. Each of the ICE Clearing Houses is a separate legal entity and is not subject to the liabilities of the others, or the obligations of the members of the other ICE Clearing Houses.
Should a particular clearing member or participant fail to deposit its original margin or fail to make a variation margin payment, when and as required, the relevant ICE Clearing House may liquidate or hedge its open positions and use their original margin and guaranty fund deposits to pay any amount owed. In the event that the defaulting clearing member's deposits are not sufficient to pay the amount owed in full, the ICE Clearing Houses will first use their respective contributions to the guaranty fund, often referred to as Skin In The Game, or SITG, to pay any remaining amount owed. In the event that the SITG is not sufficient, the ICE Clearing Houses may utilize the respective guaranty fund deposits, or collect additional funds from their respective non-defaulting clearing members on a pro-rata basis, to pay any remaining amount owed.
As of
March 31, 2019
and
December 31, 2018
, the ICE Clearing Houses have received or have been pledged
$125.9 billion
and
$121.4 billion
, respectively, in cash and non-cash collateral in original margin and guaranty fund deposits to cover price movements of underlying contracts for both periods.
Guaranty Funds & ICE Contribution
As described above, mechanisms have been created, called guaranty funds, to provide partial protection in the event of a clearing member default. With the exception of ICE NGX, each of the ICE Clearing Houses require that each clearing member make deposits into a guaranty fund.
In addition, we have contributed our own capital which could be used if a defaulting clearing member’s original margin and guaranty fund deposits are insufficient. Such amounts are recorded as long-term restricted cash and cash equivalents in our balance sheets and included in the table above.
In January 2019, we increased our contribution to ICE Clear Europe’s guaranty fund by
$27 million
and in March 2019, we increased our ICE Clear US guaranty fund contribution by
$7 million
.
19
Cash and Cash Equivalent Deposits
We have recorded cash and cash equivalent margin deposits and amounts due in our balance sheets as current assets with corresponding current liabilities to the clearing members. As of
March 31, 2019
, our cash and cash equivalent margin deposits are as follows (in millions):
|
ICE Clear Europe
(1)
|
ICE Clear
Credit |
ICE Clear US
|
ICE NGX
|
Other ICE Clearing Houses
|
Total
|
||||||||||||||||||
|
Original margin
|
$
|
27,787
|
|
$
|
21,487
|
|
$
|
7,400
|
|
$
|
—
|
|
$
|
4
|
|
$
|
56,678
|
|
|||||
|
Unsettled variation margin, net
|
—
|
|
—
|
|
—
|
|
290
|
|
—
|
|
290
|
|
|||||||||||
|
Guaranty fund
|
4,123
|
|
2,335
|
|
458
|
|
—
|
|
6
|
|
6,922
|
|
|||||||||||
|
Delivery contracts receivable/payable, net
|
—
|
|
—
|
|
—
|
|
674
|
|
—
|
|
674
|
|
|||||||||||
|
Total
|
$
|
31,910
|
|
$
|
23,822
|
|
$
|
7,858
|
|
$
|
964
|
|
$
|
10
|
|
$
|
64,564
|
|
|||||
As of
December 31, 2018
, our cash and cash equivalent deposits, are as follows (in millions):
|
ICE Clear Europe
(2)
|
ICE Clear
Credit |
ICE Clear US
|
ICE NGX
|
Other ICE Clearing Houses
|
Total
|
||||||||||||||||||
|
Original margin
|
$
|
27,597
|
|
$
|
22,770
|
|
$
|
6,260
|
|
$
|
—
|
|
$
|
3
|
|
$
|
56,630
|
|
|||||
|
Unsettled variation margin, net
|
—
|
|
—
|
|
—
|
|
417
|
|
—
|
|
417
|
|
|||||||||||
|
Guaranty fund
|
3,267
|
|
2,456
|
|
460
|
|
—
|
|
5
|
|
6,188
|
|
|||||||||||
|
Delivery contracts receivable/payable, net
|
—
|
|
—
|
|
—
|
|
720
|
|
—
|
|
720
|
|
|||||||||||
|
Total
|
$
|
30,864
|
|
$
|
25,226
|
|
$
|
6,720
|
|
$
|
1,137
|
|
$
|
8
|
|
$
|
63,955
|
|
|||||
(1)
$27.5 billion
and
$4.4 billion
is related to futures/options and CDS, respectively.
(2)
$25.8 billion
and
$5.1 billion
is related to futures/options and CDS, respectively.
Our cash and cash equivalent margin and guaranty fund deposits are maintained in accounts with national banks and reputable financial institutions or secured through direct investments, primarily in U.S. Treasury securities with original maturities of less than three months, or reverse repurchase agreements with primarily overnight maturities. Details of our cash and cash equivalent deposits are as follows (in millions):
|
Clearing House
|
Investment Type
|
As of
March 31, 2019 |
As of
December 31, 2018 |
|||||||||
|
ICE Clear Europe
|
National Bank Account
(1)
|
$
|
3,639
|
|
$
|
8,647
|
|
|||||
|
ICE Clear Europe
|
Reverse repo
|
24,515
|
|
18,097
|
|
|||||||
|
ICE Clear Europe
|
Sovereign Debt
|
3,737
|
|
4,035
|
|
|||||||
|
ICE Clear Europe
|
Demand deposits
|
19
|
|
85
|
|
|||||||
|
ICE Clear Credit
|
National Bank Account
(2)
|
18,735
|
|
19,484
|
|
|||||||
|
ICE Clear Credit
|
Reverse repo
|
2,189
|
|
1,935
|
|
|||||||
|
ICE Clear Credit
|
Demand deposits
|
2,898
|
|
3,807
|
|
|||||||
|
ICE Clear US
|
Reverse repo
|
5,269
|
|
4,380
|
|
|||||||
|
ICE Clear US
|
U.S. Treasuries
|
2,589
|
|
2,340
|
|
|||||||
|
Other ICE Clearing Houses
|
Demand deposits
|
10
|
|
8
|
|
|||||||
|
ICE NGX
|
Unsettled Variation Margin and Delivery Contracts Receivable/Payable
|
964
|
|
1,137
|
|
|||||||
|
Total
|
$
|
64,564
|
|
$
|
63,955
|
|
||||||
(1)
As of
March 31, 2019
, ICE Clear Europe held
€2.7 billion
(
$3.0 billion
based on the euro/U.S. dollar exchange rate of
1.1224
as of
March 31, 2019
) at De Nederlandsche Bank, or DNB, and
£500 million
(
$652 million
based on the pound sterling/U.S. dollar exchange rate of
1.3046
as of
March 31, 2019
) at the Bank of England, or BOE. As of December 31, 2018, ICE Clear Europe held
€7.0 billion
(
$8.0 billion
based on the euro/U.S. dollar exchange rate of
1.1466
as of December 31, 2018) at DNB and
£500 million
(
$638 million
based on the pound sterling/U.S. dollar exchange rate of
1.2756
as of December 31, 2018) at the BOE.
20
(2)
ICE Clear Credit is a systemically important financial market utility, or SIFMU, as designated by the Financial Stability Oversight Council, and holds its U.S. dollar cash margin in cash accounts at the Federal Reserve Bank of Chicago.
Other Deposits
In addition to the cash deposits above, the ICE Clearing Houses have also received other assets from clearing members, which include government obligations, and may include other non-cash collateral such as letters of credit or gold to mitigate credit risk. For certain deposits, we may impose discount or “haircut” rates to ensure adequate collateral if market values fluctuate. The value-related risks and rewards of these assets remain with the clearing members. Any gain or loss accrues to the clearing member. The ICE Clearing Houses do not rehypothecate or re-pledge these assets. These pledged assets are not reflected in our balance sheets, and are as follows:
|
|
As of March 31, 2019
|
|||||||||||||||||||
|
ICE Clear
Europe |
ICE Clear
Credit |
ICE Clear US
|
ICE NGX
|
Total
|
||||||||||||||||
|
Original margin:
|
||||||||||||||||||||
|
Government securities at face value
|
$
|
31,479
|
|
$
|
14,231
|
|
$
|
11,561
|
|
$
|
—
|
|
$
|
57,271
|
|
|||||
|
Letters of credit
|
—
|
|
—
|
|
—
|
|
2,486
|
|
2,486
|
|
||||||||||
|
ICE NGX cash deposits
|
—
|
|
—
|
|
—
|
|
482
|
|
482
|
|
||||||||||
|
Total
|
$
|
31,479
|
|
$
|
14,231
|
|
$
|
11,561
|
|
$
|
2,968
|
|
$
|
60,239
|
|
|||||
|
Guaranty fund:
|
||||||||||||||||||||
|
Government securities at face value
|
$
|
557
|
|
$
|
279
|
|
$
|
275
|
|
$
|
—
|
|
$
|
1,111
|
|
|||||
|
As of December 31, 2018
|
||||||||||||||||||||
|
ICE Clear
Europe |
ICE Clear
Credit |
ICE Clear US
|
ICE NGX
|
Total
|
||||||||||||||||
|
Original margin:
|
||||||||||||||||||||
|
Government securities at face value
|
$
|
29,887
|
|
$
|
12,990
|
|
$
|
10,208
|
|
$
|
—
|
|
$
|
53,085
|
|
|||||
|
Letters of credit
|
—
|
|
—
|
|
—
|
|
2,556
|
|
2,556
|
|
||||||||||
|
ICE NGX cash deposits
|
—
|
|
—
|
|
—
|
|
605
|
|
605
|
|
||||||||||
|
Total
|
$
|
29,887
|
|
$
|
12,990
|
|
$
|
10,208
|
|
$
|
3,161
|
|
$
|
56,246
|
|
|||||
|
Guaranty fund:
|
||||||||||||||||||||
|
Government securities at face value
|
$
|
654
|
|
$
|
256
|
|
$
|
264
|
|
$
|
—
|
|
$
|
1,174
|
|
|||||
ICE NGX
ICE NGX is the central counterparty to participants on opposite sides of its physically-settled contracts, and the balance related to delivered but unpaid contracts is recorded as a delivery contract net receivable, with an offsetting delivery contract net payable in our balance sheets. Unsettled variation margin equal to the fair value of open contracts is recorded as of each balance sheet date. ICE NGX marks all outstanding contracts to market daily, but only collects variation margin when a clearing member's or participant’s open position falls outside a specified percentage of its pledged collateral.
ICE NGX requires participants to maintain cash or letters of credit to serve as collateral in the event of default. ICE NGX maintains the following accounts with a third-party Canadian chartered bank which are available in the event of physical settlement shortfalls, subject to certain conditions:
|
Account Type
|
As of March 31, 2019
(In C$ millions)
|
As of March 31, 2019
(In $USD millions)
|
||||
|
Daylight liquidity facility
|
C$300
|
$225
|
||||
|
Overdraft facility
|
20
|
|
15
|
|
||
|
Total
|
C$320
|
$240
|
||||
As of
March 31, 2019
, ICE NGX maintains a guaranty fund utilizing a
$100 million
letter of credit that has been entered into with a major Canadian chartered bank and backed by a default insurance policy underwritten by Export Development Corporation, or EDC, a Canadian government agency. In event of a participant default, where a participant’s collateral becomes depleted, the remaining shortfall would be covered by a draw down on the letter of credit following which ICE NGX would pay the first
$15 million
in losses per its deductible and recover additional losses under the insurance policy up to
$100 million
.
21
Clearing House Exposure
Each ICE Clearing House bears financial counterparty credit risk and provides a central counterparty guarantee, or performance guarantee, to its clearing members or participants. To reduce their exposure, the ICE Clearing Houses have a risk management program with both initial and ongoing membership standards. Excluding the effects of original and variation margin, guaranty fund and collateral requirements, the ICE Clearing Houses’ maximum estimated exposure for this guarantee is
$104.6 billion
as of
March 31, 2019
, which represents the maximum estimated value by the ICE Clearing Houses of a hypothetical one-day movement in pricing of the underlying unsettled contracts. This value was determined using proprietary risk management software that simulates gains and losses based on historical market prices, volatility and other factors present at that point in time for those particular unsettled contracts. Future actual market price volatility could result in the exposure being significantly different than this amount.
12. Legal Proceedings
We are subject to legal proceedings, claims and investigations that arise in the ordinary course of our business. These include the matters described in Part I, Item 3 “Legal Proceedings” and Note 15 to the consolidated financial statements in Part II, Item 8 of our 2018 Form 10-K. We establish accruals for those matters in circumstances when a loss contingency is considered probable and the related amount is reasonably estimable. Any such accruals may be adjusted as circumstances change. Assessments of losses are inherently subjective and involve unpredictable factors. We do not believe that the resolution of these legal matters, including the matters described below, will have a material adverse effect on our consolidated financial condition, results of operations, or liquidity. It is possible, however, that future results of operations for any particular quarterly or annual period could be materially and adversely affected by any developments relating to the legal proceedings, claims and investigations.
LIBOR Litigation
On January 15, 2019 and January 31, 2019,
two
virtually identical purported class action complaints were filed by, respectively, Putnam Bank, a savings bank based in Putnam, Connecticut, and
two
municipal pension funds affiliated with the City of Livonia, Michigan in the Southern District against ICE and several of its subsidiaries, including ICE Benchmark Administration Limited (“IBA”) (the “ICE Defendants”), as well as
18
multinational banks and various of their respective subsidiaries and affiliates (the “Panel Bank Defendants”). On March 4, 2019, a virtually identical complaint was filed on behalf of
four
retirement and benefit funds affiliated with the Hawaii Sheet Metal Workers Union. IBA is the administrator for various regulated benchmarks, including the ICE LIBOR benchmark that is calculated daily based upon the submissions from a reference panel (which includes the Panel Bank Defendants).
The plaintiffs seek to litigate on behalf of a purported class of all U.S.-based persons or entities who transacted with a Panel Bank Defendant by receiving a payment on an interest rate indexed to a LIBOR-benchmarked rate during the period February 1, 2014 to the present. The plaintiffs allege that the ICE Defendants and Panel Bank Defendants engaged in a conspiracy to set the LIBOR benchmark at artificially low levels, with an alleged purpose and effect of depressing payments by the Panel Bank Defendants to members of the purported class.
The complaints assert claims for violations of the Sherman and Clayton Antitrust Acts and for unjust enrichment under common law, and seek unspecified treble damages and other relief. ICE intends to vigorously defend these matters.
13. Fair Value Measurements
Fair value is the price that would be received from selling an asset or paid to transfer a liability (an exit price) in the principal or most advantageous market for the asset or liability in an orderly transaction between market participants at the measurement date. Our financial instruments consist primarily of certain short-term and long-term assets and liabilities, customer accounts receivable, margin deposits and guaranty funds, equity investments, and short-term and long-term debt.
The fair value of our financial instruments is measured based on a three-level hierarchy:
|
•
|
Level 1 inputs
— quoted prices for identical assets or liabilities in active markets.
|
|
•
|
Level 2 inputs
— observable inputs other than Level 1 inputs such as quoted prices for similar assets and liabilities in active markets or inputs other than quoted prices that are directly observable.
|
|
•
|
Level 3 inputs
— unobservable inputs supported by little or no market activity and that are significant to the fair value of the assets or liabilities.
|
22
Financial assets and liabilities recorded or disclosed at fair value in the accompanying consolidated balance sheets as of
March 31, 2019
and
December 31, 2018
are classified in their entirety based on the lowest level of input that is significant to the asset or liability’s fair value measurement.
Our mutual funds are equity and fixed income mutual funds held for the purpose of providing future payments for the supplemental executive savings plan and the supplemental executive retirement plan and are classified as equity investments and measured at fair value using Level 1 inputs with adjustments recorded in net income.
We hold money market funds measured at fair value using Level 1 inputs with adjustments recorded in net income.
MERSCORP Holdings, Inc., or MERS, is part of our ICE Mortgage Services business and holds fixed income investments in order to satisfy the original terms of the governing documents of our June 2016 acquisition of a majority equity position in MERS. These investments are measured at fair value using Level 2 inputs with adjustments recorded in net income.
Excluding our equity investments without a readily determinable fair value, all other financial instruments are determined to approximate carrying value due to the short period of time to their maturities.
We did not use Level 3 inputs to determine the fair value of assets or liabilities measured at fair value on a recurring basis as of
March 31, 2019
or
December 31, 2018
.
We measure certain assets, such as intangible assets, at fair value on a non-recurring basis. These assets are recognized at fair value if they are deemed to be impaired. As of
March 31, 2019
and
December 31, 2018
, none of our intangible assets were required to be recorded at fair value since no impairments were recorded.
We measure certain equity investments at fair value on a non-recurring basis using our policy election under ASU No. 2016-01,
Financial Instruments-Overall (Subtopic 825-10): Recognition and Measurement of Financial Assets and Financial Liabilities.
During the
three months ended March 31, 2019
, we evaluated a transaction involving one of these investments and concluded that no fair value adjustment was required under this election.
See Note 11 for the fair value considerations related to our margin deposits, guaranty funds and delivery contracts receivable.
The table below displays the fair value of our debt as of
March 31, 2019
. The fair values of our fixed rate notes were estimated using quoted market prices for these instruments. The fair value of our commercial paper approximates par value since the interest rates on this short-term debt approximate market rates as of
March 31, 2019
.
|
As of March 31, 2019
|
|||||||
|
Carrying Amount
|
Fair value
|
||||||
|
Debt:
|
In Millions
|
||||||
|
Commercial Paper
|
$
|
1,005
|
|
$
|
1,008
|
|
|
|
2020 Senior Notes (2.75% senior unsecured notes due December 1, 2020)
|
1,247
|
|
1,252
|
|
|||
|
2022 Senior Notes (2.35% senior unsecured notes due September 15, 2022)
|
496
|
|
493
|
|
|||
|
2023 Senior Notes (3.45% senior unsecured notes due September 21, 2023)
|
397
|
|
411
|
|
|||
|
2023 Senior Notes (4.00% senior unsecured notes due October 15, 2023)
|
793
|
|
841
|
|
|||
|
2025 Senior Notes (3.75% senior unsecured notes due December 1, 2025)
|
1,243
|
|
1,302
|
|
|||
|
2027 Senior Notes (3.10% senior unsecured notes due September 15, 2027)
|
496
|
|
497
|
|
|||
|
2028 Senior Notes (3.75% senior unsecured notes due September 21, 2028)
|
592
|
|
624
|
|
|||
|
2048 Senior Notes (4.25% senior unsecured notes due September 21, 2048)
|
1,228
|
|
1,317
|
|
|||
|
Total debt
|
$
|
7,497
|
|
$
|
7,745
|
|
|
|
14.
|
Segment Reporting
|
We operate
two
business segments: our Trading and Clearing segment and our Data and Listings segment. This presentation is reflective of how our chief operating decision maker reviews and operates our business. Our Trading and Clearing segment comprises our transaction-based execution and clearing businesses. Our Data and Listings segment comprises our data services and our securities listings businesses, which are both largely subscription-based. Our chief operating decision maker does not review total assets or statements of income below operating income by segments; therefore, such information is not presented below. Our
two
segments do not engage in intersegment transactions.
Financial data for our business segments is as follows for the
three months ended
March 31, 2019
and
2018
(in millions):
23
|
Three Months Ended March 31, 2019
|
Three Months Ended March 31, 2018
|
||||||||||||||||||||||
|
Trading and Clearing Segment
|
Data and Listings Segment
|
Consolidated
|
Trading and Clearing Segment
|
Data and Listings Segment
|
Consolidated
|
||||||||||||||||||
|
Revenues:
|
|||||||||||||||||||||||
|
Energy futures and options contracts
|
$
|
229
|
|
$
|
—
|
|
$
|
229
|
|
$
|
235
|
|
$
|
—
|
|
$
|
235
|
|
|||||
|
Agricultural and metals futures and options contracts
|
62
|
|
—
|
|
62
|
|
65
|
|
—
|
|
65
|
|
|||||||||||
|
Financial futures and options contracts
|
83
|
|
—
|
|
83
|
|
91
|
|
—
|
|
91
|
|
|||||||||||
|
Cash equities and equity options
|
390
|
|
—
|
|
390
|
|
438
|
|
—
|
|
438
|
|
|||||||||||
|
Fixed income and credit
|
87
|
|
—
|
|
87
|
|
56
|
|
—
|
|
56
|
|
|||||||||||
|
OTC and other transactions
|
11
|
|
—
|
|
11
|
|
13
|
|
—
|
|
13
|
|
|||||||||||
|
Pricing and analytics
|
—
|
|
266
|
|
266
|
|
—
|
|
254
|
|
254
|
|
|||||||||||
|
Exchange data and feeds
|
—
|
|
176
|
|
176
|
|
—
|
|
164
|
|
164
|
|
|||||||||||
|
Desktops and connectivity
|
—
|
|
104
|
|
104
|
|
—
|
|
102
|
|
102
|
|
|||||||||||
|
Listings
|
—
|
|
111
|
|
111
|
|
—
|
|
109
|
|
109
|
|
|||||||||||
|
Other revenues
|
64
|
|
—
|
|
64
|
|
53
|
|
—
|
|
53
|
|
|||||||||||
|
Revenues
|
926
|
|
657
|
|
1,583
|
|
951
|
|
629
|
|
1,580
|
|
|||||||||||
|
Transaction-based expenses
|
313
|
|
—
|
|
313
|
|
355
|
|
—
|
|
355
|
|
|||||||||||
|
Revenues, less transaction-based expenses
|
613
|
|
657
|
|
1,270
|
|
596
|
|
629
|
|
1,225
|
|
|||||||||||
|
Operating expenses
|
228
|
|
377
|
|
605
|
|
207
|
|
368
|
|
575
|
|
|||||||||||
|
Operating income
|
$
|
385
|
|
$
|
280
|
|
$
|
665
|
|
$
|
389
|
|
$
|
261
|
|
$
|
650
|
|
|||||
Revenue from
one
clearing member of the Trading and Clearing segment comprised
$95 million
, or
16%
of our Trading and Clearing revenues for the
three months ended
March 31, 2019
. Revenue from
one
clearing member of the Trading and Clearing segment comprised
$104 million
, or
18%
, of our Trading and Clearing revenues for the
three months ended
March 31, 2018
. Clearing members are primarily intermediaries and represent a broad range of principal trading firms. If a clearing member ceased its operations, we believe that the trading firms would continue to conduct transactions and would clear those transactions through another clearing member firm. No additional customers or clearing members accounted for more than
10%
of our segment revenues or consolidated revenues for the
three months ended
March 31, 2019
and
2018
.
|
15.
|
Earnings Per Common Share
|
The following is a reconciliation of the numerators and denominators of the basic and diluted earnings per common share computations for the
three months ended
March 31, 2019
and
2018
(in millions, except per share amounts):
|
Three Months Ended March 31,
|
||||||||
|
2019
|
2018
|
|||||||
|
Basic:
|
||||||||
|
Net income attributable to Intercontinental Exchange, Inc.
|
$
|
484
|
|
$
|
464
|
|
||
|
Weighted average common shares outstanding
|
568
|
|
582
|
|
||||
|
Basic earnings per common share
|
$
|
0.85
|
|
$
|
0.80
|
|
||
|
Diluted:
|
||||||||
|
Weighted average common shares outstanding
|
568
|
|
582
|
|
||||
|
Effect of dilutive securities - stock options and restricted shares
|
2
|
|
4
|
|
||||
|
Diluted weighted average common shares outstanding
|
570
|
|
586
|
|
||||
|
Diluted earnings per common share
|
$
|
0.85
|
|
$
|
0.79
|
|
||
Basic earnings per common share is calculated using the weighted average common shares outstanding during the period. Common equivalent shares from stock options and restricted stock awards, using the treasury stock method, are included in the diluted per share calculations unless the effect of their inclusion would be antidilutive. During the
three months ended
March 31, 2019
and
2018
,
813,000
and
302,000
outstanding stock options, respectively, were not included in the computation of diluted earnings per common share, because to do so would have had an antidilutive effect. Certain figures in the table above may not recalculate due to rounding.
24
|
16.
|
Subsequent Events
|
On May 1, 2019, we announced that we have entered into a definitive agreement to acquire Simplifile, LC, or Simplifile, for
$335 million
in cash. Simplifile operates one of the largest networks connecting the agents and jurisdictions that underpin mortgage records. Simplifile serves as an electronic liaison between lenders, settlement agents, and county recording offices, and streamlines the local recording of residential mortgage transactions. The transaction will expand the ICE Mortgage Services portfolio, which includes MERS, and is expected to close in the third quarter of 2019, subject to obtaining the required regulatory approvals.
We have evaluated subsequent events and determined that no other events or transactions met the definition of a subsequent event for purposes of recognition or disclosure in the accompanying consolidated financial statements.
25
ITEM 2. MANAGEMENT’S DISCUSSION AND ANALYSIS OF FINANCIAL CONDITION AND RESULTS OF OPERATIONS
In this Quarterly Report on Form 10-Q, unless otherwise indicated, the terms “Intercontinental Exchange,” “ICE,” “we,” “us,” “our,” “our company” and “our business” refer to Intercontinental Exchange, Inc., together with its consolidated subsidiaries. References to "ICE Products" mean products listed on one or more of our markets. Due to rounding, figures may not sum exactly.
Forward-Looking Statements
This Quarterly Report on Form 10-Q, including the sections entitled “Notes to Consolidated Financial Statements,” “Legal Proceedings” and “Management’s Discussion and Analysis of Financial Condition and Results of Operations,” contains “forward-looking statements” as defined in the Private Securities Litigation Reform Act of 1995. Any statements contained herein that are not statements of historical fact may be forward-looking statements. Any forward looking statements are based on our present beliefs and assumptions as well as the information currently available to us. Forward-looking statements may be introduced by or contain terminology such as “may,” “will,” “should,” “could,” “would,” “targets,” “goal,” “expect,” “intend,” “plan,” “anticipate,” “believe,” “estimate,” “predict,” “potential,” “continue,” or the antonyms of these terms or other comparable terminology. These forward-looking statements relate to future events or our future financial performance and involve known and unknown risks, uncertainties and other factors that may cause our results, levels of activity, performance, cash flows, financial position or achievements to differ materially from those expressed or implied by these statements. Although we believe that the expectations reflected in the forward-looking statements are reasonable, we cannot guarantee future results, levels of activity, performance, cash flows, financial position or achievements. Accordingly, we caution you not to place undue reliance on any forward-looking statements we may make.
Factors that may affect our performance and the accuracy of any forward-looking statements include, but are not limited to, those listed below:
|
•
|
conditions in global financial markets and domestic and international economic, political and social conditions;
|
|
•
|
the impact of the introduction of or any changes in laws, regulations, rules or government policies with respect to financial markets, increased regulatory scrutiny or enforcement actions and our ability to comply with these requirements;
|
|
•
|
volatility in commodity prices, equity prices and price volatility of financial benchmarks and instruments such as interest rates, credit spreads, equity indices and foreign exchange rates;
|
|
•
|
the business environment in which we operate and trends in our industry, including trading volumes, clearing, data services, fees, changing regulations, competition and consolidation;
|
|
•
|
our ability to minimize the risks associated with operating clearing houses in multiple jurisdictions;
|
|
•
|
our equity and options exchanges’ compliance with their respective regulatory and oversight responsibilities;
|
|
•
|
the resilience of our electronic platforms and soundness of our business continuity and disaster recovery plans;
|
|
•
|
changes in renewal rates of subscription-based data revenues;
|
|
•
|
our ability to identify and effectively pursue, implement and integrate acquisitions and strategic alliances; and to realize the synergies and benefits of such transactions within the expected time frame;
|
|
•
|
the performance and reliability of our trading and clearing technologies and those of third-party service providers;
|
|
•
|
our ability to keep pace with technological developments;
|
|
•
|
our ability to ensure that the technology we utilize is not vulnerable to cybersecurity risks or other disruptive events;
|
|
•
|
our ability to identify trends and adjust our business to benefit from such trends;
|
|
•
|
the accuracy of our cost and other financial estimates and our belief that cash flows from operations will be sufficient to service our debt and to fund our operational and capital expenditure needs;
|
|
•
|
our ability to maintain existing market participants and data customers, and to attract new ones;
|
|
•
|
our ability to offer additional products and services, leverage our risk management capabilities and enhance our technology in a timely and cost-effective fashion;
|
|
•
|
our ability to attract and retain key talent;
|
|
•
|
our ability to protect our intellectual property rights and to operate our business without violating the intellectual property rights of others;
|
|
•
|
potential adverse results of threatened or pending litigation and regulatory actions and proceedings; and
|
|
•
|
our ability to realize the expected benefits of our majority investment in Bakkt which could result in additional unanticipated costs and risks.
|
26
These risks and other factors include those set forth in Item 1(A) under the caption “Risk Factors” in our Annual Report on Form 10-K for the year ended December 31, 2018, or our 2018 Form 10-K, as filed with the SEC on February 7, 2019. Due to the uncertain nature of these factors, management cannot assess the impact of each factor on the business or the extent to which any factor, or combination of factors, may cause actual results to differ materially from those contained in any forward-looking statements.
Any forward-looking statement speaks only as of the date on which such statement is made, and we undertake no obligation to update any of these statements to reflect events or circumstances occurring after the date of this Quarterly Report on Form 10-Q. New factors may emerge and it is not possible to predict all factors that may affect our business and prospects.
Overview
We are a leading global operator of regulated exchanges, clearing houses and listings venues, and a provider of data services for commodity, financial, fixed income and equity markets. We operate regulated marketplaces for listing, trading and clearing a broad array of derivatives contracts and securities across major asset classes, including energy and agricultural commodities, metals, interest rates, equities, ETFs, credit derivatives, bonds and currencies. We also offer comprehensive data services to support the trading, investment, risk management, mortgage service and connectivity needs of customers around the world and across asset classes.
Our exchanges include derivative exchanges in the U.S., U.K., EU, Canada and Singapore, and cash equities, equity options and bond trading venues in the U.S. We also operate OTC markets for physical energy, fixed income and CDS trade execution. To serve global derivatives markets, we operate central counterparty clearing houses, or CCPs, in the U.S., U.K., EU, Canada and Singapore. We offer a range of data services, globally, for financial and commodity markets, including pricing and reference data, exchange data, analytics, feeds, index services, desktops and connectivity solutions. Through our markets, clearing houses, listings and data services, we provide comprehensive solutions for our customers through liquid markets, benchmark products, access to capital markets and related services to support their ability to manage risk and raise capital. Our business is conducted as two reportable business segments, our Trading and Clearing segment and our Data and Listings segment, and the majority of our identifiable assets are located in the U.S. and U.K.
Recent Developments
Regulation
Our markets are primarily subject to the jurisdiction of regulatory agencies in the U.S., U.K., EU, Canada and Singapore. Global policy makers have undertaken reviews of their existing legal framework governing financial markets in connection with regulatory reform, and have either passed new laws and regulations, or are in the process of debating and/or enacting new laws and regulations that apply to our business and to our customers’ businesses. Legislative and regulatory actions may impact the way in which we or our customers conduct business and may create uncertainty, which could affect trading volumes or demand for market data. See Part 1, Item 1 “Business - Regulation” and Part 1, Item 1(A) "Risk Factors" included in our
2018
Form 10-K for a discussion of the primary regulations applicable to our business and certain risks associated with those regulations. As discussed in Part 1, Item 1 of our
2018
Form 10-K, the implementation of the Markets in Financial Instruments Directive II, or MiFID II, and its counterpart the European Market Infrastructure Regulation, or EMIR, may result in operational, regulatory and/or business risk.
Most of the specific regulations which support the MiFID II framework have now been approved or deferred by the European Parliament and European Council. The European Securities and Markets Authority, or ESMA, and the national regulatory authorities are continuing to work on detailed aspects of the framework that are relevant to the markets operated by ICE Futures Europe and ICE Endex, including position limits and the determination of pre-trade price transparency parameters for financial instruments.
The key areas in the evolving regulatory landscape that are likely to impact our business are:
|
•
|
The proposed revisions to the regulatory structure of non-EU clearing houses.
On March 13, 2019, the European Parliament and Council reached an agreement on the European Commission's proposal to revise the EU's current regulatory and supervisory structure for EU and non-EU clearing houses, called EMIR 2.2. The proposed revisions of the regulatory structure could have an impact on our non-EU clearing houses to the extent they are deemed to be doing business in the EU, which might involve changes to clearing house regulations and/or supervision. The nature and extent of the regulation's impact will depend on the “impact” of a non-EU clearing house’s business in the EU. Details on the impact classification of non-EU clearing will be established by the European Commission in
|
27
cooperation with ESMA and the European System of Central Banks. The exact date of application of EMIR 2.2 is currently unclear, but could be as early as the first quarter of 2020.
|
•
|
Basel III capital charges.
The implementation of capital charges in Basel III, particularly, the Supplemental Leverage Ratio applicable to certain financial institutions, may impose capital requirements on certain of our clearing house members and their customers that may raise the costs and thus discourage financial institutions from client clearing. The Federal Reserve Board, the Federal Deposit Insurance Corporation and the Office of the Comptroller of the Currency have proposed rule changes to the derivative exposure calculations and leverage ratio requirements, but these regulations still may have a negative impact on certain of our clearing members.
|
|
•
|
Continued access by EU market participants to U.K. CCPs and exchanges
.
The U.K. and EU continue to negotiate the exit of the U.K. from the EU (commonly known as Brexit). On April 10, 2019, the European Commission agreed to an extension to allow for the U.K. ratification of the withdrawal agreement to last as long as necessary and, in any event, no longer than October 31, 2019. In anticipation of Brexit, the European Commission adopted an equivalence decision regarding the U.K.’s legal and supervisory arrangements for CCPs in December 2018, and in February 2019, ESMA approved ICE Clear Europe as a third-country CCP. Upon the U.K.’s exit from the EU, EU market participants will be able to continue clearing through U.K. CCPs, such as ICE Clear Europe, for a limited period of time in case of a U.K. exit from the EU without a transition period. Separately, following Brexit, ICE Futures Europe will continue to be able to permit access by persons in the EU to trading on its platform, even in the absence of a transition agreement. However, the lack of an equivalence decision and corresponding transition period may result in increased costs for certain EU market participants which could impact trading on ICE Futures Europe. The impact to our business and corresponding regulatory changes remain uncertain at this time. We are monitoring the impact to our business as a result of these discussions and are pursuing avenues to facilitate continued access for EU customers to our services in the event the U.K. exits the EU without a transition period.
|
|
•
|
The SEC Transaction Fee Pilot.
In December 2018, the SEC adopted a Transaction Fee Pilot. The adoption establishes a pilot program, for at least one-year and up to two-years, that will limit the fees charged and rebates paid by our five securities exchanges in certain securities to be designated by the SEC. On March 28, 2019, the SEC partially stayed the Transaction Fee Pilot, pending resolution of our and two other national securities exchanges’ petitions for review of the Transaction Fee Pilot by the U.S. Court of Appeals for the District of Columbia Circuit. The only requirement that the SEC did not stay was that which requires the exchanges to collect data during a pre-pilot period. The SEC has not yet announced the date that this pre-pilot period of the Transaction Fee Pilot will commence.
|
|
•
|
The EU Benchmark Regulation, or BMR.
In June 2016, the EU Benchmark Regulation, or BMR, was adopted and applies from January 2018. Under the BMR, benchmarks provided by a third-country benchmark administrator may be used by EU-supervised entities provided that the European Commission has adopted an equivalence decision or the administrator has been recognized or endorsed and the benchmarks are listed on the register established by ESMA. The BMR provides for a transition period which was extended by the EU authorities to January 1, 2022 for providers of critical benchmarks and third-country benchmark providers. During this period ICE Data Indices, LLC applied to the U.K. Financial Conduct Authority for recognition, and benchmarks provided by ICE Data Indices, LLC may continue to be used by supervised entities.
|
28
Consolidated Financial Highlights
The following summarizes our results and significant changes in our consolidated financial performance for the periods presented (dollars in millions, except per share amounts):
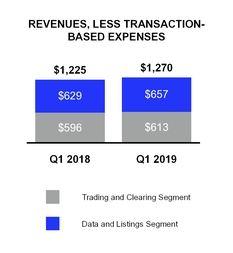
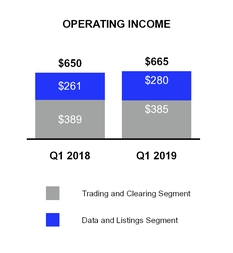
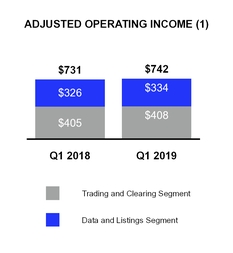
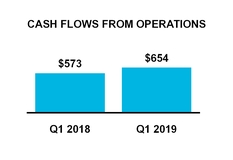
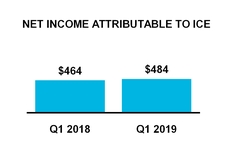
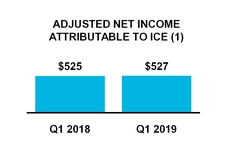
|
Three Months Ended
March 31, |
||||||||||
|
2019
|
2018
|
Change
|
||||||||
|
Revenues, less transaction-based expenses
|
$
|
1,270
|
|
$
|
1,225
|
|
4 %
|
|||
|
Operating expenses
|
$
|
605
|
|
$
|
575
|
|
5 %
|
|||
|
Adjusted operating expenses
(1)
|
$
|
528
|
|
$
|
494
|
|
7 %
|
|||
|
Operating income
|
$
|
665
|
|
$
|
650
|
|
2 %
|
|||
|
Adjusted operating income
(1)
|
$
|
742
|
|
$
|
731
|
|
2%
|
|||
|
Operating margin
|
52
|
%
|
53
|
%
|
(1) pt
|
|||||
|
Adjusted operating margin
(1)
|
58
|
%
|
60
|
%
|
(2) pts
|
|||||
|
Other income (expense), net
|
$
|
(39
|
)
|
$
|
(33
|
)
|
19 %
|
|||
|
Income tax expense
|
$
|
134
|
|
$
|
143
|
|
(7) %
|
|||
|
Effective tax rate
|
21
|
%
|
23
|
%
|
(2) pts
|
|||||
|
Net income attributable to ICE
|
$
|
484
|
|
$
|
464
|
|
4 %
|
|||
|
Adjusted net income attributable to ICE
(1)
|
$
|
527
|
|
$
|
525
|
|
—%
|
|||
|
Diluted earnings per share attributable to ICE common stockholders
|
$
|
0.85
|
|
$
|
0.79
|
|
8 %
|
|||
|
Adjusted diluted earnings per share attributable to ICE common stockholders
(1)
|
$
|
0.92
|
|
$
|
0.90
|
|
2 %
|
|||
|
Cash flows from operating activities
|
$
|
654
|
|
$
|
573
|
|
14 %
|
|||
(1)
The adjusted figures exclude items that are not reflective of our ongoing core operations and business performance. Adjusted net income attributable to ICE and adjusted diluted earnings per share attributable to ICE common stockholders, are presented net of taxes. These adjusted numbers are not calculated in accordance with GAAP. See “- Non-GAAP Financial Measures” below.
29
|
•
|
Revenues, less transaction-based expenses, increased
$45 million
for the
three months ended
March 31, 2019
from the comparable period in 2018. See "-Trading and Clearing Segment" and "Data and Listings Segment" below for a discussion of the significant changes in our revenues. The increase in revenues includes $13 million in unfavorable foreign exchange effects arising from fluctuations in the U.S. dollar for the
three months ended
March 31, 2019
. See Item 3 "Quantitative and Qualitative Disclosures About Market Risk-Foreign Currency Exchange Rate Risk" below for additional information on the impact of currency fluctuations.
|
|
•
|
Operating expenses increased
$30 million
for the
three months ended
March 31, 2019
. See "-Consolidated Operating Expenses" below for a discussion of the significant changes in our operating expenses. The increase in operating expenses includes $5 million in favorable foreign exchange effects arising from fluctuations in the U.S. dollar for the
three months ended
March 31, 2019
. See Item 3 "Quantitative and Qualitative Disclosures About Market Risk-Foreign Currency Exchange Rate Risk" below for additional information on the impact of currency fluctuations.
|
Variability in Quarterly Comparisons
Our business environment has been characterized by:
|
•
|
globalization of exchanges, customers and competitors;
|
|
•
|
interest rate and financial markets uncertainty;
|
|
•
|
rising demand for speed, data, data capacity and connectivity by market participants, necessitating increased investment in technology;
|
|
•
|
evolving and disparate regulation across multiple jurisdictions;
|
|
•
|
increasing focus on capital and cost efficiencies;
|
|
•
|
consolidation and increasing competition among global markets for trading, clearing and listings.
|
|
•
|
price volatility increasing customers' demand for risk management services;
|
|
•
|
customers' preference to manage risk in markets demonstrating the greatest depth of liquidity and product diversity; and
|
|
•
|
the evolution of existing products and new product innovation to uniquely serve emerging customer needs.
|
For additional information regarding the factors that affect our results of operations, see Item 1(A) “Risk Factors” included in our
2018
Form 10-K.
Segment Results
Our business is conducted through two reportable business segments:
|
•
|
Trading and Clearing, which comprises our transaction-based execution and clearing businesses; and
|
|
•
|
Data and Listings, which comprises our subscription-based data services and securities listings businesses.
|
While revenues are recorded specifically in the segment in which they are earned or to which they relate, a significant portion of our operating expenses are not solely related to a specific segment because the expenses serve functions that are necessary for the operation of both segments. We use a pro-rata revenue approach as the allocation method for the expenses that do not relate solely to one segment. Further, we did not allocate expenses to specific revenue streams within these segments since such an allocation is not reasonably possible. Our two segments do not engage in intersegment transactions.
30
Trading and Clearing Segment
The following presents selected statements of income data for our Trading and Clearing segment (dollars in millions):
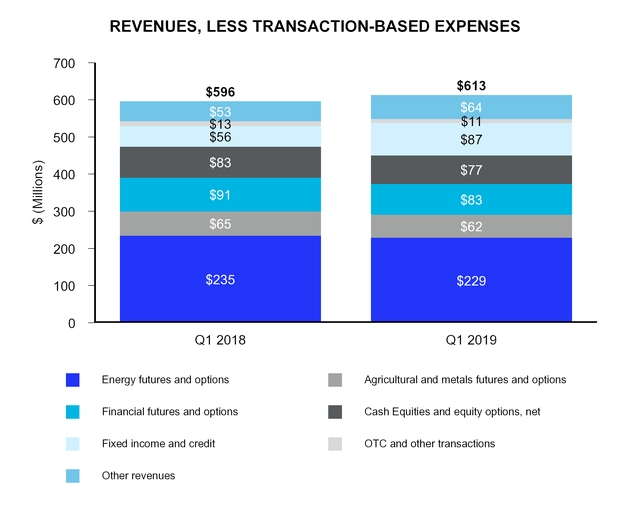
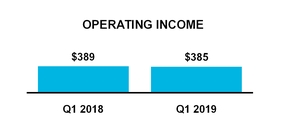
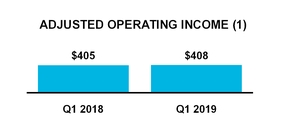
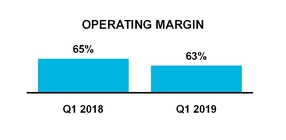
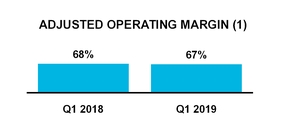
(1)
The adjusted numbers in the charts above are calculated by excluding items that are not reflective of our cash operations and core business performance. As a result, these adjusted numbers are not calculated in accordance with U.S. GAAP. See “- Non-GAAP Financial Measures” below.
31
|
Three Months Ended
March 31, |
||||||||||
|
2019
|
2018
|
Change
|
||||||||
|
Revenues:
|
||||||||||
|
Energy futures and options contracts
|
$
|
229
|
|
$
|
235
|
|
(2
|
)%
|
||
|
Agricultural and metals futures and options contracts
|
62
|
|
65
|
|
(5
|
)
|
||||
|
Financial futures and options contracts
|
83
|
|
91
|
|
(9
|
)
|
||||
|
Cash equities and equity options
|
390
|
|
438
|
|
(11
|
)
|
||||
|
Fixed income and credit
|
87
|
|
56
|
|
54
|
|
||||
|
OTC and other transactions
|
11
|
|
13
|
|
(14
|
)
|
||||
|
Transaction and clearing, net
|
862
|
|
898
|
|
(4
|
)
|
||||
|
Other revenues
|
64
|
|
53
|
|
21
|
|
||||
|
Revenues
|
926
|
|
951
|
|
(3
|
)
|
||||
|
Transaction-based expenses
|
313
|
|
355
|
|
(12
|
)
|
||||
|
Revenues, less transaction-based expenses
|
613
|
|
596
|
|
3
|
|
||||
|
Other operating expenses
|
170
|
|
157
|
|
8
|
|
||||
|
Depreciation and amortization
|
58
|
|
50
|
|
17
|
|
||||
|
Operating expenses
|
228
|
|
207
|
|
10
|
|
||||
|
Operating income
|
$
|
385
|
|
$
|
389
|
|
(1
|
)%
|
||
Transaction and Clearing Revenues
Our transaction and clearing revenues are reported on a net basis, except for the NYSE transaction-based expenses discussed below, and consist of fees collected from our derivatives, fixed income, cash equities and equity options trading and derivatives clearing. In our derivatives markets, we earn transaction and clearing revenues from both counterparties to each contract that is traded and/or cleared, and in our equity and equity options markets, we receive trade execution fees as well as routing fees related to orders in our markets which are routed to other markets for execution.
Rates per-contract, or RPC, are driven by the number of contracts or securities traded and the fees charged per contract, net of certain rebates. Our per-contract transaction and clearing revenues will depend upon many factors, including, but not limited to, market conditions, transaction and clearing volume, product mix, pricing, applicable revenue sharing and market making agreements, and new product introductions. Because transaction and clearing revenues are generally assessed on a per-contract basis, revenues and profitability fluctuate with changes in contract volume and due to product mix.
For both the
three months ended
March 31, 2019
and
2018
, 21% of our Trading and Clearing segment revenues, less transaction-based expenses, were billed in pounds sterling or euros. As the pound sterling or euro exchange rate changes, the U.S. equivalent of revenues denominated in foreign currencies changes accordingly. For the
three months ended
March 31, 2019
as compared to the same period in
2018
, foreign currency fluctuations of the U.S. dollar as compared to the pound sterling and euro resulted in a decrease to our Trading and Clearing segment revenues, less transaction-based expenses, of $9 million. See Item 3 “- Quantitative and Qualitative Disclosures About Market Risk - Foreign Currency Exchange Rate Risk” below for additional information on the impact of currency fluctuations.
Our transaction and clearing revenues are presented net of rebates. We recorded rebates of
$215 million
and
$220 million
for the
three months ended
March 31, 2019
and
2018
, respectively. We offer rebates in certain of our markets primarily to support market liquidity and trading volume by providing qualified participants in those markets a discount to the applicable commission rate. Such rebates are calculated based on volumes traded.
|
•
|
Energy Futures and Options Contracts:
Total energy volume and revenues decreased
12%
and
2%
, respectively, for the
three months ended
March 31, 2019
from the comparable period in
2018
. Revenues decreased due to lower oil and natural gas volumes.
|
We offer trading and clearing services across a range of global benchmark contracts, including: Brent, West Texas Intermediate, or WTI, Platts Dubai, Gasoil, Heating Oil, and hundreds of additional grades. Total oil volume decreased
32
9% for the
three months ended
March 31, 2019
from the comparable period in
2018
in part due to a confluence of various geopolitical uncertainties as well as supply and demand dynamics.
Our global natural gas futures and options volume decreased 18% for the
three months ended
March 31, 2019
from the comparable period in
2018
. The volume decrease was primarily due to depressed natural gas prices driven by a continued surplus of natural gas in the U.S., specifically related to the Henry Hub contract. The decrease in our Henry Hub natural gas volume was partially offset by increased volumes in our European TTF gas contract. The strength in our European TTF gas volumes was driven by the continued emergence of TTF as the European benchmark for natural gas as natural gas continues to globalize. Emission futures and options volumes increased 35% for the
three months ended
March 31, 2019
from the comparable period in
2018
driven by higher carbon prices and supply-demand dynamics impacted by regulatory uncertainty.
|
•
|
Agricultural and Metals Futures and Options Contracts:
Total volume and revenues in our agricultural and metals futures and options markets decreased
1%
and
5%
, respectively, for the
three months ended
March 31, 2019
from the comparable period in
2018
. Volume in our largest agricultural contract, sugar futures and options, increased 3% for the
three months ended
March 31, 2019
from the comparable period in
2018
. Other agricultural and metal futures and options volume decreased 5% for the
three months ended
March 31, 2019
from the comparable period in
2018
. The overall decreases in agricultural volumes were primarily driven by geopolitical uncertainty related to the trade negotiations between the U.S. and China.
|
|
•
|
Financial Futures and Options Contracts:
Interest rates futures and options volume and revenue decreased 9% and 11%, respectively, for the
three months ended
March 31, 2019
from the comparable period in
2018
. Our interest rate futures and options volume decreased for the
three months ended
March 31, 2019
due to Brexit and an uncertain European economic backdrop. Interest rates futures and options revenues were $53 million and $60 million for the
three months ended
March 31, 2019
and
2018
, respectively.
|
Other financial futures and options volume decreased 7% for the
three months ended
March 31, 2019
from the comparable period in
2018
. The decrease was primarily due to lower equity market volatility than during the same prior year period. Other financial futures and options revenues were $30 million and $31 million for the
three months ended
March 31, 2019
and
2018
, respectively.
|
•
|
Cash Equities and Equity Options:
Cash equities handled volume increased
9%
for the
three months ended
March 31, 2019
from the comparable period in
2018
due to higher industry volumes and increased market share as compared to the same prior year period. Cash equities revenues, net of transaction-based expenses, were $52 million and $56 million for the
three months ended
March 31, 2019
and
2018
, respectively.
|
Equity options volume decreased
5%
for the
three months ended
March 31, 2019
from the comparable period in
2018
primarily due to lower equity market volatility as compared to the same prior year period. Equity options revenues, net of transaction-based expenses, were $25 million and $27 million for the
three months ended
March 31, 2019
and
2018
, respectively.
|
•
|
Fixed Income and Credit:
CDS clearing revenues were $38 million and $42 million for the
three months ended
March 31, 2019
and
2018
, respectively. The notional value of CDS cleared was $4.4 trillion and $4.7 trillion, for the
three months ended
March 31, 2019
and
2018
, respectively. Buy-side participation at our U.S. CDS clearing house, ICE Clear Credit, reached record levels in terms of number of participants and single name notional cleared during the
three months ended
March 31, 2019
. These record levels were driven by increased participation from both U.S. and European buy-side customers. Fixed income and credit also includes revenues from ICE Mortgage Services and ICE Bonds, which includes ICE BondPoint, TMC Bonds, LLC, or TMC Bonds, and ICE Credit Trade.
|
|
•
|
OTC and Other Transactions:
OTC and other transactions include revenues from our OTC energy business and other trade confirmation services.
|
|
•
|
Other Revenues:
Other revenues primarily include interest income on certain clearing margin deposits, regulatory penalties and fines, fees for use of our facilities, regulatory fees charged to member organizations of our U.S. securities exchanges, designated market maker service fees, exchange membership fees and agricultural grading and certification fees. The increase in other revenues for the
three months ended
March 31, 2019
from the comparable period in
2018
is primarily due to increased interest income earned on certain clearing margin deposits reflecting higher balances and increased interest rates as compared to the same prior year period.
|
33
Selected Operating Data
The following charts and table present trading activity in our futures and options markets by commodity type based on the total number of contracts traded, as well as futures and options rate per contract (in millions, except for percentages and rate per contract amounts):
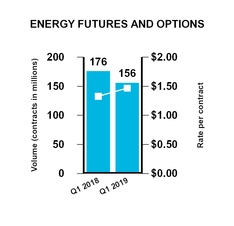
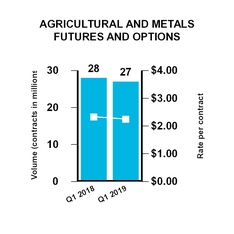
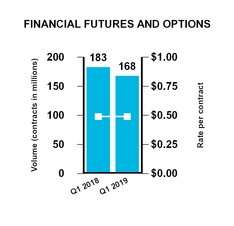
|
Volume and Rate per Contract
|
||||
|
Three Months Ended March 31,
|
|||||||||||
|
2019
|
2018
|
Change
|
|||||||||
|
Number of contracts traded (in millions):
|
|||||||||||
|
Energy futures and options
|
156
|
|
176
|
|
(12
|
)%
|
|||||
|
Agricultural and metals futures and options
|
27
|
|
28
|
|
(1
|
)
|
|||||
|
Financial futures and options
|
168
|
|
183
|
|
(8
|
)
|
|||||
|
Total
|
351
|
|
387
|
|
(9
|
)%
|
|||||
|
Three Months Ended March 31,
|
|||||||||||
|
2019
|
2018
|
Change
|
|||||||||
|
Average Daily Volume of contracts traded (in thousands):
|
|||||||||||
|
Energy futures and options
|
2,552
|
|
2,893
|
|
(12
|
)%
|
|||||
|
Agricultural and metals futures and options
|
449
|
|
455
|
|
(1
|
)
|
|||||
|
Financial futures and options
|
2,672
|
|
2,916
|
|
(8
|
)
|
|||||
|
Total
|
5,673
|
|
6,264
|
|
(9
|
)%
|
|||||
|
Three Months Ended March 31,
|
|||||||||||
|
2019
|
2018
|
Change
|
|||||||||
|
Rate per contract:
|
|||||||||||
|
Energy futures and options
|
$
|
1.47
|
|
$
|
1.33
|
|
11
|
%
|
|||
|
Agricultural and metals futures and options
|
$
|
2.25
|
|
$
|
2.33
|
|
(3
|
)%
|
|||
|
Financial futures and options
|
$
|
0.49
|
|
$
|
0.49
|
|
—
|
%
|
|||
Open interest is the aggregate number of contracts (long or short) that clearing members hold either for their own account or on behalf of their clients. Open interest refers to the total number of contracts that are currently “open,” – in other words, contracts that have been traded but not yet liquidated by either an offsetting trade, exercise, expiration or assignment. Open interest is also a measure of the future activity remaining to be closed out in terms of the number of contracts that members and their clients continue to hold in the particular contract and by the number of contracts held for each contract month listed by the exchange. The following charts and table present our quarter-end open interest for our futures and options contracts (in thousands, except for percentages):
34
|
Open Interest
|
||||
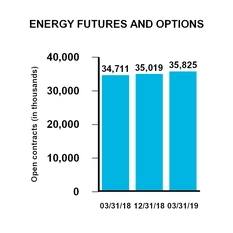
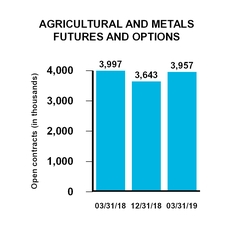
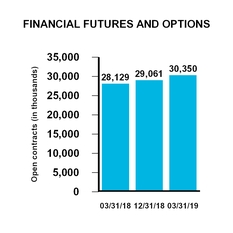
|
As of March 31,
|
||||||||
|
2019
|
2018
|
Change
|
||||||
|
Open interest — in thousands of contracts:
|
||||||||
|
Energy futures and options
|
35,825
|
|
34,711
|
|
3
|
%
|
||
|
Agricultural and metals futures and options
|
3,957
|
|
3,997
|
|
(1
|
)
|
||
|
Financial futures and options
|
30,350
|
|
28,129
|
|
8
|
|
||
|
Total
|
70,132
|
|
66,837
|
|
5
|
%
|
||
The following charts and table present selected cash and equity options trading data (all trading volume below is
presented as average net daily trading volume, or ADV, and is single counted):
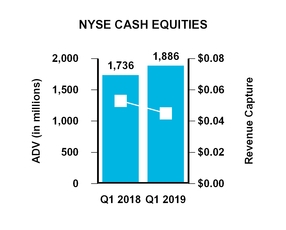
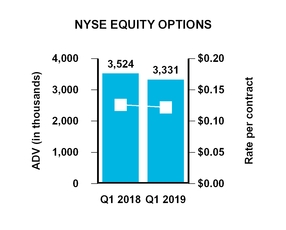
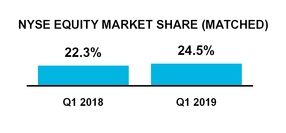
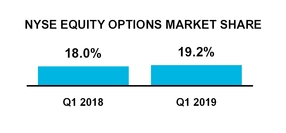
35
|
Three Months Ended March 31,
|
|||||||||
|
2019
|
2018
|
Change
|
|||||||
|
NYSE cash equities (shares in millions):
|
|||||||||
|
NYSE listed (Tape A) issues:
|
|||||||||
|
Handled volume
|
1,226
|
|
1,196
|
|
3
|
%
|
|||
|
Matched volume
|
1,213
|
|
1,186
|
|
2
|
%
|
|||
|
Total NYSE listed consolidated volume
|
3,794
|
|
3,848
|
|
(1
|
)%
|
|||
|
Share of total matched consolidated volume
|
32.0
|
%
|
30.8
|
%
|
1.1 pts
|
|
|||
|
NYSE Arca, NYSE American and regional listed (Tape B) issues:
|
|||||||||
|
Handled volume
|
389
|
|
369
|
|
5
|
%
|
|||
|
Matched volume
|
380
|
|
357
|
|
6
|
%
|
|||
|
Total NYSE Arca, NYSE American and regional listed consolidated volume
|
1,419
|
|
1,530
|
|
(7
|
)%
|
|||
|
Share of total matched consolidated volume
|
26.8
|
%
|
23.3
|
%
|
3.4 pts
|
|
|||
|
Nasdaq listed (Tape C) issues:
|
|||||||||
|
Handled volume
|
272
|
|
171
|
|
59
|
%
|
|||
|
Matched volume
|
257
|
|
161
|
|
60
|
%
|
|||
|
Total Nasdaq listed consolidated volume
|
2,327
|
|
2,255
|
|
3
|
%
|
|||
|
Share of total matched consolidated volume
|
11.1
|
%
|
7.2
|
%
|
3.9 pts
|
|
|||
|
Total cash handled volume
|
1,886
|
|
1,736
|
|
9
|
%
|
|||
|
Total cash market share matched
|
24.5
|
%
|
22.3
|
%
|
2.2 pts
|
|
|||
|
NYSE equity options (contracts in thousands):
|
|||||||||
|
NYSE equity options volume
|
3,331
|
|
3,524
|
|
(5
|
)%
|
|||
|
Total equity options volume
|
17,331
|
|
19,578
|
|
(11
|
)%
|
|||
|
NYSE share of total equity options
|
19.2
|
%
|
18.0
|
%
|
1.2 pts
|
|
|||
|
Revenue capture or rate per contract:
|
|||||||||
|
Cash equities rate per contract (per 100 shares)
|
$0.045
|
$0.053
|
(15
|
)%
|
|||||
|
Equity options rate per contract
|
$0.12
|
$0.13
|
(3
|
)%
|
|||||
Handled volume represents the total number of shares of equity securities, ETFs and crossing session activity internally matched on our exchanges or routed to and executed on an external market center. Matched volume represents the total number of shares of equity securities, ETFs and crossing session activity executed on our exchanges.
Transaction-Based Expenses
Our equities and equity options markets pay fees to the SEC pursuant to Section 31 of the Exchange Act. Section 31 fees are recorded on a gross basis as a component of transaction and clearing fee revenue. These Section 31 fees are assessed to recover the government’s costs of supervising and regulating the securities markets and professionals and are subject to change. We, in turn, collect corresponding activity assessment fees from member organizations clearing or settling trades on the equities and options exchanges, and recognize these amounts in our transaction and clearing revenues when invoiced. The activity assessment fees are designed to equal the Section 31 fees. As a result, activity assessment fees and the corresponding Section 31 fees do not have an impact on our net income, although the timing of payment by us may vary from collections. Section 31 fees were $69 million and $121 million for the
three months ended
March 31, 2019
and
2018
, respectively. The fees we collect are included in cash at the time of receipt and we remit the amounts to the SEC semi-annually as required. The total amount is included in accrued liabilities and was
$70 million
as of
March 31, 2019
.
We make liquidity payments to cash and options trading customers, as well as routing charges made to other exchanges which are included in transaction-based expenses. We incur routing charges when we do not have the best bid or offer in the market for a security that a customer is trying to buy or sell on one of our securities exchanges. In that case, we route the customer’s order to the external market center that displays the best bid or offer. The external market center charges us a fee per share (denominated in tenths of a cent per share) for routing to its system. We record routing charges on a
36
gross basis as a component of transaction and clearing fee revenue. Cash liquidity payments, routing and clearing fees were $244 million and $234 million for the
three months ended
March 31, 2019
and
2018
, respectively.
Operating Expenses, Operating Income and Operating Margin
Our Trading and Clearing segment operating expenses increased
$21 million
for the
three months ended
March 31, 2019
, from the comparable period in
2018
. See “- Consolidated Operating Expenses” below for a discussion of the significant changes in our operating expenses. Our Trading and Clearing segment operating income decreased
$4 million
for the
three months ended
March 31, 2019
, from the comparable period in
2018
. Trading and Clearing segment operating margins were
63%
and
65%
for the
three months ended
March 31, 2019
and
2018
, respectively.
Our Trading and Clearing segment adjusted operating expenses were
$205 million
and
$191 million
for the
three months ended
March 31, 2019
and
2018
, respectively. Our Trading and Clearing segment adjusted operating income was
$408 million
and
$405 million
for the
three months ended
March 31, 2019
and
2018
, respectively. Our Trading and Clearing segment adjusted operating margins were
67%
and
68%
for the
three months ended
March 31, 2019
and
2018
, respectively. See “- Non-GAAP Financial Measures” below.
Data and Listings Segment
The following charts and table present our selected statements of income data for our Data and Listings segment (dollars in millions):
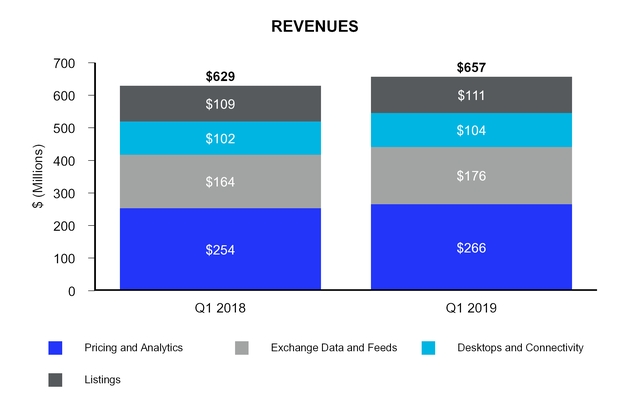
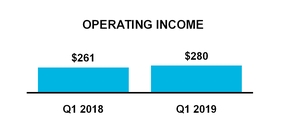
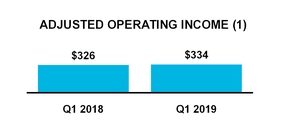
37
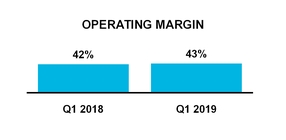
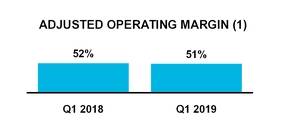
(1)
The adjusted numbers in the charts above are calculated by excluding items that are not reflective of our cash operations and core business performance. As a result, these adjusted numbers are not calculated in accordance with U.S. GAAP. See “- Non-GAAP Financial Measures” below.
|
Three Months Ended March 31,
|
|||||||||||
|
2019
|
2018
|
Change
|
|||||||||
|
Revenues:
|
|||||||||||
|
Pricing and analytics
|
$
|
266
|
|
$
|
254
|
|
5
|
%
|
|||
|
Exchange data and feeds
|
176
|
|
164
|
|
7
|
|
|||||
|
Desktops and connectivity
|
104
|
|
102
|
|
2
|
|
|||||
|
Data services
|
546
|
|
520
|
|
5
|
|
|||||
|
Listings
|
111
|
|
109
|
|
2
|
|
|||||
|
Revenues
|
657
|
|
629
|
|
4
|
|
|||||
|
Other operating expenses
|
277
|
|
268
|
|
3
|
|
|||||
|
Acquisition-related transaction and integration costs
|
—
|
|
12
|
|
n/a
|
|
|||||
|
Depreciation and amortization
|
100
|
|
88
|
|
14
|
|
|||||
|
Operating expenses
|
377
|
|
368
|
|
3
|
|
|||||
|
Operating income
|
$
|
280
|
|
$
|
261
|
|
7
|
%
|
|||
Data Services Revenues
Our Data and Listings segment represents subscription-based, or recurring, revenues from data services and listings services offered across our trading and clearing businesses and ICE Data Services. Through ICE Data Services, we generate revenues from a range of global financial and commodity markets, including pricing and reference data, exchange data, analytics, feeds, index services, desktops and connectivity solutions. Through NYSE, NYSE American and NYSE Arca, we generate listings revenue related to the provision of listings services for public companies and ETFs, and related corporate actions for listed companies.
For the
three months ended
March 31, 2019
and
2018
, 7% and 8%, respectively, of our Data and Listings segment revenues were billed in pounds sterling or euros (all relating to our data services revenues). As the pound sterling or euro exchange rate changes, the U.S. equivalent of revenues denominated in foreign currencies changes accordingly. Due to fluctuations in the U.S. dollar compared to the pound sterling and euro, our Data and Listings segment revenues were $4 million lower for the
three months ended
March 31, 2019
, from the comparable period in
2018
.
Our data services revenues are primarily subscription-based and increased
5%
for the
three months ended
March 31, 2019
, from the comparable period in
2018
. The increase in revenues for the
three months ended
March 31, 2019
was primarily due to the strong retention rate of existing customers, the addition of new customers, increased purchases by existing customers and increases in pricing of our products.
|
•
|
Pricing and Analytics:
Our pricing and analytics revenues increased
5%
for the
three months ended
March 31, 2019
, from the comparable period in
2018
. The increase in revenue was driven by the strong retention rate of existing customers, the addition of new customers, increased purchases by existing customers and increases in pricing of our products.
|
|
•
|
Exchange Data and Feeds:
Our exchange data and feeds revenues increased
7%
for the
three months ended
March 31, 2019
, from the comparable period in
2018
. The increase in revenue was driven by the strong retention rate of existing customers, the addition of new customers, increased purchases by existing customers and a larger share of the NMS Plan revenue.
|
38
|
•
|
Desktops and Connectivity:
Our desktop and connectivity revenues increased
2%
for the
three months ended
March 31, 2019
, from the comparable period in
2018
driven primarily by the addition of our July 2018 acquisition of TMC Bonds and increases in pricing of our products.
|
Annual Subscription Value, or ASV, represents, at a point in time, the data services revenues subscribed for the succeeding 12 months. ASV does not include new sales, contract terminations or price changes that may occur during that 12-month period. ASV also does not include certain data services revenue streams that are not subscription-based. Revenue from ASV businesses has historically represented approximately 90% of our data revenues. Thus, while it is an indicative forward-looking metric, it does not provide a growth forecast of the next 12 months of data services revenues.
As of
March 31, 2019
, ASV was $1.979 billion, which increased 5.6% compared to the ASV as of
March 31, 2018
. This does not adjust for year-over-year foreign exchange fluctuations or impacts of acquisitions.
Listings Revenues
Listings revenues in our securities markets arise from fees applicable to companies listed on our cash equities exchanges — original listing fees and annual listing fees. Original listing fees consist of two components: initial listing fees and fees related to corporate actions. Initial listing fees, subject to a minimum and maximum amount, are based on the number of shares that a company initially lists. All listings fees are billed upfront and the identified performance obligations are satisfied over time. Revenue related to the investor relations performance obligation is recognized ratably over a
two
-year period, with the remaining revenue recognized ratably over time as customers continue to list on our exchanges, which is generally estimated to be over a period of up to nine years for NYSE and up to five years for NYSE Arca and NYSE American.
In addition, we earn corporate actions-related listing fees in connection with actions involving the issuance of new shares, such as stock splits, rights issues and sales of additional securities, as well as mergers and acquisitions. Listings fees related to other corporate actions are considered contract modifications of our listing contracts and are recognized ratably over time as customers continue to list on our exchanges, which is generally estimated to be a period of six years for NYSE and three years for NYSE Arca and NYSE American.
Our listings revenues increased
2%
for the
three months ended
March 31, 2019
, from the comparable period in
2018
due to changes in market conditions for IPOs.
Operating Expenses, Operating Income and Operating Margin
Our Data and Listings segment operating expenses increased
$9 million
for the
three months ended
March 31, 2019
, from the comparable period in
2018
. See “- Consolidated Operating Expenses” below for a discussion of the significant changes in our operating expenses. Our Data and Listings segment operating income increased
$19 million
for the
three months ended
March 31, 2019
from the comparable period in
2018
. Our Data and Listings segment operating margins were
43%
and
42%
for the
three months ended
March 31, 2019
and
2018
, respectively. The operating income and operating margin increases were driven by the revenue increases discussed above.
Our Data and Listings segment adjusted operating expenses were
$323 million
and
$303 million
for the
three months ended
March 31, 2019
and
2018
, respectively. Our Data and Listings segment adjusted operating income was
$334 million
and
$326 million
for the
three months ended
March 31, 2019
and
2018
, respectively. Our Data and Listings segment adjusted operating margins were
51%
and
52%
for the
three months ended
March 31, 2019
and
2018
, respectively. See “— Non-GAAP Financial Measures” below.
39
Consolidated Operating Expenses
The following presents our consolidated operating expenses (dollars in millions):
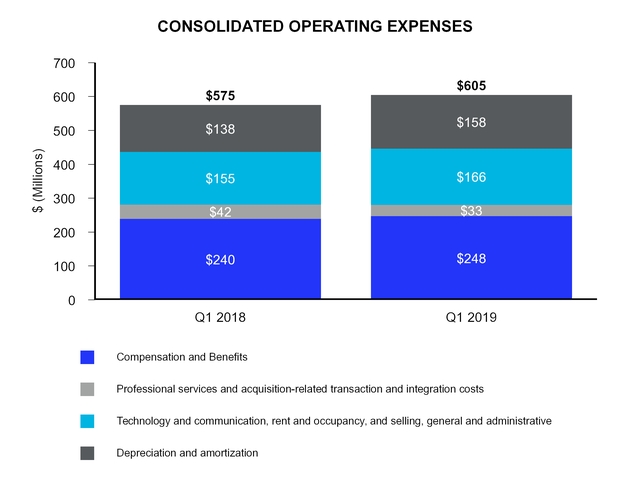
|
Three Months Ended March 31,
|
|||||||||||
|
2019
|
2018
|
Change
|
|||||||||
|
Compensation and benefits
|
$
|
248
|
|
$
|
240
|
|
3
|
%
|
|||
|
Professional services
|
33
|
|
30
|
|
13
|
|
|||||
|
Acquisition-related transaction and integration costs
|
—
|
|
12
|
|
n/a
|
|
|||||
|
Technology and communication
|
107
|
|
105
|
|
1
|
|
|||||
|
Rent and occupancy
|
17
|
|
17
|
|
5
|
|
|||||
|
Selling, general and administrative
|
42
|
|
33
|
|
24
|
|
|||||
|
Depreciation and amortization
|
158
|
|
138
|
|
15
|
|
|||||
|
Total operating expenses
|
$
|
605
|
|
$
|
575
|
|
5
|
%
|
|||
40
The majority of our operating expenses do not vary directly with changes in our volume and revenues, except for certain technology and communication expenses, including data acquisition costs, and a portion of our compensation expense that is tied directly to our data sales or overall financial performance.
We expect our operating expenses to increase in absolute terms in future periods in connection with the growth of our business, and to vary from year-to-year based on the type and level of our acquisitions, our integrations and other investments.
For the
three months ended
March 31, 2019
and
2018
,
12%
and
14%
, respectively, of our operating expenses were incurred in pounds sterling or euros. Due to fluctuations in the U.S. dollar compared to the pound sterling and euro, our consolidated operating expenses decreased $5 million for the
three months ended
March 31, 2019
, from the comparable period in
2018
. See Item 3 “— Quantitative and Qualitative Disclosures About Market Risk - Foreign Currency Exchange Rate Risk” below for additional information.
Compensation and Benefits Expenses
Compensation and benefits expense is our most significant operating expense and includes non-capitalized employee wages, bonuses, non-cash or stock compensation, certain severance costs, benefits and employer taxes. The bonus component of our compensation and benefits expense is based on both our financial performance and the individual employee performance. The performance-based restricted stock compensation expense is also based on our financial performance. Therefore, our compensation and benefits expense will vary year-to-year based on our financial performance and fluctuations in the number of employees.
As of
March 31, 2019
, we had 5,090 employees, compared to 4,879 as of
March 31, 2018
. Our employee headcount increased over the last year primarily due to new employees related to the acquisitions of CHX and TMC Bonds in July 2018 and MERS in October 2018. Our compensation and benefits expenses increased for the
three months ended
March 31, 2019
, from the comparable period in
2018
primarily due to new employees related to these acquisitions. We incurred employee severance and retention costs of $11 million and $9 million for the
three months ended
March 31, 2019
and
2018
, respectively.
Non-cash compensation expenses recognized in our consolidated financial statements for employee stock options and restricted stock were
$29 million
for both the
three months ended
March 31, 2019
and
2018
.
Professional Services Expenses
Professional services expense includes fees for consulting services received on strategic and technology initiatives, temporary labor, as well as regulatory, legal and accounting fees, and may fluctuate as a result of changes in consulting and technology services, temporary labor, and regulatory, accounting and legal proceedings.
Professional services expenses increased for the
three months ended
March 31, 2019
, from the comparable period in
2018
primarily due to legal fees associated with Brexit, regulatory and legal matters relating to the NYSE markets, litigation matters including the class action lawsuits in which the company is a defendant and consulting work related to strategic initiatives.
Acquisition-Related Transaction and Integration Costs
We did not incur any significant acquisition-related transaction and integrations costs during the
three months ended
March 31, 2019
. For the
three months ended
March 31, 2018
, we incurred $
12 million
in acquisition-related transaction and integration costs, primarily relating to employee terminations and lease terminations in connection with our integrations of Interactive Data, Securities Evaluations and Credit Market Analysis, and professional services costs from our 2018 acquisitions. The integration of Interactive Data was completed by June 30, 2018.
We expect to continue to explore and pursue various potential acquisitions and other strategic opportunities to strengthen our competitive position and support our growth. As a result, we may incur acquisition-related transaction costs in future periods. See “- Non-GAAP Financial Measures” below.
Technology and Communication Expenses
Technology support services consist of costs for running our wholly-owned data centers, hosting costs paid to third-party data centers and maintenance of our computer hardware and software required to support our technology and cybersecurity. These costs are driven by system capacity, functionality and redundancy requirements. Communication expenses consist of costs for network connections for our electronic platforms, telecommunications costs, and fees paid for access to external market data. This expense also includes licensing and other fee agreement expenses which may be impacted by growth
41
in electronic contract volume, our capacity requirements, changes in the number of telecommunications hubs and connections with customers to access our electronic platforms directly.
Technology and communications expenses increased for the
three months ended
March 31, 2019
, from the comparable period in
2018
, primarily due to increased costs related to our 2018 acquisitions of CHX, TMC Bonds and MERS, and partially offset by lower revenue share agreements related to our product offering.
Rent and Occupancy Expenses
Rent and occupancy expense relates to leased and owned property and includes rent, maintenance, real estate taxes, utilities and other related costs. We have significant operations located in and around Atlanta, New York and London with smaller offices located throughout the world.
Rent and occupancy expenses increased for the
three months ended
March 31, 2019
, from the comparable period in
2018
primarily due to increased costs related to our 2018 acquisitions of CHX, TMC Bonds and MERS.
Selling, General and Administrative Expenses
Selling, general and administrative expenses include marketing, advertising, public relations, insurance, bank service charges, dues and subscriptions, travel and entertainment, non-income taxes and other general and administrative costs.
Selling, general and administrative expenses increased for the
three months ended
March 31, 2019
, from the comparable period in
2018
, primarily due to costs related to our 2018 acquisitions of CHX, TMC Bonds, and MERS, as well as travel and entertainment, non-income taxes and other general and administrative costs.
Depreciation and Amortization Expenses
Depreciation and amortization expense results from depreciation of long-lived assets such as buildings, leasehold improvements, planes, furniture, fixtures and equipment over their estimated useful lives. This expense includes amortization of intangible assets obtained in our acquisitions of businesses, as well as on various licensing agreements, over their estimated useful lives. Intangible assets subject to amortization consist primarily of customer relationships, trading products with finite lives and technology. This expense also includes amortization of internally-developed and purchased software over its estimated useful life.
We recorded amortization expenses on intangible assets acquired as part of our acquisitions, as well as on other intangible assets, of $77 million and $69 million for the
three months ended
March 31, 2019
and
2018
, respectively. Amortization expense increased for the
three months ended
March 31, 2019
, from the comparable period in
2018
, as a result of CHX, TMC Bonds and MERS intangible assets.
We recorded depreciation expenses on our fixed assets of $81 million and $69 million for the
three months ended
March 31, 2019
and
2018
, respectively. Depreciation expense increased for the
three months ended
March 31, 2019
, from the comparable period in
2018
primarily due to depreciation resulting from increased software development and networking equipment.
Consolidated Non-Operating Income (Expense)
Income and expenses incurred through activities outside of our core operations are considered non-operating. The following table presents our non-operating income (expenses) (dollars in millions):
|
Three Months Ended March 31,
|
||||||||||
|
2019
|
2018
|
Change
|
||||||||
|
Other income (expense):
|
||||||||||
|
Interest income
|
$
|
9
|
|
$
|
4
|
|
139
|
%
|
||
|
Interest expense
|
(71
|
)
|
(52
|
)
|
35
|
|
||||
|
Other income, net
|
23
|
|
15
|
|
44
|
|||||
|
Total other income (expense), net
|
$
|
(39
|
)
|
$
|
(33
|
)
|
19
|
%
|
||
|
Net income attributable to non-controlling interest
|
$
|
(8
|
)
|
$
|
(10
|
)
|
(15
|
)%
|
||
42
Interest Income
We recognized interest income on our investments of
$9 million
and
$4 million
for the
three months ended
March 31, 2019
and
2018
, respectively. Interest income increased for the
three months ended
March 31, 2019
, from the comparable period in
2018
primarily due to a rise in short-term interest rates on various investments.
Interest Expense
Interest expense increased for the
three months ended
March 31, 2019
, from the comparable period in
2018
primarily due to an increase in the principal and coupon of our bond refinancing in August 2018, as well as a rise in short-term interest rates impacting our Commercial Paper Program.
Other income, net
In connection with our equity investment in Euroclear, we recognized dividend income of $15 million during the
three months ended
March 31, 2018
, which is included in other income. We did not receive a Euroclear dividend during the
three months ended
March 31, 2019
. We expect to receive a Euroclear dividend during the three months ended December 31, 2019.
Our equity method investments include the OCC, and prior to purchasing the remaining minority stake in MERS in October 2018, our majority investment in MERS. We recognized $27 million and $4 million in equity income related to these investments for the
three months ended
March 31, 2019
and
2018
, respectively, as other income.
Prior to October 2018, we owned a majority stake in MERS and treated it as an equity method investment because we did not have the ability to control its operations. On October 3, 2018, we completed the purchase of all remaining interests of MERS. On that date, we ceased recording equity income of MERS. MERS is now part of ICE Mortgage Services.
We own a 40% interest in the OCC, which is regulated by the SEC and the CFTC. On February 13, 2019, the SEC disapproved the OCC capital plan that was established in 2015. Following the SEC disapproval, the OCC also announced they will not be providing a refund to clearing members or declaring a dividend to shareholders for the year ended December 31, 2018, which resulted in higher reported OCC 2018 net income than we had estimated. During the
three months ended
March 31, 2019
, we recognized $27 million of equity earnings as our share of estimated OCC profits, including $19 million related to 2018 earnings. Refer to Note 3 to our consolidated financial statements, included in this Form 10-Q for additional details on our OCC investment.
We incurred foreign currency transaction losses of
$4 million
for the
three months ended
March 31, 2019
. This was primarily attributable to the fluctuations of the pound sterling and euro relative to the U.S. dollar. Foreign currency transaction gains or losses were flat for the three months ended March 31, 2018. Foreign currency gains and losses are recorded in other income, net, when the settlement of foreign currency assets, liabilities and payables that occur through our foreign operations that are received in non-functional currencies due to the increase or decrease in the period-end foreign currency exchange rates between periods. See Item 3 “- Quantitative and Qualitative Disclosures About Market Risk - Foreign Currency Exchange Rate Risk” included elsewhere in this Quarterly Report for more information on these items.
Non-controlling Interest
For consolidated subsidiaries in which our ownership is less than 100% and for which we have control over the assets and liabilities and the management of the entity, the outside stockholders' interests are shown as non-controlling interests. Non-controlling interests include those related to the operating results of our CDS clearing subsidiaries in which non-ICE limited partners hold a 26.7% ownership interest as of
March 31, 2019
.
In December 2018, Bakkt Holdings, LLC, or Bakkt, was capitalized with
$183 million
in initial funding with ICE as the majority owner, along with a group of other minority investors. We hold a call option over these interests subject to certain terms. Similarly, the non-ICE partners in Bakkt hold a put option to require us to repurchase their interests subject to certain terms. These minority interests are reflected as redeemable non-controlling interests in temporary equity within our consolidated balance sheet.
Consolidated Income Tax Provision
Consolidated income tax expense was
$134 million
and
$143 million
for the
three months ended
March 31, 2019
and
2018
, respectively. The change in consolidated income tax expense between periods is primarily due to the tax impact of changes in our pre-tax income and the changes in our effective tax rate each period. Our effective tax rate was
21%
and
23%
for the
three months ended March 31, 2019
and
2018
, respectively. The effective tax rate for the
three months ended
March 31, 2019
as compared to the same period in
2018
was lower primarily due to reduced U.S. federal and state income taxes on our non-U.S. income under certain international tax provisions enacted as part of the Tax Cuts and Jobs Act, or TCJA, and
43
deferred tax benefits related to state apportionment changes. The reduced U.S. federal and state income taxes are a result of clarifications provided by subsequent federal and state legislative or administrative guidance to those international provisions of the TCJA and related state provisions.
Quarterly Results of Operations
The following quarterly unaudited condensed consolidated statements of income data has been prepared on substantially the same basis as our audited consolidated financial statements and includes all adjustments, consisting only of normal recurring adjustments, necessary for the fair presentation of our consolidated results of operations for the quarters presented. The historical results for any quarter do not necessarily indicate the results expected for any future period. The following table sets forth quarterly consolidated statements of income data (in millions):
|
Three Months Ended,
|
|||||||||||||||||||
|
March 31, 2019
|
December 31,
2018 |
September 30, 2018
|
June 30, 2018
|
March 31, 2018
|
|||||||||||||||
|
Revenues:
|
|||||||||||||||||||
|
Energy futures and options contracts
|
$
|
229
|
|
$
|
257
|
|
$
|
223
|
|
$
|
250
|
|
$
|
235
|
|
||||
|
Agricultural and metals futures and options contracts
|
62
|
|
54
|
|
58
|
|
74
|
|
65
|
|
|||||||||
|
Financial futures and options contracts
|
83
|
|
92
|
|
77
|
|
94
|
|
91
|
|
|||||||||
|
Cash equities and equity options
|
390
|
|
462
|
|
335
|
|
389
|
|
438
|
|
|||||||||
|
Fixed income and credit
|
87
|
|
83
|
|
56
|
|
45
|
|
56
|
|
|||||||||
|
OTC and other transactions
|
11
|
|
13
|
|
11
|
|
12
|
|
13
|
|
|||||||||
|
Total transaction and clearing, net
|
862
|
|
961
|
|
760
|
|
864
|
|
898
|
|
|||||||||
|
Pricing and analytics
|
266
|
|
264
|
|
263
|
|
262
|
|
254
|
|
|||||||||
|
Exchange data and feeds
|
176
|
|
174
|
|
168
|
|
164
|
|
164
|
|
|||||||||
|
Desktops and connectivity
|
104
|
|
101
|
|
99
|
|
100
|
|
102
|
|
|||||||||
|
Total data services
|
546
|
|
539
|
|
530
|
|
526
|
|
520
|
|
|||||||||
|
Listings
|
111
|
|
112
|
|
112
|
|
111
|
|
109
|
|
|||||||||
|
Other revenues
|
64
|
|
65
|
|
61
|
|
55
|
|
53
|
|
|||||||||
|
Total Revenues
|
1,583
|
|
1,677
|
|
1,463
|
|
1,556
|
|
1,580
|
|
|||||||||
|
Transaction-based expenses
|
313
|
|
369
|
|
263
|
|
310
|
|
355
|
|
|||||||||
|
Total revenues, less transaction-based expenses
|
1,270
|
|
1,308
|
|
1,200
|
|
1,246
|
|
1,225
|
|
|||||||||
|
Compensation and benefits
|
248
|
|
262
|
|
251
|
|
241
|
|
240
|
|
|||||||||
|
Professional services
|
33
|
|
40
|
|
32
|
|
29
|
|
30
|
|
|||||||||
|
Acquisition-related transaction and integration costs
|
—
|
|
1
|
|
6
|
|
15
|
|
12
|
|
|||||||||
|
Technology and communication
|
107
|
|
112
|
|
107
|
|
108
|
|
105
|
|
|||||||||
|
Rent and occupancy
|
17
|
|
18
|
|
17
|
|
16
|
|
17
|
|
|||||||||
|
Selling, general and administrative
|
42
|
|
42
|
|
37
|
|
39
|
|
33
|
|
|||||||||
|
Depreciation and amortization
|
158
|
|
157
|
|
148
|
|
143
|
|
138
|
|
|||||||||
|
Total operating expenses
|
605
|
|
632
|
|
598
|
|
591
|
|
575
|
|
|||||||||
|
Operating income
|
665
|
|
676
|
|
602
|
|
655
|
|
650
|
|
|||||||||
|
Other income (expense), net
(1)
|
(39
|
)
|
62
|
|
(48
|
)
|
(44
|
)
|
(33
|
)
|
|||||||||
|
Income tax expense (benefit)
|
134
|
|
119
|
|
89
|
|
149
|
|
143
|
|
|||||||||
|
Net income
|
$
|
492
|
|
$
|
619
|
|
$
|
465
|
|
$
|
462
|
|
$
|
474
|
|
||||
|
Net income attributable to non-controlling interest
|
(8
|
)
|
(8
|
)
|
(7
|
)
|
(7
|
)
|
(10
|
)
|
|||||||||
|
Net income attributable to Intercontinental, Exchange, Inc.
|
$
|
484
|
|
$
|
611
|
|
$
|
458
|
|
$
|
455
|
|
$
|
464
|
|
||||
(1)
Other income (expense), net for the three months ended December 31, 2018 includes a $110 million gain in connection with our acquisition of MERS.
44
Liquidity and Capital Resources
Below are charts that reflect our capital allocation. The acquisition and integration costs in the chart below includes cash paid for acquisitions, net of cash received for divestitures, cash paid for investments, cash paid for non-controlling interest and redeemable non-controlling interest, and the acquisition-related transaction and integration costs, net of divestitures, in each period.
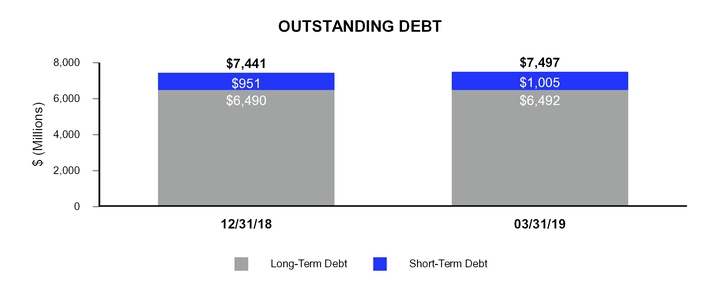
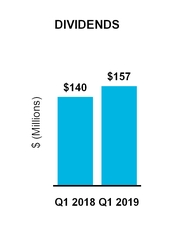
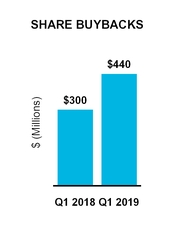
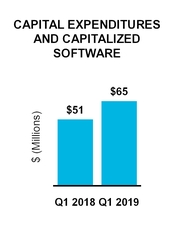
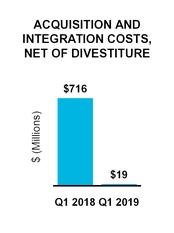
We have financed our operations, growth and cash needs primarily through income from operations and borrowings under our various debt facilities. Our principal capital requirements have been to fund capital expenditures, working capital, strategic acquisitions and investments, stock repurchases, dividends and the development of our technology platforms. We believe that our cash on hand and cash flows from operations will be sufficient to repay our outstanding debt, but we may also need to incur additional debt or issue additional equity securities in the future. See “- Future Capital Requirements” below.
Our Commercial Paper Program enables us to borrow efficiently at reasonable short-term interest rates and provides us with the flexibility to de-lever using our strong annual cash flows from operating activities whenever our leverage becomes elevated as a result of investment or acquisition activities. We had net issuances of
$54 million
under our Commercial Paper Program during the
three months ended
March 31, 2019
.
Upon maturity of our commercial paper and to the extent old issuances are not repaid by cash on hand, we are exposed to the rollover risk of not being able to issue new commercial paper. To mitigate this risk, we maintain an undrawn back-stop bank revolving credit facility for an aggregate amount which meets or exceeds the amount issued under our Commercial Paper Program at any time. If we were not able to issue new commercial paper, we have the option of drawing on the back-stop revolving facility. However, electing to do so would result in higher interest expense. For a discussion of our Commercial Paper Program and other indebtedness, see “- Debt” below.
45
Consolidated cash and cash equivalents were
$653 million
and
$724 million
as of
March 31, 2019
and
December 31, 2018
, respectively. We had
$1.2 billion
and
$1.1 billion
in short-term and long-term restricted cash and cash equivalents as of
March 31, 2019
and
December 31, 2018
, respectively. We consider all short-term, highly-liquid investments with original maturity dates of three months or less to be cash equivalents. We classify all investments with original maturity dates in excess of three months but less than one year as short-term investments and all investments that we intend to hold for more than one year as long-term investments. Short-term and long-term investments are included in other current and other non-current assets, respectively. Cash and cash equivalents that are not available for general use, either due to regulatory requirements or through restrictions in specific agreements, are classified as restricted cash and cash equivalents and investments.
As of
March 31, 2019
, the amount of unrestricted cash held by our non-U.S. subsidiaries was $241 million.
Our cash and cash equivalents and financial investments are managed as a global treasury portfolio of non-speculative financial instruments that are readily convertible into cash, such as overnight deposits, term deposits, money market funds, mutual funds for treasury investments, short duration fixed income investments and other money market instruments, thus ensuring high liquidity of financial assets. We may invest a portion of our cash in excess of short-term operating needs in investment-grade marketable debt securities, including government or government-sponsored agencies and corporate debt securities.
In September 2018, our Board of Directors approved an aggregate of $2.0 billion for future repurchases of our common stock with no fixed expiration date that became effective January 1, 2019. We expect this authorization to provide us with capacity for buybacks over six quarters and flexibility to act opportunistically. We expect funding for any share repurchases to come from our operating cash flow or borrowings under our Commercial Paper Program or our debt facilities.
Repurchases of our common stock may be made from time to time on the open market, through established trading plans, in privately-negotiated transactions or otherwise, in accordance with all applicable securities laws, rules and regulations. For the
three months ended
March 31, 2019
, we repurchased
5.9 million
shares of our outstanding common stock at a cost of
$440 million
, including 4.6 million shares at a cost of $340 million under our Rule 10b5-1 trading plan and 1.3 million shares at a cost of $100 million on the open market. For the
three months ended
March 31,
2018
, we repurchased
4.1 million
shares of our outstanding common stock at a cost of
$300 million
. The shares repurchased are held in treasury stock and were completed on the open market and under Rule 10b5-1 trading plans.
From time to time, we enter into Rule 10b5-1 trading plans, as authorized by our Board of Directors, to govern some or all of the repurchases of our shares of common stock. The timing and extent of future repurchases that are not made pursuant to a Rule 10b5-1 trading plan will be at our discretion and will depend upon many conditions. In making a determination regarding any stock repurchases, management considers multiple factors, including overall stock market conditions, our common stock price movements, the remaining amount authorized for repurchases by our Board of Directors, the potential impact of a stock repurchase program on our corporate debt ratings, our expected free cash flow and working capital needs, our current and future planned strategic growth initiatives and other potential uses of our cash and capital resources.
We may discontinue stock repurchases at any time and may amend or terminate a Rule 10b5-1 trading plan at any time. The approval of our Board of Directors for the share repurchases does not obligate us to acquire any particular amount of our common stock. In addition, our Board of Directors may increase or decrease the amount of capacity we have for repurchases from time to time.
Cash Flow
The following table presents the major components of net changes in cash, cash equivalents, and restricted cash and cash equivalents (in millions):
|
Three Months Ended March 31,
|
|||||||
|
2019
|
2018
|
||||||
|
Net cash provided by (used in):
|
|||||||
|
Operating activities
|
$
|
654
|
|
$
|
573
|
|
|
|
Investing activities
|
(40
|
)
|
(755
|
)
|
|||
|
Financing activities
|
(596
|
)
|
270
|
|
|||
|
Effect of exchange rate changes
|
1
|
|
2
|
|
|||
|
Net increase in cash, cash equivalents and restricted cash and cash equivalents
|
$
|
19
|
|
$
|
90
|
|
|
46
Operating Activities
Net cash provided by operating activities primarily consists of net income adjusted for certain non-cash items, including depreciation and amortization and the effects of changes in working capital.
The
$81 million
increase in net cash provided by operating activities during the
three months ended
March 31, 2019
as compared to the prior period in
2018
is primarily a result of the timing of various payments such as transaction-related expenses and taxes. In relation to tax payments, due to Hurricane Irma, the Internal Revenue Service allowed Georgia-based companies to defer their fourth quarter federal estimated payment from December 2017 to January 2018, which we elected to do.
Investing Activities
Consolidated net cash used in investing activities for the
three months ended
March 31, 2019
primarily relates to
$26 million
of capital expenditures,
$39 million
of capitalized software development expenditures, and a $44 million return of capital related to our equity method investment in the OCC. Refer to Note 3 to our consolidated financial statements, included in this Form 10-Q for additional details on our OCC investment.
Consolidated net cash used in investing activities for the
three months ended
March 31, 2018 primarily relates to our January 2018 acquisition of BondPoint for $400 million, the purchase of an additional 5.1% stake in Euroclear for €246 million in cash ($304 million),
$14 million
of capital expenditures and
$37 million
of capitalized software development expenditures.
The capital expenditures primarily relate to hardware and software purchases to continue the development and expansion of our electronic platforms, data services and clearing houses, and leasehold improvements associated with the new and renovated office spaces in Atlanta, New York and London. The software development expenditures primarily relate to the continued development and expansion of our electronic trading platforms, data services and clearing houses.
Financing Activities
Consolidated net cash used in financing activities for the
three months ended
March 31, 2019
primarily relates to
$440 million
in repurchases of common stock,
$54 million
in net borrowings under our Commercial Paper Program, $157 million in dividend payments to stockholders and $
57 million
in cash payments related to treasury shares received for restricted stock tax payments and stock options exercises.
Consolidated net cash provided by financing activities for the
three months ended
March 31, 2018
primarily relates to
$789 million
in net borrowings under our Commercial Paper Program, partially offset by
$300 million
in repurchases of common stock,
$140 million
in dividend payments to our stockholders, and
$72 million
in cash payments related to treasury shares received for restricted stock tax payments and stock options exercises.
Debt
Our total debt, including short-term and long-term debt, consisted of the following (in millions):
47
|
As of
March 31, 2019 |
As of
December 31, 2018 |
||||||
|
Debt:
|
|||||||
|
Short-term debt:
|
|||||||
|
Commercial Paper
|
$
|
1,005
|
|
$
|
951
|
|
|
|
Total short-term debt
|
1,005
|
|
951
|
|
|||
|
Long-term debt:
|
|||||||
|
2020 Senior Notes (2.75% senior unsecured notes due December 1, 2020)
|
1,247
|
|
1,246
|
|
|||
|
2022 Senior Notes (2.35% senior unsecured notes due September 15, 2022)
|
496
|
|
496
|
|
|||
|
2023 Senior Notes (3.45% senior unsecured notes due September 21, 2023)
|
397
|
|
397
|
|
|||
|
2023 Senior Notes (4.00% senior unsecured notes due October 15, 2023)
|
793
|
|
793
|
|
|||
|
2025 Senior Notes (3.75% senior unsecured notes due December 1, 2025)
|
1,243
|
|
1,243
|
|
|||
|
2027 Senior Notes (3.10% senior unsecured notes due September 15, 2027)
|
496
|
|
496
|
|
|||
|
2028 Senior Notes (3.75% senior unsecured notes due September 21, 2028)
|
592
|
|
591
|
|
|||
|
2048 Senior Notes (4.25% senior unsecured notes due September 21, 2048)
|
1,228
|
|
1,228
|
|
|||
|
Total long-term debt
|
6,492
|
|
6,490
|
|
|||
|
Total debt
|
$
|
7,497
|
|
$
|
7,441
|
|
|
Credit Facility
We have a
$3.4 billion
senior unsecured revolving credit facility, or the Credit Facility with a maturity date of August 9, 2023. The Credit Facility includes an option for us to propose an increase in the aggregate amount available for borrowing by up to
$975 million
, subject to the consent of the lenders funding the increase and certain other conditions.
No
amounts were outstanding under the Credit Facility as of
March 31, 2019
.
As of
March 31, 2019
, of the
$3.4 billion
that is currently available for borrowing under the Credit Facility,
$1.0 billion
is required to back-stop the amount outstanding under our Commercial Paper Program and
$105 million
is required to support certain broker-dealer subsidiary commitments. The amount required to back-stop the amounts outstanding under the Commercial Paper Program will fluctuate as we increase or decrease our commercial paper borrowings. The remaining
$2.3 billion
is available for working capital and general corporate purposes including, but not limited to, acting as a back-stop to future increases in the amounts outstanding under the Commercial Paper Program.
Commercial Paper Program
We have a U.S. dollar commercial paper program, or the Commercial Paper Program. It is currently backed by the borrowing capacity available under the Credit Facility, as described above. The effective interest rate of commercial paper issuances does not materially differ from short-term interest rates (such as USD LIBOR) which fluctuate due to market conditions and as a result may impact our interest expense. During the
three months ended
March 31, 2019
, we had net issuances of
$54 million
under the Commercial Paper Program, the proceeds of which were used for general corporate purposes.
Commercial paper notes of
$1.0 billion
with original maturities ranging from
one
to
88
days were outstanding as of
March 31, 2019
under our Commercial Paper Program, with a weighted average interest rate of
2.54%
per annum and a weighted average maturity of
22
days.
Committed Repo and Committed FX Facilities
To provide a tool to address the liquidity needs of our clearing houses and manage the liquidation of margin and guaranty fund deposits held in the form of cash and high quality sovereign debt, ICE Clear Europe, ICE Clear Credit and ICE Clear US have entered into Committed Repurchase Agreement Facilities, or Committed Repo. Additionally, ICE Clear Credit and ICE Clear Netherlands have entered into Committed FX Facilities to support these liquidity needs. As of
March 31, 2019
the following facilities were in place:
|
•
|
ICE Clear Europe:
$1.0 billion in Committed Repo to finance U.S. dollar, euro and pound sterling deposits.
|
|
•
|
ICE Clear Credit:
$300 million in Committed Repo to finance U.S. dollar and euro deposits, €250 million in Committed Repo to finance euro deposits, and €1.9 billion in Committed FX Facilities to finance euro payment obligations.
|
|
•
|
ICE Clear US:
$250 million in Committed Repo to finance U.S. dollar deposits.
|
|
•
|
ICE Clear Netherlands:
€10 million in Committed FX Facilities to finance euro payment obligations.
|
48
Future Capital Requirements
Our future capital requirements will depend on many factors, including the rate of growth across our Trading and Clearing and Data and Listings segments, strategic plans and acquisitions, available sources for financing activities, required and discretionary technology and clearing initiatives, regulatory requirements, the timing and introduction of new products and enhancements to existing products, the geographic mix of our business and potential stock repurchases.
We currently expect to incur capital expenditures (including operational and real estate capital expenditures) and to incur software development costs that are eligible for capitalization ranging in the aggregate between $290 million and $320 million in 2019, which we believe will support the enhancement of our technology, business integration and the continued growth of our businesses.
Effective January 1, 2019, our Board of Directors approved an aggregate of $2.0 billion for repurchases of our common stock with no fixed expiration date. We expect this authorization to provide us with capacity for buybacks over six quarters and flexibility to act opportunistically. As of
March 31, 2019
, we had $1.6 billion authorized for future repurchases of our common stock. Refer to Note 9 to our consolidated financial statements, included in this Form 10-Q for additional details on our stock repurchase plan.
Our Board of Directors has adopted a quarterly dividend policy providing that dividends will be approved quarterly by the board or its Audit Committee taking into account factors such as our evolving business model, prevailing business conditions and our financial results and capital requirements, without a predetermined net income payout ratio. During the first quarter of 2019, we paid a quarterly dividend of $0.275 per share of our common stock for an aggregate payout of $157 million, which includes the payment of dividend equivalents on unvested employee restricted stock units. On May 2, 2019, we announced a $0.275 per share dividend for the second quarter of 2019 with the dividend payable on June 28, 2019 to stockholders of record as of June 14, 2019.
As of
March 31, 2019
, we had
$7.5 billion
in outstanding debt. We currently also have a
$3.4 billion
Credit Facility, of which
$2.3 billion
is available for general corporate purposes. Other than the facilities discussed above for the ICE Clearing Houses, the Credit Facility and our Commercial Paper Program are currently the only significant agreements or arrangements that we have for liquidity and capital resources with third parties. In the event of any strategic acquisitions, mergers or investments, or if we are required to raise capital for any reason or desire to return capital to our stockholders, we may incur additional debt, issue additional equity to raise necessary funds, repurchase additional shares of our common stock or pay a dividend. However, we cannot provide assurance that such financing or transactions will be available or successful, or that the terms of such financing or transactions will be favorable to us. See "- Debt” above.
Non-GAAP Financial Measures
We use certain financial measures internally to evaluate our performance and make financial and operational decisions that are presented in a manner that adjusts from their equivalent GAAP measures or that supplement the information provided by our GAAP measures. We use these adjusted results because we believe they more clearly highlight trends in our business that may not otherwise be apparent when relying solely on GAAP financial measures, since these measures eliminate from our results specific financial items that have less bearing on our core operating performance.
We use these measures in communicating certain aspects of our results and performance, including in this Quarterly Report, and believe that these measures, when viewed in conjunction with our GAAP results and the accompanying reconciliation, can provide investors with greater transparency and a greater understanding of factors affecting our financial condition and results of operations than GAAP measures alone. In addition, we believe the presentation of these measures is useful to investors for making period-to-period comparisons of results because the adjustments to GAAP are not reflective of our core business performance.
These financial measures are not presented in accordance with, or as an alternative to, GAAP financial measures and may be different from non-GAAP measures used by other companies. We encourage investors to review the GAAP financial measures included in this Quarterly Report, including our consolidated financial statements, to aid in their analysis and understanding of our performance and in making comparisons.
The table below outlines our adjusted operating expenses, adjusted operating income, adjusted operating margin, adjusted net income attributable to ICE common stockholders and adjusted earnings per share, which are non-GAAP measures that are calculated by making adjustments for items we view as not reflective of our cash operations and core business performance. These measures, including the adjustments and their related income tax effect and other tax adjustments (in millions, except for percentages and per share amounts), are as follows:
49
|
Trading and Clearing Segment
|
Data and Listings Segment
|
Consolidated
|
|||||||||||||||||||||
|
Three Months Ended
March 31, |
Three Months Ended
March 31, |
Three Months Ended
March 31, |
|||||||||||||||||||||
|
2019
|
2018
|
2019
|
2018
|
2019
|
2018
|
||||||||||||||||||
|
Total revenues, less transaction-based expenses
|
$
|
613
|
|
$
|
596
|
|
$
|
657
|
|
$
|
629
|
|
$
|
1,270
|
|
$
|
1,225
|
|
|||||
|
Operating expenses
|
228
|
|
207
|
|
377
|
|
368
|
|
$
|
605
|
|
$
|
575
|
|
|||||||||
|
Less: Interactive Data integration costs
|
—
|
|
—
|
|
—
|
|
12
|
|
—
|
|
12
|
|
|||||||||||
|
Less: Amortization of acquisition-related intangibles
|
23
|
|
16
|
|
54
|
|
53
|
|
77
|
|
69
|
|
|||||||||||
|
Adjusted operating expenses
|
$
|
205
|
|
$
|
191
|
|
$
|
323
|
|
$
|
303
|
|
$
|
528
|
|
$
|
494
|
|
|||||
|
Operating income
|
$
|
385
|
|
$
|
389
|
|
$
|
280
|
|
$
|
261
|
|
$
|
665
|
|
$
|
650
|
|
|||||
|
Adjusted operating income
|
$
|
408
|
|
$
|
405
|
|
$
|
334
|
|
$
|
326
|
|
$
|
742
|
|
$
|
731
|
|
|||||
|
Operating margin
|
63
|
%
|
65
|
%
|
43
|
%
|
42
|
%
|
52
|
%
|
53
|
%
|
|||||||||||
|
Adjusted operating margin
|
67
|
%
|
68
|
%
|
51
|
%
|
52
|
%
|
58
|
%
|
60
|
%
|
|||||||||||
|
Net income attributable to ICE common stockholders
|
$
|
484
|
|
$
|
464
|
|
|||||||||||||||||
|
Add: Interactive Data integration costs
|
—
|
|
12
|
|
|||||||||||||||||||
|
Add: Amortization of acquisition-related intangibles
|
77
|
|
69
|
|
|||||||||||||||||||
|
Add: Adjustment to reduce net gain on Trayport divestiture
|
—
|
|
1
|
|
|||||||||||||||||||
|
Less: Income tax effect for the above items
|
(20
|
)
|
(21
|
)
|
|||||||||||||||||||
|
Less: Deferred tax adjustments on acquisition-related intangibles
|
(17
|
)
|
—
|
|
|||||||||||||||||||
|
Add: Other tax adjustments
|
3
|
|
—
|
|
|||||||||||||||||||
|
Adjusted net income attributable to ICE common stockholders
|
$
|
527
|
|
$
|
525
|
|
|||||||||||||||||
|
Basic earnings per share attributable to ICE common stockholders
|
$
|
0.85
|
|
$
|
0.80
|
|
|||||||||||||||||
|
Diluted earnings per share attributable to ICE common stockholders
|
$
|
0.85
|
|
$
|
0.79
|
|
|||||||||||||||||
|
Adjusted basic earnings per share attributable to ICE common stockholders
|
$
|
0.93
|
|
$
|
0.90
|
|
|||||||||||||||||
|
Adjusted diluted earnings per share attributable to ICE common stockholders
|
$
|
0.92
|
|
$
|
0.90
|
|
|||||||||||||||||
Acquisition-related transaction costs are included as part of our core business expenses, except for those that are directly related to the announcement, closing, financing or termination of a transaction. However, we adjusted for the acquisition-related integration costs relating to Interactive Data given the size of this acquisition. The integration of Interactive Data was completed by June 2018. Amortization of acquisition-related intangibles are included in non-GAAP adjustments as excluding these non-cash expenses provides greater clarity regarding our financial strength and stability of cash operating results.
In addition, we also include the 2018 reduction of the gain on our December 2017 sale of Trayport as a non-GAAP adjustment, as this is not considered a part of our core business operations. The income tax effects relating to all non-GAAP adjustments, above, are included as non-GAAP adjustments. The
$17 million
deferred tax adjustment on acquisition-related intangibles for the period ended March 31, 2019 is due to state apportionment changes. The
$3 million
other tax adjustment for the period ended March 31, 2019 is for additional audit settlement payments primarily related to pre-acquisition tax matters in conjunction with our acquisition of NYSE in 2013.
For additional information on these items, refer to our consolidated financial statements included in this Quarterly Report and “—Consolidated Operating Expenses” and “—Consolidated Non-Operating Income (Expenses)”, above.
Contractual Obligations and Commercial Commitments
In the
first quarter
of
2019
, there were no significant changes to our contractual obligations and commercial commitments from those disclosed in the section “Management’s Discussion and Analysis of Financial Condition and Results of Operations” in our
2018
Form 10-K, other than the changes related to our adoption of the new lease accounting standard, ASU 2016-02, described in Note 2 of our consolidated financial statements.
50
Off-Balance Sheet Arrangements
As described in Note 11 to our consolidated financial statements, which are included elsewhere in this Quarterly Report, certain clearing house collateral is reported off-balance sheet. We do not have any relationships with unconsolidated entities or financial partnerships, often referred to as structured finance or special purpose entities.
New and Recently Adopted Accounting Pronouncements
Refer to Note 2 to our consolidated financial statements, which are included elsewhere in this Quarterly Report, for information on the new and recently adopted accounting pronouncements that are applicable to us.
Critical Accounting Policies
In the
first quarter
of
2019
, there were no significant changes to our critical accounting policies and estimates from those disclosed in the section “Management’s Discussion and Analysis of Financial Condition and Results of Operations” in our
2018
Form 10-K.
ITEM 3. QUANTITATIVE AND QUALITATIVE DISCLOSURES ABOUT MARKET RISK
As a result of our operating and financing activities, we are exposed to market risks such as interest rate risk, foreign currency exchange rate risk and credit risk. We have implemented policies and procedures designed to measure, manage, monitor and report risk exposures, which are regularly reviewed by the appropriate management and supervisory bodies.
Interest Rate Risk
We have exposure to market risk for changes in interest rates relating to our cash and cash equivalents, short-term and long-term restricted cash and cash equivalents, short-term and long-term investments and indebtedness. As of
March 31, 2019
and
December 31, 2018
, our cash and cash equivalents, short-term and long-term investments, and short-term and long-term restricted cash and cash equivalents were both $2.0 billion of which $241 million and $275 million, respectively, were denominated in pounds sterling, euros or Canadian dollars. The remaining cash and cash equivalents, short-term investments, and short-term and long-term restricted cash and cash equivalents are denominated in U.S. dollars. We do not use our investment portfolio for trading or other speculative purposes. A hypothetical 100 basis point decrease in short-term interest rates would decrease annual pre-tax earnings by $16 million as of
March 31, 2019
, assuming no change in the amount or composition of our cash and cash equivalents and short-term and long-term restricted cash and cash equivalents.
As of
March 31, 2019
, we had $
7.5 billion
in outstanding debt, of which
$6.5 billion
relates to our senior notes, which bear interest at fixed interest rates. The remaining amount outstanding of
$1.0 billion
relates to the Commercial Paper Program, which bears interest at fluctuating rates and, therefore, subjects us to interest rate risk. A hypothetical 100 basis point increase in short-term interest rates relating to the amounts outstanding under the Commercial Paper Program as of
March 31, 2019
would decrease annual pre-tax earnings by
$10 million
, assuming no change in the volume or composition of our outstanding indebtedness and no hedging activity. See Item 2 “- Management’s Discussion and Analysis of Financial Condition and Results of Operations - Debt” included in this Quarterly Report.
The interest rates on our Commercial Paper Program are currently evaluated based upon current maturities and market conditions. The weighted average interest rate on our Commercial Paper Program increased from 2.48% as of December 31, 2018 to 2.54% as of March 31, 2019, and increased from 1.86% as of March 31, 2018. The increase in the Commercial Paper Program weighted average interest rate was primarily due to the decisions by the U.S. Federal Reserve in March 2018, June 2018, September 2018, and in December 2018 to increase the federal funds short-term interest rate by an aggregate 100 basis points to 2.50%. The effective interest rate of commercial paper issuance will continue to fluctuate based on the movement in short-term interest rates along with shifts in supply and demand within the commercial paper market.
Foreign Currency Exchange Rate Risk
As an international business, we are subject to foreign currency exchange rate risk. We may experience gains or losses from foreign currency transactions in the future given that a significant part of our assets and liabilities are recorded in pounds sterling, Canadian dollars or euros, and a significant portion of our revenues and expenses are recorded in pounds sterling or euros. Certain assets, liabilities, revenues and expenses of foreign subsidiaries are denominated in the local functional
51
currency of such subsidiaries. Our exposure to foreign denominated earnings for the
three months ended March 31, 2019
is presented by primary foreign currency in the following table (dollars in millions, except exchange rates):
|
|
Three Months Ended March 31, 2019
|
Three Months Ended March 31, 2018
|
|||||||||||||
|
|
Pound Sterling
|
|
Euro
|
Pound Sterling
|
|
Euro
|
|||||||||
|
Average exchange rate to the U.S. dollar in the current year period
|
$
|
1.3021
|
|
|
$
|
1.1355
|
|
$
|
1.3918
|
|
$
|
1.2292
|
|
||
|
Average exchange rate to the U.S. dollar in the same period in the prior year
|
$
|
1.3918
|
|
|
$
|
1.2292
|
|
$
|
1.2396
|
|
$
|
1.0654
|
|
||
|
Average exchange rate increase (decrease)
|
(6
|
)%
|
(8
|
)%
|
12
|
%
|
15
|
%
|
|||||||
|
Foreign denominated percentage of:
|
|
|
|
||||||||||||
|
Revenues, less transaction-based expenses
|
8
|
%
|
|
5
|
%
|
10
|
%
|
5
|
%
|
||||||
|
Operating expenses
|
10
|
%
|
|
2
|
%
|
12
|
%
|
2
|
%
|
||||||
|
Operating income
|
7
|
%
|
8
|
%
|
8
|
%
|
7
|
%
|
|||||||
|
Impact of the currency fluctuations
(1)
on:
|
|
|
|
||||||||||||
|
Revenues, less transaction-based expenses
|
$
|
(7
|
)
|
|
$
|
(6
|
)
|
$
|
13
|
|
$
|
8
|
|
||
|
Operating expenses
|
$
|
(4
|
)
|
|
$
|
(1
|
)
|
$
|
7
|
|
$
|
2
|
|
||
|
Operating income
|
$
|
(3
|
)
|
|
$
|
(5
|
)
|
$
|
6
|
|
$
|
6
|
|
||
|
(1)
|
Represents the impact of currency fluctuation for the
three months ended March 31, 2019
compared to the same period in the prior year.
|
We have a significant part of our assets, liabilities, revenues and expenses recorded in pounds sterling or euros. For the
three months ended
March 31, 2019
,
13%
of our consolidated revenues, less transaction-based expenses, were denominated in pounds sterling or euros, and,
12%
of our consolidated operating expenses were denominated in pounds sterling or euros. As the pound sterling or euro exchange rate changes, the U.S. equivalent of revenues and expenses denominated in foreign currencies changes accordingly.
Foreign currency transaction risk related to the settlement of foreign currency denominated assets, liabilities and payables occur through our operations, which are received in or paid in pounds sterling, Canadian dollars or euros, due to the increase or decrease in the foreign currency exchange rates between periods. We incurred foreign currency transaction losses of
$4 million
for the
three months ended
March 31, 2019
. Foreign currency transaction gains or losses were flat for the three months ended March 31, 2018. The foreign currency transactions losses were primarily attributable to the fluctuations of the pound sterling and euro relative to the U.S. dollar. A 10% adverse change in the underlying foreign currency exchange rates as of
March 31, 2019
, assuming no change in the composition of the foreign currency denominated assets, liabilities and payables and assuming no hedging activity, would result in no additional foreign currency gain or loss.
We entered into foreign currency hedging transactions during the
three months ended
March 31, 2019
as economic hedges to help mitigate a portion of our foreign exchange risk exposure and may enter into additional hedging transactions in the future to help mitigate our foreign exchange risk exposure. Although we may enter into additional hedging transactions in the future to help mitigate our foreign exchange risk exposure, these hedging arrangements may not be effective, particularly in the event of imprecise forecasts of the levels of our non-U.S. denominated assets and liabilities.
We have foreign currency translation risk equal to our net investment in our foreign subsidiaries. The financial statements of these subsidiaries are translated into U.S. dollars using a current rate of exchange, with gains or losses included in the cumulative translation adjustment account, a component of equity. Our exposure to the net investment in foreign currencies is presented by primary foreign currencies in the table below (in millions):
|
|
As of March 31, 2019
|
||||||||||
|
|
Position in
pounds sterling
|
|
Position in
Canadian dollars
|
Position in euros
|
|||||||
|
Assets
|
£
|
829
|
|
|
C$
|
1,792
|
|
€
|
151
|
|
|
|
of which goodwill represents
|
632
|
|
|
412
|
|
92
|
|
||||
|
Liabilities
|
81
|
|
|
1,380
|
|
49
|
|
||||
|
Net currency position
|
£
|
748
|
|
|
C$
|
412
|
|
€
|
102
|
|
|
|
Net currency position, in $USD
|
$
|
975
|
|
|
$
|
309
|
|
$
|
114
|
|
|
|
Negative impact on consolidated equity of a 10% decrease in foreign currency exchange rates
|
$
|
98
|
|
|
$
|
31
|
|
$
|
11
|
|
|
52
As of
March 31, 2019
and
December 31, 2018
, the portion of our equity attributable to accumulated other comprehensive loss from foreign currency translation was
$201 million
and
$227 million
, respectively. For the
three months ended
March 31, 2019
, currency exchange rate differences had a positive impact of
$26 million
on our consolidated equity. The increase for the
three months ended
March 31, 2019
is primarily due to the increase in the pound sterling/U.S. dollar exchange rate to 1.3046 as of
March 31, 2019
(from 1.2756 as of December 31, 2018) due to the strengthening of the pound sterling as compared to the U.S. dollar. The future impact on our business relating to the U.K. leaving the EU and the corresponding regulatory changes are uncertain at this time, including future impacts on currency exchange rates.
Credit Risk
We are exposed to credit risk in our operations in the event of a counterparty default. We limit our exposure to credit risk by rigorously selecting the counterparties with which we make our investments, monitoring them on an ongoing basis and executing agreements to protect our interests
.
Clearing House Cash Deposit Risks
The ICE Clearing Houses hold material amounts of clearing member cash deposits which are held or invested primarily to provide security of capital while minimizing credit, market and liquidity risks. Refer to Note 11 to our consolidated financial statements, which are included in this Quarterly Report, for more information on the ICE Clearing Houses' cash deposits, which were $
64.6 billion
as of
March 31, 2019
. While we seek to achieve a reasonable rate of return which may generate interest income for our clearing members, we are primarily concerned with preservation of capital and managing the risks associated with these deposits. As the ICE Clearing Houses may pass on interest revenues (minus costs) to the clearing members, this could include negative or reduced yield due to market conditions. For a summary of the risks associated with this investment activity and how these risks are mitigated, see Part II, Item 7(A) “Quantitative and Qualitative Disclosures About Market Risk” in our
2018
Form 10-K.
ITEM 4. CONTROLS AND PROCEDURES
(a)
Evaluation of Disclosure Controls and Procedures.
As of the end of the period covered by this report, an evaluation was carried out by our management, with the participation of our Chief Executive Officer and Chief Financial Officer, of the effectiveness of our disclosure controls and procedures (as defined in Rule 13a-15(e) under the Exchange Act). Based upon that evaluation, our Chief Executive Officer and Chief Financial Officer concluded that these disclosure controls and procedures were effective as of the end of the period covered by this report.
(b)
Changes in Internal Controls over Financial Reporting.
There were no changes in our internal controls over financial reporting that occurred during our most recent fiscal quarter that have materially affected, or are reasonably likely to materially affect, our internal controls over financial reporting. As a result, no corrective actions were taken.
PART II. Other Information
ITEM 1. LEGAL PROCEEDINGS
We are subject to legal proceedings, claims and investigations that arise in the ordinary course of our business. We establish accruals for those matters in circumstances when a loss contingency is considered probable and the related amount is reasonably estimable. Any such accruals may be adjusted as circumstances change. Assessments of losses are inherently subjective and involve unpredictable factors. We do not believe that the resolution of these legal matters will have a material adverse effect on our consolidated financial condition, results of operations or liquidity. It is possible, however, that future results of operations for any particular quarterly or annual period may be materially and adversely affected by any developments in legal proceedings, claims and investigations
.
See Part I, Item 3 “Legal Proceedings” in our
2018
Form 10-K and Note 12 to the consolidated financial statements and related notes, which are included in this Quarterly Report.
ITEM 1(A). RISK FACTORS
In the
first quarter
of
2019
, there were no significant new risk factors from those disclosed in Part 1, Item 1A, “Risk Factors” in our
2018
Form 10-K. In addition to the other information set forth in this Quarterly Report, including the information in the "- Regulation" section of Item 2 - Management’s Discussion and Analysis of Financial Condition and Results of Operations, you should carefully consider the factors discussed under “Risk Factors” and the regulation discussion under “Business - Regulation” in our
2018
Form 10-K. These risks could materially and adversely affect our business, financial
53
condition and results of operations. The risks and uncertainties in our
2018
Form 10-K are not the only ones facing us. Additional risks and uncertainties not presently known to us, or that we currently believe to be immaterial, may also adversely affect our business.
ITEM 2. UNREGISTERED SALES OF EQUITY SECURITIES AND USE OF PROCEEDS
Stock Repurchases
The table below sets forth the information with respect to purchases made by or on behalf of ICE or any “affiliated purchaser” (as defined in Rule 10b-18(a)(3) under the Exchange Act) of our common stock during the
three months ended
March 31, 2019
.
|
Period
(2019)
|
Total number of shares purchased
(in thousands)
|
Average price
paid per share
|
Total number of shares purchased as part of publicly announced plans or programs
(in thousands)
|
Approximate dollar value of shares that may yet be
purchased under the plans or programs
(in millions)
|
|
January 1 - January 31
|
1,570
|
$74.51
|
1,570
|
$1,883
|
|
February 1 - February 28
|
2,005
|
$75.88
|
3,575
|
$1,731
|
|
March 1 - March 31
|
2,296
|
$74.44
|
5,871
|
$1,560
|
|
Total
|
5,871
|
$74.95
|
5,871
|
$1,560
|
|
(1)
|
Refer to Note 9 to our consolidated financial statements and related notes, which are included elsewhere in this Quarterly Report, for details on our stock repurchase plans.
|
ITEM 3. DEFAULTS UPON SENIOR SECURITIES
None.
ITEM 4. MINE SAFETY DISCLOSURES
Not applicable.
ITEM 5. OTHER INFORMATION
Not applicable.
ITEM 6. EXHIBITS
|
Exhibit Number
|
|
Description of Document
|
|
31.1
|
—
|
|
|
31.2
|
—
|
|
|
32.1
|
—
|
|
|
32.2
|
—
|
|
|
101
|
—
|
The following materials from Intercontinental Exchange, Inc.’s Quarterly Report on Form 10-Q for the quarter ended March 31, 2019, formatted in XBRL (Extensible Business Reporting Language): (i) the Consolidated Balance Sheets, (ii) the Consolidated Statements of Income, (iii) the Consolidated Statements of Comprehensive Income, (iv) the Consolidated Statements of Changes in Equity, Accumulated Other Comprehensive Loss and Redeemable Non-Controlling Interest (v) Consolidated Statements of Cash Flows and (vi) Notes to Consolidated Financial Statements, tagged as blocks of text.*
|
54
|
*
|
As provided in Rule 406T of Regulation S-T, this information is “furnished” and not “filed” for purposes of Sections 11 and 12 of the Securities Act of 1933 and Section 18 of the Securities Exchange Act of 1934. Such exhibit will not be deemed to be incorporated by reference into any filing under the Securities Act of 1933 or the Securities Exchange Act of 1934 unless Intercontinental Exchange, Inc. specifically incorporates it by reference.
|
55
SIGNATURES
Pursuant to the requirements of Section 13 or 15(d) of the Securities Exchange Act of 1934, the Registrant has duly caused this Report to be signed on its behalf by the undersigned, thereunto duly authorized.
|
Intercontinental Exchange, Inc.
(Registrant)
|
|||
|
Date: May 2, 2019
|
By:
|
/s/ Scott A. Hill
|
|
|
Scott A. Hill
|
|||
|
Chief Financial Officer
|
|||
|
(Principal Financial Officer)
|
|||
56
TABLE OF CONTENTS
Part I. Financial StatementsItem 1. Consolidated Financial Statements (unaudited)Item 2. Management S Discussion and Analysis Of Financial Condition and Results Of OperationsItem 3. Quantitative and Qualitative Disclosures About Market RiskItem 4. Controls and ProceduresPart II. Other InformationItem 1. Legal ProceedingsItem 1(a). Risk FactorsItem 2. Unregistered Sales Of Equity Securities and Use Of ProceedsItem 3. Defaults Upon Senior SecuritiesItem 4. Mine Safety DisclosuresItem 5. Other InformationItem 6. Exhibits