UNITED STATES
SECURITIES AND EXCHANGE COMMISSION
Washington, D.C. 20549
FORM 20-F
(Mark One)
|
|
☐
|
REGISTRATION STATEMENT PURSUANT TO SECTION 12(b) OR (g) OF THE SECURITIES
|
|
|
EXCHANGE ACT OF 1934
|
OR
|
|
☒
|
ANNUAL REPORT PURSUANT TO SECTION 13 OR 15(d) OF THE SECURITIES EXCHANGE
|
|
|
ACT OF 1934
|
|
|
For the fiscal year ended December 31, 2014
|
OR
|
|
☐
|
TRANSITION REPORT PURSUANT TO SECTION 13 OR 15(d) OF THE SECURITIES EXCHANGE
|
|
|
ACT OF 1934
|
OR
|
|
☐
|
SHELL COMPANY REPORT PURSUANT TO SECTION 13 OR 15 (d) OF THE SECURITIES
|
|
|
EXCHANGE ACT OF 1934
|
|
|
Date of event requiring this shell company report
|
|
|
For the transition period from
to
.
|
Commission File Number: 001-13742
ISRAEL CHEMICALS LTD.
(Exact name of Registrant as specified in its charter)
N/A
(Translation of Registrant’s name into English)
Israel
(Jurisdiction of incorporation or organization)
Millennium Tower, 23 Aranha Street, P.O. Box 20245 Tel Aviv, 61202 Israel
(Address of principal executive offices)
(Name, Telephone, E-mail and/or Facsimile number and Address of Company Contact Person)
Securities registered or to be registered pursuant to Section 12(b) of the Act:
|
Title of each class
|
Name of each exchange on which registered
|
|
Ordinary Shares, par value NIS 1.00 per share
|
The New York Stock Exchange
|
Securities registered or to be registered pursuant to Section 12(g) of the Act:
None
Securities for which there is a reporting obligation pursuant to Section 15(d) of the Act:
None
Indicate the number of outstanding shares of each of the issuer’s classes of capital or common stock as of the close of the period covered by the annual report.
The number of outstanding shares as of December 31, 2014 was:
|
Title of Class
|
Number of Shares Outstanding
|
|
Ordinary shares
|
1,295,943,056
|
Indicate by check mark if the registrant is a well-known seasoned issuer, as defined in Rule 405 of the Securities Act.
Yes
☐
No
☒
If this report is an annual or transition report, indicate by check mark if the registrant is not required to file reports pursuant to Section 13 or 15(d) of the Securities Exchange Act of 1934.
Yes
☐
No
☒
Note
– Checking the box above will not relieve any registrant required to file reports pursuant to Section 13 or 15(d) of the Securities Exchange Act of 1934.
Indicate by check mark whether the registrant (1) has filed all reports required to be filed by Section 13 or 15(d) of the Securities Exchange Act of 1934 during the preceding 12 months (or for such shorter period that the registrant was required to file such reports), and (2) has been subject to such filing requirements for the past 90 days.
Yes
x
No
☐
Indicate by check mark whether the registrant has submitted electronically and posted on its corporate Web site, if any, every Interactive Data File required to be submitted and posted pursuant to Rule 405 of Regulation S-T (§232.405 of this chapter) during the preceding 12 months (or for such shorter period that the registrant was required to submit and post such files).
☐ Yes ☐ No
Indicate by check mark whether the registrant is a large accelerated filer, an accelerated filer, or a non-accelerated filer. See definition of “accelerated filer and large accelerated filer” in Rule 12b-2 of the Exchange Act. (Check one):
Large Accelerated Filer
☐
Accelerated Filer
☐
Non-accelerated Filer
☒
Indicate by check mark which basis of accounting the registrant has used to prepare the financial statements included in this filing:
☐
U.S. GAAP
☒
International
Financial
Reporting Standards as issued by the International Accounting Standards Board
☐
Other
If “Other” has been checked in response to the previous question, indicate by check mark which financial statement item the Registrant has elected to follow.
☐
Item 17
☐
Item 18
If this is an annual report, indicate by check mark whether the registrant is a shell company (as defined in Rule 12b-2 of the Exchange Act).
Yes
☐
No
☒
This Annual Report contains statements that constitute “forward looking statements,” many of which can be identified by the use of forward looking words such as “anticipate,” “believe,” “could,” “expect,” “should,” “plan,” “intend,” “estimate” and “potential,” among others.
Forward looking statements appear in a number of places in this Annual Report and include, but are not limited to, statements regarding our intent, belief or current expectations. Forward looking statements are based on our management’s beliefs and assumptions and on information currently available to our management. Such statements are subject to risks and uncertainties, and actual results may differ materially from those expressed or implied in the forward looking statements due to various factors, including, but not limited to, those identified in “Item 3. Key Information—D. Risk factors” in this Annual Report. These risks and uncertainties include factors relating to:
loss or impairment of business licenses or mining permits or concessions; natural disasters; failure to raise the water level in evaporation Pond 5 in the Dead Sea; accidents or disruptions at our seaport shipping facilities or regulatory restrictions affecting our ability to export our products overseas; labor disputes, slowdowns and strikes involving our employees; currency rate fluctuations; rising interest rates; general market, political or economic conditions in the countries in which we operate; pension and health insurance liabilities; price increases or shortages with respect to our principal raw materials; volatility of supply and demand and the impact of competition; changes to laws or regulations (including environmental protection and safety and tax laws or regulations), or the application or interpretation of such laws or regulations; government examinations or investigations; the difference between actual reserves and our reserve estimates; failure to integrate or realize expected benefits from acquisitions and joint ventures; volatility or crises in the financial markets; cyclicality of our businesses; changes in demand for our fertilizer products due to a decline in agricultural product prices, lack of available credit, weather conditions, government policies or other factors beyond our control; decreases in demand for bromine based products and other industrial products; litigation, arbitration and regulatory proceedings; closing of transactions, mergers and acquisitions; war or acts of terror; and other risk factors discussed under “Item 3. Key Information—D. Risk Factors.”
Forward looking statements speak only as of the date they are made, and we do not undertake any obligation to update them in light of new information or future developments or to release publicly any revisions to these statements in order to reflect later events or circumstances or to reflect the occurrence of unanticipated events.
This Annual Report contains forward-looking statements that involve risks and uncertainties. Our actual results may differ significantly from future results as a result of factors such as those set forth in “Item 3. Key Information—D. Risk Factors” and “Item 5. Operating and Financial Review and Prospects.”
The financial information included in this Annual Report have been prepared in accordance with the international financial reporting standards (“IFRS”), as issued by the International Accounting Standards Board (“IASB”). None of the financial information in this Annual Report has been prepared in accordance with accounting principles generally accepted in the United States.
This Annual Report contains translations of certain NIS amounts into U.S. dollars at specified rates solely for your convenience. These translations should not be construed as representations by us that the NIS amounts actually represent such U.S. dollar amounts or could, at this time, be converted into U.S. dollars at the rate indicated. Unless otherwise indicated, we have translated NIS amounts as at December 31, 2014, into U.S. dollars at an exchange rate of NIS 3.889 to $1.00, the daily representative exchange rate reported by the Bank of Israel for December 31, 2014, and euro amounts into U.S. dollars at an exchange rate of €1.215 to $1.00, the noon buying rate in New York for cable transfers payable in euros as reported by the U.S. Board of Governors of the Federal Reserve System for December 31, 2014.
Market data and certain industry data used in this Annual Report were obtained from internal reports and studies, where appropriate, as well as estimates, market research, publicly available information and industry publications, including publications, reports or releases of the [International Monetary Fund (“IMF”), the U.S. Census Bureau, the Food and Agriculture Organization of the United Nations (“FAO”), the International Fertilizers Association (“IFA”), the United States Department of Agriculture (the “USDA”) and the United States Geological Survey. Industry publications generally state that the information they include has been obtained from sources believed to be reliable, but that the accuracy and completeness of such information is not guaranteed. Similarly, internal reports and studies, estimates and market research, which we believe to be reliable and accurately extracted by us for use in this Annual Report, have not been independently verified. However, we believe such data is accurate. There is only a limited amount of independent data available about certain aspects of our industry, market and competitive position. As a result, certain data and information about our market rankings in certain product areas are based on our good faith estimates, which are derived from our review of internal data and information, information that we obtain from customers, and other third party sources. We believe these internal surveys and management estimates are reliable; however, no independent sources have verified such surveys and estimates.
In presenting and discussing our financial position, operating results and cash flows, management uses certain non-IFRS financial measures. These non-IFRS financial measures should not be viewed in isolation or as alternatives to the equivalent IFRS measures and should be used in conjunction with the most directly comparable IFRS measures. A discussion of non-IFRS measures included in this Annual Report and a reconciliation of such measures to the most directly comparable IFRS measures are contained in this Annual Report under “Item 3. Key Information—A. Selected Financial Data.”
In this Annual Report, unless otherwise indicated or the context otherwise requires, all references to “ICL,” the “Group,” the “Company,” “we,” “our,” “ours,” “us” or similar terms refer to Israel Chemicals Ltd., together with its consolidated subsidiaries. When we refer to our “parent company” or to “Israel Corporation,” we refer to our controlling shareholder, Israel Corporation. Unless otherwise indicated or the context otherwise requires, references in this Annual Report to “NIS” are to the legal currency of Israel, “U.S. dollars,” “$” or “dollars” are to United States dollars, “euro” or “€” are to the Euro, the legal currency of certain countries of the European Union, and “British pound” or “£” are to the legal currency of the United Kingdom. See “Item 4. Information on the Company—A. History and development of the company.” We own or have rights to trademarks or trade names that we use in conjunction with the operation of our business. Solely for convenience, trademarks and trade names referred to in this Annual Report may appear without the ® or ™ symbols, but such references are not intended to indicate, in any way, that we will not assert, to the fullest extent of the law, our rights or the rights of the applicable licensor to these trademarks and trade names. In this Annual Report, we also refer to product names, trademarks, and trade names that are the property of other companies. Each of the trademarks and trade names of other companies appearing in this Annual Report belongs to its owners. Our use or display of other companies’ product names, trademarks, or trade names is not intended to and does not imply a relationship with, or endorsement or sponsorship by us of, the product, trademark, or trade name owner, unless we otherwise indicate.
The following is a glossary of selected terms used in this Annual Report.
|
Bromine
|
A chemical element used as a basis for a wide variety of uses and compounds, and mainly as a component in flame retardants or fire prevention substances. Unless otherwise stated, the term “bromine” refers to elemental bromine.
|
|
CFR
|
Cost and freight. In a CFR transaction, the prices of goods to the customer includes, in addition to FOB expenses, marine shipping costs and all other costs that arise after the goods leave the seller’s factory gates and up to the destination port.
|
|
Cleveland Potash
|
Cleveland Potash Ltd., a United Kingdom company included in our Fertilizers segment.
|
|
CPI
|
The Consumer Price Index, as published by the Israeli Central Bureau of Statistics.
|
|
Dead Sea Bromine Company
|
Dead Sea Bromine Company Ltd., included in our Industrial Products segment.
|
|
Dead Sea Magnesium
|
Dead Sea Magnesium Ltd.
|
|
Dead Sea Works
|
Dead Sea Works Ltd., included in our Fertilizers segment.
|
|
EPA
|
U.S. Environmental Protection Agency.
|
|
FAO
|
The Food and Agriculture Organization of the United Nations, an international food organization.
|
|
FOB
|
Free on board expenses are expenses for overland transportation, loading costs and other costs, up to and including the port of origin. In an FOB transaction, the seller pays the FOB expenses and the buyer pays the other costs from the port of origin onwards.
|
|
Iberpotash
|
Iberpotash S.A., a Spanish company included in our Fertilizers segment.
|
|
IFA
|
The International Fertilizers Association, an international association of fertilizers manufacturers.
|
|
ILA
|
Israel Lands Administration.
|
|
IMF
|
International Monetary Fund.
|
|
K
|
The element potassium, one of the three main plant nutrients.
|
|
N
|
The element nitrogen, one of the three main plant nutrients.
|
|
NYSE
|
The New York Stock Exchange.
|
|
P
|
The element phosphorus, one of the three main plant nutrients, which is also used as a raw material in industry.
|
|
PCS
|
Potash Corporation of Saskatchewan Inc., a Canadian company with the world’s largest potash production capacity, which owns 13.84% of our outstanding ordinary shares.
|
|
Phosphate
|
Phosphate rock that contains the element phosphorus. Its concentration is measured in units of P2O5.
|
|
Polymer
|
A chemical compound containing a long chain of repeating units linked by a chemical bond and created by polymerization.
|
|
Polyhalite
|
A mineral whose commercial name is polysulphate, composed of potash, sulfur, calcium, and magnesium, used in its natural form as fertilizer for organic agriculture.
|
|
Potash
|
Potassium chloride (KCl), used as a plant’s main source of potassium.
|
|
REACH
|
Registration, Evaluation and Authorization of Chemicals, a framework within the European Union.
|
|
Rotem
|
Rotem Amfert Negev Ltd., included in our Fertilizers segment.
|
|
Salt
|
Unless otherwise specified, sodium chloride (NaCl).
|
|
Soluble NPK
|
Soluble fertilizer containing the three basic elements for plant development (nitrogen, phosphorus and potash).
|
|
Tami
|
Tami (IMI) Research and Development Institute Ltd., the central research institute of ICL, included in our Industrial Products segment.
|
|
TASE
|
Tel Aviv Stock Exchange, Ltd.
|
|
USDA
|
United States Department of Agriculture.
|
Not Applicable.
Not Applicable.
A. SELECTED FINANCIAL DATA
We have derived the consolidated income statement data and the consolidated balance sheets data for the years ended, and as of, December 31, 2010 (audited only in accordance with generally accepted auditing standards in Israel), 2011, 2012, 2013 and 2014 from our audited consolidated financial statements which have been prepared in accordance with IFRS, as issued by the IASB. You should read the consolidated financial data set forth below in conjunction with our consolidated financial statements and related notes and the information under “Item 5. Operating and Financial Review and Prospects”, appearing elsewhere in this Annual Report in Form 20-F. Our reporting currency is the U.S. dollar. Our historical results are not necessarily indicative of our results to be expected in any future period.
|
For the Years Ended December 31,
|
||||||||||||||||||||
|
2014
|
2013
|
2012
|
2011
|
2010
|
||||||||||||||||
|
(in thousands of U.S. dollars, except for share data)
|
||||||||||||||||||||
|
Sales
|
6,110,710 | 6,271,542 | 6,471,433 | 6,868,550 | 5,571,976 | |||||||||||||||
|
Cost of sales
|
3,914,573 | 3,861,572 | 3,760,235 | 3,767,962 | 3,185,609 | |||||||||||||||
|
Gross profit
|
2,196,137 | 2,409,970 | 2,711,198 | 3,100,588 | 2,386,367 | |||||||||||||||
|
Selling, transportation and marketing expenses
|
839,207 | 850,325 | 797,291 | 861,976 | 774,147 | |||||||||||||||
|
General and administrative expenses
|
305,526 | 281,491 | 248,782 | 265,142 | 235,095 | |||||||||||||||
|
Research and development expenses, net
|
86,943 | 82,870 | 74,099 | 70,126 | 61,948 | |||||||||||||||
|
Other expenses
|
259,336 | 110,194 | 61,085 | 29,929 | 7,741 | |||||||||||||||
|
Other income
|
(52,545 | ) | (16,276 | ) | (23,691 | ) | (4,660 | ) | (11,218 | ) | ||||||||||
|
Operating income
|
757,670 | 1,101,366 | 1,553,632 | 1,878,075 | 1,318,654 | |||||||||||||||
|
Finance expenses, net
|
155,948 | 26,855 | 60,894 | 77,812 | 60,187 | |||||||||||||||
|
Share in earnings of equity accounted investees
|
30,532 | 25,685 | 26,555 | 34,265 | 31,729 | |||||||||||||||
|
Income before income taxes
|
632,254 | 1,100,196 | 1,519,293 | 1,834,528 | 1,290,196 | |||||||||||||||
|
Income taxes
|
166,152 | 280,023 | 217,561 | 333,470 | 261,579 | |||||||||||||||
|
Net income attributable to the shareholders of the Company
|
463,555 | 818,573 | 1,300,076 | 1,498,151 | 1,024,740 | |||||||||||||||
|
Net income attributable to non-controlling interests
|
2,547 | 1,600 | 1,656 | 2,907 | 3,877 | |||||||||||||||
|
Earnings per share:
|
||||||||||||||||||||
|
Basic earnings per share
|
0.365 | 0.644 | 1.024 | 1.182 | 0.810 | |||||||||||||||
|
Diluted earnings per share
|
0.365 | 0.644 | 1.024 | 1.177 | 0.806 | |||||||||||||||
|
Weighted average number of ordinary shares outstanding:
|
||||||||||||||||||||
|
Basic
|
1,270,426 | 1,270,414 | 1,270,009 | 1,267,699 | 1,264,425 | |||||||||||||||
|
Diluted
|
1,270,458 | 1,270,414 | 1,270,117 | 1,272,945 | 1,271,598 | |||||||||||||||
|
Cash Flow Data:
|
||||||||||||||||||||
|
Net cash provided by operating activities
|
894,682 | 1,126,909 | 1,727,218 | 1,358,744 | 1,565,958 | |||||||||||||||
|
Net cash used in investing activities
|
(996,104 | ) | (839,332 | ) | (740,709 | ) | (625,529 | ) | (679,052 | ) | ||||||||||
|
Net cash provided by (used in) financing activities
|
67,924 | (309,990 | ) | (1,018,624 | ) | (833,666 | ) | (725,088 | ) | |||||||||||
|
As of December 31,
|
||||||||||||||||||||
|
2014
|
2013
|
2012
|
2011
|
2010
|
||||||||||||||||
|
US$ thousands
|
||||||||||||||||||||
|
Balance Sheet Data:
|
||||||||||||||||||||
|
Cash and cash equivalents
|
130,831 | 188,340 | 206,067 | 238,141 | 354,654 | |||||||||||||||
|
Property, plant and equipment
|
3,926,873 | 3,686,240 | 3,097,385 | 2,615,420 | 2,182,647 | |||||||||||||||
|
Total assets
|
8,347,588 | 7,973,485 | 7,344,911 | 6,963,674 | 6,184,818 | |||||||||||||||
|
Short-term credit and current portion of long- term debt
|
602,749 | 718,284 | 552,062 | 361,578 | 47,804 | |||||||||||||||
|
Long-term debt
|
1,239,494 | 1,243,638 | 916,594 | 847,006 | 844,168 | |||||||||||||||
|
Debentures
|
1,064,222 | 67,000 | 228,708 | 485,470 | 528,728 | |||||||||||||||
|
Total equity
|
3,000,226 | 3,678,674 | 3,388,264 | 3,090,251 | 2,644,390 | |||||||||||||||
The table below reconciles Adjusted EBITDA to the IFRS measure, income to Company shareholders:
|
Year Ended December 31,
|
||||||||||||||||||||
|
2014
|
2013
|
2012
|
2011
|
2010
|
||||||||||||||||
|
US$ millions
|
||||||||||||||||||||
|
Income from ordinary activities
|
464 | 819 | 1,300 | 1,498 | 1,025 | |||||||||||||||
|
Depreciation and amortization
|
356 | 338 | 323 | 316 | 254 | |||||||||||||||
|
Finance expenses, net
|
156 | 27 | 61 | 78 | 60 | |||||||||||||||
|
Taxes on income
|
166 | 280 | 218 | 333 | 262 | |||||||||||||||
|
Unusual items, net *
|
202 | 95 | 44 | — | 10 | |||||||||||||||
|
Adjusted EBITDA **
|
1,344 | 1,559 | 1,946 | 2,225 | 1,611 | |||||||||||||||
|
(*)
|
Unusual expenses in 2014 include approximately $149 million in respect of a provision relating to prior periods due to the arbitration award in the Royalties Arbitration, approximately $71 million impairment of assets in subsidiaries in the United States and Europe, gain of approximately $36 million from entry into consolidation in respect of conclusion of acquisition of all the shares of Fosbrasil, a loss of approximately $17 million due to a strike in ICL Rotem, and other expenses in the amount of approximately $1 million. Unusual expenses in 2013 include $60 million of early retirement expense at our Rotem subsidiary in Israel, a $25 million increase in the provision for waste removal and a $10 million asset write down in our Industrial Products segment. Unusual expenses in 2012 include $33 million of early retirement expense at Rotem and $22 million of early retirement expense in our Industrial Products segment, offset by $11 million of unusual income due to a VAT refund. Unusual expenses in 2010 include an expense relating to a malfunction at our sulfuric acid plant.
|
|
(**)
|
We disclose in this Annual Report a financial measure titled Adjusted EBITDA. We use Adjusted EBITDA to facilitate operating performance comparisons from period to period. Adjusted EBITDA is defined as our income to Company shareholders plus depreciation and amortization plus financing expenses, net and taxes on income plus items we view as unusual expenses/income.
|
We believe Adjusted EBITDA facilitates company to company operating performance comparisons by backing out potential differences caused by variations such as capital structures (affecting financing expenses, net), taxation (affecting taxes on income) and the age and book depreciation of facilities and equipment (affecting relative depreciation and amortization), which may vary for different companies for reasons unrelated to operating performance. Adjusted EBITDA is a non IFRS measure for reporting our total Company performance. Our management believes, however, that disclosure of Adjusted EBITDA provides useful information to investors, financial analysts and the public in their evaluation of our operating performance. Adjusted EBITDA should not be considered as the sole measure of our performance and should not be considered in isolation from, or as a substitute f
or, operating income or other statement of operations or cash flow data prepared in accordance with IFRS as a measure of our profitability or liquidity. Adjusted EBITDA does not take into account our debt service requirements and other commitments, including capital expenditures, and, accordingly, is not necessarily indicative of amounts that may be available for discretionary uses. In addition, Adjusted EBITDA, as presented in this Annual Report, may not be comparable to similarly titled measures reported by other companies due to differences in the way that these measures are calculated.
The following table reconciles Adjusted EBITDA for the year ended December 31, 2014 for each of our operating segments to operating income, which is the most similar IFRS measure:
|
Fertilizers
|
Industrial Products
|
Performance Products
|
Other
|
Eliminations(a)
|
||||||||||||||||
|
US$ thousands
|
||||||||||||||||||||
|
Income from ordinary activities
|
670,085 | (62,281 | ) | 197,300 | (9,367 | ) | (10,082 | ) | ||||||||||||
|
Depreciation and amortization
|
225,210 | 73,992 | 48,848 | 6,574 | 1,854 | |||||||||||||||
|
Unusual items, net
|
16,700 | 190,000 | (5,000 | ) | - | - | ||||||||||||||
|
Adjusted EBITDA
|
911,995 | 201,711 | 241,148 | (2,793 | ) | (8,228 | ) | |||||||||||||
|
(a)
|
Represents elimination of intercompany transactions, and share in earnings of equity accounted investees.
|
The following table sets forth, for the periods indicated, the high, low, average and period end exchange rates for the purchase of U.S. dollars expressed in New Israeli Shekels` per U.S. dollar. The average rate is calculated by using the average of Bank of Israel’s reported exchange rates on each day during a monthly period and on the last day of each month during an annual or interim period. As of March 18, 2015 the exchange rate for the purchase of U.S. dollars as reported by Bank of Israel was NIS 4.02 per U.S. dollar.
|
Period end
|
Average for period
|
Low
|
High
|
|||||||||||||
|
(New Israeli Shekel per U.S. dollar)
|
||||||||||||||||
|
NIS $
|
||||||||||||||||
|
Year Ended December 31:
|
||||||||||||||||
|
2010
|
3.55 | 3.73 | 3.55 | 3.89 | ||||||||||||
|
2011
|
3.82 | 3.58 | 3.36 | 3.82 | ||||||||||||
|
2012
|
3.73 | 3.86 | 3.70 | 4.08 | ||||||||||||
|
2013
|
3.47 | 3.61 | 3.47 | 3.79 | ||||||||||||
|
2014
|
3.89 | 3.58 | 3.40 | 3.99 | ||||||||||||
|
Month Ended:
|
||||||||||||||||
|
September 30, 2014
|
3.70 | 3.63 | 3.58 | 3.70 | ||||||||||||
|
October 31, 2014
|
3.78 | 3.74 | 3.64 | 3.79 | ||||||||||||
|
November 30, 2014
|
3.89 | 3.83 | 3.78 | 3.89 | ||||||||||||
|
December 31, 2014
|
3.89 | 3.93 | 3.89 | 3.99 | ||||||||||||
|
January 31, 2015
|
3.92 | 3.95 | 3.90 | 4.00 | ||||||||||||
|
February 28, 2015
|
3. 97 | 3.89 | 3.84 | 3.97 | ||||||||||||
|
March 18, 2015
|
4.02 | 4.01 | 3.98 | 4.05 | ||||||||||||
Not Applicable.
C. REASONS FOR THE OFFER AND USE OF PROCEEDS
Not Applicable.
D. RISK FACTORS
Our business, financial condition and results of operations could be materially and adversely affected if any of the risks described below occur. As a result, the market price of our ordinary shares could decline, and you could lose all or part of your investment. This Annual Report also contains forward looking statements that involve risks and uncertainties. See “Special Note Regarding Forward Looking Statements.” Our actual results could differ materially and adversely from those anticipated in these forward looking statements as a result of certain factors, including the risks facing our Company and/or investments in the Middle East and Europe described below and elsewhere in this Annual Report (including factors noted in the paragraph Forward Looking statements).
Risks Related to Our Business
Our mining operations are dependent on concessions, licenses and permits granted to us by the respective governments in the countries where they are located.
Our mining business depends on concessions granted to us by the respective governments in the countries in which our mining operations are located. Loss or impairment of these concessions could materially and adversely affect our business, financial condition and results of operations.
We extract potash and salt in Israel, Spain and the United Kingdom and bromine, magnesium and certain other minerals in Israel pursuant to concessions and licenses in those countries. In Israel, the concession granted by the government to utilize the resources of the Dead Sea ends on March 31, 2030. As consideration, we pay royalties to the Israeli government. In Spain, the government granted our Fertilizers segment mining rights based on legislation from 1973. Some of these licenses are valid until 2037 and the rest are valid until 2067. In exchange for these licenses, we pay royalties to the Spanish government. In the United Kingdom Government, the mining concessions of Cleveland Potash are based on approximately 114 mining leases and concessions for extracting various minerals, in addition to numerous easements and rights of way from private land owners and rights to mine in the North Sea granted by the United Kingdom. The terms of all of these leases, concessions, easements and rights of way extend for periods ranging from 2015 to 2038. See “Item 4 Information on the Company—D. Property, Plants and Equipment—Concessions and Mining Rights.”
Furthermore, we mine phosphate rock from phosphate deposits in the Negev Desert in accordance with three concessions from the State of Israel that are valid up to the end of 2021. In exchange for these concessions, we are required to pay royalties to the Israeli government. For additional information on the concessions, see “Item 4. Information on the Company—D. Property, Plants and Equipment—Concessions and Mining Rights.”
In addition to our existing phosphate mines in the Negev Desert, which we estimate have up to approximately eight years of remaining reserve life for phosphate rock designated for phosphoric acid production, our plan for mining phosphates in Barir field (South Zohar) in the Negev Desert is in the planning approval stages, and it has not yet been decided whether to file the plan with the competent authorities. Residents of the surrounding towns and villages and the Bedouin settlement in the area have objected to the filing of the plan and continuation of the related planning stages, due to the fear of environmental and health dangers they contend will be caused as a result of operation of the mine. While we believe that the mining activities in Barir field do not involve any risks to the environment or to people, others may reach contrary conclusions. After an expert appointed by the Israeli Ministry of the Prime Minister expressed his opinion that there is no health hazard in the Barir field, the Israeli Ministry of Health appointed an expert on its behalf to examine the matter before the Israeli Ministry of Health formulates an opinion. On April 3, 2014, we learned that the Israeli Ministry of Health had received the opinion of its expert and, after reading the opinion, the Israeli Ministry of Health decided to oppose mining, including exploratory mining, in the Barir field. We disagree with the Israeli Ministry of Health’s interpretation of this opinion. Based on our understanding of this opinion, we believe this opinion does not contradict our position that the mining activities in Barir field do not involve any risks to the environment or to people. On December 2, 2014, the Head of the Planning Administration in the Ministry of the Interior brought up for discussion by the Planning and Building Council a proposal for advancement of the mining plan in the Barir field by the Administration's authorities. A discussion was held however a decision regarding the matter has not yet been made. The residents of nearby towns are continuing to object to advancement of the mining plan and even to mining tests. Non-receipt of approval to mine in the Barir field will significantly harm our future mining reserves in the medium and long term. If we fail to receive such approval and cannot find alternative sources of phosphates, our business, financial condition and results of operations may be materially and adversely affected. For information on a strategic partnership agreement with Yunnan Yuntianhua, the second largest chemicals manufacturer in China and the third largest phosphates manufacturer in the world, concerning the operation of a joint venture (50/50) controlled by us of a phosphates operation with full vertical integration, including a world-scale phosphate mine and the manufacture of downstream products, see ”Item 4. Information on the Company—B. Business Overview—Fertilizers.”
Our ability to operate and/or expand our production and operating facilities is dependent on our receipt of, and compliance with, permits issued by governmental authorities, including authorities in Israel, Spain and the United Kingdom. A decision by a government authority to deny any of our permits applications may impair our business and operations.
In addition, existing permits are subject to challenges with respect to their validity, revocation, modification and non-renewal. Any successful challenges with respect to the validity of our permits or the revocation, modification or non-renewal of our permits could materially adversely impact our operations and financial condition. In addition, a failure to comply with the terms of our permits could result in payment of substantial fines and subject us to criminal sanctions.
The locations of some of our mines and facilities expose us to various natural disasters.
We are exposed to natural disasters, such as flooding and earthquakes, that may cause material damage to our business.
In Israel, some of our plants are located on the African Syrian Rift, a seismically active area. Furthermore, in recent years sinkholes and underground cavities have been discovered in the area of the Dead Sea, which could cause harm to our plants. In the area of Sodom, where many of our plants are located, there are occasional flash floods in the stream beds. While we have insurance coverage that covers these types of damage, subject to payment of deductibles, the insurance may not be sufficient to cover all of these damages.
In addition, we have underground mines in the United Kingdom and Spain. Water leakages into these mines might cause disruptions to mining or loss of the mine. We do not have property insurance for the underground property of our mine in the United Kingdom.
The accumulation of salt at the bottom of Pond 5, the central evaporation pond in our solar evaporation pond system used to extract minerals from the Dead Sea, requires the water level of the pond to be constantly raised in order to maintain the production capacity of our fertilizers.
As part of the evaporation process, salt in Pond 5 at the Dead Sea (which is the main evaporation pond in our system of solar ponds) is sinking at the rate of about 20 million tons per year. Sinking of the salt causes a reduction of the brine volume in the pond. Our production process requires that a fixed brine volume be preserved in the pond. For this purpose, the water level of the pond is raised by approximately 20 centimeters annually. Failure to raise the water level by this amount will cause a reduction in our production capacity. However, raising the water level of the pond above a certain level may cause structural damage to the foundations and the hotel buildings situated close to the water’s edge and to other infrastructure on the western shoreline of Pond 5.
The Company is currently working with the Israeli government to develop various temporary defenses and a permanent solution, which consists of full harvesting of the salt in such a manner that raising the water level in Pond 5 will not be necessary after completion of the harvesting. The temporary defenses are supposed to provide protection pending the implementation of a permanent solution, which is supposed to provide protection until the end of the current concession period in 2030.
According to the Dead Sea Protection Company, the total cost of the salt harvesting was estimated, as at October 2010, in a nominal amount of about NIS 7 billion (a discounted amount of about NIS 3.8 billion). The government will bear 20% of the cost of the salt harvesting, however not more than the discounted amount (20% of NIS 3.8 billion – discounted amount). The government’s maximum commitment is linked to the CPI and bears interest at the rate of 7%. See “Item 4. Information on the Company—D. Property, Plant and Equipment —Mineral Extraction and Mining Operations” for more information about these temporary defenses and the proposed permanent solution. There is no assurance that the temporary defenses or the permanent solution will be fully implemented or, if implemented, that they will prevent damage to the surrounding infrastructure or our operations at Pond 5. The failure to develop a solution or any such damage could materially and adversely affect our business, financial condition and results of operations.
A new pumping station will be required due to the receding water level in the Northern Basin of the
Dead Sea.
As part of our production process in Israel, we pump water from the Dead Sea through a special pumping station and deliver it to the salt and carnallite ponds. Due to the receding water level in the northern basin of the Dead Sea, the water line is receding from the current pumping station and construction of a new pumping station is necessary. Construction of the new station depends on, among other things, receipt of statutory approvals. We have set up a designated team to advance the required processes and to monitor the various developments that could impact receipt of the statutory approvals. A failure to construct the new pumping station on time may impair our ability to pump the required amount of raw material from the Dead Sea.
In addition, as the water level of the northern basin of the Dead Sea recedes, we may be pressured to reduce our usage of minerals from the Dead Sea, which could have a material and adverse impact on our business, financial condition and results of operations.
Any disruption in the transportation services we use to ship our products could have a material effect on our business, financial condition and results of operations.
Approximately one half of our net sales are sales of bulk products characterized by large quantities. Most of this production quantity is shipped from two seaports in Israel from dedicated facilities. It is not possible to ship large quantities in bulk from other facilities. Any significant disruption with regard to the seaport facilities, including due to strikes by port workers or regulatory restrictions, could delay or prevent exports of our products to our customers overseas, which could materially and adversely affect our business, financial condition and results of operations.
As a multinational company, we are exposed to fluctuations in the currency exchange rates.
Our multinational activities expose us to the impact of currency exchange rate fluctuations. Our financial statements are prepared in U.S. dollars. Our sales are made in a variety of currencies, primarily in U.S. dollars and euros. The portion of our sales made in currencies other than the U.S. dollar exposes us to fluctuations in the exchange rates of these currencies against the U.S. dollar. The functional currency of most of our foreign subsidiaries outside Israel and the United States is the local currency; therefore, revenues and expenses of these companies in the local non U.S. dollar currency do not represent exposure. On the other hand, revenues and expenses of these companies denominated in U.S. dollars expose these companies to fluctuations in currency exchange rates of the U.S. dollar against their functional currencies.
A portion of our expenses in Israel is incurred and paid in NIS. Therefore, we are exposed to strengthening of the currency exchange rate of the NIS relative to the U.S. dollar (i.e., an appreciation of the NIS). Our strategy is to partially hedge against the exposure described above according to market conditions and projections regarding developments in the currency exchange rates. See “Item 11. Quantitative and Qualitative Disclosures About Market Risk—Exchange Rate Risk.”
Because some of our liabilities bear interest at variable rates, we are subject to the risk of interest
rate increases.
A portion of our liabilities bear interest at variable rates. We are exposed to the cash flow risk stemming from an increase in interest rates, which would increase our financing expenses and adversely affect our results. See “Item 11. Quantitative and Qualitative Disclosures About Market Risk—Interest Rate Risk.”
We are subject to risks associated with our international sales and operations, which could negatively affect our sales to customers in foreign countries as well as our operations and assets in foreign countries. Some of these factors may also make it less attractive to distribute cash generated by our operations outside Israel to our shareholders, to use cash generated by our operations in one country to fund our operations or repayments of indebtedness in another country and to support other corporate purposes.
In 2014, we derived approximately 95% of our sales from customers located outside Israel. As a result, we are subject to numerous risks and uncertainties relating to international sales and operations, including:
|
|
·
|
Difficulties and costs associated with complying with a wide variety of complex laws, treaties and regulations, including the U.S. Foreign Corrupt Practices Act, the U.K. Bribery Act of 2010 and Section 291A of the Israeli Penal Law;
|
|
|
·
|
Unexpected changes in regulatory environments;
|
|
|
·
|
Increased government ownership and regulation of the economy in the countries in which we operate;
|
|
|
·
|
Political and economic instability, including potential civil unrest, inflation and adverse economic conditions resulting from governmental attempts to reduce inflation, such as imposition of higher interest rates and wage and price controls; and
|
|
|
·
|
The imposition of tariffs, exchange controls, trade barriers or other restrictions.
|
The occurrence of any of the above in the countries in which we operate or elsewhere could jeopardize or limit our ability to transact business there and could adversely affect our revenue and operating results and the value of our assets located outside Israel.
In addition, tax regulations, currency exchange controls and other restrictions may also make it economically unattractive to utilize cash generated by our operations in one country to fund our operations or repayments of indebtedness in another country or to support other corporate purposes.
Some of our employees have pension and health insurance arrangements that are our responsibility.
Some of our employees in Israel and overseas have pension and health insurance arrangements that are our responsibility. Against some of these liabilities, we have monetary reserves that are invested in financial assets. See Note 21 to our audited financial statements for information about our employee benefits liabilities and composition of plan assets. Changes in life expectancy, changes in the capital market or changes in other parameters by which undertakings to employees and retirees are calculated, and statutory amendments could increase our net liability for these arrangements.
We could be adversely affected by price increases or shortages with respect to our principal raw materials.
We use water, energy and various raw materials as inputs and we could be affected by higher costs or shortages of these materials.
Our phosphate facilities use large quantities of water purchased from the Mekorot Company, Israel’s national water company, at prices set by the government. If these prices rise significantly, our costs will rise as well. In our plants in Sodom, we obtain water from an independent system that is not part of the national water system. A shortage of water in the water sources in proximity to the plants would force our Fertilizers segment to seek water sources located further away at a higher cost.
Our plants consume large amounts of energy. Furthermore, energy is a significant component of the shipping costs of a considerable share of our products. Significant price increases for energy, or energy shortages, would affect shipping costs, production costs and/or quantities. The production processes and facilities at our magnesium plant require a continuous supply of electricity. While our magnesium plant has two power supply sources — our power station in Sodom and the national electricity network in Israel — there is a risk of damage to the power supply from these two sources simultaneously. Prolonged damage to the regular supply of electricity may damage the plants and the environment. In addition, the current supply of gas to our subsidiaries in Israel is dependent on a single supplier and also on a single gas pipeline with limited transmission capacity. While our plants are prepared for the use of alternative energy (crude oil and/or diesel fuel), an increase in our energy costs, or energy shortages could materially and adversely affect our business, financial condition and results of operations.
In addition, an increase in price or shortage of raw materials, such as sulfur (which we purchase from a third party) could reduce our margins and adversely impact our results of operations and our business.
We can provide no assurance that we will be able to pass on increased costs relating to water, energy or other raw materials, such as sulfur, that are supplied from third parties. Our inability to efficiently and effectively pass on
cost increases could adversely affect our margins. In addition, shortages in our principal raw materials may disrupt production and adversely affect the performance of our business.
The construction of a canal connecting the Red Sea to the Dead Sea could negatively impact the production of our plants.
The World Bank drafted a detailed report evaluating the feasibility of a canal from the Red Sea to the Dead Sea in order to address the receding water level of the northern basin of the Dead Sea. Following the aforesaid report, Israel, the Palestinian Authority and Jordan have signed an agreement in principle to implement stage A of the project, involving construction of a pipeline from the Red Sea. The targets underlying the World Bank’s report on the construction of the canal are desalination of water for countries in the region (mainly Jordan), stabilization of the level of the Dead Sea and contribution to regional peace. Such a canal would likely change the composition of the Dead Sea, which could negatively impact the production of our plants.
A detailed agreement was recently signed by Israel and Jordan, triggering the first stage of the Sea Canal. The project includes construction of a desalination plant in Aqaba and transportation of the desalinated water to Jordan and to Israel. The brine will be pumped to the Dead Sea. Under the agreement, water exchanges will take place, and the Jordanians and the Palestinians will be able to receive water from Israel. The facility will initially pump 200 million cubic meters a year from the Red Sea. Eighty million cubic meters will be transformed into potable water and the remaining 120 million cubic meters will be pumped into the Dead Sea. The 180 km long pipeline will be laid in Jordanian territory. Based on the evaluation performed by the World Bank, pumping up to 400 million cubic meters into the Dead Sea will have no adverse environmental effects, as no layering effect will be caused, and the water will evaporate and/or mix with the water of the Dead Sea. For this reason it appears that pumping on such a scale will similarly create no significant damage to our plants, especially since only 100-120 million cubic meters will be pumped in one pipeline in the first stage of the project, although the actual impacts may be different.
We are subject to the risk of labor disputes, slowdowns and strikes.
From time to time we experience labor disputes, slowdowns and strikes. For example, on February 2, 2015, the Workers Council of Bromine Compounds Ltd. of ICL’s industrial Products segment initiated a strike at the Bromine Compounds plants in Naot Hovav, and stopped goods’ shipments from the plants. The strike is response to the efficiency programs the Company is currently executing in Naot Hovav. Following this, on February 19, 2015, the Workers Council of DSW announced a general strike of DSW plants in Sodom. For information on implementation of the efficiency programs and the strikes that were initiated in response see “Item 6. Directors, Senior Management and Employees—D. Employees.”
Most of our employees are subject to collective bargaining agreements. Lengthy slowdowns or strikes at any of our plants could disrupt production and cause the non-delivery of products that had already been ordered, and it takes time to return to full capacity production in all facilities. Furthermore, due to the mutual dependency between ICL plants, labor disputes or a strike in any ICL plant may affect the manufacturing capacity and/or manufacturing costs of other ICL plants. If labor disputes, slowdowns or strikes occur, we could incur significant shutdown and related costs, which could adversely impact our operating results and affect our ability to fully implement future operational changes for efficiency purposes.
Our operations and sales are subject to the volatility of market supply and demand and we face significant competition from some of the world’s largest chemical and mining companies.
In addition to seasonal and cyclical variations (mainly in our Fertilizers segment), some of our businesses are characterized by fluctuations caused, in part, by factors on the supply side, such as entry into the market of new manufacturers and products and expansion of the production capacity of existing manufacturers, as well as changes on the demand side. Some of our products are commodities that are available from multiple sources. Our competitors include some of the world’s largest chemical and mining companies. Some of these companies are state owned or government subsidized. The primary competitive factor with respect to our products is price. Our prices for our products are impacted by the prices prevailing in the market. For example, at the end of July 2013, Uralkali announced that it was discontinuing its joint marketing with Belaruskali (Uralkali and Belaruskali are the leading potash producers in Russia and Belarus). In addition, Uralkali stated that it will implement a new policy for potash sales of preferring quantity over price. We believe this announcement led to a fall in potash prices.
Additional competitive factors include product quality, customer service and technical assistance. If we are unable to compete effectively with these companies, our results of operations would almost certainly be significantly adversely affected.
A committee established by the Israeli Finance Minister published its conclusions, which recommend higher taxes and royalties on our operations.
Former Israeli Minister of Finance, Mr. Yair Lapid, established a public committee (the “Committee”), headed by Prof. Eytan Sheshinski, for examination of the policy with respect to the royalties received by the State of Israel from private entities, including us, for use of national natural resources such as potash, bromine, and phosphate. The Committee was required, among other things, to examine the royalties policy from a broad perspective, while making reference to the impacts on the present agreements between the various parties engaged in these matters and the State of Israel.
On October 20, 2014, the Committee published the final conclusions regarding the government’s take to be received from use of national resources by private bodies. The highlights of the Committee’s recommendations are as follows:
The mix of taxes on natural resources in Israel will include three taxation elements: royalties, natural resources tax and corporate tax.
The royalty rate for all minerals will be 5% for any extracted amount (currently, the royalty rate for potash is 5% on annual sales of up to 1.5 million tons, and 10% for any sales above that amount. The royalty rate for bromine is 5% and the royalty rate for phosphates is 2%); the calculation of the royalties for phosphates which is made in accordance with the Mines Ordinance, will be changed such that the recognition of refining and processing costs of the mined raw material will be in accordance with normative costs to be established in the law.
A new natural resources tax will be imposed, the main features of which are:
The natural resources tax base will be the amount from which the natural resources tax will be collected every year.
The tax base will be the Company’s operating profit, according to accounting profit and loss statements, after certain adjustments less financing expenses at the rate of 5% of the Company’s working capital, and less an amount that will represent the yield on the remaining depreciated cost of the fixed property used in the production and sale of the mineral (“Yield on the Depreciated Cost”).
A progressive tax will be imposed on the tax base, as described above, at a rate that will be determined in accordance with the level of the yield on the remaining depreciated cost of the fixed property used in the production and sale of the mineral in that year. The first tax bracket for the natural resource tax will be 25% with respect to a Yield on the Depreciated Cost between 14% and 20%, and the second tax bracket will be 42% with respect to a Yield on the Depreciated Cost over 20%.
For the years in which the natural resources tax base is negative, the negative amount will be carried over from year to year, and will serve as a tax shield in the following tax year.
The natural resources tax will only be imposed on the profits derived from the production and the sale of minerals, such as potash and phosphates, and not on profits derived from downstream industrial activity. In addition, the natural resources tax will be calculated separately for each mineral. However, to the extent that there is a synergy between the different resources, and that a particular mineral produces a benefit in the production of a different mineral, the Committee believes that such benefit should be reflected in the calculation of the natural resources tax.
Consequently, the benefit produced by the magnesium plant for the potash plant in the production of sylvinite will be recognized as an expense for the potash plant, and accordingly will be recognized as income for the magnesium plant. Clear rules will be established for this purpose with regard to the calculation of the said savings, with respect to potash and other minerals, if applicable.
A mechanism will be established for determining the market price for transactions involving natural resources between related parties in Israel, as well as a mechanism for calculating the manner in which expenses will be attributed to the production and sale of the natural resource and to the downstream activities.
Regarding bromine, a natural resources tax will be imposed in the same way it is imposed on other natural resources, other than that the transfer price will be calculated separately for transfers to related parties in Israel, and separately for sales to related parties abroad. The transfer price for elemental bromine to related parties will be the higher of the following:
The actual price – the actual sale price for elemental bromine to related parties in Israel or abroad, whichever is relevant;
The price to a third party – the weighted average of the sale price to unrelated parties, which are manufacturers of bromine compounds, while adjusting the shipping and marketing costs, as needed;
A normative price – the normative price will be linked to the bromine compounds index and determined based on the Netback method, relying on the data from the five previous years for the Bromine Compounds Company in Israel or abroad, as relevant. In each of those years, all bromine compounds production costs will be deducted from the sales turnover for the Bromine Composite Company, except for the cost of purchasing the raw bromine. The operating profit, before the deduction of the cost of purchasing the raw bromine, will also be deducted of a normative profit in the rate of 12% of the sales turnover of the Bromine Compounds Company in Israel or abroad, as the case may be. The amount reached through this calculation, for each of the years that is examined, will be divided by the amount of the bromine that the Bromine Compounds Company has purchased in each of the years, and will be weighted into the stated normative price. The mechanism will be examined every 5 years and will be updated if necessary.
The Encouragement of Capital Investments Law – the law will be amended, to clarify that with regard to any tax benefits pursuant to that law, the definition of a “Mineral Extraction Plant” will include all the plant’s activity through the production of the first sellable natural resources, such as potash, bromine and magnesium. Therefore, any activity in the production of the mineral will be subjected to the excess profit tax, and will not be entitled to tax benefits pursuant to the Encouragement of Capital Investments Law. Downstream product activity such as bromine compounds and fertilizers will not be a part of the base used for calculating the excess profits tax and will not be excluded from the application of the Law for Encouragement of Capital Investments.
In addition to the Committee’s recommendations noted above, the Company is subject to corporate tax at a rate of 26.5%.
According to the Committee, the State’s portion from minerals, in the event that natural resources tax is imposed is expected to range between 46% and 55%. The Committee’s recommendations, insofar as they are enacted into legislation, will apply to DSW beginning from January 1, 2017. It should be noted, that attached to the Committee’s Recommendations, were, among other things, a minority statement of the Accountant General of the Ministry of Finance as well as a reservation from the Committee’s recommendations of the representatives of the Ministry of Economy and the Ministry of National Infrastructures, Energy and Water Resources.
On November 10, 2014, the Ministry of Finance published a press release, according to which the Social Economic Cabinet unanimously approved the Committee’s recommendations on November 10, 2014. According to the said press release, the final recommendations will be drafted as legislation and submitted to the Knesset for its approval. There is no certainty that the Knesset will approve the Committee’s recommendations in their current format.
If the Committee’s recommendations as published are legislated into law, the Company’s operations, its financial position, and the results of its operations will be significantly adversely affected.
Inaccuracies in our estimates of mineral reserves and resource deposits could result in lower than expected sales and/or higher than expected costs.
We base our mineral reserve and resource estimates on engineering, economic and geological data that is compiled and analyzed by our engineers and geologists. However, reserve estimates are necessarily imprecise and depend to some extent on statistical inferences drawn from available drilling data, which may prove unreliable/inaccurate. There are numerous uncertainties inherent in estimating quantities and qualities of reserves and non-reserve deposits and costs to mine recoverable reserves and economic feasibility, including many factors beyond our control. Estimates of economically feasible commercial reserves necessarily depend on a number of factors and assumptions, all of which may vary considerably from the actual results, such as:
|
|
·
|
Geological and mining conditions and/or effects from prior mining that may not be fully identified/assessed by available data or that may differ from experience;
|
|
|
·
|
Assumptions concerning future prices of products, operating costs, mining technology improvements, development costs and reclamation costs; and assumptions concerning future effects of regulation, including the issuance of required permits and taxes by governmental agencies.
|
Any inaccuracy in our estimates related to our mineral reserves and non-reserve mineral deposits could result in lower than expected sales and/or higher than expected costs.
We intend to expand our business through acquisitions and various initiatives to increase production and reduce costs of our existing operations. This could result in a diversion of resources and extra expenses, a disruption of our business and an adverse effect on our financial condition and results of operations.
One of the components of our strategy is to pursue acquisitions of businesses or to enter into joint ventures. The negotiation process with respect to potential acquisitions or joint ventures, as well as the integration of acquired or jointly developed businesses, will require management to invest time and resources, in addition to the necessary financial investments. There is no guarantee that businesses or joint ventures that have been or will be acquired will be successfully integrated with our current products and operations and we may not realize the intended benefits of the acquisition or joint venture.
Future acquisitions could result in:
|
|
·
|
Substantial cash expenditures;
|
|
|
·
|
Potentially dilutive issuances of equity securities;
|
|
|
·
|
The incurrence of debt and contingent liabilities, including liabilities for environmental damage caused by acquired businesses before we acquired them;
|
|
|
·
|
A decrease in our profit margins; and
|
|
|
·
|
Impairment of intangible assets and goodwill.
|
If future acquisitions disrupt our operations, our business may be materially and adversely affected.
In addition, we are working on a number of initiatives to improve our existing operations, including initiatives to increase production in Spain and reduce operating costs at our facilities. These initiatives may cost more or take longer than we anticipate and they may not ultimately achieve their goals. If we cannot do so, our competitive position could be adversely affected. See “Item 4. Information on the Company—B. Business Overview—Our Strategy” and “Streamline and integrate our global processes”.
Our tax liabilities may be higher than expected.
We are subject to taxes in many jurisdictions, and discretion is required in determination of the provisions for our tax liability. Similarly, we are subject to examination by the Tax Authorities in many different jurisdictions. As part of these examinations, the relevant tax authorities may disagree with the amount of taxable income, as stated, deriving from our inter-company agreements and may also dispute our interpretation of the applicable tax legislation. For example, in December 2013, an assessment was received from the Tax Authorities in Israel, according to which the Company was required to pay additional taxes in the amount of approximately $230 million, in addition to the amount that it had paid in respect of the years 2009-2011, The Company appealed the assessment of the Tax Authorities. In January 2015, an order was received from the Tax Authorities, which sets the amount of the additional tax at approximately $200 million. The Company disagrees with the Tax Authorities’ position and on February 25, 2015, filed an appeal against the order. In the estimation of Company Management, based on its legal advisors, the chances that the Company’s contentions will ultimately be accepted at the end of the appeal proceeding are greater than the chances that they will be rejected and, therefore, no provision for tax has been included in the financial statements in respect of the said assessment. The Tax Authorities’ main argument is that ICL’s subsidiaries, DSW and Rotem Amfert Negev, are not eligible for benefits under the Encouragement of Capital Investments Law, from the date on which Amendment No. 60 of this law entered into effect in 2005. Even though
we believe our estimates are reasonable, the final outcome of these examinations and any related legal proceedings may be different than the provisions that we record in respect of our tax liability and may have a significant impact on our results of operations.
Risks Related to Our Industry
Our operations and sales are subject to a crisis in the financial markets.
We are a multi-national company and our financial results are affected by global economic trends, the changes in terms of trade and financing, and fluctuations of currency exchange rates. A crisis in the financial markets could cause a reduction in the international sources of credit available for the purpose of financing commercial operations. The impact of such a crisis might be expressed in terms of availability of credit to us and our customers, and of the price of credit. In addition, the volatility and uncertainty in the European Union affect our activities in this market.
Sales of our fertilizer products are subject to the situation in the agricultural industry.
Most of our fertilizer products are sold to producers of agricultural products. Fertilizer sales may be adversely impacted as a result of a decline in agricultural produce prices or the availability of credit, or other events that cause farmers to plant less and consequently reduce their use of fertilizers. For example, periods of high demand, increasing profits and high capacity utilization tend to lead to new investment in crops and increased production. This growth increases supply until the market is over saturated, leading to declining prices and declining capacity utilization until the cycle repeats. As a result, the prices and quantities of fertilizer products sold have been volatile. This price and quantity volatility may cause our results of operations to fluctuate and potentially deteriorate. The price at which we sell our fertilizer products and our sales volumes could fall in the event of industry oversupply conditions, which could have a material adverse effect on our business, financial condition and results of operations. In contrast, high prices may lead our customers to delay purchasing decisions in anticipation of lower prices in the future, thereby decreasing our sales volumes. These factors could materially and adversely affect our business, financial condition and results of operations.
In addition, government policies, and specifically, subsidy levels, may affect the amount of agricultural crops and, as a result, sales of our fertilizer products. Generally, reductions in agricultural subsidies or increases in subsidies to local fertilizer manufacturers in a country where we sell our products are likely to have a negative impact on our fertilizer business.
Finally, the agricultural industry is strongly affected by local weather conditions. Conditions such as heavy storms, long periods of drought, floods, or extreme seasonal temperatures are likely to affect the local crop’s quality and yield and cause a reduction in the use of fertilizers. Loss of sales in an agricultural season in a target country as a result of weather related events can cause a loss of sales for the whole year.
Sales of our industrial products are affected by various factors that are not within our control, including developments in the electronics markets and legislative changes impacting the use of our products.
Our industrial products accounted for 21.9% of our sales (before set offs of inter segment sales) in 2014. Our sales of these products are dependent on various factors outside our control. For instance, a large proportion of our industrial products are sold for use as flame retardants. This area is subject to government regulation around the world, which can restrict certain uses of flame retardants. In addition, various “green” organizations have been increasing their pressure to reduce the use of bromine based flame retardants, and various countries are assessing possible limitations on the use of bromine based flame retardants. The European Union has already banned the bromine based flame retardant DECA for use in electrical and electronic applications, and it is likely that DECA will be prohibited for all uses in the European Union in 2017 at the earliest. See “Item 4. Information on the Company—B. Business Overview—Regulatory and Environmental, Health and Safety Matters.” Sale of oil drilling products depends on the extent of operations in the oil drilling market, mainly in deep drillings in the high seas, which in turn is dependent on fuel prices, and on the decisions of oil companies regarding rates of production and areas of production of oil and gas. The drop in oil prices in recent months may affect the scope of operations in the oil drilling market and lead to a drop in the sales of our products in this sector.
In addition, a large portion of our industrial products are used as inputs for end products. For example, a significant portion of our flame retardants are added to plastic components in electronic devices, including personal computers and televisions. The slowdown of the global economy in recent years as well as the increasing use of smart phones and tablets as opposed to personal computers have led to a decline in the demand for personal computers, which in turn has caused a decline in the demand for bromine based flame retardants sold by our Industrial Products segment. Beginning in late 2012, there was also a slump in demand for bromine based flame retardants for construction. Our strategy is to attempt to increase the demand through development of new products and new applications, by introducing bromine products such as flame retardants into new geographic areas where they are not currently used or to develop their use as part of new applications. A failure to increase demand for our bromine based products could have a material adverse effect on our business, financial condition and results of operations.
Sales of our performance products are affected by various factors that are outside our control, including a recession or slowdown in the world economy as well as an increase in the euro exchange rate vis à vis the U.S. dollar.
Sales of our performance products are affected by various factors that are outside our control, including global economic conditions in the markets in which we operate. For example, our sales may be affected by the slow economic recovery or any reversal thereof in Europe. We have significant manufacturing operations in Europe and a large portion of our European sales are in euros, whereas some of our competitors are manufacturers outside Europe whose operational currency is the U.S. dollar. As a result, a strengthening of the euro exchange rate vis à vis the U.S. dollar increases the competitive advantage of these competitors.
As an industrial chemicals company, we are subject to various legislative and licensing restrictions in Israel and throughout the world in the areas of environmental protection and safety. Related compliance costs and hazards inherent to the nature of our business may have a negative effect on our results of operations.
Because we are active in the field of industrial chemicals, we are significantly affected by legal rulings and licensing authorities in the areas of environmental protection and safety. In recent years, there has been a significant increase in the stringency and enforcement of legislative directives and regulatory requirements in these areas, in Israel and throughout the world, and the cost of conformance and compliance has risen significantly. Additionally, legislative changes throughout the world may prohibit or restrict use of our products, due to environmental protection, health or safety considerations. Standards that will be adopted in the future are likely to affect us and change our methods of operation. Furthermore, some of our licenses, including business licenses and mining licenses, are for fixed periods and must be renewed from time to time. Renewal of the licenses is not certain and the renewal may be made contingent on additional conditions. See “Item 4. Information on the Company—B. Business Overview—Regulatory and Environmental, Health and Safety Matters.”
In addition, although we take precautions to enhance the safety of our operations and minimize the risk of disruptions, we are subject to hazards inherent in chemical manufacturing and the related storage and transportation of raw materials, products and wastes. These hazards include explosions, fires, mechanical failures, remediation complications, chemical spills and discharges or releases of toxic or hazardous substances. These and other hazards are also inherent in our mining operations, particularly underground mining. These hazards can cause personal injury and loss of life, severe damage to or destruction of property and equipment and environmental damage, and may result in suspension of operations and the imposition of civil or criminal penalties. In addition, our manufacturing facilities contain sophisticated manufacturing equipment. In the event of a major disruption in the operations of any of this equipment, we may not be able to resume manufacturing operations for an extended period of time. The occurrence of material operating problems at our facilities, including, but not limited to, the events described above, may have a material adverse effect on us, during and after the period of such operational difficulties, as we are dependent on the continued operation of our production facilities and we may become subject to substantial liabilities under these circumstances.
Due to the nature of our Company, we are exposed to administrative and legal proceedings, both civil and criminal, including as a result of alleged environmental contamination caused by certain of our facilities.
From time to time we are exposed to administrative and legal proceedings, both civil and criminal, including as a result of alleged environmental contamination caused by certain of our facilities. In addition, from time to time examinations and investigations are conducted by enforcement authorities in and outside Israel. See “Item 8. Financial Information—A. Consolidated Statements and Other Financial Information—Legal Proceedings.”
Furthermore, from time to time we are exposed to claims alleging physical or property damage, which may cause us financial harm. In addition, some of the manufacturing or marketing activities (and sometimes transportation and storage as well) entail safety risks that we attempt to minimize but are not able to eliminate. In various countries, including Israel and the United States, legislation exists that can impose liability on us irrespective of our actual intent or negligence. Other laws place responsibility on defendants jointly and severally, and sometimes retroactively, and therefore can cause us to be liable for activities executed jointly with others and at times by solely by others. We may also be found liable for claims related to land that we mined or activities that we conducted within our premises, after such activities have ceased.
In addition, over the past several years, there has been an increase in the filing of claims together with a request for their certification as class actions. Due to the nature of class actions, these claims may be for very high amounts and the costs of defending against such actions may be significant even if the claims are without merit. In addition, our insurance policies include coverage limitations, are restricted to certain causes of action and may not cover claims relating to certain types of damages. For example, in August 2013, a request was filed in the District Court of Tel Aviv for certification of a claim as a class action against us, Israel Corporation, PotashCorp Cooperative Agricultural Society Ltd., the members of our Board of Directors and our Chief Executive Officer. The aggregate amount of the damages claimed is NIS 2.75 billion or NIS 3.28 billion (the amount of the claim depends on the share price used to calculate the alleged damages). We have not made a provision for this claim in our audited financial statements. See Note 23 to our audited financial statements and “Item 8. Financial Information—A. Consolidated Statements and Other Financial Information—Legal Proceedings—Securities Law Proceedings” for additional information.
We are exposed to the risk of third party and product liability claims.
We are also exposed to risk of liability related to damage caused to third parties by our operations or by our products. For example, we are subject to a number of claims alleging bodily injury as a result of discharges to the Kishon River. We are also subject to claims alleging liability for the impacts from the rising water level at one of our evaporation ponds at the Dead Sea. See Note 23 to our audited financial statements. We have third party liability insurance for damages caused by our operations and for product liability. However, there is no certainty that this insurance will fully cover all damage for such liability. Likewise, sale of faulty products by us might give rise to recall of products by us or by our customers that used the products.
Our insurance policies may not be sufficient to cover all actual losses that we may incur in the future.
We maintain, among others, property, environmental, business interruption and casualty insurance policies, but we are not fully insured against all potential hazards and risks incident to our business. We are subject to various self-retentions and deductibles under these insurance policies. As a result of market conditions, our loss experience and other factors, our premiums, self-retentions and deductibles for insurance policies can increase substantially and, in some instances, certain insurance may become unavailable or available only for reduced amounts of coverage. In addition, significantly increased costs could lead us to decide to reduce, or possibly eliminate, coverage. As a result, a disruption of operations at one of our key facilities or a significant casualty could have a material adverse effect on our financial condition and results of operations.
Risks Related to Our Operations in Israel
Due to our location in Israel, our operations may be subject to war or acts of terror.
War or acts of terror in the locations where we operate are likely to negatively impact us. This impact may manifest itself in production delays, distribution delays, loss of property, injury to employees, and appreciation of insurance premiums. In addition, our plants may be targets of terrorist acts due to the chemicals they store. We do not have property insurance against war or acts of terror, other than compensation from the State of Israel pursuant to Israeli law, which covers only physical property damage, without accounting for reinstatement values.
Since the construction of our initial facilities in the 1950s, we have never experienced material business interruptions as a result of war or acts of terror, but we can provide no assurance that we will not be subject to any such interruptions in the future.
Our computer network, communications, and production technologies constitute a basic platform for operational continuity and are also potential targets for acts of terror. Potential cyber threats can cause damage to systems and plants, data loss, software vulnerability and external and internal access to sensitive and confidential information. We have implemented a plan for safeguarding and backing up the information systems. The activities include: separation of the information networks from the computerized process systems, physical safeguarding of the computer rooms and terminals and training of employees. However, there is no assurance that our plan will successfully accomplish its goals.
We conduct operations in Israel and therefore our business, financial condition and results of operations may be materially and adversely affected by political, economic and military instability in Israel and its region.
Our headquarters, some of our operations, and some of our mining facilities are located in central Israel and many of our key employees, directors and officers are residents of Israel. Accordingly, political, economic and military conditions in Israel and the surrounding region may directly affect our business. Since the establishment of Israel in 1948, a number of armed conflicts have taken place between Israel and its Arab neighbors, Hamas (an Islamist militia and political group in the Gaza Strip) and Hezbollah (an Islamist militia and political group in Lebanon). Any hostilities involving Israel or the interruption or curtailment of trade within Israel or between Israel and its trading partners could materially and adversely affect our business, financial condition and results of operations and could also make it more difficult for us to raise capital. Recent political uprisings, social unrest and violence in various countries in the Middle East and North Africa, including Israel’s neighbors Egypt and Syria, are affecting the political stability of those countries. This instability may lead to deterioration of the political relationships that exist between Israel and these countries and have raised concerns regarding security in the region and the potential for armed conflict. In addition, Iran has threatened to attack Israel and is widely believed to be developing nuclear weapons. In addition, the assessment is that Iran has a strong influence among parties hostile to Israel in areas that neighbor Israel, such as the Syrian government, Hamas in Gaza and Hezbollah in Lebanon. Any armed conflicts, terrorist activities or political instability in the region could materially and adversely affect our business, financial condition and results of operations. In addition, the political and security situation in Israel may result in parties with whom we have agreements involving performance in Israel claiming that they are not obligated to perform their commitments under those agreements pursuant to force majeure provisions in such agreements.
Our operations may be disrupted as a result of the obligation of Israeli citizens to perform military service.
Many Israeli citizens are obligated to perform one month, and in some cases more, of annual military reserve duty until they reach the age of 45 (or older, for reservists with certain occupations) and, in the event of a military conflict, may be called to active duty. Although periods of significant call ups of military reservists in the past in response to terrorist activities have had no significant impact on our operations, it is possible that there will be military reserve duty call ups in the future, which will might disrupt our operations.
It may be difficult to enforce a U.S. judgment against us and our directors and executive officers named in this Annual Report, in Israel or the United States, or to serve process on our directors and executive officers.
We are incorporated under Israeli law. Many of our directors and executive officers listed in this Annual Report reside outside the United States, and most of our assets are located outside the United States. Therefore, a judgment obtained against us or many of our directors and executive officers in the United States, including one based on the civil liability provisions of the U.S. federal securities laws, may not be collectible in the United States and may not be enforced by an Israeli court. It also may be difficult for you to effect service of process on these persons in the United States or to assert claims under the U.S. securities laws in original actions instituted in Israel.
Your rights and responsibilities as a shareholder will be governed by Israeli law which may differ in some respects from the rights and responsibilities of shareholders of U.S. companies.
We are incorporated under Israeli law. The rights and responsibilities of the holders of our ordinary shares are governed by our Articles of Association and Israeli law. These rights and responsibilities differ in some respects from the rights and responsibilities of shareholders in typical U.S. corporations. In particular, a shareholder of an Israeli company has a duty to act in good faith toward the company and other shareholders and to refrain from abusing its power in the company, including, among other things, in voting at the general meeting of shareholders on matters such as amendments to a company’s articles of association, increases in a company’s authorized share capital, mergers and acquisitions and interested party transactions requiring shareholder approval. In addition, a
shareholder who knows that it possesses the power to determine the outcome of a shareholder vote or to appoint or prevent the appointment of a director or executive officer in the company has a duty of fairness toward the company. There is limited case law available to assist us in understanding the implications of these provisions that govern shareholders’ actions. These provisions may be interpreted to impose additional obligations and liabilities on holders of our ordinary shares that are not typically imposed on shareholders of U.S. corporations.
Risks Related to Our Ordinary Shares
We are controlled by one of our shareholders. This shareholder may make decisions with which other shareholders may disagree.
As of March 19, 2015, Israel Corporation held approximately 49.2% of our outstanding ordinary shares and approximately 46.18% of the voting rights of our shareholders.
The interests of Israel Corporation may differ from your interests. Israel Corporation exercises control over our operations and business strategy and has sufficient voting power to control many matters requiring approval by our shareholders, including:
|
|
·
|
The composition of our Board of Directors (other than external directors, as described under “Item 6. Directors, Senior Management and Employees—C. Board Practices—External Directors”;
|
|
|
·
|
Mergers, acquisitions or other business combinations;
|
|
|
·
|
Certain future issuances of ordinary shares or other securities; and
|
|
|
·
|
Amendments to our Articles of Association, excluding provisions of the Articles of Association that were determined by the Special State Share.
|
In addition, this concentration of ownership may delay, prevent or deter a change in control, or deprive you of a possible premium for your ordinary shares as part of a sale of our Company. Israel Corporation could also sell its stake and transfer control to another party without your consent.
The existence of a Special State Share gives the State of Israel veto power over transfers of certain assets and shares above certain thresholds, and may have an anti-takeover effect.
The State of Israel holds a Special State Share in our Company and in some of our Israeli subsidiaries. The Special State Share entitles the State of Israel, among other things, to restrict the transfer of certain assets and some acquisitions of shares by any person that would become a holder of specified amounts of our share capital. Because the Special State Share restricts the ability of a shareholder to gain control of our Company, the existence of the Special State Share may have an anti-takeover effect and therefore depress the price of our ordinary shares.
The market price of our ordinary shares is subject to fluctuation, which could result in substantial losses for our investors.
The stock market in general, and the market price of our ordinary shares in particular, is subject to fluctuation, and changes in our share price may be unrelated to our operating performance. The market price of our ordinary shares on the TASE has fluctuated in the past, and we expect it will continue to do so. The market price of our ordinary shares is and will be subject to a number of factors, including:
|
|
·
|
Expiration or terminations of licenses or concessions;
|
|
|
·
|
General equity market conditions;
|
|
|
·
|
Decisions by the Israeli government that affect us;
|
|
|
·
|
Variations in our and our competitors’ results of operations;
|
|
|
·
|
Changes in earnings estimates or recommendations by securities analysts; and
|
|
|
·
|
General market conditions and other factors, including factors unrelated to our operating performance.
|
These factors and any corresponding price fluctuations may materially and adversely affect the market price of our ordinary shares and result in substantial losses for our investors.
If equity research analysts issue unfavorable commentary or downgrade our ordinary shares, the price of our ordinary shares could decline.
The trading market for our ordinary shares relies in part on the research and reports that equity research analysts publish about us and our business. The price of our ordinary shares could decline if one or more securities analysts downgrade our ordinary shares or if those analysts issue other unfavorable commentary or cease publishing reports about us or our business.
You may be diluted by the future issuance of additional ordinary shares in connection with our incentive plans, acquisitions or otherwise.
As at the publication date of the report, the Company has approximately 189 million NIS par value shares (not including an issuance of 99,858 restricted shares to directors) authorized but unissued. We may choose to raise substantial equity capital in the future: to acquire or invest in businesses, products or technologies and other strategic relationships and to finance unanticipated working capital requirements and respond to competitive pressures. The issuance of any additional ordinary shares in the future, or any securities that are exercisable for or convertible into our ordinary shares, will have a dilutive effect on our shareholders since by raising additional funds by issuing equity or convertible debt securities, we will reduce the percentage ownership of our then existing shareholders, and these securities may have rights, preferences or privileges senior to those of our existing shareholders. In addition, 16,353,473 options for our ordinary shares that were issued under the Company’s incentive and remuneration plan were outstanding as of March 19, 2015. See “Item 6. Directors, Senior Management and Employees—E. Share Ownership—Incentive Compensation Plans.” Any ordinary shares that we issue, including under any options plans, would dilute the percentage ownership held by investors.
If our existing shareholders sell additional ordinary shares, or if these shares are sold by others, either on the TASE or the NYSE, or if the forward counterparties or their affiliates sell additional ordinary shares to adjust their respective hedge positions during the terms of the forward sale agreements, the market price of our ordinary shares could decline.
The sale of substantial amounts of our ordinary shares in the public market, or the perception that such sales could occur, could harm the prevailing market price of our ordinary shares on the TASE or the NYSE. These sales, or the perception that these sales could occur, also might make it more difficult for us to sell equity securities in the future at a time and at a price that we deem appropriate. We have a total of 1,295,943,056 ordinary shares outstanding. All of our outstanding shares are freely tradable without restriction or further registration under the Securities Act, except that any shares held by our affiliates, including Israel Corporation, may be sold only in compliance with the limitations described in “Shares Eligible for Future Sale” in our registration statement on Form F-1 (File no. 333-198711), as filed with the SEC on September 22, 2014.
We, our directors and officers, and Israel Corporation have signed lock up agreements with the underwriters in connection with our initial public offering that, subject to certain exceptions, including with respect to sales by pledgees under margin loans, restrict the sale of ordinary shares held by them for 180 days following the date of our initial public offering on the NYSE. Upon the expiration of the lock up agreements, all of such shares will be eligible for resale in a public market, subject to, in the case of shares held by our affiliates, volume, manner of sale and other limitations under Rule 144. Morgan Stanley & Co. LLC may, in its sole discretion, release all or any portion of the shares subject to lock up agreements.
As of December 31, 2014, Israel Corporation has pledged approximately 383 million ordinary shares, or approximately 65.3% of the total ordinary shares it holds, to secure certain liabilities, almost entirely composed of margin loans with an aggregate outstanding principal amount of $1,035 million. As of that date, the ordinary shares pledged by Israel Corporation represent approximately 30% of the total ordinary shares. Each margin loan secured by shares requires Israel Corporation to pledge additional ordinary shares or cash collateral if certain loan to value ratios are greater than the minimum ratios agreed upon with the lender of the applicable margin loan. In accordance with the loan to value ratios, Israel Corporation would be required to pledge additional ordinary shares or cash collateral if the price of our ordinary shares were to decline to prices ranging from $4.7 to $6.1. One or more of the margin loans also contain provisions that, subject to their terms, effectively require prepayment if certain events or circumstances occur, including any that have a material adverse effect on Israel Corporation, Israel Corporation ceasing to control us, a decline in the price of our ordinary shares below a specified level, Israel Corporation’s failure to comply with specified financial ratios or a requirement of prepayment is triggered under any other material indebtedness. The only liabilities of Israel Corporation that are secured by ordinary shares, and that are not margin loans, relate to cross currency interest rate swaps. At December 31, 2014, Israel Corporation had, on an unconsolidated basis, approximately $2,313 million of total indebtedness, of which approximately $1,035 million is comprised of the margin loan indebtedness described above. If Israel Corporation fails to pledge additional ordinary shares or cash collateral when it is required to do so or otherwise fails to comply with the respective terms of the margin loans and the lender accelerates payment of all amounts outstanding under these loans as a result of this non-compliance, then the lender could sell the ordinary shares pledged thereunder. In addition, certain lenders under the margin loans may elect at any time to hedge their exposure to the ordinary shares in transactions that could directly or indirectly impact the price of ordinary shares.
Pursuant to the terms of its lock up agreement, Israel Corporation may (1) pledge additional ordinary shares under its existing margin loans and cross currency interest rate swaps, whether required to do so to comply with the respective terms of the margin loans or otherwise, and (2) enter into new pledge agreements and pledge additional shares to refinance existing margin loan indebtedness, so long as in any such case the aggregate principal amount of debt under its margin loans would not be greater (after giving effect to the refinancing or additional pledge) than $1.14 billion. The lock up agreement does not otherwise impose any limitations on the terms of any such refinancing arrangements or on Israel Corporation’s ability to renegotiate any of the terms of its existing margin loan arrangements or cross currency interest rate swaps.
In addition to the above, Israel Corporation has entered into a derivative financial transaction with entities from Goldman Sachs and Morgan Stanley (“the Financial Institutions”), of the” Variable Prepaid Forward” type, based on an ISDA agreement, in connection with approximately 36.2 million additional shares of ICL that were transferred into the name of the Financial Institutions, as detailed in Israel Corporation’s Immediate Report dated September 24, 2014. As part of the financial transaction, the Financial Institutions provided Israel Corporation an initial amount of $191 million, which in is in essence, a loan.
Israel Corporation has the right to elect cash settlement under the forward sale agreements in lieu of delivering ordinary shares. To the extent Israel Corporation elects cash settlement under the forward sale agreements, the forward counterparties will return to Israel Corporation the ordinary shares it previously made available to the forward counterparties. The forward counterparties or their affiliates may make additional sales and purchases of ordinary shares to adjust their respective hedge positions during the terms of the forward sale agreements. Neither we, Israel Corporation nor the forward counterparties make any representation or prediction as to the direction or magnitude of any effect that the transactions described above may have on the price of the ordinary shares, but any selling activities could depress the price of our ordinary shares. In addition, neither we, Israel Corporation nor the forward counterparties make any representation that the forward counterparties or any of their affiliates will engage in these transactions or that these transactions, once commenced, will not be discontinued without notice.
Upon the expiry of the restrictions on resale, the market price of our ordinary shares could drop significantly if the holders of these restricted shares sell them or are perceived by the market as intending to sell them. These factors could also make it more difficult for us to raise additional funds through future offerings of our ordinary shares or other securities.
We may not be able to fulfill our dividend policy in the future.
Our Board of Directors has adopted a dividend policy to pay quarterly dividends of up to 70% of our net income. All dividends must be declared by our Board of Directors, which will take into account various factors including our profits, our investment plan, our financial status and additional factors they deem appropriate. Dividend payments are not guaranteed and our Board of Directors may decide, in its absolute discretion, at any time and for any reason, not to pay dividends, to reduce the amount of dividends paid, to pay dividends on an ad hoc basis or to adopt a share buyback program.
Our ordinary shares are traded on different markets and this may result in price variations.
Our ordinary shares have traded on the TASE since 1992 and have been listed on the NYSE since September 2014. Trading in our ordinary shares on these markets occurs in different currencies (U.S. dollars on the NYSE and NIS on the TASE) and takes place at different times (resulting from different time zones, different trading days and different public holidays in the United States and Israel). The trading prices of our ordinary shares on these two markets may differ due to these and other factors. Any decrease in the price of our ordinary shares on one of these markets could cause a decrease in the trading price of our ordinary shares on the other market.
As a foreign private issuer, we are permitted to follow certain home country corporate governance practices instead of applicable SEC and NYSE requirements, which may result in less protection than is afforded to investors under rules applicable to domestic issuers.
As a foreign private issuer, we are permitted to follow certain home country corporate governance practices instead of those otherwise required by the NYSE for domestic issuers. For instance, we have elected to follow home country practices in Israel with respect to, among other things, composition and function of the audit and finance committee and other committees of our Board of Directors and certain general corporate governance matters. In addition, in certain instances we will follow our home country law, instead of NYSE rules applicable to domestic issuers, which require that we obtain shareholder approval for certain dilutive events, such as an issuance that will result in a change of control of our Company, certain transactions other than a public offering involving issuances of a 20% or more interest in our Company and certain acquisitions of the stock or assets of another company. Following our home country corporate governance practices as opposed to the requirements that would otherwise apply to a U.S. company listed on the NYSE may provide less protection than is afforded to investors under the NYSE rules applicable to domestic issuers.
In addition, as a foreign private issuer, we are exempt from the rules and regulations under the U.S. Securities Exchange Act of 1934, as amended (the “Exchange Act”), related to the furnishing and content of proxy statements and the requirements of Regulation FD (Fair Disclosure), and our directors, officers and principal shareholders are exempt from the reporting and short swing profit recovery provisions of Section 16 of the Exchange Act. In addition, we are not required under the Exchange Act to file annual, quarterly and current reports and financial statements with the SEC as frequently or as promptly as domestic companies whose securities are registered under the Exchange Act.
We have a history of quarterly fluctuations in our results of operations due to the seasonal nature of the demand for some of our products. We expect these fluctuations to continue. Fluctuations in our results of operations may disappoint investors and result in a decline in our share price.
We have experienced, and expect to continue to experience, fluctuations in our quarterly results of operations. Our sales have historically been stronger in the second and third quarters of each year. This is due to the mix of products we sell in those quarters, as well as the mix of sales in different countries. If, for any reason, our revenues in the second and third quarters are below seasonal norms, we may not be able to recover these sales in subsequent quarters and our annual results of operations may not meet expectations. If this occurs, the market price of our ordinary shares could decline.
A. HISTORY AND DEVELOPMENT OF THE COMPANY
Our legal name is Israel Chemicals Ltd. and our commercial name is ICL. We are a public company and operate today as a limited liability company under the laws of Israel. Our registered office and principal place of business is located at Millennium Tower, 23 Aranha Street, P.O. Box 20245, Tel Aviv 61202, Israel. The telephone number at our registered office is +972 3 684 4400. Our website address is www.icl group.com. The reference to our website is intended to be an inactive textual reference and the information on, or accessible through, our website is not intended to be part of this Annual Report.
We were established in Israel in 1968 as a government-owned and -operated company in Israel and operate today as a limited liability company under the laws of Israel. In 1992, following a decision of the Israeli government to privatize the Company, the State published a sales offer prospectus and our shares were listed for trade on the Tel Aviv Stock Exchange. In September 2014, we listed our shares for trade on the New York Stock Exchange, and they are currently traded in Tel Aviv and in New York. The purpose of the listing was to expand our global base of investors, improve liquidity, increase our access to global financial markets, and improve our capital structure management flexibility. For additional information on the Company’s history and development, see “—Business Overview—Our History.”
B. BUSINESS OVERVIEW
Company Overview
We are a leading global specialty minerals company that operates a unique, integrated business model. We extract raw materials and utilize sophisticated processing and product formulation technologies to add value to customers in three attractive end markets: agriculture, food and engineered materials. These three end markets constitute over 90% of our revenue. Our operations are organized into three segments: (1) Fertilizers, which operates the raw material extraction for us and markets potash, phosphates and specialty fertilizers; (2) Industrial Products, which primarily extracts bromine from the Dead Sea and produces and markets bromine and phosphorus compounds for the electronics, construction, oil and gas drilling and automotive industries and (3) Performance Products, which mainly produces, markets and sells a broad range of downstream phosphate based food additives and industrial intermediates.
Our principal assets include:
|
|
·
|
Access to one of the world’s richest, longest life and lowest cost sources of potash and bromine (the Dead Sea).
|
|
|
·
|
Access to potash mines in the United Kingdom and Spain.
|
|
|
·
|
Bromine compounds processing facilities located in Israel, the Netherlands and China.
|
|
|
·
|
A unique integrated phosphate value chain, from phosphate rock mines in the Negev Desert in Israel to our value added products in Israel, Europe, the United States, Brazil and China.
|
|
|
·
|
An extensive global logistics and distribution network with operations in over 30 countries.
|
|
|
·
|
A focused and highly experienced group of technical experts developing production processes, new applications, formulations and products for our three key end markets: agriculture, food and engineered materials.
|
For the year ended December 31, 2014, we generated total sales of approximately $6,110 million, operating income of approximately $758 million, net income of approximately $466 million and Adjusted EBITDA of approximately $1,344 million. For the year ended December 31, 2014, the sales of the Fertilizers segment amounted to approximately $3,402 million, operating income of approximately $670 million and Adjusted EBITDA of approximately $912 million. For the year ended December 31, 2014, our Industrial Products segment generated sales of approximately $1,337 million, operating loss of approximately $62 million and Adjusted EBITDA of approximately $202 million. Our Performance Products segment generated sales of approximately $1,614 million,
operating income of approximately $197 million and Adjusted EBITDA of approximately $241 million. See “Item 3. Key Information—A. Selected Financial Data” for a definition of Adjusted EBITDA and a reconciliation to the comparable IFRS measure.
Our Industry
The majority of our businesses compete in the global fertilizer and specialty chemicals industries.
Fertilizers
Fertilizers serve an important role in global agriculture by providing vital nutrients that help increase both the yield and the quality of crops. We supply two of the three essential nutrients — potassium, phosphorus and nitrogen — required for plant growth. There are no artificial substitutes for potassium and phosphorous (which are produced by the Company). Although these nutrients are naturally found in soil, they are depleted over time by farming, which could lead to declining crop yields and land productivity. To replenish these nutrients, farmers must apply fertilizers. The demand for fertilizers is volatile and seasonal. In our estimation, the policy of most countries is to ensure an orderly supply of high quality food to their residents, including by encouraging agricultural production, which should preserve the long term growth trend of fertilizer consumption.
Potash, the salt form of potassium, helps regulate a plant’s physiological functions and improves plant resilience, providing crops with protection from drought, disease, parasites and cold weather. Unlike phosphate and nitrogen, potash does not require additional chemical conversion to be used as a fertilizer. Potash
is mined either from underground mines or, less frequently, from natural sources, such as our operations in the Dead Sea. According to estimates from the United States Geological Survey, six countries accounted for approximately 86.3% of the world’s aggregate potash production and the top nine producers (considering China as a single producer even though there are numerous producers in China) operated approximately 90% of world production in 2014. Worldwide sales of potash recovered in 2014, as compared to 2013. The average prices in 2014 were lower than the average prices in 2013. Nonetheless, commencing from the second half of 2014 there has been an increase in prices that has continued up to the present time, particularly of granulated potash, mostly in Brazil and in the United States. In 2014, imports of potash into China reached a level of 8.03 million tons – the highest level since 2007 and approximately 21.3% higher than in 2013. In the Company’s estimation, the trend of increasing imports into China is expected to continue in 2015 due to an increase in consumption and logistics problems of the local producers. After several years of low demand for potash in India, which stemmed from, among other things, the government’s subsidy policy that gave preference to nitrogen fertilizers, there was a significant improvement in imports of potash into India in 2014. Potash imports increased from 3.07 million tons in 2013 to 4.29 million tons in 2014. This increase was achieved notwithstanding the fact that there was no change in the subsidy policy and the price to the final farmer remained at the same level as it was during the last two years. In the Company’s estimation, improvement in demand for potash in India is expected to continue in 2015 as farmers have adapted to the higher level of prices, and this is expected to support an increase in demand in upcoming years, as well. Demand for potash in Brazil was high in 2014 and imports of fertilizers into Brazil reached record levels. In 2014, 9.1 million tons of potash were imported into Brazil, compared with 7.6 million tons in 2013 – an increase of 19.0%.
According to the IFA, the aggregate global demand for potash for agricultural and other uses is projected to grow at an average annual rate of 2.5% up to 2018.
Phosphate is essential for plant root development and is required for photosynthesis, seed germination and efficient usage of water. Phosphate fertilizers are produced from phosphate rock and sulfuric acid and occasionally also include ammonia. The principal phosphate fertilizer producing regions have plentiful reserves of high quality, phosphate rock that can be mined at a low cost. The vast majority of the world’s phosphate rock production in 2014 was in China, the United States, Morocco and Russia. According to the IFA, global phosphoric acid demand is forecast to grow at an annual rate of 2.2% through 2018. From January to November 2014, there was a decrease in prices of phosphate fertilizers. These price decreases stemmed from a combination of supply and demand factors. On the demand side, imports into India (the main importer of DAP) were low in the first three quarters of the year. On the supply side, there was a significant increase in the export of phosphate fertilizers from China, which increased considerably this year and even reached new markets, such as the United States. In addition, the new Saudi producer (Ma’aden) increased its exports this year, and Saudi fertilizers reached Brazil for the first time. Notwithstanding that stated, the fall in prices came to a halt in December, and a moderate increase in prices of phosphate fertilizers commenced beginning in early 2015. This improvement stemmed from the resurgence in
demand along with limitation on the supply side. Regarding demand, commencing from October, India increased the import of fertilizers, and toward the end of the year it became clear that imports in 2014 had increased significantly compared with the prior year. Furthermore, additional customers that had ceased buying in anticipation of further price decreases returned to the market with the understanding that additional price decreases are not expected. On the supply side, a number of major producers implemented a policy of contracting production: Mosaic, the U.S. fertilizers
producer, announced a curtailment of production, and OCP, the Moroccan phosphate producer, notified that it intends to focus on production of phosphoric acid and TSP fertilizers (phosphate fertilizers that do not contain ammonia). The situation prevailing in the market for phosphate fertilizers also harmed the U.S. producer MissPhos, which declared bankruptcy and discontinued its production of fertilizers in the beginning of December 2014.
The barriers to entry of new competitors into the potash market are significant, and long lead time and billions of dollars of capital per operation are required. In potash, for example, economically recoverable deposits are scarce, typically deep in the earth and geographically concentrated. In phosphates, the need for access to competitive sources of multiple raw material feedstocks (phosphate rock, sulfuric acid and ammonia) combined with the complexity of developing an economically feasible downstream value chain also acts as a significant entry barrier.
The specialty fertilizers market is growing faster than the conventional fertilizers market. Specialty fertilizers are generally used for specialty crops (such as greenhouses and horticulture) but are rapidly expanding into usage for larger specialty field crops. Farmers are looking for fertilizers that are customized to meet the needs of specific crops and climates, to maximize yield and quality. The specialty fertilizers allow more precise application of the critical foundations for development of the plant (phosphoric acid, potassium and nitrogen). In addition to reduction of the environmental impacts, the specialty fertilizers permit efficient and effective fertilization of different types of produce (fruits, vegetables, etc.). Increase in the demand for healthier food is expected to give rise to an increase in the use of specialty fertilizers. Specialty fertilizers, such as controlled release fertilizers (which allow for the exact release of nutrients over time), slow release fertilizers (which allow for a very slow release of nutrients) (nitrogen and potassium only), liquid fertilizers integrated in irrigation systems and fertilizers that are fully soluble in water (that are most commonly used for fertilization by means of drip irrigation systems and foliar spraying).
Specialty Phosphates
Phosphate is also used in a broad range of downstream products in the food, electronics, energy and construction industries. These phosphate based products deliver additional and attractive margins. Main applications are for the food industry as additives for improved texture, stability and shelf life of processed foods in the markets for meat, bakery, dairy products and soft-drinks, and for additional industries for usage in road surfaces, oil and paint additives, flame retardants and fire extinguishing. Demand for phosphate based products is driven by global economic and population growth and improved living standards, which promote the adoption of more sophisticated food products.
Bromine
The largest commercial use of bromine is in the area of brome based flame retardants, which accounts for approximately 40% of the demand for bromine. To meet fire-safety requirements, flame retardants are used as inputs in manufacturing processes and end products such as plastic cases for consumer electronics, printed circuit boards, insulation materials for construction, furniture, automobiles, and textiles. The flame retardant market has contracted in the past few years. On the other hand, alternative uses of bromine have increased considerably, with bromine now used in a number of new applications, including water purification, shale gas fracking, oil and gas drilling and other industrial uses. Many new applications are under development by us and our competitors.
Bromine is found naturally in seawater, underground brine deposits and other water reservoirs, such as the Dead Sea, and is extracted by evaporation. The Dead Sea is the world’s premier source of bromine, with concentration levels significantly higher than in regular seawater, and it accounts for about half of the global supply. Because it has the highest concentration of bromine, the Dead Sea is the most economical supply source as the least amount of water must be extracted and evaporated to produce bromine.
The bromine industry is highly concentrated, with three companies accounting for approximately 80% of worldwide capacity in 2014 (ICL, Albemarle and Chemtura). Lack of access to a low-cost source of supply such as the Dead Sea constitutes a significant entry barrier for aspiring competitors, as well as the requirement for a sophisticated logistical global supply chain (isotanks) system. We estimate that approximately 70% of global
elemental bromine production is consumed internally for production of downstream products, as there is a very small market for elemental bromine. To increase the global use of elemental bromine, development of complex production facilities for downstream products is required.
Over 90% of our revenue is derived from three highly attractive end markets: agriculture, food and engineered materials
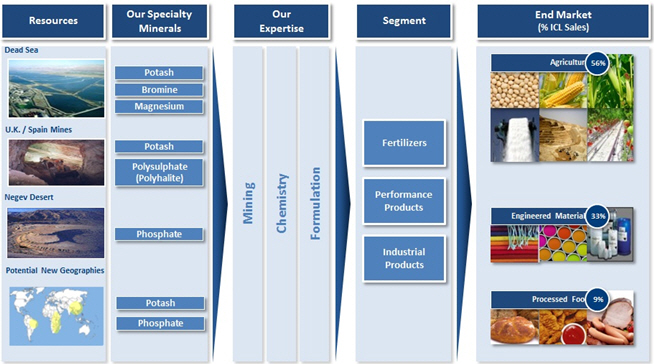
Agriculture
Global fertilizer demand is driven by grain demand and prices, which are primarily driven by population growth and dietary changes in the developing world:
|
|
·
|
Population and Income Growth.
Historically, growth in world fertilizer consumption has been closely correlated with growth in world population, which is expected to increase by over 1.0 billion to reach 8.3 billion by 2030, according to the U.S. Census Bureau. Currently, developed countries use fertilizer more intensively than developing countries and therefore produce crops at much higher yields. Economic growth in emerging markets is increasing food demand and thus fertilizer use. In addition, income per capita growth in developing markets results in a shift to more protein rich diets, and specifically, there is an increase in the consumption of meat, which requires larger quantities of grain for their growth, which leads to an increased demand for seeds for animal feed. According to the IMF, income per capita in developing countries is expected to grow by 6.0% annually up to 2018.
|
|
|
·
|
Declining Arable Land per Capita.
As the world’s population grows, mainly in cities, farmland per capita decreases and more food production is required from each acre of farmland. This, in turn, requires increased yield on existing farms. According to data from the FAO, the amount of arable land per capita is expected to decrease from 0.218 hectares per person to 0.197 hectares per person between 2012 and 2030. Effectively, new arable land is available only in limited quantities, mainly in Brazil. Therefore, the only viable path to increase crop production is through the yield increase in existing farms in developing countries, mainly in China, India, Russia, Africa and Central America, by increasing the use of fertilizers (especially potash and phosphates) together with water availability and better seeds.
|
|
|
·
|
Low Grain Stock-to-Use Ratio.
The pressure on food demand is expected to continue to result in relatively low historical levels of the grain stock to use ratio (a metric indicating the level of carryover stock), as illustrated by the chart below. The grain stock to use ratio was approximately 20.8% for the 2013/2014 season, which represented an increase from a low of 16.6% for the 2006/2007 season but a decrease as compared to the high of 28.9% for the 2000/2001 season, according to data from the USDA. Based on the report published by the USDA in February 2015, the grain stock to use ratio is expected to increase to approximately 21.15% at the end of the 2014/2015 season, compared with 20.80% at the end of the 2013/2014 season, and 19.85% in the 2012/2013 season. Most of the increase that is anticipated in the 2014/2015 season stems from an increase in corn and wheat stockpiles. The inventory of soybeans, which is not included in the grains’ inventory index, is also on the rise. A decline in the grain stock to use ratios generally indicates that grain prices will increase (due to limited stockpiles and tighter grain supply). This generally is a positive development for fertilizers, as higher grain prices support more fertilizer use. Conversely the recent increase would suggest lower prices and less fertilizer use.
|
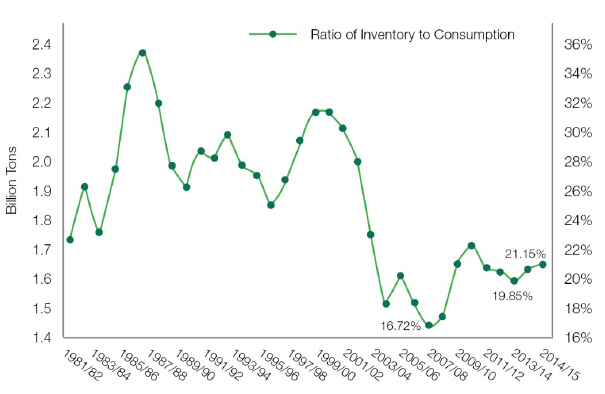
Food
Consumer demand for different food products in developed countries has changed dramatically over the last several decades, driven by a number of trends and processes including increased per capita incomes, demographic shifts and lifestyle changes. Longer working hours, changing family structures, increased awareness of nutrition and health issues and access to a broader variety of food products result in growing demand for more sophisticated, products with longer shelf lives such as convenience food and processed food products.
This changing demand includes greater demand for more sophisticated food products and
processed food products with enhanced nutritional value and balance and with improved flavor, texture and appearance. An increasingly longer supply chain and consumer awareness of waste of foods also drives the demand for longer shelf life and food stability. These trends act as long term drivers of demand for food additives such as phosphate derivatives, phosphate based formulations and hygiene products for the processed meat, bakery, dairy and beverages industries.
Engineered Materials
Demand for engineered materials that we manufacture, which include solutions based on bromine and phosphorus, and phosphate based products, is driven by the increase in construction and electronics operations, increasing demand for energy, and the increase in the demand for potable water and pharmaceutical products. Increased standards of living also increase regulation and growing environmental awareness. These trends result in greater demand for flame retardants, bromine and chlorine based biocides for water treatment, and bromine , magnesia and potassium chloride based intermediates for the pharmaceutical industry.
Our Competitive Strengths
We attribute our success to the following strengths:
|
|
·
|
Unique portfolio of mineral assets.
We benefit from our access to resource-rich, long-life and low-cost raw materials, mainly potash and bromine. Our access to these resources is based upon exclusive concessions and licenses from the State of Israel for extraction of minerals from the Dead Sea and mining potash and salt from local governments in the United Kingdom and Spain. We also have access to phosphate rock in the Negev Desert based on mining concessions from the State of Israel. Access to these assets provides us with a consistent, reliable supply of raw materials, allowing us to produce our products on a large scale and in a cost-effective manner.
|
|
|
|
Dead Sea in Israel:
Our potash and bromine production facilities at the Dead Sea enjoy low production costs due to the high concentration and virtually unlimited supply of minerals contained in the Dead Sea, and the low cost of extracting minerals from the Dead Sea, compared to mining potash from underground deposits or extracting bromine from less concentrated sources, especially using solar evaporation to extract potash and bromine, which is a low-cost process, as compared to other energy-intensive alternatives. Furthermore, the hot and dry climate of the Dead Sea allows us to store
,
at a low cost, very large amounts of potash (exceeding one full year of production) outdoors. This advantage enables us to operate worldwide potash facilities at full production capacity despite periodic fluctuations in demand. In addition, we benefit from the geographic proximity of our facilities in Israel to seaports and from Israel’s geographic positioning vis-à-vis our main geographical markets (especially the fast growing markets of India, China and Brazil), reducing transportation and logistics costs. While we benefit from these advantages, we expect to incur significant infrastructure-related costs to fully harvest salt from Pond 5 at our Dead Sea complex, which is our central evaporation pond, to avoid the need to continue to raise the water level in the pond. In addition, while the supply in the Dead Sea is virtually unlimited, our access to this supply of potash and bromine pursuant to the concession is subject to the need to construct a new pumping station. There is also a
possibility that we will be required to pay taxes and royalties in the future at a higher rate, and specifically following the conclusions of the Second Sheshinski Committee concerning the State's royalties from private entities including the Company, for the use of national natural resources such as potash and phosphate. See “Item 3. Key Information—D. Risk Factors—Risks Related to Our Business”
.
|
|
|
|
United Kingdom and Spain mineral assets:
In addition to our operations in Israel, we mine potash in the United Kingdom and Spain. Access to these assets provides us with production and logistics flexibility, geographical proximity to European customers
,
business diversification and additional reserves for future growth.
|
|
|
|
Our integrated phosphate value chain:
Due to our access to the phosphate rock in the Negev Desert, we are the only sizeable downstream fully backward integrated phosphate player. We mine and process phosphate rock from three open-pit mines in the Negev Desert under mining concessions with the State of Israel. Approximately three-quarters of the phosphate rock produced is used internally to manufacture phosphate fertilizers and phosphoric acid, with the balance sold to external producers. See “Item 3. Key Information—D. Risk Factors—Risks Related to Our Business—Our mining operations are dependent on concessions, licenses and permits granted to us by the respective governments in the countries where they are located.”
|
|
|
·
|
Diversification into higher value-added specialty products leveraging our integrated business model.
Our integrated production processes are based on a synergistic value chain that allows us to both efficiently convert raw materials into value-added downstream products and utilize by-products. For example, in phosphates we utilize our backward integration to produce higher-margin specialty phosphates used in the food industry and engineered materials applications. Our food ingredients provide solutions for improved texture and shelf-life for meat, dairy and bakery products. In addition, as a by-product of our potash production at the Dead Sea, we generate brines with the highest bromine concentration globally. Our bromine-based products serve the electronics, construction, oil and gas and other industries. Our potash mine in the United Kingdom also contains another mineral (polysulphate) which can be mined using the same infrastructure and addresses unmet emerging mineral needs of the global agricultural industry
.
|
|
|
·
|
Leading positions in markets with high barriers to entry.
We are a global leader in many of the key markets in which we operate, including PK fertilizers, specialty fertilizers and phosphates, elemental bromine and phosphate based food additives. We believe we are generally ranked among the top three leaders in our markets, as shown in the table below:
|
|
Product
|
Rank in international market
|
End-Markets
|
||
|
Potash
|
#2 in Western Europe and
#6 Worldwide
|
Agriculture
|
||
|
PK fertilizers (complex fertilizers based on potash and phosphate)
|
#1 in Western Europe
|
Agriculture
|
||
|
Specialty fertilizers CRF and MKP
|
#1 Worldwide in MAP/MKP soluble fertilizers,
#2 (tied) in Europe in controlled release fertilizers and
#1 in the United States in controlled release fertilizers
|
Agriculture
|
||
|
Phosphate-based food additives
|
Top 3 Worldwide
|
Food
|
||
|
Specialty phosphates
|
Top 2 Worldwide
|
Food and Engineered Materials
|
||
|
Elemental bromine
|
#1 Worldwide
|
Engineered Materials
|
||
|
Phosphorus-based flame retardants
|
#1 Worldwide
|
Engineered Materials
|
||
|
Forest fire retardants
|
#1 Worldwide
|
Engineered Materials
|
|
|
·
|
Most of our businesses rely on natural resources that are scarce and concentrated in the hands of a few market participants, making it difficult for new competitors to enter our businesses. Our exclusive concessions, intellectual property (unique knowledge, technologies and patents for various products and applications), world-wide marketing and distribution network and high industry start-up costs for new market entrants further add significant barriers to entry.
|
|
|
·
|
Strategically located production and logistics assets.
We benefit from the proximity of our facilities, both in Israel and Europe, to developed economies (Western Europe) and emerging markets (such as China, India and Brazil). For example, in Israel, we ship from two seaports: the Port of Ashdod (with access to Europe and South America) and the Port of Eilat (with access to Asia, Africa and Oceania). Access to these two ports provides us with two distinctive advantages versus our competitors: (1) we have lower plant gate to port costs and ocean freight costs, and transportation costs from ports to target market, which lowers our overall cost structure and (2) we have faster time to markets due to our proximity to end-markets, allowing us to opportunistically fill short-lead time orders, strengthening our position with our customers. In addition, we are the sole producer with the ability to transport potash and phosphates from the same port (which we do in Israel). Our sales are balanced between emerging markets (approximately 34% of 2014 sales) and developed economies (approximately 66% of 2014 sales).
|
|
|
·
|
Significant operating cash flow generation and return on capital.
Our businesses generate significant amounts of cash flow. Thus for example, we generated $1,127 million and $895 million of operating cash flows in 2013 and 2014, respectively. We are able to generate significant levels of cash flow due to the size and scale of our business and our relatively high margins. These cash flows have enabled us to produce high returns on capital, appropriately maintain and expand our production facilities and take advantage of acquisition opportunities. In addition, since 2007, we have a policy of paying a quarterly dividend of up to 70% of our net income. This policy has resulted in an average dividend yield in the past five years of 6.3% (calculated based on the total dividend per share in NIS distributed from the net income in the years 2010 through 2014, including special non-recurring dividends in the amount of $500 million each distributed in the years 2010 and 2014, divided by the average price per share on the Tel Aviv Stock Exchange during these years).
|
|
|
·
|
Professional expertise and culture of collaboration and determination.
Our operations are managed by an international management team with extensive industry experience. We develop leaders with strong experience in their fields and the culture to drive change and innovation in our Company. We also bring in leaders from outside the Company to supplement our expertise. We focus on nurturing and empowering talent through a global platform of qualification, collaboration and communication that reinforces innovation.
|
Our Strategy
Our “2020—Next Step Forward” corporate strategy is targeted to fulfill essential needs in our three core markets. We have developed a strategic plan based on three value creating pillars: (1)
Efficiency
: improvement of existing operations; (2)
Growth
: organic and external expansion of our value chain, from specialty minerals to the agriculture, food and engineered materials markets; and (3)
Enablers
: creating one global ICL, strengthen innovation, provide an empowering environment for our employees and align management with our external and internal stakeholders to support our growth and efficiency goals. We intend to implement this strategy while maintaining our strong financial position and our current dividend policy of distributing up to 70% of our net income.
Our key strategic initiatives include:
|
|
·
|
Continuously improve the cost base of our distinctive mineral asset base.
We have identified, and have started implementing cost reduction initiatives in our potash and phosphate operations. At our facility in Spain, we are consolidating our activities from two facilities into one facility while maintaining our production capacity. This will help us lower our fixed costs of production. At Cleveland Potash in the United Kingdom, we are upgrading our mining and production facilities to improve utilization rates, which will significantly reduce fixed costs per ton. Finally, at the Dead Sea facilities in Israel, we are implementing process efficiencies to maximize our utilization rates and reduce the workforce to further reduce production cost per ton. In phosphates, we created a significant reduction in our cost base by implementing an efficiency plan at our Rotem site, including headcount reductions and process improvements to increase utilization rates. The program has already delivered almost $30 million in annualized savings due to Rotem's operational excellence and production records in second half of 2014 and the reduction in labor costs as a result of the implementation of the early retirement plan. The contribution of the plan was partial in 2014, and beginning in 2015, we will benefit from the entire contribution of the plan. Regarding the plan for efficiency and integration of the global processes into our Company, as well as the plan for reducing the production cost of our specialty minerals pursuant to the strategic plan described above, we estimate that these activities, the execution of which we have already started and delivered contribution of approximately $100 million in 2014, will increase savings by the end of 2016 in the amount of approximately $350 million annually compared with 2013.Our estimate is based on a projection made by our management based on the experience we have accumulated and on actual process improvements. While the cost savings and efficiencies to be generated by our strategic plan described above are presented with numerical specificity, and we believe such targets to be reasonable as of the date of this Annual Report, the manner of implementation of the strategic plan and the expected timing thereof and its impact may be different, possibly even significantly different, than that forecasted. It may be difficult to reduce costs due to various factors, including the situation prevailing in the market, competition, strikes, regulation and the risk factors characterizing our activities. Accordingly, our actual results may differ from these targets and the differences may be material, particularly if actual events differ significantly, possibly adversely, from one or more of our key assumptions. We caution investors not to place undue reliance on any of these assumptions and targets. See “Special Note Regarding Forward-Looking Statements” for additional information regarding these forward-looking statements and risk factors.
|
|
|
·
|
Expand our production capabilities and reserves base.
We plan to increase our total potash sales by at least 2 million tons in the next decade, while reducing costs. This will be achieved through removing bottlenecks and improving utilization rates in Israel, England, and Spain (where we intend to invest approximately $435 million in growth and efficiency initiatives) and by increasing production capacity. At CPL we are extending the mining area to provide additional reserves and to increase our low cost polysulphate production, a new fertilizer targeting low sulfur soils. Additionally, in Spain we have potential to further expand potash capacity by approximately an additional 1 million tons by 2024. In 2014, we signed a strategic agreement with Allana Potash, a publicly traded company in Toronto, Canada (in which we have an equity investment of 16.4% with option to increase to 37%) to develop the first potash mine in Ethiopia (and in Africa). Allana estimates that production will commence within less than 5 years and ICL has secured an off-take agreement for output of the mine. In phosphates, we are increasing our production in Rotem by approximately 15% by improving utilization rates. In addition, we are seeking governmental and municipal approvals for a new mining site—Barir field—in the Negev Desert in Israel, which, if granted, will provide further cost savings and increased scale through a focused investment program. See “Item 3. Key Information—D. Risk Factors—Risks Related to Our Business. Our mining operations are dependent on concessions, licenses and permits granted to us by the respective governments in the countries where they are located”. Furthermore, we are assessing additional phosphate reserves in emerging markets with an intention to develop a full phosphate value chain in key regions in the world. Consistent with this strategy, in December 2014 we entered into a strategic alliance with Yunnan Yuntianhua – a step that almost doubles ICL’s global phosphate market share. ICL will invest up to $500 million for a 50% stake of a newly formed JV controlled by ICL, that will have major global phosphate operations in China with annual capacity of more than 1 million tons of fertilizers and other downstream products, with backward integration into world-scale phosphate rock mines with approximately 100 million tons reserves, in addition to 15% ownership of Yunnan Yuntianhua Co. Ltd. (China’s leading producer of phosphate rock and fertilizers and a public company traded on the Shanghai Stock Exchange). Within five years, JV is expected to deliver revenues of approximately $700 million with high EBITDA margins. Transaction closing is expected in the first quarter of 2016, subject to approvals from the various government and regulatory bodies.
|
|
|
·
|
Expand market demand for our products.
In potash, we will continue our investment in educating emerging market farmers on the economic benefits of fertilization with optimal levels of potash. In particular, we are focusing on India and Africa due to our current position in these markets, our proximity to them and the currently low use of fertilizers in these markets. We launched the “Potash for Life” project in India and set up 680 demonstration plots in 9 states and over 40 districts, and the “Potash for Growth” project in Ethiopia, where we set up 600 demonstration plots. We plan on expanding our program to several hundred additional farmers during 2015. This demand creation is intended to secure above average sales growth in potash for us. We intend to continue to leverage our bromine assets through the development of new products and new applications by increasing our R&D spending and utilizing our industry expertise, and through collaborations with others and by advocacy, for example, advocating for fire safety and mercury control regulations in emerging markets.
|
|
|
|
Grow our value-added downstream products.
As part of our growth strategy we intend to use our strong cash flow to further expand our specialty and value added products organically and through acquisitions. This will allow us to create strong growth in our businesses and continue to evolve from a product based to a market focused organization. In the fast growing and high return on assets specialty fertilizers business, we are improving our core technologies and expanding our geographical reach in liquid fertilizers, advanced coated fertilizers and soluble fertilizers. Consistent with this strategy, in August 2014 we acquired AmegA Sciences, an innovative industry leader and developer and manufacturer of specialty products for the agricultural markets, horticulture, grass, and convenience facilities markets, including solutions for water conservation, water retention and enhanced growth.
As part of the expansion of the company’s products portfolio in the specialty fertilizers, the company is examining options to erect a potassium nitrate production plant with a capacity of about 200Kt to enable ICL to increase its production of soluble fertilizers and food-grade phosphoric acid.
In food, we intend to expand our existing phosphate based texture and stability solutions to emerging markets. In addition, we are constantly collaborating with our customers to develop new formulations. The next phase of this strategy is to leverage our expertise and technology in enhanced texture and stability solutions beyond additives based solely on phosphates, including through acquisitions, strategic partnerships and joint ventures. In January
2015, we set a key milestone in ICL’s Food strategy with the acquisition of Prolactal – a leading European producer of dairy proteins for the food and beverage industries (approximately € 100 million revenues, 200 employees). On March 13, 2015, the transaction was closed. This acquisition should increase ICL’s ability to service its existing clients by offering them a broader selection of
texture and stability ingredients, to better meet the growing demand by consumers for food and beverages with higher protein levels. Finally, in engineered materials, we intend to utilize our expertise and technology to develop bromine and phosphate based solutions for industrial applications. In late 2014, ICL completed an a
cquisition of Fosbrasil, Latin America’s main producer of purified phosphoric acid for the food market and specialty fertilizers
. With the Fosbrasil acquisition, ICL will become South America’s market leader in specialty products for food, engineered materials and specialty fertilizers. With respect to our activities that do not constitute our core businesses, divestitures are on track to achieve net proceeds (enterprise value net of taxes) of $300-500 million. The divestitures of ICL’s APW (aluminum, paper, and water) businesses, Rhenoflex, Medentech and Anti-Germ businesses were completed, for the most part, after December 31, 2014 and generated almost $300 million in net proceeds. Additional divestiture opportunities in our non-core businesses include IDE, Clearon and Pharma/Cosmetics/Gypsum businesses.
|
|
|
·
|
Further develop and enhance our “One ICL” culture and empower our employees.
In order to achieve our strategies and continue to carry out our evolution from a natural resources company to an essential needs company, we believe we must continue to enable our employees to thrive within our organization through implementation of our “One ICL” strategy. Under our “One ICL” strategy, we are working to harmonize our systems (for example, by moving to a single global enterprise resource planning system) and processes and better share best practices across our Company to ensure that we provide the best services in our end markets and to avoid product or divisional silos. We will continue to identify and reward top performing employees and will promote them to the right locations within the organization where they can be most effective, while incentivizing them through appropriate remuneration and performance assessments that will help us achieve our goals.
|
Our History
ICL was established in 1968 as a government company in Israel and operate today as a limited liability company under the laws of Israel. In 1975, the shares of various development companies (including, among others, Dead Sea Works, the companies today consolidated as Rotem, the bromine companies and Tami) were transferred to us. In 1992, following a decision by the Israeli government to privatize our Company, Israel published its tender prospectus, 20% of the Company’s shares were sold to the public and its shares were registered for trading on the Tel Aviv Stock Exchange. Prior to our public share issuance, a Special State Share in our Company and our main Israeli subsidiaries was issued to the State of Israel. In 1995, the State of Israel sold its controlling interest in us (representing approximately 24.9% of our shares) to Israel Corporation, which was controlled at that time by the Eisenberg family. A majority of the ordinary shares held by Israel were sold during the following years. In 2000, the State of Israel ceased to be a stakeholder in terms of holding any ordinary shares in us, but it retained the Special State Share. In 1999, the Ofer Group acquired the Eisenberg family’s shares in Israel Corporation. In September 2014, we listed our shares on the New York Stock Exchange, and they are currently traded in Tel Aviv and in New York.
As of December 31, 2014, Israel Corporation holds approximately 49.2% of our outstanding ordinary shares and approximately 46.18% of the shareholders’ voting rights. With respect to any ordinary shares subject to the forward sale agreements, and made available to the forward counterparties under these agreements, Israel Corporation will cease to have voting rights with respect to these ordinary shares and will, at the relevant settlement dates, regain voting rights with respect to all or a portion of the ordinary shares it makes available to the forward counterparties under these agreements if it elects cash settlement or net physical settlement.
The following is a list of significant acquisitions and joint ventures that have contributed to the growth of our business since 1968:
|
|
·
|
Our acquisition of Giulini Chemie, a specialty chemicals company based in Ludwigshafen, Germany, in 1977;
|
|
|
·
|
Our acquisition of a fertilizer plant in Amsterdam, Holland, in 1982;
|
|
|
·
|
Our acquisition of Clearon Corp., a manufacturer in the United States of biocides for water treatment, in 1995;
|
|
|
·
|
Our acquisition of BK Ladenburg, a chemical company based in Ladenburg, Germany, in 1996;
|
|
|
·
|
The commencement in 1997 of our magnesium production operations in Israel in a joint venture with Volkswagen;
|
|
|
·
|
Our acquisition in 1998 of control of Iberpotash, our Spanish mining operation and our subsequent acquisition of the remainder of Iberpotash;
|
|
|
·
|
Our acquisition, primarily in 2000, of the publicly held minority interests in several of our principal subsidiaries;
|
|
|
·
|
Our acquisition of Cleveland Potash, our mining operation in the United Kingdom, in 2002;
|
|
|
·
|
Our acquisition of a 51% interest in BKGLC in China in 2004;
|
|
|
·
|
Our acquisition of operations and assets for our Performance Products segment from Astaris LLC, a U.S. company, in 2005;
|
|
|
·
|
Our acquisition of Supresta, a manufacturer of phosphorus based flame retardants and other products with plants in the United States and Germany, in 2007;
|
|
|
·
|
Our acquisition of the water treatment unit of the Henkel Group, a Germany company, in 2008;
|
|
|
·
|
Our five acquisitions, mainly in the fields of food hygiene and potable water, in 2009: Medentech (Ireland), Primalab (France), Argochem and Merak (Eastern Europe), Metakorn (China) and Edda, Hyproclean and the cleaning products division of Ukline (Germany);
|
|
|
·
|
Our acquisition of shares in Nutrisi Holdings in 2011, resulting in 100% ownership of Nutrisi Holdings, a Belgian holding company that owns 50% of Nu3, a manufacturer of soluble NPK fertilizer components;
|
|
|
·
|
Our acquisition in February 2011 of the companies, assets and activities of business unit in the specialty fertilizers area owned by the U.S. company, Scotts Miracle Gro Company (subsequently renamed Everris);
|
|
|
·
|
Our acquisition in April 2011 of 100% ownership of A. Fuentes Mendea S.A., a Spanish company engaged in the production and marketing of specialty fertilizers in Spain;
|
|
|
·
|
Our acquisition in December 2011 of 50% of the shares of Tetrabrom Technologies Ltd., raising our shareholdings to 100% of the share capital of Tetrabrom;
|
|
|
·
|
Our acquisition of all of the shares of the Belgian company Nu3 NV and sale of all of our shares in the Dutch company Nu3 BV, due to the liquidation of the Nu3 partnership, at the end of 2012;
|
|
|
·
|
Our acquisition in February 2013 of the assets and production operations of Knapsack, a factory in Germany used for marketing and producing P2S5 phosphates; and
|
|
|
·
|
Our acquisition of Hagesud Group, a German producer of premium spice blends and food ingredients for meat processing, in January 2014.
|
|
|
·
|
In February 2014, we signed a strategic agreement with Allana Potash (“Allana”), the shares of which are traded on the Toronto Stock Exchange, in connection with the development of a potash mine in Ethiopia. For additional information, see “—B. Business Overview—Fertilizers”.
|
|
|
·
|
In August 2014, we acquired AmegA Sciences, an innovative development company and industrial leader from England of products for special agricultural markets, landscaping, grass, and convenience installations, including solutions related to water savings, water conservation, and growth enhancement.
|
|
|
·
|
In August 2014, we announced that we reached an agreement with Albermarle to set up a joint venture for the production of polymer combustion inhibitors. The joint venture will operate a plant in Holland, with annual production capacity of 2,400 tons, and a plant in Israel with annual production capacity of 10,000 tons.
|
|
|
·
|
In December 2014, we concluded the acquisition of 100% of Fosbrasil (increasing our holdings from 44.25% to 100%), the leading manufacturer in Latin America of purified phosphoric acid for the food and special fertilizer markets and a manufacturer of secondary products based on phosphates and special fertilizers.
|
|
|
·
|
In December 2014, we signed a strategic partnership agreement with Yunnan Yuntianhua, the second largest chemicals manufacturer in China and the third largest phosphate manufacturer in the world, to operate a joint venture (50/50), under our control, of phosphate operations including full vertical integration, which includes a world-scale phosphate mine and manufacture of secondary products. For additional information, see “—Business Overview—Fertilizers.”
|
|
|
·
|
In January 2015, the Company signed an agreement for acquisition of Prolactal, a leading European company that manufacturers milk proteins for the food and beverage industry. On March 13, 2015, the transaction was closed.
|
Segment Information
We are a leading multinational company that operates mainly in the areas of fertilizers and specialty chemicals, in three segments: Fertilizers, Industrial Products and Performance Products. In addition, we have other operations that include water desalination and magnesium manufacturing.
Fertilizers
Our Fertilizers segment develops, manufactures, markets and sells fertilizers that are based primarily on potash (potassium chloride) and phosphate. In 2014, the total sales of our Fertilizers segment were approximately $3,402 million and accounted for approximately 56% of our total sales (including sales to other segments of the Company), while operating income for the segment totaled approximately $670 million, representing approximately 88% of our total operating income. Our Fertilizers segment is also a key player in the specialty fertilizers market.
Our Fertilizers segment did not have any single customer that accounted for more than 10% of the Company’s total sales in 2014.
Nitrogen, phosphorus and potassium (N, P and K) constitute the three major nutrients required for plant growth. There are currently no artificial substitutes for phosphorus and potassium (which are supplied by the Company). These three nutrients are present in the ground, however the continued use of the soil for agricultural crops depletes the concentration of these fundamental elements in the ground over time, and could result in a decline in crop yields, and therefore this deficiency must be replenished from external sources through the use of fertilizers. We sell phosphorus based and potassium based products.
Each of these three nutrients plays a different role in plant development. Potassium and phosphorus are vital for physiological processes of the plant, including strengthening cereal stalks, stimulating root development, leaf and fruit health, and accelerating the growth rate of crops. Without these nutrients, crops cannot achieve their growth potential. Potassium also enhances a plant’s ability to withstand drought and cold, improves the efficient use of nitrogen and other nutrients necessary for plant development, and improves the durability of agricultural produce in storage and transportation, thereby prolonging the shelf life of produce.
In the short term, demand for fertilizers is volatile and seasonal, and is affected by factors such as weather in the world’s key agricultural growing regions, fluctuations in planting main crops, agricultural input costs, agricultural product prices and developments in biotechnology. Some of these factors are influenced by subsidies and lines of credit granted to farmers or to producers of inputs for agriculture in various countries, and by environmental regulations. In addition, currency exchange rates, legislation and international trade policies have an impact on the supply, demand and level of consumption of fertilizer worldwide. In spite of the volatility that may be caused in the short term as a result of these factors, we believe that the policy of most countries is to ensure an orderly and high quality supply of food to the population and to this end, to encourage agricultural production. Therefore, we expect the long term growth trend of the fertilizers market will be maintained.
Our Products
The main products of our Fertilizers segment are potash, fertilizers and phosphates, including specialty fertilizers. In 2014, potash represented approximately 52% of our Fertilizers segment’s sales (including sales from to other segments in the Company) and 80% of income from ordinary activities (including income from sales to other segments in the Company) while fertilizers and phosphates represented approximately 48% of our Fertilizers segment’s sales (including sales to other segments in the Company) and 20% of income from ordinary activities (including income from sales to other segments in the Company).
Potash
. Potash is the common name for potassium chloride, which is the most common source of potassium for plants. Our Fertilizers segment sells potash for direct application as a fertilizer and to compound fertilizer manufacturers. Our Fertilizers segment also uses potash for its own production of compound fertilizers, based mainly on phosphate and potash.
Our Fertilizers segment produces potash from the Dead Sea and from underground mines in Spain and the United Kingdom. The potash production process in Israel is based on extracting carnallite in a chemical process. The carnallite, which is a compound of potassium chloride and magnesium chloride, precipitates in some of the largest solar evaporation ponds in the world, which contain brines drawn from the Dead Sea. The carnallite containing salt is transferred to the plants where a chemical process breaks down the carnallite crystal into potash using two distinct parallel technologies (“hot” and “cold” crystallization).
Extraction of potash from underground mines in Spain and the United Kingdom is carried out by mining sylvinite (a mixture of potash and salt with varying potash concentrations. The potash is separated from the salt in production plants situated near the mines.
We also produce polysulphate (also known as polyhalite), which is a mineral used in its natural form as fertilizer for agriculture, fertilizer for organic agriculture and a raw material for production of specialty fertilizers. Polysulphate is composed of potash, sulfur, calcium and magnesium, which are essential components for improvement of crops and agricultural products. Our commercial sales of polysulphate started in 2012.
Fertilizers and Phosphates.
Phosphorus, which is derived from phosphate rock, directly contributes to a wide range of physiological processes in a plant, including production of sugars (including starch), photosynthesis and energy transfer. Phosphorus strengthens plant stems, stimulates root development, promotes flower formation and accelerates crop development.
The principal raw material used in the production of phosphate products is phosphate rock. Our Fertilizers segment mines phosphate rock from open pit mines located in the Negev Desert. In 2014, 73% of the phosphate rock produced was used to manufacture phosphate fertilizers and phosphoric acid. The remaining phosphate rock was sold to external producers who manufacture phosphoric acid and fertilizers and as a direct application fertilizer. The policy of our Fertilizers segment is to use most of the phosphate rock we produce to manufacture downstream products.
Our Fertilizers segment produces fertilizer grade phosphoric acid, phosphate fertilizers, compound fertilizers and specialty fertilizers at its facilities in Israel. Our Fertilizers segment also has facilities for the production of phosphate fertilizers and specialty compound fertilizers in the Netherlands, Germany, the United States, Spain, India and Belgium, as well as animal feed additives facilities in Turkey and in Israel. In addition to phosphate rock, phosphoric acid production also requires significant quantities of sulfur, which our Fertilizers segment purchases from third parties.
Most of the compound fertilizers manufactured by our Fertilizers segment are based on the elements phosphorus and potassium. Some of the compound fertilizers also contain nitrogen, which our Fertilizers segment acquires from third parties and incorporates with the phosphorus and potassium. Our Fertilizers segment is active in developing downstream products based on phosphate rock, including phosphate fertilizers and compound and specialty fertilizers.
Specialty fertilizers allow more accurate application of the essential nutrients for plant development (phosphorus, potassium and nitrogen). These fertilizers include:
|
|
·
|
Controlled release fertilizers, which allow accurate release of nutrients over time, and slow release fertilizers, which allow very slow release of nutrients (nitrogen and potassium only). These fertilizers have a special coating that allows prolonged release of nutrients (over several weeks to several months, compared to regular fertilizers that dissolve in the soil and are available for up to four weeks);
|
|
|
·
|
Soluble fertilizers, which are fully water soluble, and fully soluble NPK compound fertilizers, commonly used for fertilization through drip irrigation systems and foliar spraying to optimize fertilizer efficiency in the root zone and to maximize yields;
|
|
|
·
|
Liquid fertilizers, used for intensive agriculture and integrated in irrigation systems (mainly drip systems);
|
|
|
·
|
Peat, a growing medium for various crops, usually containing controlled release fertilizers and crop protection products.
|
Since 2011, we have acted to significantly expand our specialty fertilizer operations by completing the acquisition of the following companies:
|
|
·
|
Everris (formerly Scotts Global Pro), a multinational company, whose core activity is the manufacture and sale of high quality specialty fertilizers, including controlled release, slow release and soluble fertilizers;
|
|
|
·
|
Fuentes Fertilizantes, a leading company in Spain that manufactures and distributes liquid and soluble fertilizers, NPK compounds and conventional fertilizers;
|
|
|
·
|
Nu3, a manufacturer of soluble NPK fertilizer components; and
|
|
|
·
|
AmegA, which develops advanced solutions for saving water, preserving water and improved absorption of the fertilizer by the plant.
|
Production
Our Fertilizers segment’s principal production facilities include its plants in Israel (potash, phosphate rock, sulfuric acid, phosphoric acid, phosphate fertilizers, special compound fertilizers, liquid fertilizers and soluble NPK fertilizers), Spain (potash, raw salt, soluble fertilizers and NPK based compound fertilizers), the United Kingdom (potash, polysulphate, raw salt, products for preserving water and improving absorption of the fertilizer by the plant, and peat as growing media), the Netherlands (mainly fertilizers based on phosphate and potash and slow release and controlled release fertilizers), Germany (mainly fertilizers based on phosphates and potash), Belgium (soluble NPK fertilizers), India (soluble NPK fertilizers), the United States (slow release and controlled release fertilizers and soluble NPK fertilizers) and Turkey (phosphate based products used as animal feed additives).
Our Fertilizers segment’s manufacturing plants, distribution centers and sales offices are set forth in the map below.
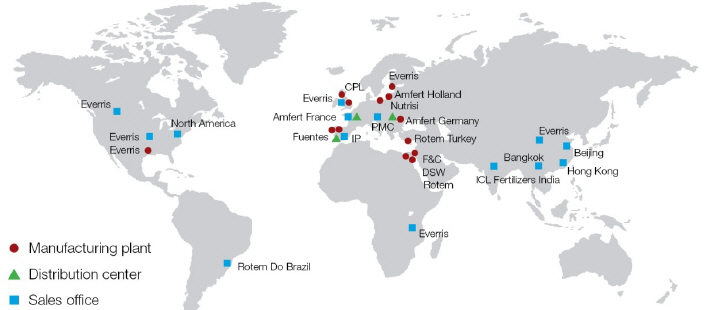
Our current annual potential potash production capacity is approximately 6.5 million tons of potash, 4.5 million tons of phosphate rock, 1.9 million tons of phosphate fertilizers and compound fertilizers, 220 thousand tons of soluble fertilizers, 450 thousand tons of liquid fertilizers, 110 thousand tons of controlled release fertilizers and 300 thousand tons of peat. The potential production capacity of our various plants is based on the hourly output of the plants, multiplied by potential hours of operation per year. This calculation assumes continuous production over the year, 24 hours a day, with the exception of a few days for planned maintenance and renovations. Actual production is usually lower than potential production capacity, due to unexpected breakdowns, special maintenance operations, availability of raw materials and market conditions. We expect to increase our actual potash production to approximately 6 million tons per year by 2018.
Our production of potash increased at an average annual growth rate of 1.9% between 1973 and 2014, and ICL Fertilizers has completed a plan in 2014 for a further, gradual increase of between 300,000 and 500,000 tons per year in potash production capacity at the Sodom facilities. This investment has effectively created surplus production capacity at our production plants in relation to the production capacity of raw materials at our evaporation ponds, thereby adding flexibility to our production process and optimizing the timing of production and sales over time.
In 2011, our Board of Directors approved the consolidation of Iberpotash’s operations from two sites to one site, as part of an efficiency plan with respect to Iberpotash. As part of this plan, production at the Suria site in Spain, which includes a mine and a plant, will be expanded gradually, and the mining and production activities at the second site will be discontinued. In the first stage of the plan, we have commenced digging an access tunnel to the mine and expanding potash production at the mine and potash granulation capacity, In addition, the first stage will entail establishing a production plant for vacuum salt (salt with high chemical purity) at Suria. At the end of 2014, the Board of Directors approved the second stage, which includes a further expansion of the potash production capacity, to 1.1 million tons, commencing in 2017, of which approximately 50,000 tons would be technical-grade potash, and the Company also plans to reach a potential production capacity of approximately 1.5 million tons of vacuum salt. We also expect our granulation capacity to grow to a level of approximately 1 million tons per year. We estimate that implementation of the first stage of the plan, at an estimated investment of approximately €196 million (approximately $238 million), will be completed by the end of 2015. We believe that implementation of the first stage of the plan will reduce expenses and contribute to streamlining, which will reduce potash production costs and contribute to conformity of production with environmental standards. Implementation of the second stage will result in higher potash production at one site compared to the present situation of production at two separate sites. Furthermore, the third stage of the plan in Spain includes additional future expansion that is expected to increase the total potash production at Suria to approximately 1.4 million tons in the future.
To help achieve these expansion plans in Spain, on June 19, 2014, one of our subsidiaries, ICL Iberia (“ICL Iberia”), signed a memorandum of understanding with the Dutch company Akzo Nobel Chemicals International B.V. (“AkzoNobel”), a leading producer of vacuum salt in Europe for the chemicals industry, for establishment of joint ventures for the processing and packaging of an annual quantity of 1.5 million tons of vacuum salt for various industrial applications and an annual quantity of 50,000 tons of white potash. The entire amount of the vacuum salt will be sold to and marketed exclusively by AkzoNobel to the European market and other markets outside Europe. The entire amount of the white potash will be sold and marketed exclusively by us. It was agreed that ICL Iberia and AkzoNobel will act to formulate a set of agreements that will govern the relations between them and between the new companies that will be incorporated for purposes of the joint ventures, for a period of 30 years. The memorandum of understanding was extended up to March 31, 2015 or until any other date that the parties may mutually agree to. If a definitive set of agreements is not signed by such date, the memorandum of understanding will cease to be effective. However, there is no certainty that this transaction will ultimately be completed, including on the dates indicated.
We also are undertaking other initiatives to expand and diversify our potash resources. In the United Kingdom, we are working to extend our mining area to increase reserves and increase utilization of the polysulphate resources in order to increase our production. In the United Kingdom. we commenced implementation of an investment plan, in the overall amount of £38 million, to expand the production and mining capacity of polysulphate, an innovative sulphate fertilizer composed of a number of nutrients, from the present output of approximately 130 thousand tons to approximately 600 thousand tons a year.
In February 2014, ICL signed a strategic agreement with Allana, a company traded on the stock exchange in Toronto, regarding development of a potash mine in Ethiopia. Based on feasibility studies, Allana believes that after the development period, the mine will produce about a million tons of potash per year for a period of 25 years from the end of the development period of the mine. Pursuant to the agreement, the Company acquired units in Allana (including shares and options), in the amount of approximately $23 million. The Company holds approximately 16% of Allana’s shares, with an option to increase its holdings to approximately 37% of Allana’s share capital. After completion of the project, Allana will have access to low cost potash in a location that provides access to the African market and is located only 400 miles from Djibouti, a port on the Red Sea that has access to the Indian and Southeast Asian markets. In addition, the Company signed an exclusive offtake agreement with Allana whereby the Company will acquire the mine’s output. Under the agreement, the Company will support Allana and will provide it technical and engineering support in connection with development and operation of the mine. The contemplated mine received environmental approval in March 2013, and a mining license in October 2013, and it has won wide support from the Ethiopian authorities due to the opportunity for economic and social development in the Afar region in Ethiopia and in Djibouti.
We are also exploring ways to increase our phosphate reserves, including through the Barir field in Israel – see “Item 4. Information on the Company – Business Overview – Concessions and Mining Rights”. In addition, we are assessing additional phosphate reserves in emerging markets with the intention of developing a full phosphate value chain in key regions of the world. Consistent with this strategy, in December 2014, ICL signed a strategic partnership agreement with Yunnan Yuntianhua – the second largest chemical producer in China and the third largest producer of phosphates in the world – to establish a joint venture (50/50), to be controlled by ICL, having fully backward integrated phosphate activities, with a world scale phosphate mine and downstream operations. The value of the transaction is estimated at approximately $452 million. For purposes of strengthening the strategic partnership between ICL and Yunnan Yuntianhua, and to create added value for their shareholders, approximately $269 million of ICL’s investment will be used to acquire a strategic holding in Yunnan Yuntianhua, China’s leading producer of phosphate rock and fertilizers, which is traded on the Shanghai Stock Exchange (Shanghai: 600096). The new shares to be issued will constitute 15% of the capital of Yunnan Yuntianhua, immediately following the issuance to ICL. The balance of the deal value, in the amount of approximately $183 million, is in the joint venture for production of phosphates (plus a net debt of $100 million, our share). Completion of the transaction is expected to take place in the first quarter of 2016, subject to approvals from various government and regulatory bodies. The joint venture will leverage the production expertise, technical capabilities and marketing prowess of the two companies and will include a joint R&D platform for development of new products and processes. The joint venture will increase ICL’s phosphate platform by more than 50% and will expand the phosphate’s end to end business model, which spans the entire value chain, to additional attractive geographical regions. Together with ICL’s existing specialty phosphate activities, which total approximately $2 billion, in Europe, North America and Brazil, the joint venture will give ICL other important capabilities: the transaction will turn ICL into the largest and most competitive player through expansion of the phosphate platform into the growing Chinese and Asian markets; the acquisition nearly doubles ICL’s global market share in the area of phosphates, and it makes ICL a new central player in the rapidly growing markets in China and Asia for fertilizers, food additives and complex substances, the joint venture will provide ICL diversified and competitive activities on a global scale in its three main markets: China, Southeast Asia and India; strengthen the position of ICL’s specialty phosphate unit as a leading global player having backward integration and the largest basket of specialty products; balancing of ICL’s global supply chain from two integrated sites – one in Israel and one in China – in order to provide better service to its customers in Europe, America and Asia, while taking full advantage of synergies in the supply chain and in the investments; potential for significant expansion and utilization of synergies; upgrading and expansion of the purified phosphoric acid production facilities, expansion of the downstream product activities, and altering the commodities-to-special-products ratios from 90/10 to 50/50 by utilizing ICL’s know-how; offering higher value-added products; expanding bulk fertilizers production via debottlenecking; and improving utilization and processes; execution of the transaction at the present time will enable us to take advantage of the current low phosphate prices in order to ensure long term reserves and a market share in growing markets.
Competition
Potash
. The potash market is characterized by a relatively small number of manufacturers, some of which export jointly. See “Item 3. Key Information—D. Risk Factors—Our operations and sales are subject to volatility of market supply and demand and we face significant competition from some of the world’s largest chemical and mining companies.” The ability to compete in the market is dependent mainly on production costs and logistics. Moreover, there are high entry barriers for new players. The barriers to entry in the potash market are high due to the large investments required to establish production plants for basic minerals and the relatively long time required to establish these plants. In addition, this industry requires appropriate concessions and proximity of production facilities to mines.
The significant competitors of our Fertilizers segment in international trade in the potash sector are Potash Corporation of Saskatchewan (Canada), Belaruskali (Belarus), Mosaic (Canada and the United States), Uralkali (Russia), K+S (Germany), Agrium (Canada), APC (Jordan) and SQM (Chile).
Although there is currently excess capacity in the industry, various companies have announced plans to develop new mines and other companies have announced plans to expand their production capacity. There is uncertainty in respect of realization of these plans and the time required for their achievement. In addition, a number of companies have announced that they are examining the possibility of entering the potash industry.
Fertilizers and Phosphates
. The phosphate fertilizer market is extremely competitive and competitors include international companies and government owned companies. The main competitive factor in the field of phosphate fertilizers is price. The ability to compete in the market is dependent mainly on production costs and logistics. For this reason, companies located in proximity to sources of raw materials, ports, and customers benefit from competitive advantages. An important factor in the area of raw materials (in addition to phosphate rock) is the accessibility to and the price of the sulfur and ammonia required for manufacture of the phosphate fertilizers. Additional factors that affect competition to a certain extent include product quality, range of products, service and the capacity to develop new products that provide unique solutions.
There are phosphate mines and production facilities in many countries, including Morocco, China, Russia, Jordan, the United States, Brazil, Saudi Arabia and Tunisia. The main phosphate producers who compete with us are Mosaic (United States), Potash Corporation of Saskatchewan (Canada), OCP (Morocco), Group Chimique Tunisienne (Tunisia), Vale (Brazil), the Roullier Group (Europe) and various Russian and Chinese producers. We believe a number of producers are approaching depletion of their higher quality reserves.
We believe our Fertilizers segment benefits from the following competitive advantages:
|
|
·
|
The low cost of potash production;
|
|
|
·
|
An integrated value chain that allows use of the phosphate rock mined in Israel for use in the production of its phosphate fertilizers rather than purchasing phosphate rock from third party suppliers;
|
|
|
·
|
Logistical advantages due to its geographical location, access to nearby ports in Israel and Europe and relative proximity to its customers;
|
|
|
·
|
Logistical synergies due to potash operations in Israel, where the hot and dry climate of the Dead Sea enables us to store, at very low cost, a large quantity of potash in an open area thereby allowing us to consistently produce at Sodom at full capacity, independent of fluctuations in global potash demand.
|
Raw Materials and Suppliers
We produce a significant portion of our primary raw materials, including potash and phosphorus, through our mining operations in Israel, Spain and the United Kingdom, as discussed further below. See “Item 4. Information on the Company—D. Property, Plant and Equipment—Mineral Extraction and Mining Operations” for further information on the Company’s mining operations.
The primary raw materials acquired from external sources are mainly sulfur and raw materials used to produce controlled release fertilizers, including ammonia, potassium hydroxide and coating materials. We seek to holds inventories of sulfur, phosphate and other auxiliary materials in quantities that take into account the projected level of production based on consumption characteristics, supply dates, distance from suppliers and other logistical considerations. The other primary components we use for production of potash are natural gas, electricity, industrial water and maintenance supplies.
Sales, Marketing and Distribution
The primary markets of our Fertilizers segment are Brazil, Europe, China and India. Our Fertilizers segment sells its fertilizer products primarily via a network of its own sales offices as well as sales agents throughout the world.
Most of our Fertilizers segment’s sales are not transacted by means of long term contracts or orders, but rather via current orders close to the date of supply. Consequently, the concept of a backlog has no significance for us.
The prices of potash and fertilizers are determined in negotiations between the manufacturers and the customers and are affected mainly by the relationship between the market demand and the available supply at that date as well as the size of the customer and term of the agreement. Prices for relatively long term contracts are not necessarily similar to spot prices (current/casual sales transactions).
In Indian and Chinese markets, it is customary to negotiate framework agreements with respect to potash, some of which are with commercial entities connected to the governments of those countries. Our Fertilizers segment has agreements in China with distributors and NPK fertilizer producers. Under these agreements, the agreed price is usually in effect for six months.
As part of framework contracts with its customers in China, in January – February 2014, ICL Fertilizers signed agreements to supply potash in the first half of 2014 on a scale that is substantially similar to the contracts signed with its customers for the first half of 2013. The contracts were signed at a price of $305 per ton CFR, representing a price reduction of approximately $95 per ton CFR compared with the contracts signed in 2013. During the second half of 2014, shipments of potash to the Company’s customers in China continued at “spot” sales prices, albeit at a slower rate than planned due to labor disputes at the Company’s factory in Sodom. In 2014, imports of potash into China reached a level of 8.03 million tons – the highest level since 2007 and approximately 21.3% higher than in 2013. In the Company’s estimation, the trend of increasing imports into China is expected to continue in 2015 due to an increase in consumption and logistics problems of the local producers.
After several years of low demand for potash in India, which stemmed from, among other things, the government’s subsidy policy that gave preference to nitrogen fertilizers, there was a significant improvement in imports of potash into India in 2014. Potash imports increased from 3.07 million tons in 2013 to 4.29 million tons in 2014. This increase was achieved notwithstanding the fact that there was no change in the subsidy policy and the prices to the end customers remained at the same level as they were during the last two years. In the first quarter of 2014, the potash manufacturers signed contracts for the agricultural year beginning on April 1, 2014 and ending on March 31, 2015 at a price that reflects a decline of $105 per ton compared with the price closed in the prior annual supply contracts in India in the beginning of 2013. In April 2014, ICL also agreed with its customers in India to supply potash for the 2014/2015 agricultural year in an aggregate quantity of approximately 825 thousand tons (including optional quantities). The selling price agreed to is approximately the same as the price set in transactions with other producers supplying potash to the Indian market. In the Company’s estimation, the trend of improvement in the demand for potash in India will continue in 2015 in light of the farmers having adapted to the higher price level, and thus will also support demand in the upcoming years.
In other markets, potash is usually imported by a larger number of customers, and the potash price is determined between the suppliers and the customers for shorter periods (quarterly, monthly or even for individual shipments). In these markets, we have trade relations with most of the major customers.
In Sodom, we benefit from being able to store very large amounts of potash (exceeding one full year of production) outside. Due to the hot and dry climate in Sodom, potash can be stored in piles in open areas. Therefore, potash production in the production facilities in Sodom is not necessarily dependent on the rate of sales. Output that is not sold is stored in open areas within the plant in Sodom. This advantage generally affords our Fertilizers segment greater production flexibility in Spain and the United Kingdom as well because we can sell from Europe while maintaining our main potash inventory in Sodom.
Regarding phosphate fertilizers, our strategy is to maximize profits by choosing whether to sell or store phosphate rock, fertilizer grade phosphoric acid, phosphate fertilizers or compound fertilizers or to produce pure phosphoric acid. The inventory policy is set accordingly.
Our Fertilizers segment ships its products from Israel to customers overseas on ships (mainly in bulk) that it leases in the marketplace and loads using designated facilities in the ports of Ashdod on the Mediterranean Sea and Eilat on the Red Sea. Our Fertilizers segment also has special port facilities for bulk loading in Barcelona (Spain), Amsterdam (the Netherlands), Ludwigshafen (Germany) and Teeside (UK).
Our Fertilizers segment grants credit terms to its clients according to customary practices in their locations. The segment’s credit sales are generally covered by trade credit risk insurance or by letters of credit from banks with high credit ratings.
Seasonality
The seasonal nature of demand for our Fertilizers segment’s products gives rise generally to quarterly sales fluctuations, as sales levels in the second and third quarters are generally higher than sales in the first and fourth quarters. In recent years, due to various influences on the timing of sales, primarily price fluctuations and the effects of negotiations in China and India and changes in the timing of fertilizer imports to Brazil, the effects of seasonality explained above have been reduced as compared to earlier periods.
Industrial Products
Our Industrial Products segment develops, manufactures, markets and sells bromine and phosphorus based flame retardants for the electronics, automotive and construction industries, bromine compounds for industrial and agricultural uses, clear bromine based brine fluids for the oil and gas drilling industry, and biocides for water treatment. These products are principally based upon bromine, magnesia, chlorine and salts from the Dead Sea and phosphorus and chlorine purchased from third parties. In 2014, the total sales of our Industrial Products segment were approximately $1,337 million and accounted for approximately 21.9% of our total sales (including sales to other segments of the Company), while the operating loss for the segment totaled approximately $62 million. The operating profit after eliminating unusual items totaled approximately $128 million. For additional information, see “Item 5. Operating and Financial Review and Prospectus.” In 2014, our Industrial Products segment used approximately 73% of the bromine it produced for its own production.
Our Industrial Products segment did not have any single customer that accounted for more than 10% of our total sales in 2014.
Bromine is a member of the halogen family that is known for its diverse uses in many industries. Bromine is used in the production of a range of bromine compounds. Bromine is found naturally in seawater, underground brine deposits and the Dead Sea. Its concentration varies depending upon its source. The method for extracting bromine depends on the nature of its source and its concentration. The lower the concentration of bromine in the brines, the more difficult and expensive it is to extract.
The Dead Sea is the world’s major source of bromine and the concentration of salts in the Dead Sea is significantly higher than the concentration in ordinary seawater. Although there are other sources of bromine around the world, about half of the global supply comes from the Dead Sea.
The operations of our Industrial Products segment are largely affected by the level of operations in the electronics, construction, automotive, oil drilling, furniture, pharmaceutical, agricultural, textile and water treatment markets. In 2014, 41% of worldwide use of bromine was for flame retardants, 6% was for water treatment, 18% was for clear brine solutions, 21% was for intermediates, 11% was for industrial uses and 3% was for other uses.
Flame retardants:
Pressure is increasingly being exerted by “green” organizations in the area of environmental protection to reduce the use of bromine based flame retardants. On the other hand, additional and new uses for bromine and its related compounds are being developed, along with regulation in additional countries that increases the use of bromine and bromine compounds. The economic slowdown in the world over the past several years triggered a slowdown in the demand for products in the electronics and construction industries. This trend, along with the decline in sales of personal computers due to increased use of tablets and smartphones, caused a decline in the demand for flame retardants, mainly bromine based flame retardants, and creation of pressure on the prices of these flame retardant products. Nonetheless, in 2014, there was a certain improvement in the demand for bromine based flame retardants for some uses in the electronics sector.
Elemental bromine:
In 2014, elemental bromine prices were relatively stable in the United States, whereas prices declined in Europe, China, and India.
Clear brine solutions:
Despite the decline in oil prices in the fourth quarter of 2014, the demand continued to be strong in the market for clear brine solutions for oil and gas drilling due to the relatively high number of drillings in the United States.
Biocides:
In 2014, the market for chlorine-based biocides for treatment of swimming pools was impacted by low prices as a result of a strategy by our competitors to increase their market shares. In the beginning of 2013, the U.S. Department of Commerce decided to impose anti-dumping taxes on manufacturers of chlorine based biocides from China, at the rate of about 30% to 38%. In the beginning of 2014, the anti-dumping taxes on the Chinese were increased by approximately 20%, and at the beginning of April 2014, the U.S. Department of Commerce gave notice of the imposition of anti-dumping taxes on Japanese manufacturers at a rate of 59% to 109%. The anti-dumping tax on Japanese manufacturers for 2015 was, however, cancelled in the fourth quarter of 2014. Growing demand for bromine based biocides used for water treatment continued in 2014.
The development of technology that allows the production of shale gas and its application in the United States creates additional business opportunities for us, among other things by increasing the demand for bromine based biocides for water treatment, although the recent trend of declining energy prices is acting to moderate these business opportunities.
Inorganic bromides:
The market for inorganic bromides for neutralizing mercury (Merquel® products) showed an increase in demand in 2014, due to increasing interest on the part of coal-based power stations to take advantage of Section 45 of the U.S. Internal Revenue Code of 1986, as amended (which grants a tax credit to stations that reduce mercury emissions). The increase also stems from the entry of new customers as part of the preparations for the entry into effect in 2015 of a new regulatory system in the U.S. that requires reduction of mercury emissions.
In early 2015, there was solid demand for flame retardants used in the area of connectors and televisions, and for clear brines fluids, although there is a high level of uncertainty in the market due to the decline in oil prices. Strong demand is continuing for bromine
-
based biocides for water treatment, mainly Fuzzicide. Furthermore, the strengthening of the dollar against the shekel is expected to positively affect costs.
Subsequent to the date of the financial statements, on February 2, 2015, the Workers Council of Bromine Compounds Ltd. of the Industrial Products segment commenced a full-scale strike in the Bromine Compounds production facilities in Naot Hovav and halted all transportation of goods from the factories. The strike at the Bromine production facilities is, among other things, a response to the efficiency program that we are implementing in Naot Hovav, as part of which, as at the date of the report, termination letters were sent to tens of employees covered by a collective bargaining agreement. For additional information, see “Item 6. Directors, Senior Management and Employees—D. Employees
.
Products
The following table sets forth the principal products of our Industrial Products segment, as well as their primary applications and primary end markets:
|
Product
|
Primary Application
|
Primary End Markets
|
||
|
Bromine- and Phosphorus-based Flame Retardants
|
Flame retardant additives
|
Electronics, Automotive, Construction, Furniture, Textiles
|
||
|
Elemental Bromine
|
Chemicals reagent, rubber ingredient
|
Tire manufacturing, Pharmaceuticals, Agriculture
|
||
|
Organic Bromine Compounds
|
Insecticides, solvents for chemical synthesis and chemical intermediates
|
Pharmaceuticals, Agriculture
|
||
|
Clear Brines
|
Completion fluids
|
Oil and Gas
|
||
|
Merquel
|
Mercury emission control
|
Emission control in coal fired power plants
|
||
|
Bromine- and Chlorine-based Biocides
|
Water treatment and disinfection
|
Pools, Spas, Cooling Towers, Paper, Sanitation and Disinfection, Oil and Gas Drilling and Fracking
|
||
|
Calcined and Specialty Magnesia
|
Magnesia derivatives, temperature control, antacid medication, food additives
|
Chemical, Rubber, Adhesives, Metallurgy, Food, Pharmaceuticals
|
||
|
Chlorine-based Salts (Magnesium, Sodium Chloride and Pure Potash)
|
De-icing, dust control, salt, electrolysis
|
Municipal, Textiles, Cosmetics, Food, Water, Electrochemicals
|
Our Industrial Products segment also develops innovative products and new applications for existing products. In 2014, our Industrial Products segment spent approximately $30
million on new product development and support and improvement of existing manufacturing processes. Our new products introduced in recent years include, among others, Merquel (inorganic bromides for neutralization of mercury), FR122P flame retardant (a bromine-based polymer flame retardant), TexFRon (a polymeric textile flame retardant product), FR-1410 (a bromine-based flame retardant), new products for polyurethane
,
and SaFRon 6605 (a phosphorus- and bromine-based product rigid polyurethane spray flame retardant for insulation systems in the construction industry).
Merquel.
Mercury emissions in the atmosphere have been proven to be detrimental to health. In February 2009, the United States announced a change in policy and even initiated an international treaty, which had already been signed by approximately 147 countries at the end of 2014, with the goal of reducing mercury emissions. In December 2011, a law was passed by the U.S. Environmental Protection Agency (“EPA”) that requires significant reduction of mercury emissions in the United States beginning in 2015. Concurrently, the United States continues to incentivize reductions in mercury emissions by providing tax credit. At the end of 2008, our Industrial Products segment launched a new product line, Merquel
®
, based on inorganic bromides, which together with certain technologies is targeted to enable efficient neutralization of mercury to the limits determined by the authorities (a 90% reduction in mercury emissions). Full application of the standards in all of the coal-fired power stations is expected by the first half of 2016 and will require use of significant quantities of inorganic bromides. Our Industrial Products segment has invested in an extensive logistics system in the United States to allow ongoing supply to the United States market and is making preparations to establish the production and logistics capacity required for stable supply to this market and to other countries that will adopt similar legislation.
In 2014, sales of Merquel
®
were approximately $28 million. In 2015, sales of this product are expected to show additional growth when application of the EPA regulation commences and additional power plants in the United States that use Merquel enter into service.
FR122P Flame Retardant.
In January 2012, we signed an agreement with the chemical company Dow Global Technologies to use certain of its patents and know-how to produce an innovative bromine-based polymer flame retardant, which is considered especially effective. We expect that the FR122P flame retardant will be a substitute for the HBCD bromine-based flame retardant that is currently used in the construction insulation industry
.
European authorities are currently studying the deferral of phasing out of HBCD beyond the original date determined – August 2015. Our Industrial Products segment has initiated production of FR122P at its plants in the Netherlands and in Israel. The plant in Israel has the capacity to produce approximately 10,000 tons and the Netherlands facility currently has the capacity to produce approximately 2,400 tons, or a total of approximately 12,400 tons per year.
At the end of August 2014, an agreement was signed with Albermarle and its related companies to establish a joint venture to manufacture FR122P. According to this agreement, if certain conditions precedent are fulfilled, including approval of the anti-trust authorities in several countries around the world, a joint venture will be established for the joint production of FR122P, under which joint companies will be established in Israel and in the Netherlands, to be owned, directly and indirectly, in equal shares, by companies of our Group on the one hand, and by Albermarle, on the other. As part of the joint venture, 50% of the production facilities of this product in the Netherlands and in Israel will be owned, directly or indirectly, by Albermarle, and our Group companies and Albermarle will conduct independent and completely separate marketing activities.
TexFRon.
In 2012, we began to sell TexFRon, a polymeric textile flame retardant product. We developed the TexFRon product line in-house as part of the R&D activities of our Industrial Products segment. TexFRon products are designed to provide high-level fire retardant solutions for textile and adhesive products and are an effective substitute for DECA (likely to be prohibited for use in Europe in 2017 at the earliest)
,
and offer enhanced durability compared to other existing products. In December 2014, the polymeric product TexFRon 4002 was recognized by Oekotex, a European standard for textile products. This product is the first bromine-based flame retardant that has received such recognition.
FR 1410
.
We recently began to sell FR 1410, which is a bromine-based flame retardant, following the expiration of our competitors’ patents. This flame retardant is primarily used in the electronics, construction and home appliance markets.
New Products for Polyurethane.
Our new products for polyurethane include the following:
|
|
·
|
Fyrol HF 5, which was developed and commercialized specifically in response to IKEA’s most recent update to their finished furniture specifications that imposed bans on specific flame retardants and substantially reduced VOC emissions from the flexible polyurethane components of their finished furniture goods. Ikea has specifically approved Fyrol HF 5 for use in its upholstered furniture products.
|
|
|
·
|
Fyrol HF 9, which was developed and commercialized in response to California’s addition of TDCP to the Proposition 65 list of substances designated by the State of California as known carcinogens. Fyrol HF 9 represents improved resistance of flexible polyurethane foam to open flames compared to the technology currently used in the upholstered furniture industry. Additionally, Fyrol HF 9 performs well in flexible polyurethane foam upholstered furniture applications from a cost performance and foam discoloration perspective.
|
|
|
·
|
Fyrol HF 10, which was recently developed and commercialized to represent an even greater step forward in terms of volatile organic compounds for flexible polyurethane foam automotive applications. It has been developed specifically to support our Industrial Products segment’s announced exit from TDCP for automotive applications by the end of 2015 and to support the global automotive industry’s gradual shift away from TDCP.
|
SaFRon 6605.
The SaFRon product line represents our Industrial Products segment’s efforts to commercialize the robust synergies of phosphorus and bromine in rigid polyurethane thermal insulation applications. SaFRon 6605 is a phosphorus- and bromine-containing product specifically targeting flame retarding rigid polyurethane spray in-place insulation systems aimed to meet flammability standards and building codes that promote safety in the use of spray in insulation systems. SaFRon 6605 is unique and differentiated because it offers high halogen content, which translates into increased efficiency of SaFRon 6605 in the use of any product commercially offered for this application.
Production
Our Industrial Products segment’s major manufacturing facilities are located in Israel (bromine, Dead Sea salts, bromine compounds and magnesia), the Netherlands (production of bromine compounds), Germany (phosphorus compounds), France (specialty magnesia products and calcium compounds used as raw materials in health foods and food additives), the United States (chlorine based biocides for water treatment and production of phosphorus compounds) and China (bromine compounds).
Our Industrial Products segment’s principal manufacturing plants, distribution centers and sales offices are set forth in the map below.
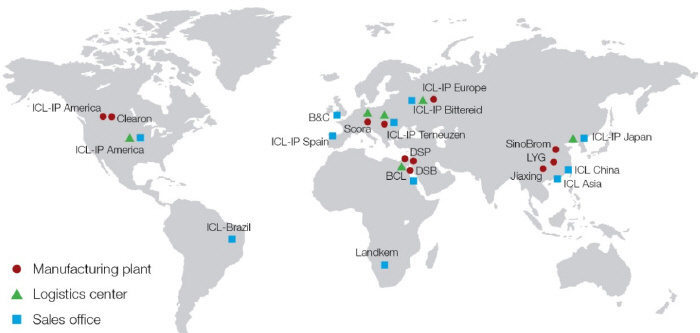
In 2014, we produced 174 thousand tons of bromine and 212 thousand tons of bromine compounds. In 2014, production of chlorine based biocides reached 19 thousand tons, production of phosphorus compounds reached 92 thousand tons and production of magnesia products reached 45 thousand tons. Our maximum annual capacity is approximately 280 thousand tons of elemental bromine, 410 thousand tons of bromine compounds, 37 thousand tons of chlorine based biocides, 150 thousand tons of phosphorus compounds, 53 thousand tons of magnesia, and 430 thousand tons of Dead Sea salts.
Competition
Our Industrial Products segment is the world’s leading producer of elemental bromine, accounting for approximately a third of total international production of bromine, according to internal assessments. Our Industrial Products segment estimates that it and its two main competitors, Albemarle and Chemtura, accounted in 2014 for approximately 80% of the worldwide consumption of bromine. Chinese production accounts for much of the remainder, but the quantity of brine available for producing bromine in China continues to decline, leading to lower production capacity. Chemtura and Albemarle produce bromine primarily from underground brine sources in the United States. Albemarle also has a joint venture with a Jordanian company to produce bromine and bromine compounds which started operations in November 2002 and is located on the Jordanian side of the Dead Sea with access to the same source of raw materials that we have. In the beginning of 2013, Albemarle doubled the production capacity of bromine produced by the JV,
and expanded its production capacity of bromine compounds it produces at the site of its joint venture in Jordan. Chemtura purchases bromine and some other bromine compounds from our Industrial Products segment under long term contracts. In January 2010, Chemtura and Albemarle signed a long term strategic agreement. Under the agreement, Albemarle supplies Chemtura with a number of principal products, including flame retardants, and organic and inorganic bromine based compounds. We believe that this agreement has no negative effect on our Industrial Products segment.
The main barrier to entry into the bromine and bromine compound market is access to an economically viable source of bromine in a sufficiently high concentration. In addition, the bromine business requires a complex logistics system based on special containers (isotanks) for transporting the bromine. The need for the logistics system is a barrier to entry of competitors into the global trade in bromine.
The main competitors of our Industrial Products segment in the bromine based flame retardant market are Albemarle and Chemtura, as well as a number of producers in China. The relatively low production cost of bromine affords our Industrial Products segment a competitive advantage. Bromine production requires a complex logistical system based on a fleet of special containers (isotanks) specifically designed to transport bromine. One of the advantages of our Industrial Products segment is having the largest fleet of isotanks in the world, which enables it to transport relatively large quantities of bromine around the world. Our Industrial Products segment has contracted with a supplier of isotanks to expand its existing fleet. During 2013, all of the new isotanks were received from the manufacturer. In addition, our Industrial Products segment has a widespread worldwide marketing network and a range of high quality products, combined with a technical support system that works closely with customers, providing a good competitive position in its target markets. In China, for example, our Industrial Products segment’s network includes three production facilities in China, a bromine containers farm, and technical support networks. In the Netherlands, our Industrial Products segment has a bromine compound production facility, which gives it a competitive advantage in Europe. The phosphorus based flame retardant and functional fluids production plants in the United States and Europe are situated in close proximity to our Industrial Products segment’s principal customers.
In the phosphorus based flame retardants market, competition is mainly from Chinese manufacturers operating in the local market and in markets outside China, mainly Europe and the United States. Access to a source of high quality, low cost phosphorus improves the capacity to compete in this market.
There are many competitors in the market for biocides for water treatment, and entry barriers are mainly related to the process for obtaining a license to sell.
There are several competitors in the magnesium chloride industry. The entry barrier to this market is low, as any company with access to magnesium chloride can produce the solution.
There is a small number of competitors in the pure potash market. Pure potash is high quality potash used mainly in the food and pharmaceutical industries. The main entry barrier is access to potash and technological knowledge required for its re crystallization.
In part of the biocide industry, the magnesia industry and the industry for other salts, our Industrial Products segment has a leading position in certain niche products.
Raw Materials and Suppliers
The principal raw materials used by our Industrial Products segment are bromine and bromine compounds, magnesia, chlorine based biocides, Dead Sea salts and phosphorus based products. We produce a significant portion of our raw materials through our Dead Sea minerals
extraction operations from the Dead Sea. See “Item 4. Information on the Company—D. Property, Plant and Equipment—Mineral Extraction and Mining Operations” for further information on our extraction operations.
Elemental bromine is produced from the end brines (salt solutions) that result as a byproduct
from the processes carried out to produce potash from carnallite. The brine is pumped into our Industrial Products segment’s plant in Sodom, where bromine is produced in an oxidation process using chlorine.
Chlorine is produced by electrolysis of sodium chloride and as a by-product of the magnesium production process of Dead Sea Magnesium Ltd. (“Dead Sea Magnesium”). The electrolysis facility and the magnesium plant are located next to the bromine facility in Sodom. The sodium chloride used in the electrolysis process is a by-product of the potash production in Sodom.
Our Industrial Products segment uses elemental bromine to manufacture bromine compounds at its facilities in Israel, the Netherlands, and China. Our Industrial Products segment sells the remaining elemental bromine to third parties. Most bromine compounds are manufactured by chemical processes involving bromine together with a range of other raw materials, of which the largest are Bisphenol A, which is used to manufacture the bromine based flame retardant TBBA, and phosphorus, which is used to manufacture phosphorus based flame retardants. Furthermore, our Industrial Products segment purchases many other raw materials required for production of the various products.
The following is a graphic representation of the production process.
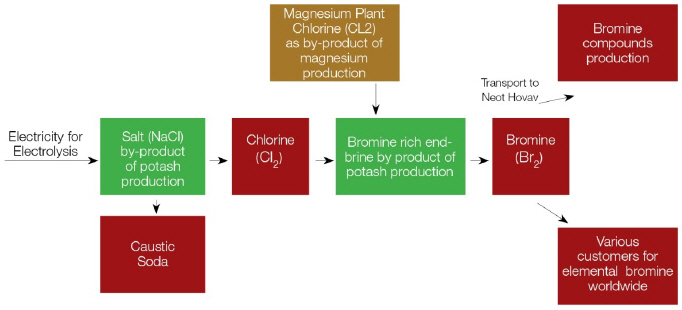
One type of brine that remains after the production of potash is rich in magnesium chloride. This brine is pumped to our Industrial Products segment’s facilities at Mishor Rotem. At these facilities, in a process utilizing magnesium chloride and other materials, magnesia (magnesium oxide) is produced. The magnesia is further processed into several grades of magnesia.
Our Industrial Products segment produces chlorine based biocides in the United States. For production of chlorine based disinfectant products (biocides), our Industrial Products segment purchases chlorine, urea and caustic soda from local manufacturers and cyanuric acid from Chinese manufacturers.
Dead Sea salts are manufactured at a facility in Sodom. The production starts from materials and brines produced as by-products of potash production. For example, magnesium chloride flakes are derived from brines rich in magnesium chloride that remain after potash is separated from carnallite. Various types of sodium chloride are also extracted from the salt that remains after potash is separated from carnallite.
Elemental phosphorus (P4) is produced in a roasting process from ores originating in Central Asia (Kazakhstan), the United States or China. Products based on phosphorus are produced in our Industrial Products segment’s factories in the United States and Germany. Our Industrial Products segment uses elemental phosphorus to produce phosphorus compounds at its factories. The basic phosphorus compound (POCl3) is manufactured in a chemical process that combines phosphorus, chlorine and oxygen. The reaction of this compound with a variety of other raw materials (such as propylene oxide or epichlorohydrin) creates the commercial phosphorus compounds.
The following is a graphic representation of the production process.

Our Industrial Products segment maintains raw material inventories in quantities that take into account the projected level of production based on consumption, supply dates, distance from the supplier, and other operational and logistical considerations.
Sales, Marketing and Distribution
Our Industrial Products segment’s principal markets are Western Europe, the United States, China, Japan, and Taiwan. Our Industrial Products segment sells its products primarily through a network of marketing companies, agents and distributors throughout the world. Commissions are paid to agents as is customary in the sector. Most of our Industrial Products segment’s sales are not transacted by means of long term contracts or orders, but rather via current orders close to the date of supply. Consequently, the concept of a backlog has no significance for our Industrial Products segment.
In addition, our Industrial Products segment has framework agreements with specific customers, under which the customer can purchase up to previously agreed maximum quantities of a product during the term, on the basis of which the customer issues purchase orders to our Industrial Products segment from time to time. In some of the agreements, sales prices have been fixed, at times with an update mechanism as well. The price determination mechanism has no significant adverse effect on our results.
Our Industrial Products segment’s policy is to seek to maintain adequate inventory, which varies from product to product, to ensure orderly supply to customers in light of the customers’ distance from production centers and their demand for inventory availability, and in conjunction with optimization of the inventory storage costs. Therefore, portions of finished product inventories are held in storage facilities in the destination countries.
Our Industrial Products segment extends credit terms to its customers according to customary practices in their locations. The segment’s sales are generally covered by trade credit risk insurance or by letters of credit from banks with high credit ratings.
Seasonality
Our Industrial Products segment’s operations are not characterized by regular seasonal fluctuations. However, amounts sold of some of its products fluctuate between the various seasons. Agricultural products are characterized by relatively high sales in the second and third quarters. Biocides for swimming pools are characterized by relatively lower sales in the fourth quarter. Salts for de-icing are characterized by relatively higher sales in the first and fourth quarters. The aggregate impact of these diverse seasonal differences on our Industrial Products segment is not significant.
Performance Products
Our Performance Products segment primarily develops, produces, markets and sells a broad range of phosphate based products as part of our strategy of increasing our production of downstream products with higher added value. In 2014, the total sales of our Performance Products segment were approximately $1,614 million and accounted for approximately 26.4% of our total sales (including sales to other segments of the Company), while the segment’s operating income totaled approximately $197 million, representing approximately 26% of our total operating income.
Approximately 71% of our Performance Products segment’s external sales in 2014 were of phosphoric acid of various grades (technical, food, electronics and polyphosphoric acid) and its downstream products. These products are produced in part using phosphate rock that is mined by our Fertilizers segment and phosphoric acid manufactured from that phosphate rock, and in part using elemental phosphorus (P4) and phosphoric acid, which are purchased from third parties.
Our Performance Products segment did not have any single customer that accounted for more than 10% of the Company’s total revenue in 2014.
Most of the products of our Performance Products segment are affected by the global economic situation, competition in our target markets, and price fluctuations in the fertilizer market, which affect the price of the main raw materials of our Performance Products segment, and by fluctuations in energy prices, which mainly affect production costs of thermal phosphoric acid.
Overall demand for downstream phosphate based products in the European and U.S. markets declined compared to 2013. This decline is primarily due to competition with exporters of phosphoric acid to the US, along with a decline in demand for phosphate salts deriving from the economic slowdown in Europe. Furthermore, competitors favored a strategy that gives preference to market share over prices, which had an ongoing negative impact on the Company during the year. Quantities sold suffered from a significant decline in demand in the phosphoric acid market mainly in North America, in which foreign and domestic competitors sought to increase their market share by lowering prices. In addition, the financial crisis in Russia and political instability in the Ukraine moderated the Company’s growth opportunities in the field of food specialties products.
During 2013 and 2014 we expanded our Performance Products Segment’s operations by means of acquisition of the following activities and companies:
In March 2013, acquisition was completed of the assets and business operations of Thermphos International B.V. located in Knapsack, Germany. The Knapsack factory is used for marketing and manufacturing P2S5.
In January 2014, acquisition was completed of the Hagesud Group, a German producer of premium spice blends and food additives for meat processing. This transaction includes the acquisition of all the operating assets of the Germany based Hemmigen company, including Hagesud’s production sites, existing businesses, state of the art production technology and warehouse facilities located in Hemmigen, Dortmund and Ottensoos, Germany with approximately 200 employees.
During the fourth quarter of 2014, the Company completed acquisition of 100% of Fosbrasil (increase in the rate of holdings from 44.25% to 100%), the leading manufacturer in Latin America of purified phosphoric acid for the food and specialty fertilizer market, and a producer of phosphate based downstream products and specialty fertilizers.
Subsequent to the date of the statement of financial position, in January 2015, the Company signed an agreement to purchase Prolactal, a leading European manufacturer of milk proteins for the food and beverage industry. On March 13, 2015, the transaction was closed.
Concurrently, in the fourth quarter of 2014, according to its strategic plan, the Company signed agreements for sale of a number of its non-core businesses:
In October 2014, the Company signed an agreement for sale of the APW (aluminum, chemicals for the paper industry, and water purification) business units located in Ludwigshafen and Dusseldorf, in Germany, along with additional sites of ICL Performance Products in Europe and in China. In January 2015, the transaction was closed (except for an insignificant number of units located in China).
In December 2014, the Company entered into a transaction for sale of the Rhenoflex business unit, located in Ludwigshafen, in Germany, and in China. Rhenoflex is a leading supplier of advanced parts for reinforcing leather shoes and orthopedic components in recognized brand name products in the global footwear industry. In February 2015, the transaction was closed.
In addition, the Company entered into a transaction for sale of the hygiene businesses (detergents and disinfectants) for various applications in the food industry, including disinfectants for dairies, agricultural companies, industrial kitchens and different types of food factories. In February 2015, the transaction was closed.
Our Products
Our Performance Products segment’s products are designed for a wide range of uses and industries. The main markets of our Performance Products segment include food, metallurgy, paint and coating, detergents, electronics, pharmaceuticals, concrete, oil additives and firefighting. Performance Products segment is part of our strategy to manufacture downstream products with higher added value based on phosphate rock.
The main products of our Performance Products segment are as follows.
Purified Phosphoric Acid—Technical Grade, Food Grade Acid, Electronics Grade Acid and Polyphosphoric Acid.
The acid is used as raw material in the food, metal treatment, detergents, electronics and construction industries. Our Performance Products segment is the world’s leading manufacturer of purified phosphoric acid. Our Performance Products segment manufactures and markets phosphoric acid of varying grades, primarily for the food industry. The product mix of our Performance Products segment also includes unique acids with high added value that are used in the electronics and construction industries.
Phosphate Salts and Food Additives.
These products are designed for diverse uses, including food additives, treatment of metals, paints and coating, detergents and toothpastes. Our Performance Products segment manufactures and markets products with high added value, including phosphate salts, produced in Germany, the United States, Brazil and China, which are primarily based on phosphoric acid. Our Performance Products segment uses much of the phosphate salts that it produces as raw material to manufacture food additives in many countries in the world. The food additives of our Performance Products segment mainly target the processed meat, fish and seafood markets, the cheese and milk products markets and the baked goods market.
Other Phosphate- and Phosphorus Based Products.
The primary markets for these products are:
|
|
·
|
Hygiene products: a broad range of disinfectant and cleaning materials for various uses in the foodservice industry, including products for cleaning dairies, agricultural companies, industrial kitchens and other types of food facilities. Our Performance Products segment produces the products in France, Germany and Austria. As noted above, in February 2015, the Company completed the transaction for sale of the business units in this area.
|
|
|
·
|
Fire prevention and retardant products (fire safety): fire safety products prevent fires, mainly in forests and open areas, by spraying products from an aircraft. We are one of the world’s leading manufacturers of phosphate based fire retardant products, which are used primarily to fight forest fires. These materials are produced in North America and France.
|
|
|
·
|
P2S5: used as a primary ingredient in lubricating oil additives and insecticides.
|
Other Products.
Our Performance Products segment manufactures a wide range of other products that are not phosphate based and require specific competencies. These products are not part of our core businesses. Among these are the following products:
|
|
·
|
Thermoplastic products (Rhenoflex): thermoplastic materials are plastic materials that can be molded under heat. Our Performance Products segment develops, manufactures and markets unique, environmentally friendly, patent protected thermoplastic products for reinforcing the toes and heels of shoes and for the production of other leather goods such as handbags and suitcases. Among our Performance Products segment customers are some of the leading manufacturers of quality footwear in the world. Production facilities are based in Germany and China. As stated above, the Company entered into a transaction for sale of this business unit. In February 2015, the transaction was concluded.
|
|
|
·
|
Chemicals for water and paper (APW—alumina compounds, paper and water chemicals): our Performance Products segment manufactures and markets a wide range of alumina compounds and other chemicals (polymers) for the paper industry and other industries, cement additives and chemicals for treatment of industrial and drinking water. In 2008, our Performance Products segment expanded its water treatment operations by acquiring the water treatment business of the German company Henkel. This business includes the production of performance products for treating water used in cooling towers, power stations, heating systems, drinking water, sewage treatment and purification. Most of the production facilities are in Germany. As noted above, during January 2015, the transaction for sale of the APW business unit (except for a number of insignificant assets located in China) was concluded.
|
|
|
·
|
Pharma, cosmetics and gypsum (PCG): our Performance Products segment manufactures and markets active ingredients and other products for the pharmaceutical and cosmetics industries and also manufactures synthetic gypsum, mainly for the medical, dental and hobby industries. Production facilities are based in Germany and China.
|
A significant portion of our Performance Products segment products are based on its intellectual property and have well-known brand names in their relevant markets, including Fibrisol, Brifisol, Joha, Tari, Py Ran, Nutrifos, Levn Lite and Phos-chek.
Our Performance Product segment’s highly sophisticated technology platform for the development of food texture and stability solutions has allowed it to develop expertise in phosphate based food additives, fire retardants and water treatment products and to achieve a leadership position in these market segments.
Production
Our Performance Products segment manufactures its products in its facilities in Germany, the United States, Israel, Brazil, France, Spain, China, the United Kingdom, Argentina, Austria, Australia and Mexico. In Mishor Rotem in Israel, our Performance Products segment manufactures purified phosphoric acid by purifying fertilizer grade phosphoric acid produced by our Fertilizers segment. Our Performance Products segment also manufactures thermal phosphoric acid in the United States by utilizing elemental phosphorous and purchasing purified phosphoric acid from third parties.
Our Performance Products segment’s principal manufacturing plants, distribution centers and sales offices are set forth in the map below.

In 2014, we produced 129,790 tons of purified phosphoric acid (as Phosphorus Pentoxide), 398,440 tons of phosphate salts and food additives, 74,680 tons of other phosphate based products and 302,190 tons of other products. Our maximum annual capacity is approximately 216,000 tons of purified phosphoric acid (as Phosphorus Pentoxide), 485,550 tons of phosphate salts and food additives, 161,260 tons of other phosphate based products and 485,800 tons of other products at our Performance Products segment.
Competition
Our Performance Products segment has a leading position in the field of purified phosphoric acid and its downstream products. Our Performance Products segment’s competitors are large and mid-size international chemical companies, which have manufacturing and marketing presences in various countries, as well as local companies that reap the benefits of being local manufacturers in a regional market. In every field, many companies compete with our Performance Products segment by offering similar products or substitutes.
Competition in our Performance Products segment centers on product features, price, quality, service and the ability to address customers’ needs.
The primary competitors of our Performance Products segment in each field are set forth below.
Phosphate Based Products:
|
|
·
|
Purified phosphoric acid, phosphate salts and food additives:
Our Performance Products segment’s main competitors are Chemische Fabrik Budenheim KG, Innophos Inc., Prayon, PCS, Adithya Birla, Haifa Chemicals Ltd. and various Chinese producers.
|
|
|
·
|
P2S5:
Our Performance Products segment’s main competitors are ChemTrade Logistics Company in North America, and Italmatch Chemicals in Brazil and Singapore.
|
Other Products:
•
Pharmaceuticals, cosmetics and gypsum
:
The primary competitors of our Performance Products segment are Reheis Inc. and Summit in the area of antiperspirants, SPI Pharma in the area of pharmaceutical products, and GC Corporation in the field of gypsum.
Raw Materials and Suppliers
The primary raw material for manufacture of phosphate salts and food additives is purified phosphoric acid, which is produced by purifying fertilizer grade phosphoric acid as well as via a thermal process from elemental phosphorus (P4). Our Performance Products segment obtains fertilizer grade phosphoric acid from our Fertilizers segment and also purchases P4 and purified phosphoric acid from external manufacturers.
Our Performance Products segment has a long term supply contract with a supplier of phosphoric acid that guarantees regular supply of this raw material through 2018. In addition, we have a long term supply agreement for P4 with another supplier through 2022.
In addition to purified phosphoric acid, our Performance Products segment uses hundreds of other raw materials, which it purchases from many suppliers. Of these, the raw material with the greatest total cost is caustic soda.
Our Performance Products segment maintains raw material inventories in quantities that take into account the expected level of production based on consumption characteristics, supply times, distance from suppliers, and other logistical considerations.
Sales, Marketing and Distribution
Our Performance Products segment sells its products mainly to industrial and commercial customers in Europe, North America, South America and Asia. Our Performance Products segment’s marketing network is based primarily on an extensive internal marketing organization and, to a lesser extent, on external distributors and selling agents.
To market and sell many of its performance products effectively, our Performance Products segment’s marketing personnel work closely with customers in order to tailor the products to the customers’ needs. Our Performance Products segment is not dependent on external marketing agents.
Most of our Performance Products segment sales are made under agreements with terms of less than one year or through spot orders placed close to the date of supply. In addition, our Performance Products segment has framework agreements with specific customers, through which the customer can purchase up to previously agreed maximum quantities of product during the term, on the basis of which the customer issues purchase orders to our Performance Products segment from time to time.
Most sales of Performance Products do not take place according to long term orders or contracts, but are regularly ordered close to the time of supply. Consequently, the concept of a backlog is of no significance for our Performance Products segment.
Our Performance Products segment’s strategy is to maintain adequate inventories to ensure orderly supply to customers in light of the customers’ distance from the manufacturing locations and their demand for inventory availability, and in conjunction with optimization of inventory’s storage costs. Therefore, portions of finished product inventories are held in storage facilities in the destination countries.
Our Performance Products segment extends credit terms to its clients according to customary practices in their locations. The segment’s sales are generally covered by trade credit risk insurance or by letters of credit from banks with high credit ratings.
Seasonality
The target markets of most our Performance Products segment’s products are not characterized by seasonality, except for flame retardants, which have a higher sales volume in the spring and summer due to the many fires in North America during this period.
Other Activities
IDE - ICL holds 50% of IDE Technology Ltd. IDE operates in the following fields: constructing and selling water desalination plants, selling water, operating and maintaining water treatment and desalination plants and developing and producing industrial evaporators and heat pumps. IDE has deployed approximately 400 water desalination plants in more than 40 countries worldwide and seeks to address a wide range of the world’s clean water challenges. IDE’s core competencies are in membrane and thermal desalination, industrial evaporators and heat pumps. As part of our strategy to divest operations that are not in core areas, we are considering the possibility of selling our holdings in IDE.
DSM - DSM produces, markets and sells pure magnesium and magnesium alloys. It also produces dry carnallite and related by-products, including chlorine and sylvinite. DSM is the second largest magnesium producer in the Western world after US Magnesium.
Sustainable Development Policy
The Company applies an overall policy of sustainable development that integrates social, economic and environmental considerations into all of our business activities. The policy stresses social responsibility, which includes taking responsibility for the safety and well-being of our employees, reducing environmental impacts, and creating a dialogue and transparent communication channel with the authorities, community service, as well as other matters in the area of sustainability. This policy includes, among other things, the following items: responsible use of natural and land resources; rehabilitation of streams, restoration and preservation of mining and quarrying regions and return thereof to the State after completion of the activities the land was designated for by the State and in accordance with the provisions of law governing the matter. Reduction at the source (in terms of the flow) of the quantity of waste produced in ICL companies and increased recycling of treatable waste. These activities are performed in ongoing cooperation with manufacturers, suppliers, research institutes and other users for purposes of development and application of methods for the safe production and use of products, while reducing or eliminating injury to users and the environment; safe transport – selection and instruction of responsible transporters, use of an emergency system for handling transport problems, strict care with respect to safe and correct packaging and assurance that only proper and orderly means of shipment are used.
ICL has a policy of involvement and investment in the society and the community, which was formulated and approved by our Board of Directors in 2001,
and amended in 2014
. Pursuant to this policy, an annual budget for community service is approved. Each investment or donation is executed as required by the policy and is reviewed by
the relevant parties who have been authorized according to the type and amount of the donation, including
the Environment, Safety and Public Affairs Committee and the Board of Directors. ICL focuses on community involvement in the communities in and outside of Israel from which its employees come and in which it operates. ICL’s main activities are in the communities in the State’s southern region, namely: Dimona, Yerucham, Arad, Beer Sheva, and the Bedouin settlements in the South. ICL focuses its activities on children and youth with handicaps, women and children at risk, populations in harsh socio-economic conditions, and populations in need and with special medical needs, as well as on education and promoting outstanding achievements of pupils in the fields of chemistry, computers, entrepreneurship, and acquaintance with the industrial sector.
Our charitable contributions in 2014 totaled approximately $5 million (approximately NIS 19 million). This amount does not include the numerous hours of work that our employees devoted as volunteers, partly at the expense of their work hours.
ICL is planning and acting to deepen and broaden its community activities outside of Israel and to bring them to a scope similar to that of its community service in Israel.
Regulatory and Environmental, Health and Safety Matters
Some of our products are potentially harmful to the environment and the health and safety of the public as a result of the effluents, air emissions and waste that are generated during the production of our products. These substances can cause pollution that necessitates remediation, clean up or other response actions. In addition, some of our products may be hazardous to those who are exposed to them during their production, transportation, storage or use. Consequently, some of our operations and products are subject to environmental, health and safety regulation. There is also a risk of claims in respect of bodily injury or property damage.
The Company routinely invests in projects in the areas of environmental protection, health and safety, and also bears current costs in connection with these matters. In 2014, we spent approximately $112 million on environmental matters in 2015, of which approximately $27 million relating to investments in property, plant and equipment and approximately $85 million as a current expense. The Company estimates that in 2015, it will spend approximately $136 million on environment protection matters, of which approximately $54 million on investments in property, plant and equipment and approximately $82 million will be a current expense. We are continuing our investments in the environment while making improvements and reducing our impact on the environment.
On December 11, 2013, the Law for Encouragement of Competition and Reduction of Business Concentration, 2013 (“the Business Concentration Law”), was published, which includes, among other things, provisions requiring regulators having authority to issue rights in areas defined as an essential infrastructure in Israel, to take into account considerations for encouraging industry wide competition and reducing business concentration in the economy prior to issuing rights in public assets to private entities defined as high concentration entities. The Business Concentration Law sets forth a list of “rights”, including, an authorization, license, concession or permit and a contract, and also includes a list of matters defined as an essential infrastructure, including areas in which the Company is engaged, such as, quarrying, mining, water and etc. A list of the high concentration entities was published in accordance with the criteria provided in the Business Concentration Law and ICL and its main subsidiaries in Israel are included in the list, as stated. In the Company’s estimation, inclusion of the Company and its main subsidiaries in Israel in the list of high concentration entities is not expected to have a significant adverse impact on the Company and its monetary results. However, in light of the frequent changes in the regulatory environment in Israel, it is possible that the Company’s estimation will prove to be inaccurate.
A number of government regulations addressing environmental and other issues, which have a significant impact on our activities, are described below:
Limits on Cadmium in Phosphate Fertilizers
Phosphate rock, which our Fertilizers segment mines, contains cadmium in various concentrations. Cadmium is considered to have a harmful effect on the environment. Most countries to which our Fertilizers segment sells phosphate fertilizers do not presently restrict quantities of cadmium in fertilizer. The European Union has been conducting a series of public hearings prior to enacting regulations limiting the maximum concentration of cadmium permitted in phosphate fertilizers anywhere within the European Union. The regulations are expected to be published in 2016 with a transition period of several years, and at the end of the transition period the producers will be required to abide by the restrictions. The cadmium content in the phosphate fertilizer products of our Fertilizers segment does not exceed the permissible quantity compared with the anticipated future restrictions in the European Union. A number of European countries in Scandinavia (Finland, Denmark and Sweden) have already instituted local limitations with respect to the cadmium content in fertilizers; however, these restrictions are not binding on the entire European Union.
Salt Accumulation at Mines in Spain
Our Fertilizers segment has two potash production centers in Spain, in the towns of Suria and Sallent. As a by-product of the potash production process, salt is produced and heaps up in piles, most of which, at the present time, is not usable.
Regarding the permission to pile up salt on the sites: with respect to the first site in the town of Suria, there is a license to pile up salt on the site that runs up to 2026 at the current production level; with respect to the second site in the town of Sallent, on which the Company intends to discontinue mining activities prior to the end of 2016, an agreement was made with the local planning board (CUCC), which permits the continued piling up of salt at the current production level up to June 30, 2017. This agreement requires approval by the Spanish Regional Court. For additional information, see “Item 8. Financial Information—A. Consolidated Statements and Other Financial Information—Legal Proceedings—Proceedings in Connection with Environmental Protection.”
Product Regulation and Registration
Insecticides (Including Soil Fumigation)
. In most countries, this material and any product containing this material must be licensed prior to import or sale in that country. Sale is restricted according to the type of the hazard (disease/organism) and the crop or yield for which the permit was granted in that country. The permit is generally for a limited time and needs to be renewed in order to continue selling.
Water Treatment (Biocides)
. In a number of countries, this material and any product containing this material, must be licensed prior to import or sale in that country. Sale is limited to those commercial uses for which the permit is received in a given country. The licensing is generally for a limited time and needs to be renewed in order to continue selling. Beginning in 2013, the Biocide Law in the European Union, which replaced the Biocide Directive, entered into effect. The Biocide Directive also implemented a process of re licensing every existing biocide on the market. Our Industrial Products segment submitted files for renewing licenses for existing biocides for various uses, according to the timetable set in the Law. Under the Directive, during the course of the licensing process, it is permitted to continue selling the products for the uses sold to date, on the condition that a licensing file is submitted for the use and the active substance in the product. The new Biocide Law continues the Biocide Directive with respect to the completion of the licensing process of the substances; however, the responsibility was transferred to European Chemicals Agency (ECHA). In addition, the Biocide Law introduced changes regarding the continued approval of products containing active biocides in the various countries, along with additional changes.
Chemicals
. In some areas of the world (such as the European Union, the United States, Canada, Japan, Korea and China), chemicals may be sold only after registration and approval by the authorities. Trade restrictions for use also apply to some of the products of our subsidiary Bromine Compounds stemming from the requirements of international treaties. Our Industrial Products segment registers the products that it develops and sells as required under local laws.
Chemical Registration in Europe (REACH)
A statute covering the framework for licensing and evaluation of chemicals in the European Union (known as “REACH”) became effective as of June 1, 2007. The statute applies to chemicals already on the market, as well as to new chemicals. Pursuant to this legislation, manufacturers in the European Union and importers of chemicals or importers of certain products containing chemicals are required to submit dossiers containing detailed information of every substance or chemical compound manufactured or imported into Europe, in quantities of more than one ton per year (the amount and content of the information depends on the volume of production and/or sales in Europe, and the nature of the product in terms of its effect on health and the environment). Some of the products will undergo risk evaluation based on the information that is submitted, and others will only be able to be sold in the future under an appropriate permit. Such a permit will only be granted on the basis of quantified evidence relating to management of the product with regard to health and environmental aspects, the lack of appropriate alternatives, and a socio economic evaluation. Certain persistent, environmentally toxic substances will require permits based only on a socio economic evaluation and on the condition that an alternative development plan be submitted, in order to encourage a transition to use of less hazardous substances.
The statute is being implemented gradually, between 2008 and 2018, under the supervision of ECHA.
Apart from higher production and raw material costs following implementation of REACH, under the law our subsidiaries incur costs in the field of licensing, control and implementation of product stewardship programs with customers. Another possible risk caused by REACH legislation is reduction in usage of a product or material, or removal of certain products from the European market. Likewise, there will be products and compounds that require investment in alternative research and development due to the need to remove certain components from use in the European market.
All of our segments are implementing REACH and are registering their chemicals as required by law.
Likewise, all the chemicals have been reclassified in line with the CLP regulations (classification, labeling and packaging of substances and mixtures), that took effect in Europe in December 2010.
All of our segments submitted applications for permits for all the chemicals relevant for their businesses in Europe (production and sale) within the timetables set in the law (2010 and 2013). We have also volunteered to lead and prepare a number of leading files for the entire industry (lead registrant).
Under the law, ECHA publishes, and regularly adds to, a list of substances defined as “substances of very high concern.” As of the date of this Annual Report, this list includes several products of our Industrial Products segment, as discussed in this report.
Limitations on the Use of Certain of Our Products
Various countries are assessing possible limitations on the use of chemicals, and this assessment includes flame retardants. Below are details regarding the main proceedings known to us as of the date of this Annual Report.
The flame retardant HBCD is on the list of materials requiring authorization under the REACH regulation, after being defined as a “substance of very high concern” by the European Union. The implication is that manufacture and use of HBCD will be prohibited in the European Union unless, on the basis of a socio economic evaluation, it is proven that the need for the product for a particular use is greater than the risk, and that there are no commercial alternatives to using the product. The results of the preliminary authorization process are expected in the first half of 2015. As of the date of this Annual Report, there is no ban on the use of the substance. In addition, HBCD was classified by two United Nations conventions (Stockholm Convention UNEP and UNECE) as a persistent organic pollutant (
“
POP
”
).
Nonetheless, in light of the fact that there is still no HBCD substitute available in commercial quantities, in May 2013 a decision was made by the Stockholm Convention to permit an exemption from the prohibition and to permit use only in polystyrene insulation panels in buildings for an additional period of up to five years. This approval will apply only to countries that are members of the Convention that demonstrate a need in the additional period and that are recorded in the request for exemption from the prohibition. The implications of the classification is that the phasing out of the material from the European market may occur more rapidly unless Europe requests to postpone implementation of the law, and in fact, Europe has applied to postpone implementation for one year so that the implementation schedule corresponds to the European REACH process. This implies that HBCD will be phased out of use in Europe only in August 2015, unless authorization is obtained under REACH to continue to use HBCD for insulation panels in buildings. As noted, the results of this process are anticipated in the first half of 2015. Our Industrial Products segment has a substitute for HBCD called FR122P, in the commercial stage.
The bromine based flame retardant DECA is banned for use in electrical and electronic applications in the European Union. In addition, due to the definition of DECA as a “substance of very high concern,” the ECHA is leading a restriction campaign to prohibit most of uses of DECA in the European Union by 2017, at the earliest. In 2013, DECA was proposed as a candidate for deliberations at the Stockholm Convention in the United Nations as a substance having POP characteristics. The deliberations commenced in October 2013 and the decision making process is expected to be completed in May 2017 at the earliest. Imposition of the prohibition against use is expected to enter into effect at the end of 2018. In North America, the three largest manufacturers of bromine based flame retardants (Albemarle, Chemtura and our Industrial Products segment) gradually phased out their distribution of DECA in 2013. Furthermore, in 2012, we commenced selling TexFRon, a substitute for DECA in the textile industry.
Propyl bromide, produced by our Industrial Products segment, was defined as a substance of very high concern in the European Union in December 2012. Propyl bromide’s use as degradable raw material will not be affected (since it is not included in this process). With respect to other uses, there is still no decision regarding prohibition. The definition of propyl bromide as a substance of very high concern has no significant impact on us.
TXP (Tri Xylyl Phosphate), a product used as a softening substance in the plastics industry, has also been defined as an SVHC in Europe. This definition of TXP as a substance of very high concern has no significant impact on us.
In October 2011, the phosphorus based flame retardant TDCPP was classified as a carcinogen in California. In November 2012, our Industrial Products segment announced that it will no longer sell the substance to the furniture industry beginning in 2013, and by the end of 2015 it will no longer produce the substance. Concurrently, we have developed two alternative products that have reached the stage of commercialization.
An evaluation will be performed on TBBA in Europe as part of REACH. The evaluation will be performed by Denmark in the period between March 2015 and March 2016.
Air Quality—Israel
During production, our facilities emit pollutants that could be harmful to people or to the environment, if they were to be emitted into the environment in concentrations or amounts exceeding the permitted levels. The materials emitted are volatile organic compounds, inorganic compounds and particles. We are taking the necessary measures to prevent the uncontrolled emissions of these substances, in accordance with the provisions of the law and the conditions set forth in our business licenses, through the use of accepted technologies.
A master plan is in place at our Fertilizers segment’s facilities in Israel to reduce point source and fugitive emissions into the atmosphere. In 2013, the upgrading of the absorption systems in the phosphoric acid plant was completed and tested in 2014, and an upgrade was also made to the absorption system in the fertilizer plant. In addition, a project was completed this year for the installation of two large extraction and filtering systems to reduce emission of particle materials in Zins factories. In DSW’s facilities, dust extraction and filtering systems were installed in the potash production facility, a central dust extraction and filtering system was installed in the facility for production of granulated potash, and a system was purchased and installed for piling up potash, equipped with dust containment systems. At our Fertilizers segment’s plants in Israel, a master plan is being implemented to install continuous control and detection measures in the stacks. At the Rotem site in Mishor Rotem, placement of a detection system on the fences and the stacks was completed. Mishor Rotem’s plants are preparing for the establishment of a system of air quality monitoring stations, in coordination with the local council and the environmental authorities. At the Fertilizers and Chemical Substances facility, an ammonia emissions reduction project is underway, by installation of a demister in the stack of the nitrate ammonia manufacturing facility. The main facilities of ICL Fertilizers in Sodom and in Mishor Rotem have been fully converted to run on natural gas and are connected to the gas pipeline. During the upcoming year, the rock facilities in Zin will undergo conversion and the factory will be connected to the distribution network. In addition, the factory of Haifa Fertilizers in the North is presently undergoing conversion to use of gas and connection to the distribution contractor in the North. The transition to use of gas significantly reduces the amount of emissions released into the atmosphere.
Our Industrial Products segment operates advanced monitoring methods to identify malfunctions in the plants’ operation and emission systems and prevent their occurrence and takes steps to prevent uncontrolled emissions according to the laws and the conditions set out in its business license, its toxins permit, and its emissions permit, using accepted technologies. Leakage detection and repair (LDAR) methodologies are also applied. LDAR provides guidance for monitoring components to detect non-specific emissions and integrated pollution prevention and control (IPPC) to prevent leakage of hazardous substances into the air. Below is a list of principal actions taken by our Industrial Products segment with regard to air quality:
|
|
·
|
Investments were made in the production facilities in order to improve recycling and recovery of solvents and other organic materials, and adsorption via active charcoal systems, in order to achieve reduction of the amount of these materials emitted into the air;
|
|
|
·
|
Investments were made in monitoring and detection systems, in order to ascertain that there are no deviations in the plants’ operation and emission systems. Furthermore, these systems were connected to the facilities’ production control systems, so that before any deviation occurs, the facility’s production process is halted;
|
|
|
·
|
Systems were implemented for the collection and treatment of volatile organic compound emissions from the plants’ stacks. This system performs additional treatment regarding the volatile organic emissions using a catalytic oxidizing technology;
|
|
|
·
|
Ongoing work is executed for the control and treatment of diffused emissions with the assistance of a European company;
|
|
|
·
|
Continuing joint work by the Mishor Rotem factories, including Periclase, together with the Ministry of Environmental Protection and the Environmental Unit of the Eastern Negev Council to set up a regional air monitoring system;
|
|
|
·
|
In 2009, continuous monitoring systems for the stacks of the Periclase plant were purchased, in coordination with the Ministry of Environmental Protection. These systems were installed in 2010. However they have not yet succeeded in operating continuously. Notwithstanding the difficulties, we made efforts in order to bring the system into good working order. The Ministry accepted the plant’s claim that installation of the continuous monitoring systems for these stacks is technically not feasible, and these systems have been removed.
|
The Israeli Clean Air Law—Air Emission Permit
On July 31, 2008, the Clean Air Law was enacted to regulate the treatment and control of air pollution in Israel. The law is effective as of 2011.
The Clean Air Law addresses, inter alia, fixed sources (including our plants) and is intended to serve as a platform for implementing the IPPC directive that was adopted by the European Union in 1996.
The Clean Air Law differentiates between plants defined in the IPPC directive as having significant environmental impact (IPPC plants), which include our plants in Israel, and the other plants. In accordance with the Clean Air Law, operations of IPPC plants are subject to a valid emission permit. The emission permit is expected to include specific instructions based on best available technology (
“
BAT
”
).
On June 22, 2010, the Ministry of Environmental Protection enacted the Clean Air Regulations (Emission Permits), 2010, which set requirements for applying for and obtaining an emission permit. To determine the BAT, these regulations refer to the European BAT Reference Documents (“BREF”) and require selection of the BAT from known technologies (except in special circumstances that require specific explanations).
As of the date of this Annual Report, our magnesium company and our Industrial Products plant in Naot Hovav (Bromine Compounds Ltd.) have received air emission permits. The air emission permits include provisions regarding application of the BAT, as well as provisions with respect to monitoring, control and reporting to the Ministry of Environmental Protection. We are taking steps to implement an improvement plan to address the requirements of the air emission permits in coordination with the Ministry of Environmental Protection. The cost of these measures is included in our capital budget for environmental protection matters.
The estimated capital investment required in order to comply with the requirements of the Naot Hovav facility’s new air emission permit, which was received in August 2013, is approximately $15 million, until the end of 2017. Our facility in Naot Hovav (Bromine Compounds Ltd.) meets the material conditions in the air emission permit.
Our other plants in Israel have submitted applications for air emission permits, as required by law.
Report of Pollutant Release to the Environment
In accordance with new legislation regarding the duty to report polluting releases into the atmosphere (Pollutant Release and Transfer Register—PRTR), during 2013, our factories in Israel began to report with respect to the quantities of pollutants released into the environment according to the provisions of the law. This law is based on generally accepted legislation in Europe. Under the law, the data reported is published to the public on the Ministry’s website. In January 2014, the Ministry of Environmental Protection published a list of emissions and transfers to the environment in accordance with the reports received from all of the reporting factories, including us. Beginning in 2014, the PRTR report is required to be submitted by March 31 of each year.
Greenhouse Gas Issues
Climate change is of increasing concern to governments, non-governmental organizations, and the general public. Increasing regulation of greenhouse gases (“GHGs”) could impact our operations by requiring changes to our production processes or increasing raw material, energy, production or transportation costs. We are striving to become a leader in reduction of emissions in general and GHG emissions in particular. Our efforts include reduction of GHG emissions in production processes (including conversion to natural gas, replacement of shielding gas in magnesium production, and energy efficiency improvements) and development of new products that contribute to GHG emissions reductions. We annually measure the balance of GHG emission in all the production facilities that we operate, and have until now measured the carbon footprint of over 60 of our products. We report our GHG emissions annually to the voluntary mechanism of the Ministry of Environmental Protection, and submit to the Carbon Disclosure Project (CDP) a comprehensive report of our GHG emissions and corporate strategy on climate change.
The high level of our transparency in 2014 in our 2014 report to the CDP (which also describes the operations in 2013), achieved a score of 98 (out of 100). This is the second consecutive year in which we have been awarded this high score, despite the increasingly stringent reporting and implementation requirements. Furthermore, by virtue of our efforts to reduce emissions, we were, for the first time, awarded the maximum score of A in the performance index, and we were included in the CPLI index, which is a short list of especially outstanding companies in emission reduction and climate change branding. This score place us among the world’s leading 150 companies, and is the highest score for an Israeli company, and the second best score of all fertilizer manufacturers in the world.
European Plan for Trade in GHG Emissions
The European Union as a party that signed the Kyoto Protocol, the framework treaty of the United Nations for dealing with climate changes, agreed on a mandatory target for reducing the emission of greenhouse gases. The main tool for achieving the reduction targets is the EU Emissions Trading Scheme (“ETS”), which was started on January 1, 2005. In the first and second stages of the ETS, the European countries agreed that every industrial company that emits GHGs above the agreed minimum threshold is required to report its emissions and to limit the emissions to the gradually decreasing periodic quota. In addition, companies were allowed to realize a monetary gain or benefit by trading and selling unused emission permits. The third phase of the ETS commenced on January 1, 2013 and will run up to December 31, 2020. The third phase includes additional emission sources on our sites in Europe that are subject to the ETS and accordingly, the quantity of our GHG emissions subject to the ETS will increase.
The European Energy Efficiency Law
The new Energy Efficiency Directive of the European Union entered into effect on December 4, 2012. Most of the requirements in the Energy Efficiency Directive must be implemented by companies in the European Union in the future. The Energy Efficiency Directive provides a joint framework to advance energy efficiency in the European Union, in order to achieve the European Union’s energy goals by 2020. These goals include the reduction of GHG emissions by 20% compared with the levels in 1990, an increase in the rate of consumption of renewable energy sources to 20% of total energy consumption and an improvement in energy efficiency by 20%. Accordingly, all countries that are members of the European Union are required to increase the efficiency of their energy consumption in all stages of the energy chain — conversion, transportation and final use. The impact of the implementation of this Directive on the regulatory regime in European countries wherein ICL is active is not yet entirely clear. Nonetheless, legislation in this field may, in certain cases and under certain conditions, temporarily and/or permanently, increase energy consumption costs of part or all ICL’s production plants in Europe.
Israeli Bill for Prevention of Land Contamination and Restoration of Contaminated Lands
In August 2011, the Bill for Prevention of Land Contamination and Restoration of Contaminated Lands, 2012 passed in the first of three readings by the Israeli parliament (“the Bill”)
.
In May 2013, a hearing with respect to the Bill commenced. The highlights of the Bill in its present version are set forth below.
The Bill defines land contamination and contaminated land, among other things, as all that exceeds a concentration of contaminating materials in the land above certain preliminary or specific thresholds. This means that there is no quantitative criterion for defining contamination and there is no exception for negligible contamination. Moreover, the Bill imposes a comprehensive prohibition against land contamination, both in public and private areas. Accordingly, the Bill is expected to apply to industrial plants and to infrastructure facilities.
The Bill requires the conduct of an historical survey of plants and sites where there is a risk of land contamination. The Ministry of Environmental Protection will be permitted to order submission of risk surveys and land surveys and may demand filing of a plan for treating the land, provide instructions with reference to the manner of treating contamination events and the way for restoring suspect lands or lands found to be contaminated, cancel or intensify the specific threshold values provided in the risk survey, approve or reject treatment plans, add or change provisions, etc. The Bill will require the owners or possessors of contaminated land to conduct surveys even if they did not cause the contamination. However, the owners or possessors will be entitled to receive indemnification, as part of a civil proceeding, from the contaminators if their identity is known. It also proposes the establishment of assistance fund for a party that is required to treat land contaminated by another party in circumstances where it is not possible to receive indemnification from the contaminating party. The Bill proposes that the financing for the fund shall come from, among other things, a levy imposed on industrial plants and parties in possession of hazardous materials. At this stage, it is not possible to know what will be the rate of the levy if imposed
.
It is unclear what will be the final version of the law and when it will be approved. If the Bill is passed in its present version, it will apply to our manufacturing sites. At every such site, an historical land survey will be conducted and according to the decision of the Ministry of Environmental Protection, there may be further requirements and land surveys as a result thereof or instructions to clean up the land, to the extent contamination is found in the land, as defined in the law. At this juncture, since a land survey has not yet been conducted, it is not possible to know the extent of the exposure to obligations under the Bill if adopted and the cost thereof.
In April 2014, the Ministry of Environmental Protection published for public comments a draft of policy principles regarding land contamination, which reflects the policy practiced by the Ministry, as expressed both in the business licenses and toxic permits issued by the Ministry. In this context, the policy will make no material change in the current legal situation. The pertinent change that results from the proposed policy in regard to the Company is that all major industrial facilities (including all of our manufacturing sites) will be required by their business licenses to conduct historical surveys.
The land surveys are being conducted in coordination with the Ministry of Environmental Protection.
At the Sodom site, historical crude oil contamination has been found near the operational salt reservoir. Our Dead Sea Works subsidiary submitted a plan to the Ministry of Environmental Protection for treatment at the site and is awaiting the Ministry’s instructions. The Bill for Prevention of Land Contamination and Restoration of Contaminated Lands, which is in the legislative process, as mentioned above may affect the treatment and the solution that is selected.
In addition, a groundwater study in Dead Sea Works’ power stations’ contaminated oil tank farm showed no contamination in groundwater; however, soil rehabilitation is expected in the future. At the old gas station, boreholes were drilled and oil is being pumped from the contaminated soil and groundwater.
There is an ongoing implementation of a multi-year master plan to prevent ground pollution by fuels or oils at our Rotem sites. This year the upgrade of the refueling station for heavy equipment on the Rotem site was completed.
Liquid and Solid Waste
During the production processes at ICL’s facilities, industrial solid waste and wastewater are produced. According to the discharge permit, wastewater is channeled into water sources or evaporation ponds.
In Spain, a multi-year program is underway to restore salt piles while paying close attention to the issue of wastewater drainage and sludge treatment.
At Dead Sea Works, a project was completed for restoring 100% of the runoff of the facility for the treatment of sanitary waste for the production facility. In addition, a detailed plan was approved for restoration of the bulky waste at the plant site.
As part of the manufacturing process in Sodom salt is produced. The Company stores some of the salt produced on a storage site in Sodom. In the opinion of the Ministry of Environmental Protection, the salt storage site in Sodom should be viewed as a salt removal / salt burial site. The Company believes that this position is not justified and the matter is now under discussion with the Ministry. As of the date of this Annual Report, the discussions have not yet been concluded.
At the Rotem site, a master plan for treating waste is being implemented with the principal aims of reducing effluent quantities, turning part of the effluents into products, recycling wastewater, reducing water consumption, treatment of wastewater at the start of the flow and neutralization and restoration of wastewater reservoirs.
At the Fertilizers and Chemical Substances facility, a number of biological pilots were conducted to find a solution for compliance by the plant with standards covering treatment of the plant’s wastewater flowing into the Kishon River, as directed by the Inbar Committee. The solutions were presented to and discussed with the Ministry of Environmental Protection.
Our Industrial Products segment operates a special authorized laboratory for monitoring and analyzing wastewater quality. In addition, our Industrial Products segment operates a facility in Naot Hovav for biological treatment of the plant’s wastewater.
A sanitary facility at the Bromine Compounds plant for the independent treatment of the sanitary effluents is being operated
.
Our Industrial Products segment has completed construction of an independent wastewater removal system at the Bromine Compounds plant. The system includes a piping system and the plant’s own evaporation ponds. The system was built according to U.S standards
,
which includes leakage monitoring and air monitoring. In 2013, the construction was completed and beginning in late 2013, all the plant’s wastewater is presently being pumped into the new evaporation ponds.
Our Industrial Products segment established a thickening and filtration facility to treat solid waste at the Periclase plant. The facility has completed its test run stages and has commenced operation.
Our manufacturing facility at Naot Hovav contains waste. Pursuant to the requirements of the Ministry of Environmental Protection, the Company is required to treat the existing (historical) waste and waste produced in ongoing operations. The treatment will take place, in part, at a restoration facility at Naot Hovav of hydro bromine acid, and in part will be sent out for external treatment. The Company has a provision for treatment of waste, amounting to, as at December 31, 2014, to about $45 million. Management estimates, based on the information available to it on the approval date of our financial statements, that the provision included in the financial statements is sufficient to cover the estimated cost of treating the historical waste. At this stage, the facility treats the ongoing waste that is created in the production processes at the facility, and the facility is in the test run stages toward commencing treatment of the historical waste that is stored in a special site in the site of the facility, in coordination with the Ministry of Environmental Protection, which is planned to be treated by the facility.
Hazardous Substances
As part of our operations, we produce, store, transport, and use materials that are defined as hazardous materials according to the Israeli Hazardous Substances Law, 1993. Handling such substances requires a special permit (“toxins permit”) that is renewed annually. All our companies have toxin permits as required by law and they operate according to the special conditions defined in these permits, based on the requirements of the toxins permit issued by Ministry of Environmental Protection. These materials include fuels, acids, sulfur, bromine, chlorine, ammonia and various organic compounds. Leakage or loss of control of these materials could cause an environmental incident and cause damage to people and to the environment. We take measures to prevent such occurrences, and, at the same time, prepare for such occurrences by means of emergency teams and appropriate equipment to deal with these types of events.
Regulation of Concessions and Mining Activities
For information about laws and legal arrangements related to our concessions and mining rights and other related licenses and permits, see “—D. Property, Plant and Equipment —Mineral Extraction and Mining Operations” and “—D. Property, Plant and Equipment —Other Leases, Licenses and Permits,” respectively.
Price Monitoring
The prices of fertilizer grade phosphoric acid for local Israeli customers are regulated under the Supervision of Prices for Commodities and Services Law 1996. The quantity of these products sold in Israel by our Fertilizers segment is not material to us.
We and some of our subsidiaries have been declared a monopoly in Israel in the following areas: potash, phosphoric acid, sulfuric acid, ammonia, chemical fertilizers, phosphates, bromine and bromine compounds. Due to their having been declared monopolies, we are subject to limitations set forth in Chapter 4 of the Restrictive Business Practices Law, 1988, most significantly its prohibition on monopolies against abusing their positions as monopolies. In 2014 and in 2013, approximately 5% of our revenue derived from Israeli sales and, therefore, in our estimation, the abovementioned declaration does not have a material impact on us. We also have an internal antitrust compliance program.
C. ORGANIZATIONAL STRUCTURE
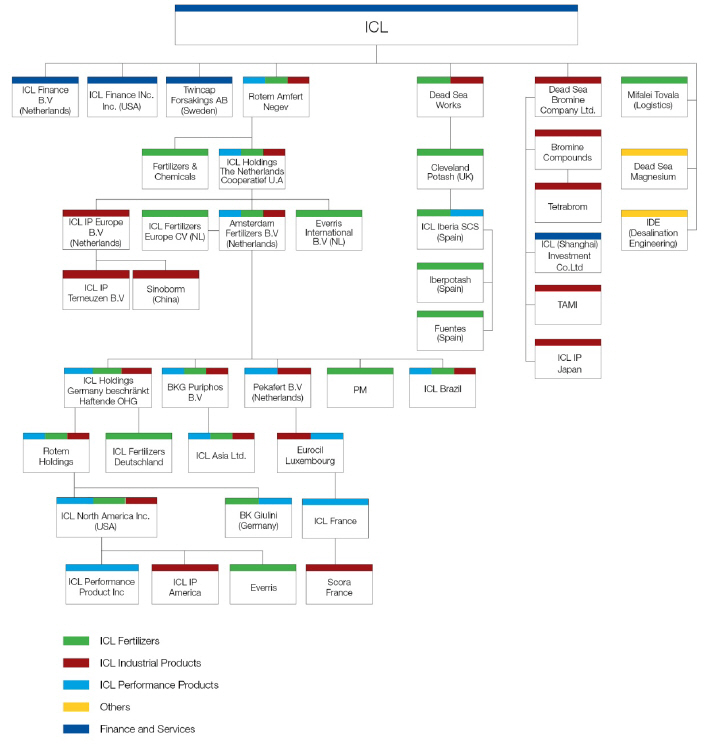
A list of our subsidiaries, including name, country of incorporation or residence and proportion of ownership interest and voting power is provided in “Item 19. Exhibits—Exhibit 8.1,” which is incorporated herein by reference.
D. PROPERTY, PLANTS AND EQUIPMENT
Under the Israeli Dead Sea Concession Law, 1961, as amended in 1986 (the “Concession Law”), we have lease rights until 2030 for the salt and carnallite ponds, pumping facilities and productions plants at Sodom. We have other production facilities in Israel, situated on land with a long term lease, including the plants at Mishor Rotem (mainly leased until 2028 to 2041), the Oron and Zin sites of our Fertilizers segment (leased until 2017 to 2024), production and transportation facilities at Naot Hovav of our Industrial Products segment (leased until 2024 to 2048), as well as production, storage and transportation facilities and chemicals and research laboratories at Kiryat Ata (leased until 2046 to 2049) that belong to our Fertilizers segment and our Industrial Products segment. We also use warehouses and loading and unloading sites at the Ashdod (leased until 2030) and Eilat ports (negotiations are underway to extend the agreement).
We have additional production facilities outside Israel, the main ones being:
|
|
·
|
Germany: production plants of our Performance Products segment at Ludwigshafen and Ladenburg are owned by the ICL Group.
|
|
|
·
|
The Netherlands: production plants of our Industrial Products segment at Terneuzen that are owned, a facility of our Fertilizers segment in Amsterdam held under a lease until 2034 (or under certain conditions up to 2044) and a production facility in the southern Netherlands on land that is partly owned and partly held under a long term lease.
|
|
|
·
|
Spain: the concessions at the potash and salt mines are held under the concession agreements described below. The potash and salt production plant, and the warehouses, as well as the loading and unloading facilities of our Fertilizers segment at Catalonia, are owned by the ICL Group. Our Fertilizers segment also has a liquid fertilizer and soluble fertilizer production plant in Totana, another plant for mixing solid fertilizers in Cartagena and a concession on two ports in Cartagena and Almeria until 2024 and 2017, respectively.
|
|
|
·
|
The United Kingdom: the rights to the potash and salt mines are held under the concession agreements described below. The potash and salt and production plants and the warehouses of our Fertilizers segment in Cleveland are owned by the ICL Group. The warehouses and bulk loading and unloading facilities at the port are leased until March 2034. The Company owns three mines and one plant for producing peat of our Fertilizers segment at Everris in the United Kingdom.
|
|
|
·
|
The United States: the production plant of our Industrial Products segment in West Virginia is mainly owned by the ICL Group, the packaging facility of that location is leased through 2017, and the production plants of our Performance Products segment in Lawrence, Kansas and St. Louis, Missouri are owned by the ICL Group. The production plants of our Fertilizers segment in South Carolina are operated under leases ending in 2025 and 2017 (with an option to extend through 2022).
|
The following table sets forth certain information regarding our principal properties as of December 31, 2014.
|
Property Type
|
Location
|
Size (square feet)
|
Products
|
Owned/Leased
|
|
Headquarters
|
Tel Aviv, Israel
|
17,222 square feet
|
Company headquarters
|
Leased
|
|
Plant
|
Sodom, Israel
|
13,099,679 square feet (not including ponds and factory)
|
Fertilizers segment products and power station
|
Leased
|
|
Plant
|
Sodom, Israel
|
2,326,060 square feet
|
Industrial Products segment products
|
Concession
|
|
Pumping station
|
Sodom, Israel
|
920,314 square feet
|
Pumping station for Fertilizers segment
|
Concession
|
|
Conveyor belt
|
Sodom, Israel
|
1,970,333 square feet
|
Transportation facility
|
Owned on leased land
|
|
Plant
|
Mishor Rotem, Israel
|
27,524,194 square feet
|
Fertilizers segment products
|
Owned on leased land
|
|
Plant
|
Mishor Rotem, Israel
|
10,763,910 square feet
|
Industrial Products segment products
|
Owned on leased land
|
|
Plant
|
Neot Hovav, Israel
|
3,761,987 square feet
|
Industrial Products segment products
|
Owned on leased land
|
|
Plant
|
Oron, Israel
|
4,413,240 square feet (not including phosphate reserve)
|
Fertilizers segment products
|
Owned on leased land
|
|
Property Type
|
Location
|
Size (square feet)
|
Products
|
Owned/Leased
|
|
Plant
|
Zin, Israel
|
8,483,916 square feet
|
Fertilizers segment products
|
Owned on leased land
|
|
Plant
|
Kiryat Ata, Israel
|
6,888,903 square feet
|
Fertilizers segment products
|
Leased
|
|
Warehouse and loading facility
|
Ashdod, Israel
|
664,133 square feet
|
Warehouse for Fertilizers segment products with capacity of 412,769 metric tons
|
Leased
|
|
Warehouse and loading facility
|
Eilat, Israel
|
152,557 square feet
|
Warehouse for Fertilizers segment products with capacity of 96,162 metric tons
|
Leased
|
|
Plant
|
Catalonia, Spain
|
48,491,416 square feet
|
Mines, manufacturing facilities and warehouses for Fertilizers segment products
|
Owned
|
|
Plant
|
Totana, Spain
|
2,210,261 square feet
|
Fertilizers segment products
|
Owned
|
|
Plant
|
Cartagena, Spain
|
209,853 square feet
|
Warehouse for Fertilizers segment products
|
Owned
|
|
Port
|
Cartagena, Spain
|
184,342 square feet
|
Storage for Fertilizers segment products
|
Concession
|
|
Port
|
Almeria, Spain
|
28,761 square feet
|
Storage for Fertilizers segment products
|
Concession
|
|
Plant
|
Cleveland, United Kingdom
|
13,239,609 square feet
|
Fertilizers segment products
|
Owned
|
|
Office
|
Ipswich, United Kingdom
|
3,274 square feet
|
Fertilizers segment office
|
Leased
|
|
Plant
|
Nutberry, United Kingdom
|
322,917 square feet
|
Fertilizers segment products
|
Owned
|
|
Peat Moor
|
Nutberry, United Kingdom
|
12,916,692 square feet
|
Peat mine
|
Owned
|
|
Peat Moor
|
Douglas Water, United Kingdom
|
4,843,759 square feet
|
Peat mine
|
Owned
|
|
Peat Moor
|
Cerca, United Kingdom
|
4,305,564 square feet
|
Peat mine
|
Leased
|
|
Plant
|
Bitterfeld, Germany
|
514,031 square feet
|
Industrial Products segment products with annual productive capacity of 190,000 metric tons
|
Owned
|
|
Property Type
|
Location
|
Size (square feet)
|
Products
|
Owned/Leased
|
|
Plant
|
Ladenburg, Germany
|
8,072,933 square feet
|
Performance Products segment products with annual productive capacity of 148,780 metric tons
|
Owned
|
|
Plant
|
Hemmingen, Germany
|
175,042 square feet
|
Performance Products segment products with annual productive capacity of 2,500 metric tons
|
Owned
|
|
Plant
|
Duesseldorf, Germany
|
1,614,587 square feet
|
Performance Products segment products with annual productive capacity of 224,000 tons
|
Leased
|
|
Plant
|
Ludwigshafen, Germany
|
231,263 square feet
|
Performance Products and Fertilizers segments products
|
Owned and leased
|
|
Plant
|
Terneuzen, the Netherlands
|
930,271 square feet
|
Industrial Products segment products
|
Owned
|
|
Plant
|
Amsterdam, the Netherlands
|
349,827 square feet
|
Fertilizers segment products and logistics center
|
Owned plant on leased land
|
|
Plant
|
Heerlen, the Netherlands
|
481,802 square feet
|
Fertilizers segment products
|
Owned and Leased
|
|
Plant
|
Calais, France
|
538,196 square feet
|
Industrial Products segment products with annual productive capacity of 22,000 metric tons
|
Owned
|
|
Plant
|
Wexford, Ireland
|
88,000 square feet
|
Industrial Products segment products with annual productive capacity of 1.8 billion tablets.
|
Owned
|
|
Plant
|
Belgium
|
128,693 square feet
|
Fertilizers segment products
|
Owned
|
|
Plant
|
Kamloops, British Columbia, Canada
|
392,040 square feet
|
Performance Products segment products
|
Leased
|
|
Plant
|
Stugeon County, Alberta, Canada
|
56,425 square feet
|
Performance Products segment products with annual productive capacity of 305,253 gallons
|
Leased
|
|
Property Type
|
Location
|
Size (square feet)
|
Products
|
Owned/Leased
|
|
Plant
|
South Charleston, West Virginia, United States
|
475,000 square feet
|
Industrial Products segment products with annual productive capacity of 54,431 metric tons
|
Leased
|
|
Plant
|
South Charleston, West Virginia, United States
|
871,200 square feet
|
Industrial Products segment products with annual productive capacity of 36,287 metric tons
|
Owned
|
|
Plant
|
North Charleston, South Carolina, United States
|
60,000 square feet
|
Fertilizers segment products with annual productive capacity of 13,608 metric tons
|
Leased
|
|
Plant
|
Summerville, South Carolina, United States
|
41,000 square feet
|
Fertilizers and Performance Products segments products
|
Leased
|
|
Plant
|
Lawrence, Kansas, United States
|
179,689 square feet
|
Performance Products segment products with annual productive capacity of 97,069 metric tons
|
Owned
|
|
Plant
|
Carondelet, Missouri, United States
|
172,361 square feet
|
Performance Products segment products with annual productive capacity of 50,953 metric tons
|
Owned
|
|
Office
|
St. Louis, Missouri, United States
|
35,000 square feet
|
US headquarters
|
Leased
|
|
Plant
|
Rancho Cucamonga, California, United States
|
103,600 square feet
|
Performance Products segment products with annual productive capacity of 11,322 metric tons
|
Leased
|
|
Plant
|
Gallipolis Ferry, West Virginia, United States
|
1,742,400 square feet
|
Industrial Products segment products with annual productive capacity of 68,039 metric tons
|
Owned
|
|
Plant
|
Sao Jose dos Campos, Brazil
|
79,298 square feet
|
Performance Products segment products with annual productive capacity of 27,000 metric tons
|
Leased
|
|
Plant
|
Nuevo Leon, Mexico
|
103,420 square feet
|
Performance Products segment products with annual productive capacity of 41,800 metric tons
|
Owned
|
|
Property Type
|
Location
|
Size (square feet)
|
Products
|
Owned/Leased
|
|
Plant
|
Bandırma, Turkey
|
375,187 square feet
|
Fertilizers segment products with annual productive capacity of 45,359 metric tons
|
Owned
|
|
Plant
|
Lian Yungang, China
|
358,665 square feet
|
Industrial Products segment products with annual productive capacity of 4,300 metric tons
|
Owned
|
|
Plant
|
Shan Dong, China
|
691,771 square feet
|
Industrial Products segment products
|
Owned
|
|
Plant
|
Jiangyin, Jaingsu, China
|
717,770 square feet
|
Performance Products segment products with annual productive capacity of 20,866 metric tons
|
Land Use Right (expires on January 31, 2054)
|
|
Plant
|
Jiaxing, China
|
828,017
|
Industrial Products segment products
|
Owned
|
|
Plant
|
Cajati, Brazil
|
101,375 square feet
|
Performance Products Segment with annual productive capacity of 107,000 metric
tons
|
Leased |
|
Plant
|
Sodom, Israel
|
4,088,800 square feet
|
Magnesium Plant with annual productive capacity of 33,000 metric
tons
|
Leased |
|
European Headquarters
|
Amsterdam, The Netherlands
|
24,220 square feet
|
European Company headquarters
|
Leased
|
Other Leases, Licenses and Permits
Well Production Permits
The supply of water to our Fertilizers segment plants at the Dead Sea is via a series of wells that we operate, both within and outside the concession area. The Company has lease agreements and production permits for these wells. Dead Sea Works has permits from the Water Authority to draw water from the wells at Ein Ofarim (which is located outside the area of the concession). The lease period from Israel Lands Administration (ILA) for these wells expired in 2009. An application to extend the lease period was submitted to ILA, but after a lengthy procedure, it was rejected. The Company has filed a request with ILA’s Exemptions Committee, which approved the application. This application is now subject to the approval of the Israeli Minister of Finance. The Company is in close contact with the Ministry of Finance, which has not yet signed the approval due to, as far as the Company knows, technical reasons.
Business Licenses and Other Permits
In November 2013, a reform in the Business Licensing Law, 1968, came into effect which determines, among other things, that business licenses in Israel will no longer be perpetual, but rather each business license will be valid for a term of between one to fifteen years, depending on the type of activity the license covers. In addition, some of the activities requiring a license in accordance with the Business License Ordinance, 2013, shall be subject to unified specifications which will be published by the authorities as specified in the Ordinance, including the Ministry of Environmental Protection.
Up to now, we have been issued valid business licenses for our sites in Israel in perpetuity, in accordance with the law. Under the abovementioned reform, all of our businesses licenses will expire and will require renewal three years after the applicable “Unified Specifications” are published, except power stations and storage of fertilizers, which will remain in perpetuity.
In addition, our Fertilizers segment and our Industrial Products segment have valid toxic substance permits under the Israeli Hazardous Materials Law (1993), issued by the Ministry of Environmental Protection. The term of the toxic substance permits is one year. Renewal of permits is performed on an ongoing basis. Additional conditions were set out in the toxic substances permit received by Bromine Compounds, including requirements for risk management and seismic surveys Bromine Compounds is required to perform in accordance with the Ministry’s guidelines.
Our Industrial Products plants at Sodom and Mishor Rotem have valid permits for discharging industrial wastewater into the Dead Sea which require renewal from time to time. The Industrial Products plant in Naot Hovav discharges industrial wastewater into the evaporation ponds in accordance with the plant’s business license requirements. The costs of renewal of these licenses are not material.
Dead Sea Works has a valid permit for discharging industrial wastewater into the Dead Sea and into the Mediterranean Sea (Deshanim plant), under the Israeli Prevention of Sea Pollution from Land Based Sources Law (1988), which requires renewal from time to time. The costs of renewal of these licenses are not material.
The segment companies operate in accordance with conditions set out in the licenses and permits. If there is any discrepancy in respect of the requirements of these conditions, the companies take immediate action to remedy the discrepancy in coordination with the Ministry of Environmental Protection.
The Ministry of Environmental Protection has commenced implementation of the integrated licensing methodology, which is based on the Integrated Pollution Prevention and Control (“IPPC”) directive that was adopted by the European Union in 1996. Pursuant to this directive, large factories are required to make use of the best available techniques (“BAT”) in every environmental aspect on which they have an impact, while addressing all these aspects in an integrated manner. The BAT is provided in reference documents, which are published by the European Union and detail every type of industry to which BAT is relevant for elimination or reduction of environmental damage. However, the Israeli Clean Air Law, 2008 (the “Clean Air Law”) adopted this methodology only partially since it addresses only emissions into the atmosphere. In order to enable integration as required by the directive, the Ministry of Environmental Protection has added requirements for implementation of the IPPC methodology in the business licenses of factories considered to be “emission sources requiring a permit” under the Clean Air Law. The conditions are stipulated by the Ministry prior to submission of the request for an emission permit so that the permit request (concerning emissions into the atmosphere) will be filed together with the information required for determination of the conditions in other areas under the integrated licensing methodology, including, among other things, runoff, waste, treatment of hazardous substances and energy savings. A factory is first required to perform a survey of these differences and to submit such survey to the Ministry. It is anticipated that concurrent with the issuance of an air emission permit, or shortly thereafter, the factory will receive additional conditions, including requirements for implementation of the BAT in these areas. The Ministry of Environmental Protection issued a request for additional information under the integrated methodology for most our plants that are required to obtain an air emissions permit under the Clean Air Law. As at the date of this Annual Report, the plant of the Magnesium Company and the plant of a company from the Industrial Products segment in Naot Hovav (Bromine Compounds Ltd.) have received an emissions permit. The Company’s other plants in Israel have filed applications for emissions permits as required by law.
The Ministry of Environmental Protection has issued additional conditions for the business licenses of some of ICL’s companies in Israel that require submission of additional information, including a historical land survey. The historical surveys for the plants are being conducted in coordination with the Ministry of Environmental Protection.
As of the date of the report, it is not possible to know what costs are entailed by implementation of these requirements, if any.
Mineral Extraction and Mining Operations
The following is a description of the material properties where we extract minerals and conduct mining.
The Dead Sea
Approximately 40% of our sales in 2014 derived from products that were based on minerals that we extracted from the Dead Sea, including potash, bromine, sodium, magnesia, magnesium chloride and metal magnesium. The concentration of these minerals in the Dead Sea has generally remained steady in recent years with a trend of an increase in the concentration of the potash component, as a result of the diversion of the channel for the brines that are redirected into the Northern Basin. In addition, the salt concentration in the Dead Sea tends to rise in periods wherein the quantity of water flowing into the Sea is less than the quantity of water evaporating from it (which is what has happened in the last fifty years). The Dead Sea contains a supply of these raw materials that is, for all practical purposes, unlimited.
Our extraction of minerals from the Dead Sea begins with an evaporation process facilitated by the hot and dry climate of the Dead Sea region. This area is located approximately 1,410 feet below sea level, which is considered to be the lowest place on earth. The Dead Sea is divided into two parts: the Northern Basin and an area in the south that consists of our evaporation ponds.
The production process begins with the pumping of water from the Northern Basin to our adjacent evaporation ponds. Our pumping station P 88 has a pumping capacity of 100,000 cubic meters per hour. In 2014, we pumped approximately 370 million cubic meters of water from the Northern Basin. Of this quantity, approximately 190 million cubic meters of brine are reflowed into the Northern Basin of the Dead Sea at the end of the process. In 2014, we produced from the Dead Sea approximately 3.5 million metric tons of potash, 174 thousand metric tons of bromine, 26 thousand metric tons of magnesium, 259 thousand metric tons of salt and 136 thousand metric tons of magnesium chloride solids. We plan to build a new pumping station from the Northern Basin to the evaporation ponds, as part of our preparations for the receding level of the Dead Sea in the Northern Basin and the retirement of pumping station P 88 from service. However, we have experienced a delay in receiving approvals from the various government agencies that must approve our statutory plans for our new pumping station. In light of the delay in approval of the statutory plans, we are required to make an additional investment to extend the life of pumping station P 88 for an additional three years.
The evaporation ponds extend over an area of approximately 146 square kilometers. They include a subsystem of 35 ponds for salt precipitation and ponds for the precipitation of carnallite.
The salt pond known as Pond 5 is the largest pond in the complex. It has an area of approximately 80 square kilometers. It was built during the 1960s by construction of a large dam, sealed by a clay core, in the area that was then the southern basin of the Dead Sea and permits the continued existence of the Southern Basin due to the system of pumping stations and flowing channels that are operated as part of the industrial operational system of the evaporation ponds. The evaporation processes give rise to concentration of the brines and the sinking of the sodium chloride to the floor of the pond. The remaining brines are rich in potash, magnesium and bromine. These brines are pumped into the systems of other ponds, and as a result of the continued evaporation, a new mineral “carnallite” precipitates. Carnallite is the raw material used for production of potash, magnesium, chlorine and magnesium chloride. The carnallite is harvested by floating barges and pumped as a slurry to our production plants. The brine from the edge of the carnallite pools is used as a raw material in the production of bromine.
The precipitated sodium chloride, or salt, creates a layer on the pond bed of approximately 20 million tons annually. Precipitation of the salt causes a reduction in the volume of the solutions in the pond. As the production process requires maintaining a fixed volume of solutions (brines) in the pond, the water level of the pond is accordingly raised by approximately 20 centimeters annually.
The situation described above requires establishment defenses for the relevant objects.
The temporary defenses have been underway for a number of years and are characterized by elevating the height of the dike along the west coast of the pond, opposite the relevant hotels, including in some of the places a system to lower the ground water. This defensive dike is raised from time to time, depending on water level of the pond. As of the date of this Annual Report, there is an agreement between Dead Sea Works and the government of Israel regarding financing of the costs of the temporary defenses: Dead Sea Works will bear 39.5% of the financing and the government of Israel will bear the remaining cost.
On July 8, 2012, we entered into an agreement with the government of Israel relating to a permanent solution for the rising water levels in Pond 5. The permanent solution is to be carried out by means of harvesting all the salt from the floor of the pond. Upon completion of the salt harvesting, the process of production of the raw material will no longer require us to constantly raise the water level in the pond. Planning and execution of the salt harvesting will be performed by us. This project will constitute an Israeli national infrastructure project that will be promoted by the Israeli Committee for National Infrastructures. Our agreement with the government requires that, starting January 1, 2017, the water level in Pond 5 will not rise above 15.1 meters. The statutory foundation for the salt harvesting project is presently being discussed by the Board of National Infrastructures and its approval is expected in 2015. Concurrently, we are performing additional activities relating to the salt harvesting project.
According to the Dead Sea Protection Company, the total cost of the salt harvesting was estimated, as of October 2010, to be in an undiscounted amount of NIS 7 billion (a discounted amount of NIS 3.8 billion). The Israeli government will bear 20% of the cost of the salt harvesting, but not more than the discounted amount (20% of NIS 3.8 billion, the discounted amount). The maximum liability of the government is linked to the Israeli CPI and bears interest at the rate of 7%.
An additional plan relating to our ability to conduct land surveys in the area was also recently approved by the Israeli Committee for National Infrastructures. Approval of each of the stages of the plan by the relevant dates set out in the project schedule is essential for continuation of Dead Sea Works’ production process, and delays could have an unfavorable impact on the process and, accordingly, could give rise to damage or losses. In order to advance execution of the new pumping station discussed above and the salt harvesting set up, the Committee for National Infrastructures held a hearing in which it approved the location of the new pumping station, allowing us to proceed with the plan for its construction.
Construction of a new partition in the middle of the dike surrounding Pond 5 was completed in 2014. The objective of this project is to minimize seepage from the dike. This project includes raising the dike by an additional meter.
The appearance of sinkholes, which is attributed mainly to the lowering of the water level of the Dead Sea, is increasing in the Dead Sea area. The receding level of the Dead Sea is not to be confused with the rise of the water level in Pond 5 discussed above, and the two seemingly contradictory phenomena are occurring simultaneously, as Pond 5 is located in the Southern Basin on a different plane than the main body of the sea lying to its north, necessitating a special pumping station to constantly feed the pond with water. See “Item 3. Key Information—D. Risk Factors—A new pumping station will be required due to the receding water level of the Dead Sea.” While the water level of Pond 5 is rising due to the accumulation of salt on its floor and the continuous pumping of water from the Northern Basin of the Dead Sea, the water level of the Northern Basin is receding. Most of the sinkholes caused by the receding level of the Dead Sea develop near the Northern Basin of the Sea, where there is little operation by our Fertilizers segment. Most of the sinkholes have appeared near the evaporation ponds and in other places in the Dead Sea Works area. Development of a sinkhole under a dike could cause the dike to burst, causing loss of the solutions in the pond. Our Fertilizers segment is working to identify the development of these sinkholes in the area of the plant and along the dikes, and to fill them when they appear.
We own and operate a 110 megawatt power station, presently limited to about 60 megawatts due to environmental protection restrictions, which provides a significant part of the power used in our production plants at the Dead Sea. The balance is purchased from Israel Electric Company, a state owned utility, and from OPC, a private producer of electricity that is a related party.
In 2012, construction of a new power station in Sodom fueled by natural gas was approved, having a license to produce approximately 290 MW and which will supply the electricity requirements of the production facilities at Sodom. As a practical matter, the Company intends, in this stage, to operate a cogeneration plant with a production capacity of 245 MW. Operation of the station is planned for the second half of 2015. The Company intends to make use of its present gas agreements and later on to enter into new gas agreements for purpose of operating the power station. For details regarding the said contracts – see Note 23 to the Company’s financial statements.
Transport from the Company’s plant in the Dead Sea is by means of a conveyor belt from the plant to the railway and from Highway 90 in Israel.
The Negev Desert
We currently operate large surface phosphate mining sites at Oron, Rotem and Zin in the Negev Desert. In addition, the Israeli Minister of National Infrastructures under the Israeli Mines Ordinance, through the Supervisor of Mines in his Office (the “Supervisor”), has decided to extend the area of the Rotem field concession (valid until the end of the 2021) so that it covers the Hatrurim field. The area of the Rotem concession has been so extended, and the matter has been transferred to the Israel Lands Administration (“ILA”) to deal with the extension of the area of the mining permit for the Rotem field, in line with the extension of the concession area.
Each of these fields has a similar layered structure and geological composition, with the phosphate preserved as relatively narrow elongated bodies along the margins and within the axes of two northeast to southwest trending asymmetrical synclines (basins or trough shaped folds in the rock layer whose upper components are younger than those below) or monoclines (step like folds in the rock layer). Oron and Rotem lie within a single syncline to the northwest of the Zin syncline. The three deposits have been proved over extensive distances in terms of length (Rotem 10 kilometers, Oron 16 kilometers and Zin 22 kilometers) and width (4 kilometers each). They are all known to extend further in terms of length but are limited in operational size. The Campanian (Upper Cretaceous period) phosphate rock deposits of Israel are part of the Mediterranean phosphate belt extending from Turkey, through Jordan and Israel, and westward through Egypt, Tunisia and Morocco. We began operations at Oron in the 1950s, and at Rotem and Zin in the 1970s. These sites are accessible by road and rail. We have long term leases to all the land on which our Israeli facilities are located but we operate under mining concessions and licenses granted to us by the Israeli Minister of National Infrastructures and by the ILA. See “Concessions and Mining Rights” below.
The plan for mining phosphates in Barir (South Zohar) is in the planning approval stages, and it has not yet been decided whether to file the plan with the proper authorities. For a description of certain risks relating to Barir field, see “Item 3. Key Information—D. Risk Factors—Our mining operations are dependent on concessions, licenses and permits granted to us by the respective governments in the countries where they are located.”
The future of our Rotem operation potentially rests on our ability to mine and produce from resources of brown and bituminous phosphate, the only resources that are likely to be converted to reserves in the future. Currently, the reserve of bituminous phosphate (approximately 0.4 million metric tons at Zin) is being mined and used in a blending process with other phosphates of lower organic concentrations to produce fertilizer products. However, due to the higher organic content of bituminous phosphate, the production of phosphoric acid on its own would currently require the use of pyrolysis (decomposing organic material by heat) for processing, which is costly and involves large investments in energy. However, our Rotem subsidiary is developing and has pilot plant tested a process using only beneficiation (the separation of phosphorus from the surrounding organic material). The results indicate improvements in the phosphorus grade from 25%–26% to 31%–32%, and reduction in the organic content by half. Further pilot plant testing of the bituminous phosphate has been carried out and has produced an acid that has a light green color (“green acid”).
The method of mining in the Negev is by conventional open pit or quarrying methods, using drilling and blasting where necessary, hydraulic excavators and rigid dump trucks or dozers with rippers for overburden removal and front-end loaders and trucks for mining phosphate. Each mine site has varying numbers and thicknesses of overburden, inter burden and phosphate rock layers, so that the size of mining equipment is conformed to the sites. At Rotem, the mining of phosphate and stripping of waste is entirely conventional and consists of 190 metric ton trucks and 18 cubic meter bucket shovel operations. Oron and Zin sites use contractors for all operations, and equipment at these sites is smaller. Typically, the excavator bucket capacities are in the range of 3 to 7 cubic meters and the trucks have capacity of 45 to 65 metric tons.
Phosphate rock from the Rotem mine is transported by truck to a nearby beneficiation plant at Mishor Rotem. At that plant, we also operate two sulfuric acid plants, three green phosphoric acid plants, one white phosphoric acid plant, three superphosphate plants, two granular fertilizer plants, one MKP (mono potassium phosphate) plant and one oil shale burning plant and production of electricity and steam. We also have beneficiation plants at both Oron and Zin. The product of the process is a high grade, multi-purpose phosphate product, most of which is used to produce phosphoric acid and fertilizers. The rest of this material is sold to other phosphoric acid and fertilizer producers and some is sold for direct application as fertilizer.
The plant at Mishor Rotem is powered by electricity that we generate at our sulfuric acid plants and by oil shale that we mine in Mishor Rotem. Any surplus power is sold to Israel Electric Company. All of the power utilized by the Oron and Zin beneficiation plants is purchased from OPC, a private, related party producer of electricity.
The following table sets forth for the periods indicated the amount of our total mine production of raw ore in our mines in the Negev (and the relevant grade) supplied to our beneficiation plants:
|
Year Ended December 31,
|
||||||||||||
|
2014
|
2013
|
2012
|
||||||||||
|
Millions of metric tons produced
|
6.9 | 6.3 | 6.2 | |||||||||
|
Grade (% P2O5 before/after beneficiation)
|
31.5/26 | 31.5/26 | 31.5/26 | |||||||||
The following table sets forth (for the three years ended December 31, 2014, 2013, and 2012) the approximate amounts of product produced after processing by our operations in the Negev Desert:
|
Year Ended December 31,
|
||||||||||||
|
2014
|
2013
|
2012
|
||||||||||
|
thousands of metric tons
|
||||||||||||
|
Phosphate Rock
|
3,357 | 3,578 | 3,513 | |||||||||
|
Green Phosphoric Acid
|
475 | 535 | 467 | |||||||||
|
Fertilizers
|
729 | 897 | 733 | |||||||||
|
White Phosphoric Acid
|
121 | 139 | 117 | |||||||||
|
MKP
|
48 | 47 | 39 | |||||||||
Spain
We conduct our potash mining operations in Spain through our indirect wholly owned subsidiary, Iberpotash, and its wholly owned subsidiary, Trafico de Mercancias. There are three underground mines that make up Iberpotash’s complex: Suria, Cabanasas and Vilafruns. The Company operates two mines, the Cabanasas mine, which is located in the town of Suria, approximately 12 kilometers north of the district capital of Manresa in the Cardoner river valley, and the Vilafruns mine, which is located in the town of Sallent, approximately 13 kilometers east of Suria in the Llobregat river valley. The Suria mine is closed and it is planned that the Vilafruns mine will close by the end of 2016. We may be forced to cease production at Vilafruns earlier than that if our appeal of the Spanish court’s suspension of our environmental license for that site is denied. See “Item 8. Financial Information—A. Consolidated Statements and Other Financial Information—Legal Proceedings—Spain Mining License Matters.” Production of potash at the Cabanasas mine is expected to increase up to approximately 800,000 tons per annum when production at the Vilafruns mine ceases and is expected to reach 1,100,000 tons per annum (double current levels) two years after production at Vilafruns ceases, and in the third stage mining of the potash is expected to increase up to about 1.4 million tons per year in the future. We own all of the land on which our Spanish surface facilities are located. The Spanish government owns all of the underground mining rights and has granted to us concessions to conduct mining operations under our land. See “– Concessions and Mining Rights — Spain” below.
The Cabanasas and Vilafruns mines are both in the province of Barcelona and are located approximately 530 to 900 meters below ground. Each mine has two access points and mining is by a modified room and pillar method. All of the mine sites are served by roads and are near major highways.
Extraction of potash from underground mines in Spain is carried out by mining sylvinite (a mixture of potash and salt found in varying potash concentrations). The potash is separated from the salt in production plants near the mines. For a description of our efficiency plan at Iberpotash, see “Item 4. Information on the Company—B. Business Overview—Segment Information—Fertilizers—Production.”
Potash was first discovered in 1912 at Suria and commercial development was started in 1920. We purchased our three Spanish mines in 1998. Potash of late Eocene age occurs in the northeast corner of the Ebro Evaporite Basin which lies along the southern flank of the Pyrenees. Sylvinite and carnallite occurs towards the top of the Cardona Halite at depths which vary considerably as a result of deformations associated with the Pyrenean fold and thrust belt. The potash layers (when seen underground) can, in places, be contorted on a local scale due to this deformation of the area. Two main potash seams are mined in the deposit Capa A and Capa B at both the Vilafruns and Cabanasas mines. Within these seams, sylvinite occurs in the joining of thin layers of halite in each of the seams. The sylvinite is high grade and with very low levels of insolubles.
We own and operate two processing plants, one in Suria and one in Sallent. The operations at these plants include crushing, grinding, desliming, froth flotation and drying. All of the power utilized by our Spanish mining operations is purchased from third party electric companies.
The following table sets forth, the quantities and grades of the potash ore extracted from the mines and processed in the plants in Spain, for the three years ended December 31, 2014, 2013 and 2012:
|
Year Ended December 31,
|
||||||||||||
|
2014
|
2013
|
2012
|
||||||||||
|
Sallent
|
||||||||||||
|
Ore processed (in millions of metric tons)
|
2.5 | 2.3 | 2.3 | |||||||||
|
Grade (% KCl)
|
23.4% | 23.4 | % | 22.3% | ||||||||
|
Suria
|
||||||||||||
|
Ore processed (in millions of metric tons)
|
1.9 | 1.9 | 1.9 | |||||||||
|
Grade (% KCl)
|
25.4% | 27.1 | % | 27.4% | ||||||||
|
Total
|
||||||||||||
|
Ore processed (in millions of metric tons)
|
4.4 | 4.2 | 4.2 | |||||||||
United Kingdom
Our mining operations in the United Kingdom are conducted by our wholly owned subsidiary, Cleveland Potash. Our mine and processing plant is located approximately 340 kilometers north of London and approximately 40 kilometers east of Middlesbrough, England in the North York Moors National Park. The mine was originally designed, developed and operated by Imperial Chemical Industries and Charter Consolidated and the first potash was extracted in 1973. We purchased the mine, including mining leases and mineral extraction licenses, in 2002 from the then owner, Anglo American Corporation.
Our mining operations in the United Kingdom are conducted both under land and under the North Sea. Mining operations are conducted at depths of as much as 1,300 meters below ground onshore and 850 meters below the surface of the North Sea. The operations under the North Sea are currently conducted as far as 14.5 kilometers offshore. Although we own the land on which our minehead and related surface operations are conducted, substantially all of our United Kingdom subsurface operations are conducted either under land that we do not own or under the North Sea, which we also do not own. We have the right to conduct our mining operations pursuant to the mining leases and mineral extraction licenses described below. See “ – Concessions and Mining Rights” below. Extraction of potash from underground mines in the United Kingdom is carried out by mining sylvinite (a mixture of potash and salt found in varying potash concentrations). The potash is separated from the salt and from insoluble materials in processing plants located near the mines.
Our United Kingdom mining operations are situated close to the western limits of potash and salt deposition in the Zechstein Basin extending inland in the United Kingdom and below the North Sea to Germany. The potash seam is of the Permian Evaporite Series and is overlain by some 800 meters to 1,300 meters of younger sedimentary rocks. The potash seam averages 7 meters in thickness but varies from zero to more than 20 meters in thickness. As part of the same Permian evaporite sequence, an approximately 11-meter-thick polysulphate layer exists approximately 150 meters below the potash deposits. Cleveland Potash has evaluated the potential of this polysulphate as a separate resource, and completed an access decline into the polysulphate bed in 2010 from one of their main salt roadways. Commencing from 2012, the Company sells the product in commercial quantities.
Our United Kingdom mine has been extensively explored using a combination of surface (sparse) and underground drilling. The underground long hole (horizontal) drilling and 3 D seismic (offshore) surveys are used to delinate areas of minerals well in advance of mining. The mine is accessed by two vertical shafts. One shaft hoists potash and salt and the other provides service access. Mining currently takes place in two discrete areas. Mining is by continuous miners with shuttle cars and by a modified room and pillar method. The mine has been designated as a “gassy” mine, containing methane gas. Supply of the electricity to the Company’s mining operations in the United Kingdom is powered primarily by electricity purchased by the local electricity company. There is also a power plant on the site than converts gas into electricity and supplements the electricity supply required for execution of the mining operations.
Our raw material processing operations include crushing, desliming, grinding, froth flotation and drying. The plant was built in 1971 and is properly maintained on an ongoing basis in order to preserve the existing production capacity.
The following table sets forth, the quantities and grades of the potash ore extracted from the mine in the United Kingdom and the insoluble clay minerals, for the three years ended December 31, 2014, 2013 and 2012.
|
Year Ended December 31,
|
||||||||||||
|
2014
|
2013
|
2012
|
||||||||||
|
Potash Ore (millions of metric tons)
|
2.6 | 2.3 | 1.8 | |||||||||
|
Grade (% KCl)
|
31.6% | 31.3% | 30.4% | |||||||||
|
Grade (% insols)
|
15.4% | 13.4% | 13.8% | |||||||||
Concessions and Mining Rights
Israel
Dead Sea Works Ltd. Concession
. Pursuant to the Dead Sea Concession Law, 1961 (hereinafter – “the Concession Law”), as amended in 1986, and the Concession Deed attached as an addendum to the concession, Dead Sea Works was granted a concession to utilize the resources of the Dead Sea and to lease the land required for its plants in Sodom for a period ending on March 31, 2030, accompanied by a priority right to receive the concession after its expiration, if the State will be interested in offering a new concession. In exchange for the concession, Dead Sea Works pays royalties to the Israeli government, calculated at the rate of about 5% of the value of the products at the factory gate, less certain expenses. In addition, DSW pays the Israel Lands Authority (ILA) lease fees for the leased land as such land is defined in the Concession Deed. The amount of the payment and its updating mechanism were stipulated in an agreement signed by the ILA (formerly – the Israel Lands Administration) in 1975.
As for the royalties payment by Dead Sea Works, the State of Israel was permitted to demand a re-evaluation of royalties rate relating to the quantity in excess of three million tons of potash manufactured in any year from 2010 and thereafter, provided the rate of the royalties with respect to such excess does not exceed 10% of the value of the product at the factory gate, less certain expenses. As part of the agreement with the State of Israel signed in July 2012, regarding performance of a harvest of the salt, it was also agreed with the Government to increase the rate of the royalties to 10% (in place of 5%) in respect of sales of potash in excess of 1.5 million tons per year.
Dead Sea Works grants a sub concession to Dead Sea Bromine Company Ltd. (“Dead Sea Bromine Company”) to produce bromine and its compounds from the Dead Sea, the expiration date of which is concurrent with Dead Sea Works’ concession. We pay royalties to the Israeli government on products manufactured by the Dead Sea Bromine Company. In addition, there is an arrangement relating to payment of royalties by Dead Sea Magnesium for production of magnesium metals by virtue of a specific arrangement with the State of Israel provided in the Israeli government’s decision dated September 5, 1993. Pursuant to the arrangement, royalties are paid by Dead Sea Magnesium on the basis of carnallite used for production of magnesium. The arrangement with Dead Sea Magnesium provides that during 2006 the State may demand a reconsideration in connection with the amount of the royalties and the method or their calculation for 2007 and thereafter. The State’s demand for reconsideration, as stated, was first received at the end of 2010, and the matter is presently in an arbitration proceeding, as described below. In 2006, a letter was received from the then Accountant General of the Israeli Ministry of Finance, claiming an underpayment of royalties amounting to hundreds of millions of shekels. Pursuant to the concession, disputes between the parties relating to the concession, including royalties are to be decided by an arbitration panel of three arbitrators (each side appoints an arbitrator and these two appoint the third arbitrator). For additional details regarding the arbitration proceeding and the provision recorded by the Company in the second quarter of 2014, in the amount of approximately $135 million, in respect of prior periods (2000 through 2013) (the total amount of the provision includes, among other things, interest and is net of the tax effect) stemming from the partial arbitration decision – see “Item 8. Financial Information—A. Consolidated Statements and Other Financial Information—Legal Proceedings.”
In 2012, 2013 and 2014, Dead Sea Works paid royalties to the Israeli government in the amount of approximately $125 million, $110 million, and $84 million, respectively.
Rotem Concession.
Rotem has been mining phosphates in the Negev in Israel for over fifty years. The mining is conducted in accordance with phosphate mining concessions, which are granted from time to time by the Minister for National Infrastructures under the Israeli Mines Ordinance by the Supervisor of Mines in the Ministry, accompanied by mining authorizations issued by the ILA. The Oron concession was first granted in 1952. The Zin concession was first granted in the 1970s as part of the Oron concession and the joint concession was subsequently renamed Zafir. The Zafir concession (consisting of both the Oron and Zin concessions) was renewed every 3 years and in 1995, it was renewed for 10 years and in 2002, it was renewed until 2021. The Rotem concession was first granted in 1970 and it was also renewed in 1995 for 10 years and in 2002, it was renewed until 2021. There is no tender process under the Mines Ordinance procedure. Given the high cost of constructing downstream processing facilities (which any other bidder would need to construct near the fields), we have not faced competition for these concessions in the past. The concessions relate to the quarry (phosphate rock) whereas the authorizations relate to use of land as active mine sites.
Under the terms of these concessions, Rotem is required to pay the State of Israel royalties based on a formula stipulated in the Israeli Mines Ordinance. The formula for the royalties was updated in February 2010 as part of a compromise agreement that settled all the disputes regarding past royalties and formulas for future royalties.
Rotem has the following three mining concessions, which cover a total area of approximately 55,327 acres:
1. Rotem Field — valid up to the end of 2021;
2. Zafir Field — (Oron-Zin) — valid up to the end of 2021;
3. Hatrurim Field — as noted, the Supervisor has decided to extend the area of the Rotem field concession so that it covers the Hatrurim Field. The matter has been transferred to the ILA to deal with the extension of the area of the mining permit for the Rotem Field, in line with the extension of the concession area.
Rotem has applied well in advance for land leases of the mining areas and has had little difficulty in renewing those leases in the recent past. The earliest renewal required for any of the existing relevant leases will be in 2021. In terms of the process for renewal, we only need to submit an application for renewal with standard geological information and a building permit from the ILA, a requirement which is not stipulated by law.
The mining and quarrying activities require zoning approval of the site based on a plan in accordance with the Israeli Planning and Building Law, 1965. These plans are updated, as needed, from time to time. As of the date of this Annual Report, there are various requests at different stages of deliberations before the planning authorities.
At the end of 2009, at the recommendation of a team accompanying preparation of a new site plan for the Oron Zin area, the Local District Board approved an extension of the execution stages of the site plan from 1991, which zones the Zàfir site (Oron Zin) for mining up to the end of 2013, and in September 2013, the District Board approved the extension of additional stages through the end of 2015. The process of getting these extensions approved consists of an ongoing process with mining execution stages in permitted mining zones.
The plan for mining phosphates in Barir field (South Zohar) is in planning approval stages, and it has not yet been decided whether to deposit it with the competent authorities. Israeli residents of Arad, the communities and the surrounding Bedouin villages in the area object to deposit of the plan and continuation of advancement of the planning stages in respect thereof, due to the fear of environmental and health dangers they contend will be caused as a result of operation of the mine. The Company believes that the mining activities in Barir field do not involve any risks to the environment or to people. After an expert appointed by the Israeli Ministry of the Prime Minister expressed his opinion that there is no health hazard in the Barir mine, the Israeli Ministry of Health appointed a committee on its behalf to examine the matter before the Israeli Ministry formulates its position. At the end of 2013, a public health expert was appointed (Prof. Samet from the United States) who delivered his opinion in the beginning of 2014. On April 3, 2014, the Company was informed that the former Minister of Health, Ms. Yael German, contacted the Head of the Planning Administration in the Ministry of the Interior, Ms. Binat Schwartz, and informed her that after she read the opinion of the expert appointed by the Ministry of Health, she has decided to oppose the mining in the Barir field, including test mining. The Company disagrees with the interpretation of the former Minister of Health of the opinion. In the Company’s estimation and based on its understanding of the said opinion, such opinion does not contradict the Company’s position that the mining activities in the Barir field do not pose any threat at all to the environment or to the residents. On December 2, 2014, the Head of the Planning Administration in the Ministry of the Interior brought up for discussion by the Planning and Building Council a proposal for advancement of the mining plan in the Barir field by the Administration’s authorities. A discussion was held however a decision regarding the matter has not yet been made. The residents of Arad are continuing to object to advancement of the mining plan and even to test mining. If mining approval is not received for the Barir field, this will significantly impact the Group’s future mining reserves in the medium and long term.
Sheshinski Committee Report
In 2012, 2013 and 2014, Rotem paid approximately $6 million, $4 million and $3 million, respectively, in royalties to the Israeli government. In terms of particular conditions that our Rotem subsidiary must meet in order to retain the concessions, we must comply with various reporting requirements in addition to the payment of royalties.
In June 2013, the former Minister of Finance, Mr. Yair Lapid, gave notice of establishment of a public committee, headed by Prof. Eitan Sheshinski, to the examine the policy covering the royalties received by the State from private entities, including the Company, for use of national natural resources, such as, potash, bromine and phosphate.
The committee was required, among other things, to examine the royalties’ policy from a broad perspective, while addressing the impacts on the present agreements between the various parties engaged in these matters and the State of Israel.
On October 20, 2014, the Committee published the final conclusions “regarding the government take to be received from use of national resources by private bodies”. The highlights of the Committee’s Recommendations are as follows:
The mix of taxes on natural resources in Israel will include three taxation elements: royalties, natural resources tax, and corporate tax.
The royalty rate for all minerals will be 5% for any extracted amount (currently, the royalty rate for potash is 5% on annual sales of up to 1.5 million tons, and 10% for any sales above that amount. The royalty rate for bromine is 5% and the royalty rate for phosphates is 2%); calculation of the royalties for phosphates which is made in accordance with the Mines Ordinance, will be changed such that the recognition of refining and processing costs of the mined raw material will be in accordance with normative costs to be established in the law.
A new natural resources tax will be imposed. The following are the main aspects of the proposed tax:
The natural resources tax base will be the amount from which the natural resources tax will be collected every year.
The tax base will be the Company’s operating profit, according to accounting profit and loss statements, after certain adjustments less financing expenses equal to 5% of the Company’s working capital, and less an amount that will represent the yield on the remaining depreciated cost of the fixed assets used in the production and sale of the mineral (hereinafter – “the Yield on the Depreciated Cost”).
A progressive tax will be imposed on the tax base, as described above, at a rate that will be determined in accordance with the level of the yield on the remaining depreciated cost of the fixed property used in the production and sale of the mineral in that year. The first tax bracket for the natural resource tax will be 25% with respect to the Yield on the Depreciated Cost between 14% and 20% and the second bracket will be 42% with respect to the Yield on the Depreciated Cost over 20%.
For the years in which the natural resources tax base is negative, the negative amount will be carried over from year to year, and will serve as a tax shield in the following tax year.
The limits of the natural resources tax – the natural resources tax will only be imposed on the profits derived from the production and the sale of minerals, such as potash and phosphates, and not on profits derived from downstream industrial activity. In addition, the natural resources tax will be calculated separately for each mineral. However, to the extent that there is a synergy between the different resources, and a particular mineral produces a benefit in the production of a different mineral, the Committee believes that such benefit should be reflected in the calculation of the natural resources tax.
Consequently, the benefit produced by the magnesium plant for the potash plant in the production of sylvinite will be recognized as an expense for the potash plant, and accordingly will be recognized as income for the magnesium plant. Clear rules will be established for this purpose with regard to the calculation of the said savings, with respect to potash and other minerals, where applicable.
A mechanism will be established for determining the market price for natural resources transactions between related parties in Israel, as well as a mechanism for calculating the manner in which expenses will be attributed to the production and sale of the natural resource and to the downstream activities.
Regarding bromine, a natural resources tax will be imposed in the same way it is imposed on other natural resources, with the exception than that the transfer price will be calculated separately for transfers to related parties in Israel, and separately for sales to related parties abroad. The transfer price for elemental bromine to related parties will be the higher of the following:
The actual price – the actual sale price for elemental bromine to related parties in Israel or abroad, whichever is relevant;
The price to a third party – the weighted average of the sale price to unrelated parties, which are manufacturers of bromine compounds, while adjusting the shipping and marketing costs, as needed;
The normative price – the normative price will be linked to the bromine compounds index and determined based on the Netback method, relying on the data from the five previous years for the Bromine Compounds Company in Israel or abroad, as relevant. In each of those years, all bromine compounds production costs will be deducted from the sales of the Bromine Composite Company, except for the cost of purchasing the raw bromine. A normative profit of 12% of the sales of the Bromine Compounds Company in Israel or abroad, as the case may be, will also be deducted from the operating profit, before the deduction of the cost of purchasing raw bromine. The amount reached through this calculation, for each of the years that is examined, will be divided by the quantity of bromine that the Bromine Compounds Company purchased in each of the years, and will be weighted into the stated normative price. The mechanism will be reviewed every 5 years and revised as necessary.
The Encouragement of Capital Investments Law – the law will be amended, to clarify that with regard to any tax benefits pursuant to that law, the definition of a “mineral extraction plant” will include all the plant’s activity through the production of the first sellable natural resources, such as potash, bromine and magnesium. Therefore, any activity in the production of the mineral will be subject to the excess profit tax, and will not be entitled to tax benefits pursuant to the Encouragement of Capital Investments Law. Downstream product activity such as bromine compounds and fertilizers will not be a part of the base used for calculating the excess profits tax and will not be excluded from the application of the Law.
In addition to the Committee’s recommendations above, corporate tax will apply at the rate of 26.5%.
The government take to be received from minerals when a natural resources tax is imposed is expected, according to the Committee, to range from 46% to 55%.
The Committee’s recommendations, if they are enacted into legislation, will apply to DSW, as of January 1, 2017.
Conclusion of the Dead Sea concession period – a designated team will be established, to be appointed by the Accountant General at the Ministry of Finance, which will work to establish certainty regarding the manner in which the value of the DSW assets will be calculated at the end of the concession period, in accordance with the Deed of Concession. This team will submit its recommendations to the Minister of Finance by the end of the first quarter of 2015. Additionally, the Minister of Finance will appoint a second team which will submit recommendations regarding the government actions that are needed in anticipation of the end of the concession period and will examine the manner in which the concession will be granted in the future. This team will submit its recommendations by the end of the first quarter of 2016.
It should be noted, that attached to the Committee’s recommendations were, among others, a minority statement of the Accountant General at the Ministry of Finance as well as a reservation from the Committee’s recommendations by representatives of the Ministry of Economy and the Ministry of National Infrastructures, Energy and Water Resources.
On November 10, 2014, the Ministry of Finance issued a press released according to which the Social-Economic Cabinet unanimously approved the Committee’s recommendations on November 10, 2014. According to the press release, the final recommendations will be drafted in contemplation of their legislation and will be brought for the approval of the Knesset. There is no certainty that the Knesset will approve the Committee’s recommendations in their current wording.
In August 2014, after publication of the interim conclusions of the Committee, the Company’s Board of Directors examined the economic viability of continuation and expansion of the production of certain products, including potash, metal magnesium, bromine compounds and downstream phosphate products. In light of the Committee’s final recommendations, and their approval by the Social-Economic Cabinet, as stated, the Company’s Board of Directors adopted the following decisions, further to decisions it had adopted in August 2014 – briefly:
Cancellation and reconsideration of investments
– to cancel the Company’s investments in Israel, mainly for the increase of the production capacity of potash, which had been approved as part the long term plan, in the amount of approximately $750 million, and to reexamine the economic expediency of additional investments in the amount of approximately $1 billion;
Bromine Compounds
– to formulate and implement an efficiency plan designed to significantly improve the profitability of Bromine Compounds Company, which belongs to the Industrial Products segment. This plan is required due to the continuing erosion of profits on bromine compounds as a result of the decline in demand for flame retardants, slow structural growth in the world market, a drop in prices, and strengthening of the shekel, compounded by the significant recent developments related to the partial arbitration decision with respect to royalties on sales of downstream products, including bromine compounds, and the possibility that the Committee’s final recommendations will be adopted and enacted into legislation. Company management formulated a plan, as stated, and has already commenced its implementation. The plan includes reduction of labor and other costs in the Bromine Compounds Company. There is no certainty that the plan will achieve its goals, due to various factors, including the situation of the market, competition, regulation, labor relations and/or any of the risk factors characterizing the Company’s activities, as noted in the “Risk Factors” section of this report. On February 2, 2015, the Workers Council of Bromine Compounds Ltd. from the ICL Industrial Products segment started a strike of the production facilities of Bromine Compounds Ltd. in Naot Hovav and halted all shipments of merchandise from the facilities. The strike at the facilities came in reaction to the efficiency plan the Company is implementing in Naot Hovav, whereby termination letters were sent to tens of employees who are covered by a collective bargaining agreement. Further to that stated above, on February 19, 2015, the Workers Council of DSW started a general strike in DSW’s factories in Sodom. For additional details – see “Item 6. Directors, Senior Management and Employees—D. Employees.”
The Magnesium Plant
– to make preparations for closure of our magnesium plant at the Dead Sea, commencing January 1, 2017, to the extent the discussions with the State of Israel regarding the tax and royalties issues will not support the continuation of the activities of the magnesium plant. Company management was instructed to ensure all existing and future customer orders and commitments in order to avoid any interruptions until the final closure of the plant to the extent it is ultimately closed down. The main economic justification for continuation of the activities of the magnesium plant at the Dead Sea stems from the plant’s synergies with our other facilities in Sodom, which provide it with, and receive from it, raw materials (the “Synergies”). The net value of the Synergies has declined due to the increase in the tax burden on production from natural resources in Israel that have already been implemented, and will further decline if the Committee’s final recommendations are enacted into law. As a result of the increased tax burden, as noted above, the Company stopped all investments in the magnesium plant (that are not investments required by law). Nonetheless, ICL’s management intends to re-examine the decision of the Board of the Directors regarding the continued existence of the magnesium plant, subject to the manner in which the government, by means of the Tax on Natural Resources Law memorandum, implements the decision of the Social-Economic Cabinet, which provided that: “a special mechanism is to be determined that will ensure that Committee’s recommendations will not directly or indirectly impact the feasibility of the continued existence of the magnesium plant”. To the extent the actual implementation of the Cabinet’s decision does not adversely impact, as a practical matter, the contribution and value of the synergy stemming from the activities of the magnesium plant, Company management will consider recommending to the Board of Directors to continue the existense of the magnesium plant even after January 2017. The sales of magnesium in 2014 amounted to approximately $148 million, the magnesium company incurred an operating loss in this year of approximately $9 million, the net property, plant and equipment of the magnesium company as at December 31, 2014 was approximately $36 million and the depreciation expenses in 2014 amounted to approximately $7 million.
Spain
The Spanish government owns all of the underground mining rights and has granted us concessions to conduct mining operations under our land pursuant to mining legislation enacted in 1973 and related regulations. Further to this legislation, the government of the Catalonia region issued special mining regulations relating to individual mining areas. The mining permits (or concessions) in Spain are administrated by the regional governments (in Catalonia, the Generalitat), except those special reserved areas that are still administered by the Spanish central government. There are several such areas in Spain, including Reserva Catalana. Iberpotash owns 126 mining concessions that are not part of the Reserva Catalana and were issued by the Generalitat
,
and mining concessions for the Reserva Catalana issued by the Spanish central government. Two separate and independent processes of paying fees and renewals are thus involved.
Originally, the concessions were divided among several mining companies in the area. However, as companies were acquired or relinquished their concessions, Iberpotash obtained these concessions. As a result, Iberpotash now holds mining concessions for each of 126 different relevant sites for our current and potential future mining activities. As part of the renewal process, we must prepare and present a basic technical report describing the intended use of the mines. The concessions cover a total area of 42,489 hectares in the province of Barcelona and 26,809 hectares in the province of Lerida. The mining royalties in 2014 amounted to approximately €150 thousand.
Regarding the Reserva Catalana (the area beyond the 126 sites referred to above), an application was filed to extend the concession period for a period of 30 years, commencing in October 2012. As at the date of the report, no mining activities are being carried out in this area. The administrative activities to extend the concession period have not yet been completed by the National Mining Authority. However, the mining rights are still valid, and Iberpotash is currently in the process of renewing these rights before their expiration.
Iberpotash has applied well in advance for concessions for the mining areas and has not had any difficulty in renewing those leases in the recent past. The earliest renewal required for any of the 126 existing relevant concessions will be in 2037, and most of the concessions are effective up to 2067. The currently planned life of the Cabanasas mine is 27 years, so renewal of some concessions may be required in order to permit mining for the entire life of the mine. As is required by law, the concessions must be renewed prior to the expiration date. If a concession were to expire for some reason, a bidding process would start.
United Kingdom
United Kingdom Mining Concession
. Cleveland Potash’s mining concession in the United Kingdom is based on approximately 114 mining leases and licenses for extracting various minerals, in addition to numerous easements and rights of way from private owners of land under which Cleveland Potash operates or, in the case of mining underneath the North Sea, granted by the United Kingdom (Crown Estates). These mining rights total approximately 92,340 acres. The terms of all of these leases, licenses, easements and rights of way run for a period from the end of 2015 up to 2038. In 2014, mining royalties amounted to about £2.6 million.
All of our older lease agreements (about 74 agreements) were signed for a period of 50 years in the 1970s of the 20
th
century, so most of these run until the early to mid-2020s, except for the leases with the Crown Commissioners (Crown Estates) for the offshore rights in the North Sea, which was recently renewed and expires in 2034. The lease with the Crown Commissioners includes provisions to explore and exploit the polysulphate mineral. Our recently acquired leases (about 40 agreements) were obtained in the late 1990s and early 2000s, and they all have a 35
-
year lease period with a 35
-
year option to extend the lease. For purposes of signing the lease agreements, Cleveland Potash used local solicitors and contacted the individual landowners. Renewal of the onshore lease currently covering about 18% of reserves area at our mine in the United Kingdom will be required at the end of 2015 (one large lease is involved). Negotiations have begun to extend this lease both geographically and temporally, as this area is important for our underground mining activities at the Boulby mine. Historically, the renewal of leases has not been problematic and we believe that we have or will receive all government approvals and permits necessary for our reserves in the United Kingdom. In the Company’s estimation, there is no competition for mineral leases because Cleveland Potash has already secured the planning permission (“Planning Permission”) for potash and rock-salt extraction in the area and has all the necessary government approvals and permits for mineral extraction. Planning permission, which is granted by local authorities in the United Kingdom, is the permission required in order to be allowed to build on land or change the use of land or buildings. In the past, when leases expired, there has been no interest from other companies and there is no competitive bidding. Cleveland Potash has a preferential right to renew the leases as it has the Planning Permission to extract potash-bearing minerals. The entities involved in renewing or obtaining new leases are Cleveland Potash, local solicitors and individual landowners who own the mineral rights, as described above. The particular conditions that must be met in order to retain the leases are payment of annual fees and a royalty payment for minerals extracted from the property to the landowner.
Several small areas remain with no mining lease as these are areas where either the mineral owners have refused to grant a lease or mineral ownership is in many small patches having a number of different owners. However, none of these has a significant impact on exploration or development and at the date of the report, there are no plans to pursue them further.
Cleveland Potash applies a plan for signing lease agreements in the area in which it has permission to plan and extract minerals. As of the date of the report, CPL has long-term mineral lease agreements covering more than 70% of the area
.
Based on past experience, we are confident that we will be able to obtain the remainder of the resource and reserve leases
.
In addition, historically no competition is anticipated in obtaining mineral lease agreements for potash mineral leases and our few failures to obtain leases in the past have been limited to very small leases that can easily be circumvented during mining. The small area of leases that Cleveland Potash does not have involve situations where the individual landowners have refused to sign mineral leases and no other party has been granted a lease.
United Kingdom Concession
. A subsidiary in the United Kingdom, in our Fertilizers segment, mines peat, which constitutes a raw material for production of detached platforms for improvement of land and for use as soil substitutes on growing media. Our mines in the United Kingdom (Nutberry and Douglas Water) are owned by the Company, whereas Creca is held under a long term lease. The mining permits were granted through the year 2024. The mining permits are granted by the local authorities for 14-year periods and are renewed after a review by the local authorities.
Reserves
We believe we have a broad and high quality mineral reserves base due to our strategically located mines and facilities. “Reserves” are defined by SEC Industry Guide 7 as that part of a mineral deposit that could be economically and legally extracted or produced at the time of the reserves determination. Industry Guide 7 divides reserves between “proven (measured) reserves” and “probable (indicated) reserves,” which are defined as follows:
|
|
·
|
Proven (measured) reserves. Reserves for which (1) quantity is computed from information received from explorations, channels, wells and drillings; grade and/or quality are computed from the results of detailed sampling and (2) the sites for inspection, sampling and measurement are spaced so closely to each other so that the geologic character is well defined that size, shape, depth and mineral content of reserves can be reliably determined.
|
|
|
·
|
Probable (indicated) reserves. Reserves for which quantity and grade and/or quality are computed from information similar to that used for proven (measured) reserves, but the sites for survey, sampling, and measurement are farther apart or are otherwise less efficiently spaced. The degree of assurance, although lower than that for proven (measured) reserves, is high enough to assume continuity between points of observation.
|
We categorize our reserves in accordance with these SEC “Guide 7” definitions, as stated above. The quantity, nature of the mineral reserves and estimate of the reserves at each of our properties are estimated by our internal geologists and mining engineers.
Israel
The following table sets forth information regarding our estimates of our phosphate reserves in Israel (all of which are wholly owned by us) as of December 31, 2014:
|
Category
|
White Phosphate
|
Low Organic Phosphate
|
High Organic Phosphate
|
Bituminous Phosphate
|
Recoverable Reserves
|
Average Grade
|
|||||||||||||||||||
|
(millions of metric tons)
|
(millions of metric tons)
|
(millions of metric tons)
|
(millions of metric tons)
|
(millions of metric tons)
|
(millions of metric tons)
|
( % P2O5) | |||||||||||||||||||
|
Rotem
|
Proven
|
– | 15.5 | – | – | 15.5 | 26.3 | % | |||||||||||||||||
|
Zin
|
Proven
|
– | 18 | 7 | 4 | 29 | 25.0 | % | |||||||||||||||||
|
Oron
|
Proven
|
22 | - | – | – | 22 | 23.5 | % | |||||||||||||||||
|
Total (Proven)
|
22 | 34 | 7 | 4 | 67 | ||||||||||||||||||||
In determining these reserves, a cut-off grade of 20% to 25% P2O5 was applied, depending on the processing characteristics of the phosphate rock and the existing process. The cut-off grade differs for each mine in accordance with the beneficiation process: a cut-off grade of 20% P2O5 was applied at Oron, a cut-off grade of 23% P2O5 was applied at Zin, and a cut-off grade of 25% P2O5 was applied at Rotem. The cut-off grade for Oron is lower because our Rotem subsidiary has the appropriate beneficiation process for chalk phosphate, which characterizes the white phosphate and therefore, the flotation process is extremely efficient. The cut-off grade for the Rotem mine is higher because the beneficiation process there has a limited grinding and flotation system, and only medium to high grade phosphate can be fed (which is appropriate for the existing reserves at Rotem). The cut-off grade for Zin is slightly higher than that of Oron because of the presence of marl and clay that reduces the efficiency of the flotation system at that mine. The parameters used in determining the cut-off grade took into account the geology (continuity, structure), mining method, mining dilution, plant utilization / metallurgical processing factors, technical feasibility, operating costs, and historical and current product prices. The parameters employed in the calculation are as follows: on site tons (multiplying area by layer thickness and phosphate density); recoverable tons (tons of mineral which can be mined, taking into account mining dilution); mineable tons (recoverable tons from which the tons produced are deducted); stripping ratio (the quantity of waste removed per ton of phosphate rock mined); planned dilution; cost per ton for mining (typically related to transport distance to beneficiation/process plant); cost per ton including reclamation; and unplanned dilution (5% unplanned dilution is taken into account based on the data from the mining in and the data from the problematic areas). Our Rotem subsidiary’s yearly mining plan is not determined by the minimum cut-off grade, and fluctuations in commodity prices rarely affect its cut-off grade.
The cut-off grade calculations come from historical yield data and our Rotem subsidiary’s historical experience with mining, adequately calculated and modelled by its geologists, operation engineers and economists. The calculation takes the ore grade in situ, converts it into extracted ore with our Rotem subsidiary’s mining method and estimates the plant yield depending on the grade. Economic modelling then gives the cut off figures currently used by our Rotem subsidiary.
The proven reserves above the cut-off grade were obtained from the calculated on site resources taking into account the mining method, the rate of mining dilution, and in plant recovery, based on our Rotem subsidiary’s historical data. In order to convert the resources into reserves, account is taken, separately, of the mining dilution rate, mining method and the geological conditions, including, historical yield data and are based on the previous five years’ experience. The mining dilution rate in the Company’s mines in Israel’s southern region is 2.5% and takes into account the continuity of the layers and the geological structure. The quantity and grade of the calculated reserves are those that are expected to be transferred to the processing plant and are subject to recovery indices in the utilization plant. The updated utilization in the plant varies between the sites as it consists of historical yield data, and it is currently between 46% (at Oron and Rotem) and 48% (at Zin). These differences in metallurgical recovery rates are due to differences in the beneficiation process at the different mines. Proven reserves have been explored by borehole intersections typically at 50 to 70 meters intervals. Each of the three plants at the mines has been developed over the past few decades for the optimum upgrading of the phosphate rock to concentrate ore containing typically 31 to 32% P2O5. The conversion ratio for most of the phosphate layers is 1.8 tons for every 1 cubic meter, where a conversion ratio of 2.0 tons per cubic meter is used for hard, calcareous beds. These factors are used on the basis of long experience and are considered to be reasonable.
In calculating the cut-off grade and reserves, an average of the previous three years’ market prices and operating costs was used as part of the calculations to ensure economic feasibility.
The three year average market prices used to calculate our reserves in the Negev as of December 31, 2014 are as follows: $701 per ton for MGA (green phosphoric acid), $1,382 per ton for WPA (white phosphoric acid), $1,484 per ton for MKP (monopotassium phosphate), $1,121 per ton for MAP (monoammonium phosphate), $353 per ton for GTSP (granulated triple super phosphate), $176 per ton for GSSP (granulated single super phosphate), and $101 per ton for phosphate rock.
In calculating the reserves, an average of the previous three years’ currency conversion rates were used to ensure economic feasibility. The three-year average currency conversation rates used to calculate our reserves in the South as of December 31, 2014 are as follows NIS 3.681 per $1.00, $1.31 per €1.00 and $1.60 per £1.00.
The life of the mine at Rotem is approximately 8 years based on reserves of 15.5 million metric tons of low organic/low magnesium phosphate. The low-organic, low-magnesium phosphates are suitable for phosphoric acid production. The annual production (mining) rate for the low-organic/low-magnesium phosphate at Rotem is 1.9 million metric tons per year.
The life of the mine at Oron is approximately 7 years based on a reserve of 22.0 million metric tons and an average production of 3.0 million metric tons per year of white phosphate.
The life of the mine at Zin is 10 years based on reserves of 29.0 million metric tons and a production of 3.1 million metric tons per year as follows:
|
|
·
|
Low-organic phosphate—1.7 million metric tons per year
|
|
|
·
|
High-organic phosphate—1.1 million metric tons per year
|
|
|
·
|
Bituminous phosphate—0.3 million metric tons per year
|
As described under “—Mineral Extraction and Mining Operations — Israel’s Southern Region”, we primarily use white/low organic phosphate rock, and blend in bituminous phosphate, in our operations. To utilize additional resources after our reserves are utilized, we would be required to modify our processes and add costly technologies.
The Company believes that we have all the government approvals and permits necessary for our reserves in Israel.
Spain
The following table sets forth our estimated potash reserves for our Spanish mining operations (all of which are wholly-owned by us) as of December 31, 2013 (latest date for which information is available):
|
Mine
|
Reserve Category
|
Millions of
metric tons
|
Average Grade
(% KCl)
|
||||||
|
Cabanasas
|
Proven
|
15 | 26 | ||||||
|
Probable
|
85 | 26 | |||||||
|
Total Proven and Probable
|
100 | 26 | |||||||
|
Vilafruns
|
Proven
|
8 | 23 | ||||||
|
Probable
|
8 | 22 | |||||||
|
Total Proven and Probable
|
16 | 22.5 | |||||||
|
Total(1)
|
Proven and Probable
|
116 | 25.5 | ||||||
_____________
(1) Amounts may not sum due to rounding.
In determining these reserves, a cut-off grade of potash ore containing 19% KCl was applied at the Cabanasas mine and a cut-off grade of potash ore containing a concentration of 18% KCl was applied at the Vilafruns mine.
The parameters used in determining the cut-off grade took into account the geology (continuity, structure), mining method, mining dilution, plant utilization, technical feasibility, operating costs and historical and current product prices. The parameters employed in the calculation are as follows: on site tons (multiplying area by layer thickness and mineral density); recovery (takes into account the values obtained historically during the mining of the Cabanasas and Vilafruns mines); recoverable tons (tons of mineral which can be mined, in terms of the recovery factor); mineable tons (recoverable tons from which the tons produced are discounted); planned dilution; unplanned dilution (5% unplanned dilution is taken into account based on the data and the data from problematic areas); and selective mining of target layers where possible (separation of the salt within the layer in areas wherein this is possible). IBP’s annual mining program is not defined in cut-off grades.
The cut-off grade calculations come from historical yield data and Iberpotash’s historical experience with mining, adequately calculated and modelled by its geologists, operation engineers and economists. The calculation takes the ore grade in situ, converts it into extracted ore with Iberpotash’s mining method and estimates the plant yield depending on the grade. Economic modelling further gives the cut off figures currently used by Iberpotash.
The proven and probable reserves above the cut-off grade were obtained taking into account the mining method, mining recovery, mining dilution, selective mining, striation, geological conditions and in plant recovery, based on Iberpotash’s historical data. The mining recovery and dilution factors, which are required in the conversion of resources to reserves and take into account the particular mining method and the geological conditions at the respective mine, consist of historical yield data and are based on 16 years of historical data at our Cabanasas and Vilafruns mines and the mining recovery ranges from approximately 65% to 75% by Iberpotash’s “room and pillar” modified layout. Reserve quantity (in tons) and grade are quoted as those that are expected to be delivered to the treatment plant and are subject to metallurgical recovery factors. Metallurgical recovery factors consist of historical yield data and are based on the previous five years’ experience and current recoveries are 89.0% KCl for the Suria plant (which is adjacent to the Cabanasas mine) and 85.0% KCl for the Sallent plant (which is adjacent to the Vilafruns mine). Information from drillings, mostly at distances of 100 to 200 meter intervals while probable reserves have been explored by boreholes up to 1,600 meter intervals. The final product is well over 95% KCl to avoid quality losses.
In calculating the cut-off grade and reserves, an average of the previous three years’ market prices and operating costs was used as part of the calculations to ensure economic feasibility. The three year average market price used to calculate our reserves for potash per ton of product in Spain as of December 31, 2013 is €288.6 per ton.
In calculating the reserves, an average of the previous three years’ currency conversion rates were used as part of the calculations to ensure economic feasibility. The three-year average currency conversation rate used to calculate our reserves as of December 31, 2013 is €0.75 per $1.00.
The Suria plant utilizes ore mined from Cabanasas and has a current capacity to produce approximately 530,000 tons per annum of potash. The Sallent plant utilizes ore mined from Vilafruns and has a current capacity to produce approximately 500,000 tons per annum of product; this plant will be gradually phased out as Suria is upgraded.
The Company believes that it has all government approvals and permits necessary for our reserves in Spain.
United Kingdom
The following table sets forth our estimated potash reserves for our United Kingdom mining operations (all of which are wholly owned by us) as of December 31, 2014:
|
Reserve Category
|
Millions of
metric tons
|
Average Grade
(% KCl)
|
||||||
|
Proven
|
12.6 | 32.3 | ||||||
|
Probable
|
4.3 | 32.9 | ||||||
|
Total Proven and Probable
|
16.9 | 32.5 | ||||||
In determining these reserves, a cut-off grade of ore containing 30% KCl was applied in both the south (onshore) and the north (offshore), for a seam having a height of 3.8 meters (though thinner sections of potash can be taken, with the inclusion of salt dilution in the floor of the seam) and the maximum distance from the shafts is 15 kilometers.
In calculating the cut-off grade and reserves, an average of the previous three years’ market prices and operating costs was used as part of the calculations to ensure economic feasibility. The three year average market price used to calculate our reserves for potash per ton of product as of December 31, 2014 is £203 per ton.
The cut-off grade calculations were made on the basis of historical yield data and Cleveland Potash’s historical experience with mining, adequately calculated and modeled by its geologists, operation engineers and economists. The calculation takes the ore grade in situ, converts it into extracted ore with Cleveland Potash’s mining method and estimates the plant yield depending on the grade. Economic modeling further gives the cut off figures currently used by Cleveland Potash.
Operating costs and historical and current product prices are taken into account, but the cut-off grade determination is largely influenced by optimization of the beneficiation process, in particular the flotation process, as our calculation is largely based on introducing the right grade of ore into the treatment plant.
Cleveland Potash’s yearly mining plan is not determined by the cut-off grade. Over the last three years, the cut-off grade has remained at 30% and has not changed as a result of market price or operating cost fluctuations or as a result of currency conversion factor changes.
The parameters used in determining the cut-off grade took into account the geology (continuity, structure), mining method, mining dilution, and plant utilization. The parameters employed in the calculation are as follows: in situ tons (area multiplied by layer thickness and mineral density); mining recovery (based on values obtained historically during mining potash ore); mineable tons (recoverable tons of mineral less produced tons); and mining dilution (based on values obtained historically during mining potash).
The proven reserves above the cut-off grade were obtained taking into account losses for mining recovery, mining dilution, mining method and geological conditions based on Cleveland Potash’s historical data. The mining recovery and dilution factors, which are required in the conversion of resources to reserves and take into account the particular mining method and the geological conditions, consist of historical yield data and are based on the previous five years’ experience and generally, the mining dilution factor reduces KCI by 10% to 17% reduction and causes a small increase in the percentage of insoluble material. The reserve quantity and grade are quoted as those that are expected to be delivered to the treatment plant and are subject to metallurgical recovery factors. Metallurgical recovery factors consist of historical yield data and are based on the previous five years’ experience and current recovery is 81%. Proven reserves have been explored by borehole intersections typically at 150 meters intervals or less while probable reserves have been explored by boreholes at 150 to 500 meters intervals.
In calculating the reserves, no currency conversion factors were used as Cleveland Potash works only with the British pound.
The potash mined at Boulby has, over the past 15 years, declined in potash grade from about 40% to just over 30% KCl. The NaCl content has risen from 47% to approximately 55%, while the content of insoluble impurities
has also risen from approximately 12% to about 15% over this time. The plant capacity at Boulby is approximately 3 million tons of ore per annum. The final product is potash at an average grade of 95.5% KCl. Annual potash production is approximately 700,000 tons per annum.
The Company believes that it will obtain renewal of all the government leases and licenses necessary for our reserves in the United Kingdom.
Logistics
Israel
Most of the output of our Dead Sea facilities is transported by a conveyor belt that extends for 18.1 kilometers to the railhead located at Tzefa in Mishor Rotem. The Company transports the output from Mishor Rotem to the port of Ashdod, mainly by train. We built, own and operate the conveyor belt. We also transport some of the output from our Dead Sea facilities by truck, mainly to the port of Eilat.
Most of our products, whether in solid or liquid state, are transported in bulk from Rotem, Oron and Zin by road or rail to either the port of Ashdod or Eilat. From Eilat, our products are transported by ship to markets in the Far East, and from Ashdod, they are transported by ship to Europe and South America.
Within the Rotem site, there is a rail loading facility that typically loads up to 30 wagons for each delivery. Approximately two million tons of products per year are transported by rail from the Rotem site to Ashdod per day. About a half a million tons of products are transported by road from Rotem to the port of Eilat, since there are no rail links between the Rotem site and Eilat.
Our wholly owned subsidiary Tovala is responsible for transporting phosphate rock from the Oron and Zin processing facilities in road going rigid trucks and trailers. Each trailer has a payload of 40 tons. Approximately 0.4 million tons of rock leave Zin by truck for delivery to the port of Eilat each year. In addition, 0.3 million tons are transported from Zin to Rotem for further processing. About 1 million tons are transported from the Oron mine by truck.
From Ashdod, approximately 650,000 tons of sulfur are transported to Rotem each year. In addition, sulfur arrives at the port of Ashdod from overseas, where it is loaded into road going trucks and transported to our sulfur dispatch 5 kilometers away. At the depot, it is loaded into rail cars and then transported to Rotem.
The port of Ashdod is located on the Mediterranean coast, approximately 40 kilometers south of Tel Aviv and approximately 120 kilometers northwest of the Rotem site and the Tzefa site.
The port of Eilat is located in the far south of Israel on the Red Sea coast. It is approximately 180 kilometers due south of Rotem and about 200 kilometers from Sodom and is accessible by road. Shipments exiting the Eilat port are to the Far East, whereas the sales to Europe and the U.S. exit from the Ashdod and Haifa ports. Sales of fertilizers and potash from Rotem and the Dead Sea are not shipped from the Haifa port since there is no infrastructure there for loading bulk products and the cost of overland transport is more expensive compared with Ashdod.
Spain
IBP transports the minerals it mines from the Company’s mines to the production plants as well as potash and salt from the factories and the mines to the port.
Ore is taken by 25-ton road haulage trucks from the Cabanasas and Vilafruns mines to the Suria and Sallent plants, respectively. The salt product is transported by articulated truck to an Iberpotash owned terminus in the port of Barcelona. A truck fleet comprises 25 27 ton capacity articulated road trucks is used to transport the salt from the
mine. Up to 40 trucks per day are dispatched from the mine road to the port. The mine also uses the port of Tarragona to export specific products.
Iberpotash owns and maintains 1.5 kilometers and 3 kilometers of standard gauge railway at Cabanasas and Vilafruns, respectively, that link to the national rail network. Each train set comprises of 850 ton payload comprising approximately 20 freight cars with two trains per working day. The rail route for potash transport from Cabanasas to the terminal in the port of Barcelona comprises an 82 kilometer rail route from Suria to Manresa to the port of Barcelona and 88 kilometers from Vilafruns to the same destination. Iberpotash owns and operates its own port facilities, which comprise bulk salt and potash storage facilities comprised of freight car and rail truck conveyor unloading facilities and product storage warehouses.
The Cabanasas/Suria and Vilafruns/Sallent complexes have one rail load out system each for the rail to port transport systems. The train electric traction engine and bulk freight car rolling stock is operated by the owner and operator FFCC (Ferrocarrils de la Generalitat de Cataluña).
The port of Barcelona is managed by the Port Authority of Barcelona and comprises an area of 7.86 square kilometers divided into three zones. As part of the plan for increasing IBP’s production capacity, an upgrade is being made of the logistical infrastructure at the mine (entrance ramps into the mine), the factory and the Company’s berth in the Barcelona port, in such a manner that will permit production, transport and export of about 2.3 million tons of potash per year.
United Kingdom
The Boulby mine comprises a network of underground roads extending 15.5 kilometers, from the mine entrance in the direction of the North Sea and over 11 kilometers from the mine entrance in the inland area. The total length of this network of roads is more than 1,000 kilometers. The mine is served with good road, rail, and water links to the national networks and is provided with good potable water and strong, stable electric power supplies.
Road transport movements from site are limited to a maximum of 150,000 tons per annum and a maximum of 66 road wagons per day (no road movements are allowed on Sundays or bank holidays) in accordance with the North Yorkshire National Parks agreements. This limitation is not expected to interfere with future production due to Cleveland Potash’s commitment to maintaining the rail link to Teesdock. Cleveland Potash is in full compliance with all road and rail requirements.
The mine has three separate integrated conveyor load out systems, one for each product. The rail load out products are transported on a Cleveland Potash owned rail line which extends approximately eight kilometers from the minehead to a junction with the national rail network, from where the products continue to Teesport, Middlesbrough, via Network Rail, owner and operator of the main line.
Cleveland Potash leases and operates two principal storage and loading facilities: the Teesdock facility, which is located on the River Tees; and the Ayton Works road depot in Middlesbrough.
Eight trains per day take rock salt, potash and polysulphate to the Teesdock. Most of the output goes into agricultural fertilizers: large quantities (around 50% of production) are exported by sea from Teesdock seaport to European Union countries and other overseas customers.
Rock salt is taken by train to Teesdock, and mostly sent by ship to English and Scottish east coast ports for sale to local authorities for de-icing roads.
In addition, the Company has storage and logistics facilities in Ludwigshafen, the Netherlands, Amsterdam and Rouen in France.
Not Applicable.
A. OPERATING RESULTS
Principal Factors Affecting Our Results of Operations and Financial Condition
We are a multinational company, the financial results of which are affected by the demand for basic agricultural products, global economic trends, changes in terms of trade and financing, and fluctuations in currency exchange rates. Together with and as part of our business strategy, we are taking steps to adapt our marketing and production policies to global market conditions. We are also focusing on improving our cash flows and diversifying our financing sources, and we are committed to taking continuous actions to improve efficiency and reduce costs.
We are an Israeli corporation, and we have significant production facilities in Israel. Accordingly, we are affected by the political, economic and security conditions prevalent in Israel. See “Item 3. Key Information—D. Risk Factors—Risks Related to Our Operations in Israel—We conduct operations in Israel and therefore our business, financial condition and results of operations may be materially and adversely affected by political, economic and military instability in Israel and its region.” In particular, we have been adversely affected by several recent regulatory and legal developments in Israel that could lead to materially higher costs and lower profitability and cash generation.
In 2013, approximately 51% of our sales revenue was derived from production activities taking place outside Israel and approximately 11% of the cost of sales of products produced outside Israel was attributable to raw materials supplied from Israel. In 2014, approximately 52% of our sales revenue was derived from production activities taking place outside Israel and approximately 9% of the cost of sales of products produced outside Israel was attributable to raw materials supplied from Israel. There is no single customer on which we are materially dependent.
Our sales are affected by pricing for our products and the quantities we sell. Average prices for certain of our key products were lower in 2014 compared to 2013, but this was partially offset by higher quantities sold. Nonetheless, our margins were adversely affected by the lower prices.
Energy expenses accounted for approximately 7% of our total operating costs in 2013 and in 2014. Of these energy expenses, the cost of oil and oil products, electricity and natural gas represented approximately 14% ($52 million), 48% ($182 million) and 25% ($95 million), respectively, in 2013 and approximately 9% ($30 million), 49% ($170 million) and 29% ($101 million), respectively, in 2014. Energy costs decreased in 2014 compared with the prior year due to increased use of national gas, which leads to savings as a result of the switch from use of expensive fuels, and from the undertaking to purchase electricity from OPC Rotem Lt. at lower costs compared with the price of electricity purchased from Israel Electric Company. We expect that with the gradual increase in the use of natural gas, and the anticipated operation of the new power plant in Sodom, energy expenses as a percentage of total operating costs will decline and the mix of these costs will change.
In 2012, our gas supplier in Israel, the Yam Tethys partnership, announced that it was being forced to reduce the quantities of gas it supplied because of the dilution of the gas in its well. On April 1, 2013, the supply of gas from the Tamar Field commenced as a substitute for the quantity supplied by the Yam Tethys partnership. Supply of the gas from the Tamar Field fulfills all of our gas needs for the facilities for which we have completed conversions. Increased use of natural gas in our facilities is expected to significantly reduce emissions of pollutants in the area surrounding our facilities, improve the quality of the output, reduce maintenance expenses and lead to a significant monetary savings due to the transition from the use of more expensive fuels.
In 2013 and 2014, our marine transportation expenses amounted to approximately 7% of our total operating costs. In 2013 and 2014, our shipping costs amounted to approximately $384 million and approximately $369
million, respectively. After several years of falling marine bulk transportation prices, transportation prices began to increase beginning in mid-2013 and in mid-December 2013 reached a three-year record high of 2,337 points on the Baltic Dry Index (“BDI”). Beginning in the first quarter of 2014, prices fell to their pre increase level, where the average BDI for 2014 was 8% lower than the average BPI for 2013, and the quarterly average BDI was 40% less than the quarterly average BDI in the fourth quarter of 2013, which is partially explained by a decline in fuel prices in this period. The effect of the aforesaid decline in marine shipping prices was partially offset by the increase in marine shipping costs resulting from an increase in quantities sold.
Our financial statements are prepared in U.S. dollars. Most of our sales are in U.S. dollars, even though a portion of our sales is in other currencies, mainly euros. Part of our operating expenses in Israel are denominated in NIS; therefore, devaluation of the average NIS exchange rate against the U.S. dollar has a positive impact on our profitability, while appreciation has the opposite effect. Devaluation of the average exchange rate of the euro against the U.S. dollar has a negative impact on our profitability, while appreciation has the opposite impact. On the other hand, devaluation of the euro against the U.S. dollar improves the competitive ability of our subsidiaries whose functional currency is the euro, compared with competitors whose functional currency is the U.S. dollar.
We hedge against our exposure to the risks described above, particularly our exposure to the cost of sales and operating expenses denominated in NIS, exposure to other currencies that are not the functional currency of our subsidiaries, and exposure to marine transportation prices and energy prices. Since all of these hedging transactions are treated as economic (non-accounting) hedges, they are not reflected in our operating costs but instead are recorded as finance income or expenses in our statements of income. Our management determines the extent of our hedging activities based on their estimation of our cost of sales and operating expenses, as well as their expectations of developments in the markets in which we operate. See “Item 11. Quantitative and Qualitative Disclosures About Market Risk—Risk Management.”
Trends Affecting Our Fertilizers Segment
There is mutual dependency among the amount of available arable land, the amount of food needed for the population, and the use of fertilizers. Natural population growth, changes in food consumption habits (a shift to richer nutrition, largely based on animal protein, which increases grain consumption) resulting from the rising standard of living, mainly in developing countries, and environmental quality considerations along with the aspirations of certain advanced economies to reduce dependence on oil imports, which have strengthened the trend of shifting to production of fuel from agricultural products (bio fuels), affect the increase in global consumption of grains (cereals, rice, soybean, corn, etc.). These trends led to significantly lower grain inventories several years ago and, consequently, higher prices of agricultural produce, increased planting of grain crops worldwide and higher yields per unit of agricultural land, mainly through the increased application of fertilizers. In 2014, there was an increase in cheap alternative energy sources, such as the production of shale gas in the United States. The impact of these alternative energy sources on overall energy prices also impacts the economic feasibility of the production of bio fuels and the rate of growth of their use. Production of ethanol from corn in 2014 was somewhat higher than in 2013 and another increase is expected in 2015 (the ethanol industry in the U.S. is expected to consume approximately 30%-40% of the corn crops in the country). This trend is expected despite the drop in fuel prices in recent months. Nonetheless, the steep rise in ethanol production, which had persisted to 2010, was halted due to moderation of fuel prices, the decision of the U.S. Environmental Protection Agency (“EPA”) not to increase the percentage of ethanol in gasoline (the blending rate) from 10% to 15%, and the decline in gasoline consumption in the U.S.
Following stability in the first half of 2014, prices of crop commodities dropped sharply in the third quarter of the year in response to expectations by the US Department of Agriculture (USDA) of a record harvest as a result of an increase in planted areas, along with favorable weather conditions in the primary growing areas. In December 2014, grain prices increased moderately to low levels compared with the prior year’s prices. In January 2015, the trend reversed, prices once again began to fall, and the grain prices reached their lowest level since 2010. In early February 2015, this trend reversed, and grain prices began to record moderate increases.
Based on the new report published by the USDA in February 2015, an increase is expected in the ratio of the inventories of grains to annual consumption, up to 21.15% at the end of the agricultural 2014/2015 year, compared with 20.80% at the end of the 2013/2014 agricultural year, and with 19.85% in the 2012/2013. Most of the increase expected in the 2014/2015 agricultural year stems from an increase in the inventory of corn and wheat. In addition, the inventory of soya, which is not included in the inventory of grains, is on the rise.
In the short term, the demand for fertilizers is volatile and seasonal and is affected by factors such as the weather in the world’s major agricultural growing regions, fluctuations in the scope of the planting of the main crops, agricultural input costs, agricultural product prices and developments in biotechnology. Some of these factors are influenced by subsidies and credit lines granted to farmers or to producers of agricultural inputs in various countries, and by environmental regulation. Changes in currency exchange rates, legislation and international trade policy also affect the supply, demand and level of consumption of fertilizers worldwide. Notwithstanding the fluctuations that may be caused in the short term as a result of these factors, we estimate that the policy of most countries in the world is to ensure an orderly supply of high quality food to their residents, including by encouraging agricultural production, which should preserve the long term growth trend of fertilizer consumption.
Worldwide sales of potash in 2014 recovered compared with 2013. During 2014, there was an increase in the demand for potash along an improvement in prices, particularly in granulated potash, primarily in Brazil and in the United States. According to the IFA, the aggregate worldwide demand for potash (for agricultural and other uses) is expected to grow at an average annual rate of 2.5% up to the year 2018. One of the main challenges causing uncertainty with respect to the demand for fertilizers is the significant decline in grain prices to their lowest level in the last four years.
In January–February 2014, ICL Fertilizers signed framework agreements with its customers in China for supply of potash in the first half of 2014 covering approximately the same amounts as the contracts signed with its customers for the first half of 2013. The contracts were signed at a price of $305 per ton CFR, representing a price decrease of approximately $95 per ton compared with the contracts signed in 2013. During the second half of 2014, the potash shipments continued to the Company’s customers in China at spot prices, albeit at a lower rate than planned due to labor disputes at the Company’s plant in Sodom. In 2014, the imports into China reached 8.03 million tons, an increase of approximately 21.3% compared with the previous year, and it is the highest level of imports since 2007. In the Company’s estimation, the trend of increasing imports is expected to continue in 2015 due to an increase in consumption, as well as logistics problems of the local producers.
After several years of low demand for potash in India, which stemmed from, among other things, the government’s subsidy policy that gave preference to nitrogen fertilizers, there was a significant improvement in imports of potash into India in 2014. Potash imports increased from 3.07 million tons in 2013 to 4.29 million tons in 2014. This increase was achieved notwithstanding the fact that there was no change in the subsidy policy and the price for the end-consumer remained at the same level as it was during the last two years. In the first quarter of 2014, potash manufacturers signed contracts for the agricultural year beginning on April 1, 2014 and ending on March 31, 2015 at a price that reflects a decline of $105 per ton compared with the price closed in the annual supply contracts with customers in India in the beginning of 2013. In April 2014, ICL agreed with its customers in India to supply potash for the 2014/2015 year in an aggregate quantity of approximately 825 thousand tons (including optional quantities). The selling price agreed to is about the same as the price set in transactions with other producers supplying potash to the Indian market. In the Company’s estimation, improvement in demand for potash in India is expected to continue in 2015 as farmers have adapted to the higher level of prices, and this is expected to support an increase in demand in upcoming years as well.
Demand for potash in Brazil was high in 2014 and imports of fertilizers into Brazil reached record levels. In 2014, 9.1 million tons of potash were imported into Brazil, compared with 7.6 million tons in 2013 – an increase of 19.0%
Early 2014 was eclipsed by the negative impact of the dissolution of the partnership of potash producers Uralkali and Belaruskali, and Uralkali’s notice that it would implement a new potash sale policy that gives preference to quantity over price. This move should lead to fierce competition in the market, with producers attempting to maintain their market shares while making significant concessions in their prices. For example, the contracts with the Chinese importers for the first half of 2014 were signed with a price decrease of $95 per ton, while the price in India for the 2014/15 agricultural year dropped by approximately $105 per ton. On the demand side, strong demand was evident in most of the world’s markets. In Brazil, imports totaled 9.1 million tons, constituting an all-time high. India imported more than 4 million tons, following three years of low imports. In 2014, the imports of potash into China reached a level of 8.03 million tons, an increase of 21.3% compared with the previous year, constituting the highest level since 2007.
From January to November 2014, there was a decrease in prices of phosphate fertilizers. These price decreases stemmed from a combination of supply and demand factors. On the demand side, imports into India (the main
importer of DAP) were low in the first three quarters of the year. On the supply side, there was a significant increase in the export of phosphate fertilizers from China, which increased considerably this year and even reached new markets, such as the United States. In addition, the new Saudi producer (Ma’aden) increased its exports this year, and Saudi fertilizers reached Brazil for the first time. Notwithstanding that, the fall in prices came to a halt in December, and a moderate increase in prices of phosphate fertilizers commenced. This improvement was evident in the resurgence in demand along with limited supply. Regarding demand, commencing from October, India increased the import of fertilizers, and toward the end of the year it became clear that imports in 2014 had increased significantly compared with the previous year. Furthermore, additional customers that had ceased buying in anticipation of further price decreases returned to the market with the understanding that additional price decreases are not expected. On the supply side, a number of major producers implemented a policy of contracting production: Mosaic, the U.S. fertilizer producer, announced a curtailment of production, and OCP, the Moroccan phosphate producer, notified that it intends to focus on production of phosphoric acid and TSP fertilizers (phosphate fertilizers that do not contain ammonia). The situation prevailing in the market for phosphate fertilizers also harmed the US producer MissPhos, which declared bankruptcy and discontinued its production of fertilizers in the beginning of December.
The decline in prices of raw materials in the specialty fertilizers products market continued during 2014, as did the impact of the average selling prices in this year. However, selling prices declined at a lower rate than the decline in the raw materials prices. Notwithstanding the decline in the selling prices and the changes in the currency exchange rates in the third and fourth quarters of 2014, the gross profit increased over 2013.
Set forth below are the average annual prices per metric ton of potash, phosphate rock and bromine for the last five years.
|
Average Annual Price ($ per metric ton)
|
||||||||||||||||||||
|
2014
|
2013
|
2012
|
2011
|
2010
|
||||||||||||||||
|
Potash
|
||||||||||||||||||||
|
FOB Vancouver
|
297 | 380 | 459 | 436 | 331 | |||||||||||||||
|
FOB Middle East
|
295 | 389 | 461 | 431 | 352 | |||||||||||||||
|
FOB Baltic
|
282 | 375 | 449 | 421 | 328 | |||||||||||||||
|
Phosphate Rock
|
||||||||||||||||||||
|
FOB Morocco
|
110 | 145 | 185 | 185 | 123 | |||||||||||||||
|
CFR India
|
141 | 162 | 200 | 201 | 147 | |||||||||||||||
|
Bromine
|
2,600 | 2,726 | 2,860 | 3,495 | 2,665 | |||||||||||||||
Trends Affecting Our Industrial Products Segment
The operations of our Industrial Products segment are largely affected by the level of activities in the electronics, construction, automotive, oil drilling, furniture, pharmaceuticals, agriculture, textile and water treatment markets. In 2014, 41% of the worldwide use of bromine was for flame retardants, 6% was for water treatment, 18% for clear solutions, 21% for intermediate materials, 11% for industrial uses and 3% was for other uses.
Flame retardants:
Pressure is being exerted by “green” organizations in the area of environmental protection to reduce the use of bromine based flame retardants. On the other hand, additional and new uses for bromine and its related compounds are being developed, along with regulation in additional countries leading to increased use of bromine and bromine compounds. The economic slowdown in the world over the past several years triggered a slowdown in the demand for electronic products and in the construction sector. This trend, along with the decline in sales of personal computers due to increased use of tablets and smartphones, caused a decline in the demand for flame retardants, mainly bromine based, and creation of price pressure on these flame retardants. Nonetheless, in 2014, there was a certain improvement in demand for bromine based flame retardants for some of the uses in the electronics sector.
Elemental bromine:
In 2014, elemental bromine prices were relatively stable in the United States, whereas there were price declines in Europe, China, and India.
Clear solutions:
Despite the decline in oil prices in the fourth quarter of 2014, the demand continued to be strong in the market for clear brine fluids for oil and gas drilling completions due to the relatively high number of drillings in the United States.
Biocides
: The market for chlorine based biocides for swimming pools was impacted during 2014 by a low level of prices due to the strategy of competitors aimed at increasing their market shares. In the beginning of 2013, the US Department of Commerce decided to impose an anti dumping tax on manufacturers of chlorine based biocides from China, at the rate of about 30%–38%. In the beginning of 2014, the anti dumping tax on the Chinese was increased approximately by a further 20%, and at the beginning of April 2014 the authorities in the US gave notice of an imposition of anti
-
dumping taxes on Japanese manufacturers at the rate of 59%
-
109%. However, taxation of Japanese producers for 2015 was cancelled during the fourth quarter of 2014. In the field of bromine
-
based biocides used for water treatment, the trend of increasing demand continued in 2014
.
The technological development that enables production of shale gas and applications thereof in the U
.
S
.
creates additional business opportunities for the Company and among other things, an increase in demand for bromine
-
based biocides for treatment of water. Nonetheless, the recent trend of declining energy prices is acting to moderate these business opportunities.
Inorganic bromides
: The market for inorganic bromides for neutralizing mercury (Merquel® products) showed an increase in demand in 2014 and in the fourth quarter of 2014 due to an increasing interest on the part of coal
-
based power stations to take advantage of Section 45 of the U.S. Internal Revenue Code of 1986, as amended (which grants a tax credit to stations that reduce mercury emissions). The increase also stems from the entry of new customers as part of the preparations for the entry into effect in 2015 of a new regulatory system in the US which requires the reduction of mercury emissions.
In the beginning of 2015, the demand for flame retardants used in the area of connectors and televisions was strong and there was a strong demand for clear brines fluids, however there is a high level of uncertainty in the market due to the decline in oil prices. Strong demand continues for bromine-based biocides for treatment of water, mainly Fuzzicide. Furthermore, the strengthening of the dollar against the shekel is expected to positively affect the costs.
Subsequent to the date of the report, on February 2, 2015, the Workers Council of the Bromine Compounds Ltd., of ICL’s Industrial Products sector, started a full strike at the production facilities of Bromine Compounds Ltd. at Naot Hovav, and halted all shipments of merchandise from the facilities. The strike at the facilities came, among other things, in response to the efficiency plans the Company is executing in Naot Hovav whereby termination letters were sent of tens of employees who are employed under collective bargaining agreements. For additional information – see “Item 6. Directors, Senior Management and Employees—D. Employees.”
Trends Affecting Our Performance Products Segment
Most of our Performance Products segment’s products are affected by the global economic situation, competition in the target markets and price fluctuations in the fertilizer market, which affect the prices and availability of the main raw materials of our Performance Products segment, and fluctuations in energy prices, which mainly affect production costs of thermal phosphoric acid. In addition, some of our Performance Products segment’s target markets are characterized by seasonality, mainly in the area of wildfire flame retardants. All of these market conditions create a competitive market for our Performance Products segment’s products.
During 2014, the demand for downstream phosphate based products in the European and U.S. markets declined compared with the prior year. Furthermore, the increased competition on the part of the Company’s competitors, which implemented a sales strategy that gives preference to market share over prices, continued to have an impact during the year. Although there was only a moderate increase in our prices, the quantities sold by us suffered a significant decline in demand, mainly in North America in the phosphoric acid market in which imports and domestic competitors sought to increase their market share by lowering prices. In addition, in the first half of 2014, the Company’s results were hampered by supply constraints resulting from labor interruptions in Israel and other operational issues at a US supplier. These issues were resolved in the second half 2014. The North American P2S5 business experienced unexpected delays in two separate maintenance shutdowns which impacted the ability to meet market demand, particularly shipments to customers in North America. Our acquisition of the Germany based Hagesud Group in January 2014 continued to contribute to the improvement in our Performance Products segment’s results while, on the other hand, the specialty food products area was unfavorably impacted by the Russian financial crisis, which moderated the Company’s growth opportunities in the area of food products as a result of the increased competition in this market and the desire to maintain market shares at reasonable price levels, along with the ongoing crisis in the Ukraine. The impact of the weakening Euro in the fourth quarter 2014 was mostly offset by the decline in costs in dollar terms in the companies operating in Europe. In light of the continuing economic slowdown in Europe, combined with the financial crisis in Russia, the Company does not expect an improvement in these markets in the first quarter of 2015. On the other hand, the U.S. market remains stable despite the competition from both local suppliers and Chinese imports.
Expected Expenses for the 2014 Compensation Plan
2014 Remuneration Plan
Following approval of our Board of Directors on August 6, 2014, we issued 4,360,073 non marketable options, for no consideration, exercisable for up to 4,360,073 of our shares, and 1,007,651 restricted shares, to approximately 450 of our officers and senior employees. The issuance includes a significant private placement of 367,294 options and 85,907 restricted shares to our CEO, which was approved by the General Meeting of our shareholders.
The fair value of the 2014 Equity Compensation Plan on the award date (including both the non-marketable options and restricted shares) is approximately $16.8
million. The fair value will be expensed in the financial statements over the vesting periods. For a description of the 2014 Equity Compensation Plan, see “Item 6. Directors, Senior Management and Employees—E. Share Ownership—Incentive Compensation Plans.”
The expected expense for the periods ended December 31, 2015, December 31, 2016, December 31, 2017, and December 31, 2018, is approximately, $5.4
million, $5.1
million, $2.9
million, and $1.2
million, respectively. In 2014, the Company recognized an expense, in the amount of about $2.2 million in respect of the said plan.
In addition, our Board of Directors approved a long-term remuneration plan for approximately 11,800 of our non-management employees who are not included in the new equity compensation plan in the aggregate scope of up to approximately $17 million (the “2014 Long-Term Incentive Plan”). Pursuant to the 2014 Long-Term Incentive Plan, the cash payment to each employee, if any, will be based on our three-year cumulative net profit from 2015 to 2017. The fair value of the liability must be calculated at each Quarter and Annual report, and up to December 31, 2017. Any changes in fair value will be recognized in profit or loss for the applicable period. The range of the possible aggregate expense is between zero and approximately $17 million
,
beginning with the third quarter of 2014 through the fourth quarter of 2017, depending upon the extent to which the Company expects to meet its approved net profit targets for the years 2015 through 2017. As at December 31, 2014, the conditions for the 2014 Long-Term Incentive Plan were not met and therefore no liability in respect of this plan was included in our financial statements.
Subsequent to the date of the financial statements, on January 25 and 26, 2015, the Remuneration Committee and the Human Resources Committee of the Company’s Board of Directors, issued 99,858 restricted shares to Company directors (except for the Company’s CEO, Mr. Stefan Borgas), for no consideration, under the 2014 shares and remuneration plan. The shares are restricted and will vest in three tranches, subject the directors continuing to serve in their positions, as follows: (1) 50% will vest on August 28, 2015, (2) 25% will vest at the end of two years from the date of the General Meeting, on February 26, 2017, and (3) 25% will vest at the end of three years from the date of the General Meeting, on February 26, 2018.
The fair value as at the grant date of the said restricted shares is about $0.7m million. The value of the restricted shares was determined based on the closing price on the stock exchange on the last day preceding the approval date of the General Meeting of the shareholders, that is, the grant date. The expected expense for the periods ending December 31, 2015, December 31, 2016, December 31, 2017 and December 31, 2018 is about $0.47 million, about $0.15 million, about $0.7 million and about $0.1 million, respectively.
Results of Operations
We have based the following discussion on our financial statements. You should read the following discussion together with our financial statements.
Year Ended December 31, 2014 Compared to Year Ended December 31, 2013
Set forth below are our results of operations for the years ended December 31, 2014 and 2013.
|
For the Years Ended December 31,
|
||||||||||||
|
2014
|
2013
|
% Increase
(Decrease)
|
||||||||||
|
US$ millions
|
US$ millions
|
|||||||||||
|
Sales
|
6,111 | 6,272 | (2.6 | )% | ||||||||
|
Cost of sales
|
3,915 | 3,862 | 1.4 | % | ||||||||
|
Gross profit
|
2,196 | 2,410 | (8.9 | )% | ||||||||
|
Selling, transport and marketing expenses
|
839 | 850 | (1.3 | )% | ||||||||
|
General and administrative expenses
|
306 | 282 | 8.5 | % | ||||||||
|
Research and development expenses, net
|
87 | 83 | 4.8 | % | ||||||||
|
Other expenses
|
259 | 110 | 135.5 | % | ||||||||
|
Other income
|
(53) | (16) | 231.3 | % | ||||||||
|
Operating income
|
758 | 1,101 | (31.2 | )% | ||||||||
|
Finance expenses
|
278 | 158 | 75.9 | % | ||||||||
|
Finance income
|
(122) | (131) | (6.9 | )% | ||||||||
|
Financing expenses, net
|
156 | 27 | 477.8 | % | ||||||||
|
Share in earnings of equity accounted investees
|
30 | 26 | 15.4 | % | ||||||||
|
Income before income taxes
|
632 | 1,100 | (42.5 | )% | ||||||||
|
Income taxes
|
166 | 280 | (40.7 | )% | ||||||||
|
Net income
|
466 | 820 | (43.2 | )% | ||||||||
|
Attributable to:
|
||||||||||||
|
The shareholders of the Company
|
463 | 818 | (43.4 | )% | ||||||||
|
Non-controlling interests
|
3 | 2 | 50.0 | % | ||||||||
|
Net income
|
466 | 820 | (43.2 | )% | ||||||||
Sales
Our sales in 2014 amounted to approximately $6,111 million, compared with approximately $6,272 million last year. This decrease stems mainly from a decrease in selling prices, which led to a decrease in sales of approximately $431 million. The decrease was partly offset by an increase in quantities sold, including the first time consolidation of companies acquired during 2014, which contributed approximately $252 million, and from the impact of changes in currency exchange rates, in the amount of approximately $18 million. As a result of the work interruptions at ICL Dead Sea during the fourth quarter, the Company’s sales were unfavorably impacted, in the amount of approximately $60 million.
Below is a geographical breakdown of our sales by customer location:
|
Year Ended December 31,
|
||||||||
|
2014
|
2013
|
|||||||
|
USD millions
|
||||||||
|
Israel
|
284 | 319 | ||||||
|
North America
|
1,374 | 1,207 | ||||||
|
South America
|
569 | 748 | ||||||
|
Europe
|
2,389 | 2,378 | ||||||
|
Asia
|
1,299 | 1,464 | ||||||
|
Rest of the world
|
196 | 156 | ||||||
|
Total
|
6,111 | 6,272 | ||||||
The breakdown of sales in 2014 indicates an increase in sales in North America, primarily as a result of a higher sales volumes of potash, bromine based and chlorine based biocides for water treatment, inorganic bromine products and magnesium products. In addition, there was an increase in sales in Europe deriving from an increase in sales in the Performance Products segment, mainly as a result of the acquisition of Hagesud and an increase in the sales of P2S5. On the other hand, there was a decrease in sales in Asia, mainly due to a decrease in prices of potash compared with the prior year and a decrease in quantities of potash sold in Asia, except for China. The decline in South America stems mainly from a decline in quantities sold and selling prices of fertilizers and potash sold, compared with 2013. The decline in quantities of fertilizer sold in South America, derives, mainly, from the impact
of the strike at ICL Rotem and from a decline in the quantities of potash sold deriving from a lack of availability of granulated potash.
Cost of Sales
Our cost of sales in 2014 amounted to approximately $3,915 million, compared with approximately $3,862 million last year, an increase of approximately $53 million. The increase in the cost of sales derives, primarily, from an increase in quantities sold, including the first time consolidation of companies acquired during 2014, in the amount of about $116 million, the impact of the change in currency exchange rates in the amount of approximately $35 million, from the impact of the strike at ICL Rotem in the amount of approximately $26 million, net of an amount of strike insurance received of approximately $9 million, and an increase in the royalties expenses in the current period due to the arbitration decision in this matter, in the amount of approximately $12 million. This increase was partly offset by a decline in the raw material and energy prices, in the amount of approximately $56 million, a decrease in salaries expenses in the amount of about $39 million, mainly due to the impact of retirement of employees at ICL Rotem, and from a decrease in other operating expenses in the amount of approximately $32 million, stemming from, among other things, a decrease in the expenses for maintenance and subcontractors and a decline in royalties due to the drop in sales.
Energy costs constituted approximately 7% of ICL’s total operating costs in 2014. Energy costs in 2014 decreased compared with 2013 due to the increased use of natural gas which leads to a savings as a result of the switch from the use of expensive fuels, and from the undertaking to purchase electricity from OPC, at lower costs compared with the price of the electricity purchased from the Israel Electric Company, which contributed to a reduction in the energy costs.
Selling and marketing expenses
Our selling and marketing expenses amounted to approximately $839 million in 2014, compared with selling and marketing expenses of approximately $850 million in 2013. The selling and marketing expenses include, mainly, costs with respect to marine shipping, overland transport, selling commissions and employee salaries. The decrease in the expenses stems mainly from a decrease in shipping expenses as a result of a decline in marine and overland shipping costs, and a change in the mix of destinations and products.
Marine shipping expenses constituted about 7% of ICL’s total operating costs in 2014, totaling approximately $369 million. After several years of falling marine bulk transportation prices, commencing from mid-2013 there has been an increase in shipping prices which reached a level of 2,337 points in the middle of December 2013 (the BDI - Baltic Dry Index- marine shipping index), a record high for the last 3 years. Starting from the first quarter of 2014, prices fell to their level prior to the increase and the average index for 2014 was 8% less than the average index for 2013. The impact of the decline in the marine shipping prices, as stated above, was partly offset by an increase in marine shipping resulting from an increase in quantities sold.
General and administrative expenses
Our general and administrative expenses amounted to approximately $306 in 2014, compared with general and administrative expenses of approximately $281 in 2013. General and administrative expenses increased as a result of, among other things, first time consolidation of companies acquired in 2014 as well as due to consulting and other expenses in connection with updating and implementing the Company’s strategy, issuance of the Company’s shares on the New York Stock Exchange, and additional processes.
Research and development expenses
Our research and development expenses were approximately $87 million in 2014, an increase of about $4 million compared with the prior year.
Other expenses
Other expenses, net, in 2014, amounted to about $207 million, compared with about $ 94 million last year. Other expenses include mainly unusual items, in the amount of about $149 million (before interest expenses and tax impact) relating to prior periods, due to the arbitration decision regarding the royalties’ issue, and from an impairment in value of assets in subsidiaries in the US and Europe, in the amount of about $71 million. This increase was partly offset by income of about $36 million resulting from a capital gain following the completion of the acquisition of 100% holdings in Fosbrasil. Other expenses last year included primarily a provision for early retirement at ICL Rotem in the amount of about $60 million, a provision for treatment of waste in the amount of about $25 million, and an impairment in the value of assets in the amount of about $10 million.
Financing expenses, net
Our net finance expenses amounted to approximately $156 million in 2014, compared with net finance expenses of approximately $27 million last year. Financing expenses include a provision in the amount of about $32 million, mainly in connection with the arbitration decision dated May 19, 2014 regarding the royalties’ issue. After elimination of the above mentioned provision, the financing expenses amounted to approximately $124 million – an increase of about $97 million, compared with last year. The increase derives mainly from an increase in interest expenses, in the amount of approximately $21 million, expenses in respect of a change in the fair value of hedging, energy, and marine shipping transactions in the period, in the amount of approximately $41 million, compared with revenues of approximately $20 million in 2013, and as a result of expenses in respect of a change in the fair value of currency and interest transactions and the effects of exchange rate differences on provisions for employee benefits in the period, in the amount of approximately $6 million, compared with revenues of approximately $21 million in 2013. On the other hand, there was a decrease in interest expenses in respect of provisions for employee benefits, in the amount of about $3 million. In addition, borrowing costs, in the amount of approximately $16 million, were capitalized during the period.
Tax expenses
Our tax expenses amounted to approximately $166 million in 2014, compared to approximately $280 million last year. The tax rate on the pre-tax income is approximately 26.3%, compared with approximately 25.5% last year. The rate of tax expenses 2014 was impacted by unusual tax expenses in the amount of approximately $62 million, mainly as a result of an assessment agreement in subsidiaries in Europe, from the change in the shekel/dollar exchange rate that gave rise to an increase in the tax rate of the companies operating in Israel the source of which are differences in the measurement basis, and an increase in the Israeli Corporate Tax rate to 26.5%. In 2013, tax expenses included unusual tax expenses recognized in respect of the release of trapped earnings, in the amount of approximately $107 million.
On December 29, 2013, an assessment was received from the Israeli Tax Authority stating that the Company is required to make an additional tax payment in the amount of $230 million over and above the amount paid for the years 2009 to 2011. The Company filed an appeal of the assessment with the Tax Authorities. On January 27, 2015, the Company received an order from the Tax Authorities which sets the additional tax amount at approximately $200 million. The Tax Authorities’ main contention is that the ICL subsidiaries, Dead Sea Works and Rotem Amfert Negev, are not entitled to benefits under the Encouragement of Capital Investments Law, as of the effective date of Amendment No. 60 of the said Law in 2005. The Company disagrees with the position of the Tax Authorities, and on February 25, 2015 filed an appeal to the order. In the estimation of Company Management, based on its legal advisors, the chances that the Company’s contentions will ultimately be accepted at the end of the appeal proceeding are greater than the chances that they will be rejected and, therefore, no provision for tax has been included in the financial statements in respect of the said assessment.
Year Ended December 31, 2013 Compared to Year Ended December 31, 2012
Set forth below are our results of operations for the years ended December 31, 2013 and 2012.
|
For the Years Ended December 31,
|
% Increase (Decrease)
|
|||||||||||
|
2013
|
2012
|
|||||||||||
|
US$ millions
|
US$ millions
|
|||||||||||
|
Sales
|
6,272 | 6,471 | (3.1 | )% | ||||||||
|
Cost of sales
|
3,862 | 3,760 | 2.7 | % | ||||||||
|
Gross profit
|
2,410 | 2,711 | (11.1 | )% | ||||||||
|
Selling, transport and marketing expenses
|
850 | 797 | 6.6 | % | ||||||||
|
General and administrative expenses
|
282 | 249 | 13.3 | % | ||||||||
|
Research and development expenses, net
|
83 | 74 | 12.2 | % | ||||||||
|
Other expenses
|
110 | 61 | 80.3 | % | ||||||||
|
Other income
|
(16) | (24) | (33.3 | )% | ||||||||
|
Operating income
|
1,101 | 1,554 | (29.2 | )% | ||||||||
|
Finance expenses
|
158 | 82 | 92.7 | % | ||||||||
|
Finance income
|
(131) | (21) | 523.8 | % | ||||||||
|
Financing expenses, net
|
27 | 61 | (55.7 | )% | ||||||||
|
Share in earnings of equity accounted investees
|
26 | 27 | (3.7 | )% | ||||||||
|
Income before income taxes
|
1,100 | 1,520 | (27.6 | )% | ||||||||
|
Income taxes
|
280 | 218 | 28.4 | % | ||||||||
|
Net income
|
820 | 1,302 | (37.0 | )% | ||||||||
|
Attributable to:
|
||||||||||||
|
The shareholders of the Company
|
818 | 1,300 | (37.1 | )% | ||||||||
|
Non-controlling interests
|
2 | 2 | – | |||||||||
|
Net income
|
820 | 1,302 | (37.0 | )% | ||||||||
Sales
Our sales in 2013 amounted to approximately $6,272 million, compared with approximately $6,471 million in 2012, a decrease of approximately 3.1%. This decrease is due mainly to a decrease in the selling prices that led to a decrease in the total sales of approximately $495 million. On the other hand, this decrease was partly offset by an increase in the quantities sold, including the first time consolidation of the financial statements of certain companies acquired which led to an increase in sales of approximately $230 million and a change in the currency exchange rates, which contributed to an increase in sales of approximately $65 million.
Below is a geographical breakdown of our sales according to customer location:
|
Year Ended December 31,
|
||||||||
|
2013
|
2012
|
|||||||
|
USD millions
|
||||||||
|
Israel
|
319 | 325 | ||||||
|
North America
|
1,207 | 1,252 | ||||||
|
South America
|
748 | 815 | ||||||
|
Europe
|
2,378 | 2,332 | ||||||
|
Asia
|
1,464 | 1,615 | ||||||
|
Rest of the world
|
156 | 132 | ||||||
|
Total
|
6,272 | 6,471 | ||||||
The sales breakdown indicates an increase in sales in Europe, stemming mainly from an increase in the quantities of potash sold. On the other hand, there was a decrease in sales, mainly in Asia, as a result of a decline in the selling prices of potash and fertilizers in India, a decrease in sales in South America, deriving mostly from impact of the decline in the price of potash, and a decrease in sales in North America, mainly due to a decline in sales of bromine based flame retardants, inorganic bromine products, and chlorine based biocides for water treatment.
Cost of Sales
The cost of sales in 2013 amounted to approximately $3,862 million, compared with approximately $3,760 million in 2012, an increase of approximately $102 million. The increase stems from an expense, in the amount of approximately $133 million, resulting from an increase in quantities sold, which includes first time consolidation of the financial statements of companies acquired in 2012 and 2013, the impact of a change in the exchange rates, in the amount of approximately $85 million, and a decline in value of inventory, in the amount of approximately $10 million. This increase was partly offset by a decline in energy costs and raw material prices (mainly sulfur), in the amount of approximately $98 million, and by a decrease in royalties and selling commissions due to a decrease in total sales, in the amount of approximately $29 million.
Selling and marketing expenses
Selling and marketing expenses amounted to approximately $850 million in 2013, compared with approximately $797 million in 2012. The selling and marketing expenses include, mainly, costs with respect to marine shipping, overland transport, selling commissions and employee salaries. The increase stems mainly from the increase in quantities sold and, accordingly, the quantities shipped, in the amount of approximately $43 million, a change in the exchange rates, in the amount of approximately $5 million, and an increase, in the amount of approximately $4 million, from the first time consolidation of the results of companies and operations acquired in 2013 and 2012.
General and administrative expenses
General and administrative expenses amounted to approximately $281 million in 2013, compared with approximately $249 million in 2012. Our general and administrative expenses include mainly salaries. The salaries in Israel are paid in NIS. The increase stems primarily from the impact of currency exchange rates due to the strengthening of the value of the NIS (on average) against the U.S. dollar during 2013, and an increase in expenses in connection with options granted to employees in 2012.
Research and development expenses
Research and development expenses were approximately $83 million in 2013, compared with approximately $74 million in 2012.
Other expenses (income)
Other expenses in 2013 include mainly an expense in the amount of approximately $60 million in respect of an early retirement plan at Rotem, a provision of approximately $25 million for waste evacuation in Bromine, and an impairment of assets in the amount of approximately $10 million. Other expenses and income in 2012 included mainly a provision for early retirement in the amount of approximately $55 million in Bromine and Rotem, and income in the amount of approximately $11 million in respect of VAT refunds in foreign subsidiaries.
Financing expenses, net
Net financing expenses amounted to approximately $27 million in 2013, compared with net financing expenses of approximately $61 million in 2012. The decrease in net financing expenses in 2013 compared with 2012 stems mainly from an increase in finance income in 2013 as a result of change in the fair value of financial derivatives and from revaluation of net short term financial liabilities, in the amount of approximately $60 million. On the other hand, there was an increase in finance expenses due to the impact of exchange rate differences on provisions for employee benefits, in the amount of approximately $13 million, stemming from appreciation of the NIS against the U.S. dollar, at the rate of approximately 7% in 2013, compared with appreciation of the NIS against the U.S. dollar at the rate of approximately 2.3%, in 2012. In addition, there was an increase in interest expenses, which totaled approximately $42 million in 2013, compared with $29 million in 2012.
The increase in financing income from the change in fair value of derivative financial instruments from $9 million in 2012 to $123 million in 2013 was a result of the appreciation of the NIS against the U.S. dollar, as described above, and an increase in the fair value of hedges relating to marine shipping prices, which increased approximately 95% in 2013 as compared to prices at the end of 2012. For additional information about our hedging transactions, see “Item 11. Quantitative and Qualitative Disclosures about Market Risk”.
Tax expenses
Tax expenses amounted to approximately $280 million in 2013, compared to approximately $218 million in 2012. The tax rate on pre-tax income was about 25.5% in 2013 compared with about 14.3% in 2012. The increase in the tax rate in 2013 compared with 2012 is derived mainly from unusual tax expenses, in the amount of approximately $108 million, due to the Company’s decision to release trapped earnings and the impact of updating our deferred taxes as a result of an increase in the corporate rate in Israel to 26.5% commencing from January 2014.
This increase was partly offset by the impact of the change in the exchange rate of the U.S. dollar against the NIS in 2013, compared with 2012. We pay Israeli taxes in Israel in NIS but measure such taxes for our accounting purposes in U.S. dollars, so the appreciation of the NIS against the U.S. dollar in 2013 triggered a decline in the tax rate as measured in U.S. dollars.
On December 29, 2013, an assessment was received by the Tax Authorities stating that the Company is required to make an additional tax payment in the amount of $230 million over and above the amount paid for the years 2009 to 2011. The Company filed an appeal of the assessment with the Tax Authorities. On January 27, 2015, the Company received an order from the Tax Authorities which puts the additional tax amount at approximately $200 million. The Tax Authorities’ main contention is that the ICL subsidiaries, Dead Sea Works and Rotem Amfert Negev, are not entitled to benefits under the Encouragement of Capital Investments Law, as of the effective date of Amendment No. 60 of the said Law in 2005. The Company disagrees with the position of the Tax Authorities, and on February 25, 2015 with an appeal of the order was file. In the estimation of Company Management, based on its legal advisors, the chances that the Company’s contentions will ultimately be accepted at the end of the appeal proceeding are greater than the chances that they will be rejected and, therefore, no provision for tax has been included in the financial statements in respect of the said assessment.
We currently benefit from reduced tax rates in Israel as a result of certain tax laws. These benefits will gradually expire. See “Item 10. Additional Information—E. Taxation—Israeli Tax Considerations—Taxation of the Company—Reform of the Investments Law—2011”.
Segment Information
Segment Information for Year Ended December 31, 2014 Compared to Year Ended December 31, 2013
|
Year Ended December 31,
|
||||||||
|
2014
|
2013
|
|||||||
|
$ millions
|
||||||||
|
Sales by segment
|
||||||||
|
ICL Fertilizers
|
3,402 | 3,655 | ||||||
|
ICL Industrial Products
|
1,337 | 1,297 | ||||||
|
ICL Performance Products
|
1,614 | 1,575 | ||||||
|
Others and setoffs
|
(242) | (255) | ||||||
|
Total
|
6,111 | 6,272 | ||||||
Note: The sales data for the segments are before setoffs of inter segment sales.
|
Year Ended December 31,
|
||||||||
|
2014
|
2013
|
|||||||
|
$ millions
|
||||||||
|
Operating income by segment
|
||||||||
|
ICL Fertilizers
|
670 | 821 | ||||||
|
ICL Industrial Products
|
(62) | 115 | ||||||
|
ICL Performance Products
|
197 | 196 | ||||||
|
Other and offsets
|
(47) | (31) | ||||||
|
Operating income(consolidated)
|
758 | 1,101 | ||||||
Fertilizers
Below is a breakdown of the sales and operating income of our Fertilizers segment in 2014 and 2013, by areas of operation (before setoffs of inter segment sales):
|
Year Ended December 31,
|
||||||||
|
2014
|
2013
|
|||||||
|
Sales
|
||||||||
|
Potash
|
52 | % | 54 | % | ||||
|
Phosphate
|
48 | % | 46 | % | ||||
|
Operating income
|
||||||||
|
Potash
|
80 | % | 90 | % | ||||
|
Phosphate
|
20 | % | 10 | % | ||||
Potash
Revenues in this segment include sales of potash from Israel, Spain (ICL Iberia) and the United Kingdom (ICL UK).
Potash – Revenues and Profit
Below is a breakdown of revenue and operating income for potash sales in 2014 and 2013.
|
Year Ended December 31,
|
||||||||
|
2014
|
2013
|
|||||||
|
$ millions
|
||||||||
|
Revenues*
|
1,816 | 2,027 | ||||||
|
Operating income
|
536 | 740 | ||||||
|
*
|
Includes revenue from inter segment sales.
|
The decrease in revenues in 2014, compared with the corresponding period last year, stems from a decrease in selling prices, which led to a decrease in sales, in the amount of about USD 325 million. In contrast, this decrease was partly offset by an increase in quantities sold, which led to an increase in revenues, in the amount of about USD 103 million and from the impact of the change in the currency exchange rates, in the amount of about USD 12 million.
The decrease in operating income in 2014 stems mainly from a decrease in the selling prices of potash, which led to a decline, in the amount of about USD 325 million, an increase in the cost of sales due to an increase in quantities sold, in the amount of about USD 19 million, and from a one-time expense in connection with a provision for arbitration relating to royalties in respect of prior periods, in the amount of about USD 8 million. On the other hand, this decrease was partly offset by the impact of the increase in quantities of potash sold, in the amount of about USD 103 million, a decline in the energy costs, in the amount of about USD 35 million, from a decline in shipping expenses, in the amount of about USD 7 million, and from a decline in other operating expenses, in the amount of about USD 3 million.
Below is a breakdown of production, sales and closing inventories for potash in 2014 and 2013.
Potash – Production, Sales and Closing Inventories
|
Year Ended December 31,
|
||||||||
|
2014
|
2013
|
|||||||
|
In thousands of tons
|
||||||||
|
Production
|
5,143 | 5,155 | ||||||
|
Sales to external customers
|
5,034 | 4,712 | ||||||
|
Sales to internal customers
|
321 | 323 | ||||||
|
Total sales (including internal sales)
|
5,355 | 5,035 | ||||||
|
Closing inventory
|
914 | 1,126 | ||||||
The quantity of potash sold to external customers in 2014 is about 322 thousand tonnes higher than in 2013, mainly due to an increase in the quantities sold to China, the United States and Europe, which was partly offset by a decline in the quantities sold to India and South America. Production of potash in 2014 was about 12 thousand tonnes lower than in 2013 as a result of a decrease in production in Israel, due to, among other things, labor interruptions at ICL Dead Sea, which was partly offset by an increase in production in the United Kingdom and in Spain.
Phosphates
Revenue from fertilizers and phosphates derive from sales in and outside Israel of phosphate rock, fertilizers (including phosphate fertilizers, compound, liquid and fully soluble fertilizers and slow release and controlled release fertilizers), phosphoric acid used as a raw material for fertilizer production (“green acid”) and other products.
Phosphates – Revenues and Profit
Below is a breakdown of revenue and operating income for fertilizers and phosphates in 2014 and 2013.
|
Year Ended December 31,
|
||||||||
|
2014
|
2013
|
|||||||
|
$ millions
|
||||||||
|
Revenues*
|
1,678 | 1,754 | ||||||
|
Operating income
|
133 | 79 | ||||||
|
Adjusted operating income(1)
|
141 | 139 | ||||||
|
*
|
Includes revenue from inter segment sales.
|
|
(1)
|
In 2013 a provision for early retirement at ICL Rotem, in the amount of about USD 60 million was booked. In 2014 the impact of the strike at ICL Rotem, in the amount of about USD 16 million, net of receipt of strike insurance reimbursement, in the amount of about USD 8 million. |
The decrease in sales in 2014 stems from a decrease in selling prices of phosphate fertilizers, which caused a decrease in the sales of about USD 94 million. This decrease was partly offset as a result of the change in the currency exchange rates, in the amount of about USD 18 million.
The increase in operating income in 2014 derives mainly from a decrease in the prices of raw materials, in the amount of about USD 33 million, from a decline in salaries expenses, in the amount of about USD 36 million, mainly as a result of the retirement of employees at ICL Rotem, from changes in currency exchange rates, in the amount of about USD 3 million, a drop in shipping expenses due to a fall in the quantities sold in the amount of about USD 2 million, and a decline in other operating costs, in the amount of about USD 22 million, due to, among other things, a decrease in maintenance costs and costs of contractors. On the other hand, this increase was partially offset by a fall in selling prices, in the amount of about USD 94 million, and the impact of the strike at ICL Rotem, in the amount of about USD 16 million, net of receipt of strike insurance reimbursement, in the amount of about USD 8 million. Operating income last year was impacted by a provision for early retirement at ICL Rotem, in the amount of about USD 60 million.
Phosphates – Production and Sales
Below is a breakdown of production and sales for fertilizers and phosphates in 2014 and 2013.
|
Year Ended December 31,
|
||||||||
|
2014
|
2013
|
|||||||
|
In thousands of tons
|
||||||||
|
Phosphate rock
|
||||||||
|
Production of rock
|
3,357 | 3,578 | ||||||
|
Sales *
|
920 | 879 | ||||||
|
Phosphate rock used for internal purposes
|
2,398 | 2,577 | ||||||
|
Fertilizers
|
||||||||
|
Production
|
1,590 | 1,747 | ||||||
|
Sales *
|
1,695 | 1,695 | ||||||
|
*
|
To external customers.
|
Production of phosphate fertilizers and phosphate rock, in 2014, was 157 thousand tonnes and 221 thousand tonnes lower, respectively, compared to 2013, as a result of the strike at ICL Rotem that took place in the first half of the year and the damage caused to ICL Rotem’s sulfuric acid production facility.
Industrial Products
Sales
Sales of ICL-IP in 2014 were about USD 1,337 million – an increase of about USD 40 million compared with 2013. This increase stems from an increase in quantities sold, mainly of bromine based flame retardants, bromine based and chlorine based biocides used for water treatment, inorganic bromine products and magnesium products, in the amount of about USD 65 million. This increase was partly offset by a decline in selling prices, mainly of inorganic bromine products and bromine based flame retardants, which reduced sales by about USD 22 million, as well as the impact of the currency exchange rates, in the amount of about USD 3 million.
Profitability
Operating loss in 2014 totaled about USD 62 million, compared with operating income of about USD 115 million 2013. Operating income after eliminating unusual items, as detailed below, in 2014, amounted to about USD 128 million, compared with adjusted operating income last year, in the amount of about USD 150 million. The rate of adjusted operating income out of the sales amounted to about 9.6% compared with adjusted operating income rate of about 11.5% last year.
The decrease in operating income is primarily as a result of unusual items in connection with a provision for royalties relating to prior periods due to an arbitration decision in the amount of about USD 141 million, an impairment of assets in subsidiaries in the US and Europe, in the amount of about USD 49 million, a decrease in selling prices, which reduced the operating income by the amount of about USD 22 million, the impact of changes in currency exchange rates, in the amount of about USD 15 million, an increase in royalties’ expenses relating to current period as a result of the arbitration decision, in the amount of about USD 12 million, an increase in shipping expenses due mainly to an increase in quantities sold, in the amount of about USD 8 million, and an increase in other operating expenses, in the amount of about USD 4 million. This decrease was partly offset by an increase in quantities sold and a change in the mix of quantities of various products sold, which led to an increase in income of about USD 24 million, and a decrease in the raw material and energy prices, which contributed about USD 15 million to the income. The operating income last year was impacted by a provision for treatment of waste and an impairment of assets, in the amounts of about USD 25 million and about USD 10 million, respectively.
Performance Products
Sales
Total sales in 2014 amounted to approximately USD 1,614 million, an increase of approximately USD 39 million compared with 2013. This increase stems from the first time consolidation of companies acquired during 2014, in the amount of approximately USD 56 million, and from an increase in selling prices of approximately USD 12 million. These impacts were partly offset by a decrease in quantities sold of approximately USD 21 million, and the impact of changes in currency exchange rates, in the amount of approximately USD 7 million.
Profitability
The segment’s operating income in 2014 amounted to approximately USD 197 million, an increase of approximately USD 2 million compared with 2013. This increase stems mainly from income due to entry into the consolidation, in the amount of USD 36 million, resulting from acquisition of the entire holdings in Fosbrasil S.A. (hereinafter – “Fosbrasil”) which led to an increase from a rate of holdings of 44.25% to 100%, resulting in the consolidation of Fosbrasil in the Company’s financial statements, and from an increase in selling prices, in the amount of approximately USD 12 million. This increase was partially offset by an impairment in value of assets in subsidiaries in Europe, in the amount of approximately USD 22 million, an increase in costs due to the strike at ICL Rotem in the amount of approximately USD 10 million (net of the insurance reimbursement received on account of the strike, in the amount of approximately USD 1 million), a decline in quantities sold, net of first time consolidation of companies acquired during 2014, in the amount of approximately USD 9 million, and an increase in raw material prices in the amount of approximately USD 5 million.
Segment Information for Year Ended December 31, 2013 Compared to Year Ended December 31, 2012
|
Year Ended December 31,
|
||||||||
|
2013
|
2012
|
|||||||
|
$ millions
|
||||||||
|
Sales by segment
|
||||||||
|
ICL Fertilizers
|
3,655 | 3,806 | ||||||
|
ICL Industrial Products
|
1,297 | 1,417 | ||||||
|
ICL Performance Products
|
1,575 | 1,472 | ||||||
|
Others and setoffs
|
(255) | (224) | ||||||
|
Total
|
6,272 | 6,471 | ||||||
|
|
Note: The sales data for the segments are before setoffs of inter-segment sales.
|
|
Year Ended December 31,
|
||||||||
|
2013
|
2012
|
|||||||
|
$ millions
|
||||||||
|
Operating income by segment
|
||||||||
|
ICL Fertilizers
|
821 | 1,159 | ||||||
|
ICL Industrial Products
|
115 | 217 | ||||||
|
ICL Performance Products
|
196 | 179 | ||||||
|
Other and offsets
|
(31) | (1) | ||||||
|
Operating income (consolidated)
|
1,101 | 1,554 | ||||||
Fertilizers
Below is a breakdown of the sales and operating income of our Fertilizers segment in 2013 and 2012, by areas of operation (before setoffs of inter segment sales):
|
Year Ended December 31,
|
||||||||
|
2013
|
2012
|
|||||||
|
Sales
|
||||||||
|
Potash
|
54 | % | 56 | % | ||||
|
Phosphate
|
46 | % | 44 | % | ||||
|
Operating income
|
||||||||
|
Potash
|
90 | % | 86 | % | ||||
|
Phosphate
|
10 | % | 14 | % | ||||
Potash
Revenues in this segment include sales of potash from Israel, Spain (ICL Iberia) and the United Kingdom (ICL UK).
Potash – Revenues and Profit
Below is a breakdown of revenue and operating income for potash sales in 2013 and 2012.
|
Year Ended December 31,
|
||||||||
|
2013
|
2012
|
|||||||
|
$ millions
|
||||||||
|
Revenues*
|
2,027 | 2,198 | ||||||
|
Operating income
|
740 | 996 | ||||||
|
*
|
Includes revenue from inter segment sales.
|
The decrease in revenue in 2013 compared with 2012 stems mainly from a decrease in selling prices, which led to a decrease in revenue, in the amount of approximately $359 million. On the other hand, this decrease was partly offset by an increase in quantities sold, which caused an increase in sales of approximately $177 million, and the impact of the change in currency exchange rates, in the amount of approximately $10 million.
The decrease in operating income in 2013 compared with 2012 is mainly due to the impact of the decrease in selling prices of potash, which reduced operating income by approximately $359 million, changes in currency exchange rates, in the amount of approximately $10 million, and an increase in other operating expenses, in the amount of approximately $9 million. This decrease was partly offset by improved results of approximately $81 million due to higher quantities sold (due to an increase in sales of $177 million that was partially offset by increases in the cost of sales of $70 million and transportation costs of $26 million due to the increase in quantities sold), a decrease in sales commissions of approximately $18 million (stemming mainly from a decrease in sales) and a decrease in energy prices, in the amount of approximately $24 million.
Potash – Production, Sales and Closing Inventories
Below is a breakdown of production, sales and closing inventories for potash in 2013 and 2012.
|
Year Ended December 31,
|
||||||||
|
2013
|
2012
|
|||||||
|
In thousands of tons
|
||||||||
|
Production
|
5,155 | 4,936 | ||||||
|
Sales to external customers
|
4,712 | 4,336 | ||||||
|
Sales to internal customers
|
323 | 293 | ||||||
|
Total sales (including internal sales)
|
5,035 | 4,629 | ||||||
|
Closing inventory
|
1,126 | 1,006 | ||||||
The quantity of potash sold to external customers in 2013 was about 376 thousand tons higher than in 2012, mainly as a result of an increase in quantities sold to China and Brazil. Production of potash in 2013 was about 219 thousand tons higher than in 2012, as a result of an improvement in production in our mines in Europe.
Phosphates
Revenue from fertilizers and phosphates derive from sales in and outside Israel of phosphate rock, fertilizers (including phosphate fertilizers, compound, liquid and fully soluble fertilizers and slow release and controlled release fertilizers), phosphoric acid used as a raw material for fertilizer production (“green acid”) and other products.
Phosphates – Revenues and Profit
Below is a breakdown of revenue and operating income for fertilizers and phosphates in 2013 and 2012.
|
Year Ended December 31,
|
||||||||
|
2013
|
2012
|
|||||||
|
$ millions
|
||||||||
|
Revenues*
|
1,754 | 1,727 | ||||||
|
Operating income
|
79 | 162 | ||||||
|
Adjusted operating income(1)
|
139 | 195 | ||||||
|
*
|
Includes revenue from inter segment sales.
|
|
(1)
|
Operating income excluding unusual items. Unusual items in 2013 and 2012 included $60 million and $33 million, respectively, of early retirement expense at Rotem.
|
The increase in revenue in 2013 compared with 2012 is mainly due to an increase in quantities of phosphate fertilizers sold, including the first time consolidation of the financial statements of certain companies acquired, which led to an increase in the total revenue in the amount of approximately $99 million, and the impact of changes in currency exchange rates, in the amount of approximately $39 million. This increase was mostly offset by a decrease in selling prices of fertilizers and phosphates products, which led to a decline in revenue of approximately $109 million.
The Operating income in 2013 was $79 million, a decrease of approximately $83 million as compared to operating income of $162 million in 2012. Operating income as a percentage of sales was 4.5% in 2013 as compared to 9.4% in 2012. Operating income in 2013 and 2012, after eliminating unusual items, amounted to approximately $139 million and approximately $195 million, respectively. Adjusted operating income, which reflects the elimination of the unusual items described above, as a percentage of sales, was approximately 7.9%, as opposed to an adjusted operating income rate of approximately 11.3% in 2012.
The decrease in operating income in 2013 compared with 2012 stems mainly from a decrease in selling prices, in the amount of approximately $109 million, partially offset by a decrease in sales commissions, in the amount of approximately $12 million (stemming mainly from a decrease in sales). The decrease in operating income was also due to a provision for early retirement in Rotem, in the amount of approximately $60 million (as compared to a similar provision in 2012 of $33 million), the impact of changes in currency exchange rates, in the amount of approximately $8 million, and impairment in the value of inventory, in the amount of approximately $10 million. This decrease was partly offset by a decrease in raw material prices, in the amount of approximately $52 million, and a decrease in other operating expenses, in the amount of approximately $7 million.
In addition, operating income was affected by the sales increase, which was due to the increase in quantities sold of approximately $55 million, offset by the impact of higher cost of sales of approximately $40 million and transportation costs of approximately $16 million due to the increase in quantities sold.
Phosphates – Production and Sales
Below is a breakdown of production and sales for fertilizers and phosphates in 2013 and 2012.
|
Year Ended December 31,
|
||||||||
|
2013
|
2012
|
|||||||
|
In thousands of tons
|
||||||||
|
Phosphate rock
|
||||||||
|
Production of rock
|
3,578 | 3,513 | ||||||
|
Sales *
|
879 | 739 | ||||||
|
Phosphate rock used for internal purposes
|
2,577 | 2,491 | ||||||
|
Fertilizers
|
||||||||
|
Production
|
1,747 | 1,598 | ||||||
|
Sales *
|
1,695 | 1,575 | ||||||
|
*
|
To external customers.
|
Phosphate rock is produced according to demand, both for internal use and for sales to external customers, while maintaining appropriate inventory levels. Production of phosphate fertilizers in 2013 was higher than in 2012, mainly due to maintenance work in the production facilities performed in the first half of 2012.
Industrial Products
Sales
The total sales of the Industrial Products segment in 2013 reached approximately $1,297 million, a decrease of approximately $120 million compared with 2012. The decrease in sales stems mainly from a decrease in the quantities sold, mainly of bromine based flame retardants, inorganic bromine products and chlorine based biocides for water treatment, which decreased the total sales by approximately $82 million, as well as from a decline in the selling prices in the amount of approximately $42 million. This decrease was offset in part by the impact of changes in currency exchange rates, in the amount of approximately $3 million.
Profitability
Operating income in 2013 totaled approximately $115 million, compared with operating income of approximately $217 million in 2012. Operating income in 2013 and 2012 amounted to approximately $150 million and approximately $239 million, respectively, after eliminating unusual items (in 2013, $25 million expenses in respect of a provision for waste treatment, and $10 million impairment of assets, and in 2012 $22 million early retirement expense). Operating income as a percentage of sales was approximately 8.9% in 2013 compared to 15.3% in 2012. Adjusted operating income, which reflects the elimination of the unusual items described above, as a percentage of sales, was approximately 11.6%, compared with approximately 16.9% in 2012.
Operating income decreased primarily as a result of a decrease in the quantities sold and produced, which caused a decrease in operating income of approximately $49 million (due to a decrease in sales of $82 million that was partially offset by decreases in the cost of sales of $30 million and transportation costs of $3 million due to the decrease in quantities sold), a decrease in the selling prices, which caused a decrease in operating income of approximately $42 million, expenses relating to update of the provision for waste removal in the amount of approximately $25 million, an impairment of assets in the amount of approximately $10 million, and the impact of changes in currency exchange rates in the amount of approximately $9 million. This decrease was partly offset by a decrease in raw material and energy prices by approximately $14 million. Operating income in 2012 was impacted by a provision for early retirement, in the amount of approximately $22 million.
Performance Products
Sales
Sales in our Performance Products segment in 2013 amounted to approximately $1,575 million, an increase of approximately $103 million compared with 2012. The increase in sales stems from an increase in quantities sold, including the first time consolidation of the financial statements of companies acquired during 2013, which led to an increase of approximately $90 million, and from the effect of changes in exchange rates, which gave rise to an increase of approximately $12 million.
Profitability
The operating income in our Performance Products segment in 2013 amounted to approximately $196 million, an increase of approximately $17 million compared with 2012. The increase stems mainly from a decline in raw material prices, in the amount of approximately $24 million, and improved results of approximately $20 million due to higher quantities sold (due to an increase in sales of $70 million that was partially offset by increases in the cost of sales of approximately $44 million and transportation costs of approximately $6 million due to the increase in quantities sold). This increase was partly offset by an increase in other operating expenses, in the amount of approximately $16 million, and by the impact of unusual income in respect of a VAT refund to an overseas subsidiary, in the amount of approximately $11 million, recognized in 2012.
B. LIQUIDITY AND CAPITAL RESOURCES
Overview
We have a balance of $131 million in cash and cash equivalents as at December 31, 2014. Our net financial liabilities were $2,659 million as of December 31, 2014, including approximately $2,304 million of long term debt (excluding current portion) and debentures and approximately $603 million of short term debt (including current portion of long term debt).
Our policy is to secure sources of financing for our operating activities and investments, while diversifying the sources of financing among various financial instruments, and between local and international financing entities. Our sources of financing are short and long term loans from banks (mainly international banks) and institutional entities in Israel, debentures issued to institutional investors in Israel and the United States, and securitization of customer receivables whereby some of our subsidiaries sell their customer receivables in return for a cash payment. Our policy is to fully utilize the various financing facilities according to our cash flow requirements, alternative costs and market conditions.
Our management believes our sources of liquidity and capital resources, including working capital, are adequate for our current requirements and business operations and will at least be adequate to satisfy our anticipated requirements during the next tweleve months for working capital, capital expenditures and other corporate needs.
Distributions of dividends to us from our subsidiaries and transfers of funds through certain countries may under certain circumstances result in the creation of tax liabilities. However, taxation on dividend distributions and funds transfers have not had and are not expected to have a material impact on our ability to meet our cash obligations.
In addition to our normal operating expenses, including debt service, and our capital expenditures, we also need to make a significant one-time payment to the State of Israel as a result of a recent partial arbitration award we received on May 19, 2014. For additional information, see “Item 8. Financial Information—A. Consolidated Statements and Other Financial Information—Legal Proceedings—Arbitration concerning Royalties.”
In November 2014, we received an international credit rating of BBB with a stable rating outlook, issued by two credit rating companies: Standards & Poor’s and Fitch Rating Ltd. The debentures we issued (see Note 17 to the Company’s financial statements) received a rating that was identical to the Company’s rating. The Company also has an Israeli credit rating of ilAA with a stable rating outlook, which was issued by Standards & Poor’s Maalot.
Sources and Uses of Cash
The following table sets forth our cash flows for the periods indicated:
|
Year Ended December 31,
|
||||||||||||
|
2014
|
2013
|
2012
|
||||||||||
|
$ millions
|
||||||||||||
|
Net cash provided by operating activities
|
895 | 1,127 | 1,727 | |||||||||
|
Net cash used in investing activities
|
(996 | ) | (839 | ) | (741 | ) | ||||||
|
Net cash provided by (used in) financing activities
|
68 | (310 | ) | (1,019 | ) | |||||||
Operating Activities
Net cash flow from operating activities is a significant source of liquidity for the Company. In 2014, net cash provided by operations was approximately $895 million, compared with approximately $1,127 million last year. Most of the decline in cash flows from operating activities derived from the decline in income after setting off the change in working capital in accounts receivable item, mainly as a result of the decline in fair value of derivatives (after setting off the effect of changes in trade accounts receivable and inventory) and from coordinating additional non-cash accounting expenses and income in 2014 in respect of impairment of assets and income from entry into consolidation. The cash flows from operating activities, together with an increase in financial liabilities, were the source used to fund dividend payments and acquisition of operations. In 2013, the cash flow from operating activities was $1,127 million, compared with $1,727 million in 2012. Most of the decline in cash flows from operating activities derived from the decline in income and change in working capital, mainly as a result of the increase in trade receivables due to the increase in sales in the fourth quarter of 2013 compared with the fourth quarter of 2012.
Investing Activities
In 2014, net cash used in investing activities was approximately $996 million, compared with approximately $839 million in 2013.
In 2014, investments in property, plant, and equipment declined, mainly as a result of the completion in 2013 of the major part of the work on the construction of a partition in the dikes that surround Pond 5 in the Dead Sea. The flow of investments in property, plant, and equipment declined relative to the corresponding period of the previous year (approximately $752 million compared to $827 million) as a result of the decline in said investments after setting off the effect of payments paid to property, plant, and equipment suppliers in 2014. Nonetheless, the cash flow used in investing activities increased in 2014, mainly as a result of the increase in payments for business combinations, investments in intangible assets, and investments in investees treated under the equity method.
Net cash used in investing activities was $839 million in 2013, compared with $741 million in 2012. The increase in net cash used in investing activities between 2013 and 2012 was due primarily to the performance of work on the dike surrounding the evaporation ponds of our Fertilizers segment at the Dead Sea, construction work with respect to a new power station in Sodom, and the increase of the production capacity in our mines in Europe.
Financing Activities
Net cash provided by financing activities was approximately $68 million in 2014, compared with approximately $310 million used in financing activities in 2013. The primary reason for the increase in net cash provided by financing activities was the increase in net long-term loans in 2014 in the amount of approximately $1,056 million compared with approximately $61 million in 2013, after deducting the effects of repayment of short-term credit in 2014 in the amount of approximately $142 million, compared to short-term credit in the amount of approximately $263 million received in 2013, and the increase in dividends paid in the amount of approximately $211 million as a result of a one-time dividend in the amount of approximately $500 million that was paid in March 2014. Net cash used in financing activities was approximately $310 million in 2013, compared with approximately $1,019 million in 2012. The primary reasons for the decrease in net cash used in financing activities between 2013 and 2012 were dividends paid in the amount of approximately $634 million in 2013 compared with approximately $1,019 million in 2012 and an increase in short term credit in the amount of approximately $263 million in 2013 compared to short term credit paid in the amount of approximately $51 million in 2012.
As of December 31, 2014, our non-current liabilities consisted of loans from financial institutions in the amount of approximately $1,239 million and debentures in the amount of approximately $1,064 million. For information about the currencies in which our liabilities are denominated and their interest rates, see Note 17 to our audited financial statements included elsewhere in this Annual Report. As of December 31, 2014, we had approximately $821 million of unutilized long term credit lines.
A portion of our loans bear variable interest rates based on short term LIBOR for period of one to twelve months, plus a margin as defined in each loan agreement. Therefore, we are exposed to changes in cash flows arising from changes in these interest rates. Some of the loans and debentures issued by us bear fixed interest for the entire loan period. We hedge part of this exposure using financial instruments to fix the range of interest rates, in order to adjust our actual interest rate structure to match our projections regarding anticipated developments in the interest rate market.
For a description of material covenants in our loan agreements and any potential risk relating to compliance, see Note 17 to our audited financial statements included elsewhere in this Annual Report.
Credit Agreements
In December 2010, we received a loan from a European bank in the amount of approximately €100 million (approximately $121 million). The loan is to be repaid on December 15, 2015. The interest rate on the loan is Euribor plus 1.14%.
In March 14, 2011, we entered into an agreement with a consortium of 17 banks from Europe, the U.S., and Israel, under which these banks granted the Company a credit facility of approximately $675 million. The credit facility is for five years, and is repayable in full at the end of this period. Graded annual interest is payable on the utilized amount of credit, according to the actual utilization of the credit facility, as follows:
|
|
·
|
Utilization of up to 33% - LIBOR plus 0.8%;
|
|
|
·
|
Utilization between 33% and 66% - LIBOR plus 0.95% (on the entire utilized amount);
|
|
|
·
|
Utilization above 66% - LIBOR plus 1.1% (on the entire utilized amount).
|
The credit agreement does not include a commitment to utilize a minimum amount of the credit facility, but a non-utilization commission applies at the rate of 0.28% per year. As of the date of this Annual Report, we utilized approximately $505 million of this credit facility.
In the second half of 2011, we entered into an agreement with a European bank, under which the bank granted us a credit facility of approximately €100 million (approximately $121 million). The credit facility is for six years, and is to be repaid in full at the end of the period. The interest rate on the loan is LIBOR plus 0.9% to 1.4%, depending on the extent of the credit utilized. As of December 31, 2014, the credit facility was not utilized. In the first half of 2014, the Company entered into an agreement with the same bank, under which the bank granted a credit facility of approximately €100 million and approximately $100 million. This credit facility is for a period of six years and is to be repaid in entirety at the end of the period. The credit facility in euro replaces the unutilized credit facility that the bank had granted the Company in the second half of 2011. The dollar credit facility bears variable interest on the basis of Libor plus a margin of between 0.9% and 1.4%. The euro credit facility bears variable interest on the basis of Eurobor plus a margin of between 0.9% and 1.4%. The non-utilization commission is 0.32% per year. As of December 31, 2014, a total of approximately $100 million of the dollar credit facility was utilized.
In December 2011, we entered into an agreement with a consortium of seven international banks for a credit facility of approximately $650 million. The credit facility is for five years, and is to be repaid in full in December 2016. Graded annual interest is payable on the utilized amount of credit, according to the actual utilization of the credit facility, as follows:
|
|
·
|
Utilization of up to 33% - LIBOR plus 1%;
|
|
|
·
|
Utilization between 33% and 66% - LIBOR plus 1.2% (on the entire utilized amount);
|
|
|
·
|
Utilization above 66% - LIBOR plus 1.4% (on the entire utilized amount).
|
The credit agreement does not include a commitment to utilize a minimum amount of the credit facility, but a non-utilization commission applies at the rate of 0.35% per year. As of the date of this Annual Report, approximately $214 million of this credit facility was utilized.
On September 11, 2012, we received a loan in the amount of approximately $50 million from a third party, bearing interest at three month LIBOR plus a margin of 0.7%. The loan is extended every three months on the same terms on which it was received. The last date on which the loan was extended was December 11, 2014.
In December 2012, we entered into a credit facility agreement with a European bank for a credit facility of approximately €100 million (approximately $121 million). As of December 31, 2014, we had utilized $100 million of this facility. The repayment date for this amount is in December 2019. The interest rate on this amount is LIBOR plus 1.4%. The balance of the utilized amount of this credit facility must be repaid six years from the date of utilization but no later than December 2021.
In November 2013, we entered into a loan agreement with several institutional entities in the amount of approximately $170 million, bearing fixed interest at a rate of 4.74%. The loan is to be paid in installments until November 2024 (average duration of seven years).
In 2014, we received a number of short term loans from Israeli banks. As of December 31, 2014, the total amount of the loans was approximately $40 million.
In May 2014, we signed an agreement with a European bank whereby the bank provided a credit facility in the amount of approximately €50 million. This credit facility is for a period of five years and is to be repaid in full at the end of the period. It bears variable interest based on Euribor plus a margin of 0.95% to 1.25%. A non-utilization commission of 0.33% per year applies. As of December 31, 2014, this credit facility had not been used.
In June 2014, we signed loan agreements with a number of international institutional entities in the aggregate amount of approximately €57 million and approximately $45 million. The proceeds of these loans were received in July 2014. The loans are to be repaid in a period of between five to ten years, where some of the loans bear fixed interest in the range of 2.1% to 3.75%, some bear variable interest based on LIBOR plus 1.55%, and some bear variable interest based on Euribor plus a margin of 1.4% to 1.7%.
In December 2014, we signed a loan agreement in the amount of approximately R$161 million (approximately $60 million) with a European bank. The loan is payable in installments until 2021. The loan bears CDI interest (Brazilian Interbank Certificates of Deposits) plus a margin of 1.35%.
Controlling Shareholder Loan
On June 26, 2012, we received a short term loan in the amount of approximately $50 million from our controlling shareholder (Israel Corporation Ltd). The loan was granted on terms similar to market terms. The loan was renewed periodically for periods of three or six months and bore interest at a rate of 0.776%. In August 2014, the loan was repaid in full. .
Securitization Transaction
On July 2, 2010, we and certain subsidiaries ( the “Subsidiaries”) entered into a number of securitization agreements with Rabobank International and Credit Agricole (the “Lending Banks”) for the sale of our customer receivables to a foreign company established specifically for this purpose that is neither owned nor controlled by us (the “Acquiring Company”).
The Acquiring Company finances acquisition of the receivables by means of a loan received from a financial institution that is not related to us, which finances the loan out of the proceeds from the issuance of commercial paper on the commercial paper market. The repayment of both the commercial paper and the loan are backed by credit lines from the Lending Banks. The amount of cash that will be received in respect of the initial sale of the customer debts in the securitization transaction will be up to approximately $350 million.
The acquisition is on an ongoing basis, such that the proceeds received by the Acquiring Company from customers whose receivables were sold are used to acquire new customer receivables. The period in which the Subsidiaries are entitled to sell our customer receivables to the Acquiring Company is five years from the agreement closing date, although both parties have the option at the end of each year to give notice of termination of the securitization transaction. The securitization agreement will end in July 2015.
The selling price of the customer receivables is the amount of the debt sold, less the calculated interest cost based on the anticipated period between the sale date of the customer debt and its repayment date. Upon acquisition of a receivable, the Acquiring Company pays the majority of the sale price in cash and the remainder in a deferred liability, which is paid after collection of the receivable sold. The cash portion of the consideration varies according to the composition and behavior of the customer portfolio. Our Subsidiaries handle collection of the customer receivables included in the securitization transaction on behalf of the Acquiring Company.
In addition, as part of the agreement, a number of conditions were set in connection with the quality of the customer portfolios, which give the Lending Banks the option to terminate the agreement or determine that some of the Subsidiaries, whose customer portfolios do not meet the conditions provided, will no longer be included in the securitization agreement.
The securitization of customer receivables does not meet the conditions for disposal of financial assets prescribed in International Standard IAS 39, regarding Financial Instruments—Recognition of Measurement, since we did not transfer all of the risks and rewards deriving from customers’ debts. Therefore, the amounts received from the Acquiring Company are presented as a financial liability as part of the short term credit. As of December 31, 2014, utilization of the securitization facility and trade receivables within this framework amounted to approximately $290 million (approximately $285 million as of December 31, 2013).
2005 Debentures
In 2005, we issued debentures to institutional investors in a private placement in the United States in the amount of approximately $125 million bearing fixed interest. As of December 31, 2014, the outstanding balance of the debentures was approximately $67 million, bearing interest at a fixed rate of 5.72%. The debentures were repaid in full on March 3, 2015.
April 2009 Debentures
On April 27, 2009, we issued three series of debentures for an amount equal to approximately NIS 695 million (approximately $167 million), of which Series B and C were repaid in full in 2013, and Series A was repaid in full on April 30, 2014 for approximately $147 million.
September 2009 Debentures
On September 9, 2009, we issued three series of debentures for an amount equal to approximately NIS 898 million (approximately $235 million). The debentures were issued in three series, of which Series B and C were repaid in full during 2013, and Series D was repaid in full on October 31, 2014 for approximately $26 million.
2013 Debentures
In November 2013, a wholly owned and controlled subsidiary of ours entered into an agreement with international institutional investors to make a private offering in the United States of unlisted debentures. Our subsidiary issued three series of debentures in an aggregate principal amount of approximately $275 million, the proceeds of which were received in January 2014.
The debentures were issued in three series, as follows:
|
|
·
|
Approximately $84 million of debentures with a repayment date of January 15, 2021 bearing interest at a fixed rate of 4.55%.
|
|
|
·
|
Approximately $145 million of debentures with a repayment date of January 15, 2024 bearing interest at a fixed rate of 5.16%.
|
|
|
·
|
Approximately $46 million of debentures with a repayment date of January 15, 2026 bearing interest at a fixed rate of 5.31%.
|
2014 Debentures
On December 2, 2014, the Company completed the private placement of senior notes pursuant to Rule 144A and Regulation S under the U.S. Securities Act of 1933, as amended, to institutional investors in the U.S., Europe, and Israel, in an aggregate principal amount of $800 million, due December 2, 2024. The notes carry an annual coupon of 4.5% to be paid in semi-annual installments, on June 2 and December 2 of each year. The notes were issued at a price of 99.285% to yield 4.59%, for net total proceeds of approximately $794 million. The notes have been rated BBB with a stable rating outlook by Standard and Poor’s and by Fitch Rating Ltd. The notes are listed for trade in the TACT Institutional, by the Tel-Aviv Stock Exchange Ltd.
Critical Accounting Policies and Estimates
The following is a description of certain key accounting policies on which our financial condition and results of operations are dependent. The key accounting policies generally involve complex quantitative analyses or are based on subjective judgments or assumptions. Management bases its estimates and judgments on historical experience and on various other factors that are believed to be reasonable under current circumstances. Actual results may differ from these estimates if assumptions and conditions change.
Employee Benefits
According to International Standard IAS 19, some of our employee benefit plans constitute a defined benefit plan as defined in IAS 19. Such plans principally include liabilities for pension and severance benefits.
In computing pension liability, we use various assessments. These assessments include, among other things, the interest rate for discounting our pension liability and the pension fund assets, assessments regarding the long term increase in wages and an assessment of the life expectancy of the group of employees entitled to a pension. Assessment of the interest rate for purposes of discounting our pension liability and the pension fund assets is based on the rate of return on bonds of corporations operating in countries where an active market exists for corporate bonds and on the rate of return on government bonds for companies operating in countries where there is no active market for corporate bonds. The rate of return on long term bonds changes according to market conditions. As a result the discount rate will also change as will the pension liability and the pension fund assets will change accordingly. The assessment regarding the increase in wages is based on our forecasts in accordance with past experience and existing labor agreements. Such assessments may be different than the actual wage increases. The life expectancy assessment is based on actuarial research published in each country. This research is updated every several years, and accordingly the life expectancy assessment may be updated.
Measurement of the liability for severance pay is based upon an actuarial assessment, which takes into account various assessments including, among others, the future increase in employee wages and the rate of employee turnover. The measurement is made on the basis of discounting the expected future cash flows according to the interest rate on high ranking highly rated corporate bonds. In addition, the severance pay deposits are measured according to their fair value. Changes in the assumptions used for the calculation of the liability for severance pay and the related plan assets for severance pay could increase or decrease the net liability for severance pay recognized.
Environmental and Contingent Liabilities
We produce fertilizers and chemical products and, therefore, are exposed in our ordinary course of business to obligations and commitments under environmental and related laws and regulations. We recognize a liability in our books when such liability is expected, is derived from a liability event that has already occurred and can be reliably measured. Assessment of the liability is based mostly on past experience, familiarity with the legal requirements concerning our areas of operation, as well as assessments regarding contingent claims existing against us based on opinions of legal advisors and other experts. As explained in Note 23 to our audited financial statements, a number of lawsuits are pending against us, the results of which may have a material impact on our results of operations.
When assessing the possible outcomes of legal claims that were filed against us and our investee companies, we base our assessments on the opinions of our legal advisors. These opinions of the legal advisors are based on their best professional judgment, and take into consideration the current stage of the proceedings and the legal experience accumulated with respect to the various matters. As the results of the claims will ultimately be determined by the courts or as part of a settlement, they may be different from these estimates by us and our legal advisors.
Property, Plant and Equipment
Property, plant and equipment items are depreciated using the straight line method over their estimated useful lives.
We evaluate the estimated useful lives of the property, plant and equipment by means of a comparison to the sector in which we operate, the level of upkeep of the facilities and the performance of the facilities over the years. Changes in these estimates in succeeding periods could increase or decrease the rate of depreciation of the facilities.
Impairment of Assets IAS 36
We examine at every reporting date whether there have been events or changes in circumstances indicating that there has been an impairment of one or more non-monetary assets. When there are indications of impairment, an examination is made as to whether the carrying amount of the investment can be recovered from the discounted cash flows anticipated to be derived from the asset, and if necessary, we record an impairment provision up to the amount of the recoverable value. Assessment of the impairment of goodwill and of other intangible assets having an indeterminable lifespan is performed once a year or more frequently when indications of impairment exist.
The recoverable value of the asset or the cash generating unit is determined based on the higher of the fair value of the asset less realization costs and the present value of the future cash flows expected from the continued use of the asset in its existing state, including the cash flows expected upon removal of the asset from service and its eventual sale (value in use).
The future cash flows are discounted to their present value using a discount rate that reflects assessments of the market participants of the time value of money and the risks specific to the asset. The estimates regarding cash flows are based on past experience with respect to this asset or similar assets, and on our best assessments regarding the economic conditions that will exist during the asset’s remaining useful life.
The estimates of the future cash flows are based on our forecasts. Since the actual cash flows could be different than our forecasts, the amount of the realizable value determined in the examination of impairment in value may change in succeeding periods, such that in the future an additional reduction of the value of the assets or elimination of a reduction recorded in prior periods may be required.
There were no indications of impairment in 2012, 2013, or 2014, except for impairment in one of our cash generating units of approximately $10 million and $40 million, which was recognized as an impairment of property, plant and equipment in 2013 and 2014, respectively. The cash generating unit had no intangible or goodwill assets.
Business Combinations
We are required to allocate the cost of acquiring companies and operations in business combinations on the basis of the estimated fair value of the assets and liabilities acquired. We use the valuations of external independent appraisers and internal valuations for purposes of determining the fair value. The valuations include assessments and estimates of management concerning forecasts of the expected cash flows from the acquired business, and models for calculating the fair value of the acquired items and their depreciation period. Management’s estimates have an impact on the balance of assets and liabilities acquired and the depreciation and amortization in the statement of income. Management’s estimates of the forecasted cash flows and useful lives of the acquired assets may differ from the actual results.
Taxes on Income
The Company and the group companies are subject to income taxes in numerous jurisdictions and, therefore, our management is required to exercise considerable judgment in order to determine the aggregate provision for taxes. A provision in respect of uncertain tax positions is recorded where it is more likely than not that a flow of economic resources will be required in order to discharge the obligation. For information on the assessment issued by the Tax Authorities in Israel, according to which we are to pay additional tax of approximately $200 million, beyond the amount already paid in respect of the years 2009-2011 – see Note 20 to the financial statements. In the estimation of Company Management, based on its legal advisors, the chances that at the end of the appeal process the Company
’
s contentions will be accepted exceed the chances that they will be rejected and, accordingly, no provision for tax has been included in the financial statements as a result of said assessment.
The deferred taxes are computed according to the tax rates expected to apply when the timing differences are realized, as stated in Note 3(O) to our audited financial statements. The tax rate expected to apply upon the realization of the timing differences applying to Benefited Enterprises in Israel entitled to tax benefits is based on forecasts of future revenues to be earned by such Benefited Enterprises in proportion to our total revenues. For additional information about Benefited Enterprises in Israel, see “Item 10. Additional Information—Taxation.” Changes in these assessments could lead to changes in the book value of these tax assets, the tax liabilities and the results of operations.
Inventories
Inventories are measured in the financial statements at the lower of cost or net realizable value. The net realizable value is an estimate of the selling price in the ordinary course of business, less the estimate of the cost of completion and the estimate of the costs needed to effect the sale. The selling price is estimated on the basis of the selling price expected at the time of realization of the inventories. A decrease in the expected selling price could cause a decrease in the book value of the inventories and therefore our results of operations. Raw materials are written down to realizable value, which is based on the realization values of the inventories of the finished products in which they are included, only when the finished products in which they are included are expected to be sold at prices below cost. In cases where the replacement price of raw materials serves as the best available evidence for realizable value, measurement of realizable value is based on the replacement price. A decline in the expected replacement value could give rise to a decline in the value of the inventories of raw materials in the books and our results of operations.
Part of the raw materials, work in process and finished goods are in bulk. The quantities are based on estimates made, for the most part, by third parties who measure the volume and density of the inventory. Variances in the estimates used in determining the assessments may cause a change in the value of the inventory in the books.
Principal Capital Expenditures and Divestitures
We had capital expenditures of approximately $780 million, $947 million and $958 million in 2012, 2013 and 2014, respectively. Our principal capital expenditures since January 1, 2012 have consisted of work on the dike surrounding the evaporation ponds of our Fertilizers segment at the Dead Sea, construction work with respect to a new power station at Sodom, investments as part of a plan to gradually increase the production capacity of the Sodom plans, investments to increase the production capacity of our mines in Europe, improvements in our logistics setup and the purchase and refurbishing of isotanks for transporting bromine. We are financing our capital expenditures from cash flows from operations and from credit facilities.
Our capital expenditures in 2014 are primarily in Israel and Spain, and include elevation of the dike at Pond 5 in the Dead Sea, construction work in respect of the new power plant in Sodom, investments as part of the program to gradually increase our production capacity at the Sodom plants, expansion of our production capacity at the Suria site in Spain, and an investment related to the planning and establishment of one ERP system. We are funding these capital expenditures using cash flows from operations and our credit facilities. As of the date of this Annual Report, there is an agreement between Dead Sea Works and the State of Israel regarding financing of the costs of the dike (the temporary defenses stage) pursuant to which Dead Sea Works will bear 39.5% of the financing and the State of Israel will bear the rest. On July 8, 2012, we entered into an agreement with the government of Israel, relating to a permanent solution for the increase in the level of Pond 5. The permanent solution for the rising of the level of the Dead Sea is by means of full harvesting of the salt from Pond 5. Upon completion of the salt harvesting, the process of production of the raw materials will no longer cause or require raising of the water level of Pond 5. Planning and execution of the salt harvesting will be performed by us. This project will constitute an Israeli national infrastructure project that will be promoted by the Israeli Committee for National Infrastructures and starting January 1, 2017, the water level in Pond 5 will not rise above 15.1 meters. The Board of National Infrastructures is currently discussing the preparation of a detailed plan for the salt harvesting project (National Infrastructure Plan 35A) and its approval is expected in late 2015. Concurrently, we are performing additional activities relating to the salt harvesting project. According to the estimates of the Dead Sea Protection Company, the total cost of the salt harvesting was estimated, as of October 2010, to be in the nominal amount of NIS 7 billion (a discounted amount of NIS 3.8 billion). The Israeli government will bear 20% of the cost of the salt harvesting, however not more than the discounted amount (20% of NIS 3.8 billion – the discounted amount). The government’s maximum liability is linked to the Israeli CPI and bears interest at the rate of 7%. For additional details regarding this agreement – see Note 23 to the Company’s financial statements.
According to our strategy, various possibilities in connection with the continued integration of non-core activities in our Company are examined, and we are preparing to divest activities that are not synergetic with our activities. Accordingly, in the fourth quarter of 2014, we signed agreements to sell the APW (Alumina, Paper, Water) businesses, Rhenoflex, which produces components to reinforce leather shoes, the Anti-Germ businesses, and Medentech. For the most part, these transactions were completed subsequent to the date of the financial statements and produced after-tax cash flows of about $300 million. Additional potential sales of non-core businesses include PCG, Clearon, and IDE. We intend to use these proceeds to reinforce our core businesses.
Sodom Power Plant Construction Contract
On June 28, 2012, Dead Sea Works entered into agreements regarding a project to construct a new dual fuel cogeneration plant in Sodom with a production capacity of 330 tons of steam per hour and approximately 245 megawatts of electricity that will fulfill all the electricity and steam requirements of the production plants at the Sodom site in the upcoming years. The project is expected to be completed in the second half of 2015. The cost of the project is estimated at approximately $320 million.
C. RESEARCH AND DEVELOPMENT, PATENTS AND LICENSES, ETC.
Research and development
In 2014, we significantly expanded our research activities with outside entities in our core areas: agriculture, food, and industrial materials. Also included within these activities are the incubator operations, which focus mainly on technologies in the initial stages of development and are high risk in comparison with ordinary research and development projects. As of the date of this Annual Report, we have 12 projects approved for work, and research work on 8 of these has commenced.
In the first quarter of 2014, the ICL R&D Management Forum was established, headed by the CTO, on whose decisions several cross-segment development teams were established and which work together according to common areas of interest and operations in order to promote the application of new products and technologies. For example, teams have been established on coatings for diverse applications, storage, energy and other applications.
Several of the defined goals of the research and development operations are directed at the expansion of our new products and new technologies portfolio, activities to improve processes in our manufacturing facilities (reducing costs per ton), and cultivating technological human capital.
Our R&D expenses, net were $74 million, $83 million and $87 million in 2012, 2013 and 2014, respectively.
Our Fertilizers segment’s R&D activities in 2014 focused on the following items:
|
|
·
|
Improvement of processes and reduction of costs in the phosphates and potash plants;
|
|
|
·
|
Improvement of the quality of the products being sold;
|
|
|
·
|
Research regarding environmental protection, including development of methods for reducing and treating effluents;
|
|
|
·
|
Analysis of alternative methods for increasing production of carnallite;
|
|
|
·
|
Further analysis of adaptation of various types of phosphate rock to production of phosphoric acid and its downstream products as part of an effort to exploit existing phosphate reserves;
|
|
|
·
|
Development of outside technology for use of bituminous phosphate as a source for production of phosphoric acid and downstream products;
|
|
|
·
|
Development of products having a high acid content allowing diverse applications of soluble fertilizers;
|
|
|
·
|
Development of controlled release products with coating materials of compositions and thicknesses unlike those currently available in the market with the addition of micro nutrients;
|
|
|
·
|
Development of controlled release fertilizers with improved environmental profile;
|
|
|
·
|
Development of applications preserving water and improving availability of the fertilizers around the root;
|
|
|
·
|
Geological examination of our concessions in Spain in order to ascertain whether a significant expansion is possible; and
|
|
|
·
|
Examination of processes for improvement of the production of polysulphate on the Company’s site in the UK.
|
Our Fertilizers segment’s total R&D expenses in 2014 were approximately $22 million.
The R&D activities of our Industrial Products segment are part of the segment’s strategic plan. Therefore, the expenses in the segment’s five year plan are expected to increase in the upcoming years — both due to an internal increase and as a result of cooperative efforts with universities, research institutes and other outside research bodies. The activities will focus primarily on identifying additional uses for bromine or its derivatives, as well as developments in the area of magnesia and phosphorus-based flame retardants.
The R&D activities of our Industrial Products segment are as follows:
Environmental:
|
|
·
|
Brominated polymers: continued development of brominated flame retardants, which are destined to become the generation of environmentally friendly flame retardants, and potential future substitutes of existing products such as DECA and FR 1410. Due to the size (and molecular weight) of polymer molecules, it is unlikely that they will penetrate oily body tissue and remain there.
|
|
|
·
|
Textiles: continued development of TexFRon, a series of textile flame retardant products. TexFRon is an effective and environmentally friendly solution for diverse textile products, replacing DECA and offering a transparent and laundry durable solution that is not currently available on the market. We commenced selling the product in 2012.
|
|
|
·
|
Energy storage: continued development of bromine based solutions for storing energy using diverse technologies.
|
|
|
·
|
Ecological research to improve sewage treatment systems, and to reduce air emissions and solid waste.
|
New Products:
|
|
·
|
Biocides: continued development of new materials for water treatment and prevention of biofilm (algae) in irrigation systems and refrigerated water for industry. In addition, there is research activity for polymer synthesis with biocidal activity, as well as an examination of meat disinfection applications.
|
|
|
·
|
Phosphorus based products: development of new phosphorus based products and/or integration of phosphorus/bromine chemistry mainly flame-retardants in the polyurethane field (i.e., flexible and rigid foam). A common application of polyurethane flame retardants is insulation used in the construction, furniture and automobile industries. In addition, new lubricating oils have been developed.
|
|
|
·
|
Improvement of the formulation of a soil disinfectant product including preliminary toxicological testing.
|
Other processes:
|
|
·
|
Support of production: improving product quality and lowering production costs by changing and improving processes, while using the principles of green chemistry (for example, research on the reduction of use of organic solvents in production processes). There is extensive use of a “sustainability index” model for new products, which includes various parameters relating to product properties.
|
|
|
·
|
Engineering: research in the area of building materials in order to overcome problems of accelerated wear and tear of building materials, corrosion prevention, equipment adaptation, and experiments in accelerated aging.
|
Our Industrial Products segment’s total R&D expenses in 2014 were approximately $30 million.
The principal R&D activities of our Performance Products segment in 2014 were as follows:
Advanced Additives - Phosphoric acid varieties and its downstream products, phosphate salt specialties:
|
|
·
|
Process development for improving competitiveness as a global supplier for phosphoric acid specialties;
|
|
|
·
|
Flame retardants based on phosphate salts for the automotive industry and for paints & coatings;
|
Food Specialties - Development of innovative formulations for modifying texture and stability of processed food:
|
|
·
|
Investigation of properties of vegetable and milk proteins as components for complex formulations, providing a tool box for modifying texture and stability of food products;
|
|
|
·
|
Development of novel products by exploiting synergies between food phosphates, proteins, starches and fibers;
|
|
|
·
|
Continued development uses of low sodium salts based on raw materials from the Dead Sea.
|
Other activities:
|
|
·
|
Environmentally friendly corrosion inhibitors for industrial boilers potentially replacing toxic hydrazine;
|
Our Performance Products segment’s total R&D expenses in 2014 were approximately $21 million.
In the past, some of our Israeli subsidiaries received grants from the Office of the Chief Scientist in the Israeli Ministry of the Economy (“OCS”) under the Law for the Encouragement of Industrial Research and Development, 1984, and the regulations promulgated thereunder (“the R&D Law”). In general, the grants are required to be repaid in the form of royalties on the revenues, if any, generated by the funded projects, plus interest. Our remaining financial obligations under the grants are minimal. According to the R&D Law, the transfer of OCS funded know how is subject to OCS approval and to possible payments to the OCS in the event of transfer of the know how outside of Israel.
Intellectual property
We believe that protecting our intellectual property is one of the methods of protecting and developing our business activities.
Our Fertilizers segment has 13 groups of patents, mostly related to derivatives of the Osmocote brand, for specific soluble fertilizers, production technology of coatings (P1, P2), and for applications of controlled fertilizer compounds and plant protection products.
Industrial Products has 264 patents that have been registered over the years and approximately 182 patent applications that are in various stages of review around the world. As at the date of this Annual Report, these patents protect a relatively small portion of our Industrial Products segment products. In 2014, 47 new patent applications filed by our Industrial Products segment were approved.
Our Performance Products segment has, in various countries, approximately 1,466 registered trademarks and approximately 542 registered patents.
We do not believe that the expiration of any patent or violation by any of our entities would have a material effect on our operations or our financial results.
D. TREND INFORMATION
Trend information is included throughout the other sections of this Item 5. In addition, we expect our operating results to continue to fluctuate in future quarters. Specific material drivers of these trends are identified in the discussion above with respect to the years ended December 31, 2012, 2013 and 2014. Seasonality of our business is included in Item 4. Information on the Company—B. Business Overview.
E. OFF-BALANCE SHEET ARRANGEMENTS
As of December 31, 2014, we had no off-balance sheet arrangements.
F. TABULAR DISCLOSURE OF CONTRACTUAL OBLIGATIONS
The following table presents information related to our contractual obligations, including estimated interest payments, as of December 31, 2014.
|
As at December 31, 2014
|
||||||||||||||||||||
|
Total
amount
|
12 months
or less
|
1-2
years
|
3-5
years
|
More than
5 years
|
||||||||||||||||
|
US$ millions
|
||||||||||||||||||||
|
Credit from banks and others
(not including current maturities)
|
402.4 | 406.6 | – | – | – | |||||||||||||||
|
Trade payables
|
584.9 | 584.9 | – | – | – | |||||||||||||||
|
Other payables
|
519.9 | 519.9 | – | – | – | |||||||||||||||
|
Operating lease obligations
|
149.4 | 28.7 | 21.7 | 49.1 | 49.9 | |||||||||||||||
|
Purchase obligations(1)
|
1,222.8 | 573.5 | 263.6 | 336.4 | 49.3 | |||||||||||||||
|
Non-convertible debentures
(including current maturities and interest on debentures)
|
1,131.2 | 120.6 | 49.7 | 149.2 | 1,317.2 | |||||||||||||||
|
Long-term bank loans
(including current maturities and interest on long-term loans)
|
1,372.8 | 162.6 | 759.0 | 292.1 | 286.5 | |||||||||||||||
|
Total
|
5,383.4 | 2,396.8 | 1,094.0 | 826.8 | 1,702.9 | |||||||||||||||
|
(1)
|
This information excludes ordinary course agreements for purchases within the next twelve months.
|
|
As at December 31, 2014
|
||||||||||||||||||||
|
Total
amount
|
12 months
or less
|
1-2
years
|
3-5
years
|
More than
5 years
|
||||||||||||||||
|
US$ millions
|
||||||||||||||||||||
|
Financial liabilities – derivative instruments utilized for economic hedging
|
||||||||||||||||||||
|
Interest rate swaps and options
|
9.5 | 0.2 | 1.6 | 2.8 | 4.9 | |||||||||||||||
|
Foreign exchange derivatives
|
71.9 | 63.0 | 0.4 | 1.1 | 7.4 | |||||||||||||||
|
Derivative instruments on energy and marine transport
|
28.3 | 26.6 | 1.7 | – | – | |||||||||||||||
| 109.7 | 89.8 | 3.7 | 3.9 | 12.3 | ||||||||||||||||
G. SAFE HARBOR
The safe harbor provided in Section 27A of the Securities Act of 1933, as amended, and Section 21E of the Exchange Act, or the statutory safe harbors, shall apply to forward looking information provided pursuant to “—F. Tabular disclosure of contractual obligations” above. For our cautionary statement on the forward-looking statements in this Annual Report, see paragraph on forward-looking information, on page 2 of this Annual Report.
A. DIRECTORS AND OFFICERS
The following table lists the names and ages of our directors as at the publication date of this Annual Report. The address for our directors is c/o Israel Chemicals Ltd., 23 Aranha Street, Millennium Tower, Tel Aviv, 61070, Israel.
|
Name
|
Age
|
Position
|
|
Nir Gilad
|
58
|
Chairman of the Board of Directors
|
|
Yaacov Dior
|
71
|
External Director
|
|
Ovadia Eli
|
70
|
Director
|
|
Dr. Miriam Haran
|
65
|
External Director
|
|
Victor Medina
|
76
|
Director
|
|
Prof. Yair Orgler
|
75
|
External Director
|
|
Avisar Paz
|
58
|
Director
|
|
Eran Sarig
|
41
|
Director
|
|
Aviad Kaufman
|
44
|
Director
|
|
Geoffery Merszei
|
64
|
Director
|
|
Shimon Eckhaus
|
64
|
Director
|
|
Stefan Borgas
|
50
|
Director
|
All of our directors are independent directors under the rules applicable to U.S. companies listed on the NYSE, except for Messrs. Nir Gilad, Avisar Paz, Eran Sarig, Ovadia Eli, Aviad Kaufman and Stefan Borgas by virtue of the positions they hold with our controlling shareholder or in the Company. These directors are not considered independent directors also under Israeli law due to a relationship with our controlling shareholder. Three of our directors are “external directors” and one additional director was designated as an “independent director” under the Israeli Companies Law, 1999 (the “Companies Law”) as described under “Item 6. Directors, Senior Management and Employees—C. Board Practices—External Directors”.
The following table lists the names, ages and positions of our officers as of the publication date of this report. The address for sending notices is c/o Israel Chemicals Ltd., 23 Aranha Street, Millennium Tower, Tel Aviv, 61070, Israel.
|
Name
|
Age
|
Position
|
|
Stefan Borgas
|
50
|
Chief Executive Officer
|
|
Avi Doitchman*
|
53
|
Executive Vice President, Chief Financial Officer & Strategy
|
|
Nissim Adar
|
63
|
Chief Executive Officer of our Fertilizers segment
|
|
Eli Amit**
|
60
|
Senior Vice President of Economics
|
|
Herzel Bar Niv
|
65
|
Vice President of International Taxation
|
|
Amir Benita
|
41
|
Vice President
|
|
Shmuel Daniel***
|
63
|
Internal Auditor
|
|
Dan (Dani) Chen
|
63
|
Executive Vice President Corporate Relations
|
|
Israel Dreyfuss
|
34
|
Controller
|
|
Eyal Ginzberg
|
52
|
Senior Vice President, Chief Technology Officer
|
|
Asher Grinbaum
|
65
|
Executive Vice President & Chief Operating Officer
|
|
Michael Hazzan
|
49
|
Vice President of Finance
|
|
Lisa Haimovitz
|
49
|
Vice President, General Counsel and Corporate Secretary
|
|
Hezi Israel
|
47
|
Vice President of Business Development and Strategy
|
|
Ofer Lifshitz
|
56
|
Senior Vice President for Global Processes
|
|
Yakir Menashe
|
43
|
Senior Vice President of Global Human Resources
|
|
Mark Volmer
|
51
|
Chief Executive Officer of our Performance Products segment
|
|
Charles M. Weidhas
|
56
|
Chief Executive Officer of our Industrial Products segment
|
|
Ronnie Shushan
|
47
|
Senior Vice President for Investments and Project Management
|
_______________
|
*
|
On October 27, 2014, Avi Doitchman gave notice of his wish to retire from his position. He will retire on April 1, 2015 and on the same day, Mr. Kobi Altman will commence serving as Executive Vice President and CFO.
|
|
**
|
On November 11, 2014, Eli Amit gave notice of his wish to retire from his position in 2016.
|
|
***
|
On July 31, 2014, Shlomo Ben Shimol ceased serving as the Internal Auditor, and on August 1, 2014, Shmuel Daniel commenced serving as the Internal Auditor.
|
Nir Gilad
.
Mr. Gilad has served as Chairman of our Board of Directors since January 2008. He serves as a director in Oil Refineries Ltd. Mr. Gilad has served as President and
CEO
of Israel Corporation until January 7, 2015.
He also served as Deputy CEO for Business Development and Strategy.
He also served as Chairman of the Boards of Directors of
ZIM Integrated Shipping Services LTD ,IC Power Israel Ltd., IC Green Energy Ltd., and
H.L. Management and Consulting (1986) Ltd. Mr. Gilad served as a
Director
in companies fully owned by Israel Corporation,
Director
in Tower Semiconductor Ltd. and Qoros Automotive Co. Ltd. (formerly known as Chery Quantum Auto Co. Ltd. 2007) Ltd.
Prior to joining Israel Corp., Mr. Gilad was Senior Vice President of Migdal Insurance Company, CEO of Migdal Investment Management Ltd. and Chairman of Migdal Capital Markets Ltd. During his term of office as Accountant General of the Ministry of Finance and the deputy Head of the Budget Division of the Ministry of Finance, Mr. Gilad played a role in the negotiations towards the peace accords with Jordan and the Palestinian authority. He also served as the CFO of the Israeli Aircraft Industries. He was responsible for the initiation and direction of strategic programs for the Government of Israel, aimed at improving Israel’s Negev and Galilee regions. Mr. Gilad is active in Yedidei Atidim Association, a non-profit organization that integrates peripheral populations into the higher education system. Mr. Gilad is a member of the Executive Committee of the “South” and “North”, private companies for public benefit (non-profit), established by Israeli and Jewish entrepreneurs and philanthropists in order to lead national strategic planning programs to the Negev and the Galilee. Mr. Gilad holds an MA in Business Administration from Bar Ilan University, and a BA in Economics, Agricultural Administration and Natural Sciences from the Hebrew University, Jerusalem. Mr. Gilad is a Lieutenant Colonel in the IDF reserves.
Yaacov Dior
. Mr. Dior has served as external director since October 2011. Mr. Dior is an External Director of Clal Insurance Holdings Ltd. and served as Chairman of the Board of Directors of Cellarix Mobile Payments Ltd., Chief Executive Officer of IDT Carmel LTD and Chairman of the Board of Kneh Hakol Ltd. Mr. Dior is a Member of Friends of Bar-Ilan University and Chairman of the Audit Committee of Bar-Ilan University. In addition, Mr. Dior is a Member of the Public Committee of Alut—the National Association for Autistic Children and a Member of the Association of Friends of Meir Hospital. Mr. Dior holds a B.A. in Economics and Political Science from the Hebrew University of Jerusalem and an MBA from Tel Aviv University.
Ovadia Eli
.
Mr. Eli has served as a director since August 2011. Mr. Eli has served as Chairman of the Board of the Israel Airports Authority, Shmanim Basisiim Haifa Ltd. and I.C.P.I. He was a member of the Boards of Directors of Salt Industries Israel Ltd., Shaarei Ribit, Ltd., Zim Integrated Shipping Services Ltd., OPC Rotem Ltd. and is a member of the Board of Directors of Adriel Israel Properties Ltd. Mr. Eli serves as Chairman of Oil Refineries Ltd. as of February 2015. Mr. Eli holds a BA in Educational Counseling and Bible Studies from the University of Haifa and is a graduate of the Lifshitz Teachers Academy, Jerusalem.
Dr. Miriam Haran
. Dr. Haran has served as external director since September 2009. Dr. Haran has served as Director General of Israel’s Ministry of the Environment. Dr. Haran serves as the head of Ono Academic College’s MBA Program in Environmental Management, is a Board member in M.A.I (recycling electrical and electronic waste), a consultant for Ashkelon Eilat Pipeline Ltd. and has served as a Board member of the Company for Environmental Services (2008-2012). and as Chairman of the Consumer Council (2012-2014). Dr. Haran holds a PhD in Organic Chemistry from Brandeis University and a B.Sc. in Natural Sciences from the Hebrew University of Jerusalem.
Victor Medina
. Mr. Medina has served as a director since September 2006. Mr. Medina has served as Chief Executive Officer of United Mizrahi Bank Ltd. Between 1990 and 1995, he served as Chairman of our Board of Directors. He previously served as Director General of the Israeli Ministry of Finance. He has held senior positions in the Bank of Israel. Mr. Medina serves as Chairman of the Board of Aptateck Ltd. and served as Chairman of the Board of Directors of Migdal Capital Markets. Mr. Medina holds a BA in Economics and Political Sciences and an MA in Economics, majoring in Finance and Banking, from the Hebrew University of Jerusalem.
Prof. Yair Orgler
. Prof. Orgler has served as external director since September 2006. Prof. Orgler has served as Professor of Finance and Banking, Dean of the Faculty of Management and Vice Rector of Tel Aviv University. He has published and edited ten books in his areas of specialization as well as dozens of scientific and professional articles. He served as the Chairman of the Board of the TASE. Prof. Orgler founded and served as an active Chairman of Maalot Israel first Securities Rating Company Ltd. He has served and serves as director of various additional public companies. Prof. Orgler is Chairman of the Finance and Audit Committee of the Israel Cancer Association and Professor Emeritus at Tel Aviv University. Prof. Orgler served as an outside director Itamar Medical Ltd. (2007-2013). He is an outside director in Gazit Globe Ltd. and Ceragon Networks Ltd. and a director in Atidim High Tech Industrial Park Ltd. Prof. Orgler is a member of the Board of Trustees of the Academic College of Tel Aviv Yaffo, member of the management committee of Secure Future and the Association of Public Companies and member of the Friends of the Reut Medical Center. Prof. Orgler holds a B.Sc. in Industrial Engineering and Management from the Technion Israel Institute of Technology in Haifa, an M.Sc. in Industrial Engineering from the University of Southern California (USC) and a Ph.D. in Industrial Administration from Carnegie Mellon University, Pittsburgh.
Avisar Paz
. Mr. Paz has served as a director since April 2001. Mr. Paz served as the Chief Financial Officer of Israel Corporation and as of January 7, 2015, serves as Chief Executive Officer of Israel Corporation. He serves as a director of various subsidiaries of Israel Corporation. He serves as a director of Oil Refineries Ltd. Mr. Paz holds a BA in Economics and Accounting from Tel Aviv University and is a certified public accountant in Israel.
Eran Sarig
. Mr. Sarig has served as a director since October 2010. Mr. Sarig serves as Executive Vice President of Business Development and Strategy of Israel Corporation. He serves as a director of Oil Refineries Ltd. He holds an LLB from Tel Aviv University School of Law, LLM from Duke University School of Law and MBA from the Herzliya Interdisciplinary Center.
Aviad Kaufman
. Mr. Kaufman has served as a director since March 2014. He is the Chief Financial Officer of Quantum Pacific (UK) LLP, part of the Quantum Pacific Group, which is related to Mr. Idan Ofer, a position he has held since 2008. He is also a board member of Israel Corporation. Mr. Kaufman is a certified public accountant and holds a BA in Accounting and Economics from the Hebrew University in Jerusalem (with distinction), and a MBA majoring in Finance from Tel Aviv University.
Geoffrey Merszei
. Mr. Merszei was appointed director on February 26, 2015. Mr. Merszei serves as the Chairman of the Board of Zolentis AG, Switzerland. From 1977 to 2001 and from 2005 to 2013, Mr. Merszei served in a number of positions at The Dow Chemical Company, including as its Executive Vice President (2005 to 2012) and Chief Financial Officer (2005 to 2009) and as the CEO and Chairman of the Board of Dow Europe, Middle East and Africa (2009 to 2012). Mr. Merszei also served as a director of Dow Corning Corporation (2005 to 2010) and of the Chemical Financial Corporation and Chemical Bank (2006 to 2010). Mr. Merszei previously served as an executive committee member of the European Chemical Industry Council (CEFIC) (2009 to 2012). Mr. Merszei holds a BA in Economics from Albion College, Michigan, U.S.A.
Shimon Eckhaus
. Mr. Eckhaus was appointed director on February 26, 2015. Mr. Eckhaus serves as the President of Worldwide Integrated Network Ltd. Mr. Eckhaus also serves on the board of directors of Orbit Technologies Ltd. and AqWise Ltd. He also serves as a strategic and marketing advisor to a number of private and public companies. From 2009 to 2011, Mr. Eckhaus served as the Chairman of the Board of Starling Advanced Communications Ltd. and as a member of the board of directors of Israel Electric Company Ltd. and O.D.F Optronics Ltd. Mr. Eckhaus holds a B.Sc. in Materials and Process Engineering, including a specialization in Nuclear Engineering, and an M.Sc. in Materials and Processing Engineering, both from Ben Gurion University of the Negev, in Beer-Sheva.
Stefan Borgas
. Mr. Borgas has served in his current position since September 2012. On February 26, 2015, he was appointed director of the Company. Mr. Borgas previously served as Chief Executive Officer of Lonza Group (2004 to 2012) and is a director at Syngenta Group. Mr. Borgas is a member of the Board of the Israeli-German Chamber of Commerce and serves on the Board of Directors of IFA, the International Fertilizers Association. He holds a BA in Business Administration from the University of Saarbrucken (Germany) and an MBA from the University of St. Gallen (Switzerland).
Avi Doitchman
. Mr. Doitchman has served in his current position since February 2000. He is a director of Rotem Amfert Negev Ltd., Dead Sea Works Ltd., Dead Sea Bromine Company Ltd., Bromine Compounds Ltd., IDE Technologies Ltd., ICL Fine Chemicals Ltd., Ferson Chemicals Ltd. and PAMA (Energy Resources Development) Ltd. and is a member of the Executive Committee of the Public Companies Association. Mr. Doitchman holds a BA in Economics and Accounting from Bar-Ilan University. He is a certified public accountant in Israel.
Nissim Adar
. Mr. Adar has served in his current position since October 2013. Mr. Adar previously served as Chief Executive Officer of our Industrial Products segment (2008 to October 2013). Mr. Adar holds a BA in Chemical Engineering and MBA in Industrial Management from Ben Gurion University of the Negev.
Eli Amit
. Mr. Amit has served in his current position since January 2002. He is a director at Dead Sea Works Ltd., Rotem Amfert Negev Ltd., Dead Sea Bromine Company Ltd. and Bromine Compounds Ltd. Mr. Amit holds a BA in Economics and Philosophy and an MBA from Tel Aviv University, as well as an MA in Economics from Northwestern University.
Herzel Bar Niv
. Mr. Bar Niv has served in his current position since January 2008. Mr. Bar Niv has served as the Controller of the Company, and as the chairman of the audit committee at Makefet Fund. Mr. Bar Niv holds a BA in Economics and Accounting from Bar-Ilan University. He is a certified public accountant in Israel.
Amir Benita
. Mr. Benita serves since 2012 as Vice President and is the manager of the ICL Harmonization Project. Mr. Benita has served as controller of the Company and as senior lecturer in accounting studies at the College of Management. He serves as a director of Dead Sea Magnesium Ltd. Mr. Benita holds a BA in Business Management and Accounting from the College of Management and is a certified public accountant in Israel.
Shmuel Daniel
. Mr. Daniel has served in his current position since August 2014. Mr. Daniel previously served as Chief Financial Officer of our Industrial Products segment (2011 to 2014). He holds a BA in Economy and Statistics, and Accounting and an MA in Industrial Management from Ben Gurion University. He is a certified public accountant in Israel.
Dan (Dani) Chen
. Mr. Chen has served in his current position since October 2013. Mr. Chen was Chief Executive Officer of our Fertilizers segment until October 2013. He holds a BA in Electrical Engineering from the Technion Israel Institute of Technology in Haifa and an MA in Industrial Management from Ben Gurion University of the Negev.
Israel Dreyfuss
.
Mr. Dreyfuss has served in his current position since June 2012. Mr. Dreyfuss has served as an accountant with Phoenix Insurance Company, and worked as an accountant in the Corporate Department of the Israel Securities Authority. He has also been a lecturer at the Hebrew University. Mr. Dreyfuss holds a BA in Accounting and Law and an MBA from the Hebrew University of Jerusalem. He is a certified public accountant and is a member of the Israel Bar
.
Eyal Ginzberg
.
Mr. Ginzberg has served in his current role since June 2013. Mr. Ginzberg has served as Chief Executive Officer of Tami IMI R&D Institute, as well as the Chief Executive Officer of Fertilizers & Chemicals Ltd. Mr. Ginzberg holds a BA in Chemical Engineering from Ben Gurion University of the Negev.
Asher Grinbaum
.
Mr. Grinbaum has served in his current position since January 2008. He is as a director at Dead Sea Works Ltd., Rotem Amfert Negev Ltd., Dead Sea Bromine Company Ltd. and Bromine Compounds Ltd. – subsidiaries of the Company. He is chairman of the management committee of Beersheba Theatre and a member of the management committee of the non-profit “To See” Association. He was a member of the management committee of Israel Chemical Society
.
He holds a BA in Mechanical Engineering and an MBA in Business Management, both from Ben Gurion University of the Negev.
Michael Hazzan
.
Mr. Hazzan has served in his current position since March 2012. Mr. Hazzan served as the Finance Manager of the Company. He is a director of Ferson Chemical Materials Ltd., ICL Fine Chemicals Ltd. and IDE Technologies Ltd.-subsidiaries of the Company. Mr. Hazzan holds a BA in Economics from Tel Aviv University and an MA in Economics from Bar llan University.
Lisa Haimovitz
.
Ms. Haimovitz has served in her current position since May 2009. Ms. Haimovitz has also served as the Vice President for Strategy in the Delek Group and has served in a number of positions in the Israel Securities Authority. She holds an LLB and an MBA from Tel Aviv University and is a member of the Israel Bar.
Hezi Israel
.
Mr. Israel has served in his current position since March 2012. Mr. Israel has served as Vice President of Strategy and Business Development for the Company’s Industrial Products segment. He holds an MBA majoring in Finance and a BA in Economics and Political Science from Tel Aviv University.
Ofer Lifshitz.
Mr. Lifshitz has served in his current role since June 2013. Mr. Lifshitz serves also as the ICL Integration Manager.
Mr. Lifshitz previously served as our Industrial Products segment’s Executive Vice President (2008 to 2013). Mr. Lifshitz holds a BA in Economics and MBA in Industrial Management from Ben Gurion University of the Negev.
Yakir Menashe
.
Mr. Menashe has served in his current position since March 2013. Mr. Menashe has served as a Vice President of Regulatory Affairs and Assistant to the Chief Executive Officer of the Company. Mr. Menashe holds an LLB in Law from the College of Management. He is a member of the Israel Bar
.
Ronnie Shushan
.
Mr. Shushan has served in his current position since May 2014. Mr. Shushan previously served as CEO ICL Fertilizers Europe (2012 to 2014) and Senior Vice President of Finance and Economics (CFO) ICL Fertilizers (2008 to 2012). Mr. Shushan is a certified public accountant in Israel and holds a BA in Economics and Accounting from Ben Gurion University of the Negev.
Mark Volmer
.
Mr. Volmer has served in his current position since November 2013. Mr. Volmer has served as a business manager with BASF, heading its Construction Chemicals business in Asia Pacific. Mr. Volmer holds an M.Sc. in Chemistry from Vrije University and an MBA from the School of Management, Erasmus University, Rotterdam
.
Charles M. Weidhas
. Mr. Weidhas has served in his current position since October 2013 and is currently Chairman of Tami IMI R&D Institute. He previously served as the Chief Executive Officer of our Performance Products segment (2007 to 2013) and had prior management positions with Monsanto and Solutia. Mr. Weidhas holds a B.Sc. in Chemical Engineering and an MBA from Northeastern University.
Family Relationships
There are no family relationships between any members of our executive management and our directors.
Arrangements for Election of Directors and Members of Management
There are no arrangements or understandings with major shareholders, customers, suppliers or others pursuant to which any of our executive management or our directors were selected.
B. COMPENSATION
External directors compensation is subject to regulations promulgated under the Companies Law (“Compensation Regulations”). These regulations permit the payment of cash compensation within a specified range, depending on the size of the company, or cash and/or equity compensation that is consistent with the relative compensation paid to other directors who are not controlling shareholders and are not employed by the Company or by the controlling shareholder and companies under its control. Until February 26, 2015, all the directors in the Company (excluding directors employed by the controlling shareholder), were entitled to receive cash compensation in the maximum amount set for our external directors in the Compensation Regulations. In 2014, this amount for each director designated “expert director” was approximately NIS 148,575 (currently equivalent to approximately $37,000) per year and NIS 5,715 (currently equivalent to approximately $1,453) per meeting, and for directors not designated “expert director”, approximately NIS 111,345 (currently equivalent to approximately $28,310) per year and NIS 4,285 (currently equivalent to approximately $1,090) per meeting, which amounted to an aggregate amount of approximately $675,000 paid to our Board members in that year. Directors who are employees of Israel Corporation do not receive additional cash compensation for their services as directors. Instead, those fees are included in the annual management fees we pay to Israel Corporation. On January 25, 2015 and on January 26, 2015 the Compensation and Human Resources Committee and the Board of Directors, respectively, approved, and on February 26, 2015 the General Meeting of Shareholders approved that the cash compensation to be paid to each of the directors (excluding directors who are employees of Israel Corp. and excluding directors who are Company employees, including Mr. Stefan Borgas)
,
shall include a fixed annual amount of NIS 200,000 (currently equivalent to approximately $50,850), and that the compensation for attending meetings shall be paid at the lowest possible amount permitted in the Compensation Regulations for external directors of companies of the Company’s size. This amount currently stands at NIS 3,205 (currently equivalent to approximately $815) per meeting for “expert directors” (directors whom the Company’s Board of Directors has defined as directors with knowledge and expertise in finance or in the business in which the Company operates) and at NIS 2,410 (currently equivalent to approximately $613) for directors not designated “expert directors”. However, such reduced attendance compensation amounts shall be paid from August 29, 2015 and until that date the Company shall continue paying attendance compensation according to the maximum amount provided in the Compensation Regulations. In addition, the Compensation and Human Resources Committee, the Board of Directors and the General Meeting of Shareholders approved, on the said dates, an allocation of 9,078 restricted shares to each Company director (excluding the Company’s CEO, Mr. Stefan Borgas), for no consideration, in accordance with the Company’s Equity Compensation Plan (2014), as specified in “—E. Share Ownership The 2014 Equity Compensation Plan”. It should be noted that the Compensation and Human Resources Committee, the Board of Directors and the General Meeting of Shareholders approved that the directors who are employed by Israel Corporation and Mr. Aviad Kaufman may transfer restricted shares as aforementioned, to the Israel Corporation and to Millennium Investments Elad Ltd., respectively.
The aggregate compensation paid to all of the members of our senior management (including the officers listed in the table below) was approximately $13 million in 2014. The following table and accompanying footnotes describe the compensations given in 2014 to the five highest earning senior officers in the Company and its subsidiaries.
|
Details of the Recipient
|
Payments for services
|
||||||||||||||||||||||||||||
|
Name
|
Position
|
Scope of position
|
Holding in equity
|
Salary
|
Compensation (1)
|
Bonus (2)
|
Share based payment
|
Total
|
|||||||||||||||||||||
|
US$ thousands
|
|||||||||||||||||||||||||||||
|
Stefan
Borgas (3)
|
Chief Executive Officer
|
100 | % | * | 1,005 | 1,419 | 1,125 | 1,195 | (8) | 3,739 | |||||||||||||||||||
|
Charles Weidhas (4)
|
Chief Executive Officer, Industrial Products
|
100 | % | * | 392 | 529 | 255 | 376 | (9) | 1,160 | |||||||||||||||||||
|
Asher Grinbaum (5)
|
Executive Vice President and COO
|
100 | % | * | 461 | 663 | 390 | 376 | (10) | 1,429 | |||||||||||||||||||
|
Dani Chen (6)
|
Executive Vice President-Corporate Relations
|
100 | % | * | 392 | 593 | 285 | 376 | (11) | 1,254 | |||||||||||||||||||
|
Nissim Adar (7)
|
Chief Executive Officer, ICL Fertilizers
|
100 | % | * | 392 | 584 | 391 | 376 | (12) | 1,351 | |||||||||||||||||||
________________
|
*
|
Less than 1%
|
|
(1)
|
The salary component set out in the above table includes all of the following components: monthly salary, social benefits, customary social and related provisions, company car, rent and reimbursement of telephone expenses.
|
|
(2)
|
The bonus that appears in the above table represents the bonus with respect to 2014, which was set in accordance with the provisions in our Compensation Policy and the officers’ bonus plan that was approved by the Compensation and Human Resources Committee, Board of Directors and General Meeting of Shareholders in August 2013, as amended with the approval of the General Meeting of Shareholders on December 2014.
|
|
(3)
|
Mr. Stefan Borgas has served as our Chief Executive Officer since September 20, 2012. Mr. Borgas’ employment agreement is for an unlimited period and may be terminated by either party at any time. His monthly salary, as of December 31, 2014, is approximately $83,333. Stefan Borgas’ salary is paid in NIS at the representative exchange rate on the date of payment. In addition to his monthly salary, Mr. Borgas is entitled to a monthly participation for the cost of a residence. In addition, Mr. Borgas is entitled to coverage for the cost of airplane tickets for two annual vacations in Europe for himself and for his family, as well as participation in his medical insurance. With respect to severance, other than in cases where the right to compensation is revoked under Israeli law, Mr. Borgas is entitled to a notice period equivalent to 6 months’ salary if his resignation is at his request, and equivalent to 12 months’ salary if his resignation is initiated by the Company. In addition to the amounts provided regularly for pension and compensation, the severance compensation for Mr. Borgas will be calculated and paid based on the seniority he accumulates in our Company and on the basis of his last monthly salary multiplied by the number of years he is employed by us.
|
|
(4)
|
Mr. Charles Weidhas serves as CEO of ICL Industrial Products as of 1 October 2013. Mr. Weidhas’ employment agreement is for an unlimited period and may be terminated by either party at any time by written notification. Mr. Weidhas is entitled to a notice period of 6 months each and is entitled to life insurance and health insurance for himself and his family. For a period of 5 years, Mr. Weidhas is entitled to coverage for the cost of airplane tickets for two annual visits to the United States for himself and his wife. Mr. Weidhas’ monthly salary as of December 31, 2014 is approximately NIS 117,056. His employment agreement states that his salary will be updated twice a year according to the rise in the CPI in the months that passed since the last update. Mr. Weidhas is also entitled to maintain the net amount in respect of all payments made to him as would be obtained in the United States (tax equalization). In addition to the amount provided regularly to the pension fund and/or to the managers insurance, Mr. Weidhas is entitled to severance payment equal to his last salary multiplied by the number of years he serves as Chief Executive Officer of our Industrial Products segment.
|
|
(5)
|
Mr. Asher Grinbaum serves as Executive Vice President and Chief Operating Officer. The 1994 employment contract with Mr. Grinbaum, as amended to date, states that Mr. Grinbaum’s salary will be updated twice a year according to the rise in the CPI in the months that passed since the last update. The employment contract is not limited in time and will remain in force until it is ended by one of the parties by means of providing prior written notification. Mr. Grinbaum is entitled to a notice period of 6 months. According to the employment contract and the salary updates, as decided by our Board of Directors from time to time, Mr. Grinbaum’s salary as of December 31, 2014 was approximately NIS 137,774. In addition Mr. Grinbaum is entitled, beyond the current provisions for pension benefits and/or managers’ insurance, to additional severance pay equal to his last salary times multiplied by the years of his service with us.
|
|
(6)
|
Mr. Dan (Dani) Chen serves as Executive Vice President for our Corporate Relations department since October 1, 2013. The 1978 employment contract with Mr. Chen, as amended to date, states that Mr. Chen’s salary will be updated twice a year according to the rise in the CPI in the months that passed since the last update. The employment contract is not limited in time and will be in force until it is ended by one of the parties giving prior written notification. Mr. Chen is entitled to a notice period of 6 months. According to the employment contract and the salary updates, as decided by our Board of Directors from time to time, Mr. Chen’s salary as of December 31, 2014 is approximately NIS 117,056. In addition, Mr. Chen is entitled, beyond the current provisions for pension funds and/or managers’ insurance, to severance pay in the amount of his last salary multiplied by the number of years of his service as CEO of ICL Fertilizers and as Executive Vice President Corporate Relations.
|
|
(7)
|
Mr. Nissim Adar serves as Chief Executive Officer of our Fertilizers segment since October 1, 2013. The 2002 employment contract with Mr. Adar as amended to date, states that Mr. Adar’s salary will be updated twice a year according to the rise in the CPI in the months that passed since the last update. The employment contract is not limited in time and will be in force until it is ended by one of the parties giving prior written notification. Mr. Adar is entitled to a notice period of 6 months. According to the employment contract and the salary updates, as decided by decisions of our Board of Directors from time to time, Mr. Adar’s salary as of December 31, 2014 is about NIS 117,056. In addition, Mr. Adar is entitled, beyond the current provisions for pension benefits and/or managers’ insurance, to severance pay equal to the amount of his last salary multiplied by the number of years of his service as CEO of ICL Industrial Products and as CEO of ICL Fertilizers.
|
|
(8)
|
On November 26, 2012, an allotment of 1,190,000 non-negotiable options, for no consideration, was approved for Mr. Stefan Borgas under our 2012 Option Plan. On December 30, 2012, the options were assigned to a trustee in Mr. Borgas’ favor. The options are exercisable into our ordinary shares at an exercise price of NIS 46.6 (subject to adjustments) and will vest in three equal portions beginning on November 26, 2013, 2014 and 2015. The expiration date for the options vesting within the first and second portions is upon the lapse of 48 months from the date of allocation, and the expiration date for the options vesting within the third portion is upon the lapse of 60 months of the date of allocation. The weighted financial value of each option, on the date of approval, was NIS 11.9 for the first and second portions, and NIS 12.7 for the third portion. For additional information, see “E. Share Ownership -The 2012 Option Plan”. The amount appearing in the table reflects the aggregate expenditure recorded by us in 2014 with regard to the allocation of options to Mr. Borgas, based on generally accepted accounting principles. The exercise price for converting the options into shares as of March 15, 2015, is NIS 41.52, this price is 46.7% higher than the last share price on this date (meaning, these options are “out of the money”). Yet the table above includes an amount which is 27.4% of the value of all the options allocated to Mr. Borgas (due to generally accepted accounting principles). |
On August 4, 2014 and August 6, 2014 the Compensation and Human Resources Committee and the Board of Directors, respectively, approved, and on December 11, 2014 the General Meeting of Shareholders approved an allocation of 367,294 non-negotiable options for no consideration to Mr. Stefan Borgas, as well as 85,907 restricted shares, under our 2014 Equity Compensation Plan. On December 11, 2014 the options and restricted shares were allocated to a trustee in Mr.
Borgas’ favor. The options are exercisable into Company shares at an exercise price of NIS 28.71 (subject to adjustments). The options and restricted shares will vest in three equal portions as follows: one third upon the lapse of 24 months after December 1, 2014 (the “Commencement Date”), one third upon the lapse of 36 months after the Commencement Date, and one third upon the lapse of 48 months after the Commencement Date. The expiration date for the options vesting within the first portion is upon the lapse of 48 months of the Commencement Date, the expiration date for the options vesting within the second portion is upon the lapse of 60 months of the Commencement Date, and the expiration date for the options vesting within the third portion is upon the lapse of 72 months of the Commencement Date. The weighted financial value of each such option, at the date of approval, was NIS 6.57. The fair value of the restricted shares, at the date of approval, was NIS 28.09 (see also “E. Share Ownership - The 2014 Equity Compensation Plan”). The amount specified in the table reflects the aggregate expenditure recorded by us in 2014 with respect to the allocation of options and restricted shares to Mr. Borgas, based on generally accepted accounting principles. The vesting price for converting the options into shares as of March 15
,
2015 is NIS 27.79 (about $7), the share price on that day was NIS 28.3 (about $7.1). It should be noted that the table above includes an amount constituting about 13% of the value of all the options allocated to Mr. Borgas (due to generally accepted accounting principles).
|
(9)
|
On November 26, 2012, an allotment of 380,000 non-negotiable options was approved, for no consideration for Mr. Weidhas under our 2012 Option Plan. On December 30, 2012, the options were assigned to a trustee in behalf of Mr. Weidhas. The options are exercisable into our ordinary shares at an exercise price of NIS 46.6 (subject to adjustments) and will mature in three equal portions beginning on November 26, 2013, 2014 and 2015. The expiration date for the options vesting within the first and second portions is upon the lapse of 48 months from the date of allocation, and the expiration date for the options vesting within the third portion is upon the lapse of 60 months of the date of allocation. The weighted financial value of each option, on the date of approval, was NIS 11.9 for the first and second portions, and NIS 12.7 for the third portion. For additional information, see “E. Share Ownership -The 2012 Option Plan”. The amount appearing in the table reflects the aggregate expenditure recorded by us in 2014 with regard to the allocation of options to Mr. Weidhas, based on generally accepted accounting principles. The exercise price for converting the options into shares as of March 15, 2015, is NIS 41.52, this price is 46.7% higher than the share price on this date (meaning, these options are “out of the money”). Yet the table above includes an amount which is 27.4% of the value of all the options allocated to Mr. Weidhas (due to generally accepted accounting principles).
|
On August 4, 2014 and August 6, 2014 the Compensation and Human Resources Committee and the Board of Directors, respectively, approved an allocation of 95,129 non-negotiable options for no consideration to Mr. Charles Weidhas, as well as 22,250 restricted shares, under our 2014 Equity Compensation Plan. On September 29, 11, 2014 the options and restricted shares were allocated to a trustee in Mr. Weidhas’ favor. The options are exercisable into Company shares at an exercise price of NIS 28.71 (subject to adjustments). The options and restricted shares will mature in three equal portions as follows: one third upon the lapse of 24 months after December 1, 2014 (the “Commencement Date”), one third upon the lapse of 36 months after the Commencement Date, and one third upon the lapse of 48 months after the Commencement Date. The expiration date for the options vesting within the first portion is upon the lapse of 48 months of the Commencement Date, the expiration date for the options vesting within the second portion is upon the lapse of 60 months of the Commencement Date, and the expiration date for the options vesting within the third portion is upon the lapse of 72 months of the Commencement Date. The weighted financial value of each such option, at the date of approval, was NIS 6.57. The fair value of the restricted shares, at the date of approval, was NIS 28.09 (see also “E. Share Ownership - The 2014 Equity Compensation Plan”). The amount specified in the table reflects the aggregate expenditure recorded by us in 2014 with respect to the allocation of options and restricted shares to Mr. Weidhas, based on generally accepted accounting principles. The vesting price for converting the options into shares as of March 15
,
2015 is NIS 27.79 (about $7), the share price on that day was NIS 28.3 (about $7.1). It should be noted that the table above includes an amount constituting about 13% of the value of all the options allocated to Mr. Weidhas (due to generally accepted accounting principles).
|
(10)
|
On November 26, 2012, an allotment of 380,000 non-negotiable options was approved, for no consideration, for Mr. Asher Grinbaum under our 2012 Option Plan. On December 30, 2012 the options were allocated to a trustee in behalf of Mr. Grinbaum. The options are exercisable into our ordinary shares at an exercise price of NIS 46.6 (subject to adjustments) and will mature in three equal portions beginning on November 26, 2013, 2014 and 2015. The expiration date for the options vesting within the first and second portions is upon the lapse of 48 months from the date of allocation, and the expiration date for the options vesting within the third portion is upon the lapse of 60 months of the date of allocation. The weighted financial value of each option, on the date of approval, was NIS 11.9 for the first and second portions, and NIS 12.7 for the third portion. For additional information, see “E. Share Ownership -The 2012 Option Plan”. The amount appearing in the table reflects the aggregate expenditure recorded by us in 2014 with regard to the allocation of options to Mr. Grinbaum, based on generally accepted accounting principles. The exercise price for converting the options into shares as of March
15
, 2015, is NIS 41.
52
, this price is
46.7
% higher than the share price on this date (meaning, these options are “out of the money”). Yet the table above includes an amount which is 27.4% of the value of all the options allocated to Mr. Grinbaum (due to generally accepted accounting principles).
|
On August 4, 2014 and August 6, 2014 the Compensation and Human Resources Committee and the Board of Directors, respectively, approved an allocation of 95,129 non-negotiable options for no consideration to Mr. Asher Grinbaum, as well as 22,250 restricted shares, under our 2014 Equity Compensation Plan. On September 27, 2014 the options and restricted shares were allocated to a trustee in Mr. Grinbaum’s favor. The options are exersizable into Company shares at an exercise price of NIS 28.71 (subject to adjustments). The options and restricted shares will mature in three equal portions as follows: one third upon the lapse of 24 months after December 1, 2014 (the “Commencement Date”), one third upon the lapse of 36 months after the Commencement Date, and one third upon the lapse of 48 months after the Commencement Date. The expiration date for the options vesting within the first portion is upon the lapse of 48 months of the Commencement Date, the expiration date for the options vesting within the second portion is upon the lapse of 60 months of the Commencement Date, and the expiration date for the options vesting within the third portion is upon the lapse of 72 months of the Commencement Date. The weighted financial value of each such option, at the date of approval, was NIS 6.57. The fair value of the restricted shares, at the date of approval, was NIS 28.09 (see also “E. Share Ownership - The 2014 Equity Compensation Plan”). The amount specified in the table reflects the aggregate expenditure recorded by us in 2014 with respect to the allocation of options and restricted shares to Mr. Grinbaum, based on generally accepted accounting principles. The vesting price for converting the options into shares as of March 15
,
2015 is NIS 27.79 (about $7), the share price on that day was NIS 28.3 (about $7.1). It should be noted that the table above includes an amount constituting about 13% of the value of all the options allocated to Mr. Grinbaum (due to generally accepted accounting principles).
|
(11)
|
On November 26, 2012, an allotment of 380,000 non-negotiable options was approved, for no consideration, for Mr. Dani Chen under our 2012 Option Plan. On December 30, 2012, the options were assigned to a trustee in Mr. Chen’s favor. The options are exercisable into our ordinary shares at an exercise price of NIS 46.6 (subject to adjustments) and will mature in three equal portions beginning on November 26, 2013, 2014 and 2015. The expiration date for the options vesting within the first and second portions is upon the lapse of 48 months from the date of allocation, and the expiration date for the options vesting within the third portion is upon the lapse of 60 months of the date of allocation. The weighted financial value of each option, on the date of approval, was NIS 11.9 for the first and second portions, and NIS 12.7 for the third portion. For additional information, see “E. Share Ownership -The 2012 Option Plan”. The amount appearing in the table reflects the aggregate expenditure recorded by us in 2014 with regard to the allocation of options to Mr. Chen, based on generally accepted accounting principles. The exercise price for converting the options into shares as of March
15
, 2015, is NIS 41.
52
, this price is
46.7
% higher than the share price on this date (meaning, these options are “out of the money”). Yet the table above includes an amount which is 27.4% of the value of all the options allocated to Mr. Chen (due to generally accepted accounting principles).
|
On August 4, 2014 and August 6, 2014 the Compensation and Human Resources Committee and the Board of Directors, respectively, approved an allocation of 95,129 non-negotiable options for no consideration to Mr. Dani Chen, as well as 22,250 restricted shares, under our 2014 Equity Compensation Plan. On September 27, 2014 the options and restricted shares were allocated to a trustee in Mr. Chen’s favor. The options are exercisable into Company shares at an exercise price of NIS 28.71 (subject to adjustments). The options and restricted shares will mature in three equal portions as follows: one third upon the lapse of 24 months after December 1, 2014 (the “Commencement Date”), one third upon the lapse of 36 months after the Commencement Date, and
one third upon the lapse of 48 months after the Commencement Date. The expiration date for the options vesting within the first portion is upon the lapse of 48 months of the Commencement Date, the expiration date for the options vesting within the second portion is upon the lapse of 60 months of the Commencement Date, and the expiration date for the options vesting within the third portion is upon the lapse of 72 months of the Commencement Date. The weighted financial value of each such option, at the date of approval, was NIS 6.57. The fair value of the restricted shares, at the date of approval, was NIS 28.09 (see also “E. Share Ownership - The 2014 Equity Compensation Plan”). The amount specified in the table reflects the aggregate expenditure recorded by us in 2014 with respect to the allocation of options and restricted shares to Mr. Chen, based on generally accepted accounting principles. The vesting price for converting the options into shares as of March 15
,
2015 is NIS 27.79 (about $7), the share price on that day was NIS 28.3 (about $7.1). It should be noted that the table above includes an amount constituting about 13% of the value of all the options allocated to Mr. Chen (due to generally accepted accounting principles).
|
(12)
|
On November 26, 2012, an allotment of 380,000 non-negotiable options was approved, for no consideration, for Mr. Nissim Adar under our 2012 Option Plan. On December 30, 2012, the options were assigned to a trustee in Mr. Adar’s favor. The options are exercisable into our ordinary shares at an exercise price of NIS 46.6 (subject to adjustments) and will mature in three equal portions beginning on November 26, 2013, 2014 and 2015. The expiration date for the options vesting within the first and second portions is upon the lapse of 48 months from the date of allocation, and the expiration date for the options vesting within the third portion is upon the lapse of 60 months of the date of allocation. The weighted financial value of each option, on the date of approval, was NIS 11.9 for the first and second portions, and NIS 12.7 for the third portion. For additional information, see “E. Share Ownership -The 2012 Option Plan”. The amount appearing in the table reflects the aggregate expenditure recorded by us in 2014 with regard to the allocation of options to Mr. Adar, based on generally accepted accounting principles. The exercise price for converting the options into shares as of March 15, 2015, is NIS 41.52, this price is 46.7% higher than the share price on this date (meaning, these options are “out of the money”). Yet the table above includes an amount which is 27.4% of the value of all the options allocated to Mr. Adar (due to generally accepted accounting principles).
|
On August 4, 2014 and August 6, 2014 the Compensation and Human Resources Committee and the Board of Directors, respectively, approved an allocation of 95,129 non-negotiable options for no consideration to Mr. Nissim Adar, as well as 22,250 restricted shares, under our 2014 Equity Compensation Plan. On September 27, 2014 the options and restricted shares were allocated to a trustee in Mr. Adar’s favor. The options are exercisable into Company shares at an exercise price of NIS 28.71 (subject to adjustments). The options and restricted shares will mature in three equal portions as follows: one third upon the lapse of 24 months after December 1, 2014 (the “Commencement Date”), one third upon the lapse of 36 months after the Commencement Date, and one third upon the lapse of 48 months after the Commencement Date. The expiration date for the options vesting within the first portion is upon the lapse of 48 months of the Commencement Date, the expiration date for the options vesting within the second portion is upon the lapse of 60 months of the Commencement Date, and the expiration date for the options vesting within the third portion is upon the lapse of 72 months of the Commencement Date. The weighted financial value of each such option, at the date of approval, was NIS 6.57. The fair value of the restricted shares, at the date of approval, was NIS 28.09 (see also “E. Share Ownership - The 2014 Equity Compensation Plan”). The amount specified in the table reflects the aggregate expenditure recorded by us in 2014 with respect to the allocation of options and restricted shares to Mr. Adar, based on generally accepted accounting principles. The vesting price for converting the options into shares as of March 15
,
2015 is NIS 27.79 (about $7), the share price on that day was NIS 28.3 (about $7.1). It should be noted that the table above includes an amount constituting about 13% of the value of all the options allocated to Mr. Adar (due to generally accepted accounting principles).
The Annual Bonus Component
In December 2012, Amendment 20 to the Companies Law entered into effect, whereby public companies such as us were required to set a compensation policy for their directors and officers. At the same time, we decided to formulate a comprehensive compensation plan (the “Global Compensation Plan”) for our directors and officers and our subsidiaries’ directors and officers, in and outside Israel, to create an orderly system of principles and rules for provision of compensation and incentives to directors and officers. In the view of our management, the Global Compensation Plan is a central tool for administering our senior management personnel resources, which drive our growth. The target of the plan is to recruit, retain and promote experienced and leading managers, in and outside Israel, and to grant them incentives by means of an incentive package that creates a proper balance between fixed and variable compensation components, while implementing our long standing profit sharing policy.
The bonus component is determined according to the annual cash bonus formula set forth in the Compensation Policy and in accordance with the bonus plan approved for Mr. Stefan Borgas by the Compensation and Human Resources Committee and the Board of Directors in July 2013 and by the General Meeting of Shareholders in August 2013, as amended by approval of the General Meeting of Shareholders in December 2014, and to the other officers, as approved by the Compensation and Human Resources Committee and the Board of Directors in August 2014. For details respecting our Compensation Policy and amendments to that policy, see “Item 7. Major Shareholders and Related Party Transactions—B. Related Party Transactions—Approval of Related Party Transactions.”
On March 4, 2015 and March 19, 2015 the Compensation and Human Resources Committee and the Board of Directors, respectively, pursuant to the Section 7.1 of our Compensation Policy, approved the adjustment of the Company’s net profit in 2014 for one-time items, for the purpose of calculating the general threshold amount for measurable components included in the annual bonus formula (the threshold amount constituting a condition for receiving bonuses according to the Compensation Policy). The net profit amount for purposes of the said general threshold amount was adjusted by an amount of approximately $274 million, due to a provision for past years as a result of the partial arbitration award respecting the royalties owed by the Company (see “Item 4. Information on the Company—B. Business Overview—Regulatory and Environmental, Health and Safety Matters”); a one-time tax expense mainly due to tax assessment agreements of consolidated subsidiaries in Europe; effects of the strike in Rotem Amfert Negev and a provision for early retirement of employees in Rotem Amfert Negev and DSW; expense due a change in the fair value of energy hedging transactions as a result of accounting principles; expense/income due to gaining/losing control in subsidiaries; expense/income due to impairment/cancellation of impairment, and other one-time expenses. Following the said adjustment of the net profit, the general threshold condition for the annual bonus, as provided in the Compensation Policy is met. It should be noted that, according to the resolution of the Compensation and Human Resources Committee and the Board of Directors, the said adjustment of the net profit was made solely for the purposes of the said general threshold amount; however, for the purpose of calculating the annual bonus granted to the officers, in accordance with the formula provided in the Compensation Policy, no adjustment shall be made to the net and operational profit.
The bonus to officers was calculated as follows:
Mr. Stefan Borgas – the formula of the bonus to Mr. Borgas and the weights of categories therein is as specified in the Compensation Policy (as amended). In the Company financial indicators category, which include the Company’s compliance with the operational profit target and the net profit target (the “Financial Indicators”), the Company’s results were 56% lower than the target pursuant to the Compensation Policy (average net profit and operational profit compared to these parameters in the last three years). In the category of personal specific performance indicators (“KPIs”), which included strategic indicators, growth indicators, savings and efficiency, Mr. Borgas met with all his targets exceptionally well. Furthermore, performance was measured in the qualitative category of managerial capabilities evaluation (“Managerial Capabilities Evaluation”) as provided in the Compensation Policy.
Mr. Charles Weidhas – the formula of the bonus to Mr. Weidhas is as specified in the Compensation Policy (as amended), while the weights of the various categories are as follows: Financial Indicators category – 30%, Segment Financial Indicators category – 30%, KPIs – 30%, Managerial Capabilities Evaluation – 10%. In the Financial Indicators category the Company’s results were 56% lower than the target pursuant to the Compensation Policy (average in the last three years). In the Segment Financial Indicators category the results of the industrial products segment were negative. In the KPIs category, which included operational indicators, financial indicators, and efficiency indicators, Mr. Weidhas met his targets. Furthermore, performance was measured in the Managerial Capabilities Evaluation category as provided in the Compensation Policy.
Mr. Asher Grinbaum – the formula of the bonus to Mr. Grinbaum is as specified in the Compensation Policy (as amended), while the weights of the various categories are as follows: Financial Indicators category – 60%, KPIs – 30%, Managerial Capabilities Evaluation – 10%. In the Financial Indicators category the Company’s results were 56% lower than the target pursuant to the Compensation Policy (average in the last three years). In the KPIs category, which included safety, ecology, investments, R&D and efficiency indicators, Mr. Grinbaum met his targets. Furthermore, performance was measured in the Managerial Capabilities Evaluation category as provided in the Compensation Policy.
Mr. Dani Chen – the formula of the bonus to Mr. Chen is as specified in the Compensation Policy (as amended), while the weights of the various categories are as follows: Financial Indicators category – 60%, KPIs – 30%, Managerial Capabilities Evaluation – 10%. In the Financial Indicators category the Company’s results were 56% lower than the target pursuant to the Compensation Policy (average in the last three years). In the KPIs category, which included improvement of the Company’s image and support of processes and targets indicators. Chen met his targets. Furthermore, performance was measured in the Managerial Capabilities Evaluation category as provided in the Compensation Policy.
Mr. Nissim Adar – the formula of the bonus to Mr. Adar is as specified in the Compensation Policy (as amended), while the weights of the various categories are as follows: Financial Indicators category – 30%, Segment Financial Indicators category – 30%, KPIs – 30%, Managerial Capabilities Evaluation – 10%. In the Financial Indicators category the Company’s results were 56% lower than the target pursuant to the Compensation Policy (average in the last three years). In the Segment Financial Indicators category the results of the Fertilizers segment were 41% lower than the target as provided in the Compensation Policy (average operational profit in the last three years). In the KPIs category, which included the following indicators: growth, R&D, operations, safety and ecology and HR, Mr. Adar met his targets. Furthermore, performance was measured in the Managerial Capabilities Evaluation category as provided in the Compensation Policy.
Pensions, Retirement and Similar Benefits
We set aside approximately $0.8 million for pension or other retirement benefits for our senior management (GEC) in 2014.
C. BOARD PRACTICES
Board of Directors
According to our Articles of Association, we must have at least seven and no more than twenty directors. Our directors are normally elected by our shareholders at our annual meeting. Our Board of Directors is also authorized to appoint directors in order to fill vacancies or for any other reason. Each of our directors, other than our external directors, serves from the date of election or appointment until our next annual meeting of shareholders. A majority of the members of our Board of Directors must be both citizens and residents of Israel. The approval of at least a majority of the voting rights represented at a shareholders’ meeting and voting on the matter is generally required to remove any of our directors from office (other than external directors).
As of the date of this Annual Report, our Board of Directors consists of twelve directors. In the event of a stalemate in a vote of our Board of Directors, our Chairman of the Board has the right to cast the deciding vote. All of our directors are independent under the rules applicable to U.S. companies listed on the NYSE, except for Messrs. Nir Gilad, Avisar Paz, Eran Sarig, Ovadia Eli, Aviad Kaufman and Stefan Borgas, by virtue of the positions they hold with our controlling shareholder or with the Company. Three of our directors are external directors and an additional director was designated as an “independent director” under the Companies Law. We do not have service contracts with our current directors, excluding the CEO, Mr. Stefan Borgas.
External Directors
As a public Israeli company, we are required by the Companies Law to have at least two external directors who meet certain independence criteria to ensure that they are not related parties to the Company or to our controlling shareholder. The definition of “external director” under the Companies Law and the definition of “independent director” under the NYSE rules overlap to a significant degree such that we would generally expect a director who qualifies as one to also qualify as the other. Since the definitions are not identical, however, it is possible for a director to qualify as one and not as the other.
An external director must also have either financial and accounting expertise or professional qualifications, as defined in regulations promulgated under the Companies Law, and at least one of the external directors is required to have financial and accounting expertise. An external director is entitled to reimbursement of expenses and compensation as provided in regulations promulgated under the Companies Law but is otherwise prohibited from receiving any other compensation from us, directly or indirectly, during his term and for two years thereafter.
Under the Companies Law, external directors must be elected at a shareholders’ meeting by a simple majority of the votes cast on the matter, provided that such majority includes a majority of the votes cast by non-controlling shareholders and shareholders who do not have a personal interest in the election (excluding a personal interest that did not result from the shareholder’s relationship with the controlling shareholder), unless the votes cast by such shareholders against the election did not exceed 2% of our aggregate voting rights. External directors serve for up to three terms of three years each, and our Audit and Finance Committee and Board of Directors may nominate them for additional terms under certain circumstances. Even if an external director is not nominated by our Board of Directors for reelection for a second or third term, shareholders holding at least 1% of our voting rights have the right to nominate the external director for reelection, and in addition, the external director may nominate himself for reappointment. In such a case, the reelection can be approved without the approval of our controlling shareholder if it is approved by a majority of the votes cast by non-controlling shareholders and shareholders who do not have a personal interest in the election (excluding a personal interest that did not result from the shareholder’s relationship with the controlling shareholder) and the votes cast by such shareholders approving the election exceed 2% of our aggregate voting rights. A term of an external director may be terminated prior to expiration only by a shareholder vote, by the same threshold required for election, or by a court, but in each case only if the external director ceases to meet the statutory qualifications for election or if the external director breaches his duty of loyalty to us.
Under the Companies Law, each committee of a company’s board of directors that is authorized to exercise powers of the board of directors is required to include at least one external director, and all external directors must be members of the company’s Audit Committee and Compensation Committee.
We currently have three external directors: Prof. Yair Orgler, whose third term commenced on September 5, 2012, Dr. Miriam Haran, whose second term commenced on August 29, 2012, and whose appointment for a third term, commencing on August 29, 2015, was approved by the General Meeting of Shareholders, and Mr. Yaacov Dior, whose second term commenced on February 26, 2015.
Financial Experts
Our Board of Directors has resolved that at least three of its members must have financial and accounting expertise, as defined in regulations promulgated under the Companies Law. Our Board of Directors has determined that ten of our current directors meet such qualifications.
In addition, our Board of Directors has determined that all members of our Audit and Finance Committee are financially literate as determined in accordance with NYSE rules and that Mr. Dior, Prof. Orgler and Mr. Merszei are qualified to serve as “audit committee financial experts” as defined by SEC rules.
Alternate Directors
Our Articles of Association provide, consistent with Israeli law, that any director may appoint another person who is not a director or an alternate director to serve as his alternate director, subject to the approval of the Board of Directors. The term of an alternate director can be terminated at any time by the appointing director or the Board of Directors and automatically terminates upon the termination of the term of the appointing director. The Companies Law stipulates that an external director may not appoint an alternate director except under very limited circumstances. An alternate director has the same rights and responsibilities as a director, except for the right to appoint an alternate director. As of the date of this Annual Report, no director has appointed any other person as an alternate director.
Our Committees
Our Board of Directors has established the following committees. Each committee operates in accordance with a written charter that sets forth the committee’s structure, operations, membership requirements, responsibilities and authority to engage advisors.
Audit and Finance Committee
Under the Companies Law, the board of directors of a public company must establish an audit committee. The audit committee must consist of at least three directors who meet certain independence criteria and must include all of the company’s external directors. The chairman of the audit committee is required to be an external director. The responsibilities of an audit committee under the Companies Law include identifying and addressing flaws in the business management of the company, reviewing and approving related party transactions, establishing whistleblower procedures, overseeing the company’s internal audit system and the performance of its internal auditor, and assessing the scope of the work and recommending the fees of the company’s independent accounting firm. In addition, the audit committee is required to determine whether certain related party actions and transactions are “material” or “extraordinary” for the purpose of the requisite approval procedures under the Companies Law and to establish procedures for reviewing proposed transactions with a controlling shareholder.
In accordance with U.S. law and NYSE requirements, our Audit and Finance Committee is also responsible for the appointment, compensation and oversight of the work of our independent auditors and, according to such rules and to the Companies Law and regulations by virtue thereof, an audit and finance committee is also responsible for assisting our Board of Directors in monitoring our financial statements, the effectiveness of our internal controls and our compliance with legal and regulatory requirements.
Our Audit and Finance Committee consists of five directors: Prof. Yair Orgler (Chairman), Mr. Yaacov Dior, Dr. Miriam Haran, Mr. Victor Medina and Mr. Geoffery Merszei. Our Audit and Finance Committee complies with the requirements applicable to U.S. companies that are listed on the NYSE. All of the members are external directors or independent directors as defined in the Companies Law. All of the members are also independent as defined in SEC rules and NYSE listing requirements. Our Board of Directors has determined that all members of our Audit and Finance Committee are financially literate as determined in accordance with NYSE rules and that Prof. Orgler, Mr. Dior and Mr. Merszei are qualified to serve as “audit committee financial experts” as defined by SEC rules.
Compensation and Human Resources Committee
Under the Companies Law, the board of directors of a public company must establish a compensation committee. The compensation committee must consist of at least three directors who meet certain independence criteria and include all of the company’s external directors, who are required to constitute a majority of its members. The chairman of the compensation committee must be an external director. The remaining members are required to meet certain independence criteria and be paid in accordance with the regulations governing the compensation of external directors. The responsibilities of a compensation committee under the Companies Law include recommending to the board of directors, for ultimate shareholder approval by a special majority, a policy governing the compensation of directors and officers based on specified criteria, reviewing modifications to and implementation of such compensation policy from time to time and approving the actual compensation terms of directors and officers prior to approval by the board of directors.
Our Compensation and Human Resources Committee is also charged with oversight of our human resources strategy and key programs, including our “One ICL” program, senior leadership development, bonus and equity plans and top management evaluation and succession planning.
Our Compensation and Human Resources Committee consists of four directors, Mr. Yaacov Dior (Chairman), Prof. Yair Orgler, Dr. Miriam Haran and Mr. Shimon Eckhaus. All of the members, except Mr. Eckhaus, are external directors as defined in the Companies Law and all the directors are independent as defined in the NYSE listing requirements applicable to U.S. companies.
Environment, Safety and Public Affairs Committee
Our Environment, Safety and Public Affairs Committee is designed to assist our Board of Directors to oversee our environment and safety policies and programs and our community outreach, public relations and advocacy programs. Our Environment, Safety and Public Affairs Committee is not authorized to exercise any power of our Board of Directors. It consists of three directors, Mr. Eran Sarig (Chairman), Dr. Miriam Haran and Mr. Shimon Eckhaus.
Operations Committee
The purpose of our Operations Committee is to assist our Board of Directors in fulfilling its responsibilities with respect to our equity management, business operations and strategy implementation, including M&A transactions and research and development strategy. Our Operations Committee is not authorized to exercise any power of our Board of Directors. The committee consists of five members, Mr. Nir Gilad (Chairman), Mr. Ovadia Eli, Mr. Victor Medina, Mr. Avisar Paz and Mr. Eran Sarig.
Internal Auditor
Under the Companies Law, the board of directors is required to appoint an internal auditor recommended by the audit committee. The role of the internal auditor is to examine, among other things, whether the company’s actions comply with applicable law and proper business procedures. The internal auditor may not be an interested party, a director or an officer of the company, or a relative of any of the foregoing, nor may the internal auditor be our independent accountant or a representative thereof. Our chief internal auditor oversees the work of various internal auditors throughout our organization. Our chief internal auditor is Mr. Shmuel Daniel, who is a certified internal auditor and certified public accountant in Israel. The chief internal auditor serves in this position since August 1, 2014 and for a period of three years.
Insurance and Indemnification
The Articles of Association of the Company and its Israeli subsidiaries include provisions that permit exemption, indemnification and insurance of the liability of officers, all in accordance with the provisions of the Israeli Companies Law. The Company, with the approval of the Audit Committee, the Board of Directors and the General Meeting of Shareholders, granted its officers an exemption and letters of indemnification, and has also taken out an insurance policy covering directors and officers. The insurance and the compensation do not apply to those cases specified in Section 263 of the Israeli Companies Law. The exemption is for damage caused and/or to be caused by such officers, due to a breach of the duty of care to the Company. The amount of the indemnification payable by the Company under the letter of indemnification, in addition to amounts received from an insurance company, if any, for all of the officers on a cumulative basis, for one or more of the events detailed therein, was limited to $300 million. The insurance is renewed annually. On May 8, 2014 the General Meeting of Shareholders approved an increase of the insurance coverage as determined within the framework resolution approved by the General Meeting of Shareholders in August 2012, from $300 million to $350 million from the date on which our shares were listed for sale on the US stock exchange. The coverage in effect (including a shared tier with the parent company of up to $20 million) stands at an aggregate amount of $220 million.
Other Information
We do not have any agreement with directors providing for benefits upon termination of employment.
D. EMPLOYEES
As of December 31, 2014, we had a workforce of 12,457 employees. Of these, 61 were employed at our headquarters and the balance were employed by our various subsidiaries.
Breakdown of Employees by Area of Activity
|
2014
|
2013
|
2012
|
||||||||||
|
Production
|
9,148 | 9,070 | 8,981 | |||||||||
|
Marketing and sales
|
1,453 | 1,416 | 1,351 | |||||||||
|
Management & administration
|
1,401 | 1,250 | 1,134 | |||||||||
|
Research and development
|
455 | 416 | 410 | |||||||||
|
Total employees
|
12,457 | 12,152 | 11,876 | |||||||||
Breakdown of Employees by Segment
|
2014
|
2013
|
2012
|
||||||||||
|
ICL Fertilizers
|
5,995 | 6,073 | 5,920 | |||||||||
|
ICL-IP
|
2,591 | 2,637 | 2,621 | |||||||||
|
ICL-PP
|
3,324 | 2,992 | 2,887 | |||||||||
|
Other (includes employees of DSM and ICL management)
|
547 | 450 | 448 | |||||||||
|
Total employees
|
12,457 | 12,152 | 11,876 | |||||||||
Geographic Breakdown of Employees
|
2014
|
2013
|
2012
|
||||||||||
|
Israel
|
4,940 | 5,238 | 5,198 | |||||||||
|
Germany
|
1,539 | 1,317 | 1,267 | |||||||||
|
Spain
|
1,270 | 1,205 | 1,215 | |||||||||
|
UK
|
1,203 | 1,156 | 1,062 | |||||||||
|
Netherlands
|
494 | 462 | 450 | |||||||||
|
USA
|
1,123 | 1,121 | 1,080 | |||||||||
|
China
|
614 | 621 | 606 | |||||||||
|
France
|
343 | 351 | 350 | |||||||||
|
Brazil
|
234 | 132 | 96 | |||||||||
|
Other
|
697 | 549 | 552 | |||||||||
|
Total employees
|
12,457 | 12,152 | 11,876 | |||||||||
On December 31, 2014, our workforce comprised 12,457 employees, compared to 12,152 employees as at December 31, 2013, an increase of 305 employees. The increase in the number of employees stems from the additional workforce in respect of acquisition of companies, mainly in Europe and South America, in the Performance Products segment.
We began to implement an efficiency plan at Rotem at the end of 2012. The purpose of the efficiency plan is to reduce our production costs in order to improve our competitive position. As a result of the efficiency plans formulated in Rotem during the past two years, 190 employees left their employment (72 employees left their employment in the beginning of 2013 pursuant to an efficiency plan formulated at the end of 2012 and 118 employees took early retirement during 2013 and 2014, under a different plan). In 2012 and 2013, we recorded an expense in the amount of approximately $60 million and $33 million, respectively, relating to early retirement at Rotem.
In the beginning of 2014, a strike was started at Rotem, against the background of the efficiency plan at Rotem’s factories. The strike lasted 33 days. In most of ICL’s companies in Israel, labor disputes have been declared, partly due to the efficiency plan and the strategy that the Company is implementing, as well as a result of construction of the planned joint service center in Israel. In some of the ICL’s production facilities in Israel, the employees have started to strike. Subsequent to the date of the statement of financial position, on February 2, 2015, the Workers Council of Bromine Compounds Ltd. (“Bromine Compounds”), which belongs to ICL’s Industrial Products segment, started a full scale strike at the Bromine Compounds’ plants in Naot Hovav and halted all shipments of goods from the plants. The strike at the plants came, among other things, in response to the efficiency programs that the Company is currently executing in Naot Hovav, as part of which termination letters were sent to tens of employees employed under a collective agreement. On February 19, 2015, in response to the said termination letters that were sent to employees of Bromine Compounds, the Workers Council of Dead Sea Works (DSW) gave notice of a full strike at DSW’s facilities in Sodom, including the bromine facility and the power plant. Since shutdown of the bromine facility prevents utilization of the chlorine produced in the production process of metal magnesium, and creates an ecological risk, a danger is posed to the continued operation of the magnesium plant within 72 hours of shutdown of the bromine facility. As a result, the Company’s management petitioned the Labor Court for relief prohibiting the Workers Council from taking any actions which could result in the stoppage of the proper operation of certain facilities in Sodom, including the magnesium facility, the bromine facility and the power plant. The Labor Court accepted the Company’s claims and issued an Order instructing the Workers Council to immediately cease all aforementioned actions. Should the magnesium plant be closed, it will not be possible to return it to service, meaning that significant damage may also be caused to the production capacity of Bromine Compounds in Naot Hovav. In a hearing held in the National Labor Court on March 11, 2015, it was agreed to continue to carry on intensive negotiations between the Company and the representatives of the employees along with the participation of the Chairman of the National Histadrut (employees’ union). The termination proceedings have been stayed during the period of the negotiations. Each side may exit the negotiations upon provision of advance notice of 48 hours and in such a case the agreements reached will be cancelled. The voluntary early retirement processes are continuing. As at the publication date of the report, the strikes at Bromine Compounds and DSW are continuing. Furthermore, after the strikes come to an end, an additional period of time will be required in order to return to production at full capacity in all the facilities. There is no certainty as to the scope and/or the duration of the strikes.
As part of the efficiency plan approved by the Company’s Board of Directors and in order to implement further operating excellence measures in the Company’s factories worldwide, in 2014 the Company continued the planning of construction of joint service centers in Israel and Europe, in addition to the joint service center already operating in the United States (St. Louis). During 2015, ICL opened a new European headquarters in Amsterdam intended to manage all the activities in Europe. The new headquarters will serve as one of ICL’s joint global service centers (together with the existing service center in the United States and the planned service center in Israel) and will also operate as the Company’s worldwide procurement (purchasing) center. The joint service centers in Israel and Europe are to provide services to all ICL companies in Europe and Israel.
The activities to be included in these service centers include accounting and finance, human resources, information technology, procurement and legal services. The Company expects that establishment of these service centers will contribute to improvement of the quality of service provided, uniform application of processes within the Company, improvement of control and compliance processes, and also to result in cost savings, mainly as a result of savings relating to procurement costs and the reduction in the number of personnel presently existing in such departments. As of the date of this report, establishment of the joint service centers is being discussed by Company management and labor representatives.
Employment Agreements, Collective Bargaining Agreements and Temporary Employees
ICL employees in Israel are employed under collective or individual employment agreements. The collective bargaining agreements are signed for specified terms and are renewed from time to time. By law, in the event that a new collective bargaining agreement is not signed, the terms of the original agreement are extended for an unlimited period, unless one party gives notice to the other of its cancellation. As of the date of this Annual Report, no notice of cancellation had been given for any of the collective bargaining agreements currently in effect at ICL.
Dead Sea Works, Rotem, Fertilizers and Chemical Materials Ltd. (“FCM”), Dead Sea Magnesium and Bromine Compounds have collective bargaining agreements with termination dates ranging from September 2015 to the end of 2018.
Senior employees in special positions and members of management are employed under individual agreements. These agreements are not limited in time and can be terminated with advance notice of a few months.
Local employees of our subsidiaries overseas are employed according to the employment terms prevalent in the countries in which they are employed. Most of our overseas employees, primarily in Germany, the Netherlands, the United Kingdom, Spain and the United States, are employed under collective bargaining agreements.
A relatively limited number of the employees at our sites in Israel are employed by employment agencies for short terms. In addition, we have contracted in Israel with subcontractors for various outsourcing services such as security, packaging, maintenance, catering, cleaning and other services. In accordance with the decision of the boards of directors of ICL and its Israeli subsidiaries in October 2004, contractors who employ workers at our plants in Israel are required to give employees working on a regular basis for ICL salary terms beyond those required by law. Pursuant to this decision, the employers are obligated to grant these employees, in addition to current salary that must be at least 5% higher than the minimum wage stipulated by law, other benefits such as uniforms and meals.
On July 11, 2013, a collective bargaining agreement was signed between the Organization of Cleaning Companies in Israel regulating the salary and employment conditions of the employees of these companies. The agreement applies to employers in the cleaning and maintenance sector in Israel that are members of the Organization of Cleaning Companies.
E. SHARE OWNERSHIP
Information with respect to share ownership of members of our Management and Supervisory Boards and our senior management is included in “Item 7. Major Shareholders and Related Party Transactions.”
Incentive Compensation Plans
The 2010 Option Plan
On January 7, 2010, our Board of Directors approved issuance of 10,930,500 non-transferable options for no consideration to 318 of our officers and senior employees in Israel and overseas. The issue included a significant private placement of 1,100,000 options to our former Chief Executive Officer and 800,000 options to our Chairman of the Board. On February 15, 2010, at an extraordinary general meeting of our shareholders, the issue to the Chairman of the Board was approved. The 2010 Plan options vested in three equal annual installments as follows: one third at the end of 12 months from the date of approval of the Board of Directors; one third at the end of 24 months from the date of approval of the Board of Directors; and one third at the end of 36 months from the date of approval of the Board of Directors. As at December 31, 2014, all the options had expired.
The 2012 Option Plan
On November 26, 2012, our Board of Directors approved the issue of up to 12,000,000 non marketable options for no consideration to 416 of our officers and senior employees in Israel and overseas. On December 27, 2012, 11,999,400 options were issued. The issuance included a material private placement of 1,190,000 options to our Chief Executive Officer. This grant format of the options plan includes a “cap” for the value of a share where if, as at the exercise date, the closing price of a Company share is higher than twice the exercise price (the “Share Value Cap”), the number of the exercised shares will be reduced so that the product of the exercised shares actually issued to an offeree multiplied by the share closing price will equal the product of the number of exercised options multiplied by the Share Value Cap. The options may be exercised in three equal tranches on November 26, 2013, 2014 and 2015. The expiration date of the options for the first and second tranches is at the end of 48 months from the issuance date, and the expiration date of the options for the third tranche is at the end of 60 months from the issuance date.
The 2014 Equity Compensation Plan
Following the approval of our Board of Directors on August 6, 2014, we issued 4,360,073 non marketable options, for no consideration, exercisable for up to 4,360,073 of our ordinary shares, and 1,007,651 restricted shares, to approximately 450 of our officers and senior employees. The issuance includes a significant private placement of 367,294 options and 85,907 restricted shares to our Chief Executive Officer, which was approved by the general meeting of our shareholders. This grant format of the options plan includes a “cap” for the value of a share where if, as at the exercise date, the closing price of an ordinary share is higher than twice the exercise price (the “Share Value Cap”), the number of the exercised shares will be adjusted so that the product of the exercised shares actually issued to the offeree multiplied by the share closing price will equal the product of the number of exercised options multiplied by the Share Value Cap.
The options and restricted shares will vest in three equal tranches: one third at the end of 24 months from December 1, 2014, one third at the end of 36 months from December 1, 2014 and one third at the end of 48 months from December 1, 2014. The expiration date of the options in the first tranche is at the end of 48 months from December 1, 2014, the expiration date of the options in the second tranche is at the end of 60 months from December 1, 2014 and the expiration date of the options in the third tranche is at the end of 72 months from December 1, 2014.
Subsequent to the date of the financial statements, on January 25 and 26, 2015, the Human Resources and Compensation Committee of the Company’s Board of Directors, approved the issue of 99,858 restricted shares to Company directors (except for the Company’s CEO, Mr. Stefan Borgas), for no consideration, under the 2014 shares and remuneration plan. The shares are restricted and will vest in three tranches, subject to the directors continuing to serve in their positions, as follows: (1) 50% will vest on August 28, 2015, (2) 25% will vest at the end of two years from the date of the General Meeting, on February 26, 2017, and (3) 25% will vest at the end of three years from the date of the General Meeting, on February 26, 2018.
Upon exercise, each option may be converted into one ordinary share of NIS 1 par value of the Company. The ordinary shares issued as a result of exercise of the options have the same rights as the Company’s ordinary shares, immediately upon their issuance. The options issued to the employees in Israel are covered by the provisions of Section 102 of the Israeli Income Tax Ordinance (New Version) and the regulations promulgated thereunder. The Company elected to perform the issuance through a trustee, under the Capital Gains Track. The exercise price is linked to the CPI that is known as of the date of payment, which is the exercise date. In a case of distribution of a dividend by the Company, the exercise price is reduced on the “ex dividend” date, by the amount of the dividend per share (gross), based on the amount thereof in NIS on the effective date. The options are not marketable and are not transferable.
Fair Value of Options
The fair value of the options awarded under the 2010 plan was estimated by applying the Black & Scholes model of option pricing. The fair value of the options awarded under the 2012 and 2014 plans was estimated using the binomial model for option pricing. The following factors were used in applying the models:
|
2010 Plan
|
2012 Plan
|
2014 Plan
|
||||||||||
|
Share price (in $)
|
14.3 | 12.1 | 8.2 | |||||||||
|
CPI-linked exercise price (in $)
|
14.3 | 12.1 | 8.4 | |||||||||
|
Expected volatility:
|
||||||||||||
|
First tranche
|
54.98 | % | 36.70 | % | 29.40 | % | ||||||
|
Second tranche
|
54.98 | % | 36.70 | % | 31.20 | % | ||||||
|
Third tranche
|
48.45 | % | 44.20 | % | 40.80 | % | ||||||
|
Expected life of options (in years):
|
||||||||||||
|
First tranche
|
2.5 | 4.0 | 4.3 | |||||||||
|
Second tranche
|
2.5 | 4.0 | 5.3 | |||||||||
|
Third tranche
|
3.5 | 5.0 | 6.3 | |||||||||
|
Risk-free interest rate:
|
||||||||||||
|
First tranche
|
0.59 | % | 0.22 | % | (0.17 | )% | ||||||
|
Second tranche
|
0.59 | % | 0.22 | % | 0.05 | % | ||||||
|
Third tranche
|
1.29 | % | 0.54 | % | 0.24 | % | ||||||
|
Fair value (in $ millions)
|
54.3 | 37.7 | 8.4 | |||||||||
|
Weighted average grant date fair value per option (in $)
|
5.0 | 3.1 | 1.9 | |||||||||
The fair value on the grant date of the restricted shares issued pursuant to the approval of the Board of Directors on August 6, 2014, is about $8.4 million. The value of the restricted shares is determined according to the closing price on the TASE on the most recent trading day preceding the date of the approval of the Board of Directors (with the exception of the restricted shares issued to our CEO, the value of which was determined according to the closing price on the TASE on the most recent trading date preceding the date of the approval of the general meeting, which is the grant date).
The fair value on the grant date of the restricted shares issued to directors in accordance with the approval of the General Meeting on February 26, 2015, is about $710 million. The value of the restricted shares was determined in accordance with the closing price on the stock exchange on the last day before the date of approval by the General Meeting of the Company’s shareholders, namely, the grant date.
The cost of the benefit embedded in the aforesaid plans will be recognized in profit and loss over the vesting period.
The 2013 and 2014 Cash Incentive Plans
On May 12, 2013, our Board of Directors decided to approve a long-term remuneration plan (“the 2013 Plan”) for approximately 11,300 Company employees in Israel and overseas, who are not included in the 2012 Plan. The maximum cost of the new plan is approximately $45 million. According to criteria defined in the 2013 Plan, an amount of up to $4,050 will be paid to each employee included in the Plan, provided that our net income in each of the years 2013, 2014, and 2015 meets the requirements defined in the Plan.
Furthermore, on August 6, 2014, our Board of Directors approved a long-term benefit plan of up to approximately $17 million for approximately 11,800 of our non-managerial employees who are not included in the aforesaid 2014 option and restricted shares plan.
As at December 31, 2014, the conditions for the aforesaid plans did not obtain and therefore no liability in respect of the 2013 Cash Incentive Plan and the 2014 Cash Incentive Plan was included in our financial statements.
A. MAJOR SHAREHOLDERS
The following table presents as of March 1, 2015 (unless otherwise noted below) the beneficial ownership of our ordinary shares by each person who is known by us to be the beneficial owner of 5% or more of our outstanding ordinary shares and each of our directors and executive officers. The data presented is based on information provided to us by the holders or disclosed in public regulatory filings.
|
Ordinary Shares Beneficially Owned (1)
|
Special State Share
|
|||||||||||||||
|
Shareholders
|
Number
|
%
|
Number
|
%
|
||||||||||||
|
Israel Corporation Ltd.(2)
|
587,055,812 | 46.17 | % | – | – | |||||||||||
|
PotashCorp Agricultural Cooperative Society Ltd.(3)
|
176,088,630 | 13.85 | % | – | – | |||||||||||
|
State of Israel(4)
|
– | – | 1 | 100 | % | |||||||||||
|
Yair Orgler
|
1,600 | * | – | – | ||||||||||||
|
Avi Doitchman
|
285,332 | * | – | – | ||||||||||||
|
Nissim Adar
|
253,332 | * | – | – | ||||||||||||
|
Eli Amit
|
117,659 | * | – | – | ||||||||||||
|
Herzel Bar Niv
|
58,666 | * | – | – | ||||||||||||
|
Amir Benita
|
36,666 | * | – | – | ||||||||||||
|
Shmuel Daniel
|
93,332 | * | – | – | ||||||||||||
|
Dan (Dani) Chen
|
275,132 | * | – | – | ||||||||||||
|
Israel Dreyfuss
|
4,000 | * | – | – | ||||||||||||
|
Eyal Ginzberg
|
60,000 | * | – | – | ||||||||||||
|
Asher Grinbaum
|
253,332 | * | – | – | ||||||||||||
|
Michael Hazzan
|
41,966 | * | – | – | ||||||||||||
|
Lisa Haimovitz
|
54,666 | * | – | – | ||||||||||||
|
Hezi Israel
|
54,666 | * | – | – | ||||||||||||
|
Ofer Lifshitz
|
112,000 | * | – | – | ||||||||||||
|
Yakir Menashe
|
36,666 | * | – | – | ||||||||||||
|
Charles Weidhas
|
253,332 | * | – | – | ||||||||||||
|
Ronnie Shushan
|
110,000 | * | – | – | ||||||||||||
|
Mark Volmer
|
– | * | – | – | ||||||||||||
|
*
|
Less than 1%
|
After December 31, 2014, the General Meeting of Shareholders approved an allocation of 9,078 restricted shares for each of the Company directors (except for the CEO, Mr. Stefan Borgas), for no consideration. See “Item 6. Directors, Senior Management and Employees—E. Share Ownership –The 2014 Equity Compensation Plan”. The Company’s Compensation and Human Resources Committee, Board of Directors and General Meeting of Shareholders approved transfer by the directors employed by Israel Corporation of the equity compensation granted to them (a total of 27,234 restricted shares) or the financial benefits by virtue thereof, to the Israel Corporation.
|
(1)
|
The percentages shown are based on 1,271,433,609 ordinary shares issued and outstanding as of March 1, 2015 (after excluding shares held by us or our subsidiaries). In accordance with the rules of the SEC, beneficial ownership includes voting or investment power with respect to securities and includes the shares issuable pursuant to options that are exercisable within 60 days from March 1, 2015. Shares issuable pursuant to options are deemed outstanding for computing the percentage of the person holding such options but are not outstanding for computing the percentage of any other person.
|
|
(2)
|
The Group’s parent company is Israel Corporation Ltd. Israel Corporation Limited is a public company listed for trading on the Tel Aviv Stock exchange (TASE). Based on the information the Company received from Israel Corporation, Millennium Investments Elad Ltd. (hereinafter – “Millennium”) and Mr. Idan Ofer are considered as controlling shareholders jointly of Israel Corporation, for purposes of the Securities Law (both Millennium and Mr. Ofer hold shares in Israel Corporation directly, and Idan Ofer serves as a director of Millennium and has an indirect interest in it as a beneficiary of a trust that has indirect control of Millennium). Millennium holds approximately 46.94% of the share capital in Israel Corporation. To the best of the Company’s knowledge, Millennium is held by Mashat Investments Ltd (hereinafter, “Mashat”), and by XT Investments Ltd (hereinafter, “XT Investments”), with 80% and 20% holdings, respectively. Mashat is a private company, wholly owned by a Dutch company Ansonia Holdings B. V. (hereinafter – “Ansonia”). Ansonia is a wholly-owned subsidiary of Jelany Corporation N. V. (registered in Curaçao), which is a wholly owned subsidiary of the Liberian company Court Investments Ltd (hereinafter – “Court”). Court is wholly owned by a foreign discretionary trust of which Mr. Idan Ofer is a beneficiary. XT Investments, which directly holds approximately 1.24% of the share capital in Israel Corporation, is a shareholder in Millennium, as stated. XT Investments is a private company, wholly owned by XT Holdings Ltd. (hereinafter – “XT Holdings), a private company whose ordinary shares are held in equal shares by Orona Investments Ltd (which is indirectly controlled by Mr. Ehud Angel) and by Lynav Holdings Ltd., a company that is controlled by a foreign discretionary trust of which Mr. Idan Ofer is a prime beneficiary. Among other things Mr. Ehud Angel holds a special share that gives him, inter alia, under certain limitations and for certain issues, an additional vote on the Board of Directors of XT Holdings. In addition, Kirby Enterprises Inc., which is indirectly held by a foreign discretionary trust that holds Mashat in which, as stated, Mr. Idan Ofer is the beneficiary, holds approximately 0.74% of the share capital of Israel Corporation. Furthermore, Mr. Idan Ofer holds directly approximately 3.85% of the share capital of Israel Corporation.
|
On September 24, 2014, we listed our ordinary shares on the NYSE in connection with the initial public offering of our shares. The offering, including the subsequent option exercise, included 42,222,942 of our ordinary shares sold by Israel Corporation and 23,951,015 of our ordinary shares sold by certain forward counterparties. Immediately following the offering, Israel Corporation had voting rights with respect to approximately 46.18% of our outstanding ordinary shares (after excluding shares held by us or our subsidiaries). Even though Israel Corporation has less than 50% of our ordinary shares, it still has a major impact on the General Meeting of Shareholders and will de facto have the power to appoint directors and have a strong influence upon the composition of our Board of Directors.
As of March 1, 2015, 353 million ordinary shares have been pledged by Israel Corporation to secure certain liabilities, almost entirely comprised of margin loans with an aggregate outstanding principal amount of $1,035 million.
|
(3)
|
PotashCorp Agricultural Cooperative Society Ltd. is an Israeli subsidiary of Potash Corporation of Saskatchewan Inc., a Canadian corporation whose shares are listed for trading on the Toronto Stock Exchange and the NYSE.
|
|
(4)
|
For a description of the different voting rights held by the holder of the Special State Share, see “Description of Share Capital—The Special State Share” in our registration statement on Form F-1 (File no. 333-198711) filed with the SEC on September 22,2014.
|
To our knowledge, as of March 16, 2015, we had one shareholder of record who was registered with an address in the United States, holding approximately 5.20% of our outstanding ordinary shares. Such numbers are not representative of the portion of our shares held in the United States nor are they representative of the number of beneficial holders residing in the United States, since such ordinary shares were held of record by one U.S. nominee company, CEDE & Co. In Israel, the nominee company to the TASE in whose name most of our ordinary shares are held of record is Registration Company of Bank Hapoalim Ltd.
B. RELATED PARTY TRANSACTIONS
Approval of Related Party Transactions
Approval of Related Party Transactions
Under the Companies Law, a related party transaction may be approved only if it is for the benefit of the company. A transaction that is not an extraordinary transaction in which a director or officer has a personal interest requires the approval of the Board of Directors, unless the articles of association of the company provide otherwise. Our Articles of Association provide that such a transaction, if it does not relate to a director’s or officer’s compensation terms, may be approved by any of our Board of Directors, our Audit and Finance Committee, a disinterested director or officer or a person authorized for this purpose by our Board of Directors. If the transaction is an extraordinary transaction, it must be approved by the Audit Committee and the Board of Directors, and, under certain circumstances, by the shareholders of the company. An “extraordinary transaction” is a transaction other than in the ordinary course of business, other than on market terms or that is likely to have a material impact on the company’s profitability, assets or liabilities.
Pursuant to the Companies Law, extraordinary transactions in which a controlling shareholder has a personal interest require the approval of the Audit Committee, or the Compensation and Human Resources Committee if the transaction is in connection with employment or service with the company, the Board of Directors and the shareholders of the company. The shareholder approval must be by a simple majority of all votes cast, provided that (i) such majority includes a simple majority of the votes cast by non-controlling shareholders having no personal interest in the matter or (ii) the total number of votes of shareholders mentioned in clause (i) above who voted against such transaction does not exceed 2% of the total voting rights in the company.
The Companies Law prohibits any director who has a personal interest in an extraordinary transaction from being present for the discussion and voting on such transaction in the audit committee or board of directors. Notwithstanding, a director who has a personal interest may be present at the meeting and vote on the matter if a majority of the directors or members of the audit committee have a personal interest in the approval of such transaction. If a majority of the members of the Board of Directors have a personal interest in the transaction, such transaction also requires shareholder approval.
Approval of Director and Officer Compensation
Under the Companies Law, we are required to approve, at least once every three years, a compensation policy with respect to our directors and officers. Following the recommendation of our Compensation and Human Resources Committee, the compensation policy must be approved by our Board of Directors and our shareholders. The shareholder approval must be by a simple majority of all votes cast, provided that (i) such majority includes a simple majority of the votes cast by non-controlling shareholders having no personal interest in the matter or (ii) the total number of votes of shareholders mentioned in clause (i) above who voted against such transaction does not exceed 2% of the total voting rights in the company. In general, the compensation terms of directors, the chief executive officer and any employee or service provider who is considered a controlling shareholder, as well as a relative of a controlling shareholder, must be approved separately by the Compensation and Human Resources Committee, the Board of Directors and the shareholders. Generally, shareholder approval is not required for director compensation payable in cash up to the maximum amount set forth in the regulations governing the compensation of external directors. The compensation terms of other officers who report directly to the chief executive officer require the approval of the Compensation and Human Resources Committee and the Board of Directors.
On July 17, 2013, our Board of Directors approved the compensation policy for our directors and officers in accordance with the recommendation of our Compensation and Human Resources Committee, which approved the compensation policy on July 16, 2013. Our compensation policy was approved by our shareholders on August 26, 2013. In March 2014, our Compensation and Human Resources Committee and our Board of Directors approved certain amendments to our compensation policy including, among other things, with regard to the method of calculating the target bonus for officers who have not served as officers or who have served in another position in the Company in the three years prior to the bonus, the possibility of awarding a special bonus and certain amendments to the equity bonus mechanism (including with regard to minimum permitted vesting period). In August 2014, our Compensation and Human Resources Committee and our Board of Directors approved, and on December 11, 2014, the General Meeting of Shareholders approved additional specific amendments to our compensation policy which, among other things:
|
|
·
|
add an exception to the criteria for the selection of the comparative companies in relation to which the compensation packages offered to officers will be examined, provided that there is available public information on the compensation packages in such companies;
|
|
|
·
|
amend the ranges for the desirable ratios between the fixed and the variable components of the compensation of officers;
|
|
|
·
|
amend the ratio between the weights of the different categories in the formula for calculating officers’ compensation;
|
|
|
·
|
with respect to ICL and the segments’ financial measures, authorize our Compensation and Human Resources Committee and Board to adjust (upwards or downwards) the net income and/or operating income of the or the respective segment for one-time items, for purposes of calculating the annual bonus;
|
|
|
·
|
for purposes of the compliant equity bonus mechanism provided in Section 7.7 of the Compensation Policy – for purposes of determining the minimal total shareholder return, which constitutes a prerequisite for the maturity of the matching equity bonus, the foreign comparative companies will be direct business competitors of ICL or companies that operate in similar markets as ICL, for which available public information exists, and that have income and/or a market value within a reasonable range of our income and market value;
|
|
|
·
|
amend the way of calculating the target bonus for officers who have not served the Company in the last three years; and
|
|
|
·
|
add the possibility of granting special bonuses for special efforts or unique contributions.
|
Transactions with Related Parties
Registration Rights Agreement
We entered into a registration rights agreement with Israel Corporation on September 12, 2014. We obtained shareholder approval of our entry into this agreement on May 8, 2014. This agreement provides for customary demand, piggyback and shelf registration rights and provides that we will perform various actions and comply with various requirements to facilitate and promote such registrations, as well as cover certain expenses of Israel Corporation in connection with any such registration.
Controlling Shareholder
As of March 19, 2015, Israel Corporation held approximately 49.02% of our outstanding ordinary shares and approximately 46.17% of the voting rights of our shareholders.
Israel Corporation exercises control over our operations and business strategy and has sufficient voting power to control many matters requiring approval by our shareholders, including:
|
|
·
|
The composition of our Board of Directors (other than external directors, as described under “Item 6. Directors, Senior Management and Employees—C. Board Practices—External Directors”);
|
|
|
·
|
Mergers or other business combinations;
|
|
|
·
|
Certain future issuances of ordinary shares or other securities; and
|
|
|
·
|
Amendments to our Articles of Association, excluding provisions of the Articles of Association that were determined by the Special State Share.
|
However, Israel Corporation does not exercise control with respect to our compensation policy and related party transactions, since these must be approved by a majority of our non-related shareholders.
Joint Insurance
On August 29, 2012, following approval by our Audit and Finance Committee and our Board of Directors, our shareholders approved a new framework resolution to purchase an insurance policy for two tier coverage of director and officer liability jointly with Israel Corporation. The first tier, which is shared with Israel Corporation, has a joint liability limit of up to $20 million, and the premiums are paid about 42.5% by us and about 57.5% by Israel Corporation. The second tier covers us alone for up to $200 million. This framework resolution is valid for up to three years.
In August 2013, following approval by our Compensation and Human Resources Committee and our Board of Directors, our shareholders approved an increase of the total insurance cap to $350 million.
In connection with our initial public offering, we updated the terms of our insurance policy for directors and officers in accordance with the practice of companies listed in the United States, including with respect to the limit of liability, the premium and the apportioning of the insurance premium to be paid between us and Israel Corporation. The insurance policy includes a joint tier with Israel Corporation with a liability limit of up to $20 million and a separate tier that covers us alone for up to $220 million, with our directors and officers as beneficiaries of both tiers. The new insurance policy was approved by our shareholders, as a three year framework resolution, in May 8, 2014, following approval by our Audit and Finance and Board of Directors.
On August 31, 2014, we announced that our Audit and Finance Committee and our Board of Directors had approved the renewal of our insurance policy in accordance with the three year framework resolution approved by our shareholders in May 2014 and our Compensation Policy. The new insurance policy, which entered into effect as of September 1, 2014, includes a joint tier with Israel Corporation with a joint liability limit up to $20 million (the division of the premium amount was changed in 2014 so that about 60% will be paid by the Company and about 40% by Israel Corporation) and a separate tier that covers us alone with a liability limit up to $220 million.
Management Fees to Controlling Shareholder
We have paid our parent company, Israel Corporation, annual management fees for management services, since 1996. Management services include ongoing general consultation, such as professional, financial, strategic and managerial consulting, and consulting and representation in regulatory issues. The parties may agree to expand management services to additional areas. On January 2015 our Compensation and Human Resources Committee and our Board of Directors approved, and on February 26, 2015 our General Meeting of Shareholders approved, an extension of the management agreement that expired on December 31, 2014, for the years 2015-2017, under the same terms, except for the following changes: (1) upon approval of the terms of office for the Executive Chairman of the Board, management fees shall be reduced to $1 million plus VAT. In case the Chairman of the Board is appointed Executive Chairman of the Board and thereafter ceases to serve and be compensated as an Executive Chairman of the Board, as of such time management fees shall once more be set at an amount of $3.5 million plus VAT; (2) to allow the Company to grant equity compensation to incumbent and future directors who are employed by the Israel Corporation (such directors do not receive cash compensation for their service); these directors may assign their equity compensation to Israel Corporation.
Relationships with Other Companies
A subsidiary in our Performance Products segment entered into a long term agreement with an interested party of the Company for the acquisition of food grade phosphoric acid. The agreement was signed before the subsidiary was acquired by us and is in effect until 2018.
On February 28, 2013, our Audit and Finance Committee and our Board of Directors approved certain of our Israeli subsidiaries in our Industrial Products segment to purchase electricity from OPC Rotem Ltd. During 2013, additional subsidiaries from our Fertilizers segment entered into an agreement with OPC Rotem Ltd. to purchase electricity in accordance with the amended agreement approved on February 28, 2013.
Short Term Loan
On June 26, 2012, we received a short term loan in the amount of approximately $50 million from our controlling shareholder (Israel Corporation Ltd.). The loan was granted on terms similar to market terms and was extended periodically for three or six months, bore interest at a rate of 0.77625% and was repaid in full in August 2014.
The table below sets forth certain income statement information with respect to balances of our related party transactions.
|
For the year ended December 31
|
||||||||||||
|
2014
|
2013
|
2012
|
||||||||||
|
US$ thousands
|
||||||||||||
|
Sales
|
6,212 | 9,958 | 14,693 | |||||||||
|
Cost of sales(1)
|
173,358 | 131,845 | 94,512 | |||||||||
|
Selling, transport and marketing expenses
|
16,326 | 18,424 | 36,019 | |||||||||
|
Management fees to the parent company(2)
|
3,752 | 4,002 | 3,792 | |||||||||
The table below sets forth certain balance sheet information with respect to balances of our related party transactions.
|
As at December 31
|
||||||||||||
|
2014
|
2013
|
2012
|
||||||||||
|
US$ thousands
|
||||||||||||
|
Long-term deposits, net of current maturities
|
1,512 | 780 | 958 | |||||||||
|
Current maturities of long-term deposits
|
411 | 260 | 239 | |||||||||
|
Other current assets
|
11,063 | 6,342 | 6,824 | |||||||||
|
Other current liabilities
|
28,652 | 73,558 | 73,087 | |||||||||
The Company declares a dollar dividend that is paid in NIS, pursuant to the exchange rate on the effective date. The Company executes a hedging transaction in order to hedge the exposure to changes in the U.S. dollar/NIS exchange rate. The dividend paid to the Company’s controlling shareholder, Israel Corporation, is made partly based on the exchange rate on the effective date and partly based on the exchange rate on the date of distribution. In addition, the dividend paid to an interested party is made pursuant to the exchange rate on the date of distribution.
For additional information regarding our related party transactions, see note 29 to our audited financial statements.
Option Plans
See “Item 6. Directors, Senior Management and Employees—E. Share Ownership” for a description of the Option Plans.
C. INTERESTS OF EXPERTS AND COUNSEL
Not Applicable.
A. CONSOLIDATED STATEMENTS AND OTHER FINANCIAL INFORMATION
The fixed operating costs for the years 2014, 2013 and 2012 amounted to approximately $2,432 million, $2,328 million and $2
,
189 million, respectively. The variable operating costs for the years 2014, 2013 and 2012 amounted to approximately $2,921 million, $2,842 million and $2,729 million, respectively
.
See “Item 18. Financial Statements.”
Legal Proceedings
Tax Proceedings
On December 29, 2013, an assessment was received from the Israeli Tax Authorities whereby the Company is required to pay additional tax beyond the amount we already paid for 2009 to 2011 in the amount of approximately $230 million. The Company has filed its objections to the assessment. On January 27, 2015, an order was received from the Tax Authorities, setting the amount of the additional tax at $200 million. The Company disagrees with the position of the Taxes Authority and on February 25, 2015, it filed a notice of appeal against the order with the court. The primary contention of the Tax Authorities is that our subsidiaries, Dead Sea Works and Rotem Amfert Negev, are not entitled to benefits under the Law for Encouragement of Capital Investments commencing from the date on which Amendment No. 60 to this law entered into effect in 2005. In the estimation of Company Management, based on its legal advisors, the chances that the Company’s contentions will ultimately be accepted at the end of the appeal proceeding are greater than the chances that they will be rejected and, therefore, no provision for tax has been included in the financial statements in respect of the said assessment.
Dead Sea Works Proceedings
Arbitration regarding Royalties at Dead Sea Works Ltd.
Pursuant to the Israeli Dead Sea Concession Law, 1961 (hereinafter – “the Concession Law”), as amended in 1986, and the concession indenture attached as an addendum to the Concession Law, Dead Sea Works was granted a concession to utilize the resources of the Dead Sea and to lease the land required for its plants in Sodom for a period ending on March 31, 2030, together with a priority right to receive the concession after its expiration, should the Government wish to offer a new concession. In consideration of the concession, Dead Sea Works pays royalties to the Government of Israel, calculated at the rate of approximately 5% of the value of the products at the factory gate, less certain expenses, where the rate of the royalties for an annual quantity of potash sold in excess of 1.5 million tons is 10% (instead of 5%). DSW grants a sub-concession to Dead Sea Bromine Ltd. to produce bromine and its compounds from the Dead Sea, the expiration date of which is concurrent with the Company’s concession. The royalties for the products manufactured by the Bromine Company are received by the Company from the Bromine Company, which pays them to the State. In addition, there is an arrangement relating to payment of royalties by Dead Sea Magnesium for production of magnesium metals by virtue of a specific arrangement with the State prescribed in the Government’s decision of September 5, 1993. Pursuant to the arrangement, royalties are paid by Dead Sea Magnesium on the basis of carnallite used for production of magnesium. The arrangement with Dead Sea Magnesium provides that during 2006 the State may demand a reconsideration in connection with the amount of the royalties and the method or their calculation for 2007 and thereafter. The State’s demand for reconsideration was first received at the end of 2010, and the matter is presently in an arbitration proceeding, as described below.
In 2006, a letter was received from the then Accountant General of the Israeli Ministry of Finance, claiming an underpayment of royalties amounting to hundreds of millions of shekels. Pursuant to the concession, disputes between the parties relating to the concession, including royalties, are to be decided by an arbitration panel of three arbitrators (each side appoints an arbitrator and these two appoint the third arbitrator). On January 9, 2011, the State of Israel and DSW decided to refer to arbitration the issue of how to calculate the royalties under the concession and the royalties to be paid for metal magnesium and payment or refunds (if any) resulting from the issues above. Each of the parties appointed an arbitrator on its behalf and these arbitrators appointed the third arbitrator. In the statement of claim filed by the State of Israel in the arbitration proceedings, the State of Israel claims the amount of $265 million in respect of underpayment of royalties for the years 2000 through 2009, with the addition of interest and linkage differences, and change in the method of calculating royalty payments from the sale of metal magnesium.
After studying the State of Israel’s claims in respect of prior years, the Company believes, on the basis of a legal opinion it received, that the royalties it had paid and their manner of calculation are consistent with the provisions of the concession. The same method of calculation was applied consistently since the time that DSW was a government company, and the method was known to the State of Israel and accepted by it. Accordingly, and on the basis of the legal opinion the Company received, no provision was recorded in the financial statements as of March 31, 2014 with respect to royalties that the State of Israel contends were underpaid.
On May 19, 2014, a partial arbitration decision was received regarding the royalties’ issue. Based on the principles of the decision received, DSW is required to pay the State royalties on the sale of downstream products manufactured by companies that are controlled by ICL that have production plants located both in and outside the Dead Sea area, including outside of Israel. The royalties are to be paid according to the value of the downstream products, which will be determined in accordance to the formula described in Section 15(a)(2) of the Concession Deed, based on the selling price of the downstream products to unrelated third parties
,
less the deductions set forth in subsections (I), (II) and (III) of that Section. Regarding metal magnesium, it was decided that the State of Israel and DSW are to exhaust their discussions on the subject of the royalties to be paid by DSW on metal magnesium, and if no agreement is reached the matter is to be returned to arbitration. As a result of the partial arbitration decision, in the second quarter of 2014, the Company recorded a provision in the amount of approximately $135 million for the years 2000 through 2013
.
The amount of this provision includes, among other things, interest and is net of the tax effect (a total of about $149 million in respect of royalties relating to prior periods plus interest, in the amount of about $31 million, which was included in the financing expenses and net of the tax effect, in the amount of about $45 million, which was recognized as a tax benefit). The arbitrators’ decision is partial and is primarily directed at making a decision with respect to payment of royalties on downstream products, as noted above. The principles whereby the financial calculations are to be made have not yet been formulated. These principles will be discussed in the second stage of the arbitration. In the second stage of the arbitration proceeding, in January 2015, the Company submitted an interim calculation of the royalties. Such interim calculation does not take into account certain issues that have not yet been resolved, including, the minimum rate of the mineral in the downstream product that creates the liability to pay royalties for the downstream product. The amount of the royalties according to the interim calculation is significantly lower than the provision. The final amount to be ruled by the arbitrators, at the close of the second stage of arbitration proceeding, and after the financial calculation formulas are determined, as stated, may be materially different from the amount of the provision. The Company’s estimate in connection with the provision is based on various assumptions regarding the manner of calculation of the royalties deriving from the partial arbitration decision and reflects the best estimate of the expenditure that will be required to settle the obligation presently, as at the date of the report.
Dead Sea Works Class Action
On September 21, 2014, we received a motion submitted to the District Court in Israel to certify a class action against our subsidiary, Dead Sea Works. According to the motion, the plaintiff is a farmer who has bought and currently buys potash in Israel, which is produced by Dead Sea Works, for fertilization purposes and seeks to represent a group of class members that would include all purchasers of potash or products produced with potash in Israel from 2006, when potash prices were deregulated, through the date of the action. The plaintiff alleges that Dead Sea Works charged an excessive price for potash, contrary to the Israeli anti-trust laws, and seeks damages in the amount of approximately NIS 96.4 million (approximately $24.8 million). The total sales of potash in Israel in 2014 to the customers who, to the best of our understanding, constitute the group described above, account for less than 1% of our total sales in that year. In February 2015, DSW filed its response to the motion to certify the class action. In the estimation of the Company and its legal advisors, the chances that the class action will be certified are less than 50% and, accordingly, no provision was recorded in the financial statements.
Personal Injury Claims
During the 1990s, a claim was filed against some of our subsidiaries by plaintiffs from various countries who worked mostly as banana plantation workers, who allegedly were injured by exposure to di bromo chloropropane (“DBCP”) produced many years ago by a number of manufacturers, including large chemical companies and, according to the plaintiffs, some of our subsidiaries. As of December 31, 2014, our subsidiaries are parties to one legal proceeding filed by nine plaintiffs who are requesting certification of their claim as a class action. The claim is for bodily injury and therefore the amount of claimed damages has not been stated. In the opinion of management and our legal advisors, it is not possible to estimate the results of the above claims. Nonetheless, it is estimated that our overall exposure will not exceed $20 million. No provision was included in our financial statements in respect of the aforesaid claim.
Environmental Claims
Kishon River Wastewater Matters
The Company’s production site borders the Kishon River. For decades FCM, along with many other entities, municipalities and plants, has diverted wastewater into the Kishon River.
Between 2001 and 2005, a number of claims for monetary damages were filed in the Haifa District Court against the Company and a series of other defendants (including the State of Israel) by 50 individuals (or their heirs or dependents), most of them fishermen who had worked, according to the claims, in the Kishon’s fishing harbor. According to the plaintiffs, the flow of sewage to the Kishon River by each of the chemical plants operating on the river banks has caused the plaintiffs’ cancer and other illnesses. Dozens of factories, local governments and insurance companies were added as third party defendants. In the course of examining the claims, ten plaintiffs withdrew their claims, which were dismissed.
On November 3, 2013, a court judgment was rendered rejecting all the plaintiffs’ claims for damages and on February 9, 2014, the court charged all the plaintiffs for the defendants’ legal expenses, in the amount of about $1.2 million (about NIS 4.6 million). The Company’s share in the legal fees for which the plaintiffs were charged is about $0.3 million (about NIS 1.1 million). On September 1, 2014, notices of appeal were filed by seven plaintiffs. Based on an opinion of its legal advisors, the Company estimates that the chances that the appeals will succeed are low.
Between 2000 and 2007, a number of claims were filed in the District Court at Haifa against a list of defendants by former soldiers (and their heirs and dependents). The plaintiffs claim that contact with toxic substances in and around the Kishon River caused them cancer and other diseases (hereinafter –
“
the Claims of the Soldiers”). Several dozen factories (including the Company), governments, including the State of Israel, and insurance companies were added as third-party defendants.
On June 17, 2013, a court decision was rendered rejecting the claim for damages of 72 former soldiers (and their heirs and dependents) in the consolidated cases, with no order for expenses. The court decision did not include one claim of 17 soldiers that was not consolidated with the said claims (out of the 17 claims, one claim was rejected by consent). On September 8, 2013, the plaintiffs filed a notice of appeal in the Supreme Court and on November 18, 2013 some of the defendants, including the Company, filed a counter appeal with respect to the court’s decision not to order payment of expenses. On November 24, 2013, at the court’s request, the plaintiffs filed an amended notice of appeal. On December 9, 2014, a statement of summations was filed by the plaintiffs with reference to the appeal and thereafter a statement of summations was filed by the respondents in the appeal. Then court set a hearing date for oral supplementation of the summations in September 2015. Based on the evaluation of its legal advisors, and in light of the court’s detailed and reasoned decision, the Company estimates that the chances that of appeal succeeding are low.
As stated, the above mentioned decision does not include a claim of 16 soldiers that was heard as part of the said claims however that were not consolidated with them. Regarding this claim, the court decided to “stay” the hearing until after the decision of the Supreme Court regarding the claims with respect to which an appeal was filed.
Based on the court’s determinations with respect to the claims regarding which a decision has been rendered, as stated, the Company estimates, in reliance on its legal advisors, that the chances that this claim will prevail are low. No provisions have been included in the financial statements in connection with the above mentioned claims.
Naot Hovav Pollutant Matters
Three claims were filed with the District Court at Beer Sheva in March and June 2007 against the State of Israel and the Industrial Local Council at Naot Hovav, in whose jurisdiction the Naot Hovav plants operate, including the plants of our Industrial Products segment. The plaintiffs argue that various pollutants in the vicinity of Naot Hovav have caused their illnesses, including, among other things, respiratory diseases, spontaneous abortion, birth defects, diseases of the nervous system, cancer, and other illnesses. The claims rely, among other things, on results of an epidemiological study. The claims sue for sums for treatment expenses incurred by the plaintiffs, as well as compensation for pain and suffering, distress, and punitive damages. The plaintiffs are suing for a total sum of approximately $61 million.
In 2008, the Local Council and the State of Israel filed a third party notice against a number of plants at Naot Hovav, including factories of our Industrial Products segment.
On January 9, 2013, a judgment was rendered dismissing the claim. On February 20, 2013, the plaintiffs filed an appeal with the Supreme Court, which was rejected on September 29, 2014.
Spain Mining License Matters
Our subsidiary in Spain, Iberpotash (IBP), has two potash production centers in Spain in the towns of Suria and Sallent. As a by-product of the potash production process, salt is produced and heaps up in piles, most of which, at the present time, is not usable. In order to operate in Spain, there is a need for an environmental license and a urban license.
Regarding the Sallent site, in October 2013, the regional court issued a judgment disqualifying the Company’s environmental mining license (contending that there were defects in provision of the license by the government) and in February 2014, the urban license (contending that the license does not comply with the required conditions for piling up salt on the site). The court’s determination is not final, and the Company and the government of Catalonia have filed an appeal in the Spanish Supreme Court. The Company estimates that the legal process will last more than one year, such that there will be no significant effect on the Spanish mining operations since the Company expects to close the Vilafruns mine at Sallent prior to the end of 2016 as part of our efficiency plan. In addition, an agreement was made with the local planning board (CUCC), which permits the continued piling up of salt at the current production level up to June 30, 2017. This agreement requires approval by the Spanish Regional Court. If the Spanish Supreme Court does not accept the appeal described above, the Company will be required to enter into an administrative proceeding in order to obtain an environmental license that complies with the new environmental protection regulations in Spain (
autoritzacio substantive
).
Regarding the Suria site, in April 2014, after a favorable survey was received from the Environmental Protection Authority in Catalonia, the Company received an environmental license that complies with the new environmental protection regulations in Spain (
autoritzacio substantive
), this being after the Company first received the urban license. Prior to receipt of the said licenses, two legal proceedings were held against the government of Catalonia, relating to issuance of the urban and environmental licenses to the efficiency plan with respect to Iberpotash. As part of these proceedings, it was alleged that the project work requires a significant change in the environmental license and that the government must require the Company to conduct an environmental impact survey. Accordingly, the plaintiffs are requesting termination of the project work. In the Company’s estimation, upon renewal of the environmental license, continuation of the legal proceeding will become superfluous.
Securities Law Proceedings
On August 29, 2013, a motion to certify a class action against us, Israel Corporation, Potashcorp Cooperative Agricultural Society Ltd., the members of our Board of Directors and our CEO, was filed in the District Court in Tel Aviv, on the grounds of misleading information, deception and non-disclosure of material information in our reports, allegedly in violation of the provisions of the Israeli Securities Law and the general laws. The aggregate amount of the damage claimed is $0.79 billion (NIS 2.75 billion) or $0.95 billion (NIS 3.28 billion). (The amount of the claim depends on the share price used to calculate the claimed damages). In February 2014, a response to the motion was filed. In November 2014 a hearing was held on the motion to certify the claim as a class action. The plaintiffs submitted their summations and defendants will submit their summations in the case in the next several months. In our opinion, based on the position of our legal advisors, the chances that the claims against it will be rejected exceed the chances that they will be accepted. Accordingly, no provision was included in the financial statements.
Commercial Proceedings
Haifa Chemicals acquires potash from DSW as part of its manufacturing inputs. Pursuant to the agreement between DSW and Haifa Chemicals, the price for which Haifa Chemicals was charged was based on DSW’s average FOB price to its two largest customers in the preceding quarter. In 2008, an agreement between Haifa Chemicals and Dead Sea Works was cancelled and the parties failed to reach a new agreement. Haifa Chemicals believed that the price Dead Sea Works demanded in exchange for potash was unfair, based on the contention that it was unable to operate at that price. In 2009, Haifa Chemicals notified its employees of a shutdown of the production lines at its factory until purchase of potash could be resumed at prices it deemed acceptable. At the same time, Haifa Chemicals contacted the Israeli Minister of Finance and the Israeli Minister of Industry, Commerce and Labor and requested that they use their authority to subject potash prices to supervision. The parties agreed in principle to appoint an arbitrator to set the price of potash. Arbitration began in May 2009 and in March 2014, the arbitration decision was issued.
The decision includes a formula on the basis of which the selling price of potash between Dead Sea Works and Haifa Chemicals will be determined for a period of ten years from the date of the decision and with respect to the period from the commencement of arbitration. The price formula provides that the selling price during a quarter will be based on a price equal to the lower of the weighted average of the lowest three FOB selling prices of potash sold by Dead Sea Works in the prior quarter and the average of the two lowest FOB selling prices of potash sold by Dead Sea Works to major buyers (foreign buyers who purchase 150,000 or more tons per year) in the prior quarter, less certain expenses and a discount of 2% (“the base price”). In certain circumstances, this base price will be based on the production cost plus a certain margin. This adjusted price will apply to a quantity of 270 thousand tons of potash, while the base price would continue to apply to the remainder of the potash, however without a discount of 2%
.
In our estimation, based on estimates in accordance with the arbitration decision and taking into account other claims Haifa Chemicals has raised against us, the Company will not receive and will not pay significant amounts in respect of the past (2009-2013). As a result, no provisions were included and no income receivable was recorded in the financial statements.
In addition to the specific legal proceedings referred to above, a number of other claims are pending against the Company and various subsidiaries (including lawsuits), amounting to about $22
million in the aggregate as of December 31, 2014. We have recorded provisions in a total amount of about $2 million on account of such claims. In addition, part of these claims are covered by insurance policies. In the opinion of our management, the provisions recorded adequately reflect the exposure presented by these claims to the Company and its relevant subsidiaries.
Dividend policy
On March 27, 2007, our Board of Directors approved the payment of a quarterly dividend at a rate of up to 70% of our net income and reapproved that policy on May 24, 2010 and August 3, 2013. Any dividends must be approved by our Board of Directors, which will take into account various factors including, inter alia, our profits, our investment plan, our financial position, the progress relating to our strategy plan, the conditions prevailing in the market and additional factors they deem appropriate. Dividend payments are not guaranteed and our Board of Directors may decide, in its absolute discretion, at any time and for any reason, not to pay dividends, to reduce the rate, to pay a one-time dividend or to a adopt a buy-back plan.
The profits distributable as dividends as of December 31, 2014 amounted to $ 2,432 million.
The terms of certain of our existing indebtedness require us to maintain a minimum level of shareholders’ equity, which could restrict our ability to pay dividends in the future. See note 17(D) to our audited financial statements for additional information regarding covenants in our loan agreements and their impact on our ability to pay dividends.
In addition, the distribution of dividends is limited by Israeli law, which permits the distribution of dividends only out of distributable profits and only if there is no reasonable concern that such distribution will prevent us from meeting our existing and future obligations when they become due. Generally, dividends paid by an Israeli company are subject to an Israeli withholding tax
.
For a discussion of certain tax considerations affecting dividend payments, see “Item 10. Additional Information—E. Taxation.”
The following table sets forth the cash dividends we have paid on our ordinary shares since January 1, 2009.
|
Year Ended December 31,
|
Dividend per Ordinary Share (in U.S. dollars)
|
Total Dividends (in millions of U.S. dollars)
|
||||||
|
2009
|
0.44 | 549 | ||||||
|
2010
|
0.79 | 998 | ||||||
|
2011
|
0.88 | 1,131 | ||||||
|
2012
|
0.80 | 1,019 | ||||||
|
2013
|
0.50 | 634 | ||||||
|
2014
|
0.67 | 845 | ||||||
B. SIGNIFICANT CHANGES
To the best of our knowledge, no significant changes have occurred since the date of our consolidated financial statements.
A. OFFER AND LISTING DETAILS
New York Stock Exchange
The following table sets forth, for the periods indicated since September 24, 2014, which was the date on which our ordinary shares began trading on the New York Stock Exchange, the high and low sales prices of our ordinary shares as reported by the New York Stock Exchange
|
U.S. Dollar Price per
Ordinary Share
|
||||||||
|
High
|
Low
|
|||||||
|
Year Ended December 31 2014:
|
7.43 | 6.47 | ||||||
|
Year Ended December 31, 2014:
|
||||||||
|
Fourth Quarter
|
7.43 | 6.47 | ||||||
|
Year Ended December 31, 2015:
|
||||||||
|
First Quarter (through March 18)
|
7.65 | 6.85 | ||||||
|
Month Ended:
|
||||||||
|
September 30, 2014
|
7.23 | 7.05 | ||||||
|
October 31, 2014
|
7.22 | 6.68 | ||||||
|
November 30, 2014
|
7.29 | 6.76 | ||||||
|
December 31, 2014
|
7.43 | 6.47 | ||||||
|
January 31, 2015
|
7.41 | 7.16 | ||||||
|
February 28, 2015
|
7.65 | 7.05 | ||||||
|
March 31, 2015 (through March 18)
|
7.19 | 6.85 | ||||||
On March 18, 2015, the last reported sale price of our ordinary shares on the New York Stock Exchange was $6.85 per share.
Tel Aviv Stock Exchange
The following table shows the annual, quarterly and monthly ranges of the high and low per share sales price for our ordinary shares as reported by the TASE in NIS and U.S. dollars. U.S. dollar per ordinary share amounts are calculated using the U.S. dollar representative rate of exchange on the date to which the high or low market price is applicable, as reported by the Bank of Israel.
|
NIS price per ordinary share
|
USD price per ordinary share
|
|||||||||||||||
|
High
|
Low
|
High
|
Low
|
|||||||||||||
|
Year Ended December 31:
|
||||||||||||||||
|
2010
|
62.70 | 40.19 | 17.43 | 10.78 | ||||||||||||
|
2011
|
64.78 | 33.91 | 17.93 | 8.99 | ||||||||||||
|
2012
|
50.10 | 38.22 | 12.94 | 9.85 | ||||||||||||
|
2013
|
51.75 | 24.48 | 13.87 | 6.74 | ||||||||||||
|
2014
|
30.44 | 24.68 | 8.51 | 6.90 | ||||||||||||
|
Year Ended December 31, 2013:
|
||||||||||||||||
|
First Quarter
|
51.75 | 44.91 | 13.87 | 11.85 | ||||||||||||
|
Second Quarter
|
49.16 | 35.70 | 13.54 | 9.90 | ||||||||||||
|
Third Quarter
|
36.55 | 24.48 | 10.07 | 6.74 | ||||||||||||
|
Fourth Quarter
|
31.35 | 28.03 | 8.84 | 7.95 | ||||||||||||
|
Year Ended December 31, 2014:
|
||||||||||||||||
|
First Quarter
|
31.97 | 27.01 | 9.21 | 7.71 | ||||||||||||
|
Second Quarter
|
31.80 | 28.90 | 9.20 | 8.41 | ||||||||||||
|
Third Quarter
|
28.96 | 25.80 | 8.25 | 7.35 | ||||||||||||
|
Fourth Quarter
|
29.00 | 24.68 | 7.56 | 6.44 | ||||||||||||
|
Year Ended December 31, 2015:
|
||||||||||||||||
|
First Quarter (through March 18)
|
29.43 | 27.36 | 7.56 | 6.86 | ||||||||||||
|
Month Ended:
|
||||||||||||||||
|
September 30, 2014
|
28.96 | 25.80 | 7.98 | 7.11 | ||||||||||||
|
October 31, 2014
|
26.35 | 24.68 | 7.05 | 6.61 | ||||||||||||
|
November 30, 2014
|
27.38 | 25.24 | 7.15 | 6.59 | ||||||||||||
|
December 31, 2014
|
29.00 | 25.41 | 7.37 | 6.46 | ||||||||||||
|
January 31, 2015
|
29.18 | 28.25 | 7.39 | 7.16 | ||||||||||||
|
February 28, 2015
|
29 .43 | 27.36 | 7.56 | 7.03 | ||||||||||||
|
March 31, 2015 (through March 18)
|
28.89 | 27.55 | 7.20 | 6.86 | ||||||||||||
On March 18, 2015, the last reported sale price of our ordinary shares on the TASE was NIS 27.55 per share, or $6.85 per share (based on the exchange rate reported by Bank of Israel on such date, which was NIS 4.02 = $1.00).
B. PLAN OF DISTRIBUTION
Not applicable.
C. MARKETS
Our ordinary shares are listed on the NYSE and on the TASE under the symbol “ICL.”
D. SELLING SHAREHOLDERS
Not applicable.
E. DILUTION
Not applicable.
F. EXPENSES OF THE ISSUE
Not applicable.
A. SHARE CAPITAL
Regarding the issuance of options and restricted shares to officers and senior employees and their exercise in 2013-2014, and regarding the allocation of restricted shares to Company directors and the approval of the issuance of restricted shares to directors dated February 26, 2015, see Note 24 to the financial statements.
To the Company’s best knowledge and as per reports received from its shareholders, in the years 2013 and 2014, there were no significant transactions in the Company shares, except for a transfer, for no consideration, of 2,216,131 dormant shares of the Company held by a subsidiary fully controlled by the Company, and excluding the sale of Company shares in a sale offer and a financial transaction by Israel Corporation (the controlling shareholder), as follows:
On September 24, 2014, Israel Corporation issued an immediate report regarding its engagement in transactions in connection with the Company shares by way of an offer for sale and a financial transaction for a total of 78.4 million shares, the completion of the pricing in connection with the sale of Company shares according to a prospectus filed by the Company in the U.S. and its engagement in an underwriting agreement. On the same day, the Company signed an underwriting agreement with Israel Corporation and with the underwriters who accompanied the transactions that are subject of Israel’s Corporation Report, which includes, inter alia, representations and indemnification arrangements between the underwriters, Israel Corporation and the Company, as well as a lock-up undertaking of the Company’s officers with regards to its shares for a period of 180 days, subject to the terms and exceptions agreed upon. On the same day trading in the Company shares began in the New York Stock Exchange (NYSE). On October 12, 2014, Israel Corporation issued an immediate report on the aforementioned underwriters’ announcement that they exercised the option granted to them under the underwriting agreement to acquire 6,015,814 ordinary Company shares at the offering price. After the exercise of the option, Israel Corporation’s holding of the Company stands at 46.17% as of today. It should be noted that Israel Corporation’s voting rights is determined considering the shares involved in the financial transaction. The shares subject to the financial transaction (36,207,128) are borrowed shares and Israel Corporation has equity rights in respect of these shares.
B. MEMORANDUM, ARTICLES OF ASSOCIATION AND SPECIAL STATE SHARE
Our shareholders adopted the Articles of Association filed as Exhibit 3.2 to our registration statement on Form F-1 (File no. 333-198711) with the SEC on September 12, 2014.
We incorporate by reference into this Annual Report the description of our Amended and Restated Articles of Association, which became effective upon the closing of our IPO on the NYSE, contained in our F-1 registration statement (File No. 333-198711) originally filed with the SEC on September 12,2014, as amended. Such description sets forth a summary of certain provisions of our articles of association as currently in effect.
The State of Israel holds a nontransferable Special State Share in ICL in order to preserve the State’s vital interests. Any change in provisions of our Articles of Association relating to the rights attached to the Special State Share requires approval from the State of Israel. The Special State Share grants its holder the rights described below.
Without the approval of the holder of the Special State Share, the sale or transfer of material assets of the Company or granting any other rights in the abovementioned assets, not in the ordinary course of our business, whether in one transaction or in a series of transactions, is invalid. The holder of the Special State Share has the right to oppose the transfer of a material asset as stated above only if, in its opinion, such transfer is likely to harm one of the “State’s vital interests” enumerated below. Restrictions are similarly imposed on voluntary liquidation, mergers and reorganizations, excluding certain exceptional cases enumerated in our Articles of Association.
In addition, without the approval of the holder of the Special State Share, any acquisition or holding of 14% or more of our outstanding share capital is not valid. In addition, any acquisition or holding of 25% or more of our outstanding share capital (including an increase of holdings to 25%) is not valid without the approval of the holder of the Special State Share, even if in the past the approval of the holder of the Special State Share had been received for ownership of less than 25%. Our Articles of Association set forth procedures required to be followed by a person who intends to acquire shares in an amount that would require the approval of the holder of the Special State Shares. A pledge over shares is treated like an acquisition of shares. As a condition to voting at any shareholders’ meeting, each interested party in the Company, including a holder of 5% or more of our outstanding shares, will be required to certify in writing that the voting power derived from the holding of shares does not require the approval of the holder of the Special State Share or that such approval has been obtained.
In addition to the above, the approval of the holder of the Special State Share is required for the ownership of any shares that grant their holder the right, ability or practical potential to appoint directly or indirectly 50% or more of our directors, and such appointments will not be valid as long as that approval has not been obtained.
The holder of the Special State Share has the right to receive information from us, as provided in our Articles of Association. Our Articles of Association also provide that the holder of the Special State Share will use this information only to exercise its rights under the Articles of Association for purposes of protecting the State’s vital interests.
Our Articles of Association also impose a periodic reporting obligation on us for the benefit of the holder of the Special State Share, regarding all asset-related transactions approved by our Board of Directors during the three months prior to the date of the report, any changes in share capital ownership and any voting agreements among the Company’s shareholders signed during that period.
The following are the “State’s vital interests” as defined in our Articles of Association for purposes of the Special State Share:
To preserve the character of the Company and its subsidiaries Dead Sea Works, Rotem, Dead Sea Bromine Company, Bromine Compounds and Tami as Israeli companies whose centers of business and management are in Israel. In our estimation, this condition is being fulfilled.
To monitor the control over minerals and natural resources, for purposes of their efficient development and utilization, including maximum utilization in Israel of the results of investments, research and development.
To prevent acquisition of a position of influence in the Company or the foregoing Israeli subsidiaries by hostile entities or entities likely to harm foreign relations or security of the State of Israel.
To prevent acquisition of a position of influence in the Company or the foregoing Israeli subsidiaries or management of such companies, whereby such acquisition or management will create a situation of significant conflicts of interest likely to negatively impact one of the vital interests enumerated above.
Furthermore, our headquarters and the ongoing management and control over our business activities must be in Israel. The majority of the members of our Board of Directors must be Israeli citizens and residents. In general, meetings of our Board of Directors must take place in Israel.
Other than the rights enumerated above, the Special State Share does not grant the holder any voting or equity rights.
The State of Israel also holds a Special State Share in the following ICL subsidiaries: Dead Sea Works, Dead Sea Bromine Company, Rotem, Bromine Compounds, Tami and Dead Sea Magnesium. The rights granted by these shares according to the Articles of Association of these subsidiaries are substantially similar to the rights enumerated above. The full provisions governing the rights of the Special State Share appear in our Articles of Association and in the Articles of Association of Dead Sea Works, Rotem, Dead Sea Bromine Company, Bromine Compounds, Tami and Dead Sea Magnesium and are available for the public’s review. We report to the State of Israel on an ongoing basis in accordance with the provisions of our Articles of Association. Certain asset transfer or sale transactions that in our opinion require approval, have received the approval of the holder of the Special State Share.
C. MATERIAL CONTRACTS
Except as otherwise disclosed in this Annual Report, we are not currently, and have not been in the last two years, party to any material contract, other than contracts entered into in the ordinary course of business.
D. EXCHANGE CONTROLS
There are currently no Israeli currency control restrictions on payments of dividends or other distributions with respect to our ordinary shares or the proceeds from the sale of the shares, except for the obligation of Israeli residents to file reports with the Bank of Israel regarding certain transactions. However, legislation remains in effect pursuant to which currency controls can be imposed by administrative action at any time.
E. TAXATION
Israeli Tax Considerations
Taxation of the Company
General Corporate Tax Structure
Israeli companies are generally subject to corporate tax on their taxable income at the rate of 25% for the 2013 tax year and 26.5% for the 2014 tax year. Pursuant to an amendment to the Israeli Income Tax Ordinance (New Version), 1961 (the “Tax Ordinance”), which came into effect on January 1, 2014, the corporate tax rate is scheduled to remain at 26.5% for future tax years. Israeli companies are generally subject to capital gains tax at the corporate tax rate. For information about the new “natural resources tax” proposed by the Sheshinski Committee, see “Item 8. Financial Information—A. Consolidated Statements and Other Financial Information—Legal Proceedings.”
Tax Benefits under the Law for the Encouragement of Capital Investments, 1959 - Amendment of the Investments Law 2005
On April 1, 2005, an amendment to the Law for Encouragement of Capital Investments, 1959 (“the Investments Encouragement Law”) came into effect, which is referred to as Amendment No. 60. Amendment No. 60 revised the criteria for investments qualified to receive tax benefits. An eligible investment program under the amendment will qualify for benefits as a Benefited Enterprise (rather than the previous terminology of Approved Enterprise). Among other things, the Amendment 60 provides tax benefits to both local and foreign investors and simplifies the approval process. The period of the tax benefits for a new Benefited Enterprise commences in the later of – the election year, wherein the company’s notice regarding its eligibility for benefits was filed with the Assessing Officer, or the first year in which the Benefited Enterprise
company has taxable income
. Amendment No. 60 applies to Benefited Enterprise programs in which the year of commencement of benefits under the Investments Law is 2004 or later, unless such programs received “Approved Enterprise” approval from the Investment Center on or prior to March 31, 2005, in which case the provisions of the amendment do not apply. Generally, under the amendment a company that is Abundant in Foreign Investment (as defined in the Investments Law) is entitled to an extension of the benefits period by an additional five years, depending on the rate of its income that is derived in foreign currency.
Amendment No. 60 changed the definition of “foreign investment” in the Investments Law to require a minimal investment of NIS five million by foreign investors. Furthermore, such definition was also amended to include the purchase of outstanding shares of the company from an existing shareholder, provided that the company’s outstanding and paid up share capital exceeds NIS five million. Such changes to the aforementioned definition are retroactive from 2003.
Amendment No. 60 also added a specific taxation package, referred to as the “Ireland Track”. Upon election, the Ireland Track provides for a 10 year term with a corporate tax rate of 11.5% and either a tax rate of 4% on the distribution of dividends to foreign investors (15% to Israeli resident investors), with no further corporate tax implications on the distributing company, or an exemption from tax provided that the company distributes no dividends from this source.
As of December 31, 2014, we have trapped earnings of $754 million (2014 was the final year for benefits in the tax-exempt package),
The production facilities of several group companies in Israel claimed Benefited Enterprise status under the Investments Law, and specifically under the Ireland Track. We believe our Benefited Enterprises operate in substantial compliance with all applicable conditions and criteria. We cannot assure you that our programs will continue to receive benefits at the current levels, if at all. For further information, see Note 20 to our audited financial statements included elsewhere in this Annual Report.
Reform of the Investments Law—2011
On December 29, 2010, the Israeli Parliament approved an amendment to the Investments Law, effective as of January 1, 2011, which constitutes a reform of the incentives regime under such law, or the Investments Law Reform. Its provisions apply with respect to “preferred income” (as defined in the Investments Law Reform) produced from or generated by a new type of program called a Preferred Enterprise or Special Preferred Enterprise. The Investments Law Reform replaces the previous regime of Approved Enterprises and Benefitted Enterprises, although pre-existing programs are permitted to continue until the expiration thereof.
The Investments Law Reform modifies the objectives of the Investments Law to focus on achieving enhanced growth in the business sector, improving the Israeli industry’s competitiveness in international markets and creating employment and development opportunities in remote areas of Israel. It allows enterprises meeting certain criteria to enjoy grants as well as tax benefits. It also introduces changes to the map of geographic development areas for purposes of entitlement to preferential terms under the Investments Law.
The main points of the Investments Law Reform are a standard reduced tax rate on all revenues that are entitled to benefits, which include the following:
|
|
·
|
A reduced corporate tax rate for industrial enterprises, provided that at least 25% of their annual income is derived from export, which will apply to the enterprise’s entire preferred income, such that in the tax years 2011-2012 the reduced tax rate was 10% for preferred income derived from industrial facilities located in development area A and 15% for those located elsewhere in Israel, in the tax year 2013 the reduced tax rate was 7% for development area A and 12.5% for the rest of Israel, and in the tax year 2014 and onwards the reduced tax rate will be 9% for development area A and 16% for the rest of Israel.
|
|
|
·
|
The reduced tax rates will no longer be contingent upon making a minimum qualifying investment in productive assets, as was required prior to the Investments Law Reform.
|
|
|
·
|
A definition of “preferred income” was introduced into the Investments Law to include certain types of income that are generated by the Israeli production activity of a Preferred Enterprise.
|
|
|
·
|
A reduced dividend withholding tax rate of 15% for the tax year 2013 and 20% for the tax year 2014 and onwards will apply to dividends paid from preferred income to both Israeli and non-Israeli investors, with an exemption from such withholding tax applying to dividends paid to an Israeli company.
|
|
|
·
|
A special tax benefits route will be granted to certain industrial enterprises entitling them to a reduced tax rate of 5% for preferred income derived from industrial facilities located in development area A and 8% for
those located elsewhere in Israel, provided that certain criteria are met and such enterprise can demonstrate its significant contribution to Israel’s economy and promotion of national market objectives.
|
The Investments Law Reform provides various transition provisions which allow, under certain circumstances, the application of the new regime to investment programs previously approved or elected under the Investments Law.
Under the Investments Law Reform, incentives are not available to an industrial enterprise that is a mine, another plant for the extraction of minerals, or an oil exploration enterprise. Consequently, our plants that are defined as mining or mineral extraction operations will be unable to benefit from the incentives under the Investments Law Reform. The Investments Law Reform did not affect the incentives under pre-existing Approved Enterprises and Benefitted Enterprises, which are permitted to continue until the expiration thereof under law.
Tax Benefits Under the Law for the Encouragement of Industry (Taxes)
According to the Law for the Encouragement of Industry (Taxes), 1969, or the Industry Encouragement Law, an “industrial company” is a company resident in Israel, at least 90% of the income of which, in a given tax year, determined in Israeli currency (exclusive of income from certain government loans, capital gains, interest and dividends), is derived from an enterprise whose major activity in a given tax year is industrial production activity.
Under the Industry Encouragement Law, industrial companies are entitled to the following preferred corporate tax benefits:
|
|
·
|
Amortization of purchases of know-how and patents over an eight year period for tax purposes;
|
|
|
·
|
Deductions over a three year period of expenses involved with the issuance and listing of shares on a stock market;
|
|
|
·
|
The right to elect, under specified conditions, to file a consolidated tax return with additional related Israeli industrial companies; and
|
|
|
·
|
Accelerated depreciation rates on equipment and buildings (subject to the extension of certain regulations).
|
Eligibility for benefits under the Industry Encouragement Law is not subject to receipt of prior approval from any governmental authority.
We believe that we currently qualify as an industrial company within the definition of the Industry Encouragement Law. We cannot assure you that we will continue to qualify as an industrial company or that the benefits described above will be available to us in the future.
Israeli Transfer Pricing Regulations
On November 29, 2006, Income Tax Regulations (Determination of Market Terms), 2006, promulgated under Section 85A of the Tax Ordinance, came into effect. Section 85A of the Tax Ordinance and such regulations generally require that all cross border transactions carried out between associated parties, as defined by the Tax Ordinance, will be conducted on an arm’s length basis and will be taxed accordingly. The Company and its Israeli subsidiaries conduct transactions with non-Israeli group companies and believe they are in compliance with Section 85A of the Tax Ordinance and such regulations. However, no assurance can be given that the Israeli tax authorities will not challenge the pricing for any of our related party transactions.
Taxation of Investors
The following are material Israeli income tax consequences to the investors described below of owning and disposing of our ordinary shares, but it does not purport to be a comprehensive description of all the tax considerations that may be relevant to a particular person’s decision to own the ordinary shares.
Capital Gains Tax
Israeli law generally imposes a capital gains tax on the sale of any capital assets by residents of Israel, as defined for Israeli tax purposes, and on the sale of capital assets located in Israel, including shares of Israeli companies, by non-residents of Israel, unless a specific exemption is available or unless a tax treaty between Israel and the shareholder’s country of residence provides otherwise. The law distinguishes between real gain and inflationary surplus. The inflationary surplus is a portion of the total capital gain that is equivalent to the increase of the relevant asset’s purchase price which is attributable to the increase in the Israeli consumer price index or a foreign currency exchange rate between the date of purchase and the date of sale. The real gain is the excess of the total capital gain over the inflationary surplus.
Israeli Residents
Generally, as of January 1, 2012, the tax rate applicable to capital gains derived from the sale of shares, whether listed on a stock market or not, is the corporate tax rate in Israel (26.5% commencing from January 2014) for Israeli companies and 25% for Israeli individuals, unless such shareholder claims a deduction for finance expenses in connection with such shares, in which case the gain will generally be taxed at a rate of 30%. Additionally, if such shareholder is considered a “significant shareholder” at any time during the 12 month period preceding such sale, the tax rate will be 30%. A “significant shareholder” is defined as one who holds, directly or indirectly, including together with others, at least 10% of any means of control in the company. However, different tax rates will apply to dealers in securities. Israeli companies are subject to the corporate tax rate on capital gains derived from the sale of listed shares.
As of January 1, 2013, shareholders who are individuals with taxable income that exceeds NIS 800,000 in a tax year (linked to the Israeli consumer price index each year—NIS 811,560 for 2014) will be subject to an additional tax at the rate of 2% on the portion of their taxable income for such tax year that is in excess such threshold. For this purpose, taxable income includes taxable capital gains from the sale of our shares and taxable income from dividend distributions.
Non Israeli Residents
Non Israeli residents are generally exempt from Israeli capital gains tax on any gains derived from the sale of shares of Israeli companies publicly traded on a recognized stock exchange outside Israel, so long as such shareholders did not acquire their shares prior to the company’s initial public offering and the gains did not derive from a permanent establishment of such shareholders in Israel. However, shareholders that are non-Israeli corporations will not be entitled to such exemption if Israeli residents hold an interest of more than 25% in such non Israeli corporation or are the beneficiaries or are entitled to 25% or more of the revenues or profits of such non Israeli corporation, whether directly or indirectly.
In certain instances where our shareholders may be liable to Israeli tax on the sale of their ordinary shares, the payment of the consideration may be subject to the withholding of Israeli tax at the source.
In addition, pursuant to the Convention between the Government of the United States of America and the Israeli government with respect to Taxes on Income, as amended, or the U.S. Israel Tax Treaty, the sale, exchange or disposition of ordinary shares by a person who qualifies as a resident of the United States within the meaning of the U.S. Israel Tax Treaty and who is entitled to claim the benefits afforded to such person by the U.S. Israel Tax Treaty generally will not be subject to the Israeli capital gains tax unless such person holds, directly or indirectly, shares representing 10% or more of our voting power during any part of the 12 month period preceding such sale, exchange or disposition, subject to particular conditions, or the capital gains from such sale, exchange or disposition can be allocated to a permanent establishment in Israel or is considered to be derived from or sale of Israeli real property interests for purposes of the U.S. Israel Tax Treaty. If a U.S. investor is not exempt from Israeli taxes under the U.S. Israel Tax Treaty, such U.S. investor may be subject to Israeli tax, to the extent applicable as described above; however, under the U.S. Israel Tax Treaty, such person may be permitted to claim a credit for such taxes against the U.S. federal income tax imposed with respect to such sale, exchange or disposition, subject to the limitations in U.S. laws applicable to foreign tax credits. The U.S. Israel Tax Treaty does not relate to U.S. state or local taxes.
Taxation of Dividend Distributions
Israeli Residents
Israeli resident individuals are generally subject to Israeli income tax on the receipt of dividends paid on our ordinary shares, other than bonus shares (share dividends). As of January 1, 2012, the tax rate applicable to such dividends is 25% or 30% for a shareholder that is considered a significant shareholder at any time during the 12 month period preceding such distribution. Dividends paid from income derived from Approved, Benefited or Preferred Enterprises (accrued up to December 31, 2013) are subject to withholding at the rate of 15%. Dividends paid from income derived from Approved or Preferred Enterprises accrued from January 1, 2014 will be subject to withholding at the rate of 20%.
Israeli resident companies are generally exempt from tax on the receipt of dividends paid on our ordinary shares (excluding dividends paid from income derived from Approved or Benefited Enterprises).
We cannot assure you that we will designate the profits that are being distributed in a way that will reduce shareholders’ tax liability.
Non Israeli Residents
Non-residents of Israel are subject to income tax on income accrued or derived from sources in Israel, including dividends paid by Israeli companies. On distributions of dividends other than stock dividends, income tax (generally collected by means of withholding) will generally apply at the rate of 25%, or 30% for a shareholder that is considered a significant shareholder (as defined above) at any time during the 12 month period preceding such distribution, unless a different rate is provided in a treaty between Israel and the shareholder’s country of residence. Dividends paid from income derived from Approved, Benefited or Preferred Enterprises (accrued up to December 31, 2013) are subject to withholding at the rate of 15%, or 4% for Benefited Enterprises in the Ireland Track. Dividends paid from income derived from Approved or Preferred Enterprises accrued from January 1, 2014 will be subject to withholding at the rate of 20%.
If the dividend is attributable partly to income derived from an Approved, Benefited or Preferred Enterprise, and partly to other sources of income, the withholding rate will be a weighted average rate reflecting the relative portions of the various types of income.
Under the U.S. Israel Tax Treaty, the maximum tax on dividends paid to a holder of ordinary shares who qualifies as a resident of the United States within the meaning of the U.S. Israel Tax Treaty is 25%. The treaty provides for reduced tax rates on dividends if (a) the shareholder is a U.S. corporation holding at least 10% of our issued voting power during the part of the tax year that precedes the date of payment of the dividend and held such minimal percentage during the whole of its prior tax year, and (b) not more than 25% of the Israeli company’s gross income consists of interest or dividends, other than dividends or interest received from subsidiary corporations or corporations 50% or more of the outstanding voting shares of which is owned by the Israeli company. The reduced treaty rate, if applicable, is 15% in the case of dividends paid from income derived from Approved, Benefited or Preferred Enterprise or 12.5% otherwise.
Material U.S. Federal Income Tax Considerations for U.S. Holders
The following are material U.S. federal income tax consequences to the U.S. Holders described below of owning and disposing of our ordinary shares, but it does not purport to be a comprehensive description of all the tax considerations that may be relevant to a particular person’s decision to hold the ordinary shares. This discussion applies only to a U.S. Holder that holds the ordinary shares as capital assets for U.S. federal income tax purposes. In addition, it does not describe all of the tax consequences that may be relevant in light of a U.S. Holder’s particular circumstances, including alternative minimum tax consequences, any aspect of the provisions of the Internal Revenue Code of 1986, as amended (the “Code”) commonly known as the Medicare tax and tax consequences applicable to U.S. Holders subject to special rules, such as:
|
|
·
|
certain financial institutions;
|
|
|
·
|
dealers or traders in securities that use a mark-to-market method of tax accounting;
|
|
|
·
|
persons holding ordinary shares as part of a “straddle” or integrated transaction or persons entering into a constructive sale with respect to the ordinary shares;
|
|
|
·
|
persons whose functional currency for U.S. federal income tax purposes is not the U.S. dollar;
|
|
|
·
|
entities classified as partnerships for U.S. federal income tax purposes;
|
|
|
·
|
tax exempt entities, “individual retirement accounts” or “Roth IRAs”;
|
|
|
·
|
Persons who acquired our ordinary shares pursuant to the exercise of an employee stock option or otherwise as compensation;
|
|
|
·
|
persons that own or are deemed to own 10% or more of our voting stock; or
|
|
|
·
|
persons holding our ordinary shares in connection with a trade or business conducted outside of the United States.
|
If an entity that is classified as a partnership for U.S. federal income tax purposes owns ordinary shares, the U.S. federal income tax treatment of a partner will generally depend on the status of the partner and the activities of the partnership. Partnerships owning ordinary shares and partners in such partnerships should consult their tax advisers as to the particular U.S. federal tax consequences of owning and disposing of the ordinary shares.
This discussion is based on the Code, administrative pronouncements, judicial decisions, and final and proposed Treasury regulations, changes to any of which subsequent to the date of this offering may affect the tax consequences described herein.
For purposes of this discussion, a “U.S. Holder” is a person who, for U.S. federal income tax purposes, is a beneficial owner of ordinary shares and is:
|
|
·
|
a citizen or individual resident of the United States;
|
|
|
·
|
a corporation, or other entity taxable as a corporation, created or organized in or under the laws of the United States, any state therein or the District of Columbia; or
|
|
|
·
|
an estate or trust the income of which is subject to U.S. federal income taxation regardless of its source.
|
U.S. Holders should consult their tax advisers concerning the U.S. federal, state, local and foreign tax consequences of owning and disposing of our ordinary shares in their particular circumstances.
This discussion assumes that we are not, and will not become, a passive foreign investment company, as described below.
Taxation of Distributions
Distributions paid on our ordinary shares, other than certain pro rata distributions of ordinary shares, will be treated as dividends to the extent paid out of our current or accumulated earnings and profits (as determined under U.S. federal income tax principles). Because we do not calculate our earnings and profits under U.S. federal income tax principles, it is expected that distributions generally will be reported to U.S. Holders as dividends. Subject to applicable limitations, dividends paid to certain non-corporate U.S. Holders may be taxable at the favorable tax rates applicable to “qualified dividend income”. Non-corporate U.S. Holders should consult their tax advisers regarding the availability of these favorable rates on dividends in their particular circumstances. Dividends will not be eligible for the dividends received deduction generally available to U.S. corporations under the Code. Dividends will generally be included in a U.S. Holder’s income on the date of receipt. Dividend income will include any amounts withheld by us in respect of Israeli taxes, and will be treated as foreign source income for foreign tax credit purposes. If any dividend is paid in NIS, the amount of dividend income will be the dividend’s U.S. dollar amount calculated by reference to the exchange rate in effect on the date of receipt, regardless of whether the payment is in fact converted into U.S. dollars. If the dividend is converted into U.S. dollars on the date of receipt, a U.S. Holder should not be required to recognize foreign currency gain or loss in respect of the dividend income. A U.S. Holder may have foreign currency gain or loss if the dividend is converted into U.S. dollars after the date of receipt. Such gain or loss would generally be treated as U.S.-source ordinary income or loss. Subject to applicable limitations, some of which vary depending upon the U.S. Holder’s circumstances, Israeli taxes withheld from dividends on our ordinary shares will be creditable against the U.S. Holder’s U.S. federal income tax liability. The rules governing foreign tax credits are complex, and U.S. Holders should consult their tax advisers regarding the creditability of foreign taxes in their particular circumstances. In lieu of claiming a foreign tax credit, U.S. Holders may, at their election, deduct foreign taxes, including Israeli taxes, in computing their taxable income, subject to applicable limitations. An election to deduct foreign taxes instead of claiming foreign tax credits applies to all foreign taxes paid or accrued in the taxable year.
Sale or Other Taxable Disposition of Ordinary Shares
For U.S. federal income tax purposes, gain or loss realized on the sale or other taxable disposition of our ordinary shares will be capital gain or loss, and will be long term capital gain or loss if the U.S. Holder held the ordinary shares for more than one year. The amount of the gain or loss will equal the difference between the U.S. Holder’s tax basis in the ordinary shares disposed of and the amount realized on the disposition, in each case as determined in U.S. dollars. This gain or loss will generally be U.S. source gain or loss for foreign tax credit purposes. The deductibility of capital losses is subject to limitations.
Passive Foreign Investment Company Rules
In general, a non U.S. corporation will be a “passive foreign investment company” (a “PFIC”) for any taxable year if (i) 75% or more of its gross income consists of passive income or (ii) 50% or more of the average quarterly value of its assets consists of assets that produce, or are held for the production of, passive income. For purposes of the above calculations, a non U.S. corporation that directly or indirectly owns at least 25% by value of the shares of another corporation is treated as if it held its proportionate share of the assets of the other corporation and received directly its proportionate share of the income of the other corporation. Passive income generally includes dividends, interest, rents, royalties and gains from transactions in commodities (other than certain active business gains from the sales of commodities).
Based on the manner in which we operate our business, we believe that we were not a PFIC for 2014. However, because PFIC status depends on the composition and character of a company’s income and assets and the value of its assets from time to time, there can be no assurance that we will not be a PFIC for any taxable year.
If we were a PFIC for any taxable year during which a U.S. Holder held ordinary shares, gain recognized by a U.S. Holder on a sale or other disposition (including certain pledges) of the ordinary shares would be allocated ratably over the U.S. Holder’s holding period for the ordinary shares. The amounts allocated to the taxable year of the sale or other disposition and to any year before we became a PFIC would be taxed as ordinary income. The amount allocated to each other taxable year would be subject to tax at the highest rate in effect for individuals or corporations, as appropriate, for that taxable year, and an interest charge would be imposed on the resulting tax liability for each such taxable year. Further, any distribution in respect of ordinary shares in excess of 125% of the average of the annual distributions received by a U.S. Holder during the preceding three years or the U.S. Holder’s holding period, whichever is shorter, would be subject to taxation in the same manner. Certain elections may be available that would result in alternative treatments (such as mark-to-market treatment) of the ordinary shares in the case that we were a PFIC for any taxable year.
If we were a PFIC for any taxable year during which a U.S. Holder owned ordinary shares, the U.S. Holder generally will be required to file annual reports on Internal Revenue Service Form 8621. In addition, the favorable tax rates described above with respect to dividends paid to certain non-corporate U.S. Holders would not apply if we were a PFIC for the taxable year of distribution or the preceding taxable year.
Information Reporting and Backup Withholding
Payments of dividends and sales proceeds that are made within the United States or through certain U.S. related financial intermediaries generally are subject to information reporting, and may be subject to backup withholding, unless (i) the U.S. Holder is a corporation or other exempt recipient or (ii) in the case of backup withholding, the U.S. Holder provides a correct taxpayer identification number and certifies that it is not subject to backup withholding. Backup withholding is not an additional tax.
The amount of any backup withholding from a payment to a U.S. Holder will be allowed as a credit against the U.S. Holder’s U.S. federal income tax liability and may entitle it to a refund, provided that the required information is timely furnished to the Internal Revenue Service.
Certain U.S. Holders who are individuals (and under proposed regulations, certain entities controlled by individuals) may be required to report information relating to their ownership of securities of non U.S. issuers, such as our ordinary shares, unless the securities are held in accounts at financial institutions (in which case the accounts may be reportable if maintained by non U.S. financial institutions). U.S. Holders should consult their tax advisers regarding their reporting obligations with respect to the ordinary shares.
F. DIVIDENDS AND PAYING AGENTS
Not applicable.
G. STATEMENT BY EXPERTS
Not applicable.
H. DOCUMENTS ON DISPLAY
We are subject to the informational requirements of the Exchange Act. Accordingly, we are required to file reports and other information with the SEC, including annual reports on Form 20-F and reports on Form 6-K. You may inspect and copy reports and other information filed with the SEC at the Public Reference Room at 100 F Street, N.E., Washington, D.C. 20549. Information on the operation of the Public Reference Room may be obtained by calling the SEC at 1-800-SEC-0330. In addition, the SEC maintains an Internet website that contains reports and other information about issuers, like us, that file electronically with the SEC. The address of that website is www.sec.gov.
I. SUBSIDIARY INFORMATION
The Company and its subsidiaries do not maintain any direct or indirect connection with Iran or with enemy nations (as defined in the Israel Trade with the Enemy Ordinance - 1939).
Risk Management
In the ordinary course of our business activities, we are exposed to various market risks that are beyond our control, including fluctuations in the prices of certain of our products and inputs, currency exchange rates, interest rates, energy prices and marine shipping prices, that may have an adverse effect on the value of our financial assets and liabilities, future cash flows and profit. As a result of these market risks, we could suffer a loss due to adverse changes in the prices of our products or our inputs, foreign exchange rates, interest rates, energy prices or marine shipping prices.
For financial assets and financial liabilities in currencies that are not the functional currency of our subsidiaries, our policy is to minimize this exposure as far as possible by the use of various hedging instruments. We do not hedge against severance pay liabilities or our tax results since the exposure is long term. We do not use hedging instruments to hedge the prices of our products. For hedging against the prices of crude oil, marine shipping prices, projected income and expenses in currencies that are not the functional currency of our subsidiaries, and interest rates, our policy is to hedge, as described below.
We regularly monitor the extent of our exposure and the hedging rates for the various risks described below. The hedging policy for all types of exposure is discussed by our Board of Directors as part of the annual budget discussions, and our Board of Directors establishes our maximum exposure according to a value at risk model. Together with a report on the quarterly financial results, our audit and finance committee receives quarterly reports on exposure and hedging rates and determines if our hedging policy should be revised. Management implements our hedging policy with reference to actual developments and expectations in the various markets.
We use financial instruments and derivatives for hedging purposes only. These hedging instruments reduce our exposure as described above. These transactions do not meet the hedging conditions provided in IFRS, and therefore they are measured at fair value, and changes in the fair value are charged immediately to profit and loss. The counterparties for our derivatives transactions are banks. We believe the credit risk in respect thereof is negligible.
For additional information about our hedging activities, see Note 27 to our audited financial statements.
Exchange Rate Risk
The U.S. dollar is the principal currency of the business environment in which most of our subsidiaries operate. The majority of our activities—sales, purchase of materials, selling, marketing expenses and financing expenses, as well as the purchase of property, plant and equipment—are executed mainly in U.S. dollars, and so the U.S. dollar is used as the functional currency for measurement and reporting of the Company and the majority of our subsidiaries.
We have a number of consolidated subsidiaries overseas and one local subsidiary in Israel, whose functional currencies are their local currency—mainly the euro, the British pound, the Brazilian real, the Israeli shekel and the Chinese yuan.
Set forth below is a description of our principal exposures in respect of changes in currency exchange rates.
Transactions by our subsidiaries in currencies that are not their functional currency expose us to changes in the exchange rates of those currencies compared with the functional currencies of those companies. Measurement of this type of our exposure is based on the ratio of net income to expenses in each currency that is not the functional currency of that company.
Part of the costs of our inputs in Israel are denominated and paid in NIS. Thus, we are exposed to a strengthening of the NIS exchange rate against the U.S. dollar (NIS appreciation). This exposure is similar in substance to the exposure described above for transactions in foreign currencies but is much larger than the other currency exposures.
The results for tax purposes of us and our subsidiaries operating in Israel are measured in NIS. As a result, we are exposed to the rate of the change in the U.S. dollar exchange rate and the measurement base for tax purposes (the NIS) in respect of those subsidiaries.
Our subsidiaries have severance pay liabilities that are denominated in the local currency, and in Israel they are sometimes also affected by rises in the CPI. Our subsidiaries in Israel have reserves to cover part of these liabilities. The reserves are denominated in NIS and affected by the performance of the funds in which the sums are invested. As a result, we are exposed to changes in the exchange rates of the U.S. dollar against various local currencies in respect of net liabilities for severance pay.
Our subsidiaries have financial assets and liabilities that are denominated in or linked to currencies other than their functional currencies. A surplus of assets over liabilities denominated in currencies that are not the functional currency creates exposure for us in respect of exchange rate fluctuations.
With respect to investment in subsidiaries whose functional currency is not the U.S. dollar, the end of period balance sheet balances of these companies are translated into U.S. dollars based on the exchange rate of the U.S. dollar in relation to the reporting currency of these companies at the end of the relevant period. The beginning of period balance sheet balances, as well as capital changes during the period, are translated into U.S. dollars at the exchange rate at the beginning of the period or on the date of the change in capital, respectively. The differences arising from the effect of the change in the exchange rate between the U.S. dollar and the currency in which the companies report create exposure. The effects of this exposure are charged directly to equity.
Our Finance Forum (whose members are the senior financial managers of our Company and each of our segments) periodically examines the extent of the hedging implemented for each of the exposures described above, and decides on the required scope of the hedging. We use various financial instruments for our hedging activity, including derivatives.
The tables below set forth the sensitivity of our derivative instruments and certain balance sheet items to 5% and 10% increases and decreases in exchange rates as of December 31, 2014.
|
Increase (decrease) in fair value
|
Fair value
|
Increase (decrease) in fair value
|
||||||||||||||||||
|
USD/NIS
Type of instrument
|
Increase of
10%
|
Increase of
5%
|
Decrease of
5%
|
Decrease of
10%
|
||||||||||||||||
|
(USD millions)
|
||||||||||||||||||||
|
Cash and cash equivalents
|
(0.7 | ) | (0.4 | ) | 7.2 | 0.4 | 0.7 | |||||||||||||
|
Short term deposits and loans
|
(0.1 | ) | (0.1 | ) | 1.5 | 0.1 | 0.1 | |||||||||||||
|
Trade receivables
|
(5.5 | ) | (2.8 | ) | 55.2 | 2.8 | 5.5 | |||||||||||||
|
Receivables and debit balances
|
(1.1 | ) | (0.5 | ) | 10.8 | 0.5 | 1.1 | |||||||||||||
|
Long-term deposits and loans
|
(0.4 | ) | (0.2 | ) | 3.7 | 0.2 | 0.4 | |||||||||||||
|
Credit from banks and others
|
0.6 | 0.3 | (6.2 | ) | (0.3 | ) | (0.6 | ) | ||||||||||||
|
Trade payables
|
22.0 | 11.0 | (219.7 | ) | (11.0 | ) | (22.0 | ) | ||||||||||||
|
Other payables
|
13.0 | 6.5 | (129.8 | ) | (6.5 | ) | (13.0 | ) | ||||||||||||
|
Long-term loans
|
14.8 | 7.4 | (148.1 | ) | (7.4 | ) | (14.8 | ) | ||||||||||||
|
Options
|
(50.4 | ) | (26.9 | ) | (57.1 | ) | 33.9 | 61.6 | ||||||||||||
|
Forward
|
(17.1 | ) | (9.0 | ) | (0.2 | ) | 9.9 | 20.9 | ||||||||||||
|
Swap
|
(17.0 | ) | (8.9 | ) | (9.2 | ) | 9.8 | 20.8 | ||||||||||||
|
Total
|
(41.9 | ) | (23.6 | ) | (491.9 | ) | 32.4 | 60.7 | ||||||||||||
|
Increase (decrease) in fair value
|
Fair value
|
Increase (decrease) in fair value
|
||||||||||||||||||
|
CPI
Type of instrument
|
Increase of
10%
|
Increase of
5%
|
Decrease of
5%
|
Decrease of
10%
|
||||||||||||||||
|
(USD millions)
|
||||||||||||||||||||
|
Long-term deposits and loans
|
0.1 | 0.1 | 1.3 | (0.1 | ) | (0.1 | ) | |||||||||||||
|
Increase (decrease) in fair value
|
Fair value
|
Increase (decrease) in fair value
|
||||||||||||||||||
|
EUR/USD
Type of instrument
|
Increase of
10%
|
Increase of
5%
|
Decrease of
5%
|
Decrease of
10%
|
||||||||||||||||
|
(USD millions)
|
||||||||||||||||||||
|
Cash and cash equivalents
|
(6.9 | ) | (3.4 | ) | 68.9 | 3.4 | 6.9 | |||||||||||||
|
Short term deposits and loans
|
(0.7 | ) | (0.4 | ) | 7.3 | 0.4 | 0.7 | |||||||||||||
|
Trade receivables
|
(26.4 | ) | (13.2 | ) | 264.0 | 13.2 | 26.4 | |||||||||||||
|
Receivables and debit balances
|
0.0 | 0.0 | 0.2 | 0.0 | 0.0 | |||||||||||||||
|
Long-term deposits and loans
|
0.0 | 0.0 | 0.3 | 0.0 | 0.0 | |||||||||||||||
|
Credit from banks and others
|
22.3 | 11.2 | (223.0 | ) | (11.2 | ) | (22.3 | ) | ||||||||||||
|
Trade payables
|
17.5 | 8.7 | (174.7 | ) | (8.7 | ) | (17.5 | ) | ||||||||||||
|
Other payables
|
11.1 | 5.6 | (111.4 | ) | (5.6 | ) | (11.1 | ) | ||||||||||||
|
Long-term loans from banks
|
7.1 | 3.6 | (71.0 | ) | (3.6 | ) | (7.1 | ) | ||||||||||||
|
Options
|
8.8 | 4.2 | 7.2 | (3.7 | ) | (7.1 | ) | |||||||||||||
|
Forward
|
(26.9 | ) | (12.7 | ) | (1.8 | ) | 11.5 | 22.0 | ||||||||||||
|
Total
|
5.9 | 3.6 | (234.0 | ) | (4.3 | ) | (9.1 | ) | ||||||||||||
|
Increase (decrease) in fair value
|
Fair value
|
Increase (decrease) in fair value
|
||||||||||||||||||
|
GBP/USD
Type of instrument
|
Increase of
10%
|
Increase of
5%
|
Decrease of
5%
|
Decrease of
10%
|
||||||||||||||||
|
(USD millions)
|
||||||||||||||||||||
|
Cash and cash equivalents
|
(0.6 | ) | (0.3 | ) | 5.8 | 0.3 | 0.6 | |||||||||||||
|
Trade receivables
|
(3.7 | ) | (1.9 | ) | 37.1 | 1.9 | 3.7 | |||||||||||||
|
Receivables and debit balances
|
0.0 | 0.0 | 0.2 | 0.0 | 0.0 | |||||||||||||||
|
Credit from banks and others
|
1.6 | 0.8 | (16.4 | ) | (0.8 | ) | (1.6 | ) | ||||||||||||
|
Trade payables
|
2.7 | 1.4 | (27.2 | ) | (1.4 | ) | (2.7 | ) | ||||||||||||
|
Other payables
|
1.7 | 0.8 | (16.7 | ) | (0.8 | ) | (1.7 | ) | ||||||||||||
|
Options
|
(1.5 | ) | (0.6 | ) | (0.2 | ) | 0.1 | 0.4 | ||||||||||||
|
Forward
|
(4.6 | ) | (2.2 | ) | (0.1 | ) | 2.0 | 3.8 | ||||||||||||
|
Total
|
(4.4 | ) | (2.0 | ) | (17.4 | ) | 1.2 | 2.5 | ||||||||||||
|
Increase (decrease) in fair value
|
Fair value
|
Increase (decrease) in fair value
|
||||||||||||||||||
|
GBP/EUR
Type of instrument
|
Increase of
10%
|
Increase of
5%
|
Decrease of
5%
|
Decrease of
10%
|
||||||||||||||||
|
(USD millions)
|
||||||||||||||||||||
|
Forward
|
3.4 | 1.8 | (0.1 | ) | (2.0 | ) | (4.1 | ) | ||||||||||||
|
Options
|
(2.5 | ) | (1.6 | ) | 0.5 | 2.2 | 3.3 | |||||||||||||
|
Total
|
0.9 | 0.2 | 0.4 | 0.2 | (0.8 | ) | ||||||||||||||
|
Increase (decrease) in fair value
|
Fair value
|
Increase (decrease) in fair value
|
||||||||||||||||||
|
JPY/USD
Type of instrument
|
Increase of
10%
|
Increase of
5%
|
Decrease of
5%
|
Decrease of
10%
|
||||||||||||||||
|
(USD millions)
|
||||||||||||||||||||
|
Cash and cash equivalents
|
(0.5 | ) | (0.3 | ) | 5.2 | 0.3 | 0.5 | |||||||||||||
|
Trade receivables
|
(0.9 | ) | (0.5 | ) | 9.3 | 0.5 | 0.9 | |||||||||||||
|
Long-term deposits and loans
|
0.0 | 0.0 | 0.2 | 0.0 | 0.0 | |||||||||||||||
|
Trade payables
|
0.1 | 0.1 | (1.0 | ) | (0.1 | ) | (0.1 | ) | ||||||||||||
|
Other payables
|
0.0 | 0.0 | (0.2 | ) | 0.0 | 0.0 | ||||||||||||||
|
Options
|
0.6 | 0.3 | 1.1 | (0.4 | ) | (0.7 | ) | |||||||||||||
|
Forward
|
0.7 | 0.4 | 0.9 | (0.4 | ) | (0.8 | ) | |||||||||||||
|
Total
|
0.0 | 0.0 | 15.5 | (0.1 | ) | (0.2 | ) | |||||||||||||
|
Increase (decrease) in fair value
|
Fair value
|
Increase (decrease) in fair value
|
||||||||||||||||||
|
BRL/USD
Type of instrument
|
Increase of
10%
|
Increase of
5%
|
Decrease of
5%
|
Decrease of
10%
|
||||||||||||||||
|
(USD millions)
|
||||||||||||||||||||
|
Cash and cash equivalents
|
(1.3 | ) | (0.7 | ) | 13.2 | 0.7 | 1.3 | |||||||||||||
|
Trade receivables
|
(2.0 | ) | (1.0 | ) | 19.9 | 1.0 | 2.0 | |||||||||||||
|
Trade payables
|
2.9 | 1.5 | (29.0 | ) | (1.5 | ) | (2.9 | ) | ||||||||||||
|
Other payables
|
0.2 | 0.1 | (1.5 | ) | (0.1 | ) | (0.2 | ) | ||||||||||||
|
Total
|
(0.2 | ) | (0.1 | ) | 2.6 | 0.1 | 0.2 | |||||||||||||
|
Increase (decrease) in fair value
|
Fair value
|
Increase (decrease) in fair value
|
||||||||||||||||||
|
CNY/USD
Type of instrument
|
Increase of 10%
|
Increase of 5%
|
Decrease of 5%
|
Decrease of 10%
|
||||||||||||||||
|
(USD millions)
|
||||||||||||||||||||
|
Cash and cash equivalents
|
(1.9 | ) | (1.0 | ) | 19.4 | 1.0 | 1.9 | |||||||||||||
|
Trade receivables
|
(1.0 | ) | (0.5 | ) | 10.0 | 0.5 | 1.0 | |||||||||||||
|
Trade payables
|
0.2 | 0.1 | (1.6 | ) | (0.1 | ) | (0.2 | ) | ||||||||||||
|
Other payables
|
0.7 | 0.3 | (6.6 | ) | (0.3 | ) | (0.7 | ) | ||||||||||||
|
Credit from banks and others
|
0.1 | 0.0 | (0.9 | ) | 0.0 | (0.1 | ) | |||||||||||||
|
Total
|
(1.9 | ) | (1.1 | ) | 20.3 | 1.1 | 1.9 | |||||||||||||
Interest Rate Risk
We have loans bearing variable interest that expose our finance expenses and cash flows to changes in those interest rates. With respect to our fixed interest loans, there is exposure to changes in the fair value of the loans due to changes in the market interest rate.
Our Finance Forum examines the extent of the hedging in order to adjust the structure of the actual interest to our expectations with regard to the anticipated developments in interest rates, taking into account the cost of the hedging. The hedging is implemented by using a fixed interest range and by hedging variable interest.
The table below sets forth the sensitivity of certain financial instruments to 0.5% and 1% increases and decreases in LIBOR as of December 31, 2014.
|
Increase (decrease) in fair value
|
Fair value
|
Increase (decrease) in fair value
|
||||||||||||||||||
|
Type of instrument
|
Increase of
1%
|
Increase of
0.5%
|
Decrease of
0.5%
|
Decrease of
1%
|
||||||||||||||||
|
(USD millions)
|
||||||||||||||||||||
|
Fixed-USD interest debentures
|
78.0 | 39.9 | (1,170.8 | ) | (41.8 | ) | (85.7 | ) | ||||||||||||
|
Collar transactions
|
0.6 | 0.4 | (0.8 | ) | (0.4 | ) | (0.5 | ) | ||||||||||||
|
Swap transactions
|
20.2 | 10.3 | (7.7 | ) | (10.7 | ) | (21.9 | ) | ||||||||||||
|
NIS/USD swap
|
12.2 | 6.2 | (9.2 | ) | (6.5 | ) | (13.2 | ) | ||||||||||||
|
Total
|
111.0 | 56.8 | (1,188.5 | ) | (59.4 | ) | (121.3 | ) | ||||||||||||
The table below sets forth the sensitivity of certain financial instruments to 0.5% and 1% increases and decreases in the NIS interest rate as of December 31, 2014.
|
Increase (decrease) in fair value
|
Fair value
|
Increase (decrease) in fair value
|
||||||||||||||||||
|
Sensitivity to changes in the
shekel interest rate
Type of instrument
|
Increase of
1%
|
Increase of
0.5%
|
Decrease of
0.5%
|
Decrease of
1%
|
||||||||||||||||
|
(USD millions)
|
||||||||||||||||||||
|
NIS/USD swap
|
(11.5 | ) | (5.9 | ) | (9.2 | ) | 6.1 | 12.5 | ||||||||||||
Energy Price Risk
Execution of hedging is determined by appropriate personnel after consultation with Israeli and foreign energy advisors.
The table below sets forth the sensitivity of instruments hedging energy price risks to 5% and 10% increases and decreases in energy prices as of December 31, 2014.
|
Increase (decrease) in fair value
|
Fair value
|
Increase (decrease) in fair value
|
||||||||||||||||||
|
Type of instrument
|
Increase of
10%
|
Increase of
0.5%
|
Decrease of
0.5%
|
Decrease of
10%
|
||||||||||||||||
|
(USD millions)
|
||||||||||||||||||||
|
Energy hedges
|
3.1 | 1.5 | (19.3 | ) | (1.5 | ) | (3.0 | ) | ||||||||||||
Marine Shipping Price Risk
We purchase hedges on part of our exposure to marine bulk shipping prices. Hedging is executed by the appropriate personnel, after consultation with overseas experts.
The table below sets forth the sensitivity of instruments hedging marine shipping price risk to 5% and 10% increases and decreases in marine shipping prices as of December 31, 2014.
|
Increase (decrease) in fair value
|
Fair value
|
Increase (decrease) in fair value
|
||||||||||||||||||
|
Type of instrument
|
Increase of
10%
|
Increase of
0.5%
|
Decrease of
0.5%
|
Decrease of
10%
|
||||||||||||||||
|
(USD millions)
|
||||||||||||||||||||
|
Marine shipping hedges
|
3.2 | 1.6 | (9.0 | ) | (1.6 | ) | (3.2 | ) | ||||||||||||
Not Applicable.
None.
USE OF PROCEEDS
Not Applicable.
A. DISCLOSURE CONTROLS AND PROCEDURES
In accordance with Rule 13a-15(b) of the Exchange Act, our management evaluated, with the participation of our Chief Executive Officer and Chief Financial Officer, the effectiveness of the design and operation of our disclosure controls and procedures (as defined in Rule 13a-15(e) under the Exchange Act) as of December 31, 2014.
Based upon their evaluation of these disclosure controls and procedures, the Chief Executive Officer and Chief Financial Officer concluded that the disclosure controls and procedures were effective as of December 31, 2014 to ensure that information required to be disclosed under the Exchange Act is recorded, processed, summarized, and reported, within the time period specified in the SEC rules and forms, and to ensure that information required to be disclosed under the Exchange Act is accumulated and communicated to our management, including our principal executive and principal financial officers, as appropriate, to allow timely decisions regarding required disclosure.
B.
MANAGEMENT’S ANNUAL REPORT ON INTERNAL CONTROLS OVER FINANCIAL REPORTING
This Annual Report does not include a report of management’s assessment regarding internal control over financial reporting or an attestation report of our independent registered public accountant due to a transition period established by rules of the Securities and Exchange Commission for newly public companies (IPO).
C. ATTESTATION REPORT OF THE REGISTERED PUBLIC ACCOUNTING FIRM
Not Applicable.
D. CHANGES IN INTERNAL CONTROL OVER FINANCIAL REPORTING
During the year ended December 31, 2014, there were no changes to our internal controls over financial reporting that have materially affected or are reasonably likely to materially affect our internal control over financial reporting.
Our Board of Directors has determined that Prof. Yair Orgler, Mr. Yaacov Dior and Mr. Geoffery Merszei are audit committee financial experts, as that term is defined in Item 16A(b) of Form 20-F, and are independent for the purposes of NYSE corporate governance rules and Rule 10A-3 of the Exchange Act.
Our Board of Directors have adopted a Code of Conduct that applies to Board of Directors, senior management and employees, including our principal executive officer, principal financial officer, principal accounting officer or controller and any other persons who perform similar functions for us. The Code of Conduct is available, free of charge, on our website, www.icl-group.com.
Somekh Chaikin, a member firm of KPMG International, was appointed as our independent registered public accounting firm, on August 26, 2014, for the audit of the fiscal year ending December 31, 2014, for which audited financial statements appear in this Annual Report.
The following is a summary of the fees billed by Somekh Chaikin, respectively, and member firms in their respective networks, for professional services rendered for fiscal years ended December 31, 2013 and 2014:
|
Year ended December 2014
|
Year ended December 2013
|
|||||||||||||||||||||||
|
Somekh Chaikin
|
Other KPMG network firms
|
Total
|
Somekh Chaikin
|
Other KPMG network firms
|
Total
|
|||||||||||||||||||
|
US$ thousands
|
US$ thousands
|
|||||||||||||||||||||||
|
Audit fees(1)
|
2,435 | 2,871 | 5,306 | 2,306 | 3,654 | 5,960 | ||||||||||||||||||
|
Audit-related fees(2)
|
100 | 79 | 179 | - | 868 | 868 | ||||||||||||||||||
|
Tax fees(3)
|
765 | 1, 300 | 2,065 | 679 | 1,733 | 2,412 | ||||||||||||||||||
|
All other fees(4)
|
- | 434 | 434 | - | - | - | ||||||||||||||||||
|
Total
|
3,300 | 4,684 | 7,984 | 2,985 | 6,255 | 9,240 | ||||||||||||||||||
_______________
|
(1)
|
The aggregate audit fees include fees billed or accrued for professional services rendered by the principal accountant for the audit of our annual financial statements and review of the interim condensed consolidated financial statements and additional services that are normally provided by the accountant in connection with statutory and regulatory filings or engagements, except for those not required by statute or regulation. The audit fees do not include fees in connection with the PCAOB audit for the years 2011-2013 as part of filing of the prospectus and registration of ICL with the SEC. The fees for the above-mentioned audit work were about $2,050 thousand.
|
|
(2)
|
Audit-related fees consist of fees billed or accrued services rendered during the fiscal year for assurance and related services that are reasonably related to the performance of the audit or review of our consolidated financial statements and are not reported under “Audit fees”.
|
|
(3)
|
Tax fees consist of fees for professional services rendered during the fiscal year by the principal accountant for tax compliance, tax advice, and tax planning, assistance with tax audits and appeals.
|
|
(4)
|
All other fees consisted of fees billed or accrued for products and services provided by the principal accountant, other than the services reported above under other captions in the above table.
|
Audit Committee’s pre-approval policies and procedures
All services provided by our auditors are approved in advance by either the Audit Committee or members thereof, to whom authority has been delegated, in accordance with the Audit Committee’s pre-approval policy.
None.
None.
None.
Corporate Governance Practices
We are incorporated in Israel and therefore subject to various corporate governance requirements under the Companies Law relating to such matters as external directors, the audit committee, the compensation committee and the internal auditor. These are in addition to the requirements of the NYSE and relevant provisions of U.S. securities laws that apply to us. As a foreign private issuer whose shares are listed on the NYSE, we have the option to follow certain Israeli corporate governance practices rather than those of the NYSE, except to the extent that such laws would be contrary to U.S. securities laws and provided that we disclose the practices that we are not following and describe the home country practices we follow instead. We intend to rely on this “foreign private issuer exemption” with respect to the following NYSE requirements:
|
|
·
|
Majority Independent Board
. Under Section 303A.01 of the NYSE Listed Company Manual (the “LCM”), a U.S. domestic listed company, other than a controlled company, must have a majority of independent directors. Six of our twelve directors are not considered independent directors under Israeli law due to either a relationship with our controlling shareholder or the length of their tenure on our Board of Directors.
|
|
|
·
|
Nominating/Corporate Governance Committee
. Under Section 303A.04 of the LCM, a U.S. domestic listed company, other than a controlled company, must have a nominating/corporate governance committee composed entirely of independent directors.
The Company is a controlled company and thereof is exempt from this requirement according to U.S. law. The Company’s controlling shareholder, Israel Corporation, has significant control over the appointment of our directors.
|
|
|
·
|
Equity Compensation Plans
. Under Section 303A.08 of the LCM, shareholders must be given the opportunity to vote on all equity compensation plans and material revisions thereto, with certain limited exemptions as described therein. We follow the requirements of the Companies Law, under which approval of equity compensation plans and material revisions thereto is within the authority of the board of directors. However, under the Companies Law, any compensation to directors, the chief executive officer or a controlling shareholder or another person in which a controlling shareholder has a personal interest, including equity based compensation, generally requires the approval of the compensation committee, the board of directors and the shareholders, in that order. The compensation of directors and officers is generally required to comply with a shareholder approved compensation policy, which is required to include a monetary cap on the value of equity compensation that may be granted to any director or officer.
|
|
|
·
|
Shareholder Approval of Securities Issuances
. Under Section 312.03 of the LCM, shareholder approval is a prerequisite to (a) issuing common stock, or securities convertible into or exercisable for common stock, to a related party, a subsidiary, affiliate or other closely related person of a related party or any company or entity in which a related party has a substantial interest, if the number of shares of common stock to be issued exceeds either 1% of the number of shares of common shares or 1% of the voting power outstanding before the issuance, and (b) issuing common stock, or securities convertible into or exercisable for common stock, if the common stock has, or will have upon issuance, voting power equal to or in excess of 20% of the voting power outstanding before the issuance or the number of shares of common stock to be issued is equal to or in excess of 20% of the number of shares of common stock before the issuance, in each case subject to certain exceptions. We seek shareholder approval for all corporate actions requiring such approval under the requirements of the Companies Law, which are different from the requirements for seeking shareholder approval under Section 312.03 of the LCM. Under the Companies Law, shareholder approval is a prerequisite to any extraordinary transaction with a controlling shareholder or in which a controlling shareholder has a personal interest. Under the Companies Law, shareholder approval is also a prerequisite to a private placement of securities if it will cause a person to become a controlling shareholder or in case all of the following conditions are met:
|
|
|
·
|
the securities issued amount to 20% or more of the company’s outstanding voting rights before the issuance;
|
|
|
·
|
some or all of the consideration is other than cash or listed securities or the transaction is not on market terms; and
|
|
|
·
|
the transaction will increase the relative holdings of a 5% shareholder or will cause any person to become, as a result of the issuance, a 5% shareholder.
|
Except as stated above, we intend to substantially comply with the rules applicable to U.S. companies listed on the NYSE. We may in the future decide to use other foreign private issuer exemptions with respect to some or all of the other NYSE listing requirements. Following our home country governance practices, as opposed to the requirements that would otherwise apply to a company listed on the NYSE, may provide less protection than is accorded to investors under NYSE listing requirements applicable to domestic issuers. For more information, see “Item 3. Key Information—D. Risk Factors—Risks Related to Our Ordinary Shares—As a foreign private issuer, we are permitted to follow certain home country corporate governance practices instead of applicable SEC and NYSE requirements, which may result in less protection than is accorded to investors under rules applicable to domestic issuers.”
Not applicable.
See Item 18.
See page F-1.
|
1.1*
|
Memorandum of Association of Israel Chemicals Ltd. (unofficial translation from original Hebrew).
|
|
1.2*
|
Articles of Association of Israel Chemicals Ltd. (unofficial translation from original Hebrew).
|
|
4.1*
|
Dead Sea Concession Law, 1961 (and the Deed of Concession, dated as of May 31, 1961, between the State of Israel and Dead Sea Works, Ltd. set out as a schedule thereto) (unofficial translation from original Hebrew).
|
|
4.2*
|
Plan for the Private Allocation of Options for Shares of the Company to the CEO of the Company, to Office Holders and Employees of the Company and its Subsidiaries dated January 7, 2010 (unofficial translation from original Hebrew).
|
|
4.3*
|
Plan for the Private Allocation of Options for Shares of the Company to the CEO of the Company, to Office Holders and Employees of the Company and its Subsidiaries dated November 27, 2012 (unofficial translation from original Hebrew).
|
|
4.4*
|
Equity Compensation Plan (2014) dated August 20, 2014 (unofficial translation from original Hebrew).
|
|
4.5*
|
Compensation Policy for Directors and Officers, as adopted in July 2013 and approved by shareholders in August 2013.
|
|
4.6*
|
Agreement between the Israeli Ministry of Finance and Dead Sea Works Ltd. dated as of July 8, 2012 relating to salt harvesting at the Dead Sea.
|
|
4.7*
|
2012 related Loan, as amended.
|
|
4.8*
|
Registration Rights Agreement, dated September 12 , 2014 by and among Israel Chemicals Ltd. and Israel Corporation Ltd.
|
|
8.1*
|
List of subsidiaries of Israel Chemicals Ltd.
|
|
12.1
|
Certification by Principal Executive Officer Pursuant to Section 302 of the Sarbanes-Oxley Act of 2002
|
|
12.2
|
Certification by Principal Financial Officer Pursuant to Section 302 of the Sarbanes-Oxley Act of 2002
|
|
13.1
|
Certification by Principal Executive Officer Pursuant to Section 906 of the Sarbanes-Oxley Act of 2002
|
|
13.2
|
Certification by Principal Financial Officer Pursuant to Section 906 of the Sarbanes-Oxley Act of 2002
|
_______________
|
*
|
Incorporated by reference to our registration statement on Form F-1 (file no. 333- 198711), as amended.
|
SIGNATURES
The registrant hereby certifies that it meets all of the requirements for filing on Form 20-F and that it has duly caused and authorized the undersigned to sign this annual report on its behalf.
|
ISRAEL CHEMICALS LTD.
|
||
|
By:
|
/s/ Lisa Haimovitz
|
|
|
Name:
|
Lisa Haimovitz
|
|
|
Title:
|
Vice President, General Counsel and Corporate Secretary
|
|
|
By:
|
/s/ Avi Doitchman
|
|
|
Name:
|
Avi Doitchman
|
|
|
Title:
|
Executive Vice President and Chief Financial Officer
|
|
Date: March 19, 2015
Israel Chemicals Ltd.
Consolidated
Financial
Statements
As at
December 31, 2014
TABLE OF CONTENTS
Page

|
Somekh Chaikin
|
Telephone
|
972 3 684 8000
|
|
KPMG Millennium Tower
|
Fax
|
972 3 684 8444
|
|
17 Ha'arba'a Street, PO Box 609
|
Internet
|
www.kpmg.co.il
|
|
Tel Aviv 61006 Israel
|
Report of Independent Registered Public Accounting Firm
The Board of Directors and Shareholders
Israel Chemicals Ltd
We have audited the accompanying consolidated statements of financial position of Israel Chemicals Ltd. and subsidiaries (the Company) as of December 31, 2014 and 2013, and the related consolidated statements of income, comprehensive income, changes in equity and cash flows for each of the years in the three year period ended December 31, 2014. These consolidated financial statements are the responsibility of the Company’s management. Our responsibility is to express an opinion on these consolidated financial statements based on our audits.
We conducted our audits in accordance with the standards of the Public Company Accounting Oversight Board (United States). Those standards require that we plan and perform the audit to obtain reasonable assurance about whether the financial statements are free of material misstatement. An audit includes examining, on a test basis, evidence supporting the amounts and disclosures in the financial statements. An audit also includes, assessing the accounting principles used and significant estimates made by management, as well as evaluating the overall financial statement presentation.
We believe that our audits provide a reasonable basis for our opinion.
In our opinion, the consolidated financial statements referred to above present fairly, in all material respects, the financial position of the Company as of December 31, 2014 and 2013, and the results of its operations and its cash flows for each of the years in the three-year period ended December 31, 2014, in conformity with International Financial Reporting Standards (IFRS) as issued by the International Accounting Standards Board.
/s/ Somekh Chaikin
Certified Public Accountants (Isr.)
Member Firm of KPMG International
Tel Aviv, Israel
March 19, 2015
Somekh Chaikin, a partnership registered under the Israeli partnership
Ordinance, is the Israeli member firm of KPMG International,
a Swiss cooperative.
|
2014
|
2013
|
|||||||||||
|
Note
|
US$ thousands
|
|||||||||||
|
Current assets
|
||||||||||||
|
Cash and cash equivalents
|
130,831 | 188,340 | ||||||||||
|
Short-term investments and deposits
|
6 | 116,492 | 96,388 | |||||||||
|
Trade receivables
|
7 | 1,039,146 | 1,057,028 | |||||||||
|
Derivatives and other receivables
|
27,16,8 | 154,784 | 186,317 | |||||||||
|
Current tax assets
|
139,093 | 105,270 | ||||||||||
|
Inventories
|
9 | 1,335,098 | 1,408,297 | |||||||||
|
Assets held for sale
|
11A | 224,595 | — | |||||||||
|
Total current assets
|
3,140,039 | 3,041,640 | ||||||||||
|
Non-current assets
|
||||||||||||
|
Investments in equity-accounted investees
|
10 | 184,549 | 174,511 | |||||||||
|
Long-term deposits and receivables
|
12 | 11,666 | 15,768 | |||||||||
|
Surplus in defined benefit plan
|
21 | 66,063 | 83,124 | |||||||||
|
Long-term derivative instruments
|
27,16 | — | 7,619 | |||||||||
|
Non-current inventories
|
9 | 57,035 | 62,252 | |||||||||
|
Deferred tax assets
|
20 | 158,443 | 111,157 | |||||||||
|
Property, plant and equipment
|
13 | 3,926,873 | 3,686,240 | |||||||||
|
Intangible assets
|
14 | 802,920 | 791,174 | |||||||||
|
Total non-current assets
|
5,207,549 | 4,931,845 | ||||||||||
|
Total assets
|
8,347,588 | 7,973,485 | ||||||||||
|
2014
|
2013
|
|||||||||||
|
Note
|
US$ thousands
|
|||||||||||
|
Current liabilities
|
||||||||||||
|
Short-term credit and current portion of long-term
debt
|
17 | 602,749 | 718,284 | |||||||||
|
Trade payables
|
18 | 584,909 | 669,102 | |||||||||
|
Provisions
|
22 | 35,118 | 38,485 | |||||||||
|
Derivatives and other payables
|
27,19,16 | 692,913 | 500,453 | |||||||||
|
Current tax liabilities
|
36,461 | 33,717 | ||||||||||
|
Liabilities held for sale
|
11A | 50,702 | — | |||||||||
|
Total current liabilities
|
2,002,852 | 1,960,041 | ||||||||||
|
Non-current liabilities
|
||||||||||||
|
Long-term debt
|
17 | 1,239,494 | 1,243,638 | |||||||||
|
Debentures
|
17 | 1,064,222 | 67,000 | |||||||||
|
Long-term derivative instruments
|
27,16 | 19,321 | 6,582 | |||||||||
|
Deferred taxes
|
20 | 259,877 | 220,877 | |||||||||
|
Employee benefits
|
21 | 659,165 | 702,103 | |||||||||
|
Provisions
|
22 | 102,431 | 94,570 | |||||||||
|
Total non-current liabilities
|
3,344,510 | 2,334,770 | ||||||||||
|
Total liabilities
|
5,347,362 | 4,294,811 | ||||||||||
|
Equity
|
24 | |||||||||||
|
Share capital
|
543,107 | 542,853 | ||||||||||
|
Share premium
|
133,633 | 133,633 | ||||||||||
|
Capital reserves
|
(135,277 | ) | 84,715 | |||||||||
|
Retained earnings
|
2,692,364 | 3,152,832 | ||||||||||
|
Treasury shares
|
(260,113 | ) | (260,113 | ) | ||||||||
|
Total shareholders’ equity
|
2,973,714 | 3,653,920 | ||||||||||
|
Non-controlling interests
|
26,512 | 24,754 | ||||||||||
|
Total equity
|
3,000,226 | 3,678,674 | ||||||||||
|
Total liabilities and equity
|
8,347,588 | 7,973,485 | ||||||||||
The accompanying notes are an integral part of these financial statements.
|
2014
|
2013
|
2012
|
||||||||||||||
|
Note
|
US$ thousands
|
|||||||||||||||
|
Sales
|
26A | 6,110,710 | 6,271,542 | 6,471,433 | ||||||||||||
|
Cost of sales
|
26B | 3,914,573 | 3,861,572 | 3,760,235 | ||||||||||||
|
Gross profit
|
2,196,137 | 2,409,970 | 2,711,198 | |||||||||||||
|
Selling, transport and marketing expenses
|
26D | 839,207 | 850,325 | 797,291 | ||||||||||||
|
General and administrative expenses
|
26E | 305,526 | 281,491 | 248,782 | ||||||||||||
|
Research and development expenses,
net
|
26C | 86,943 | 82,870 | 74,099 | ||||||||||||
|
Other expenses
|
26G | 259,336 | 110,194 | 61,085 | ||||||||||||
|
Other income
|
26G | (52,545 | ) | (16,276 | ) | (23,691 | ) | |||||||||
|
Operating income
|
757,670 | 1,101,366 | 1,553,632 | |||||||||||||
|
Finance expenses
|
278,243 | 158,403 | 81,595 | |||||||||||||
|
Finance income
|
(122,295 | ) | (131,548 | ) | (20,701 | ) | ||||||||||
|
Financing expenses, net
|
26F | 155,948 | 26,855 | 60,894 | ||||||||||||
|
Share in earnings of equity accounted investees
|
10 | 30,532 | 25,685 | 26,555 | ||||||||||||
|
Income before income taxes
|
632,254 | 1,100,196 | 1,519,293 | |||||||||||||
|
Income taxes
|
20 | 166,152 | 280,023 | 217,561 | ||||||||||||
|
Net income
|
466,102 | 820,173 | 1,301,732 | |||||||||||||
|
Attributable to:
|
||||||||||||||||
|
The shareholders of the Company
|
463,555 | 818,573 | 1,300,076 | |||||||||||||
|
Non-controlling interests
|
2,547 | 1,600 | 1,656 | |||||||||||||
|
Net income
|
466,102 | 820,173 | 1,301,732 | |||||||||||||
|
Earnings per share attributable to
|
US$
|
US$
|
US$
|
|||||||||||||
|
the equity holders of the company:
|
28 | |||||||||||||||
|
Basic earnings per share
|
0.365 | 0.644 | 1.024 | |||||||||||||
|
Diluted earnings per share
|
0.365 | 0.644 | 1.024 | |||||||||||||
The accompanying notes are an integral part of these financial statements.
|
2014
|
2013
|
2012
|
||||||||||
|
US$ thousands
|
||||||||||||
|
Net Income
|
466,102 | 820,173 | 1,301,732 | |||||||||
|
Components of other comprehensive income that may be reclassified subsequently to net income
|
||||||||||||
|
Currency translation effects
|
(220,196 | ) | 49,142 | 24,674 | ||||||||
|
Gains (losses) on derivatives designated as a cash flow hedge
|
(11,635 | ) | 1,718 | 15,634 | ||||||||
|
Income tax relating to items that may be reclassified subsequently to net income
|
— | (898 | ) | 313 | ||||||||
|
Total
|
(231,831 | ) | 49,962 | 40,621 | ||||||||
|
Items that will not be reclassified to net income
|
||||||||||||
|
Actuarial gains (losses) from defined benefit plan
|
(103,174 | ) | 47,282 | (43,904 | ) | |||||||
|
Income tax relating to items that will not be reclassified to net income
|
24,476 | (14,172 | ) | 9,018 | ||||||||
|
Total
|
(78,698 | ) | 33,110 | (34,886 | ) | |||||||
|
Total comprehensive income
|
155,573 | 903,245 | 1,307,467 | |||||||||
|
Attributable to:
|
||||||||||||
|
The shareholders of the Company
|
153,163 | 901,749 | 1,305,242 | |||||||||
|
Non-controlling interests
|
2,410 | 1,496 | 2,225 | |||||||||
|
Total comprehensive income
|
155,573 | 903,245 | 1,307,467 | |||||||||
The accompanying notes are an integral part of these financial statements.
|
Attributable to the shareholders of the Company
|
Non-
controlling
interests
|
Total
equity
|
||||||||||||||||||||||||||||||||||
|
Share
capital
|
Share
premium
|
Cumulative
translation
adjustment
|
Capital
reserves
|
Treasury
shares,
at cost
|
Retained
earnings
|
Total
shareholders'
equity
|
||||||||||||||||||||||||||||||
|
US$ thousands
|
||||||||||||||||||||||||||||||||||||
|
For the year ended December 31, 2014
|
||||||||||||||||||||||||||||||||||||
|
Balance as at January 1, 2014
|
542,853 | 133,633 | 19,183 | 65,532 | (260,113 | ) | 3,152,832 | 3,653,920 | 24,754 | 3,678,674 | ||||||||||||||||||||||||||
|
Share-based compensation
|
254 | — | — | 11,790 | — | — | 12,044 | — | 12,044 | |||||||||||||||||||||||||||
|
Dividends paid
|
— | — | — | — | — | (845,325 | ) | (845,325 | ) | (652 | ) | (845,977 | ) | |||||||||||||||||||||||
|
Tax on share-based compensation
|
— | — | — | (88 | ) | — | — | (88 | ) | — | (88 | ) | ||||||||||||||||||||||||
|
Comprehensive income
|
— | — | (220,059 | ) | (11,635 | ) | — | 384,857 | 153,163 | 2,410 | 155,573 | |||||||||||||||||||||||||
|
Balance as at December 31, 2014
|
543,107 | 133,633 | (200,876 | ) | 65,599 | (260,113 | ) | 2,692,364 | 2,973,714 | 26,512 | 3,000,226 | |||||||||||||||||||||||||
The accompanying notes are an integral part of these financial statements.
Consolidated Statements of Changes in Equity (cont'd)
|
Attributable to the equity holders of the Company
|
Non-
controlling
interests
|
Total
equity
|
||||||||||||||||||||||||||||||||||
|
Share
capital
|
Share
premium
|
Cumulative
translation
adjustment
|
Capital
reserves
|
Treasury
shares,
at cost
|
Retained
earnings
|
Total
shareholders'
equity
|
||||||||||||||||||||||||||||||
|
US$ thousands
|
||||||||||||||||||||||||||||||||||||
|
For the year ended December 31, 2013
|
||||||||||||||||||||||||||||||||||||
|
Balance as at January 1, 2013
|
542,769 | 101,501 | (30,063 | ) | 75,375 | (260,113 | ) | 2,935,537 | 3,365,006 | 23,258 | 3,388,264 | |||||||||||||||||||||||||
|
Exercise of options
|
84 | 32,132 | — | (32,216 | ) | — | — | — | — | — | ||||||||||||||||||||||||||
|
Share-based compensation
|
— | — | — | 21,776 | — | — | 21,776 | — | 21,776 | |||||||||||||||||||||||||||
|
Dividends paid
|
— | — | — | — | — | (634,388 | ) | (634,388 | ) | — | (634,388 | ) | ||||||||||||||||||||||||
|
Tax on share-based compensation
|
— | — | — | (223 | ) | — | — | (223 | ) | — | (223 | ) | ||||||||||||||||||||||||
|
Comprehensive income
|
— | — | 49,246 | 820 | — | 851,683 | 901,749 | 1,496 | 903,245 | |||||||||||||||||||||||||||
|
Balance as at December 31, 2013
|
542,853 | 133,633 | 19,183 | 65,532 | (260,113 | ) | 3,152,832 | 3,653,920 | 24,754 | 3,678,674 | ||||||||||||||||||||||||||
The accompanying notes are an integral part of these financial statements.
Consolidated Statements of Changes in Equity (cont'd)
|
Attributable to the equity holders of the Company
|
Non-
controlling
interests
|
Total
equity
|
||||||||||||||||||||||||||||||||||
|
Share
capital
|
Share
premium
|
Cumulative
translation
adjustment
|
Capital
reserves
|
Treasury
shares,
at cost
|
Retained
earnings
|
Total
shareholders’
equity
|
||||||||||||||||||||||||||||||
|
US$ thousands
|
||||||||||||||||||||||||||||||||||||
|
For the year ended December 31, 2012
|
||||||||||||||||||||||||||||||||||||
|
Balance as at January 1, 2012
|
542,377 | 94,798 | (54,168 | ) | 53,866 | (260,113 | ) | 2,689,569 | 3,066,329 | 23,922 | 3,090,251 | |||||||||||||||||||||||||
|
Exercise of options
|
392 | 6,703 | — | (3,295 | ) | — | — | 3,800 | — | 3,800 | ||||||||||||||||||||||||||
|
Share-based compensation
|
— | — | — | 8,668 | — | — | 8,668 | — | 8,668 | |||||||||||||||||||||||||||
|
Dividends paid
|
— | — | — | — | — | (1,019,222 | ) | (1,019,222 | ) | (2,889 | ) | (1,022,111 | ) | |||||||||||||||||||||||
|
Tax on shares-based compensation
|
— | — | — | 189 | — | — | 189 | — | 189 | |||||||||||||||||||||||||||
|
Comprehensive income
|
— | — | 24,105 | 15,947 | — | 1,265,190 | 1,305,242 | 2,225 | 1,307,467 | |||||||||||||||||||||||||||
|
Balance as at December 31, 2012
|
542,769 | 101,501 | (30,063 | ) | 75,375 | (260,113 | ) | 2,935,537 | 3,365,006 | 23,258 | 3,388,264 | |||||||||||||||||||||||||
The accompanying notes are an integral part of these financial statements.
|
2014
|
2013
|
2012
|
||||||||||
|
US$ thousands
|
||||||||||||
|
Cash flows from operating activities
|
||||||||||||
|
Net Income
|
466,102 | 820,173 | 1,301,732 | |||||||||
|
Adjustments for:
|
||||||||||||
|
Depreciation and amortization
|
427,478 | 347,741 | 322,511 | |||||||||
|
Interest expenses, net
|
73,865 | 41,951 | 28,529 | |||||||||
|
Share in earnings of equity-accounted investees
|
(30,532 | ) | (25,685 | ) | (26,555 | ) | ||||||
|
Loss (gain) on sale of property, plant and equipment, net
|
(5,746 | ) | (1,958 | ) | 602 | |||||||
|
Share-based compensation
|
12,044 | 21,776 | 8,668 | |||||||||
|
Revaluation of assets and liabilities denominated in foreign currencies
|
(35,976 | ) | 29,541 | 7,511 | ||||||||
|
Gain on achievement of control of an associated company
|
(35,740 | ) | (1,827 | ) | (1,945 | ) | ||||||
|
Income tax expenses
|
166,152 | 280,023 | 217,561 | |||||||||
| 1,037,647 | 1,511,735 | 1,858,614 | ||||||||||
|
Change in inventories
|
(33,333 | ) | 4,061 | (54,852 | ) | |||||||
|
Change in trade and other receivables
|
(25,461 | ) | 19,614 | 217,118 | ||||||||
|
Change in trade and other payables
|
55,323 | (84,903 | ) | (71,612 | ) | |||||||
|
Change in provisions and employee benefits
|
66,126 | 53,782 | 30,973 | |||||||||
| 1,100,302 | 1,504,289 | 1,980,241 | ||||||||||
|
Income taxes paid
|
(158,772 | ) | (333,794 | ) | (220,179 | ) | ||||||
|
Interest received
|
1,974 | 2,380 | 12,207 | |||||||||
|
Interest paid
|
(48,822 | ) | (45,966 | ) | (45,051 | ) | ||||||
|
Net cash provided by operating activities
|
894,682 | 1,126,909 | 1,727,218 | |||||||||
|
Cash flows from investing activities
|
||||||||||||
|
Increase in long-term deposits
|
— | — | (2,397 | ) | ||||||||
|
Proceeds from sale of property, plant and equipment
|
8,618 | 3,304 | 924 | |||||||||
|
Short-term loans and deposits, net
|
(22,861 | ) | 38,770 | (16,099 | ) | |||||||
|
Business acquisitions, net of cash acquired
|
(142,880 | ) | (63,057 | ) | (11,875 | ) | ||||||
|
Dividends from equity-accounted investees
|
16,640 | 23,168 | 17,089 | |||||||||
|
Purchases of property, plant and equipment, net
|
(751,806 | ) | (826,588 | ) | (711,721 | ) | ||||||
|
Purchases of intangible assets
|
(83,114 | ) | (22,093 | ) | (11,350 | ) | ||||||
|
Investments and loans to equity-accounted investees
|
(22,614 | ) | — | (8,521 | ) | |||||||
|
Proceeds from sale of long-term deposits
|
1,913 | 7,164 | 3,241 | |||||||||
|
Net cash used in investing activities
|
(996,104 | ) | (839,332 | ) | (740,709 | ) | ||||||
|
Cash flows from financing activities
|
||||||||||||
|
Proceeds from exercise of share options
|
— | — | 3,800 | |||||||||
|
Dividend paid to the shareholders
|
(845,325 | ) | (634,388 | ) | (1,019,222 | ) | ||||||
|
Dividend paid to non-controlling interests
|
(652 | ) | — | (2,889 | ) | |||||||
|
Receipt of long-term debt
|
2,055,146 | 674,736 | 362,001 | |||||||||
|
Repayment of long-term debt
|
(998,992 | ) | (613,457 | ) | (311,415 | ) | ||||||
|
Short-term credit from banks and others, net
|
(142,253 | ) | 263,119 | (50,899 | ) | |||||||
|
Net cash provided by (used in) financing activities
|
67,924 | (309,990 | ) | (1,018,624 | ) | |||||||
|
Net change in cash and cash equivalents
|
(33,498 | ) | (22,413 | ) | (32,115 | ) | ||||||
|
Cash and cash equivalents as at beginning of the year
|
188,340 | 206,067 | 238,141 | |||||||||
|
Net effect of currency translation on cash and cash equivalents
|
(16,409 | ) | 4,686 | 41 | ||||||||
|
Cash and cash equivalents included as part of assets held for sale
|
(7,602 | ) | — | — | ||||||||
|
Cash and cash equivalents as at end of the year
|
130,831 | 188,340 | 206,067 | |||||||||
The accompanying notes are an integral part of these financial statements.
A. The reporting entity
Israel Chemicals Ltd. (hereinafter – “the Company” or “ICL”), is a company domiciled and incorporated in Israel and the shares of which are traded on the Tel-Aviv Stock Exchange and on the New York Stock Exchange. The address of the Company’s registered office is 23 Aranha St., Tel Aviv, Israel. The Company and its subsidiaries, associated companies and joint ventures (hereinafter – “the Group”) is a leading specialty minerals group that operates a unique, integrated business model. The Company competitively extract raw materials and utilize sophisticated processing and product formulation technologies to add value to customers in three attractive end-markets: agriculture, food and engineered materials. These three end markets constitute over 90% of the Company’s revenues today. The Company’s operations are organized into three segments: (1) Fertilizers, which operates the raw material extraction for ICL and markets potash, phosphates and specialty fertilizers; (2) Industrial Products, which primarily extracts bromine from the Dead Sea and produces and markets bromine and phosphorus compounds for the electronics, construction, oil & gas and automotive industries and (3) Performance Products, which mainly produces, markets and sells a broad range of downstream phosphate-based food additives and industrial intermediates. The Company is a subsidiary of Israel Corporation Ltd.
The Company principal assets include: One of the world’s richest, longest-life and lowest-cost sources of potash and bromine (the Dead Sea). Additionally, Potash mines in the United Kingdom and Spain. Bromine compounds processing facilities located in Israel, in the Netherlands and in China. A unique integrated phosphate value chain, from phosphate rock mines in the Negev Desert in Israel into production facilities of value-added products in Israel, Europe, US, Brazil and China. An extensive global logistics and distribution network with operations in over 30 countries and a focused and highly experienced staff which develops production processes, new applications, formulations and products for our 3 key end markets – agriculture, food and engineered materials.
ICL operates in the markets for potash, bromine, pure phosphoric acid, special phosphates, bromine-based and phosphorus-based flame retardants and chemicals for the prevention of the spreading of fires.
ICL’s products are used mainly in the areas of agriculture, electronics, food, fuel and gas exploration, water purification and desalination, detergents, cosmetics, medicines, vehicles and others.
The Company’s overseas operations consist mainly of the production of products that are integrated with or based on the activities of the companies in Israel or in closely related fields. About 95% of the Group’s products are sold to customers outside of Israel.
B. State share
The State of Israel holds a Special State Share in ICL and in some of its subsidiaries, entitling the State the right to safeguard the State of Israel interests (see Note 24).
C. Definitions
1. Subsidiary – a company over which the Company has control and the financial statements of which are fully consolidated with the Company's statements as part of the consolidated financial statements.
2. Associated company – a company, which is not a subsidiary, over the financial and operational policies of which the Company has significant influence, and the investment in which is presented on the basis of the equity method of accounting. Significant influence is deemed to exist when the holding percentage in the said company is 20% or more, unless there are circumstances that contradict this assumption.
3. Investee company – (a) a subsidiary or (b) a joint venture of which the Company’s direct or indirect investment is included in the financial statement based on the equity method.
4. Joint arrangements – arrangements wherein the Company has joint control that was obtained by means of an agreement that requires unanimous consent with respect to the activities having a significant impact on the arrangement's results.
A. Statement of compliance with International Financial Reporting Standards
The consolidated financial statements have been prepared by the Group in accordance with International Financial Reporting Standards (IFRS) as issued by the International Accounting Standards Boards (IASB).
The consolidated financial statements were authorized for issuance by the Company’s Board of Directors on March 19, 2015.
B. Functional and presentation currency
Items included in the consolidated financial statements of the Company and each of its subsidiaries are measured using the currency of the primary economic environment in which the individual entity operates (“the functional currency”). The consolidated financial statements are presented in United States Dollars (“US Dollars”; $), which is the functional currency of the Company and the majority of its subsidiaries.
C. Basis of measurement
The consolidated financial statements have been prepared on the historical cost basis except for derivative financial instruments, securities held for trade that are stated at fair value.
Deferred tax assets and liabilities are recognized for temporary differences between the carrying amounts of assets and liabilities and their value for taxation purposes. The deferred taxes are measured at the tax rates expected to apply to the temporary differences when they reverse, based on the laws that have been enacted or effectively enacted as at the reporting date. Inventories are measured at the lower of cost and net realizable value. Provisions are recognized according to the best estimate at the end of the reporting period of the outflow required to settle the obligation presently. When the value of time is significant, the future cash flows are discounted at a pre tax rate that reflects current market assessments of the time value of money and the risks specific to the liability.
For information regarding the measurement basis of assets and liabilities in respect of employee benefits – see Note 3J.
D. Operating cycle
The Company’s regular operating cycle is one year. As a result, the current assets and the current liabilities include items the realization of which is intended and anticipated to take place within one year.
E. Use of estimates and judgment
In preparation of the financial statements in accordance with IFRS as issued by the IASB, Company Management is required to use judgment when making estimates, assessments and assumptions that affect implementation of the accounting policies and the amounts of assets, liabilities, income and expenses. It is clarified that the actual results may be different from these estimates.
At the time of formulating the accounting estimates used in preparation of the Company’s financial statements, Company Management is required to make assumptions regarding circumstances and events involving significant uncertainty. When using its judgment in determining the estimates, Company Management uses past experience, various facts, outside experts and reasonable assumptions in accordance with the circumstances appropriate to each estimate.
The estimates and the assumptions used in preparation of the financial statements are reviewed on an ongoing basis. Revisions to estimates are recognized prospectively.
Presented hereunder is information with respect to estimates for which significant value adjustment risk exist, and were made while implementing the accounting policies that have a material impact on the financial statements:
F-12
Note 2 – Basis of Preparation of the Financial Statements (cont'd)
1. Employee benefits
According to International Standard IAS 19, some of the Group’s employee benefit plans constitute a defined benefit plan as defined in IAS 19. Such plans include principally, liabilities for pension and severance benefits.
In computing the pension liability, the Company uses various assessments. These assessments include, among other things, the interest rate for discounting the Company’s pension liability and the pension fund assets, assessments regarding the long term increase in wages and an assessment of the life expectancy of the group of employees entitled to a pension. Assessment of the interest rate for purposes of discounting the Company’s pension liability and the pension fund assets is based on the rate of return on bonds of corporations operating in countries where an active market exists for corporate bonds and on the rate of return on government bonds for companies operating in countries where there is no active market for corporate bonds. The rate of return on long-term bonds changes according to market conditions. As a result the discount rate will also change as will the pension liability and the pension fund assets. The assessment regarding the increase in wages is based on the Company’s forecasts in accordance with past experience and existing labor agreements. Such assessments may be different than the actual wage increases.
The life expectancy assessment is based on actuarial research published in each country. This research is updated every several years, and accordingly the life expectancy assessment may be updated.
Measurement of the liability for severance pay is based upon an actuarial assessment, which takes into account various assessments, among others, the future increase in employee wages and the rate of employee turnover. The measurement is made on the basis of discounting the expected future cash flows according to the interest rate on highly rated corporate bonds. In addition, the severance pay deposits are measured according to their fair value. Changes in the assumptions used for the calculation of the liability for severance pay and the related plan assets for severance pay could increase or decrease the net liability for severance pay recognized.
2. Environmental and contingent liabilities
The Company produces fertilizers and chemical products and, therefore, is exposed in its ordinary course of business to obligations and commitments under environmental and related laws and regulations. The Company recognizes a liability in its books when such liability is expected, is derived from a liability event that has already occurred and can be reliably measured. Assessment of the liability is based mostly on past experience, familiarity with the legal requirements concerning the Company’s areas of operation, as well as assessments regarding contingent claims existing against the Company based on opinions of legal advisors and other experts. As explained in Note 23 to the financial statements, a number of lawsuits are pending against the Company, the results of which may have a material impact on its results.
When assessing the possible outcomes of legal claims that were filed against the Company and its investee companies, the Company bases itself on the opinions of its legal advisors. These opinions of the legal advisors are based on the best of their professional judgment, and take into consideration the current stage of the proceedings and the legal experience accumulated with respect to the various matters. As the results of the claims will ultimately be determined by the courts or as part of a compromise, they may be different from the aforesaid estimates of the Company and its advisors.
3. Property, plant and equipment
Property, plant and equipment items are depreciated using the straight-line method over their estimated useful lives.
The Company evaluates the estimated useful lives of the property, plant and equipment by means of a comparison to the sector in which the Group operates, the level of upkeep of the facilities and the performance of the facilities over the years. Changes in these estimates in succeeding periods could increase or decrease the rate of depreciation of the facilities.
4. Impairment of assets – IAS 36
The Company examines at every reporting date whether there have been events or changes in circumstances indicating that there has been an impairment of one or more non monetary assets. When there are indications of
Note 2 – Basis of Preparation of the Financial Statements (cont'd)
impairment, an examination is made as to whether the carrying amount of the investment can be recovered from the discounted cash flows anticipated to be derived from the asset, and if necessary it records an impairment provision up to the amount of the recoverable value. Assessment of the impairment of goodwill and of other intangible assets having an indeterminable lifespan is performed once a year or more frequently when indications of impairment exist.
The recoverable value of the asset or the cash generating unit is determined based on the higher of the fair value of the asset less realization costs and the present value of the future cash flows expected from the continued use of the asset in its existing state, including the cash flows expected upon removal of the asset from service and its eventual sale (value in use).
The future cash flows are discounted to their present value using a discount rate that reflects assessments of the market participants of the time value of money and the risks specific to the asset. The estimates regarding cash flows are based on past experience with respect to this asset or similar assets, and on the Company’s best assessments regarding the economic conditions that will exist during the asset’s remaining useful life.
The estimates of the future cash flows are based on the Company’s forecasts. Since the actual cash flows could be different than the Company’s forecasts, the amount of the realizable value determined in the examination of impairment in value may change in succeeding periods, such that in the future an additional reduction of the value of the assets may be required or elimination of the reduction recorded in prior periods.
In 2012, 2013 and 2014, there were no signs of impairment in value, except for a decline in value of one of the Company's cash generating units, in the amounts of about $10 million and about $40 million, which were recognized in 2013 and 2014, respectively.
5. Business combinations
The Company is required to allocate the cost of acquiring companies and operations in business combinations on the basis of the estimated fair value of the assets and liabilities acquired. The Company uses the valuations of external independent appraisers and internal valuations for purposes of determining the fair value. The valuations include assessments and estimates of Management concerning expected cash flow forecasts from the acquired business, and models for calculating the fair value of the acquired items and their depreciation period. Management’s estimate has an impact on the balance of assets and liabilities acquired and the depreciation and amortization in the statement of income. Management’s estimates of the forecasted cash flows and useful lives of the acquired assets may differ from the actual results.
6. Taxes on Income
The Company and the Group companies are assessed for income tax purposes in numerous jurisdictions and, therefore, Company Management is required to exercise considerable judgment in order to determine the aggregate provision for taxes. A provision in respect of uncertain tax positions is recorded where it is more likely than not that a flow of economic resources will be required in order to discharge the obligation. For details in connection with an assessment from the Taxes Authority in Israel whereby the Company is required to pay additional tax beyond the amount it already paid in respect of 2009 2011, in the amount of about $200 million – see Note 20.
The deferred taxes are computed according to tax rates expected to apply when the timing differences are realized, as stated in Note 3O. The tax rate expected to apply upon the realization of the timing differences applying to Beneficiary Enterprises in Israel entitled to tax benefits is based on forecasts of future revenues to be earned by such Beneficiary Enterprises in proportion to the Company's total revenues. Changes in these assessments could lead to changes in the book value of these tax assets, the tax liabilities and the results of operations.
7. Inventories
Inventories are measured in the financial statements at the lower of cost or net realizable value. The net realizable value is an estimate of the selling price during the ordinary course of business, less the estimate of the cost of completion and the estimate of the costs needed to effect the sale. The selling price is estimated on the basis of the selling price expected at the time of realization of the inventories; a decrease in the expected selling price could cause a decrease in the book value of the inventories and the results of operations accordingly. Raw materials are written down to realizable value, which are based on the realization values of the inventories of the finished products
in which they are included, only when the finished products in which they are included are expected to be sold at prices below cost. In cases where the replacement price of raw materials serves as the best available evidence for realizable value, measurement of realizable value is based on the replacement price. A decline in the expected replacement value could give rise to a decline in the value of the inventories of raw materials in the books and the results of operations, respectively.
Part of the raw materials, work in process and finished goods are in bulk. The quantities are based on estimates made, for the most part, by third-parties who measure the volume and density of the inventory. Variances in the estimates used in determining the measurements may cause a change in the value of the inventory in the books and in the Company's results.
The accounting policies in accordance with IFRS are consistently applied by the Group companies for all the periods presented in these consolidated financial statements.
A. Basis for Consolidation
1. Subsidiaries
Subsidiaries are entities that are controlled by the Group. Control exists when the Group, is exposed, or has rights to variable yields from its involvement in the investee company and the Group has the ability to impact these yields by means of its influence over the investee company. When examining control, actual rights held by the Group and by others are taken into account. The financial statements of the subsidiaries are included in the consolidated financial statements from the date control was acquired until the date control ceases to exist/
2. Associated companies
Associated companies are entities regarding which the Group has significant influence over their financial and operational policy, however control thereof has not been obtained. Associated companies are accounted for using the equity method of accounting. The consolidated financial statements include the Group’s share in the net revenues and expenses of associated companies.
3. Intercompany balances and transactions eliminated in the consolidation
Intercompany balances within the Group and unrealized income and expenses deriving from intercompany transactions are eliminated in preparation of the consolidated financial statements. Unrealized net profit deriving from transactions and joint ventures with associated companies was eliminated against the investment based on the Group’s rights in these investments.
4. Non-controlling interests
The non-controlling interests represent the interest in the net assets of subsidiaries that are allocated to rights not owned by the Company, whether directly or indirectly through subsidiaries. The non-controlling interests are presented in the consolidated statement of financial position in the equity section, separate from the equity attributable to the Company’s shareholders. The share of the non-controlling interests in the Group’s results is presented in the consolidated statement of income as an allocation of the total income or loss for the period between the non-controlling interests and the Company’s shareholders.
Transactions with non-controlling interests where control is retained, are accounted for as an equity transaction. Differences between the consideration paid and the change in the non-controlling interests is recorded to the share of the Company’s shareholders directly to the retained earnings.
5. Business combinations
The Group implements the “acquisition method” for all business combinations. The acquisition date is the date on which the acquiring entity obtains control over the acquired entity.
F-15
Note 3 – Significant Accounting Policies (cont'd)
The Group recognizes goodwill as at the acquisition date based on the fair value of the consideration paid less the net amount attributed in the acquisition to the identifiable assets acquired and the liabilities undertaken. The consideration paid includes the fair value of contingent consideration. Subsequent to the acquisition date, the Group recognizes changes in the fair value of contingent consideration classified as a liability in the statement of income.
Costs related to the acquisition incurred by the purchaser in respect of the acquisition such as: brokers’ commissions, consultants’ commissions, legal fees and valuations, are recorded as an expense in the period the services are received.
B. Foreign Currency
1. Transactions in foreign currency
Transactions in foreign currency are translated into the functional currency of the Company and each of its subsidiaries based on the exchange rate in effect on the dates of the transactions. Monetary assets and liabilities denominated in foreign currency on the report date are translated into the functional currency of the Company and each of its subsidiaries based on the exchange rate in effect on that date. Exchange rate differences in respect of monetary items are the difference between the net book value in the functional currency at the beginning of the year plus the payments during the year and the net book value in foreign currency translated based on the rate of exchange at the end of the year. Exchange rate differences deriving from translation into the functional currency are recognized in the statement of income. Non monetary items denominated in foreign currency and measured in terms of historical cost are translated using the exchange rate in effect on the date of the transaction.
2. Foreign activities
The assets and liabilities of foreign activities, including goodwill and adjustments to fair value created upon acquisition, were translated into dollars according to the rates of exchange in effect on the date of the report. Income and expenses of the foreign activities were translated into dollars according to the rates of exchange that were in effect on the transaction dates.
Exchange rate differences in respect of the translation are recorded in other comprehensive income, as part of the reserve for translation of foreign activities. When a foreign activity is realized that causes a loss of control, the accumulated amount in the translation reserve of foreign activities is transferred to the income statement as part of the gain or loss on realization of the investment.
Gains and losses from exchange rate differences deriving from loans received from or granted to foreign activities, the settlement of which is not planned and is not expected to take place in the foreseeable future, are included as part of the net investment in the foreign activities and are recognized in other comprehensive income in a reserve for translation of foreign activities.
C. Financial Instruments
1. Non-derivative financial instruments
Non-derivative financial instruments include investments in shares and debt instruments, including trade and other receivables, cash and cash equivalents, loans and credit received, and trade and other payables.
With respect to instruments not presented at fair value through the statement of income, the initial recognition is at fair value with the addition of all allocable directly related transaction costs.
The Group initially recognizes loans, receivables and deposits on the date they are created. The rest of the financial assets purchased in the regular way, including assets designated at fair value through the statement of income, are initially recognized on the trade date when the Group becomes a party to the instrument's contractual conditions, that is, on the date the Group committed to buy or sell the asset. Financial assets are eliminated when the contractual rights of the Group to the cash flows deriving from the financial assets expire, or when the Group transfers the financial assets to others without retaining control or effectively transfers all of the risks and rewards deriving from the asset. Acquisitions and sales of financial assets made in the usual manner are recognized on the trade date, that is, on the date the Group committed to buy or sell the asset. Financial liabilities are eliminated when the Group’s obligation as described in the contract expires or when it is paid or cancelled.
A financial asset and a financial liability are offset and the amounts are presented on a net basis in the statement of financial position where the Group has a currently enforceable legal right to offset the amounts recognized and the intention is to settle the asset and liability on a net basis or to realize the asset and settle the liability concurrently.
Cash and cash equivalents
Cash and cash equivalents includes cash balances that are available for immediate use and deposits at call. Cash equivalents include short-term investments, where the period of time from the original deposit and up to the redemption date is up to three months, having high liquidity that can be easily converted into known amounts of cash and that are subject to an insignificant risk in connection with changes in value.
Loans and receivables
Loans and receivables are non-derivative financial instruments having fixed payments or payments that can be fixed that are not traded on an active market. After the initial recognition, the loans and debit balances are measured based on amortized cost using the effective interest rate method while taking into account transaction costs and net of impairment losses.
2. Derivative financial instruments
The Group holds derivative financial instruments for the purpose of economic (non-accounting) hedging against foreign currency risks, risks with respect to commodity prices, marine shipping prices, and interest risks. In addition, for purposes of an accounting hedge, the Company held derivative financial instruments for hedging the exposure to changes in the cash flows of an undertaking for construction of a new cogeneration power plant in Sodom. On the commencement date of the accounting hedge, the Group formally documented the hedge ratio between the hedging instrument and the hedged item, including the risk management target and the Group's strategy with respect to execution of the hedge, as well as the manner in which the Group estimates the effectiveness of the hedge ratio.
Derivatives are recognized according to fair value and the attributable transaction costs are recorded in the statement of income as incurred. Changes in the fair value of the derivatives are recorded in the statement of income, except for derivatives used to hedge cash flows, as detailed below.
Cash flow hedges
Changes in the fair value of derivatives used to hedge cash flows, in respect of the effective portion of the hedge, were recorded through other comprehensive income directly in a capital reserve. With respect to the non effective part, changes in the fair value were recognized in the statement of income. The amount accumulated in the capital reserve was reclassified and included in the statement of income in the same period as the hedged cash flows affected profit or loss under the same line item in the statement of income as the hedged item.
Where the hedged item is a non-financial asset, the amount recorded in the capital reserve is transferred to the book value of the asset, upon recognition thereof.
If the hedging instrument no longer meets the criteria for hedge accounting, expires or is sold, terminated or exercised, hedge accounting is discontinued. The cumulative gain or loss previously recognized through other comprehensive income and presented in the hedging reserve in equity remains there until the forecasted transaction occurs or is no longer expected to occur. If the forecasted transaction is no longer expected to occur, the cumulative gain or loss previously recognized in the hedging reserve is recognized immediately in profit or loss.
Economic hedge that does not meet the conditions of an accounting hedge
Changes in the fair value of derivatives that do not meet the conditions of an accounting hedge in accordance with IFRS, after the date of the initial recognition thereof, are recorded in the statement of income as financing income or expenses.
3. CPI-linked assets and liabilities not measured at fair value
The value of index-linked financial assets and liabilities, which are not measured based on fair value, are revalued every period in accordance with the actual rate of increase/ decrease in the CPI.
D. Property, plant and equipment
1. Recognition and measurement
Property, plant and equipment are presented at cost after deducting the related amounts of government grants and less accumulated depreciation and provision for impairment.
The cost includes expenses that can be directly attributed to purchase of the asset. The cost of assets that were constructed independently includes the cost of the materials and direct salary costs, as well as any additional costs that are directly attributable to bringing the asset to the required position and condition so that it will be able to function as management intended, as well as an estimate of the costs to dismantle and remove the items and to restore its location, where there is an obligation to dismantle and remove or to restore the site. The cost of purchased software, which constitutes an inseparable part of operating the related equipment, is recognized as part of the cost of said equipment.
Spare parts for facilities are valued at cost determined based on the moving average method, after recording a write down in respect of obsolescence. The portion designated for current consumption is presented in the inventories “category” in the current assets’ section.
Where significant parts of an item of property, plant and equipment (including costs of major periodic inspections) have different life expectancies, they are treated as separate items (significant components) of the property, plant and equipment.
Changes in a commitment to dismantle and remove items and to restore their location, except for changes stemming from the passage of time, are added to or deducted from the cost of the asset in the period in which they occur. The amount deducted from the cost of the asset may not exceed its book value. The balance, if any, is recognized immediately in the statement of income.
Gains and losses on disposal of a property, plant or equipment item are determined by comparing the proceeds from disposal with the carrying amount of the asset, and are recognized net in the income statement in the “other income” or “other expenses” category, as applicable.
2. Subsequent costs (costs incurred after the initial recognition date)
The cost of replacing part of an item of property, plant and equipment and other subsequent costs are recognized as part of the book value of the item if it is expected that the future economic benefit inherent therein will flow to the Group and that its cost can be reliably measured. The book value of the part that was replaced is eliminated. Routine maintenance costs are charged to the statement of income as incurred.
3. Depreciation
Depreciation of an item of property, plant and equipment begins when it is available for use, that is, when it has reached the place and condition required in order that it can be used in the manner contemplated for it by Management.
Depreciation is recorded in the statement of income according to the straight-line method over the estimated useful life of each significant component of the property, plant and equipment items. Owned land is not depreciated.
The estimated useful life for the current period and comparative periods is as follows:
|
In Years
|
||||
|
Land development, roads and structures
|
10–30 | |||
|
Facilities, machinery and equipment
|
8–25 | |||
|
Dams and ponds (1)
|
6–40 | |||
Note 3 – Significant Accounting Policies (cont'd)
|
Heavy mechanical equipment, train cars and tanks
|
5 –10 | |||
|
Office furniture and equipment, motor vehicles, computer equipment and other
|
3–20 |
|
(1)
|
Mainly 40 years
|
E. Intangible Assets
1. Goodwill
Goodwill is created as a result of acquisition of subsidiaries. Acquisition of non controlling interests are transactions with shareholders and goodwill is not recognized on such acquisitions.
Subsequent measurement
Goodwill is measured at cost less accumulated losses from impairment.
2. Costs of exploration and evaluation of resources
Costs incurred in respect of exploration of resources and the evaluation thereof are recognized as intangible assets. The expenditures are recognized on the cost basis less a provision for impairment.
The cost includes, among other things, costs of performing research studies, drilling costs and activities in connection with assessing the technical feasibility with respect to the commercial viability of extracting the resources.
3. Research and development
Expenditures for research activities are recognized in profit or loss as incurred.
Development expenditures are capitalized to intangible asset only if development costs can be measured reliably, the product or process is technically and commercially feasible, future economic benefits are probable, and the Group has the intention and sufficient resources to complete development and to use or sell the asset. Other development expenditures costs are recognized in profit or loss as incurred. Subsequent to initial recognition, development expenditures are measured at cost less accumulated amortization and any accumulated impairment loss.
4. Other intangible assets
Other intangible assets purchased by the Group, with a defined useful life, are measured according to cost less amortization and accumulated losses from impairment.
Intangible assets with indefinite useful lives are measured according to cost less accumulated losses from impairment.
5. Subsequent costs
Subsequent costs are recognized as an intangible asset only when they increase the future economic benefit inherent in the asset for which they were incurred. All other costs, including costs relating to goodwill or trademarks developed independently, are charged to the statement of income as incurred.
6. Amortization
Amortization is recorded in the statement of income according to the straight-line method from the date the assets are available for use, over the estimated useful economic life of the intangible assets, except for customer relationships and geological surveys, which are amortized according to the rate of consumption of the economic benefits expected from the asset on the basis of cash flow forecasts. Goodwill and intangible assets having an indefinite lifespan are not amortized on a systematic basis but, rather, are examined at least once a year for purposes of impairment in value.
The estimated useful life for the current period and comparative periods is as follows:
|
In Years
|
||||
|
Concessions – over the balance of the concession granted to the companies
|
||||
|
Software costs
|
3–10 | |||
|
Trademarks
|
5–30 | |||
|
Customer relationships
|
15–25 | |||
|
Agreements with suppliers
|
5 | |||
|
Patents
|
7–20 | |||
|
Non-competition agreement
|
5 | |||
Deferred expenses in respect of geological surveys are amortized over their useful life based on a geological estimate of the amount of the material that will be produced from the mining site.
The estimates regarding the amortization method and useful life are reviewed, at a minimum, at the end of every reporting year and are adjusted where necessary. The Group assesses the useful life of the customer relationships on an ongoing basis, based on an analysis of all of the relevant factors and evidence, considering the experience the Company has with respect to recurring orders and churn rates and considering the future economic benefits expected to flow to the Company from these customer relationships.
The Group periodically examines the estimated useful life of an intangible asset that is not amortized, at least once a year, in order to determine if events and circumstances continue to support the determination that the intangible asset has an indefinite life.
F. Leased Assets
Leases, where the Group assumes substantially all the risks and rewards of ownership of the asset, are classified as financing leases. Upon initial recognition, the leased assets are measured and a liability is recognized at an amount equal to the lower of its fair value or the present value of the future minimum lease payments. Subsequent to initial recognition, the asset is accounted for in accordance with the accounting policy applicable to that asset.
Other leases are classified as operating leases where the leased assets are not recognized in the Group’s statement of financial position. Payments under an operating lease are recorded in the statement of income on the straight-line method, over the period of the lease.
G. Inventories
Inventories are measured at the lower of cost or net realizable value. The cost of the inventories includes the costs of purchasing the inventories and bringing it to its present location and condition. In the case of work in process and finished goods, the cost includes the proportionate part of the manufacturing overhead based on normal capacity. Net realization value is the estimated selling price in the ordinary course of business, after deduction of the estimated cost of completion and the estimated costs required to execute the sale.
The cost of the inventories of raw and auxiliary materials, maintenance materials, finished goods and goods in process, is determined mainly according to the “moving average” method. If the benefit from stripping costs (costs of removing waste produced as part of a mine's mining activities during its production stage) is realized in the form of inventories, the Company accounts for these stripping costs as inventories. In a case where the benefit is improved access to the quarry, the Company recognizes the costs as a non current addition to the asset, provided the criteria presented in IFRIC 20 are met.
Inventories which are expected to be sold in a period of more than 12 months from the reporting date are presented as non-current inventories, as part of non-current assets.
H. Capitalization of Borrowing Costs
Specific borrowing costs are capitalized to qualifying assets (assets that require a significant period of time to prepare them for their intended use or sale) during the period required for their completion and establishment until the time when they are ready for their intended use. Non-specific borrowing costs are capitalized to the investment
Note 3 – Significant Accounting Policies (cont'd)
in qualifying assets using an interest rate that is the weighted-average of the interest rates in respect of those credit sources that were not capitalized specifically. Other borrowing costs are charged to the statement of income as incurred.
I. Impairment
1. Financial assets
An impairment of a financial asset is examined when there is objective evidence that one or more events have occurred that may have had a negative impact on the estimate of the future cash flows from the asset.
Objective evidence that financial assets have been impaired can include a contractual default by a debtor, restructuring of an amount due to the Group on terms that the Group would not otherwise consider, indications that a debtor or issuer will enter into bankruptcy, or the disappearance of an active market for a security.
The loss from impairment in the value of a financial asset measured according to amortized cost is calculated as the difference between the book value of the asset and the present value of the estimated future cash flows, discounted using the original effective interest rate. A loss from impairment in value of a financial asset classified as “available for sale” is calculated on the basis of its present fair value. Regarding significant financial assets, the need for an impairment in value is examined for each asset separately.
Losses from impairment in value, except for losses relating to a financial asset classified as “available for sale”, are recorded in the statement of income. An accumulated loss, which relates to a financial asset classified as “available for sale” that was previously recorded to equity, is transferred to the statement of income where it sustains a significant or continuing decline in its fair value below the original cost.
The Group examines evidence of impairment for receivables and loans on a specific basis. An impairment loss is cancelled if the cancellation can be related objectively to an event occurring after the impairment loss was recognized. Cancellation of an impairment loss for financial assets measured at amortized cost is recorded in the statement of income, except for cancellation of an impairment loss for financial assets classified as “available-for-sale” that are equity instruments, which are recognized directly in other comprehensive income.
2. Non-financial assets
In every reporting period, an examination is made with respect to whether there are signs indicating impairment in value of the Group’s non-financial assets, other than inventories and deferred tax assets. If such signs exist, the estimated recoverable amount of the asset is calculated. The Group conducts an annual examination of the recoverable amount of goodwill and intangible assets with indefinite useful lives or that are not available for use, or more frequently if there are indications of impairment.
The recoverable amount of an asset or a cash-producing unit is the higher of its value in use or the net selling price (fair value less realization costs). When determining the value in use the Group discounts the anticipated future cash flows according to a pre-tax discount rate that reflects the evaluations of the market's participants regarding the time value of money and the specific risks relating to the asset or to a cash-producing unit. For purposes of testing impairment in value, the assets are grouped together into the smallest group of assets that yields cash flows from continuing use, which is essentially independent of the other assets and other groups (“cash generating unit”). Goodwill purchased in the context of business combinations is allocated for the purpose of examining impairment in value to cash-producing units that are expected to yield benefits from the synergy of the combination.
Assets of the Company's headquarters – assets of the Company's headquarters do not produce separate cash flows and they serve more than one cash-producing unit. Some of the assets of the Company's headquarters are allocated to cash-producing units on a reasonable and consistent basis and are examined for impairment as part of examination of impairment of the cash-producing units to which they are allocated.
Losses from impairment of value are recognized when the book value of the asset or of the cash-producing unit exceeds the recoverable value and are recorded in the statement of income. Losses from impairment of value that were recognized for cash-producing units are first allocated to reducing the book value of the goodwill attributed to these units and afterwards to reducing the book value of the other assets in the cash-producing unit, proportionately.
A loss from impairment in value of goodwill is not cancelled. Regarding other assets with respect to which losses from impairments of value were recognized in previous periods, in each reporting period an examination is made as to whether there are signs indicating that these losses have decreased or no longer exist. A loss from impairment of value is cancelled if there has been a change in the estimates used to determine the recoverable value, only if the book value of the asset, after cancellation of the loss from impairment of value, does not exceed the book value, after deduction of depreciation or amortization, that would have been determined if the loss from impairment of value had not been recognized.
J. Employee Benefits
The Group has several post-employment benefit plans. The plans are funded partly by deposits with insurance companies or funds managed by a trustee, and they are classified as defined contribution plans and as defined benefit plans.
1. Defined contribution plans
A defined contribution plan is a post-employment benefit plan under which the Group pays fixed contributions into a separate entity and has no legal or constructive obligation to pay further amounts if the fund does not have sufficient assets to pay all the employee benefits relating to the employee’s service in the current and prior periods.
The Group’s obligation to make deposits in a defined contribution plan is recorded as an expense in the statement of income in the periods during which the employees provided the services.
2. Defined benefit plans
Defined benefit plans are retirement benefit plans that are not defined contribution plans.
The Group’s net obligation, regarding defined benefit plans for post-employment benefits, is calculated for each plan separately by estimating the future amount of the benefit to which an employee will be entitled as compensation for his services in the current and past periods. The benefit is presented at present value after deducting the fair value of the plan assets. The discount rate for the Group companies operating in countries having a “deep” market wherein there is a high level of trading in corporate bonds is in accordance with the yield on the corporate bonds, including Israel. The discount rate for the Group companies operating in countries not having a market wherein there is a high level of trading in corporate bonds, as stated above, is in accordance with the yield on government bonds – the currency and redemption date of which are similar to the terms binding the Group. The calculations are performed by a qualified actuary using the projected unit credit method.
When on the basis of the calculations a net asset is created for the Group, the asset is recognized up to the net present value of the available economic benefits in the form of a refund from the plan or by a reduction in future deposits to the plan. An economic benefit in the form of a refund from the plan or a reduction in future deposits will be considered available when it can be realized in the lifetime of the plan or after settlement of the obligation.
Costs in respect of past services are recognized immediately and without reference to whether or not the benefits have vested.
The movement in the net liability in respect of a defined benefit plan that is recognized in every accounting period in the statement of income is comprised of the following:
(i) Current service costs – the increase in the present value of the liability deriving from employees’ service in the current period.
(ii) The net financing income (expenses) are calculated by multiplying the net defined benefit liability (asset) by the discount rate used for measuring the defined benefit liability, as determined at the beginning of the annual reporting period.
(iii) Exchange rate differences;
(iv) Past service costs and plan reduction – the change in the present value of the liability in the current period as a result of a change in post-employment benefits attributed to prior periods.
The difference, as at the date of the report, between the net liability as at the beginning of the period plus the movement in profit and loss as detailed above, and the actuarial liability less the fair value of the fund assets at the end of the period, reflects the balance of the actuarial income or expenses recognized in other comprehensive income and is recorded in retained earnings.
The current interest costs and return on plan assets are recognized as expenses and interest income in the respective financing category.
3. Other long-term employee benefits
Some of the Company’s employees are entitled to other long-term benefits that do not relate to a post-retirement benefit plan. Actuarial gains and losses are recorded directly to the statement of income in the period in which they arise.
In cases where the amount of the benefit is the same for every employee, without taking into account the years of service, the cost of the benefit is recognized when entitlement to the benefit is determined. The amount of these benefits is discounted to its present value in accordance with an actuarial evaluation.
4. Early retirement pay
Early retirement pay is recognized as an expense and as a liability when the Group has clearly undertaken to pay it, without any reasonable chance of cancellation, in respect of termination of employees before they reach the customary age of retirement according to a formal, detailed plan. The benefits provided to employees upon voluntary retirement are charged when the Group proposes a plan to the employees encouraging voluntary retirement, it is expected that the proposal will be accepted and it is possible to reliably estimate the number of employees that will accept the proposal.
5. Short term benefits
Obligations for short-term employee benefits are measured on a non-discounted basis, and the expense is recorded at the time the said service is provided.
A provision for short-term employee benefits in respect of cash bonuses is recognized when the Group has a current legal or implied obligation to pay the said amount for services provided by the employee in the past and it is possible to reliably estimate the amount.
Classification of employee benefits as a short term employee benefit or a long term employee benefit (for measurement purposes) is determined based on the Group's expectation with respect to full utilization of the benefits and not based on the date on which the employee is entitled to utilize the benefit.
6. Share-based compensation
The fair value on the grant date of share-based compensation awards granted to employees is recognized as a salary expense, with a corresponding increase in equity, over the period that the employees become unconditionally entitled to the awards. The amount recognized as an expense in respect of share-based compensation awards that are conditional upon meeting vesting conditions that are service conditions, is adjusted to reflect the number of awards that are expected to vest.
K. Provisions
A provision is recognized when the Group has a present legal or implied obligation as the result of an event that occurred in the past, that can be reliably estimated and when it is expected that a flow of economic benefits will be required in order to settle the obligation. The provisions are made by means of discounting of the future cash flows at a pre-tax interest rate reflecting the current market estimates of the time value of money and the risks specific to the liability, and without taking into account the Company’s credit risk. The book value of the provision is adjusted in every period in order to reflect the amount of time that has elapsed and is recognized as financing expenses. In rare cases where it is not possible to estimate the outcome of a potential liability, no provision is recorded in the financial statements.
1. Warranty
A provision for warranty is recognized when the products or services, in respect of which the warranty is provided, are sold or performed. The provision is based on historical data and on a weighting of all possible expenses according to their probability of occurrence.
2. Provision for environmental costs
The Group recognizes a provision for an existing obligation for prevention of environmental pollution and anticipated provisions for costs relating to environmental restoration stemming from current or past activities.
Costs for preventing environmental pollution that increase the life expectancy or efficiency of a facility or decrease or prevent the environmental pollution are recorded as a provision, are capitalized to the cost of the property, plant and equipment and are depreciated according to the usual depreciation rates used by the Group.
3. Legal claims
A provision for legal claims is recognized when the Group has an express or implied legal obligation as a result of an event that occurred in the past, if it is more likely than not that an outflow of economic resources will be required to settle the obligation and it can be reliably estimated. Where the time value is significant, the provision is measured based on its present value.
Sale of goods
Revenue from the sale of goods in the ordinary course of business is measured at the fair value of the consideration received or receivable, net of returns, trade discounts and volume rebates. When the credit period is short and constitutes the accepted credit in the industry, the future consideration is not discounted.
Revenue is recognized when persuasive evidence exists (usually in the form of an executed sales agreement) that the significant risks and rewards of ownership have been transferred to the buyer, recovery of the consideration is probable, the associated costs and possible return of goods can be estimated reliably, there is no continuing management involvement with the goods, and the amount of revenue can be measured reliably. If it is probable that discounts will be granted and the amount can be measured reliably, then the discount is recognized as a reduction of revenue as the sales are recognized.
M. Treasury stock
Where share capital recognized as equity has been reacquired by the Group, the amount of the consideration paid including direct expenses, is deducted from equity. The reacquired shares are classified as treasury shares and are presented as a deduction from equity.
N. Financing Income and Expenses
Financing income includes income from interest on amounts invested, gains from exchange rate differences, gains from derivative financial instruments recognized in the statement of income, and gains from available for sale financial assets. Interest income is recognized as accrued, using the effective interest method.
Financing expenses include interest on loans received, changes in the time value of provisions, securitization transaction costs, losses from impairment of available for sale financial assets, losses from derivative financial instruments, changes due to the passage of time in liabilities in respect of defined benefit plans for employees less interest income deriving from plan assets of a defined benefit plan for employees and losses from exchange rate differences. Borrowing costs, which are not capitalized, are recorded in the income statement using the effective interest method.
Gains and losses from exchange rate differences and from derivative financial instruments are reported on a net basis, as financing income or financing expenses, based on the fluctuation in the exchange rates and based on their position (net gain or loss).
In the statements of cash flows, interest received and interest paid are presented as part of cash flows from operating activities.
O. Taxes on Income
Taxes on income include current and deferred taxes.
The current tax is the amount of tax that is expected to be paid on the taxable income for the year, which is calculated according to the tax rates in effect based on the law that was finally legislated or effectively legislated as at the date of the report, and includes changes in tax payments attributed to prior years, and payment of tax in respect of distribution of a dividend.
Recognition of deferred taxes is according to the balance sheet approach, relating to temporary differences between the book values of the assets and liabilities for purposes of financial reporting and their value for tax purposes. The Company does not recognize deferred taxes for the following temporary differences: initial recognition of goodwill, initial recognition of assets and liabilities for transactions that do not constitute a business combination and do not impact the accounting income and the income for tax purposes, as well as differences deriving from investments in subsidiaries, investee companies and associated companies that are presented according to equity method, if it is not expected that they will reverse in the foreseeable future and if the Group controls the date the provision will reverse, whether via sale or distribution of a dividend. The deferred taxes are measured according to the tax rates expected to apply to the temporary differences at the time they are realized, on the basis of the law that was finally legislated or effectively legislated as at the date of the report. The Company offsets deferred tax assets and liabilities if there is an enforceable legal right to offset current tax assets and liabilities and they are attributable to the same taxable income and are taxed by the same tax authority for the same assessed company or for different companies that intend to settle current tax assets and liabilities on a net basis or if the tax assets and liabilities are settled concurrently.
A deferred tax asset is recognized in the books when it is expected that in the future there will be taxable income against which the temporary differences can be utilized. Deferred tax assets are examined at each reporting date, and if it is not expected that the related tax benefits will be realized, they are written down.
Deferred taxes that were not recognized are re evaluated at every reporting date and are recognized if the expectation has changed such that it is expected that in the future there will be taxable income against which it will be possible to utilize them.
The Group could become liable for additional taxes in the case of distribution of intercompany dividends between the Group companies. These additional taxes are not included in the financial statements in light of the policy of the Group companies not to cause distribution of a dividend that involves additional taxes to the paying company in the foreseeable future. In cases where an investee company is expected to distribute a dividend involving additional tax, the Company records a reserve for taxes in respect of the said additional tax it is expected to incur due to distribution of the dividend.
Deferred taxes in respect of intra-company transactions in the consolidated financial statements are recorded according to the tax rate applicable to the buying company.
Deferred and current taxes relating to items recognized in shareholders’ equity and/or other comprehensive income are recorded directly in shareholders’ equity or other comprehensive income, respectively.
P. Earnings per share
The Group presents basic and diluted earnings per share data for its ordinary share capital. The basic earnings per share are calculated by dividing the income or loss attributable to the holders of the Company’s ordinary shares by the weighted-average number of ordinary shares outstanding during the year, after adjustment in respect of treasury shares. The diluted earnings per share are determined by adjusting the income or loss attributable to the holders of the Company’s ordinary shares and the weighted-average number of ordinary shares outstanding for the effect of options for shares granted to employees.
Q. Segment Information
An operating segment is a component of the Group that meets the following three conditions:
1. It engages in business activities from which it is expected to earn revenues and incur expenses, including revenues and expenses relating to transactions between the Group companies;
2. Its operating results are reviewed regularly by the Group’s chief operating decision maker in order to make decisions about resources to be allocated to the segment and to assess its performance, and
3. Separate financial information is available in respect thereof.
Inter-segment pricing is determined based on transaction prices in the ordinary course of business.
Segment results, assets and liabilities include items that are directly attributable to the segment and items that can reasonably be attributed to it. Asset and liability items that were not allocated consist primarily of investments, loans and credit, assets of the Company’s headquarters, as well as tax assets and liabilities.
Unallocated items of revenue and expense include financing income and expenses on investments, loans and credit, administrative and general costs attributed to the Company’s headquarters and taxes.
Capital investments of the segment are the total costs that were incurred during the period for purchasing property, plant and equipment and intangible assets.
R. Non-current assets and disposal groups held for sale
Non-current assets (or disposal groups composed of assets and liabilities) are classified as held for sale or distribution if it is highly probable that they will be recovered primarily through a sale transaction or a distribution to the owners and not through continuing use. This applies also to when the Company is obligated to a sale plan that involves losing control over a subsidiary, whether or not the Company will retain any non-controlling interests in the subsidiary after the sale.
Immediately before classification as held for sale or distribution, the assets (or components of the disposal group) are remeasured in accordance with the Group’s accounting policies. Thereafter, the assets (or components of the disposal group) are measured at the lower of their carrying amount and fair value less costs to sell.
Any impairment loss on a disposal group is initially allocated to goodwill, and then to remaining assets and liabilities on pro rata basis, except that no loss is allocated to assets that are not in the scope of the measurement requirements of IFRS 5 such as: inventories, financial assets, deferred tax assets, employee benefit assets, investment property measured at fair value and biological assets, which continue to be measured in accordance with the Group’s accounting policies. Impairment losses recognized on initial classification as held for sale, and subsequent gains or losses on remeasurement, are recognized in profit or loss. Gains are not recognized in excess of any cumulative impairment loss.
In subsequent periods, depreciable assets classified as held for sale or distribution are not depreciated on a periodic basis and investments in associated companies classified as held for sale are not accounted for based on the equity method of accounting.
S. New Standards and Interpretations not yet Adopted
IFRIC Interpretation 21 “Impositions” (hereinafter – “the Interpretation”)
. The Interpretation provides guidelines in connection with the accounting treatment of a liability to pay government impositions that are covered by IAS 37 "Provisions", contingent liabilities and contingent assets, and government impositions that are not covered by IAS 37 since the timing and amount of their repayment are certain. An "imposition" is defined as an outflow of resources imposed on an entity by the government by means of legislation and/or regulation. The Interpretation provides that a liability for payment of an imposition will be recognized only upon occurrence of the event that creates the liability for payment, even in cases where the entity has no practical possibility of avoiding the event.
Application of the Interpretation in 2014 did not have an impact on the Company's financial statements.
T. Indices and exchange rates
Balances in or linked to foreign currency are included in the financial statements at the representative exchange rate on the date of the report. Balances linked to the Consumer Price Index (hereinafter – “the CPI”) are included on the basis of the index relating to each linked asset or liability.
As part of the accounting policies and disclosures, the Group is required to determine the fair value of both financial and non-financial assets and liabilities. The fair values have been determined for measurement and/or disclosure purposes based on the methods described below. Further information about the assumptions made in determining the fair values is disclosed in the notes specific to that asset or liability.
A. Property, plant and equipment
The fair value of property, plant and equipment recognized in a business combination is based on the cost model or on the market value model. According to the cost model, the fair value of the property, plant and equipment is based on the depreciated replacement price of the item measured. The depreciated replacement price takes into account adjustments in respect of physical wear and tear and obsolescence of the property, plant and equipment item. According to the market value model, the fair value is based on the selling price determined in sale transactions of similar assets, while making adjustments to the asset items sold and the asset item acquired in the business combination
B. Intangible assets
The fair value of patents and trademarks acquired in a business combination is based on the discounted estimated royalty payments that would be required to be paid if the patent or trademark was not owned. The fair value of customer relationships acquired in a business combination is determined using the multi-period excess earnings method, whereby the fair value of the asset is estimated after deducting a fair return on all other assets that are part of creating the related cash flows.
The fair value of other intangible assets is based on the discounted cash flows expected to be derived from the use and eventual sale of the assets
C. Inventories
The fair value of inventories acquired in a business combination is determined as follows:
(1) Finished goods inventories – on the basis of the estimated selling price of the products in the ordinary course of business, less the estimated selling costs as well as a reasonable margin in respect of the efforts required for completion and sale of the inventories.
(2) Inventory of work-in-progress – determined on the basis of estimates described in Section 1 above, less costs required for its completion.
(3) Inventory of raw materials – based on replacement value.
D. Investments in securities
The fair value of financial assets classified as available-for-sale and as held-for-trading is determined based on their market price at date of the report. If the an asset or liability measured at fair value has a bid price and an ask price, the price in the range between them that best reflects fair value under the circumstances will be used for measuring fair value.
E. Derivatives
The fair value of forward contracts on foreign currency is determined by averaging the exchange rate and the appropriate interest coefficient for the period of the transaction and the relevant currency index.
The fair value of currency options is determined based on the Black and Scholes model, taking into account the intrinsic value, standard deviation and the interest rates.
The fair value of interest rate swap contracts is determined by discounting the estimated amount of the future cash flows on the basis of the terms and length of period to maturity of each contract, while using market interest rates of similar instruments at the date of measurement.
Future contracts on energy prices are presented on the basis of quotes of the prices of products on an ongoing basis.
The reasonableness of the market price is examined by comparing it to quotations by banks.
For further information regarding the fair value hierarchy – see Note 27 regarding financial instruments.
F. Liabilities in respect of debentures
The fair value of the liabilities and the debentures is determined for disclosure purposes only.
The fair value of marketable debentures is determined based on the stock market prices as at the date of the report. The fair value of the non marketable debentures is calculated based on the present value of future cash flows in respect of the principal and interest components, discounted at the market rate of interest as at the reporting date.
G. Share-based compensation
The fair value of employee share options and of share appreciation rights is measured using the Black and Scholes model or a binomial model, in accordance with the plan (see Note 24). The model’s assumptions include the share price on the measurement date, exercise price of the instrument, expected volatility (based on the weighted average historic volatility), the weighted average expected life of the instruments (based on historical experience and general option holder behavior), expected dividends, and the risk-free interest rate (based on government debentures).
H. Contingent consideration in respect of business combinations
The fair value of contingent consideration is calculated at the time of the business combination using the income approach based on the expected payment amounts and their associated probabilities. When the contingent consideration is long term in nature, the liability is discounted to present value using the market interest rate as at the reporting date.
A. General
1. Information on business segments:
ICL is a multi national enterprise, which operates mainly in the fields of fertilizers and specialty chemicals, in three reporting segments – fertilizers (that includes potash and phosphate), industrial products and performance products. The segments are described below:
ICL Fertilizers –
ICL Fertilizers extracts potash from the Dead Sea and mines and produces potash and salt from subterranean mines in Spain and the UK. ICL Fertilizers processes the potash into its types and markets it throughout the world. This segment also uses part of the potash to produce compound fertilizers.
In addition, ICL Fertilizers mines and processes phosphate rock in open mines in the south of Israel, and produces sulfuric acid in Israel, agricultural phosphoric acid, phosphate fertilizers, compound fertilizers, based mainly on potash and phosphate, liquid fertilizers and soluble fertilizers. ICL Fertilizers also manufactures compound fertilizers in the Netherlands, Germany and Belgium, liquid fertilizers and soluble fertilizers in Spain, slow release fertilizers and controlled release fertilizers in the Netherlands and in the United States, and phosphate based food additives for livestock, in Turkey and in Israel.
ICL Fertilizers markets its products worldwide, mainly in Europe, Brazil, India, China and Israel. The activities of ICL Fertilizers also include the activities of Mifalei Tovala Ltd., which is engaged in the transportation of cargo, mainly of ICL companies in Israel, since a large part of the Company’s activities consists of bulk transport of cargo of the ICL Fertilizers segment.
ICL Industrial Products –
ICL Industrial Products produces bromine out of a solution that is created as a by product of the potash production process in Sodom, Israel, as well as bromine based compounds. ICL Industrial Products uses most of the bromine it produces for self production of bromine compounds at production sites in Israel, the Netherlands and China. In addition, ICL Industrial Products extracts salt, magnesia and chlorine from Dead Sea brine, and produces chlorine based products in Israel and the United States. In addition, ICL Industrial Products engages in the production and marketing of flame retardants and additional phosphorus based products.
ICL Performance Products –
ICL Performance Products cleans some of the agricultural phosphoric acid manufactured by ICL Fertilizers, purchases clean phosphoric acid from other sources and also manufactures thermal phosphoric acid. The clean phosphoric acid and the thermal phosphoric acid are used to manufacture downstream products with high added value, phosphate salts, which are also used as a raw material for manufacturing, food additives, hygiene products and flame retardants and fire extinguishment products. ICL Performance Products also manufactures phosphorous derivatives based on phosphorous acquired from outside sources and manufactures specialty products, based on aluminum acids (hereinafter – “Aluminia”) and other raw materials. The manufacturing of ICL’s performance products is mostly carried out at production sites in Europe, (particularly in Germany), the United States, Brazil, Israel, China, Mexico and other countries.
In addition to the segments described above, ICL has other operations, including production and marketing of pure magnesium as well as magnesium alloys.
2. Segment assets and liabilities
Segment assets include all the operating assets used by the segment and consist principally of cash and cash equivalents, trade and other receivables, inventories, property, plant and equipment and intangible assets, net of allowances and provisions. Most of these assets can be directly attributed to the individual segments. Segment liabilities include all the operating liabilities and consist principally of trade payables and wages, which are scheduled for current payment, and liabilities for employee benefits. Segment capital investments for each of the reporting periods also include property, plant and equipment and intangible assets acquired as part of business combinations.
3. Inter–segment transfers
Segment revenues, segment expenses and segment results include transfers between business segments and between geographical segments. Such transfers are accounted for at arm’s length, representing prices charged to external customers for similar goods. These transfers are eliminated as part of consolidation of the statements.
|
Fertilizers
|
||||||||||||||||||||||||||||||||||||
|
Potash
|
Phosphate
|
Eliminations
|
Total
|
Industrial
products
|
Performance
products
|
Other
activities
|
Eliminations
|
Consolidated
|
||||||||||||||||||||||||||||
|
US$ thousands
|
||||||||||||||||||||||||||||||||||||
|
Year 2014:
|
||||||||||||||||||||||||||||||||||||
|
Sales to external parties
|
1,620,298 | 1,521,683 | — | 3,141,981 | 1,316,829 | 1,533,080 | 118,820 | — | 6,110,710 | |||||||||||||||||||||||||||
|
Inter-segment sales
|
195,997 | 156,533 | (92,949 | ) | 259,581 | 19,962 | 81,091 | 29,611 | (390,245 | ) | — | |||||||||||||||||||||||||
|
Total sales
|
1,816,295 | 1,678,216 | (92,949 | ) | 3,401,562 | 1,336,791 | 1,614,171 | 148,431 | (390,245 | ) | 6,110,710 | |||||||||||||||||||||||||
|
Income from ordinary activities
|
536,491 | 132,938 | 656 | 670,085 | (62,281 | ) | 197,300 | (9,367 | ) | 795,737 | ||||||||||||||||||||||||||
|
Unallocated expenses and intercompany eliminations
|
(38,067 | ) | ||||||||||||||||||||||||||||||||||
|
Operating income
|
757,670 | |||||||||||||||||||||||||||||||||||
|
Financing expenses
|
(278,243 | ) | ||||||||||||||||||||||||||||||||||
|
Financing income
|
122,295 | |||||||||||||||||||||||||||||||||||
|
Share in profits of investee companies accounted for using the equity method of accounting
|
30,532 | |||||||||||||||||||||||||||||||||||
|
Income before taxes on income
|
632,254 | |||||||||||||||||||||||||||||||||||
|
Other Data:
|
||||||||||||||||||||||||||||||||||||
|
Segment assets
|
2,951,352 | 1,669,364 | (68,566 | ) | 4,552,150 | 1,745,235 | 1,351,244 | 88,720 | (160,877 | ) | 7,576,472 | |||||||||||||||||||||||||
|
Unallocated assets
|
771,116 | |||||||||||||||||||||||||||||||||||
|
Consolidated total assets
|
8,347,588 | |||||||||||||||||||||||||||||||||||
|
Segment liabilities
|
566,115 | 484,988 | (44,462 | ) | 1,006,641 | 596,267 | 364,965 | 59,840 | (52,319 | ) | 1,975,394 | |||||||||||||||||||||||||
|
Unallocated liabilities
|
3,371,968 | |||||||||||||||||||||||||||||||||||
|
Consolidated total liabilities
|
5,347,362 | |||||||||||||||||||||||||||||||||||
|
Capital expenditures
|
456,272 | 152,819 | — | 609,091 | 108,235 | 202,956 | 8,226 | — | 928,508 | |||||||||||||||||||||||||||
|
Unallocated capital expenditures
|
29,203 | |||||||||||||||||||||||||||||||||||
|
Total capital expenditures
|
957,711 | |||||||||||||||||||||||||||||||||||
|
Depreciation and amortization
|
103,530 | 121,680 | — | 225,210 | 122,992 | 70,848 | 6,574 | — | 425,624 | |||||||||||||||||||||||||||
|
Unallocated depreciation and amortization
|
1,854 | |||||||||||||||||||||||||||||||||||
|
Total depreciation and amortization
|
427,478 | |||||||||||||||||||||||||||||||||||
Note 5 – Operating Segments (cont'd)
|
Fertilizers
|
||||||||||||||||||||||||||||||||||||
|
Potash
|
Phosphate
|
Eliminations
|
Total
|
Industrial
products
|
Performance
products
|
Other
activities
|
Eliminations
|
Consolidated
|
||||||||||||||||||||||||||||
|
US$ thousands
|
||||||||||||||||||||||||||||||||||||
|
Year 2013:
|
||||||||||||||||||||||||||||||||||||
|
Sales to external parties
|
1,797,360 | 1,584,420 | — | 3,381,780 | 1,277,432 | 1,496,601 | 115,729 | — | 6,271,542 | |||||||||||||||||||||||||||
|
Inter-segment sales
|
229,237 | 169,815 | (125,567 | ) | 273,485 | 19,253 | 78,095 | 38,980 | (409,813 | ) | — | |||||||||||||||||||||||||
|
Total sales
|
2,026,597 | 1,754,235 | (125,567 | ) | 3,655,265 | 1,296,685 | 1,574,696 | 154,709 | (409,813 | ) | 6,271,542 | |||||||||||||||||||||||||
|
Income from ordinary activities
|
740,342 | 79,494 | 1,235 | 821,071 | 114,525 | 195,797 | (16,574 | ) | 1,114,819 | |||||||||||||||||||||||||||
|
Unallocated expenses and intercompany eliminations
|
(13,453 | ) | ||||||||||||||||||||||||||||||||||
|
Operating income
|
1,101,366 | |||||||||||||||||||||||||||||||||||
|
Financing expenses
|
(158,403 | ) | ||||||||||||||||||||||||||||||||||
|
Financing income
|
131,548 | |||||||||||||||||||||||||||||||||||
|
Share in profits of investee companies accounted for using the equity method of accounting
|
25,685 | |||||||||||||||||||||||||||||||||||
|
Income before taxes on income
|
1,100,196 | |||||||||||||||||||||||||||||||||||
|
Other Data:
|
||||||||||||||||||||||||||||||||||||
|
Segment assets
|
2,712,374 | 1,660,265 | (77,795 | ) | 4,294,844 | 1,775,407 | 1,202,911 | 94,665 | (150,455 | ) | 7,217,372 | |||||||||||||||||||||||||
|
Unallocated assets
|
756,113 | |||||||||||||||||||||||||||||||||||
|
Consolidated total assets
|
7,973,485 | |||||||||||||||||||||||||||||||||||
|
Segment liabilities
|
649,312 | 563,078 | (53,035 | ) | 1,159,355 | 424,498 | 352,643 | 69,179 | (48,092 | ) | 1,957,583 | |||||||||||||||||||||||||
|
Unallocated liabilities
|
2,337,228 | |||||||||||||||||||||||||||||||||||
|
Consolidated total liabilities
|
4,294,811 | |||||||||||||||||||||||||||||||||||
|
Capital expenditures
|
551,508 | 141,983 | — | 693,491 | 141,338 | 93,394 | 8,860 | — | 937,083 | |||||||||||||||||||||||||||
|
Unallocated capital expenditures
|
10,180 | |||||||||||||||||||||||||||||||||||
|
Total capital expenditures
|
947,263 | |||||||||||||||||||||||||||||||||||
|
Depreciation and amortization
|
100,533 | 117,895 | — | 218,428 | 75,071 | 46,580 | 6,323 | — | 346,402 | |||||||||||||||||||||||||||
|
Unallocated depreciation and amortization
|
1,339 | |||||||||||||||||||||||||||||||||||
|
Total depreciation and amortization
|
347,741 | |||||||||||||||||||||||||||||||||||
Note 5 – Operating Segments (cont'd)
|
Fertilizers
|
||||||||||||||||||||||||||||||||||||
|
Potash
|
Phosphate
|
Eliminations
|
Total
|
Industrial
products
|
Performance
products
|
Other
activities
|
Eliminations
|
Consolidated
|
||||||||||||||||||||||||||||
|
US$ thousands
|
||||||||||||||||||||||||||||||||||||
|
Year 2012
|
||||||||||||||||||||||||||||||||||||
|
Sales to external parties
|
1,964,741 | 1,568,944 | — | 3,533,685 | 1,401,645 | 1,406,626 | 129,477 | — | 6,471,433 | |||||||||||||||||||||||||||
|
Inter-segment sales
|
233,587 | 158,151 | (119,544 | ) | 272,194 | 15,778 | 65,491 | 49,907 | (403,370 | ) | — | |||||||||||||||||||||||||
|
Total sales
|
2,198,328 | 1,727,095 | (119,544 | ) | 3,805,879 | 1,417,423 | 1,472,117 | 179,384 | (403,370 | ) | 6,471,433 | |||||||||||||||||||||||||
|
Income from ordinary activities
|
996,491 | 162,419 | (88 | ) | 1,158,822 | 217,336 | 179,256 | 630 | 1,556,044 | |||||||||||||||||||||||||||
|
Unallocated expenses and intercompany eliminations
|
(2,412 | ) | ||||||||||||||||||||||||||||||||||
|
Operating income
|
1,553,632 | |||||||||||||||||||||||||||||||||||
|
Financing expenses
|
(81,595 | ) | ||||||||||||||||||||||||||||||||||
|
Financing income
|
20,701 | |||||||||||||||||||||||||||||||||||
|
Share in profits of investee companies accounted for using the equity method of accounting
|
26,555 | |||||||||||||||||||||||||||||||||||
|
Income before taxes on income
|
1,519,293 | |||||||||||||||||||||||||||||||||||
|
Other Data:
|
||||||||||||||||||||||||||||||||||||
|
Segment assets
|
2,230,177 | 1,690,603 | (86,841 | ) | 3,833,939 | 1,705,510 | 1,153,942 | 90,142 | (64,908 | ) | 6,718,625 | |||||||||||||||||||||||||
|
Unallocated assets
|
626,286 | |||||||||||||||||||||||||||||||||||
|
Consolidated total assets
|
7,344,911 | |||||||||||||||||||||||||||||||||||
|
Segment liabilities
|
640,407 | 522,327 | (60,846 | ) | 1,101,888 | 473,342 | 338,564 | 82,383 | (68,467 | ) | 1,927,710 | |||||||||||||||||||||||||
|
Unallocated liabilities
|
2,028,937 | |||||||||||||||||||||||||||||||||||
|
Consolidated total liabilities
|
3,956,647 | |||||||||||||||||||||||||||||||||||
|
Capital expenditures
|
428,474 | 151,235 | — | 579,709 | 138,488 | 47,727 | 7,798 | — | 773,722 | |||||||||||||||||||||||||||
|
Unallocated capital expenditures
|
5,894 | |||||||||||||||||||||||||||||||||||
|
Total capital expenditures
|
779, 616 | |||||||||||||||||||||||||||||||||||
|
Depreciation and amortization
|
110,217 | 101,393 | — | 211,610 | 61,998 | 42,451 | 5,614 | — | 321,673 | |||||||||||||||||||||||||||
|
Unallocated depreciation and amortization
|
838 | |||||||||||||||||||||||||||||||||||
|
Total depreciation and amortization
|
322,511 | |||||||||||||||||||||||||||||||||||
C. Information on geographical segments:
Following is data regarding the distribution of the Group’s sales by geographical location of the customers:
|
For the year ended December 31
|
||||||||||||
|
2014
|
2013
|
2012
|
||||||||||
|
US$ thousands
|
||||||||||||
|
Europe
|
2,388,990 | 2,378,397 | 2,331,808 | |||||||||
|
Asia
|
1,299,419 | 1,463,622 | 1,615,202 | |||||||||
|
North America
|
1,374,185 | 1,207,221 | 1,252,269 | |||||||||
|
South America
|
568,752 | 747,589 | 815,181 | |||||||||
|
Others
|
195,403 | 155,753 | 132,203 | |||||||||
| 5,826,749 | 5,952,582 | 6,146,663 | ||||||||||
|
In Israel
|
283,961 | 318,960 | 324,770 | |||||||||
| 6,110,710 | 6,271,542 | 6,471,433 | ||||||||||
Following is data regarding the distribution of the Group's sales by geographical location of the assets:
|
For the year ended December 31
|
||||||||||||
|
2014
|
2013
|
2012
|
||||||||||
|
US$ thousands
|
||||||||||||
|
Israel
|
2,958,266 | 3,095,136 | 3,438,575 | |||||||||
|
Europe
|
2,692,359 | 2,715,573 | 2,601,443 | |||||||||
|
United States
|
1,107,397 | 1,099,152 | 1,115,106 | |||||||||
|
Others
|
405,360 | 382,159 | 402,792 | |||||||||
| 7,163,382 | 7,292,020 | 7,557,916 | ||||||||||
|
Intercompany transactions - mainly from Israel
|
(1,052,672 | ) | (1,020,478 | ) | (1,086,483 | ) | ||||||
| 6,110,710 | 6,271,542 | 6,471,433 | ||||||||||
Following is data regarding the operating income by geographical location of the assets from which the income was produced:
|
For the year ended December 31
|
||||||||||||
|
2014
|
2013
|
2012
|
||||||||||
|
US$ thousands
|
||||||||||||
|
Israel
|
527,756 | 711,222 | 1,092,348 | |||||||||
|
Europe
|
129,824 | 299,127 | 282,486 | |||||||||
|
United States
|
71,459 | 115,764 | 134,825 | |||||||||
|
Others
|
68,035 | 35,167 | 37,871 | |||||||||
|
Eliminations
|
(39,404 | ) | (59,914 | ) | 6,102 | |||||||
|
Total
|
757,670 | 1,101,366 | 1,553,632 | |||||||||
Following is data reflecting the carrying value of allocated segmental assets and allocated segmental additions to property, plant and equipment and intangible assets by the geographical location of the assets:
|
Carrying value of assets as at December 31
|
Additions to property, plant and equipment, and intangible assets for the year ended December 31
|
|||||||||||||||||||||||
|
2014
|
2013
|
2012
|
2014
|
2013
|
2012
|
|||||||||||||||||||
|
US$ thousands
|
||||||||||||||||||||||||
|
Israel
|
4,482,262 | 4,159,207 | 3,738,589 | 543,206 | 671,087 | 553,979 | ||||||||||||||||||
|
Europe
|
2,188,301 | 2,240,248 | 2,064,569 | 248,972 | 236,086 | 176,176 | ||||||||||||||||||
|
United States
|
931,193 | 921,961 | 971,141 | 22,054 | 20,160 | 31,813 | ||||||||||||||||||
|
Others
|
455,362 | 309,134 | 315,332 | *114,276 | 9,750 | 11,754 | ||||||||||||||||||
|
Eliminations
|
(480,646 | ) | (413,178 | ) | (371,006 | ) | — | — | — | |||||||||||||||
|
Total
|
7,576,472 | 7,217,372 | 6,718,625 | 928,508 | 937,083 | 773,722 | ||||||||||||||||||
*In 2014, mainly as a result of acquisition of the entire holdings in Fosbrasil. For additional details – see Note 11B.
Following is data depreciation and amortization by geographical areas:
|
Year ended December 31
|
||||||||||||
|
2014
|
2013
|
2012
|
||||||||||
|
US$ thousands
|
||||||||||||
|
Israel
|
197,842 | 172,112 | 158,394 | |||||||||
|
Europe
|
128,652 | 117,225 | 116,778 | |||||||||
|
United States
|
74,267 | 45,217 | 34,545 | |||||||||
|
Others
|
26,717 | 13,187 | 12,794 | |||||||||
|
Total
|
427,478 | 347,741 | 322,511 | |||||||||
|
As at December 31
|
||||||||
|
2014
|
2013
|
|||||||
|
US$ thousands
|
||||||||
|
Trading securities
|
45,210 | 36,140 | ||||||
|
Deposits in banks and financial institutions and short-term loans
|
70,254 | 58,954 | ||||||
|
Current maturities of long-term deposits
|
1,028 | 1,294 | ||||||
| 116,492 | 96,388 | |||||||
|
As at December 31
|
||||||||
|
2014
|
2013
|
|||||||
|
US$ thousands
|
||||||||
|
Trade – open accounts:
|
|
|||||||
|
Non- Israeli
|
985,666 | 997,490 | ||||||
|
Israeli
|
61,752 | 70,318 | ||||||
| 1,047,418 | 1,067,808 | |||||||
|
Less – allowance for doubtful debts
|
8,272 | 10,780 | ||||||
| 1,039,146 | 1,057,028 | |||||||
|
As at December 31
|
||||||||
|
2014
|
2013
|
|||||||
| US$ thousands | ||||||||
|
Israeli government institutions
|
28,532 | 17,028 | ||||||
|
Non-Israeli government institutions
|
35,030 | 31,145 | ||||||
|
Prepaid expenses
|
24,243 | 26,193 | ||||||
|
Advances to suppliers
|
4,696 | 7,828 | ||||||
|
Derivatives
|
14,595 | 62,235 | ||||||
|
Other
|
47,688 | 41,888 | ||||||
| 154,784 | 186,317 | |||||||
|
As at December 31
|
||||||||
|
2014
|
2013
|
|||||||
|
US$ thousands
|
||||||||
|
Finished products
|
846,851 | 887,377 | ||||||
|
Work in progress
|
202,020 | 248,303 | ||||||
|
Raw materials and supplies
|
217,429 | 214,225 | ||||||
|
Spare parts and maintenance supplies
|
125,833 | 120,644 | ||||||
| 1,392,133 | 1,470,549 | |||||||
|
Less – non-current inventories (presented in non-current assets)
|
57,035 | 62,252 | ||||||
| 1,335,098 | 1,408,297 | |||||||
A. Movement during the year in investments in equity-accounted investees
|
US$ thousands
|
||||
|
Balance as at January 1, 2014
|
174,511 | |||
|
Changes during the year:
|
||||
|
Share in earnings
|
30,532 | |||
|
Dividends received
|
(16,640 | ) | ||
|
Increase in investment
|
22,614 | |||
|
Increase in rate of holdings in associated company – initial consolidation
|
(15,168 | ) | ||
|
Cumulative translation adjustments
|
(6,901 | ) | ||
|
Reclassification to assets held for sale
|
(4,399 | ) | ||
|
Balance as at December 31, 2014
|
184,549 | |||
B. Condensed data with respect to equity-accounted investees
Set forth below is condensed financial data with respect to equity-accounted investees which are individually insignificant without adjustments for the ownership rates held by the Group.
|
As at December 31, 2014
|
||||||||||||||||||||||||||||||||||||
|
US$ thousands
|
||||||||||||||||||||||||||||||||||||
|
Current
assets
|
Non-current
assets
|
Total
assets
|
Current
liabilities
|
Non-current
liabilities
|
Total
liabilities
|
Revenues
|
Expenses
|
Profit
|
||||||||||||||||||||||||||||
|
Joint arrangements
|
357,011 | 711,268 | 1,068,279 | 208,045 | 411,766 | 619,811 | 513,008 | 455,939 | 57,069 | |||||||||||||||||||||||||||
|
As at December 31, 2013
|
||||||||||||||||||||||||||||||||||||
|
US$ thousands
|
||||||||||||||||||||||||||||||||||||
|
Current
assets
|
Non-current
assets
|
Total
assets
|
Current
liabilities
|
Non-current
liabilities
|
Total
liabilities
|
Revenues
|
Expenses
|
Profit
|
||||||||||||||||||||||||||||
|
Joint arrangements
|
400,734 | 662,469 | 1,063,203 | 318,837 | 394,546 | 713,383 | 474,311 | 419,161 | 55,150 | |||||||||||||||||||||||||||
A. Assets held for sale
(1) Pursuant to the Company’s strategy, various alternatives are being considered in connection with the continued inclusion of non core businesses. Accordingly, during the fourth quarter of 2014, the Company signed agreements for the sale of APW (Alumunia, Paper, Water), the Rhenoflex business, which manufactures parts for reinforcing leather shoes, the Anti-Germ business and Medentech. Subsequent to the date of the report, in January 2015 sale of the APW sale was closed (except for a number of insignificant units located in China) and in February 2015 the sales of the Rhenoflex, Anti-Germ and Medentech businesses were closed. Further to that stated above, the Company reclassified the above mentioned business units as “assets held for sale” as at December 31, 2014. As a result of re measurement of the Anti Germ business and Medentech based on the lower of their carrying amounts and their fair value less costs to sell, in the fourth quarter of 2014, the Company recognized an impairment loss of about $31 million, which was recorded in the “other expense” category in the statement of income. In the first quarter of 2015, the Company is expected to record a net gain of approximately $145 million, as a result of the conclusion of sales of the APW and Rhenoflex businesses.
(2) Assets and liabilities of disposal groups classified as held for sale
Assets of disposal groups classified as held for sale
|
2014
|
||||
|
US$ thousands
|
||||
|
Cash and cash equivalents
|
7,602 | |||
|
Short-term investments and deposits
|
1,235 | |||
|
Trade receivables
|
15,692 | |||
|
Derivatives and other receivables
|
6,040 | |||
|
Current tax assets
|
97 | |||
|
Inventories
|
66,904 | |||
|
Investments in equity-accounted investees
|
4,399 | |||
|
Long-term deposits and receivables
|
1,301 | |||
|
Non-current inventories
|
409 | |||
|
Deferred tax assets
|
1,894 | |||
|
Property, plant and equipment
|
38,473 | |||
|
Intangible assets
|
80,549 | |||
| 224,595 | ||||
Liabilities of disposal groups classified as held for sale
|
2014
|
||||
|
US$ thousands
|
||||
|
Trade payables
|
8,784 | |||
|
Provisions
|
48 | |||
|
Derivatives and other payables
|
18,244 | |||
|
Current tax liabilities
|
1,032 | |||
|
Long-term debt
|
25 | |||
|
Deferred taxes
|
5,063 | |||
|
Employee benefits
|
17,506 | |||
| 50,702 | ||||
(3) Income and expenses recognized in other comprehensive income
The Group has income in the amount of about $8 million that was recognized directly in other comprehensive income and that relates to non-current assets and disposal groups held for sale
Fair value measurement of disposal group is classified as level 1 fair value hierarchy.
B. Business Acquisitions
A
. In February 2014, ICL signed a strategic agreement with Allana Potash, a company traded on the Toronto stock exchange in connection with development of a potash mine in Ethiopia. Pursuant to the agreement, ICL acquired units of Allana (including shares and options), at a rate of 16% of Allana’s capital. ICL has an option to increase its holdings to about 37%. The investment is accounted for in the financial statements in accordance with the equity method of accounting.
B
. In August 2014, an agreement was signed with Albermarle and its related companies to establish a joint venture to manufacture FR122P. According to this agreement, if certain conditions precedent are fulfilled, including approval of the anti-trust authorities in several countries around the world, a joint venture will be established for the joint production of FR122P, under which joint companies will be established in Israel and in the Netherlands, to be owned, directly and indirectly, in equal shares, by companies of our Group on the one hand, and by Albermarle, on the other. As part of the joint venture, 50% of the production facilities of this product in the Netherlands and in Israel will be owned by Albermarle, and each of the members of our Group and Albermarle will conduct independent and completely separate marketing activities.
C.
In December 2014, the Company completed acquisition of 100% of Fosbrasil (increase from a rate of holdings of 44.25% to 100%), the leading manufacturer in Latin America of purified phosphoric acid for the food market and specialty fertilizers, and a producer of phosphate based downstream products and specialty fertilizers. As a result of the increase in the rate of holdings, and achievement of control over Fosbrasil, the Company recognized income, in the amount of about $36 million, which was recorded in the “other income” category.
D.
In December 2014, ICL signed a strategic partnership agreement with Yunnan Yuntianhua, China’s second largest chemicals manufacturer and the third largest phosphate producer in the world for operation of a 50/50 joint venture company, controlled by ICL, of a fully backward integrated phosphate business with a world-scale phosphate rock mine and downstream operations. The total deal value is estimated at about $452 million. For purposes of strengthening the strategic partnership between ICL and Yunnan Yuntianhua, and to create added value for their shareholders, about $269 million out of ICL's investment will be used to acquire a strategic holding in Yunnan Yuntianhua, China's leading producer of phosphate rock and fertilizers, which is traded on the Shanghai stock exchange. The new shares to be issued will constitute 15% of the share capital of Yunnan Yuntianhua (after the issuance to ICL). The balance of the deal value, in the amount of about $183 million, is in a joint venture for production of phosphate (together with a net debt of $100 million – ICL's share). Completion of the transaction is expected to take place in the first quarter of 2016, subject to various government and regulatory approvals.
E.
Subsequent to the date of the report, in January 2015, the Company signed an agreement for the acquisition of Prolactal, a leading European company engaged in the production of milk proteins for the food and beverage industry. On March 13, 2015, the transaction was closed.
A. Composition
|
As at December 31
|
||||||||
|
2014
|
2013
|
|||||||
|
US$ thousands
|
||||||||
|
Bank deposits and other
|
3,323 | 4,634 | ||||||
|
Less – current maturities
|
1,028 | 1,294 | ||||||
| 2,295 | 3,340 | |||||||
|
Other receivables
|
9,371 | 12,428 | ||||||
| 11,666 | 15,768 | |||||||
B. Long-term deposits and receivables classified by currency and interest rates
|
Weighted average interest rate
|
||||||||||||
|
As at December 31
|
||||||||||||
|
2014
|
2014
|
2013
|
||||||||||
|
%
|
US$ thousands
|
|||||||||||
|
In Israeli currency
|
3.0 | 2,986 | 4,247 | |||||||||
|
Other
|
0.1 | 337 | 387 | |||||||||
| 3,323 | 4,634 | |||||||||||
C. The deposits and receivables (net of current maturities) mature in the following years after each reporting date as follows:
|
As at December 31
|
||||||||
|
2014
|
2013
|
|||||||
|
Second year
|
924 | 1,162 | ||||||
|
Third year
|
766 | 935 | ||||||
|
Fourth year
|
263 | 735 | ||||||
|
Fifth year
|
83 | 188 | ||||||
|
Sixth year and thereafter
|
259 | 320 | ||||||
| 2,295 | 3,340 | |||||||
|
Land, land
development,
roads and
buildings
|
Installations,
machinery
and
equipments
|
Dikes and
evaporating
ponds
|
Heavy
mechanical
equipment,
railroad
cars and
tanks
|
Furniture,
office
equipment,
vehicles,
computer
equipment
and other
|
Plants under
construction
(2)
|
Spare parts
for
installations
|
Total
|
|||||||||||||||||||||||||
|
US$ thousands
|
||||||||||||||||||||||||||||||||
|
Cost (1)
|
||||||||||||||||||||||||||||||||
|
Balance as at January 1, 2014
|
741,102 | 4,842,320 | 1,429,096 | 163,983 | 251,746 | 660,114 | 7,603 | 8,095,964 | ||||||||||||||||||||||||
|
Additions
|
22,984 | 271,328 | 128,115 | 8,377 | 11,399 | 268,501 | 362 | 711,066 | ||||||||||||||||||||||||
|
Additions in respect of business combinations
|
22,268 | 7,702 | — | — | 6,508 | 617 | — | 37,095 | ||||||||||||||||||||||||
|
Disposals
|
(6,039 | ) | (39,494 | ) | — | (14,438 | ) | (7,696 | ) | (716 | ) | — | (68,383 | ) | ||||||||||||||||||
|
Translation differences
|
(41,519 | ) | (111,904 | ) | (29,098 | ) | (901 | ) | (9,515 | ) | (26,197 | ) | — | (219,134 | ) | |||||||||||||||||
|
Reclassification to assets held for sale
|
(23,663 | ) | (55,549 | ) | — | — | (12,142 | ) | (7,584 | ) | — | (98,938 | ) | |||||||||||||||||||
|
Balance as at December 31, 2014
|
715,133 | 4,914,403 | 1,528,113 | 157,021 | 240,300 | 894,735 | 7,965 | 8,457,670 | ||||||||||||||||||||||||
|
Accumulated depreciation (1)
|
||||||||||||||||||||||||||||||||
|
Balance as at January 1, 2014
|
367,032 | 3,025,067 | 738,370 | 88,962 | 190,293 | — | — | 4,409,724 | ||||||||||||||||||||||||
|
Additions
|
19,506 | 193,227 | 75,099 | 8,558 | 16,084 | — | — | 312,474 | ||||||||||||||||||||||||
|
Disposals
|
(5,764 | ) | (37,448 | ) | — | (13,400 | ) | (6,541 | ) | — | — | (63,153 | ) | |||||||||||||||||||
|
Impairment
|
20,380 | 34,220 | — | — | 3,662 | — | — | 58,262 | ||||||||||||||||||||||||
|
Translation differences
|
(18,563 | ) | (77,932 | ) | (22,451 | ) | (741 | ) | (6,358 | ) | — | — | (126,045 | ) | ||||||||||||||||||
|
Reclassification to assets held for sale
|
(17,770 | ) | (33,113 | ) | — | — | (9,582 | ) | — | — | (60,465 | ) | ||||||||||||||||||||
|
Balance as at December 31, 2014
|
364,821 | 3,104,021 | 791,018 | 83,379 | 187,558 | — | — | 4,530,797 | ||||||||||||||||||||||||
|
Depreciated balance as at December 31, 2014
|
350,312 | 1,810,382 | 737,095 | 73,642 | 52,742 | 894,735 | 7,965 | 3,926,873 | ||||||||||||||||||||||||
|
Land, land
development,
roads and
buildings
|
Installations,
machinery
and
equipments
|
Dikes and
evaporating
ponds
|
Heavy
mechanical
equipment,
railroad
cars and
tanks
|
Furniture,
office
equipment,
vehicles,
computer
equipment
and other
|
Plants under
construction
(2)
|
Spare parts
for
installations
|
Total
|
|||||||||||||||||||||||||
|
US$ thousands
|
||||||||||||||||||||||||||||||||
|
Cost (1)
|
||||||||||||||||||||||||||||||||
|
Balance as at January 1, 2013
|
669,934 | 4,534,314 | 1,176,122 | 161,571 | 232,740 | 452,572 | 7,778 | 7,235,031 | ||||||||||||||||||||||||
|
Additions
|
59,646 | 335,576 | 242,767 | 10,765 | 15,912 | 200,235 | — | 864,901 | ||||||||||||||||||||||||
|
Additions in respect of business combinations
|
351 | 3,038 | — | 3,284 | 2,254 | 4 | — | 8,931 | ||||||||||||||||||||||||
|
Disposals
|
(7,237 | ) | (67,552 | ) | — | (11,871 | ) | (3,047 | ) | — | (175 | ) | (89,882 | ) | ||||||||||||||||||
|
Translation differences
|
18,408 | 36,944 | 10,207 | 234 | 3,887 | 7,303 | — | 76,983 | ||||||||||||||||||||||||
|
Balance as at December 31, 2013
|
741,102 | 4,842,320 | 1,429,096 | 163,983 | 251,746 | 660,114 | 7,603 | 8,095,964 | ||||||||||||||||||||||||
|
Accumulated depreciation (1)
|
||||||||||||||||||||||||||||||||
|
Balance as at January 1, 2013
|
342,158 | 2,866,356 | 663,898 | 90,849 | 174,385 | — | — | 4,137,646 | ||||||||||||||||||||||||
|
Additions
|
18,629 | 190,039 | 66,881 | 7,949 | 15,494 | — | — | 298,992 | ||||||||||||||||||||||||
|
Disposals
|
(5,636 | ) | (66,117 | ) | — | (10,169 | ) | (2,194 | ) | — | — | (84,116 | ) | |||||||||||||||||||
|
Impairment
|
— | 10,000 | — | — | — | — | — | 10,000 | ||||||||||||||||||||||||
|
Translation differences
|
11,881 | 24,789 | 7,591 | 333 | 2,608 | — | — | 47,202 | ||||||||||||||||||||||||
|
Balance as at December 31, 2013
|
367,032 | 3,025,067 | 738,370 | 88,962 | 190,293 | — | — | 4,409,724 | ||||||||||||||||||||||||
|
Depreciated balance as at December 31, 2013
|
374,070 | 1,817,253 | 690,726 | 75,021 | 61,453 | 660,114 | 7,603 | 3,686,240 | ||||||||||||||||||||||||
Property, plant and equipment includes assets that have been fully depreciated and which are still in use. The original cost of those assets as of December 31, 2014 is approximately $2,553 million (as of December 31, 2013 $2,484 million).
Plants under construction – the changes represent additions during the year, net of transfers to property, plant and equipment.
A. Composition
|
Intangible assets acquired
|
Intangible assets internally developed
|
Computer
application
|
Others
|
Total
|
||||||||||||||||||||||||||||||||||||||||
|
Goodwill
|
Concessions
and mining
rights (1)
|
Trademarks
|
Technology
/ patents
|
Customer
relationships
|
Exploration
and
evaluation
assets
|
Technology
/ patents
|
Development
costs
|
|||||||||||||||||||||||||||||||||||||
|
US$ thousands
|
||||||||||||||||||||||||||||||||||||||||||||
|
Cost
|
||||||||||||||||||||||||||||||||||||||||||||
|
Balance as at January 1, 2014
|
290,840 | 161,596 | 112,046 | 71,986 | 260,884 | 23,778 | 437 | 7,281 | 78,722 | 65,135 | 1,072,705 | |||||||||||||||||||||||||||||||||
|
Additions
|
— | — | — | — | — | 3,233 | — | — | 77,107 | 2,774 | 83,114 | |||||||||||||||||||||||||||||||||
|
Additions in respect of business combinations
|
103,639 | — | 2,231 | 4,971 | 11,836 | — | — | — | 513 | 4,295 | 127,485 | |||||||||||||||||||||||||||||||||
|
Translation differences
|
(24,718 | ) | (7,463 | ) | (11,035 | ) | (2,521 | ) | (21,494 | ) | (1,652 | ) | (49 | ) | (544 | ) | (689 | ) | (5,525 | ) | (75,690 | ) | ||||||||||||||||||||||
|
Reclassification to assets held for sale
|
(42,761 | ) | — | (14,322 | ) | (4,364 | ) | (55,529 | ) | — | (152 | ) | — | (681 | ) | (3,044 | ) | (120,853 | ) | |||||||||||||||||||||||||
|
Balance as at December 31, 2014
|
327,000 | 154,133 | 88,920 | 70,072 | 195,697 | 25,359 | 236 | 6,737 | 154,972 | 63,635 | 1,086,761 | |||||||||||||||||||||||||||||||||
|
Amortization and impairment losses
|
||||||||||||||||||||||||||||||||||||||||||||
|
Balance as at January 1, 2014
|
23,590 | 45,094 | 18,665 | 25,409 | 69,571 | 5,289 | 281 | 6,102 | 53,678 | 33,852 | 281,531 | |||||||||||||||||||||||||||||||||
|
Amortization for the year
|
— | 3,297 | 4,233 | 4,809 | 14,692 | 1,311 | 17 | 181 | 5,670 | 3,755 | 37,965 | |||||||||||||||||||||||||||||||||
|
Translation differences
|
(2,112 | ) | (173 | ) | (2,619 | ) | (1,610 | ) | (4,872 | ) | (244 | ) | (17 | ) | (517 | ) | (1,563 | ) | (521 | ) | (14,248 | ) | ||||||||||||||||||||||
|
Impairment
|
12,445 | — | 1,365 | 836 | 3,506 | — | — | — | 745 | — | 18,897 | |||||||||||||||||||||||||||||||||
|
Reclassification to assets held for sale
|
(9,466 | ) | — | (7,874 | ) | (2,636 | ) | (16,663 | ) | — | (304 | ) | — | (518 | ) | (2,843 | ) | (40,304 | ) | |||||||||||||||||||||||||
|
Balance as at December 31, 2014
|
24,457 | 48,218 | 13,770 | 26,808 | 66,234 | 6,356 | (23 | ) | 5,766 | 58,012 | 34,243 | 283,841 | ||||||||||||||||||||||||||||||||
|
Amortized Balance as at December 31, 2014
|
302,543 | 105,915 | 75,150 | 43,264 | 129,463 | 19,003 | 259 | 971 | 96,960 | 29,392 | 802,920 | |||||||||||||||||||||||||||||||||
Note 14 – Intangible Assets (cont'd)
|
Intangible assets acquired
|
Intangible assets internally developed
|
Computer
application
|
Others
|
Total
|
||||||||||||||||||||||||||||||||||||||||
|
Goodwill
|
Concessions
and mining
rights (1)
|
Trademarks
|
Technology
/ patents
|
Customer
relationships
|
Exploration
and
evaluation
assets
|
Technology
/ patents
|
Development
costs
|
|||||||||||||||||||||||||||||||||||||
|
US$ thousands
|
||||||||||||||||||||||||||||||||||||||||||||
|
Cost
|
||||||||||||||||||||||||||||||||||||||||||||
|
Balance as at January 1, 2013
|
281,005 | 158,398 | 110,590 | 68,190 | 205,008 | 21,121 | 368 | 7,016 | 61,485 | 62,692 | 975,873 | |||||||||||||||||||||||||||||||||
|
Additions
|
— | 469 | 91 | 353 | — | 2,105 | 62 | — | 17,097 | 1,916 | 22,093 | |||||||||||||||||||||||||||||||||
|
Additions in respect of business combinations
|
2,907 | — | 182 | — | 48,481 | — | — | — | 19 | 234 | 51,823 | |||||||||||||||||||||||||||||||||
|
Disposals
|
— | — | — | — | — | — | — | — | — | — | — | |||||||||||||||||||||||||||||||||
|
Translation differences
|
6,928 | 2,729 | 1,183 | 3,443 | 7,395 | 552 | 7 | 265 | 121 | 293 | 22,916 | |||||||||||||||||||||||||||||||||
|
Balance as at December 31, 2013
|
290,840 | 161,596 | 112,046 | 71,986 | 260,884 | 23,778 | 437 | 7,281 | 78,722 | 65,135 | 1,072,705 | |||||||||||||||||||||||||||||||||
|
Amortization and impairment losses
|
||||||||||||||||||||||||||||||||||||||||||||
|
Balance as at January 1, 2013
|
22,853 | 41,780 | 14,474 | 20,181 | 53,690 | 4,132 | 258 | 5,698 | 48,170 | 29,828 | 241,064 | |||||||||||||||||||||||||||||||||
|
Amortization for the year
|
— | 3,250 | 4,837 | 4,390 | 14,826 | 1,091 | 16 | 175 | 5,080 | 3,879 | 37,544 | |||||||||||||||||||||||||||||||||
|
Translation differences
|
737 | 64 | (646 | ) | 838 | 1,055 | 66 | 7 | 229 | 428 | 145 | 2,923 | ||||||||||||||||||||||||||||||||
|
Balance as at December 31, 2013
|
23,590 | 45,094 | 18,665 | 25,409 | 69,571 | 5,289 | 281 | 6,102 | 53,678 | 33,852 | 281,531 | |||||||||||||||||||||||||||||||||
|
Amortized Balance as at December 31, 2013
|
267,250 | 116,502 | 93,381 | 46,577 | 191,313 | 18,489 | 156 | 1,179 | 25,044 | 31,283 | 791,174 | |||||||||||||||||||||||||||||||||
|
(1)
|
As at December 31, 2014, subsidiary in Spain has mining rights intended for future development of new mines for quarrying potash, in the amount of about $54 million. Part of these rights are effective up to 2037 while the balance is effective up to 2067. Development of the new mines has not yet commenced and, accordingly, amortization of the mining rights has not yet commenced.
|
B. Total book value of intangible assets having defined useful lives and those having indefinite useful lives are as follows:
|
As at December 31
|
||||||||
|
2014
|
2013
|
|||||||
|
US$ thousands
|
||||||||
|
Intangible assets having a defined useful life
|
465,719 | 488,140 | ||||||
|
Intangible assets having an indefinite useful life
|
337,201 | 303,034 | ||||||
| 802,920 | 791,174 | |||||||
A. Impairment testing for cash generating units containing goodwill and intangible assets with an indefinite useful life
For the purpose of impairment testing, goodwill and intangible assets with an indefinite useful life are allocated to the cash-generating units which represent the lowest level within the Group at which the goodwill is monitored for internal management purposes.
The aggregate carrying amounts of goodwill and intangible assets with an indefinite useful life allocated to each unit are as follows:
|
As at December 31
|
||||||||
|
2014
|
2013
|
|||||||
|
US$ thousands
|
||||||||
|
Goodwill
|
||||||||
|
Potash, Spain
|
3,906 | 4,425 | ||||||
|
Specialty Fertilizers
|
67,709 | 64,383 | ||||||
|
Industrial Products, Europe
|
31,675 | 40,159 | ||||||
|
Industrial Products, United States
|
56,826 | 56,826 | ||||||
|
Performance Products, United States
|
11,333 | 11,489 | ||||||
|
Fertilizers, Israel
|
22,484 | 23,707 | ||||||
|
Industrial Products, Israel
|
3,992 | 3,708 | ||||||
|
Performance Products, Europe
|
6,386 | 51,017 | ||||||
|
Performance Products, South America
|
98,232 | 11,536 | ||||||
| 302,543 | 267,250 | |||||||
|
Trademarks
|
||||||||
|
Industrial Products, United States
|
13,000 | 13,000 | ||||||
|
Industrial Products, Europe
|
7,787 | 8,913 | ||||||
|
Performance Products, United States
|
13,871 | 13,871 | ||||||
| 34,658 | 35,784 | |||||||
| 337,201 | 303,034 | |||||||
Value in use was determined by discounting the future cash flows generated from the continuing operation of the cash-generating unit and was based on the following key assumptions:
|
Discount
rate
|
Average
annual
growth rate
(1-5 years)
|
Long-term
growth rate
|
Period of
projected
cash flows
|
|||||||||||
|
Industrial Products, United States
|
9.2 | % | 5.3 | % | 2.0 | % |
5 years
|
|||||||
|
Industrial Products, Europe
|
9.0 | % | 7.0 | % | 2.0 | % |
5 years
|
|||||||
|
Performance Products, United States
|
9.0 | % | 3.5 | % | 2.0 | % |
5 years
|
|||||||
|
Performance Products, Europe
|
9.2 | % | 6.2 | % | 1.5 | % |
5 years
|
|||||||
|
Performance Products, South America
|
9.0 | % | 4.1 | % | 1.0 | % |
5 years
|
|||||||
|
Potash, Spain
|
9.5 | % | 0.6 | % | 0.0 | % |
5 years
|
|||||||
|
Specialty Fertilizers
|
9.0 | % | 2.5 | % | 2.0 | % |
5 years
|
|||||||
F-44
The recoverable value of the above mentioned units is based on their value in use. The value in use of the units examined has been determined by an internal valuation made by the Company. It has been determined in all cases that the stated value of the units in the financial statements is lower than their recoverable value, and accordingly no impairment loss has been recognized in respect of such units.
In the period of the report, the Company examined the recoverable value of its assets in the Industrial Products segment in the United States, in view of the decline in the selling prices of the Company's products as a result of its competitors' strategy to increase their market share, and in view of the cancellation of the anti-dumping tax on Japanese chlorine-based biocide manufacturers in the fourth quarter of 2014. The examination included a comparison of the discounted value of the anticipated cash flows in the remaining lifetime of the Company's facilities, using a five-year projected cash flow, where the fifth year was selected as the representative year for the remainder of the lifetime of the plant, property, and equipment, and the value of the assets in the Company's books. The discounted value of the anticipated cash flows were calculated according to an annual after-tax discount rate of 9.2%, and based on the Company's estimates for future sales prices. In these terms, the recoverable value of the subsidiary's assets is lower than their book value, and the Company accordingly included a provision for impairment in the amount of approximately $40 million, recorded in "other expenses".
The estimates and assumptions represent Management’s assessment of future trends in the industry and are based on both external sources and internal sources.
In addition, as a result of the reclassification of assets held for sale, in 2014 the Company recognized an impairment loss, in the amount of about $31 million, stemming from re measurement of some of the disposal groups (see Note 11) based on the lower of their carrying value in the books and their fair values in business units and companies from the Industrial Products' segment and from the Performance Products' segment in Europe.
|
As at December 31, 2014
|
As at December 31, 2013
|
|||||||||||||||
|
Assets
|
Liabilities
|
Assets
|
Liabilities
|
|||||||||||||
|
US$ thousands
|
||||||||||||||||
|
Included in current assets and liabilities:
|
||||||||||||||||
|
Foreign currency and derivative instruments
|
13,553 | (63,062 | ) | 55,293 | (10,016 | ) | ||||||||||
|
Interest derivative instruments
|
1,042 | (250 | ) | 858 | (1,765 | ) | ||||||||||
|
Derivative instruments on energy and marine transport
|
— | (27,091 | ) | 6,084 | — | |||||||||||
| 14,595 | (90,403 | ) | 62,235 | (11,781 | ) | |||||||||||
|
Included in non-current assets and liabilities:
|
||||||||||||||||
|
Foreign currency and derivative instruments
|
— | (8,861 | ) | 3,419 | — | |||||||||||
|
Interest derivative instruments
|
— | (9,299 | ) | 3,072 | (6,582 | ) | ||||||||||
|
Derivative instruments on energy and marine transport
|
— | (1,161 | ) | 1,128 | — | |||||||||||
| — | (19,321 | ) | 7,619 | (6,582 | ) | |||||||||||
A. Composition
|
As at December 31
|
||||||||
|
2014
|
2013
|
|||||||
|
US$ thousands
|
||||||||
|
Current liabilities
|
||||||||
|
Short-term credit:
|
||||||||
|
From financial institutions
|
352,443 | 438,538 | ||||||
|
From the parent company (1)
|
- | 50,000 | ||||||
|
Other liabilities
|
50,000 | 50,000 | ||||||
| 402,443 | 538,538 | |||||||
|
Current maturities of long-term loans:
|
||||||||
|
From financial institutions
|
133,215 | 1,792 | ||||||
|
Non Marketable Debentures
|
67,000 | - | ||||||
|
Other long-term loans
|
91 | 2,169 | ||||||
|
From marketable debentures
|
- | 175,785 | ||||||
| 200,306 | 179,746 | |||||||
| 602,749 | 718,284 | |||||||
|
Non current liabilities
|
||||||||
|
Loans from financial institutions*
|
1,366,159 | 1,239,705 | ||||||
|
Other loans
|
6,641 | 7,894 | ||||||
| 1,372,800 | 1,247,599 | |||||||
|
Less – current maturities in respect of loans from
financial institutions and others
|
133,306 | 3,961 | ||||||
| 1,239,494 | 1,243,638 | |||||||
|
Marketable debentures
|
789,222 | 175,785 | ||||||
|
Non-marketable debentures
|
342,000 | 67,000 | ||||||
| 1,131,222 | 242,785 | |||||||
|
Less – current maturities
|
67,000 | 175,785 | ||||||
| 1,064,222 | 67,000 | |||||||
|
Total non-current liabilities
|
2,303,716 | 1,310,638 | ||||||
|
(1)
|
For details – see Note 29.
|
|
*
|
The Group has the right to make early repayment of the loans from financial institutions.
|
B. Classified by currency and interest rates
|
Weighted average
interest rate as at
December 31
|
As at December 31
|
|||||||||||
|
2014
|
2014
|
2013
|
||||||||||
|
%
|
US$ thousands
|
|||||||||||
|
Current liabilities (without current maturities)
|
||||||||||||
|
Short-term credit from financial institutions:
|
||||||||||||
|
In dollars (1)
|
1.1 | 234,196 | 313,671 | |||||||||
|
In Euro (2)
|
0.9 | 101,448 | 105,840 | |||||||||
|
In other currencies
|
1.4 | 16,799 | 19,027 | |||||||||
|
Short-term credit from the parent company and others:
|
||||||||||||
|
In Dollar
|
0.9 | 50,000 | 100,000 | |||||||||
| 402,443 | 538,538 | |||||||||||
|
Non-current liabilities (including current maturities)
|
||||||||||||
|
Loans from financial institution:
|
||||||||||||
|
In Dollar (1)
|
1.3 | 960,648 | 914,686 | |||||||||
|
In Israeli currency – unlinked
|
4.7 | 154,282 | 172,860 | |||||||||
|
In Euro (2)
|
1.6 | 190,718 | 152,159 | |||||||||
|
In other currencies
|
10.1 | 60,511 | - | |||||||||
| 1,366,159 | 1,239,705 | |||||||||||
|
Loans from others:
|
||||||||||||
|
In Dollar
|
3.0 | 3,801 | 3,590 | |||||||||
|
In Euro
|
4.8 | 1,903 | 2,697 | |||||||||
|
In other currencies
|
1.6 | 937 | 1,607 | |||||||||
| 6,641 | 7,894 | |||||||||||
| 1,372,800 | 1,247,599 | |||||||||||
|
Non-marketable debentures – in dollar (3)
|
5.1 | 342,000 | 67,000 | |||||||||
|
Marketable debentures (3):
|
||||||||||||
|
In Dollar
|
4.5 | 789,222 | - | |||||||||
|
In Israeli currency –unlinked
|
- | 28,773 | ||||||||||
|
In Israeli currency – linked to CPI
|
- | 147,012 | ||||||||||
| 789,222 | 175,785 | |||||||||||
|
Unutilized long-term credit lines (4):
|
821,000 | 682,000 | ||||||||||
|
(1)
|
The interest in respect of most of the dollar debt is determined based on LIBOR + a margin at a rate of about 1.1%.
|
|
(2)
|
The interest in respect of most of the Euro debt is determined based on the Euribor + a margin at a rate of about 1.2%.
|
|
(3)
|
See Section F.
|
|
(4)
|
See Sections H, I, J, M and P.
|
C. Maturity periods
The credit and the loans from banks and others including debentures (net of current maturities) mature in the years after the date of the report, as follows:
|
As at December 31
|
||||||||
|
2014
|
2013
|
|||||||
|
US$ thousands
|
||||||||
|
Second year
|
732,043 | 226,049 | ||||||
|
Third year
|
15,936 | 821,543 | ||||||
|
Fourth year
|
15,498 | 7,451 | ||||||
|
Fifth year
|
214,248 | 7,341 | ||||||
|
Sixth year and thereafter
|
1,325,991 | 248,254 | ||||||
| 2,303,716 | 1,310,638 | |||||||
D. Restrictions on the Group relating to the receipt of credit
As part of the loan agreements the Group has signed, various restrictions were provided including financial covenants, a cross default mechanism and a negative pledge.
Set forth below is information regarding the financial covenants applicable to the Company as part of the loan agreements and the compliance therewith:
|
Financial Covenants (1)
|
Financial Ratio Required
under the Agreement
|
Financial Ratio December 31,
|
Financial Ratio December 31,
|
||||||
|
2014
|
2013
|
||||||||
|
Equity
|
Equity greater than 2,000
|
2,974 | 3,654 | ||||||
|
million dollar
|
million dollars
|
million dollars
|
|||||||
|
The ratio of the EBITDA to the net interest expenses
|
Equal to or greater than 3.5
|
18.20 | 37.38 | ||||||
|
Ratio of the net financial debt EBITDA
|
Less than 3.5
|
1.76 | 0.93 | ||||||
|
Ratio of the financial liabilities of the subsidiaries to the total assets of the consolidated company
|
Less than 10%
|
0.8 | % | 0.39 | % | ||||
|
Ratio of the net financial debt to the equity
|
Less than 2.1
|
0.8 | 0.40 | ||||||
|
(1)
|
Examination of compliance with the above mentioned financial covenants is made as required based on the data in the Company's consolidated financial statements.
|
E. Sale of receivables under securitization transaction
On July 2, 2010, the Company and certain Group subsidiaries (hereinafter – “the Subsidiaries”) entered into a number of securitization agreements with Rabobank International and Credit Agricol (hereinafter – “the Lending Banks”) for the sale of their customer debts to a foreign company which was established specifically for this purpose and which is neither owned nor controlled by the ICL Group (hereinafter – “the Acquiring Company”).
The Acquiring Company finances acquisition of the debts by means of a loan received from a financial institution, which is not related to ICL, which finances the loan out of the proceeds from the issuance of commercial paper on the U.S. commercial paper market. The repayment of both the commercial paper and the loan are backed by credit lines from the Lending Banks. The amount of cash that will be received in respect of the initial sale of the customer debts in the securitization transaction will be up to $350 million.
The acquisition is on an ongoing basis, such that the proceeds received from customers whose debts were sold are used to acquire new trade receivables.
The period in which the Subsidiaries are entitled to sell their trade receivables to the Acquiring Company is five years from the closing date of the transaction, where both parties have the option at the end of each year to give notice of cancellation of the transaction. The securitization agreement will expire in July 2015.
The selling price of the trade receivables is the amount of the debt sold, less the calculated interest cost based on the anticipated period between the sale date of the customer debt and its repayment date.
Upon acquisition of the debt, the Acquiring Company pays the majority of the debt price in cash and the remainder in a subordinated note, which is paid after collection of the debt sold. The rate of the cash consideration varies according to the composition and behavior of the customer portfolio.
The Subsidiaries handle collection of the trade receivables included in the securitization transaction, on behalf of the Acquiring Company.
In addition, as part of the agreements a number of conditions were set in connection with the quality of the customer portfolios, which gives the Lending Banks the option to end the undertaking or determining that some of the Subsidiaries, the customer portfolios of which do not meet the conditions provided, will no longer be included in the securitization agreement.
The securitization of trade receivables does not meet the conditions for disposal of financial assets prescribed in International Standard IAS 39, regarding Financial Instruments – Recognition and Measurement, since the Group did not transfer all of the risks and rewards deriving from the trade receivables. Therefore, the receipts received from the Acquiring Company are presented as a financial liability as part of the short-term credit. As of December 31, 2014, utilization of the securitization facility and trade receivables within this framework amounted to $290 million (As at December 31, 2013, approximately $285 million).
Once the Company transferred its trade receivables, it no longer has the right to sell them to another party. In the case of a credit fault, the Company bears 30% of the overall secured trade receivable balance.
The value of the transferred assets (which is approximately their fair value), fair value of the associated liabilities and net position are as follows:
|
Year ended December 31,
|
||||||||||||
|
2014
|
2013
|
2012
|
||||||||||
|
US$ thousands
|
||||||||||||
|
Value of the transferred assets
|
290,323 | 285,246 | 162,681 | |||||||||
|
Fair value of the associated liabilities
|
290,053 | 284,978 | 162,506 | |||||||||
|
Net position
|
270 | 268 | 175 | |||||||||
F. Issuance of Debentures
1. In 2005, we issued debentures to institutional investors in a private issuance in the United States in the amount of $125 million bearing fixed interest. As of December 31, 2014, the outstanding balance of the debentures was approximately $67 million, bearing fixed interest at a rate of 5.72%. Subsequent to the date of the report, on March 3, 2015, the debentures were repaid in full.
2. On April 27, 2009, we issued three series of debentures for an amount equal to NIS 695 million (approximately $167 million), of which Series B and C were repaid in full in 2013, and Series A was repaid in full on April 30, 2014.
3. On September 9, 2009, we issued three series of debentures for an amount equal to NIS 898 million (approximately $235 million). The debentures were issued in three series, of which Series B and C were repaid in full during 2013, and Series D was repaid in full on October 31, 2014.
4. In November 2013, a wholly owned and controlled subsidiary of ours entered into an agreement with institutional and international investors to make a private offering in the United States of unregistered debentures in an amount of $275 million. The proceeds in respect of the issuance were received in January 2014.
The debentures were issued in three series, as follows:
A. $84 million of debentures with a repayment date of January 15, 2021 bearing interest at a fixed rate of 4.55%.
B. $145 million of debentures with a repayment date of January 15, 2024 bearing interest at a fixed rate of 5.16%.
C. $46 million of debentures with a repayment date of January 15, 2026 bearing interest at a fixed rate of 5.31%.
5. On December 2, 2014, the Company completed the private issuance of senior notes pursuant to Rule 144A and Regulation S under the U.S. Securities Act of 1933, as amended, to institutional investors in the U.S., Europe, and Israel, in an aggregate principal amount of $800 million, scheduled for repayment on December 2, 2024. The notes bear an annual coupon of 4.5% to be paid in semi annual installments, on June 2 and December 2 of each year. The notes were issued at a price of 99.285% to yield 4.59%. The proceeds received by the Company for the debentures amount to about $794 million. The notes have been rated BBB (stable) by Standard and Poor's and by Fitch Rating Ltd. The notes are registered for trade in the TACT Institutional, by the Tel-Aviv Stock Exchange Ltd.
G.
In December 2010, the Company received a loan from a European Bank in the amount of €100 million (about $121 million). Repayment of the loan is on December 15, 2015. The interest rate on the loan is Eurobor + 1.14%.
H.
On March 14, 2011, the Company signed an agreement with a group of 17 banks from Europe, the United States and Israel whereby these banks made available to the Company credit in the amount of $675 million. The credit line is for a period of 5 years and will be paid in one lump-sum at the end of the period. On the amount of the credit actually utilized, graduated annual interest will be paid, as follows:
|
–
|
Up to 33% of the credit utilized:
|
Libor + 0.8%.
|
|
–
|
From 33% to 66% of the credit utilized:
|
Libor + 0.95% (on the full amount utilized).
|
|
–
|
More than 66% of the credit utilized:
|
Libor + 1.1% (on the full amount utilized).
|
The credit agreement does not include a commitment to utilize a minimum amount of the credit line. A non utilization commission will apply at the rate of 0.28% per year.
As of the date of the financial statements, $505 million of the credit facility had been utilized.
I.
In In the first half of 2014, the Company entered into an agreement with a European bank, under which the bank granted a credit facility of €100 million and $100 million. This credit facility is for a period of six years and is payable in entirety at the end of the period. The credit facility in euro replaces the unutilized credit facility that the bank had granted the Company in November 2011.The dollar credit facility bears variable interest on the basis of Libor plus a margin of between 0.9% and 1.4%. The euro credit facility bears variable interest on the basis of Eurobor plus a margin of between 0.9% and 1.4%. The non-utilization commission is 0.32% per year. As at December 31, 2014, a total of approximately $100 million of the dollar credit facility was utilized.
J.
In December 2011, the Company entered into an undertaking with 7 international banks whereby the banks will provide the Company a credit line, in the aggregate amount of $650 million. The credit line is for a period of five years and is to be repaid in full at the end of the period. On the amount of the credit actually utilized, graduated annual interest will be paid, as follows:
|
–
|
Up to 33% of the credit is utilized:
|
Libor + 1%.
|
|
–
|
From 33% up to 66% of the credit is utilized:
|
Libor + 1.2% (on the entire amount utilized).
|
|
–
|
From 66% and above of the credit is utilized:
|
Libor + 1.4% (on the entire amount utilized).
|
The credit agreement does not include a commitment to utilize a minimum amount of the credit line. A non utilization commission will apply at a rate of 0.35% per year. As of the date of the report, the amount of $214 million had been utilized out of the credit line.
K.
On June 26, 2012, we received a short term loan in the amount of $50 million from our controlling shareholder (Israel Corporation Ltd). The loan was granted on terms similar to market terms. The loan was renewed periodically for periods of three or six months and bore interest at a rate of 0.776%. In August 2014, the loan was repaid in full.
L.
On September 11, 2012, the Company received a loan in the amount of $50 million from a third party, bearing interest at the three month Libor rate plus a margin of 0.7%. The loan is extended every three months on the same terms on which it was received. The last date on which the loan was extended was December 11, 2014.
M.
In December 2012, we entered into a credit facility agreement with a European bank for a loan of approximately €100 million (approximately $121 million). As of December 31, 2014, we had utilized $100 million from this facility. The repayment date for this amount is in December 2019. The interest rate on this amount is LIBOR plus 1.4%. The amount that is utilized from this credit facility must be repaid six years from the date of utilization but no later than December 2021.
N.
In November 2013, the Company signed a loan agreement with several institutional entities, in the amount of $170 million, bearing a fixed interest at a rate of 4.74%. The loan is to be repaid in increments until November 2024 (average life of seven years).
O.
In 2014, we received a number of short term loans from Israeli banks. As of December 31, 2014, the total amount of the loans was approximately $40 million.
P.
In May 2014, we signed an agreement with a European bank whereby the bank provided a credit facility in the amount of €50 million. This credit facility is for a period of five years and is to be repaid in full at the end of the period. It bears variable interest based on Euribor plus a margin of 0.95% to 1.25%. A non utilization commission is chargeable at the rate of 0.33% per year. As of December 31, 2014, this credit facility had not been used.
Q.
In June 2014, we signed loan agreements with a number of international institutional entities in the aggregate amount of approximately €57 million and approximately $45 million. The proceeds of these loans were received in
July 2014. The loans are to be repaid in a period of between five to ten years, where some of the loans bear fixed interest in the range of 2.1% to 3.75%, some bear variable interest based on LIBOR plus 1.55% and some bear variable interest based on Euribor plus a margin of 1.4% to 1.7%.
R.
In December 2014, we signed a loan agreement in the amount of R$161 million (approximately $60 million) with a European bank. The loan is payable in installments until 2021. The loan bears CDI interest (Brazilian Interbank Certificates of Deposits) plus a margin of 1.35%.
|
As at December 31
|
||||||||
|
2014
|
2013
|
|||||||
|
US$ thousands
|
||||||||
|
Open accounts
|
568,780 | 657,897 | ||||||
|
Checks payable
|
16,129 | 11,205 | ||||||
| 584,909 | 669,102 | |||||||
|
As at December 31
|
||||||||
|
2014
|
2013
|
|||||||
|
US$ thousands
|
||||||||
|
Government of Israel – mainly in respect of royalties (1)
|
245,579 | 53,941 | ||||||
|
Employees
|
217,922 | 275,692 | ||||||
|
Accrued expenses
|
67,591 | 73,354 | ||||||
|
Derivative instruments
|
90,403 | 11,781 | ||||||
|
Benefits for early retirement
|
14,709 | 19,330 | ||||||
|
Others
|
56,709 | 66,355 | ||||||
| 692,913 | 500,453 | |||||||
|
(1)
|
See Note 23
|
A. Taxation of companies in Israel
1. Measurement of results for tax purposes under the Income Tax (Inflationary Adjustments) Law, 1985 (hereafter – “the Inflationary Adjustments Law”)
The Income Tax Law (Adjustments for Inflation) – 1985 (hereinafter – the Law), which is effective as from the 1985 tax year, introduced the concept of measurement of results for tax purposes on a real (net of inflation) basis. On February 26, 2008, the Knesset enacted the Income Tax Law (Adjustments for Inflation) (Amendment No. 20) (Restriction of Commencement Period), 2008, whereby the effective period of the Adjustments Law ceased at the end of the 2007 tax year and the depreciation of property, plant and equipment, are adjusted up to the end of the 2007 tax year, and from this time forward their linkage will be discontinued.
The Income Tax Regulations (Adjustments for Inflation) (Rates of Depreciation), 1986, which allow depreciation at rates different than those in Section 21 of the Ordinance, apply even after the Adjustments Law is no longer in effect, and therefore the Company continues to claim accelerated depreciation, in certain situations, on the basis of these Regulations (the regulations apply with respect to accelerated depreciation in an industrial plant or assets that were initially used prior to December 31, 2013).
2. Income tax rates
Presented hereunder are the tax rates relevant to the Company in the years 2012-2014:
2012 – 25%
2013 – 25%
2014 – 26.5%
On August 5, 2013 the Israeli Knesset passed the Law for Changes in National Priorities (Legislative Amendments for Achieving Budget Objectives in the Years 2013 and 2014) – 2013, by which, inter alia the corporate tax rate would be raised by 1.5% to a rate of 26.5% as from 2014.
In addition, the Israeli Law for the Encouragement of Capital Investments was amended such that the tax rate applicable to a Preferred Company in Development Area A will be 9% whereas the tax applicable to companies in the rest of Israel will be 16%. The impact of the legislation on the financial statements for 2013 is recognition of tax expenses, in the amount of about $11 million, against adjustment of the balance of the deferred taxes.
3. Tax benefits under the Israeli Law for the Encouragement of Capital Investments, 1959 (hereinafter – “The Encouragement Law”)
a) Beneficiary Enterprises
The production facilities of some of the subsidiaries in Israel (hereinafter – “the Subsidiaries”) received “Beneficiary Enterprise” status under the Encouragement Law, as worded after Amendment No. 60 to the Law published in April 2005.
The benefits granted to the Company are mainly:
1) Reduced tax rates
During the benefits period – 10 years commencing in the first year in which the companies earn taxable income from the Benefited Enterprises (provided the maximum period to which it is restricted by law has not elapsed) – tax applies to the income of the companies from the Benefited Enterprises they own at the rates of 0% for the Regular Track and 11.5% for the Ireland Track instead of the regular tax rate (see A(2) above).
The Company has Benefited Enterprises under the Regular Track (tax rate 0%) and Benefited Enterprises under the Ireland Track (tax rate 11.5%).
In the event of distribution of a cash dividend out of income that was exempt from tax, as stated above, the Company will have to pay tax at the grossed up rate of 25% in respect of the amount distributed (see also Sections b and c below). The temporary difference related to distribution of a dividend from exempt income as of December 31, 2014, in respect of which deferred taxes were not recognized, is in the amount of about $190 million.
The part of the taxable income entitled to benefits at reduced tax rates is calculated on the basis of the ratio of the turnover of the “Benefited Enterprise” to the Company’s total turnover. The turnover attributed to the “Benefited Enterprise” is generally calculated according to the increase in the turnover compared to a “base” turnover, which is the average turnover in the three years prior to the year of election of the “Benefited Enterprise”.
2) Accelerated depreciation
In respect of buildings, machinery and equipment used by the Approved Enterprise, the Company is entitled to claim accelerated depreciation as provided by law, commencing from the year each asset is placed in service.
b) Preferred Enterprises
On December 29, 2010, the Israeli Knesset approved the Economic Policy Law for 2011 2012, whereby the Law for the Encouragement of Capital Investments, 1959, was amended (hereinafter – “the Amendment to the Law”). The Amendment to the Law is effective from January 1, 2011 and its provisions will apply to preferred income derived or accrued by a Preferred Enterprise (industrial plant that fulfills the law’s provisions regarding qualifying as a competitive plant contributing to the Gross Domestic Product (GDP) or a competitive plant in the area of renewable energy) in 2011 and thereafter. A company may choose to not be included in the scope of the
Note 20 – Taxes on Income (cont'd)
Amendment of the Law and to remain in the scope of the law before its amendment until the end of the benefits period. The 2012 tax year is the last year the Company may choose a Preferred Enterprise as the election year, provided that the minimum qualifying investment began in 2010.
As part of the Amendment, the existing tax benefit tracks were eliminated (the tax exempt track, the “Ireland track” and the “Strategic” track) and two new tax tracks were introduced in their place – a Preferred Enterprise and a Special Preferred Enterprise, which mainly provide a uniform and reduced tax rate for all the Company’s income entitled to benefits, as follows:
For a Preferred Enterprise – in 2011-2012 tax years – a tax rate of 10% for Development Area A and of 15% for the rest of the country. In 2013 tax year – a tax rate of 7% for Development Area A and of 12.5% for the rest of the country, and as from the 2014 tax year – 9% for Development Area A and 16% for the rest of the country.
A Special Preferred Enterprise – for a period of 10 consecutive years a reduced tax rate of 5% if it is located in Development Area A or of 8% if it is located in the rest of the country.
The Amendment to the Law also provides that no tax will apply to a dividend distributed out of preferred income to a shareholder that is a company – both at the level of the distributing company and at the shareholder level. A tax rate of 15% will apply to a dividend distributed out of preferred income to an individual shareholder or foreign resident, subject to treaties for prevention of double taxation. Furthermore, the Amendment to the Law provides relief with respect to tax paid on a dividend received by an Israeli company from profits of an approved/alternative/beneficiary enterprise that accrued in the benefits period according to the provisions of the law before its amendment, if the company distributing the dividend notifies the Tax Authorities by June 30, 2015 that it is applying the provisions of the Amendment to the Law and the dividend is distributed after the date of the notice.
The Amendment to the law does not apply to an Industrial Enterprise that is a mine, other facility for production of minerals or a facility for exploration of fuel. Therefore, ICL plants that are defined as mining plants and mineral producers will not be able to take advantage of the tax rates proposed as part of the new law. The Company has Preferred Enterprises at the tax rate of 9%.
Nonetheless, tax benefits to which a Benefited Plant is entitled will not be cancelled in respect of investments up to December 31, 2012. Therefore, those plants will be able to utilize the tax benefits in respect of qualifying investments made up to December 31, 2012, in accordance with the provisions of the old law.
As at the approval date of the financial statements, the Company is examining the impact of the law and its application with respect to the companies operating in Israel.
On July 29, 2013, the Israeli Knesset approved the Budget Law and the Law for Change of National Priorities (Legislative Amendments for Achieving the Budget Targets for 2013 and 2014), 2013. As part of this legislation, it was determined that the tax rate for an individual and a foreign resident on a dividend that is distributed commencing from January 1, 2014 and the source of which is preferred income, will increase to 20% in place of the present rate of 15%.
c) Trapped Earnings Law – Temporary Order
On November 5, 2012, the Israeli Knesset passed Amendment No. 69 and Temporary Order to the Law for the Encouragement of Capital Investments, 1959 (hereinafter – “the Temporary Order”), which offers a reduced tax rate arrangement to companies that received an exemption from Companies Tax under the aforesaid law. The Temporary Order provides that companies that choose to apply the Temporary Order (effective for one year), will be entitled to a reduced tax rate on the “release” of exempt profits (hereinafter – “the Beneficiary Companies Tax Rate”). The release of exempt profits will make it possible to distribute them without additional tax at the company level and will also make it possible to use the profits without the restrictions that applied to the use of the exempt profits.
The Beneficiary Companies Tax Rate will be determined according to the rate of exempt profits the company chooses to release from its entire exempt profits, and will be between 40% and 70% of the Companies Tax rate that would have applied to the revenue in the year it was produced if it had not been exempt, but in any event no less than 6%. Furthermore, a company that chooses to pay the Beneficiary Companies Tax Rate will have to invest in an industrial enterprise up to 50% of the tax saving it obtained, within a period of 5 years beginning from the year of notice. Failure to comply with this condition will require the company to pay additional Companies Tax.
On November 4, 2013, the Company's Board of Directors decided to apply the Temporary Order and to release part of the exempt earnings. As a result, the amount of about NIS 3.8 billion (about $1.1 billion) of the exempt earnings was released. Accordingly, in 2013 the Company recognized current tax expenses in respect of payment of the preferred Companies Tax, in the amount of about NIS 377 million (about $108 million).
4. The Law for the Encouragement of Industry (Taxation), 1969
Some of the Company’s Israeli subsidiaries are “Industrial Companies”, as defined in the above mentioned law. As such, these companies are entitled to claim depreciation at increased rates for equipment used in industrial activities, as stipulated in the regulations published under the Inflationary Adjustments Law.
The industrial enterprises held by the Company and some of its Israeli subsidiaries have a common line of production and are therefore entitled to file consolidated tax returns in accordance with Section 23 of the Law for the Encouragement of Industry. Accordingly, each of the said companies is entitled to offset its tax losses against the taxable income of the other companies.
B. Taxation of non-Israeli subsidiaries
Subsidiaries incorporated outside of Israel are assessed for tax under the tax laws in their countries of residence. The principal tax rates applicable to the major subsidiaries outside Israel are as follows:
Subsidiary incorporated in the Netherlands – tax rate of 25%.
Subsidiary incorporated in Germany – tax rate of 29%.
Subsidiary incorporated in the United States – tax rate of 40%.
Subsidiary incorporated in Spain – tax rate of 30%.
Subsidiary incorporated in United Kingdom – tax rate of 21%
1
.
C. Carried forward tax losses
As at December 31, 2014, the balances of the carryforward tax losses of subsidiaries, for which deferred taxes were created, amount to about $351 million (December 31, 2013 – about $94 million).
The balances of the carryforward tax losses of subsidiaries, for which deferred taxes were not created is about $25 million.
The capital losses for tax purposes available for carryforward to future years amount to about $18 million. In accordance with an assessment agreement with the Israeli Tax Authorities, it will be possible to utilize most of these losses only against capital gains the Group companies have from a sale of shares of companies in which they hold directly at least 30%, to a company they control, directly or indirectly, at the rate of at least 50%. Deferred taxes were not recorded in respect of these capital losses. These losses are linked to the CPI as stated in Paragraph A(1) above.
D. Tax assessments
The Company and its Israeli subsidiaries that are being consolidated for tax purposes have received final tax assessments up to and including the 2008 tax year.
The rest of the Israeli subsidiaries have final tax assessments up to and including the 2009 tax year.
Significant subsidiaries outside of Israel have final tax assessments up to and including the 2007 tax year (for the majority of them).
1
The tax rate in the United Kingdom was reduced to 21% starting April 1, 2014, and to 20% commencing from April 1, 2015.
On December 29, 2013, an assessment was received from the Israeli Tax Authority (“ITA”) whereby the Company is required to pay tax in addition to the amount it already paid in respect of the years 2009 2011, in the amount of about $230 million. The Company has appealed the ITA's assessment. Subsequent to the date of the report, on January 27, 2015, an Order was received from the ITA placing the amount of the additional tax at about $200 million. The main contentions of the ITA is that ICL's subsidiaries: Dead Sea Works and Rotem Amfert Negev, are not entitled to benefits under the Law for Encouragement of Capital Investments – this being from the date of entry into effect of Amendment No. 60 to this Law, in 2005. The Company disagrees with the ITA's position and on February 25, 2015 it filed an appeal of the Order. In the estimation of Company Management, based on its legal advisors, the chances that the Company's claims will be accepted at the end of the appeal process are higher than the chances that they will be rejected and, therefore, there is no provision for tax included in the financial statements as a result of the said assessment.
Pursuant to the assessments agreement signed between subsidiaries in Europe and the tax authorities, the Company included a provision, in the amount of about $51 million, during the first half of 2014.
E. Deferred income taxes
1. The composition of the deferred taxes and the changes therein, are as follows:
|
In respect of financial position
|
||||||||||||||||||||||||
|
Depreciable property,
plant and equipment
|
Inventories
|
Provisions for employee benefits
|
Other
|
In respect
of carry forward tax losses
|
Total
|
|||||||||||||||||||
|
US$ thousands
|
||||||||||||||||||||||||
|
Balance as at January 1, 2013
|
(333,402 | ) | 46,045 | 141,977 | (19,159 | ) | 61,579 | (102,960 | ) | |||||||||||||||
|
Changes in 2013:
|
||||||||||||||||||||||||
|
Amounts recorded to a capital reserve
|
— | — | (14,172 | ) | (223 | ) | (4,376 | ) | (18,771 | ) | ||||||||||||||
|
Translation differences
|
1,303 | 1 | (651 | ) | (473 | ) | (1,255 | ) | (1,075 | ) | ||||||||||||||
|
Amounts recorded in the statement of income
|
337 | 3,506 | 22,088 | (8,491 | ) | (4,354 | ) | 13,086 | ||||||||||||||||
|
Balance as at December 31, 2013
|
(331,762 | ) | 49,552 | 149,242 | (28,346 | ) | 51,594 | (109,720 | ) | |||||||||||||||
|
Changes in 2014:
|
||||||||||||||||||||||||
|
Additions in respect of business combinations
|
27 | — | — | (507 | ) | — | (480 | ) | ||||||||||||||||
|
Amounts recorded to a capital reserve
|
— | — | 24,478 | (88 | ) | 12,165 | 36,555 | |||||||||||||||||
|
Translation differences
|
6,558 | (12 | ) | (4,647 | ) | 5,579 | (1,908 | ) | 5,570 | |||||||||||||||
|
Amounts recorded in the statement of income
|
(62,857 | ) | (11,206 | ) | (21,802 | ) | 23,846 | 35,491 | (36,528 | ) | ||||||||||||||
|
Transfer to the group assets held for sale
|
85 | — | — | 3,084 | — | 3,169 | ||||||||||||||||||
|
Balance as at December 31, 2014
|
(387,949 | ) | 38,334 | 147,271 | 3,568 | 97,342 | (101,434 | ) | ||||||||||||||||
2. Deferred taxes are presented in the statement of financial position as follows:
|
As at December 31
|
||||||||
|
2014
|
2013
|
|||||||
|
US$ thousands
|
||||||||
|
As part of non-current assets
|
158,443 | 111,157 | ||||||
|
As part of non-current liabilities
|
(259,877 | ) | (220,877 | ) | ||||
| (101,434 | ) | (109,720 | ) | |||||
3. The currencies in which the deferred taxes are denominated:
|
As at December 31
|
||||||||
|
2014
|
2013
|
|||||||
|
US$ thousands
|
||||||||
|
Dollar
|
(15,134 | ) | (17,541 | ) | ||||
|
Euro
|
(9,527 | ) | (16,535 | ) | ||||
|
Shekels
|
(96,555 | ) | (84,510 | ) | ||||
|
Other
|
19,782 | 8,866 | ||||||
| (101,434 | ) | (109,720 | ) | |||||
4. For companies in Israel – the deferred taxes as at December 31, 2014 are computed mainly at the weighted-average tax rate of 25.6% (December 31, 2013 – 23%). Regarding companies outside of Israel – see B above.
F. Taxes on income included in the income statements:
1. Composition
|
For the year ended December 31
|
||||||||||||
|
2014
|
*2013 | *2012 | ||||||||||
|
US$ thousands
|
||||||||||||
|
Current taxes
|
76,451 | 185,230 | 201,061 | |||||||||
|
Deferred taxes
|
36,603 | (12,631 | ) | 22,543 | ||||||||
|
Taxes in respect of release of trapped earnings
|
— | 108,623 | — | |||||||||
|
Taxes in respect of prior years *
|
53,098 | (1,199 | ) | (6,043 | ) | |||||||
| 166,152 | 280,023 | 217,561 | ||||||||||
|
*
|
Including deferred taxes in respect of prior years.
|
2. Following is a reconciliation of the theoretical tax expense, assuming all income is taxed at the regular tax rates (see A(2) above) and the tax expense presented in the statements of income:
|
For the year ended December 31
|
||||||||||||
|
2014
|
2013
|
2012
|
||||||||||
|
US$ thousands
|
||||||||||||
|
Income before taxes on income, as reported in the statements of income
|
632,254 | 1,100,196 | 1,519,293 | |||||||||
|
Statutory tax rate
|
26.5 | % | 25 | % | 25 | % | ||||||
|
Theoretical tax expense on this income
|
167,547 | 275,049 | 379,823 | |||||||||
|
Less – tax benefits arising from reduced tax rate applicable to an “Preferred Enterprise” and “Benefited Enterprise”
|
(42,988 | ) | 7,072 | (121,266 | ) | |||||||
| 124,559 | 282,121 | 258,557 | ||||||||||
|
Add (less) – the tax effect of:
|
||||||||||||
|
Differences between the basis of measurement for tax purposes and for financial reporting purposes (the dollar)
|
12,800 | (16,557 | ) | (6,965 | ) | |||||||
|
Differences in respect of foreign subsidiaries
|
7,649 | 22,516 | 24,347 | |||||||||
|
Non–deductible expenses
|
6,231 | 7,902 | 9,130 | |||||||||
|
Additional deduction for tax purposes for foreign subsidiaries and withholding of tax at the source in respect of a dividend from outside of Israel
|
(34,973 | ) | (5,903 | ) | (56,647 | ) | ||||||
|
Taxes in respect of prior years
|
53,098 | (1,199 | ) | (6,043 | ) | |||||||
|
Elimination of tax calculated in respect of the Company’s share in profits of associated companies
|
(8,091 | ) | (6,421 | ) | (6,639 | ) | ||||||
|
Other differences
|
4,879 | (2,436 | ) | 1,821 | ||||||||
|
Taxes on income included in the income statements
|
166,152 | 280,023 | 217,561 | |||||||||
G. Taxes on income relating to equity items
|
For the year ended December 31
|
||||||||||||
|
2014
|
2013
|
2012
|
||||||||||
|
US$ thousands
|
||||||||||||
|
Tax recorded in other comprehensive income
|
||||||||||||
|
Actuarial gains from defined benefit plan
|
24,476 | (14,172 | ) | 9,018 | ||||||||
|
Change in fair value of derivatives used for hedging cash flows
|
— | (898 | ) | 313 | ||||||||
|
Taxes in respect of exchange rate differences on equity loan to a subsidiary included in translation adjustment
|
12,165 | (4,376 | ) | (1,889 | ) | |||||||
| 36,641 | (19,446 | ) | 7,442 | |||||||||
|
For the year ended December 31
|
||||||||||||
|
2014
|
2013
|
2012
|
||||||||||
|
US$ thousands
|
||||||||||||
|
Tax recorded directly in equity
|
||||||||||||
|
Tax benefits (taxes on income) in respect of issuance of shares to employees
|
(88 | ) | (223 | ) | 189 | |||||||
A. Composition
|
As at December 31
|
||||||||
|
2014
|
2013
|
|||||||
|
US$ thousands
|
||||||||
|
Present value of funded obligations
|
865,326 | 784,256 | ||||||
|
Less – fair value of plan assets
|
765,546 | 761,257 | ||||||
| 99,780 | 22,999 | |||||||
|
Present value of unfunded obligations
|
392,087 | 452,909 | ||||||
|
Post-retirement medical benefits
|
3,341 | 3,812 | ||||||
|
Recognized liability for defined benefit obligations plans
|
495,208 | 479,720 | ||||||
|
Liability for severance benefits
|
112,603 | 158,589 | ||||||
|
Total liability for employee benefits recognized in the statement of financial position
|
607,811 | 638,309 | ||||||
The liability in respect of employee benefits is presented in the statement of financial position as follows:
|
As at December 31
|
||||||||
|
2014
|
2013
|
|||||||
|
US$ thousands
|
||||||||
|
As part of non-current assets
|
66,063 | 83,124 | ||||||
|
As part of non-current liabilities
|
659,165 | 702,103 | ||||||
|
As part of current liabilities
|
14,709 | 19,330 | ||||||
| 607,811 | 638,309 | |||||||
Composition of the plans’ assets:
|
As at December 31
|
||||||||
|
2014
|
2013
|
|||||||
|
US$ thousands
|
||||||||
|
Equity instruments
|
||||||||
|
With quoted market price
|
232,436 | 242,516 | ||||||
|
Without quoted market price
|
296 | 307 | ||||||
| 232,732 | 242,823 | |||||||
|
Debt instruments
|
||||||||
|
With quoted market price
|
203,432 | 192,603 | ||||||
|
Without quoted market price
|
160,941 | 172,490 | ||||||
| 364,373 | 365,093 | |||||||
|
Deposits with insurance companies
|
168,441 | 153,341 | ||||||
| 765,546 | 761,257 | |||||||
B. Linkage terms
|
As at December 31
|
||||||||
|
2014
|
2013
|
|||||||
|
US$ thousands
|
||||||||
|
Dollar
|
10,525 | 9,671 | ||||||
|
Euro
|
170,969 | 168,216 | ||||||
|
Israeli Shekel
|
361,825 | 418,057 | ||||||
|
British pound
|
62,699 | 39,780 | ||||||
|
Other
|
1,793 | 2,585 | ||||||
| 607,811 | 638,309 | |||||||
C. Severance pay
1. Israeli companies
Pursuant to Israeli labor laws and the labor contracts in force, the Company and its Israeli subsidiaries are required to pay severance pay to dismissed employees and employees leaving their employment in certain other circumstances. Severance pay is computed based on length of service and generally according to the latest monthly salary and one month’s salary for each year worked.
The liabilities relating to employee severance pay rights are covered as follows:
a) Under collective labor agreements, the Group companies in Israel make current deposits in outside pension plans for some of the employees. These plans generally provide full severance pay coverage and, in some cases, 72% of the severance pay liability.
The severance pay liabilities covered by these plans are not reflected in the financial statements, since all the risks relating to the payment of the severance pay, as described above, have been transferred to the pension funds.
b) The Group companies in Israel make current deposits in Managers’ Insurance policies in respect of employees holding management positions. These policies provide coverage for the severance pay liability in respect of the said personnel. Under employment agreements, these insurance policies are, subject to certain limitations, the property of the employees. The amounts funded in respect of these policies are not reflected in the balance statements of financial position since they are not under the control and management of the companies.
c) As to the balance of the liabilities that are not funded, as above, a provision is made in the financial statements based on an actuarial calculation.
d) On February 2, 2015, the Workers Council of a subsidiary started a strike at the production facilities in Naot Havov and stopped all shipments of merchandise from the facilities. Shutting down of the plants comes in reaction to the efficiency plans the Company is implementing in Naot Havov, pursuant to which termination letters were sent to tens of employees employed under collective bargaining agreements. Further to that stated above, on February 19, 2015, the Workers Council of a subsidiary in Sodom announced a general strike of its factories. As at December 31, 2014, the conditions had not been fulfilled for recognizing a provision in respect of employee dismissals, as stated above, and accordingly no provision has been included in the financial statements.
2. Certain subsidiaries outside Israel
Since the countries wherein these subsidiaries operate have no law requiring payment of severance pay, the Group does not include a provision in the financial statements for possible eventual future severance payments to employees, except in cases where part of the activities of the enterprise is discontinued and, as a result, the employees are dismissed.
D. Pension and early retirement
1. Some of the Group’s employees in and outside of Israel (some of whom have already left the Group) have defined benefit pension plans (within the companies) for their retirement. Generally, the terms of the plans provide that the employees are entitled to receive pension payments based on, among other things, their number of years of service (in certain cases up to 70% of their last base salary) or computed, in certain cases, based on a fixed salary.
2. In addition to the above, some Group companies have entered into an agreement with funds – and with a pension fund for some of the employees – under which such companies make current deposits with that fund which releases them from their liability for making a pension payment under the labor agreements to all of their employees upon reaching a retirement age. The amounts funded are not reflected in the statements of financial position since they are not under the control and management of the Group companies.
3. Employees of a subsidiary in Sodom, Israel are entitled to early retirement if they fulfill certain conditions, including age and seniority at the time of retirement.
4. In December 2013, a plan was approved whereby a number of employees of the Rotem subsidiary may leave on early retirement prior to the retirement age provided by law. As a result, in 2013 the Group recorded an expense in the amount of about $60 million included in "other expenses" in the statement of income.
In the months of November and December 2012, plans were approved whereby a number of employees of the subsidiaries were permitted to take early retirement prior to the retirement age provided by law. In the statement of income for 2012, an expense was included in the amount of about $55 million in respect of the said early retirement plans.
E. Post-employment retirement benefits
Some of the retirees of the Group companies receive, aside from the pension payments from a pension fund, benefits that are primarily holiday gifts and weekend trips. The companies’ liability for these costs accrues during the employment period. The Group companies include in their financial statements the projected costs in the post-employment period according to an actuarial calculation.
F.
(1) Movement in present value of defined benefit plans
|
For the year ended December 31
|
||||||||
|
2014
|
2013
|
|||||||
|
US$ thousands
|
||||||||
|
Obligation in respect of defined benefit plan at beginning of the year
|
1,240,977 | 1,215,913 | ||||||
|
Current service costs
|
37,088 | 43,166 | ||||||
|
Interest costs
|
48,719 | 48,434 | ||||||
|
Employee contributions
|
697 | 691 | ||||||
|
Benefits paid
|
(80,356 | ) | (82,883 | ) | ||||
|
Actuarial losses (gains) deriving from changes in financial assumptions
|
163,509 | (32,385 | ) | |||||
|
Actuarial gains deriving from changes in demographic assumptions
|
(5,683 | ) | (1,498 | ) | ||||
|
Increase in liabilities as part of business combinations
|
127 | 1,682 | ||||||
|
Past service cost
|
(5,616 | ) | (8,611 | ) | ||||
|
Changes in respect of exchange rate differences
|
(57,793 | ) | 40,364 | |||||
|
Changes in respect of translation differences
|
(63,410 | ) | 16,104 | |||||
|
Transfer to the group assets held for sale
|
(17,505 | ) | — | |||||
|
Obligation in respect of defined benefit plan at end of the year
|
1,260,754 | 1,240,977 | ||||||
(2) Movement in plan assets for defined benefit plans
|
For the year ended December 31
|
||||||||
|
2014
|
2013
|
|||||||
|
US$ thousands
|
||||||||
|
Fair value of plan assets at beginning of the year
|
761,257 | 704,858 | ||||||
|
Interest income
|
29,750 | 26,248 | ||||||
|
Actuarial gains recognized in equity
|
54,652 | 13,399 | ||||||
|
Employer contributions
|
22,416 | 23,868 | ||||||
|
Employee contributions
|
852 | 758 | ||||||
|
Increase in assets as part of business combinations
|
— | 570 | ||||||
|
Benefits paid
|
(33,006 | ) | (42,150 | ) | ||||
|
Changes in respect of exchange rate differences
|
(32,764 | ) | 20,989 | |||||
|
Changes in respect of translation differences
|
(37,202 | ) | 12,717 | |||||
|
Transfer to the group assets held for sale
|
(409 | ) | — | |||||
|
Fair value of plan assets at end of the year
|
765,546 | 761,257 | ||||||
(3) Expenses recognized in the income statement
|
For the year ended December 31
|
||||||||||||
|
2014
|
2013
|
2012
|
||||||||||
|
US$ thousands
|
||||||||||||
|
Current service costs
|
37,088 | 43,166 | 34,460 | |||||||||
|
Interest costs
|
48,719 | 48,434 | 49,627 | |||||||||
|
Interest income
|
(29,750 | ) | (26,248 | ) | (27,159 | ) | ||||||
|
Past service cost
|
(5,616 | ) | (8,611 | ) | 2,009 | |||||||
|
Exchange rate differences, net
|
(25,029 | ) | 19,375 | 6,202 | ||||||||
| 25,412 | 76,116 | 65,139 | ||||||||||
(4) Actual and expected return
|
For the year ended December 31
|
||||||||||||
|
2014
|
2013
|
2012
|
||||||||||
|
US$ thousands
|
||||||||||||
|
Actual return on plan assets
|
84,402 | 39,647 | 69,879 | |||||||||
|
Expected yield on plan assets
|
29,750 | 26,248 | 27,159 | |||||||||
(5) Actuarial gains and losses recognized directly in equity
|
For the year ended December 31
|
||||||||||||
|
2014
|
2013
|
2012
|
||||||||||
|
US$ thousands
|
||||||||||||
|
Cumulative amount (before tax) as at January 1
|
123,039 | 170,321 | 126,417 | |||||||||
|
Actuarial losses (gains) deriving from changes in demographic assumptions
|
(5,683 | ) | (1,498 | ) | (26,173 | ) | ||||||
|
Actuarial losses (gains) deriving from changes in financial assumptions
|
108,857 | (45,784 | ) | 70,077 | ||||||||
|
Cumulative amounts (before tax) as at December 31
|
226,213 | 123,039 | 170,321 | |||||||||
|
Deferred taxes in respect of actuarial gains and losses recognized directly in equity
|
(52,497 | ) | (28,021 | ) | (42,193 | ) | ||||||
| 173,716 | 95,018 | 128,128 | ||||||||||
(6) a. Actuarial assumptions
Principal actuarial assumptions at the reporting date (expressed as weighted averages):
|
For the year ended December 31
|
||||||||||||
|
2014
|
2013
|
2012
|
||||||||||
| % | % | % | ||||||||||
|
Discount rate as at December 31
|
3.2 | 4.0 | 4.2 | |||||||||
|
Future salary increases
|
3.4 | 4.4 | 3.8 | |||||||||
|
Future pension increase
|
2.1 | 2.4 | 2.5 | |||||||||
The assumptions regarding the future mortality rate are based on published statistics and accepted mortality tables.
A one percentage point change in assumed healthcare cost trend rates does not have a material effect on the Company.
In 2014, it was determined that there is a deep market for high quality corporate debentures in Israel. Accordingly, commencing December 31, 2014, a defined benefit obligation and other long-term benefits that are shekel-denominated or shekel-linked are to be discounted according to an interest rate derived from an interest curve based on the rate of the yields on high-quality corporate debentures in accordance with IAS 19,
Employee Benefits
.
In addition, during 2014 there was a decrease in the risk-free interest rate that reduced the effect of the transition to an interest curve based on yield rates of high quality corporate debentures. The effects of the change in the discount rate as compared with the discount rate determined at the end of last year are an increase in the defined benefit obligation and an adjustment in deferred tax balances as at December 31, 2014, in the amounts of $27 million and $6 million, respectively, which were recognized against other comprehensive income. Of those amounts, a decrease of $27 million and $7 million in the defined benefit obligation and the deferred tax balances, respectively, derives from the change in the discount rate from an end-of-period rate that is based on government debentures to a rate that is based on high quality corporate debentures (the difference at the end of the period between the discount rate based on corporate debentures and the discount rate based on government debentures is 0.5%). The impact of the change in the interest rate on the liability in respect of other long term employee benefits is not material. In addition, the effect of these changes in 2015 on the interest costs in the financing expenses is not expected to be material.
(6) b. Sensitivity analysis
Assuming all other assumptions remain constant, the following reasonable possible changes effect the defined benefit obligation as of the date of the financial statements in the following manner:
|
December 2014
|
||||||||||||||||
|
Decrease 10%
|
Decrease 5%
|
Increase 5%
|
Increase 10%
|
|||||||||||||
|
US$ millions
|
||||||||||||||||
|
Significant actuarial assumptions
|
||||||||||||||||
|
Discount rate
|
(49,972 | ) | (21,744 | ) | 22,830 | 44,953 | ||||||||||
|
Salary increase
|
25,433 | 12,781 | (13,233 | ) | (26,504 | ) | ||||||||||
|
Mortality table
|
(21,399 | ) | (10,622 | ) | 10,515 | 20,788 | ||||||||||
G.
The expenses recorded in respect of defined contribution plans in 2014 is about $25.9 million (in 2013 and 2012 – expenses were declared in the amounts of about $26.4 million and about $24.1 million, respectively).
The Group’s estimate of the deposits expected to be made in 2015 in funded defined benefit plans is about $18.2 million.
The Group’s estimate life the defined benefit plans (based on a weighted average), as at the end of the period of the report, is about 15.4 years (2013– about 14.4 years).
H. Long-term remuneration plan
On May 12, 2013, ICL's Board of Directors decided to approve a long term remuneration plan for about 11,300 employees of the Company in and outside of Israel who are not managers that participated in the Company's options' plan (which was approved in November 2012) based on terms defined in the plan. The maximum cost of the plan is about $45 million. As at the date of the report, the said terms were not met and, accordingly, no liability was included in the books in respect of this plan.
On August 6, 2014, ICL's Board of Directors decided to approve a long term remuneration plan for about 11,800 Company employees in and outside of Israel that are not managers, who participated in the Company's options and shares plan (which was approved on the same date) pursuant to the terms provided in the plan. The maximum cost of the plan is about $17 million. As at the date of the report, the said terms were not met and, accordingly, no liability was included in the books in respect of this plan.
A. Composition and changes in the provision
|
Warranties
|
Site restoration, removal and dismantling of property, plant and equipment items
|
Legal claims
|
Other
|
Total
|
||||||||||||||||
|
US$ millions
|
||||||||||||||||||||
|
Balance as at January 1, 2014
|
588 | 96,973 | 3,658 | 31,836 | 133,055 | |||||||||||||||
|
Change in respect of business combinations
|
— | — | — | 2,678 | 2,678 | |||||||||||||||
|
Provisions made during the period
|
555 | 8,268 | 1,525 | 428 | 10,776 | |||||||||||||||
|
Provisions reversed during the period
|
(227 | ) | (575 | ) | (166 | ) | (1,934 | ) | (2,902 | ) | ||||||||||
|
Effect of the passage of time (due to discounting)
|
— | 5,049 | — | — | 5,049 | |||||||||||||||
|
Payments during the period
|
(314 | ) | (3,337 | ) | (1,012 | ) | (1,432 | ) | (6,095 | ) | ||||||||||
|
Translation differences
|
(116 | ) | (3,846 | ) | (330 | ) | (672 | ) | (4,964 | ) | ||||||||||
|
Transfer to the group assets held for sale
|
(48 | ) | — | — | — | (48 | ) | |||||||||||||
|
Balance as at December 31, 2014
|
438 | 102,532 | 3,675 | 30,904 | 137,549 | |||||||||||||||
Presentation in the statement of financial position:
|
As at December 31
|
||||||||
|
2014
|
2013
|
|||||||
|
US$ millions
|
||||||||
|
In current liabilities
|
35,118 | 38,485 | ||||||
|
In non-current liabilities
|
102,431 | 94,570 | ||||||
| 137,549 | 133,055 | |||||||
B. Restoration of mines and mining sites
1. The Group included a provision in the books for restoration of mines and mining sites. The provision is based on the discounted cash flows based on an estimate of the future expenses that will be required to close down the mines and to restore the mining sites. The estimated closing date of the mines is based on a geological evaluation of the quantity of potash remaining in the mines and the resources available to the subsidiaries.
2. Pursuant to the provisions of Spanish law covering environmental protection in connection with areas affected by mining activities, a subsidiary in Spain has submitted a plan for restoration of mining sits for the subsidiary’s two production sites. The plan for restoration of the Suria site is intended to last for a period of about 24 years and for the Sallent center until the end of 2016 (the planned closure date). According to the subsidiary’s estimate, the overall, undiscounted, scope of the plan for restoration of the mining sites will amount to $20 million (€17 million). As at December 31, 2014, a provision in the amount of $12 million (€10 million) was recorded in the
books of the subsidiary in Spain. The provision was calculated on the basis of discounted projected costs of restoration.
3. A manufacturing facility of the Group in Naot Hovav, Israel contains solid waste. Pursuant to the requirements of the Israeli Ministry of Environmental Protection, the facility is required to treat the existing (past) and ongoing waste. The treatment will be partly through a restoration facility of hydro-bromine acid, operated by the subsdiary, while part of the waste will be will sent outside for treatment. The Company has a provision for treatment of waste, which as at December 31, 2014, amounts to about $45 million. In Management's estimation, as of the approval date of the financial statements the provision included in the financial statements is sufficient to cover the estimated cost of treating the historical waste. At this stage, the facility treats the current waste produced from the plant’s existing production processes and is presently in the test run stages for purposes of commencement of treatment of the stored up historical waste in a special site on the plant’s premises in coordination with the Israeli Ministry of Environmental Protection – which is planned to be treated by the plant.
4. From time to time, one of the Group’s subsidiaries in Israel is required to examine various contentions that soil contamination has been caused due to subterranean penetration of waste water or other waste materialss created during the manufacturing process. The subsidiary may be required to clean up the relevant sites or the subterranean areas if and when it is found that it is responsible for the said contamination as stated. In the past several years, various examinations were performed by various institutions in order to investigate land contamination in this area and in the area surrounding the subsidiary’s site in Be’er Sheva, Israel.
A. Commitments
(1) Several of the Group’s subsidiaries have entered into agreements with suppliers in and outside of Israel for the purchase of raw materials in the ordinary course of business, for various periods ending on December 31, 2019. The total amount of the commitments under the said purchase periods of the agreements is approximately $585 million as of December 31, 2014.
(2) Several of the Group’s subsidiaries have entered into agreements with suppliers for acquisition of property, plant and equipment. As at December 31, 2014, the subsidiaries had capital purchase commitments of about $280 million.
(3) A subsidiary in England has entered into 114 long term land contracts for the lease of land used to mine potash. The lease fees are generally determined based on the quantity of potash mined in each leased area. The two main lease contracts run up to December 2015 and 2035. The Company has commenced a process or renewal of the license that expires at the end of 2015. The contracts are usually signed for a term of 35 to 50 years. As of the date of this Annual Report,
the remaining term covered by the lease contracts range from 1 to 24 years.
(4) In September 2003, a long-term (20 year) supply agreement was signed between an Israeli subsidiary and a non-Israeli corporation commencing from January 2004, for the supply of bromine and bromine compounds by the subsidiary.
(5) The Articles of Association of the Company and its Israeli subsidiaries include provisions that permit exemption, indemnification and insurance of the liability of officers, all in accordance with the provisions of the Israeli Companies Law.
The Company, with the approval of the Audit Committee, the Board of Directors and the General Meeting of the shareholders, granted its officers an exemption and letters of indemnification, and has also taken out an insurance policy covering directors and officers. The insurance and the indemnity do not apply to those cases specified in Section 263 of the Israeli Companies Law. The exemption is for damage caused and/or that will be caused by such officers, due to a breach of the duty of care to the Company. The amount of the indemnification payable by the Company under the letter of indemnification, in addition to amounts received from an insurance company, if any, for all of the officers on a cumulative basis, for one or more of the events detailed therein, was limited to $300 million. The insurance is renewed annually. The coverage in effect (including a joint layer with the parent company in the amount of $20 million) is in the aggregate amount of $220 million. On May 8, 2014, the General Meeting of the Company’s shareholders decided to approve an increase from $300 million to $350 million
Note 23 – Commitments, Concessions and Contingent Liabilities (cont'd)
of the insurance coverage that was determined in the framework approved by the General Meeting in August 2012 – this being from the date the Company's shares were listed for trading in the United States.
(6) Several of the Group’s subsidiaries in Israel have entered into agreements with various natural gas vendors for the supply of natural gas to the Group’s manufacturing facilities in Israel. The Company committed to “take or pay’’ with respect to a minimum annual quantity of gas in a scope and in accordance with the mechanism provided in the agreements. The total quantities under the currently existing agreements should provide the Group all its gas needs until September 30, 2017, including quantities required to operate the power station the Group intends to construct in Sodom, Israel, which is expected to start in the second half of 2015. The supply of the gas under the currently existing agreements is for a term ending September 30, 2017. Additionally, upon a shortage of capacity in the production of gas, based on a decision of the Israeli Gas Authority, allocation of the supply of gas will be pro rata among all the consumers connected to the national gas transport system, based on the formula provided in the decision of the Gas Authority. The Company anticipates that the amount of the annual consumption of the gas, after operation of the power station, as is expected to be received based on the Yam Thetys agreement and the Tamar Agreement, will be about BCM 0.76.
(7) On June 28, 2012, the Group entered into agreements regarding a project to construct a new cogeneration plant in Sodom, Israel (hereinafter—‘‘the Project’’) with a production capacity of 330 tons of steam per hour and 245 megawatts of electricity that will provide all the electricity and steam requirements of the production plants at the Sodom site in the upcoming years. The Project is expected to be completed in the second half of 2015. The cost of the Project is estimated at about $320 million. The construction agreements are linked to the exchange rate of the euro. The Company entered into derivative foreign-currency hedging transactions to hedge the exposure to changes in the Project’s cash flows deriving from changes in the dollar/euro exchange rate.
B. Concessions
Dead Sea Works Ltd. (DSW)
Pursuant to the Israeli Dead Sea Concession Law, 1961 (hereinafter—“the Concession Law”), as amended in 1986, and the concession indenture attached as an addendum to the Concession Law, the Company was granted a concession to utilize the resources of the Dead Sea and to lease the land required for its plants in Sodom for a period ending on March 31, 2030, accompanied by a priority right to receive the concession after its expiration, should the Government wish to offer a new concession. In consideration of the concession, the Company pays royalties to the Government of Israel, calculated at the rate of about 5% of the value of the products at the factory gate, less certain expenses, where the royalties in respect of the annual quantity of potash sold in excess of 1.5 million is 10% (in place of 5%).
(1) Dead Sea Works Ltd. (DSW) (cont'd)
DSW granted a sub concession to Dead Sea Bromine Ltd. to produce bromine and its compounds from the Dead Sea, the expiration date of which is concurrent with the Company's concession. The royalties in respect of the products manufactured by the Bromine Company are received by the Company from the Bromine Company, and the Company then pays them over to the State.
In addition, there is an arrangement relating to payment of royalties by Dead Sea Magnesium for production of magnesium metals by virtue of a specific arrangement with the State provided in the Government’s decision dated September 5, 1993. Pursuant to the arrangement, royalties are paid by Dead Sea Magnesium on the basis of carnallite used for production of magnesium.
The arrangement with Dead Sea Magnesium provides that during 2006 the State may demand a reconsideration in connection with the amount of the royalties and the method or their calculation for 2007 and thereafter. The State’s demand for reconsideration, as stated, was first received at the end of 2010, and the matter is presently in an arbitration proceeding, as described below.
In 2006, a letter was received from the then Accountant General of the Israeli Ministry of Finance, claiming an underpayment of royalties amounting to hundreds of millions of shekels. Pursuant to the concession, disputes between the parties relating to the concession, including royalties, are to be decided by an arbitration panel of three arbitrators (each side appoints an arbitrator and these two appoint the third). On January 9, 2011, the State of Israel and DSW decided to turn to arbitration for purposes of deliberating and deciding the issue of the manner of
Note 23 – Commitments, Concessions and Contingent Liabilities (cont'd)
calculation of the royalties under the concession and royalties to be paid for magnesium metals and payment or refunds (if any) due deriving from these matters. Each of the parties appointed an arbitrator on its behalf and these arbitrators appointed the third arbitrator.
In the statement of claim filed by the State of Israel in the arbitration proceedings, the State of Israel is claiming the amount of $265 million in respect of underpayment of royalties for the years 2000 through 2009, with the addition of interest and linkage differences, and a change in the method of calculating royalty payments from the sale of metal magnesium.
After studying the State of Israel’s allegations in respect of prior years, the Company believes, on the basis of a legal opinion it received, that the royalties it paid and their manner of calculation are consistent with the provisions of the concession. The same method of calculation has been applied consistently since the time the Company was a government company, and was known to the State of Israel and accepted by it. Accordingly, and on the basis of the legal opinion the Company received, no provision has been recorded in the financial statements as of March 31, 2014 with respect to royalties that the State of Israel contends were underpaid.
On May 19, 2014, a partial arbitration decision was received regarding the royalties’ issue. Based on the principles of the decision received, Dead Sea Works Ltd. (‘‘DSW’’) is also required to pay the State royalties on the sale of downstream products manufactured by companies that are controlled by ICL that have production plants located both in and outside the Dead Sea area, including outside of Israel. The royalties are to be paid according to the value of the downstream products, which will be set according to the formula described in Section 15(a)(2) of the Concession Deed, based on the selling price of the downstream products to unrelated third parties less the deductions set forth in subsections (I), (II) and (III) of that Section. Regarding metal magnesium, it was decided that the State of Israel and DSW are to exhaust their discussions on the subject of the royalties to be paid by DSW on metal magnesium, and if no agreement is reached the matter is to be returned to arbitration. As a result of the partial arbitration decision, the Company recorded a provision in the second quarter of 2014 in the amount of about $135 million for the years 2000 through 2013. The amount of this provision includes, among other things, interest and is net of the tax effect (the amount of about $149 million in respect of royalties for prior periods plus interest of about $31 million, which is included in the "financing expenses" category and net of the tax effect, in the amount of about $45 million, which was recognized as a tax benefit). The arbitrators’ decision is partial and its main decision is with respect to payment of royalties on downstream products, as mentioned above. The principles whereby the financial calculations will be made have not yet been determined. Such principles will be discussed in the second stage of the arbitration. As part of the second stage of the arbitration, in January 2015 the Company submitted an interim calculation of the royalties. The said interim calculation does not take into account certain issues that have not yet been resolved, including, the minimum rate of the mineral in the downstream product that creates a requirement to pay royalties in respect of the said downstream product. The correct amount of the royalties according to the interim calculations
is significantly lower than the provision. The final amount that will be awarded by the arbitrators at the end of the second stage of the arbitration proceedings, and after they determine the financial calculations, as stated, may be materially different than the amount of the provision. The Company's estimate in connection with the provision is based on various assumptions relating to the manner of calculating the royalties deriving from the partial arbitration decision, and reflects the best estimate of the expenditure required to settle the obligation presently, as at the date of the report.
In June 2013, the former Minister of Finance, Mr. Yair Lapid, gave notice of establishment of a public committee, headed by Prof Eitan Sheshinski, for examination of the policy with respect to the royalties received by the State from private parties, including the Company, for use of national natural resources, such as potash and phosphates. The committee was required, among other things, to examine the royalties' policy from a broad standpoint, while making reference to the impacts on existing agreements between various entities engaged in the said matters and the State of Israel. For additional information regarding the committee's final conclusions that were published in October 2014 – see Section C "Increase in the Water Level of Pond 5".
In 2014, 2013 and 2012, DSW paid royalties to the Government of Israel in the amounts of approximately $84 million, approximately $110 million and approximately $125 million, respectively.
(2) Rotem
Rotem has been mining phosphates in the Negev for more than fifty years. The mining is conducted in accordance with phosphate mining concessions, which are granted from time to time by the Minister of National
Note 23 – Commitments, Concessions and Contingent Liabilities (cont'd)
Infrastructures under the Mines Ordinance, through the Supervisor of Mines in his Office (hereinafter—‘‘the Supervisor’’), accompanied by mining authorizations issued by the Israel Lands Administration (hereinafter—‘‘the ILA’’). The concessions relate to the quarry (phosphate rock) whereas the authorizations relate to use of land as active mine sites.
Rotem has the following mining concessions:
i. Rotem Field – valid up to the end of 2021;
ii. Zafir Field – (Oron Zin) – valid up to the end of 2021;
iii. Hatrurim Field – the Supervisor has decided to extend the area of the Rotem field concession so that it will include the Hatrurim Field and the matter has been transferred to the ILA to deal with the extension of the area of the mining permit for the Rotem Field, in accordance with the extension of the concession area.
In September 2012, a committee was set up by the Director General of the Israeli Ministry of Energy and Water, to examine the phosphates sector, including representatives of the Israeli Ministry of Energy and Water, the Israeli Geological Institute and the Israeli Ministry of Economy, Trade and Industry, in order to look into use of the phosphate resource in Israel, and to submit recommendations regarding the annual mining quantity of phosphates, the manner of use of the phosphates layers and the stages for restoring the mine areas. The committee published its recommendations and, among other things, it recommended to examine the possibility of imposing certain restrictions on the manner of the mining and utilization of the phosphates, and also recommended to approve mining in additional fields, such as, the Barir field.
As at the date of the report, no operative decisions had been made based on the committee’s recommendations.
Mining royalties
In respect of mining of the phosphate, Rotem is required to pay the State of Israel royalties based on a calculation format stipulated in the Israeli Mines Ordinance. The calculation format for the royalties was updated in February 2010 as part of a compromise agreement that settled all the disputes regarding past royalties and formulas for future royalties. Notwithstanding that stated, in June 2013, the former Minister of Finance, Mr. Yair Lapid, gave notice regarding an establishment of a public committee, headed by Professor Eytan Sheshinski, for examination of the policy with respect to the royalties received by the State of Israel from private entities, including the Company, for use of national natural resources such as potash and phosphate. The committee is required, among other things, to examine the royalties' policy from a broad perspective, while making reference to the impacts on the present agreements between the various parties engaged in these matters and the State of Israel. For additional information regarding the committee's final conclusions that were published in October 2014 – see Section C – "Increase in the Water Level in Pond 5".
In 2014, 2013 and 2012, Rotem paid royalties to Israeli government in the amounts of approximately $3 million, $4 million and $6 million, respectively.
Planning and building.
The mining and quarrying activities require zoning approval of the site based on a plan in accordance with the Israeli Planning and Building Law, 1965. These plans are updated, as needed, from time to time. As at the date of the report, there are various requests at different stages of deliberations pending before the planning authorities.
At the end of 2009, at the recommendation of a team accompanying preparation of a new site plan for the Zin-Oron area in Israel, the Local District Board approved extension of the execution stages of the site plan from 1991, which zones the Zafir site (Zin-Oron) for mining up to the end of 2013, and in September 2013, the Local District Board approved extension of additional stages up to the end of 2015.
The plan for mining phosphates in Barir field (South Zohar) is in planning approval stages, and it has not yet been decided whether to deposit it with the competent authorities. Israeli residents of Arad, the communities and the surrounding Bedouin villages in the area object to deposit of the plan and continuation of advancement of the planning stages in respect thereof, due to the fear of environmental and health dangers they contend will be caused as a result of operation of the mine. The Company believes that the mining activities in Barir field do not involve
any risks to the environment or to people. After an expert appointed by the Israeli Ministry of the Prime Minister expressed his opinion that there is no health hazard in the Barir mine, the Israeli Ministry of Health appointed a committee on its behalf to examine the matter before the Israeli Ministry formulates its position. At the end of 2013, a public health expert was appointed (Prof. Samet from the United States) who delivered his opinion in the beginning of 2014. On April 3, 2014, the Company was informed that the former Minister of Health, Ms. Yael German, contacted the Head of the Planning Administration in the Ministry of the Interior, Ms. Binat Schwartz, and informed her that after she read the opinion of the expert appointed by the Ministry of Health, she has decided to oppose the mining in the Barir field, including test mining. The Company disagrees with the interpretation of the former Minister of Health of the opinion. In the Company's estimation and based on its understanding of the said opinion, such opinion does not contradict the Company's position that the mining activities in the Barir field do not pose any threat at all to the environment or to the residents. On December 2, 2014, the Head of the Planning Administration in the Ministry of the Interior brought up for discussion by the Planning and Building Council a proposal for advancement of the mining plan in the Barir field by the Administration's authorities. A discussion was held however a decision regarding the matter has not yet been made. The residents of Arad are continuing to object to advancement of the mining plan and even to test mining. If mining approval is not received for the Barir field, this will significantly impact the Group’s future mining reserves in the medium and long term.
In December 2014, ICL signed a strategic partnership agreement with Yunnan Yuntianhua, China's second largest chemical manufacturer and the third largest phosphate manufacturer in the world, for operation of a joint venture (50/50) controlled by ICL with respect to phosphate activities having full horizontal integration that includes a world scope phosphate mine and production of downstream products. The aggregate amount of the transaction is estimated at about $452 million. Closing of the transaction is expected to take place in the first quarter of 2016, subject to approvals of various government and regulatory entities.
(3) A subsidiary in Spain from the ICL Fertilizers segment was granted mining rights based on legislation of Spain’s Government from 1973. Further to the legislation, the Government of the Catalonia region issued special mining regulations whereby the subsidiary, a company from the ICL Fertilizers segment, received single license for each of 126 different relevant sites for the current mining activities and possibilities for the future. Some of the licenses are valid up to 2037 and the rest are effective up to 2067. The mining royalties in 2014 amounted to about euro €150 thousand. Regarding an additional area beyond the areas referred to above, ‘‘Reserva Catalana,’’ a request was submitted to extend the period of the concession, commencing from October 2012, for a period of 30 years. As at the date of the report, there are still no mining activities being carried out in this area. The administrative activities of the National Mining Authority with respect to extending the concession period have not yet been completed however the mining rights are still valid and IBP is in the process of renewing the rights before they expire.
(4) The mining rights of a subsidiary in the United Kingdom, from the ICL Fertilizers segment (hereinafter—‘‘CPL’’) are based on approximately 114 mining leases and licenses for extracting various minerals, in addition to numerous easements and rights of way from private owners of land under which CPL operates or, in the case of mining underneath the North Sea, granted by the British Crown.
The terms of all of these leases, licenses, easements and rights of way extend until from December 2015 until 2038. In 2014, mining royalties amounted to about £2.6 million.
(5) A subsidiary in the United Kingdom from the ICL Fertilizers segment has peat mines in the U.K. (Creca, Nutberry and Douglas Water). Peat is used as a raw material for production of detached platforms for improvement of land and for use as soil substitutes on growing platforms. The Nutberry and Douglas Water mining sites are owned by the Company, while the Creca mine is held under a long term lease. The mining permits were granted up to the end of 2024 and are granted by the local authorities for fixed time periods of 14 years and are renewed after being examined by the said local authorities
C. Contingent liabilities
(1) As of December 31, 2014, the total guarantees provided by the Group to third parties amount to $83 million. The guaranties provided by the Group in respect of loans taken out by the Group’s subsidiaries amount to about $1,673 million.
(2) During the 1990s, several claims were made against a few of the Group’s subsidiaries in respect of plaintiffs from various countries, who worked mostly as banana plantation workers, who allegedly have been injured by exposure to Di Bromo Chloropropane (‘‘DBCP’’) produced, many years ago, by a number of manufacturers, including large chemical companies. As at the date of approval of the financial statements, the Group’s subsidiaries are parties to one legal proceeding by 9 plaintiffs who are requesting certification of their claim as a class action. The claim is for bodily injury and therefore the amount for the claims has not been stated. The Group believes the quantities of material supplied by the Group to the relevant countries in the relevant periods was, if at all, small compared with the quantities of material sold by other chemical manufacturers.
In the opinion of the Company's management and its legal advisors, it is not possible to estimate the outcome of the above claims. Nonetheless, it is estimated that the overall exposure of ICL and the subsidiaries will not exceed $20 million. No provision has been included in the financial statements in respect of this claim.
(3) Environmental protection
a) The Group companies manufacture, store and sell hazardous chemical products and, therefore, they are exposed to risks deriving from harm caused to the environment. The companies invest significant amounts in order to comply with the environmental rules and regulations. In the estimation of Company Management and on the basis of information in its possession, as at the signing date of the financial statements, the provision existing in the financial statements covers the quantifiable liabilities in respect of costs relating to environmental protection.
b) Pending proceedings relating to the Kishon River, Israel
The Company's production site borders the Kishon River. For decades FCM, along with many other entities, municipalities and plants, has diverted wastewater into the Kishon River.
Between 2001 and 2005, a number of claims for monetary damages were filed in the Haifa District Court against the Company and a series of other defendants (including the State of Israel) by 50 individuals (or their heirs or dependents), most of them fishermen who worked, according to the claims, in the Kishon’s fishing harbor. According to the plaintiffs, the flow of sewage to the Kishon River by each of the chemical plants operating on the river banks has caused the plaintiffs’ cancer and other illnesses. Dozens of factories, local governments and insurance companies were added as third-party defendants. In the course of examining the claims, ten plaintiffs withdrew their claims, which were dismissed.
On November 3, 2013, a court judgment was rendered rejecting all the plaintiffs’ claims for damages and on February 9, 2014, the court charged all the plaintiffs for the defendants' legal expenses, in the amount of about $1.2 million (about NIS 4.6 million). The Company's share in the legal fees for which the plaintiffs were charged is about $0.3 million (about NIS 1.1 million). On September 1, 2014, notices of appeal were filed by seven plaintiffs. Based on an opinion of its legal advisors, the Company estimates that the chances that the appeals will succeed are low.
Between 2000 and 2007, a number of claims were filed in the District Court at Haifa against a list of defendants by former soldiers (and their heirs and dependents). The plaintiffs claim that contact with toxic substances in and around the Kishon River caused them cancer and other diseases (hereinafter – "the Claims of the Soldiers"). Several dozen factories (including the Company), governments, including the State of Israel, and insurance companies were added as third-party defendants.
On June 17, 2013, a court decision was rendered rejecting the claim for damages of 72 former soldiers (and their heirs and dependents) in the consolidated cases, with no order for expenses. The court decision did not include one claim of 17 soldiers that was not consolidated with the said claims (out of the 17 claims, one claim was rejected by consent). On September 8, 2013, the plaintiffs filed a notice of appeal in the Supreme Court and on November 18, 2013 some of the defendants, including the Company, filed a counter appeal with respect to the court's decision not to order payment of expenses. On November 24, 2013, at the court's request, the plaintiffs filed an amended notice of appeal. On December 9, 2014, a statement of summations was filed by the plaintiffs with reference to the appeal and thereafter a statement of summations was filed by the respondents in the appeal. Then court set a hearing date for oral supplementation of the summations in September 2015. Based on the evaluation of its legal advisors, and in light of the court’s detailed and reasoned decision, the Company estimates that the chances that of appeal succeeding are low. As stated, the above mentioned decision does not include a claim of 16 soldiers that was heard as part of the said claims however that
Note 23 – Commitments, Concessions and Contingent Liabilities (cont'd)
were not consolidated with them. Regarding this claim, the court decided to "stay" the hearing until after the decision of the Supreme Court regarding the claims with respect to which an appeal was filed.
Based on the court's determinations with respect to the claims regarding which a decision has been rendered, as stated, the Company estimates, in reliance on its legal advisors, that the chances that this claim will prevail are low. No provisions have been included in the financial statements in connection with the above mentioned claims.
c) Three claims were filed with the District Court at Beer Sheva, Israel in March and June 2007 against the State of Israel and the Industrial Local Council at Naot Hovav, Israel, in whose jurisdiction the Naot Hovav plants operate and plants of ICL Industrial Products. The plaintiffs argue that various pollutants in the vicinity of Naot Hovav have caused their illnesses, including, among other things, respiratory diseases, spontaneous abortion, birth defects, diseases of the nervous system, cancer, and other illnesses. The claims rely, among other things, on results of an epidemiological study. The claims sue for sums for treatment expenses incurred by the plaintiffs, as well as compensation for pain and suffering, distress, and punitive damages. The plaintiffs are suing for a total sum of approximately $61 million (NIS 238 million).
In 2008, the Local Council and the State of Israel filed a third party notice against a number of plants at Naot Hovav, including factories of ICL Industrial Products. On January 9, 2013, a judgment was rendered rejecting the claim. On February 20, 2013, the plaintiffs filed an appeal with the Supreme Court, which was rejected on September 29, 2014.
(4) Increase in level of Pond 5, Israel
The minerals from the Dead Sea are extracted by way of solar evaporation, whereby salt precipitates onto the bed of one of the evaporation ponds at Sodom, in one of the DSW’s sites. The precipitated salt creates a layer on the pond bed of approximately 20 million tons annually. The process of production of the raw material requires that a fixed brine volume is preserved in the pond. To this end, the water level of the pond is raised by approximately 20 centimeters annually. The Ein Boqeq and Hamei Zohar hotels, the town of Neve Zohar and other facilities and infrastructures are located on the western beach of this pond. Raising the water level of the pond above a certain level is likely to cause structural damage to the foundations and the hotel buildings situated close to the water’s edge, to the settlement of Neve Zohar
and to other infrastructure on the western shoreline of the pond, depending on the height to which the water level is raised and the location of the relevant object.
In July 2012, an appendix to the agreement from 2007 was signed relating to additional protections of beachfronts that are to be executed in order to permit strengthening of the water level. Based on the appendix to that agreement, the level of the DSW’s participation in the beachfront protection will be 39.5%.
On July 8, 2012, the Group entered into an agreement with the government of Israel, relating to a permanent solution to the rising water level in level of Pond 5. This solution is by means of full harvesting of the salt from Pond 5 of DSW (hereinafter—‘‘the Salt Harvesting’’), in such a manner that will no longer require raising of the water level in the Pond after completion of the Salt Harvesting’. The highlights of the agreement are set forth below:
A. Planning and execution of the Salt Harvesting will be performed by the Company.
B. The Salt Harvesting project, including a new pumping station to be constructed, constitute an Israeli national infrastructure project that will be promoted by the Israeli Committee for National Infrastructures.
C. Starting from January 1, 2017, the water level in Pond 5 will not rise above 15.1 meters in DSW’s network. If there is a material deviation from the timetables for construction of the Salt Harvesting project as a result of a requirement for changes by the planning institutions, as a result of which the Plan is not approved on time, without the Company having violated its obligations, the Company will be permitted to request raising of the water level above that level. The Company will be required to pay compensation for any damages caused, as a result of the rise in the water level. The statutory infrastructure of the Salt Harvesting project is presently being discussed by the Board of National Infrastructures and its approval is expected at the end of 2015. Concurrently, the Group is performing additional activities relating to the harvesting project.
D. Pursuant to estimates of the Dead Sea Protection Company, the total cost of the Salt Harvesting was estimated, as at October 2010, in an undiscounted amount of about NIS 7 billion (a discounted amount of about NIS 3.8 billion). The Government will bear 20% of the cost of the Salt Harvesting, however not more than the
Note 23 – Commitments, Concessions and Contingent Liabilities (cont'd)
discounted amount (20% of NIS 3.8 billion – “the discounted amount”). The Government’s maximum commitment is linked to the Consumer Price Index and bears interest at the rate of 7%.
E. Increase in the rate of the royalties from 5% to 10% of sales, for quantities of chloride potash DSW sells in excess of 1.5 million tons annually, this increase will apply to sales starting January 1, 2012. The Group also agreed that for the period starting January 1, 2010 and until January 1, 2012, for annual sales exceeding 3.0 million tons additional royalties at a rate of 5% will be paid.
F. As part of the agreement, the State of Israel declared that as of that date, it sees no need to make additional changes in its then specific fiscal policy regarding mining from the quarries at the Dead Sea, including the commercial utilization thereof and, accordingly, at that present time, it will not initiate and will not object, as applicable, to proposed laws regarding this matter. The Company’s consent to the increase of the rate of the royalties, as stated in E above, is contingent on implementation of the Government of Israel’s decision, as stated in this Section. The agreement further provides that if legislation is enacted that changes the specific fiscal policy in connection with profits or royalties deriving from mining of quarries from the Dead Sea, the Company’s consent will not apply regarding an increase in the rate of royalties above on the surplus quantities referred to above, commencing from the date the additional tax is to be collected as stated in the legislation and the matter will be returned to arbitration. If such a situation does occur, the matter of the royalties’ rate on the surplus quantity stated in E above, will be transferred to arbitration and each side will be permitted to raise any contention it could have raised immediately preceding signing of the above-mentioned agreement.
(5) Sheshenski Committee conclusions
On June 17, 2013, the former Minister of Finance, Mr. Yair Lapid, gave notice regarding an establishment of a public committee, headed by Prof. Eytan Sheshinski, for examination of the policy with respect to the share of the State received for use by private entities, including the Company, of national natural resources. Pursuant to the appointment certificate the committee was granted, the committee is required, inter alia, to examine the royalties' policy with a broad perspective, while making reference to the impacts on the present agreements between the various parties engaged in these matters and the State of Israel. In addition, the committee is required to examine application of the principles formulated in connection with the Dead Sea quarries, taking into account, among other things, Government Decision No. 4060 and the detailed agreement signed with DSW in July 2012 as a result of this decision, and while addressing the public debate held regarding the possibility of merging the Company with a foreign company.
Pursuant to the Group’s position, as it was presented to the committee, there is no room for imposing any type of additional royalties on the Group.
On October 20, 2014, the Sheshinski Committee published the final conclusions "regarding the government take to be received from use of national resources by private bodies". The highlights of the Committee's Recommendations, , are as follows:
The mix of taxes on natural resources in Israel will include three taxation elements: royalties, natural resources tax and corporate tax.
The royalty rate for all minerals will be 5% for any extracted amount (currently, the royalty rate for potash is 5% on annual sales of up to 1.5 million tons, and 10% for any sales above that amount. The royalty rate for bromine is 5% and the royalty rate for phosphates is 2%); the calculation of the royalties for phosphates which is made in accordance with the Mines Ordinance, will be changed such that the recognition of refining and processing costs of the mined raw material will be in accordance with normative costs to be established in the law.
A new natural resources tax will be imposed. The following are the main aspects of the proposed tax:
The natural resources tax base will be the amount from which the natural resources tax will be collected every year.
The tax base will be the Company’s operating profit, according to accounting profit and loss statements, after certain adjustments less financing expenses in the rate of 5% of the Company’s working capital, and less an amount that will represent the yield on the remaining depreciated cost of the fixed assets used in the production and sale of the mineral (hereafter – “the yield on the depreciated cost”).
A progressive tax will be imposed on the tax base, as described above, at a rate that will be determined in accordance with the level of the yield on the remaining depreciated cost of the fixed property used in the production and sale of the mineral in that year. The first tax bracket for the natural resource tax will be 25% on the yield on the depreciated cost between 14% 20% and the second tax bracket will be 42% on the yield on the depreciated cost above 20%.
For the years in which the natural resources tax base is negative, the negative amount will be carried over from year to year, and will serve as a tax shield in the following tax year.
The limits of the natural resources tax – the natural resources tax will only be imposed on the profits derived from the production and the sale of minerals, such as potash and phosphates, and not on profits derived from downstream industrial activity. In addition, the natural resources tax will be calculated separately for each mineral. However, to the extent that there is a synergy between the different resources, and that a particular mineral produces a benefit in the production of a different mineral, the Committee believes that such benefit should be reflected in the calculation of the natural resources tax.
Consequently, the benefit produced by the magnesium plant for the potash plant in the production of sylvinite will be recognized as an expense for the potash plant, and accordingly will be recognized as income for the magnesium plant. Clear rules will be established for this purpose with regard to the calculation of the said savings, with respect to potash and other minerals, if applicable.
A mechanism will be established for determining the market price for natural resources transactions between related parties in Israel, as well as a mechanism for calculating the manner in which expenses will be attributed to the production and sale of the natural resource and to the downstream activities.
Regarding bromine, a natural resources tax will be imposed in the same way it is imposed on other natural resources, other than that the transfer price will be calculated separately for transfers to related parties in Israel, and separately for sales to related parties abroad. The transfer price for elemental bromine to related parties will be the higher of the following:
The actual price – the actual sale price for elemental bromine to related parties in Israel or abroad, whichever is relevant;
The price to a third party – the weighted average of the sale price to unrelated parties, which are manufacturers of bromine compounds, while adjusting the shipping and marketing costs, as needed;
A normative price – the normative price will be linked to the bromine compounds index and determined based on the Netback method, relying on the data from the five previous years for the Bromine Compounds Company in Israel or abroad, as relevant. In each of those years, all bromine compounds production costs will be deducted from the sales turnover for the Bromine Composite Company, except for the cost of purchasing the raw bromine. From the operating profit, before the deduction of the cost of purchasing the raw bromine, will also be deducted of a normative profit in the rate of 12% of the sales turnover of the Bromine Compounds Company in Israel or abroad, as the case may be. The amount reached through this calculation, for each of the years that is examined, will be divided by the amount of the bromine that the Bromine Compounds Company has purchased in each of the years, and will be weighted into the stated normative price. The mechanism will be examined every 5 years and will be updated if necessary.
The Encouragement of Capital Investments Law – the law will be amended, to clarify that with regard to any tax benefits pursuant to that law, the definition of a “mineral extraction plant” will include all the plant’s activity through the production of the first sellable natural resources, such as potash, bromine and magnesium. Therefore, any activity in the production of the mineral will be subjected to the excess profit tax, and will not be entitled to tax benefits pursuant to the Encouragement of Capital Investments Law. Downstream product activity such as bromine compounds and fertilizers will not be a part of the base used for calculating the excess profits tax and will not be excluded from the application of the Law.
In addition to the Committee's recommendation above, corporate tax will apply at the rate of 26.5%.
The government's take to be received from minerals when a natural resources tax is imposed is expected according to the Committee to range from 46%-55%.
The Committee’s Recommendations, if they are enacted into legislation, will apply to DSW, as of January 1, 2017.
The end of the Dead Sea concession period – a designated team will be established, to be appointed by the Accountant General at the Ministry of Finance, which will work to establish certainty regarding the manner in which the value of the DSW assets will be calculated at the end of the concession period, in accordance with the Deed of Concession. This team will submit its recommendations to the Minister of Finance by the end of the first quarter of 2015. Additionally, the Minister of Finance will appoint a second team which will submit recommendations regarding the government actions that are needed in anticipation of the end of the concession period and will examine the manner in which the concession will be granted in the future. This team will submit its recommendations by the end of the first quarter of 2016.
It should be noted, that attached to the Committee’s Recommendation’s, were, among others, a minority statement of the Accountant General at the Ministry of Finance as well as a reservation from the Committee’s Recommendations of the representatives of the Ministry of Economy and the Ministry of National Infrastructures, Energy and Water Resources.
On November 10, 2014, the Ministry of Finance issued a press released according to which on November 10, 2014, the Social-Economic Cabinet unanimously approved the recommendations of the Sheshinski Committee. According to the press release, the final recommendations will be drafted in contemplation of their legislation and will be brought for the approval of the Knesset. There is no certainty that the Knesset will approve the Committee's recommendations in their current wording.
In August 2014, after publication of the interim conclusions of the Sheshinski Committee, the Company's Board of Directors examined the economic viability of continuation and expansion of the production of certain products, including potash, metal magnesium, bromine compounds and downstream phosphate products. In light of the Committee's final recommendations, and their approval by the Social-Economic Cabinet, as stated, the Company's Board of Directors made the following decisions, further to decisions it made in August 2014 – briefly:
Cancellation and reconsideration of investments – to cancel the Company investments in Israel, mainly increase of the production capacity of potash, which had been approved as part the long term plan, in the amount of about $750 million, and to reconsider whether investments in the amount of about $1 billion are worthwhile;
Bromine Compounds
– to formulate and implement an efficiency plan designed to significantly improve the profitability of Bromine Compounds Company, from the Industrial Products segment. This plan is required due to the continuing erosion of profits on bromine compounds as a result of a decline in demand for flame retardants, slow structural growth in the world market, a drop in prices and strengthening of the shekel, compounded by the significant recent developments related to the partial arbitration decision with respect to royalties on sales of downstream products, including bromine compounds and the possibility that the Sheshinski Committee’s final recommendations will be adopted and enacted into legislation. Company management formulated a plan, as stated, and has already commenced its implementation. The plan includes reduction of labor and other costs in the Bromine Compounds Company. There is no certainty that such plan will successfully achieve its goals, as a result of various factors, including the situation of the market, competition, regulation, labor relations and/or any of the risk factors characterizing the Company's activities.
The Magnesium Plant
– to make preparations for closure of our magnesium plant at the Dead Sea, commencing January 1, 2017, to the extent the discussions with the State of Israel regarding the tax and royalties issues will not support the continuation of the activities of the magnesium plant. Company management was instructed to ensure all existing and future customer orders and commitments in order to avoid any interruptions until the final closure of the plant, to the extent it is ultimately closed down. The main economic justification for continuation of the activities of the magnesium plant at the Dead Sea stems from the plant’s synergies with our other facilities in Sodom, which provide it with, and receive from it, raw materials (the “Synergies”). The net value of the Synergies has declined due to the increase in the tax burden on production from natural resources in Israel that have already been implemented, and will further decline if the Sheshinski Committee’s final recommendations are enacted into law. As a result of the increased tax burden, as noted above, the Company stopped all the investments in the magnesium plant (that are not investments required by law). Nonetheless, ICL's management intends to re examine the decision of the Board of the Directors regarding the continued existence of the magnesium plant, subject to the manner in which the government, by means of the Tax on
Note 23 – Commitments, Concessions and Contingent Liabilities (cont'd)
Natural Resources Law memorandum, implements the decision of the Social-Economic Cabinet providing that:
“
a special mechanism is to be determined that will ensure that Committee
’
s recommendations will not directly or indirectly impact the feasibility of the continued existence of the magnesium plant
”
. To the extent the actual implementation of the Cabinet's decision does not adversely impact, as a practical matter, the contribution and value of the synergy stemming from the activities of the magnesium plant, Company management will consider recommending to the Board of Directors to continue the existence of the magnesium plant even after January 2017. The sales of magnesium in 2014 amounted to about $148 million, the magnesium company incurred an operating loss in this year of about $9 million, the net property, plant and equipment of the magnesium company as at December 31, 2014 was about $36 million and the depreciation expenses in 2014 amounted to about $7 million.
(6) The subsidiary in Spain (IBP) has two potash production centers in Spain in the towns of Suria and Sallent. As a by-product of the potash production process, salt is produced and heaps up in piles, most of which, at the present time, is not usable. To operate in Spain, an environmental license and an urban license are required.
Regarding the Sallent site, in October 2013, the regional court issued a judgment disqualifying the Company's environmental mining license (contending that there were defects in provision of the license by the government), and in February 2014, the urban license (contending that the license does not comply with the required conditions for piling up salt on the site). The court's determination is not final, and the Company and the government of Catalonia have filed an appeal with the Spanish Supreme Court.
The Company estimates that the legal process will last more than one year, such that there will be no significant effect on the Spanish mining operations since the Company expects to close the Vilafruns mine at Sallent prior to the end of 2016 as part of the efficiency plan. In addition, an agreement was made with the local planning board (CUCC), which permits the continued piling up of salt at the current production level up to June 30, 2017. This agreement requires approval by the Spanish Regional Court. If the Spanish Supreme Court does not accept the appeal described above, the Company will be required to enter into an administrative proceeding in order to obtain an environmental license that complies with the new environmental protection regulations in Spain (autoritzacio substantive).
Regarding the Suria site, in April 2014, after a favorable survey was received from the Environmental Protection Authority in Catalonia, the Company received an environmental license that complies with the new environmental protection regulations in Spain (autoritzacio substantive), this being after the Company first received the urban license. Prior to receipt of the said licenses, two legal proceedings were held against the government of Catalonia, relating to issuance of the urban and environmental licenses for the efficiency plan at Iberpotash. As part of these proceedings, it was alleged that the project work requires a significant change in the environmental license and that the government must require the Company to conduct an environmental impact survey. Accordingly, the plaintiffs are requesting termination of the project work. In the Company's estimation, upon renewal of the environmental license, continuation of the legal proceeding will become superfluous.
(7) On August 29, 2013, a request for certification of a claim as a class action against the Company, Israel Corporation Ltd., Potashcorp Cooperative Agricultural Society Ltd., the members of the Company’s Board of Directors and its CEO, was filed in the District Court in Tel-Aviv, on the grounds of a misleading detail, deception and non-disclosure of a material detail in the Company’s reports, this allegedly being in violation of the provisions of the Securities Law and the general laws in Israel. The aggregate amount of the damage claimed is $0.79 billion (NIS 2.75 billion) or $0.95 billion (NIS 3.28 billion) (the amount of the claim depends on the share price used for calculating the alleged damages). In February 2014, a response to the request was submitted. In November 2014, a hearing on the motion to certify a class action was held. The plaintiffs submitted their summation and the defendants will submit their summations in the case in the next several months.
In the Company’s estimation, based on the position of its legal advisors, the chances that the allegations
against the Company will be dismissed exceed the chances that the allegations will be accepted. Accordingly, no provision was included in the financial statements.
(8) On September 21, 2014, we received a petition submitted to the District Court in Israel in respect of a purported class action against our subsidiary, Dead Sea Works. According to the petition, the plaintiff is a farmer who has bought and currently buys potash in Israel, which is produced by Dead Sea Works, for fertilization purposes and seeks to represent a group of class members that would include all purchasers of potash or products
produced with potash in Israel from 2006, when potash prices were deregulated, through the date of the action. The plaintiff alleges that Dead Sea Works charged an excessive price for potash, contrary to the Israeli anti trust laws, and seeks damages in the amount of approximately NIS 96.4 million (approximately $24.8 million). In February 2015, DSW filed its response to the request to certify the claim as a class action. The total sales of potash in Israel in 2014 to the customers, which to the best of our understanding is the group described above, constitutes less than 1% of our total sales in that year. In the estimation of the Company, based on its legal advisors, the chances that the claim will be accepted are less than 50% and, accordingly, no provision was recorded in the financial statements.
(9) Haifa Chemicals acquires potash from DSW as part of its manufacturing inputs. Pursuant to the agreement between DSW and Haifa Chemicals, the price for which Haifa Chemicals was charged was based on the average price, FOB, of DSW for its two largest customers in the preceding quarter. In 2008, an agreement between Haifa Chemicals and Dead Sea Works was cancelled and the parties did not succeed in reaching a new agreement. Haifa Chemicals believed that the price Dead Sea Works demanded in exchange for potash was unfair, based on the contention that it was unable to operate at that price. In 2009, Haifa Chemicals notified its employees of a shutdown of the production lines at its factory until purchase of potash could be resumed at prices it deemed acceptable. At the same time, Haifa Chemicals contacted the Israeli Minister of Finance and the Israeli Minister of Industry, Commerce and Labor and requested that they use their authority to subject potash prices to supervision. The parties agreed in principle to appoint an arbitrator to set the price of potash. The arbitration began in May 2009 and in March 2014, the arbitration decision was issued, which included a price formula on the basis of which the selling price of potash between Dead Sea Works and Haifa Chemicals will be determined for a period of ten years from the date of the decision and with respect to the period from the commencement of arbitration.
The price formula provides that the selling price during a quarter will be based on a price equal to the lower of the weighted average of the lowest three FOB selling prices of potash sold by Dead Sea Works in the prior quarter and the average of the two lowest FOB selling prices of potash sold by Dead Sea Works to large buyers (foreign buyers who purchase 150,000 or more tons per year) in the prior quarter, less certain expenses and a discount of 2%. The possibility exists that under certain circumstances, the base price will be based on the production cost plus a certain margin. This adjusted price will apply to a quantity of 270 thousand tons of potash, while the base price would continue to apply to the remainder of the potash. In our estimation, based on estimates in accordance with the arbitration decision and taking into account other claims Haifa Chemicals has raised against us, the Company will not receive and will not pay significant amounts in respect of the prior period (1999-2014). Accordingly, no provisions or income receivable have been included in the financial statements.
(10) In addition, to the contingencies referred to in the above sections, various claims are pending against the Group (including lawsuits). In respect of claims for an amount of up to about $22 million as of December 31, 2014, the Group has recorded a provision as at that date in the amount of about $2 million. In addition, part of the above claims is covered by insurance. In the estimation of Company Management, based on opinions of its legal advisors, the provision recognized is sufficient to cover the exposure in respect of the above mentioned claims.
A. Composition:
|
As at December 31, 2014
|
As at December 31, 2013
|
|||||||||||||||
|
Authorized
|
Issued and paid
|
Authorized
|
Issued and paid
|
|||||||||||||
|
Number of Ordinary shares of NIS 1 par value
|
1,484,999,999 | 1,295,943,056 | 1,484,999,999 | 1,295,015,589 | ||||||||||||
|
Number of Special State share of NIS 1 par value
|
1 | 1 | 1 | 1 | ||||||||||||
The reconciliation of the number of shares outstanding at the beginning and at the end of the period are as follows:
|
Period
|
Number of
Outstanding Shares
|
|||
|
As at January 1, 2013
|
1,294,703,031 | |||
|
Options exercised during the year
|
312,558 | |||
|
As at December 31, 2013
|
1,295,015,589 | |||
|
Private issuance of restricted shares
|
927,467 | |||
|
As at December 31, 2014
|
1,295,943,056 | |||
As of December 31, 2014, the number of shares reserved for issuance under the Company’s option plans was 16,353,473.
The shares of ICL are listed for trade on the Tel-Aviv Stock Exchange and the New York Stock Exchange. The closing price per share on the Tel-Aviv Stock Exchange on December 31, 2014 was NIS 28.28 and on the New York Stock Exchange was $7.25.
B. Rights conferred by the shares
The ordinary shares confer upon their holders voting rights (including appointment of directors by a simple majority at shareholders’ meetings), the right to participate in shareholders’ meetings, the right to receive profits and the right to a share in excess assets upon liquidation of ICL.
The Special State of Israel Share, held by the State of Israel in order to safeguard matters of vital interest of the State of Israel , confers upon it special rights to make decisions among other things on the following matters:
|
|
·
|
Sale or transfer of Company assets, which are “vital” to the State of Israel not in the ordinary course of business.
|
|
|
·
|
Voluntary liquidation, change or reorganization of the organizational structure of ICL or merger (excluding mergers of entities controlled by ICL that would not impair the rights or power of the Government, as holder of the Special State Share).
|
|
|
·
|
Any acquisition or holding of 14% or more of the issued share capital of ICL.
|
|
|
·
|
The acquisition or holding of 25% or more of the issued share capital of ICL (including augmentation of an existing holding up to 25%), even if there was previously an understanding regarding a holding of less than 25%.
|
Any percentage of holding of the Company’s shares, which confers upon its holder the right, ability or actual possibility to appoint, directly or indirectly, such number of the Company’s directors equal to half or more of the Company’s directors actually appointed.
C. Share-based payments to employees
1. On January 7, 2010, ICL’s Board of Directors approved an issuance of 10,930,500 non marketable options for no consideration to 318 ICL executives and senior employees in Israel and overseas. The issuance included a material private placement of 1,100,000 options to former CEO of the Company and 800,000 options to the Company’s Chairman of the Board. On February 15, 2010, an Extraordinary General Meeting of ICL’s shareholders approved the issuance to the Chairman of the Board. The options from the 2010 plan vested in three equal portions, as follows: one third at the end of 12 months from the date of the Board’s approval; one third at the end of 24 months from the date of the Board’s approval; and one third at the end of 36 months from the date of the Board’s approval. As at December 31, 2014, all the options had expired.
2. On November 26, 2012, the Company’s Board of Directors approved an issuance of up to 12,000,000 non-marketable options for no consideration to 416 ICL officers and senior employees in Israel and overseas. On December 27, 2012, 11,999,400 options were issued. The issuance included a material private placement of 1,190,000 options to the Company’s CEO. This plan includes a “cap” for the value of the shares where if as at the exercise date the closing price of a Company share is higher than twice the exercise price (“the Share Value Cap”), the number of exercised shares will be reduced so that the product of the exercised shares actually issued to the offeree multiplied by the share closing price will equal the product of the number of exercised options multiplied by the Share Value Cap. The options may be exercised in three equal portions on November 26, 2013, 2014, and 2015. The expiration date of the options for the first and second portions is at the end of 48 months from the approval of the Board and the expiration date of the options for the third portion is at the end of 60 months from the issuance date.
3. Following the approval of our Board of Directors on August 6, 2014, we issued, under the 2014 Equity Compensation Plan, 4,360,073 non marketable options, for no consideration, exercisable for up to 4,360,073 of our
Note 24 – Equity (cont'd)
ordinary shares, and 1,007,651 restricted shares, to approximately 450 of our officers and senior employees ("the 2014 Plan"). The issuance includes a significant private placement of 367,294 options and 85,907 restricted shares to our Chief Executive Officer, which was approved by the General Meeting of our shareholders. This grant format of the options plan includes a “cap” for the value of a share where if, as at the exercise date, the closing price of an ordinary share is higher than twice the exercise price (the “Share Value Cap”), the number of the exercised shares will be adjusted so that the product of the exercised shares actually issued to the offeree multiplied by the share closing price will equal the product of the number of exercised options multiplied by the Share Value Cap.
The options and restricted shares will vest in three equal tranches: one third at the end of 24 months from December 1, 2014, one third at the end of 36 months from December 1, 2014 and one third at the end of 48 months from December 1, 2014. The expiration date of the options in the first tranche is at the end of 48 months from December 1, 2014, the expiration date of the options in the second tranche is at the end of 60 months from December 1, 2014 and the expiration date of the options in the third tranche is at the end of 72 months from December 1, 2014.
4. Subsequent to the date of the financial report, on January 25 and 26, 2015, our Remuneration and Human Resources Committee and the Board of Directors, respectively, and on February 26, 2015 the General Meeting of our shareholders, approved issuance of 99,858 restricted shares to Company directors (excluding our Chief Executive Officer, Mr. Stephan Borgas), for no consideration, under the 2014 remuneration and share plan. The restricted shares will vest in three tranches, subject to the directors continuing to serve in their positions on the vesting date, as follows: (1) 50% will vest on August 28, 2015; (2) 25% will vest at the end of two years from the date of the General Meeting, on February 26, 2017, and (3) 25% at the end of three years from the date of the General Meeting, on February 26, 2018.
Upon exercise, each option may be converted into one ordinary share of NIS 1 par value of the Company. The ordinary shares issued as a result of exercise of the options have the same rights as the Company’s ordinary shares, immediately upon their issuance. The options issued to the employees in Israel are covered by the provisions of Section 102 of the Israeli Income Tax Ordinance (New Version) and the regulations promulgated thereunder. The Company elected to perform the issuance through a trustee, under the Capital Gains Track. The exercise price is linked to the CPI that is known as of the date of payment, which is the exercise date. In a case of distribution of a dividend by the Company, the exercise price is reduced on the “ex dividend” date, by the amount of the dividend per share (gross), based on the amount thereof in NIS on the effective date. The options are not marketable and are not transferable.
The fair value of the options granted under the 2010 plan as stated above was estimated on the basis of the Black & Scholes model for the pricing of options. The fair value of the option issued in the said 2012 and 2014 plan was valued on the basis of a binomial model for valuing options. The parameters used in applying the models are as follows:
|
2010 Plan
|
2012 Plan
|
2014 Plan
|
||||||||||
|
Share price (in $)
|
14.3 | 12.1 | 8.2 | |||||||||
|
CPI-linked exercise price (in $)
|
14.3 | 12.1 | 8.4 | |||||||||
|
Expected volatility:
|
||||||||||||
|
First tranche
|
54.98 | % | 36.70 | % | 29.40 | % | ||||||
|
Second tranche
|
54.98 | % | 36.70 | % | 31.20 | % | ||||||
|
Third tranche
|
48.45 | % | 44.20 | % | 40.80 | % | ||||||
|
Expected life of options (in years):
|
||||||||||||
|
First tranche
|
2.5 | 4.0 | 4.3 | |||||||||
|
Second tranche
|
2.5 | 4.0 | 5.3 | |||||||||
|
Third tranche
|
3.5 | 5.0 | 6.3 | |||||||||
|
Risk-free interest rate:
|
||||||||||||
|
First tranche
|
0.59 | % | 0.22 | % | (0.17 | )% | ||||||
|
Second tranche
|
0.59 | % | 0.22 | % | 0.05 | % | ||||||
|
Third tranche
|
1.29 | % | 0.54 | % | 0.24 | % | ||||||
|
Fair value (in $ millions)
|
54.3 | 37.7 | 8.4 | |||||||||
|
Weighted average grant date fair value per option (in $)
|
5.0 | 3.1 | 1.9 | |||||||||
The expected volatility was determined on the basis of the historical volatility in the Company’s share prices. For every tranche shown in the above table, the vesting period is different.Since the expected life for each tranche is different, the Company used different expected volatility and risk-free interest rates for each tranche.
The expected life of the options was determined on the basis of Management’s estimate of the period the employees will hold the options, taking into consideration their position with the Company and the Company’s past experience regarding the turnover of employees.
The risk free interest rate was determined on the basis of the yield to maturity of shekel denominated Israeli Government debentures, with a remaining life equal to the anticipated life of the option.
The fair value of the restricted shares granted pursuant to approval of the Board of Directors on August 6, 2014 is approximately $8.4 million as at the grant date. The value of the restricted shares is determined according to the closing price on the TASE on the most recent trading day preceding the date of the approval of the Board of Directors (with the exception of the restricted shares issued to our CEO, the value of which was determined according to the closing price on the TASE on the most recent trading date preceding the date of the approval of the general meeting, which is the grant date).
The fair value on the grant date of the said restricted shares that were granted to directors pursuant to approval of the general shareholders meeting on February 26, 2015, is approximately $0.7 million. The value of the restricted shares offered to offerees is determined according to the closing price on the TASE on the most recent trading day preceding the date of the approval of the General Meeting of the shareholders, which is the grant date.
The cost of the benefit embedded in the options and shares from the 2010, 2012 and 2014 plans is recognized in the statement of income over the vesting period of each portion. Accordingly, in 2014, 2013 and 2012, the Company recorded expenses of about $12 million, $21.8 million and about $8.7 million, respectively.
The movement in the options during 2014 and 2013 are as follows:
|
Number of options
2010 Plan
|
Number of options
2012 Plan
|
Number of options
2014 Plan
|
||||||||||
|
Balance as at January 1, 2013
|
10,844,167 | 11,999,400 | — | |||||||||
|
Movement in 2013:
|
||||||||||||
|
Exercised during the year
|
(6,633,574 | ) | — | — | ||||||||
|
Forfeited during the year
|
(463,338 | ) | (4,000 | ) | — | |||||||
|
Total options outstanding as at December 31, 2013
|
3,747,255 | 11,995,400 | — | |||||||||
|
Movement in 2014:
|
||||||||||||
|
Allocated during the year
|
— | — | 4,360,073 | |||||||||
|
Expired during the period
|
(3,747,255 | ) | — | — | ||||||||
|
Forfeited during the year
|
— | (2,000 | ) | — | ||||||||
|
Total options outstanding as at December 31, 2014
|
— | 11,993,400 | 4,360,073 | |||||||||
The exercise price for options outstanding at the beginning and end of each period are as follows:
|
December 31
2014
|
December 31
2013
|
December 31
2012
|
||||||||||
|
2010 Plan US$
|
N/A | 13.16 | 12.57 | |||||||||
|
2012 Plan US$
|
10.85 | 12.85 | 12.26 | |||||||||
|
2014 Plan US$
|
7.26 | N/A | N/A | |||||||||
The number of options vested at the end of each period and the weighted average exercise price for these options are as follows:
|
December 31
2014
|
December 31
2013
|
December 31
2012
|
||||||||||
|
Number of options exercisable
|
7,995,600 | 7,745,722 | 7,229,445 | |||||||||
|
Weighted average exercise price NIS
|
42.18 | 45.11 | 46.92 | |||||||||
|
Weighted average exercise price US$
|
10.85 | 13.00 | 12.57 | |||||||||
The range of exercise prices for the options outstanding at the end of each period are as follows:
|
December 31
2014
|
December 31
2013
|
December 31
2012
|
||||||||||
|
Range of exercise price in NIS
|
28.24-42.18 | 44.59-45.66 | 45.77-46.92 | |||||||||
|
Range of exercise price in US$
|
7.26-10.85 | 12.85-13.16 | 12.26-12.57 | |||||||||
The average remaining contractual life for the outstanding vested options at the end of each period are as follows:
|
December 31
2014
|
December 31
2013
|
December 31
2012
|
||||||||||
|
Average remaining contractual life for the outstanding vested options at the end of each period
|
1.91 | 1.51 | — | |||||||||
D. Dividends
|
Date of decision of the Board of Directors to distribute the dividend
|
Actual date of
distribution of the dividend
|
Gross amount of the dividend distributed
(in millions of $)
|
Net amount of the distribution (net of the subsidiary’s share)
(in millions of $)
|
Amount of the dividend per share
|
|||||||||
|
March 26, 2012
|
April 30, 2012
|
260 | 259.5 | $0.20 | |||||||||
|
May 22, 2012
|
June 26, 2012
|
200 | 199.7 | $0.16 | |||||||||
|
August 14, 2012
|
September 12, 2012
|
285 | 284.5 | $0.22 | |||||||||
|
November 20, 2012
|
December 19, 2012
|
276 | 275.5 | $0.22 | |||||||||
|
March 12, 2013
|
April 25, 2013
|
147 | 146.7 | $0.12 | |||||||||
|
May 12, 2013
|
June 20, 2013
|
213 | 212.6 | $0.17 | |||||||||
|
August 6, 2013
|
September 16, 2013
|
221 | 220.6 | $0.17 | |||||||||
|
November 12, 2013
|
December 18, 2013
|
54.5 | 54.4 | $0.04 | |||||||||
|
February 11, 2014
|
March 26, 2014
|
500 | 499.1 | $0.39 | |||||||||
|
March 18, 2014
|
May 27, 2014
|
83 | 82.9 | $0.07 | |||||||||
|
May 14, 2014
|
June 25, 2014
|
91.5 | 91.3 | $0.07 | |||||||||
|
August 6, 2014
|
September 17, 2014
|
47 | 47 | $0.04 | |||||||||
|
November 11, 2014
|
December 17, 2014
|
125 | 125 | $0.10 | |||||||||
Subsequent to the balance sheet date, on March 19, 2015, the Company’s Board of Directors decided to distribute a dividend in the amount of $59.5 million, about $0.05 per share.. The dividend will be distributed on 29 April, 2015.
E. Cumulative translation adjustment
The translation reserve includes all translation differences arising from translation of financial statements of foreign operations.
F. Capital reserves
The capital reserves include expenses for share based compensation to employees against a corresponding increase in equity (see C. above).
G. Reserve for cash flows hedge
As at December 31, 2014, the capital reserve for hedging cash flows includes the effective part of the change in the fair value of instruments used to hedge the exposure to changes in the cash flows of construction of the new cogeneration power plant project in Sodom, Israel, in connection with changes in the rates of exchange of the dollar against the euro.
H. Treasury shares
1) On August 4, 2014, the Company received 2,216,131 ordinary shares of NIS 1 par value of the Company, for no consideration, which were held by a wholly controlled subsidiary of the Company.
2) On September 3, 2008, the Company’s Board of Directors decided to authorize the Company, to acquire from time to time, up to June 30, 2009, ordinary shares of the Company up to 5% of the Company’s issued and paid up share capital – out of the Company’s distributable earnings in accordance with the Israeli Companies Law. In total, 22,373,500 shares were acquired by the Company under this purchase plan, constituting approximately 1.74% of the Company’s issued and paid up share capital, for a total consideration of approximately $258 million.
3) In determining the amount of retained earnings available for distribution as a dividend pursuant to the Israeli Companies Law, a deduction must be made from the balance of the retained earnings the amount of self acquisitions (that are presented separately in the “treasury shares” category in the equity section).
The Group has undertaken various obligations in respect of loans and credit received from non Israeli banks, including a negative pledge whereby the Group, committed, among other things, in favor of the lenders, to limit guarantees and indemnities to third parties (other than the guarantees in respect to subsidiaries) up to an agreed amount for $550 million. The Group has also undertaken to grant loans only to subsidiaries and to associated companies in which it holds at least 25% of the voting rights – not more than stipulated by the agreement with the banks. ICL has further committed not to grant any credit, other than in the ordinary course of business, and not to register any charges, including rights of lien, except those defined in the agreement as “liens permitted to be registered” on its existing and future assets and income. For details with regards to the covenants in respect of these loans, see Note 17.
|
For the year ended December 31
|
||||||||||||
|
2014
|
2013
|
2012
|
||||||||||
|
US$ thousands
|
||||||||||||
|
Sales
|
||||||||||||
|
Sales
|
6,110,710 | 6,271,542 | 6,471,433 | |||||||||
|
Cost of sales (1)
|
||||||||||||
|
Materials and spare parts
|
1,509,434 | 1,485,149 | 1,520,414 | |||||||||
|
Power and energy
|
348,282 | 380,807 | 404,373 | |||||||||
|
Labor and related expenses
|
823,066 | 833,256 | 766,501 | |||||||||
|
Subcontracted work
|
330,204 | 325,421 | 313,593 | |||||||||
|
Depreciation and amortization
|
304,141 | 294,759 | 281,566 | |||||||||
|
Other production expenses
|
323,676 | 332,754 | 330,962 | |||||||||
|
Logistics and port expenses
|
74,099 | 68,224 | 65,833 | |||||||||
| 3,712,902 | 3,720,370 | 3,683,242 | ||||||||||
|
Decrease (increase) in inventories of finished products and work in progress
|
201,671 | 141,202 | 76,993 | |||||||||
| 3,914,573 | 3,861,572 | 3,760,235 | ||||||||||
|
(1) Net of amounts capitalized to property, plant and equipment under construction
|
12,035 | 16,535 | 20,970 | |||||||||
Note 26 – Details of Income Statement Items (cont'd)
|
For the year ended December 31
|
||||||||||||
|
2014
|
2013
|
2012
|
||||||||||
|
US$ thousands
|
||||||||||||
|
Research and development expenses, net
|
||||||||||||
|
Amount of expenses
|
86,943 | 82,910 | 74,303 | |||||||||
|
Less – grants and participations
|
— | 40 | 204 | |||||||||
| 86,943 | 82,870 | 74,099 | ||||||||||
|
Selling, transport and marketing expenses
|
||||||||||||
|
Transport and insurance
|
528,276 | 546,517 | 510,964 | |||||||||
|
Salaries and related expenses
|
159,959 | 151,278 | 143,944 | |||||||||
|
Agents’ commissions
|
26,945 | 27,193 | 26,174 | |||||||||
|
Other
|
124,027 | 125,337 | 116,209 | |||||||||
| 839,207 | 850,325 | 797,291 | ||||||||||
|
General and administrative expenses
|
||||||||||||
|
Salaries and related expenses
|
154,991 | 162,894 | 141,105 | |||||||||
|
Buildings maintenance
|
17,416 | 16,787 | 14,579 | |||||||||
|
Legal advice
|
11,443 | 12,748 | 10,280 | |||||||||
|
Other*
|
121,676 | 89,062 | 82,818 | |||||||||
| 305,526 | 281,491 | 248,782 | ||||||||||
|
* Including movement in provision for doubtful debts
|
(484 | ) | 112 | 1,410 | ||||||||
|
Financing income and expenses
|
||||||||||||
|
Financing income recorded in the income statements:
|
||||||||||||
|
Interest income from bank deposits
|
1,974 | 8,607 | 12,197 | |||||||||
|
Financing income recorded in relation to employee benefits
|
3,366 | — | — | |||||||||
|
Net change in fair value of derivative financial instruments
|
— | 122,941 | 8,504 | |||||||||
|
Net gain from changes in exchange rates
|
116,955 | — | — | |||||||||
| 122,295 | 131,548 | 20,701 | ||||||||||
|
Financing expenses recorded in the income statements:
|
||||||||||||
|
Interest expenses to banks and others
|
102,409 | 52,116 | 42,642 | |||||||||
|
Financing expenses in relation to employee benefits
|
— | 43,816 | 31,604 | |||||||||
|
Bank commissions
|
2,333 | 2,654 | 2,755 | |||||||||
|
Net change in fair value of derivative financial instruments
|
189,174 | — | — | |||||||||
|
Net loss from changes in exchange rates
|
— | 63,439 | 8,089 | |||||||||
|
Financing expenses
|
293,916 | 162,025 | 85,090 | |||||||||
|
Net of borrowing costs capitalized
|
15,673 | 3,622 | 3,495 | |||||||||
| 278,243 | 158,403 | 81,595 | ||||||||||
| Net financing expenses recorded in the income statements | 155,948 | 26,855 | 60,894 | |||||||||
|
For the year ended December 31
|
||||||||||||
|
2014
|
2013
|
2012
|
||||||||||
|
US$ thousands
|
||||||||||||
|
Other income and expenses
|
||||||||||||
|
Gain on increase in rate of holdings in investee company
|
35,740 | 1,827 | 1,945 | |||||||||
|
Capital gains from sale of fixed assets, net
|
5,746 | 2,687 | — | |||||||||
|
VAT refund and deductions
|
— | — | 15,267 | |||||||||
|
Past service cost
|
5,618 | 8,611 | — | |||||||||
|
Other
|
5,441 | 3,151 | 6,479 | |||||||||
|
Other income recorded in the income statements
|
52,545 | 16,276 | 23,691 | |||||||||
|
Arbitrtaion expenses in respect of prior years' royalties (1)
|
149,326 | — | — | |||||||||
|
Expenses in respect of early retirement (2)
|
3,677 | 60,199 | 55,332 | |||||||||
|
Other expenses in connection with update of the Company's strategy and various internal processes
|
10,016 | 14,103 | — | |||||||||
|
Provision for treatment of waste
|
7,169 | 25,000 | — | |||||||||
|
Past service cost
|
— | — | 2,009 | |||||||||
|
Impairment of assets in companies in the U.S. and Europe
|
71,234 | 10,658 | — | |||||||||
|
Other
|
17,914 | 234 | 3,744 | |||||||||
|
Other expenses recorded in the income statements
|
259,336 | 110,194 | 61,085 | |||||||||
|
(1)
|
See Note 23.
|
|
(2)
|
See Note 21.
|
A. General
The Group has extensive international operations wherein it is exposed to credit, liquidity and market risks (including currency, interest and other price risks). In order to reduce the exposure to these risks, the Group holds financial derivative instruments, (including forward transactions, SWAP transactions, and options) for purposes of economic (non accounting) hedging of foreign currency risks, commodity price risks, and interest risks. Furthermore, the Group holds derivative financial instruments to hedge the exposure and changes in the cash flows.
The transactions in derivatives are executed with large Israeli and non-Israeli financial institutions, and therefore Group management believes the credit risk in respect thereof is low.
This Note presents information about the Group’s exposure to each of the above risks, and the Group’s objectives, policies and processes for measuring and managing risk.
The Group companies monitor on a regular basis the extent of the exposures and the hedges in respect thereof. The hedging policies of all the types of exposures are discussed by the Company’s Board of Directors in the framework of the annual budget. The Finance Committee of the Company’s Board of Directors receives a report every quarter in the framework of the discussion of the quarterly results, as a means of controlling implementation of the policies and for purposes of updating the policies, where necessary. The Group’s managment implements the policies that are determined, while taking into consideration the actual and anticipated developments in the various markets.
B. Groups and measurement bases of financial assets and financial liabilities
|
As at December 31, 2014
|
||||||||||||||||
|
Financial assets
|
Financial liabilities
|
|||||||||||||||
|
Measured at
fair value through the statement
of income
|
Loans and receivables
|
Measured at
fair value through the statement
of income
|
Measured at amortized cost
|
|||||||||||||
|
US$ thousands
|
||||||||||||||||
|
Cash and cash equivalents
|
— | 130,831 | — | — | ||||||||||||
|
Short-term investments and deposits
|
45,210 | 71,282 | — | — | ||||||||||||
|
Trade receivables
|
— | 1,039,146 | — | — | ||||||||||||
|
Derivatives and other receivables
|
14,595 | 47,682 | — | — | ||||||||||||
|
Deposits and other long term receivables
|
— | 5,064 | — | — | ||||||||||||
|
Total financial assets
|
59,805 | 1,294,005 | — | — | ||||||||||||
|
Short term credit from banks and others
|
— | — | — | (602,749 | ) | |||||||||||
|
Trade payables
|
— | — | — | (584,909 | ) | |||||||||||
|
Derivatives and other payables
|
— | — | (90,403 | ) | (519,865 | ) | ||||||||||
|
Long-term loans from banks and others
|
— | — | — | (2,303,716 | ) | |||||||||||
|
Long term derivatives instruments
|
— | — | (19,321 | ) | — | |||||||||||
|
Total financial liabilities
|
— | — | (109,724 | ) | (4,011,239 | ) | ||||||||||
|
Total financial instruments, net
|
59,805 | 1,294,005 | (109,724 | ) | (4,011,239 | ) | ||||||||||
C. Credit risk
(1) General
(a) Customer credit risks
Credit risk is the risk of financial loss to the Group if a customer or counterparty to a financial instrument fails to meet its contractual obligations, and arises mainly from the Group’s receivables from customers and from other receivables as well as from investments in securities.
The Company sells to a wide range and large number of customers, including customers with material credit balances. On the other hand, the Company does not have a concentration of sales to individual customers.
The Company has a regular policy of insuring the credit risk of all its customers by means of purchasing credit insurance with insurance companies, other than sales to government agencies and sales in small amounts. All other sales are executed only after receiving approval of coverage in the necessary amount from an insurance company or other collaterals of a similar level.
The use of an insurance company as aforementioned ensures that the credit risk is managed professionally and objectively by an expert external party and transfers most of the credit risk to third parties. Nevertheless, the common deductible in credit insurances is 10% (even higher in a small number of cases) thus the Group is still exposed to part of the risk, out of the total insured amount.
In addition, the Group has an additional deductible of a cumulative annual of approximately $5 million through a wholly owned captive reinsurance Company. In addition the Group has a credit insurance provided by the government of Israel’s foreign trade risks insurance company.
Most of the Group’s customers have been trading with the Group for many years and only rarely have credit losses been incurred by the Group. The financial statements include specific allowance for doubtful debts that appropriately reflect, in Management’s opinion, the credit loss in respect of accounts receivables is doubtful.
(b) Credit risks in respect of deposits
The Group deposits its balance of liquid financial assets in bank deposits and in securities. All the deposits are with a diversified group of leading banks preferably with banks that provide loans to the Group.
(2) Maximum Exposure to credit risk
The carrying amount of financial assets represents the maximum credit exposure. The maximum exposure to credit risk at the reporting date was:
|
As at December 31
|
||||||||
|
Carrying amount (US$ thousands)
|
||||||||
|
2014
|
2013
|
|||||||
|
Cash and cash equivalents
|
130,831 | 188,340 | ||||||
|
Short term investments and deposits
|
116,492 | 96,388 | ||||||
|
Trade receivables
|
1,039,146 | 1,057,028 | ||||||
|
Derivatives and other receivables
|
62,277 | 104,117 | ||||||
|
Long term receivables and deposits
|
5,064 | 7,325 | ||||||
|
Long term derivative instruments
|
— | 7,619 | ||||||
| 1,353,810 | 1,460,817 | |||||||
The maximum exposure to credit risk for trade receivables, at the reporting date by geographic region was:
|
As at December 31
|
||||||||
|
Carrying amount (US$ thousands)
|
||||||||
|
2014
|
2013
|
|||||||
|
Eastern Europe
|
30,735 | 29,679 | ||||||
|
Western Europe
|
322,024 | 343,793 | ||||||
|
North America
|
177,786 | 149,419 | ||||||
|
South America
|
132,179 | 121,573 | ||||||
|
India
|
120,719 | 85,155 | ||||||
|
China
|
65,718 | 162,785 | ||||||
|
Israel
|
63,800 | 71,247 | ||||||
|
Other
|
126,185 | 93,377 | ||||||
| 1,039,146 | 1,057,028 | |||||||
(3) Aging of debts and impairment losses
The aging of trade receivables at the reporting date was:
|
As at December 31
|
||||||||||||||||
|
2014
|
2013
|
|||||||||||||||
|
Gross
|
Impairment
|
Gross
|
Impairment
|
|||||||||||||
|
US$ thousands
|
||||||||||||||||
|
Not past due
|
954,129 | (448 | ) | 928,217 | (1,534 | ) | ||||||||||
|
Past due up to 3 months
|
78,803 | (593 | ) | 107,117 | (609 | ) | ||||||||||
|
Past due 3 to 6 months
|
5,966 | (65 | ) | 20,584 | (899 | ) | ||||||||||
|
Past due 6 to 9 months
|
2,844 | (2,141 | ) | 4,337 | (1,193 | ) | ||||||||||
|
Past due 9 to 12 months
|
423 | (22 | ) | 561 | (160 | ) | ||||||||||
|
Past due over 12 months
|
5,253 | (5,003 | ) | 6,992 | (6,385 | ) | ||||||||||
| 1,047,418 | (8,272 | ) | 1,067,808 | (10,780 | ) | |||||||||||
The movement in the allowance of doubtful accounts during the year was as follows:
|
2014
|
2013
|
|||||||
|
US$ thousands
|
||||||||
|
Balance as at January 1
|
10,780 | 11,363 | ||||||
|
Additional allowance
|
743 | 830 | ||||||
|
Write offs
|
(124 | ) | (324 | ) | ||||
|
Reversals
|
(844 | ) | (1,401 | ) | ||||
|
Changes due to translation differences
|
(1,203 | ) | 312 | |||||
|
Transfer to the group assets held for sale
|
(1,080 | ) | — | |||||
|
Balance as at December 31
|
8,272 | 10,780 | ||||||
D. Liquidity risk
Liquidity risk is the risk that the Group will not be able to meet its financial obligations as they fall due. The Group’s approach to managing liquidity is to ensure, as far as possible, that it will always have sufficient liquidity to timely meet its liabilities, under both normal and stressed conditions, without incurring unwanted losses.
The Company manages the liquidity risk by holding cash balances, short-term deposits and secured bank credit facilities.
The following are the contractual maturities of financial liabilities, including estimated interest payments:
|
As at December 31, 2014
|
||||||||||||||||||||
|
Carrying
amount
|
12 months
or less
|
1-2 years
|
3-5 years
|
More than
5 years
|
||||||||||||||||
|
US$ thousands
|
||||||||||||||||||||
|
Non-derivative financial liabilities
|
||||||||||||||||||||
|
Short term credit (not including current maturities)
|
402,443 | 406,644 | — | — | — | |||||||||||||||
|
Trade payables
|
584,909 | 584,909 | — | — | — | |||||||||||||||
|
Other payables
|
519,865 | 519,865 | — | — | — | |||||||||||||||
|
Non-convertible debentures (including current maturities)
|
1,131,222 | 120,579 | 49,746 | 149,240 | 1,317,152 | |||||||||||||||
|
Long-term bank loans (including current maturities)
|
1,372,800 | 162,551 | 759,015 | 292,147 | 286,479 | |||||||||||||||
| 4,011,239 | 1,794,548 | 808,761 | 441,387 | 1,603,631 | ||||||||||||||||
|
Financial liabilities – derivative instruments utilized for economic hedging
|
||||||||||||||||||||
|
Interest rate swaps and options
|
9,549 | 250 | 1,638 | 2,771 | 4,890 | |||||||||||||||
|
Foreign exchange derivatives
|
71,923 | 63,062 | 369 | 1,108 | 7,384 | |||||||||||||||
|
Derivative instruments on energy and marine transport
|
28,252 | 26,616 | 1,636 | — | — | |||||||||||||||
| 109,724 | 89,928 | 3,643 | 3,879 | 12,274 | ||||||||||||||||
|
As at December 31, 2013
|
||||||||||||||||||||
|
Carrying
amount
|
12 months
or less
|
1-2 years
|
3-5 years
|
More than
5 years
|
||||||||||||||||
|
US$ thousands
|
||||||||||||||||||||
|
Non-derivative financial liabilities
|
||||||||||||||||||||
|
Short term credit (not including current maturities)
|
538,538 | 543,724 | — | — | — | |||||||||||||||
|
Trade payables
|
669,102 | 669,102 | — | — | — | |||||||||||||||
|
Other payables
|
387,046 | 387,046 | — | — | — | |||||||||||||||
|
Non-convertible debentures (including current maturities)
|
242,785 | 185,306 | 70,832 | — | — | |||||||||||||||
|
Long-term bank loans (including current maturities)
|
1,247,599 | 25,003 | 39,243 | 1,017,938 | 260,202 | |||||||||||||||
| 3,085,070 | 1,810,181 | 110,075 | 1,017,938 | 260,202 | ||||||||||||||||
|
Financial liabilities – derivative instruments utilized for economic and accounting hedging
|
||||||||||||||||||||
|
Interest rate swaps and options
|
8,347 | 1,765 | 4,000 | 2,582 | — | |||||||||||||||
|
Foreign exchange derivatives
|
10,016 | 10,016 | — | — | — | |||||||||||||||
| 18,363 | 11,781 | 4,000 | 2,582 | — | ||||||||||||||||
E. Market risk
Market risk is the risk that changes in market prices, such as foreign exchange rates, interest rates and equity prices will affect the fair value or future cash flows of a financial instrument.
1. Interest risk
The Group has loans bearing variable interests and therefore its financial results and cash flows are exposed to fluctuations in the market interest rates.
ICL uses financial instruments, including derivatives, in order to hedge this exposure. The Group uses interest rate swap contracts and interest options mainly in order to reduce the exposure to cash flow risk in respect of changes in interest rates.
In addition, in 2005 the Company issued debentures in the amount of $125 million, bearing fixed interest, the balance of which as at the date of the report is $67 million. The liability in respect of the debentures, which bears fixed interest, exposes the Company to fair value risk in respect of changes in the market interest rate. The Company has executed swap transactions, in order to change the interest rate whereby it pays variable interest and receives fixed interest.
(a) Interest Rate Profile
Set forth below is detail regarding the type of interest on the Group’s non-derivative interest bearing financial instruments:
|
As at December 31
|
||||||||
|
2014
|
2013
|
|||||||
|
US$ thousands
|
||||||||
|
Fixed rate instruments:
|
||||||||
|
Financial assets
|
61,572 | 47,644 | ||||||
|
Financial liabilities
|
(1,330,201 | ) | (390,908 | ) | ||||
| (1,268,629 | ) | (343,264 | ) | |||||
|
Variable rate instruments:
|
||||||||
|
Financial assets
|
190,815 | 244,409 | ||||||
|
Financial liabilities
|
(1,576,264 | ) | (1,638,014 | ) | ||||
| (1,385,449 | ) | (1,393,605 | ) | |||||
(b) Sensitivity analysis for fixed rate instruments
Most of the Group’s instruments bearing fixed interest are not measured at fair value through the statement of income. Therefore, changes in the interest rate as at the date of the report would not be expected to have any impact on the profit or loss in respect of changes in the value of assets and liabilities bearing fixed interest.
(c) Sensitivity analysis for variable rate instruments
The below analysis assumes that all other variables (except for the interest rate), in particular foreign currency rates, remain constant
|
As at December 31, 2014
Impact on profit (loss)
|
||||||||||||||||
|
Decrease of
1% in interest
|
Decrease of
0.5% in interest
|
Increase of
0.5% in interest
|
Increase of
1% in interest
|
|||||||||||||
|
US$ thousands
|
||||||||||||||||
|
Changes in Dollar interest
|
||||||||||||||||
|
Non-derivative instruments
|
11,972 | 5,986 | (5,986 | ) | (11,972 | ) | ||||||||||
|
Cylinder instruments
|
(496 | ) | (365 | ) | 379 | 608 | ||||||||||
|
Exchange instruments
|
(21,878 | ) | (10,725 | ) | 10,315 | 20,239 | ||||||||||
| (10,402 | ) | (5,104 | ) | 4,708 | 8,875 | |||||||||||
|
Changes in Shekel interest
|
||||||||||||||||
|
Non-derivative instruments
|
(124 | ) | (62 | ) | 62 | 124 | ||||||||||
|
Changes in Euro interest
|
||||||||||||||||
|
Non-derivative instruments
|
1,829 | 914 | (914 | ) | (1,829 | ) | ||||||||||
|
Changes in other currencies interest
|
||||||||||||||||
|
Non-derivative instruments
|
177 | 88 | (88 | ) | (177 | ) | ||||||||||
(d) Terms of derivative financial instruments used to hedge interest risk
|
As at December 31, 2014
|
||||||||||||||||
|
Carrying amount (fair value)
|
Stated amount
|
Maturity date
|
Interest rate range
|
|||||||||||||
|
US$ thousands
|
US$ thousands
|
Years
|
%
|
|||||||||||||
|
Dollar
|
||||||||||||||||
|
SWAP contracts from fixed interest to variable interest
|
1,042 | 48,000 | 0-1 | 4.63 | % | |||||||||||
|
SWAP contracts from variable interest to fixed interest
|
(8,716 | ) | 425,000 | 0-10 | 1.4%-3.4 | % | ||||||||||
|
Cylinder instruments
|
(833 | ) | 120,000 | 0-2 | 1.0%-3.2 | % | ||||||||||
|
As at December 31, 2013
|
||||||||||||||||
|
Carrying amount (fair value)
|
Stated amount
|
Maturity date
|
Interest rate range
|
|||||||||||||
|
US$ thousands
|
US$ thousands
|
Years
|
%
|
|||||||||||||
|
Dollar
|
||||||||||||||||
|
SWAP contracts from fixed interest to variable interest
|
3,072 | 48,000 | 1-2 | 4.63 | % | |||||||||||
|
SWAP contracts from variable interest to fixed interest
|
(6,422 | ) | 322,000 | 1-5 | 1.4%-3.4 | % | ||||||||||
|
Cylinder instruments
|
(1,925 | ) | 145,000 | 1-3 | 1.0%-3.2 | % | ||||||||||
|
Shekel
|
||||||||||||||||
|
SWAP contracts from fixed interest to variable interest
|
858 | 57,620 | 1 | 3.40 | % | |||||||||||
2. Currency risk
The Group is exposed to currency risk with respect to sales, purchases, assets and liabilities that are denominated in a currency other than the functional currency of the Group. The main exposure is the NIS, Euro, British Sterling, Chinese Yuan, Japanese Yen and Brazilian Real.
The Group enters into foreign currency derivatives – forward exchange transactions and currency options – all in order to protect the Group from the risk that the eventual cash flows, resulting from existing assets and liabilities, and sales and purchases of goods within the framework of firm or anticipated commitments (based on a budget of up to one year), denominated in foreign currency, will be affected by changes in the exchange rates.
(a) Sensitivity analysis
A 10% strengthening at the rate of the US$ against the following currencies would have increased (decreased) profit or loss by the amounts shown below. This analysis assumes that all other variables, in particular interest rates, remain constant.
|
As at December 31
|
||||||||
|
Impact on profit (loss)
|
||||||||
|
2014
|
2013
|
|||||||
|
US$ thousands
|
||||||||
|
Non-derivative financial instruments
|
||||||||
|
Dollar/Euro
|
(73,743 | ) | (31,093 | ) | ||||
|
Dollar/NIS
|
42,223 | 65,887 | ||||||
|
Dollar/British Pound
|
1,050 | 3,092 | ||||||
|
Dollar/Japanese Yen
|
(776 | ) | (545 | ) | ||||
|
Dollar/Chinese Yuan
|
(16 | ) | (141 | ) | ||||
A 10% weakening of the US$ against the above currencies at December 31 would have the same effect but in the opposite direction.
Presented hereunder is a sensitivity analysis of the Group’s foreign currency derivative instruments as at December 31, 2014. Any change in the exchange rates of the principal currencies shown below as at December 31 would have increased (decreased) profit and loss and equity by the amounts shown below (in US $ thousands). This analysis assumes that all other variables remain constant.
|
As at December 31, 2014
|
||||||||||||||||
|
Increase 10%
|
Increase 5%
|
Decrease 5%
|
Decrease 10%
|
|||||||||||||
|
US$ thousands
|
||||||||||||||||
|
Euro/Dollar
|
||||||||||||||||
|
Forward transactions
|
(26,912 | ) | (12,736 | ) | 11,524 | 22,018 | ||||||||||
|
Options
|
8,842 | 4,166 | (3,743 | ) | (7,063 | ) | ||||||||||
|
Dollar/NIS
|
||||||||||||||||
|
Forward transactions
|
(17,124 | ) | (8,972 | ) | 9,916 | 20,929 | ||||||||||
|
Options
|
(50,376 | ) | (26,919 | ) | 33,892 | 61,589 | ||||||||||
|
SWAP
|
(17,011 | ) | (8,910 | ) | 9,847 | 20,791 | ||||||||||
|
JPY/Dollar
|
||||||||||||||||
|
Forward transactions
|
686 | 359 | (397 | ) | (839 | ) | ||||||||||
|
Options
|
626 | 327 | (358 | ) | (740 | ) | ||||||||||
|
GBP/Dollar
|
||||||||||||||||
|
Forward transactions
|
(4,640 | ) | (2,199 | ) | 1,990 | 3,797 | ||||||||||
|
Options
|
(1,478 | ) | (615 | ) | 92 | 419 | ||||||||||
|
GBP/Euro
|
||||||||||||||||
|
Forward transactions
|
3,369 | 1,767 | (1,953 | ) | (4,117 | ) | ||||||||||
|
Options
|
(2,482 | ) | (1,640 | ) | 2,153 | 3,278 | ||||||||||
(b) Terms of derivative financial instruments used to economically hedge foreign currency risk
|
As at December 31, 2014
|
||||||||||||
|
Carrying amount
|
Stated amount
|
Average
exchange rate
|
||||||||||
|
US$ thousands
|
US$ thousands
|
|||||||||||
|
Forward contracts
|
||||||||||||
|
NIS/Dollar
|
(159 | ) | 188,585 | 3.89 | ||||||||
|
Dollar/Euro
|
(1,795 | ) | 242,252 | 1.22 | ||||||||
|
Dollar/JPY
|
871 | 8,420 | 107.12 | |||||||||
|
Euro/GBP
|
(86 | ) | 36,982 | 0.78 | ||||||||
|
Dollar/GBP
|
(85 | ) | 41,781 | 1.56 | ||||||||
|
Other
|
497 | 12,002 | — | |||||||||
|
Currency and interest SWAPs
|
||||||||||||
|
Shekel to Dollars
|
(9,230 | ) | 170,000 | — | ||||||||
|
Put options
|
||||||||||||
|
NIS/Dollar
|
804 | 592,500 | 3.50 | |||||||||
|
Dollar/Euro
|
7,476 | 80,732 | 1.33 | |||||||||
|
Dollar/JPY
|
(7 | ) | 8,000 | 103.19 | ||||||||
|
Euro/GBP
|
642 | 17,615 | 0.80 | |||||||||
|
Dollar/GBP
|
(220 | ) | 10,000 | 1.65 | ||||||||
|
Call options
|
||||||||||||
|
NIS/Dollar
|
(57,872 | ) | 592,500 | 3.50 | ||||||||
|
Dollar/Euro
|
(241 | ) | 80,732 | 1.33 | ||||||||
|
Dollar/JPY
|
1,092 | 8,000 | 103.19 | |||||||||
|
Euro/GBP
|
(98 | ) | 17,615 | 0.80 | ||||||||
|
Dollar/GBP
|
41 | 10,000 | 1.65 | |||||||||
|
As at December 31, 2013
|
||||||||||||
|
Carrying amount
|
Stated amount
|
Average
exchange rate
|
||||||||||
|
US$ thousands
|
US$ thousands
|
|||||||||||
|
Forward contracts
|
||||||||||||
|
NIS/Dollar
|
1,311 | 223,605 | 3.50 | |||||||||
|
Dollar/Euro
|
452 | 506,101 | 1.38 | |||||||||
|
Dollar/JPY
|
400 | 5,511 | 97.40 | |||||||||
|
Euro/GBP
|
(20 | ) | 492 | 0.87 | ||||||||
|
Dollar/GBP
|
987 | 46,555 | 1.62 | |||||||||
|
Other
|
(1,953 | ) | 21,325 | — | ||||||||
|
CPI
|
(1,062 | ) | 57,620 | — | ||||||||
|
Currency and interest SWAPs
|
||||||||||||
|
Shekel and CPI to Dollars
|
21,870 | 290,908 | — | |||||||||
|
Put options
|
||||||||||||
|
NIS/Dollar
|
31,667 | 697,000 | 3.60 | |||||||||
|
Dollar/Euro
|
1,183 | 98,230 | 1.34 | |||||||||
|
Dollar/JPY
|
(100 | ) | 10,000 | 100.00 | ||||||||
|
Euro/GBP
|
423 | 20,665 | 0.84 | |||||||||
|
Call options
|
||||||||||||
|
NIS/Dollar
|
(3,494 | ) | 697,000 | 3.60 | ||||||||
|
Dollar/Euro
|
(3,464 | ) | 98,230 | 1.34 | ||||||||
|
Dollar/JPY
|
595 | 10,000 | 100.00 | |||||||||
|
Euro/GBP
|
(99 | ) | 20,665 | 0.84 | ||||||||
The maturity date of all of the derivatives used to economically hedge foreign currency risk is up to a year.
(c) Linkage terms of monetary balances – in thousands of Dollars
|
As at December 31, 2014
|
||||||||||||||||||||||||||||
|
US$
|
Euro
|
GBP
|
NIS
|
CPI
|
JPY
|
Others
|
||||||||||||||||||||||
|
Non-derivative instruments:
|
||||||||||||||||||||||||||||
|
Cash and cash equivalents
|
— | 68,917 | 5,797 | 7,194 | — | 5,172 | 43,751 | |||||||||||||||||||||
|
Short term investments and deposits
|
102,122 | 7,257 | — | 1,484 | — | — | 5,629 | |||||||||||||||||||||
|
Trade receivables
|
617,154 | 264,041 | 37,136 | 55,178 | — | 9,260 | 56,377 | |||||||||||||||||||||
|
Other receivables
|
36,452 | 164 | 234 | 10,802 | — | 30 | — | |||||||||||||||||||||
|
Deposits and other long term receivables
|
852 | 301 | — | 2,402 | 1,303 | 202 | 4 | |||||||||||||||||||||
|
Total financial assets
|
756,580 | 340,680 | 43,167 | 77,060 | 1,303 | 14,664 | 105,761 | |||||||||||||||||||||
|
Credit from banks and other credit providers
|
351,196 | 223,025 | 16,375 | 6,178 | — | — | 5,975 | |||||||||||||||||||||
|
Trade payables
|
124,893 | 174,745 | 27,189 | 219,693 | — | 1,023 | 37,366 | |||||||||||||||||||||
|
Other payables
|
250,009 | 111,384 | 16,748 | 129,761 | — | 170 | 11,793 | |||||||||||||||||||||
|
Long term loans from banks and others
|
2,028,671 | 71,044 | — | 148,110 | — | 33 | 55,858 | |||||||||||||||||||||
|
Total financial liabilities
|
2,754,769 | 580,198 | 60,312 | 503,742 | — | 1,226 | 110,992 | |||||||||||||||||||||
|
Total non-derivative financial instruments, net
|
(1,998,189 | ) | (239,518 | ) | (17,145 | ) | (426,682 | ) | 1,303 | 13,438 | (5,231 | ) | ||||||||||||||||
|
Derivative instruments:
|
||||||||||||||||||||||||||||
|
Forward transactions
|
— | 242,252 | 41,781 | 188,585 | — | (8,420 | ) | 48,984 | ||||||||||||||||||||
|
Cylinder
|
— | (80,732 | ) | 10,000 | 592,500 | — | (8,000 | ) | 17,615 | |||||||||||||||||||
|
SWAPS – dollar into shekel
|
— | — | — | 170,000 | — | — | — | |||||||||||||||||||||
|
Total derivative instruments
|
— | 161,520 | 51,781 | 951,085 | — | (16,420 | ) | 66,599 | ||||||||||||||||||||
|
Net exposure
|
(1,998,189 | ) | (77,998 | ) | 34,636 | 524,403 | 1,303 | (2,982 | ) | 61,368 | ||||||||||||||||||
Note 27 – Financial Instruments and Risk Management (cont'd)
|
As at December 31, 2013
|
||||||||||||||||||||||||||||
|
US$
|
Euro
|
GBP
|
NIS
|
CPI
|
JPY
|
Others
|
||||||||||||||||||||||
|
Non-derivative instruments:
|
||||||||||||||||||||||||||||
|
Cash and cash equivalents
|
29,384 | 64,862 | 17,941 | 32,096 | — | 4,201 | 39,856 | |||||||||||||||||||||
|
Short term investments and deposits
|
84,212 | 815 | — | 1,431 | — | — | 9,930 | |||||||||||||||||||||
|
Trade receivables
|
591,710 | 291,257 | 33,072 | 61,878 | — | 7,820 | 71,291 | |||||||||||||||||||||
|
Other receivables
|
34,644 | 1,742 | 435 | 4,751 | — | 47 | 263 | |||||||||||||||||||||
|
Deposits and other long term receivables
|
603 | 474 | — | 4,094 | 1,912 | 230 | 12 | |||||||||||||||||||||
|
Total financial assets
|
740,553 | 359,150 | 51,448 | 104,250 | 1,912 | 12,298 | 121,352 | |||||||||||||||||||||
|
Credit from banks and other credit providers
|
415,240 | 108,232 | 15,964 | 28,549 | 147,012 | 703 | 2,584 | |||||||||||||||||||||
|
Trade payables
|
134,873 | 245,307 | 14,136 | 251,626 | — | 961 | 22,199 | |||||||||||||||||||||
|
Other payables
|
84,327 | 129,360 | 9,441 | 152,949 | — | 301 | 10,668 | |||||||||||||||||||||
|
Long term loans from banks and others
|
985,276 | 152,416 | — | 172,860 | — | 38 | 48 | |||||||||||||||||||||
|
Total financial liabilities
|
1,619,716 | 635,315 | 39,541 | 605,984 | 147,012 | 2,003 | 35,499 | |||||||||||||||||||||
|
Total non-derivative financial instruments, net
|
(879,163 | ) | (276,165 | ) | 11,907 | (501,734 | ) | (145,100 | ) | 10,295 | 85,853 | |||||||||||||||||
|
Derivative instruments:
|
||||||||||||||||||||||||||||
|
Forward transactions
|
— | 506,101 | 46,555 | 223,605 | 57,620 | (5,511 | ) | 21,817 | ||||||||||||||||||||
|
Cylinder
|
— | (98,230 | ) | — | 697,000 | — | (10,000 | ) | 20,665 | |||||||||||||||||||
|
SWAPS – dollar into shekel and CPI
|
— | — | — | 261,782 | 29,126 | — | — | |||||||||||||||||||||
|
Total derivative instruments
|
— | 407,871 | 46,555 | 1,182,387 | 86,746 | (15,511 | ) | 42,482 | ||||||||||||||||||||
|
Net exposure
|
(879,163 | ) | 131,706 | 58,462 | 680,653 | (58,354 | ) | (5,216 | ) | 128,335 | ||||||||||||||||||
Note 27 – Financial Instruments and Risk Management (cont'd)
3. Other price risk
A. Investment in securities
The Group companies have an investment in marketable securities, in the amount of approximately $45 million. The impact of the change in the fair value of this investment will be recorded in the statement of income in “financing expenses” category.
B. Hedging of marine shipping and energy transactions
The Company is exposed to risk in respect of marine shipping and energy costs. The Company uses marine shipping and energy derivatives to hedge the risk that its cash flows will be affected by changes in marine shipping and energy prices. As at December 31, 2014, the fair value of the marine shipping and energy derivatives was approximately $28.3 million (liability).
F. Fair value of financial instruments
The Group’s financial instruments include mostly non-derivative assets: cash and cash equivalents, investments, short-term deposits and loans, receivables and other debit balances, long-term investments and receivables; non-derivative financial liabilities: short-term credit, payables and other current liabilities, long-term loans and other long-term liabilities; as well as derivative financial instruments.
Due to their nature, the fair value of the financial instruments included in the Group’s working capital is generally identical or approximates their carrying value. The fair value of the long-term deposits and receivables and the long-term liabilities also approximates their book value, as these financial instruments bear interest at a rate which approximates the accepted interest market rate.
The following table details the book value and the fair value of financial instrument groups presented in the financial statements not in accordance with their fair value
|
As at December 31, 2014
|
As at December 31, 2013
|
|||||||||||||||
|
Carrying amount
|
Fair value
|
Carrying amount
|
Fair value
|
|||||||||||||
|
US$ thousands
|
||||||||||||||||
|
Debentures bearing fixed interest
|
||||||||||||||||
|
Marketable (1)
|
792,090 | 815,231 | 147,848 | 148,711 | ||||||||||||
|
Non-marketable (2)
|
349,680 | 355,549 | 68,342 | 69,889 | ||||||||||||
| 1,141,770 | 1,170,780 | 216,190 | 218,600 | |||||||||||||
|
(1)
|
The fair value of the marketable debentures is based on the quoted stock exchange price and is classified as level 1 under the fair value hierarchy.
|
|
(2)
|
The fair value of the non-marketable debentures is based on a calculation of the present value of the cash flows based on the customary Libor rate for similar loans having similar characteristics and is classified as level 2 under the fair value hierarchy. The average discount rate as at December 31, 2014 is 4.04% (December 31, 2013– 3.6%).
|
G. Hierarchy of fair value
The following table presents an analysis of the financial instruments measured by fair value, using the valuation method. (See Note 4 for more details regarding the valuation method).
The following levels were defined:
Level 1: Quoted (unadjusted) prices in an active market for identical instruments
Level 2: Observed data (directly or indirectly) not included in Level 1 above.
|
As at December 31, 2014
|
||||||||||||
|
Level 1
|
Level 2
|
Total
|
||||||||||
|
US$ thousands
|
||||||||||||
|
Securities held for trading purposes
|
45,210 | — | 45,210 | |||||||||
|
Derivatives used for hedging, net
|
— | (95,129 | ) | (95,129 | ) | |||||||
| 45,210 | (95,129 | ) | (49,919 | ) | ||||||||
Basic earnings per share
Calculation of the basic earnings per share for the year ended December 31, 2014, is based on the earnings allocated to the holders of the ordinary shares divided by the weighted-average number of ordinary shares outstanding, calculated as follows:
|
For the year ended December 31
|
||||||||||||
|
2014
|
2013
|
2012
|
||||||||||
|
US$ thousands
|
||||||||||||
|
Earnings attributed to holders of the ordinary shares
|
463,555 | 818,573 | 1,300,076 | |||||||||
Weighted-average number of ordinary shares in thousands:
|
For the year ended December 31
|
||||||||||||
|
2014
|
2013
|
2012
|
||||||||||
|
Shares thousands
|
||||||||||||
|
Balance as at January 1
|
1,270,426 | 1,270,119 | 1,268,508 | |||||||||
|
Plus – options exercised for shares
|
— | 295 | 1,501 | |||||||||
|
Weighted average number of ordinary shares used in computation of the basic earnings per share
|
1,270,426 | 1,270,414 | 1,270,009 | |||||||||
Diluted earnings per share
Calculation of the diluted earnings per share for the year ended December 31, 2014, is based on the earnings allocated to the holders of the ordinary shares divided by the weighted-average number of ordinary shares outstanding after adjustment for the number of potential diluted ordinary shares, calculated as follows:
|
For the year ended December 31
|
||||||||||||
|
2014
|
2013
|
2012
|
||||||||||
|
US$ thousands
|
||||||||||||
|
Earnings attributed to the ordinary shareholders (diluted)
|
463,555 | 818,573 | 1,300,076 | |||||||||
Weighted average number of ordinary shares (diluted) in thousands:
|
For the year ended December 31
|
||||||||||||
|
2014
|
2013
|
2012
|
||||||||||
|
Shares thousands
|
||||||||||||
|
Weighted average number of ordinary shares used in the computation of the basic earnings per share
|
1,270,426 | 1,270,414 | 1,270,009 | |||||||||
|
Effect of stock options and restricted shares
|
32 | — | 108 | |||||||||
|
Weighted average number of ordinary shares used in the computation of the diluted earnings per share
|
1,270,458 | 1,270,414 | 1,270,117 | |||||||||
At December 31, 2014, 16,353 thousand options (at December 31, 2013 and 2012, 15,743 thousand and 22,844 thousand options, respectively) were excluded from the diluted weighted average number of ordinary shares calculation as their effect would have been anti dilutive.
The average market value of the Company’s shares, for purposes of calculating the dilutive effect of the stock options, is based on the quoted market prices for the period in which the options were outstanding.
Related parties within the meaning thereof in IAS 24, “Related Parties”; Interested parties within the meaning thereof in Paragraph 1 of the definition of an “interested party” in a company, as defined in Section 1 of the Israeli Securities Law, 1968.
A. Parent company and subsidiaries
The Group’s parent company is Israel Corporation Ltd. Israel Corporation Limited is a public company listed for trading on the Tel Aviv Stock exchange (TASE). Based on the information the Company received from Israel Corporation, Millennium Investments Elad Ltd. (hereinafter – “Millennium”) and Mr. Idan Ofer are considered as controlling shareholders jointly of Israel Corporation, for purposes of the Securities Law (both Millennium and Mr. Ofer hold shares in Israel Corporation directly, and Idan Ofer serves as a director of Millennium and has an indirect interest in it as a beneficiary of a trust that has indirect control of Millennium). Millennium holds approximately 46.94% of the share capital in Israel Corporation. To the best of the Company’s knowledge, Millennium is held by Mashat Investments Ltd (hereinafter, “Mashat”), and by XT Investments Ltd (hereinafter, “XT Investments”), with 80% and 20% holdings, respectively. Mashat is a private company, wholly owned by a Dutch company Ansonia Holdings B. V. (hereinafter – “Ansonia”). Ansonia is a wholly owned subsidiary of Jelany Corporation N. V. (registered in Curaçao), which is a wholly owned subsidiary of the Liberian company Court Investments Ltd (hereinafter – “Court”). Court is wholly owned by a foreign discretionary trust of which Mr. Idan Ofer is a beneficiary. XT Investments, which directly holds approximately 1.24% of the share capital in Israel Corporation, is a shareholder in Millennium, as stated. XT Investments is a private company, wholly owned by XT Holdings Ltd. (hereinafter – “XT Holdings), a private company whose ordinary shares are held in equal shares by Orona Investments Ltd (which is indirectly controlled by Mr. Ehud Angel) and by Lynav Holdings Ltd., a company that is controlled by a foreign discretionary trust of which Mr. Idan Ofer is a prime beneficiary. Among other things, Mr. Ehud Angel holds a special share that gives him, inter alia, under certain limitations and for certain issues, an additional vote on the Board of Directors of XT Holdings. In addition, Kirby Enterprises Inc., which is indirectly held by a foreign discretionary trust that holds Mashat in which, as stated, Mr. Idan Ofer is the beneficiary, holds approximately 0.74% of the share capital of Israel Corporation. Furthermore, Mr. Idan Ofer holds directly approximately 3.85% of the share capital of Israel Corporation.
Regarding the subsidiaries – see Note 30, regarding the Group entities.
B. Benefits to key management personnel (including directors)
The senior managers, in addition to their salaries, are entitled to non-cash benefits (vehicle and telephone). The Group contributes to a post-employment defined benefit plan on their behalf. In accordance with the terms of the plan, the retirement age of senior managers is 67. Senior managers and directors also participate in the Company's incentive and equity remuneration plans (options for Company shares and restricted shares (see Note 24 – Share-Based Payments).
Benefits for key management personnel (in total 23 key management personnel including directors, in 2013 – 21 key management personnel) comprised:
|
For the year ended December 31
|
||||||||
|
2014
|
2013
|
|||||||
|
US$ thousands
|
||||||||
|
Short-term benefits
|
9,565 | 9,963 | ||||||
|
Post-employment benefits
|
853 | 1,651 | ||||||
|
Share-based payments
|
3,520 | 6,789 | ||||||
|
Total *
|
13,938 | 16,328 | ||||||
|
* To related parties employed by the Company
|
3,739 | 5,193 | ||||||
|
* To related parties not employed by the Company
|
675 | 1,021 | ||||||
C. Ordinary transactions that are not exceptional
The Company’s Board of Directors, with the agreement of the Audit Committee, decided that a transaction with related parties will be considered an “insignificant” transaction for public reporting purposes if all the following conditions have been met:
(1) It is not an “extraordinary transaction” within the meaning thereof in the Companies Law.
(2) The effect of each of the parameters listed hereunder is less than one percent (hereinafter – “the Negligibility Threshold”):
For every transaction or arrangement that is tested for the Negligibility Threshold, the parameters will be examined, to the extent they are relevant, on the basis of ICL’s reviewed or audited consolidated financial statements, as applicable, prior to the transaction, as detailed below:
|
|
·
|
Assets ratio
– the amount of the assets in the transaction (acquired or sold assets) divided by total assets.
|
|
|
·
|
Equity ratio
– the increase or decrease in equity divided by the total equity.
|
|
|
·
|
Revenue ratio
– estimated revenue from the transaction divided by the annual revenue.
|
|
|
·
|
Manufacturing expenses ratio
– the amount of the expenses in the transaction divided by the annual cost of sales.
|
|
|
·
|
Profit ratio
– the profit or loss attributed to the transaction divided by total annual comprehensive income or loss during the period.
|
(3) The transaction is negligible also from a qualitative point of view. For the purpose of this criterion, it shall be examined whether there are special considerations justifying a special report on the transaction, even if it does not meet the quantitative criteria described above.
(4) In examining the negligibility of a transaction expected to occur in the future, among other things, the probability of the transaction occurring is to be examined.
D. Transactions with related and interested parties
|
For the year ended December 31
|
||||||||
|
2014
|
2013
|
|||||||
|
US$ thousands
|
||||||||
|
Sales
|
6,212 | 9,958 | ||||||
|
Cost of sales (1)
|
173,358 | 131,845 | ||||||
|
Selling, transport and marketing expenses
|
16,326 | 18,424 | ||||||
|
Management fees to the parent company (2)
|
3,752 | 4,002 | ||||||
|
(1)
|
A subsidiary in the Performance Products segment entered into a long-term agreement with an interested party of the Company for the acquisition of food quality phosphoric acid. The agreement was signed before the subsidiary was acquired by ICL and is in effect until 2018. Additionally, on February 28, 2013, ICL’s Audit Committee and Board of Directors authorized to the certain of Group subsidiaries in Israel from the Industrial Products segment to purchase electricity from OPC Rotem (a company related to the Company’s controlling
|
shareholder). During 2013, additional companies from the Fertilizers segment entered into an agreement with OPC Rotem to purchase electricity in accordance to the amended agreement authorized on February 28, 2013.
|
(2)
|
In June 2009, following approval by the Audit Committee, the Company’s Board of Directors approved a revision of the management fees payable to Israel Corp. to $ 3.5 million per year, plus VAT as per law, for each of the years from 2009 to 2011. On July 20, 2009, the revision was approved by the General Meeting of the Company’s shareholders. On October 5, 2011 the General Meeting of the Company’s shareholders approved an extension of the management agreement on the same terms for the years 2012 until 2014. In January 2015, the Remuneration Committee and the Board of Directors approved, and on February 26, 2015, the General Meeting of the Company’s shareholders also approved, extension of the management agreement for the years 2015 through 2017, on the same terms, except for the following changes: (1) upon approval of the service conditions of the Chairman of the Company’s Board of Directors, as Acting Chairman, the management fees will be reduced to $1 million, plus VAT as per law. If the Chairman of the Company’s Board of Directors is appointed as Acting Chairman, and thereafter he ceases to serve and to receive remuneration as Acting Chairman, commencing from that time the management fees will return to $3.5 million, plus VAT as per law; and (2) the management agreement was amended such that it permits the Company to provide equity remuneration to directors that serve and/or will serve from time to time and that are employed by Israel Corporation Ltd. (such directors do not receive cash remuneration in respect of their service). It is noted that the Remuneration Committee, the Board of Directors and the General Meeting of the Company’s shareholders approved that equity remuneration that will be granted to directors, as stated, or the economic benefit in respect thereof, shall be transferred to Israel Corporation Ltd.
|
|
(3)
|
On June 26, 2012, the Company received a short-term loan in the amount of $50 million from the Company’s controlling shareholder (Israel Corporation Ltd.). The loan was granted at market terms. The loan was renewed every period for three or six months, bore interest at the rate of 0.776%. In August 2014 it was repaid in full.
|
E. Balances with interested parties
1) Composition:
|
As at December 31
|
||||||||
|
2014
|
2013
|
|||||||
|
US$ thousands
|
||||||||
|
Long-term deposits, net of current maturities
|
1,512 | 780 | ||||||
|
Current maturities of long-term deposits
|
411 | 260 | ||||||
|
Other current assets
|
11,063 | 6,342 | ||||||
|
Other current liabilities
|
28,652 | 73,558 | ||||||
2) The Company declares a dollar dividend that is paid partly in NIS, according to the exchange rate on the effective date. The Company enters hedging transaction in order to hedge the exposure to changes in the dollar/shekel exchange rate. The dividend paid to the Company’s controlling shareholder, Israel Corporation, is made partly based on the exchange rate on the effective date and partly based on the exchange rate on the date of distribution. In addition, the dividend paid to an interested party is made according to the exchange rate on the date of distribution.
|
Percentage of
|
Shareholding
|
|||||
|
The Holding Company
|
The Affiliate
|
Shares conferring rights to profits
|
Voting shares
|
|||
|
Israel Chemicals Ltd., Israel
|
—
|
—
|
—
|
|||
|
Dead Sea Works Ltd., Israel
|
100.00
|
100.00
|
||||
|
Dead Sea Bromine Company Ltd., Israel
|
100.00
|
100.00
|
||||
|
Rotem Amfert Negev Ltd., Israel
|
100.00
|
100.00
|
||||
|
Dead Sea Periclase ltd., Israel ***
|
100.00
|
100.00
|
||||
|
Mifalei Tovala Ltd., Israel
|
100.00
|
100.00
|
||||
|
I.D.E. Technologies Ltd., Israel
|
50.00
|
50.00
|
||||
|
Ferson Chemicals Ltd., Israel***
|
100.00
|
100.00
|
||||
|
ICL Israel Ltd., Israel
|
100.00
|
100.00
|
||||
|
P.A.M.A ( Energy Resources Development) Ltd., Israel***
|
25.00
|
25.00
|
||||
|
Dead Sea Magnesium Ltd.
|
100.00
|
100.00
|
||||
|
ICL Finance B.V, The Netherlands
|
100.00
|
100.00
|
||||
|
ICL Finance Inc., USA
|
100.00
|
100.00
|
||||
|
Twincap Försäkrings AB, Sweden
|
100.00
|
100.00
|
||||
|
Hoyermann Chemie GmbH , Germany
|
100.00
|
100.00
|
||||
|
Hoyermann Chemie GmbH, Germany
|
—
|
—
|
—
|
|||
|
ICL-IP Bitterfeld Grundbesitz GmbH & Co KG, Germany*
|
5.10
|
5.10
|
||||
|
BK Giulini, GmbH , Germany*
|
5.10
|
5.10
|
||||
|
Dead Sea Works Ltd., Israel
|
—
|
—
|
—
|
|||
|
Ashli Chemicals (Holland) B.V., Israel
|
100.00 | 100.00 | ||||
|
Cleveland Potash ltd (CPL), U.K*
|
62.78
|
62.78
|
||||
|
Ashli Chemicals (Holland) B.V., Israel
|
—
|
—
|
—
|
|||
|
Cleveland Potash ltd (CPL), U.K*
|
37.22
|
37.22
|
||||
|
ICL Finance Belgium N.V., Belgium
|
100.00
|
100.00
|
||||
|
Cleveland Potash ltd (CPL), U.K
|
—
|
—
|
—
|
|||
|
Constantine & Company (Export) Limited
|
50.00
|
50.00
|
||||
|
ICL Iberia Ltd, UK
|
100.00
|
100.00
|
||||
|
ICL Iberia Ltd. SCS, Spain
|
100.00
|
100.00
|
||||
|
Everris Ltd., (UK)
|
100.00
|
100.00
|
||||
|
Amega Sciences Holdings Ltd., UK
|
100.00
|
100.00
|
||||
|
Amega Sciences Holdings Ltd., UK
|
—
|
—
|
—
|
|||
|
Amega Sciences Plc., UK
|
100.00
|
100.00
|
||||
|
Amega Sciences Plc., UK
|
—
|
—
|
—
|
|||
|
Nutriet Sciences Ltd., UK
|
100.00
|
100.00
|
||||
|
Service Chemicals Ltd., UK***
|
100.00
|
100.00
|
||||
|
ICL Iberia Ltd. SCS, Spain
|
—
|
—
|
—
|
Note 30 – Group Entities (cont'd)
|
Percentage of
|
Shareholding
|
|||||
|
The Holding Company
|
The Affiliate
|
Shares conferring rights to profits
|
Voting shares
|
|||
|
Iberpotash S.A. , Spain
|
100.00
|
100.00
|
||||
|
Trafico de Mercancias S.A.,Spain
|
100.00
|
100.00
|
||||
|
Medentech Limited, Ireland
|
100.00
|
100.00
|
||||
|
Absia SL, Spain
|
100.00
|
100.00
|
||||
|
ICL Fosfatos Y Adtivos Servicios de Mexico, S.A. de C.V.*
|
100.00
|
100.00
|
||||
|
ICL Fostfatos Y Aditivos Mexico, S.A. de C.V*
|
100.00
|
100.00
|
||||
|
Everris Iberica Fertilizers S.L, Spain
|
100.00
|
100.00
|
||||
|
BK Giulini Iberica S.L, Spain
|
100.00
|
100.00
|
||||
|
Fomento y Desarrollo Agrícola, S.L, Spain
|
100.00
|
100.00
|
||||
|
Logística de Fertilizantes Fuentes, S.A. Spain
|
100.00
|
100.00
|
||||
|
Agrocallejas mediterranea, S.L Unipersonal, Spain
|
100.00
|
100.00
|
||||
|
Fuentes Fertilizantes S.L., Spain
|
100.00
|
100.00
|
||||
|
Auxquimia, S.A., Spain
|
100.00
|
100.00
|
||||
|
Dead Sea Bromine Company Ltd., Israel
|
—
|
—
|
—
|
|||
|
Bromine Compounds Ltd., Israel
|
100.00
|
100.00
|
||||
|
IMI Tami Institute for R&D Ltd. , Israel
|
100.00
|
100.00
|
||||
|
ICL JAPAN Ltd, Japan
|
100.00
|
100.00
|
||||
|
Landchem Ltd. ,South Africa
|
100.00
|
100.00
|
||||
|
Bromine and Chemicals Ltd., UK
|
100.00
|
100.00
|
||||
|
Dead Sea Periclase Fused products Co., Israel *
|
99.00
|
99.00
|
||||
|
ICL Management & Trading India Private Limited., India
|
100.00
|
100.00
|
||||
|
ICL (Shanghai) Investment Co. Ltd; China
|
100.00
|
100.00
|
||||
|
Bromine Compounds Ltd., Israel
|
—
|
—
|
—
|
|||
|
Tetrabrom Technologies Ltd., Israel
|
100.00
|
100.00
|
||||
|
Chemada Fine Chemicals Ltd., Israel
|
26.00
|
26.00
|
||||
|
Bromine Compounds Marketing (2002) ltd., Israel
|
100.00
|
100.00
|
||||
|
Dead Sea Periclase Fused products Co., Israel*
|
1.00
|
1.00
|
||||
|
IMI Tami Institute for R&D Ltd. , Israel
|
—
|
—
|
—
|
|||
|
Potassium Nitrate Ltd., Israel***
|
50.00
|
50.00
|
||||
|
Novetide Ltd. Israel
|
50.00
|
50.00
|
||||
|
Magsens Ltd.***
|
22.20
|
22.20
|
||||
|
ICL Innovation Ltd, Israel
|
100.00
|
100.00
|
||||
|
Rotem Amfert Negev Ltd. , Israel
|
—
|
—
|
—
|
|||
|
Agro-Vant, Israel
|
100.00
|
100.00
|
Note 30 – Group Entities (cont'd)
|
Percentage of
|
Shareholding
|
|||||
|
The Holding Company
|
The Affiliate
|
Shares conferring rights to profits
|
Voting shares
|
|||
|
Fertilizers and Chemicals Ltd.
|
100.00
|
100.00
|
||||
|
Zuari Rotem specialty fertilizers Limited, India
|
50.00
|
50.00
|
||||
|
ICL Holding The Netherlands Cooperatief U.A., The Netherlands
|
100.00
|
100.00
|
||||
| Rotem Manufacturing Private Limited Company, Ethiopa* |
99.00
|
99.00
|
||||
|
Fertilizers and Chemicals Ltd., Israel
|
—
|
—
|
—
|
|||
|
Industrial Chemical Equipment Ltd., Israel
|
100.00
|
100.00
|
||||
|
Revivim In The Bay Water and Environment Ltd., Israel
|
100.00
|
100.00
|
||||
| Rotem Manufacturing Private Limited Company, Ethiopa* |
1.00
|
1.00
|
||||
|
Industrial Chemical Equipment Ltd., Israel
|
—
|
—
|
—
|
|||
|
Agripo Management services Ltd. Israel***
|
50.00
|
50.00
|
||||
|
ICL Holding The Netherlands Cooperatief U.A., The Netherlands
|
—
|
—
|
—
|
|||
|
Everris International B.V, The Netherlands
|
100.00
|
100.00
|
||||
|
Amsterdam Fertilizers B.V., The Netherlands
|
100.00
|
58.10
|
||||
|
ICL-IP Europe B.V . ,The Netherlands
|
100.00
|
100.00
|
||||
|
Allana Potash, Corp., Canada
|
16.50
|
16.50
|
||||
|
ICL GROUP ASIA PACIFIC PTE. LTD
|
100.00
|
100.00
|
||||
|
ICL-IP Europe B.V., The Netherlands
|
—
|
—
|
—
|
|||
|
ICL-IP Terneuzen B.V, The Netherlands
|
100.00
|
100.00
|
||||
|
Bromisa Industrial e Commercial Ltda, Brasil*
|
90.95
|
90.95
|
||||
|
Lianyungang Dead Sea Bromine Compounds Co. Ltd, China
|
60.00
|
60.00
|
||||
|
Sinobrom compounds Co. Ltd, China
|
75.00
|
75.00
|
||||
|
Amsterdam Fertilizers B.V., The Netherlands*
|
—
|
41.90
|
||||
|
ICL-IP Terneuzen B.V, The Netherlands
|
—
|
—
|
—
|
|||
|
Bromisa Industrial e Commercial Ltda, Brasil*
|
9.05
|
9.05
|
||||
|
Everris International B.V, The Netherlands
|
—
|
—
|
—
|
|||
|
Everris Kenya Ltd*. , Kenya
|
50.00
|
50.00
|
||||
|
Everris Malaysia Sdn. Bhd , Malaysia
|
100.00
|
100.00
|
||||
|
Amsterdam Fertilizers B.V., The Netherlands
|
—
|
—
|
—
|
|||
|
ICL Holding beschränkt haftende OHG, Germany*
|
95.00
|
95.00
|
||||
|
Amsterdam Fertilizers B.V., The Netherlands
|
Finacil EEIG (European Economic Interest Grouping)****
|
12.50
|
12.50
|
|||
|
BKG Puriphos B.V, The Netherlands
|
100.00
|
100.00
|
|
Percentage of
|
Shareholding
|
|||||
|
The Holding Company
|
The Affiliate
|
Shares conferring rights to profits
|
Voting shares
|
|||
|
ICL Fertilizers Europe C.V., The Netherlands*
|
100.00
|
100.00
|
||||
|
NU3 N.V., Belgium
|
100.00
|
100.00
|
||||
|
Incap B.V, The Netherlands
|
100.00
|
100.00
|
||||
|
Pekafert B.V., The Netherlands
|
100.00
|
100.00
|
||||
|
ICL brasil Ltda.
|
100.00
|
100.00
|
||||
|
P.M. Chemicals Srl, Italy
|
100.00
|
100.00
|
||||
|
BK Giulini Kimya Sanayi ve Ticaret A.S,Turkey*
|
100.00
|
100.00
|
||||
|
Everris Kenya Ltd*, Kenya
|
50.00
|
50.00
|
||||
|
Eurocil Luxembourg SA, Luxembourg*
|
1.00
|
1.00
|
||||
|
Rotem Kimyevi Maddeler Sanayi ve Ticaret A.S, Turkey
|
73.30
|
73.30
|
||||
|
P.M. Chemicals Srl, Italy
|
—
|
—
|
—
|
|||
|
Everris Italia Srl , Italy
|
100.00
|
100.00
|
||||
|
ICL Holding beschränkt haftende OHG, Germany
|
—
|
—
|
—
|
|||
|
Stodiek Dunger GmbH, Germany
|
100.00
|
100.00
|
||||
|
ICL Holding Germany GmbH, Germany
|
100.00
|
100.00
|
||||
|
Rotem Holding GmbH. , Germany
|
100.00
|
100.00
|
||||
|
ICL Fertilizers Deutschland GmbH, Germany
|
100.00
|
100.00
|
||||
|
Eisenbacher Dentalwaren ED GmbH, Germany
|
100.00
|
100.00
|
||||
|
Adentatec GmbH Competence in Dental, Germany
|
100.00
|
100.00
|
||||
|
Everris GmbH, Germany
|
100.00
|
100.00
|
||||
|
Tiami Vattenkemi AB, Sweden
|
100.00
|
100.00
|
||||
|
ICL Holding Germany GmbH, Germany
|
—
|
—
|
—
|
|||
|
ICL Holding beschränkt haftende OHG, Germany*
|
5.00
|
5.00
|
||||
|
Incap B.V, The Netherlands
|
—
|
—
|
—
|
|||
|
Intracap Insurance Ltd., Switzerland
|
100.00
|
100.00
|
||||
|
ICL Brasil Ltda.
|
—
|
—
|
—
|
|||
|
Fosbrasil S.A, brasil
|
100.00
|
100.00
|
||||
|
Pekafert B.V., The Netherlands
|
—
|
—
|
—
|
|||
|
Eurocil Luxembourg SA, Luxembourg*
|
99.00
|
99.00
|
||||
|
Clearon Corp. , USA.*
|
2.00
|
2.00
|
||||
|
Eurocil Luxembourg S.A, Luxembourg
|
—
|
—
|
—
|
|||
|
Anti-Germ Austria GmbH, Austria
|
100.00
|
100.00
|
||||
|
Anti-Germ Deutschland GmbH, Germany
|
100.00
|
100.00
|
||||
|
ICL France S.A.S, France
|
100.00
|
100.00
|
||||
|
ICL France S.A.S, France
|
—
|
—
|
—
|
|||
| Scora S.A.S, France |
100.00
|
100.00
|
F-101
Note 30 – Group Entities (cont'd)
|
Percentage of
|
Shareholding
|
|||||
|
The Holding Company
|
The Affiliate
|
Shares conferring rights to profits
|
Voting shares
|
|||
|
Anti-Germ Austria GmbH, Austria
|
—
|
—
|
—
|
|||
|
Anti-Germ CZ s.r.o; Czech Republic*
|
98.00
|
98.00
|
||||
|
Anti-Germ Hungary, Hungary
|
100.00
|
100.00
|
||||
|
Anti-Germ Slovakia s.r.o., Slovakia
|
100.00
|
100.00
|
||||
|
Anti-Germ Slovakia s.r.o., Slovakia
|
—
|
—
|
—
|
|||
|
Anti-Germ CZ s.r.o; Czech Republic*
|
2.00
|
2.00
|
||||
|
BKG Puriphos B.V, The Netherlands
|
—
|
—
|
—
|
|||
|
ICL ASIA Ltd, Hong Kong
|
100.00
|
100.00
|
||||
|
Rotem Holding GmbH. , Germany
|
—
|
—
|
—
|
|||
|
BK Giulini, GmbH , Germany*
|
94.90
|
94.90
|
||||
|
Fibrisol Service Ltd. ,UK
|
100.00
|
100.00
|
||||
|
Fibrisol Service Australia Pty. Ltd., Australia
|
100.00
|
100.00
|
||||
|
BK Giulini Argentina S.A, Argentina*
|
95.00
|
95.00
|
||||
|
Shanghai Tari International Ltd., China
|
51.00
|
51.00
|
||||
|
Yunnan B.K Giulini Tianchuang Phosphate Co. Ltd., China
|
60.00
|
60.00
|
||||
|
Fibrisol Muscalla GmbH, Germany*
|
34.65
|
34.65
|
||||
|
ICL Polska Sp.z.o.o, Poland*
|
95.00
|
95.00
|
||||
|
BK Giulini Leather Chemistry Co. Ltd. Hong Kong
|
100.00
|
100.00
|
||||
|
BKG Personal Care Co., Ltd.Hong Kong
|
100.00
|
100.00
|
||||
|
Flexotex GmbH , Germany
|
100.00
|
100.00
|
||||
|
ICL Performance Products Jiangyin Co., Ltd. China*
|
53.05
|
53.05
|
||||
|
ICL North America Inc. USA
|
100.00
|
100.00
|
||||
|
BK Giulini Specialities Private Limited, India
|
51.00
|
51.00
|
||||
|
Turris Versicherungvermittlung GmbH, Germany
|
100.00
|
100.00
|
||||
|
ICL-IP Bitterfeld GmbH, Germany
|
100.00
|
100.00
|
||||
|
Fibrisol Service Australia Pty. Ltd., Australia
|
—
|
—
|
—
|
|||
|
Everris Australia Pty. Ltd. , Australia
|
100.00
|
100.00
|
||||
|
BK Giulini Leather Chemistry Co. Ltd. Hong Kong,
|
—
|
—
|
—
|
|||
|
ICL Performance Products Jiangyin Co., Ltd. China*
|
11.00
|
11.00
|
||||
|
ICL-IP Bitterfeld GmbH, Germany
|
—
|
—
|
—
|
|||
|
ICL-IP Bitterfeld Grundbesitz GmbH & Co KG, Germany*
|
94.90
|
94.90
|
||||
|
Flexotex GmbH , Germany
|
—
|
—
|
—
|
|||
|
BKG Finance Gmbh, Germany
|
100.00
|
100.00
|
Note 30 – Group Entities (cont'd)
|
Percentage of
|
Shareholding
|
|||||
|
The Holding Company
|
The Affiliate
|
Shares conferring rights to profits
|
Voting shares
|
|||
|
BKG Finance Sup GmbH, Germany
|
100.00
|
100.00
|
||||
|
ICL North America Inc, USA
|
—
|
—
|
—
|
|||
|
Phosphorus Derivatives Inc., USA
|
100.00
|
100.00
|
||||
|
ICL Performance Products Inc., USA
|
100.00
|
100.00
|
||||
|
ICL-IP America Inc. USA **
|
100.00
|
100.00
|
||||
|
Everris NA Inc, USA
|
100.00
|
100.00
|
||||
|
Clearon Corp. , USA*.
|
98.00
|
98.00
|
||||
|
ICL Performance Products Inc., USA
|
—
|
—
|
—
|
|||
|
ICL Performance Products LP, USA*,**
|
99.00
|
99.00
|
||||
|
ICL Performance Products LLC, US
|
100.00
|
100.00
|
||||
|
ICL Performance Products Canada Limited; Canada
|
100.00
|
100.00
|
||||
|
ICL Performance Products LLC, USA
|
—
|
—
|
—
|
|||
|
ICL Performance Products LP, USA*,**
|
1.00
|
1.00
|
||||
|
BKG Personal Care Co., Ltd.Hong Kong
|
—
|
—
|
—
|
|||
|
ICL Performance Products Jiangyin Co., Ltd. China*
|
35.95
|
35.95
|
||||
|
ICL Performance Products Jiangyin Co., Ltd. China*
|
Guangzhou Eclean Technology Co., Ltd, China
|
100.00
|
100.00
|
|||
|
ICL ASIA Ltd, Hong Kong
|
—
|
—
|
—
|
|||
|
ARM Ltd., Hong Kong
|
100.00
|
100.00
|
||||
|
ICL Fertilizers (India) Private Ltd.
|
100.00
|
100.00
|
||||
|
Jiaxing ICL Chemical Co., Ltd. , China
|
100.00
|
100.00
|
||||
|
Zhangjiagang FTZ ICL Trading Co. Ltd.
|
100.00
|
100.00
|
||||
|
ARM Ltd., Hong Kong
|
—
|
—
|
—
|
|||
|
ICL Trading (HK) Ltd., Hong Kong
|
100.00
|
100.00
|
||||
|
DDFR Corporation Ltd , Hong Kong
|
50.00
|
50.00
|
||||
|
BK Giulini Hong Kong Limited, Hong Kong
|
100.00
|
100.00
|
||||
|
AUB Storing and Services (Hong Kong) Ltd., Hong Kong
|
55.00
|
55.00
|
||||
|
BK Giulini Hong Kong Limited, Hong Kong
|
—
|
—
|
—
|
|||
|
BK Giulini Hygiene Hong Kong Ltd.
|
100.00
|
100.00
|
||||
|
Angang BK Giulini Water Treatment Co Ltd, China
|
50.00
|
50.00
|
||||
|
B.K. Giulini GmbH , Germany
|
—
|
—
|
—
|
|||
|
Fibrisol Muscalla GmbH, Germany*
|
65.35
|
65.35
|
||||
|
BK Mercosur S.A. , Uruguay
|
100.00
|
100.00
|
||||
|
Rhenoflex GmbH , Germany
|
100.00
|
100.00
|
||||
|
Rotem do Brasil Ltd. , Brasil
|
100.00
|
100.00
|
|
Percentage of
|
Shareholding
|
|||||
|
The Holding Company
|
The Affiliate
|
Shares conferring rights to profits
|
Voting shares
|
|||
|
Tari International N.Z Ltd.,New Zealand
|
100.00
|
100.00
|
||||
|
ICL Polska Sp.z.o.o, Poland*
|
5.00
|
5.00
|
||||
|
BK Giulini Argentina S.A*
|
5.00
|
5.00
|
||||
|
Hagesüd Interspice Gewürzwerke GmbH & Co. KG, Germany
|
100.00
|
100.00
|
||||
|
Hagesüd Gewürzwerke Beteiligungs GmbH Germany
|
100.00
|
100.00
|
||||
|
Hagesüd Interspice France S.A.R.L
|
100.00
|
100.00
|
||||
|
Rhenoflex GmbH , Germany
|
—
|
—
|
—
|
|||
|
Gurit Worbla GmbH , Germany
|
100.00
|
100.00
|
||||
|
Mifalei Tovala Ltd., Israel
|
—
|
—
|
—
|
|||
|
Sherut Integrated transportation services 2013 Ltd.
|
100.00
|
100.00
|
||||
|
Sherut Rail & Road Transportaion Services 1990 Registered Partnership, Israel***
|
100.00
|
100.00
|
||||
|
M.M.M. Company United Landfill Industries (1998) Ltd., Israel
|
33.33
|
33.33
|
||||
|
I.D.E. Technologies Ltd. Israel
|
—
|
—
|
—
|
|||
|
Ambient Technologies Inc., USA
|
100.00
|
100.00
|
||||
|
IDE Canaries S.A., Spain
|
100.00
|
100.00
|
||||
|
Larnaca Water Partners, Cyprus*
|
95.00
|
95.00
|
||||
|
Pelagos Desalination Services, Cyprus
|
100.00
|
100.00
|
||||
|
Detelca UTE, Spain
|
20.00
|
20.00
|
||||
|
Indian Desalination Engineering PVT Ltd., India
|
50.00
|
50.00
|
||||
|
V.I.D Desalination Company LTD, Israel
|
50.00
|
50.00
|
||||
|
OTID desalination partnership. Israel
|
50.00
|
50.00
|
||||
|
West Galile Desalination Company Ltd***, Israel
|
50.00
|
50.00
|
||||
|
ADOM Ashkelon desalination Ltd., Israel
|
40.50
|
40.50
|
||||
|
I.D.E.S.B DESALINATION PARTNERSHIP, Israel
|
50.00
|
50.00
|
||||
|
H2ID Ltd, . Israel
|
50.00
|
50.00
|
||||
|
OMIS Water Ltd, Israel
|
60.00
|
60.00
|
||||
|
IDE Technologies India Private Ltd. , India*
|
99.00
|
99.00
|
||||
|
Sorek Desalination Ltd. Israel
|
51.00
|
51.00
|
||||
|
Sorek Desalination Partnership. Israel
|
51.00
|
51.00
|
||||
|
Sorek Operation and maintenance company Ltd. Israel
|
51.00
|
51.00
|
||||
|
IDE Americas Inc, USA
|
100.00
|
100.00
|
||||
|
Desalination Plants (Development of Zarchin Process) Limited, Israel ***
|
86.50
|
100.00
|
||||
|
PCT Protective Coating Technologies Ltd., Israel
|
88.40
|
88.40
|
||||
|
Idea Desalination Construction Partnership*, Israel
|
99.00
|
99.00
|
|
Percentage of
|
Shareholding
|
|||||
|
The Holding Company
|
The Affiliate
|
Shares conferring rights to profits
|
Voting shares
|
|||
|
Idea Desalination Construction Partnership*, Israel
|
99.00
|
99.00
|
||||
|
IDE SAL WATER Ltd., Israel
|
100.00
|
100.00
|
||||
|
Ambient Technologies Inc., USA
|
—
|
—
|
—
|
|||
|
Larnaca Water Partners, Israel*
|
5.00
|
5.00
|
||||
|
IDE Technologies India Private Ltd. , India*
|
1.00
|
1.00
|
||||
|
IDE Canaries S.A., Spain
|
—
|
—
|
—
|
|||
|
Idea Desalination Construction Partnership*, Israel
|
1.00
|
1.00
|
||||
|
Dead Sea Magnesium Ltd.
|
—
|
0
|
—
|
|||
|
M.R.I. Research & Development Ltd.,Israel***
|
100.00
|
77.78
|
||||
|
Dead Sea Magnesium Inc., USA
|
100.00
|
100.00
|
||||
|
Israeli Light Metal Initiative Ltd. Israel
|
9.00
|
9.00
|
|
*
|
The investee is also held by other Group companies.
|
|
**
|
There are preferred shares.
|
|
***
|
In liquidation/inactive.
|
|
****
|
The company is held by other group companies, where the holding percentage changes from time to time according to the provisions of the Articles of Association.
|
F-105
TABLE OF CONTENTS
Part IItem 1 Identity Of Directors, Senior Management and AdvisorsItem 2 Offer Statistics and Expected TimetableItem 3 Key InformationItem 4 Information on The CompanyItem 4A Unresolved Staff CommentsItem 5 Operating and Financial Review and ProspectsItem 6 Directors, Senior Management and EmployeesItem 7 Major Shareholders and Related Party TransactionsItem 8 Financial InformationItem 9 The Offer and ListingItem 10 Additional InformationItem 11 Quantitative and Qualitative Disclosures About Market RiskItem 12 Description Of Securities Other Than Equity SecuritiesPart IIItem 13 Defaults, Dividend Arrangements and DelinquenciesItem 14 Material Modifications To The Rights Of Security Holders andItem 15 Controls and ProceduresItem 16A Audit Committee Financial ExpertItem 16B Code Of EthicsItem 16C Principal Accountant Fees and ServicesItem 16D Exemptions From The Listing Standards For Audit CommitteesItem 16E Purchase Of Equity Securities By The Issuer and Affiliated PurchasersItem 16F Change in Registrant S Certifying AccountantItem 16G Corporate GovernanceItem 16H Mine Safety DisclosurePart IIIItem 17 Financial StatementsItem 18 Financial StatementsItem 19 ExhibitsNote 1 GeneralNote 2 Basis Of Preparation Of The Financial StatementsNote 2 Basis Of Preparation Of The Financial Statements (cont'd) 1. Employee BenefitsNote 2 Basis Of Preparation Of The Financial Statements (cont'd)Note 3 Significant Accounting PoliciesNote 3 Significant Accounting Policies (cont'd)Note 4 Determination Of Fair ValuesNote 4 Determination Of Fair Values (cont'd)Note 5 Operating SegmentsNote 5 Operating Segments (cont'd)Note 6 Short-term Investments, Deposits and LoansNote 7 Trade ReceivablesNote 8 Other Receivables, Including Derivative InstrumentsNote 9 InventoriesNote 10 Investment in Investee CompaniesNote 10 Investment in Investee Companies (cont'd)Note 11 Assets Held For Sale and Business AcquisitionsNote 11 Assets Held For Sale and Business Acquisitions (cont'd)Note 12 Long-term Deposits and ReceivablesNote 13 Property, Plant and EquipmentNote 13 Property, Plant and Equipment (cont'd)Note 14 Intangible AssetsNote 14 Intangible Assets (cont'd)Note 15 Impairment Testing For Property, Plant and Equipment and Cash-generating Units Containing GoodwillNote 15 Impairment Testing For Property, Plant and Equipment and Cash-generating Units Containing Goodwill (cont'd)Note 16 Derivative InstrumentsNote 17 Credit From Banks and OthersNote 17 Credit From Banks and Others (cont'd)Note 18 Trade PayablesNote 19 Derivatives and Other PayablesNote 20 Taxes on IncomeNote 20 Taxes on Income (cont'd)Note 21 Employee BenefitsNote 21 Employee Benefits (cont'd)Note 22 ProvisionsNote 22 Provisions (cont'd)Note 23 Commitments, Concessions and Contingent LiabilitiesNote 23 Commitments, Concessions and Contingent Liabilities (cont'd)Note 24 EquityNote 24 Equity (cont'd)Note 25 Pledges and Restrictions Placed in Respect Of LiabilitiesNote 26 Details Of Income Statement ItemsNote 26 Details Of Income Statement Items (cont'd)Note 27 Financial Instruments and Risk ManagementNote 27 Financial Instruments and Risk Management (cont'd)Note 28 Earnings Per ShareNote 28 Earnings Per Share (cont'd)Note 29 Related and Interested PartiesNote 29 Related and Interested Parties (cont'd)Note 30 Group EntitiesNote 30 Group Entities (cont'd)