|
(Mark One)
|
|
|
|
REGISTRATION STATEMENT PURSUANT TO SECTION 12(b) OR (g) OF THE SECURITIES EXCHANGE ACT OF 1934
|
|
|
|
|
ANNUAL REPORT PURSUANT TO SECTION 13 OR 15(d) OF THE SECURITIES EXCHANGE ACT OF 1934
|
|
|
|
|
|
For the fiscal year ended
|
|
|
TRANSITION REPORT PURSUANT TO SECTION 13 OR 15(d) OF THE SECURITIES EXCHANGE ACT OF 1934
|
|
|
|
|
SHELL COMPANY REPORT PURSUANT TO SECTION 13 OR 15 (d) OF THE SECURITIES EXCHANGE ACT OF 1934
|
|
|
|
|
|
Date of event requiring this shell company report
|
|
|
For the transition period from
to
.
|
Tel: +
|
Title of each class
|
Trading Symbol(s)
|
Name of each exchange on which registered
|
|
|
|
|
|
Title of Class
|
Number of Shares Outstanding
|
|
Ordinary shares
|
|
|
|
Accelerated Filer
☐
|
Non-accelerated Filer
☐
|
|
Emerging Growth Company
☐
|
|
|

|
|
|
|
ICL Group Ltd
|

|
|
PART I
|
Page
|
||
|
1
|
|||
|
1
|
|||
|
1
|
|||
|
39
|
|||
|
165
|
|||
|
166
|
|||
|
199
|
|||
|
228
|
|||
|
237
|
|||
|
241
|
|||
|
241
|
|||
|
251
|
|||
|
260
|
|||
|
PART II
|
|||
|
260
|
|||
|
260
|
|||
|
261
|
|||
|
262
|
|||
|
262
|
|||
|
263
|
|||
|
263
|
|||
|
263
|
|||
|
264
|
|||
|
264
|
|||
|
266
|
|||
|
266
|
|||
|
266
|
|||
|
267
|
|||
|
Bromine
|
A chemical element used as a basis for a wide variety of
uses and compounds, and mainly as a component in flame retardants or fire prevention substances. Unless otherwise stated, the term “bromine”
refers to elemental bromine.
|
|
CDP
|
Carbon Disclosure Project – A leading non-profit organization
in the greenhouse gas emissions reporting field.
|
|
CFR
|
Cost and Freight. In a CFR transaction, the prices of goods
to customer include, in addition to FOB expenses, marine shipping costs and all other costs that arise after the goods leave the seller’s
factory gates and up to the destination port.
|
|
CLP
|
Classification, Labeling and Packaging of Substances and
Mixtures– EU regulation.
|
|
CPI
|
The Consumer Price Index, as published by the Israeli Central
Bureau of Statistics.
|
|
CRU
|
Intelligence company that provides information on global
mining, metal and fertilizers market.
|
|
ICL ADS
|
ICL América do Sul (formerly Compass Minerals América
do Sul S.A.).
|
|
Dead Sea Bromine
|
Dead Sea Bromine Company Ltd., included in the Industrial
Products segment.
|
|
MAP
|
Monoammonium Phosphate, a fertilizer containing nitrate and
phosphorus oxide.
|
|
GTSP
|
Granular Triple Superphosphate, used as fertilizer, a source
of high phosphorus.
|
|
GSSP
|
Granular Single Superphosphate, used as a phosphate fertilizer.
|
|
Green Hydrogen
|
Hydrogen produced by splitting water into hydrogen and oxygen
using renewable electricity.
|
|
DAP
|
Diammonium Phosphate - a fertilizer containing nitrate and
phosphorus oxide.
|
|
EPA
|
US Environmental Protection Agency.
|
|
FAO
|
The Food and Agriculture Organization of the United Nations.
|
|
FOB
|
Free on-Board expenses are expenses for overland transportation,
loading costs and other costs, up to and including the port of origin. In FOB transaction, the seller pays the FOB expenses, and the buyer
pays the other costs from the port of origin onwards.
|
|
CPT
|
Cost Per Ton.
|
|
CIF
|
Cost, Insurance, and Freight. In CIF transaction, the price
of goods includes, as well as FOB expenses, the expenses for insurance, shipping and any other costs that arise after the goods leave
the factory gates and up to the destination port.
|
|
ICL Haifa (Fertilizers & Chemicals)
|
Fertilizers and Chemicals Ltd., included in the Innovative
Ag Solutions segment.
|
|
GHG
|
Greenhouse Gases – air emissions contributing to climate
change.
|
|
Granular
|
Fertilizer having granular particles.
|
|
ICL Boulby
|
A United Kingdom subsidiary included in the Potash segment.
|
|
ICL Iberia (Iberpotash)
|
Iberpotash S.A., a Spanish subsidiary included in the
Potash segment.
|
|
IC
|
Israel Corporation Ltd.
|
|
Indicated Mineral Resource
|
That part of a mineral resource for which quantity and grade
or quality are estimated on the basis of adequate geological evidence and sampling. The level of geological certainty associated with
an indicated mineral resource is sufficient to allow a qualified person to apply modifying factors in sufficient detail to support mine
planning and evaluation of the economic viability of the deposit. Because an indicated mineral resource has a lower level of confidence
than the level of confidence of a measured mineral resource, an indicated mineral resource may only be converted to a probable mineral
reserve.
|
|
Inferred Mineral Resource
|
That part of a mineral resource for which quantity and grade
or quality are estimated on the basis of limited geological evidence and sampling. The level of geological uncertainty associated with
an inferred mineral resource is too high to apply relevant technical and economic factors likely to influence the prospects of economic
extraction in a manner useful for evaluation of economic viability. Because an inferred mineral resource has the lowest level of geological
confidence of all mineral resources, which prevents the application of the modifying factors in a manner useful for evaluation of economic
viability, an inferred mineral resource may not be considered when assessing the economic viability of a mining project and may not be
converted to a mineral reserve.
|
|
DSW
|
Dead Sea Works Ltd., included in the Potash segment.
|
|
DSM
|
Dead Sea Magnesium Ltd., included in the Potash segment.
|
|
ICL Neot Hovav
|
Subsidiaries in the Neot Hovav area in the south of Israel,
including facilities of Bromine Compounds Ltd included in the Industrial Products segment.
|
|
Rotem Israel
|
Rotem Amfert Negev Ltd., included in the Phosphate Solutions
segment.
|
|
IFA
|
The International Fertilizers Industry Association, an international
association of fertilizers manufacturers.
|
|
ILA
|
Israel Land Authority.
|
|
IMF
|
International Monetary Fund.
|
|
K
|
The element potassium, one of the three main plant nutrients.
|
|
KNO
3
|
Potassium Nitrate, a soluble fertilizer containing N&P
used as a stand-alone product or as a key component of some water-soluble blends.
|
|
KOH
|
Potassium hydroxide 50% liquid.
|
|
MGA
|
Merchant grade phosphoric acid.
|
|
Measured Mineral Resource
|
That part of a mineral resource for which quantity and grade
or quality are estimated on the based on conclusive geological evidence and sampling. The level of geological certainty associated with
a measured mineral resource is sufficient to allow a qualified person to apply modifying factors, as defined in this section, in sufficient
detail to support detailed mine planning and final evaluation of the economic viability of the deposit. Because a measured mineral resource
has a higher level of confidence than the level of confidence of either an indicated mineral resource or an inferred mineral resource,
a measured mineral resource may be converted to a proven mineral reserve or to a probable mineral reserve.
|
|
Mineral Reserve
|
An estimate of tonnage and grade or quality of indicated
and measured mineral resources that, in the opinion of the qualified person, can be the basis of an economically viable project. More
specifically, it is the economically mineable part of a measured or indicated mineral resource, which includes diluting materials and
allowances for losses that may occur when the material is mined or extracted.
|
|
Mineral Resource
|
A concentration or occurrence of material of economic interest
in or on the Earth's crust in such form, grade or quality, and quantity that there are reasonable prospects for economic extraction. A
mineral resource is a reasonable estimate of mineralization, taking into account relevant factors such as cut-off grade, likely mining
dimensions, location or continuity, that, with the assumed and justifiable technical and economic conditions, is likely to, in whole or
in part, become economically extractable. It is not merely an inventory of all mineralization drilled or sampled.
|
|
MoEP
|
Israel Ministry of Environmental Protection.
|
|
N
|
The element nitrogen, one of the three main plant nutrients.
|
|
P
|
The element phosphorus, one of the three main plant nutrients,
which is also used as a raw material in industry.
|
|
NPK
|
Complex fertilizer comprised primarily of 3 primary nutrients
(N,P,K).
|
|
NYSE
|
The New York Stock Exchange.
|
|
Phosphate
|
Phosphate rock that contains the element phosphorus. Its
concentration is measured in units of P
2
O
5
.
|
|
Polyhalite
|
A mineral marketed by ICL under the brand name Polysulphate™,
composed of potash, sulphur, calcium, and magnesium. Used in its natural form as a fully soluble and natural fertilizer, which is also
used for organic agriculture and as a raw material for production of fertilizers.
|
|
Probable Mineral Reserve
|
The economically mineable part of an Indicated
and, in some cases, a Measured Mineral Resource. Quantity, grade and/or quality of Probable Mineral Reserves are computed from information
similar to that used for Proven Mineral Reserves, but the sites for survey, sampling and measurement are further apart or are otherwise
less efficiently spaced. The degree of assurance, although lower than that for proven reserves, is high enough to assume continuity
between points of observation.
|
|
Proven Mineral Reserve
|
The economically mineable part of a Measured Mineral Resource.
Proven Mineral Reserve quantities are computed from information received from explorations, channels, wells, and drilling; grade and/or
quality are computed from the results of detailed sampling. The sites for inspection, sampling and measurement for proven reserves are
spaced so closely to each other so that the geologic character is well defined so the size, shape, depth and mineral content of reserves
can be reliably determined.
|
|
Chlorine
|
A chemical, raw material in various productions process.
A byproduct of Dead Sea Magnesium production.
|
|
Sylvinite
|
A byproduct from the production of Magnesium from the raw
material – Carnallite. Transferred to DSW as an additional source for potash production.
|
|
Polymer
|
A chemical compound containing a long chain of repeating
units linked by a chemical bond and created by polymerization.
|
|
Potash
|
Potassium chloride (KCl), used as a plant’s main source
of potassium.
|
|
P
2
O
5
|
Phosphorus pentoxide.
|
|
P
2
S
5
|
Phosphorus pentasulfide.
|
|
TCFD
|
Task Force on Climate-Related Financial Disclosures.
|
|
SASB
|
Sustainability Accounting Standards Board.
|
|
REACH
|
Registration, Evaluation, Authorization and Restriction of
Chemicals, a framework within the European Union.
|
|
Reserves
|
The part of a mineral deposit that could be economically
and legally extracted or produced at the time of the Mineral Reserve determination. Reserves are divided between “proven reserves”
and “probable reserves”.
|
|
Salt
|
Unless otherwise specified, sodium chloride (NaCl).
|
|
S
|
Sulphur – a chemical used for the production of sulfuric
acid for sulfate and phosphate fertilizers, and other chemical processes.
|
|
Soluble NPK
|
Soluble fertilizer containing the three basic elements for
plant development (nitrogen, phosphorus and potash).
|
|
Standard
|
Fertilizer having small particles.
|
|
Tami
|
Tami (IMI) Research and Development Institute Ltd.,
the central research institute of ICL.
|
|
TASE
|
Tel Aviv Stock Exchange, Ltd.
|
|
USDA
|
United States Department of Agriculture.
|
|
WPA
|
White Phosphoric Acid, purified from MGA.
|
|
Urea
|
A white granular or pill solid fertilizer containing 46%
nitrogen.
|
|
YTH/YPC
|
The Chinese partner in the Company’s joint venture
YPH in China.
|
|
4D
|
Clean green phosphoric acid, used as a raw material for purification
processes.
|
|
PM
|
Particular Matter
|
|
For the Year Ended December 31,
|
|||
|
2021
|
2020
|
2019
|
|
|
US$ millions
|
|||
|
Sales
|
6,955
|
5,043
|
5,271
|
|
Gross profit
|
2,611
|
1,490
|
1,817
|
|
Operating income
|
1,210
|
202
|
756
|
|
Income before taxes on income
|
1,092
|
49
|
628
|
|
Net income attributable to the shareholders of the Company
|
783
|
11
|
475
|
|
Earnings per share (in dollars):
|
|||
|
Basic earnings per share
|
0.61
|
0.01
|
0.37
|
|
Diluted earnings per share
|
0.60
|
0.01
|
0.37
|
|
Weighted average number of ordinary shares outstanding:
|
|||
|
Basic (in thousands)
|
1,282,807
|
1,280,026
|
1,278,950
|
|
Diluted (in thousands)
|
1,287,051
|
1,280,273
|
1,282,056
|
|
Dividends declared per share (in dollars)
|
0.21
|
0.09
|
0.22
|
|
For the Year Ended December 31,
|
|||
|
2021
|
2020
|
2019
|
|
|
US$ millions
|
|||
|
Statements of Financial Position Data:
|
|||
|
Total assets
|
11,080
|
9,664
|
9,173
|
|
Total liabilities
|
6,344
|
5,576
|
5,112
|
|
Total equity
|
4,736
|
4,088
|
4,061
|
|
For the Year Ended December 31,
|
|||
|
2021
|
2020
|
2019
|
|
|
US$ millions
|
|||
|
Operating income
|
1,210
|
202
|
756
|
|
Dispute and other settlement expenses (1)
|
5
|
-
|
7
|
|
Divestment related items and transaction costs from acquisitions
(2)
|
(22)
|
-
|
-
|
|
Impairment and disposal of assets, provision for closure
and restoration costs (3)
|
1
|
229
|
(3)
|
|
Provision for early retirement (4)
|
-
|
78
|
-
|
|
Total adjustments to operating income
|
(16)
|
307
|
4
|
|
Adjusted operating income
|
1,194
|
509
|
760
|
|
Net income attributable to the shareholders of the
Company
|
783
|
11
|
475
|
|
Total adjustments to operating income
|
(16)
|
307
|
4
|
|
Total tax adjustments (5)
|
57
|
(60)
|
-
|
|
Total adjusted net income - shareholders of the Company
|
824
|
258
|
479
|
|
|
(1) |
For 2021, the amount reflects settlement costs related to the
termination of partnership and arbitration proceedings between ICL Iberia and Nobian and reimbursement of arbitration costs related to
the Ethiopian potash project, which was partially offset by a reversal of a VAT provision following a court ruling in Brazil.
|
|
|
(2) |
For 2021, the amount reflects a capital gain related to the sale
of an asset located in the industrial area of Ashdod, Israel and to the divestment of the Zhapu site (China) from the Industrial Products
segment, which was partially offset by an earnout adjustment relating to prior years' divestment, as well as transaction costs related
to the acquisitions in Brazil.
|
|
|
(3) |
For 2021, the amount reflects a disposal of a pilot investment,
which will not materialize in Spain and an increase in restoration costs, offset by a reversal of an impairment due to the strengthening
of phosphate prices at Rotem Israel.
|
|
|
(4) |
For 2020, the amount reflects an increase in the provision following
the implementation of an efficiency plan, primarily through an early retirement plan, at Israeli production facilities (Rotem Israel,
Bromine Compounds and Dead Sea Magnesium).
|
|
|
(5) |
For 2021, the amount reflects the tax impact of the adjustments
made to the operational income and tax expenses related to the release of trapped earnings of the Company and certain Israeli subsidiaries.
For 2020, reflects the tax impact of the adjustments made to operational income.
|
|
|
• |
Our ability to operate and/or expand our production and operating
facilities
worldwide is dependent on our receipt of, and compliance
with, permits issued by governmental authorities. A decision by a government authority to deny any of our permit applications may impair
the Company’s business and its operations.
|
|
|
• |
As a leading global specialty minerals company, we are exposed
to various legislative
,
regulatory and licensing restrictions in the areas of
environmental protection and safety. Related compliance costs and liabilities may adversely affect the results of our operations.
|
|
|
• |
Our mineral extraction operations are dependent on concessions,
licenses and permits granted to us by the respective governments in the countries in which we operate.
|
|
|
• |
Securing the future of the phosphate mining operations at Rotem
Israel depends on obtaining several approvals and permits from the authorities in Israel.
|
|
|
• |
Current and future laws and regulations regarding climate change
and greenhouse gas (GHG) emissions, as well as the physical impacts of climate change, may affect our operations and businesses
.
|
|
|
• |
The continued spread of the COVID-19 pandemic has affected and
may in the future materially and adversely affect our financial condition and results of operations.
|
|
|
• |
Our operations and sales are exposed to volatility in supply and
demand, mergers of key producers\customers\suppliers, expansion of production capacity and competition from some of the world’s
largest chemical and mining companies.
|
|
|
• |
Our operations could be adversely affected by price increases
or shortages with respect to water, energy and our principal raw materials
.
|
|
|
• |
The accumulation of salt at the bottom of Pond 5, the central
evaporation pond in our solar evaporation ponds system used to extract minerals from the Dead Sea in Israel, requires regular harvesting
salt to maintain a fixed brine volume and thereby sustain the production capacity of extracted minerals and prevent potential damage to
the foundations and structures of hotels and other buildings situated close to the edge of the pond.
|
|
|
• |
The receding water level in the Northern Basin of the Dead Sea,
may require capital and/or operational expenses to enable the continuation of the Company's operations in the Dead Sea.
|
|
|
• |
We are exposed to risks associated with our international sales
and operations, which could adversely affect our sales to customers as well as our operations and assets in various countries. Some of
these factors may also make it less attractive to distribute cash generated by our operations outside Israel to our shareholders, use
cash generated by our operations in one country to fund our operations or repayments of our indebtedness in another country and support
other corporate purposes or the distribution of dividends.
|
|
|
• |
Changes in our evaluations and estimates, which serve as a basis
for analyzing our contingent liabilities and for the recognition and measurement of assets and liabilities, including provisions for waste
removal and the reclamation of mines, may adversely affect our business results and financial condition.
|
|
|
• |
Our tax liabilities may be higher than expected.
|
|
|
• |
Due to the nature of our operations, we are exposed to administrative
and legal proceedings, both civil and criminal, including as a result of alleged environmental contamination caused by certain of our
facilities.
|
|
|
• |
Geological and mining conditions and/or effects of prior mining
that may not be fully identified/assessed within the available data or that may differ from those based on our experience;
|
|
|
• |
Assumptions concerning future prices of products, operating costs,
updates to the statistical model and geological parameters according to past experience and developing practices in this field, mining
technology improvements, development costs and reclamation costs; and
|
|
|
• |
Assumptions concerning future effects of regulation, including
the issuance of required permits and taxes imposed by governmental agencies.
|
|
|
• |
Difficulties and costs associated with complying with a wide variety
of complex laws, treaties and regulations, including the U.S. Foreign Corrupt Practices Act (the “FCPA”), the UK. Bribery
Act of 2010 and Section 291A of the Israeli Penal Law;
|
|
|
• |
Unexpected changes in regulatory environments and increased government
ownership and regulation in the countries in which we operate;
|
|
|
• |
Political and economic instability, including civil unrest, inflation
and adverse economic conditions resulting from governmental attempts to reduce inflation, such as imposition of higher interest rates
and wage and price controls;
|
|
|
• |
Public health crises, such as pandemics and epidemics; and
|
|
|
• |
The imposition of tariffs, exchange controls, trade barriers or
sanctions, new taxes or tax rates or other restrictions, including the current trade dispute between the US and China
.
|
|
|
• |
The duration, severity and spread of the pandemic and the actions
required by government authorities or other health organizations to contain the disease or treat its impact, including the effectiveness
of the vaccinations developed and already administered in most countries
.
|
|
|
• |
The duration and severity of the sustained global recession, and
the uncertainty as to when global economy will fully recover.
|
|
|
• |
The possibility of additional outbreaks of the virus, or the development
of more harmful and resistant variants of the virus, or any possible recurrence of other similar types of pandemics, or any other widespread
public health emergencies.
|
|
|
• |
Significant disruption of global financial markets and credit
markets, which may reduce our ability to access capital or our customers’ ability to pay us for past or future purchases, which
could negatively affect our liquidity.
|
|
|
• |
The possibility of temporary closures of our facilities or the
facilities of our suppliers, customers, their contract manufacturers, and the possibility of certain industries shutting down.
|
|
|
• |
The ability to purchase raw materials in times of shortages resulting
from supply chain disruptions, quarantines, lockdown orders and production shutdowns.
|
|
|
• |
Lower demand and/or pricing for our products and a potential global
economic recession could lead to reduced demand in our end markets, particularly bromine compounds. In addition, the significant decline
in crude oil prices and the oil markets’ current ability to absorb excess supplies and rebalance inventory is likely to continue
to result in decreased demand for our clear brine fluids.
|
|
|
• |
The ability of our suppliers, contractors and third-party providers
to meet their obligations to us at previously anticipated costs and timelines without significant disruption.
|
|
|
• |
Our ability to continue to meet the manufacturing and supply arrangements
with our customers at previously anticipated costs and timelines without significant disruption.
|
|
|
• |
Some government incentive programs may be discontinued, expire
or be cancelled;
|
|
|
• |
Governments may initiate new legislation or amend existing legislation in order to impose additional and/or
increased fiscal liabilities on our business, such as additional royalties
,
natural
resource taxes or required investments, as has occurred in Israel;
|
|
|
• |
The applicable tax rates may increase;
|
|
|
• |
We may no longer be able to meet the requirements for continuing
to qualify for some incentive programs;
|
|
|
• |
Such incentive programs and tax benefits may be unavailable at
their current levels;
|
|
|
• |
Upon the expiration of a particular benefit, we may not be eligible
to participate in a new program or qualify for a new tax benefit that would offset the loss of the expiring tax benefit.
|
|
|
• |
Changes in trade agreements between countries, such as in the
trade agreements between the United States and China.
|
|
|
• |
Changes in international taxation laws, as may be adopted by several
countries we operate in, or sell to, may result in additional taxes or high tax rates being imposed on our operations.
|
|
|
• |
Emissions permit under the Israeli Clean Air Act (hereinafter
- the Law): In June 2021, the Company's emission permit was renewed by the Israeli Ministry of Environmental Protection (MoEP), until
September 2023. The renewed permit reflects an updated outline of requirements. Postponement in the execution of a limited number of projects
was granted within the framework of an administrative order under Section 45 of the Law, received in July 2021. Management still expects
difficulties in meeting the execution schedules of a limited number of projects and accordingly continues to work with the MoEP to find
a satisfactory solution regarding the timing of the investments, taking into account the impact of uncertainty surrounding Rotem Israel's
activity, as far as the implementation of long-term projects is concerned.
|
|
|
• |
Oron's lease agreement - The Company has been working to extend
the lease agreement for Oron's plant area since 2017 by exercising the extension option provided in the agreement.
|
|
|
• |
Phosphogypsum storage - In October 2021, a new Urban Building Plan was approved, the main objectives of
which are to regulate areas for phosphogypsum storage reservoirs. According to the new Plan, the Company is required to obtain building
permits involving permit fees. Due to the ambiguity of the guidelines regarding the fee's calculation, there is a difficulty in estimating
the future required outflows.
|
|
|
• |
Energy
production – In order to ensure the continuity of energy production in Rotem Israel, and in accordance with the policy of the Ministry
of Energy and the Ministry of Environmental Protection, the Company is working to accelerate the completion of a project to replace existing
energy production infrastructure at Rotem, which utilizes oil shale, with a natural gas-based steam boiler, so it will be completed before
the existing mined reserves of oil shale are utilized
.
|
|
|
• |
Finding
economically feasible alternatives for continued mining of phosphate rock in Israel – According to the Company's assessment of economic
phosphate reserves in the existing mining areas and the estimated useful life of Rotem's phosphate rock reserves, which are essential
for its production, is limited to only a few years. The Company is working to obtain permits and approvals which will provide an economic
alternative for future mining of phosphate rock in Israel
.
|
|
|
• |
The composition of our Board of Directors (other than external
directors, as described under “Item 6 - Directors, Senior Management and Employees— C. Board Practices— External Directors”);
|
|
|
• |
Mergers, acquisitions, divestitures or other business combinations;
|
|
|
• |
Future issuances of ordinary shares or other securities;
|
|
|
• |
Amendments to our Articles of Association, excluding provisions
of the Articles of Association that were determined by virtue of the Special State Share
;
and
|
|
|
• |
Dividend distribution policy
.
|
|
|
• |
Expiration or termination of licenses and/or concessions;
|
|
|
• |
General stock market conditions;
|
|
|
• |
Decisions by governmental entities that affect us;
|
|
|
• |
Variations in our and our competitors’ results of operations;
|
|
|
• |
Changes in earnings estimates or recommendations by securities
analysts; and
|
|
|
• |
General market conditions and other factors, including factors
unrelated to our operating performance.
|
|
|
• |
In January 2021, we completed the acquisition of Agro Fertiláqua
Participações S.A., one of Brazil's leading specialty plant nutrition companies, and in July 2021, we acquired the South American
Plant Nutrition business of Compass Minerals América do Sul S.A. (hereinafter - ADS).
|
|
|
• |
In July 2021, we completed the sale of Jiaxing ICL Chemical Co.
Ltd (ICL Zhapu), which was part of our Industrial Products segment to China Sanjiang Fine Chemicals Company Limited.
|
|
|
• |
In May 2020, we completed the sale of Hagesüd Interspice
Gewürzwerke GmbH, including related real-estate assets, to Solina Corporate SAS.
|
|
|
• |
In February 2020, we completed the acquisition of Growers Holdings,
Inc., an innovator in the field of process and data-driven farming. For further information see "Item 5 – Operating and Financial
Review and Prospects – C. Research and Development, Patents and Licenses, etc. – Research and Development"
.
|
|
|
• |
In March 2018, we completed the sale of our fire safety and oil
additives businesses, for $1,010 million.
|
|
|
• |
Access to one of the world’s richest, longest‑life
and lowest‑cost sources of potash and bromine (the Dead Sea).
|
|
|
• |
A potash mine and processing facilities in Spain.
|
|
|
• |
Bromine compounds processing facilities in Israel, the Netherlands
and China.
|
|
|
• |
A unique integrated phosphate value chain that extends from phosphate
rock mines in Israel and in China to value‑added downstream products produced in facilities located in Israel, Europe, the United
States, Brazil and China. Our specialty phosphates serve the food industry by providing texture and stability solutions to the meat, meat
alternatives, poultry, sea food, dairy and bakery markets
,
as well as numerous
other industrial markets
,
such as metal treatment, water treatment, oral care,
carbonated drinks, asphalt modification, paints and coatings and more.
|
|
|
• |
Polysulphate® resources in the United Kingdom.
|
|
|
• |
Customized, highly effective specialty fertilizers that provide
improved value to the grower
,
as well as essential nutrition for plant development,
optimization of crop yields and reduced environmental impact.
|
|
|
• |
A focused and highly experienced team of technical experts that
develop production processes, new applications, formulations and products for our agricultural and industrial markets.
|
|
|
• |
A strong crop nutrition sales and marketing infrastructure that
optimizes distribution channels of commodity, specialty and semi-specialty fertilizers by leveraging its commercial excellence, global
operational efficiency, region-specific knowledge, agronomic and R&D capabilities, logistical assets and customer relationships.
|
|
|
• |
Research & Development and Innovation: We benefit from
our proximity to Israel’s global-leading high-tech and agri-tech eco-system, as well as our vast agronomy and chemistry knowledge
that we have accumulated over decades. Our extensive global R&D infrastructure includes 26 R&D and Innovation centers around the
world that employ 300 highly experienced personnel who have obtained 770 patents in 220 patent families. ICL's R&D unit supports the
development of new, innovative products, applications and formulations for each of our operating segments through internal research, employee
ideation and collaborative research with third parties.
|
|
|
• |
An extensive global logistics and distribution network with operations
in over 30 countries.
|
|
|
• |
The acquisitions of Fertiláqua and ADS have helped position
ICL as the leading specialty plant nutrition company in Brazil.
|

|
|
• |
Unique portfolio of mineral assets
.
Access
to these assets provides us with a consistent, reliable supply of raw materials, allows for large scale-production, and supports our integrated
value chain of specialty products.
|
|
|
• |
Diversification into higher value‑added
specialty products leverages our integrated business model.
The Company’s integrated production processes are based on a
synergistic value chain which allows us to both efficiently convert raw materials into value‑added downstream products and to utilize
the by‑products. For example, in phosphates, we utilize backward integration to produce specialty phosphates for the food industry
and for industrial applications. These businesses benefit from higher growth rates, higher margins and lower volatility compared to commodity
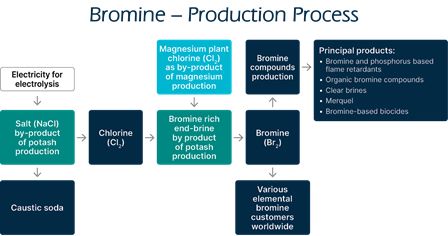
phosphates. In addition, as a by‑product of the potash production at the Dead Sea, we generate brines with the highest bromine concentration
globally. Our bromine‑based products serve various industries such as the electronics, construction, oil and gas and automotive
industries
.
|
|
|
• |
Leading positions in markets with
high barriers to entry
.
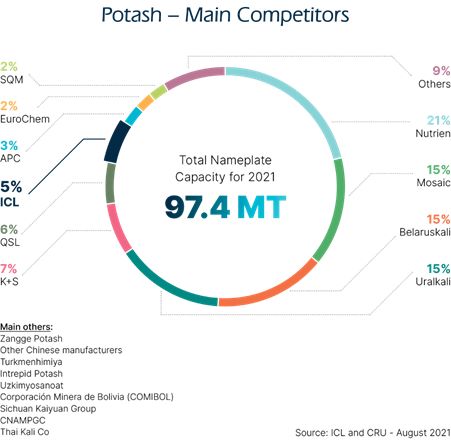
ICL has leadership positions
in many of the key markets in which it operates. It is the clear leader in the bromine market, with 40% of market capacity, or approximately
one third of global production, as well as most of the excess capacity in the market. In the potash market, our Dead Sea operations have
a leading competitive position and, according to CRU, the Dead Sea is among the most competitive potash suppliers to China, India and
Brazil. ICL also has the largest market share in specialty phosphates, in the combined markets of North America, Europe and Latin America
and is the sole producer of Polysulphate®. ICL has leadership positions in additional product lines, such as phosphorous-based flame
retardants, PK fertilizers in Europe, and soluble phosphate‑based fertilizers
.
|
|
|
• |
Strategically located production
and logistics assets.
We benefit from the proximity of our facilities, both in Israel and Europe, to developed economies (Western
Europe) and emerging markets (such as China, India and Brazil). In Israel, we ship from two seaports: the Port of Ashdod (with access
to Europe and South America) and the Port of Eilat (with access to Asia, Africa and Oceania). Access to these two ports provides us with
two distinct advantages versus our competitors: (1) lower plant ‑to‑port, ocean freight, and transportation costs from
our ports to our target markets, which lower our overall cost structure; and (2) faster time to markets, due to our proximity to
end‑markets, which allows us to opportunistically fill short lead‑time orders and strengthen our position with our customers.
|
|
|
• |
Strong cash
generation and
closely
monitored capital allocation approach
. A continuous focus
on cash generation and the optimization of capital expenditures (CAPEX) and working capital – as well as the implementation of efficiency
measures – enabled us to generate operating cash flow of $1,065 million in 2021, an increase of 32% compared to 2020. ICL's capital
allocation approach balances its long‑term value creation through investments in its growth, with its commitment to providing a
solid dividend yield, while aiming to maintain an investment grade rating of at least BBB- by S&P and Fitch. In February 2020, the
Company’s Board of Directors resolved to extend our dividend policy of a payout ratio of up to 50% of annual adjusted net income,
until further notice. In respect to 2021 adjusted net income, the Company declared total dividends in the amount of $411 million, reflecting
a dividend yield rate of approximately 4.57% (based on the average share price for the year). See “Item 8 - Financial Information—
A. Consolidated Statements and Other Financial Information— Dividend policy”.
|
|
|
• |
Professional
expertise and culture of collaboration and determination
.
Our operations are managed by an international management team with extensive industry experience. ICL develops leaders with strong experience
in their fields and focuses on nurturing and empowering talent through a global platform of qualification, collaboration and communication,
in order to drive change and innovation within the Company.
|
|
|
• |
In 2021, we established Agmatix, an agro-informatics start-up
that creates data-driven solutions for ag professionals worldwide. Agmatix has developed a cutting-edge platform that uses agronomy data
science and advanced AI technology to convert agronomic data into actionable insights at the field level. Agmatix aims to compensate the
challenge of data standardization in order to dramatically increase crop yield, and quality, and to promote sustainable agriculture.
|
|
|
• |
In July 2021, we launched ‘ICL Planet Startup Hub’,
a foodTech and agriTech accelerator, aimed at offering ICL’s knowledge, experience, market access, and resources to startups
operating within and adjacent to ICL’s core areas of expertise. ICL Planet Startup Hub’s first investment was a $1 million
series A investment in Protera, an AI-driven start-up designing and developing new proteins and providing for a wide range of plant-based
sustainable solutions to the alternative protein market.
|
|
|
• |
As part of our effort to expand our global Food Specialties portfolio and to focus the development of healthier
and more sustainable food products, the Company launched a new alternative-protein fiber production facility in St. Louis in December
2021. The facility will produce plant-based protein fibers to be used in the production of meat substitute products sold by food companies,
food-service distributors, restaurants and grocery chains
|
|
|
• |
During 2021, we also expanded our specialty products offerings
by producing a mono ammonium phosphate battery grade MAP solution for the production of LFP batteries, destined for electric vehicles
and other energy storage uses. The Company also collaborates with research and academic institutes to advance LFP technology.
|
|
|
• |
In February 2020, ICL acquired Growers Holdings, Inc. ('Growers'),
an innovator in the field of process and data-driven farming, to help further enhance our digital service offerings and accelerate our
global development roadmap. The Growers platform collects and structures manual and machine-generated farm data, instantly creating agile
and return-focused plans for planting, fertilization and purchasing decisions.
|
|
|
• |
Our strong commitment to foster an innovation-driven culture is
also reflected by the establishment of an internal innovation accelerator, designed "Business Innovation for Growth" (BIG), aimed to optimally
leverage the experience, knowledge and ingenuity of our approximately 12,000 employees worldwide. This integrated ideation platform also
provides a structured evaluation process, professional support and resources for developing the ideas raised by employees and enables
them to create a meaningful business impact. Since the program’s launch in January 2020, ICL employees submitted more than 3,000
ideas across various areas of ICL’s businesses, including new applications and products, production optimization and debottlenecking,
implementation of Industry 4.0 technologies, introduction of new business models, service improvement and enhancement, supply chain optimization,
digitalization of manual business processes, adoption of more sustainable production and operational process, sustainable products development
and waste to product projects and much more. Out of the ideas submitted to date, more than 930 have become fully funded projects, of which
nearly 600 were completed by the end of 2021. These projects have made an outstanding contribution to ICL's current and future profits,
as well as to many other aspects of the Company’s business, including commercial and service excellence, operational excellence,
suitability, safety, employee satisfaction and other qualitative aspects.
|
|
Sub-business line
|
Product
|
Primary Applications
|
Primary End‑Markets
|
|
Flame retardants
|
Bromine-, phosphorus and magnesium-Based Flame Retardants
|
Plastic, building materials and textile production
|
Electronics, automotive, building and construction, furniture
and textiles
|
|
Industrial solutions
|
Elemental Bromine
|
Chemical reagent
|
Tire manufacturing, pharmaceuticals and agro
|
|
Phosphorus-based industrial compounds
|
Fire resistant fluids in turbines & power generation
hydraulic systems and phosphorus-based inorganic intermediates
|
Power plants and agro
|
|
|
Organic Bromine Compounds
|
Insecticides, solvents for chemical synthesis and chemical
intermediates
|
Pharmaceuticals and agro
|
|
|
Clear Brines
|
Oil and gas drillings
|
Oil and gas
|
|
|
Merquel
|
Mercury emission control
|
Emission control in coal‑fired power plants
|
|
|
Bromine‑Based Biocides
|
Water treatment and disinfection
|
Cooling towers, paper plants and oil and gas drillings
|
|
|
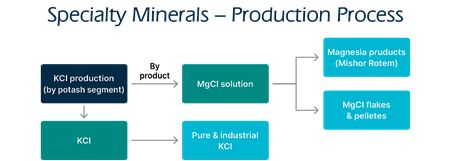
Specialty minerals
|
Magnesia Products
|
Pharma and Supplementals, transformer steel, catalysts,
fuel and oil additives.
|
Supplementals, multivitamins, transformer steel, automotive
rubber and plastic, health care
|
|
Calcium Carbonate
|
Supplementals and pharma
|
Supplementals and pharma
|
|
|
Solid MgCl2, KCl
|
Deicing, food, oil drilling, pharma
|
Deicing, sodium replacement, KCl for drugs. multivitamins,
oil drilling companies, small industrial niche markets
|

|
|
• |
The relatively low average cost of potash production at the Dead
Sea, using the sun as a solar energy source in the evaporation process.
|
|
|
• |
Logistical advantages due to our geographical location, access
to nearby ports in Israel and Europe and relative proximity to our customers, which are reflected in particularly competitive marine and
overland shipping costs and delivery times.
|
|
|
• |
Climate advantages due to the hot and dry climate of the Dead
Sea that enable us to store, at very low cost, a large quantity of potash in an open area thereby allowing us to constantly produce at
Sodom at full capacity, independent of fluctuations in global potash demand.
|
|
|
• |
Our mine in Spain is one of the last mines in Western Europe,
creating logistics advantages in supplying customers in Europe.
|
|
|
• |
Currently, we are the sole producer of Polysulphate® worldwide. Regarding an additional potential
future producer of Polysulphate®, see “Item 3 – Key Information – D. Risk Factors – Our operations and sales
are exposed to volatility in supply and demand, mergers of key producers\customers\suppliers, expansion of production capacity and competition
from some of the world’s largest chemical and mining companies".
|
|
|
• |
Our ability to increase production at a relatively low capital
expenditure.
|
|
|
• |
Polysulphate® and Polysulphate®-based fertilizers, customized
to meet the needs of different crops and soil types, maximize yield and allow more precise and efficient applications.
|
|
|
• |
Polysulphate® contributes to and follows the main market
trends in the fields of increased nutrient-use efficiency, low carbon footprint and organic fertilizers.
|
|
|
• |
PotashpluS – a compressed mixture of Polysulphate®
and potash. The product includes potassium, sulphur, calcium and magnesium. ICL continued the growth trend of PotashpluS throughout 2021
and plans to continue this trend in 2022.
|
|
|
• |
PKpluS – a unique combination of phosphate, potash and Polysulphate
®. In 2021, the Company, through our Phosphate Solutions Segment, increased PKpluS sales and plans to continue this trend in 2022.
|
|
|
• |
NPKpluS – a unique combination of Nitrogen, phosphate, potash
and Polysulphate®. This product includes all 6 macro nutrients in one granule
|
|
|
• |
Polysulphate premium – granulated uniform, robust spheres
of natural, multi-nutrient Polysulphate fertilizer with smooth surface protects from abrasion, humidity or damage & gives consistent
flow rate
|
|
|
• |
NovaPhos – ensures an effective supply of slow-release phosphorus,
calcium, magnesium and micronutrients for crops, specifically tailored for use in acidic soil.
|
|
|
• |
NPS – a nitrogen-phosphate fertilizer compounded with sulphur,
which provides exceptional effectiveness for the enhancement of a wide range of crops through the combination of these three nutrients
in one product.
|
|
|
• |
PK+Micronutrients – a tailor-made fertilizer, with precise
micronutrient composition for the specific type of crop.
|
|
|
• |
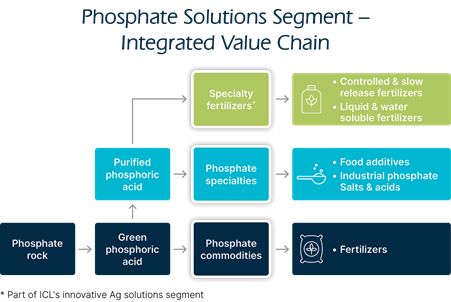
An integrated value chain that uses phosphate rock mined in Israel
(at Rotem Israel), as well as in China (YPH) to produce green phosphoric acid, which serves mainly as a raw material for the production
of the segment's products and for the production of our Innovative Ag Solutions products
.
|
|
|
• |
Logistical advantages due to the segment's geographical location
and diversification, proximity to ports in Israel and Europe and relative proximity to its customers.
|
|
|
• |
Our Company is a global fertilizer producer that can combine potash
and phosphate fertilizers in the same shipment, which enables us to service smaller customers, particularly in Brazil and the United States.
|
|
|
• |
The segment enjoys a competitive advantage in specialty phosphates
deriving from product features, quality, service, technical application support, a global manufacturing footprint and a very broad product
line.
|
|
|
• |
YPH provides an integrative phosphate platform in China
,
with better access to the Chinese market. In addition, the segment enjoys a competitive cost advantage in its phosphate activities
,
due to access to low‑cost phosphate rock with long‑term reserves
.
|
|
|
• |
Controlled‑release fertilizers (CRF) allow accurate release
of nutrients over time. CRFs have a special coating that allows prolonged release of nutrients over several weeks and up to 18 months
- compared to regular fertilizers that dissolve in the soil and are immediately available but therefore leach partially in the soil. ICL
Innovative Ag Solutions has leading global brand-name products including Osmocote, Agroblen
,
Agrocote
,
Polyblen and Producote.
|
|
|
• |
Soluble fertilizers, which are fully water‑soluble, and
fully‑soluble NPK compound fertilizers, are commonly used for fertilization through drip irrigation systems to optimize fertilizer
efficiency in the root zone to maximize yields. These fully soluble fertilizers are also used sometimes for foliar applications. Our well-known
brands for fertigation are Peters, Universol, Agrolution, NovaNPK and Novacid. ICL develops specific formulations for different applications
and circumstances. In South America, products such as Profol, Kellus, Tonus, Translok, Forcy, Nutritio, Vegetação and Dimi Tônico
are used as high technology products for farmers to improve plant nutrition and physiology through foliar fertilization. There are specific
formulations for specific crops, greenhouses and/or open fields, as well as for different water types
.
|
|
|
• |
We also sell ‘Straight fertilizers’ which are crystalline,
free‑flowing and high purity phosphorus soluble fertilizers such as MKP, MAP and PeKacid. Key brands include NovaPeak & NovaMAP.
PeKacid is the only solid highly acidifying, water
-
soluble fertigation product
that contains both phosphorus and potassium. The product is ideal for specific water conditions where an acidifying effect is required,
as well as for keeping dripping lines clean.
|
|
|
• |
Liquid fertilizers are used for intensive agriculture and are
integrated in irrigation systems (mainly drip systems). Our product line includes mostly tailor‑made formulations designed for specific
soil & water/climate conditions and crop needs.
|
|
|
• |
Peat, a growing medium for various crops, where generally controlled‑release
fertilizers and plant‑protection products are mixed in. Specific formulations of growing media are designed for specific plant needs,
such as greenhouse bedding plants and outdoor nurseries. A well-known ICL brand is the “Levington” brand. Inclusion of growing
media products in the portfolio in the UK allows ICL to offer an effective total solution to its customers. We intend to use more
circular products and have extended our growing media offerings with Fibagro Advance, a unique and superior peat alternative manufactured
in the UK. This innovative and advanced woodfibre product is being used as a key component in professional growing media mixes and provides
professional growers with a sustainable growing solution
.
|
|
|
• |
Water conservation and soil conditioning products are new product
lines developed by the segment. Water conservation products are used in professional turf to keep water in the root-zone. Key brands are
H2Flo and H2Pro. In 2021, the H2Gro brand grew strongly in the ornamental horticulture market. These products significantly reduce irrigation
requirements. This new technology is also used in agriculture to allow better water availability around the root-zone of the crops.
|
|
|
• |
Seed treatment technologies are used to deliver plant nutrients
and bio-stimulants, with a focus on improved root development, early plant development and nitrogen fixation. Several products and brands
serve the needs of different crops such as ProSelect and Landscaper Pro
.
|
|
|
• |
Bio-stimulants technologies such as Triplus, Improver, Concorde,
Vegetação and Dimi Tônicoare, are being successfully used by farmers to increase their productivity and alleviate abiotic
stress, such as drought, salinity and others.
|
|
|
• |
Adjuvants are essential to enhance foliar nutrition, herbicides
and crop protection spray. We offer the South American market adjuvant technologies including Helper, Tensor Max and AD+ as well as various
formulations that address the primary challenges facing farmers, such as drift and run off
.
|
|
|
• |
Soil conditioner has a set of amino and organic acids which contribute
to the soil biological balance and help increase the index of beneficial microorganisms and, thus enlarge the capacity to revitalize the
macro environment in a sustainable way. Recent research has indicated substantial potential for the product to maintain soil carbon stocks.
The segment's brands
,
Mol Top and Longevus
,
contain a mix of carefully developed components that increase plant production potential
.
|
|
|
• |
A strong, efficient and integrated supply chain with in-house
access to high quality raw materials, mostly phosphate and potash, which is based on an extensive product portfolio and multi-location
production.
|
|
|
• |
Unique R&D and product development capabilities, creating
a strong platform for future growth in controlled-release fertilizers, fertigation, foliar soluble fertilizers, enhanced nutrients, bio-stimulants
water
efficiency and innovative, next generation products.
|
|
|
• |
Added value production process technology – custom-made
formulations that meet our customers’ unique needs.
|
|
|
• |
A highly skilled global agronomic sales team that provides professional
advice and consultation which fosters loyalty by distributors.
|
|
|
• |
Full product portfolio (one-stop shop).
|
|
|
• |
ICL’s well-known and leading brands.
|
|
|
• |
Direct working relationships with farmers (B2C) especially in
Brazil, providing service at the field level and accelerates the innovation cycle
.
|
|
|
• |
MagiK, a fertilization product developed from a by-product stream created as part of our magnesium's production
process.
|
|
|
• |
Fibagro Advance, a peat alternative growing media that uses waste,
from the timber industry, and a thermo-mechanical process, to create a unique matrix that improves moisture and nutrient retention. It
also has a lower carbon footprint, compared with peat and other peat alternatives.
|
|
|
• |
Our Phosphate Solution segment is integrating new technologies
to use secondary source phosphate as an alternative to virgin raw materials. There are immediate uses in our production facilities in
Europe and we are developing future sources for our fertilizer products, including a technology roadmap for recycling and recovery of
phosphorus and nitrogen from secondary sources
.
|
|
|
• |
In ICL Dead Sea, some salt was used in the rehabilitation of an
abandoned site and the construction of an observatory for use by the public.
|
|
|
• |
PSLoop - ICL is one of the co-founders of the PolyStyrene Loop (PSL) recycling project, together with
the complete PS value chain, which introduces a recycling scheme for PolyStyrene (PS) foams containing the flame retardant HBCD (Hexabromocyclododecane).
The PolyStyrene Loop facility in the Netherlands will recycle EPS insulation and will turn EPS foam demolition waste into new high-quality
raw material. Impurities, such as cement or other construction residues, as well as the legacy flame retardant HBCD, will be safely removed,
the valuable bromine it contains recovered and re -used in the new polymeric flame-retardant FR-112P.
|
|
|
• |
Phosphogypsum for building roads - As part of YPH circular economy efforts, the Company develops a variety
of different uses for Phosphogypsum - our only by-product that has not yet been fully utilized. In addition to the existing solutions,
that were already developed and implemented, the company has developed a new solution for integrating phosphogypsum into road paving.
A full-scale pilot is expected to be carried out in China in 2022.
|
|
|
• |
Physical risks:
2030 and
2050, using the Intergovernmental Panel on Climate Change (IPCC) Representative Concentration Pathway (RCP) 4.5 (low carbon scenario)
and 8.5 (high carbon scenario);
|
|
|
• |
Transition risks and opportunities:
2025, 2030, 2040 and 2050, using
the two scenarios ‘Stated Policies Scenario (STEPS)’ and ‘Sustainable Development Scenario (SDS)’ developed by
the International Energy Agency (IEA). Additional scenario data was obtained from equivalent scenarios to STEPS/SDS. The IEA scenarios
use carbon prices as an input into their modelling For example, STEPS take into consideration existing or announced carbon pricing schemes
and in SDS it is assumed that pricing is established in all advanced economies.
|
|
Location
|
Short-term 0 to 3 years (2022
to 2025)
|
Medium-term 3 to 13 years (2025
to 2035)
|
Long-term 13+ years (2035 to 2050)
|
|
Israel
|
Extreme Heat, storm & wind
|
Extreme heat, storms and wind, water stress.
|
Extreme heat, storms and wind, water stress
|
|
China
|
Watercourse & rainfall flooding, storms & wind, water
stress
|
Extreme heat, watercourse & rainfall flooding
|
Extreme heat, watercourse & rainfall flooding
|
|
Europe
|
Watercourse flooding, storm & wind
|
Extreme heat, watercourse & coastal & rainfall flooding,
storms & wind, water stress
|
Extreme heat, watercourse & coastal flooding, storms
& wind, water stress, wildfires
|
|
USA
|
Watercourse flooding, extreme heat, storms, & wind
|
Extreme heat, watercourse flooding, storms & wind, water
stress
|
Extreme heat, WC flooding, storms & wind, water stress
|
|
Risk / Opportunity description
|
Key ICL Segments
|
Risk / opportunity
|
Planned or existing responses
|
|
Regulation and Policy particularly in the medium term: Additional
costs associated with increasingly stringent climate policy mechanisms, such as carbon pricing, emissions trading and carbon taxes including
carbon border mechanism advancements.
|
All
|
Risk
|
Measures to reduce industrial
CO
2
e
intensity, such as internal carbon pricing, fuel switching, electrification, production process optimization and energy efficiency
|
|
Regulatory and Policy, Market Demand and Reputational, particularly
in the medium term: Increasing requirements to invest in renewable electricity generation, storage and purchasing, due to external policies
and internal targets.
Investment in site's operational improvements, such as energy
efficiencies and optimization of production processes.
|
All, particularly Potash and Phosphate Solutions
|
Risk
|
Measures to transition away from unabated natural gas use,
such as fuel switching, electrification, process optimization and energy efficiency
|
|
Market demand in the medium and long term - Decrease consumer
demand for some of ICL’s products
|
All, mainly IP and Phosphate Solutions
|
Risk
|
•
Reviewing
potential risks.
•
RD&I
is working to find alternatives and new opportunities
|
|
Regulatory and Policy particularly in the medium term:
Increased shipping transportation costs as a result of measures
(investments/regulatory instruments) implemented to increase efficiency of the global shipping fleet
|
All
|
Risk
|
•
Explore
using low-carbon shipping methods and suppliers in the global supply chain
|
|
Market Demand in the short to medium term:
Increased consumer demand for ICL’s low-carbon products
driving up revenue
|
All
|
Opportunity
|
•
Investment
into R&D for low-carbon fertilizers, as well as meat and dairy substitutes
•
Increase
in target revenue for low-carbon products – aligning with the trend for product circularity and life cycle regulation
•
Creating
procedures to collect, analyse and manage GHG data from all operations
|
|
Risk / Opportunity description
|
Key ICL Segments
|
Risk / opportunity
|
Planned or existing responses
|
|
Regulation and Policy driving Market Demand and Technology
Innovation in the short to longer term:
Increase in renewable energy generation leading to a reduction
in emissions and operating costs
|
Dependent on geography, all particularly Potash and Phosphate
Solutions
|
Opportunity
|
•
Energy
efficiency
•
Increase
in renewable energy generation or procurement
|
|
Regulation and Policy driving Market Demand in the short
to medium term:
Increased electrification of industrial processes leading
to a reduction in emissions and operating costs
|
All, particularly Potash
|
Opportunity
|
•
Electrifying
fossil fuel-based industrial processes
|
|
Year 2021 (1)
|
Year 2018 (2)
|
VS 2018
|
||
|
Scope 1
|
CO
2
e
tons (thousands)
|
2,158
|
2,220
|
(2.8%)
|
|
Scope 2
|
CO
2
e
tons (thousands)
|
380
|
720
|
(47.2%)
|
|
Total scope 1+2 GHG emission
|
CO
2
e
tons (thousands)
|
2,538
|
2,940
|
(13.67%)
|
|
|
(1) |
Emissions from facilities acquired during 2021 are not included
in the current greenhouse gas measurements.
|
|
|
(2) |
2018 is the baseline year for ICL’s decarbonization roadmap.
|
|
|
• |
The development of “next generation fertilization”
to promote nutrient use efficiency, biodegradable coatings, nutrient sensing, growth enhancers, nitrogen fixation and soil health.
|
|
|
• |
Food technology developments in the areas of food texture improvement,
stabilization, salt reduction, shelf-life extension and the development of alternative, plant-based proteins, including meat substitutes.
|
|
|
• |
Studies and development in the areas of E-mobility and sustainability,
focusing on energy storage solutions, hydrogen carriers for fuel cells, urban mining and lithium battery recycling.
|
|
|
• |
The development of novel materials, including flame retardants,
paints & coatings additives and biocides.
|
|
|
• |
Circular economy initiatives, including developments of waste-to-product
solutions, waste recycling and efficiency improvement.
|
|
|
• |
ICL’s Industry 4.0 program, which develops IOT concepts
in manufacturing, safety and environment, machine learning and artificial intelligence for manufacturing optimization and product development.
|
|
|
• |
ICL’s Digital Agriculture program, which aims to leverage
ICL’s digital platforms and data-driven solutions to create an agro-professional community, enabling sharing of information and
knowledge between growers and agro-professionals, retailers, academia, and food producers to extract the most value from agriculture.
|
|
|
• |
Commissioning of a high efficiency gas-fired combined heat and
power (CHP) plant at ICL’s Sodom facility to supply ICL’s facilities in Israel, replacing older, oil-fired power generation
systems.
|
|
|
• |
Beginning the transition to the procurement of renewably generated
electricity, across all ICL sites, starting with the procurement of renewable electricity for ICL sites in Europe.
|
|
|
• |
Phasing out oil shale-firing for power generation at ICL Rotem
(Israel), in favour of a more efficient gas-fired power generation plant with much lower GHG emissions.
|
|
|
• |
Improved measurement of GHG emissions, including digital dashboards
for more accurate and up-to-date reporting of emission at site and product levels.
|
|
|
• |
Eliminating or reducing process GHG emissions.
|
|
|
• |
Converting ICL’s production plants in Israel to the use
of natural gas in place of higher carbon intensity energy sources such as fuel oils.
|
|
|
• |
Increasing energy efficiency through the phasing out of inefficient
production technologies, streamlining its production facilities, increasing the efficiency of its consumption of heat and steam, recovering
heat where possible.
|
|
|
• |
Reducing the use of electricity for lighting and air conditioning
through the implementation of more efficient technologies.
|
|
|
• |
Targeting 50% of electricity to be sourced from renewable energy, mainly at sites in Europe and North America.
Renewable electricity supplies and market mechanisms such as power purchase agreements are not yet available in other parts of the world,
but ICL will seek to increase its share of renewable electricity as it becomes available.
|
|
|
• |
Planning for installation of solar photovoltaic (solar PV) electricity generation systems in all available
and appropriate areas within the operational boundaries of ICL sites in Israel, Spain, Germany and other countries.
|
|
|
• |
Use of carbon pricing consideration in product development and
investment decision-making, in order to raise internal awareness, promote better life-cycle costing decisions, and better prepare our
business for future emissions trading schemes.
|
|
|
• |
DSW and DSM will implemen
t
major dust reduction projects over the next few years. Our other production sites in Israel will also increase their efforts to reduce
particle emissions.
|
|
|
• |
In June 2021, Rotem Israel's emission permit was renewed by the Israeli Ministry of Environmental Protection
(MoEP), which is valid until September 2023. The renewed permit reflects an updated outline of requirements. Postponement in the execution
of a limited number of projects was granted within the framework of an administrative order under Section 45 of the Law.
|
|
|
• |
SBCL – Bromine leakage occurred during January 2022. According
to the guidance of local authorities, production onsite was halted. Corrective actions were taken. Production activity is expected to
resume by mid – March, following the approval by authorities
.
|
|
|
• |
ICL Dead Sea (DSW) - Salt by-product is transferred to a large open-air depot, in proximity to DSW’s
site. The open-air depot's dimensions (height and area) are limited by statutory requirements. DSW is examining alternatives for salt
storage/treatment.
|
|
|
• |
Rotem Israel – The site is implementing a master plan for
wastewater treatment, with the principal goal of reducing effluent quantities, by converting some effluents into products, wastewater
recycling, reducing water consumption, treatment/neutralization of wastewater and restoration of wastewater ponds. The plan currently
includes additional wastewater streams created by air emission purification processes, as required by the Israeli Clean Air Law.
|
|
|
• |
Neot Hovav - Pursuant to the requirements of the MoEP, in the
coming years our Neot Hovav site will be required to treat existing hazardous waste (historical). This waste is stored in a designated
defined area on the site's premises, in coordination with the MoEP. Some of the currently produced waste is also stored in this area.
Treatment of this waste is partly conducted through a combustion facility (Bromine Recovery Unit), which recovers hydro-bromine acid.
Additional waste quantities are sent to external designated treatment facilities
.
Once the area
is cleared, the Company will be required to conduct soil surveys. For further information, see Note 17 to our Audited Financial
Statements.
|
|
|
• |
ICL Periclase - The site is working to reduce historic Magnesia
waste, stored in a designated waste area, and to reuse it for the benefit of a circular economy. ICL Periclase is implementing a project
that uses magnesia powder, a non-hazardous material, to fill sinkholes in the Dead Sea region. The project is expected to be completed
by January 2023.
|
|
|
• |
ICL Haifa (F&C) – Treated wastewater of the site's facilities flows into the Kishon River, according
to a permit issued by the MoEP. To comply with the standards covering treatment of the wastewater, the site, in coordination with the
MoEP, is conducting a project to channel the treated wastewater underground. This project is in advanced stages.
|
|
|
• |
ICL Boulby - All wastewater leaving our site in the UK is permitted
according to the UK’s Environment Agency. The site's wastewater consists of extracted sea water, mine brines, gathered surface rainwater
and water treated at the on-site sewage plant. Multiple parameter limits are imposed on the site by the wastewater permit, and no compliance
breaches have occurred since the site’s transition to producing Polysulphate®, and, in fact, wastewater amounts have been reduced
considerably.
|
|
|
• |
ICL Iberia - A multi-year program is underway to restore large salt piles, while paying close attention
to the issue of wastewater drainage and sludge treatment. In April 2021, the Company signed an agreement with the ACA, Catalan Water Agency,
for the construction and operation of a new collector. The new collector is infrastructure required for the removal of brine water that
will be used for restoration, as well as for production. For further information regarding the restoration plan and the agreement for
the construction and operation of the collector in Spain, see Notes 17 and 18 to our Audited Financial Statements.
|
|
|
• |
ICL US Gallipolis Ferry - The site operates under a National Pollutant
Discharge Elimination System (NPDES) Permit which regulates water discharge from point sources and is renewed every 5 years. The site
operates a large Wastewater Treatment Plant (WWTP). Discharge limitations, set by the West Virginia Department of Environmental Protection
(WVDEP), are becoming stricter, placing a challenge on the treatment capabilities for some parameters being treated within the current
WWTP. Therefore, in 2021 the site installed new technology for its wastewater treatment processes. The site has been very active in pursuing
recycling initiatives, which helped achieve a landfill to recycling ratio of 50%. Additionally, the facility entered into a Voluntary
Remediation Agreement (VRA) with the former owner of the facility, and the WVDEP. The active remediation has been completed and is being
reviewed by the WVDEP for approval. Currently, there is ongoing periodic groundwater sampling, analysis, monitoring, and reporting
to the WVDEP, per the VRA.
|
|
|
• |
YPH
-
All wastewater at
YPH, after physical or chemical treatment, is reused in the production system with zero discharge.
|
|
|
• |
LYG - During 2021, ICL ceased operations at its LYG plant following a request by the Chinese authorities
to either relocate the plant or cease its operation. As part of the closure process, soil surveys were conducted. Once concluded, ICL
is expected to receive compensation due to the closure.
|
|
|
• |
ICL DSW – Due to the negative water balance, the water level in the northern basin of the Dead Sea
is decreasing. The receding water levels over the years has required ICL to reposition its pumping station northwards, in order to enable
continued operations in the Dead Sea region, which also enables the existence of tourism infrastructure. The P-9 pumping station and feeder
canal crossing the Tze’elim stream were constructed in order to maintain operational continuity. The Tze’elim stream alluvial
fan is one of the largest and most developed of all the surviving fans in the area, and therefore it is important to preserve it and to
protect the biodiversity existing in this habitat. ICL reached an agreement with environmental authorities and organizations, according
to which, seven culverts were constructed above the excavated canal
to allow flood waters
to flow through the original flow channel, without damaging the feeder canal,
while maintaining
the braided channel fan pattern. In addition, the culverts serve as an ecological corridor, by providing passageways for animals. ICL
periodically reviews field data and makes adjustments in accordance with the findings. For further information, see “Item 4 –
Information on the company — D. Property, Plant and Equipment — Mineral Extraction and Mining Operations- Dead Sea”.
|
|
|
• |
ICL Iberia - ICL Iberia’s past activities have resulted
in the salinization of some water wells in the Suria and Sallent sites. Compensation to the relevant owners is under discussion. For more
information, see
note 17 to our Audited Financial Statements.
|
|
|
• |
Rotem Israel - In 2017, Rotem experienced an environmental accident in which approximately 100,000 cubic
meters of acidic phosphogypsum liquid were released into the surrounding environment, as a result of a breach in its Number 3 detainment
pond. The liquid entered the nearby Ashalim Creek (Nahal Ashalim), which flows through an area designated as a nature reserve. To the
best of our knowledge, as of the reporting date, criminal investigation of the event is still underway. We took intensive actions to restore
the creek, to its state prior to the accident, in full cooperation with the relevant authorities.
|
|
|
• |
ICL R&D Beer Sheva - A soil survey was conducted. The initial
results of the survey point to small amounts of contamination. ICL will act in accordance with the survey's findings, and related MoEP
guidelines.
|
|
|
• |
lCL Periclase - In 2021, brine, a non-hazardous substance, leaked
from a ruptured pipeline in a nature reserve. No significant damage was recorded, and we are in the process of remediating the area. We
committed to testing and replacing the necessary pipeline components, in order to prevent future occurrences.
|
|
|
• |
ICL DSW - Sodom Saltmarsh Lake. The Ashalim reservoir, located
south of the ICL’s Dead Sea site, is a wet habitat, situated within a typical arid habitat. It is abundant with rich biological
diversity. ICL Dead Sea, whose excavations in the region created this wet habitat, takes extra measures to preserve it and invests in
making this unique habitat accessible to the public. In the past, the Sodom salt flats area was a resting stop and habitat for migratory
birds. Today, due to changes in the land’s use – to agriculture, residential and industrial purposes, almost no salt flats
remain. These flats have unique characteristics with high salinity in the soil and unique species that have adapted to these extreme conditions.
The salt flats in Israel are a rare habitat and have been shrinking over time. The Sodom Saltmarsh Lake, initially created as a result
of ICL Dead Sea’s excavation activities, has become a salt flat substitute. The lake was created from a rise in groundwater in the
excavated area. Over the past few years, the lake has had relatively good water quality year-round. We also started monitoring the lake,
using sensors, to continuously measure its water quality. Vegetation was planted in a stable water environment. The lake is now used as
a resting spot for migrating birds and as a nesting site for a wide range of species.
|
|
|
• |
ICL Boulby - Adjacent to ICL Boubly’s mining facilities,
and within its operational area, are non-developed turfs where important habitats and species flourish. Most notable are the woodlands
at Mines Wood and Ridge Lane Wood, near Dalehouse. These are some of the most wildlife-rich woodlands in the Northeast England / Yorkshire
areas. The woodlands are home to invertebrates, birds and mammals. For over a decade ICL Boulby has worked with the Industry Nature Conservation
Association (INCA) to monitor and manage the wildlife that exists in proximity to the mine. Key to this process is a Site Biodiversity
Action Plan (Site BAP), operated by ICL Boulby within its operational area. The site BAP is designed to conserve the key habitats and
species which live at the site, and is assisted by INCA annually.
For further information
see: “Item 4 – Information on the Company — D. Property, Plant and Equipment — Mineral Extraction and Mining Operations”
and Note 18(c) to our Audited Financial Statements.
|
|
|
• |
The European Ecodesign E-Display regulation, published by the
European Commission in December 2019, bans the use of halogenated flame retardants in electronic display enclosures. The regulation has
been in force as of March 2021. This is the first-time chemicals have been regulated under this regulation and was justified as a means
to improve plastics recycling.
|
|
|
• |
Tetrabromobisphenol A (TBBPA or TBBA) flame retardant is under review as part of REACH. The results of
the review are expected during 2022. TBBA is also being reviewed under the European Directive on the Restriction of the Use of Certain
Hazardous Substances in electrical and electronic equipment (RoHS). The draft assessment was published in December 2019 and includes a
proposal to restrict TBBA for its additive uses in plastics for EE&E (Electric and Electronic Equipment). BSEF commented on the proposed
regulation, expressing concern regarding the scientific basis to justify any restrictions. The European Commission will review and make
its final decision, likely in fourth quarter 2022. TBBA is mostly used as a reactive flame retardant and not as an additive.
|
|
|
• |
Ammonium Bromide: Sweden has filed a dossier supporting proposed
classification as reproductive toxin category 1B under the Classification, Labelling & Packaging (CLP) EU Regulation. In October 2020,
the risk assessment committee (RAC) of ECHA provided an opinion that the classification is warranted. The final Commission decision
on the classification is expected by Q2 2022. A decision on the further use of ammonium bromide as a biocide will be taken by the BPC
(Biocidal Products Committee), probably during 2022, pending provision of additional data to be requested by Sweden.
|
|
|
• |
Additional specific products of the Industrial Products segment
are in the process of evaluation under REACH. For some products, there are draft or final decisions by ECHA to perform additional studies,
a process that will take a few years until evaluations are completed. Other products are in the process of evaluation under the Biocides
Products Regulation (BPR).
|
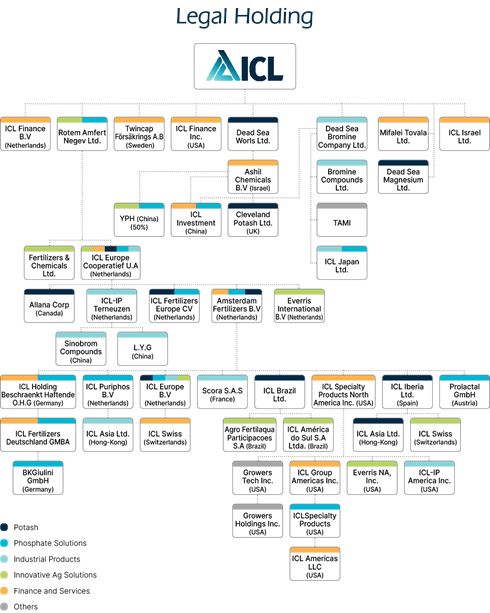
|
|
• |
Israel: under the Israeli Dead Sea Concession Law, 1961, as amended in 1986 (the “Concession Law”),
we have lease rights until March 31, 2030, for salt and carnallite ponds, pumping facilities and productions plants at Sodom. We have
other production facilities in Israel, situated on land with a long term lease, including the Oron and Zin plants at Mishor Rotem of the
Phosphate Solutions segment (the lease agreement for Oron plant has been under an extension process since 2017), production facilities
at Naot Hovav of Industrial Products segment (leased until 2024-2048), as well as production, storage and transportation facilities together
with chemicals and research laboratories at Kiryat Ata that belong to the Innovative Ag Solutions segment (leased until 2046 2049). We
also use warehouse, loading and unloading sites at Ashdod and Eilat ports (leased until 2030).
|
|
|
• |
Europe:
|
|
|
• |
North and South America:
|
|
|
• |
Asia:
|
|
Property Type
|
Location
|
Size (square feet)
|
Products
|
Owned/Leased
|
|
Plant
|
Mishor Rotem, Israel
|
27,094,510
|
Phosphate Solutions products
|
Owned on leased land
|
|
Plant
|
Mishor Rotem, Israel
|
10,763,910
|
Industrial Products products
|
Owned on leased land
|
|
Plant
|
Neot Hovav, Israel
|
9,601,591
|
Industrial Products products
|
Owned on leased land
|
|
Plant
|
Zin, Israel
|
8,484,123
|
Phosphate Solutions products
|
Owned on leased land
|
|
Plant
|
Kiryat Ata, Israel
|
6,888,903
|
Innovative Ag Solutions products
|
Leased
|
|
Plant
|
Oron, Israel
|
4,413,348 (not including phosphate reserve)
|
Phosphate Solutions products
|
Owned on leased land
|
|
Plant
|
Sodom, Israel
|
13,099,679 (not including ponds and Magnesium factory)
|
Potash products
|
Owned on leased land
|
|
Plant
|
4,088,800
|
Magnesium products (Potash segment)
|
Owned on leased land
|
|
|
Plant
|
2,326,060
|
Industrial Products products
|
Owned on leased land
|
|
|
Conveyor belt
|
1,970,333
|
Transportation facility for Potash
|
Owned on leased land
|
|
|
Pumping station
|
920,314
|
Pumping station for Potash segment
|
Owned on leased land
|
|
|
Plant
|
667,362
|
Industrial Products products
|
Owned on leased land
|
|
|
Power plant
|
645,856
|
Power and steam production for Potash segment
|
Owned on leased land
|
|
Warehouse and loading facility
|
Ashdod, Israel
|
664,133
|
Warehouse for Potash and Phosphate Solutions products
|
Owned on leased land
|
|
Headquarters
|
Beer Sheva, Israel
|
191,598
|
Company headquarters
|
Owned and leased
|
|
Plant
|
Mishor Rotem, Israel
|
430,355
|
Phosphate Solutions products
|
Owned on leased land
|
|
Warehouse and loading facility
|
Eilat, Israel
|
152,557
|
Warehouse for Potash and Phosphate Solutions products
|
Owned on leased land
|
|
Headquarters
|
Tel Aviv, Israel
|
21,797
|
Company headquarters
|
Leased
|
|
Plant
|
Catalonia, Spain
|
48,491,416
|
Mines, manufacturing facilities and warehouses for Potash
|
Owned
|
|
Port/warehouse
|
Catalonia, Spain
|
866,407
|
Potash and salt products
|
Owned on leased land
|
|
Plant
|
Totana, Spain
|
2,210,261
|
Innovative Ag Solutions products
|
Owned
|
|
Plant
|
Cartagena, Spain
|
209,853
|
Innovative Ag Solutions products
|
Owned
|
|
Warehouse and loading facility
|
Cartagena, Spain
|
184,342
|
Storage for Innovative Ag Solutions products
|
Leased
|
|
Plant
|
Shandong, China
|
692,045
|
Industrial Products products
|
Owned on leased land
|
|
Plant
|
Lian Yungang, China
|
358,793
|
Industrial Products products
|
Owned on leased land
|
|
Headquarters
|
Shanghai, China
|
8,224
|
Company headquarters
|
Leased
|
|
Plant
|
Kunming, Yunnan, China
|
1,161,593
|
Phosphate Solutions products
|
Owned land
|
|
Plant
|
Kunming, Yunnan, China
|
8,345,037
|
Phosphate Solutions products
|
Leased land
|
|
Pumping station
|
Kunming, Yunnan, China
|
36,931
|
A pumping station for Phosphate Solutions
|
Leased land
|
|
Peat Moor
|
Nutberry and Douglas Water, United Kingdom
|
17,760,451
|
Peat mine -Innovative Ag Solutions
|
Owned
|
|
Plant
|
Cleveland, United Kingdom
|
13,239,609
|
Polysulphate products (Potash segment)
|
Owned
|
|
Warehouse and loading facility
|
Cleveland, United Kingdom
|
2,357,296
|
Polysulphate products (Potash segment)
|
Owned on leased land
|
|
Peat Moor
|
Creca, United Kingdom
|
4,305,564
|
Peat mine - Innovative Ag Solutions
|
Owned
|
|
Plant
|
Nutberry, United Kingdom
|
322,917
|
Innovative Ag Solutions products
|
Owned
|
|
Plant
|
Daventry, United Kingdom
|
81,539
|
Innovative Ag solutions products
|
Owned and leased
|
|
Plant
|
Terneuzen, the Netherlands
|
1,206,527
|
Industrial Products products
|
Owned
|
|
Plant & warehouse
|
Lawford Heath, Rugby
|
45,000
|
Innovative Ag solutions products
|
Leased
|
|
Plant
|
Heerlen, the Netherlands
|
481,802
|
Innovative Ag solutions products
|
Owned and leased
|
|
Plant
|
Amsterdam, the Netherlands
|
349,827
|
Phosphate Solutions products and logistics center
|
Owned on leased land
|
|
European Headquarters
|
Amsterdam, the Netherlands
|
59,055
|
European Company headquarters
|
Leased
|
|
Plant
|
Gallipolis Ferry, West Virginia, United States
|
1,742,400
|
Industrial Products products
|
Owned
|
|
Plant
|
Lawrence, Kansas, United States
|
179,689
|
Phosphate Solutions products
|
Owned
|
|
Plant
|
Carondelet, Missouri, United States
|
172,361
|
Phosphate Solutions products
|
Owned
|
|
Plant
|
North Charleston, South Carolina, United States
|
100,000
|
Innovative Ag solutions products
|
Leased
|
|
Plant
|
Summerville, South Carolina, United States
|
40,000
|
Innovative Ag solutions products
|
Leased
|
|
US headquarters
|
St. Louis, Missouri, United States
|
45,595
|
US Company headquarters
|
Leased
|
|
Plant
|
Ludwigshafen, Germany
|
2,534,319
|
Phosphate Solutions products and Infrastructure
|
Leased
|
|
Plant
|
Ladenburg, Germany
|
1,569,764
|
Phosphate Solutions products
|
Owned
|
|
Plant
|
Bitterfeld, Germany
|
514,031
|
Industrial Products products
|
Owned
|
|
Plant
|
Cajati, Brazil
|
413,959
|
Phosphate Solutions products
|
Owned
|
|
Plant
|
Sao Jose dos Campos, Brazil
|
Phosphate plant: 137,573 Blending plant: 80,729
|
Phosphate Solutions products
|
Owned on (free of charge) leased land
|
|
Plant
|
Brazil Cidade Ocidental
|
8,275
|
Innovative Ag solutions products
|
Owned
|
|
Plant
|
Brazil Cruz Alta
|
7,499
|
Innovative Ag solutions products
|
Owned
|
|
Plant
|
Brazil Jacarei I
|
879,248
|
Innovative Ag solutions products
|
Owned
|
|
Plant
|
Brazil Jacarei II
|
967,987
|
Innovative Ag solutions products
|
Leased
|
|
Plant
|
Brazil Maua
|
968,751
|
Innovative Ag solutions products
|
Owned
|
|
Plant
|
Brazil Suzano I
|
3,349,186
|
Innovative Ag solutions products
|
Owned
|
|
Plant
|
Brazil Suzano II
|
637,001
|
Innovative Ag solutions products
|
Owned
|
|
Plant
|
Brazil Uberlandia
|
263,716
|
Innovative Ag solutions products
|
Owned
|
|
Plant
|
Belgium
|
128,693
|
Innovative Ag solutions products
|
Owned
|
|
Plant
|
Calais, France
|
546,290
|
Industrial Products products
|
Owned
|
|
Plant
|
Bandırma, Turkey
|
375,187
|
Phosphate Solutions products
|
Owned
|
|
Plant
|
Hartberg, Austria
|
692,937
|
Phosphate Solutions products
|
Owned
|
|
Plant
|
Heatherton, Australia
|
64,583
|
Phosphate Solutions products
|
Leased
|
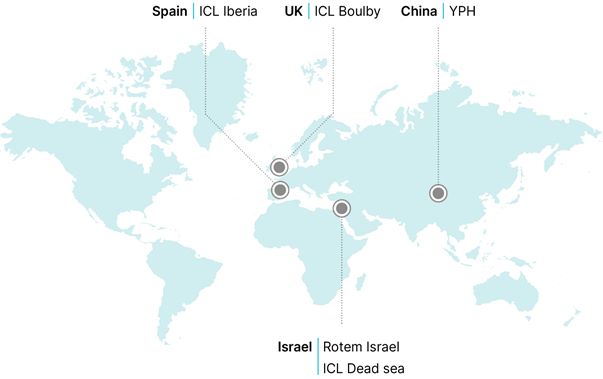
|
|
• |
ICL Rotem has been mining phosphates in the Negev in Israel for more than sixty years. The mining is conducted
in accordance with phosphate mining concessions, which are granted from time to time by the Minister of Energy under the Mines Ordinance,
by the Supervisor of Mines in his Office, as well as the mining authorizations issued by the Israel Lands Authority. The concessions relate
to quarries (phosphate rock), whereas the authorizations cover use of land as active mining areas.
|
|
|
• |
ICL Dead Sea (DSW) comprises 37 evaporation ponds producing potash
and salt, among other chemical products, located on the south-west shore of the Dead Sea’s southern basin in Israel. DSW is in the
production stage and is leased by ICL. Dead Sea Works Ltd., a wholly owned subsidiary, operates the DSW concession covering 652 sqkm,
which is in place through 2030.
|
|
|
• |
ICL Iberia holds mining rights for two underground
potash mines, Cabanasses and Vilafruns, located in Spain. ICL owns the land on which the Spanish surface facilities are located and the
Spanish government owns the underground mining rights. Cabanasses is in the production stage, while Vilafruns was put on care and maintenance
in June 2020. ICL Iberia, a wholly owned subsidiary, operates Cabanasses, which comprise 126 licenses for the extraction of rocksalt and
potash covering 693 sqkm.
|
|
|
• |
ICL Boulby is an underground polyhalite mine in the production
stage located in the United Kingdom, of which ICL owns the freehold of approximately 198 hectares of the mineral field, with the remainder
held on a leasehold basis. Cleveland Potash Limited, a wholly owned subsidiary, operates ICL Boulby, which comprises 74 mining leases
which cover a total area of 822sqkm, primarily offshore.
|
|
|
• |
YPH is a joint venture between ICL and Yunnan Phosphate Corporation (YPC), controlled by ICL, that owns
and operates the open-pit Haikou Phosphate Mine and Processing Facility in the Xishan district of China, of which ICL has a 50% interest.
YPH holds two phosphate mining licenses, including the mining license for the Haikou Mine covering 9.6sqkm, which is in the production
stage and the Company operates.
|
|
Israel
|
Out of Israel
|
Total
|
||
|
Year Ended December 31,
|
$ millions
|
NIS millions
|
$ millions
|
|
|
2021
|
75
|
242
|
3
|
78
|
|
2020
|
75
|
257
|
3
|
78
|
|
2019*
|
82
|
295
|
3
|
85
|
|
Production Data for ICL Boulby
|
|||
|
2021
|
2020
|
2019
|
|
|
Polyhalite – Hoisted,
kt
|
784
|
711
|
636
|
|
Total Polyhalite Production, kt
|
789
|
709
|
632
|
|
Potash Production at
Suria Plant
|
|||
|
2021
|
2020
|
2019
|
|
|
Ore hoisted from Cabanasses mine
|
2,534 | 1,874 | 1,831 |
|
Ore hoisted from Vilafruns mine
|
-
|
484 | 836 |
|
Total Processed (Kt)
|
2,534
|
2,358
|
2,667
|
|
Head Grade, % KCl
|
26.4%
|
24.2%
|
23.8%
|
|
KCl Produced (Kt)
|
599
|
503
|
569
|
|
Product Grade, % KCl
|
95.5%
|
95.5%
|
95.5%
|
|
Potash Production at
Sallent
Plant
|
|||
|
2021
|
2020
|
2019
|
|
|
Ore hoisted from Vilafruns mine
|
277 | 1,183 | |
|
Total Processed (Kt)
|
-
|
277
|
1,183
|
|
Head Grade, % KCl
|
-
|
22.4%
|
22.5%
|
|
KCl Produced (Kt)
|
-
|
54
|
234
|
|
Product Grade, % KCl
|
-
|
95.5% | 95.5% |
|
Total Mine Production of raw ore
at Negev (Rotem, Oron and Zin)
|
|||
|
2021
|
2020
|
2019
|
|
|
Tons (Mt)
|
5
|
6
|
7
|
|
P
2
O
5
% (Before / After Beneficiation)
|
26% / 32%
|
26% / 32%
|
26% / 32%
|
|
Product Produced after processing at Negev Operations (Rotem, Oron and Zin) (Kt)
|
|||
|
2021
|
2020
|
2019
|
|
|
Phosphate Rock
|
2,431
|
3,090
|
2,807
|
|
Green Phosphate Rock
|
531
|
544
|
567
|
|
Fertilizers
|
1,082
|
920
|
1,033
|
|
White Phosphoric Acid
|
168
|
171
|
134
|
|
Speciality Fertilizers
|
72
|
70
|
66
|
|
DSW Production (kt)
|
|||
|
2021
|
2020
|
2019
|
|
|
Potash
|
3,900
|
3,960
|
3,334
|
|
Compacting plant
|
1,858
|
1,707
|
1,218
|
|
Bromine
|
182
|
171
|
181
|
|
Cast Mg
|
18
|
18
|
22
|
|
Total Mine Production of raw ore
at YPH
|
|||
|
2021
|
2020
|
2019
|
|
|
Millions of tons produced
|
2.66
|
2.40
|
2.15
|
|
Grade (% P
2
O
5
before/after
beneficiation)
|
21% / 28%
|
21% / 29%
|
21% / 29%
|
|
Product Produced after processing
at YPH
(Kt)
|
|||
|
2021
|
2020
|
2019
|
|
|
Phosphate Rock *
|
2,194
|
2,044
|
1,946
|
|
Green Phosphoric Acid
|
673
|
632
|
637
|
|
Fertilizers
|
612
|
584
|
516
|
|
White Phosphoric Acid
|
83
|
71
|
64
|
|
Speciality Fertilizers
|
76
|
55
|
46
|
|
Measured Mineral Resources
|
Indicated Mineral Resources
|
Measured + Indicated Mineral Resources
|
Inferred Mineral Resources
|
|||||
|
Amount
(Mt)
|
Grades/
qualities |
Amount
(Mt)
|
Grades/
qualities |
Amount
(Mt)
|
Grades/
qualities |
Amount
(Mt)
|
Grades/
qualities |
|
|
Commodity: K
2
O
|
||||||||
|
United Kingdom
|
-
|
-
|
24.0
|
13.7%
|
24.0
|
13.7%
|
17.3
|
13.5%
|
|
Boulby
|
-
|
-
|
24.0
|
13.7%
|
24.0
|
13.7%
|
17.3
|
13.5%
|
|
Total
|
-
|
-
|
24.0
|
13.7%
|
24.0
|
13.7%
|
17.3
|
13.5%
|
|
Commodity: KCl
|
||||||||
|
Spain
|
96.5
|
26.4%
|
60.8
|
24.7%
|
157.3
|
25.7%
|
361.2
|
29.1%
|
|
Cabanasses
|
83.9
|
25.7%
|
51.4
|
23.3%
|
135.
3
|
24.8%
|
330.5
|
29.1%
|
|
Vilafruns
|
12.6
|
31.0%
|
9.4
|
32.1%
|
22.0
|
31.5%
|
30.7
|
28.9%
|
|
Israel
|
225.0
|
20.0%
|
1,500.0
|
20.0%
|
1,725.0
|
20.0%
|
445.0
|
20.0%
|
|
Mine/Property DSW
|
225.0
|
20.0%
|
1,500.0
|
20.0%
|
1,725.0
|
20.0%
|
445.0
|
20.0%
|
|
Total
|
321.5
|
21.9%
|
1,560.8
|
20.2%
|
1,882.3
|
20.5%
|
806.2
|
24.1%
|
|
Commodity: P
2
O
5
|
||||||||
|
Israel
|
247.7
|
27.5%
|
10.0
|
26.0%
|
257.7
|
27.5%
|
-
|
-
|
|
Rotem
|
247.7
|
27.5%
|
10.0
|
26.0%
|
257.7
|
27.5%
|
-
|
-
|
|
China
|
3.0
|
22.3%
|
2.3
|
24.0%
|
5.3
|
23.0%
|
0.2
|
20.0%
|
|
YPH
|
3.0
|
22.3%
|
2.3
|
24.0%
|
5.3
|
23.0%
|
0.2
|
20.0%
|
|
Total
|
250.7
|
27.4%
|
12.3
|
25.6%
|
263.0
|
27.4%
|
0.2
|
20.0%
|
|
Proven Reserves
|
Probable Reserves
|
Total Reserves
|
||||
|
Amount (Mt)
|
Grades/
qualities |
Amount (Mt)
|
Grades/
qualities |
Amount (Mt)
|
Grades/
qualities |
|
|
Commodity: K
2
O
|
||||||
|
United Kingdom
|
-
|
-
|
8.0
|
13.8%
|
8.0
|
13.8%
|
|
ICL Boulby
|
-
|
-
|
8.0
|
13.8%
|
8.0
|
13.8%
|
|
Total
|
-
|
-
|
8.0
|
13.8%
|
8.0
|
13.8%
|
|
Commodity: KCl:
|
||||||
|
Spain
|
29.0
|
25.5%
|
61.6
|
26.8%
|
90.6
|
26.3%
|
|
Cabanasses
|
29.0
|
25.5%
|
61.6
|
26.8%
|
90.6
|
26.3%
|
|
Vilafruns
|
-
|
-
|
-
|
-
|
-
|
-
|
|
Israel
|
172.0
|
20.0%
|
-
|
-
|
172.0
|
20.0
|
|
DSW
|
172.0
|
20.0%
|
-
|
-
|
172.0
|
20.0
|
|
Total
|
201.0
|
20.8%
|
61.6
|
26.8%
|
262.6
|
22.2%
|
|
Commodity: P
2
O
5
|
||||||
|
Israel
|
60.2
|
25.4%
|
-
|
-
|
60.2
|
25.4%
|
|
Rotem Israel
|
60.2
|
25.4%
|
-
|
-
|
60.2
|
25.4%
|
|
China
|
57.7
|
21.8%
|
-
|
-
|
57.7
|
21.8%
|
|
YPH
|
57.7
|
21.8%
|
-
|
-
|
57.7
|
21.8%
|
|
Total
|
117.9
|
23.6%
|
-
|
-
|
117.9
|
23.6%
|
|
|
(1) |
The totals contained in the above table have been rounded to reflect the relative uncertainty of the estimate,
and numbers may not sum due to rounding.
|
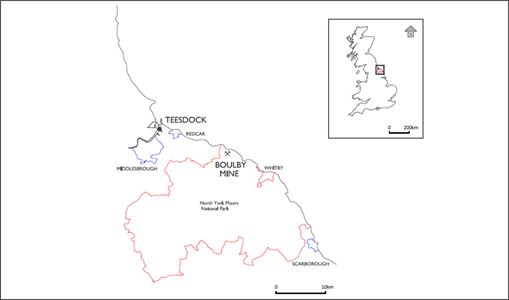
|
2021
|
2020
|
2019
|
|
Polyhalite – Hoisted, kt
|
784
|
711
|
636
|
|
Total Polyhalite Production, kt
|
789
|
709
|
632
|
|
Resources
|
||||
|
Amount
(Mt)
|
Grades/qualities
(K
2
O)
|
Cut-off grades
(K
2
O)
|
Metallurgical
recovery
(K
2
O)
|
|
|
Measured mineral resources
|
-
|
-
|
12.9% Equivalent
|
100%
|
|
Indicated mineral resources
|
24.0
|
13.7%
|
||
|
Measured + Indicated mineral resources
|
24.0
|
13.7%
|
||
|
Inferred mineral resources
|
17.3
|
13.5%
|
|
|
(1) |
Mineral Resources are reported exclusive of any Ore Reserve.
|
|
|
(2) |
All figures are rounded to reflect the relative accuracy of
the estimate, and numbers may not sum due to rounding.
|
|
|
(3) |
Mineral Resources are reported in accordance with the guidelines
of the JORC (2012) Codefor Mineral Resources and Ore Reserves.
|
|
Amount
(Mt) |
Grades/qualities
(K
2
O)
|
Cut-off grades
(K
2
O)
|
Metallurgical
recovery
(K
2
O)
|
|
Proven mineral reserves
|
-
|
-
|
12.9%
|
100%
|
|
Probable mineral reserves
|
8.0
|
13.8%
|
||
|
Total mineral reserves
|
8.0
|
13.8%
|
|
|
(1) |
All figures are rounded to reflect the relative accuracy of the estimate, and numbers may not sum due to
rounding.
|
|
|
(2) |
The mineral reserve estimate for the ICL Boulby is classified
in accordance with the JORC (2012) Code for Mineral Resources and Ore Reserves.
|
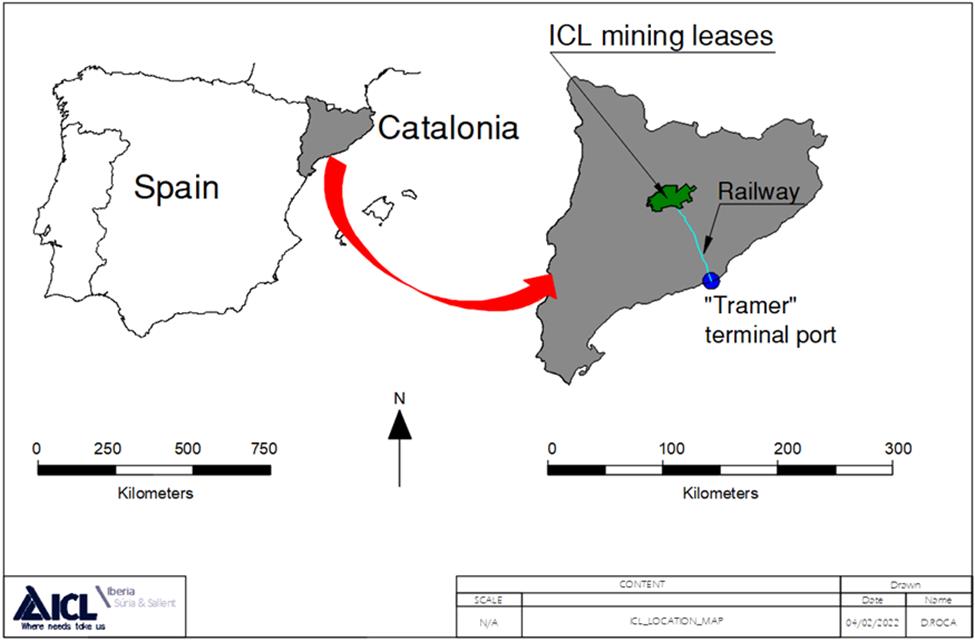
|
Potash
Production at Suria Plant
|
|||
|
2021
|
2020
|
2019
|
|
|
Ore hoisted from Cabanasses
mine
|
2,534
|
1,874
|
1,831
|
|
Ore hoisted from Vilafruns mine
|
-
|
484
|
836
|
|
Total Processed (Kt)
|
2,534
|
2,358
|
2,667
|
|
Head Grade, % KCI
|
26.4%
|
24.2%
|
23.8%
|
|
KCI Produced (Kt)
|
599
|
503
|
569
|
|
Product Grade, % KCI
|
95.5%
|
95.5%
|
95.5%
|
|
(1)
|
Potash at Vilafruns was extracted
until the end of the second quarter of 2020.
|
|
Potash
Production at Sallent Plant
|
|||
|
2021
|
2020
|
2019
|
|
|
Ore hoisted from Vilafruns mine
|
-
|
277 | 1,183 |
|
Total Processed (Kt)
|
-
|
277 | 1,183 |
|
Head Grade, % KCI
|
-
|
22.4%
|
22.5%
|
|
KCI Produced (Kt)
|
-
|
54
|
234
|
|
Product Grade, % KCI
|
-
|
95.5% | 95.5% |
|
(1)
|
Potash at Vilafruns was extracted until the end of the second quarter of 2020.
|
|
Resources
|
||||
|
Amount
(Mt)
|
Grades/qualities
(KCl)
|
Cut-off grades
(KCl)
|
Metallurgical
recovery
(KCl)
|
|
|
Measured
mineral resources
|
83.9
|
25.7%
|
10%
|
85.5% |
|
Indicated
mineral resources
|
51.4
|
23.3%
|
||
|
Measured
+ Indicated mineral resources
|
135.3
|
24.8%
|
||
|
Inferred
mineral resources
|
330.5
|
29.1%
|
|
|
(1) |
Mineral Resources are reported exclusive of any Ore Reserve.
|
|
|
(2) |
All figures are rounded to reflect the relative accuracy of
the estimate, and numbers may not sum due to rounding.
|
|
|
(3) |
Mineral Resources for Cabanasses have been estimated in accordance
with the guidelines of the JORC Code (2012).
|
|
Resources
|
||||
|
Amount
(Mt)
|
Grades/qualities
(KCl)
|
Cut-off grades
(KCl)
|
Metallurgical
recovery
(KCl)
|
|
|
Measured
mineral resources
|
12.6
|
31.0%
|
10% |
85.5%
|
|
Indicated
mineral resources
|
9.4
|
32.1%
|
||
|
Measured
+ Indicated mineral resources
|
22.0
|
31.5%
|
||
|
Inferred
mineral resources
|
30.7
|
28.9%
|
|
|
(1) |
Mineral Resources are reported exclusive of any Ore Reserve.
|
|
|
(2) |
All figures are rounded to reflect the relative accuracy of
the estimate, and numbers may not sum due to rounding.
|
|
|
(3) |
Mineral Resources for Vilafruns have been estimated in accordance
with the guidelines of the JORC Code (2012).
|
|
Amount
(Mt)
|
Grades/qualities
(KCl)
|
Cut-off grades
(KCl)
|
Metallurgical recovery
(KCl)
|
|
Proven
mineral reserves
|
29.0
|
25.5%
|
19%
|
85.5%
|
|
Probable
mineral reserves
|
61.6
|
26.8%
|
||
|
Total
mineral reserves
|
90.6
|
26.3%
|
|
|
(1) |
All figures are rounded to reflect the relative accuracy of the estimate, and numbers may not sum due to
rounding.
|
|
|
(2) |
Mineral Reserves for Cabansses are classified in accordance
with the guidelines of the JORC Code (2012).
|
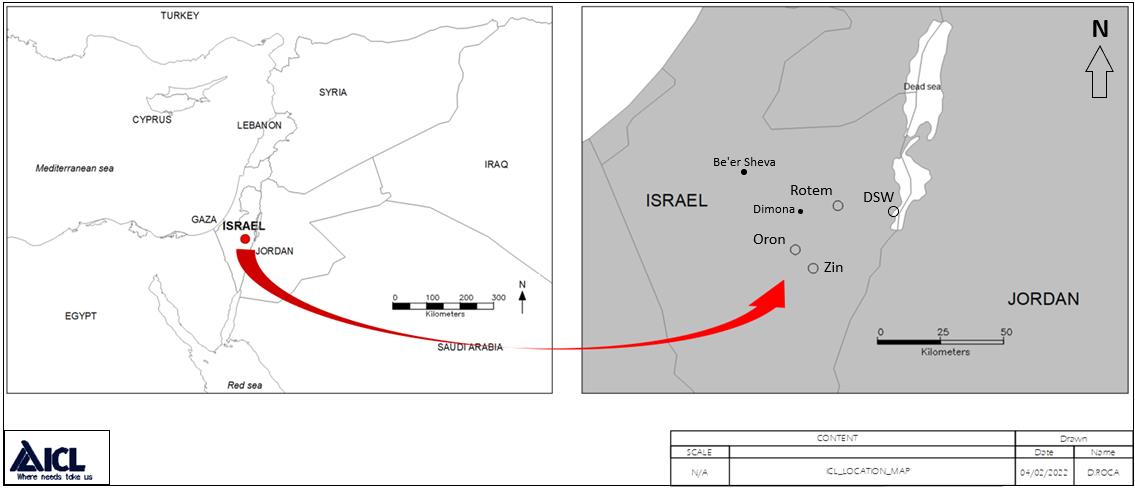
|
Year Ended December 31,
|
|||
|
2021
|
2020
|
2019
|
|
|
Millions of tons produced
|
5
|
6
|
7
|
|
Grade (% P
2
O
5
before/after beneficiation)
|
26% / 32%
|
26% / 32%
|
26% / 32%
|
|
Year Ended December 31,
|
|||
|
2021
|
2020
|
2019
|
|
|
thousands of tons
|
thousands of tons
|
thousands of tons
|
|
|
Phosphate Rock
|
2,431
|
3,090
|
2,807
|
|
Green Phosphoric Acid
|
531
|
544
|
567
|
|
Fertilizers
|
1,082
|
920
|
1,033
|
|
White Phosphoric Acid
|
168
|
171
|
134
|
|
Specialty Fertilizers
|
72
|
70
|
66
|
|
Category
|
White Phosphate
|
Low
Organic Phosphate |
High Organic &
Bituminous
Phosphate
|
Average
Grade
(P
2
O
5
)
|
Cut-off
Grades
(P
2
O
5
)
|
Metallurgical Recovery
(P
2
O
5
)
|
|
|
|
(millions of tons)
|
|
|||||
|
Rotem
|
Measured
|
156.7
|
27.5%
|
25% |
54%
|
||
|
Indicated
|
10.0
|
26.0%
|
|||||
|
M + Ind
|
166.7
|
27.5%
|
|||||
|
Inferred
|
-
|
-
|
|||||
|
Zin
|
Measured
|
3.0
|
18.0
|
27.5%
|
23%
|
56%
|
|
|
Indicated
|
-
|
-
|
-
|
||||
|
M + Ind
|
3.0
|
18.0
|
27.5%
|
||||
|
Inferred
|
-
|
.
|
-
|
||||
|
Oron
|
Measured
|
70.0
|
27.5%
|
20%
|
59%
|
||
|
Indicated
|
-
|
-
|
|||||
|
M + Ind
|
70.0
|
27.5%
|
|||||
|
Inferred
|
-
|
-
|
|||||
|
Total
|
Measured
|
3.0
|
244.7
|
27.5%
|
|||
|
Indicated
|
-
|
10.0
|
26.0%
|
||||
|
M + Ind
|
3.0
|
254.7
|
27.5%
|
||||
|
Inferred
|
-
|
-
|
-
|
|
|
|
(1) |
Mineral Resources are reported exclusive of any Ore Reserve.
|
|
|
(2) |
All figures are rounded to reflect the relative accuracy of
the estimate, and numbers may not sum due to rounding.
|
|
|
(3) |
Mineral Resources for Rotem, Zin, and Oron are classified in
accordance with the Pan European Reserves and Resources Reporting Committee (PERC) Standard for Reporting of Exploration Results.
|
|
|
• |
Rotem mine:
The life of
the mine at Rotem is approximately 4 years based on reserves of nominally 8.6 million tons of low organic/low magnesium phosphate
(given the current annual mining volume). The low‑organic, low-magnesium phosphates are suitable for phosphoric acid production.
The annual average production (mining) rate for the low-organic/low-magnesium phosphate at Rotem is 2 million tons per year.
|
|
|
• |
Oron mine:
The life of
the mine at Oron is approximately 3 years based on a reserve of 8.5 million tons and an average production of 2.8 million tons per year
of white phosphate (given the current annual mining volume).
|
|
|
• |
Zin mine:
In order to actively
address global market volatility, the continuing trend of economic and business uncertainty and to mitigate the implications of the COVID-19
spread and its impact on the Segment's results, several efficiency initiatives and measures have been initiated, which include, among
other things, the discontinuation of the production and sale of the phosphate rock activity at Zin plant in 2020.
|
|
Category
|
White Phosphate
|
Low Organic Phosphate
|
High Organic & Bituminous Phosphate
|
Total
(Mt)
|
Average
Grade
(P
2
O
5
)
|
Cut-off
Grades
(P 2 O 5 ) |
Metallurgical Recovery
(P
2
O
5
)
|
|
|
(millions of tons)
|
|
|||||||
|
Rotem
|
Proven
|
8.6
|
10.0
|
18.6
|
26.7%
|
25.0% | 54% | |
|
Probable
|
-
|
-
|
-
|
-
|
|
|||
|
Zin
|
Proven
|
12.4
|
17.7
|
30.1
|
25.5%
|
23.0% | 56% | |
|
Probable
|
-
|
-
|
-
|
-
|
|
|||
|
Oron
|
Proven
|
8.5
|
3.0
|
11.5
|
23.1%
|
20.0%
|
59% | |
|
Probable
|
-
|
-
|
|
|||||
|
Total
|
Proven
|
8.5
|
24.0
|
27.7
|
60.2
|
25.4%
|
||
|
Probable
|
-
|
-
|
-
|
-
|
-
|
-
|
|
|
(1) |
All figures are rounded to reflect the relative accuracy of the estimate, and numbers may not sum due to
rounding.
|
|
|
(2) |
Mineral Resources for Rotem, Zin, and Oron are classified in
accordance with the Pan European Reserves and Resources Reporting Committee (PERC) Standard for Reporting of Exploration Results.
|
|
Production (Kt)
|
|||
|
2021
|
2020
|
2019
|
|
|
Potash
|
3,900
|
3,960
|
3,334
|
|
Compacting plant
|
1,858
|
1,707
|
1,218
|
|
Bromine
|
182
|
171
|
181
|
|
Cast Mg
|
18
|
18
|
22
|
|
|
1. |
Determination of pumping rate of brines from northern Dead Sea
area to lagoons.
|
|
|
2. |
Determination of expected recovery of product as based upon:
|
|
|
a. |
Ability to determine composition and consistency of supply
|
|
|
b. |
Ability to predict consistency of evaporation and mineral precipitation
|
|
|
c. |
Ability to predict consistency of split into various products
|
|
|
3. |
Determination of Mineral Resource classification is based upon:
|
|
|
a. |
Any variation in supply composition
|
|
|
b. |
Any variation in return flow of brines to the northern Dead Sea
basin to assess efficiency and consistency of process
|
|
|
c. |
Variation in precipitation of mineral amounts
|
|
|
d. |
Accuracy of sonar measurements in determining reconciliation
|
|
|
4. |
Consideration of the length of extraction license held by ICL
|
|
|
5. |
Assessment of potential changes to any of the above factors during
the remaining length of license.
|
|
Classification
|
Product
|
Amount
(Mt)
|
Grades/qualities
(KCl) |
Cut-off Grades
(KCl)
|
Metallurgical
Recovery
(KCl)
|
|
Measured
|
KCl
|
225
|
20%
|
n/a
|
100%
|
|
Indicated
|
KCl
|
1,500
|
20%
|
||
|
Inferred
|
KCl
|
445
|
20%
|
||
|
Total
|
KCl
|
2,170
|
20%
|
|
|
(1) |
Potential brine volume is based upon the estimated pumping rate
from Northern Dead Sea multiplied by potential extraction period until the year 2133.
|
|
|
(2) |
Mineral Resources are reported exclusive of any Ore Reserve.
|
|
|
(3) |
All figures are rounded to reflect the relative accuracy of the estimate, and numbers may not sum due to
rounding.
|
|
|
(4) |
Mineral Resources for the DSW are classified in accordance with
the Pan European Reserves and Resources Reporting Committee (PERC) Standard for Reporting of Exploration Results.
|
|
Amount (Mt)
|
Grades/qualities
(KCl)
|
Cut-off grades
(KCl)
|
Metallurgical
recovery
(KCl)
|
|
Proven mineral reserves
|
172
|
20%
|
n/a
|
100%
|
|
Probable mineral reserves
|
-
|
-
|
||
|
Total mineral reserves
|
172
|
20%
|
|
|
(1) |
All figures are rounded to reflect the relative accuracy of the estimate, and numbers may not sum due to
rounding
.
|
|
|
(2) |
Mineral Reserves for the DSW are classified in accordance with
the guidelines of the PERC Code (2021).
|
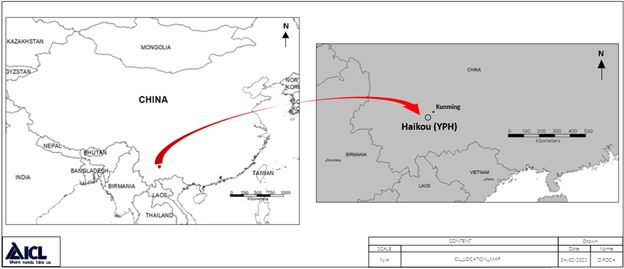
|
Year Ended December 31,
|
|||
|
2021
|
2020
|
2019
|
|
|
Millions of tons produced
|
2.66
|
2.40
|
2.15
|
|
Grade (% P
2
O
5
before/after beneficiation)
|
21% / 28%
|
21% / 29%
|
21% / 29%
|
|
(1)
|
All figures are rounded to reflect
the relative accuracy of the estimate, and numbers may not sum due to rounding
.
|
|
Year Ended December 31,
|
|||
|
2021
|
2020
|
2019
|
|
|
thousands of tons
|
thousands of tons
|
thousands of tons
|
|
|
Phosphate Rock *
|
2,194
|
2,044
|
1,946
|
|
Green Phosphoric Acid
|
673
|
632
|
637
|
|
Fertilizers
|
612
|
584
|
516
|
|
White Phosphoric Acid
|
83
|
71
|
64
|
|
Specialty Fertilizers
|
76
|
55
|
46
|
|
Measured
|
Indicated
|
Inferred
|
Measured + Indicated
|
Cut-off Grades
(P
2
O
5
)
|
Metallurgica
Recovery
(P
2
O
5
)
|
|||||
|
Mining Area
|
Mt
|
(P
2
O
5
)
|
Mt
|
(P
2
O
5
)
|
Mt
|
(P
2
O
5
)
|
Mt
|
(P
2
O
5
)
|
||
|
Block 1 and 2
|
0.6
|
23.0%
|
0.02
|
22.4%
|
-
|
-
|
0.7
|
23.0%
|
15% | 89.3% |
|
Block 3
|
1.6
|
22.0%
|
2
|
24.1%
|
-
|
-
|
3.8
|
23.2%
|
||
|
Block 4
|
0.7
|
22.4%
|
0.2
|
23.1%
|
0.2
|
20.0%
|
0.9
|
22.5%
|
||
|
Total
|
3
|
22.3%
|
2.3
|
24.0%
|
0.2
|
20.0%
|
5.3
|
23.0%
|
|
|
(1) |
Mineral Resources are reported on a dry in-situ basis and are
exclusive of Mineral Reserves.
|
|
|
(2) |
All figures are rounded to reflect the relative accuracy of the estimate, and numbers may not sum due to
rounding
.
|
|
|
(3) |
Mineral Resources are classified in accordance with the Pan
European Reserves and Resources Reporting Committee (PERC) Standard for Reporting of Exploration Results.
|
|
|
(4) |
The reported Mineral Resource estimate was constrained by limiting
polygons for the purpose of establishing reasonable prospects of economic extraction based on potential mining, metallurgical and processing
grade parameters identified by mining, metallurgical and processing studies performed to date on the project. A minimum cut-off grade
of 15% P
2
O
5
has been applied for reporting purposes.
|
|
Category
|
Low Organic Phosphate
(Mt)
|
Average
Grade
(P
2
O
5
)
|
Cut-off Grade
(P
2
O
5
)
|
Metallurgical Recovery
(P
2
O
5
)
|
|
Block 1 + 2
|
Proven
|
6.9
|
21.8%
|
15%
|
89.3%
|
|
Probable
|
–
|
–
|
|||
|
Block 3
|
Proven
|
39.0
|
21.9%
|
||
|
Probable
|
–
|
–
|
|||
|
Block 4
|
Proven
|
11.9
|
21.3%
|
||
|
Probable
|
–
|
–
|
|||
|
Total
|
Proven
|
57.7
|
21.8%
|
||
|
Probable
|
–
|
–
|
|
|
(1) |
All figures are rounded to reflect the relative accuracy of the estimate, and numbers may not sum due to
rounding.
|
|
|
(2) |
Mineral Reserves reported on a dry basis delivered to the processing
plant primary crusher.
|
|
Year Ended December 31,
|
$ millions
|
NIS millions
|
|
2021
|
507
|
1,636
|
|
2020
|
346
|
1,192
|
|
2019
|
425
|
1,514
|
|
Average prices
|
2021
|
2020
|
VS 2020
|
|
Granular potash – Brazil
|
CFR spot
($ per tonne)
|
534
|
238
|
124.4%
|
|
Granular potash – Northwest Europe
|
CIF spot/contract
(€ per tonne)
|
361
|
244
|
48.0%
|
|
Standard potash – Southeast Asia
|
CFR spot
($ per tonne)
|
389
|
245
|
58.8%
|
|
Potash imports
|
||||
|
To Brazil
|
million tons
|
12.6
|
11.0
|
14.5%
|
|
To China
|
million tons
|
7.6
|
8.7
|
(12.6)%
|
|
To India
|
million tons
|
2.5
|
4.1
|
(39.0)%
|
|
Average prices
|
$ per ton
|
2021
|
2020
|
VS 2020
|
|
DAP
|
CFR India Spot
|
618
|
331
|
87%
|
|
TSP
|
CFR Brazil Spot
|
562
|
251
|
124%
|
|
SSP
|
CFR Brazil inland 18-20% P2O5 Spot
|
297
|
177
|
68%
|
|
Sulphur
|
Bulk FOB Adnoc monthly contract
|
181
|
60
|
202%
|
|
For the Years Ended December 31,
|
%
Increase
(Decrease)
|
||
|
2021
|
2020
|
||
|
$ millions
|
$ millions
|
||
|
Sales
|
6,955
|
5,043
|
38%
|
|
Cost of sales
|
4,344
|
3,553
|
22%
|
|
Gross profit
|
2,611
|
1,490
|
75%
|
|
Selling, transport and marketing expenses
|
1,067
|
766
|
39%
|
|
General and administrative expenses
|
276
|
232
|
19%
|
|
Research and development expenses
|
64
|
54
|
19%
|
|
Other expenses
|
57
|
256
|
(78)%
|
|
Other income
|
(63)
|
(20)
|
215%
|
|
Operating income
|
1,210
|
202
|
499%
|
|
Finance expenses, net
|
122
|
158
|
(23)%
|
|
Share in earnings of equity-accounted investees
|
4
|
5
|
(20)%
|
|
Income before taxes on income
|
1,092
|
49
|
2129%
|
|
Taxes on income
|
260
|
25
|
940%
|
|
Net income
|
832
|
24
|
3367%
|
|
Net income attributable to the shareholders of the Company
|
783
|
11
|
7018%
|
|
Earnings per share attributable to the shareholders of
the Company:
|
|||
|
Basic earnings per share (in dollars)
|
0.61
|
0.01
|
6000%
|
|
Diluted earnings per share (in dollars)
|
0.60
|
0.01
|
5900%
|
|
Sales
|
Expenses
|
Operating income
|
||
|
$ millions
|
||||
|
YTD 2020 figures
|
5,043
|
(4,841)
|
202
|
|
|
Total adjustments YTD 2020*
|
-
|
307
|
307
|
|
|
Adjusted YTD 2020 figures
|
5,043
|
(4,534)
|
509
|
|
|
New Brazilian Businesses' contribution
|
341
|
(290)
|
51
|

|
|
Quantity
|
353
|
(243)
|
110
|
|
|
Price
|
1,081
|
-
|
1,081
|
|
|
Exchange rates
|
137
|
(191)
|
(54)
|

|
|
Raw materials
|
-
|
(246)
|
(246)
|
|
|
Energy
|
-
|
(27)
|
(27)
|
|
|
Transportation
|
-
|
(154)
|
(154)
|
|
|
Operating and other expenses
|
-
|
(76)
|
(76)
|
|
|
Adjusted YTD 2021 figures
|
6,955
|
(5,761)
|
1,194
|
|
|
Total adjustments YTD 2021*
|
-
|
16
|
16
|
|
|
YTD 2021 figures
|
6,955
|
(5,745)
|
1,210
|
|
|
- |
Sales
– The Company's sales increased by $1,912 million
compared to 2020. The increase was primarily related to a $278 increase in the average realized price per ton of potash year-over-year,
as well as an increase in the selling prices of phosphate fertilizers, acids, bromine and phosphorus-based flame retardants, bromine-based
industrial solutions, Innovative ag solutions products, phosphate specialties business and FertilizerpluS products. In addition, an increase
was recorded in sales volumes of bromine-based flame retardants, Innovative ag solutions products, bromine-based industrial solutions,
mainly clear brine fluids, FertilizerpluS products, phosphate specialties business and specialty minerals. In addition, the increase in
sales included an increase of $341 from the acquisitions of Fertiláqua and ADS and the appreciation of the average exchange rate
of the euro, the Chinese yuan and the Israeli shekel against the dollar. The increase was partly offset by a decrease in sales volumes
of Potash and phosphate fertilizers.
|
|
|
- |
Cost of sales
– Cost of sales increased by $791 million
compared to 2020. The increase was primarily related to higher prices of sulphur consumed during the period, raw materials used in the
production of bromine- and phosphorus-based flame retardants, commodity fertilizers and ammonia. In addition, an increase of $225 million
was derived from the acquisitions of Fertiláqua and ADS, as well as an increase of $185 million in sales volumes of bromine-based
flame retardants, Innovative ag solutions products, bromine-based industrial solutions, mainly clear brine fluids FertilizerpluS products,
phosphate specialties business and specialty minerals. Another contribution to the increase was due to the appreciation of the average
exchange rate of the Israeli shekel, the euro and the Chinese yuan against the dollar and higher electricity prices. The increase was
partly offset by a decrease in sales volumes of potash and phosphate fertilizers.
|
|
|
- |
Selling and marketing
– Selling and marketing expenses increased by $301 million compared to 2020, mainly due to higher transportation costs, higher sales
volumes, the acquisitions of Fertiláqua and ADS and favorable exchange rate.
|
|
|
- |
General and administrative
– General and administrative expenses increased by $44 million compared to 2020, mainly due to higher labor costs, the appreciation
of the average exchange rate of the Israeli shekel and the euro against the dollar and the acquisitions of Fertiláqua and ADS.
|
|
|
- |
Research and Development
– Research and development expenses increased by $10 million compared to 2020, mainly due to higher labor costs.
|
|
|
- |
Other expenses, net
– Other expenses, net, decreased by $242 million compared to 2020. The decrease was primarily due to higher expenses in 2020 related
to impairment of assets, early retirement of employees, site closure and restoration costs (see ‘Adjustments to reported operating
and net income – non-GAAP financial measures’ above).
|
|
Year Ended December 31,
|
||
|
2021
|
2020
|
|
|
$ millions
|
$ millions
|
|
|
Europe
|
2,159
|
1,822
|
|
Asia
|
1,876
|
1,432
|
|
North America
|
1,186
|
859
|
|
South America
|
1,305
|
517
|
|
Rest of the world
|
429
|
413
|
|
Total
|
6,955
|
5,043
|
|
|
- |
Europe
–
The increase in sales was primarily related to an increase in sales volumes and selling prices of Innovative ag solutions products, bromine
and phosphorus-based flame retardants, phosphate salts and white phosphoric acid (WPA), as well as a higher selling prices of phosphate
fertilizers and potash. The increase was partly offset by a decrease in sales volumes of potash, phosphate fertilizers and clear brine
fluids.
|
|
|
- |
Asia
– The
increase in sales was primarily related to an increase in sales volumes and selling prices of bromine-based flame retardants, bromine
industrial solutions products, Innovative Ag Solutions segment products and phosphate salts, as well as an increase in the selling prices
of potash, phosphate fertilizers and acids. The increase in sales was also supported by an increase in sales volumes of clear brine fluids
and the positive impact of the appreciation of the average exchange rate of the Chinese yuan against the dollar. The increase was partly
offset by a decrease in sales volumes of potash, phosphate fertilizers and acids.
|
|
|
- |
North America
– The increase in sales was primarily related to an increase in sales volumes and selling prices of potash, phosphate fertilizers,
bromine and phosphorus-based flame retardants, especially minerals products, phosphate-based food additives and Innovative ag solutions
products.
|
|
|
- |
South America
– The increase in sales was primarily related to an increase in sales volumes and selling prices of specialty agriculture products,
which include sales from our acquired Fertiláqua and ADS business, potash, phosphate fertilizers and white phosphoric acid (WPA),
as well as an increase in sales volumes of clear brine fluids. The increase was partly offset by a decrease in selling prices of clear
brine fluids.
|
|
|
- |
Rest of the world
– The increase in sales was primarily related to higher sales volumes and selling prices of specialty fertilizers products and higher
selling prices of specialty minerals products.
|
|
2021
|
2020
|
|
|
$ millions
|
$ millions
|
|
Segment Sales
|
1,617
|
1,255
|
|
Sales to external customers
|
1,601
|
1,242
|
|
Sales to internal customers
|
16
|
13
|
|
Segment Operating Income
|
435
|
303
|
|
Depreciation and amortization
|
65
|
77
|
|
Capital expenditures
|
74
|
84
|
|
Year Ended December 31,
|
||
|
2021
|
2020
|
|
|
$ millions
|
$ millions
|
|
|
Europe
|
529
|
458
|
|
Asia
|
597
|
405
|
|
North America
|
360
|
296
|
|
South America
|
62
|
40
|
|
Rest of the world
|
53
|
43
|
|
Total
|
1,601
|
1,242
|
|
Sales
|
Expenses
|
Operating income
|
||
|
$ millions
|
||||
|
YTD 2020 figures
|
1,255
|
(952)
|
303
|
|
|
Quantity
|
198
|
(104)
|
94
|
|
|
Price
|
150
|
-
|
150
|
|
|
Exchange rates
|
14
|
(26)
|
(12)
|
|
|
Raw materials
|
-
|
(57)
|
(57)
|
|
|
Energy
|
-
|
2
|
2
|
|
|
Transportation
|
-
|
(22)
|
(22)
|
|
|
Operating and other expenses
|
-
|
(23)
|
(23)
|
|
|
YTD 2021 figures
|
1,617
|
(1,182)
|
435
|
|
|
- |
Quantity
–
The positive impact on the segment’s operating income was primarily due to higher sales volumes of bromine- and phosphorus-based
flame retardants, as well as bromine-and phosphorus industrial solutions and specialty minerals products.
|
|
|
- |
Price
–
The positive impact on the segment’s operating income was primarily related to the record level of elemental bromine prices in China
and higher selling prices of bromine- and phosphorus-based flame retardants, as well as specialty minerals products.
|
|
|
- |
Exchange rates
– The unfavorable impact on the segment’s operating income resulted primarily from the appreciation of the average exchange
rate of the Israeli shekel against the US dollar, which increased operational costs. This was partly offset by the appreciation of the
average exchange rate of the euro against the US dollar.
|
|
|
- |
Raw materials
–The negative impact on the segment’s operating income was primarily related to higher prices of raw materials used in the
production of bromine- and phosphorus-based flame retardants.
|
|
|
- |
Transportation
- The negative impact on the segment’s operating income was primarily related to higher marine transportation costs.
|
|
|
- |
Operating and other expenses
– The negative impact on operating income was primarily related to higher operational costs and royalties, due to higher revenue.
|
|
2021
|
2020
|
|
|
$ millions
|
$ millions
|
|
Segment Sales
|
1,931
|
1,346
|
|
Potash sales to external customers
|
1,401
|
979
|
|
Potash sales to internal customers
|
94
|
95
|
|
Other and eliminations (1)
|
436
|
272
|
|
Gross Profit
|
894
|
472
|
|
Segment Operating Income
|
399
|
120
|
|
Depreciation and amortization*
|
165
|
166
|
|
Capital expenditures
|
298
|
296
|
|
Average realized price (in $) (2)
|
337
|
230
|
|
|
(1) |
Mainly includes polysulphate produced in UK, salt produced
in underground mines in the UK and Spain, magnesium-based products and sales of electricity produced in Israel.
|
|
|
(2) |
Potash average realized price (dollar per ton) is calculated
by dividing total Potash revenue by total sales’ quantities. The difference between FOB price and average realized price is mainly
marine transportation costs.
|
|
Year Ended December 31,
|
||
|
2021
|
2020
|
|
|
$ millions
|
$ millions
|
|
|
Asia
|
511
|
431
|
|
Europe
|
442
|
354
|
|
South America
|
506
|
230
|
|
North America
|
216
|
86
|
|
Rest of the world
|
93
|
82
|
|
Total
|
1,768
|
1,183
|
|
Sales
|
Expenses
|
Operating income
|
||
|
$ millions
|
||||
|
YTD 2020 figures
|
1,346
|
(1,226)
|
120
|
|
|
Quantity
|
72
|
(85)
|
(13)
|
|
|
Price
|
496
|
-
|
496
|
|
|
Exchange rates
|
17
|
(48)
|
(31)
|
|
|
Energy
|
-
|
(30)
|
(30)
|
|
|
Transportation
|
-
|
(97)
|
(97)
|
|
|
Operating and other expenses
|
-
|
(46)
|
(46)
|
|
|
YTD 2021 figures
|
1,931
|
(1,532)
|
399
|
|
|
- |
Quantity
–
The negative impact on the segment’s operating income was primarily related to a decrease in sales volumes of potash from both ICL
Dead Sea and ICL Iberia.
|
|
|
- |
Price
–
The positive impact on the segment’s operating income was primarily related to an increase of $278 in the average realized price
per ton of potash year-over-year, as well as an increase in the selling prices of FertilizerpluS products.
|
|
|
- |
Exchange rates
– The unfavorable impact on the segment’s operating income related primarily to the appreciation of the average exchange rate
of the Israeli shekel and the British pound against the US dollar, which led to a negative effect on operating income. This was accompanied
by the appreciation of the average exchange rate of the euro against the US dollar, which contributed to sales as much as it increased
operational costs.
|
|
|
- |
Energy
- The negative
impact on the segment’s operating income was primarily due to an increase in electricity prices, mainly in Europe.
|
|
|
- |
Transportation
– The negative impact on the segment’s operating income was primarily related to an increase in marine transportation costs.
|
|
|
- |
Operating and other expenses
– The negative impact on the segment’s operating income was primarily related to a higher operational cost, as well as higher
payments of royalties due to the increase in potash prices.
|
|
Thousands of Tons
|
2021
|
2020
|
|
Production
|
4,514
|
4,527
|
|
Total sales (including internal sales)
|
4,434
|
4,666
|
|
Closing inventory
|
355
|
275
|
|
|
- |
Production
–
In 2021, potash production was 13 thousand ton lower than the corresponding year, mainly due to a planned shutdown of more than one week
at ICL Dead Sea during the first quarter of 2021.
|
|
|
- |
Sales
–
The quantity of potash sold in 2021 was 232 thousand tons lower year-over-year, as significantly higher sales to the US, Brazil, Vietnam
and Taiwan were offset by lower sales to China and India.
|
|
2021
|
2020
|
|
|
$ millions
|
$ millions
|
|
Segment Sales
|
2,432
|
1,948
|
|
Sales to external customers
|
2,334
|
1,871
|
|
Sales to internal customers
|
98
|
77
|
|
Segment Operating Income
|
307
|
66
|
|
Depreciation and amortization*
|
215
|
210
|
|
Capital expenditures
|
238
|
275
|
|
Year Ended December 31,
|
||
|
2021
|
2020
|
|
|
$ millions
|
$ millions
|
|
|
Europe
|
748
|
651
|
|
Asia
|
610
|
468
|
|
North America
|
491
|
371
|
|
South America
|
358
|
227
|
|
Rest of the world
|
127
|
154
|
|
Total
|
2,334
|
1,871
|
|
Sales
|
Expenses
|
Operating income
|
||
|
$ millions
|
||||
|
YTD 2020 figures
|
1,948
|
(1,882)
|
66
|
|
|
Quantity
|
35
|
(2)
|
33
|
|
|
Price
|
384
|
-
|
384
|
|
|
Exchange rates
|
65
|
(71)
|
(6)
|
|
|
Raw materials
|
-
|
(159)
|
(159)
|
|
|
Energy
|
-
|
(1)
|
(1)
|
|
|
Transportation
|
-
|
(32)
|
(32)
|
|
|
Operating and other expenses
|
-
|
22
|
22
|
|
|
YTD 2021 figures
|
2,432
|
(2,125)
|
307
|
|
|
- |
Quantity
– The positive impact on the segment's operating
income was primarily related to an increase in the sales volumes of acids in all regions, salts and phosphate-based food additive. This
trend was partly offset by a decrease in sales volumes of phosphate fertilizers.
|
|
|
- |
Price
–
The positive impact on the segment's operating income was primarily related to an increase in the selling prices of phosphate fertilizers
and acids, as well as higher selling prices in the phosphate specialties business.
|
|
|
- |
Exchange rates
– The unfavorable impact on the segment’s operating income was primarily related to the appreciation of the average exchange
rate of the Israeli shekel against the dollar, which increased operational costs. This was partly offset by the depreciation of the average
exchange rate of the euro against the dollar which contributed to the operating income.
|
|
|
- |
Raw materials
– The negative impact on the segment’s operating income was due to higher prices of sulphur consumed during the period.
|
|
|
- |
Transportation
– The negative impact on the
segment’s operating income was primarily related to an increase in marine and inland transportation costs.
|
|
|
- |
Operating and other expenses
– The positive impact on operating income was primarily related to lower operational costs.
|
|
2021
|
2020
|
|
|
$ millions
|
$ millions
|
|
Segment Sales
|
1,245
|
731
|
|
Sales to external customers
|
1,226
|
715
|
|
Sales to internal customers
|
19
|
16
|
|
Segment Operating Income
|
121
|
40
|
|
Depreciation and amortization
|
38
|
25
|
|
Capital expenditures
|
36
|
20
|
|
Year Ended December 31,
|
||
|
2021
|
2020
|
|
|
$ millions
|
$ millions
|
|
|
Europe
|
421
|
332
|
|
Asia
|
156
|
126
|
|
North America
|
117
|
103
|
|
South America
|
378
|
21
|
|
Rest of the world
|
154
|
133
|
|
Total
|
1,226
|
715
|
|
Sales
|
Expenses
|
Operating income
|
||
|
$ millions
|
||||
|
YTD 2020 figures
|
731
|
(691)
|
40
|
|
|
New Brazilian Businesses' contribution
|
341
|
(290)
|
51
|
|
|
Quantity
|
71
|
(52)
|
19
|
|
|
Price
|
60
|
-
|
60
|
|
|
Exchange rates
|
42
|
(38)
|
4
|
|
|
Raw materials
|
-
|
(39)
|
(39)
|
|
|
Energy
|
-
|
1
|
1
|
|
|
Transportation
|
-
|
(2)
|
(2)
|
|
|
Operating and other expenses
|
-
|
(13)
|
(13)
|
|
|
YTD 2021 figures
|
1,245
|
(1,124)
|
121
|
|
|
- |
New Brazilian businesses'
contribution
- In January 2021, the Company completed the acquisition of Fertiláqua and in July 2021, the acquisition of ADS.
|
|
|
- |
Quantity
–
The positive impact on the segment's operating income was due to strong sales volumes in most regions and business lines, primarily in
specialty agriculture and turf and ornamental products.
|
|
|
- |
Price
–
The positive impact on the segment's operating income was due to higher sales prices in most business lines, especially in specialty agriculture
and turf and ornamental products.
|
|
|
- |
Exchange rate
– The favorable impact on the segment’s operating income was primarily related to the appreciation of the average exchange
rate of the euro against the dollar, which contributed to the segment's revenue. The appreciation in the average exchange rate of the
Israeli shekel against the dollar offset each other and had no impact on the segment's operating income.
|
|
|
- |
Raw materials
– The negative impact on the segment's operating income was primarily related to higher costs of commodity fertilizers and ammonia.
|
|
|
- |
Operating and other expenses
– The negative impact on operating income was primarily related to higher operational costs, mainly selling and marketing costs.
|
|
Year Ended December 31,
|
||
|
2021
|
2020
|
|
|
$ millions
|
$ millions
|
|
|
Net cash provided by operating activities
|
1,065
|
804
|
|
Net cash used in investing activities
|
(579)
|
(583)
|
|
Net cash used in financing activities
|
(244)
|
(105)
|
|
|
• |
New flame retardants for printed wire boards: commercialization
of new phosphorus-based solutions for PWB according to emerging demands from the market, for example, Polyquel® P100. This is a polymeric
phosphorus-based flame retardant active ester curing agent for epoxy laminates with superior performance. It is in the market development
stage.
|
|
|
• |
Flame retardants for polyurethanes: development of new phosphorus-based solutions and integrated phosphorus/bromine
solutions as flame retardants for the polyurethane market (flexible and rigid foam). For example, our VeriQuel® F series, a new flexible
phosphorus based active flame retardant for flexible polyurethane being launched in the market, and VeriQuel®R100, new reactive phosphorus-based
flame retardant for rigid insulation foams in building and construction markets.
|
|
|
• |
Energy storage: continued development of bromine-based energy
storage solutions for Br-battery companies, using diverse compounds, and commercialization of the new bromine based electrolyte.
|
|
|
• |
Biocides: continued development of new materials for water treatment and prevention of biofilm in industrial
water-cooling systems and pulp & paper plants. Promotion of the Bactesperse® technology for pulp & paper, Reverse Osmosis
membranes & cooling towers.
|
|
|
• |
Phosphorus based products: Development of new phosphorus-based
solutions for hydraulic fluids.
|
|
|
• |
A new product, Bromoquel®, for safer handling of bromine was developed and implemented in the plants.
|
|
|
• |
New fire retardants for the textile market were developed and are
in
the market development stage e.g., Alexiflam NF-LS product.
|
|
|
• |
A new product to treat uncontrolled Chlorine release is being
developed and reached a pilot testing stage.
|
|
|
• |
Magnesia based products: Development of formulations to fulfill unmet needs in the markets such as eliminating
Aluminum salt in deodorants, for example, CareMag® D, which is already in the market with several leading international companies.
|
|
|
• |
Knowledge transfer and technical support for the manufacturing of Lopon® ST (a stabilizer used as
an additive in silicate-based paints) at our Bitterfeld plant (Germany). First production runs are expected during January 2022.
|
|
|
• |
Additional products were developed for baby care applications (CareMag® B) and a cosmetic face mask
(CareMag® M).
|
|
|
• |
Use of artificial intelligence for identifying new applications
for bromine and bromine derivatives.
|
|
|
• |
Support of production: improving product quality, production costs,
energy-saving, recycling and waste treatment. Changing and improving processes while using the principles of green chemistry.
|
|
|
• |
Implementation of a new modified process for TBBA production was
assimilated in the plants.
|
|
|
• |
Troubleshooting and equipment maintenance cycle improvement using
better construction materials preventing accelerated corrosion, wear & tear and equipment adaptation.
|
|
|
• |
A special emphasis is given to research in the sustainability
field on developing recycling technologies for all kinds of materials, e.g., polymers and rare earth metals, etc., and on the recycling
and use of side streams/by-products.
|
|
|
• |
Efficiency activities and synergy measures to increase potash
production and reduce its cost per ton at potash and magnesium plants in Sodom.
|
|
|
• |
Advancement of research regarding environmental protection, including
development of methods for treating and reducing effluents.
|
|
|
• |
Analysis of alternative methods for increasing the production
capacity of carnallite at our evaporation ponds.
|
|
|
• |
Implementation of the R&D department recommendations designed
to clear bottlenecks, focused on flotation and crystalizing areas, for the purpose of increasing production capacity at ICL Iberia.
|
|
|
• |
The segment continues to check the adaptation of various potential
types of phosphate rock to produce phosphoric acid and its downstream products as part of an effort to utilize and increase existing phosphate
reserves. In 2022, the Company will further analyze additional types of phosphate including R&D, pilots, plant testing activities,
and other economic feasibility assessments
.
|
|
|
• |
Research regarding environmental protection, including the development
of methods to treat and reduce effluents and applications for Phosphogypsum uses
.
|
|
|
• |
Integration of secondary source Phosphate technologies (circular
economy) - immediate uses in our production facilities in Europe and development of future sources for our fertilizer products, including
technology road map for recycle and recovery of Phosphorous and nitrogen from secondary sources to transform our products into sustainable
fertilizers.
|
|
|
• |
Development of fertilizers with higher agronomic nutrient efficiency
(NUE).
|
|
|
• |
Development of a new PK fertilizer that is fully water soluble.
|
|
|
• |
R&D Food Specialties supported further growth in the traditional
markets and application areas of Meat/Poultry/Seafood (MPS), Dairy, and Bakery by expanding its footprint in emerging markets.
|
|
|
• |
Continued diversification and development of a product portfolio
for meat substitutes. Several patent applications were filed in 2021 to protect ICL's proprietary technologies. The newly developed continuous
process to produce vegan protein fibers will be implemented in a dedicated US plant, which started to operate in Q4 2021. The product
is suited for tender white meat imitations for chicken and fish replacements; the emulsion technology was successfully transitioned from
vegetarian to vegan to emulate hotdogs, cold cuts, etc. The award-winning technology for ROVITARIS® textured proteins was further
improved in terms of quality to drive a global roll-out outside the US
.
|
|
|
• |
The established dedicated Front-End Innovation group screened
over 100 technologies and start-ups within the first year. The corporate incubator platform Planet ICL invested in Protera Bioscience
whose focus is the discovery and upscaling of protein-based functional ingredients.
|
|
|
• |
Development of controlled release fertilizers with a faster biodegradable
coating to satisfy the upcoming requirements from the EU Fertilizer Product Regulation in July 2026
.
|
|
|
• |
Development of new biostimulant products and fertilizer products
with embedded biostimulant to boost their performance.
|
|
|
• |
Improvement of liquid and fully soluble fertilizers.
|
|
|
• |
Development of products which improve water use efficiency.
|
|
|
• |
Improvement of micronutrients solutions and sulfur fertilizer
solutions
|
|
|
• |
Development of tailor-made formulations based on customer requirements.
|
|
|
• |
Fyrol® - a brand name for a range of phosphorus-containing
flame retardants targeting flexible and rigid polyurethane foam applications.
|
|
|
• |
Joha® - a global trademark for dairy specialties, which specializes
in emulsifying salts for processed cheese.
|
|
|
• |
Merquel® - a line of inorganic brominated salts which can
be used to control mercury emissions from coal power plants.
|
|
|
• |
Osmocote® - a leading brand in the area of controlled released
fertilizers which uses innovative technologies and is used globally by container nursery stocks, pot- plant growers and more.
|
|
|
• |
Peters® - a brand of water-soluble fertilizers, specifically
designed for bedding-, pot- and container nursery plants.
|
|
|
• |
Tari® - a brand in the meat industry as well as in the artisan
business which focuses on the production and processing of meat products with functional additives, spices and flavors.
|
|
|
• |
Brifisol® - a global brand in the meat and seafood industries,
which concentrates in improving texture by adding cryoprotectant for frozen food products such as meat, shrimp, fish filets and more.
|
|
|
• |
Rovitaris® - a brand name for plant-based meat alternatives
that are virtually indistinguishable from their traditional meat counterparts.
|
|
|
A . |
DIRECTORS AND OFFICERS
|
|
Name
|
Age
|
Commencement date as director
|
Director Qualification
|
Financial Expertise
|
Membership in Board Committees
|
||
|
Under the Israeli Companies Law
|
Under the NYSE rules
|
Under the Israeli Companies Law
|
Under the SEC rules
|
||||
|
Yoav Doppelt (Executive Chairman of the Board)
|
53
|
12/18 and as CoB since 07/19
|
(3)
|
-
|
-
|
Operations Committee (Chair)
|
|
|
Aviad Kaufman
|
51
|
March 2014
|
(3)
|
Financial Expert
|
-
|
Financing Committee (member)
|
|
|
Avisar Paz
|
65
|
April 2001
|
(3)
|
Financial Expert
|
-
|
Financing Committee (member)
Operations Committee (member)
|
|
|
Lior Reitblatt
|
64
|
November 2017
|
Independent Director
|
Independent Director
|
Financial Expert
|
Audit Committee Financial Expert
|
Audit & Accounting Committee (member)
Compensation Committee (member)
Financing Committee (member)
Operations Committee (member)
|
|
Ovadia Eli
|
76
|
August 2011
|
(3)
|
-
|
-
|
Safety, Environment, Climate & Public Affairs Committee
(member)
Operations Committee (member)
|
|
|
Reem Aminoach
|
60
|
March 2017
|
(4)
|
Independent Director
|
Financial Expert
|
-
|
Safety, Environment, Climate & Public Affairs Committee
(member)
Operations Committee (member)
|
|
Sagi Kabla
|
45
|
February 2016
|
(3)
|
Financial Expert
|
-
|
Financing Committee (Chair)
Safety, Environment, Climate & Public Affairs Committee
(member)
Operations Committee (member)
|
|
|
Tzipi Ozer Armon
|
55
|
January 2020
|
Independent Director
|
Independent Director
|
Financial Expert
|
-
|
-
|
|
Gadi Lesin
|
54
|
March 2021
|
Independent Director
|
Independent Director
|
Financial Expert
|
Audit Committee Financial Expert
|
Audit & Accounting Committee (member)
Safety, Environment, Climate & Public Affairs Committee
(member)
Operations Committee (member)
|
|
Dr. Miriam Haran(1)
|
72
|
July 2021
|
External Director
|
Independent Director
|
Financial Expert
|
Audit Committee Financial Expert
|
Audit & Accounting Committee (Temporary Chair until
05/22)
Compensation Committee (Chair)
Safety, Environment, Climate & Public Affairs Committee
(Cahir)
|
|
Dafna Gruber(2)
|
56
|
January 2022
|
External Director
|
Independent Director
|
Financial Expert
|
Audit Committee Financial Expert
|
Audit & Accounting Committee (will become Chair as
of 05/22)
Compensation Committee (member)
|
|
|
(1) |
Dr. Miriam Haran's first 3-year tenure commenced as of the date
of approval of ICL's shareholders in July 2021. Dr. Haran replaced Dr. Nadav Kaplan which served as an external director until August
19, 2021. For additional information about Dr. Haran, refer to her bio below.
|
|
|
(2) |
Ms. Dafna Gruber's first 3-year tenure commenced as of the date of approval of ICL's shareholders in January
2022. Ms. Gruber replaced Ms. Ruth Ralbag who served as an external director until November 3, 2021. Ms. Ruth Ralbag notified the Chairman
of ICL's Board of Directors in October 2021 of her decision to resign from her position as an external director of the Board, following
her recent appointment to the position of CEO of Clalit Health Services in Israel, which will require all of her time. For additional
information about Ms. Gruber, refer to her bio below.
|
|
|
(3) |
Messrs. Yoav Doppelt, Aviad Kaufman, Sagi Kabla, Avisar Paz and
Ovadia Eli are not considered independent directors under the above rules by virtue of the positions they hold, or previously held, with
our controlling shareholder or in the Company.
|
|
|
(4) |
Mr. Reem Aminoach meets all qualifications under the Companies Law for Independent Director but was not
formally classified as one.
|
|
Name
|
Age
|
Position
|
|
Raviv Zoller
|
58
|
President & Chief Executive Officer
|
|
Amir Meshulam
(1)
|
45
|
Senior Vice President, Global Internal Auditor
|
|
Anantha N. Desikan
|
54
|
Executive Vice President, ICL Chief Innovation and Technology
Officer
|
|
Anat Tal-Ktalav
|
53
|
President, ICL Industrial Products Division
|
|
Aviram Lahav
(2)
|
62
|
Chief Financial Officer
|
|
Chris Millington
(3)
|
53
|
President, ICL Phosphate Specialty Solutions Division
|
|
Elad Aharonson
|
48
|
Executive Vice President, ICL Innovative Ag Solutions Division
|
|
Ilana Fahima
|
56
|
Executive Vice President, Chief People Officer
|
|
Lilach Geva-Harel
|
45
|
Executive Vice President, Global General Counsel
|
|
Meir Mergi
|
59
|
President, Potash Division
|
|
Miri Mishor
|
58
|
Executive Vice President, Global Information Technology
|
|
Nitzan Moshe
|
54
|
Executive Vice President, ICL Global Operations
|
|
Noam Goldstein
|
61
|
Executive Vice President, Operational Excellence, Energy,
and Innovation
|
|
|
(1) |
See C. Board Practices – Internal Auditor.
|
|
|
(2) |
On January 1, 2022, Mr. Aviram Lahav joined ICL as Chief Financial
Officer, replacing Mr. Kobi Altman.
|
|
|
(3) |
On January 1, 2022, Mr. Chris Millington entered into office
as President, ICL Phosphate Specialty Solutions Division, replacing Ofer Lifshitz.
|
|
Grant for Year
|
Offerrees
|
Grant Date
|
Type of Equity
(2)
|
Dates of Organs' Approvals
|
Grant Value (ILS) per Director
|
Grant Amount per Director
|
Expiration Date & Vesting Schedule
|
|
2021
|
Mr. Yoav Doppelt, Executive Chairman of the Board
|
1.7.2019
|
Options
|
HR & Comp. Committee & Board – 15.4.19
Shareholders (Extraordinary GM) – 29.5.19
|
3 million
|
2,168,675
|
Expiration Date: 30.6.2024
Vesting:
one-half
of the Options vesting upon the lapse of 24 months from Grant Date and one-half upon the lapse of 36 months from the Grant Date
|
|
|
(1) |
The Equity awards are made pursuant to the Company’s Equity
Compensation Plan (2014), as amended in June 2016.
|
|
|
(2) |
On January 31, 2022 and February 6, 2022 and February 8, 2022, our HR & Compensation Committee and
Board of Directors approved, respectively, subject to shareholder approval at the annual general meeting of our shareholders expected
to take place on March 30, 2022 (the "Grant Date"), a three-year long-term incentive award to Mr. Yoav Doppelt, for the years 2022-2024,
in the form of options, with a total value of NIS 9 million (approximately $2.8 million), or NIS 3 million (approximately $937,500) per
vesting annum. The vesting of the 2022-2024 LTI Grant will be in three equal tranches, with one-third of the Options vesting upon the
lapse of 12 months from Grant Date, one-third of the Options vesting upon the lapse of 24 months from Grant Date and one-third upon the
lapse of 36 months from the Grant Date. The Options may be exercised, in whole or in part, as of the date of “maturity” of
each tranche and until the lapse of five years after the Grant Date.
|
|
Details of the Recipient
|
Payments for services
|
||||||
|
Name
|
Position
|
Scope of position
|
Base Salary
|
Compensation
(1)
|
Bonus (STI)
(2)
|
Equity based compensation (LTI)
(3)
|
Total
|
|
US$ thousands
|
|||||||
|
Raviv Zoller
(4)
|
President & Chief Executive Officer
|
100%
|
759
|
1,103
|
1,045
|
1,118
|
3,266
|
|
Kobi Altman
(5)
|
Former Chief Financial Officer
|
100%
|
440
|
604
|
709
|
545
|
1,858
|
|
Ofer Lifshitz
(6)
|
Former President of Phosphate Solutions Division
|
100%
|
381
|
536
|
639
|
371
|
1,546
|
|
Anat Tal-Ktalav
(7)
|
President of Industrial Products Division
|
100%
|
310
|
441
|
386
|
371
|
1,198
|
|
Elad Aharonson
(8)
|
President, Innovative Agro Solutions Division
|
100%
|
319
|
768
|
285
|
83
|
1,136
|
|
|
(1) |
The salary items (compensation) column set out in the above table
includes all of the following components: base salary, customary social benefits, customary social and related provisions, Company car
and reimbursement of telephone expenses. The compensation is in accordance with the Company's Compensation Policy.
|
|
|
(2) |
The short-term incentives (STI/annual bonuses) to officer holders
for 2021, including the top-five earners in 2021, were approved by our HR & Compensation Committee and Board of Directors on January
31 and February 8, 2022, respectively.
|
|
|
(3) |
The expense for share-based payment compensation is calculated
according to IFRS and is recognized in the Company’s statement of income over the vesting period of each portion. The amounts reported
in this column represent the expense recorded in the Company’s financial statements for the year ended December 31, 2021 with respect
to equity-based compensation granted to the senior officer. For details regarding the Company's equity compensation plans, see Note 19
to our Audited Financial Statements.
|
|
|
(4) |
Mr.
Zoller’s terms of employment, as approved by our authorized organs, include
:
(a) annual base salary of NIS 2.4 million (approximately $750,000), indexed to the Israeli Consumer Price Index (CPI). Mr. Zoller's annual
base salary as of December 31, 2021 remained NIS 2.4 million (approximately $750,000). Mr. Zoller's monthly base salary, as of December
31, 2021, was approximately NIS 202,800 (approximately $63,500); (b) annual cash bonus in accordance with ICL’s bonus plan and Compensation
Policy. Mr. Zoller’s Target Bonus as per his employment agreement is NIS 2.5 million (approximately $781,000), with the maximum
annual bonus that can amount to NIS 3.75 million (approximately $1.17 million). For details regarding Mr. Zoller's annual bonus in 2021,
see the Annual Bonus Component section below; (c) an annual LTI (equity) grant of NIS 4.8 million (approximately $1.5 million), or any
other amount per vesting annum, as determined and approved by the Company's authorized organs, including by the Company's shareholders.
On January 31, 2022 and February 6, 2022 and February 8, 2022, our HR & Compensation Committee and Board of Directors approved, respectively,
subject to shareholder approval at the annual general meeting of our shareholders expected to take place on March 30, 2022 (the "Grant
Date"), a three-year long-term incentive award to Mr. Zoller, for the years 2022-2024, in the form of options, with a total value of NIS
16.56 million (approximately $5.18 million), or NIS 5.5 million (approximately $1.84 million) per vesting annum. The vesting of the 2022-2024
LTI Grant will be in three equal tranches, with one-third of the Options vesting upon the lapse of 12 months from Grant Date, one-third
of the Options vesting upon the lapse of 24 months from Grant Date and one-third upon the lapse of 36 months from the Grant Date. The
Options may be exercised, in whole or in part, as of the date of “maturity” of each tranche and until the lapse of five years
after the Grant Date. For details regarding Mr. Zoller's equity compensation grants, see Note 19 to our Audited Financial Statements;
(d) Mr. Zoller is entitled to an advance notice period of 12 months in case of termination by the Company (not for cause) and is required
to give the Company 6 months advance notice in case he resigns. During such advance notice period Mr. Zoller may be required to continue
working for ICL, and therefore Mr. Zoller would continue to be entitled to all of his compensation terms, including vesting of his LTI
awards, but excluding an annual bonus in respect of the advanced notice period and excluding an equity grant, to the extent granted during
such advance notice period; (e) in addition, in case of termination of office, Mr. Zoller will be entitled to an additional severances
equal to his last his last base salary multiplied by the number of years that he served as ICL’s President & CEO; (f) Mr. Zoller
is entitled to all other cash and non-cash benefits payable to our senior executives pursuant to our policies in effect from time to time,
including but not limited to, pension, study fund, disability insurance, Company car, gross up, etc., as well as the exemption, insurance
and indemnification arrangements applying to the Company’s office holders.
|
|
|
(5) |
Mr. Kobi Altman served as ICL’s Chief Financial Officer
(CFO) as of April 1, 2015, until December 31, 2021, following his retirement announcement from October 11, 2021 (the "Notice Date").
Mr.
Altman’s employment agreement provided that
: (a) Mr. Altman’s base salary will be updated twice a year according to
the rise in the Consumer Price Index in the months that passed since the previous update. Accordingly, Mr. Altman’s monthly
base salary, as of December 31, 2021, was approximately NIS 119,271 (approximately $37,270); (b) the employment agreement is for
an unlimited period and may be terminated by either party at any time by advance written notice; and (c) Mr. Altman is entitled to all
benefits customary in the Company, such as regular provisions for pension and severance, disability fund, Company car. Mr. Altman’s
termination terms, which are in compliance with the Company’s compensation policy and in accordance with Mr. Altman’s employment
agreement, were approved by our HR & Compensation Committee and our Board of Directors on November 1, 2021, and November 3, 2021,
respectively, and include a six-month advance notice period which commenced on the Notice Date, during which Mr. Altman continues to be
eligible for all of his employment terms, including vesting of his equity grants. Following utilization of accrued unused vacation days,
Mr. Altman’s expected employment termination date will be April 20, 2022. In addition, our HR & Compensation Committee and Board
of Directors approved on January 31, 2022 and February 8, 2022, respectively, a special bonus to Mr. Altman for 2021 in the amount of
approximately NIS 715,600 (approximately $230,000), equivalent to six base salaries, due to his extraordinary achievements in the 2022
budget planning and approval process, successful transformation of the finance organization and successful hand over of the CFO role to
his successor, Mr. Aviram Lahav. For details regarding Mr. Altman's annual bonus in 2021, see the Annual Bonus Component section below.
The equity-based compensation (LTI) amount in the above table reflects the expense that was recognized by the Company for Mr. Altman’s
LTI in the Company's 2021 Financial Statements
.
|
|
|
(6) |
Mr. Lifshitz served as President of the Phosphate Solution Division
since August 2018 and has announced his wish to retire on November 18, 2021 (the "Notice Date").
Mr.
Lifshitz’s employment agreement provided that
: (a) Mr. Lifshitz’s base salary may be updated twice a year according
to the rise in the Consumer Price Index in the months that passed since the previous update. Accordingly, Mr. Lifshitz’s monthly
base salary, as of December 31, 2021, was approximately NIS 103,382 (approximately $32,300); (b) the employment agreement is for an unlimited
period and may be terminated by either party at any time by advance written notice; (c) Mr. Lifshitz is entitled to an advance notice
period of 3 months; and (d) Mr. Lifshitz is entitled to all benefits customary in the Company, such as regular provisions for pension
and severance, disability fund, Company car
.
Mr. Lifshitz' termination terms
were approved by our HR & Compensation Committee and our Board of Directors on January 31, 2021, and February 8, 2022, respectively.
As part of his termination arrangement, our HR & Compensation Committee and Board of Directors, approved to extend Mr. Lifshitz' advance
notice period by 3 months (to a total of 6 months), to align his terms with the terms of the other executive management members. Accordingly,
following additional utilization of accrued unused vacation days, Mr. Lifshitz' expected end of employment date will be on July 19, 2022.
During this entire period, Mr. Lifshitz continues to be eligible for all of his employment terms, including vesting of his equity grants.
In addition, our HR & Compensation Committee and Board of Directors approved a grant of a special bonus to Mr. Lifshitz for 2021 in
the amount of approximately NIS 620,300 (approximately $194,000), which is equivalent to 6 base salaries, for achieving all-times record
results in the PS division in 2021, and remarkable handover to his successor. For details regarding Mr. Lifshitz' annual bonus in 2021,
see the Annual Bonus Component section below. The equity-based compensation (LTI) amount in the above table reflects the expense that
was recognized by the Company for Mr. Lifshitz’ LTI in the Company's 2021 Financial Statements
.
|
|
|
(7) |
Mrs. Tal-Ktalav’s
employment agreement provides that
: (a) Mrs. Tal-Ktalav’s base salary may be updated twice a year according to the rise in
the Consumer Price Index in the months that passed since the previous update. Mrs. Tal-Ktalav monthly base salary, as of December 31,
2021, was approximately NIS 84,194 (approximately $26,300); (b) the employment agreement is for an unlimited period and may be terminated
by either party at any time by advance written notice; (c) Mrs. Tal-Ktalav is entitled to an advance notice period of 6 months; and
(d) Mrs. Tal-Ktalav is entitled to all benefits customary in the Company, such as regular provisions for pension and severance, disability
fund, Company car and gross up
.
For details regarding Mrs. Tal-Ktalav's annual
bonus in 2021, see the Annual Bonus Component section below. The equity-based compensation (LTI) amount in the above table reflects the
expense that was recognized by the Company for Mrs. Tal-Ktalav’s LTI in the Company's 2021 Financial Statements
.
|
|
|
(8) |
Mr.
Aharonson's employment agreement provides that
: (a) Mr. Aharonson´s base salary may be updated twice a year according to the
rise in the Israeli Consumer Price Index in the months that passed since the previous update. Mr. Aharonson´s monthly base salary,
as of December 31, 2021, was approximately NIS 115,000 (approximately $36,000); (ii) the employment agreement is for an unlimited period
and may be terminated by either party at any time by advance written notice; (iii) Mr. Aharonson is entitled to an advance notice period
of six months; (iv) Mr. Aharonson is entitled to a six month adjustment period if his employment is involuntary terminated during the
first two years of his employment, and (v) Mr. Aharonson is entitled to all benefits customary in the Company, such as regular provisions
for pension and severance, disability fund, Company car and gross up . For details regarding Mr. Aharonson's annual bonus in 2021, see
the Annual Bonus Component section below. The equity-based compensation (LTI) amount in the above table reflects the expense that was
recognized by the Company for Mr. Aharonson’s LTI in the Company's 2021 Financial Statements.
|
|
Number of meetings in reported year
|
Average Attendance
|
|
|
Board of Directors
|
18
|
94%
|
|
Audit & Accounting Committee
|
10
|
97%
|
|
HR & Compensation Committee
|
7
|
100%
|
|
Financing Committee
|
3
|
80%
|
|
Operations Committee
|
2
|
83%
|
|
Safety, Environment, Climate, Diversity, Inclusion and Public
Affairs Committee
|
3
|
100%
|
|
2021
|
2020
|
2019
|
|
Phosphate Solutions
|
4,608
|
4,601
|
4,867
|
|
Potash
|
2,498
|
2,491
|
2,541
|
|
Industrial Product
|
1,595
|
1,654
|
948
|
|
Innovative Ag Solutions
|
2,406
|
994
|
1,651
|
|
Global functions and headquarters
|
1,162
|
1,092
|
1,083
|
|
Sub Total
|
12,269
|
10,832
|
11,090
|
|
Temporary employees
|
964
|
912
|
1,027
|
|
Total employees
|
13,233
|
11,744
|
12,117
|
|
2021
|
2020
|
2019
|
|
Israel
|
4,462
|
4,401
|
4,507
|
|
China
|
1,977
|
2,048
|
2,064
|
|
Spain
|
872
|
868
|
892
|
|
USA
|
772
|
716
|
720
|
|
Germany
|
670
|
697
|
858
|
|
UK
|
676
|
670
|
658
|
|
Netherlands
|
578
|
584
|
584
|
|
Brazil
|
1,644
|
259
|
262
|
|
France
|
122
|
117
|
119
|
|
All other
|
496
|
426
|
523
|
|
Sub Total
|
12,269
|
10,786
|
11,187
|
|
Temporary employees
|
964
|
912
|
1,027
|
|
Total employees
|
13,233
|
11,698
|
12,214
|
One of the key milestones in this important journey is to commit to ICL’s Diversity and Inclusion (D&I) policy , first formulated in 2020, that will strengthen ICL’s direction and provide a measurement for this area.
As part of this process we appointed a Global ICL D&I officer . The new role includes responsibility for supporting the Company by developing a D&I culture and improving ICL’s D&I measures. We also launched a dedicated and interactive online intranet, (MyCampus), to inform and educate employees on diversity, inclusion and belonging issues.
Initiating Global Membership Catalyst
To achieve this goal, we offer virtual sessions on Unconscious Bias , Understanding Privilege and Cultural Awareness, in addition to short knowledge bursts (e-learning) on “ Leading Your Team in an Inclusive Manner ” or “ Running More Inclusive Meetings ”.
Global DIB@ICL ambassadors
|
Ordinary Shares
Beneficially Owned (1) |
Special State
Share |
|||
|
Shareholders
|
Number
|
%
|
Number
|
%
|
|
Israel Corporation Ltd.
(2)
|
587,178,758
|
45.62%**
|
-
|
-
|
|
State of Israel
(3)
|
-
|
-
|
1
|
100%
|
|
Migdal Insurance & Financial Holdings Ltd.
(4)
|
78,034,267
|
6.06%
|
-
|
-
|
|
Harel Insurance Investments & Financial Services Ltd.
(5)
|
67,348,503
|
5.23%
|
-
|
-
|
|
Yoav Doppelt
|
15,381
|
*
|
-
|
-
|
|
Avisar Paz
|
16,926
|
*
|
-
|
-
|
|
Aviad Kaufman
|
-
|
*
|
-
|
-
|
|
Sagi Kabla
|
-
|
*
|
-
|
-
|
|
Ovadia Eli
(6)
|
86,380
|
*
|
-
|
-
|
|
Lior Reitblatt
(7)
|
53,629
|
*
|
-
|
-
|
|
Reem Aminoach
(8)
|
53,629
|
*
|
-
|
-
|
|
Tzipi Ozer Armon
(9)
|
16,220
|
*
|
-
|
-
|
|
Gadi Lesin
|
-
|
*
|
-
|
-
|
|
Miriam Haran
|
53,289
|
*
|
-
|
-
|
|
Dafna Gruber
|
-
|
*
|
-
|
-
|
|
Raviv Zoller
|
-
|
*
|
-
|
-
|
|
Aviram Lahav
|
-
|
*
|
-
|
-
|
|
Lilach Geva Harel
(10)
|
422,535
|
*
|
-
|
-
|
|
Ilana Fahima
(11)
|
422,535
|
*
|
-
|
-
|
|
Eli Amon
(12)
|
344,454
|
*
|
-
|
-
|
|
Nitzan Moshe
|
-
|
*
|
-
|
-
|
|
Anantha Desikan
(13)
|
379,644
|
*
|
-
|
-
|
|
Noam Goldstein
(14)
|
561,972
|
*
|
-
|
-
|
|
Anat Tal-Ktalav
(15)
|
721,387
|
*
|
-
|
-
|
|
Amir Meshulam
(16)
|
147,888
|
*
|
-
|
-
|
|
Miri Mishor
(17)
|
189,825
|
*
|
-
|
-
|
|
Chris Millington
|
-
|
*
|
-
|
-
|
|
Elad Aharonson
|
-
|
*
|
-
|
-
|
|
Meir Mergi
|
33,356
|
*
|
-
|
-
|
|
|
(1) |
The percentages shown are based on 1,287,150,942 ordinary shares
issued and outstanding as of February 22, 2022 (after excluding shares held by us or our subsidiaries). In accordance with SEC rules,
beneficial ownership includes voting or investment power with respect to securities and includes the shares issuable pursuant to options
that are exercisable within 60 days of the date of February 22, 2022. Shares issuable pursuant to options are deemed outstanding
for computing the percentage of the person holding such options but are not considered outstanding for computing the percentage of any
other person.
|
|
|
(2) |
Israel Corp. is a public company listed for trading on the Tel
Aviv Stock Exchange (TASE). Based on the information provided by Israel Corp., Millenium Investments Elad Ltd. (“Millenium”)
and Mr. Idan Ofer are considered as controlling shareholders jointly of Israel Corp., for purposes of the Israeli Securities Law (each
of Millenium and Mr. Idan Ofer hold shares in Israel Corp. directly, and Mr. Idan Ofer serves as a director of Millenium and has an indirect
interest in it as the beneficiary of the discretionary trust that has indirect control of Millenium, as stated below). Millenium holds
approximately 44.44% of the share capital in Israel Corp., which holds as of December 31, 2021 approximately 45.62% of the voting rights
and approximately 44.76% of the issued share capital, of the Company.
|
|
|
(3) |
For a description of the different voting rights held by the holder
of the Special State Share, see “Item 10 - Additional Information— B. Memorandum, Articles of Association and Special State
Share — The Special State Share.”
|
|
|
(4) |
Based solely upon and qualified in its entirety with reference
to a Schedule 13G filed by Migdal Insurance & Financial Holdings Ltd. (“Migdal”) with the SEC on February 2, 2022. According
to the Schedule 13G, of the 78,034,267 Ordinary Shares reported as beneficially owned by Migdal (i) 78,034,267 Ordinary Shares are held
for members of the public through, among others, provident funds, mutual funds, pension funds and insurance policies, which are managed
by direct and indirect subsidiaries of Migdal, each of which subsidiaries operates under independent management and makes independent
voting and investment decisions, (ii) 5,574,849 Ordinary Shares are held by companies for the management of funds for joint investments
in trusteeship, each of which operates under independent management and makes independent voting and investment decisions, and (iii) 0
are beneficially held for their own account (Nostro account)
.
|
|
|
(5) |
Based solely upon and qualified in its entirety with reference
to Amendment No.1 to Schedule 13G filed by Harel Insurance Investments & Financial Services Ltd. (“Harel”), with the SEC
on January 31, 2022. According to the Schedule 13G, of the 67,348,503 Ordinary Shares reported as beneficially owned by Harel (i) 63,307,104
Ordinary Shares are held for members of the public through, among others, provident funds and/or mutual funds and/or pension funds and/or
index-linked securities and/or insurance policies, which are managed by subsidiaries of the Reporting Person, each of which subsidiaries
operates under independent management and makes independent voting and investment decisions, (ii) 1,682,923 Ordinary Shares are held by
third-party client accounts managed by a subsidiary of Harel as portfolio managers, which subsidiary operates under independent management
and makes independent investment decisions and has no voting power in the securities held in such client accounts, and (iii) 2,358,476
Ordinary Shares are beneficially held for their own account (Nostro account).
|
|
|
(6) |
Includes 77,917 ordinary shares and 8,463 ordinary shares subject
to options that are currently exercisable or will be exercisable within 60 days of the date of the table.
|
|
|
(7) |
Includes 45,166 ordinary shares and 8,463 ordinary shares subject
to options that are currently exercisable or will be exercisable within 60 days of the date of the table.
|
|
|
(8) |
Includes 55,018 ordinary shares and 289,436 ordinary shares subject
to options that are currently exercisable or will be exercisable within 60 days of the date of the table
.
|
|
|
(9) |
Includes 8,110 ordinary shares and 8,110 ordinary shares subject
to options that are currently exercisable or will be exercisable within 60 days of the date of the table
.
|
|
|
(10) |
Includes 422,535 ordinary shares subject to options that are currently
exercisable or will be exercisable within 60 days of the date of the table
.
|
|
|
(11) |
Includes 422,535 ordinary shares subject to options that are currently
exercisable or will be exercisable within 60 days of the date of the table
.
|
|
|
(12) |
Includes 55,018 ordinary shares and 289,436 ordinary shares subject
to options that are currently exercisable or will be exercisable within 60 days of the date of the table
.
|
|
|
(13) |
Includes 379,644 ordinary shares subject to options that are currently
exercisable or will be exercisable within 60 days of the date of the table
.
|
|
|
(14) |
Includes 561,972 ordinary shares subject to options that are currently
exercisable or will be exercisable within 60 days of the date of the table
.
|
|
|
(15) |
Includes 87,310 ordinary shares and 634,077 ordinary shares subject
to options that are currently exercisable or will be exercisable within 60 days of the date of the table
.
|
|
|
(16) |
Includes 147,888 ordinary shares subject to options that are currently
exercisable or will be exercisable within 60 days of the date of the table.
|
|
|
(17) |
Includes 41,937 ordinary shares and 147,888 ordinary shares subject
to options that are currently exercisable or will be exercisable within 60 days of the date of the table.
|
|
|
• |
The composition of our Board of Directors (other than external
directors, as described under “Item 6 - Directors, Senior Management and Employees— C. Board Practices— External Directors”);
|
|
|
• |
Mergers or other business combinations;
|
|
|
• |
Certain future issuances of ordinary shares or other securities;
and
|
|
|
• |
Amendments to our Articles of Association, excluding provisions
of the Articles of Association that were determined by the Special State Share.
|
|
For the year ended December 31
|
|||
|
2021
|
2020
|
2019
|
|
|
$ millions
|
$ millions
|
$ millions
|
|
|
Sales
|
7
|
3
|
4
|
|
Cost of sales
|
6
|
3
|
8
|
|
Selling, transport and marketing expenses
|
13
|
7
|
10
|
|
Financing expenses (income), net
|
(2)
|
(1)
|
(1)
|
|
General and administrative expenses
|
1
|
1
|
1
|
|
Management fees to the parent company
|
1
|
1
|
1
|
|
As of December 31
|
||
|
2021
|
2020
|
|
|
$ millions
|
$ millions
|
|
|
Other current assets
|
40
|
35
|
|
Other current liabilities
|
4
|
2
|
|
|
A. |
CONSOLIDATED STATEMENTS AND OTHER FINANCIAL INFORMATION
|
|
|
1. |
On January 10, 2018, an application for certification of a derivative
action was filed by a shareholder of Oil Refineries Ltd. (“Bazan”) with the Tel Aviv-Yafo District Court, against former and
current board members of Bazan, OPC Energy Ltd. OPC Rotem Ltd., OPC Hadera Ltd. and the Company, (hereinafter, jointly: the “Additional
Companies”), and against Israel Corporation Ltd., Mr. Idan Ofer and Mr. Ehud Angel (the “Application”).
|
|
|
1. |
According to the announcement issued by the Company on May 10,
2017, ICL Europe Coöperatief U.A. (“ICL Europe”), a subsidiary of the Company, filed a Notice of Arbitration against
the Federal Democratic Republic of Ethiopia ("Ethiopia") under the Agreement of Encouragement and Reciprocal Protection of Investments
between Ethiopia and the Kingdom of the Netherlands ("the Ethiopia- Netherlands BIT"). A three-member arbitration tribunal ("Tribunal")
was constituted under the Arbitration Rules of the United Nations Commission on International Trade Law ("UNCITRAL Rules") to hear the
case, which is being administered by the Permanent Court of Arbitration located in The Hague, the Netherlands. Following ICL Europe's
filing of Notice of Arbitration on May 10, 2017 and Ethiopia's response thereto on June 12, 2017, ICL Europe submitted to the Tribunal
on June 19, 2018, its Statement of Claim seeking compensation in the amount of $181 million plus interest for damage its claims as a result
of Ethiopia's coercive, arbitrary, discriminatory and unlawful conduct, culminating in the imposition without legal basis of a purported
tax on ICL Europe's indirectly owned Ethiopian company, Allana Potash Afar Plc, and Ethiopia's violation of multiple provisions of the
Ethiopia- Netherlands BIT, including the requirements to accord fair and equitable treatment to ICL Europe's investment, to provide full
protection and security to ICL Europe's investment and not to expropriate unlawfully ICL Europe's investment. Ethiopia submitted to the
Tribunal on October 19, 2018, its Statement of Defense and Objections to Jurisdiction. Among other things, Ethiopia argues that ICL Europe
failed to make its investment in compliance with Ethiopian law and that the Tribunal lacks jurisdiction under the Ethiopia-Netherlands
BIT as a result, that the challenged tax was lawful and does not provide a basis for presenting a claim under the Ethiopia- Netherlands
BIT and that ICL terminated its investment for reasons unrelated to any of the alleged unlawful acts and omissions of Ethiopia. On August
12, 2019, ICL submitted its Reply in support of its claims against Ethiopia and in response to which Ethiopia submitted on November 25,
2019 its Rejoinder. Due to the emergence of the COVID-19 pandemic the Tribunal decided on June 19, 2020 that the hearing would proceed
in two phases, in August and December 2020, with the first phase to proceed by videoconference and with the examination of Ethiopia’s
fact witnesses deferred to the second phase of the hearing. On August 13, 2020, the first phase was completed and on December 8, 2020,
the second phase was completed (also by videoconference). On July 9, 2021, the arbitration tribunal rendered its award. Despite indications
that Ethiopia’s tax assessment was flawed, the tribunal interpreted the BIT as significantly limiting the BIT’s protections
in relation to disputes regarding taxation. Among other things, this had the significant effect of precluding ICL Europe's claims that
Ethiopia violated the requirement to accord fair and equitable treatment to ICL Europe's investments in Ethiopia. Consequently, the tribunal
rejected ICL Europe's claims and ordered ICL Europe to pay an amount of approximately $2.5 million as reimbursement of arbitration costs
in accordance with the applicable arbitration rules. Since 2017, Allana Afar is not included in ICL's consolidated financial statements.
This award does not have a material impact on the Company’s Financial Statements
.
|
|
|
2. |
The Inter-Ministry Directors
General Committee recommendations on the Haifa Bay
: In connection with our subsidiary, Fertilizers & Chemicals (F&C), on
April 26, 2021, the Inter-Ministry Directors General Committee published its recommendations on the Haifa Bay, which aim to promote and
develop the Haifa Bay area and realize its potential by rezoning of the Bay and determining land designations that will enable the development
of the area for the welfare of its residents and end all petrochemical industry and the fertilizers plants within a decade. The Committee
recommended the establishment of a government team with the aim of negotiating with companies operating in the Haifa Bay, including F&C,
in order to reach renewed agreements regarding the possibility of changing their operations in Haifa Bay, as part of the aforesaid land
rezoning, by way of mutual collaboration and by trying to achieve the purpose of the engagement with them, and if possible, in a way that
is as compatible as possible with the needs of the employees and the interests of the companies.
In February 2022, the Company received a draft government decisions proposal regarding the advancement
of a strategy for the development and promotion of Haifa Bay in Israel (hereinafter – the draft).
|
|
|
A. |
OFFER AND LISTING DETAILS
|
|
|
◾ |
To preserve the character of the Company and its subsidiaries
,
ICL Dead Sea, ICL Rotem, Dead Sea Bromine Company, Bromine Compounds and Tami
,
as Israeli companies whose centers of business and management are in Israel. In our estimation, this condition is met.
|
|
|
◾ |
To monitor the control over minerals and natural resources, for
purposes of their efficient development and utilization, including maximum utilization in Israel of the results of investments, research
and development.
|
|
|
◾ |
To prevent acquisition of a position of influence in the Company
or the foregoing Israeli subsidiaries by hostile entities or entities likely to harm the foreign and security interests of the State of
Israel.
|
|
|
◾ |
To prevent acquisition of a position of influence in the Company
or the foregoing Israeli subsidiaries or management of such companies, whereby such acquisition or management may create a situation of
significant conflicts of interest likely to harm any of the vital interests enumerated above.
|
|
|
• |
certain financial institutions
;
|
|
|
• |
dealers or traders in securities that use a mark-to-market method
of tax accounting
;
|
|
|
• |
persons holding ordinary shares as part of a “straddle”
or integrated transaction or persons entering into a constructive sale with respect to the ordinary shares
;
|
|
|
• |
persons whose functional currency for U.S. federal income tax
purposes is not the U.S. dollar
;
|
|
|
• |
entities classified as partnerships for U.S. federal income tax
purposes
;
|
|
|
• |
tax exempt entities, “individual retirement accounts”
or “Roth IRAs
"
:
|
|
|
• |
Persons who acquired our ordinary shares pursuant to the exercise
of an employee stock option or otherwise as compensation;
|
|
|
• |
persons that own or are deemed to own 10% or more of our stock
by vote or value; or
|
|
|
• |
persons holding our ordinary shares in connection with a trade
or business conducted outside of the United States
.
|
|
|
• |
a citizen or individual resident of the United States
;
|
|
|
• |
a corporation, or other entity taxable as a corporation, created
or organized in or under the laws of the United States, any state therein or the District of Columbia; or
|
|
|
• |
an estate or trust the income of which is subject to U.S. federal
income taxation regardless of its source
.
|
|
Increase (decrease)
in fair value
|
Fair value
|
Increase (decrease)
in fair value
|
|||
|
USD/NIS
|
$ millions
|
$ millions
|
$ millions
|
$ millions
|
$ millions
|
|
Type of instrument
|
Increase of 10%
|
Increase of 5%
|
Decrease of 5%
|
Decrease of 10%
|
|
|
Cash and cash equivalents
|
(0.3)
|
(0.1)
|
3.1
|
0.2
|
0.3
|
|
Trade receivables
|
(7.5)
|
(3.9)
|
82.0
|
4.3
|
9.1
|
|
Receivables and debit balances
|
(1.7)
|
(0.9)
|
18.7
|
1.0
|
2.1
|
|
Trade payables
|
37.2
|
19.5
|
(409.7)
|
(21.6)
|
(45.5)
|
|
Other payables
|
1.6
|
0.8
|
(17.8)
|
(0.9)
|
(2.0)
|
|
Long-term loans
|
17.3
|
9.1
|
(60.3)
|
(10.0)
|
(21.1)
|
|
Fixed rate debentures
|
57.8
|
30.3
|
(635.8)
|
(33.5)
|
(70.6)
|
|
Options
|
(39.7)
|
(18.1)
|
13.5
|
25.1
|
54.9
|
|
Forward
|
(47.5)
|
(24.7)
|
1.5
|
27.7
|
58.4
|
|
Swap
|
(69.3)
|
(36.3)
|
118.8
|
40.2
|
84.8
|
|
Total
|
(52.1)
|
(24.3)
|
(886.0)
|
32.5
|
70.4
|
|
Increase (decrease)
in fair value
|
Fair value
|
Increase (decrease)
in fair value
|
|||
|
EUR/USD
|
$ millions
|
$ millions
|
$ millions
|
$ millions
|
$ millions
|
|
Type of instrument
|
Increase of 10%
|
Increase of
5%
|
Decrease of 5%
|
Decrease of 10%
|
|
|
Cash and cash equivalents
|
(2.1)
|
(1.1)
|
22.8
|
1.2
|
2.5
|
|
Short term deposits and loans
|
0.0
|
0.0
|
0.2
|
0.0
|
0.0
|
|
Trade receivables
|
(23.7)
|
(12.4)
|
260.3
|
13.7
|
28.9
|
|
Receivables and debit balances
|
(2.0)
|
(1.1)
|
22.2
|
1.2
|
2.5
|
|
Long-term deposits and loans
|
(0.3)
|
(0.2)
|
3.6
|
0.2
|
0.4
|
|
Trade payables
|
19.7
|
10.3
|
(216.3)
|
(11.4)
|
(24.0)
|
|
Other payables
|
6.6
|
3.5
|
(72.6)
|
(3.8)
|
(8.1)
|
|
Long-term loans from banks
|
28.2
|
14.8
|
(310.6)
|
(16.3)
|
(34.5)
|
|
Options
|
5.6
|
2.7
|
1.7
|
(2.4)
|
(5.0)
|
|
Forward
|
22.1
|
11.0
|
4.3
|
(11.0)
|
(22.1)
|
|
Total
|
54.1
|
27.5
|
(284.4)
|
(28.6)
|
(59.4)
|
|
Increase (decrease)
in fair value
|
Fair value
|
Increase (decrease)
in fair value
|
|||
|
GBP/USD
|
$ millions
|
$ millions
|
$ millions
|
$ millions
|
$ millions
|
|
Type of instrument
|
Increase of 10%
|
Increase of
5%
|
Decrease of 5%
|
Decrease of 10%
|
|
|
Cash and cash equivalents
|
(0.5)
|
(0.2)
|
5.2
|
0.3
|
0.6
|
|
Trade receivables
|
(3.7)
|
(2.0)
|
41.2
|
2.2
|
4.6
|
|
Receivables and debit balances
|
(0.1)
|
0.0
|
0.8
|
0.0
|
0.1
|
|
Trade payables
|
2.6
|
1.4
|
(28.5)
|
(1.5)
|
(3.2)
|
|
Other payables
|
0.3
|
0.2
|
(3.8)
|
(0.2)
|
(0.4)
|
|
Options
|
(1.2)
|
(0.7)
|
(0.1)
|
0.5
|
1.1
|
|
Forward
|
(1.6)
|
(0.8)
|
(0.3)
|
0.8
|
1.6
|
|
Total
|
(4.2)
|
(2.1)
|
14.5
|
2.1
|
4.4
|
|
Increase (decrease)
in fair value
|
Fair value
|
Increase (decrease)
in fair value
|
|||
|
BRL/USD
|
$ millions
|
$ millions
|
$ millions
|
$ millions
|
$ millions
|
|
Type of instrument
|
Increase of 10%
|
Increase of
5%
|
Decrease of 5%
|
Decrease of 10%
|
|
|
Cash and cash equivalents
|
(6.9)
|
(3.6)
|
76.3
|
4.0
|
8.5
|
|
Trade receivables
|
(20.2)
|
(10.6)
|
221.8
|
11.7
|
24.6
|
|
Trade payables
|
9.4
|
4.9
|
(103.3)
|
(5.4)
|
(11.5)
|
|
Long-term deposits and loans
|
(0.6)
|
(0.3)
|
6.2
|
0.3
|
0.7
|
|
Other payables
|
0.9
|
0.5
|
(10.3)
|
(0.5)
|
(1.1)
|
|
Long-term loans from banks
|
0.2
|
0.1
|
(2.3)
|
(0.1)
|
(0.3)
|
|
Forward
|
3.4
|
1.8
|
(0.9)
|
(2.0)
|
(4.2)
|
|
Total
|
(13.8)
|
(7.2)
|
188.4
|
8.0
|
16.7
|
|
Increase (decrease)
in fair value
|
Fair value
|
Increase (decrease)
in fair value
|
|||
|
CNY/USD
|
$ millions
|
$ millions
|
$ millions
|
$ millions
|
$ millions
|
|
Type of instrument
|
Increase of 10%
|
Increase of
5%
|
Decrease of 5%
|
Decrease of 10%
|
|
|
Cash and cash equivalents
|
(23.9)
|
(12.5)
|
262.8
|
13.8
|
29.2
|
|
Short term investments and deposits
|
(0.3)
|
(0.2)
|
3.2
|
0.2
|
0.4
|
|
Trade receivables
|
(8.2)
|
(4.3)
|
90.7
|
4.8
|
10.1
|
|
Trade payables
|
8.3
|
4.3
|
(90.9)
|
(4.8)
|
(10.1)
|
|
Other payables
|
1.4
|
0.7
|
(15.0)
|
(0.8)
|
(1.7)
|
|
Long-term loans (CNY)
|
3.2
|
1.7
|
(34.8)
|
(1.8)
|
(3.9)
|
|
Forward
|
(4.2)
|
(2.2)
|
0.7
|
2.5
|
5.2
|
|
Total
|
(23.7)
|
(12.5)
|
216.7
|
13.9
|
29.2
|
|
Increase (decrease)
in fair value
|
Fair value
|
Increase (decrease)
in fair value
|
|||
|
USD/NIS
|
$ millions
|
$ millions
|
$ millions
|
$ millions
|
$ millions
|
|
Type of instrument
|
Increase of 10%
|
Increase of 5%
|
Decrease of 5%
|
Decrease of 10%
|
|
|
Cash and cash equivalents
|
(0.2)
|
(0.1)
|
2.2
|
0.1
|
0.2
|
|
Trade receivables
|
(5.3)
|
(2.8)
|
58.0
|
3.1
|
6.4
|
|
Receivables and debit balances
|
(0.6)
|
(0.3)
|
6.7
|
0.4
|
0.7
|
|
Credit from banks and others
|
3.3
|
1.7
|
(35.8)
|
(1.9)
|
(4.0)
|
|
Trade payables
|
29.6
|
15.5
|
(325.8)
|
(17.1)
|
(36.2)
|
|
Other payables
|
1.5
|
0.8
|
(17.0)
|
(0.9)
|
(1.9)
|
|
Long-term loans
|
12.4
|
6.5
|
(135.9)
|
(7.2)
|
(15.1)
|
|
Fixed rate debentures
|
67.9
|
35.6
|
(747.4)
|
(39.3)
|
(83.0)
|
|
Options
|
(26.1)
|
(13.6)
|
11.2
|
19.2
|
43.9
|
|
Forward
|
(39.0)
|
(20.4)
|
8.1
|
22.6
|
47.7
|
|
Swap
|
(81.7)
|
(43.0)
|
115.2
|
47.8
|
101.0
|
|
Total
|
(38.2)
|
(20.1)
|
(1,060.5)
|
26.8
|
59.7
|
|
Increase (decrease)
in fair value
|
Fair value
|
Increase (decrease)
in fair value
|
|||
|
EUR/USD
|
$ millions
|
$ millions
|
$ millions
|
$ millions
|
$ millions
|
|
Type of instrument
|
Increase of 10%
|
Increase of
5%
|
Decrease of 5%
|
Decrease of 10%
|
|
|
Cash and cash equivalents
|
(1.2)
|
(0.6)
|
12.8
|
0.7
|
1.4
|
|
Short term deposits and loans
|
(0.5)
|
(0.2)
|
5.0
|
0.3
|
0.6
|
|
Trade receivables
|
(20.7)
|
(10.8)
|
227.4
|
12.0
|
25.3
|
|
Receivables and debit balances
|
(3.7)
|
(1.9)
|
40.6
|
2.1
|
4.5
|
|
Long-term deposits and loans
|
(0.2)
|
(0.1)
|
2.5
|
0.1
|
0.3
|
|
Credit from banks and others
|
6.4
|
3.3
|
(70.0)
|
(3.7)
|
(7.8)
|
|
Trade payables
|
14.9
|
7.8
|
(163.5)
|
(8.6)
|
(18.2)
|
|
Other payables
|
6.2
|
3.2
|
(68.0)
|
(3.6)
|
(7.6)
|
|
Long-term loans from banks
|
3.3
|
1.7
|
(35.9)
|
(1.9)
|
(4.0)
|
|
Options
|
3.8
|
2.1
|
(1.5)
|
(2.8)
|
(6.1)
|
|
Forward
|
13.6
|
7.1
|
(0.1)
|
(7.9)
|
(16.6)
|
|
Swap
|
33.4
|
17.5
|
(41.1)
|
(19.4)
|
(40.9)
|
|
Total
|
55.3
|
29.1
|
(91.8)
|
(32.7)
|
(69.1)
|
|
Increase (decrease)
in fair value
|
Fair value
|
Increase (decrease)
in fair value
|
|||
|
GBP/USD
|
$ millions
|
$ millions
|
$ millions
|
$ millions
|
$ millions
|
|
Type of instrument
|
Increase of 10%
|
Increase of
5%
|
Decrease of 5%
|
Decrease of 10%
|
|
|
Cash and cash equivalents
|
(0.5)
|
(0.2)
|
5.0
|
0.3
|
0.6
|
|
Trade receivables
|
(3.2)
|
(1.7)
|
35.1
|
1.8
|
3.9
|
|
Credit from banks and others
|
7.7
|
4.0
|
(84.7)
|
(4.5)
|
(9.4)
|
|
Trade payables
|
2.0
|
1.0
|
(21.5)
|
(1.1)
|
(2.4)
|
|
Other payables
|
0.3
|
0.2
|
(3.6)
|
(0.2)
|
(0.4)
|
|
Long-term loans
|
2.0
|
1.1
|
(22.3)
|
(1.2)
|
(2.5)
|
|
Swap
|
(6.2)
|
(3.3)
|
5.0
|
3.6
|
7.6
|
|
Options
|
(0.8)
|
(0.4)
|
0.4
|
0.5
|
1.1
|
|
Forward
|
(2.5)
|
(1.3)
|
0.3
|
1.4
|
3.0
|
|
Total
|
(1.2)
|
(0.6)
|
(86.3)
|
0.6
|
1.5
|
|
Increase (decrease)
in fair value
|
Fair value
|
Increase (decrease)
in fair value
|
|||
|
BRL/USD
|
$ millions
|
$ millions
|
$ millions
|
$ millions
|
$ millions
|
|
Type of instrument
|
Increase of 10%
|
Increase of
5%
|
Decrease of 5%
|
Decrease of 10%
|
|
|
Cash and cash equivalents
|
(0.6)
|
(0.3)
|
6.4
|
0.3
|
0.7
|
|
Trade receivables
|
(1.9)
|
(1.0)
|
21.4
|
1.1
|
2.4
|
|
Trade payables
|
1.0
|
0.5
|
(11.0)
|
(0.6)
|
(1.2)
|
|
Long-term deposits and loans
|
(0.3)
|
(0.2)
|
3.6
|
0.2
|
0.4
|
|
Other payables
|
0.0
|
0.0
|
(0.1)
|
0.0
|
0.0
|
|
Long-term loans from banks
|
0.8
|
0.4
|
(8.9)
|
(0.5)
|
(1.0)
|
|
Options
|
(0.2)
|
(0.2)
|
0.2
|
0.2
|
0.2
|
|
Forward
|
0.1
|
0.0
|
0.0
|
(0.1)
|
(0.1)
|
|
Total
|
(1.1)
|
(0.8)
|
11.6
|
0.6
|
1.4
|
|
Increase (decrease)
in fair value
|
Fair value
|
Increase (decrease)
in fair value
|
|||
|
CNY/USD
|
$ millions
|
$ millions
|
$ millions
|
$ millions
|
$ millions
|
|
Type of instrument
|
Increase of 10%
|
Increase of
5%
|
Decrease of 5%
|
Decrease of 10%
|
|
|
Cash and cash equivalents
|
(5.5)
|
(2.9)
|
60.2
|
3.2
|
6.7
|
|
Short term investments and deposits
|
(0.3)
|
(0.2)
|
3.7
|
0.2
|
0.4
|
|
Trade receivables
|
(4.6)
|
(2.4)
|
51.1
|
2.7
|
5.7
|
|
Investments at fair value through other comprehensive income
|
(12.3)
|
(6.5)
|
135.7
|
7.1
|
15.1
|
|
Trade payables
|
6.0
|
3.2
|
(66.3)
|
(3.5)
|
(7.4)
|
|
Other payables
|
2.4
|
1.2
|
(26.0)
|
(1.4)
|
(2.9)
|
|
Credit from banks and others
|
5.6
|
2.9
|
(61.9)
|
(3.3)
|
(6.9)
|
|
Long-term loans (CNY)
|
5.4
|
2.8
|
(59.8)
|
(3.1)
|
(6.6)
|
|
Forward
|
2.1
|
1.1
|
(0.2)
|
(1.2)
|
(2.6)
|
|
Total
|
(1.2)
|
(0.8)
|
36.5
|
0.7
|
1.5
|
|
Increase (decrease)
in fair value
|
Fair value
|
Increase (decrease)
in fair value
|
|||
|
$ millions
|
$ millions
|
$ millions
|
$ millions
|
$ millions
|
|
|
Type of instrument
|
Increase of
1%
|
Increase of 0.5%
|
Decrease of 0.5%
|
Decrease of 1%
|
|
|
Fixed-USD interest debentures
|
98.5
|
50.9
|
(1,302.1)
|
(54.4)
|
(112.6)
|
|
Swap transactions
|
4.2
|
2.1
|
(6.5)
|
(2.2)
|
(4.3)
|
|
NIS/USD swap
|
28.8
|
14.8
|
118.8
|
(15.6)
|
(31.9)
|
|
Total
|
131.5
|
67.8
|
(1,189.8)
|
(72.2)
|
(148.8)
|
|
Increase (decrease)
in fair value
|
Fair value
|
Increase (decrease)
in fair value
|
|||
|
$ millions
|
$ millions
|
$ millions
|
$ millions
|
$ millions
|
|
|
Type of instrument
|
Increase of
1%
|
Increase of 0.5%
|
Decrease of 0.5%
|
Decrease of 1%
|
|
|
Fixed-USD interest debentures
|
108.0
|
55.8
|
(1,419.1)
|
(59.8)
|
(124.0)
|
|
Swap transactions
|
5.9
|
3.0
|
(13.1)
|
(3.0)
|
(6.1)
|
|
NIS/USD swap
|
36.6
|
18.8
|
115.2
|
(19.5)
|
(39.5)
|
|
GBP/USD swap
|
0.2
|
0.1
|
5.0
|
(0.1)
|
(0.2)
|
|
EUR/USD swap
|
(0.9)
|
(0.5)
|
(41.1)
|
0.5
|
1.0
|
|
Total
|
149.8
|
77.2
|
(1,353.1)
|
(81.9)
|
(168.8)
|
|
Sensitivity to changes in the
shekel interest rate
|
Increase (decrease)
in fair value
|
Fair value
|
Increase (decrease)
in fair value
|
||
|
$ millions
|
$ millions
|
$ millions
|
$ millions
|
$ millions
|
|
|
Type of instrument
|
Increase of
1%
|
Increase of 0.5%
|
Decrease of 0.5%
|
Decrease of 1%
|
|
|
Fixed-interest long-term loan
|
0.2
|
0.1
|
(60.3)
|
(0.1)
|
(0.1)
|
|
Fixed rate debentures
|
26.6
|
13.6
|
(635.8)
|
(14.4)
|
(29.5)
|
|
NIS/USD swap
|
(35.1)
|
(18.1)
|
118.8
|
19.2
|
39.4
|
|
Total
|
(8.3)
|
(4.4)
|
(577.3)
|
4.7
|
9.8
|
|
Sensitivity to changes in the
shekel interest rate
|
Increase (decrease)
in fair value
|
Fair value
|
Increase (decrease)
in fair value
|
||
|
$ millions
|
$ millions
|
$ millions
|
$ millions
|
$ millions
|
|
|
Type of instrument
|
Increase of
1%
|
Increase of 0.5%
|
Decrease of 0.5%
|
Decrease of 1%
|
|
|
Fixed-interest long-term loan
|
1.9
|
0.9
|
(135.9)
|
(1.0)
|
(1.9)
|
|
Fixed rate debentures
|
31.6
|
16.2
|
(747.4)
|
(17.1)
|
(35.1)
|
|
NIS/USD swap
|
(42.4)
|
(22.1)
|
115.2
|
23.8
|
49.0
|
|
Total
|
(8.9)
|
(5.0)
|
(768.1)
|
5.7
|
12.0
|
|
Increase (decrease)
in fair value
|
Fair value
|
Increase (decrease)
in fair value
|
|||
|
$ millions
|
$ millions
|
$ millions
|
$ millions
|
$ millions
|
|
|
Type of instrument
|
Increase of
10%
|
Increase of 5%
|
Decrease of 5%
|
Decrease of 10%
|
|
|
Energy hedges
|
-
|
-
|
0.0
|
-
|
-
|
|
Increase (decrease)
in fair value
|
Fair value
|
Increase (decrease)
in fair value
|
|||
|
$ millions
|
$ millions
|
$ millions
|
$ millions
|
$ millions
|
|
|
Increase of
10%
|
Increase of 5%
|
Decrease of 5%
|
Decrease of 10%
|
||
|
Energy hedges
|
-
|
-
|
(0.5)
|
-
|
-
|
|
Increase (decrease)
in fair value
|
Fair value
|
Increase (decrease)
in fair value
|
|||
|
$ millions
|
$ millions
|
$ millions
|
$ millions
|
$ millions
|
|
|
Type of instrument
|
Increase of
10%
|
Increase of 5%
|
Decrease of 5%
|
Decrease of 10%
|
|
|
Marine shipping hedges
|
0.8
|
0.4
|
1.6
|
(0.4)
|
(0.8)
|
|
Increase (decrease)
in fair value
|
Fair value
|
Increase (decrease)
in fair value
|
|||
|
$ millions
|
$ millions
|
$ millions
|
$ millions
|
$ millions
|
|
|
Type of instrument
|
Increase of
10%
|
Increase of 5%
|
Decrease of 5%
|
Decrease of 10%
|
|
|
Marine shipping hedges
|
-
|
-
|
-
|
-
|
-
|
|
|
• |
pertain to the maintenance of records that, in reasonable detail,
accurately and fairly reflect transactions and dispositions of our assets;
|
|
|
• |
provide reasonable assurance that transactions are recorded as
necessary to permit preparation of financial statements, in accordance with generally accepted accounting principles, and that receipts
and expenditures are being made only in accordance with authorization of our management and directors; and
|
|
|
• |
provide reasonable assurance regarding prevention or timely detection
of unauthorized acquisition, use or disposition of our assets that could have a material effect on our financial statements.
|
|
2021
|
2020
|
|
|
US$ thousands
|
US$ thousands
|
|
Audit fees(1)
|
4,645
|
4,739
|
|
Audit-related fees(2)
|
148
|
146
|
|
Tax fees(3)
|
1,303
|
1,643
|
|
Total
|
6,096
|
6,528
|
Not Applicable.
|
|
• |
Majority Independent Board.
Under
Section 303A.01 of the NYSE Listed Company Manual (the “LCM”), a US domestic listed company, other than a controlled
company, must have a majority of independent directors. Six of our ten directors are not considered independent directors under Israeli
law whether due to their relationship with the Company, our controlling shareholder or the length of their tenure on our Board of Directors.
|
|
|
• |
Nominating/Corporate Governance
Committee.
Under Section 303A.04 of the LCM, a US domestic listed company, other than a controlled company, must have
a nominating/corporate governance committee composed entirely of independent directors. Our controlling shareholder, Israel Corporation,
has significant control over the appointment of our directors (other than external directors).
|
|
|
• |
Equity Compensation Plans.
Under Section 303A.08 of the LCM, shareholders must be given the opportunity to vote on all equity‑compensation plans and material
revisions thereto, with certain limited exemptions as described therein. We follow the requirements of the Companies Law, under which
approval of equity compensation plans and material revisions thereto is within the authority of our HR & Compensation Committee and
the Board of Directors. However, under the Companies Law, any compensation to directors, the Chief Executive Officer or a controlling
shareholder or another person in which a controlling shareholder has a personal interest, including equity compensation plans, generally
requires the approval of the compensation committee, the Board of Directors and the shareholders, in that order. Under the Companies Law,
the compensation of directors and officers is generally required to comply with a shareholder‑approved compensation policy, which
is required, among other things, to include a monetary cap on the value of equity compensation that may be granted to any director or
officer.
|
|
|
• |
Shareholder Approval of Securities
Issuances
. Under Section 312.03 of the LCM, shareholder approval is a prerequisite to (a) issuing ordinary shares, or
securities convertible into or exercisable for ordinary shares, to a related party, a subsidiary, affiliate or other closely related person
of a related party or any company or entity in which a related party has a substantial interest, if the number of ordinary shares to be
issued exceeds either 1% of the number of ordinary shares or 1% of the voting power outstanding before the issuance, and (b) issuing
ordinary shares, or securities convertible into or exercisable for ordinary shares, if the ordinary share has, or will have upon issuance,
voting power equal to or in excess of 20% of the voting power outstanding before the issuance or the number of ordinary shares to be issued
is equal to or in excess of 20% of the number of ordinary shares before the issuance, in each case subject to certain exceptions. We seek
shareholder approval for all corporate actions requiring such approval under the requirements of the Companies Law, which are different
from the requirements for seeking shareholder approval under Section 312.03 of the LCM. Under the Companies Law, shareholder approval
is a prerequisite to any extraordinary transaction with a controlling shareholder or in which a controlling shareholder has a personal
interest. Under the Companies Law, shareholder approval is also a prerequisite to a private placement of securities if it will cause a
person to become a controlling shareholder or in case all of the following conditions are met:
|
|
|
• |
The securities issued amount to 20% or more of the Company’s
outstanding voting rights before the issuance;
|
|
|
• |
Some or all of the consideration is other than cash or listed
securities or the transaction is not on market terms; and
|
|
|
• |
The transaction will increase the relative holdings of a 5% shareholder
or will cause any person to become, as a result of the issuance, a 5% shareholder.
|
|
1.1
|
|
|
2.1
|
|
|
4.1
|
|
|
4.3
|
|
|
101.INS
|
XBRL Instance Document
|
|
101.SCH
|
XBRL Taxonomy Extension Schema Document
|
|
101.CAL
|
XBRL Taxonomy Extension Calculation Linkbase Document
|
|
101.DEF
|
XBRL Taxonomy Extension Definition Linkbase Document
|
|
101.LAB
|
XBRL Taxonomy Extension Label Linkbase Document
|
|
101.PRE
|
XBRL Taxonomy Extension Presentation Linkbase Document
|
|
101.INS
|
XBRL Instance Document
|
|
|
ICL Group Ltd.
|
||
|
|
By:
|
/s/ Aviram Lahav
|
|
|
|
|
Name:
|
Aviram Lahav
|
|
|
|
Title:
|
Chief Financial Officer
|
|
|
ICL Group Ltd.
|
||
|
|
By:
|
/s/ Aya Landman
|
|
|
|
|
Name:
|
Aya Landman
|
|
|
|
Title:
|
VP, Company Secretary & Global Compliance
|
Consolidated Financial Statements
As of December 31, 2021

|
ICL Group Ltd |
Consolidated Financial Statements as of December 31, 2021
Contents
|
Auditors' Report
(
PCAOB
|
|
| 1 | |
| 2 | |
| 3 | |
|
4
|
|
| 7 | |
| 8 |

|
|
Somekh Chaikin
|
|
|
|
KPMG Millennium Tower
|
Telephone 972 3 684 8000
|
|
|
17 Ha'arba'a Street, PO Box 609
|
Fax 972 3 684 8444
|
|
|
Tel Aviv 61006 Israel
|
Internet www.kpmg.co.il
|
|
2021
|
2020
|
||
|
Note
|
$ millions
|
$ millions
|
|
Current assets
|
|||
|
Cash and cash equivalents
|
|
|
|
|
Short-term investments and deposits
|
|
|
|
|
Trade receivables
|
|
|
|
|
Inventories
|
6
|
|
|
|
Inv
estments at fair value through other comprehensive income
|
|
|
|
|
Prepaid expenses and other receivables
|
7
|
|
|
|
Total current assets
|
|
|
|
|
Non-current assets
|
|||
|
Investments at fair value through other comprehensive income
|
|
|
|
|
Deferred tax assets
|
15
|
|
|
|
Property, plant and equipment
|
10
|
|
|
|
Intangible assets
|
11
|
|
|
|
Other non-current assets
|
9,16
|
|
|
|
Total non-current assets
|
|
|
|
|
Total assets
|
|
|
|
|
Current liabilities
|
|||
|
Short-term debt
|
13
|
|
|
|
Trade payables
|
|
|
|
|
Provisions
|
17
|
|
|
|
Other payables
|
14
|
|
|
|
Total current liabilities
|
|
|
|
|
Non-current liabilities
|
|||
|
Long-term debt and debentures
|
13
|
|
|
|
Deferred tax liabilities
|
15
|
|
|
|
Long-term employee liabilities
|
16
|
|
|
|
Long-term provisions and accruals
|
17
|
|
|
|
Other
|
|
|
|
|
Total non-current liabilities
|
|
|
|
|
Total liabilities
|
|
|
|
|
Equity
|
|||
|
Total shareholders’ equity
|
19
|
|
|
|
Non-controlling interests
|
|
|
|
|
Total equity
|
|
|
|
|
Total liabilities and equity
|
|
|
The accompanying notes are an integral part of these consolidated financial statements.
|
2021
|
2020
|
2019
|
||
|
Note
|
$ millions
|
$ millions
|
$ millions
|
|
Sales
|
20
|
|
|
|
|
Cost of sales
|
20
|
|
|
|
|
Gross profit
|
|
|
|
|
|
Selling, transport and marketing expenses
|
20
|
|
|
|
|
General and administrative expenses
|
20
|
|
|
|
|
Research and development expenses
|
20
|
|
|
|
|
Other expenses
|
20
|
|
|
|
|
Other income
|
20
|
(
|
(
|
(
|
|
Operating income
|
|
|
|
|
|
Finance expenses
|
|
|
|
|
|
Finance income
|
(
|
(
|
(
|
|
|
Finance expenses, net
|
20
|
|
|
|
|
Share in earnings of equity-accounted investees
|
|
|
|
|
|
Income before taxes on income
|
|
|
|
|
|
Taxes on income
|
15
|
|
|
|
|
Net income
|
|
|
|
|
|
Net income attributable to the non-controlling interests
|
|
|
|
|
|
Net income attributable to the shareholders of the Company
|
|
|
|
|
|
Earnings per share attributable to the shareholders of the Company:
|
22
|
|||
|
Basic earnings per share (in dollars)
|
|
|
|
|
|
Diluted earnings per share (in dollars)
|
|
|
|
|
|
Weighted-average number of ordinary shares outstanding:
|
22
|
|||
|
Basic (in thousands)
|
|
|
|
|
|
Diluted (in thousands)
|
|
|
|
The accompanying notes are an integral part of these consolidated financial statements.
|
2021
|
2020
|
2019
|
|
|
$ millions
|
$ millions
|
$ millions
|
|
Net income |
|
|
|
|
Components of other comprehensive income that will be reclassified subsequently to net income
|
|||
|
Foreign currency translation differences |
(
|
|
(
|
|
Change in fair value of cash flow hedges transferred to the statement of income
|
(
|
(
|
(
|
|
Effective portion of the change in fair value of cash flow hedges
|
|
|
|
|
Tax relating to items that will be reclassified subsequently to net income
|
|
|
(
|
|
(
|
|
(
|
|
|
Components of other comprehensive income that will not be reclassified to net income
|
|||
|
Net changes of investments at fair value through other comprehensive income
|
|
|
|
|
Gains (losses) from defined benefit plans
|
|
(
|
(
|
|
Tax relating to items that will not be reclassified to net income
|
(
|
(
|
|
|
|
(
|
(
|
|
|
Total comprehensive income
|
|
|
|
|
Comprehensive income attributable to the non-controlling interests
|
|
|
|
|
Comprehensive income attributable to the shareholders of the Company
|
|
|
|
|
Attributable to the shareholders of the Company
|
Non- controlling interests
|
Total equity
|
|||||||
|
Share capital
|
Share premium
|
Cumulative translation adjustment
|
Capital reserves
|
Treasury shares,
at cost |
Retained earnings
|
Total shareholders’ equity
|
|||
|
$ millions
|
|||||||||
|
For the year ended December 31, 2021
|
|||||||||
|
Balance as of January 1, 2021
|
|
|
(
|
|
(
|
|
|
|
|
|
Share-based compensation
|
|
|
|
(
|
|
|
|
|
|
|
Dividends
|
|
|
|
|
|
(
|
(
|
(
|
(
|
|
Comprehensive income
|
|
|
(
|
|
|
|
|
|
|
|
Balance as of December 31, 2021
|
|
|
(
|
|
(
|
|
|
|
|
|
Attributable to the shareholders of the Company
|
Non- controlling interests
|
Total equity
|
|||||||
|
Share capital
|
Share premium
|
Cumulative translation adjustment
|
Capital reserves
|
Treasury shares,
at cost |
Retained earnings
|
Total shareholders’ equity
|
|||
|
$ millions
|
|||||||||
|
For the year ended December 31, 2020
|
|||||||||
|
Balance as of January 1, 2020
|
|
|
(
|
|
(
|
|
|
|
|
|
Share-based compensation
|
|
|
|
|
|
|
|
|
|
|
Dividends
|
|
|
|
|
|
(
|
(
|
(
|
(
|
|
Comprehensive income
|
|
|
|
|
|
(
|
|
|
|
|
Balance as of December 31, 2020
|
|
|
(
|
|
(
|
|
|
|
|
|
Attributable to the shareholders of the Company
|
Non- controlling interests
|
Total equity
|
|||||||
|
Share capital
|
Share premium
|
Cumulative translation adjustment
|
Capital reserves
|
Treasury shares,
at cost |
Retained earnings
|
Total shareholders’ equity
|
|||
|
$ millions
|
|||||||||
|
For the year ended December 31, 2019
|
|||||||||
|
Balance as of January 1, 2019
|
|
|
(
|
(
|
(
|
|
|
|
|
|
Share-based compensation
|
|
|
|
|
|
|
|
|
|
|
Dividends
|
|
|
|
|
|
(
|
(
|
(
|
(
|
|
Comprehensive income
|
|
|
(
|
|
|
|
|
|
|
|
Balance as of December 31, 2019
|
|
|
(
|
|
(
|
|
|
|
|
|
2021
|
2020
|
2019
|
|
|
$ millions
|
$ millions
|
$ millions
|
|
Cash flows from operating activities
|
|||
|
Net income
|
|
|
|
|
Adjustments for:
|
|||
|
Depreciation and amortization
|
|
|
|
|
(Reversal of) Impairment of fixed assets
|
(
|
|
(
|
|
Exchange rate, interest and derivative, net
|
|
|
|
|
Tax expenses
|
|
|
|
|
Change in provisions
|
(
|
|
(
|
|
Other
|
(
|
|
(
|
|
|
|
|
|
|
Change in inventories
|
(
|
|
(
|
|
Change in trade receivables
|
(
|
(
|
|
|
Change in trade payables
|
|
|
(
|
|
Change in other receivables
|
|
|
|
|
Change in other payables
|
|
|
|
|
Net change in operating assets and liabilities
|
(
|
|
|
|
Interest paid, net
|
(
|
(
|
(
|
|
Income taxes paid, net of refund
|
(
|
(
|
(
|
|
Net cash provided by operating activities
|
|
|
|
|
Cash flows from investing activities
|
|||
|
Proceeds (payments) from deposits, net
|
|
|
(
|
|
Business combinations
|
(
|
(
|
|
|
Purchases of property, plant and equipment and intangible assets
|
(
|
(
|
(
|
|
Proceeds from divestiture of businesses net of transaction expenses
|
|
|
|
|
Other
|
|
|
|
|
Net cash used in investing activities
|
(
|
(
|
(
|
|
Cash flows from financing activities
|
|||
|
Dividends paid to the Company's shareholders
|
(
|
(
|
(
|
|
Receipt of long-term debt
|
|
|
|
|
Repayments of long-term debt
|
(
|
(
|
(
|
|
Repayments of short-term debt, net
|
(
|
(
|
(
|
|
Receipts (payments) from transactions in derivatives
|
(
|
|
|
|
Other
|
(
|
(
|
(
|
|
Net cash used in financing activities
|
(
|
(
|
(
|
|
Net change in cash and cash equivalents
|
|
|
(
|
|
Cash and cash equivalents as of the beginning of the year
|
|
|
|
|
Net effect of currency translation on cash and cash equivalents
|
|
|
(
|
|
Cash and cash equivalents as of the end of the year
|
|
|
|
| A. |
The reporting entity
|
ICL Group Ltd. (hereinafter – the Company), is a company domiciled and incorporated in Israel. The Company's shares are traded on both the Tel-Aviv Stock Exchange (TASE) and the New York Stock Exchange (NYSE) under the ticker: ICL. The address of the Company’s registered headquarters is 23 Aranha St., Tel‑Aviv, Israel. The Company is a subsidiary of Israel Corporation Ltd., a public company traded on the TASE under the ticker: ILCO:TA. The Company together with its subsidiaries, associated companies and joint ventures (hereinafter – the Group or ICL), is a leading specialty minerals group that operates a unique, integrated business model. The Company competitively extracts certain minerals as raw materials and utilizes processing and product formulation technologies to add value to customers in two main end-markets: agriculture and Industrial (including food additives). ICL’s products are used mainly in the areas of agriculture, electronics, food, fuel and gas exploration, water purification and desalination, detergents, cosmetics, pharmaceuticals, and automotive.
| B. |
Impact of the COVID-19 spread |
The COVID-19 pandemic continues to create business and economic uncertainty and volatility in the global markets. Many countries around the world are experiencing further outbreaks of the pandemic, following which governments are once again imposing various restrictions. At the same time, there is a recovery trend in the volume of economic activity around the world that leads on one hand, to significant demand for certain products and services and on the other hand, disruptions to worldwide supply chain routes and some raw materials. The Company continues to take measures to ensure the health and safety of its employees, suppliers, other business partners and the communities in which it operates in order to ensure, among others, the operation level, the proper functioning of its facilities around the world and to minimize the pandemic's potential impact on its business. Manufacturing continues at the Company's sites around the world without interruptions. However, there is still a difficulty in assessing the future impacts of the pandemic on the Company's operations, inter alia, in light of the uncertainty of its duration, the extent of its intensity and effects on global supply chains and global markets, and additional countermeasures that may be taken by governments and central banks.
| C. |
Definitions
|
| 1. |
Subsidiary – a company over which the Company has control and the financial statements of which are fully consolidated with the Company's statements as part of the consolidated financial statements.
|
| 2. |
Investee company – Subsidiaries, including a partnership or joint venture, which is accounted for using the equity method.
|
| 3. |
Related party – As in IAS 24 (2009), “Related Party Disclosures”.
|
| A. |
Statement of compliance with International Financial Reporting Standards
|
| B. |
Functional and presentation currency
|
| C. |
Basis of measurement
|
| D. |
Operating cycle
|
| E. |
Classifications
|
| F. |
Use of estimates and judgment
|
| F. |
Use of estimates and judgment (cont'd)
|
|
Estimate
|
Principal assumptions
|
Possible effects
|
Reference
|
|
Concessions, permits and business licenses
|
Forecast of obtaining renewed concessions, permits and business licenses which constitute the basis for the Company's continued operations and the Company's expectations regarding the holding of the operating assets by it and / or by a subsidiary until the end of their useful lives
|
Impact on the value of the operation, depreciation periods and residual values of related assets.
|
See Note 18 - Concessions.
|
|
Recoverable amount of a cash generating unit, among other things, containing goodwill
|
Expected cash-flow forecasts including estimates of mineral reserves, discount rate, market risk and the forecasted growth rate.
|
Change in impairment valuation.
|
See Note 12 - impairment testing.
|
|
Uncertain tax positions
|
The extent of the certainty that ICL’s tax positions will be accepted and the risk of it incurring any additional tax and interest expenses. This is based on an analysis of several matters, including interpretations of tax laws and the Company’s past experience.
|
Recognition of additional income tax expenses.
|
See Note 15 - taxes on income.
|
|
Probability assessment of contingent and environmental liabilities including cost of waste removal/ restoration
|
Whether it is more likely than not that an outflow of economic resources will be required in respect of potential liabilities under the environmental protection laws and legal claims pending against ICL and the estimation of their amounts. The waste removal/ restoration obligations depend on the reliability of the estimates of future removal costs and interpretation of regulations.
|
A change in the Company's estimated provisions for a claim and/or environmental liability, including waste removal and restoration.
|
See Note 18 - contingent liabilities.
|
| A. |
Basis for Consolidation
|
| 1. |
Business combinations
|
| 2. |
Subsidiaries
|
| 3. |
Non-controlling interests
|
| A. |
Basis for Consolidation (cont'd)
|
| 4. |
Loss of control
|
| 5. |
Transactions eliminated in consolidation
|
| 6. |
Investment in associated companies and joint ventures
|
| B. |
Foreign Currency
|
| 1. |
Transactions in foreign currency
|
Non‑monetary items denominated in foreign currency measured at historical cost are translated using the exchange rate at the date of the transaction.
| 2. |
Foreign operations
|
| B. |
Foreign Currency (cont'd)
|
| 3. |
Foreign operations (cont'd)
|
| C. |
Financial Instruments
|
| 1. |
Non-derivative financial assets (IFRS9)
|
| C. |
Financial Instruments (cont'd)
|
| 1. |
Non-derivative financial assets (IFRS9) (cont'd)
|
| 2. |
Non-derivative financial liabilities
|
| C. |
Financial Instruments (cont'd)
|
| 2. |
Non-derivative financial liabilities (cont'd)
|
Offset of financial instruments:
| 3. |
Derivative financial instruments
|
| 4. |
CPI-linked assets and liabilities not measured at fair value
|
The value of index-linked financial assets and liabilities, which are not measured at fair value, is re‑measured every period in accordance with the actual increase/ decrease in the CPI.
| 5. |
Share capital
|
| D. |
Property, plant and equipment
|
| 1. |
Recognition and measurement
|
| 2. |
Subsequent Costs (after initial recognition)
|
| 3. |
Depreciation
|
|
In Years
|
|
|
Buildings
|
|
|
Technical equipment and machinery (1)
|
|
|
Dikes and evaporating ponds (2)
|
|
|
Other
|
|
| D. |
Property, plant and equipment (cont'd)
|
| 3. |
Depreciation (cont'd)
|
| E. |
Intangible Assets
|
| 1. |
Goodwill
|
| 2. |
Research and development
|
| 3. |
Other intangible assets
|
| 4. |
Subsequent costs
|
| 5. |
Amortization
|
| E. |
Intangible Assets (cont'd)
|
| 5. |
Amortization (cont'd)
|
|
In Years
|
|
|
Concessions and mining rights – over the remaining duration of the rights granted |
|
|
Trademarks
|
|
|
Technology / patents
|
|
|
Customer relationships
|
|
|
Computer applications
|
|
| F. |
Inventories
|
| F. |
Inventories (cont'd)
|
| G. |
Capitalization of Borrowing Costs
|
| H. |
Impairment
|
| 1. |
Non-derivative financial assets
|
| 2. |
Non-financial assets
|
| H. |
Impairment (cont'd)
|
| 2. |
Non-financial assets (cont'd)
|
| I. |
Employee Benefits
|
| 1. |
Defined contribution plans
|
| I. |
Employee Benefits (cont'd)
|
| 1. |
Defined contribution plans (cont'd)
|
| 2. |
Defined benefit plans
|
| 3. |
Other long-term employee benefits
|
| I. |
Employee Benefits (cont'd)
|
| 4. |
Early Retirement Pay
|
| 5. |
Short‑term benefits
|
| 6. |
Share-based compensation
|
| J. |
Provisions
|
| J. |
Provisions
(cont'd)
|
| (1) |
Warranty
|
| (2) |
Provision for environmental costs
|
| (3) |
Restructuring
|
| (4) |
Site restoration
|
| (5) |
Legal claims
|
| K. |
Revenue Recognition
|
| K. |
Revenue Recognition (cont'd)
|
| L. |
Government grants
|
| M. |
Leases
|
| M. |
Leases
(cont'd)
|
| N. |
Financing Income and Expenses
|
| O. |
Taxes on Income
|
| O. |
Taxes on Income
(cont'd)
|
| P. |
Earnings per share
|
| Q. |
Transactions with controlling shareholder
|
| R. |
Non-current assets and disposal groups held for sale
|
| A. |
Investments in equity securities
|
| B. |
Derivatives
|
| C. |
Liabilities in respect of debentures
|
| D. |
Property, plant and equipment of the subsidiaries Dead Sea Works, Dead Sea Bromine and Dead Sea Magnesium in Israel |
Innovative Ag Solutions – The Innovative Ag Solutions segment aims to achieve global leadership in specialty fertilization markets by enhancing its global positions in its core markets of specialty agriculture, ornamental horticulture, turf and landscaping, targeting high-growth markets such as Brazil, India and China, by leveraging its unique R&D capabilities, vast agronomic experience, global footprint, backward integration to potash and phosphate and chemistry know-how, while integrating and generating synergies from acquired businesses.
In January 2021, the Company completed the acquisition of Fertiláqua, one of Brazil’s leading specialty plant nutrition companies, and in July 2021, the acquisition of the South American Plant Nutrition business of Compass Minerals América do Sul S.A. (hereinafter - ADS).
ICL is continuously working to expand its broad portfolio of specialty plant nutrition, plant stimulation and plant health solutions, which consists of enhanced efficiency and controlled release fertilizers (CRF), water soluble fertilizers (WSF), liquid fertilizers and straights (MKP/MAP/PeKacid), soil and foliar micronutrients, secondary nutrients, biostimulants, soil conditioners, seed treatment products, and adjuvants.
The Innovative Ag Solutions segment develops, manufactures, markets and sells its products globally, mainly in Brazil, Europe, Asia, North America and Israel. It produces water soluble specialty fertilizers in Belgium, Israel and Spain, liquid fertilizers in Israel, Spain, China and Brazil, straights soluble fertilizers in China and Israel, controlled‑release fertilizers in the Netherlands, Brazil and the United States, as well as secondary nutrients, biostimulants, soil conditioners, seed treatment product, and adjuvants in Brazil.
| A. |
General (cont'd)
|
Note 5 - Operating Segments (cont'd)
|
Industrial Products
|
Potash
|
Phosphate Solutions
|
Innovative Ag Solutions
|
Other
Activities
|
Reconciliations
|
Consolidated
|
|
|
$ millions
|
|||||||
|
For the year ended December 31, 2021
|
|||||||
|
Sales to external parties
|
|
|
|
|
|
|
|
|
Inter-segment sales
|
|
|
|
|
|
(
|
|
|
Total sales
|
|
|
|
|
|
(
|
|
|
Segment operating income (loss)
|
|
|
|
|
(
|
(
|
|
|
Other income not allocated to the segments
|
|
||||||
|
Operating income
|
|
||||||
|
Financing expenses, net
|
(
|
||||||
|
Share in earnings of equity-accounted investees
|
|
||||||
|
Income before income taxes
|
|
||||||
|
Depreciation amortization and impairment
|
|
|
|
|
|
(
|
|
|
Capital expenditures
|
|
|
|
|
|
|
|
|
Capital expenditures
as part of business combination
|
|
|
|
|
|
|
|
|
Industrial Products
|
Potash
|
Phosphate Solutions
|
Innovative Ag Solutions
|
Other
Activities
|
Reconciliations
|
Consolidated
|
|
|
$ millions
|
|||||||
|
For the year ended December 31, 2020
|
|||||||
|
Sales to external parties
|
|
|
|
|
|
|
|
|
Inter-segment sales
|
|
|
|
|
|
(
|
|
|
Total sales
|
|
|
|
|
|
(
|
|
|
Segment
operating income (loss)
|
|
|
|
|
(
|
(
|
|
|
Other expenses not allocated to the segments
|
(
|
||||||
|
Operating income
|
|
||||||
|
Financing expenses, net
|
(
|
||||||
|
Share in earnings of equity-accounted investees
|
|
||||||
|
Income before income taxes
|
|
||||||
|
Depreciation amortization and impairment
|
|
|
|
|
|
|
|
|
Capital expenditures
|
|
|
|
|
|
|
|
|
Capital expenditures as part of business combination
|
|
|
|
|
|
|
|
|
Industrial Products
|
Potash
|
Phosphate Solutions
|
Innovative Ag Solutions
|
Other
Activities
|
Reconciliations
|
Consolidated
|
|
|
$ millions
|
|||||||
|
For the year ended December 31, 2019
|
|||||||
|
Sales to external parties
|
|
|
|
|
|
|
|
|
Inter-segment sales
|
|
|
|
|
|
(
|
|
|
Total sales
|
|
|
|
|
|
(
|
|
|
Segment operating income
|
|
|
|
|
|
(
|
|
|
Other expenses not allocated to the segments
|
(
|
||||||
|
Operating income
|
|
||||||
|
Financing expenses, net
|
(
|
||||||
|
Share in earnings of equity-accounted investees
|
|
||||||
|
Income before income taxes
|
|
||||||
|
Depreciation amortization and impairment
|
|
|
|
|
|
(
|
|
|
Implementation of IFRS 16 |
|
|
|
|
|
|
|
|
Capital expenditures
|
|
|
|
|
|
|
|
|
2021
|
2020
|
2019
|
||||
|
$
millions
|
% of
sales
|
$
millions
|
% of
sales
|
$
millions
|
% of
sales
|
|
|
Brazil
|
|
|
|
|
|
|
|
USA |
|
|
|
|
|
|
|
China
|
|
|
|
|
|
|
|
United Kingdom
|
|
|
|
|
|
|
|
Germany
|
|
|
|
|
|
|
|
Israel
|
|
|
|
|
|
|
|
Spain
|
|
|
|
|
|
|
|
France
|
|
|
|
|
|
|
|
India
|
|
|
|
|
|
|
|
Italy
|
|
|
|
|
|
|
|
All other
|
|
|
|
|
|
|
|
Total
|
|
|
|
|
|
|
| C. |
Information based on geographical location (cont'd)
|
|
Industrial Products
|
Potash
|
Phosphate Solutions
|
Innovative Ag Solutions
|
Other
Activities
|
Reconciliations
|
Consolidated
|
|
|
$ millions
|
|||||||
|
For the year ended December 31, 2021
|
|||||||
|
Europe
|
|
|
|
|
|
(
|
|
|
Asia
|
|
|
|
|
|
(
|
|
|
South America
|
|
|
|
|
|
(
|
|
|
North America |
|
|
|
|
|
(
|
|
|
Rest of the world
|
|
|
|
|
|
(
|
|
|
Total
|
|
|
|
|
|
(
|
|
|
Industrial Products
|
Potash
|
Phosphate Solutions
|
Innovative Ag Solutions
|
Other
Activities
|
Reconciliations
|
Consolidated
|
|
|
$ millions
|
|||||||
|
For the year ended December 31, 2020
|
|||||||
|
Europe
|
|
|
|
|
|
(
|
|
|
Asia
|
|
|
|
|
|
(
|
|
|
South America
|
|
|
|
|
|
(
|
|
|
North America
|
|
|
|
|
|
(
|
|
|
Rest of the world
|
|
|
|
|
|
(
|
|
|
Total
|
|
|
|
|
|
(
|
|
| C. |
Information based on geographical location (cont'd)
|
|
Industrial Products
|
Potash
|
Phosphate Solutions
|
Innovative Ag Solutions
|
Other
Activities
|
Reconciliations
|
Consolidated
|
|
|
$ millions
|
|||||||
|
For the year ended December 31, 2019
|
|||||||
|
Europe
|
|
|
|
|
|
(
|
|
|
Asia
|
|
|
|
|
|
(
|
|
|
South
America
|
|
|
|
|
|
(
|
|
|
North
America
|
|
|
|
|
|
(
|
|
|
Rest of the world
|
|
|
|
|
|
(
|
|
|
Total
|
|
|
|
|
|
(
|
|
| C. |
Information based on geographical location (cont'd)
|
|
For the year ended December 31
|
|||
|
2021
|
2020
|
2019
|
|
|
$ millions
|
$ millions
|
$ millions
|
|
|
Israel
|
|
|
|
|
Europe
|
|
|
|
|
South
America
|
|
|
|
|
North America
|
|
|
|
|
Asia
|
|
|
|
|
Others
|
|
|
|
|
|
|
|
|
|
Intercompany sales
|
(
|
(
|
(
|
|
Total
|
|
|
|
|
For the year ended December 31
|
|||
|
2021
|
2020
|
2019
|
|
|
$ millions
|
$ millions
|
$ millions
|
|
|
Israel*
|
|
|
|
|
Asia
|
|
|
|
|
South America**
|
|
|
|
|
North America
|
|
|
|
|
Europe |
|
(
|
|
|
Others
|
|
|
|
|
Intercompany eliminations
|
(
|
(
|
|
|
Total
|
|
|
|
| * |
Israel operating income for 2020 includes a loss of $
|
|
As of December 31
|
||
|
2021
|
2020
|
|
|
$ millions
|
$ millions
|
|
|
Israel
|
|
|
|
Europe
|
|
|
|
Asia
|
|
|
| South America |
|
|
|
North America
|
|
|
|
Other
|
|
|
|
Total
|
|
|
| (*) |
Mainly consist of property, plant and equipment, intangible assets and non-current inventories.
|
|
As of December 31
|
||
|
2021
|
2020
|
|
|
$ millions
|
$ millions
|
|
|
Finished products
|
|
|
|
Work in progress
|
|
|
|
Raw materials
|
|
|
|
Spare parts
|
|
|
|
Total inventories
|
|
|
|
Of which:
|
||
|
Non-current inventories - mainly raw materials (presented in non-current assets) |
|
|
|
Current inventories
|
|
|
|
As of December 31
|
||
|
2021
|
2020
|
|
|
$ millions
|
$ millions
|
|
|
Government institutions
|
|
|
|
Current tax assets
|
|
|
|
Prepaid expenses
|
|
|
|
Derivative instruments
|
|
|
|
Financial asset at amortized cost
|
|
|
|
Other
|
|
|
|
|
|
| A. |
Non-controlling interests in subsidiaries
|
|
As of December 31
|
||
|
2021
|
2020
|
|
|
$ millions
|
$ millions
|
|
|
Current assets
|
|
|
|
Non-current assets
|
|
|
|
Current liabilities
|
(
|
(
|
|
Non-current liabilities
|
(
|
(
|
|
Equity
|
(
|
(
|
|
For the year ended December 31
|
|||
|
2021
|
2020
|
2019
|
|
|
$ millions
|
$ millions
|
$ millions
|
|
|
Sales
|
|
|
|
|
Operating Income
|
|
|
|
|
Depreciation and amortization
|
|
|
|
|
Operating income before depreciation and amortization
|
|
|
|
|
Net Income
|
|
|
|
|
Total Comprehensive income
|
|
|
|
| B. |
Business Acquisition and Divestiture
|
| (1) |
As part of the Company's strategy to expand the specialty fertilizers business and focus on growing markets, such as achieving leadership positions in Brazil, a high growth specialty plant nutrition market, in January 2021, the Company completed the acquisition of Agro Fertiláqua Participações S.A., one of Brazil's leading specialty plant nutrition companies, for a consideration of $
|
In July 2021, the Company completed the acquisition of the South American plant nutrition business of ADS, for a total consideration of about $
Note 8 - Investments in Subsidiaries (cont'd)
| B. |
Business Acquisition and Divestiture (cont'd)
|
|
Identifiable assets acquired and liabilities assumed (*): |
|
$ millions |
|
|
Cash and cash equivalents |
|
|
Inventories |
|
|
Trade and Other receivables |
|
|
Property, plant and equipment |
|
|
Intangible assets |
|
|
Other non-current assets |
|
|
Trade and Other payables |
(
|
|
Loans and Credit |
(
|
|
Provisions |
(
|
|
Net identifiable assets |
|
| (2) |
In July 2021, the Company completed the sale of Jiaxing ICL Chemical Co. Ltd (ICL Zhapu), which was part of the Industrial Products segment to China Sanjiang Fine Chemicals Company Limited, for a consideration of about $
|
|
| (3) |
As part of the Company's strategy to divest low synergy businesses and non-core business activities, in January 2022, the Company entered into a definitive agreement to sell its
|
|
As of December 31
|
||
|
2021
|
2020
|
|
|
$ millions
|
$ millions
|
|
|
Non-current inventories
|
|
|
|
Surplus in employees' defined benefit plans (1)
|
|
|
|
Derivative designated as a cash flow hedge
|
|
|
|
Investments in equity-accounted investees
|
|
|
|
Other
|
|
|
|
|
|
| (1) |
|
A. Composition
|
Land and buildings
|
Technical equipment and machinery
|
Dikes and evaporating
ponds
|
Plants under construction
(1)
|
Other
|
Right of use
asset
|
Total
|
|
|
$ millions
|
|||||||
|
Cost
|
|||||||
|
Balance as of January 1, 2021
|
|
|
|
|
|
|
|
|
Additions in respect of business combinations
|
|
|
|
|
|
|
|
|
Additions
|
|
|
|
(
|
|
|
|
|
Disposals
|
(
|
(
|
(
|
|
(
|
(
|
(
|
|
Exit from consolidation
|
(
|
(
|
|
|
(
|
(
|
(
|
|
Translation differences
|
(
|
(
|
(
|
(
|
(
|
(
|
(
|
|
Balance as of December 31, 2021
|
|
|
|
|
|
|
|
|
Accumulated depreciation
|
|||||||
|
Balance as of January 1, 2021
|
|
|
|
|
|
|
|
|
Depreciation
|
|
|
|
|
|
|
|
|
Reversal of impairment
|
|
(
|
|
|
|
|
(
|
|
Disposals
|
(
|
(
|
|
|
(
|
(
|
(
|
|
Exit from consolidation
|
(
|
(
|
|
|
|
|
(
|
|
Translation differences
|
(
|
(
|
(
|
|
(
|
(
|
(
|
|
Balance as of December 31, 2021
|
|
|
|
|
|
|
|
|
Depreciated balance as of December 31, 2021
|
|
|
|
|
|
|
|
A. Composition (cont'd)
|
Land and buildings
|
Technical equipment and machinery
|
Dikes and evaporating
ponds
|
Plants under construction
(1)
|
Other
|
Right of use asset
|
Total
|
|
|
$ millions
|
|||||||
|
Cost
|
|||||||
|
Balance as of January 1, 2020
|
|
|
|
|
|
|
|
|
Additions
|
|
|
|
(
|
|
|
|
|
Disposals
|
(
|
(
|
|
|
(
|
(
|
(
|
|
Exit from consolidation |
(
|
(
|
|
|
(
|
(
|
(
|
|
Translation differences
|
|
|
|
|
|
|
|
|
Balance as of December 31, 2020
|
|
|
|
|
|
|
|
|
Accumulated depreciation
|
|||||||
|
Balance as of January 1, 2020
|
|
|
|
|
|
|
|
|
Depreciation
|
|
|
|
|
|
|
|
|
Disposals
|
(
|
(
|
|
|
(
|
(
|
(
|
|
Impairment
|
|
|
|
|
|
|
|
|
Exit from consolidation |
(
|
(
|
|
|
(
|
|
(
|
|
Translation differences
|
|
|
|
|
|
|
|
|
Balance as of December 31, 2020
|
|
|
|
|
|
|
|
|
Depreciated balance as of December 31, 2020
|
|
|
|
|
|
|
|
B. Additional information
(1)
In accordance with the Company’s policy regarding the periodic examination of the estimated useful life of Property, Plant and Equipment, in 2021, the Company conducted an examination of the estimated remaining useful life of Property, Plant and Equipment at its facilities in Israel, which was based on the Company’s experience, level of maintenance and operation of the facilities over the years. According to the examination, it was found that following the increase in maintenance activity and the implementation of operational excellence processes, the life expectancy of certain Property, Plant and Equipment is higher than their previously estimated remaining useful life. Based on the assessment, the estimated useful life of the said assets was extended by
(2) In December 2021, the Company entered into an agreement with a third party for the sale of an asset located in the industrial area of Ashdod, Israel, for a consideration of about $
| A. |
Composition
|
|
Goodwill
|
Concessions and mining rights
|
Trademarks
|
Technology /
patents
|
Customer relationships
|
Computer
application
|
Others
|
Total
|
|
|
$ millions
|
||||||||
|
Cost
|
||||||||
|
Balance as of January 1, 2021
|
|
|
|
|
|
|
|
|
|
Additions in respect of business combinations
|
|
|
|
|
|
|
|
|
| Additions |
|
|
|
|
|
|
|
|
|
Translation differences
|
(
|
(
|
(
|
(
|
(
|
(
|
(
|
(
|
|
Balance as of December 31, 2021
|
|
|
|
|
|
|
|
|
|
Amortization
|
||||||||
|
Balance as of January 1, 2021
|
|
|
|
|
|
|
|
|
|
Amortization for the year
|
|
|
|
|
|
|
|
|
|
Translation differences
|
(
|
|
(
|
(
|
(
|
(
|
(
|
(
|
|
Balance as of December 31, 2021
|
|
|
|
|
|
|
|
|
|
Amortized Balance as of December 31 ,2021
|
|
|
|
|
|
|
|
|
| A. |
Composition (cont'd)
|
|
Goodwill
|
Concessions and mining rights
|
Trademarks
|
Technology /
patents
|
Customer
relationships |
Computer
application
|
Others
|
Total
|
|
|
$ millions
|
||||||||
|
Cost
|
|
|
|
|
|
|
|
|
|
Balance as of January 1, 2020
|
|
|
|
|
|
|
|
|
|
Additions in respect of business combinations |
|
|
|
|
|
|
|
|
|
Additions |
|
|
|
|
|
|
|
|
|
Exit from consolidation |
|
|
|
(
|
(
|
|
|
(
|
|
Translation differences
|
|
|
|
|
|
|
|
|
|
Balance as of December 31, 2020
|
|
|
|
|
|
|
|
|
|
Amortization and impairment losses
|
|
|
|
|
|
|
|
|
|
Balance as of January 1, 2020
|
|
|
|
|
|
|
|
|
|
Amortization
|
|
|
|
|
|
|
|
|
|
Impairment |
|
|
|
|
|
|
|
|
|
Exit from consolidation |
|
|
|
(
|
(
|
|
|
(
|
|
Translation differences
|
|
|
|
|
|
|
|
|
|
Balance as of December 31, 2020
|
|
|
|
|
|
|
|
|
|
|
|
|
|
|
|
|
|
|
|
Amortized Balance as of December 31 ,2020
|
|
|
|
|
|
|
|
|
| B . |
Total book value of intangible assets having defined useful lives and those having indefinite useful lives are as follows:
|
|
As of December 31
|
||
|
2021
|
2020
|
|
|
$ millions
|
$ millions
|
|
|
Intangible assets having a defined useful life
|
|
|
|
Intangible assets having an indefinite useful life
|
|
|
|
|
|
| A. |
Impairment testing for intangible assets with an indefinite useful life
|
|
As of December 31
|
||
|
2021
|
2020
|
|
|
$ millions
|
$ millions
|
|
|
Goodwill
|
||
|
Phosphate Solutions
|
|
|
|
Industrial Products
|
|
|
|
Innovative Ag. Solutions
*
|
|
|
|
Potash
|
|
|
|
Other
|
|
|
|
|
|
|
|
Trademarks
|
|
|
|
|
|
*
| A. |
Impairment testing for intangible assets with an indefinite useful life (cont'd)
|
| A. |
Composition
|
|
As of December 31
|
||
|
2021
|
2020
|
|
|
$ millions
|
$ millions
|
|
|
Short-term debt
|
||
|
From financial institutions
|
|
|
|
Current maturities of:
|
||
|
Debentures
|
|
|
|
Long-term loans from financial institutions
|
|
|
|
Lease Liability
|
|
|
|
Long-term loans from others
|
|
|
|
|
|
|
|
Total Short-Term debt
|
|
|
|
Long- term debt and debentures
|
||
|
Long term lease liability
|
|
|
|
Loans from financial institutions
|
|
|
|
Other loans
|
|
|
|
|
|
|
|
Marketable debentures
|
|
|
|
Non-marketable debentures
|
|
|
|
|
|
|
|
|
|
|
|
Less – current maturities of:
|
||
|
Debentures
|
|
|
|
Long-term loans from financial institutions
|
|
|
|
Lease liability
|
|
|
|
Long-term loans from others
|
|
|
|
|
|
|
|
Total Long- term debt and debentures
|
|
|
| B. |
Yearly movement in Credit from Banks and Others (*)
|
|
As of December 31
|
||
|
2021
|
2020
|
|
|
$ millions
|
$ millions
|
|
|
Balance as of January 1
|
|
|
|
Changes from financing cash flows
|
||
|
Additions in respect of business combination |
|
|
|
Receipt of long-term debts
|
|
|
|
Repayment of long-term debt
|
(
|
(
|
|
Repayment of short-term credit
|
(
|
(
|
|
Interest paid
|
(
|
(
|
|
Receipt (payments) from transaction in derivatives
|
(
|
|
|
Total net financing cash flows
|
|
(
|
|
Initial recognition of lease liability
|
|
|
|
Interest expenses
|
|
|
|
Effect of changes in foreign exchange rates
|
(
|
|
|
Change in fair value of derivatives
|
(
|
(
|
|
Other changes
|
|
(
|
|
Balance as of December 31
|
|
|
| C. |
Sale of receivables under securitization transaction
|
| D. |
Information on material loans and debentures outstanding as of December 31, 2021:
|
|
Instrument type
|
Loan date
|
Original principal
(millions)
|
Currency
|
Carrying amount
($ millions)
|
Interest rate
|
Principal repayment date
|
Additional information
|
|
Debentures - Series F
|
May 2018, December 2020
|
|
U.S. Dollar
|
|
|
|
(4), (5)
|
|
Debentures - Series E
|
April 2016
|
|
Israeli Shekel
|
|
|
2021- 2024
(annual installment)
|
Partially repaid (1), (4)
|
|
Debentures (private offering) – 3 series
|
January 2014
|
|
U.S. Dollar
|
|
5.16%
5.31%
|
January 2024
January 2026
|
(1) |
|
Debentures - Series G
|
January/May 2020
|
|
Israeli Shekel
|
|
|
2022- 2034
(annual installment)
|
(4) |
|
Debentures - Series D
|
December 2014
|
|
U.S. Dollar
|
|
|
|
(4), (5)
|
| SLL |
September 2021
|
|
Euro
|
|
|
|
(2) |
|
Loan - European Bank
|
September 2021
|
|
Euro
|
|
|
|
(3) |
|
Loan-Israeli institutions
|
November 2013
|
|
Israeli Shekel
|
|
|
2015-2024
(annual installment)
|
Partially repaid
|
|
Loan - Asian Bank
|
May 2020, May 2021
|
|
Chinese Yuan
|
|
|
March 2021-March 2024 |
Partially repaid
|
|
September 2020, March 2021
|
|
|
|
||||
|
Loan -
Brazilian Bank
|
December 2014-January 2021
|
|
Brazilian Real
|
|
|
|
Partially repaid
|
| D. |
Information on material loans and debentures outstanding as of December 31, 2021: (cont'd)
|
| (1) |
In January 2021, the Company repaid $
|
|
| (2) |
In September 2021, the Company entered into a new sustainability linked loan (SLL) agreement in the amount of €
The loan is an innovative step forward in the Company’s ongoing sustainability efforts and includes three sustainability performance targets: (1) an annual 4% to 5% reduction in direct and indirect Scope 1 and Scope 2 CO
2
e emissions resulting from ICL global operations. (2) Through 2025, the Company is committed to adding a significant number of Tfs (Together for Sustainability) qualified vendors each year who meet criteria of management, environment, health and safety, labor and human rights, ethics, and governance and (3) for women to hold at least
|
|
| (3) |
In September 2021, ICL Iberia signed a new loan agreement in the amount of €
|
|
| (4) |
On June 23, 2021, the credit rating agency S&P reaffirmed the Company’s international credit rating and senior unsecured rating 'BBB-’. In addition, the credit rating agency S&P Ma’alot reaffirmed the Company’s credit rating 'ilAA’ with a stable rating outlook. As of December 31, 2021, the Company is in compliance with all its financial covenants set forth in its financing agreements. For more details see note 13F. |
|
| (5) |
On June 21, 2021, the credit rating agency Fitch Ratings reaffirmed the Company’s long-term issuer default rating and senior unsecured rating at 'BBB-’. The outlook on the long-term Issuer default rating is stable. |
| E. |
Credit facilities:
|
|
Issuer
|
Group of international banks (1)
|
European bank
|
Brazilian bank (2)
|
| Date of the credit facility |
|
|
|
|
Date of credit facility termination
|
|
|
|
|
The amount of the credit facility
|
|
|
|
|
Credit facility has been utilized
|
|
|
|
|
Interest rate
|
Up to 33% use of the credit: Libor/Euribor + 0.70%.
From 33% to 66% use of the credit: Libor/Euribor + 0.80%
66% or more use of the credit: Libor/Euribor + 0.95%
|
30 million dollar-Libor + 0.80%
|
|
|
Loan currency type
|
|
|
|
|
Pledges and restrictions
|
|
|
|
|
Non-utilization fee
|
|
|
|
| (1) |
|
| (2) |
|
| F. |
Restrictions on the Group relating to the receipt of credit
|
|
Financial Covenants (1)
|
Financial Ratio Required
under the Agreement
|
Financial Ratio
|
|
December 31, 2021
|
|
Total shareholder’s equity
|
Equity greater than $2,000 million
|
$
|
|
Ratio of EBITDA to the net interest expenses
|
Equal to or greater than 3.5
|
|
|
Ratio of the net financial debt to EBITDA
|
Less than 3.5
|
|
|
Ratio of certain subsidiaries loans to the total assets of the consolidated company
|
Less than 10%
|
|
| (1) |
The examination of compliance with the financial covenants is based on the Company’s consolidated financial statements. As of December 31, 2021, the Company complies with all of its financial covenants. |
| G. |
Pledges and Restrictions Placed in Respect of Liabilities
|
| (1) |
The Company has undertaken various obligations in respect of loans and credit lines from banks, including a negative pledge, whereby the Company committed, among other things, in favor of the lenders, to limit guarantees and indemnities to third parties (other than guarantees in respect of subsidiaries) up to an agreed amount of $
|
| (2) |
As of December 31, 2021, the total guarantees provided by the Company were in the amount of $
|
|
As of December 31
|
||
|
2021
|
2020
|
|
|
$ millions
|
$ millions
|
|
|
Employees
|
|
|
|
Current tax liabilities
|
|
|
|
Governmental (mainly in respect of royalties)
|
|
|
|
Accrued expenses
|
|
|
|
Income received in advance
|
|
|
|
Derivative designated as an economic hedge
|
|
|
|
Others
|
|
|
|
|
|
| A. |
Taxation of companies in Israel
|
| 1. |
Income tax rate
|
| 2. |
Tax benefits under the Israeli Law for the Encouragement of Capital Investments, 1959 (hereinafter – the Encouragement Law)
|
Under the “Ireland” track, the
C
ompany paid a re
duced tax rate of
The part of taxable income entitled to benefits at reduced tax rates is calculated based on the ratio of the “Beneficiary Enterprise” turnover to a company’s total turnover. The turnover attributed to the “Beneficiary Enterprise” is generally calculated according to the increase in the turnover compared to a “base” turnover, which is the average turnover in the three years prior to the election year of the “Beneficiary Enterprise”.
A company having a “Beneficiary Enterprise” that distributes a dividend out of exempt income, will be subject to corporate tax in the year in which the dividend was distributed on the amount distributed (including corporate tax applicable amount due to the distribution) at the tax rate applicable under the Encouragement Law in the year in which the income was generated, had it not been exempt from tax.
| A. |
Taxation of companies in Israel (cont'd)
|
| 2. |
Tax benefits under the Israeli Law for the Encouragement of Capital Investments, 1959 (cont'd)
|
On November 15, 2021, the Israeli Economic Efficiency Law for the years 2021 and 2022 was published, which consists of numerous legislative amendments and arrangements, including an amendment to Section 74 of the Encouragement Law, which deals with the identification of sources of dividend distributions as of August 15, 2021 (hereinafter - the amendment).
The amendment stipulates that in any dividend distribution from companies holding accumulated profits that were exempt from tax until their distribution as a dividend ("trapped earnings"), a certain part of the distribution will be considered a distribution of those trapped earnings, which will be fully taxed upon release.
In addition, a temporary provision to the Encouragement Law was published, which offers a reduced tax payment arrangement to companies that have trapped earnings. The temporary provision, which is valid until November 14, 2022, stipulates that companies that have chosen to apply it, will be entitled to a tax rebate on corporate income tax, for the released trapped earnings. The release of trapped earnings allows their distribution at a beneficiary corporate tax rate according to the ratio of the distributed profits .
The beneficiary corporate tax will
be determined according to the ratio of the trapped earnings that the company seeks to release from all its trapped earnings. It will range between
Considering the above-mentioned amendment, the Company assessed its deferred tax liabilities with regards to the possibility to release trapped earnings in its future dividend distributions. In December 2021, due to the Company's settlement agreement with the Israeli Tax Authorities, regarding tax assessments for the years 2015-2019, and as a result of the Company's decision to apply the said temporary provision, the Company recognized a tax provision for the release of trapped earnings in the total amount of $
| A. |
Taxation of companies in Israel (cont'd)
|
| 2. |
Tax benefits under the Israeli Law for the Encouragement of Capital Investments, 1959 (cont'd)
|
| 1) |
Preferred Enterprises located in Development Area A –
|
| 2) |
Preferred Enterprises located in the rest of the country –
|
| A. |
Taxation of companies in Israel (cont'd)
|
| 3. |
The Law for the Encouragement of Industry (Taxation), 1969
|
|
a)
|
Some of the Company’s Israeli subsidiaries are “Industrial Enterprise”, as defined in the abovementioned law. In respect of buildings, machinery and equipment owned and used by any "Industrial Enterprise", the Company is entitled to claim accelerated depreciation as provided by the Income Tax Regulations – Adjustments for Inflation (Depreciation Rates), 1986 which allow accelerated depreciation to any "Industrial Enterprise" as of the tax year in which each asset is first placed in service.
|
|
b)
|
The Industrial Enterprises owned by some of the Company's Israeli subsidiaries have a common line of production or similar industrial branch activity and, therefore, they file, together with the Company, a consolidated tax return in accordance with Section 23 of the Law for the Encouragement of Industry. Accordingly, each of the said companies is entitled to offset its tax losses against the taxable income of the other companies.
|
| 4. |
The Law for Taxation of Profits from Natural Resources
|
| A. |
Taxation of companies in Israel (cont'd)
|
| 4. |
The Law for Taxation of Profits from Natural Resources (cont'd)
|
| 1) |
Actual price in the sale transaction.
|
| 2) |
A price which will provide an operating profit for the bromine compounds manufacturer of
|
| 1) |
Actual price in the sale transaction.
|
| 2) |
A price which will keep an operating profit with the downstream products manufacturer of
|
| 3) |
The production and operating costs attributable to a unit of phosphate.
|
| A. |
Taxation of companies in Israel (cont'd)
|
| 4. |
The Law for Taxation of Profits from Natural Resources (cont'd)
|
Amendment number 3 to the Law
In November 2021, Amendment number 3 to the Law was approved by the Israeli Kneset, according to which the arrangement of tax collection will be altered so that companies will be required to pay 75% of the disputed tax, after objecting to a tax assessment by appeal to the district court, and prior to a Court ruling. Prior to this amendment, the payment of the Surplus Profit Levy in dispute was not required until a Court ruling is rendered. This amendment may impact the collection of Surplus Profit Levy from the Company for the years 2016 and onwards.
| B. |
Taxation of non-Israeli subsidiaries
|
|
Country
|
Tax rate
|
Note
|
|
Brazil
|
|
|
|
Germany
|
|
|
|
United States
|
|
(1)
|
|
Netherlands
|
|
|
|
Spain
|
|
|
|
China
|
|
|
|
United Kingdom
|
|
| (1) |
|
| C. |
Carried forward tax losses
|
As of December 31, 202
1
, the balances of the carryforward tax losses of subsidiaries for which deferred taxes were recorded, is about $
As of December 31, 202
1
, the balances of the carryforward tax losses to future years of subsidiaries for which deferred taxes were not recorded, is about $
As of December 31, 2021, the capital losses for tax purposes available for carryforward to future years for which deferred taxes were not recorded is about $
| D. |
Tax assessments
|
|
(1)
|
The Company and the main operational companies in Israel (DSW, Rotem, Bromine, DSM, and BCL), have received final tax assessments up to and including
2019 (see items 2 and 3 below). Other companies in Israel received final tax assessments up to and including 2016. The main subsidiaries outside of Israel have final tax assessments up to and including 2015
.
|
| (2) |
Regarding the tax assessment for the years 2012‑2014 issued by the Israeli Tax Authorities (ITA) to the Company and to certain Israeli subsidiaries,
in September 2021, a judgment was given approving a settlement agreement between the Company and the ITA, for the final and complete settlement of all claims, demands and arguments of the ITA against the Company in connection with such tax assessments. As a result, the Company paid $
|
|
Regarding the tax assessment for the year 2015 issued by the ITA, in December 2021, the Company reached an agreement with the ITA regarding the tax years 2015‑2019, pursuant to which the Company will pay $
|
|
(3)
|
The Company's subsidiary in Belgium (hereinafter - ICL Belgium or the Company) recognized a notion deduction on its capital, based on its interpretation of the Belgian tax law. This position was disputed by the tax authorities. In November 2021, the Supreme Court accepted the Company's position, which finalized all tax disputes with the local tax authorities. |
Note 15 - Taxes on Income (cont'd)
| E. |
Uncertain Tax Position
|
| E. |
Uncertain Tax Position
(cont'd)
|
Given the mineral's price environment, its effect on the profitability of the Subsidiaries and after deduction of a 14% allowed deductible on the balance of property, plant and equipment, as stated in the law and based on the replacement cost, as of December 31, 2021, no natural resources tax liability was payable. In respect of the phosphate resource, due to prior years' losses, no natural resources tax liability was payable.
The Tax Authority's position could be materially different, even in very significant amounts, mainly, as a result of the different interpretation regarding the implementation of the Law, with respect to the carrying amount for natural resources tax purposes of the property, p lant and equipment.
Should the
ITA
, and subsequently the applicable District Court, in case of an appeal,
decide
s
that the
measurement of the property, plant and equipment, for this purpose, should
be
in accordance with depreciated historical cost,
and
fu
lly
reject
s
the Company's
arguments with respect to this issue
, the result
can
be an increase in the Company's tax liabilities in an aggregate amount of about $
In March 2021, the ITA issued an assessment for the years 2016‑2017, which includes a demand for payment of Surplus Profit Levy, in the amount of approximately $
| F. |
Deferred income taxes
|
| 1. |
The composition of the deferred taxes and the changes therein, are as follows:
|
|
In respect of financial position
|
In respect
of carry forward tax losses
|
Total
|
||||
|
Depreciable property,
plant and equipment and intangible assets
|
Inventories
|
Provisions for employee benefits
|
Other
|
|||
|
$ millions
|
||||||
|
Balance as of January 1, 2020 |
(
|
|
|
|
|
(
|
|
Changes in 2020:
|
||||||
|
Amounts recorded in the statement of income
|
(
|
|
|
(
|
|
|
|
Amounts recorded to a capital reserve |
|
|
(
|
|
(
|
(
|
|
Translation differences |
(
|
|
|
|
|
|
|
Balance as of December 31, 2020
|
(
|
|
|
(
|
|
(
|
|
Changes in 2021: |
||||||
|
Additions in respect of business c ombinations |
|
|
|
|
|
|
|
Amounts recorded in the statement of income
|
|
|
|
(
|
(
|
(
|
|
Amounts recorded to a capital reserve
|
|
|
(
|
(
|
|
(
|
|
Translation differences
|
|
|
(
|
(
|
(
|
(
|
|
Balance as of December 31, 2021
|
(
|
|
|
(
|
|
(
|
| 2. |
The currencies in which the deferred taxes are denominated:
|
|
As of December 31
|
||
|
2021
|
2020
|
|
|
$ millions
|
$ millions
|
|
|
Euro
|
|
|
|
Brazilian Real |
|
(
|
|
British Pound
|
|
|
|
U.S Dollar
|
(
|
(
|
|
Israeli Shekels |
(
|
(
|
|
Other
|
|
|
|
(
|
(
|
| G. |
Taxes on income included in the income statements
|
| 1. |
Composition of income tax expenses (income)
|
|
|
For the year ended December 31
|
|||
|
2021
|
2020
|
2019
|
|
|
$ millions
|
$ millions
|
$ millions
|
|
|
Current taxes
|
|
|
|
|
Deferred taxes
|
|
(
|
|
|
Taxes in respect of prior years
|
|
(
|
(
|
|
|
|
|
| 2. |
Theoretical tax
|
|
For the year ended December 31
|
|||
|
2021
|
2020
|
2019
|
|
|
$ millions
|
$ millions
|
$ millions
|
|
|
Income before taxes on
income
, as reported in the statements of income
|
|
|
|
|
Statutory tax rate (in Israel)
|
|
|
|
|
Theoretical tax expense
|
|
|
|
|
Add (less) – the tax effect of:
|
|||
|
Reduced tax due to tax benefits
|
(
|
(
|
(
|
|
Differences deriving from additional deduction and different tax rates applicable to foreign subsidiaries
|
(
|
(
|
(
|
|
Tax on dividend
|
|
|
|
|
Deductible temporary differences and their reversal (including carryforward losses) for which deferred taxes assets were not recorded and non–deductible expenses
|
(
|
|
|
|
Taxes in respect of prior years*
|
|
(
|
(
|
|
Differences in measurement basis
|
(
|
|
|
|
Other differences
|
|
|
(
|
|
Taxes on income included in the income statements
|
|
|
|
| H. |
Taxes on income relating to items recorded in equity
|
|
For the year ended December 31
|
|||
|
2021
|
2020
|
2019
|
|
|
$ millions
|
$ millions
|
$ millions
|
|
|
Tax recorded in other comprehensive income
|
|||
|
Actuarial gains from defined benefit plan
|
(
|
(
|
|
|
Change in investments at fair value through other comprehensive income
|
(
|
|
(
|
|
Taxes in respect of exchange rate differences on equity loan to a subsidiary included in translation adjustment
|
(
|
(
|
|
|
Total
|
(
|
(
|
|
| A. |
Composition
|
|
As of December 31
|
||
|
2021
|
2020
|
|
|
$ millions
|
$ millions
|
|
|
Fair value of plan assets
|
|
|
|
Termination benefits
|
(
|
(
|
|
Defined benefit obligation
|
(
|
(
|
|
(
|
(
|
|
As of December 31
|
||
|
2021
|
2020
|
|
|
$ millions
|
$ millions
|
|
|
Equity instruments
|
||
|
With quoted market price
|
|
|
|
Without quoted market price
|
|
|
|
|
|
|
|
Debt instruments
|
||
|
With quoted market price
|
|
|
|
Without quoted market price
|
|
|
|
|
|
|
|
Deposits with insurance companies
|
|
|
|
|
|
| B. |
Severance Pay
|
| 1. |
Israeli companies
|
| 2. |
Certain subsidiaries outside Israel
|
| C. |
Pension and Early Retirement
|
|
|
(1)
|
|
| (2) |
Some subsidiaries have signed plans with funds – and with a pension fund for some of the employees – under which such subsidiaries make current deposits with that fund which releases them from their liability for making a pension payment under the labor agreements to their employees upon reaching a retirement age. The amounts funded are not reflected in the statements of financial position, since they are not under the control and management of the subsidiaries.
|
| D. |
Post-employment retirement benefits
|
| E. |
Movement in net defined benefit obligation and in its components:
|
|
Fair value of plan assets
|
Defined benefit obligation
|
Defined benefit obligation, net
|
||||
|
2021
|
2020
|
2021
|
2020
|
2021
|
2020
|
|
|
$ millions
|
$ millions
|
$ millions
|
$ millions
|
$ millions
|
$ millions
|
|
|
Balance as of January 1
|
|
|
(
|
(
|
(
|
(
|
|
Income (costs) included in profit or loss:
|
||||||
|
Current service costs
|
|
|
(
|
(
|
(
|
(
|
|
Interest income (expenses)
|
|
|
(
|
(
|
(
|
(
|
|
Past service cost
|
|
|
|
|
|
|
|
Effect of movements in exchange rates, net
|
|
|
(
|
(
|
(
|
(
|
|
Included in other comprehensive income:
|
||||||
|
Actuarial profits (losses) deriving from changes in financial assumptions |
|
|
|
(
|
|
(
|
|
Other actuarial gains
|
|
|
|
|
|
|
|
Change with respect to translation differences, net
|
(
|
|
|
(
|
|
(
|
|
Other movements:
|
||||||
|
Benefits received (paid)
|
(
|
(
|
|
|
|
|
|
Employer contribution
|
|
|
-
|
-
|
|
|
|
Balance as of December 31
|
|
|
(
|
(
|
(
|
(
|
| F. |
Actuarial assumptions
|
|
For the year ended December 31
|
|||
|
2021
|
2020
|
2019
|
|
|
%
|
%
|
%
|
|
|
Discount rate as of December 31
|
|
|
|
|
Future salary increases
|
|
|
|
|
Future pension increase
|
|
|
|
| G. |
Sensitivity analysis
|
|
December 2021
|
||||
|
Decrease
10% |
Decrease
5%
|
Increase
5%
|
Increase
10%
|
|
|
$ millions
|
$ millions
|
$ millions
|
$ millions
|
|
|
Significant actuarial assumptions
|
||||
|
Salary increases
|
(
|
(
|
|
|
|
Discount rate
|
|
|
(
|
(
|
|
Mortality table
|
|
|
(
|
(
|
The assumptions regarding the future mortality rate are based on published statistics and accepted mortality tables.
| H. |
The Effect of the plans on the Company's future cash flows
|
| I. |
Long-term incentive plan
|
|
|
(1)
|
In February 2022, the Company’s HR & Compensation Committee and the Board of Directors approved a triennial equity grant for the years 2022-2024 in the form of options exercisable to the Company's ordinary shares. For further information - see Note 19.
|
| (2) |
In November 2021, Company's HR & Compensation Committee and the Board of Directors approved a new Cash LTI plan, according to which, other senior managers will be awarded a cash incentive in 2024, the fair value of the grant as of the grant date is about $
|
|
|
|
(3)
|
In
April 2019, Company’s HR & Compensation Committee and the Board of Directors approved a Cash LTI plan, according to which, senior managers will be awarded with a cash incentive of about $
|
| A. |
Composition and changes in the provision
|
|
Site restoration and equipment dismantling
|
Legal claims
|
Other
|
Total
|
|
|
$ millions
|
$ millions
|
$ millions
|
$ millions
|
|
Balance as of January 1, 2021
|
|
|
|
|
|
Provisions recorded during the year
|
|
|
|
|
|
Provisions recorded in respect of business combinations
|
|
|
|
|
|
Provisions reversed during the year
|
|
(
|
(
|
(
|
|
Payments during the year
|
(
|
(
|
(
|
(
|
|
Translation differences
|
(
|
(
|
|
(
|
|
Balance as of December 31, 2021
|
|
|
|
|
| (1) |
Main items under 'Site restoration and equipment dismantling':
|
| a. |
Spain – In June 2018, a new restoration plan was approved for the Suria and Sallent sites, which included a plan for handling the salt piles and dismantling of facilities. The restoration plan for the Suria site is scheduled to extend until 2094, and for the Sallent site up to 2075.
|
| b. |
Rotem Israel – as of December 31, 2021, according to the Company's estimation, the provision for the restoration of the mining sites and waste repositories, for Rotem Israel's operations, amounted to $
|
| A. |
Composition and changes in the provision (cont'd)
|
| c. |
Bromine Israel (Neot Hovav) – pursuant to the Ministry of Environmental Protection, the Company is required to treat both solid waste of past periods which is stored in a designated defined area on the site's premises, and currently-produced waste created during the ongoing production processes in the plant. Waste treatment is partly conducted through a hydro-bromine acid recovering facility (BRU), operated by the Company. Part of the waste is sent for external designated treatment. As of December 31, 2021, the provision for prior periods waste treatment amounted to about $
|
| (1) |
In 2016, a court decision was rendered which determined that ICL Iberia bears responsibility for contamination of water in certain wells at the Suria and Sallent sites (due to an over concentration of salt). In 2018, claims were received from several owners of the land surrounding the wells, demanding compensation from ICL Iberia for damages in the aggregate amount of $
|
| (2) |
In 2017, the Israeli Water Law was amended, according to which saline water of the kind produced for Dead Sea plants by the Company's own water drilling is charged with water fees. The Company objected to the charges relating to water drilling within the concession area, which constitutes about
|
| A. |
Commitments
|
| (1) |
Several of the Group’s subsidiaries have entered into agreements with suppliers for the purchase of raw materials and energy in the ordinary course of business, for various periods ending on December 31, 2036. As of December 31, 2021, the total amount of the commitments under the said purchase periods of the agreements is about $
|
| (2) |
Several of the Group’s subsidiaries have entered into agreements with suppliers for the acquisition of property, plant and equipment. As of December 31, 2021, the subsidiaries have capital expenditures commitments of about $
|
| (3) |
As part of the collaboration between ICL's subsidiary in Spain (ICL Iberia) and the government of Catalonia to achieve environmental sustainability goals, the Company has undertaken to carry out restoration of the salt piles in its sites, mainly by processing and removing them to the sea via a collector. In April 2021, the Company signed an agreement with the Catalan Water Agency for the construction and operation of a collector. The main highlights of the agreement include, among other things, the guidelines by which the project will be managed, the financing aspects of the project, the definition of project costs and the determination of the operational maintenance mechanism, including usage costs.
Based on the said agreement and Spain's water law, it was determined that ICL Iberia will assume up to 90% of the project's cost (approximately $
|
| (4) |
In
December 2017, the Company entered into a gas purchase agreement with Energean Israel Limited (hereinafter - Energean) who holds a license for the development of the Karish and Tanin gas reservoirs. Under the agreement, Energean is expected to supply the Company with natural gas (NG) at a quantity of up to 13 BCM, at a value of $
|
|
A. |
Commitments (cont'd) |
|
| (4) |
(Cont'd)
|
|
| (5) |
In June 2020, the Company entered into a long-term lease agreement with a third party, according to which ICL will lease an office building in Be'er Sheva Israel for a period of
|
| (6) |
The Articles of Association of the Company and its Israeli subsidiaries include provisions that permit exemption, indemnification and insurance of the liability of officers, all in accordance with the provisions of the Companies Law.
|
| B. |
Concessions
|
|
| (1) |
Dead Sea Works Ltd. (hereinafter – DSW) |
| B. |
Concessions (cont'd) |
|
| (1) |
DSW (cont'd) |
| B. |
Concessions (cont'd) |
|
| (1) |
DSW (cont'd) |
| (2) |
Rotem Amfert Israel (hereinafter – “Rotem Israel”) |
Rotem Israel has been mining phosphates in the Negev in Israel for more than sixty years. The mining is conducted in accordance with phosphate mining concessions, which are granted from time to time by the Minister of Energy under the Mines Ordinance, by the Supervisor of Mines in his Office, as well as the mining authorizations issued by the Israel Lands Authority (hereinafter – the Authority). The concessions relate to quarries (phosphate rock), whereas the authorizations cover use of land as active mining areas.
|
Mining Concessions |
| B. |
Concessions (cont'd) |
|
| (2) |
Rotem Israel (cont'd) |
|
Lease Agreements |
In accordance with the Mines Ordinance (Third addendum A), the royalty rate for production of phosphates is
|
Planning and Building |
| B. |
Concessions (cont'd) |
|
|
(2) |
Rotem Israel (cont'd) |
In addition, it was decided to establish a team with representatives of the ministries of Treasury, Health, Transportation, Environmental Protection and Energy (hereinafter – The Inter-ministerial team ) , which will present to the Housing Cabinet a report that includes health aspects for NOP 14B.
|
• |
Emissions permit under the Israeli Clean Air Act (hereinafter - the Law): In June 2021, the Company's emission permit was renewed by the Israeli Ministry of Environmental Protection (MoEP), until September 2023. The renewed permit reflects an updated outline of requirements. Postponement in the execution of a limited number of projects was granted within the framework of an administrative order under Section 45 of the Law, received in July 2021. Management still expects difficulties in meeting the execution schedules of a limited number of projects and accordingly continues to work with the MoEP to find a satisfactory solution regarding the timing of the investments, taking into account the impact of uncertainty surrounding Rotem Israel's activity, as far as the implementation of long-term projects is concerned. |
|
B. |
Concessions (cont'd) |
|
| (2) |
Rotem Israel (cont'd) |
|
• |
Oron's
lease agreement - The Company has been working to extend the lease agreement for Oron's plant area since 2017 by exercising the extension option provided in the agreement.
|
|
|
•
|
Phosphogypsum storage - In October 2021, a new Urban Building Plan was approved, the main objectives of which are to regulate areas for phosphogypsum storage reservoirs. According to the new Plan, the Company is required to obtain building permits involving permit fees. Due to the ambiguity of the guidelines regarding the fee's calculation, there is a difficulty in estimating the future required outflows.
|
|
|
• |
Energy Production – In order to ensure the continuity of energy production in Rotem Israel, and in accordance with the policy of the Ministry of Energy and the Ministry of Environmental Protection, the Company is working to accelerate the completion of a project to replace existing energy production infrastructure at Rotem, which utilizes oil shale, with a natural gas-based steam boiler, so it will be completed before the existing mined reserves of oil shale are utilized.
|
|
|
• |
Finding economically feasible alternatives for continued mining of phosphate rock in Israel – According to the Company's assessment of economic phosphate reserves in the existing mining areas and the estimated useful life of Rotem's phosphate rock reserves, which are essential for its production, is limited to only a few years. As described above, the Company is working to obtain permits and approvals which will provide an economic alternative for future mining of phosphate rock in Israel. |
|
|
The Company is continuing its discussions with the relevant authorities, in order that the required approvals, permits and future phosphate rock resources are granted. The Company estimates that it is more likely than not that the said approvals, permits and future phosphate rock resources will be granted within a timeframe that will not materially impact the Company's results. Nevertheless, there is no certainty as to the receipt of such approvals, permits and future phosphate rock resources and/or the date of their receipt. Failure to obtain these approvals, permits and future phosphate rock resources, or a significant delay in receiving them can lead to a material impact on the Company's business, financial position and results of operations. |
||
|
B. |
Concessions (cont'd) |
| (3) |
ICL Iberia – a subsidiary in Spain |
|
ICL Iberia was granted mining rights based on legislation of Spain’s Government from 1973 and the regulations accompanying this legislation. Further t o the legislation, the g overnment of the Catalonia region published special mining regulations whereby ICL Iberia received individual licenses for each of the 126 different sites that are relevant to current and possible future mining activities. Some of t he licenses are valid until 2037 and the remainder are effective until 2067. The concession for the "Reserva Catalana", an additional site where mining did not commence, expired in 2012. The Company is acting in cooperation with the Spanish Government to obtain a renewal of the concession. According to the Spanish authorities, the concession period is valid until a final decision is made regarding the renewa l. |
||
| (4) |
United Kingdom |
| A. |
The mineral leases of ICL Boulby, ICL's subsidiary in the United Kingdom (hereinafter – ICL Boulby), are based on approximately 74 mineral leases and licenses for extracting various minerals, in addition to numerous easements and rights of way from private owners of land under which ICL Boulby operates, and mineral lease rights under the North Sea granted by The Crown Estates. The mineral lease rights with The Crown Estates, include provisions to explore and exploit all targeted and known polyhalite mineral resources of interest to ICL Boulby. Said leases cover a total area of about 822 square kilometers (onshore leases total around 32 square kilometers and offshore leases from the Crown Estates cover around 790 square kilometers). All the lease periods, licenses, easements and rights of way are effective, some until 2022 and others until 2038. The Company is acting to renew the rights necessary for the mining operation which expire in 2022, or, alternatively, to seek ownership of these rights.
Regarding ICL Boulby's planning permit for mineral exploitation, which is valid until 2023, in December 2021, the North York Moors Park Authority Planning Committee approved ICL Boulby Mine’s application for the continuation of polyhalite and salt production for an additional 25 years, commencing 2023. |
With respect to the mining royalties, ICL Boulby pays royalties of
| B. |
A
UK subsidiary which is a part of the Innovative Ag Solutions segment (hereinafter – Everris Limited), has peat mines in the UK (Creca, Nutberry and Douglas Water). Peat is used as a component to produce professional growing media. All sites are owned by Everris Limited. The current extraction permits are granted by the local authorities and are renewed after examining the renewal applications. The extraction permits for Nutberry and Douglas Water were granted until the end of 2024 and until 2037 for Creca.
|
| B. |
Concessions (cont'd) |
| (5) |
YPH - China |
|
|
Mining Concessions |
|
Grant of Mining Rights to Lindu |
|
Natural Resources Royalties |
|
Planning and Building |
| C. |
Contingent liabilities
|
|
| (1) |
Ecology |
| A. |
In September 2020, an application for a class action was filed in the Beer Sheva District Court in Israel against the Company, the Company's subsidiary Rotem Israel, and certain of the Company's present and past office‑holders by a number of local residents in the Arava region in the south of Israel (hereinafter – the Applicants). The Applicants claim that discharge, leakage and seepage of wastewater from ICL's Zin site allegedly caused various environmental hazards to the Zin stream, which resulted in damage to various groups in Israel’s population, including: the Israeli public whose property is Zin stream; those who avoided visiting Zin stream due to the environmental hazards; visitors of Zin stream who were exposed to the aforementioned hazards and the residents of the area near Zin stream who were affected by the hazards. Accordingly, the Applicants request several remedies, including restitution and compensation for the damage that they claim was caused to the various groups in a minimum amount of NIS
|
| B. |
In
July 2019, an application for approval of a claim as a class action was submitted to the Jerusalem District Court by an Israeli environmental association (hereafter - the Applicant) against 30 defendants, including Fertilizers and Chemicals Ltd., a subsidiary of the Company (hereinafter – the Respondents). The application includes claims relating to air pollution in Haifa Bay (located in northern Israel) and to alleged illness therefrom to the population of the said area.
Within the framework of the petition, the Applicant requests declarative relief and the establishment of a mechanism for compensation awards, without specifying their amount, or alternatively, for splitting remedies to allow each group member to sue for damages in a separate proceeding. On January 10, 2022, the Company filed its response objecting to the petition. A hearing procedure is currently being held, in the framework of which a deliberation should take place in the first quarter of 2022. Considering the early stage of the proceeding and the limited precedents of such cases in Israel, there is a difficulty in estimating its outcome. No provision has been recorded in the Company's financial statements.
|
| C. |
Contingent liabilities (cont'd)
|
|
| (1) |
Ecology (cont'd) |
| C. |
In March 2018,
an application for certification of a claim as a class action was filed with the
Be’er Sheva District Court by two groups: the first class constituting the entire public of the State of Israel and the second-class constituting visitors of the Bokek stream and the Dead Sea (hereinafter – the Applicants), against the subsidiaries, Rotem Israel and Periclase Dead Sea Ltd. (hereinafter – the Respondents).
|
| D. |
I
n July and August 2017, three applications for certification of claims as class actions were filed against the Company, as a result of a partial collapse of the dyke in an evaporation pond at Rotem Amfert Israel which resulted in contamination of the Ashalim Stream and its surrounding area. The claimants contend that the Company breached various provisions of environmental laws, including, the provisions of the Law for Prevention of Environmental Hazards, the Water Law, provisions of the Torts Ordinance, a breach of statutory duty and negligence. In the framework of the first application, the Court was requested to instruct the Company to rectify the harm caused as a result of its omissions, in order to prevent recurrence of the damage caused as well as to grant a monetary remedy for non‑pecuniary damages. The monetary remedy was not defined, however, according to the claimants, the amount of the personal claim is NIS
|
| C. |
Contingent liabilities (cont'd)
|
|
| (1) |
Ecology (cont'd) |
| D. |
(Cont'd)
|
In conjunction with the aforesaid application, the NPA filed a motion to strike the three applications mentioned above and to prefer the approval application on its behalf, as it argues that it is the most suitable to serve as the representative plaintiff in a class action in this regard, as its application is detailed and well-established as well as the special status conferred upon it under the Class Actions Law, which allows for specific benefits.
| C. |
Contingent liabilities (cont'd)
|
|
| (1) |
Ecology (cont'd) |
| D. |
(Cont'd)
|
In November 2018, the Company was notified that all four applicants had agreed to join efforts and manage the class actions in a joint and coordinated manner, as well as of their consent to take part in a mediation process in an attempt to resolve the disputes outside of court. In January 2020, the parties signed a procedural agreement that regulates the procedure by which the disputes will be addressed in the mediation procedure which has been initiated. Considering the early stage of the proceedings, there is a difficulty in estimating their outcome. The Company is in contact with its insurance carriers to activate the relevant insurance policies. No provision has been recorded in the Company's financial statements.
In May 2018, the Company was served with a motion for discovery and pursual of documents (hereinafter – the Motion), filed with the Tel Aviv District Court, by a shareholder of the Company (hereinafter – the Movant), as a preliminary proceeding in preparation for the possible filing of an application for certification of a multiple derivative action against officers of the Company and Rotem Israel who, according to the Movant, caused the alleged damages incurred and to be incurred by the Company as a result of the Ashalim incident. In 2018, the parties reached an arrangement, according to which, the legal proceedings will be delayed until the relevant investigation's materials are provided to the Company by the investigating authority. As of the reporting date, such investigative materials have not yet been received. Considering the proceedings are in an early stage and even suspended, there is a difficulty in estimating their outcome.
| E. |
In 2015, a request was filed for certification of a claim as a class action, in the Tel Aviv-Jaffa District Court, against eleven defendants, including a subsidiary, Fertilizers and Chemical Ltd., in respect of claims relating to air pollution in Haifa Bay and for the harm allegedly caused by it to residents of the Haifa Bay area. The amount of the claim is about NIS
|
| F. |
In December 2021, the Company, along with the State of Israel, received a letter of warning prior to pursuing legal action, by Kibbutz Mitzpe Shalem in Israel, claiming, among others, that they were allegedly responsible for the closure of Mineral Beach in January 2015, as a result of a sinkhole. The Kibbutz claims alleged damages of $27 million and has requested a dialogue meeting to be held before pursuing legal action.
|
The Company operates in accordance with the provisions of the Concession Law and permits issued by the local Authorities. The Company rejects all of the allegations against it by the Kibbutz. Considering the preliminary stage of the proceeding it is difficult to estimate its outcome.
| C. |
Contingent liabilities (cont'd)
|
|
| (2) |
Increase in the level of the evaporation Pond in Sodom (hereinafter – Pond 5) |
The minerals from the Dead Sea are extracted by way of solar evaporation, whereby salt precipitates onto the bed of Pond 5, located in one of the sites of DSW. The precipitated salt creates a layer on Pond 5 bed with a volume of approximately 16 million cubic meters per year.
The production process of the raw material requires that a fixed brine volume is preserved in Pond 5. Failure to maintain a constant volume of brine in Pond 5 could result in a reduction in production capacity. To this end, up to the end of 2021, the raising of the brines' level of Pond 5 was according to the rate at which the pond floor rises, while performing the salt harvest. Since the solutions' level maximum height (15.1 meters) was reached at the end of 2021, from 2022 onwards, the solutions' volume in Pond 5 will be preserved by way of harvesting the salt ("the Permanent Solution" and/or "the Salt Harvesting Project" as described below).
Raising the water level of Pond 5 above a certain level may cause structural damage to the foundations of hotel buildings situated close to the water’s edge, to the settlement of Neve Zohar and to other infrastructure located along the western shoreline of the Pond.
Until the end of 2020, in order to ensure that Pond 5 water level does not exceed the maximum height (15.1 meters), the Government of Israel, through the Dead Sea Preservation Government Company Ltd., implemented a project for construction of coastline defenses, together with DSW (which financed
The "Permanent Solution", which should provide a defense at least until the end of the current concession period in 2030, was established in the agreement with the Government of Israel signed in 2012. The purpose of the agreement was, among others, to provide a permanent solution for raising the water level in Pond 5 and stabilizing the water therein at a fixed level by harvesting salt from this pond and transferring it to the Northern Basin of the Dead Sea. According to the agreement, the planning and execution of the Permanent Solution will be through the Salt Harvesting Project which will be performed by DSW. In addition, the agreement stipulates that from January 1, 2017, the water level in the pond will not rise above 15.1 meters. Nevertheless, in the event of a material deviation from the project's timetables, without the Company having violated its obligations, the Company will be permitted to request raising of the water level above 15.1 meters.
The Company bears
In 2015 and 2016, the National Infrastructures Committee and the Israeli Government, respectively, approved National Infrastructures Plan 35A (hereinafter – the Plan), which includes the statutory infrastructure for establishment of the Salt Harvesting Project in Pond 5, and construction of the P-9 pumping station in the Northern Basin of the Dead Sea.
| C. |
Contingent liabilities (cont'd)
|
|
| (2) |
Increase in the level of Pond 5 (cont'd) |
| (3) |
Spain |
| A. |
A
subsidiary in Spain (hereinafter – ICL Iberia) operated two potash production centers in Suria and Sallent. As part of an efficiency plan, the Company consolidated the activities of ICL Iberia into one site by means of expanding the Suria production site and discontinuing the mining activities at the Sallent site. The mining activities in Spain require, among other things, an environmental mining license and an urban license.
|
| B. |
Following an arbitration proceeding conducted between a Spanish subsidiary (IBP) and Nobian concerning the termination of a partnership agreement between them, in October 2021 an agreement was signed to terminate the partnership, under which the Company will pay a net amount of approximately $
|
| C. |
Contingent liabilities (cont'd)
|
| (4) |
In March 2021, an application for a class action was filed with the Tel Aviv-Jaffa District Court against the Company, Israel Corporation Ltd. and the controlling shareholder of Israel Corporation (hereinafter – the Respondents). The application includes a series of allegations concerning, among others, alleged misleading and violation of the Company’s reporting and disclosure obligations to the public under the Israeli Securities Law, 5728-1968, relating to the implications of the royalties' claim filed in 2011 by the State of Israel against its subsidiary, Dead Sea Works Ltd., pursuant to the Dead Sea Concession Law, 5721-1961, which was conducted and concluded within an arbitration proceeding. The applicant is a shareholder of the Company asking to act on behalf of a represented class including all those who acquired Company shares or Israel Corp. shares and held them between August 17, 2011, and May 27, 2014. According to the application, this group incurred alleged damages by the Respondents, and accordingly, the Court is requested to rule in favor of the group members who are shareholders of the Company, damages in the amount of about NIS
The
Company rejects the claims made in the application and, accordingly, in September 2021 filed its response within the framework of the legal proceeding. Considering the preliminary stage of the proceeding there is a difficulty in estimating its outcome. No provision has been recorded in the Company's financial statements.
|
|
| (5) |
In
connection with the Harmonization Project (to create one global ERP system), which was discontinued in 2016 by a decision of the Company's Board of Directors, in December 2018, the Company filed a lawsuit in the Tel Aviv District Court against IBM Israel, the leading project provider (hereinafter – IBM), in the amount of
$
|
In March 2019, IBM filed its statement of defense, together with a counterclaim against the Company, according to which IBM claims that ICL allegedly refrained from making certain payments, conducted negotiations in bad faith, and terminated the project unilaterally, in a way that harmed IBM's reputation and goodwill and therefore claims an amount of about $
| C. |
Contingent liabilities (cont'd)
|
| (6) |
In December 2018, an application for certification of a class action was filed with the Tel Aviv District Court against the Company, Israel Corporation, and office holders, including directors who held office during the said dates which are stated in the application, with respect to the manner in which the IT (the Harmonization) project was managed and terminated. According to the allegations made in the Application, the Company failed to properly report negative developments which occurred on certain dates during the said IT project, and such failure caused the company immense financial damages.
The represented class was defined in the application as all those who acquired the Company's shares at any time during the period commencing June 11, 2015 and did not sell them until September 29, 2016 (hereinafter – the Applicants). |
| (7) |
In July 2018, an application for certification of a class action was filed with the Central District Court against the Company and its subsidiaries, Rotem Israel and Fertilizers and Chemicals Ltd. (jointly hereinafter – the Defendants). The causes of action are the alleged exploitation of the Defendants' monopolistic position to charge consumers in Israel excessive and unfair prices for products classified as "solid phosphate fertilizer" between 2011 and 2018, contrary to the provisions of the Restrictive Trade Practices Law, and unjust profits at the expense of the plaintiff and the represented group. The representative plaintiff is a Kibbutz member who grows various plants and trees in his yard and in a nearby orchard.
|
Note 18 - Commitments, Concessions and Contingent Liabilities (cont'd)
| C. |
Contingent liabilities (cont'd)
|
|
| (7) |
(cont'd) |
According to the statement of claim, the plaintiff requests, among other things, that the Court rules in his favor and in favor of the Represented Group, awarding them compensation for the damages allegedly caused to them, in the total amount of NIS
| (8) |
In addition to the contingent liabilities, as stated above, as of the reporting date, the contingent liabilities regarding the matters of environmental protection and legal claims, which are pending against the Group, are in immaterial amounts. It is noted that part of the above claims is covered by insurance. According to the Company’s estimation, the provisions recognized in its financial statements are sufficient.
|
| A. |
Composition:
|
|
As of December 31, 2021
|
As of December 31, 2020
|
|||
|
Authorized
|
Issued and paid
|
Authorized
|
Issued and paid
|
|
|
Number of ordinary shares of Israeli Shekel 1 par value (in millions)
|
|
|
|
|
|
Number of Special State shares of Israeli Shekel 1 par value
|
|
|
|
|
|
Number of Outstanding Shares (in millions)
|
|
As of January 1, 2020
|
|
|
Issuance of shares
|
|
|
As of December 31, 2020
|
|
|
Issuance of shares
|
|
|
As of December 31, 2021
|
|
| B. |
Rights conferred by the shares
|
|
(1)
|
The ordinary shares grant their holders voting rights in General Meetings of the Company, the right to participate in shareholders’ meetings, the right to receive dividends and the right to a share in excess assets upon liquidation of ICL.
|
| (2) |
The Special State of Israel Share, held by the State of Israel for the purpose of monitoring matters of vital interest to the State of Israel, grants special rights to make decisions, among other things, on the following matters:
|
| - |
Sale or transfer of company assets, which are “essential” to the State of Israel, not in the ordinary course of business.
|
| - |
Voluntary liquidation, change or reorganization of the organizational structure of ICL or merger (excluding mergers of entities controlled by ICL, directly or indirectly, that would not impair the rights or power of the Government, as holder of the Special State Share).
|
| - |
Any acquisition or holding of
|
| - |
The acquisition or holding of
|
| B. |
Rights conferred by the shares (cont'd)
|
| - |
Any percentage of holding of the Company’s shares, which grants its holder the right, ability or actual possibility to appoint, directly or indirectly, such number of the Company’s directors equal to half or more of the Company’s directors appointed.
|
| C. |
Share-based payments
|
|
1.
|
Non-marketable options
|
| Grant date | Employees entitled | Number of instruments (thousands) | Issuance’s details | Instrument terms | Vesting conditions | Expiration date |
|
August 6, 2014
|
Officers and senior employees
|
|
|
|
3 equal tranches:
(1) one third on December 1, 2016
(2) one third on December 1, 2017
(3) one third on December 1, 2018
|
|
|
June 30, 2016 |
Officers and senior employees
|
|
|
3 equal tranches:
(1) one third at the end of 12 months after the grant date
(2) one third at the end of 24 months after the grant date
(3) one third at the end of 36 months after the grant date
|
|
|
|
September 5, 2016 |
Former chairman of BOD |
|
||||
|
February 14, 2017 |
Former CEO |
|
|
|||
|
June 20, 2017 |
Officers and senior employees |
|
|
|||
|
August 2, 2017 |
Former chairman of BOD |
|
||||
|
March 6, 2018 |
Officers and senior employees |
|
|
| C. |
Share-based payments (cont'd)
|
| 1. |
Non-marketable options (cont'd)
|
| Grant date | Employees entitled | Number of instruments (thousands) | Issuance’s details | Instrument terms | Vesting conditions | Expiration date |
|
May 14, 2018
|
CEO
|
|
|
|
3 equal tranches:
(1) one third at the end of 12 months after the grant date
(2) one third at the end of 24 months after the grant date
(3) one third at the end of 36 months after the grant date
|
|
|
August 20, 2018
|
Former chairman of BOD
|
|
|
|||
|
April 15, 2019
|
Officers and senior manager
|
|
(1) half at the end of 24 months after the grant date. (2) half at the end of 36 months after the grant date. |
|
||
|
June 27, 2019
|
CEO
|
|
||||
|
May 29, 2019 * |
Chairman of BOD |
|
||||
|
June 30, 2021 |
Senior employees |
|
|
* The options were issued upon Mr. Doppelt’s entry into office on July 1, 2019.
|
| C. |
Share-based payments (cont'd)
|
| 1. |
Non-marketable options (cont'd)
|
|
2014 Plan
|
||||||
|
Granted 2014
|
Granted 2016
|
Granted 2017
|
Granted 2018
|
Granted 2019
|
Granted 2021
|
|
|
Share price (in $)
|
|
|
|
|
|
|
|
CPI-linked exercise price (in $)
|
|
|
|
|
|
|
|
Expected volatility:
|
||||||
|
First tranche
|
|
|
|
|
|
|
|
Second tranche
|
|
|
|
|
|
|
|
Third tranche
|
|
|
|
|
|
|
|
Expected life of options (in years):
|
||||||
|
First tranche
|
|
|
|
|
|
|
|
Second tranche
|
|
|
|
|
|
|
|
Third tranche
|
|
|
|
|
|
|
|
Risk-free interest rate:
|
||||||
|
First tranche
|
(
|
|
|
|
(
|
|
|
Second tranche
|
|
|
|
|
(
|
|
|
Third tranche
|
|
|
|
|
|
|
|
Fair value (in $ millions)
|
|
|
|
|
|
|
|
Weighted average grant date fair value per option (in $)
|
|
|
|
|
|
|
Note 19 – Equity (cont'd)
| C. |
Share-based payments (cont'd)
|
|
| 1. |
Non-marketable options (cont'd) |
|
Number of options
|
|
|
(in millions) |
|
Balance as of January 1, 2020
|
|
|
Movement in 2020:
|
|
|
Expired during the year
|
(
|
|
Exercised during the year
|
(
|
|
Total options outstanding as of December 31, 2020
|
|
|
Movement in 2021:
|
|
|
Granted during the year
|
|
|
Exercised during the year
|
(
|
|
Total options outstanding as of December 31, 2021
|
|
|
Subsequent to the date of the report
|
|
|
In February 2022, the Company’s HR & Compensation Committee and the Board of Directors, approved a new triennial equity grant for the years 2022-2024 in the form of about
|
| C. |
Share-based payments (cont'd)
|
| 1. |
Non-marketable options (cont'd)
|
|
December 31, 2021
|
December 31, 2020
|
December 31, 2019
|
|
Granted 2014 US Dollar
|
|
|
|
|
Granted 2016 US Dollar
|
|
|
|
|
Granted 2017 US Dollar
|
|
|
|
|
Granted 2018 US Dollar
|
|
|
|
|
Granted 2019 US Dollar
|
|
|
|
|
Granted 2021 US Dollar
|
|
|
|
|
December 31, 2021
|
December 31, 2020
|
December 31, 2019
|
|
Number of options exercisable (in Millions)
|
|
|
|
|
Weighted average exercise price in Israeli Shekel
|
|
|
|
|
Weighted average exercise price in US Dollar
|
|
|
|
|
December 31, 2021
|
December 31, 2020
|
December 31, 2019
|
|
Range of exercise price in Israeli Shekel
|
|
|
|
|
Range of exercise price in US Dollar
|
|
|
|
|
December 31, 2021
|
December 31, 2020
|
December 31, 2019
|
|
|
Average remaining contractual life
|
|
|
|
| C. |
Share-based payments (cont'd)
|
| 2. |
Restricted shares
|
| Grant date | Employees entitled | Number of instruments (thousands) |
Vesting conditions (*)
|
Instrument terms | Additional Information | Fair value at the grant date (Million) |
|
June 30, 2016
|
Officers and senior employees
|
|
3 equal tranches:
(1) one third at the end of 12 months after the grant date
(2) one third at the end of 24 months after the grant date
(3) one third at the end of 36 months after the grant date
|
|
|
|
|
September 5, 2016
|
Former chairman of BOD
|
|
||||
|
June 20, 2017
|
Officers and senior employees
|
|
|
|||
|
August 2, 2017
|
Former chairman of BOD
|
|
|
|||
|
January 10, 2018
|
ICL’s Directors (excluding ICL’s CEO & Chairman of the BOD)
|
|
|
|||
|
March 6, 2018
|
Officers and senior employees
|
|
|
|||
|
May 14, 2018
|
CEO
|
|
|
|||
|
August 20, 2018
|
Former chairman of BOD
|
|
|
|||
|
April 23, 2020
|
ICL’s Directors (excluding directors who are officers or directors of Israel Corporation Ltd.)
|
|
3 equal tranches:
(1) one third on January 1, 2021
(2) one third on January 1, 2022
(3) one third on January 1,2023
|
|
|
|
(*) |
Vesting of the Restricted Shares would be fully accelerated if the holder ceases to serve as a director of the Company, unless he/she ceased to hold office due to those certain circumstances regarding early termination of office or imposition of enforcement measures, as set forth in Sections 231-232a and 233(2) of the Israeli Companies Law. |
| D. |
Dividends distributed to the Company’s Shareholders
|
|
The date of Board of
Directors’ decision
to distribute
the dividend
|
Actual date of
distribution of
the dividend
|
Gross amount
of the dividend
distributed
(in millions of $)
|
Net amount of
the distribution
(net of the
subsidiary’s share)
(in millions of $)
|
Amount of
the dividend
per share
(in $)
|
|
February 4, 2019 |
|
|
|
|
|
May 6, 2019 |
|
|
|
|
|
July 30, 2019 |
|
|
|
|
|
November 5, 2019 |
|
|
|
|
|
Total 2019
|
|
|
|
|
|
February 11, 2020 |
|
|
|
|
|
May 10, 2020 |
|
|
|
|
|
July 27, 2020 |
|
|
|
|
|
November 10, 2020 |
|
|
|
|
|
Total 2020
|
|
|
|
|
|
February 10, 2021 |
|
|
|
|
|
May 5, 2021 |
|
|
|
|
|
July 27, 2021 |
|
|
|
|
|
November 3, 2021 |
|
|
|
|
|
Total 2021
|
|
|
|
|
|
February 8, 2022*
|
|
|
|
|
| E. |
Cumulative translation adjustment
|
| F. |
Capital reserves
|
The capital reserves include expenses for share‑based compensation to employees against a corresponding increase in equity (See item C above) and change in investment at fair value through other comprehensive income (See Note 21.E(3)).
| G. |
Treasury shares
|
|
During 2008 and 2009
|
|
For the year ended December 31
|
|||
|
2021
|
2020
|
2019
|
|
|
$ millions
|
$ millions
|
$ millions
|
|
|
Sales
|
|
|
|
|
Cost of sales
|
|||
|
Materials consumed
|
|
|
|
|
Cost of labor
|
|
|
|
|
Depreciation and amortization
|
|
|
|
|
Energy and fuel
|
|
|
|
|
Other
|
|
|
|
|
|
|
|
|
For the year ended December 31
|
|||
|
2021
|
2020
|
2019
|
|
|
$ millions
|
$ millions
|
$ millions
|
|
|
Selling, transport and marketing expenses
|
|||
|
Land and Marine transportation
|
|
|
|
|
Cost of labor
|
|
|
|
|
Other
|
|
|
|
|
|
|
|
|
|
General and administrative expenses
|
|||
|
Cost of labor
|
|
|
|
|
Professional Services
|
|
|
|
|
Other
|
|
|
|
|
|
|
|
|
|
Research and development expenses, net
|
|||
|
Cost of labor
|
|
|
|
|
Other
|
|
|
|
|
|
|
|
|
For the year ended December 31
|
|||
|
2021
|
2020
|
2019
|
|
|
$ millions
|
$ millions
|
$ millions
|
|
|
Other income
|
|
|
|
|
Capital gain |
|
|
|
|
Profit from divestment |
|
|
|
|
Past service cost |
|
|
|
|
Reversal of provision for legal claims |
|
|
|
|
Reversal of Impairment of fixed assets |
|
|
|
|
Other
|
|
|
|
|
Other income recorded in the income statements
|
|
|
|
|
Other expenses
|
|||
|
Provision for legal claims |
|
|
|
|
Provision for historical waste removal and site closure costs |
|
|
|
|
Transaction costs |
|
|
|
|
Impairment and disposal of assets |
|
|
|
|
Provision for early retirement and dismissal of employees |
|
|
|
|
Other
|
|
|
|
|
Other expenses recorded in the income statements
|
|
|
|
Note 20 - Details of Income Statement Items (cont'd)
|
For the year ended December 31
|
|||
|
2021
|
2020
|
2019
|
|
|
$ millions
|
$ millions
|
$ millions
|
|
|
Financing income and expenses
|
|||
|
Financing income:
|
|||
|
Net gain from change in fair value of derivative designated as economic hedge |
|
|
|
|
Net gain from change in fair value of derivative designated as cash flow hedge |
|
|
|
|
Interest income from banks and others |
|
|
|
|
|
|
|
|
|
Financing expenses:
|
|||
|
Interest expenses to banks and others
|
|
|
|
|
Net loss from changes in exchange rates
|
|
|
|
|
Financing expenses in relation to employees’ benefits
|
|
|
|
|
Banks and finance institutions commissions (mainly commission on early repayment of loans) |
|
|
|
|
Net loss from change in fair value of derivative designated as economic hedge |
|
|
|
|
Financing expenses
|
|
|
|
|
Net of borrowing costs capitalized
|
|
|
|
|
|
|
|
|
|
Net financing expenses recorded in the income statements
|
|
|
|
|
As of December 31, 2021
|
||||
|
Financial assets
|
Financial liabilities
|
|||
|
Measured at fair value through the statement of income
|
Measured at amortized cost
|
Measured at fair value through the statement of income
|
Measured at amortized cost
|
|
|
$ millions
|
$ millions
|
$ millions
|
$ millions
|
|
|
Current assets
|
||||
|
Cash and cash equivalents
|
|
|
|
|
|
Short-term investments and deposits
|
|
|
|
|
|
Trade receivables
|
|
|
|
|
|
Other receivables
|
|
|
|
|
|
Foreign currency derivative designated as economic hedge
|
|
|
|
|
|
Marine transport derivative designated as economic hedge |
|
|
|
|
|
Foreign currency and interest derivative instruments designated as cash flow hedge |
|
|
|
|
|
Non-current assets
|
||||
|
Foreign currency and interest derivative instruments designated as cash flow hedge
|
|
|
|
|
|
Other non-current asset
|
|
|
|
|
|
Total financial assets
|
|
|
|
|
|
Current liabilities
|
||||
|
Short term debt
|
|
|
|
(
|
|
Trade payables
|
|
|
|
(
|
|
Other current liabilities
|
|
|
|
(
|
|
Foreign currency derivative designated as economic hedge
|
|
|
(
|
|
|
Non-current liabilities
|
||||
|
Long term debt and debentures
|
|
|
|
(
|
|
Interest derivative instruments designated as economic hedge
|
|
|
(
|
|
|
Other non- current liabilities
|
|
|
|
(
|
|
Total financial liabilities
|
|
|
(
|
(
|
|
Total financial instruments, net
|
|
|
(
|
(
|
|
As of December 31, 2020
|
||||||
|
Financial assets
|
Financial liabilities
|
|||||
|
Measured at fair value through the statement of income
|
Measured at fair value through the statement
of comprehensive income
|
Measured at
amortized cost
|
Measured at fair value through the statement of income
|
Measured at amortized cost
|
||
|
$ millions
|
$ millions
|
$ millions
|
$ millions
|
$ millions
|
||
|
Current assets
|
|||||
|
Cash and cash equivalents
|
|
|
|
|
|
|
Short-term investments and deposits
|
|
|
|
|
|
|
Trade receivables
|
|
|
|
|
|
|
Other receivables
|
|
|
|
|
|
|
Investments at fair value through other comprehensive income |
|
|
|
|
|
|
Foreign currency and interest derivative designated as economic hedge
|
|
|
|
|
|
|
Non-current assets
|
|||||
|
Foreign currency and interest derivative instruments designated as cash flow hedge
|
|
|
|
|
|
|
Investments at fair value through other comprehensive income
|
|
|
|
|
|
|
Other non-current asset
|
|
|
|
|
|
|
Total financial assets
|
|
|
|
|
|
|
Current liabilities
|
|||||
|
Short term debt
|
|
|
|
|
(
|
|
Trade payables
|
|
|
|
|
(
|
|
Other current liabilities
|
|
|
|
|
(
|
|
Foreign currency and interest derivative designated as economic hedge
|
|
|
|
(
|
|
|
Energy and marine transport derivative designated as economic hedge
|
|
|
|
(
|
|
|
Non-current liabilities
|
|||||
|
Long term debt and debentures
|
|
|
|
|
(
|
|
Foreign currency and interest derivative designated as economic hedge
|
|
|
|
(
|
|
|
Foreign currency and interest derivative instruments designated as cash flow hedge |
|
|
|
(
|
|
|
Other non- current liabilities
|
-
|
|
|
|
(
|
|
Total financial liabilities
|
|
|
|
(
|
(
|
|
Total financial instruments, net
|
|
|
|
(
|
(
|
|
As of December 31
|
||
|
Carrying amount ($ millions)
|
||
|
2021
|
2020
|
|
|
Cash and cash equivalents
|
|
|
|
Short term investments and deposits
|
|
|
|
Trade receivables
|
|
|
|
Other receivables
|
|
|
|
Derivatives
|
|
|
|
Other non-current assets
|
|
|
|
|
|
|
As of December 31
|
||
|
Carrying amount ($ millions)
|
||
|
2021
|
2020
|
|
|
Asia |
|
|
|
Europe |
|
|
|
South America |
|
|
|
North America |
|
|
|
Israel
|
|
|
|
Other
|
|
|
|
|
|
|
As of December 31
|
||||
|
2021
|
2020
|
|||
|
Gross
|
Impairment
|
Gross
|
Impairment
|
|
|
$ millions
|
$ millions
|
$ millions
|
$ millions
|
|
|
Not past due
|
|
(
|
|
|
|
Past due up to 3 months
|
|
|
|
|
|
Past due 3 to 12 months
|
|
(
|
|
(
|
|
Past due over 12 months
|
|
(
|
|
(
|
|
|
(
|
|
(
|
|
2021
|
2020
|
|
|
$ millions
|
$ millions
|
|
Balance as of January 1
|
|
|
|
Additional allowance
|
(
|
|
|
Reversals
|
(
|
|
|
Changes due to translation differences
|
|
|
|
Balance as of December 31
|
|
|
|
As of December 31, 2021
|
|||||
|
Carrying amount
|
12 months or less
|
1-2 years
|
3-5 years
|
More than 5 years
|
|
|
$ millions
|
|||||
|
Non-derivative financial liabilities
|
|||||
|
Short term debt (not including current maturities)
|
|
|
|
|
|
|
Trade payables
|
|
|
|
|
|
|
Other current liabilities
|
|
|
|
|
|
|
Long-term debt, debentures and others
|
|
|
|
|
|
|
|
|
|
|
|
|
|
Financial liabilities – derivative instruments
|
|||||
|
Foreign currency and interest derivative designated as economic hedge |
|
|
|
|
|
|
As of December 31, 2020
|
|||||
|
Carrying amount
|
12 months or less
|
1-2 years
|
3-5 years
|
More than 5 years
|
|
|
$ millions
|
|||||
|
Non-derivative financial liabilities
|
|||||
|
Short term debt (not including current maturities)
|
|
|
|
|
|
|
Trade payables
|
|
|
|
|
|
|
Other current liabilities
|
|
|
|
|
|
|
Long-term debt, debentures and others |
|
|
|
|
|
|
|
|
|
|
|
|
|
Financial liabilities – derivative instruments utilized for economic hedging
|
|||||
|
Foreign currency and interest derivative designated as economic hedge
|
|
|
|
|
|
|
Energy and marine transport derivative designated as economic hedge
|
|
|
|
|
|
|
Foreign currency and interest derivative designated as cash flow hedge |
|
|
|
|
|
|
|
|
|
|
|
The Company has loans bearing variable interests and therefore its financial results and cash flows are exposed to fluctuations in the market interest rates.
The Company uses financial instruments, including derivatives, in order to hedge this exposure. The Company uses interest rate swap contracts mainly in order to reduce the exposure to cash flow risk in respect of changes in interest rates.
As part of the global reform in interest rate benchmarks, the Libor GBP settings ceased from 1 January 2022 and replaced by SONIA (GBP) Benchmark. Most US dollar LIBOR settings will continue to be calculated using panel bank submissions until mid-2023.
As of December 31,2021, USD LIBOR continues to be used as a reference rate and in valuation of instruments with maturities that exceed the expected end date for LIBOR. the Company has USD
As of December 31,2021, we have not finalized an agreement with the banks regarding the Libor transition effects on loans and derivatives.
|
As of December 31
|
||
|
2021
|
2020
|
|
|
$ millions
|
$ millions
|
|
|
Fixed rate instruments
|
|
|
|
Financial assets
|
|
|
|
Financial liabilities
|
(
|
(
|
|
(
|
(
|
|
|
Variable rate instruments
|
||
|
Financial assets
|
|
|
|
Financial liabilities
|
(
|
(
|
|
(
|
(
|
|
As of December 31, 2021
|
||||
|
Impact on profit (loss)
|
||||
|
Decrease of 1%
in interest
|
Decrease of 0.5%
in interest
|
Increase of 0.5%
in interest
|
Increase of 1%
in interest
|
|
|
$ millions
|
$ millions
|
$ millions
|
$ millions
|
|
|
SWAP instruments
|
||||
|
Changes in U.S. Dollar interest
|
(
|
(
|
|
|
|
Changes in Israeli Shekel interest
|
|
|
(
|
(
|
|
As of December 31, 2021
|
||||
|
Carrying amount
(fair value) |
Stated
amount
|
Maturity date
|
Interest rate
range
|
|
|
$ millions
|
$ millions
|
Years
|
%
|
|
|
U.S. Dollar
|
||||
|
SWAP contracts from variable interest to fixed interest
|
(
|
|
|
|
|
Israeli Shekel
|
||||
|
SWAP contracts from fixed ILS interest to fixed USD interest
|
|
|
|
|
|
As of December 31, 2020
|
||||
|
Carrying amount
(fair value) |
Stated
amount
|
Maturity date
|
Interest rate
range
|
|
|
$ millions
|
$ millions
|
Years
|
%
|
|
|
U.S. Dollar
|
||||
|
SWAP contracts from variable interest to fixed interest
|
(
|
|
|
|
|
Israeli Shekel
|
||||
|
SWAP contracts from fixed ILS interest to fixed USD interest
|
|
|
|
|
|
GBP |
||||
|
SWAP contracts from variable USD interest to fixed GBP interest. |
|
|
|
|
|
Euro
|
||||
|
SWAP contracts from variable USD interest to fixed EUR interest
|
(
|
|
|
|
Note 21 - Financial Instruments and Risk Management (cont'd)
|
As of December 31
|
||
|
Impact on profit (loss)
|
||
|
2021
|
2020
|
|
|
$ millions
|
$ millions
|
|
|
Non-derivative financial instruments
|
||
|
U.S. Dollar/Euro
|
(
|
(
|
|
U.S. Dollar/Israeli Shekel
|
|
|
|
U.S. Dollar/British Pound
|
(
|
|
|
U.S. Dollar/Chinese Yuan
|
|
(
|
|
U.S. Dollar/Turkey Lira
|
|
(
|
(a) Sensitivity analysis (cont'd)
|
As of December 31, 2021
|
||||
|
Increase 10%
|
Increase 5%
|
Decrease 5%
|
Decrease 10%
|
|
|
$ millions
|
$ millions
|
$ millions
|
$ millions
|
|
|
U.S. Dollar/Israeli Shekel
|
||||
|
Forward transactions
|
(
|
(
|
|
|
|
Options
|
(
|
(
|
|
|
|
SWAP
|
(
|
(
|
|
|
|
Euro/ U.S. Dollar |
||||
|
Forward transactions
|
|
|
(
|
(
|
|
Options
|
|
|
(
|
(
|
|
U.S Dollar/RMB |
||||
|
Forward transactions
|
(
|
(
|
|
|
|
As of December 31, 2021
|
|||
|
Carrying amount
|
Stated amount
|
Average
|
|
|
$ millions
|
$ millions
|
exchange rate |
|
|
Forward contracts
|
|||
|
U.S. Dollar/Israeli Shekel
|
|
|
|
|
Euro/U.S. Dollar
|
|
|
|
|
U.S Dollar/Brazilian Real |
(
|
|
|
|
U.S. Dollar/British Pound
|
|
|
|
|
U.S. Dollar/Chinese Yuan Renminbi
|
|
|
|
|
Other
|
|
|
|
|
Currency and interest SWAPs
|
|||
|
U.S. Dollar/Israeli Shekel
|
|
|
|
|
Put options
|
|||
|
U.S. Dollar/Israeli Shekel
|
|
|
|
|
Euro/U.S. Dollar
|
|
|
|
|
U.S. Dollar/Japanese Yen
|
|
|
|
|
U.S. Dollar/British Pound
|
|
|
|
|
Call options
|
|||
|
U.S. Dollar/Israeli Shekel
|
(
|
|
|
|
Euro/U.S. Dollar
|
|
|
|
|
U.S. Dollar/Japanese Yen
|
|
|
|
|
U.S. Dollar/British Pound
|
|
|
|
|
As of December 31, 2020
|
|||
|
Carrying amount
|
Stated amount
|
Average
|
|
|
$ millions
|
$ millions
|
exchange rate |
|
|
Forward contracts
|
|||
|
U.S. Dollar/Israeli Shekel
|
|
|
|
|
Euro/U.S. Dollar
|
|
|
|
|
U.S. Dollar/British Pound
|
|
|
|
|
U.S. Dollar/Chinese Yuan Renminbi
|
|
|
|
|
Other
|
|
|
|
|
Currency and interest SWAPs
|
|||
|
U.S. Dollar/Israeli Shekel
|
|
|
|
|
Euro/U.S. Dollar
|
(
|
|
|
|
U.S. Dollar/British Pound
|
|
|
|
|
Put options
|
|||
|
U.S. Dollar/Israeli Shekel
|
|
|
|
|
Euro/U.S. Dollar
|
|
|
|
|
U.S. Dollar/Japanese Yen
|
|
|
|
|
U.S. Dollar/British Pound
|
|
|
|
|
Call options
|
|||
|
U.S. Dollar/Israeli Shekel
|
(
|
|
|
|
Euro/U.S. Dollar
|
(
|
|
|
|
U.S. Dollar/Japanese Yen
|
|
|
|
|
U.S. Dollar/British Pound
|
|
|
|
|
As of December 31, 2021
|
||||||||
|
US Dollar
|
Euro
|
British Pound
|
Israeli Shekel
|
Brazilian Real
|
Chinese Yuan Renminbi
|
Other
|
Total
|
|
|
Non-derivative instruments:
|
||||||||
|
Cash and cash equivalents
|
|
|
|
|
|
|
|
|
|
Short term investments and deposits
|
|
|
|
|
|
|
|
|
|
Trade receivables
|
|
|
|
|
|
|
|
|
|
Other receivables
|
|
|
|
|
|
|
|
|
|
Other non-current assets
|
|
|
|
|
|
|
|
|
|
Total financial assets
|
|
|
|
|
|
|
|
|
|
Short-term debt
|
|
|
|
|
|
|
|
|
|
Trade payables
|
|
|
|
|
|
|
|
|
|
Other current liabilities
|
|
|
|
|
|
|
|
|
|
Long term debt, debentures and others
|
|
|
|
|
|
|
|
|
|
Other non-current liabilities
|
|
|
|
|
|
|
|
|
|
Total financial liabilities
|
|
|
|
|
|
|
|
|
|
Total non-derivative financial instruments, net
|
(
|
(
|
(
|
(
|
|
|
|
(
|
|
Derivative instruments:
|
||||||||
|
Forward transactions
|
|
|
|
|
|
|
|
|
|
Cylinder
|
|
|
|
|
|
|
|
|
|
SWAPS – U.S. Dollar into Israeli Shekel
|
-
|
-
|
-
|
579
|
-
|
-
|
-
|
579
|
|
Total derivative instruments
|
|
|
|
|
|
|
|
|
|
Net exposure
|
(
|
(
|
|
|
|
|
|
(
|
|
As of December 31, 2020
|
||||||||
|
US Dollar
|
Euro
|
British Pound
|
Israeli Shekel
|
Brazilian Real
|
Chinese Yuan Renminbi
|
Others
|
Total
|
|
|
Non-derivative instruments:
|
||||||||
|
Cash and cash equivalents
|
|
|
|
|
|
|
|
|
|
Short term investments and deposits
|
|
|
|
|
|
|
|
|
|
Trade receivables
|
|
|
|
|
|
|
|
|
|
Other receivables
|
|
|
|
|
|
|
|
|
|
Investments at fair value through other comprehensive income
|
|
|
|
|
|
|
|
|
|
Other non-current assets
|
|
|
|
|
|
|
|
|
|
Total financial assets
|
|
|
|
|
|
|
|
|
|
Short-term debt
|
|
|
|
|
|
|
|
|
|
Trade payables
|
|
|
|
|
|
|
|
|
|
Other current liabilities
|
|
|
|
|
|
|
|
|
|
Long term debt, debentures and others
|
|
|
|
|
|
|
|
|
|
Other non-current liabilities
|
|
|
|
|
|
|
|
|
|
Total financial liabilities
|
|
|
|
|
|
|
|
|
|
Total non-derivative financial instruments, net
|
(
|
(
|
(
|
(
|
|
|
|
(
|
|
Derivative instruments:
|
||||||||
|
Forward transactions
|
|
|
|
|
|
|
|
|
|
Cylinder
|
|
|
|
|
|
|
|
|
|
SWAPS – U.S. Dollar into Israeli Shekel
|
|
|
|
|
|
|
|
|
|
SWAPS – U.S. Dollar into Euro
|
|
|
|
|
|
|
|
|
|
SWAPS – U.S. Dollar into British Pound |
|
|
|
|
|
|
|
|
|
Total derivative instruments
|
|
|
|
|
|
|
|
|
|
Net exposure
|
(
|
|
|
|
|
|
|
(
|
|
As of December 31, 2021
|
As of December 31, 2020
|
|||
|
Carrying amount
|
Fair value
|
Carrying amount
|
Fair value
|
|
|
$ millions
|
$ millions
|
$ millions
|
$ millions
|
|
|
Loans bearing fixed interest (1)
|
|
|
|
|
|
Debentures bearing fixed interest
|
||||
|
Marketable (2)
|
|
|
|
|
|
Non-marketable (3)
|
|
|
|
|
|
|
|
|
|
| (1 ) |
The fair value of the Shekel, Euro, Brazilian Real and Yuan loans issued bearing fixed interest is based on calculation of the present value of the cash flows in respect of the principal and the interest and is discounted at the market interest rates on the measurement date for similar loans having similar characteristics and is classified as Level 2 in the fair value hierarchy. The average discount interest as of December 31, 2021, for the Shekel, Euro Brazilian Real and Yuan loans was
|
| (2) |
The fair value of the marketable debentures is based on the quoted stock exchange price and is classified as Level 1 in the fair value hierarchy.
|
| (3) |
The
fair value of the non‑marketable debentures is based on calculation of the present value of the cash flows in respect of the principal and the interest and is discounted at the Libor rate customary in the market for similar loans having similar characteristics and is classified as Level 2 in the fair value hierarchy. The average discount interest as of December 31, 2021, was
|
|
Level 1
|
As of December 31, 2021
|
As of December 31, 2020
|
|
$ millions
|
$ millions
|
|
Investments at fair value through other comprehensive income
|
|
|
|
Level 2
|
As of December 31, 2021
|
As of December 31, 2020
|
|
$ millions
|
$ millions
|
|
Derivatives designated as economic hedge, net
|
|
(
|
|
Derivatives designated as cash flow hedge, net
|
|
|
|
|
|
|
For the year ended December 31
|
|||
|
2021
|
2020
|
2019
|
|
|
$ millions
|
$ millions
|
$ millions
|
|
|
Earnings attributed to the shareholders of the Company
|
|
|
|
|
Weighted-average number of ordinary shares in thousands:
|
|||
|
For the year ended December 31
|
|||
|
2021
|
2020
|
2019
|
|
|
Shares thousands
|
Shares thousands
|
Shares thousands
|
|
|
Balance as of January 1
|
|
|
|
|
Shares issued during the year
|
|
|
|
|
Shares vested
|
|
|
|
|
Weighted average number of ordinary shares used in computation of the basic earnings per share
|
|
|
|
|
For the year ended December 31
|
|||
|
2021
|
2020
|
2019
|
|
|
Shares thousands
|
Shares thousands
|
Shares thousands
|
|
|
Weighted average number of ordinary shares used in the computation of the basic earnings per share
|
|
|
|
|
Effect of stock options and restricted shares*
|
|
|
|
|
Weighted average number of ordinary shares used in the computation of the diluted earnings per share
|
|
|
|
| A. |
Parent company and subsidiaries
|
| A. |
Parent company and subsidiaries (cont'd)
|
| B. |
Benefits to key management personnel (including directors)
|
|
For the year ended December 31
|
||
|
2021
|
2020
|
|
|
$ millions
|
$ millions
|
|
|
Short-term benefits
|
|
|
|
Post-employment benefits
|
|
|
|
Share-based payments
|
|
|
|
Total *
|
|
|
|
* To interested parties employed by the Company
|
|
|
|
* To interested parties not employed by the Company
|
|
|
| C. |
Ordinary transactions that are not exceptional (cont'd)
|
|
For the year ended December 31
|
|||
|
2021
|
2020
|
2019
|
|
|
$ millions
|
$ millions
|
$ millions
|
|
|
Sales
|
|
|
|
|
Cost of sales
|
|
|
|
|
Selling, transport and marketing expenses
|
|
|
|
|
Financing expenses (income), net
|
(
|
(
|
(
|
|
General and administrative expenses
|
|
|
|
|
Management fees to the parent company
|
|
|
|
| (1) |
On November 9, 2020, and November 11, 2020, our Audit and Accounting Committee and Board of Directors, respectively, approved, and on January 5, 2021, our general meeting of shareholders approved, the renewal of the management services agreement between the Company and Israel Corp. effective retroactively as of January 1, 2021, for an additional term of
|
| (2) |
On January 30, 2020, our shareholders approved a new
-year framework transaction for the Company's engagement in directors' and officers' liability insurance policies, starting February 1, 2020 (the "New Framework Transaction"). The insurance policies under the New Framework Transaction shall include a joint primary tier with Israel Corp. with a joint liability cap of up to $
|
Our directors and officers are beneficiaries of both
tiers. Pursuant to the New Framework Agreement, the cost of the annual premium shall not exceed a cap of $
| (3) |
In December 2017, the Company, Oil Refineries Ltd. (a public company controlled by Israel Corp.) and OPC Energy Ltd. (a public company that is controlled indirectly by one of the Company’s controlling shareholders) signed individual agreements with Energean PLC for the supply of natural gas. Under the agreement between the Company and Energean, the Company will be entitled to acquire up to
|
| D. |
Transactions with related and interested parties (cont'd) |
| (4) |
In October 2020, the Company and Oil Refineries Ltd. signed individual bridge supply agreements with Tamar Reservoir for the supply of natural gas, following a process of joint negotiations with the supplier and the approval of ICL's general meeting of shareholders. For further information see Note 18.
|
|
As of December 31
|
||
|
2021
|
2020
|
|
|
$ millions
|
$ millions
|
|
|
Other current assets
|
|
|
|
Other current liabilities
|
|
|
|
|
|
Ownership interest in its subsidiary and investee companies for the year ended December 31
|
|
|
Name of company
|
Principal location of the company’s activity
|
2021
|
2020
|
|
|
|
|
|
|
|
|
|
|
|
|
|
|
|
|
|
|
|
|
|
|
|
|
|
|
|
|
|
|
|
|
|
|
|
|
|
|
|
|
|
|
|
|
|
|
|
|
|
|
|
|
|
|
|
|
|
|
|
|
|
|
|
|
|
|
|
|
|
|
|
|
|
|
|
|
|
|
|
|
|
|
|
|
|
|
|
|
|
|
|
|
|
|
|
|
|
|
|
|
|
|
|
|
|
|
|
|
|
|
|
|
|
|
|
|
|
|
|
|
|
|
|
|
|
|
|
|
|
|
|
|
|
|
|
|
|
|
|
|
|
|
|
|
|
|
|
|
|
|
|
|
|
|
|
|
|
|
|
|
|
|
|
|
|
|
|
|
|
|
|
|
|
|
|