INTERDIGITAL, INC.
10-Ks and 10-Qs
|
|
|
|
|
|
|
|
|
|
|
|
|
|
|
|
|
|
|
|
|
|
|
|
|
|
|
|
|
|
|
|
|
|
|
|
|
|
|
|
|
|
|
|
|
|
|
|
|
|
|
|
|
|
|
|
UNITED STATES SECURITIES AND EXCHANGE COMMISSION
Washington, DC 20549
Form 10-K
|
þ
|
|
ANNUAL REPORT PURSUANT TO SECTION 13 OR 15(d) OF THE SECURITIES EXCHANGE ACT OF 1934
|
|
|
|
For the fiscal year ended December 31, 2012
|
|
OR
|
||
|
o
|
|
TRANSITION REPORT PURSUANT TO SECTION 13 OR 15(d) OF THE SECURITIES EXCHANGE ACT OF 1934
|
|
|
|
For the transition period from to
|
Commission file number 1-33579
INTERDIGITAL, INC.
(Exact name of registrant as specified in its charter)
|
Pennsylvania
|
|
23-1882087
|
|
(State or other jurisdiction of incorporation or organization)
|
|
(IRS Employer Identification No.)
|
|
200 Bellevue Parkway, Suite 300
Wilmington, Delaware
|
|
19809
(Zip Code)
|
|
(Address of principal executive offices)
|
|
|
Registrant’s telephone number, including area code (302) 281-3600
_____________________________________________
Securities registered pursuant to Section 12(b) of the Act:
|
Common Stock (par value $0.01 per share)
(title of class)
|
|
NASDAQ
(name of exchange on which registered)
|
Securities registered pursuant to Section 12(g) of the Act: None
_____________________________________________
Indicate by check mark if the registrant is a well-known seasoned issuer, as defined in Rule 405 of the Securities Act. Yes
þ
No
o
Indicate by check mark if the registrant is not required to file reports pursuant to Section 13 or Section 15(d) of the Act. Yes
o
No
þ
Indicate by check mark whether the registrant (1) has filed all reports required to be filed by Section 13 or 15(d) of the Securities Exchange Act of 1934 during the preceding 12 months (or for such shorter period that the registrant was required to file such reports), and (2) has been subject to such filing requirements for the past 90 days. Yes
þ
No
o
Indicate by check mark whether the registrant has submitted electronically and posted on its corporate Web site, if any, every Interactive Data File required to be submitted and posted pursuant to Rule 405 of Regulation S-T (§ 232.405 of this chapter) during the preceding 12 months (or for such shorter period that the registrant was required to submit and post such files). Yes
þ
No
o
Indicate by check mark if disclosure of delinquent filers pursuant to Item 405 of Regulation S-K (§ 229.405) is not contained herein, and will not be contained, to the best of registrant’s knowledge, in definitive proxy or information statements incorporated by reference in Part III of this Form 10-K or any amendment to this Form 10-K.
þ
Indicate by check mark whether the registrant is a large accelerated filer, an accelerated filer, a non-accelerated filer, or a smaller reporting company. See the definitions of “large accelerated filer,” “accelerated filer” and “smaller reporting company” in Rule 12b-2 of the Exchange Act. (Check one):
|
Large accelerated filer
þ
|
|
Accelerated filer
o
|
|
Non-accelerated filer
o
|
|
Smaller reporting company
o
|
|
|
|
(Do not check if a smaller reporting company)
|
||||
Indicate by check mark whether the registrant is a shell company (as defined in Rule 12b-2 of the Act). Yes
o
No
þ
The aggregate market value of the voting and non-voting common equity held by non-affiliates computed by reference to the price at which the common equity was last sold, or the average bid and asked price of such common equity, as of the last business day of the registrant’s most recently completed second fiscal quarter:
$1,267,153,587
as of June 30,
2012
.
The number of shares outstanding of the registrant’s common stock was
41,144,187
as of February 22, 2013.
DOCUMENTS INCORPORATED BY REFERENCE
Portions of the registrant's definitive proxy statement to be filed pursuant to Regulation 14A in connection with the registrant's 2012 annual meeting of shareholders are incorporated by reference into Items 10, 11, 12, 13 and 14 of Part III of this Form 10-K.
TABLE OF CONTENTS
|
|
Page
|
|
ITEM 4.
MINE SAFETY DISCLOSURES
|
|
|
EXHIBIT 10.4
|
|
|
EXHIBIT 10.5
|
|
|
EXHIBIT 21
|
|
|
EXHIBIT 23.1
|
|
|
EXHIBIT 31.1
|
|
|
EXHIBIT 31.2
|
|
|
EXHIBIT 32.1
|
|
|
EXHIBIT 32.2
|
|
2
|
Item 1.
|
BUSINESS.
|
Overview
InterDigital designs and develops advanced technologies that enable and enhance wireless communications and capabilities. Since our founding in 1972, we have designed and developed a wide range of innovations that are used in digital cellular and wireless products and networks, including 2G, 3G, 4G and IEEE 802-related products and networks. We are a leading contributor of intellectual property to the wireless communications industry.
Given our long history and focus on advanced research and development, InterDigital has amassed one of the most significant patent portfolios in the wireless industry. As of December 31, 2012, InterDigital's wholly owned subsidiaries held a portfolio of over 19,000 patents and patent applications related to the fundamental technologies that enable wireless communications. In that portfolio are a number of patents and patent applications that we believe are or may be essential or may become essential to cellular and other wireless standards, including the 2G, 3G, 4G and the IEEE 802 suite of standards. That portfolio has largely been built through internal development, supplemented by joint development projects with other companies as well as select patent acquisitions. Products incorporating our patented inventions include: mobile devices, such as cellular phones, tablets, notebook computers and wireless personal digital assistants; wireless infrastructure equipment, such as base stations; and components, dongles and modules for wireless devices.
InterDigital derives revenues primarily from patent licensing and sales, technology solutions licensing and sales and engineering services. In 2012, InterDigital generated revenues of
$663.1 million
, an increase of
$361.4 million
, or
120%
, from 2011. Additional information about our revenues, profits and assets, as well as additional financial data, is provided in the selected financial data in Part II, Item 6, and in the financial statements and accompanying Notes in Part II, Item 8, of this Form 10-K.
Our Strategy
Our objective is to continue to be a leading designer and developer of technology solutions and intellectual property for the wireless industry and to monetize those solutions and intellectual property through a combination of licensing, sales and other revenue opportunities.
To execute our strategy, we intend to:
|
•
|
Develop and source innovative technologies related to wireless.
We intend to maintain a leading position in advanced wireless technology, by leveraging our expertise in digital cellular and wireless products to guide internal research and development capabilities and direct our efforts in partnering with leading inventors and partnering with industry players to source new technologies.
|
|
•
|
Establish and grow our patent-based revenue base.
We intend to grow our licensing revenue base by adding licensees, expanding into adjacent technology areas that align with our intellectual property position and leveraging the continued growth of the overall mobile technology market. Those licensing efforts can be self-driven or executed in conjunction with licensing partnerships and other efforts, and may involve the vigorous defense of our intellectual property through litigation and other means. We also believe that the size and growth of our patent portfolio enable us to sell patent assets that are not essential to our core licensing programs as a sustainable revenue stream, as well as to execute patent exchanges that can strengthen our overall portfolio.
|
|
•
|
Maintain a collaborative relationship with key industry players and worldwide standards bodies.
We intend to continue contributing to the ongoing process of defining wireless standards and other industry-wide efforts, and incorporating our inventions into those technology areas. Those efforts, and the knowledge gained through them, underpin internal development efforts and also help guide technology and intellectual property sourcing through partners and other external sources.
|
Strategic Alternatives Review and Expansion of Business Strategy
On July 19, 2011, we announced that our Board of Directors had initiated a process to explore and evaluate potential strategic alternatives for the company, including a sale or other transaction. On January 23, 2012, we announced that our Board of Directors had concluded its review of strategic alternatives for the company and determined that it was in the best interests of the company and its shareholders to execute on the company's business plan and to expand the plan to include patent sales and patent licensing partnerships as additional vehicles to generate revenue. On October 23, 2012, we announced a further
3
expansion of our business strategy by enhancing our technology sourcing and establishing a business unit, InterDigital Solutions, dedicated to monetizing the company's market-ready technologies and research capabilities.
Technology Research and Development
As an early participant in the digital wireless market, InterDigital developed pioneering solutions for the primary cellular air interface technologies in use today, TDMA and CDMA. That early involvement, our continued development of those advanced digital wireless technologies and innovations in OFDM/OFDMA and MIMO technologies have enabled us to create our significant worldwide portfolio of patents. In conjunction with our participation in certain standards bodies, we have filed declarations stating that we have patents that we believe are or may be essential or may become essential to cellular and other wireless standards and that we agree to make such patents available for use and license on fair, reasonable and non-discriminatory terms or similar terms consistent with the requirements of the respective standards organizations.
Our capabilities in the development of advanced digital wireless technologies are based on the efforts of a highly specialized engineering team, leveraging leading-edge equipment and software platforms. As of December 31, 2012, we employed approximately 172 engineers, 43% of whom hold advanced degrees and 27% of whom hold doctorate degrees. Over the last three years, investment in development has ranged from $63.8 million to $71.5 million, and the largest portion of this expense has been personnel costs. Additional information about our development expenses is provided in the results of operations, under the heading "Operating Expenses" in Part II, Item 7, of this Form 10-K.
On October 23, 2012, we announced an enhancement to our technology sourcing strategy. The company's internal, self-funded research and development efforts were centralized under Innovation Labs, a unit that will continue to pursue research into the ever-broadening field of mobile communications. In addition, we announced the formation of Innovation Partners, a new external sourcing model based around partnerships with leading inventors and research organizations, as well as the acquisition of technology and patent portfolios that align with InterDigital's roadmap. Finally, the company announced the formation of InterDigital Solutions, with a partial mandate of securing engineering services engagements that could supplement core internal research and development.
As of December 31, 2012, our patent portfolio consisted of approximately 1,500 U.S. patents (approximately 190 of which were issued in 2012) and approximately 8,800 non-U.S. patents (approximately 1,200 of which were issued in 2012). As of the same date, we also had numerous patent applications pending worldwide, with approximately 1,200 pending applications in the United States and approximately 7,900 pending non-U.S. applications. The patents and applications comprising our portfolio relate predominantly to digital wireless radiotelephony technology (including, without limitation, 2G, 3G and 4G technologies). Issued patents expire at differing times ranging from 2013 through 2031.
Our current research efforts are focused on technology solutions to solve the industry's challenge of providing enough bandwidth for handsets and various other connected devices, such as tablets and laptops. We have taken a broad approach to solve these challenges, which includes air interface enhancements, policy-driven bandwidth management, cognitive radio and intelligent and optimized data delivery. We are developing technologies that will enable efficient multimedia content delivery across heterogeneous devices and networks, to enable richer multimedia experience with optimal data usage and radio network efficiency. From an air interface perspective, we are creating evolved system architectures that enable operation in small cells and additional frequency bands, improved cell-edge performance as well as device-to-device communications. These solutions provide interference mitigation across cells, uniform coverage and significantly improved data rates, system capacity and energy efficiency. We are also developing technologies that will optimize use of the current network resources by dynamically allocating and aggregating bandwidth across different networks and spectrum bands. With the goal of reducing the looming bandwidth supply/demand gap in mobile networks, our technologies will enable the aggregation, segregation and offload of traffic.
In the field of machine-to-machine (M2M) applications, we are developing technologies to enable seamless interconnection for multiple access types (cellular, WLAN, WPAN) and M2M service frameworks that can be managed by an operator and leveraged by a diverse set of vertical applications.
InterDigital’s Technology Position
Cellular Technologies
We have a long history of developing cellular technologies, including those related to CDMA and TDMA and, more recently, OFDM/OFDMA and MIMO. A number of our TDMA-based and CDMA-based inventions are being used in all 2G, 2.5G and 3G wireless networks and mobile terminal devices.
We led the industry in establishing TDMA-based TIA/EIA-54 as a digital wireless U.S. standard in the 1980s. We developed a substantial portfolio of TDMA-based patented inventions. These inventions include or relate to
4
fundamental elements of TDMA-based systems in use around the world. Some of our TDMA inventions include or relate to:
|
•
|
The fundamental architecture of commercial TD/FDMA systems;
|
|
•
|
Methods of synchronizing TD/FDMA systems;
|
|
•
|
A flexible approach to managing system capacity through the reassignment of online subscriber units to different time slots and/or frequencies in response to system conditions;
|
|
•
|
The design of a multi-component base station, utilizing distributed intelligence, which allows for more robust performance; and
|
|
•
|
Initializing procedures that enable roaming.
|
We have also developed and patented innovative CDMA technology solutions. Today, we hold a significant worldwide portfolio of CDMA patents and patent applications. Similar to our TDMA inventions, we believe that a number of our CDMA inventions are or may be essential or may become essential to the implementation of CDMA systems in use today. Some of our CDMA inventions include or relate to:
|
•
|
Global pilot:
The use of a common pilot channel to synchronize sub-channels in a multiple access environment;
|
|
•
|
Bandwidth allocation:
Techniques including multi-channel and multi-code mechanisms;
|
|
•
|
Power control:
Highly efficient schemes for controlling the transmission output power of terminal and base station devices, a vital feature in a CDMA system;
|
|
•
|
Joint detection and interference cancellation techniques for reducing interference;
|
|
•
|
Soft handover enhancement techniques between designated cells;
|
|
•
|
Various sub-channel access and coding techniques;
|
|
•
|
Packet data;
|
|
•
|
Fast handoff;
|
|
•
|
Geo-location for calculating the position of terminal users;
|
|
•
|
Multi-user detection;
|
|
•
|
High-speed packet data channel coding; and
|
|
•
|
High-speed packet data delivery in a mobile environment, including enhanced uplink.
|
The cellular industry has ongoing initiatives aimed at technology improvements. We have engineering development projects to build and enhance our technology portfolio in many of these areas, including the LTE and LTE-Advanced projects for 3GPP radio technology, further evolution of the 3GPP WCDMA Standard (including HSPA+) and continuing improvements to the legacy GSM-EDGE Radio Access Network. The common goal is to improve the user experience and reduce the cost to operators via increased capacity, reduced cost per bit, increased data rates, improved cell-edge or coverage solutions and reduced latency. Of the above technologies, LTE is the most advanced in that it uses the newer OFDMA/MIMO. Some of our LTE inventions include or relate to:
|
•
|
MIMO technologies for reducing interference and increasing data rates;
|
|
•
|
OFDM/OFDMA/SC-FDMA;
|
|
•
|
Power control;
|
|
•
|
Hybrid-ARQ for fast error correction;
|
|
•
|
Discontinuous reception for improved battery life;
|
|
•
|
Control channel structures for efficient signaling;
|
|
•
|
Advanced resource scheduling/allocation (bandwidth on-demand);
|
|
•
|
Security;
|
|
•
|
Home Node-B (femto cells);
|
|
•
|
Relay communications for improved cell-edge performance;
|
5
|
•
|
LTE receiver implementations;
|
|
•
|
Carrier aggregation for LTE-Advanced;
|
|
•
|
Multi-carrier HSDPA;
|
|
•
|
Coordinated Multi-Point Communications for LTE-Advanced; and
|
|
•
|
Machine Type Communications (“MTC”).
|
Other Wireless Technologies
Our strong wireless background includes engineering and corporate development activities that focus on solutions that apply to other wireless market segments. These segments primarily fall within the continually expanding scope of the IEEE 802, IETF and ETSI standards. We are building a portfolio of technology related to WLAN, Wi-Fi, WMAN and the digital cellular area that includes, for example, improvements to the IEEE 802.11 PHY and MAC to increase peak data rates (i.e., IEEE 802.11n, 802.11ac, 802.11ad and future variants), handover among radio access technologies (IEEE 802.21), mesh networks (IEEE 802.11s), radio resource measurements (IEEE 802.11k), wireless network management (IEEE 802.11v), wireless network security and broadband wireless (IEEE 802.16, including WiMAX wireless technology). We are actively developing technology for newer Wi-Fi and WLAN standards focused on fast initial link setup (802.11ai), hotspot operation (WFA HOTSPOT 2.0) and the use of additional spectrum bands, such as TV-Whitespace (802.11af) and sub 1 GHz (802.11ah). We also are expanding our portfolio of technologies in areas such as M2M or MTC, mobility, spectrum management and session continuity within ETSI and IETF. In addition, we have commenced development of a portfolio related to improved video delivery, including solutions related to the ITU-T HEVC standards.
Patent-Based Revenue
We believe that companies making, importing, using or selling products compliant with the standards covered by our patent portfolio, including all manufacturers of mobile handsets, tablets and other devices, require a license under our patents and will require licenses under patents that may issue from our pending patent applications. As of the end of 2012, our licensing efforts had resulted in agreements with companies representing 63% of worldwide 3G device shipments, with an additional 22% of that market the subject of pending litigation. In 2012, we began the process of securing licensing agreements with companies shipping 4G products. We have successfully entered into licensing agreements with many of the leading mobile communications companies globally, including Apple Inc., HTC Corporation, BlackBerry and Samsung Electronics Co., Ltd., among others.
Most of our patent license agreements are structured on a royalty-bearing basis, while others are structured on a paid-up basis or a combination thereof. Upon entering into a new patent license agreement, the licensee typically agrees to pay consideration for sales made prior to the effective date of the license agreement (i.e., past sales) and also agrees to pay royalties or license fees on licensed products sold during the term of the agreement. We expect that, for the most part, new license agreements will follow this model. Almost all of our patent license agreements provide for the payment of royalties based on sales of licensed products designed to operate in accordance with particular standards (convenience-based licenses), as opposed to the payment of royalties if the manufacture, sale or use of the licensed product infringes one of our patents (infringement-based licenses).
In most cases, we recognize the revenue from per-unit royalties in the period when we receive royalty reports from licensees. In circumstances where we receive consideration for past sales, we recognize such payments as revenue in the period in which the patent license agreement is signed. Some of these patent license agreements provide for the non-refundable prepayment of royalties that are usually made in exchange for prepayment discounts. As the licensee reports sales of covered products, the royalties are calculated and either applied against any prepayment or become payable in cash or other consideration. Additionally, royalties on sales of licensed products under the license agreement become payable or applied against prepayments based on the royalty formula applicable to the particular license agreement. These formulas include flat dollar rates per unit, a percentage of sales, a percentage of sales with a per-unit cap and other similar measures. The formulas can also vary by other factors, including territory, covered standards, quantity and dates sold.
Some of our patent licenses are paid up, requiring no additional payments relating to designated sales under agreed upon conditions. Those conditions can include paid-up licenses for a period of time, for a class of products, for a number of products sold, under certain patents or patent claims, for sales in certain countries or a combination thereof. Licenses have become paid-up based on the payment of fixed amounts or after the payment of royalties for a term. With the exception of amounts allocated to past sales, we recognize revenues related to fixed amounts on a straight-line basis. Our license agreements typically contain provisions that give us the right to audit our licensees' books and records to ensure compliance with the licensees' reporting and payment obligations under those agreements. From time to time, these audits reveal underreporting or
6
underpayments under the applicable agreements. In such cases, we seek payment for the amount owed and enter into negotiations with the licensee to resolve the discrepancy.
On January 23, 2012, we announced that the company would be adding targeted sales of portions of its large and growing patent portfolio as a revenue stream. This strategy is based on the expectation that the company's portfolio and its growth rate extend well beyond the requirements for a successful licensing program. In addition, the strategy leverages the desire from new entrants in the mobile technology space to build strong intellectual property positions to support their businesses.
In 2012, we executed two patent sales for total revenues of
$384.0 million
. The major part of those revenues included a $375.0 million patent transaction with Intel Corporation, involving approximately 1,700 patents and applications related to 3G, LTE and 802.11 technologies. The transaction represented approximately 8% of InterDigital's total portfolio of patents and applications at the time.
Other Potential Revenue Sources
The company's strong technology expertise and research and development team also form the basis for other potential revenue opportunities, focused around such areas as engineering services, research joint ventures and the continued development, commercialization and licensing of research and development projects that have progressed to a pre-commercial or commercial phase.
On October 23, 2012, the company announced the formation of InterDigital Solutions. This unit is focused on commercializing market-ready technologies. These include: the company's Smart Access Manager, a standards-based bandwidth management solution for operators, infrastructure companies and device manufacturers, M2M communications technology; and other advanced technologies. InterDigital Solutions' mission adds a component to leverage InterDigital's technology and team to engage in strategic engineering services engagements that supplement the company's core research while acting as new sources of revenue.
During 2012, InterDigital completed the formation of a joint venture with Sony Corporation of America. Called Convida Wireless, the joint venture combines InterDigital's advanced M2M research capabilities with Sony's consumer electronics expertise. The agreement also includes a patent license from InterDigital for Sony's sale of 3G and 4G products. The formation of Convida Wireless will provide an outlet for driving new research in the growing M2M wireless communications field.
Wireless Communications Industry Overview
The wireless communications industry continues to experience rapid growth worldwide, as well as an expansion of device types entering the market. IHS iSuppli estimates that just over 1.5 billion handsets and tablets alone were shipped in 2012—a number that is expected to grow to more than 2 billion devices yearly in 2016 (source: IHS iSuppli, Market Data Tracker, 2012). In addition, the rate of uptake of the latest 4G technologies has been very rapid, with global LTE subscriber growth increasing 334% in 2012 over 2011 (
IHS iSuppli Consumer and Communications Market Tracker Report, August 2012
).
7
Global Mobile Device Shipments
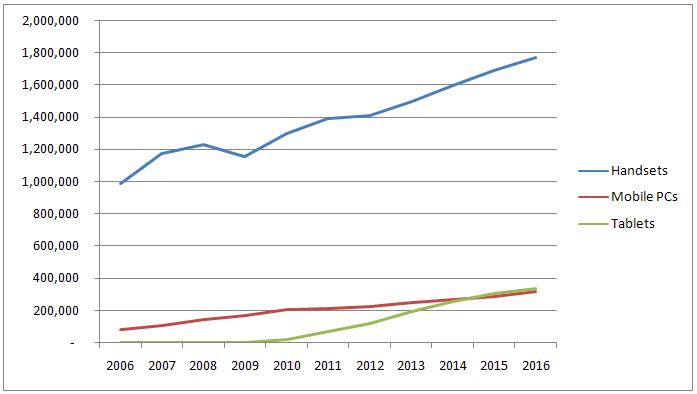
Worldwide shipments of mobile handsets, PCs and tablets, 2006-2016 ('000s). Source: IHS iSuppli Connected Devices Database, Q3 2012.
Global LTE Handset Shipments
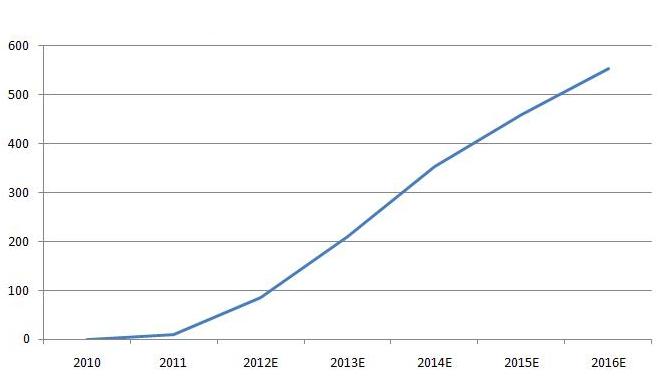
Worldwide shipments of LTE handsets, 2010-2016 ('000s). Source: IHS iSuppli Design Forecast - Mobile Handsets, H2 2012.
To achieve economies of scale and support interoperability among different participants, products for the wireless industry have typically been designed to operate in accordance with certain standards. Wireless communications standards are formal guidelines for engineers, designers, manufacturers and service providers that regulate and define the use of the radio frequency spectrum in conjunction with providing detailed specifications for wireless communications products. A primary goal of the standards is to ensure interoperability of products marketed by multiple companies. A large number of international and regional wireless Standards Development Organizations (“SDOs”), including the ITU, ETSI, TIA (USA), IEEE, ATIS (USA), TTA (Korea), ARIB (Japan) and ANSI, have responsibility for the development and administration of wireless
8
communications standards. New standards are typically adopted with each new generation of products, are often compatible with previous generations and are defined to ensure equipment interoperability and regulatory compliance.
Standards have evolved in response to consumer demand for services and expanded capabilities of mobile devices. Cellular standards have evolved from voice-oriented services to multimedia services that exploit the higher speeds offered by newer technologies, such as 3G or, most recently, LTE (Long Term Evolution). The wireless communications industry has also made significant advances in non-cellular wireless technologies. In particular, IEEE 802.11 WLAN has gained momentum in recent years as a wireless broadband solution in the home, office and select public areas. IEEE 802.11 technology offers high-speed data connectivity through unlicensed spectra within a relatively modest operating range. The IEEE wireless standards bodies are creating sets of standards to enable higher data rates, provide coverage over longer distances, enable roaming and integrate more fully with cellular networks.
SDOs typically ask participating companies to declare formally whether they believe they hold patents or patent applications essential to a particular standard and whether they are willing to license those patents on either a royalty-bearing basis on fair, reasonable and nondiscriminatory terms or on a royalty-free basis. To manufacture, have made, sell, offer to sell or use such products on a non-infringing basis, a manufacturer or other entity doing so must first obtain a license from the holder of essential patent rights. The SDOs do not have enforcement authority against entities that fail to obtain required licenses, nor do they have the ability to protect the intellectual property rights of holders of essential patents.
InterDigital often publicly characterizes its business, including license agreements and development projects, as pertaining to standards generally characterized as 2G, 3G and/or 4G. In doing this, we generally rely on the positions of the applicable standards-setting organizations in defining the relevant standards. However, the definitions may evolve or change over time, including after we have characterized certain transactions.
Business Activities
2012 Patent Sales
On June 18, 2012, we announced that certain of our subsidiaries had entered into a definitive agreement to sell approximately 1,700 patents and patent applications, including approximately 160 issued U.S. patents and approximately 40 U.S. patent applications, to Intel Corporation for $375.0 million. The sale agreement involved patents primarily related to 3G, LTE and 802.11 technologies. Upon completion of the transaction in third quarter 2012, we recognized $375.0 million as patent sales revenue and $15.6 million as patent sales expense, which was recorded within the patent administration and licensing line on our Consolidated Statements of Income. Included in the patent sales expense was the remaining net book value of the patents sold, as well as commissions and legal and accounting services fees paid in conjunction with the sale.
We intend to pursue additional patent sale opportunities as part of our expanded strategy. However, we are unable to predict the timing and magnitude of any such sales due to the unpredictable nature of the sales cycle for such transactions.
2012
Patent Licensing Activity
I
n first quarter 2012, we entered into a worldwide, non-exclusive, royalty-bearing patent license agreement with u-blox AG, headquartered in Switzerland. The agreement covers various products, including wireless modules for consumer electronics and M2M devices which are designed to operate in accordance with 2G, 3G and 4G wireless technologies, including LTE and LTE-Advanced. U-blox is a leading fabless semiconductor provider of embedded position and wireless communications solutions for the consumer, industrial and automotive markets.
Also in first quarter 2012, we entered into an amendment to our worldwide, non-exclusive, royalty-bearing patent license agreement with Cinterion Wireless Modules GmbH, headquartered in Munich, Germany. This amendment expanded the scope of our existing agreement with Cinterion to include products designed to operate in accordance with 4G wireless technologies, including LTE, LTE-Advanced and WiMax standards, in addition to 2G and 3G wireless technologies. We also expanded the patent license, which previously provided coverage for M2M and PC cards, to cover modules for use in certain consumer electronic devices, such as personal computers, tablets and gaming devices. Cinterion is one of the world's leading suppliers of cellular M2M communication modules.
In first quarter 2012, we also entered into an amendment to our worldwide, non-exclusive, royalty-bearing patent license agreement with Sierra Wireless, Inc. to include a license for products designed to operate in accordance with 4G wireless technologies, including LTE, LTE-Advanced and WiMax. Based in Richmond, Canada, Sierra Wireless is a leading supplier of hardware, software and connected services for mobile lifestyles and M2M communications.
In second quarter 2012, we entered into amendments to our worldwide, non-exclusive, royalty-bearing patent license agreements with each of Acer, Inc. and Pantech Co. Ltd. The license agreements as amended include patent coverage for
9
products not previously covered, including tablets. Both of the original license agreements covered 2G, 3G and 4G technologies when signed in 2009 (Pantech) and 2011 (Acer).
In third quarter 2012, we entered into a worldwide, non-exclusive, royalty-bearing patent license agreement with Wistron Corporation, a Taiwanese corporation. The agreement covers various products, including handsets, wireless modules, computers, tablets and other consumer electronic devices, designed to operate in accordance with 2G, 3G and 4G wireless standards, including LTE and LTE-Advanced. Wistron is a leading original design manufacturer in the laptop market.
In fourth quarter 2012, we entered into agreements that amend the terms of our worldwide, non-exclusive, royalty-bearing patent license agreements with BlackBerry and Quanta Computers, Inc., in each case to add coverage for 4G products, including LTE, LTE-Advanced and WiMax products.
Also in fourth quarter 2012, we entered into a patent license agreement with Sony Corporation of America that covers Sony's sale of 3G and 4G products.
Customers Generating Revenues Exceeding 10% of Total
2012
Revenues
Intel and Samsung comprised approximately
57%
and
15%
of our total
2012
revenues, respectively.
In 2009, we entered into a patent license agreement with Samsung Electronics Co., Ltd. (the “2009 Samsung PLA”) covering Samsung's affiliates, including Samsung Electronics America, Inc. Under the terms of the 2009 Samsung PLA, we granted Samsung a non-exclusive, worldwide, fixed-fee royalty-bearing license covering the sale of single-mode terminal units and infrastructure designed to operate in accordance with TDMA-based 2G standards that became paid-up in 2010 and a non-exclusive, worldwide, fixed-fee royalty-bearing license covering the sale of terminal units and infrastructure designed to operate in accordance with 3G standards through 2012. The 2009 Samsung PLA superseded a binding term sheet signed in November 2008 by such parties and terminated a patent license agreement entered into between us and Samsung in 1996. The 2009 Samsung PLA also ended all litigation and arbitration proceedings then ongoing between the parties. Pursuant to the 2009 Samsung PLA, Samsung paid InterDigital $400.0 million in four equal installments over an 18-month period. Samsung paid the first two $100.0 million installments in 2009. We received the third and fourth $100.0 million installments in January 2010 and July 2010, respectively. We recognized revenue associated with the 2009 Samsung PLA on a straight-line basis over the life of the agreement. During
2012
, we recognized $102.7 million of revenue associated with the 2009 Samsung PLA.
Patent Infringement and Declaratory Judgment Proceedings
From time to time, if we believe any party is required to license our patents in order to manufacture and sell certain products and such party refuses to do so, we may institute legal action against them. This legal action typically takes the form of a patent infringement lawsuit or an administrative proceeding such as a Section 337 proceeding before the United States International Trade Commission (“USITC” or the "Commission"). In a patent infringement lawsuit, we would typically seek damages for past infringement and an injunction against future infringement. In a USITC proceeding, we would seek an exclusion order to bar infringing goods from entry into the United States, as well as a cease and desist order to bar further sales of infringing goods that have already been imported into the United States. The response from the subject party can come in the form of challenges to the validity, enforceability, essentiality and/or applicability of our patents to their products. In addition, a party might file a declaratory judgment action to seek a court's declaration that our patents are invalid, unenforceable, not infringed by the other party's products or are not essential. Our response to such a declaratory judgment action may include claims of infringement. When we include claims of infringement in a patent infringement lawsuit, a favorable ruling for the company can result in the payment of damages for past sales, the setting of a royalty for future sales or issuance by the court of an injunction enjoining the manufacturer from manufacturing and/or selling the infringing product.
Contractual Arbitration Proceedings
We and our customers, in the normal course of business, may have disagreements as to the rights and obligations of the parties under the applicable agreement. For example, we could have a disagreement with a licensee as to the amount of reported sales and royalties. Our license agreements typically provide for audit rights as well as private arbitration as the mechanism for resolving disputes. Arbitration proceedings can be resolved through an award rendered by the arbitrators or by settlement between the parties. Parties to arbitration might have the right to have the award reviewed in a court of competent jurisdiction. However, based on public policy favoring the use of arbitration, it is generally difficult to have arbitration awards vacated or modified. The party securing an arbitration award may seek to have that award converted into a judgment through an enforcement proceeding. The purpose of such a proceeding is to secure a judgment that can be used for, if need be, seizing assets of the other party.
10
Competition
With respect to our technology development activities, we face competition from in-house development teams at other wireless device companies and semiconductor companies and wireless operators that participate in the wireless standards bodies, whose competing solutions could be adopted into the standards instead of the solutions that we set forth into the standards-setting arena.
Due to the exclusionary nature of patent rights, we do not compete, in a traditional sense, with other patent holders for licensing relationships or sale transactions. Other patent holders do not have the same rights to the inventions and technologies encompassed by our patent portfolio. In any device or piece of equipment that contains intellectual property, the manufacturer may need to obtain licenses from multiple holders of intellectual property. In licensing our patent portfolio, we compete with other patent holders for a share of the royalties, which may face practical limitations. We believe that licenses under a number of our patents are required to manufacture and sell 2G, 3G and 4G products. However, numerous companies also claim that they hold 2G, 3G and 4G patents that are or may be essential or may become essential to cellular and other wireless standards. To the extent that multiple parties all seek royalties on the same product, the manufacturers could claim to have difficulty in meeting the financial requirements of each patent holder. In the past, certain manufacturers have sought antitrust exemptions to act collectively on a voluntary basis. In addition, certain manufacturers have sought to limit aggregate licensing fees or rates for essential patents. Similarly, potential purchasers of our patents often amass patent portfolios for defensive and/or cross-licensing purposes and could choose to acquire patent assets within the same general technology space from other patent holders.
In the last several years, intellectual property has emerged as a strategically important asset class and a number of large patent acquisition transactions have taken place. As new participants have entered the wireless communications industry, the market for intellectual property has become increasingly competitive, with many large, well capitalized companies pursuing wireless patent portfolios. As we enhance our technology sourcing by supplementing our internal research and development efforts with acquisitions of intellectual property assets, we compete with such other companies over available wireless assets.
Employees
As of
December 31, 2012
, we had approximately 290 employees. None of our employees are represented by a collective bargaining unit.
Geographic Concentrations
We have one reportable segment. During
2012
, the majority of our revenue was derived from the previously discussed patent sale to Intel, which is headquartered in the United States. The remainder of our
2012
revenue derived from a limited number of licensees based outside of the United States, primarily in Asia. These revenues were paid in U.S. dollars and were not subject to any substantial foreign exchange transaction risk. The table below lists the countries of the headquarters of our licensees and the total revenue derived from each country for the periods indicated (in thousands):
|
|
For the Year Ended December 31,
|
||||||||||
|
|
2012
|
2011
|
2010
|
||||||||
|
United States
|
$
|
406,950
|
|
$
|
13,719
|
|
$
|
18,953
|
|
||
|
Korea
|
118,078
|
|
118,078
|
|
175,614
|
|
|||||
|
Canada
|
40,667
|
|
54,728
|
|
38,820
|
|
|||||
|
Taiwan
|
40,394
|
|
43,993
|
|
21,559
|
|
|||||
|
Japan
|
39,558
|
|
61,594
|
|
121,113
|
|
|||||
|
China
|
9,246
|
|
688
|
|
6,305
|
|
|||||
|
Germany
|
3,470
|
|
5,439
|
|
10,292
|
|
|||||
|
Other Europe
|
4,700
|
|
3,461
|
|
1,877
|
|
|||||
|
Other Asia
|
—
|
|
42
|
|
12
|
|
|||||
|
Total
|
$
|
663,063
|
|
$
|
301,742
|
|
$
|
394,545
|
|
||
At
December 31, 2012
,
2011
and
2010
, we held
$185.4 million
,
or nearly
100%
,
$146.0 million
, or
nearly
100%
, and
$138.4 million
,
or
99%
,
respectively, of our property and equipment and patents in the United States net of accumulated depreciation and amortization. At
December 31, 2012
,
2011
and
2010
, we also held
$0 million
,
$0.1 million
and
$0.2 million
, respectively, of property and equipment, net of accumulated depreciation, in Canada.
11
Corporate Information
The ultimate predecessor company of InterDigital, Inc. was incorporated in 1972 under the laws of the Commonwealth of Pennsylvania and conducted its initial public offering in November 1981. Our corporate headquarters and administrative offices are located in Wilmington, Delaware, USA. Our research and technology development centers are located in the following locations: King of Prussia, Pennsylvania, USA; Melville, New York, USA; San Diego, California, USA; and Montreal, Quebec, Canada.
Our Internet address is
www.interdigital.com
,
where, in the “Investors” section
,
we make available, free of charge, our Annual Reports on Form 10-K, Quarterly Reports on Form 10-Q, Current Reports on Form 8-K, certain other reports and filings required to be filed under the Securities Exchange Act of 1934, as amended, and all amendments to those reports or filings as soon as reasonably practicable after such material is electronically filed with or furnished to the United States Securities and Exchange Commission. The information contained on or connected to our website is not incorporated by reference into this Form 10-K.
Item 1A.
RISK FACTORS.
We face a variety of risks that may affect our business, financial condition, operating results, the trading price of our common stock, or any combination thereof. You should carefully consider the following information and the other information in this Form 10-K in evaluating our business and prospects and before making an investment decision with respect to our common stock. If any of these risks were to occur, our business, financial condition, results of operations or prospects could be materially and adversely affected. In such an event, the market price of our common stock could decline and you could lose all or part of your investment. The risks and uncertainties we describe below are not the only ones facing us. Additional risks not presently known to us or that we currently deem immaterial may also affect our business.
Risks Related to Our Business
Rulings in third party legal proceedings, increased scrutiny by antitrust authorities, the outcome of potential patent legislation, USPTO rule changes and international patent rule changes may affect our strategies for patent prosecution, licensing and enforcement and may increase our costs of doing business.
The potential effect of rulings in legal proceedings among third parties may affect our strategies for patent prosecution, licensing and enforcement. In addition,
domestic and foreign antitrust authorities have recently increased their scrutiny of the use of standard essential patents in the mobile wireless industry, including the enforcement of such patents against competitors. Such scrutiny may lead to an increase in antitrust inquiries and/or enforcement actions and/or impact the availability of injunctive and monetary relief, which may adversely affect our strategies for patent prosecution, licensing and enforcement and increase our costs of operation.
Finally, changes to certain U.S. and international patent laws, rules and regulations may occur in the future, some or all of which may affect our costs, the scope of future patent coverage we secure and remedies we may be entitled to in patent litigation and may require us to reevaluate and modify our patent prosecution, licensing and enforcement strategies. We continue to monitor and evaluate our strategies for prosecution, licensing and enforcement with regard to these developments; however, any resulting change in such strategies may have an adverse impact on our business and financial condition.
Setbacks in defending and enforcing our patent rights could cause our revenue and cash flow to decline.
Major telecommunications equipment manufacturers have challenged, and we expect will continue to challenge, the infringement, validity and enforceability of certain of our patents. In some instances, certain of our patent claims could be substantially narrowed or declared invalid, unenforceable, not essential or not infringed. We cannot assure that the validity and enforceability of our patents will be maintained or that our patents will be determined to be applicable to any particular product or standard. Moreover, third parties could attempt to circumvent certain of our patents through design changes. Any significant adverse finding as to the validity, enforceability or scope of certain of our patents and/or any successful design-around of certain patents could result in the loss of patent licensing revenue from existing licensees, through termination or modification of agreements or otherwise and could substantially impair our ability to secure new patent licensing arrangements, either at all or on beneficial terms.
12
Our recently announced plans to broaden our revenue sources through enhanced technology sourcing, commercializing our market-ready technologies and research capabilities and pursuing patent licensing partnerships and patent sales may not be successful and could cause our revenue and cash flow to decline.
On January 23, 2012, we announced that we had expanded our business plan to include patent sales and patent licensing partnerships as additional vehicles to generate revenue. On October 23, 2012, we announced a further expansion of our business strategy by enhancing our technology sourcing and establishing a business unit dedicated to monetizing the company's market-ready technologies and research capabilities. There is no guarantee that we will succeed in acquiring technology and patents or partnering with inventors and research organizations to contribute new areas to our existing portfolio of intellectual property. Also, our technology development activities may experience delays, or the markets for our technology solutions may fail to materialize to the extent or at the rate we expect, each of which could reduce our opportunities for technology sales and licensing and could materially adversely affect our long-term business, financial condition and operating results. There is no guarantee that we will succeed in our pursuit of select patent licensing partnerships or additional patent sales, and, if we are successful, there is no guarantee that the revenue and cash flow generated through such patent sales or licensing partnerships will be greater than the revenue and cash flow we would have generated if we had retained and licensed the patents ourselves. In addition, potential licensees may be reluctant to enter into new patent license agreements, and current licensees may be reluctant to renew their agreements, either at all or on terms acceptable to the company, based on the belief that we plan to sell some of the patents we are asking them to license, which could ultimately cause our revenue and cash flow to decline.
Challenges relating to our ability to enter into new license agreements could cause our revenue and cash flow to decline.
We face challenges in entering into new patent license agreements. The most significant challenge we face is that most potential licensees do not voluntarily seek to enter into license agreements with us before they commence manufacturing and/or selling devices that use our patented inventions. As a result, we must approach companies that are reluctant to take licenses and attempt to establish license agreements with them. The process of identifying potential users of our inventions and negotiating license agreements with reluctant prospective licensees requires significant time, effort and expense. Once discussions with unlicensed companies have commenced, we face the additional challenges imposed by the significant negotiation issues that arise from time to time. Given these challenges relating to our ability to enter into new license agreements, we cannot assure that all prospective licensees will be identified or, if they are identified, will be persuaded during negotiations to enter into a patent license agreement with us, either at all or on terms acceptable to us, and, as a result, our revenue and cash flow could materially decline. In addition, the length of time required to negotiate a license agreement leads to delays in the receipt of the associated revenue stream, which could also cause our revenue and cash flow to decline.
Due to the nature of our business, we could be involved in a number of costly litigation, arbitration and administrative proceedings to enforce our intellectual property rights.
While some companies seek licenses before they commence manufacturing and/or selling devices that use our patented inventions, most do not. Consequently, we approach companies and seek to establish license agreements for using our inventions. We expend significant time and effort identifying potential users of our inventions and negotiating license agreements with companies that may be reluctant to take licenses. However, if we believe that a third party is required to take a license to our patents in order to manufacture, sell, offer for sale, import, or use products, we may commence legal or administrative action against the third party if they refuse to enter into a license agreement with us. In turn, we could face counterclaims that challenge the essential nature of our patents, that our patents are invalid, unenforceable or not infringed or that our royalty rates are other than fair, reasonable and nondiscriminatory. As a result of enforcing our patents, we could be subject to significant legal fees and costs, including the costs and fees of opposing counsel in certain jurisdictions if we are unsuccessful. In addition, litigation, arbitration and administrative proceedings require significant key employee involvement for significant periods of time, which could divert these employees from other business activities.
In addition, the cost of enforcing and defending our intellectual property has been and may continue to be significant. Litigation may be required to enforce our intellectual property rights, protect our trade secrets, enforce patent license and confidentiality agreements or determine the validity, enforceability and scope of proprietary rights of others. In addition, third parties could commence litigation against us seeking to invalidate our patents or obtain a determination that our patents are not infringed, are not essential, are invalid or are unenforceable. As a result of any such litigation, we could lose our proprietary rights or incur substantial unexpected operating costs. Any action we take to protect our intellectual property rights could be costly and could require significant amounts of time by key members of executive management and other personnel.
13
Our revenue may be affected by the deployment of 4G or other technologies in place of 2G and 3G technologies or by the need to extend or modify certain existing license agreements to cover subsequently issued patents.
Although we own a growing portfolio of issued and pending patents related to 4G and non-cellular technologies, our patent portfolio licensing program in these areas is less established and may not be as successful in generating licensing income as our 2G and 3G licensing programs. Many wireless operators have selected LTE (or, to a lesser extent, WiMAX) as next-generation technologies for deployment in existing or future spectrum bands as complementary to their existing 2G or 3G networks. Although we believe that certain of our technology is, may be or may become essential to LTE and WiMAX standards, we may not be as successful in licensing 4G products as we have been in licensing 2G and 3G products or we may not achieve a level of royalty revenues on such 4G products that is comparable to that we have historically received on 2G and 3G products.
The licenses that we grant under our patent license agreements typically only cover products designated to operate in accordance with specified cellular technologies and that were manufactured or deployed or soon to be manufactured or deployed at the time of entry into the agreement. As a result, most of our current patent license agreements cover products designed to operate in accordance with 2G and/or 3G Standards but do not cover products designed to operate in accordance with 4G Standards. Also, we have patent license agreements with licensees that now offer for sale types of products that were not sold by such licensees at the time the patent license agreements were entered into and, thus, are not licensed by us. We do not derive patent licensing revenue from the sale of products by our licensees that are not covered by a patent license agreement. In order to grant a patent license for any such products, we will need to extend or modify our patent license agreements or enter into new license agreements with such licensees. We may not be able to modify these license agreements on financial terms acceptable to us, without affecting the other material terms and conditions of our license agreements with such licensees or at all. Further, such modifications may adversely affect our revenue on the sale of products covered by the license prior to modification.
Our revenue and cash flow are dependent upon our licensees' sales and market conditions and other factors that are beyond our control or are difficult to forecast.
A significant portion of our licensing revenues are running royalty-based and dependent on sales by our licensees that are outside our control and that could be negatively affected by a variety of factors, including global and/or country-specific economic conditions, country-specific natural disasters impacting licensee manufacturing and sales, buying patterns of end users, competition for our licensees' products and any decline in the sale prices our licensees receive for their covered products. In addition, our operating results also could be affected by general economic and other conditions that cause a downturn in the market for the licensees of our products or technologies. Our revenue and cash flow also could be affected by (i) the unwillingness of any licensee to satisfy all of their royalty obligations on the terms or within the timeframe we expect or a decline in the financial condition of any licensee or (ii) the failure of sales to meet market forecasts due to global economic conditions, political instability, natural disasters, competitive technologies or otherwise. It is also difficult to predict the timing and amount of licensing revenue associated with past infringement and new licenses and the timing, nature or amount of revenues associated with strategic relationships. The foregoing factors are difficult to forecast and could adversely affect both our quarterly and annual operating results and financial condition. In addition, some of our patent license agreements provide for fixed payments or prepayments that cover our licensees' future sales for a specified period and reduce future cash receipts from those licensees. As a result, our cash flow has historically fluctuated from period to period. Depending upon the payment structure of any new patent license agreements into which we may enter, such cash flow fluctuations may continue in the future.
Royalty rates could decrease for future license agreements.
Royalty
payments to us under future license agreements could be lower than anticipated. Certain licensees and others in the wireless industry, individually and collectively, are demanding that royalty rates for patents be lower than historic royalty rates. There is also increasing downward pricing pressure on certain products, including handsets, that we believe implement our patented inventions and some of our royalty rates are tied to the pricing of handsets. In addition, a number of other companies also claim to hold patents that are essential with respect to products for the cellular market. The increasing pricing pressure, as well as the number of patent holders seeking royalties on their cellular technologies, could result in a decrease in the royalty rates we receive for use of our patented inventions, thereby decreasing future revenue and cash flow.
Our revenues are derived primarily from a limited number of licensees or customers.
The
mobile device market is very concentrated. As a result, we earn a significant amount of our revenues from a limited number of licensees or customers, and we expect that a significant portion of our revenues will continue to come from a limited number of licensees for the foreseeable future. For example, in
2012
, Intel and Samsung comprised approximately
57%
and
15%
of our total revenues, respectively. In the event that one or more of our significant licensees or customers fail to meet
14
their payment or reporting obligations under their respective license agreements, we are unable to renew one or more of such license agreements upon expiration or our revenues from these licensees significantly decline, our future revenue and cash flow could be materially adversely affected.
We depend on key senior management, engineering, patent and licensing resources.
Our future success depends largely upon the continued service of our directors, executive officers and other key management and technical personnel. Our success also depends on our ability to continue to attract, retain and motivate qualified personnel with specialized patent, licensing, engineering and other skills. The market for such talent in our industry is extremely competitive. In particular, competition exists for qualified individuals with expertise in patents and in licensing and with significant engineering experience in cellular and air interface technologies. Our ability to attract and retain qualified personnel could be affected by any adverse decisions in any litigation or arbitration, by our ability to offer competitive cash and equity compensation and work environment conditions and by the geographic location of our various offices. The failure to attract and retain such persons with relevant and appropriate experience could interfere with our ability to enter into new license agreements and undertake additional technology and product development efforts, as well as our ability to meet our strategic objectives.
Delays in renewing or an inability to renew existing license agreements could cause our revenue and cash flow to decline.
Many of our license agreements have fixed terms. We endeavor to renew license agreements with fixed terms prior to the expiration of the license agreements and, due to various factors, including the technology and business needs and competitive positions of our licensees and, at times, reluctance on the part of our licensees to participate in renewal discussions, we may not be able to renegotiate the license agreements on acceptable terms before the expiration of the license agreement, on acceptable terms after the expiration of the license agreement, or at all. If there is a delay in renegotiating and renewing a license agreement prior to its expiration, there could be a gap in time during which we may be unable to recognize revenue from that licensee or we may be forced to renegotiate and renew the license agreement on terms that are more favorable to such licensee, and, as a result, our revenue and cash flow could be materially adversely affected. In addition, if we fail to renegotiate and renew our license agreements at all, we could lose existing licensees, and our revenue and cash flow could be materially adversely affected. For example, the 3G portion of our patent license agreement with Samsung expired at the end of 2012. If we are unable to renew this agreement at all or on acceptable terms, our revenue would be adversely affected.
Changes to our tax assets or liabilities could have an adverse effect on our consolidated financial condition or results of operations.
The calculation of tax assets and liabilities involves significant judgment in estimating the impact of uncertainties in the application of complex tax laws. We are subject to examinations by the Internal Revenue Service (IRS) and other taxing jurisdictions on various tax matters, including challenges to various positions we assert in our filings and foreign tax liability and withholding. With our January 1, 2007 adoption of the guidance for accounting for uncertainty in income taxes, certain tax contingencies are recognized when they are determined to be more likely than not to occur. Although we believe we have adequately recorded tax assets and accrued for tax contingencies that meet this criterion, we may not fully recover our tax assets or may be required to pay taxes in excess of the amounts we have accrued. As of December 31, 2012 and 2011, there were certain tax contingencies that did not meet the applicable criteria to record an accrual. In the event that the IRS or another taxing jurisdiction levies an assessment in the future, it is possible the assessment could have an adverse effect on our consolidated financial condition or results of operations.
Our technologies may not be become patented, adopted by wireless standards or widely deployed.
We invest significant resources in the development of advanced wireless technology and related solutions. However, certain of our inventions that we believe will be employed in current and future products, including 4G products, are the subject of patent applications where no patent has been issued to us yet by the relevant patent issuing authorities. There is no assurance that these applications will issue as patents, either at all or with claims that would be required by products in the market currently or in the future. Our investments may not be recoverable or may not result in meaningful revenue if a sufficient number of our technologies are not patented and adopted by the relevant Standards or if products based on the technologies in which we invest are not widely deployed. Competing digital wireless technologies could reduce the opportunities for the adoption or deployment of technologies we develop. If the technologies in which we invest do not become patented or are not adopted by the relevant Standards or deployed in the mainstream markets, at all or at the rate or within time periods we expect, or if we are unable to secure partner support for our technologies, our business, financial condition and operating results could be adversely affected.
15
It can be difficult for us to verify royalty amounts owed to us under our licensing agreements, and this may cause us to lose potential revenue.
The standard terms of our license agreements require our licensees to document the sale of licensed products and report this data to us on a quarterly basis. Although our standard license terms give us the right to audit books and records of our licensees to verify this information, audits can be expensive, time consuming, incomplete and subject to dispute. From time to time, we audit certain of our licensees to verify independently the accuracy of the information contained in their royalty reports in an effort to decrease the likelihood that we will not receive the royalty revenues to which we are entitled under the terms of our license agreements, but we cannot give assurances that these audits will be numerous enough and/or effective to that end.
Consolidation in the wireless communications industry could adversely affect our business.
The wireless communications industry has experienced consolidation of participants and sales of participants or their businesses, and these trends may continue. Any concentration or sale within the wireless industry may reduce the number of licensing opportunities or, in some instances, result in the reduction, loss or elimination of existing royalty obligations. Further, if wireless carriers consolidate with companies that utilize technologies that are competitive with our technologies or that are not covered by our patents, we could lose market opportunities, which could negatively impact our revenues and financial condition.
We face risks from doing business in international markets.
A significant portion of our licensees are international, and our licensees sell their products to markets throughout the world. Accordingly, we could be subject to the effects of a variety of uncontrollable and changing factors, including, but not limited to: difficulty in protecting our intellectual property in foreign jurisdictions; enforcing contractual commitments in foreign jurisdictions or against foreign corporations; government regulations, tariffs and other applicable trade barriers; currency control regulations and variability in the value of the U.S. dollar against foreign currency; social, economic and political instability; natural disasters, acts of terrorism, widespread illness and war; potentially adverse tax consequences; and general delays in remittance of and difficulties collecting non-U.S. payments. In addition, we also are subject to risks specific to the individual countries in which we and our licensees do business.
Our industry is subject to rapid technological change, uncertainty and shifting market opportunities.
Our success depends, in part, on our ability to define and keep pace with changes in industry standards, technological developments and varying customer requirements. Changes in industry standards and needs could adversely affect the development of, and demand for, our technology, rendering our technology currently under development obsolete and unmarketable. The patents and applications comprising our portfolio have fixed terms, and, if we fail to anticipate or respond adequately to these changes through the development or acquisition of new patentable inventions, patents or other technology, we could miss a critical market opportunity, reducing or eliminating our ability to capitalize on our patents, technology solutions or both.
The high amount of capital required to obtain radio frequency licenses, deploy and expand wireless networks and obtain new subscribers could slow the growth of the wireless communications industry and adversely affect our business.
Our growth is dependent upon the increased use of wireless communications services that utilize our technology. In order to provide wireless communications services, wireless operators must obtain rights to use specific radio frequencies. The allocation of frequencies is regulated in the United States and other countries throughout the world, and limited spectrum space is allocated to wireless communications services. Industry growth may be affected by the amount of capital required to obtain licenses to use new frequencies, deploy wireless networks to offer voice and data services, expand wireless networks to grow voice and data services and obtain new subscribers. The significant cost of licenses, wireless networks and subscriber additions may slow the growth of the industry if wireless operators are unable to obtain or service the additional capital necessary to implement or expand advanced wireless networks. The growth of our business could be adversely affected if this occurs.
Market projections and data are forward-looking in nature.
Our strategy is based on our own projections and on analyst, industry observer and expert projections, which are forward-looking in nature and are inherently subject to risks and uncertainties. The validity of their and our assumptions, the timing and scope of wireless markets, economic conditions, customer buying patterns, timeliness of equipment development, pricing of products, growth in wireless telecommunications services that would be delivered on wireless devices and availability of capital for infrastructure improvements could affect these predictions. In addition, market data upon which we
16
rely is based on third party reports that may be inaccurate. The inaccuracy of any of these projections and/or market data could adversely affect our operating results and financial condition.
The markets for our technology solutions may fail to materialize in the manner we expect.
We are positioning our current development projects for the evolving advanced digital wireless markets. Certain of these markets may continue to develop at a slower rate or pace than we expect and may be of a smaller size than we expect. In addition, there could be fewer applications for our technology and products than we expect. The development of advanced wireless markets also could be affected by general economic conditions, customer buying patterns, timeliness of equipment development, pricing of advanced wireless infrastructure and mobile devices, rate of growth in telecommunications services and the availability of capital for, and the high cost of, radio frequency licenses and infrastructure improvements. Failure of the markets for our technologies and/or our products to materialize to the extent or at the rate we expect could reduce our opportunities for sales and licensing and could materially adversely affect our long-term business, financial condition and operating results.
We face competition from companies developing other or similar technologies.
We face competition from companies, including the in-house development teams at wireless device and semiconductor manufacturing companies and operators, developing other and similar technologies that are competitive with our solutions that we may set forth into the standards-setting arena. Due to competing solutions, our solutions may not be adopted by the relevant standards. In addition, in licensing our patent portfolio, we may compete with other companies, many of whom also claim to hold essential patents, for a share of the available royalties. In any device or piece of equipment that contains intellectual property, the manufacturer may need to obtain a license from multiple holders of intellectual property. To the extent that multiple parties all seek royalties on the same product, the manufacturers could claim to have difficulty in meeting the financial requirements of each patent holder.
Our technology development activities may experience delays.
We may experience technical, financial, resource or other difficulties or delays related to the further development of our technologies. Delays may have adverse financial effects and may allow competitors with comparable technology offerings to gain an advantage over us in the Standards setting arena. There can be no assurance that we will continue to have adequate staffing or that our development efforts will ultimately be successful. Moreover, certain of our technologies have not been fully tested in commercial use, and it is possible that they may not perform as expected. In such cases, our business, financial condition and operating results could be adversely affected, and our ability to secure new licensees and other business opportunities could be diminished.
We rely on relationships with third parties to develop and deploy technology solutions.
Successful exploitation of our technology solutions is partially dependent on the establishment and success of relationships with equipment producers and other industry participants. Delays or failure to enter into licensing or other relationships to facilitate technology development efforts or delays or failure to enter into technology licensing agreements to secure integration of additional functionality could impair our ability to introduce into the market portions of our technology and resulting products, cause us to miss critical market windows or impair our ability to remain competitive.
We may engage in acquisitions or other strategic transactions or make investments that could result in significant changes or management disruption and fail to enhance shareholder value.
We continue to evaluate and may acquire businesses, technology and/or intellectual property, enter into joint ventures or other strategic transactions and purchase equity and debt securities in other entities, including minority equity interests and corporate bonds/notes in publicly traded and privately held companies. In some cases, such strategic investments may serve as consideration for a license in lieu of cash royalties. Most strategic investments entail a high degree of risk and will not become liquid until more than one year from the date of investment, if at all. Acquisitions or strategic investments may not generate financial returns or result in increased adoption or continued use of our technologies. In addition, other investments may not generate financial returns or may result in losses due to market volatility, the general level of interest rates and inflation expectations. We could make strategic investments in early-stage companies, which require us to consolidate or record our share of the earnings or losses of those companies. Our share of any such losses may adversely affect our financial results until we exit from or reduce our exposure to these investments.
Achieving the anticipated benefits of acquisitions depends in part upon our ability to integrate the acquired businesses in an efficient and effective manner. The integration of acquired companies or businesses may result in significant challenges, and we may be unable to accomplish the integration smoothly or successfully. We cannot assure you that the integration of
17
acquired businesses, technology and/or intellectual property with our business will result in the realization of the full benefits we anticipate to result from such acquisitions. We may not derive any commercial value from the acquired technology, products and intellectual property or from future technologies and products based on the acquired technology and/or intellectual property, and we may be subject to liabilities that are not covered by the indemnification protection we may obtain.
Changes in financial accounting standards or policies may affect our reported financial condition or results of operations.
From time to time the Financial Accounting Standards Board (the “FASB”) and the SEC change their guidance governing the form and content of our external financial statements. In addition, accounting standard setters and those who interpret U.S. generally accepted accounting principles (“GAAP”), such as the FASB and the SEC may change or even reverse their previous interpretations or positions with regard to how these standards should be applied. A change in accounting principles or their interpretation can have a significant effect on our reported results. In certain cases, the company could be required to apply new or revised guidance retroactively or apply existing guidance differently. For example, in November 2011, the FASB and International Accounting Standards Board released an updated exposure draft,
Revenue from Contracts with Customers
, which, if it becomes final,
could significantly impact the timing of revenue recognition for new and existing contracts with licensees. This and other potential changes in reporting standards could substantially change our reporting practices in a number of areas, including revenue recognition and recording of assets and liabilities, and affect our reported financial condition or results of operations.
Currency fluctuations could negatively affect future product sales or royalty revenues or increase the U.S. dollar cost of our activities and international strategic investments.
We are exposed to risk from fluctuations in currencies, which may change over time as our business practices evolve, that could impact our operating results, liquidity and financial condition. We operate and invest globally. Adverse movements in currency exchange rates may negatively affect our business due to a number of situations, including the following:
|
•
|
If the effective price of products sold by our licensees were to increase as a result of fluctuations in the exchange rate of the relevant currencies, demand for the products could fall, which in turn would reduce our royalty revenues.
|
|
•
|
Assets or liabilities of our consolidated subsidiaries may be subject to the effects of currency fluctuations, which may affect our reported earnings. Our exposure to foreign currencies may increase as we expand into new markets.
|
|
•
|
Certain of our operating and investing costs, such as foreign patent prosecution, are based in foreign currencies. If these costs are not subject to foreign exchange hedging transactions, strengthening currency values in selected regions could adversely affect our near-term operating expenses, investment costs and cash flows. In addition, continued strengthening of currency values in selected regions over an extended period of time could adversely affect our future operating expenses, investment costs and cash flows.
|
Our engineering services business could subject us to specific costs and risks that we might fail to manage adequately.
We derive a portion of our revenues from engineering services. Any mismanagement of, or negative development in, a number of areas, including, among others, the perceived value of our intellectual property portfolio, our ability to convince customers of the value of our engineering services and our reputation for performance under our service contracts, could cause our revenues from engineering services to decline, damage our reputation and harm our ability to attract future licensees, which would in turn harm our operating results. If we fail to deliver as required under our service contracts, we could lose revenues and become subject to liability for breach of contract. We need to monitor these services adequately in order to ensure that we do not incur significant expenses without generating corresponding revenues. Our failure to monitor these services adequately may harm our business, financial position, results of operations or cash flows.
If wireless handsets are perceived to pose health and safety risks, demand for products of our licensees could decrease.
Media reports and certain studies have suggested that radio frequency emissions from wireless handsets may be linked to health concerns, such as brain tumors, other malignancies and genetic damage to blood, and may interfere with electronic medical devices, such as pacemakers, telemetry and delicate medical equipment. Growing concerns over radio frequency emissions, even if unfounded, could discourage the use of wireless handsets and cause a decrease in demand for the products of our licensees. In addition, concerns over safety risks posed by the use of wireless handsets while driving and the effect of any resulting legislation could reduce demand for the products of our licensees.
18
Risks Relating to Our Common Stock and the Notes
The price of our common stock is volatile and may decline regardless of our operating performance.
Historically, we have had large fluctuations in the price of our common stock, and such fluctuations could continue. From January 4, 2010 to February 22, 2013, the trading price of our common stock has ranged from a low of $22.30 per share to a high of $82.50 per share. The market price for our common stock is volatile and may fluctuate significantly in response to a number of factors, most of which we cannot control, including:
|
•
|
the public's response to press releases or other public announcements by us or third parties, including our filings with the SEC and announcements relating to licensing, technology development, litigation, arbitration and other legal proceedings in which we are involved and intellectual property impacting us or our business;
|
|
•
|
announcements concerning strategic transactions, such as spin-offs, joint ventures and acquisitions or divestitures;
|
|
•
|
the financial projections we may provide to the public, any changes in these projections or our failure to meet these projections;
|
|
•
|
changes in financial estimates or ratings by any securities analysts who follow our common stock, our failure to meet these estimates or failure of those analysts to initiate or maintain coverage of our common stock;
|
•
investor perceptions as to the likelihood of achievement of near-term goals;
•
changes in market share of significant licensees;
|
•
|
changes in operating performance and stock market valuations of other wireless communications companies generally; and
|
•
market conditions or trends in our industry or the economy as a whole.
In the past, stockholders have instituted securities class action litigation following periods of market volatility. If we were involved in securities litigation, we could incur substantial costs and our resources and the attention of management could be diverted from our business.
Our increased indebtedness could adversely affect our business, financial condition and results of operations and our ability to meet our payment obligations under such indebtedness.
Our total consolidated long-term debt as of December 31, 2012 was approximately
$200.4 million
. This level of debt could have significant consequences on our future operations, including:
|
•
|
making it more difficult for us to meet our payment and other obligations under our 2.50% senior convertible notes due 2016 (the “Notes”);
|
|
•
|
reducing the availability of our cash flow to fund working capital, capital expenditures, acquisitions and other general corporate purposes, and limiting our ability to obtain additional financing for these purposes;
|
|
•
|
limiting our flexibility in planning for, or reacting to, and increasing our vulnerability to, changes in our business, the industry in which we operate and the general economy; and
|
|
•
|
placing us at a competitive disadvantage compared to our competitors that have less debt or are less leveraged.
|
Any of the above-listed factors could have an adverse effect on our business, financial condition and results of operations and our ability to meet our payment obligations under the Notes.
Our ability to meet our payment and other obligations under the Notes depends on our ability to generate significant cash flow in the future. This, to some extent, is subject to general economic, financial, competitive, legislative and regulatory factors as well as other factors that are beyond our control. We cannot assure you that our business will generate cash flow from operations, or that future borrowings will be available to us, in an amount sufficient to enable us to meet our payment obligations under the Notes and to fund other liquidity needs. If we are not able to generate sufficient cash flow to service our debt obligations, we may need to refinance or restructure our debt, including the Notes, sell assets, reduce or delay capital investments, or seek to raise additional capital. If we are unable to implement one or more of these alternatives, we may not be able to meet our payment obligations under the Notes, and this default could cause us to be in default on any other future outstanding indebtedness.
19
Our stockholders may not receive the level of dividends provided for in our dividend policy or any dividend at all, and any decrease in or suspension of the dividend could cause our stock price to decline.
Our initial dividend policy, adopted and announced in December 2010, contemplates the payment of a regular quarterly cash dividend of $0.10 per share on our outstanding common stock. We expect to continue to pay quarterly cash dividends on our common stock at the rate set forth in our current dividend policy. However, the dividend policy and the payment and timing of future cash dividends under the policy are subject to the final determination each quarter by our Board of Directors that (i) the dividend will be made in compliance with laws applicable to the declaration and payment of cash dividends, including Section 1551(b) of the Pennsylvania Business Corporation Law, and (ii) the policy remains in our best interests, which determination will be based on a number of factors, including our earnings, financial condition, capital resources and capital requirements, alternative uses of capital, restrictions imposed by any existing debt, economic conditions and other factors considered relevant by the Board of Directors. Given these considerations, our Board of Directors may increase or decrease the amount of the dividend at any time and may also decide to vary the timing of or suspend or discontinue the payment of cash dividends in the future. Any decrease in the amount of the dividend, or suspension or discontinuance of payment of a dividend, could cause our stock price to decline.
If securities or industry analysts fail to continue publishing research about our business, our stock price and trading volume could decline.
The trading market for our common stock is influenced by the research and reports that industry or securities analysts publish about us or our business. If one or more of these analysts cease coverage of our company or fail to publish reports on us regularly, we could lose visibility in the financial markets, which in turn could cause our stock price or trading volume to decline.
The convertible note hedge transactions and warrant transactions that we entered into in connection with the offering of the Notes may affect our earnings per share and/or the market price for our common stock.
In connection with the offering of the Notes, we entered into convertible note hedge transactions with an affiliate of the initial purchaser (the “option counterparty”). We also sold warrants to the option counterparty. These transactions have been accounted for as an adjustment to our shareholders' equity. The convertible note hedge transactions are expected to reduce the potential equity dilution upon conversion of the Notes. The warrants will have a dilutive effect to the extent that the market value per common share of our common stock, as measured under the warrants, exceeds the strike price of the warrants at the time the warrants are exercisable.
In connection with establishing its initial hedge of these transactions, the option counterparty (and/or an affiliate thereof) purchased our common stock in open market transactions and/or privately negotiated transactions and/or entered various cash-settled derivative transactions with respect to our common stock concurrently with, or shortly after, the pricing of the Notes. The option counterparty (and/or an affiliate thereof) may modify its hedge positions from time to time (including during any conversion period related to a conversion of the Notes) by entering into or unwinding various derivative transactions with respect to our common stock and/or by purchasing or selling our common stock in open market transactions and/or privately negotiated transactions. The effect, if any, of any of these transactions and activities on the market price of our common stock will depend in part on market conditions and cannot be ascertained at this time, but any of these activities could adversely affect the market price of our common stock.
Future sales or other dilution of our equity could depress the market price of our common stock.
Sales of our common stock in the public market, or the perception that such sales could occur, could negatively impact the market price of our common stock. We also have several institutional stockholders that own significant blocks of our common stock. If one or more of these stockholders were to sell large portions of their holdings in a relatively short time, for liquidity or other reasons, the prevailing market price of our common stock could be negatively affected.
Under certain circumstances, shares of our common stock could be issued upon conversion of the Notes, which would dilute the ownership interest of our existing stockholders. In addition, the issuance of additional common stock, or issuances of securities convertible into or exercisable for our common stock or other equity linked securities, including preferred stock or warrants, would dilute the ownership interest of our common stockholders and could depress the market price of our common stock and impair our ability to raise capital through the sale of additional equity securities.
Approved stock repurchase programs may not result in a positive return of capital to stockholders.
Our board-approved stock repurchase program may not return value to stockholders because the market price of the stock may decline significantly below the levels at which we repurchased shares of stock. Stock repurchase programs are
20
intended to deliver stockholder value over the long term, but stock price fluctuations can reduce the effectiveness of such programs.
Provisions of the Notes could discourage an acquisition of us by a third party.
Certain provisions of the Notes could make it more difficult or more expensive for a third party to acquire us. Upon the occurrence of certain transactions constituting a fundamental change, including the sale of all or substantially all of our assets, holders of the Notes will have the right, at their option, to require us to repurchase all of their Notes or any portion of the principal amount of such Notes. We may also be required to issue additional shares upon conversion in the event of certain fundamental change transactions. These provisions could limit the price that some investors might be willing to pay in the future for shares of our common stock and could have the effect of discouraging delaying or preventing an acquisition of us by a third party.
We are subject to counterparty risk with respect to the convertible note hedge transactions.
The option counterparty is a financial institution or the affiliate of a financial institution, and we will be subject to the risk that the option counterparty may default or otherwise fail to perform, or may exercise certain rights to terminate their obligations, under the convertible note hedge transactions. Our exposure to the credit risk of the option counterparty will not be secured by any collateral. Recent global economic conditions have resulted in the actual or perceived failure or financial difficulties of many financial institutions. If the option counterparty becomes subject to insolvency proceedings, we will become an unsecured creditor in those proceedings with a claim equal to our exposure at that time under the convertible note hedge transactions. Our exposure will depend on many factors but, generally, the increase in our exposure will be correlated to the increase in our common stock market price and in volatility of our common stock. In addition, upon a default by the option counterparty, we may suffer adverse tax consequences and dilution with respect to our common stock. We can provide no assurance as to the financial stability or viability of the option counterparty.
|
Item 1B.
|
UNRESOLVED STAFF COMMENTS.
|
None.
|
Item 2.
|
PROPERTIES.
|
Our research and development activities are conducted in facilities located in King of Prussia, Pennsylvania, USA, Melville, New York, USA, San Diego, California, USA, and Montreal, Quebec, Canada. We own the facility located in King of Prussia, Pennsylvania, which consists of approximately 52,000 square feet of administrative office and research space. We are a party to a lease, scheduled to expire in February 2020, for approximately 44,810 square feet of administrative office and research space in Melville, New York. In addition, we are a party to a lease, scheduled to expire in June 2016, for approximately 14,242 square feet of administrative office and research space in Montreal, Quebec. We are a party to another lease, scheduled to expire in April 2018, for approximately 11,759 square feet of administrative office and research space in San Diego, California. Finally, we are a party to a lease, scheduled to expire in November 2022, for approximately 36,182 square feet of office space in Wilmington, Delaware, which houses our corporate headquarters.
|
Item 3.
|
LEGAL PROCEEDINGS.
|
Samsung, Nokia, Huawei and ZTE 2013 USITC Proceeding (337-TA-868) and Related Delaware District Court Proceedings
On January 2, 2013, the company's wholly owned subsidiaries InterDigital Communications, Inc., InterDigital Technology Corporation, IPR Licensing, Inc. and InterDigital Holdings, Inc. filed a complaint with the USITC against Samsung Electronics Co., Ltd., Samsung Electronics America, Inc. and Samsung Telecommunications America, LLC, Nokia Corporation and Nokia Inc., Huawei Technologies Co., Ltd., Huawei Device USA, Inc. and FutureWei Technologies, Inc. d/b/a Huawei Technologies (USA) and ZTE Corporation and ZTE (USA) Inc. (collectively, the “337-TA-868 Respondents”), alleging violations of Section 337 of the Tariff Act of 1930 in that they engaged in unfair trade practices by selling for importation into the United States, importing into the United States and/or selling after importation into the United States certain 3G and 4G wireless devices (including WCDMA-, cdma2000- and LTE-capable mobile phones, USB sticks, mobile hotspots, laptop computers and tablets and components of such devices) that infringe one or more of up to seven of InterDigital's U.S. patents. The complaint also extends to certain WCDMA and cdma2000 devices incorporating WiFi
21
functionality. InterDigital's complaint with the USITC seeks an exclusion order that would bar from entry into the United States infringing 3G or 4G wireless devices (and components), including LTE devices, that are imported by or on behalf of the 337-TA-868 Respondents, and also seeks a cease-and-desist order to bar further sales of infringing products that have already been imported into the United States. Certain of the asserted patents have been asserted against Nokia, Huawei and ZTE in earlier pending USITC proceedings (including the Nokia, Huawei and ZTE 2011 USITC Proceeding (337-TA-800) and the Nokia 2007 USITC Proceeding (337-TA-613), as set forth below) and therefore are not being asserted against those 337-TA-868 Respondents in this investigation. On February 6, 2013, the Administrative Law Judge (“ALJ”) overseeing the proceeding issued an order setting a target date of June 4, 2014 for the Commission's final determination in the investigation, with the ALJ's Initial Determination on alleged violation due on February 4, 2014. On February 21, 2013, each 337-TA-868 Respondent filed their respective responses to the complaint.
On February 21, 2013, Samsung moved for partial termination of the investigation as to six of the seven patents asserted against Samsung, alleging that Samsung was authorized to import the specific 3G or 4G devices that InterDigital relied on to form the basis of its complaint. InterDigital's opposition is due March 4, 2013.
On February 22, 2013, Huawei and ZTE moved to stay the investigation pending their respective requests to the United States District Court for the District of Delaware (described below) to set a FRAND royalty rate for a license that covers the asserted patents, or in the alternative, until a Final Determination issues in the 337-TA-800 investigation. InterDigital's opposition is due March 4, 2013.
On January 2, 2013, the company's wholly owned subsidiaries InterDigital Communications, Inc., InterDigital Technology Corporation, IPR Licensing, Inc. and InterDigital Holdings, Inc. filed four related district court actions in the United States District Court for the District of Delaware against the 337-TA-868 Respondents. These complaints allege that each of the defendants infringes the same patents with respect to the same products alleged in the complaint filed by InterDigital in USITC Proceeding (337-TA-868). The complaints seek permanent injunctions and compensatory damages in an amount to be determined, as well as enhanced damages based on willful infringement and recovery of reasonable attorneys' fees and costs. On January 24, 2013, Huawei filed its answer and counterclaims to InterDigital's complaint. Huawei asserted counterclaims for breach of contract, equitable estoppel, waiver of right to enjoin and declarations that InterDigital has not offered or granted Huawei licenses on fair, reasonable and non-discriminatory (“FRAND”) terms, declarations seeking the determination of FRAND terms and declarations of noninfringement, invalidity and unenforceability of the asserted patents. In addition to the declaratory relief specified in its counterclaims, Huawei seeks specific performance of InterDigital's purported contracts with Huawei and standards-setting organizations, appropriate damages in an amount to be determined at trial, reasonable attorneys' fees and such other relief as the court may deem appropriate. On January 31, 2013, ZTE filed its answer and counterclaims to InterDigital's complaint; ZTE asserted counterclaims for breach of contract, equitable estoppel, waiver of right to enjoin and declarations that InterDigital has not offered ZTE licenses on FRAND terms, declarations seeking the determination of FRAND terms and declarations of noninfringement, invalidity and unenforceability. Nokia and Samsung have not yet responded to the complaints against them. In addition to the declaratory relief specified in its counterclaims, ZTE seeks specific performance of InterDigital's purported contracts with ZTE and standards-setting organizations, appropriate damages in an amount to be determined at trial, reasonable attorneys' fees and such other relief as the court may deem appropriate.
On February 11, 2013, Huawei and ZTE filed motions to expedite discovery and trial on their FRAND-related counterclaims. Huawei seeks a schedule for discovery and trial on its FRAND-related counterclaims that would afford Huawei the opportunity to accept a FRAND license rate at the earliest opportunity, and in any case before December 28, 2013. ZTE seeks a trial on its FRAND-related counterclaims no later than November 2013.
Huawei Complaint to European Commission
On May 23, 2012, Huawei lodged a complaint with the European Commission alleging that InterDigital was acting in breach of Article 102 of the Treaty on the Functioning of the European Union (the "TFEU"). Huawei is claiming that InterDigital has a dominant position with respect to the alleged market for the licensing of its 3G standards-essential patents. Huawei further claims that InterDigital is acting in abuse of its alleged dominant position by allegedly seeking to force Huawei to agree to unfair purchase or selling prices and in applying dissimilar conditions to equivalent transactions contrary to the terms of Article 102 of the TFEU. The European Commission has not yet indicated whether or not it will initiate proceedings against InterDigital as a result of the complaint.
Huawei China Proceedings
On February 21, 2012, InterDigital was served with two complaints filed by Huawei Technologies Co., Ltd. in the Shenzhen Intermediate People's Court in China on December 5, 2011. The first complaint names as defendants InterDigital, Inc. and its wholly owned subsidiaries InterDigital Technology Corporation and InterDigital Communications, LLC (now InterDigital Communications, Inc.). This first complaint alleges that InterDigital had a dominant market position in China and
22
the United States in the market for the licensing of essential patents owned by InterDigital, and abused its market power by engaging in allegedly unlawful practices, including differentiated pricing, tying and refusal to deal. Huawei sought relief in the amount of 20.0 million RMB (approximately 3.2 million USD based on the current exchange rate), an order requiring InterDigital to cease the allegedly unlawful conduct and compensation for its costs associated with this matter. The second complaint names as defendants the company's wholly owned subsidiaries InterDigital Technology Corporation, InterDigital Communications, LLC (now InterDigital Communications, Inc.), InterDigital Patent Holdings, Inc. and IPR Licensing, Inc. This second complaint alleges that InterDigital is a member of certain standards-setting organization(s); that it is the practice of certain standards-setting organization(s) that owners of essential patents included in relevant standards license those patents on FRAND terms; and that InterDigital has failed to negotiate on FRAND terms with Huawei. Huawei is asking the court to determine the FRAND rate for licensing essential Chinese patents to Huawei and also seeks compensation for its costs associated with this matter.
On February 4, 2013, the Shenzhen Intermediate People's Court issued rulings in the two proceedings. With respect to the first complaint, the court decided that InterDigital had violated the Chinese Anti-Monopoly Law by (i) making proposals for royalties from Huawei that the court believed were excessive, (ii) tying the licensing of essential patents to the licensing of non-essential patents, (iii) requesting as part of its licensing proposals that Huawei provide a grant-back of certain patent rights to InterDigital and (iv) commencing a USITC action against Huawei while still in discussions with Huawei for a license. Based on these findings, the court ordered InterDigital to cease the alleged excessive pricing and alleged improper bundling of InterDigital's Chinese essential and non-essential patents, and to pay Huawei approximately 3.2 million USD in damages related to attorneys fees and other charges, without disclosing a factual basis for its determination of damages. The court dismissed Huawei's remaining allegations, including Huawei's claim that InterDigital improperly sought a worldwide license and improperly sought to bundle the licensing of essential patents on multiple generations of technologies. With respect to the second complaint, the court determined that, despite the fact that the FRAND requirement originates from ETSI's Intellectual Property Rights policy, which refers to French law, InterDigital's license offers to Huawei should be evaluated under Chinese law. Under Chinese law, the court concluded that the offers did not comply with FRAND. The court further ruled that the royalties to be paid by Huawei for InterDigital's 2G, 3G and 4G essential Chinese patents under Chinese law should not exceed 0.019% of the actual sales price of each Huawei product, without explanation as to how it arrived at this calculation. InterDigital intends to appeal both decisions.
Nokia, Huawei and ZTE 2011 USITC Proceeding (337-TA-800) and Related Delaware District Court Proceeding
On July 26, 2011, InterDigital's wholly owned subsidiaries InterDigital Communications, LLC (now InterDigital Communications, Inc.), InterDigital Technology Corporation and IPR Licensing, Inc. filed a complaint with the USITC against Nokia Corporation and Nokia Inc., Huawei Technologies Co., Ltd. and FutureWei Technologies, Inc. d/b/a Huawei Technologies (USA) and ZTE Corporation and ZTE (USA) Inc. (collectively, the “337-TA-800 Respondents”), alleging violations of Section 337 of the Tariff Act of 1930 in that they engaged in unfair trade practices by selling for importation into the United States, importing into the United States and/or selling after importation into the United States certain 3G wireless devices (including WCDMA- and cdma2000-capable mobile phones, USB sticks, mobile hotspots and tablets and components of such devices) that infringe seven of InterDigital's U.S. patents. The action also extends to certain WCDMA and cdma2000 devices incorporating WiFi functionality. InterDigital's complaint with the USITC seeks an exclusion order that would bar from entry into the United States any infringing 3G wireless devices (and components) that are imported by or on behalf of the 337-TA-800 Respondents, and also seeks a cease-and-desist order to bar further sales of infringing products that have already been imported into the United States. On October 5, 2011, InterDigital filed a motion requesting that the USITC add LG Electronics, Inc., LG Electronics U.S.A., Inc. and LG Electronics Mobilecomm U.S.A., Inc. as 337-TA-800 Respondents to the complaint and investigation, and that the Commission add an additional patent to the complaint and investigation as well. On December 5, 2011, the ALJ overseeing the proceeding granted this motion and, on December 21, 2011, the Commission determined not to review the ALJ's determination, thus adding the LG entities as 337-TA-800 Respondents and including allegations of infringement of the additional patent.
On January 6, 2012, the ALJ granted the parties' motion to extend the target date for completion of the investigation from February 28, 2013 to June 28, 2013. On March 23, 2012, the ALJ issued a new procedural schedule for the investigation, setting a trial date of October 22, 2012 to November 2, 2012.
On January 20, 2012, LG filed a motion to terminate the investigation as it relates to the LG entities, alleging that there is an arbitrable dispute. The ALJ granted LG's motion on June 4, 2012. On July 6, 2012, the Commission determined not to review the ALJ's order, and the investigation was terminated as to LG. On August 27, 2012, InterDigital filed a petition for review of the ALJ's order in the United States Court of Appeals for the Federal Circuit (the “Federal Circuit”). On September 14, 2012, the Federal Circuit granted LG's motion to intervene. On October 23, 2012, InterDigital filed its opening brief. Responsive briefs were filed on January 22, 2013, and InterDigital's reply brief was filed on February 8, 2013. The Federal Circuit has scheduled oral argument for April 4, 2013.
23
On the same date that we filed USITC Proceeding (337-TA-800), we filed a parallel action in the United States District Court for the District of Delaware against the 337-TA-800 Respondents alleging infringement of the same asserted patents identified in USITC Proceeding (337-TA-800). The Delaware District Court complaint seeks a permanent injunction and compensatory damages in an amount to be determined, as well as enhanced damages based on willful infringement, and recovery of reasonable attorneys' fees and costs. On September 23, 2011, the defendants in the Delaware District Court complaint filed a motion to stay the Delaware District Court action pending the parallel proceedings in the USITC. Because the USITC has instituted USITC Proceeding (337-TA-800), the defendants have a statutory right to a mandatory stay of the Delaware District Court proceeding pending a final determination in the USITC. On October 3, 2011, InterDigital amended the Delaware District Court complaint, adding LG as a defendant and adding the same additional patent that InterDigital requested be added to USITC Proceeding (337-TA-800). On October 11, 2011, the Delaware District Court granted the defendants' motion to stay.
On March 21, 2012, InterDigital filed an unopposed motion requesting that the Commission add newly formed entity Huawei Device USA, Inc. as a 337-TA-800 Respondent. On April 11, 2012, the ALJ granted this motion and, on May 1, 2012, the Commission determined not to review the ALJ's determination, thus adding Huawei Device USA, Inc. as a 337-TA-800 Respondent.
On July 20, 2012, in an effort to streamline the evidentiary hearing and narrow the remaining issues, InterDigital voluntarily moved to withdraw certain claims from the investigation, including all of the asserted claims from U.S. Patent No. 7,349,540. By doing so, InterDigital expressly reserved all arguments regarding the infringement, validity and enforceability of those claims. On July 24, 2012, the ALJ granted the motion. On August 8, 2012, the Commission determined not to review the ALJ's Initial Determination granting the motion to terminate the investigation as to the asserted claims of the '540 patent.
On August 23, 2012, the parties jointly moved to extend the target date in view of certain outstanding discovery to be provided by the 337-TA-800 Respondents and third parties. On September 10, 2012, the ALJ granted the motion and issued an Initial Determination setting the evidentiary hearing for February 12, 2013 to February 22, 2013. The ALJ also set June 28, 2013 as the deadline for his Initial Determination as to violation and October 28, 2013 as the target date for the Commission's Final Determination in the investigation. On October 1, 2012, the Commission determined not to review the Initial Determination setting those deadlines, thereby adopting them.
On January 2, 2013, in an effort to streamline the evidentiary hearing and narrow the remaining issues, InterDigital voluntarily moved to withdraw certain additional patent claims from the investigation. By doing so, InterDigital expressly reserved all arguments regarding the infringement, validity and enforceability of those claims. On January 3, 2013, the ALJ granted the motion. On January 23, 2013, the Commission determined not to review the ALJ's Initial Determination granting the motion to terminate the investigation as to those withdrawn patent claims. InterDigital continues to assert seven U.S. patents in this investigation.
The ALJ held the evidentiary hearing from February 12, 2013 to February 21, 2013. The ALJ's final Initial Determination is due by June 28, 2013, and the target date for completion of the investigation is October 28, 2013.
LG Arbitration
On March 19, 2012, LG Electronics, Inc. filed a demand for arbitration against the company's wholly owned subsidiaries InterDigital Technology Corporation, IPR Licensing, Inc. and InterDigital Communications, LLC (now InterDigital Communications, Inc.) with the American Arbitration Association's International Centre for Dispute Resolution (“ICDR”), initiating an arbitration in Washington, D.C. LG seeks a declaration that it is licensed to certain patents owned by InterDigital, including the patents asserted against LG in USITC Proceeding (337-TA-800). On April 18, 2012, InterDigital filed an Answering Statement objecting to the jurisdiction of the ICDR on the ground that LG's claims are not arbitrable, and denying all claims made by LG in its demand for arbitration. The issue of whether LG's claim to arbitrability is wholly groundless is currently on appeal before the Federal Circuit. In January 2013, the appointment of the arbitral tribunal was completed. The tribunal has tentatively set the hearing in the arbitration for the fall of 2013.
Nokia 2007 USITC Proceeding (337-TA-613), Related Delaware District Court Proceeding and Federal Circuit Appeal
In August 2007, InterDigital filed a USITC complaint against Nokia Corporation and Nokia, Inc., alleging a violation of Section 337 of the Tariff Act of 1930 in that Nokia engaged in an unfair trade practice by selling for importation into the United States, importing into the United States and/or selling after importation into the United States certain 3G mobile handsets and components that infringe two of InterDigital's patents. In November and December 2007, a third patent and a fourth patent were added to our complaint against Nokia. The complaint seeks an exclusion order barring from entry into the United States infringing 3G mobile handsets and components that are imported by or on behalf of Nokia. Our complaint also seeks a cease-and-desist order to bar further sales of infringing Nokia products that have already been imported into the United States.
24
In addition, on the same date as our filing of USITC Proceeding (337-TA-613), we also filed a complaint in the Delaware District Court alleging that Nokia's 3G mobile handsets and components infringe the same two InterDigital patents identified in the original USITC complaint. The complaint seeks a permanent injunction and damages in an amount to be determined. This Delaware action was stayed on January 10, 2008, pursuant to the mandatory, statutory stay of parallel district court proceedings at the request of a respondent in a USITC investigation. Thus, this Delaware action is stayed with respect to the patents in this case until the USITC's determination on these patents becomes final, including any appeals. The Delaware District Court permitted InterDigital to add to the stayed Delaware action the third and fourth patents InterDigital asserted against Nokia in the USITC action.
On August 14, 2009, the ALJ overseeing USITC Proceeding (337-TA-613) issued an Initial Determination finding no violation of Section 337 of the Tariff Act of 1930. The Initial Determination found that InterDigital's patents were valid and enforceable, but that Nokia did not infringe these patents. In the event that a Section 337 violation were to be found by the Commission, the ALJ recommended the issuance of a limited exclusion order barring entry into the United States of infringing Nokia 3G WCDMA handsets and components, as well as the issuance of appropriate cease-and-desist orders.
On October 16, 2009, the Commission issued a notice that it had determined to review in part the Initial Determination, and that it affirmed the ALJ's determination of no violation and terminated the investigation. The Commission determined to review the claim construction of the patent claim terms “synchronize” and “access signal” and also determined to review the ALJ's validity determinations. On review, the Commission modified the ALJ's claim construction of “access signal” and took no position with regard to the claim term “synchronize” or the validity determinations. The Commission determined not to review the remaining issues decided in the Initial Determination.
On November 30, 2009, InterDigital filed with the Federal Circuit a petition for review of certain rulings by the USITC. In the appeal, neither the construction of the term “synchronize” nor the issue of validity can be raised because the Commission took no position on these issues in its Final Determination. On December 17, 2009, Nokia filed a motion to intervene in the appeal, which was granted by the Federal Circuit on January 4, 2010. In its appeal, InterDigital seeks reversal of the Commission's claim constructions and non-infringement findings with respect to certain claim terms in U.S. Patent Nos. 7,190,966 and 7,286,847, vacatur of the Commission's determination of no Section 337 violation and a remand for further proceedings before the Commission. InterDigital is not appealing the Commission's determination of non-infringement with respect to U.S. Patent Nos. 6,973,579 and 7,117,004. On August 1, 2012, the Federal Circuit issued its decision in the appeal, holding that the Commission had erred in interpreting the claim terms at issue and reversing the Commission's finding of non-infringement. The Federal Circuit adopted InterDigital's interpretation of such claim terms and remanded the case back to the Commission for further proceedings. In addition, the Federal Circuit rejected Nokia's argument that InterDigital did not satisfy the domestic industry requirement. On September 17, 2012, Nokia filed a combined petition for rehearing by the panel or en banc with the Federal Circuit. On January 10, 2013, the Federal Circuit denied Nokia's petition. Nokia has until April 10, 2013 to petition the United States Supreme Court for a writ of certiorari.
On January 17, 2013, the Federal Circuit issued its mandate remanding USITC Proceeding (337-TA-613) to the Commission for further proceedings. On February 4, 2013, the Commission issued an order requiring the parties to submit comments regarding what further proceedings must be conducted to comply with the Federal Circuit's August 1, 2012 judgment, including whether any issues should be remanded to an ALJ to be assigned to this investigation.
Nokia Delaware Proceeding
In January 2005, Nokia filed a complaint in the Delaware District Court against InterDigital Communications Corporation (now InterDigital, Inc.) and its wholly owned subsidiary InterDigital Technology Corporation, alleging that we have used false or misleading descriptions or representations regarding our patents' scope, validity and applicability to products built to comply with 3G standards (the “Nokia Delaware Proceeding”). Nokia's amended complaint seeks declaratory relief, injunctive relief and damages, including punitive damages, in an amount to be determined. We subsequently filed counterclaims based on Nokia's licensing activities as well as Nokia's false or misleading descriptions or representations regarding Nokia's 3G patents and Nokia's undisclosed funding and direction of an allegedly independent study of the essentiality of 3G patents. Our counterclaims seek injunctive relief as well as damages, including punitive damages, in an amount to be determined.
On December 10, 2007, pursuant to a joint request by the parties, the Delaware District Court entered an order staying the proceedings pending the full and final resolution of USITC Proceeding (337-TA-613). Specifically, the full and final resolution of USITC Proceeding (337-TA-613) includes any initial or final determinations of the ALJ overseeing the proceeding, the USITC and any appeals therefrom, and any remand proceedings thereafter. Pursuant to the order, the parties and their affiliates are generally prohibited from initiating against the other parties, in any forum, any claims or counterclaims that are the same as the claims and counterclaims pending in the Nokia Delaware Proceeding, and should any of the same or similar claims or counterclaims be initiated by a party, the other parties may seek dissolution of the stay.
25
Except for the Nokia Delaware Proceeding and the Nokia Arbitration Concerning Presentations (described below), the order does not affect any of the other legal proceedings between the parties.
Nokia Arbitration Concerning Presentations
In November 2006, InterDigital Communications Corporation (now InterDigital, Inc.) and its wholly owned subsidiary InterDigital Technology Corporation filed a request for arbitration with the International Chamber of Commerce against Nokia (the “Nokia Arbitration Concerning Presentations”), claiming that certain presentations Nokia has attempted to use in support of its claims in the Nokia Delaware Proceeding (described above) are confidential and, as a result, may not be used in the Nokia Delaware Proceeding pursuant to the parties' agreement.
The December 10, 2007 order entered by the Delaware District Court to stay the Nokia Delaware Proceeding also stayed the Nokia Arbitration Concerning Presentations pending the full and final resolution of USITC Proceeding (337-TA-613).
Other
We are party to certain other disputes and legal actions in the ordinary course of business. We do not believe that these matters, even if adversely adjudicated or settled, would have a material adverse effect on our financial condition, results of operations or cash flows.
Contingency related to Technology Solutions Agreement Arbitration
Our wholly owned subsidiaries InterDigital Communications LLC and InterDigital Technology Corporation are engaged in an arbitration relating to a contractual dispute concerning the scope of royalty obligations and the scope of the licenses granted under one of our technology solutions agreements. The arbitration hearing took place in late June 2012, and a decision is expected in early 2013. As of
December 31, 2012
, we have deferred related revenue of
$44.3 million
pending the resolution of this arbitration and recorded such amount within short-term deferred revenue since we expect a decision within the next twelve months.
|
Item 4.
|
MINE SAFETY DISCLOSURES.
|
Not applicable.
|
Item 5.
|
MARKET FOR REGISTRANT’S COMMON EQUITY, RELATED STOCKHOLDER MATTERS AND ISSUER PURCHASES OF EQUITY SECURITIES.
|
Market Information
The principal market for our common stock is the NASDAQ Stock Market (“NASDAQ”). The following table sets forth the high and low sales prices of our common stock for each quarterly period in
2012
and
2011
, as reported by NASDAQ.
|
High
|
Low
|
||||||
|
2012
|
|
|
|
|
|||
|
First quarter
|
$
|
46.09
|
|
$
|
34.86
|
|
|
|
Second quarter
|
35.23
|
|
22.54
|
|
|||
|
Third quarter
|
37.27
|
|
25.50
|
|
|||
|
Fourth quarter
|
45.05
|
|
34.02
|
|
|||
|
High
|
Low
|
||||||
|
2011
|
|
|
|
|
|||
|
First quarter
|
$
|
58.64
|
|
$
|
40.15
|
|
|
|
Second quarter
|
49.57
|
|
34.61
|
|
|||
|
Third quarter
|
82.50
|
|
41.20
|
|
|||
|
Fourth quarter
|
52.60
|
|
38.51
|
|
|||
26
Holders
As of February 22, 2013, there were
908
holders of record of our common stock.
Dividends
Prior to 2010, we had not declared any cash dividends on our shares of common stock. In fourth quarter 2010, our Board of Directors approved the company’s initial dividend policy and declared the first quarterly cash dividend of $0.10 per share. Cash dividends on the company's outstanding common stock declared in
2012
and
2011
were as follows (in thousands, except per share data):
|
2012
|
Per Share
|
Total
|
Cumulative by Fiscal Year
|
||||||||
|
First quarter
|
$
|
0.10
|
|
$
|
4,469
|
|
$
|
4,469
|
|
||
|
Second quarter
|
0.10
|
|
4,348
|
|
8,817
|
|
|||||
|
Third quarter
|
0.10
|
|
4,095
|
|
12,912
|
|
|||||
|
Fourth quarter
|
1.60
|
|
65,643
|
|
78,555
|
|
|||||
|
$
|
1.90
|
|
$
|
78,555
|
|
||||||
|
2011
|
|||||||||||
|
First quarter
|
$
|
0.10
|
|
$
|
4,535
|
|
$
|
4,535
|
|
||
|
Second quarter
|
0.10
|
|
4,540
|
|
9,075
|
|
|||||
|
Third quarter
|
0.10
|
|
4,549
|
|
13,624
|
|
|||||
|
Fourth quarter
|
0.10
|
|
4,570
|
|
18,194
|
|
|||||
|
$
|
0.40
|
|
$
|
18,194
|
|
||||||
On December 5, 2012, we announced that our Board of Directors had declared a special cash dividend of $1.50 per share on InterDigital common stock. The dividend was payable on December 28, 2012 to stockholders of record as of the close of business on December 17, 2012. We currently expect to continue to pay dividends comparable to our quarterly $0.10 cash dividends in the future; however, continued payment of cash dividends and changes in the company’s dividend policy will depend on the company’s earnings, financial condition, capital resources and capital requirements, alternative uses of capital, restrictions imposed by any existing debt, economic conditions and other factors considered relevant by our Board of Directors.
Performance Graph
The following graph compares five-year cumulative total returns of the company, the NASDAQ Composite Index and the NASDAQ Telecommunications Stock Index. The graph assumes $100 was invested in the common stock of InterDigital and each index as of December 31, 2007 and that all dividends were re-invested.
27
COMPARISON OF 5-YEAR CUMULATIVE TOTAL RETURN
among InterDigital, Inc., the NASDAQ Composite Index
and the NASDAQ Telecommunications Index

|
12/07
|
12/08
|
12/09
|
12/10
|
12/11
|
12/12
|
|
|
InterDigital, Inc.
|
100.00
|
117.87
|
113.84
|
178.48
|
188.79
|
186.36
|
|
NASDAQ Composite
|
100.00
|
59.03
|
82.25
|
97.32
|
98.63
|
110.78
|
|
NASDAQ Telecommunications
|
100.00
|
57.58
|
72.97
|
86.05
|
90.3
|
89.62
|
Issuer Purchases of Equity Securities
Repurchase of Common Stock
During
2012
, we repurchased a cumulative total of
4.9 million
shares of our common stock for an aggregate of
$152.7 million
under the 2009 Repurchase Program and the 2012 Repurchase Program, each as defined below. We made no share repurchases during
2011
or 2010.
In March 2009, our Board of Directors authorized a
$100.0 million
share repurchase program (the “2009 Repurchase Program”). The company repurchased shares under the 2009 Repurchase Program through pre-arranged trading plans. During
2012
,
we repurchased
2.3 million
s
hares under the 2009 Repurchase Program for
$75.0 million
.
The 2009 Repurchase Program was completed in second quarter 2012, bringing the cumulative repurchase total under the program to approximately
approximately
3.3 million
shares at a cost of
$
100.0 million
.
In May 2012, our Board of Directors authorized a new share repurchase program, which was then expanded in June 2012 to increase the amount of the program from $100.0 million to
$200.0 million
(the "2012 Repurchase Program"). The company may repurchase shares under the 2012 Repurchase Program through open market purchases, pre-arranged trading plans or privately negotiated purchases. During
2012
, we repurchased approximately
approximately
2.6 million
shares under the 2012 Repurchase Program for
$77.7 million
.
There were no repurchases of common stock during fourth quarter 2012, or from January 1, 2013 through February 25, 2013.
28
|
Item 6.
|
SELECTED FINANCIAL DATA.
|
|
2012
|
2011
|
2010
|
2009
|
2008
|
|||||||||||||||
|
|
(in thousands except per share data)
|
||||||||||||||||||
|
Consolidated statements of operations data:
|
|
|
|
|
|
|
|
|
|
|
|||||||||
|
Revenues (a)
|
$
|
663,063
|
|
$
|
301,742
|
|
$
|
394,545
|
|
$
|
297,404
|
|
$
|
228,469
|
|
||||
|
Income from operations (b)
|
$
|
419,030
|
|
$
|
134,757
|
|
$
|
235,873
|
|
$
|
113,889
|
|
$
|
36,533
|
|
||||
|
Income tax provision (c)
|
$
|
(136,830
|
)
|
$
|
(35,140
|
)
|
$
|
(84,831
|
)
|
$
|
(25,447
|
)
|
$
|
(13,755
|
)
|
||||
|
Net income applicable to common shareholders
|
$
|
271,804
|
|
$
|
89,468
|
|
$
|
153,616
|
|
$
|
87,256
|
|
$
|
26,207
|
|
||||
|
Net income per common share — basic
|
$
|
6.31
|
|
$
|
1.97
|
|
$
|
3.48
|
|
$
|
2.02
|
|
$
|
0.58
|
|
||||
|
Net income per common share — diluted
|
$
|
6.26
|
|
$
|
1.94
|
|
$
|
3.43
|
|
$
|
1.97
|
|
$
|
0.57
|
|
||||
|
Weighted average number of common shares outstanding — basic
|
43,070
|
|
45,411
|
|
44,084
|
|
43,295
|
|
44,928
|
|
|||||||||
|
Weighted average number of common shares outstanding — diluted
|
43,396
|
|
46,014
|
|
44,824
|
|
44,327
|
|
45,964
|
|
|||||||||
|
Cash dividends declared per common share (d)
|
$
|
1.90
|
|
$
|
0.40
|
|
$
|
0.10
|
|
$
|
—
|
|
$
|
—
|
|
||||
|
Consolidated balance sheets data:
|
|
|
|
|
|
|
|
|
|||||||||||
|
Cash and cash equivalents
|
$
|
349,843
|
|
$
|
342,211
|
|
$
|
215,451
|
|
$
|
210,863
|
|
$
|
100,144
|
|
||||
|
Short-term investments
|
227,436
|
|
335,783
|
|
326,218
|
|
198,943
|
|
41,516
|
|
|||||||||
|
Working capital
|
641,434
|
|
595,734
|
|
440,996
|
|
449,762
|
|
114,484
|
|
|||||||||
|
Total assets
|
1,056,609
|
|
996,968
|
|
874,643
|
|
908,485
|
|
405,768
|
|
|||||||||
|
Total debt
|
200,391
|
|
192,709
|
|
468
|
|
1,052
|
|
2,929
|
|
|||||||||
|
Total shareholders’ equity
|
$
|
518,705
|
|
$
|
471,682
|
|
$
|
353,116
|
|
$
|
169,537
|
|
$
|
87,660
|
|
||||
_______________________________________
|
(a)
|
In 2012, our revenues included
$384.0 million
associated with patent sales.
|
|
(b)
|
Our income from operations included charges of
$12.5 million
and
$38.6 million
in 2012 and 2009, respectively, associated with actions to reposition the company’s operations.
|
|
(c)
|
In 2012, our income tax provision included a tax benefit of $6.7 million related to the release of valuation allowances on deferred tax assets, which we now expect to utilize. In 2011, our income tax provision included benefits of $6.8 million related to the favorable resolution of tax contingencies and $1.5 million associated with after-tax interest income on tax refunds. In 2009, our income tax provision included a net benefit of approximately $16.4 million, primarily related to the recognition of foreign tax credits. See Note 11 to the Consolidated Financial Statements for further discussion on these foreign tax credits.
|
|
(d)
|
On December 5, 2012, we announced that our Board of Directors had declared a special cash dividend of $1.50 per share on InterDigital common stock. The dividend was payable on December 28, 2012 to stockholders of record as of the close of business on December 17, 2012.
|
|
Item 7.
|
MANAGEMENT’S DISCUSSION AND ANALYSIS OF FINANCIAL CONDITION AND RESULTS OF OPERATIONS.
|
OVERVIEW
The following discussion should be read in conjunction with the Selected Financial Data, the Consolidated Financial Statements and the Notes thereto contained in this Form 10-K.
Business
InterDigital designs and develops advanced technologies that enable and enhance wireless communications and capabilities. Since our founding in 1972, we have designed and developed a wide range of innovations that are used in digital cellular and wireless products and networks, including 2G, 3G, 4G and IEEE 802-related products and networks. We are a leading contributor of intellectual property to the wireless communications industry.
29
Given our long history and focus on advanced research and development, InterDigital has amassed one of the most significant patent portfolios in the wireless industry. As of December 31, 2012, InterDigital's wholly owned subsidiaries held a portfolio of over 19,000 patents and patent applications related to the fundamental technologies that enable wireless communications. In that portfolio are a number of patents and patent applications that we believe are or may be essential or may become essential to cellular and other wireless standards, including the 2G, 3G, 4G and the IEEE 802 suite of standards. That portfolio has largely been built through internal development, supplemented by joint development projects with other companies as well as select patent acquisitions. Products incorporating our patented inventions include: mobile devices, such as cellular phones, tablets, notebook computers and wireless personal digital assistants; wireless infrastructure equipment, such as base stations; and components, dongles and modules for wireless devices.
InterDigital derives revenues primarily from patent licensing and sales, technology solutions licensing and sales and engineering services. In
2012
,
2011
and
2010
, our total revenues were
$663.1 million
,
$301.7 million
and
$394.5 million
, respectively. In 2012, we recorded
$384.0 million
of revenue related to the sale of less than ten percent of our patent portfolio. Our patent licensing revenues in 2012, 2011 and 2010 were
$276.6 million
,
$295.3 million
and
$370.2 million
, respectively.
In
2012
, the amortization of fixed-fee royalty payments accounted for approximately
49%
of our patent licensing revenues. These fixed-fee revenues are not affected by the related licensees’ success in the market or the general economic climate. The majority of the remaining portion of our patent licensing revenue is variable in nature due to the per-unit structure of the related license agreements. Approximately 82% of this per-unit, variable portion for
2012
related to sales by two of our licensees with concentrations in the smartphone market and our collection of Japanese licensees, for whom the majority of the sales are within Japan. As a result, our per-unit, variable patent license royalties have been, and will continue to be, largely influenced by the sales performance of these licensees.
Strategic Alternatives Review and Expansion of Business Strategy
On July 19, 2011, we announced that our Board of Directors had initiated a process to explore and evaluate potential strategic alternatives for the company, including a sale or other transaction. We announced on January 23, 2012, that our Board of Directors had concluded its review of strategic alternatives for the company and determined that it was in the best interests of the company and its shareholders to execute on the company's business plan and to expand the plan to include patent sales and patent licensing partnerships as additional vehicles to generate revenue. On October 23, 2012, we announced a further expansion of our business strategy by enhancing our technology sourcing and establishing a business unit, InterDigital Solutions, dedicated to monetizing the company's market-ready technologies and research capabilities. For additional information regarding the company's business strategy, see Part I, Item 1, of this Form 10-K.
Repositioning
On October 23, 2012, we announced that, as part of our ongoing expense management, we had initiated a voluntary early retirement program ("VERP"). In connection with the VERP, we incurred a related repositioning charge of
$12.5 million
in
2012
. During 2012, cash payments of
$1.4 million
were made for severance and related costs associated with the VERP. We have accrued
$11.1 million
for severance and related costs at the balance sheet date. The
$12.5 million
charge is included within the repositioning line of our Consolidated Statements of Income. Approximately
60
employees elected to participate in the VERP across our locations, the majority of whose last day was December 15, 2012. The majority of the charge recorded in 2012 represents cash obligations associated with severance. We expect to recognize an additional
$1.0 million
to
$2.0 million
charge related to the VERP in 2013. All of the severance and related costs are scheduled to be paid within twelve months of the balance sheet date.
We did not incur any repositioning charges during
2011
or
2010
.
Patent Sales
On June 18, 2012, we announced that certain of our subsidiaries had entered into a definitive agreement to sell approximately 1,700 patents and patent applications, including approximately 160 issued U.S. patents and approximately 40 U.S. patent applications, to Intel Corporation for $375.0 million. The sale agreement involved patents primarily related to 3G, LTE and 802.11 technologies. Upon completion of the transaction in third quarter 2012, we recognized $375.0 million as patent sales revenue and $15.6 million as patent sales expense, which was recorded within the patent administration and licensing line on our Consolidated Statements of Income. Included in the patent sales expense was the remaining net book value of the patents sold, as well as commissions and legal and accounting services fees paid in conjunction with the sale.
We intend to pursue additional patent sale opportunities as part of our expanded strategy. However, we are unable to predict the timing and magnitude of any such sales due to the unpredictable nature of the sales cycle for such transactions.
30
Patent License Agreements
In fourth quarter 2012, we entered into an agreement that extends the term of our worldwide, non-exclusive, royalty-bearing patent license agreement with BlackBerry. In addition to extending the patent license agreement for a multi-year period, the parties agreed to amend the patent license to add coverage for 4G products, including LTE and LTE-Advanced products.
Also in fourth quarter 2012, we entered into a patent license agreement with Sony that covers Sony's sale of 3G and 4G products.
Additionally, during 2012, we entered into new or expanded patent license agreements with u-blox AG, Cinterion Wireless Modules GmbH, Sierra Wireless, Inc., Acer Inc., Pantech Co. Ltd., Wistron Corporation and Quanta Computers, Inc. These agreements cover various wireless modules for consumer electronics and M2M devices, including handsets, wireless modules, computers and tablets designed to operate in accordance with 4G wireless technologies, LTE, LTE-Advanced and WiMax standards, in addition to 2G and 3G wireless technologies.
Expiration of Patent License Agreement with Samsung
In 2012, we recognized the remaining $102.7 million of revenue associated with the 2009 Samsung PLA. The 2009 Samsung PLA covered the sale of single-mode terminal units and infrastructure designed to operate in accordance with TDMA-based 2G standards, which portion of the license became paid up in 2010, and the sale of terminal units and infrastructure designed to operate in accordance with 3G standards through 2012. Pursuant to the 2009 Samsung PLA, Samsung paid InterDigital $400.0 million in four equal installments over an 18-month period. Samsung paid the first two $100.0 million installments in 2009. We received the third and fourth $100.0 million installments in January 2010 and July 2010, respectively. Upon expiration of the 2009 Samsung PLA, Samsung retained its paid-up license to sell single-mode terminal units and infrastructure designed to operate in accordance with TDMA-based 2G standards and became unlicensed as to all other products covered under the agreement.
In January 2013, we filed a complaint with the USITC against Samsung and seven other respondents, alleging that they engaged in unfair trade practices by selling for importation into the United States, importing into the United States and/or selling after importation into the United States certain 3G and 4G wireless devices that infringe up to seven of InterDigital's U.S. patents.
Patent Licensing Royalties
Patent licensing royalties in
2012
of
$276.6 million
decreased
6%
from the prior year. This
$18.7 million
year-over-year
decrease
in patent licensing royalties was primarily driven by a decrease in royalties from our Japanese per-unit licensees and lower shipments from our per-unit licensees with concentrations in the smartphone market. Refer to "Results of Operations --
2012
Compared with
2011
" for further discussion of our
2012
revenue.
Technology Solutions and Engineering Services
We are engaged in arbitration to determine whether royalties are owed on specific product classes pursuant to one of our technology solutions agreements. As of
December 31, 2012
and
December 31, 2011
, we have deferred related revenue of
$44.3 million
and
$29.7 million
, respectively. These amounts have either been collected or recorded in accounts receivable on their respective balance sheet dates.
During fourth quarter 2012, we entered into an agreement with Convida Wireless, our joint venture with Sony Corporation of America, to provide M2M research and platform development. Work under this agreement commenced during first quarter 2013.
USITC Proceedings
Samsung, Nokia, Huawei and ZTE 2013 USITC Proceeding (337-TA-868) and Related Delaware District Court Proceedings
On January 2, 2013, the company's wholly owned subsidiaries InterDigital Communications, Inc., InterDigital Technology Corporation, IPR Licensing, Inc. and InterDigital Holdings, Inc. filed a complaint with the USITC against Samsung Electronics Co., Ltd., Samsung Electronics America, Inc. and Samsung Telecommunications America, LLC, Nokia Corporation and Nokia Inc., Huawei Technologies Co., Ltd., Huawei Device USA, Inc. and FutureWei Technologies, Inc. d/b/a
31
Huawei Technologies (USA) and ZTE Corporation and ZTE (USA) Inc. (collectively, the “337-TA-868 Respondents”), alleging violations of Section 337 of the Tariff Act of 1930 in that they engaged in unfair trade practices by selling for importation into the United States, importing into the United States and/or selling after importation into the United States certain 3G and 4G wireless devices (including WCDMA-, cdma2000- and LTE-capable mobile phones, USB sticks, mobile hotspots, laptop computers and tablets and components of such devices) that infringe one or more of up to seven of InterDigital's U.S. patents. The complaint also extends to certain WCDMA and cdma2000 devices incorporating WiFi functionality. InterDigital's complaint with the USITC seeks an exclusion order that would bar from entry into the United States infringing 3G or 4G wireless devices (and components), including LTE devices, that are imported by or on behalf of the 337-TA-868 Respondents, and also seeks a cease-and-desist order to bar further sales of infringing products that have already been imported into the United States. Certain of the asserted patents have been asserted against Nokia, Huawei and ZTE in earlier pending USITC proceedings (including the Nokia, Huawei and ZTE 2011 USITC Proceeding (337-TA-800) and the Nokia 2007 USITC Proceeding (337-TA-613), as set forth below) and therefore are not being asserted against those 337-TA-868 Respondents in this investigation. On February 6, 2013, the Administrative Law Judge (“ALJ”) overseeing the proceeding issued an order setting a target date of June 4, 2014 for the Commission's final determination in the investigation, with the ALJ's Initial Determination on alleged violation due on February 4, 2014. On February 21, 2013, each 337-TA-868 Respondent filed their respective responses to the complaint.
On February 21, 2013, Samsung moved for partial termination of the investigation as to six of the seven patents asserted against Samsung, alleging that Samsung was authorized to import the specific 3G or 4G devices that InterDigital relied on to form the basis of its complaint. InterDigital's opposition is due March 4, 2013.
On February 22, 2013, Huawei and ZTE moved to stay the investigation pending their respective requests to the United States District Court for the District of Delaware to set a FRAND royalty rate for a license that covers the asserted patents, or in the alternative, until a Final Determination issues in the 337-TA-800 investigation. InterDigital's opposition is due March 4, 2013.
On January 2, 2013, the company's wholly owned subsidiaries InterDigital Communications, Inc., InterDigital Technology Corporation, IPR Licensing, Inc. and InterDigital Holdings, Inc. filed four related district court actions in the Delaware District Court against the 337-TA-868 Respondents. These complaints allege that each of the defendants infringes the same patents with respect to the same products alleged in the complaint filed by InterDigital in USITC Proceeding (337-TA-868). The complaints seek permanent injunctions and compensatory damages in an amount to be determined, as well as enhanced damages based on willful infringement and recovery of reasonable attorneys' fees and costs. On January 24, 2013, Huawei filed its answer and counterclaims to InterDigital's complaint. Huawei asserted counterclaims for breach of contract, equitable estoppel, waiver of right to enjoin and declarations that InterDigital has not offered or granted Huawei licenses on FRAND terms, declarations seeking the determination of FRAND terms and declarations of noninfringement, invalidity and unenforceability of the asserted patents. In addition to the declaratory relief specified in its counterclaims, Huawei seeks specific performance of InterDigital's purported contracts with Huawei and standards-setting organizations, appropriate damages in an amount to be determined at trial, reasonable attorneys' fees and such other relief as the court may deem appropriate. On January 31, 2013, ZTE filed its answer and counterclaims to InterDigital's complaint; ZTE asserted counterclaims for breach of contract, equitable estoppel, waiver of right to enjoin and declarations that InterDigital has not offered ZTE licenses on FRAND terms, declarations seeking the determination of FRAND terms and declarations of noninfringement, invalidity and unenforceability. Nokia and Samsung have not yet responded to the complaints against them. In addition to the declaratory relief specified in its counterclaims, ZTE seeks specific performance of InterDigital's purported contracts with ZTE and standards-setting organizations, appropriate damages in an amount to be determined at trial, reasonable attorneys' fees and such other relief as the court may deem appropriate.
On February 11, 2013, Huawei and ZTE filed motions to expedite discovery and trial on their FRAND-related counterclaims. Huawei seeks a schedule for discovery and trial on its FRAND-related counterclaims that would afford Huawei the opportunity to accept a FRAND license rate at the earliest opportunity, and in any case before December 28, 2013. ZTE seeks a trial on its FRAND-related counterclaims no later than November 2013.
Nokia, Huawei and ZTE 2011 USITC Proceeding (337-TA-800) and Related Delaware District Court Proceeding
On July 26, 2011, InterDigital's wholly owned subsidiaries InterDigital Communications, LLC (now InterDigital Communications, Inc.), InterDigital Technology Corporation and IPR Licensing, Inc. filed a complaint with the USITC against Nokia Corporation and Nokia Inc., Huawei Technologies Co., Ltd. and FutureWei Technologies, Inc. d/b/a Huawei Technologies (USA) and ZTE Corporation and ZTE (USA) Inc., alleging violations of Section 337 of the Tariff Act of 1930 in that they engaged in unfair trade practices by selling for importation into the United States, importing into the United States and/or selling after importation into the United States certain 3G wireless devices (including WCDMA- and cdma2000-capable mobile phones, USB sticks, mobile hotspots and tablets and components of such devices) that infringe seven of InterDigital's
32
U.S. patents. The action also extends to certain WCDMA and cdma2000 devices incorporating WiFi functionality. InterDigital's complaint with the USITC seeks an exclusion order that would bar from entry into the United States any infringing 3G wireless devices (and components) that are imported by or on behalf of the 337-TA-800 Respondents, and also seeks a cease-and-desist order to bar further sales of infringing products that have already been imported into the United States. On October 5, 2011, InterDigital filed a motion requesting that the USITC add LG Electronics, Inc., LG Electronics U.S.A., Inc. and LG Electronics Mobilecomm U.S.A., Inc. as 337-TA-800 Respondents to the complaint and investigation, and that the Commission add an additional patent to the complaint and investigation as well. On December 5, 2011, the ALJ overseeing the proceeding granted this motion and, on December 21, 2011, the Commission determined not to review the ALJ's determination, thus adding the LG entities as 337-TA-800 Respondents and including allegations of infringement of the additional patent.
On January 20, 2012, LG filed a motion to terminate the investigation as it relates to the LG entities, alleging that there is an arbitrable dispute. The ALJ granted LG's motion on June 4, 2012. On July 6, 2012, the Commission determined not to review the ALJ's order, and the investigation was terminated as to LG. On August 27, 2012, InterDigital filed a petition for review of the ALJ's order in the Federal Circuit. On September 14, 2012, the Federal Circuit granted LG's motion to intervene. On October 23, 2012, InterDigital filed its opening brief. Responsive briefs were filed on January 22, 2013, and InterDigital's reply brief was filed on February 8, 2013. The Federal Circuit has scheduled oral argument for April 4, 2013.
On the same date that we filed USITC Proceeding (337-TA-800), we filed a parallel action in the United States District Court for the District of Delaware against the 337-TA-800 Respondents alleging infringement of the same asserted patents identified in USITC Proceeding (337-TA-800). The Delaware District Court complaint seeks a permanent injunction and compensatory damages in an amount to be determined, as well as enhanced damages based on willful infringement, and recovery of reasonable attorneys' fees and costs. On September 23, 2011, the defendants in the Delaware District Court complaint filed a motion to stay the Delaware District Court action pending the parallel proceedings in the USITC. Because the USITC has instituted USITC Proceeding (337-TA-800), the defendants have a statutory right to a mandatory stay of the Delaware District Court proceeding pending a final determination in the USITC. On October 3, 2011, InterDigital amended the Delaware District Court complaint, adding LG as a defendant and adding the same additional patent that InterDigital requested be added to USITC Proceeding (337-TA-800). On October 11, 2011, the Delaware District Court granted the defendants' motion to stay.
On March 21, 2012, InterDigital filed an unopposed motion requesting that the Commission add newly formed entity Huawei Device USA, Inc. as a 337-TA-800 Respondent. On April 11, 2012, the ALJ granted this motion and, on May 1, 2012, the Commission determined not to review the ALJ's determination, thus adding Huawei Device USA, Inc. as a 337-TA-800 Respondent.
On July 20, 2012, in an effort to streamline the evidentiary hearing and narrow the remaining issues, InterDigital voluntarily moved to withdraw certain claims from the investigation, including all of the asserted claims from U.S. Patent No. 7,349,540. By doing so, InterDigital expressly reserved all arguments regarding the infringement, validity and enforceability of those claims. On July 24, 2012, the ALJ granted the motion. On August 8, 2012, the Commission determined not to review the ALJ's Initial Determination granting the motion to terminate the investigation as to the asserted claims of the '540 patent.
On August 23, 2012, the parties jointly moved to extend the target date in view of certain outstanding discovery to be provided by the 337-TA-800 Respondents and third parties. On September 10, 2012, the ALJ granted the motion and issued an Initial Determination setting the evidentiary hearing for February 12, 2013 to February 22, 2013. The ALJ also set June 28, 2013 as the deadline for his Initial Determination as to violation and October 28, 2013 as the target date for the Commission's Final Determination in the investigation. On October 1, 2012, the Commission determined not to review the Initial Determination setting those deadlines, thereby adopting them.
On January 2, 2013, in an effort to streamline the evidentiary hearing and narrow the remaining issues, InterDigital voluntarily moved to withdraw certain additional patent claims from the investigation. By doing so, InterDigital expressly reserved all arguments regarding the infringement, validity and enforceability of those claims. On January 3, 2013, the ALJ granted the motion. On January 23, 2013, the Commission determined not to review the ALJ's Initial Determination granting the motion to terminate the investigation as to those withdrawn patent claims. InterDigital continues to assert seven U.S. patents in this investigation.
The ALJ held the evidentiary hearing from February 12, 2013 to February 21, 2013. The ALJ's final Initial Determination is due by June 28, 2013, and the target date for completion of the investigation is October 28, 2013.
Nokia 2007 USITC Proceeding (337-TA-613), Related Delaware District Court Proceeding and Federal Circuit Appeal
On August 1, 2012, the Federal Circuit issued its decision in InterDigital's appeal of the USITC's Final Determination in this proceeding, holding that the Commission had erred in interpreting the claim terms at issue and reversing the
33
Commission's finding of non-infringement. The Federal Circuit adopted InterDigital's interpretation of such claim terms and remanded the case back to the Commission for further proceedings. In addition, the Federal Circuit rejected Nokia's argument that InterDigital did not satisfy the domestic industry requirement. On September 17, 2012, Nokia filed a combined petition for rehearing by the panel or en banc with the Federal Circuit. On January 10, 2013, the Federal Circuit denied Nokia's petition. Nokia has until April 10, 2013 to petition the United States Supreme Court for a writ of certiorari.
On January 17, 2013, the Federal Circuit issued its mandate remanding USITC Proceeding (337-TA-613) to the Commission for further proceedings. On February 4, 2013, the Commission issued an order requiring the parties to submit comments regarding what further proceedings must be conducted to comply with the Federal Circuit's August 1, 2012 judgment, including whether any issues should be remanded to an ALJ to be assigned to this investigation.
Please see Part I, Item 3, of this Form 10-K for a fuller discussion of our USITC proceedings.
Cash and Short-Term Investments
At
December 31, 2012
, we had
$577.3 million
of cash and short-term investments and an additional $291.7 million of fixed or prepayments due under agreements signed, including
$169.9 million
recorded in accounts receivable as it is due within twelve months of the balance sheet date. A substantial portion of this balance relates to fixed and prepaid royalty payments we have received that relate to future sales of our licensees’ products. As a result, our cash receipts from existing licenses subject to fixed and prepaid royalties will be reduced in future periods. During
2012
, we recorded
$472.7 million
of cash receipts related to patent licensing, technology solutions agreements and patent sales as follows (in thousands):
|
|
Cash In
|
||
|
Fixed royalty payments
|
$
|
8,048
|
|
|
Current royalties and past sales
|
54,513
|
|
|
|
Prepaid royalties
|
12,816
|
|
|
|
Technology solutions
|
17,367
|
|
|
|
Patent Sales
|
380,000
|
|
|
|
|
$
|
472,744
|
|
The
$20.9 million
of fixed-fee and prepaid royalty cash receipts, together with a
$156.8 million
accrual of accounts receivable related to scheduled prepaid royalties and fixed-fee payments, partially offset the
$223.4 million
in deferred revenue recognized, resulting in a net
$19.9 million
decrease
in deferred revenue to
$268.1 million
at
December 31, 2012
. Approximately
$84.7 million
of our
$268.1 million
deferred revenue balance relates to fixed royalty payments that are scheduled to amortize as follows (in thousands):
|
2013
|
$
|
62,031
|
|
|
2014
|
17,190
|
|
|
|
2015
|
2,027
|
|
|
|
2016
|
2,027
|
|
|
|
2017
|
1,459
|
|
|
|
Thereafter
|
—
|
|
|
|
|
$
|
84,734
|
|
The remaining
$183.4 million
of deferred revenue primarily relates to prepaid royalties that will be recorded as revenue as our licensees report their sales of covered products and prepaid royalties that may be recorded as revenue upon the resolution of the arbitration related to one of our technology solutions agreements.
Repurchase of Common Stock
During
2012
, we repurchased a cumulative total of
4.9 million
shares of our common stock for an aggregate of
$152.7 million
under the 2009 Repurchase Program and the 2012 Repurchase Program, each as defined below. We made no share repurchases during
2011
or 2010.
In March 2009, our Board of Directors authorized a
$100.0 million
share repurchase program (the “2009 Repurchase Program”). The company repurchased shares under the 2009 Repurchase Program through pre-arranged trading plans. During
2012
,
we repurchased
2.3 million
s
hares under the 2009 Repurchase Program for
$75.0 million
.
The 2009 Repurchase Program
34
was completed in second quarter 2012, bringing the cumulative repurchase total under the program to approximately
3.3 million
shares at a cost of
$
100.0 million
.
In May 2012, our Board of Directors authorized a new share repurchase program, which was then expanded in June 2012 to increase the amount of the program from $100.0 million to
$200.0 million
(the "2012 Repurchase Program"). The company may repurchase shares under the 2012 Repurchase Program through open market purchases, pre-arranged trading plans or privately negotiated purchases. During
2012
, we repurchased approximately
2.6 million
shares under the 2012 Repurchase Program for
$77.7 million
.
From January 1, 2013 through February 25, 2013, we did not make any share repurchases under the 2012 Repurchase Program.
Intellectual Property Rights Enforcement
If we believe any party is required to license our patents in order to manufacture and sell certain products and such party refuses to do so, we may institute legal action against them. This legal action typically takes the form of a patent infringement lawsuit or an administrative proceeding such as a Section 337 proceeding before the USITC. In addition, we and our licensees, in the normal course of business, might seek to resolve disagreements between the parties with respect to the rights and obligations of the parties under the applicable license agreement through arbitration or litigation.
In
2012
, our intellectual property enforcement costs
increased
to
$52.7 million
from
$23.7 million
and
$12.1 million
in
2011
and
2010
, respectively. The 2012 amount includes a $3.2 million increase to accrue for a litigation contingency related to the Huawei-China proceedings. This represented
42%
of our
2012
total patent administration and licensing costs of
$126.3 million
. Intellectual property enforcement costs will vary depending upon activity levels, and it is likely they will continue to be a significant expense for us in the future.
Comparability of Financial Results
When comparing
2012
financial results against other periods, the following items should be taken into consideration:
• Our 2012 revenue includes:
◦
$384.0 million
of revenue associated with patent sales; and
◦
$26.2 million
of past sales related to a new patent license agreement with Sony, new and amended agreements signed during 2012 and revenue associated with the audits of existing licensees.
• Our 2012 operating expenses include:
◦
$16.7 million
of expense related our 2012 patent sales;
◦
$12.5 million
of expense associated with actions to reposition the company's operations;
◦
$4.4 million
charge to increase the accrual rate under our Long-Term Compensation Program ("LTCP") for the program cycle ending December 31, 2012; and
◦ lower accrual rates as compared to 2011 for the remaining two active cycles under the LTCP;
◦ $4.5 million tax benefit for release of valuation allowances on DTA.
Critical Accounting Policies and Estimates
Our consolidated financial statements are based on the selection and application of accounting principles generally accepted in the United States of America (“GAAP”), which require us to make estimates and assumptions that affect the amounts reported in both our consolidated financial statements and the accompanying notes. Future events and their effects cannot be determined with absolute certainty. Therefore, the determination of estimates requires the exercise of judgment. Actual results could differ from these estimates and any such differences may be material to the financial statements. Our significant accounting policies are described in Note 2 to our Consolidated Financial Statements and are included in Item 8 of Part II of this Form 10-K. We believe the accounting policies that are of particular importance to the portrayal of our financial condition and results and that may involve a higher degree of complexity and judgment in their application compared to others are those relating to revenue recognition, compensation and income taxes. If different assumptions were made or different conditions existed, our financial results could have been materially different.
35
Revenue Recognition
We derive the vast majority of our revenue from patent licensing. The timing and amount of revenue recognized from each licensee depends upon a variety of factors, including the specific terms of each agreement and the nature of the deliverables and obligations. Such agreements are often complex and include multiple elements. These agreements can include, without limitation, elements related to the settlement of past patent infringement liabilities, up-front and non-refundable license fees for the use of patents and/or know-how, patent and/or know-how licensing royalties on covered products sold by licensees, cross-licensing terms between us and other parties, the compensation structure and ownership of intellectual property rights associated with contractual technology development arrangements, advanced payments and fees for service arrangements and settlement of intellectual property enforcement. For agreements entered into or materially modified prior to 2011, due to the inherent difficulty in establishing reliable, verifiable, and objectively determinable evidence of the fair value of the separate elements of these agreements, the total revenue resulting from such agreements has often been recognized over the performance period. Beginning in January 2011, all new or materially modified agreements are being accounted for under the Financial Accounting Standards Board ("FASB") revenue recognition guidance, "Revenue Arrangements with Multiple Deliverables." This guidance requires consideration to be allocated to each element of an agreement that has stand alone value using the relative fair value method. In other circumstances, such as those agreements involving consideration for past and expected future patent royalty obligations, after consideration of the particular facts and circumstances, the appropriate recording of revenue between periods may require the use of judgment. In all cases, revenue is only recognized after all of the following criteria are met: (1) written agreements have been executed; (2) delivery of technology or intellectual property rights has occurred or services have been rendered; (3) fees are fixed or determinable; and (4) collectibility of fees is reasonably assured.
We establish a receivable for payments expected to be received within twelve months from the balance sheet date based on the terms in the license. Our reporting of such payments often results in an increase to both accounts receivable and deferred revenue. Deferred revenue associated with fixed-fee royalty payments is classified on the balance sheet as short-term when it is scheduled to be amortized within twelve months from the balance sheet date. All other deferred revenue is classified as long term, as amounts to be recognized over the next twelve months are not known.
Patent License Agreements
Upon signing a patent license agreement, we provide the licensee permission to use our patented inventions in specific applications. We account for patent license agreements in accordance with the guidance for revenue arrangements with multiple deliverables and the guidance for revenue recognition. We have elected to utilize the leased-based model for revenue recognition, with revenue being recognized over the expected period of benefit to the licensee. Under our patent license agreements, we typically receive one or a combination of the following forms of payment as consideration for permitting our licensees to use our patented inventions in their applications and products:
Consideration for Past Sales:
Consideration related to a licensee’s product sales from prior periods may result from a negotiated agreement with a licensee that utilized our patented inventions prior to signing a patent license agreement with us or from the resolution of a disagreement or arbitration with a licensee over the specific terms of an existing license agreement. We may also receive consideration for past sales in connection with the settlement of patent litigation where there was no prior patent license agreement. In each of these cases, we record the consideration as revenue when we have obtained a signed agreement, identified a fixed or determinable price and determined that collectibility is reasonably assured.
Fixed-Fee Royalty Payments:
These are up-front, non-refundable royalty payments that fulfill the licensee’s obligations to us under a patent license agreement for a specified time period or for the term of the agreement for specified products, under certain patents or patent claims, for sales in certain countries, or a combination thereof — in each case for a specified time period (including for the life of the patents licensed under the agreement). We recognize revenues related to Fixed-Fee Royalty Payments on a straight-line basis over the effective term of the license. We utilize the straight-line method because we cannot reliably predict in which periods, within the term of a license, the licensee will benefit from the use of our patented inventions.
Prepayments:
These are up-front, non-refundable royalty payments towards a licensee’s future obligations to us related to its expected sales of covered products in future periods. Our licensees’ obligations to pay royalties typically extend beyond the exhaustion of their Prepayment balance. Once a licensee exhausts its Prepayment balance, we may provide them with the opportunity to make another Prepayment toward future sales or it will be required to make Current Royalty Payments.
Current Royalty Payments:
These are royalty payments covering a licensee’s obligations to us related to its sales of covered products in the current contractual reporting period.
Licensees that either owe us Current Royalty Payments or have Prepayment balances are obligated to provide us with quarterly or semi-annual royalty reports that summarize their sales of covered products and their related royalty obligations to
36
us. We typically receive these royalty reports subsequent to the period in which our licensees’ underlying sales occurred. As a result, it is impractical for us to recognize revenue in the period in which the underlying sales occur, and, in most cases, we recognize revenue in the period in which the royalty report is received and other revenue recognition criteria are met due to the fact that without royalty reports from our licensees, our visibility into our licensees’ sales is very limited.
The exhaustion of Prepayments and Current Royalty Payments are often calculated based on related per-unit sales of covered products. From time to time, licensees will not report revenues in the proper period, most often due to legal disputes. When this occurs, the timing and comparability of royalty revenue could be affected.
In cases where we receive objective, verifiable evidence that a licensee has discontinued sales of products covered under a patent license agreement with us, we recognize any related deferred revenue balance in the period that we receive such evidence.
Patent Sales
During 2012, we expanded our business strategy of monetizing our intellectual property to include the sale of select patent assets. As patent sales executed under this expanded strategy represent a component of our ongoing major or central operations and activities, we will record the related proceeds as revenue. We will recognize the revenue when there is persuasive evidence of a sales arrangement, fees are fixed or determinable, delivery has occurred and collectibility is reasonably assured. These requirements are generally fulfilled upon closing of the patent sale transaction.
Technology Solutions and Engineering Services
Technology solutions revenue consists primarily of revenue from software licenses and engineering services. Software license revenues are recognized in accordance with the original and revised guidance for software revenue recognition. When the arrangement with a customer includes significant production, modification, or customization of the software, we recognize the related revenue using the percentage-of-completion method in accordance with the accounting guidance for construction-type and certain production-type contracts. Under this method, revenue and profit are recognized throughout the term of the contract, based on actual labor costs incurred to date as a percentage of the total estimated labor costs related to the contract. Changes in estimates for revenues, costs and profits are recognized in the period in which they are determinable. When such estimates indicate that costs will exceed future revenues and a loss on the contract exists, a provision for the entire loss is recognized at that time.
We recognize revenues associated with engineering service arrangements that are outside the scope of the accounting guidance for construction-type and certain production-type contracts on a straight-line basis, unless evidence suggests that the revenue is earned in a different pattern, over the contractual term of the arrangement or the expected period during which those specified services will be performed, whichever is longer. In such cases we often recognize revenue using proportional performance and measure the progress of our performance based on the relationship between incurred labor hours and total estimated labor hours or other measures of progress, if available. Our most significant cost has been labor and we believe both labor hours and labor cost provide a measure of the progress of our services. The effect of changes to total estimated contract costs is recognized in the period such changes are determined.
When technology solutions agreements include royalty payments, we recognize revenue from the royalty payments using the same methods described above under our policy for recognizing revenue from patent license agreements.
Sony Agreement
On December 21, 2012, we formed a joint venture with Sony Corporation of America to combine Sony's consumer electronics expertise with our wireless M2M and bandwidth management research. The joint venture, called Convida Wireless, will focus on driving new research in M2M wireless communications and other connectivity areas. Based on the terms of the agreement, the parties will contribute funding and resources for additional M2M research and platform development, which we will perform. Stephens Capital Partners LLC (“Stephens”), the principal investing affiliate of Stephens Inc., is a minority investor in Convida Wireless.
Our agreement with Sony is a multiple-element arrangement that also includes a three-year license to our patents for Sony's sale of 3G and 4G products, effective January 1, 2013, and an amount for past sales.
Under the arrangement, we expect to collect a total of
$125.0 million
of cash and have also acquired certain patents covering non-baseband technologies from Sony. We have estimated the value of the acquired patents to be
$28.9 million
.
We estimated the fair value of patents by a combination of a discounted cash flow analysis (the income approach) and an analysis of comparable market transactions (the market approach). For the income approach, the inputs and assumptions used to develop this estimate were based on a market participant perspective and included estimates of projected royalties, discount rates, useful lives and income tax rates, among others. For the market approach, judgment was applied as to which market transactions were
37
most comparable to this transaction. These inputs and assumptions represent our best estimates at the time of the transaction. Changes in any number of these assumptions may have had a substantial impact on the estimated value of the acquired patents.
In connection with this arrangement, we recognized
$22.3 million
of patent licensing revenue in fourth quarter 2012, and we expect to recognize
$116.6 million
of patent licensing revenue, using the straight-line method, over the three-year term of the patent license. The remaining
$15.0 million
represents funding toward M2M research and platform development.
Convida Wireless is a variable interest entity. Based on our provision of M2M research and platform development services to Convida Wireless, we have determined that we are the primary beneficiary for accounting purposes and must consolidate Convida Wireless. Because Convida Wireless had no operations in 2012, the consolidation of Convida Wireless had no impact on our financial statements as of December 31, 2012, and there was
no
income or loss to allocate to interests held by other parties.
The agreement is a multiple-element arrangement for accounting purposes. As discussed in our revenue recognition policy footnote, we identified each element of the arrangement and determined when those elements should be recognized. Using the accounting guidance from multiple-element revenue arrangements, we allocated the consideration to each element for accounting purposes using our best estimate of selling price for each element. The development of a number of these inputs and assumptions in the model requires a significant amount of management judgment and is based upon a number of factors, including the selection of industry comparables, market growth rates and other relevant factors. Changes in any number of these assumptions may have had a substantial impact on the fair value as assigned to each element for accounting purposes. These inputs and assumptions represent management's best estimates at the time of the transaction.
The impact that a five percent change in each of the following key estimates would have had on fourth quarter 2012 revenue and pretax income is summarized in the following table (in millions):
|
Change in estimate
|
|||||||
|
+ 5%
|
- 5%
|
||||||
|
Value of patents acquired
|
$
|
1.4
|
|
$
|
(1.4
|
)
|
|
|
Allocation between past and future royalties
|
$
|
(7.0
|
)
|
$
|
7.0
|
|
|
Compensation Programs
We use a variety of compensation programs to both attract and retain employees, and to more closely align employee compensation with company performance. These programs include, but are not limited to, short-term incentive awards tied to performance goals and cash awards to inventors for filed patent applications and patent issuances, as well as, prior to 2010, restricted stock unit (“RSU”) awards for non-managers and the LTCP for managers, which included both time-based and performance-based RSUs and a performance-based cash incentive component. Prior to 2010, LTCP awards would alternate annually between RSU and cash cycles, each of which generally covered a three-year period and could overlap with another cycle by as many as two years.
In fourth quarter 2010, the LTCP was amended to, among other things, increase the relative proportion of performance-based compensation for executives and managers, extend participation to all employees, and eliminate alternating RSU and cash cycles. Effective with the cycle that began on January 1, 2010 through December 31, 2012, executives and managers received 25% of their LTCP participation in the form of time-based RSUs that vest in full at the end of the respective three-year cycle and the remaining 75% in the form of performance-based awards granted under the long-term incentive plan (“LTIP”) component of the LTCP. LTIP performance-based awards may be paid out in the form of cash, equity or any combination thereof, as determined by the Compensation Committee of the Board of Directors. Where the form of payment has not been determined at the beginning of the cycle, as is the case of Cycle 5, Cycle 6 and Cycle 7 (each as defined below), the LTIP payment is assumed to be 100% cash for accounting purposes. All employees below manager level received 100% of their LTCP participation in the form of time-based RSUs that vest in full at the end of the respective three-year cycle. The following LTCP cycles were active for all or some portion of the three years ended
December 31, 2012
:
|
•
|
Cash Cycle 3:
A long-term performance-based cash incentive covering the period January 1, 2008 through December 31, 2010;
|
|
•
|
RSU Cycle 4:
Time-based and performance-based RSUs granted on January 1, 2009, with a target vest date of January 1, 2012;
|
|
•
|
Cycle 5:
Time-based RSUs granted on November 1, 2010, which vested on January 1, 2013, and a long-term performance-based incentive covering the period from January 1, 2010 through December 31, 2012;
|
38
|
•
|
Cycle 6
: Time-based RSUs granted on January 1, 2011, which vest on January 1, 2014, and a long-term performance-based incentive covering the period from January 1, 2011 through December 31, 2013; and
|
|
•
|
Cycle 7
: Time-based RSUs granted on January 1, 2012, which vest on January 1, 2015, and a long-term performance-based incentive covering the period from January 1, 2012 through December 31, 2014.
|
______________________________________
Note: The long-term performance-based incentives for each of Cycle 6 and Cycle 7 were converted into performance-based RSUs on January 18, 2013. As the conversion occurred after December 31, 2012, these cycles were accounted for as cash awards during 2011 and 2012.
We recognized share-based compensation expense of
$6.5 million
,
$8.1 million
and
$5.8 million
in
2012
,
2011
and
2010
, respectively. Included in 2011 is a charge of
$1.3 million
to increase the accrual rate for the performance-based RSU grant under RDU Cycle 4 from 0% to 31% based on the final payout associated with this grant. We also recognized
$8.3 million
,
$1.8 million
and
$11.2 million
of compensation expense in
2012
,
2011
and
2010
, respectively, related to the performance-based cash incentive under our LTCP.
In 2012, performance-based cash incentive cost of
$8.3 million
includes a charge of
$4.4 million
to increase the accrual rate for Cycle 5 from the previously estimated payout of 50% to the actual payout of 100%. The increase in the incentive payout from 50% to 100% was driven by the company's success in achieving a number of key goals, including the execution of strategic patent sales and the signing of new or amended 4G patent license agreements, after we had reduced the accrual rate to 50% in 2011.
In 2011, performance-based cash incentive cost of
$1.8 million
is net of a reduction of
$5.7 million
to decrease the accrual rates for Cycle 5 and Cycle 6 from 100% to 50%. This reduction was driven by the impact of our strategic alternatives review process on the timing of license agreements and includes a
$1.9 million
adjustment to amounts accrued through December 31, 2010.
In 2010, the performance-based cash incentive cost includes a charge of
$3.3 million
to increase the accrual rate for Cash Cycle 3 from the previously estimated payout of 50% to the actual payout of 86%. The increase in the incentive payout from 50% to 86% was driven by the company's success in achieving a number of key goals, including the signing of five new or amended 3G patent license agreements, after we had reduced the accrual rate to 50% in third quarter 2009.
At
December 31, 2012
, accrued compensation expense associated with the LTCP’s performance-based incentives was based on estimated payouts of 100%, 50% and 0% for Cycle 5, Cycle 6 and Cycle 7, respectively. Under both the current and immediately prior versions of the program, 100% achievement of the goals set by the Compensation Committee of the Board of Directors results in a 100% payout of the performance-based incentive target amounts. For each 1% change above or below 100% achievement, the payout is adjusted by 2.5 percentage points, with a maximum payout under the current program of 200%, a maximum payout of 225% under the current program and no payout under either program for performance that falls below 80% achievement. The following table provides examples of the performance-based incentive payout that would be earned based on various levels of goal achievement:
|
Payout Scenarios Under Current LTCP Program
|
|||
|
Goal
Achievement
|
Payout
|
||
|
less than 80%
|
—
|
%
|
|
|
80%
|
50
|
%
|
|
|
100%
|
100
|
%
|
|
|
120%
|
150
|
%
|
|
|
140% or greater (current program maximum)
|
200
|
%
|
|
|
150% or greater (prior program maximum)
|
225
|
%
|
|
If we had assumed that goal achievement for Cycle 6 would be either 100% or less than 50%, we would have accrued
$3.8 million
more or less, respectively, of related compensation expense through
December 31, 2012
.
If we had assumed that goal achievement for Cycle 7 would be 100% or 50%, we would have accrued
$3.2 million
or
$1.6 million
, respectively, of related compensation expense through
December 31, 2012
.
For LTCP RSU cycles that began prior to 2010, executives received 50% of their RSU grant as performance-based RSUs and 50% as time-based RSUs, and the company’s managers received 25% of their RSU grant as performance-based RSUs and 75% as time-based RSUs.
39
Under the prior LTCP program, 100% achievement of the goals set by the Compensation Committee of the Board of Directors resulted in a 100% payout of the performance-based RSU incentive target amounts. For each 1% change above or below 100% achievement, the RSU payout was adjusted by 4 percentage points, with a maximum payout of 300%. For performance that fell below 80% achievement, no payout would occur. The following table provides examples of the performance-based RSU payout that would have been earned based on various levels of goal achievement:
|
Payout Scenarios Under Prior LTCP Program
|
|||
|
Goal
Achievement
|
Payout
|
||
|
less than 80%
|
—
|
%
|
|
|
80%
|
20
|
%
|
|
|
100%
|
100
|
%
|
|
|
120%
|
180
|
%
|
|
|
150% or greater
|
300
|
%
|
|
Income Taxes
Income taxes are accounted for under the asset and liability method. Under this method, deferred tax assets and liabilities are recognized for the estimated future tax consequences attributable to differences between the financial statement carrying amounts of existing assets and liabilities and their respective tax bases, and operating loss and tax credit carry forwards. Deferred tax assets and liabilities are measured using enacted tax rates in effect for the year in which those temporary differences are expected to be recovered or settled. The effect on deferred tax assets and liabilities of a change in tax rates is recognized in the Consolidated Statement of Income in the period that includes the enactment date. A valuation allowance is recorded to reduce the carrying amounts of deferred tax assets if management has determined that it is more likely than not that such assets will not be realized.
In addition, the calculation of tax liabilities involves significant judgment in estimating the impact of uncertainties in the application of complex tax laws. We are subject to examinations by the Internal Revenue Service (“IRS”) and other taxing jurisdictions on various tax matters, including challenges to various positions we assert in our filings. In the event that the IRS or another taxing jurisdiction levies an assessment in the future, it is possible the assessment could have a material adverse effect on our consolidated financial condition or results of operations.
The financial statement recognition of the benefit for a tax position is dependent upon the benefit being more likely than not to be sustainable upon audit by the applicable tax authority. If this threshold is met, the tax benefit is then measured and recognized at the largest amount that is greater than 50 percent likely of being realized upon ultimate settlement. In the event that the IRS or another taxing jurisdiction levies an assessment in the future, it is possible the assessment could have a material adverse effect on our consolidated financial condition or results of operations.
During fourth quarter 2009, we completed a study to assess the company’s ability to utilize foreign tax credit carryovers into the tax year 2006. As a result of the study, we amended our United States federal income tax returns for the periods 1999 — 2005 to reclassify
$29.3 million
of foreign tax payments we made during those periods from deductions to foreign tax credits. We also amended our federal tax returns for the periods 2006 - 2008 to utilize the resulting tax credits. When we completed the study, we established a basis to support amending the returns and estimated that the maximum incremental benefit would be
$19.1 million
.
We recognized a net benefit of
$16.4 million
after establishing a
$2.7 million
reserve for related tax contingencies. In 2011, we recorded an additional tax benefit of
$8.3 million
to eliminate this $2.7 million reserve and other tax contingencies and recognize interest income on the associated refund.
Between 2006 and 2012, we paid approximately
$145.8 million
in foreign taxes for which we have claimed foreign tax credits against our U.S. tax obligations. It is possible that as a result of tax treaty procedures, the U.S. government may reach an agreement with the related foreign governments that will result in a partial refund of foreign taxes paid with a related reduction in our foreign tax credits. Due to both foreign currency fluctuations and differences in the interest rate charged by the U.S. government compared to the interest rates, if any, used by the foreign governments, any such agreement could result in interest expense and/or foreign currency gain or loss.
40
New Accounting Guidance
Accounting Standards Updates: Fair Value Measurements: Amendments to Achieve Common Fair Value Measurement and Disclosure Requirements in U.S. GAAP and IFRS
In May 2011, the FASB issued authoritative guidance that is more closely aligned with the fair value measurement and disclosure guidance issued by the International Accounting Standards Board ("IASB"). The issuance of this standard results in global fair value measurement and disclosure guidance that minimizes the differences between U.S. GAAP and International Financial Reporting Standards. Many of the changes in the final standard represent clarifications to existing guidance, while some changes related to the valuation premise and the application of premiums and discounts and new required disclosures are more significant. This guidance is effective for interim and annual periods beginning after December 15, 2011. We adopted this guidance effective January 1, 2012; however, the adoption of this guidance does not have a significant impact on the company’s financial statements or related disclosures.
Accounting Standards Updates: Presentation of Comprehensive Income
In June 2011, the FASB issued authoritative guidance requiring most entities to present items of net income and other comprehensive income either in one continuous statement, referred to as the statement of comprehensive income, or in two separate, but consecutive, statements of net income and other comprehensive income. The option to present items of other comprehensive income in the statement of changes in equity was eliminated. This guidance is effective for interim and annual periods beginning after December 15, 2011. We adopted this guidance effective January 1, 2012. We have chosen to present items of net income and other comprehensive income in two separate but consecutive statements.
On December 23, 2011, the FASB issued an amendment to the new standard on comprehensive income to defer the requirement to measure and present reclassification adjustments from accumulated other comprehensive income to net income by income statement line item in net income and also in other comprehensive income. The deferred requirement would have called for the measurement and presentation in net income of items previously recognized in other comprehensive income.
In February 2013, the FASB issued final guidance on the presentation of reclassifications out of other comprehensive income. The amendments require an entity to provide information about the amounts reclassified out of other comprehensive income by component. In addition, an entity is required to present, either on the face of the income statement or in a footnote, significant amounts reclassified out of accumulated other comprehensive income by the respective line items of net income, only if the amount reclassified is required by GAAP to be reclassified to net income in its entirety in the same reporting period. For other amounts that are not required under GAAP to be reclassified in their entirety to net income, an entity is required to cross-reference to other disclosures required under GAAP that provide detail about those amounts. This amendment is effective for interim and fiscal years beginning after December 15, 2012. The amended standard will not impact the Company's financial position or results of operations.
Legal Proceedings
We are routinely involved in disputes associated with enforcement and licensing activities regarding our intellectual property, including litigations and other proceedings. These litigations and other proceedings are important means to enforce our intellectual property rights. We are a party to other disputes and legal actions not related to our intellectual property, but also arising in the ordinary course of our business. Refer to Part I, Item 3, of this Form 10-K for a description of our material legal proceedings.
FINANCIAL POSITION, LIQUIDITY AND CAPITAL REQUIREMENTS
Our primary sources of liquidity are cash, cash equivalents and short-term investments, as well as cash generated from operations. We have the ability to obtain additional liquidity through debt and equity financings. Based on our past performance and current expectations, we believe our available sources of funds, including cash, cash equivalents and short-term investments and cash generated from our operations, will be sufficient to finance our operations, capital requirements, debt obligations and existing stock repurchase and dividend programs in the next twelve months.
On
April 4, 2011, we completed an offering of $230.0 million in aggregate principal amount of 2.50% Senior Convertible Notes due 2016 (the "Notes"). The net proceeds from the offering were approximately $222.0 million, after deducting the initial purchaser's discount and offering expenses. A portion of the net proceeds of the offering were used to fund the cost of the convertible note hedge transactions entered into in connection with the offering of the Notes.
Refer to Note 6, "Obligations," in the Notes to Condensed Consolidated Financial Statements included in Part II, Item 8, of this Form 10-K for a more detailed discussion of the Notes.
41
On June 18, 2012, we announced that certain of our subsidiaries had entered into a definitive agreement to sell approximately 1,700 patents to Intel Corporation for $375.0 million in cash. Upon the closing of the transaction in third quarter 2012, we received $375.0 million of cash and recorded this amount as revenue. Driven by this transaction, we made an estimated federal tax payment of approximately
$104.0 million
in fourth quarter 2012.
We have and expect to continue to use the net proceeds discussed above for general corporate purposes, which may include, among other things: acquisitions of intellectual property-related assets or businesses or securities in such businesses, capital expenditures, payment of cash dividends, funding of our existing stock repurchase program and working capital.
Cash, cash equivalents and short-term investments
At
December 31, 2012
and
December 31, 2011
, we had the following amounts of cash, cash equivalents and short-term investments (in thousands):
|
December 31, 2012
|
December 31, 2011
|
Increase /
(Decrease)
|
|||||||||
|
Cash and cash equivalents
|
$
|
349,843
|
|
$
|
342,211
|
|
$
|
7,632
|
|
||
|
Short-term investments
|
227,436
|
|
335,783
|
|
(108,347
|
)
|
|||||
|
Total cash and cash equivalents and short-term investments
|
$
|
577,279
|
|
$
|
677,994
|
|
$
|
(100,715
|
)
|
||
The decrease in cash, cash equivalents and short-term investments was primarily attributable to the cost of repurchasing of common stock of
$152.7 million
, dividend payments of
$83.1 million
and
$47.4 million
in capital investments, which were partially offset by
$177.6 million
of cash provided by operating activities.
Cash flows from operations
We generated or used the following cash flows from our operating activities in 2012 and 2011 (in thousands):
|
|
For the Year Ended December 31,
|
||||||||||
|
2012
|
2011
|
Increase / (Decrease)
|
|||||||||
|
Cash flows provided (used in) by operating activities
|
$
|
177,608
|
|
$
|
(34,338
|
)
|
$
|
211,946
|
|
||
The positive operating cash flow during 2012 was derived principally from cash receipts of
$472.7 million
from patent sales and patent license and technology solutions agreements. We received
$380.0 million
of patent sales payments,
$67.3 million
of per-unit royalty payments, including past sales, current royalties and prepayments, from existing customers and new licensees and
$8.0 million
of fixed-fee payments. Cash receipts from our technology solutions agreements totaled
$17.4 million
, primarily related to royalties and other license fees associated with our SlimChip modem core. These cash receipts and other changes in working capital were partially offset by cash operating expenses (operating expenses less depreciation of fixed assets, amortization of patents, non-cash cost of patent sales, non-cash compensation, accretion of debt discount and amortization of financing costs) of
$191.5 million
, cash payments for short-term and long-term incentive compensation of $10.3 million, estimated federal tax payments of
$110.5 million
and cash payments for foreign source withholding taxes of
$3.6 million
.
Cash used in operating activities during 2011 included cash operating expenses (operating expenses less depreciation of fixed assets, amortization of patents, non-cash compensation, accretion of debt discount, impairment of long-term investments and amortization of financing costs) of $126.9 million, cash payments for short-term and long-term incentive compensation accrued in prior periods of $20.1 million and tax payments of $36.6 million. These items were partially offset by $128.3 million of cash receipts from patent license and technology solutions agreements, tax refunds and other changes in working capital. We received $34.0 million of fixed-fee payments and $65.4 million of per-unit royalty payments, including past sales and prepayments, from existing licensees and a new licensee. Cash receipts from our technology solutions agreements totaled $28.9 million, primarily related to royalties and other license fees associated with our SlimChip modem core. In addition, we received $19.5 million in tax refunds, including interest income, as a result of amendments of previously filed tax returns.
Working capital
We believe that working capital, adjusted to exclude cash, cash equivalents, short-term investments and current deferred revenue provides additional information about non-cash assets and liabilities that might affect our near-term liquidity.
42
While we believe cash and short-term investments are important measures of our liquidity, the remaining components of our current assets and current liabilities, with the exception of deferred revenue, could affect our near-term liquidity and/or cash flow. We have no material obligations associated with our deferred revenue, and the amortization of deferred revenue has no impact on our future liquidity and or cash flow. Our adjusted working capital, a non-GAAP financial measure, reconciles to working capital, the most directly comparable GAAP financial measure, at
December 31, 2012
and
December 31, 2011
(in thousands) as follows:
|
December 31, 2012
|
December 31, 2011
|
Increase / (Decrease)
|
|||||||||
|
Current assets
|
$
|
814,347
|
|
$
|
768,887
|
|
$
|
45,460
|
|
||
|
Less
: current liabilities
|
172,913
|
|
173,153
|
|
(240
|
)
|
|||||
|
Working capital
|
641,434
|
|
595,734
|
|
45,700
|
|
|||||
|
Subtract:
|
|
|
|
||||||||
|
Cash and cash equivalents
|
349,843
|
|
342,211
|
|
7,632
|
|
|||||
|
Short-term investments
|
227,436
|
|
335,783
|
|
(108,347
|
)
|
|||||
|
Add:
|
|||||||||||
|
Current deferred revenue
|
106,305
|
|
134,087
|
|
(27,782
|
)
|
|||||
|
Adjusted working capital
|
$
|
170,460
|
|
$
|
51,827
|
|
$
|
118,633
|
|
||
The
$118.6 million
increase in adjusted working capital in
2012
compared to
2011
is primarily attributable to a
$132.8 million
increase in accounts receivable related to new and recently renewed its patent license agreements and a
$21.4 million
increase in prepaid expenses and other current assets primarily related to tax receivables. These increases were partially offset by increases to accrued compensation and other accrued expenses, primarily due to the LTCP performance cycle that ended December 31, 2012 and the accrued repositioning charge, respectively. Additionally, a decrease in deferred tax assets of
$17.0 million
primarily related to timing differences in the recognition of deferred revenue for book and tax purposes helped offset the increases discussed above.
Cash used in or provided by investing and financing activities
We generated net cash in investing activities of
$63.0 million
in
2012
and used
$41.2 million
in
2011
. We
sold
$110.4 million
of short-term marketable securities, net of purchases in
2012
, and we purchased
$10.1 million
of short-term marketable securities, net of sales, in
2011
. This increase in net sales was driven by higher cash needs primarily associated with our stock repurchase program and our cash dividends. Purchases of property and equipment decreased to
$3.6 million
in
2012
from
$3.8 million
in
2011
primarily due to a lower level of investments in new and existing facilities. Investment costs associated with capitalized patent costs and acquisition of patent costs increased to
$43.8 million
in 2012 from
$27.2 million
in 2011, primarily due to investments in patent acquisitions in 2012.
Net cash used in financing activities
decrease
d by
$435.2 million
in 2012 primarily due to our issuance of the Notes and related transactions in second quarter 2011 as well as our repurchases of common stock of
$152.7 million
and dividends paid of
$83.1 million
in 2012.
Other
Our combined short-term and long-term deferred revenue balance at
December 31, 2012
was approximately
$268.1 million
, a
decrease
of
$19.9 million
from
December 31, 2011
. We have no material obligations associated with such deferred revenue. The decrease in deferred revenue was primarily due to
$223.4 million
of deferred revenue recognized, partially offset by a gross increase in deferred revenue of
$174.6 million
. This deferred revenue recognized was comprised of
$135.1 million
of amortized fixed-fee royalty payments and
$88.4 million
in past sales and per-unit exhaustion of prepaid royalties (based upon royalty reports provided by our licensees). The gross increase in deferred revenue of
$174.6 million
primarily related to cash received or due from patent licensees and technology solutions customers. Of the
$174.6 million
, $14.5 million relates to the technology solutions agreement arbitration discussed above in the "Overview" section.
Based on current license agreements, we expect the amortization of fixed-fee royalty payments to reduce the
December 31, 2012
deferred revenue balance of
$268.1 million
by
$62.0 million
over the next twelve months. Additional reductions to deferred revenue will be dependent upon the level of per-unit royalties our licensees report against prepaid balances or arbitration rulings.
43
Contractual Obligations
On April 4, 2011, InterDigital entered into an indenture (the “Indenture”), by and between the company and The Bank of New York Mellon Trust Company, N.A., as trustee, pursuant to which the $230.0 million in Notes were issued. The Notes bear interest at a rate of 2.50% per year, payable in cash on March 15 and September 15 of each year, commencing September 15, 2011. The Notes will mature on March 15, 2016, unless earlier converted or repurchased.
For more information on the Notes, see Note 6, “
Obligations
,” in the Notes to Consolidated Financial Statements included in Part II, Item 8, of this Form 10-K.
The following table summarizes our contractual obligations as of
December 31, 2012
(in millions):
|
|
Payments Due by Period
|
||||||||||||||||||
|
Total
|
Less Than
1 year
|
1-3 Years
|
3-5 Years
|
Thereafter
|
|||||||||||||||
|
2.50% Senior Convertible Notes due 2016
|
$
|
230.0
|
|
$
|
—
|
|
$
|
—
|
|
$
|
230.0
|
|
$
|
—
|
|
||||
|
Contractual interest payments on Notes
|
20.2
|
|
5.8
|
|
11.5
|
|
2.9
|
|
—
|
|
|||||||||
|
Operating lease obligations
|
16.9
|
|
2.4
|
|
4.5
|
|
3.9
|
|
6.1
|
|
|||||||||
|
Purchase obligations (a)
|
11.3
|
|
11.3
|
|
—
|
|
—
|
|
—
|
|
|||||||||
|
Total contractual obligations
|
$
|
278.4
|
|
$
|
19.5
|
|
$
|
16.0
|
|
$
|
236.8
|
|
$
|
6.1
|
|
||||
_______________________________________
|
(a)
|
Purchase obligations consist of agreements to purchase good and services that are legally binding on us, as well as accounts payable.
|
Off-Balance Sheet Arrangements
We do not have any off-balance sheet arrangements as defined by Item 303(a)(4) of Regulation S-K.
RESULTS OF OPERATIONS
2012 Compared with 2011
Revenues
The following table compares
2012
revenues to
2011
revenues (in millions):
|
For the Year Ended December 31,
|
||||||||||||||
|
|
2012
|
2011
|
(Decrease)/Increase
|
|||||||||||
|
Per-unit royalty revenue
|
$
|
115.3
|
|
$
|
146.5
|
|
$
|
(31.2
|
)
|
(21
|
)%
|
|||
|
Fixed-fee amortized royalty revenue
|
135.1
|
|
135.2
|
|
(0.1
|
)
|
—
|
%
|
||||||
|
Current patent royalties
|
250.4
|
|
281.7
|
|
(31.3
|
)
|
(11
|
)%
|
||||||
|
Past sales
|
26.2
|
|
13.6
|
|
12.6
|
|
93
|
%
|
||||||
|
Total patent licensing royalties
|
276.6
|
|
295.3
|
|
(18.7
|
)
|
(6
|
)%
|
||||||
|
Patent Sales
|
384.0
|
|
—
|
|
384.0
|
|
100
|
%
|
||||||
|
Technology solutions revenue
|
2.5
|
|
6.4
|
|
(3.9
|
)
|
(61
|
)%
|
||||||
|
Total revenue
|
$
|
663.1
|
|
$
|
301.7
|
|
$
|
361.4
|
|
120
|
%
|
|||
Total revenue increased
$361.4 million
in 2012, primarily attributable to patent sales. Not including patent sales revenue, total revenue decreased
$22.6 million
. This decrease is primarily attributable to a
$31.3 million
decrease
in current patent licensing royalties, which was partially offset by a
$12.6 million
increase
in past sales revenue. Per-unit royalty revenue
decrease
d
$31.2 million
, the majority of which wa
s due to lower shipments from our Japanese per-unit licensees and our licensees with concentrations in the smartphone market.
Royalties from past sales totaled
$26.2 million
in
2012
, primarily related to the signing of new or amended license agreements and the resolution of audits of existing licensees. Royalties from
44
past sales totaled
$13.6 million
in
2011
, primarily related to the resolution of audits of existing licensees. The
decrease
in technology solutions revenue was due to lower royalties recognized in connection with our SlimChip modem IP business.
In
2012
and
2011
,
72%
and
59%
of our total revenues, respectively, were attributable to companies that individually accounted for 10% or more of our total revenues. In
2012
and
2011
, the following customers accounted for 10% or more of our total revenues:
|
|
For the Year Ended December 31,
|
||
|
|
2012
|
|
2011
|
|
Intel Corporation
|
57%
|
< 10%
|
|
|
Samsung Electronics Company, Ltd.
|
15%
|
|
34%
|
|
BlackBerry
|
< 10%
|
|
14%
|
|
HTC Corporation
|
< 10%
|
|
11%
|
Operating Expenses
The following table summarizes the change in operating expenses by category (in millions):
|
For the Year Ended December 31,
|
||||||||||||||
|
|
2012
|
2011
|
Increase/(Decrease)
|
|||||||||||
|
Patent administration and licensing
|
$
|
126.3
|
|
$
|
71.7
|
|
$
|
54.6
|
|
76
|
%
|
|||
|
Development
|
67.9
|
|
63.8
|
|
4.1
|
|
6
|
%
|
||||||
|
Selling, general and administrative
|
37.4
|
|
31.5
|
|
5.9
|
|
19
|
%
|
||||||
|
Repositioning
|
12.5
|
|
—
|
|
12.5
|
|
100
|
%
|
||||||
|
Total operating expenses
|
$
|
244.1
|
|
$
|
167.0
|
|
$
|
77.1
|
|
46
|
%
|
|||
Operating expenses increased
46%
to
$244.1 million
in
2012
from
$167.0 million
in
2011
. Not including
$12.5 million
in repositioning charges in
2012
, operating expenses would have increased
39%
. The
$77.1 million
increase in total operating expenses was primarily due to increases/(decreases) in the following items (in millions):
|
|
Increase/
(Decrease)
|
||
|
Intellectual property enforcement and non-patent litigation
|
$
|
31.2
|
|
|
Cost of patent sales
|
16.7
|
|
|
|
Personnel-related costs
|
6.8
|
|
|
|
Long-term compensation
|
5.0
|
|
|
|
Litigation contingency
|
3.2
|
|
|
|
Depreciation and amortization
|
2.6
|
|
|
|
Patent maintenance and evaluation
|
1.4
|
|
|
|
Other
|
(0.8
|
)
|
|
|
Strategic alternatives evaluation process costs
|
(1.5
|
)
|
|
|
Total increase in operating expenses excluding repositioning charges
|
64.6
|
|
|
|
Repositioning charge
|
12.5
|
|
|
|
Total increase in operating expenses
|
$
|
77.1
|
|
Intellectual property enforcement and non-patent litigation costs increased
$31.2 million
primarily due to costs associated with the USITC actions initiated in second half 2011 and January 2013, the ongoing arbitration proceeding related to one of our technology solutions agreements, and various arbitrations with our existing licensees. We recognized
$16.7 million
of expense associated with patent sales. Included in this amount was the remaining net book value of patents sold, as well as commissions and legal and accounting services fees paid in conjunction with the sales. Personnel-related costs grew
$6.8 million
primarily due to increased personnel levels and merit increases. Long-term compensation increased
$5.0 million
, primarily due to a
$4.4 million
charge to increase the accrual rate on our LTCP cycle ended December 31, 2012, and a net $4.4
45
million reduction to the accrual rates on our active cycles in 2011. This increase was partially offset by lower accrual rates on the remaining two active cycles under the LTCP in 2012 as compared to 2011. In 2012 we recorded a litigation contingency related to our Huawei China proceedings. Patent amortization increased
$3.1 million
due to increases in the number of patent applications filed in recent years and patent acquisitions made during 2012, and was partially offset by decreases in depreciation of
$0.5 million
. The increase in patent maintenance and patent evaluation costs was primarily related to due diligence associated with both patent acquisition and patent sale opportunities. Costs associated with our strategic alternatives evaluation process decreased
$1.5 million
due to the company exiting the process in first quarter 2012.
Patent administration and licensing expense:
The increase in patent administration and licensing expense primarily resulted from the above-noted increases in intellectual property enforcement, cost of patent sales, personnel-related costs, patent amortization and patent maintenance and evaluation.
Development expense:
The increase in development expense was primarily attributable to the above-noted increase in personnel-related costs and long-term compensation.
Selling, general and administrative expense:
The increase in selling, general and administrative expense was primarily attributable to the above-noted increases in non-patent litigation, personnel-related costs and long-term compensation. These increases were partially offset by the above-noted decrease in costs associated with the strategic alternatives process.
Repositioning expense:
As part of our ongoing expense management, we initiated a voluntary early retirement program ("VERP") in September 2012. Approximately 60 employees elected to participate in the VERP across our 5 locations. We incurred a charge of
$12.5 million
in 2012.
Other (Expense) Income
The following table compares
2012
other (expense) income to
2011
other (expense) income (in millions):
|
For the Year Ended December 31,
|
||||||||||||||
|
2012
|
2011
|
(Decrease)/Increase
|
||||||||||||
|
Interest expense
|
$
|
(14.9
|
)
|
$
|
(10.9
|
)
|
$
|
(4.0
|
)
|
37
|
%
|
|||
|
Other
|
(0.2
|
)
|
(1.8
|
)
|
1.6
|
|
(89
|
)%
|
||||||
|
Investment income
|
4.7
|
|
2.6
|
|
2.1
|
|
81
|
%
|
||||||
|
$
|
(10.4
|
)
|
$
|
(10.1
|
)
|
$
|
(0.3
|
)
|
3
|
%
|
||||
The change between periods primarily resulted from the recognition of an additional $3.7 million of interest expense associated with the Notes, due to the Notes being outstanding for the full year in 2012 compared to only nine months in 2011. This change was partially offset by higher returns on our investment balances in 2012 and a decrease in other expense due to $1.6 million of investment impairments recorded in 2011.
Income Taxes
In
2012
, our effective tax rate was approximately
33.5%
based on the statutory federal tax rate net of discrete foreign taxes and a $6.7 million benefit related to the reversal of a valuation allowances against deferred taxes. During
2011
, our effective tax rate was approximately
28.2%
based on the statutory federal tax rate net of discrete foreign taxes, a
$6.8 million
benefit related to the reversal of a previously accrued liability for tax contingencies and its related interest and
$1.5 million
of after-tax interest income related to a tax refund.
2011 Compared with 2010
Revenues
The following table compares 2011 revenues to 2010 revenues (in millions):
46
|
For the Year Ended
December 31,
|
||||||||||||||
|
|
2011
|
2010
|
Increase/ (Decrease)
|
|||||||||||
|
Fixed-fee amortized royalty revenue
|
$
|
135.2
|
|
$
|
195.8
|
|
$
|
(60.6
|
)
|
(31
|
)%
|
|||
|
Per-unit royalty revenue
|
146.5
|
|
133.1
|
|
13.4
|
|
10
|
%
|
||||||
|
Current patent royalties
|
281.7
|
|
328.9
|
|
(47.2
|
)
|
(14
|
)%
|
||||||
|
Past sales
|
13.6
|
|
41.3
|
|
(27.7
|
)
|
(67
|
)%
|
||||||
|
Total patent licensing royalties
|
295.3
|
|
370.2
|
|
(74.9
|
)
|
(20
|
)%
|
||||||
|
Technology solutions revenue
|
6.4
|
|
24.3
|
|
(17.9
|
)
|
(74
|
)%
|
||||||
|
Total revenue
|
$
|
301.7
|
|
$
|
394.5
|
|
$
|
(92.8
|
)
|
(24
|
)%
|
|||
The $92.8 million decrease in total revenue was primarily attributable to a $74.9 million decrease in patent licensing royalties. Of this decrease in patent licensing royalties, $60.6 million was attributable to a decrease in fixed-fee amortized royalty revenue. This decrease was primarily driven by the expiration of the 3G portion of our patent license agreement with LG at the end of 2010. The $27.7 million decrease in past sales revenue was due to the signing of a patent license agreement with Casio Hitachi Mobile Communications Co., Ltd., the resolution of a routine audit and the renewal of a patent license agreement, each in 2010. Royalties from past sales totaled $13.6 million in 2011, primarily related to the resolution of audits of existing licensees. Per-unit royalty revenue increased $25.6 million due to strong sales from licensees with concentrations in smartphones, partly offset by a $12.7 million decrease in royalties from our Japanese licensees as a result of lower shipments. The decrease in technology solutions revenue was due to the elimination of $14.1 million of revenue under technology solutions agreements that concluded in 2010. The remaining decrease was due to lower royalties recognized in connection with our SlimChip modem IP as a result of the ongoing arbitration proceeding related to one of our technology solutions agreements.
In 2011 and 2010, 59% and 41% of our total revenues, respectively, were attributable to companies that individually accounted for 10% or more of our total revenues. In 2011 and 2010, the following licensees accounted for 10% or more of our total revenues:
|
For the Year Ended December 31,
|
|||
|
|
2011
|
2010
|
|
|
Samsung Electronics Company, Ltd.
|
34%
|
26%
|
|
|
BlackBerry
|
14%
|
< 10%
|
|
|
HTC Corporation
|
11%
|
< 10%
|
|
|
LG Electronics, Inc.
|
0%
|
15%
|
|
Operating Expenses
The following table summarizes the change in operating expenses by category (in millions):
|
|
For the Year Ended December 31,
|
|
|
|||||||||||
|
|
2011
|
2010
|
Increase/(Decrease)
|
|||||||||||
|
Patent administration and licensing
|
$
|
71.7
|
|
$
|
58.9
|
|
$
|
12.8
|
|
22
|
%
|
|||
|
Development
|
63.8
|
|
71.5
|
|
(7.7
|
)
|
(11
|
)%
|
||||||
|
Selling, general and administrative
|
31.5
|
|
28.3
|
|
3.2
|
|
11
|
%
|
||||||
|
Repositioning
|
—
|
|
—
|
|
—
|
|
—
|
%
|
||||||
|
Total operating expenses
|
$
|
167.0
|
|
$
|
158.7
|
|
$
|
8.3
|
|
5
|
%
|
|||
The
$8.3 million
increase in operating expenses was primarily due to net changes in the following items (in millions):
47
|
|
Increase/
(Decrease)
|
||
|
Intellectual property enforcement and non-patent litigation
|
$
|
14.0
|
|
|
Personnel-related costs
|
6.0
|
|
|
|
Strategic alternatives evaluation process costs
|
2.1
|
|
|
|
Depreciation and amortization
|
1.6
|
|
|
|
Consulting services
|
1.3
|
|
|
|
Other
|
0.6
|
|
|
|
Engineering software, equipment and maintenance
|
0.5
|
|
|
|
Sublicense fees
|
(7.5
|
)
|
|
|
Long-term compensation
|
(7.0
|
)
|
|
|
Commissions
|
(3.3
|
)
|
|
|
Total increase in operating expenses
|
$
|
8.3
|
|
Intellectual property enforcement and non-patent litigation costs increased $14.0 million primarily due to costs associated with USITC Proceeding (337-TA-868). Personnel-related costs grew $6.0 million primarily due to increased personnel levels within our patents, licensing and advanced research groups. Costs associated with our strategic alternatives evaluation process contributed $2.1 million to the operating expense increase. Depreciation and patent amortization increased $1.6 million due to higher levels of capitalized patent costs in recent years. Consulting services and engineering software, equipment and maintenance increased $1.8 million primarily due to the initiation of new development projects in 2011. The decrease in sublicense fees was as a result of technology solutions agreements that concluded in 2010. The $7.0 million decrease in long-term compensation was primarily due to a $5.7 million reduction to the accrual rates on Cycles 5 and 6 of the LTCP in 2011, a $1.3 million increase to the accrual rate on RSU Cycle 4 in 2011 and a $3.3 million charge, in 2010, to increase our accrual rate for Cash Cycle 3. The $3.3 million decrease in commission expense was primarily driven by the decline in revenue in 2011.
Patent administration and licensing expense:
The increase in patent administration and licensing expense primarily resulted from the above-noted increases in intellectual property enforcement, personnel-related costs and patent amortization. These increases were partially offset by the above-noted decrease in commissions, as well as a decrease in consulting services due to lower levels of patent due diligence. The decrease in long-term compensation costs further offset the previously mentioned increases.
Development expense:
The decrease in development expense was primarily attributable to the above-noted decreases in sublicense fees related to technology solutions agreements that concluded in 2010 and long-term compensation costs. These decreases were partially offset by the above-noted increases in personnel-related costs, as well as increases in consulting services and engineering software, equipment and maintenance attributable to the initiation of new research and development projects in 2011.
Selling, general and administrative expense:
The increase in selling, general and administrative expense was primarily attributable to the above-noted increases in costs associated with our strategic alternatives evaluation process and non-patent litigation costs, which was related to the previously discussed arbitration proceeding related to one of our technology solutions agreements. These increases were partially offset by a decrease in long-term compensation costs.
Other (Expense) Income
The following table compares
2011
other (expense) income to
2010
other (expense) income (in millions):
|
For the Year Ended December 31,
|
||||||||||||||
|
2011
|
2010
|
(Decrease)/Increase
|
||||||||||||
|
Interest expense
|
$
|
(10.9
|
)
|
$
|
(0.1
|
)
|
$
|
(10.8
|
)
|
10,800
|
%
|
|||
|
Other
|
(1.8
|
)
|
0.3
|
|
(2.1
|
)
|
(700
|
)%
|
||||||
|
Investment income
|
2.6
|
|
2.4
|
|
0.2
|
|
8
|
%
|
||||||
|
$
|
(10.1
|
)
|
$
|
2.6
|
|
$
|
(12.7
|
)
|
(488
|
)%
|
||||
The change between periods primarily resulted from the recognition of $10.9 million of interest expense associated with the Notes and the recognition of a $1.6 million charge for investment impairment in 2011.
48
Income Taxes
In 2011, our effective tax rate was approximately 28.2% based on the statutory federal tax rate net of discrete foreign taxes, a $6.8 million benefit related to the reversal of a previously accrued liability for tax contingencies and its related interest and $1.5 million of after-tax interest income related to a tax refund. During 2010, our effective tax rate was approximately 35.6% based on the statutory federal tax rate net of discrete foreign taxes.
STATEMENT PURSUANT TO THE PRIVATE SECURITIES LITIGATION REFORM ACT OF 1995 - FORWARD-LOOKING STATEMENTS
This Annual Report on Form 10-K contains forward-looking statements within the meaning of Section 21E of the Securities Exchange Act of 1934, as amended. Such statements include certain information in “Part I, Item 1. Business” and “Part II, Item 7. Management's Discussion and Analysis of Financial Condition and Results of Operations” and other information regarding our current beliefs, plans and expectations, including without limitation the matters set forth below. Words such as “anticipate,” “estimate,” “expect,” “project,” “intend,” “plan,” “forecast,” “believe,” “could,” “would,” “should,” “if,” “may,” “might,” “future,” “target,” “goal,” “trend,” “seek to,” “will continue,” “predict,” “likely,” “in the event,” variations of any such words or similar expressions contained herein are intended to identify such forward-looking statements. Forward-looking statements in this Annual Report on Form 10-K include, without limitation, statements regarding:
(i) Our expectation that the technologies in which we are engaged in advanced research will improve the wireless user's experience and enable the delivery of a broad array of information and services;
(ii) Our objective to continue to be a leading designer and developer of technology solutions for the wireless industry;
(iii) Our plans for executing on our business strategy, including our plans to pursue additional patent sales and patent licensing partnerships, enhance our technology sourcing and commercialize our market-ready technologies and research capabilities;
(iv) Our belief that our portfolio includes a number of patents and patent applications that are or may be essential or may become essential to cellular and other wireless standards, including 2G, 3G, 4G and the IEEE 802 suite of standards, and that companies making, importing, using or selling products compliant with these standards require a license under our patents and will require licenses under patents that may issue from our pending patent applications;
(v) The anticipated continued growth in sales of advanced wireless products and services and continued proliferation of converged devices;
(vi) The predicted increases in global wireless subscriptions, worldwide handset shipments, including shipments of 3G and 4G phones, shipments of media tablets with wireless connectivity and IEEE 802.11 semiconductor shipments over the next several years;
(vii) Factors driving the continued growth of advanced wireless products and services sales over the next five years;
(viii) The types of licensing arrangements and various royalty structure models that we anticipate using under our future license agreements;
(ix) The possible outcome of audits of our license agreements when underreporting or underpayment is revealed;
(x) Our plan to continue to pay a quarterly cash dividend on our common stock at the rate set forth in our current dividend policy;
(xi) Our current plans to preserve a significant portion of our cash, cash equivalents and short-term investments to finance our business in the near future;
(xii) Our ability to obtain additional liquidity through debt and equity financings;
(xiii) Our belief that our available sources of funds will be sufficient to finance our operations, capital requirements, debt obligations and existing stock repurchase and dividend programs in the next twelve months;
(xiv) The potential effects of new accounting standards on our financial statements or results of operations;
(xv) The expected amortization of fixed-fee royalty payments over the next twelve months to reduce our deferred revenue balance;
49
(xvi) The expected timing, outcome and impact of our various litigation and administrative matters; and
(xii) Our belief that it is more likely than not that the company will successfully sustain its separate company reporting in connection with our New York State audit described in Note 11 to the Consolidated Financial Statements.
Although the forward-looking statements in this Form 10-K reflect the good faith judgment of our management, such statements can only be based on facts and factors currently known by us. Consequently, forward-looking statements concerning our business, results of operations and financial condition are inherently subject to risks and uncertainties. We caution readers that actual results and outcomes could differ materially from those expressed in or anticipated by such forward-looking statements due to a variety of factors, including, without limitation, the following:
(i) unanticipated difficulties or delays related to the further development of our technologies;
(ii) the failure of the markets for our technologies to materialize to the extent or at the rate that we expect;
(iii) changes in the company's plans, strategy or initiatives;
(iv) the challenges related to entering into new and renewed patent license agreements and unanticipated delays, difficulties or acceleration in the negotiation and execution of patent license agreements;
(v) our ability to leverage our strategic relationships and secure new patent license and technology solutions agreements on acceptable terms;
(vi) the impact of current trends in the industry that could result in reductions in and/or caps on royalty rates under new patent license agreements;
(vii) changes in the market share and sales performance of our primary licensees, delays in product shipments of our licensees and timely receipt and final reviews of quarterly royalty reports from our customers and related matters;
(viii) the timing and/or outcome of our various litigation, arbitration or administrative proceedings, including any awards or judgments relating to such proceedings, additional legal proceedings, changes in the schedules or costs associated with legal proceedings or adverse rulings in such legal proceedings;
(ix) the impact of potential patent legislation, USPTO rule changes and international patent rule changes on our patent prosecution and licensing strategies;
(x) the timing and/or outcome of any state or federal tax examinations or audits, changes in tax laws and the resulting impact on our tax assets and liabilities;
(xi) the effects of any dispositions, acquisitions or other strategic transactions by the company;
(xii) decreased liquidity in the capital markets; and
(xiii) unanticipated increases in the company's cash needs or decreases in available cash.
You should carefully consider these factors as well as the risks and uncertainties outlined in greater detail in Part I, Item 1A, in this Form 10-K before making any investment decision with respect to our common stock. These factors, individually or in the aggregate, may cause our actual results to differ materially from our expected and historical results. You should understand that it is not possible to predict or identify all such factors. In addition, you should not place undue reliance on the forward-looking statements contained herein, which are made only as of the date of this Form 10-K. We undertake no obligation to revise or update publicly any forward-looking statement for any reason, except as otherwise required by law.
|
Item 7A.
|
QUANTITATIVE AND QUALITATIVE DISCLOSURES ABOUT MARKET RISK.
|
Cash Equivalents and Investments
The primary objectives of our investment activities are to preserve principal and maintain liquidity while at the same time capturing a market rate of return. To achieve these objectives, we maintain our portfolio of cash and cash equivalents, and short-term and long-term investments in a variety of securities, including government obligations, corporate bonds and commercial paper.
Interest Rate Risk —
We invest our cash in a number of diversified high quality investment-grade fixed and floating rate securities with a fair value of
$577.3 million
at
December 31, 2012
. Our exposure to interest rate risks is not significant due to the short average maturity, quality and diversification of our holdings. We do not hold any derivative, derivative commodity instruments or other similar financial instruments in our portfolio. The risk associated with fluctuating interest rates is generally
50
limited to our investment portfolio. We believe that a hypothetical 10% change in period-end interest rates would not have a significant impact on our results of operations or cash flows.
The following table provides information about our interest-bearing securities that are sensitive to changes in interest rates as of
December 31, 2012
. The table presents principal cash flows, weighted-average yield at cost and contractual maturity dates. Additionally, we have assumed that these securities are similar enough within the specified categories to aggregate these securities for presentation purposes.
Interest Rate Sensitivity
Principal Amount by Expected Maturity
Average Interest Rates
(in millions)
|
2013
|
2014
|
2015
|
2016
|
2017
|
Thereafter
|
Total
|
|||||||||||||||||||||
|
Money market and demand accounts
|
$
|
261.9
|
|
$
|
—
|
|
$
|
—
|
|
$
|
—
|
|
$
|
—
|
|
$
|
—
|
|
$
|
261.9
|
|
||||||
|
Cash equivalents
|
$
|
87.9
|
|
$
|
—
|
|
$
|
—
|
|
$
|
—
|
|
$
|
—
|
|
$
|
—
|
|
$
|
87.9
|
|
||||||
|
Short-term investments
|
$
|
207.4
|
|
$
|
11.9
|
|
$
|
6.2
|
|
$
|
0.2
|
|
$
|
1.0
|
|
$
|
0.8
|
|
$
|
227.5
|
|
||||||
|
Interest rate
|
2.0
|
%
|
1.6
|
%
|
1.0
|
%
|
0.8
|
%
|
2.2
|
%
|
0.7
|
%
|
0.7
|
%
|
|||||||||||||
Cash and cash equivalents and available-for-sale securities are recorded at fair value.
Bank Liquidity Risk —
As of
December 31, 2012
we had approximately
$261.9 million
in operating accounts and money market funds that are held with domestic and international financial institutions. The majority of these balances are held with domestic financial institutions. While we monitor daily cash balances in our operating accounts and adjust the cash balances as appropriate, these cash balances could be lost or become inaccessible if the underlying financial institutions fail or if they are unable to meet the liquidity requirements of their depositors. Notwithstanding, we have not incurred any losses and have had full access to our operating accounts to date.
Foreign Currency Exchange Rate Risk —
We are exposed to risk from fluctuations in currencies, which might change over time as our business practices evolve, that could impact our operating results, liquidity and financial condition. We operate and invest globally. Adverse movements in currency exchange rates might negatively affect our business due to a number of situations. Currently, our international licensing agreements are typically made in U.S. dollars and are generally not subject to foreign currency exchange rate risk. We do not engage in foreign exchange hedging transactions at this time.
Between 2006 and 2012, we paid approximately
$145.8 million
in foreign taxes for which we have claimed foreign tax credits against our U.S. tax obligations. It is possible that as a result of tax treaty procedures, the U.S. government may reach an agreement with the related foreign governments that will result in a partial refund of foreign taxes paid with a related reduction in our foreign tax credits. Due to both foreign currency fluctuations and differences in the interest rate charged by the U.S. government compared to the interest rates, if any, used by the foreign governments, any such agreement could result in interest expense and/or foreign currency gain or loss.
Investment Risk —
We are exposed to market risk as it relates to changes in the market value of our short-term and long-term investments in addition to the liquidity and creditworthiness of the underlying issuers of our investments. We hold a diversified investment portfolio, which includes, fixed and floating-rate, investment-grade marketable securities, mortgage and asset-backed securities and U.S. government and other securities. The instruments included in our portfolio meet high credit quality standards, as specified in our investment policy guidelines. This policy also limits our amount of credit exposure to any one issue, issuer and type of instrument. Given that the guidelines of our investment policy prohibit us from investing in anything but highly rated instruments, our investments are not subject to significant fluctuations in fair value due to the volatility of the credit markets and prevailing interest rates for such securities. Our marketable securities, consisting of government obligations, corporate bonds and commercial paper, are classified as available-for-sale with a fair value of
$227.5 million
as of
December 31, 2012
.
Equity Risk —
We are exposed to changes in the market-traded price of our common stock as it influences the calculation of earnings per share. In connection with the offering of the Notes, we entered into convertible note hedge transactions with an affiliate of the initial purchaser (the “option counterparty”). We also sold warrants to the option counterparty. These transactions have been accounted for as an adjustment to our shareholders' equity. The convertible note hedge transactions are expected to reduce the potential equity dilution upon conversion of the Notes. The warrants along with any shares issuable upon conversion of the Notes will have a dilutive effect on our earnings per share to the extent that the average market price of our common
51
stock for a given reporting period exceeds the applicable strike price or conversion price of the warrants or convertible Notes, respectively.
|
Item 8.
|
FINANCIAL STATEMENTS AND SUPPLEMENTARY DATA.
|
|
|
PAGE NUMBER
|
|
CONSOLIDATED FINANCIAL STATEMENTS:
|
|
|
SCHEDULES:
|
|
All other schedules are omitted because they are either not required or applicable or equivalent information has been included in the financial statements and notes thereto.
52
Report of Independent Registered Public Accounting Firm
To the Board of Directors and Shareholders of InterDigital, Inc.:
In our opinion, the consolidated financial statements listed in the accompanying index present fairly, in all material respects, the financial position of InterDigital, Inc. and its subsidiaries at December 31, 2012 and December 31, 2011, and the results of their operations and their cash flows for each of the three years in the period ended
December 31, 2012 in conformity with accounting principles generally accepted in the United States of America. In addition, in our opinion, the financial statement schedule listed in the accompanying index
presents fairly, in all material respects, the information set forth therein when read in conjunction with the related consolidated financial statements. Also in our opinion, the Company maintained, in all material respects, effective internal control over financial reporting as of December 31, 2012, based on criteria established in
Internal Control - Integrated Framework
issued by the Committee of Sponsoring Organizations of the Treadway Commission (COSO). The Company's management is responsible for these financial statements and financial statement schedule, for maintaining effective internal control over financial reporting and for its assessment of the effectiveness of internal control over financial reporting, included in “Management's Annual Report on Internal Control Over Financial Reporting” appearing under Item 9A. Our responsibility is to express opinions on these financial statements, on the financial statement schedule, and on the Company's internal control over financial reporting based on our integrated audits. We conducted our audits in accordance with the standards of the Public Company Accounting Oversight Board (United States). Those standards require that we plan and perform the audits to obtain reasonable assurance about whether the financial statements are free of material misstatement and whether effective internal control over financial reporting was maintained in all material respects. Our audits of the financial statements included examining, on a test basis, evidence supporting the amounts and disclosures in the financial statements, assessing the accounting principles used and significant estimates made by management, and evaluating the overall financial statement presentation. Our audit of internal control over financial reporting included obtaining an understanding of internal control over financial reporting, assessing the risk that a material weakness exists, and testing and evaluating the design and operating effectiveness of internal control based on the assessed risk. Our audits also included performing such other procedures as we considered necessary in the circumstances. We believe that our audits provide a reasonable basis for our opinions.
A company's internal control over financial reporting is a process designed to provide reasonable assurance regarding the reliability of financial reporting and the preparation of financial statements for external purposes in accordance with generally accepted accounting principles. A company's internal control over financial reporting includes those policies and procedures that (i) pertain to the maintenance of records that, in reasonable detail, accurately and fairly reflect the transactions and dispositions of the assets of the company; (ii) provide reasonable assurance that transactions are recorded as necessary to permit preparation of financial statements in accordance with generally accepted accounting principles, and that receipts and expenditures of the company are being made only in accordance with authorizations of management and directors of the company; and (iii) provide reasonable assurance regarding prevention or timely detection of unauthorized acquisition, use, or disposition of the company's assets that could have a material effect on the financial statements.
Because of its inherent limitations, internal control over financial reporting may not prevent or detect misstatements. Also, projections of any evaluation of effectiveness to future periods are subject to the risk that controls may become inadequate because of changes in conditions, or that the degree of compliance with the policies or procedures may deteriorate.
/s/ PricewaterhouseCoopers LLP
Philadelphia, Pennsylvania
February 25, 2013
53
INTERDIGITAL, INC. AND SUBSIDIARIES
(in thousands, except per share data)
|
DECEMBER 31,
2012 |
DECEMBER 31,
2011 |
||||||
|
ASSETS
|
|
|
|||||
|
CURRENT ASSETS:
|
|
|
|||||
|
Cash and cash equivalents
|
$
|
349,843
|
|
$
|
342,211
|
|
|
|
Short-term investments
|
227,436
|
|
335,783
|
|
|||
|
Accounts receivable, less allowances of $1,750
|
169,874
|
|
28,079
|
|
|||
|
Deferred tax assets
|
36,997
|
|
53,990
|
|
|||
|
Prepaid and other current assets
|
30,197
|
|
8,824
|
|
|||
|
Total current assets
|
814,347
|
|
768,887
|
|
|||
|
PROPERTY AND EQUIPMENT, NET
|
7,824
|
|
7,997
|
|
|||
|
PATENTS, NET
|
177,557
|
|
137,963
|
|
|||
|
DEFERRED TAX ASSETS
|
30,687
|
|
54,110
|
|
|||
|
OTHER NON-CURRENT ASSETS
|
26,194
|
|
28,011
|
|
|||
|
|
242,262
|
|
228,081
|
|
|||
|
TOTAL ASSETS
|
$
|
1,056,609
|
|
$
|
996,968
|
|
|
|
LIABILITIES AND SHAREHOLDERS’ EQUITY
|
|
|
|||||
|
CURRENT LIABILITIES:
|
|
|
|||||
|
Current portion of long-term debt
|
$
|
—
|
|
$
|
180
|
|
|
|
Accounts payable
|
9,600
|
|
7,110
|
|
|||
|
Accrued compensation and related expenses
|
20,661
|
|
14,129
|
|
|||
|
Deferred revenue
|
106,305
|
|
134,087
|
|
|||
|
Taxes payable
|
3,960
|
|
3,265
|
|
|||
|
Dividend payable
|
—
|
|
4,570
|
|
|||
|
Other accrued expenses
|
32,387
|
|
9,812
|
|
|||
|
Total current liabilities
|
172,913
|
|
173,153
|
|
|||
|
LONG-TERM DEBT
|
200,391
|
|
192,529
|
|
|||
|
LONG-TERM DEFERRED REVENUE
|
161,820
|
|
153,953
|
|
|||
|
OTHER LONG-TERM LIABILITIES
|
2,780
|
|
5,651
|
|
|||
|
TOTAL LIABILITIES
|
537,904
|
|
525,286
|
|
|||
|
COMMITMENTS AND CONTINGENCIES
|
|
|
|||||
|
SHAREHOLDERS’ EQUITY:
|
|
|
|||||
|
Preferred Stock, $0.10 par value, 14,399 shares authorized, 0 shares issued and outstanding
|
—
|
|
—
|
|
|||
|
Common Stock, $0.01 par value, 100,000 shares authorized, 69,459 and 69,118 shares issued and 41,050 and 45,548 shares outstanding
|
695
|
|
691
|
|
|||
|
Additional paid-in capital
|
579,852
|
|
573,950
|
|
|||
|
Retained earnings
|
659,235
|
|
466,727
|
|
|||
|
Accumulated other comprehensive income (loss)
|
864
|
|
(439
|
)
|
|||
|
|
1,240,646
|
|
1,040,929
|
|
|||
|
Treasury stock, 28,409 and 23,570 shares of common held at cost
|
721,941
|
|
569,247
|
|
|||
|
Total shareholders’ equity
|
518,705
|
|
471,682
|
|
|||
|
TOTAL LIABILITIES AND SHAREHOLDERS’ EQUITY
|
$
|
1,056,609
|
|
$
|
996,968
|
|
|
The accompanying notes are an integral part of these statements.
54
INTERDIGITAL, INC. AND SUBSIDIARIES
(in thousands, except per share data)
|
FOR THE YEAR ENDED DECEMBER 31,
|
|||||||||||
|
|
2012
|
2011
|
2010
|
||||||||
|
REVENUES
|
|||||||||||
|
Patent licensing royalties
|
$
|
276,547
|
|
$
|
295,372
|
|
$
|
370,231
|
|
||
|
Patent sales
|
384,000
|
|
—
|
|
—
|
|
|||||
|
Technology solutions
|
2,516
|
|
6,370
|
|
24,314
|
|
|||||
|
663,063
|
|
301,742
|
|
394,545
|
|
||||||
|
OPERATING EXPENSES:
|
|
|
|
||||||||
|
Patent administration and licensing
|
126,284
|
|
71,736
|
|
58,907
|
|
|||||
|
Development
|
67,862
|
|
63,763
|
|
71,464
|
|
|||||
|
Selling, general and administrative
|
37,351
|
|
31,486
|
|
28,301
|
|
|||||
|
Repositioning
|
12,536
|
|
—
|
|
—
|
|
|||||
|
|
244,033
|
|
166,985
|
|
158,672
|
|
|||||
|
Income from operations
|
419,030
|
|
134,757
|
|
235,873
|
|
|||||
|
OTHER (EXPENSE) INCOME
|
(10,396
|
)
|
(10,149
|
)
|
2,574
|
|
|||||
|
Income before income taxes
|
408,634
|
|
124,608
|
|
238,447
|
|
|||||
|
INCOME TAX PROVISION
|
(136,830
|
)
|
(35,140
|
)
|
(84,831
|
)
|
|||||
|
NET INCOME
|
$
|
271,804
|
|
$
|
89,468
|
|
$
|
153,616
|
|
||
|
NET INCOME PER COMMON SHARE — BASIC
|
$
|
6.31
|
|
$
|
1.97
|
|
$
|
3.48
|
|
||
|
WEIGHTED AVERAGE NUMBER OF COMMON SHARES OUTSTANDING — BASIC
|
43,070
|
|
45,411
|
|
44,084
|
|
|||||
|
NET INCOME PER COMMON SHARE — DILUTED
|
$
|
6.26
|
|
$
|
1.94
|
|
$
|
3.43
|
|
||
|
WEIGHTED AVERAGE NUMBER OF COMMON SHARES OUTSTANDING — DILUTED
|
43,396
|
|
46,014
|
|
44,824
|
|
|||||
|
CASH DIVIDENDS DECLARED PER COMMON SHARE
|
$
|
1.90
|
|
$
|
0.40
|
|
$
|
0.10
|
|
||
The accompanying notes are an integral part of these statements.
55
INTERDIGITAL, INC. AND SUBSIDIARIES
CONSOLIDATED STATEMENTS OF COMPREHENSIVE INCOME
(in thousands)
|
|
For the Year Ended December 31,
|
|||||||||||
|
|
2012
|
2011
|
2010
|
|||||||||
|
Net income
|
$
|
271,804
|
|
$
|
89,468
|
|
$
|
153,616
|
|
|||
|
Unrealized gain (loss) investments, net of tax
|
1,303
|
|
(550
|
)
|
(166
|
)
|
||||||
|
Total comprehensive income
|
$
|
273,107
|
|
$
|
88,918
|
|
$
|
153,450
|
|
|||
The accompanying notes are an integral part of these statements.
56
INTERDIGITAL, INC. AND SUBSIDIARIES
CONSOLIDATED STATEMENTS OF SHAREHOLDERS’ EQUITY
(in thousands, except per share data)
|
Common Stock
|
Additional
Paid-In Capital
|
Retained Earnings
|
Accumulated
Other
Comprehensive
Income (Loss)
|
Treasury Stock
|
Total
Shareholders'
Equity
|
|||||||||||||||||||||||||
|
|
Shares
|
Amount
|
Shares
|
Amount
|
||||||||||||||||||||||||||
|
BALANCE, DECEMBER 31, 2009
|
66,831
|
|
$
|
668
|
|
$
|
491,068
|
|
$
|
246,771
|
|
$
|
277
|
|
23,570
|
|
$
|
(569,247
|
)
|
$
|
169,537
|
|
||||||||
|
Net income
|
—
|
|
—
|
|
—
|
|
153,616
|
|
—
|
|
—
|
|
—
|
|
153,616
|
|
||||||||||||||
|
Net change in unrealized gain on short-term investments
|
—
|
|
—
|
|
—
|
|
—
|
|
(166
|
)
|
—
|
|
—
|
|
(166
|
)
|
||||||||||||||
|
Dividends declared
|
—
|
|
—
|
|
62
|
|
(4,588
|
)
|
—
|
|
—
|
|
—
|
|
(4,526
|
)
|
||||||||||||||
|
Exercise of Common Stock options
|
1,491
|
|
15
|
|
21,505
|
|
—
|
|
—
|
|
—
|
|
—
|
|
21,520
|
|
||||||||||||||
|
Issuance of Common Stock, net
|
280
|
|
3
|
|
(316
|
)
|
—
|
|
—
|
|
—
|
|
—
|
|
(313
|
)
|
||||||||||||||
|
Tax benefit from exercise of stock options
|
—
|
|
—
|
|
7,653
|
|
—
|
|
—
|
|
—
|
|
—
|
|
7,653
|
|
||||||||||||||
|
Amortization of unearned compensation
|
—
|
|
—
|
|
5,795
|
|
—
|
|
—
|
|
—
|
|
—
|
|
5,795
|
|
||||||||||||||
|
BALANCE, DECEMBER 31, 2010
|
68,602
|
|
$
|
686
|
|
$
|
525,767
|
|
$
|
395,799
|
|
$
|
111
|
|
23,570
|
|
$
|
(569,247
|
)
|
$
|
353,116
|
|
||||||||
|
Net income
|
—
|
|
—
|
|
—
|
|
89,468
|
|
—
|
|
—
|
|
—
|
|
89,468
|
|
||||||||||||||
|
Net change in unrealized gain on short-term investments
|
—
|
|
—
|
|
—
|
|
—
|
|
(550
|
)
|
—
|
|
—
|
|
(550
|
)
|
||||||||||||||
|
Dividends declared
|
—
|
|
—
|
|
347
|
|
(18,540
|
)
|
—
|
|
—
|
|
—
|
|
(18,193
|
)
|
||||||||||||||
|
Exercise of Common Stock options
|
333
|
|
3
|
|
4,494
|
|
—
|
|
—
|
|
—
|
|
—
|
|
4,497
|
|
||||||||||||||
|
Issuance of Common Stock, net
|
183
|
|
2
|
|
(385
|
)
|
—
|
|
—
|
|
—
|
|
—
|
|
(383
|
)
|
||||||||||||||
|
Tax benefit from exercise of stock options
|
—
|
|
—
|
|
5,131
|
|
—
|
|
—
|
|
—
|
|
—
|
|
5,131
|
|
||||||||||||||
|
Amortization of unearned compensation
|
—
|
|
—
|
|
8,115
|
|
—
|
|
—
|
|
—
|
|
—
|
|
8,115
|
|
||||||||||||||
|
Convertible note hedge transactions, net of tax
|
—
|
|
—
|
|
(27,519
|
)
|
—
|
|
—
|
|
—
|
|
—
|
|
(27,519
|
)
|
||||||||||||||
|
Warrant transactions
|
—
|
|
—
|
|
31,740
|
|
—
|
|
—
|
|
—
|
|
—
|
|
31,740
|
|
||||||||||||||
|
Equity component of the Notes, net of tax
|
—
|
|
—
|
|
27,760
|
|
—
|
|
—
|
|
—
|
|
—
|
|
27,760
|
|
||||||||||||||
|
Deferred financing costs allocated to equity
|
—
|
|
—
|
|
(1,500
|
)
|
—
|
|
—
|
|
—
|
|
—
|
|
(1,500
|
)
|
||||||||||||||
|
BALANCE, DECEMBER 31, 2011
|
69,118
|
|
$
|
691
|
|
$
|
573,950
|
|
$
|
466,727
|
|
$
|
(439
|
)
|
23,570
|
|
$
|
(569,247
|
)
|
$
|
471,682
|
|
||||||||
|
Net income
|
—
|
|
—
|
|
—
|
|
271,804
|
|
—
|
|
—
|
|
—
|
|
271,804
|
|
||||||||||||||
|
Net change in unrealized gain on short-term investments
|
—
|
|
—
|
|
—
|
|
—
|
|
1,303
|
|
—
|
|
—
|
|
1,303
|
|
||||||||||||||
|
Dividends declared
|
—
|
|
—
|
|
789
|
|
(79,296
|
)
|
—
|
|
—
|
|
—
|
|
(78,507
|
)
|
||||||||||||||
|
Exercise of Common Stock options
|
132
|
|
2
|
|
2,109
|
|
—
|
|
—
|
|
—
|
|
—
|
|
2,111
|
|
||||||||||||||
|
Issuance of Common Stock, net
|
209
|
|
2
|
|
(4,389
|
)
|
—
|
|
—
|
|
—
|
|
—
|
|
(4,387
|
)
|
||||||||||||||
|
Tax benefit from exercise of stock options
|
—
|
|
—
|
|
898
|
|
—
|
|
—
|
|
—
|
|
—
|
|
898
|
|
||||||||||||||
|
Amortization of unearned compensation
|
—
|
|
—
|
|
6,495
|
|
—
|
|
—
|
|
—
|
|
—
|
|
6,495
|
|
||||||||||||||
|
Repurchase of Common Stock
|
—
|
|
—
|
|
—
|
|
—
|
|
—
|
|
4,839
|
|
(152,694
|
)
|
(152,694
|
)
|
||||||||||||||
|
BALANCE, DECEMBER 31, 2012
|
69,459
|
|
$
|
695
|
|
$
|
579,852
|
|
$
|
659,235
|
|
$
|
864
|
|
28,409
|
|
$
|
(721,941
|
)
|
$
|
518,705
|
|
||||||||
The accompanying notes are an integral part of these statements
57
INTERDIGITAL, INC. AND SUBSIDIARIES
(in thousands)
|
FOR THE YEAR ENDED DECEMBER 31,
|
|||||||||||
|
|
2012
|
2011
|
2010
|
||||||||
|
CASH FLOWS FROM OPERATING ACTIVITIES:
|
|
|
|||||||||
|
Net income
|
$
|
271,804
|
|
$
|
89,468
|
|
$
|
153,616
|
|
||
|
Adjustments to reconcile net income to net cash provided by (used in) operating activities:
|
|
||||||||||
|
Depreciation and amortization
|
26,248
|
|
23,805
|
|
22,125
|
|
|||||
|
Amortization of deferred financing fees and accretion of debt discount
|
9,165
|
|
6,544
|
|
—
|
|
|||||
|
Deferred revenue recognized
|
(223,419
|
)
|
(235,513
|
)
|
(283,012
|
)
|
|||||
|
Increase in deferred revenue
|
174,604
|
|
56,575
|
|
81,737
|
|
|||||
|
Deferred income taxes
|
40,416
|
|
(1,210
|
)
|
(6,738
|
)
|
|||||
|
Share-based compensation
|
6,495
|
|
8,115
|
|
5,801
|
|
|||||
|
Impairment of long-term investment
|
—
|
|
1,616
|
|
—
|
|
|||||
|
Non-cash cost of patent sales
|
10,654
|
|
—
|
|
—
|
|
|||||
|
Other
|
90
|
|
(238
|
)
|
80
|
|
|||||
|
(Increase) decrease in assets:
|
|||||||||||
|
Receivables
|
(141,795
|
)
|
5,553
|
|
179,273
|
|
|||||
|
Deferred charges and other assets
|
(21,651
|
)
|
21,025
|
|
2,319
|
|
|||||
|
Increase (decrease) in liabilities:
|
|
|
|||||||||
|
Accounts payable
|
2,453
|
|
(571
|
)
|
417
|
|
|||||
|
Accrued compensation and other expenses
|
21,849
|
|
(2,322
|
)
|
8,130
|
|
|||||
|
Accrued taxes payable and other tax contingencies
|
695
|
|
(7,185
|
)
|
(29,825
|
)
|
|||||
|
Net cash provided by (used in) operating activities
|
177,608
|
|
(34,338
|
)
|
133,923
|
|
|||||
|
CASH FLOWS FROM INVESTING ACTIVITIES:
|
|||||||||||
|
Purchases of short-term investments
|
(331,828
|
)
|
(713,683
|
)
|
(696,478
|
)
|
|||||
|
Sales of short-term investments
|
442,182
|
|
703,538
|
|
568,888
|
|
|||||
|
Purchases of property and equipment
|
(3,621
|
)
|
(3,835
|
)
|
(2,520
|
)
|
|||||
|
Capitalized patent costs
|
(28,317
|
)
|
(27,172
|
)
|
(27,814
|
)
|
|||||
|
Acquisition of patents
|
(15,450
|
)
|
—
|
|
—
|
|
|||||
|
Net cash provided by (used in) investing activities
|
62,966
|
|
(41,152
|
)
|
(157,924
|
)
|
|||||
|
CASH FLOWS FROM FINANCING ACTIVITIES:
|
|||||||||||
|
Net proceeds from exercise of stock options
|
2,111
|
|
4,497
|
|
21,520
|
|
|||||
|
Payments on long-term debt, including capital lease obligations
|
(180
|
)
|
(288
|
)
|
(584
|
)
|
|||||
|
Proceeds from issuance of convertible senior notes
|
—
|
|
230,000
|
|
—
|
|
|||||
|
Purchase of convertible bond hedge
|
—
|
|
(42,665
|
)
|
—
|
|
|||||
|
Proceeds from issuance of warrants
|
—
|
|
31,740
|
|
—
|
|
|||||
|
Payments of debt issuance costs
|
—
|
|
(8,015
|
)
|
—
|
|
|||||
|
Dividends paid
|
(83,077
|
)
|
(18,150
|
)
|
—
|
|
|||||
|
Tax benefit from share-based compensation
|
898
|
|
5,131
|
|
7,653
|
|
|||||
|
Repurchase of common stock
|
(152,694
|
)
|
—
|
|
—
|
|
|||||
|
Net cash (used in) provided by financing activities
|
(232,942
|
)
|
202,250
|
|
28,589
|
|
|||||
|
NET INCREASE IN CASH AND CASH EQUIVALENTS
|
7,632
|
|
126,760
|
|
4,588
|
|
|||||
|
CASH AND CASH EQUIVALENTS, BEGINNING OF PERIOD
|
342,211
|
|
215,451
|
|
210,863
|
|
|||||
|
CASH AND CASH EQUIVALENTS, END OF PERIOD
|
$
|
349,843
|
|
$
|
342,211
|
|
$
|
215,451
|
|
||
|
SUPPLEMENTAL CASH FLOW INFORMATION:
|
|||||||||||
|
Interest Paid
|
5,754
|
|
2,600
|
|
51
|
|
|||||
|
Income taxes paid, including foreign witholding taxes
|
116,871
|
|
36,593
|
|
113,820
|
|
|||||
|
Non-cash investing and financing activities:
|
|
|
|
|
|
|
|||||
|
Dividend payable
|
—
|
|
4,570
|
|
4,526
|
|
|||||
|
Non-cash acquisition of patents
|
28,900
|
|
—
|
|
—
|
|
|||||
|
Accrued capitalized patent costs
|
(286
|
)
|
(105
|
)
|
(538
|
)
|
|||||
|
Accrued purchases of property, plant and equipment
|
—
|
|
(4
|
)
|
(333
|
)
|
|||||
The accompanying notes are an integral part of these statements.
58
INTERDIGITAL, INC. AND SUBSIDIARIES
NOTES TO CONSOLIDATED FINANCIAL STATEMENTS
December 31, 2012
|
1.
|
BACKGROUND
|
InterDigital designs and develops advanced technologies that enable and enhance wireless communications and capabilities. Since our founding in 1972, we have designed and developed a wide range of innovations that are used in digital cellular and wireless products and networks, including 2G, 3G, 4G and IEEE 802-related products and networks. We are a leading contributor of intellectual property to the wireless communications industry.
Repositioning
On October 23, 2012, we announced that, as part of our ongoing expense management, we had initiated a voluntary early retirement program ("VERP"). In connection with the VERP, we incurred a related repositioning charge of
$12.5 million
in
2012
. During 2012, cash payments of
$1.4 million
were made for severance and related costs associated with the VERP. We have accrued
$11.1 million
for severance and related costs at the balance sheet date. The
$12.5 million
charge is included within the repositioning line of our Consolidated Statements of Income. Approximately
60
employees elected to participate in the VERP across our locations, the majority of whose last day was December 15, 2012. The majority of the charge recorded in 2012 represents cash obligations associated with severance. We expect to recognize an additional
$1.0 million
to
$2.0 million
charge related to the VERP in 2013. All of the severance and related costs are scheduled to be paid within twelve months of the balance sheet date.
We did not incur any repositioning charges during
2011
or
2010
.
|
2.
|
SUMMARY OF SIGNIFICANT ACCOUNTING POLICIES
|
Principles of Consolidation
The accompanying consolidated financial statements include all of our accounts and all entities which we have a controlling interest, which are required to be consolidated in accordance with the Generally Accepted Accounting Principles in the United States (“GAAP”). All significant intercompany accounts and transactions have been eliminated in consolidation.
In determining whether we are the primary beneficiary of an entity and therefore required to consolidate, we apply a qualitative approach that determines whether we have both the power to direct the economically significant activities of the entity and the obligation to absorb losses of, or the right to receive benefits from, the entity that could potentially be significant to that entity. These considerations impact the way we account for our existing collaborative relationships and other arrangements. We continuously assess whether we are the primary beneficiary of a variable interest entity as changes to existing relationships or future transactions may result in us consolidating or deconsolidating our partner(s) to collaborations and other arrangements.
Use of Estimates
The preparation of financial statements in conformity with GAAP requires management to make estimates and assumptions that affect the reported amounts of assets and liabilities, the disclosure of contingent assets and liabilities as of the date of the financial statements and the reported amounts of revenues and expenses during the reporting period. Actual results could differ from these estimates. We believe the accounting policies that are of particular importance to the portrayal of our financial condition and results, and that may involve a higher degree of complexity and judgment in their application compared to others, are those relating to revenue recognition, compensation and income taxes. If different assumptions were made or different conditions had existed, our financial results could have been materially different.
Cash and Cash Equivalents
We classify all highly liquid investment securities with original maturities of three months or less at date of purchase as cash equivalents. Our investments are comprised of mutual and exchange traded funds, commercial paper, United States and municipal government obligations and corporate securities. Management determines the appropriate classification of our investments at the time of acquisition and re-evaluates such determination at each balance sheet date.
59
Cash and cash equivalents at
December 31, 2012
and
2011
consisted of the following (in thousands):
|
|
December 31,
|
||||||
|
|
2012
|
2011
|
|||||
|
Money market and demand accounts
|
$
|
261,899
|
|
$
|
338,211
|
|
|
|
Commercial paper
|
87,944
|
|
4,000
|
|
|||
|
|
$
|
349,843
|
|
$
|
342,211
|
|
|
Short-Term Investments
At
December 31, 2012
and
2011
, all marketable securities have been classified as available-for-sale and are carried at fair value, with unrealized gains and losses reported net-of-tax as a separate component of shareholders’ equity. None of our marketable securities are deemed impaired as of
December 31, 2012
, as substantially all of our investments are investment grade government and corporate debt securities that have maturities of less than 3 years, and we have both the ability and intent to hold the investments until maturity. Net unrealized gain on short-term investments was
$1.3 million
million at
December 31, 2012
. Realized gains and losses for
2012
,
2011
and
2010
were as follows (in thousands):
|
Year
|
Gains
|
Losses
|
Net
|
|||||||||
|
2012
|
$
|
14
|
|
$
|
(249
|
)
|
$
|
(235
|
)
|
|||
|
2011
|
$
|
37
|
|
$
|
(274
|
)
|
$
|
(237
|
)
|
|||
|
2010
|
$
|
64
|
|
$
|
(234
|
)
|
$
|
(170
|
)
|
|||
Short-term investments as of
December 31, 2012
and
2011
consisted of the following (in thousands):
|
|
December 31,
|
||||||
|
|
2012
|
2011
|
|||||
|
Commercial paper
|
$
|
62,924
|
|
$
|
156,574
|
|
|
|
U.S. government agency instruments
|
50,560
|
|
66,647
|
|
|||
|
Corporate bonds and asset backed securities
|
13,270
|
|
16,432
|
|
|||
|
Mutual and exchange traded funds
|
100,682
|
|
96,130
|
|
|||
|
|
$
|
227,436
|
|
$
|
335,783
|
|
|
At
December 31, 2012
and
2011
,
$207.4 million
and
$212.3 million
respectively, of our short-term investments had contractual maturities within one year. The remaining portions of our short-term investments had contractual maturities primarily within two to five years.
Concentration of Credit Risk and Fair Value of Financial Instruments
Financial instruments that potentially subject us to concentration of credit risk consist primarily of cash equivalents, short-term investments and accounts receivable. We place our cash equivalents and short-term investments only in highly rated financial instruments and in United States government instruments.
Our accounts receivable are derived principally from patent license and technology solutions agreements. At
December 31, 2012
,
four
licensees comprised
96%
of our net accounts receivable balance. At
December 31, 2011
,
three
licensees represented
97%
of our net accounts receivable balance. We perform ongoing credit evaluations of our licensees, who generally include large, multinational, wireless telecommunications equipment manufacturers. We believe that the book values of our financial instruments approximate their fair values.
Fair Value Measurements
Effective January 1, 2008, we adopted the provisions of the FASB fair value measurement guidance that relate to our financial assets and financial liabilities. We adopted the guidance related to non-financial assets and liabilities as of January 1, 2009. We use various valuation techniques and assumptions when measuring fair value of our assets and liabilities. We utilize market data or assumptions that market participants would use in pricing the asset or liability, including assumptions about risk and the risks inherent in the inputs to the valuation technique. This guidance established a hierarchy that prioritizes fair value measurements based on the types of input used for the various valuation techniques (market approach, income approach and cost approach). The levels of the hierarchy are described below:
60
Level 1 Inputs — Level 1 includes financial instruments for which quoted market prices for identical instruments are available in active markets.
Level 2 Inputs — Level 2 includes financial instruments for which there are inputs other than quoted prices included within Level 1 that are observable for the instrument such as quoted prices for similar instruments in active markets, quoted prices for identical or similar instruments in markets with insufficient volume or infrequent transactions (less active markets) or model-driven valuations in which significant inputs are observable or can be derived principally from, or corroborated by, observable market data, including market interest rate curves, referenced credit spreads and pre-payment rates.
Level 3 Inputs — Level 3 includes financial instruments for which fair value is derived from valuation techniques including pricing models and discounted cash flow models in which one or more significant inputs are unobservable, including the company’s own assumptions. The pricing models incorporate transaction details such as contractual terms, maturity and, in certain instances, timing and amount of future cash flows, as well as assumptions related to liquidity and credit valuation adjustments of marketplace participants.
Our assessment of the significance of a particular input to the fair value measurement requires judgment and may affect the valuation of financial assets and financial liabilities and their placement within the fair value hierarchy. We use quoted market prices for similar assets to estimate the fair value of our Level 2 investments. Our financial assets are included within short-term investments on our consolidated balance sheets, unless otherwise indicated. Our financial assets that are accounted for at fair value on a recurring basis are presented in the tables below as of
December 31, 2012
and
December 31, 2011
(in thousands):
|
|
Fair Value as of December 31, 2012
|
||||||||||||||
|
|
Level 1
|
Level 2
|
Level 3
|
Total
|
|||||||||||
|
Assets:
|
|
|
|
|
|||||||||||
|
Money market and demand accounts (a)
|
$
|
261,899
|
|
$
|
—
|
|
$
|
—
|
|
$
|
261,899
|
|
|||
|
Mutual and exchange traded funds
|
100,682
|
|
—
|
|
—
|
|
100,682
|
|
|||||||
|
Commercial paper (b)
|
—
|
|
150,868
|
|
—
|
|
150,868
|
|
|||||||
|
U.S. government securities
|
—
|
|
50,560
|
|
—
|
|
50,560
|
|
|||||||
|
Corporate bonds and asset backed securities
|
—
|
|
13,270
|
|
—
|
|
13,270
|
|
|||||||
|
|
$
|
362,581
|
|
$
|
214,698
|
|
$
|
—
|
|
$
|
577,279
|
|
|||
______________________________
|
(a)
|
Included within cash and cash equivalents.
|
|
(b)
|
Includes
$87.9 million
of commercial paper that is included within cash and cash equivalents.
|
|
|
Fair Value as of December 31, 2011
|
||||||||||||||
|
|
Level 1
|
Level 2
|
Level 3
|
Total
|
|||||||||||
|
Assets:
|
|
|
|
|
|||||||||||
|
Money market and demand accounts (a)
|
$
|
338,211
|
|
$
|
—
|
|
$
|
—
|
|
$
|
338,211
|
|
|||
|
Mutual and exchange traded funds
|
96,130
|
|
—
|
|
—
|
|
96,130
|
|
|||||||
|
Commercial paper (b)
|
—
|
|
160,574
|
|
—
|
|
160,574
|
|
|||||||
|
U.S. government securities
|
—
|
|
66,647
|
|
—
|
|
66,647
|
|
|||||||
|
Corporate bonds and asset backed securities
|
—
|
|
16,432
|
|
—
|
|
16,432
|
|
|||||||
|
|
$
|
434,341
|
|
$
|
243,653
|
|
$
|
—
|
|
$
|
677,994
|
|
|||
______________________________
|
(a)
|
Included within cash and cash equivalents.
|
|
(b)
|
Includes
$4.0 million
of commercial paper that is included within cash and cash equivalents.
|
The carrying amount of long-term debt reported in the consolidated balance sheet as of
December 31, 2012
and
December 31, 2011
was
$200.4 million
and
$192.5 million
, respectively. Using inputs such as actual trade data, benchmark yields, broker/dealer quotes and other similar data, which were obtained from independent pricing vendors, quoted market prices or other sources, we determined the fair value of the Notes (as defined in Note 6,
Obligations
) to be
$245.2 million
and
$240.9 million
as of
December 31, 2012
and
December 31, 2011
.
61
Property and Equipment
Property and equipment are stated at cost. Depreciation and amortization of property and equipment are provided using the straight-line method. The estimated useful lives for computer equipment, computer software, engineering and test equipment and furniture and fixtures are generally
three
to
five
years. Leasehold improvements are amortized over the lesser of their estimated useful lives or their respective lease terms, which are generally
five
to
ten
years. Buildings are being depreciated over
twenty-five
years. Expenditures for major improvements and betterments are capitalized, while minor repairs and maintenance are charged to expense as incurred. Leases meeting certain capital lease criteria are capitalized and the net present value of the related lease payments is recorded as a liability. Amortization of capital leased assets is recorded using the straight-line method over the lesser of the estimated useful lives or the lease terms.
Upon the retirement or disposition of property, plant and equipment, the related cost and accumulated depreciation or amortization are removed, and a gain or loss is recorded.
Internal-Use Software Costs
We capitalize costs associated with software developed for internal use that are incurred during the software development stage. Such costs are limited to expenses incurred after management authorizes and commits to a computer software project, believes that it is more likely than not that the project will be completed, the software will be used to perform the intended function with an estimated service life of
two
years or more, and the completion of conceptual formulation, design and testing of possible software project alternatives (the preliminary design stage). Costs incurred after final acceptance testing has been successfully completed are expensed. Capitalized computer software costs are amortized over their estimated useful life of three years.
All computer software costs capitalized to date relate to the purchase, development and implementation of engineering, accounting and other enterprise software.
Other-than-Temporary Impairments
We review our investment portfolio during each reporting period to determine whether there are identified events or circumstances that would indicate there is a decline in the fair value that is considered to be other-than-temporary. For non-public investments, if there are no identified events or circumstances that would have a significant adverse effect on the fair value of the investment, then the fair value is not estimated. If an investment is deemed to have experienced an other-than-temporary decline below its cost basis, we reduce the carrying amount of the investment to its quoted or estimated fair value, as applicable, and establish a new cost basis for the investment. For cost method investments we charge the impairment to
Other (Expense) Income
line of our Consolidated Statements of Income.
Investments in Other Entities
We may make strategic investments in companies that have developed or are developing technologies that are complementary to our business. We account for our investments using either the cost or equity method of accounting. Under the cost method, we do not adjust our investment balance when the investee reports profit or loss but monitor the investment for an other-than-temporary decline in value. On a quarterly basis, we monitor our investment’s financial position and performance to assess whether there are any triggering events or indicators present that would be indicative of an other-than-temporary impairment of our investment. When assessing whether an other-than-temporary decline in value has occurred, we consider such factors as the valuation placed on the investee in subsequent rounds of financing, the performance of the investee relative to its own performance targets and business plan, and the investee’s revenue and cost trends, liquidity and cash position, including its cash burn rate, and updated forecasts. Under the equity method of accounting, we initially record our investment in the stock of an investee at cost, and adjust the carrying amount of the investment to recognize our share of the earnings or losses of the investee after the date of acquisition. The amount of the adjustment is included in the determination of net income, and such amount reflects adjustments similar to those made in preparing consolidated statements including adjustments to eliminate intercompany gains and losses, and to amortize, if appropriate, any difference between our cost and underlying equity in net assets of the investee at the date of investment. The investment is also adjusted to reflect our share of changes in the investee’s capital. Dividends received from an investee reduce the carrying amount of the investment. When there are a series of operating losses by the investee or when other factors indicate that a decrease in value of the investment has occurred which is other than temporary, we recognize an impairment equal to the difference between the fair value and the carrying amount of our investment. The carrying costs of our investments are included within
Other Non-Current Assets
on our Consolidated Balance Sheets.
62
In September 2009, we entered into a worldwide patent licensing agreement with Pantech Co., Ltd. (“Pantech”) (formally known separately as Pantech Co., Ltd. and Pantech & Curitel Communications, Inc.). In exchange for granting Pantech the license, we received cash consideration and a minority equity interest in both Pantech Co., Ltd. and Pantech & Curitel Communications, Inc. Simultaneous with the execution of the patent license agreement, we executed a stock agreement to acquire a minority stake in Pantech using the Korean Won provided by Pantech with no participation at the board level or in management. Given that there are no observable inputs relevant to our investment in Pantech, we assessed pertinent risk factors, and reviewed a third-party valuation that used the discounted cash flow method, and incorporated illiquidity discounts in order to assign a fair market value to our investment. After consideration of the aforementioned factors, we valued our non-controlling equity interest in Pantech at
$21.7 million
. We are accounting for this investment using the cost method of accounting.
During 2007, we made a
$5.0 million
investment for a non-controlling interest in Kineto Wireless (“Kineto”). Due to the fact that we do not have significant influence over Kineto, we are accounting for this investment using the cost method of accounting. In first quarter 2008, we wrote down this investment by
$0.7 million
based on a lower valuation of Kineto. Early in second quarter 2008, we participated in a new round of financing that included several other investors, investing an additional
$0.7 million
in Kineto. This second investment both maintained our ownership position and preserved certain liquidation preferences. During 2009, we reassessed our investment in Kineto and concluded that, given their financial position at the time, it was necessary to record an impairment of
$3.9 million
, which reduced our carrying amount of our investment in Kineto to approximately
$1.0 million
at December 31, 2009. During 2010, we reassessed our investment in Kineto and concluded that there was no evidence of an other-than-temporary impairment. As of December 31, 2010, the carrying amount of our investment in Kineto was
$1.0 million
. During 2011, we reassessed our investment in Kineto and concluded that given their financial position at the time, it was necessary to record an impairment of
$1.0 million
which reduced our carrying amount of our investment to
zero
as of December 31, 2011.
On December 17, 2009, we announced a multi-faceted collaboration agreement with Attila Technologies LLC (“Attila”). We will collaborate on the development and marketing of bandwidth aggregation technologies and related multi-network innovations. In addition, we paid approximately
$0.7 million
to acquire a
7%
minority stake. No other amounts were paid or are payable to Attila for the period ended December 31, 2009. Certain terms of the agreement afford us the ability to exercise significant influence over Attila; therefore we are accounting for this investment using the equity method of accounting. During 2010, we reassessed our investment in Attila and concluded that there was no evidence of an other-than-temporary impairment. As of December 31, 2010, the carrying amount of our investment in Attila was
$0.7 million
. During 2011, we reassessed our investment in Attila and concluded that given their financial position at the time, it was necessary to record an impairment of
$0.7 million
which reduced our carrying amount of our investment to
zero
as of December 31, 2011.
Patents
We capitalize external costs, such as filing fees and associated attorney fees, incurred to obtain issued patents and patent license rights. We expense costs associated with maintaining and defending patents subsequent to their issuance in the period incurred. We amortize capitalized patent costs for internally generated patents on a straight-line basis over ten years, which represents the estimated useful lives of the patents. The ten year estimated useful life for internally generated patents is based on our assessment of such factors as: the integrated nature of the portfolios being licensed, the overall makeup of the portfolio over time, and the length of license agreements for such patents. The estimated useful lives of acquired patents and patent rights, however, have been and will continue to be based on separate analysis related to each acquisition and may differ from the estimated useful lives of internally generated patents. The average estimated useful life of acquired patents thus far has been
twelve
years. We assess the potential impairment to all capitalized net patent costs when events or changes in circumstances indicate that the carrying amount of our patent portfolio may not be recoverable.
Patents consisted of the following (in thousands, except for useful life data):
|
|
December 31,
|
||||||
|
|
2012
|
2011
|
|||||
|
Weighted average estimated useful life (years)
|
10.3
|
|
10.7
|
|
|||
|
Gross patents
|
$
|
300,174
|
|
$
|
245,999
|
|
|
|
Accumulated amortization
|
(122,617
|
)
|
(108,036
|
)
|
|||
|
Patents, net
|
$
|
177,557
|
|
$
|
137,963
|
|
|
Amortization expense related to capitalized patent costs was
$22.7 million
,
$19.6 million
and
$17.2 million
in
2012
,
2011
and
2010
, respectively. These amounts are recorded within
Patent administration and licensing
line of our Consolidated Statements of Income.
63
The estimated aggregate amortization expense for the next five years related to our patents balance as of
December 31, 2012
is as follows (in thousands):
|
2013
|
$
|
26,777
|
|
|
2014
|
25,916
|
|
|
|
2015
|
24,734
|
|
|
|
2016
|
23,308
|
|
|
|
2017
|
20,727
|
|
|
Intangible Assets
We capitalize the cost of technology solutions and platforms we acquire or license from third parties when they have a future benefit and the development of these solutions and platforms is substantially complete at the time they are acquired or licensed.
Revenue Recognition
We derive the vast majority of our revenue from patent licensing. The timing and amount of revenue recognized from each licensee depends upon a variety of factors, including the specific terms of each agreement and the nature of the deliverables and obligations. Such agreements are often complex and include multiple elements. These agreements can include, without limitation, elements related to the settlement of past patent infringement liabilities, up-front and non-refundable license fees for the use of patents and/or know-how, patent and/or know-how licensing royalties on covered products sold by licensees, cross-licensing terms between us and other parties, the compensation structure and ownership of intellectual property rights associated with contractual technology development arrangements, advanced payments and fees for service arrangements and settlement of intellectual property enforcement. For agreements entered into or materially modified prior to 2011, due to the inherent difficulty in establishing reliable, verifiable, and objectively determinable evidence of the fair value of the separate elements of these agreements, the total revenue resulting from such agreements has often been recognized over the performance period. Beginning in January 2011, all new or materially modified agreements are being accounted for under the Financial Accounting Standards Board ("FASB") revenue recognition guidance, "Revenue Arrangements with Multiple Deliverables." This guidance requires consideration to be allocated to each element of an agreement that has stand alone value using the relative fair value method. In other circumstances, such as those agreements involving consideration for past and expected future patent royalty obligations, after consideration of the particular facts and circumstances, the appropriate recording of revenue between periods may require the use of judgment. In all cases, revenue is only recognized after all of the following criteria are met: (1) written agreements have been executed; (2) delivery of technology or intellectual property rights has occurred or services have been rendered; (3) fees are fixed or determinable; and (4) collectibility of fees is reasonably assured.
We establish a receivable for payments expected to be received within twelve months from the balance sheet date based on the terms in the license. Our reporting of such payments often results in an increase to both accounts receivable and deferred revenue. Deferred revenue associated with fixed-fee royalty payments is classified on the balance sheet as short-term when it is scheduled to be amortized within twelve months from the balance sheet date. All other deferred revenue is classified as long term, as amounts to be recognized over the next twelve months are not known.
Patent License Agreements
Upon signing a patent license agreement, we provide the licensee permission to use our patented inventions in specific applications. We account for patent license agreements in accordance with the guidance for revenue arrangements with multiple deliverables and the guidance for revenue recognition. We have elected to utilize the leased-based model for revenue recognition, with revenue being recognized over the expected period of benefit to the licensee. Under our patent license agreements, we typically receive one or a combination of the following forms of payment as consideration for permitting our licensees to use our patented inventions in their applications and products:
Consideration for Past Sales:
Consideration related to a licensee’s product sales from prior periods may result from a negotiated agreement with a licensee that utilized our patented inventions prior to signing a patent license agreement with us or from the resolution of a disagreement or arbitration with a licensee over the specific terms of an existing license agreement. We may also receive consideration for past sales in connection with the settlement of patent litigation where there was no prior patent license agreement. In each of these cases, we record the consideration as revenue when we have obtained a signed agreement, identified a fixed or determinable price and determined that collectibility is reasonably assured.
64
Fixed-Fee Royalty Payments:
These are up-front, non-refundable royalty payments that fulfill the licensee’s obligations to us under a patent license agreement for a specified time period or for the term of the agreement for specified products, under certain patents or patent claims, for sales in certain countries, or a combination thereof — in each case for a specified time period (including for the life of the patents licensed under the agreement). We recognize revenues related to Fixed-Fee Royalty Payments on a straight-line basis over the effective term of the license. We utilize the straight-line method because we cannot reliably predict in which periods, within the term of a license, the licensee will benefit from the use of our patented inventions.
Prepayments:
These are up-front, non-refundable royalty payments towards a licensee’s future obligations to us related to its expected sales of covered products in future periods. Our licensees’ obligations to pay royalties typically extend beyond the exhaustion of their Prepayment balance. Once a licensee exhausts its Prepayment balance, we may provide them with the opportunity to make another Prepayment toward future sales or it will be required to make Current Royalty Payments.
Current Royalty Payments:
These are royalty payments covering a licensee’s obligations to us related to its sales of covered products in the current contractual reporting period.
Licensees that either owe us Current Royalty Payments or have Prepayment balances are obligated to provide us with quarterly or semi-annual royalty reports that summarize their sales of covered products and their related royalty obligations to us. We typically receive these royalty reports subsequent to the period in which our licensees’ underlying sales occurred. As a result, it is impractical for us to recognize revenue in the period in which the underlying sales occur, and, in most cases, we recognize revenue in the period in which the royalty report is received and other revenue recognition criteria are met due to the fact that without royalty reports from our licensees, our visibility into our licensees’ sales is very limited.
The exhaustion of Prepayments and Current Royalty Payments are often calculated based on related per-unit sales of covered products. From time to time, licensees will not report revenues in the proper period, most often due to legal disputes. When this occurs, the timing and comparability of royalty revenue could be affected.
In cases where we receive objective, verifiable evidence that a licensee has discontinued sales of products covered under a patent license agreement with us, we recognize any related deferred revenue balance in the period that we receive such evidence.
Patent Sales
During 2012, we expanded our business strategy of monetizing our intellectual property to include the sale of select patent assets. As patent sales executed under this expanded strategy represent a component of our ongoing major or central operations and activities, we will record the related proceeds as revenue. We will recognize the revenue when there is persuasive evidence of a sales arrangement, fees are fixed or determinable, delivery has occurred and collectibility is reasonably assured. These requirements are generally fulfilled upon closing of the patent sale transaction.
Technology Solutions and Engineering Services
Technology solutions revenue consists primarily of revenue from software licenses and engineering services. Software license revenues are recognized in accordance with the original and revised guidance for software revenue recognition. When the arrangement with a customer includes significant production, modification, or customization of the software, we recognize the related revenue using the percentage-of-completion method in accordance with the accounting guidance for construction-type and certain production-type contracts. Under this method, revenue and profit are recognized throughout the term of the contract, based on actual labor costs incurred to date as a percentage of the total estimated labor costs related to the contract. Changes in estimates for revenues, costs and profits are recognized in the period in which they are determinable. When such estimates indicate that costs will exceed future revenues and a loss on the contract exists, a provision for the entire loss is recognized at that time.
We recognize revenues associated with engineering service arrangements that are outside the scope of the accounting guidance for construction-type and certain production-type contracts on a straight-line basis, unless evidence suggests that the revenue is earned in a different pattern, over the contractual term of the arrangement or the expected period during which those specified services will be performed, whichever is longer. In such cases we often recognize revenue using proportional performance and measure the progress of our performance based on the relationship between incurred labor hours and total estimated labor hours or other measures of progress, if available. Our most significant cost has been labor and we believe both labor hours and labor cost provide a measure of the progress of our services. The effect of changes to total estimated contract costs is recognized in the period such changes are determined.
When technology solutions agreements include royalty payments, we recognize revenue from the royalty payments using the same methods described above under our policy for recognizing revenue from patent license agreements.
65
Deferred Charges
From time to time, we use sales agents to assist us in our licensing activities. In such cases, we may pay a commission. The commission rate varies from agreement to agreement. Commissions are normally paid shortly after our receipt of cash payments associated with the patent license agreements. We defer recognition of commission expense related to both prepayments and fixed-fee royalty payments and amortize these expenses in proportion to our recognition of the related revenue. In
2012
,
2011
and
2010
, we paid cash commissions of approximately
$4.7 million
,
$0.1 million
and
$0.6 million
, respectively.
Incremental direct costs incurred related to acquisition or origination of a customer contract in a transaction that results in the deferral of revenue may be either expensed as incurred or capitalized. The only eligible costs for deferral are those costs directly related to a particular revenue arrangement. We capitalize those direct costs incurred for the acquisition of a contract through the date of signing, and amortize them on a straight-line basis over the life of the patent license agreement. We paid approximately
$0.6 million
of direct contract origination costs in 2009 in relation to our patent licensing agreement with Pantech. There were no direct contract origination costs incurred during
2012
,
2011
, or 2010.
Incremental direct costs incurred related to a debt financing transaction may be capitalized. In connection with our Notes offering, discussed in detail within Note 6,
Obligations
, the company incurred
$8.0 million
of directly related costs. The initial purchaser's transaction fees and related offering expenses were allocated to the liability and equity components of the debt in proportion to the allocation of proceeds and accounted for as debt issuance costs. We allocated
$6.5 million
of debt issuance costs to the liability component of the debt, which were capitalized as deferred financing costs. These costs are being amortized to interest expense over the term of the debt using the effective interest method. The remaining
$1.5 million
of costs allocated to the equity component of the debt were recorded as a reduction of the equity component of the debt. There were no debt issuance costs incurred in 2012 or 2010.
Deferred charges are recorded in our Consolidated Balance Sheets within the following captions (in thousands):
|
|
December 31,
|
||||||
|
|
2012
|
2011
|
|||||
|
Prepaid and other current assets
|
|
|
|
|
|||
|
Deferred commission expense
|
$
|
289
|
|
$
|
289
|
|
|
|
Deferred contract origination costs
|
79
|
|
79
|
|
|||
|
Deferred financing costs
|
1,303
|
|
1,303
|
|
|||
|
Other non-current assets
|
|
|
|
|
|||
|
Deferred commission expense
|
1,061
|
|
1,406
|
|
|||
|
Deferred contract origination costs
|
237
|
|
316
|
|
|||
|
Deferred financing costs
|
2,932
|
|
4,235
|
|
|||
Commission expense was approximately
$5.0 million
,
$0.4 million
and
$3.7 million
in
2012
,
2011
and
2010
, respectively. Commission expense is included within the
Patent administration and licensing
line of our Consolidated Statements of Income. Deferred contract origination expense recognized in
2012
,
2011
and
2010
was less than
$0.1 million
in each period and is included within
Patent administration and licensing
line of our Consolidated Statements of Income. Deferred financing expense was
$1.3 million
in
2012
and
$1.0 million
in 2011. There was no deferred financing expense incurred in 2010. Deferred financing expense is included within the
Other (Expense) Income
line of our Consolidated Statements of Income.
Research and Development
Research and development expenditures are expensed in the period incurred, except certain software development costs which are capitalized between the point in time that technological feasibility of the software is established and the product is available for general release to customers. We did not have any such capitalized software costs in any period presented. Research, development and other related costs were approximately
$67.9 million
,
$63.8 million
and
$71.5 million
in
2012
,
2011
and
2010
, respectively.
66
Compensation Programs
We account for compensation costs associated with share-based transactions based on the fair value of the instruments issued, net of any estimated award forfeitures. At
December 31, 2012
,
2011
and
2010
, we have estimated the forfeiture rates for outstanding RSUs to be between
0%
and
25%
over their lives of one to three years, depending upon the type of grant and the specific terms of the award issued.
In 2006, we adopted the short-cut method to establish the historical additional paid-in-capital pool (“APIC Pool”) related to the tax effects of employee share-based compensation. Any positive balance would be available to absorb tax shortfalls (which occur when the tax deductions resulting from share-based compensation are less than the related book expense) recognized subsequent to the adoption of the stock-based compensation guidance. We did not incur any net tax shortfalls in
2012
,
2011
, or
2010
.
In all periods, our policy has been to set the value of RSU and restricted stock awards equal to the value of our underlying common stock on the date of measurement. For grants made prior to
2010
with graded vesting, we amortize the associated unrecognized compensation cost using an accelerated method. For grants made in
2012
,
2011
and
2010
that cliff vest, we expect to amortize the associated unrecognized compensation cost at
December 31, 2012
on a straight-line basis over a three-year period.
Impairment of Long-Lived Assets
We evaluate long-lived and intangible assets for impairment when factors indicate that the carrying value of an asset may not be recoverable. When factors indicate that such assets should be evaluated for possible impairment, we review whether we will be able to realize our long-lived assets by analyzing the projected undiscounted cash flows in measuring whether the asset is recoverable. We did not have any long-lived asset impairments in
2012
, 2011, or 2010.
Income Taxes
Income taxes are accounted for under the asset and liability method. Under this method, deferred tax assets and liabilities are recognized for the estimated future tax consequences attributable to differences between the financial statement carrying amounts of existing assets and liabilities and their respective tax bases, and operating loss and tax credit carry forwards. Deferred tax assets and liabilities are measured using enacted tax rates in effect for the year in which those temporary differences are expected to be recovered or settled. The effect on deferred tax assets and liabilities of a change in tax rates is recognized in the Consolidated Statement of Income in the period that includes the enactment date. A valuation allowance is recorded to reduce the carrying amounts of deferred tax assets if management has determined that it is more likely than not that such assets will not be realized.
In addition, the calculation of tax liabilities involves significant judgment in estimating the impact of uncertainties in the application of complex tax laws. We are subject to examinations by the Internal Revenue Service (“IRS”) and other taxing jurisdictions on various tax matters, including challenges to various positions we assert in our filings. In the event that the IRS or another taxing jurisdiction levies an assessment in the future, it is possible the assessment could have a material adverse effect on our consolidated financial condition or results of operations.
The financial statement recognition of the benefit for a tax position is dependent upon the benefit being more likely than not to be sustainable upon audit by the applicable tax authority. If this threshold is met, the tax benefit is then measured and recognized at the largest amount that is greater than 50 percent likely of being realized upon ultimate settlement. In the event that the IRS or another taxing jurisdiction levies an assessment in the future, it is possible the assessment could have a material adverse effect on our consolidated financial condition or results of operations.
During fourth quarter 2009, we completed a study to assess the company’s ability to utilize foreign tax credit carryovers into the tax year 2006. As a result of the study, we amended our United States federal income tax returns for the periods 1999 — 2005 to reclassify
$29.3 million
of foreign tax payments we made during those periods from deductions to foreign tax credits. We also amended our federal tax returns for the periods 2006 - 2008 to utilize the resulting tax credits. When we completed the study, we established a basis to support amending the returns and estimated that the maximum incremental benefit would be
$19.1 million
.
We recognized a net benefit of
$16.4 million
after establishing a
$2.7 million
reserve for related tax contingencies. In 2011, we recorded an additional tax benefit of
$8.3 million
to eliminate this $2.7 million reserve and other tax contingencies and recognize interest income on the associated refund.
Between 2006 and 2012, we paid approximately
$145.8 million
in foreign taxes for which we have claimed foreign tax credits against our U.S. tax obligations. It is possible that as a result of tax treaty procedures, the U.S. government may reach an agreement with the related foreign governments that will result in a partial refund of foreign taxes paid with a related
67
reduction in our foreign tax credits. Due to both foreign currency fluctuations and differences in the interest rate charged by the U.S. government compared to the interest rates, if any, used by the foreign governments, any such agreement could result in interest expense and/or foreign currency gain or loss.
Net Income Per Common Share
Basic Earnings Per Share ("EPS") is calculated by dividing net income available to common shareholders by the weighted-average number of common shares outstanding for the period. Diluted EPS reflects the potential dilution that could occur if options or other securities with features that could result in the issuance of common stock were exercised or converted to common stock. The following table reconciles the numerator and the denominator of the basic and diluted net income per share computation (in thousands, except for per share data):
|
|
For the Year Ended December 31,
|
||||||||||||||||||||||
|
|
2012
|
2011
|
2010
|
||||||||||||||||||||
|
|
Basic
|
Diluted
|
Basic
|
Diluted
|
Basic
|
Diluted
|
|||||||||||||||||
|
Numerator:
|
|
|
|
|
|||||||||||||||||||
|
Net income applicable to common shareholders
|
$
|
271,804
|
|
$
|
271,804
|
|
$
|
89,468
|
|
$
|
89,468
|
|
$
|
153,616
|
|
$
|
153,616
|
|
|||||
|
Denominator:
|
|
|
|
|
|
||||||||||||||||||
|
Weighted-average shares outstanding: Basic
|
43,070
|
|
43,070
|
|
45,411
|
|
45,411
|
|
44,084
|
|
44,084
|
|
|||||||||||
|
Dilutive effect of stock options, RSUs and convertible securities
|
|
326
|
|
|
603
|
|
|
740
|
|
||||||||||||||
|
Weighted-average shares outstanding: Diluted
|
|
43,396
|
|
|
46,014
|
|
|
44,824
|
|
||||||||||||||
|
Earnings Per Share:
|
|
|
|
|
|
|
|||||||||||||||||
|
Net income: Basic
|
$
|
6.31
|
|
6.31
|
|
$
|
1.97
|
|
1.97
|
|
$
|
3.48
|
|
3.48
|
|
||||||||
|
Dilutive effect of stock options, RSUs and convertible securities
|
|
(0.05
|
)
|
|
(0.03
|
)
|
(0.05
|
)
|
|||||||||||||||
|
Net income: Diluted
|
|
$
|
6.26
|
|
|
$
|
1.94
|
|
$
|
3.43
|
|
||||||||||||
For the years ended
December 31, 2012
, December 31, 2011 and December 31, 2010, options to purchase
zero
,
zero
and less than
0.1 million
shares of common stock, respectively, were excluded from the computation of diluted EPS because their effect would have been anti-dilutive.
For the years ended
December 31, 2012
and December 31, 2011,
4.0 million
and
3.9 million
shares of common stock issuable under convertible securities were excluded from the computation of diluted EPS because their effect would have been anti-dilutive.
For the years ended
December 31, 2012
and December 31, 2011,
4.0 million
shares of common stock issuable under warrants were excluded from the computation of diluted EPS because their effect would have been anti-dilutive. There were no warrants or convertible securities outstanding for the year ended
December 31, 2010
.
New Accounting Guidance
Accounting Standards Updates: Fair Value Measurements: Amendments to Achieve Common Fair Value Measurement and Disclosure Requirements in U.S. GAAP and IFRS
In May 2011, the FASB issued authoritative guidance that is more closely aligned with the fair value measurement and disclosure guidance issued by the International Accounting Standards Board ("IASB"). The issuance of this standard results in global fair value measurement and disclosure guidance that minimizes the differences between U.S. GAAP and International Financial Reporting Standards. Many of the changes in the final standard represent clarifications to existing guidance, while some changes related to the valuation premise and the application of premiums and discounts and new required disclosures are more significant. This guidance is effective for interim and annual periods beginning after December 15, 2011. We adopted this guidance effective January 1, 2012; however, the adoption of this guidance does not have a significant impact on the company’s financial statements or related disclosures.
Accounting Standards Updates: Presentation of Comprehensive Income
In June 2011, the FASB issued authoritative guidance requiring most entities to present items of net income and other comprehensive income either in one continuous statement, referred to as the statement of comprehensive income, or in two
68
separate, but consecutive, statements of net income and other comprehensive income. The option to present items of other comprehensive income in the statement of changes in equity was eliminated. This guidance is effective for interim and annual periods beginning after December 15, 2011. We adopted this guidance effective January 1, 2012. We have chosen to present items of net income and other comprehensive income in two separate but consecutive statements.
On December 23, 2011, the FASB issued an amendment to the new standard on comprehensive income to defer the requirement to measure and present reclassification adjustments from accumulated other comprehensive income to net income by income statement line item in net income and also in other comprehensive income. The deferred requirement would have called for the measurement and presentation in net income of items previously recognized in other comprehensive income.
In February 2013, the FASB issued final guidance on the presentation of reclassifications out of other comprehensive income. The amendments require an entity to provide information about the amounts reclassified out of other comprehensive income by component. In addition, an entity is required to present, either on the face of the income statement or in a footnote, significant amounts reclassified out of accumulated other comprehensive income by the respective line items of net income, only if the amount reclassified is required by GAAP to be reclassified to net income in its entirety in the same reporting period. For other amounts that are not required under GAAP to be reclassified in their entirety to net income, an entity is required to cross-reference to other disclosures required under GAAP that provide detail about those amounts. This amendment is effective for interim and fiscal years beginning after December 15, 2012. The amended standard will not impact the Company's financial position or results of operations.
|
3.
|
SIGNIFICANT AGREEMENTS
|
Sony Agreement
On December 21, 2012, we formed a joint venture with Sony Corporation of America to combine Sony's consumer electronics expertise with our wireless M2M and bandwidth management research. The joint venture, called Convida Wireless, will focus on driving new research in M2M wireless communications and other connectivity areas. Based on the terms of the agreement, the parties will contribute funding and resources for additional M2M research and platform development, which we will perform. Stephens Capital Partners LLC (“Stephens”), the principal investing affiliate of Stephens Inc., is a minority investor in Convida Wireless.
Our agreement with Sony is a multiple-element arrangement that also includes a three-year license to our patents for Sony's sale of 3G and 4G products, effective January 1, 2013, and an amount for past sales.
Under the arrangement, we expect to collect a total of
$125.0 million
of cash and have also acquired
certain patents
from Sony. We have estimated the value of the acquired patents to be
$28.9 million
.
We estimated the fair value of patents by a combination of a discounted cash flow analysis (the income approach) and an analysis of comparable market transactions (the market approach). For the income approach, the inputs and assumptions used to develop this estimate were based on a market participant perspective and included estimates of projected royalties, discount rates, useful lives and income tax rates, among others. For the market approach, judgment was applied as to which market transactions were most comparable to this transaction. These inputs and assumptions represent our best estimates at the time of the transaction. Changes in any number of these assumptions may have had a substantial impact on the estimated value of the acquired patents.
In connection with this arrangement, we recognized
$22.3 million
of patent licensing revenue in fourth quarter 2012, and we expect to recognize
$116.6 million
of patent licensing revenue, using the straight-line method, over the three-year term of the patent license. The remaining
$15.0 million
represents funding toward M2M research and platform development.
Convida Wireless is a variable interest entity. Based on our provision of M2M research and platform development services to Convida Wireless, we have determined that we are the primary beneficiary for accounting purposes and must consolidate Convida Wireless. Because Convida Wireless had no operations in 2012, the consolidation of Convida Wireless had no impact on our financial statements as of December 31, 2012, and there was
no
income or loss to allocate to interests held by other parties.
|
4.
|
GEOGRAPHIC / CUSTOMER CONCENTRATION
|
We have one reportable segment. As of
December 31, 2012
, a large portion of our revenue was derived from
$375.0 million
in patent sales to Intel Corporation, a U.S. company. Our remaining revenues were primarily derived from a limited number of licensees based outside of the United States, primarily in Asia. These revenues were paid in U.S. dollars and were not subject to any substantial foreign exchange transaction risk. The table below lists the countries of the headquarters of our licensees and the total revenue derived from each country for the periods indicated (in thousands):
69
|
|
For the Year Ended December 31,
|
||||||||||
|
|
2012
|
2011
|
2010
|
||||||||
|
United States
|
$
|
406,950
|
|
$
|
13,719
|
|
$
|
18,953
|
|
||
|
Korea
|
118,078
|
|
118,078
|
|
175,614
|
|
|||||
|
Canada
|
40,667
|
|
54,728
|
|
38,820
|
|
|||||
|
Taiwan
|
40,394
|
|
43,993
|
|
21,559
|
|
|||||
|
Japan
|
39,558
|
|
61,594
|
|
121,113
|
|
|||||
|
China
|
9,246
|
|
688
|
|
6,305
|
|
|||||
|
Other Europe
|
4,700
|
|
3,461
|
|
1,877
|
|
|||||
|
Germany
|
3,470
|
|
5,439
|
|
10,292
|
|
|||||
|
Other Asia
|
—
|
|
42
|
|
12
|
|
|||||
|
Total
|
$
|
663,063
|
|
$
|
301,742
|
|
$
|
394,545
|
|
||
During
2012
,
2011
and
2010
, the following licensees or customers accounted for
10%
or more of total revenues:
|
2012
|
2011
|
2010
|
|||
|
Intel Corporation
|
57%
|
< 10%
|
< 10%
|
||
|
Samsung Electronics Co., Ltd.
|
15%
|
34%
|
26%
|
||
|
BlackBerry
|
< 10%
|
14%
|
< 10%
|
||
|
HTC Corporation
|
< 10%
|
11%
|
< 10%
|
||
|
LG Electronics
|
—%
|
—%
|
15%
|
||
At
December 31, 2012
,
2011
and
2010
, we held
$185.4 million
,
or nearly
100%
,
$146.0 million
, or
nearly
100%
,
and
$138.4 million
,
or
99%
,
respectively, of our property and equipment and patents in the United States net of accumulated depreciation and amortization. At
December 31, 2012
,
2011
and
2010
, we also held
zero
,
$0.1 million
and
$0.2 million
, respectively, of property and equipment, net of accumulated depreciation, in Canada.
5. PROPERTY AND EQUIPMENT
|
|
December 31,
|
||||||
|
|
2012
|
2011
|
|||||
|
Land
|
$
|
695
|
|
$
|
695
|
|
|
|
Building and improvements
|
7,800
|
|
7,763
|
|
|||
|
Engineering and test equipment
|
11,604
|
|
11,021
|
|
|||
|
Computer equipment and software
|
28,143
|
|
25,738
|
|
|||
|
Furniture and fixtures
|
1,578
|
|
1,357
|
|
|||
|
Leasehold improvements
|
4,655
|
|
4,530
|
|
|||
|
Property and equipment, gross
|
54,475
|
|
51,104
|
|
|||
|
Less: accumulated depreciation
|
(46,651
|
)
|
(43,107
|
)
|
|||
|
Property and equipment, net
|
$
|
7,824
|
|
$
|
7,997
|
|
|
Depreciation expense was
$3.6 million
,
$4.2 million
and
$4.9 million
in
2012
,
2011
and
2010
, respectively. Depreciation expense included depreciation of computer software costs of
$1.0 million
,
$1.2 million
and
$1.8 million
in
2012
,
2011
and
2010
, respectively. Accumulated depreciation related to computer software costs was
$15.7 million
and
$14.7 million
at
December 31, 2012
and
2011
, respectively. The net book value of our computer software was
$1.7 million
and
$1.6 million
at
December 31, 2012
and
2011
, respectively.
70
|
6.
|
OBLIGATIONS
|
|
|
December 31,
|
||||||
|
|
2012
|
2011
|
|||||
|
Mortgage debt
|
$
|
—
|
|
$
|
180
|
|
|
|
2.50% Senior Convertible Notes due 2016
|
230,000
|
|
230,000
|
|
|||
|
Unamortized interest discount
|
(29,609
|
)
|
(37,471
|
)
|
|||
|
Total debt obligations
|
200,391
|
|
192,709
|
|
|||
|
Less: Current portion
|
—
|
|
180
|
|
|||
|
Long-term debt obligations
|
$
|
200,391
|
|
$
|
192,529
|
|
|
During 1996, we purchased our King of Prussia, Pennsylvania, facility for
$3.7 million
, including cash of
$0.9 million
and a 16-year mortgage of
$2.8 million
with interest payable at a rate of
8.28%
per annum. We have no obligations associated with our King of Prussia, Pennsylvania, facility as of December 31, 2012. The carrying amount of the land and office building in King of Prussia was
$2.3 million
as of
December 31, 2012
.
There were no capital leases remaining at December 31, 2012 and December 31, 2011.
Maturities of principal of the long-term debt obligations of the company as of
December 31, 2012
are as follows (in thousands):
|
2013
|
$
|
—
|
|
|
2014
|
—
|
|
|
|
2015
|
—
|
|
|
|
2016
|
230,000
|
|
|
|
2017
|
—
|
|
|
|
Thereafter
|
—
|
|
|
|
|
$
|
230,000
|
|
Senior Convertible Note, Note Hedge and Warrant Transactions
On April 4, 2011, InterDigital issued
$230.0 million
in aggregate principal amount of its
2.50%
Senior Convertible Notes due 2016 (the “Notes”) pursuant to an indenture (the “Indenture”), dated as of April 4, 2011, by and between the company and The Bank of New York Mellon Trust Company, N.A., as trustee (the “Trustee”). The Notes bear interest at a rate of
2.50%
per year, payable in cash on March 15 and September 15 of each year, commencing September 15, 2011. The Notes will mature on March 15, 2016, unless earlier converted or repurchased. The Notes are the company's senior unsecured obligations and rank equally in right of payment with any of the company's future senior unsecured indebtedness, and the Notes are structurally subordinated to the company's future secured indebtedness to the extent of the value of the related collateral and to the indebtedness and other liabilities, including trade payables, of the company's subsidiaries, except with respect to any subsidiaries that become guarantors pursuant to the terms of the Indenture.
The Notes will be convertible into cash and, if applicable, shares of the company's common stock at a conversion rate of
17.958
shares of common stock per
$1,000
principal amount of Notes (which is equivalent to an initial conversion price of approximately
$55.69
per share), as adjusted for the special dividend paid December 28, 2012. The conversion rate, and thus the conversion price, may be adjusted under certain circumstances, including in connection with conversions made following certain fundamental changes and under other circumstances as set forth in the Indenture.
Prior to 5:00 p.m., New York City time, on the business day immediately preceding December 15, 2015, the Notes will be convertible only under certain circumstances as set forth in the Indenture. Commencing on December 15, 2015, the Notes will be convertible in multiples of
$1,000
principal amount, at any time prior to 5:00 p.m., New York City time, on the business day immediately preceding the maturity date of the Notes. Upon any conversion, the conversion obligation will be settled in cash up to, and including, the principal amount and, to the extent of any excess over the principal amount, in shares of common stock.
71
If a fundamental change (as defined in the Indenture) occurs, holders may require the company to purchase all or a portion of their Notes for cash at a repurchase price equal to 100% of the principal amount of the Notes to be repurchased, plus any accrued and unpaid interest to, but excluding, the fundamental change repurchase date.
The company may not redeem the Notes prior to their maturity date.
On March 29 and March 30, 2011, in connection with the offering of the Notes, InterDigital entered into convertible note hedge transactions with respect to its common stock with Barclays Bank PLC, through its agent, Barclays Capital Inc. The two convertible note hedge transactions cover, subject to customary anti-dilution adjustments, approximately
3.5 million
and approximately
0.5 million
shares of common stock, respectively, at a strike price that corresponds to the initial conversion price of the Notes, also subject to adjustment, and are exercisable upon conversion of the Notes.
On April 4, 2011, the company paid
$37.1 million
and
$5.6 million
for the convertible note hedge transactions entered into on March 29 and March 30, 2011, respectively. The aggregate cost of the convertible note hedge transactions was
$42.7 million
. As described in more detail below, this cost was partially offset by the proceeds from the sale of the warrants in separate transactions.
The convertible note hedge transactions are intended generally to reduce the potential dilution to the common stock upon conversion of the Notes in the event that the market price per share of the common stock is greater than the strike price.
The convertible note hedge transactions are separate transactions and are not part of the terms of the Notes. Holders of the Notes have no rights with respect to the convertible note hedge transactions.
On March 29 and March 30, 2011, InterDigital also entered into privately-negotiated warrant transactions with Barclays Bank PLC, through its agent, Barclays Capital Inc., whereby InterDigital sold warrants to acquire, subject to customary anti-dilution adjustments, approximately
3.5 million
shares and approximately
0.5 million
shares, respectively, of common stock at a strike price of
$64.09
per share, as adjusted for the special dividend paid December 28, 2012. The warrants become exercisable in tranches starting in June 2016. As consideration for the warrants issued on March 29 and March 30, 2011, the company received, on April 4, 2011,
$27.6 million
and
$4.1 million
, respectively.
If the market value per share of the common stock, as measured under the warrants, exceeds the strike price of the warrants at the time the warrants are exercisable, the warrants will have a dilutive effect on the company's earnings per share.
Accounting Treatment of the Senior Convertible Note, Convertible Note Hedge and Warrant Transactions
The offering of the Notes on March 29, 2011 was for
$200.0 million
and included an overallotment option that allowed the initial purchaser to purchase up to an additional
$30.0 million
aggregate principal amount of Notes. The initial purchaser exercised its overallotment option on March 30, 2011, bringing the total amount of Notes issued on April 4, 2011 to
$230.0 million
.
In connection with the offering of the Notes, as discussed above, InterDigital entered into convertible note hedge transactions with respect to its common stock. The
$42.7 million
cost of the convertible note hedge transactions was partially offset by the proceeds from the sale of the warrants described above, resulting in a net cost of
$10.9 million
.
Existing accounting guidance provides that the March 29, 2011 convertible note hedge and warrant contracts be treated as derivative instruments for the period during which the initial purchaser's overallotment option was outstanding. Once the overallotment provision was exercised on March 30, 2011, the March 29 convertible note hedge and warrant contracts were reclassified to equity, as the settlement terms of the company's note hedge and warrant contracts both provide for net share settlement. There was no material net change in the value of these convertible note hedges and warrants during the one day they were classified as derivatives and the equity components of these instruments will not be adjusted for subsequent changes in fair value.
Under current accounting guidance, the company bifurcated the proceeds from the offering of the Notes between the liability and equity components of the debt. On the date of issuance, the liability and equity components were calculated to be approximately
$187.0 million
and
$43.0 million
, respectively. The initial
$187.0 million
liability component was determined based on the fair value of similar debt instruments excluding the conversion feature. The initial
$43.0 million
(
$28.0 million
net of tax) equity component represents the difference between the fair value of the initial
$187.0 million
in debt and the
$230.0 million
of gross proceeds. The related initial debt discount of
$43.0 million
is being amortized using the effective interest method over the life of the Notes. An effective interest rate of
7%
was used to calculate the debt discount on the Notes.
In connection with the above-noted transactions, the company incurred
$8.0 million
of directly related costs. The initial purchaser's transaction fees and related offering expenses were allocated to the liability and equity components of the debt in proportion to the allocation of proceeds and accounted for as debt issuance costs. We allocated
$6.5 million
of debt issuance costs to the liability component of the debt, which were capitalized as deferred financing costs. These costs are being
72
amortized to interest expense over the term of the debt using the effective interest method. The remaining
$1.5 million
of costs allocated to the equity component of the debt were recorded as a reduction of the equity component of the debt.
The following table presents the amount of interest cost recognized for the
for the years ended
December 31, 2012
and
December 31, 2011
related to the contractual interest coupon, accretion of the debt discount and the amortization of financing costs (in thousands).
|
For the Year Ended December 31,
|
For the Year Ended December 31,
|
|||||||
|
2012
|
2011
|
|||||||
|
Contractual coupon interest
|
$
|
5,750
|
|
$
|
4,313
|
|
||
|
Accretion of debt discount
|
7,862
|
|
5,567
|
|
||||
|
Amortization of financing costs
|
1,303
|
|
977
|
|
||||
|
Total
|
$
|
14,915
|
|
$
|
10,857
|
|
||
|
7.
|
COMMITMENTS
|
Leases
We have entered into various operating lease agreements. Total rent expense, primarily for office space, was
$3.4 million
,
$3.4 million
and
$2.9 million
in
2012
,
2011
and
2010
, respectively. Minimum future rental payments for operating leases as of
December 31, 2012
are as follows (in thousands):
|
2013
|
$
|
2,406
|
|
|
2014
|
2,385
|
|
|
|
2015
|
2,120
|
|
|
|
2016
|
1,997
|
|
|
|
2017
|
1,875
|
|
|
|
Thereafter
|
6,073
|
|
|
|
8.
|
LITIGATION AND LEGAL PROCEEDINGS
|
Samsung, Nokia, Huawei and ZTE 2013 USITC Proceeding (337-TA-868) and Related Delaware District Court Proceedings
On January 2, 2013, the company's wholly owned subsidiaries InterDigital Communications, Inc., InterDigital Technology Corporation, IPR Licensing, Inc. and InterDigital Holdings, Inc. filed a complaint with the United States International Trade Commission (the “USITC” or “Commission”) against Samsung Electronics Co., Ltd., Samsung Electronics America, Inc. and Samsung Telecommunications America, LLC, Nokia Corporation and Nokia Inc., Huawei Technologies Co., Ltd., Huawei Device USA, Inc. and FutureWei Technologies, Inc. d/b/a Huawei Technologies (USA) and ZTE Corporation and ZTE (USA) Inc. (collectively, the “337-TA-868 Respondents”), alleging violations of Section 337 of the Tariff Act of 1930 in that they engaged in unfair trade practices by selling for importation into the United States, importing into the United States and/or selling after importation into the United States certain 3G and 4G wireless devices (including WCDMA-, cdma2000- and LTE-capable mobile phones, USB sticks, mobile hotspots, laptop computers and tablets and components of such devices) that infringe one or more of up to seven of InterDigital's U.S. patents. The complaint also extends to certain WCDMA and cdma2000 devices incorporating WiFi functionality. InterDigital's complaint with the USITC seeks an exclusion order that would bar from entry into the United States infringing 3G or 4G wireless devices (and components), including LTE devices, that are imported by or on behalf of the 337-TA-868 Respondents, and also seeks a cease-and-desist order to bar further sales of infringing products that have already been imported into the United States. Certain of the asserted patents have been asserted against Nokia, Huawei and ZTE in earlier pending USITC proceedings (including the Nokia, Huawei and ZTE 2011 USITC Proceeding (337-TA-800) and the Nokia 2007 USITC Proceeding (337-TA-613), as set forth below) and therefore are not being asserted against those 337-TA-868 Respondents in this investigation. On February 6, 2013, the Administrative Law Judge (“ALJ”) overseeing the proceeding issued an order setting a target date of June 4, 2014 for the Commission's final determination in the investigation, with the ALJ's Initial Determination on alleged violation due on February 4, 2014. On February 21, 2013, each 337-TA-868
Respondent filed their respective responses to the complaint.
73
On February 21, 2013, Samsung moved for partial termination of the investigation as to six of the seven patents asserted against Samsung, alleging that Samsung was authorized to import the specific 3G or 4G devices that InterDigital relied on to form the basis of its complaint. InterDigital's opposition is due March 4, 2013.
On February 22, 2013, Huawei and ZTE moved to stay the investigation pending their respective requests to the United States District Court for the District of Delaware (described below) to set a FRAND royalty rate for a license that covers the asserted patents, or in the alternative, until a Final Determination issues in the 337-TA-800 investigation. InterDigital's opposition is due March 4, 2013.
Also on January 2, 2013, the company's wholly owned subsidiaries InterDigital Communications, Inc., InterDigital Technology Corporation, IPR Licensing, Inc. and InterDigital Holdings, Inc. filed four related district court actions in the United States District Court for the District of Delaware (the “Delaware District Court”) against the 337-TA-868 Respondents. These complaints allege that each of the defendants infringes the same patents with respect to the same products alleged in the complaint filed by InterDigital in USITC Proceeding (337-TA-868). The complaints seek permanent injunctions and compensatory damages in an amount to be determined, as well as enhanced damages based on willful infringement, and recovery of reasonable attorneys' fees and costs. On January 24, 2013, Huawei filed its answer and counterclaims to InterDigital's complaint. Huawei asserted counterclaims for breach of contract, equitable estoppel, waiver of right to enjoin and declarations that InterDigital has not offered or granted Huawei licenses on fair, reasonable and non-discriminatory (“FRAND”) terms, declarations seeking the determination of FRAND terms and declarations of noninfringement, invalidity and unenforceability of the asserted patents. In addition to the declaratory relief specified in its counterclaims, Huawei seeks specific performance of InterDigital's purported contracts with Huawei and standards-setting organizations, appropriate damages in an amount to be determined at trial, reasonable attorneys' fees and such other relief as the court may deem appropriate. On January 31, 2013, ZTE filed its answer and counterclaims to InterDigital's complaint; ZTE asserted counterclaims for breach of contract, equitable estoppel, waiver of right to enjoin and declarations that InterDigital has not offered ZTE licenses on FRAND terms, declarations seeking the determination of FRAND terms and declarations of noninfringement, invalidity and unenforceability. Nokia and Samsung have not yet responded to the complaints against them. In addition to the declaratory relief specified in its counterclaims, ZTE seeks specific performance of InterDigital's purported contracts with ZTE and standards-setting organizations, appropriate damages in an amount to be determined at trial, reasonable attorneys' fees and such other relief as the court may deem appropriate.
On February 11, 2013, Huawei and ZTE filed motions to expedite discovery and trial on their FRAND-related counterclaims. Huawei seeks a schedule for discovery and trial on its FRAND-related counterclaims that would afford Huawei the opportunity to accept a FRAND license rate at the earliest opportunity, and in any case before December 28, 2013. ZTE seeks a trial on its FRAND-related counterclaims no later than November 2013.
Huawei Complaint to European Commission
On May 23, 2012, Huawei lodged a complaint with the European Commission alleging that InterDigital was acting in breach of Article 102 of the Treaty on the Functioning of the European Union (the "TFEU"). Huawei is claiming that InterDigital has a dominant position with respect to the alleged market for the licensing of its 3G standards-essential patents. Huawei further claims that InterDigital is acting in abuse of its alleged dominant position by allegedly seeking to force Huawei to agree to unfair purchase or selling prices and in applying dissimilar conditions to equivalent transactions contrary to the terms of Article 102 of the TFEU. The European Commission has not yet indicated whether or not it will initiate proceedings against InterDigital as a result of the complaint.
Huawei China Proceedings
On February 21, 2012, InterDigital was served with two complaints filed by Huawei Technologies Co., Ltd. in the Shenzhen Intermediate People's Court in China on December 5, 2011. The first complaint names as defendants InterDigital, Inc. and its wholly owned subsidiaries InterDigital Technology Corporation and InterDigital Communications, LLC (now InterDigital Communications, Inc.). This first complaint alleges that InterDigital had a dominant market position in China and the United States in the market for the licensing of essential patents owned by InterDigital, and abused its market power by engaging in allegedly unlawful practices, including differentiated pricing, tying and refusal to deal. Huawei sought relief in the amount of 20.0 million RMB (approximately 3.2 million USD based on the current exchange rate), an order requiring InterDigital to cease the allegedly unlawful conduct and compensation for its costs associated with this matter. The second complaint names as defendants the company's wholly owned subsidiaries InterDigital Technology Corporation, InterDigital Communications, LLC (now InterDigital Communications, Inc.), InterDigital Patent Holdings, Inc. and IPR Licensing, Inc. This second complaint alleges that InterDigital is a member of certain standards-setting organization(s); that it is the practice of certain standards-setting organization(s) that owners of essential patents included in relevant standards license those patents on FRAND terms; and that InterDigital has failed to negotiate on FRAND terms with Huawei. Huawei is asking the
74
court to determine the FRAND rate for licensing essential Chinese patents to Huawei and also seeks compensation for its costs associated with this matter.
On February 4, 2013, the Shenzhen Intermediate People's Court issued rulings in the two proceedings. With respect to the first complaint, the court decided that InterDigital had violated the Chinese Anti-Monopoly Law by (i) making proposals for royalties from Huawei that the court believed were excessive, (ii) tying the licensing of essential patents to the licensing of non-essential patents, (iii) requesting as part of its licensing proposals that Huawei provide a grant-back of certain patent rights to InterDigital and (iv) commencing a USITC action against Huawei while still in discussions with Huawei for a license. Based on these findings, the court ordered InterDigital to cease the alleged excessive pricing and alleged improper bundling of InterDigital's Chinese essential and non-essential patents, and to pay Huawei approximately 3.2 million USD in damages related to attorneys fees and other charges, without disclosing a factual basis for its determination of damages. The court dismissed Huawei's remaining allegations, including Huawei's claim that InterDigital improperly sought a worldwide license and improperly sought to bundle the licensing of essential patents on multiple generations of technologies. With respect to the second complaint, the court determined that, despite the fact that the FRAND requirement originates from ETSI's Intellectual Property Rights policy, which refers to French law, InterDigital's license offers to Huawei should be evaluated under Chinese law. Under Chinese law, the court concluded that the offers did not comply with FRAND. The court further ruled that the royalties to be paid by Huawei for InterDigital's 2G, 3G and 4G essential Chinese patents under Chinese law should not exceed 0.019% of the actual sales price of each Huawei product, without explanation as to how it arrived at this calculation. InterDigital intends to appeal both decisions.
Nokia, Huawei and ZTE 2011 USITC Proceeding (337-TA-800) and Related Delaware District Court Proceeding
On July 26, 2011, InterDigital's wholly owned subsidiaries InterDigital Communications, LLC (now InterDigital Communications, Inc.), InterDigital Technology Corporation and IPR Licensing, Inc. filed a complaint with the USITC against Nokia Corporation and Nokia Inc., Huawei Technologies Co., Ltd. and FutureWei Technologies, Inc. d/b/a Huawei Technologies (USA) and ZTE Corporation and ZTE (USA) Inc. (collectively, the “337-TA-800 Respondents”), alleging violations of Section 337 of the Tariff Act of 1930 in that they engaged in unfair trade practices by selling for importation into the United States, importing into the United States and/or selling after importation into the United States certain 3G wireless devices (including WCDMA- and cdma2000-capable mobile phones, USB sticks, mobile hotspots and tablets and components of such devices) that infringe seven of InterDigital's U.S. patents. The action also extends to certain WCDMA and cdma2000 devices incorporating WiFi functionality. InterDigital's complaint with the USITC seeks an exclusion order that would bar from entry into the United States any infringing 3G wireless devices (and components) that are imported by or on behalf of the 337-TA-800 Respondents, and also seeks a cease-and-desist order to bar further sales of infringing products that have already been imported into the United States. On October 5, 2011, InterDigital filed a motion requesting that the USITC add LG Electronics, Inc., LG Electronics U.S.A., Inc. and LG Electronics Mobilecomm U.S.A., Inc. as 337-TA-800 Respondents to the complaint and investigation, and that the Commission add an additional patent to the complaint and investigation as well. On December 5, 2011, the ALJ overseeing the proceeding granted this motion and, on December 21, 2011, the Commission determined not to review the ALJ's determination, thus adding the LG entities as 337-TA-800 Respondents and including allegations of infringement of the additional patent.
On January 6, 2012, the ALJ granted the parties' motion to extend the target date for completion of the investigation from February 28, 2013 to June 28, 2013. On March 23, 2012, the ALJ issued a new procedural schedule for the investigation, setting a trial date of October 22, 2012 to November 2, 2012.
On January 20, 2012, LG filed a motion to terminate the investigation as it relates to the LG entities, alleging that there is an arbitrable dispute. The ALJ granted LG's motion on June 4, 2012. On July 6, 2012, the Commission determined not to review the ALJ's order, and the investigation was terminated as to LG. On August 27, 2012, InterDigital filed a petition for review of the ALJ's order in the United States Court of Appeals for the Federal Circuit (the “Federal Circuit”). On September 14, 2012, the Federal Circuit granted LG's motion to intervene. On October 23, 2012, InterDigital filed its opening brief. Responsive briefs were filed on January 22, 2013, and InterDigital's reply brief was filed on February 8, 2013. The Federal Circuit has scheduled oral argument for April 4, 2013.
On the same date that we filed USITC Proceeding (337-TA-800), we filed a parallel action in the United States District Court for the District of Delaware against the 337-TA-800 Respondents alleging infringement of the same asserted patents identified in USITC Proceeding (337-TA-800). The Delaware District Court complaint seeks a permanent injunction and compensatory damages in an amount to be determined, as well as enhanced damages based on willful infringement, and recovery of reasonable attorneys' fees and costs. On September 23, 2011, the defendants in the Delaware District Court complaint filed a motion to stay the Delaware District Court action pending the parallel proceedings in the USITC. Because the USITC has instituted USITC Proceeding (337-TA-800), the defendants have a statutory right to a mandatory stay of the Delaware District Court proceeding pending a final determination in the USITC. On October 3, 2011, InterDigital amended the Delaware District Court complaint, adding LG as a defendant and adding the same additional patent that InterDigital requested
75
be added to USITC Proceeding (337-TA-800). On October 11, 2011, the Delaware District Court granted the defendants' motion to stay.
On March 21, 2012, InterDigital filed an unopposed motion requesting that the Commission add newly formed entity Huawei Device USA, Inc. as a 337-TA-800 Respondent. On April 11, 2012, the ALJ granted this motion and, on May 1, 2012, the Commission determined not to review the ALJ's determination, thus adding Huawei Device USA, Inc. as a 337-TA-800 Respondent.
On July 20, 2012, in an effort to streamline the evidentiary hearing and narrow the remaining issues, InterDigital voluntarily moved to withdraw certain claims from the investigation, including all of the asserted claims from U.S. Patent No. 7,349,540. By doing so, InterDigital expressly reserved all arguments regarding the infringement, validity and enforceability of those claims. On July 24, 2012, the ALJ granted the motion. On August 8, 2012, the Commission determined not to review the ALJ's Initial Determination granting the motion to terminate the investigation as to the asserted claims of the '540 patent.
On August 23, 2012, the parties jointly moved to extend the target date in view of certain outstanding discovery to be provided by the 337-TA-800 Respondents and third parties. On September 10, 2012, the ALJ granted the motion and issued an Initial Determination setting the evidentiary hearing for February 12, 2013 to February 22, 2013. The ALJ also set June 28, 2013 as the deadline for his Initial Determination as to violation and October 28, 2013 as the target date for the Commission's Final Determination in the investigation. On October 1, 2012, the Commission determined not to review the Initial Determination setting those deadlines, thereby adopting them.
On January 2, 2013, in an effort to streamline the evidentiary hearing and narrow the remaining issues, InterDigital voluntarily moved to withdraw certain additional patent claims from the investigation. By doing so, InterDigital expressly reserved all arguments regarding the infringement, validity and enforceability of those claims. On January 3, 2013, the ALJ granted the motion. On January 23, 2013, the Commission determined not to review the ALJ's Initial Determination granting the motion to terminate the investigation as to those withdrawn patent claims. InterDigital continues to assert seven U.S. patents in this investigation.
LG Arbitration
On March 19, 2012, LG Electronics, Inc. filed a demand for arbitration against the company's wholly owned subsidiaries InterDigital Technology Corporation, IPR Licensing, Inc. and InterDigital Communications, LLC (now InterDigital Communications, Inc.) with the American Arbitration Association's International Centre for Dispute Resolution (“ICDR”), initiating an arbitration in Washington, D.C. LG seeks a declaration that it is licensed to certain patents owned by InterDigital, including the patents asserted against LG in USITC Proceeding (337-TA-800). On April 18, 2012, InterDigital filed an Answering Statement objecting to the jurisdiction of the ICDR on the ground that LG's claims are not arbitrable, and denying all claims made by LG in its demand for arbitration. The issue of whether LG's claim to arbitrability is wholly groundless is currently on appeal before the Federal Circuit. In January 2013, the appointment of the arbitral tribunal was completed. The tribunal has tentatively set the hearing in the arbitration for the fall of 2013.
Nokia 2007 USITC Proceeding (337-TA-613), Related Delaware District Court Proceeding and Federal Circuit Appeal
In August 2007, InterDigital filed a USITC complaint against Nokia Corporation and Nokia, Inc., alleging a violation of Section 337 of the Tariff Act of 1930 in that Nokia engaged in an unfair trade practice by selling for importation into the United States, importing into the United States and/or selling after importation into the United States certain 3G mobile handsets and components that infringe two of InterDigital's patents. In November and December 2007, a third patent and a fourth patent were added to our complaint against Nokia. The complaint seeks an exclusion order barring from entry into the United States infringing 3G mobile handsets and components that are imported by or on behalf of Nokia. Our complaint also seeks a cease-and-desist order to bar further sales of infringing Nokia products that have already been imported into the United States.
In addition, on the same date as our filing of USITC Proceeding (337-TA-613), we also filed a complaint in the Delaware District Court alleging that Nokia's 3G mobile handsets and components infringe the same two InterDigital patents identified in the original USITC complaint. The complaint seeks a permanent injunction and damages in an amount to be determined. This Delaware action was stayed on January 10, 2008, pursuant to the mandatory, statutory stay of parallel district court proceedings at the request of a respondent in a USITC investigation. Thus, this Delaware action is stayed with respect to the patents in this case until the USITC's determination on these patents becomes final, including any appeals. The Delaware District Court permitted InterDigital to add to the stayed Delaware action the third and fourth patents InterDigital asserted against Nokia in the USITC action.
On August 14, 2009, the ALJ overseeing USITC Proceeding (337-TA-613) issued an Initial Determination finding no violation of Section 337 of the Tariff Act of 1930. The Initial Determination found that InterDigital's patents were valid and
76
enforceable, but that Nokia did not infringe these patents. In the event that a Section 337 violation were to be found by the Commission, the ALJ recommended the issuance of a limited exclusion order barring entry into the United States of infringing Nokia 3G WCDMA handsets and components, as well as the issuance of appropriate cease-and-desist orders.
On October 16, 2009, the Commission issued a notice that it had determined to review in part the Initial Determination, and that it affirmed the ALJ's determination of no violation and terminated the investigation. The Commission determined to review the claim construction of the patent claim terms “synchronize” and “access signal” and also determined to review the ALJ's validity determinations. On review, the Commission modified the ALJ's claim construction of “access signal” and took no position with regard to the claim term “synchronize” or the validity determinations. The Commission determined not to review the remaining issues decided in the Initial Determination.
On November 30, 2009, InterDigital filed with the Federal Circuit a petition for review of certain rulings by the USITC. In the appeal, neither the construction of the term “synchronize” nor the issue of validity can be raised because the Commission took no position on these issues in its Final Determination. On December 17, 2009, Nokia filed a motion to intervene in the appeal, which was granted by the Federal Circuit on January 4, 2010. In its appeal, InterDigital seeks reversal of the Commission's claim constructions and non-infringement findings with respect to certain claim terms in U.S. Patent Nos. 7,190,966 and 7,286,847, vacatur of the Commission's determination of no Section 337 violation and a remand for further proceedings before the Commission. InterDigital is not appealing the Commission's determination of non-infringement with respect to U.S. Patent Nos. 6,973,579 and 7,117,004. On August 1, 2012, the Federal Circuit issued its decision in the appeal, holding that the Commission had erred in interpreting the claim terms at issue and reversing the Commission's finding of non-infringement. The Federal Circuit adopted InterDigital's interpretation of such claim terms and remanded the case back to the Commission for further proceedings. In addition, the Federal Circuit rejected Nokia's argument that InterDigital did not satisfy the domestic industry requirement. On September 17, 2012, Nokia filed a combined petition for rehearing by the panel or en banc with the Federal Circuit. On January 10, 2013, the Federal Circuit denied Nokia's petition. Nokia has until April 10, 2013 to petition the United States Supreme Court for a writ of certiorari.
On January 17, 2013, the Federal Circuit issued its mandate remanding USITC Proceeding (337-TA-613) to the Commission for further proceedings. On February 4, 2013, the Commission issued an order requiring the parties to submit comments regarding what further proceedings must be conducted to comply with the Federal Circuit's August 1, 2012 judgment, including whether any issues should be remanded to an ALJ to be assigned to this investigation.
Nokia Delaware Proceeding
In January 2005, Nokia filed a complaint in the Delaware District Court against InterDigital Communications Corporation (now InterDigital, Inc.) and its wholly owned subsidiary InterDigital Technology Corporation, alleging that we have used false or misleading descriptions or representations regarding our patents' scope, validity and applicability to products built to comply with 3G standards (the “Nokia Delaware Proceeding”). Nokia's amended complaint seeks declaratory relief, injunctive relief and damages, including punitive damages, in an amount to be determined. We subsequently filed counterclaims based on Nokia's licensing activities as well as Nokia's false or misleading descriptions or representations regarding Nokia's 3G patents and Nokia's undisclosed funding and direction of an allegedly independent study of the essentiality of 3G patents. Our counterclaims seek injunctive relief as well as damages, including punitive damages, in an amount to be determined.
On December 10, 2007, pursuant to a joint request by the parties, the Delaware District Court entered an order staying the proceedings pending the full and final resolution of USITC Proceeding (337-TA-613). Specifically, the full and final resolution of USITC Proceeding (337-TA-613) includes any initial or final determinations of the ALJ overseeing the proceeding, the USITC and any appeals therefrom and any remand proceedings thereafter. Pursuant to the order, the parties and their affiliates are generally prohibited from initiating against the other parties, in any forum, any claims or counterclaims that are the same as the claims and counterclaims pending in the Nokia Delaware Proceeding, and should any of the same or similar claims or counterclaims be initiated by a party, the other parties may seek dissolution of the stay.
Except for the Nokia Delaware Proceeding and the Nokia Arbitration Concerning Presentations (described below), the order does not affect any of the other legal proceedings between the parties.
Nokia Arbitration Concerning Presentations
In November 2006, InterDigital Communications Corporation (now InterDigital, Inc.) and its wholly owned subsidiary InterDigital Technology Corporation filed a request for arbitration with the International Chamber of Commerce against Nokia (the “Nokia Arbitration Concerning Presentations”), claiming that certain presentations Nokia has attempted to use in support of its claims in the Nokia Delaware Proceeding (described above) are confidential and, as a result, may not be used in the Nokia Delaware Proceeding pursuant to the parties' agreement.
77
The December 10, 2007 order entered by the Delaware District Court to stay the Nokia Delaware Proceeding also stayed the Nokia Arbitration Concerning Presentations pending the full and final resolution of USITC Proceeding (337-TA-613).
InterDigital has no obligation as a result of this or any of the other matters described in this Note 8 to Consolidated Financial Statements, and we have not recorded any related liabilities in our financial statements.
Other
We are party to certain other disputes and legal actions in the ordinary course of business. We do not believe that these matters, even if adversely adjudicated or settled, would have a material adverse effect on our financial condition, results of operations or cash flows.
Contingency related to Technology Solutions Agreement Arbitration
Our wholly owned subsidiaries InterDigital Communications LLC and InterDigital Technology Corporation are engaged in an arbitration relating to a contractual dispute concerning the scope of royalty obligations and the scope of the licenses granted under one of our technology solutions agreements. The arbitration hearing took place in late June 2012, and a decision is expected in early 2013. As of
December 31, 2012
, we have deferred related revenue of
$44.3 million
pending the resolution of this arbitration and recorded such amount within short-term deferred revenue since we expect a decision within the next twelve months.
|
9.
|
RELATED PARTY TRANSACTIONS
|
On December 17, 2009, we announced a multi-faceted collaboration agreement with Attila, a company in which we have a direct investment. Under the agreement, we collaborate on the development and marketing of bandwidth aggregation technologies and related multi-network innovations. In addition, we paid approximately
$0.7 million
in 2009 to acquire a
7%
minority stake in Attila. In each of 2011 and 2010, we paid
$0.4 million
to Attila in relation to the collaboration agreement previously discussed.
|
10.
|
COMPENSATION PLANS AND PROGRAMS
|
Stock Plans
On June 4, 2009, the company’s shareholders adopted and approved the 2009 Stock Incentive Plan (the “2009 Plan”), under which current or prospective officers and employees and non-employee directors, consultants and advisors can receive share-based awards such as RSUs, restricted stock, stock options and other stock awards. As of this date, no further grants were permitted under any previously existing stock plans (the “Pre-existing Plans”). We issue the share-based awards authorized under the 2009 Plan through a variety of compensation programs.
The following table summarizes changes in the number of equity instruments available for grant (in thousands) under the 2009 Plan for the current year:
|
|
Available for Grant
|
|
|
Balance at December 31, 2011
|
3,494
|
|
|
RSUs granted (a)
|
(207
|
)
|
|
Options expired and RSUs cancelled
|
140
|
|
|
Balance at December 31, 2012
|
3,427
|
|
_______________________________________
|
(a)
|
RSUs granted include time-based RSUs, performance-based RSUs and dividend equivalents.
|
Stock Options
We have outstanding non-qualified stock options that were granted under the Pre-existing Plans to non-employee directors, officers and employees of the company and other specified groups, depending on the plan. No further grants are allowed under the Pre-existing Plans. In 2009, our shareholders approved the 2009 Plan, which allows for the granting of incentive and non-qualified stock options, as well as other securities. The 2009 Plan authorizes the issuance of up to approximately
3.0 million
shares of common stock. The administrator of the 2009 Plan, initially the Compensation Committee
78
of the Board of Directors, determines the number of options to be granted. Under the terms of the 2009 Plan, the exercise price per share of each option, other than in the event of options granted in connection with a merger or other acquisition, cannot be less than
100%
of the fair market value of a share of common stock on the date of grant. Under all of the plans, options are generally exercisable for a period of 10 years from the date of grant and may vest on the grant date, another specified date or over a period of time.
Information with respect to current year stock options activity under the above plans is summarized as follows (in thousands, except per share amounts):
|
|
Outstanding Options
|
Weighted
Average Exercise Price |
||||
|
Balance at December 31, 2011
|
342
|
|
$
|
14.37
|
|
|
|
Canceled
|
—
|
|
—
|
|
||
|
Exercised
|
(132
|
)
|
17.62
|
|
||
|
Balance at December 31, 2012
|
210
|
|
$
|
16.39
|
|
|
The weighted average remaining contractual life of our outstanding options was
21.39
years as of
December 31, 2012
. We currently have approximately
0.1 million
options outstanding that have an indefinite contractual life. These options were granted between 1983 and 1986 under a Pre-existing Plan. For purposes of calculating the weighted average remaining contractual life, these options were assigned an original life in excess of 50 years. The majority of these options have an exercise price between
$8.25
and
$26.86
. The total intrinsic value of stock options exercised during the years ended
December 31, 2012
,
2011
and
2010
was
$2.8 million
,
$12.1 million
and
$25.3 million
, respectively. The total intrinsic value of our options outstanding at
December 31, 2012
was
$5.8 million
. In
2012
, we recorded cash received from the exercise of options of
$2.1 million
and tax benefits from option exercises and RSU vestings of
$0.9 million
. Upon option exercise, we issued new shares of stock.
At
December 31, 2012
and
2011
, we had, respectively, approximately
0.2 million
and
0.3 million
options outstanding that had exercise prices less than the fair market value of our stock at each balance sheet date. These options would have generated cash proceeds to the company of
$2.8 million
and
$4.9 million
, respectively, if they had been fully exercised on those dates.
RSUs and Restricted Stock
Under the 2009 Plan, we may issue up to approximately
3.0 million
RSUs and/or shares of restricted stock to current or prospective officers and employees and non-employee directors, consultants and advisors. No further grants are allowed under the Pre-existing Plans. Any cancellations of outstanding RSUs that were granted under the 2009 Plan or Pre-existing Plans will increase the number of RSUs and/or shares of restricted stock available for grant under the 2009 Plan. The RSUs vest over periods generally ranging from
0
to
3
years from the date of the grant. During
2012
and
2011
, we granted approximately
0.2 million
and
0.2 million
RSUs, respectively, under the 2009 Plan. We have issued less than
0.1 million
shares of restricted stock under the 2009 Plan.
At
December 31, 2012
and
2011
, we had unrecognized compensation cost related to share-based awards of
$6.1 million
and
$6.0 million
, respectively. For grants made prior to 2010 with graded vesting, we expect to amortize the unrecognized compensation cost at
December 31, 2012
over a weighted average period of less than one year using an accelerated method. For grants made in 2012, 2011 and 2010 that cliff vest, we expect to amortize the associated unrecognized compensation cost at
December 31, 2012
on a straight-line basis over a three-year period.
We grant RSUs as an element of compensation to all of our employees under our Long-Term Compensation Program (“LTCP”).
Under all LTCP cycles that began after 2009, all time-based awards vest at the end of the respective three-year LTCP cycle. For employees below manager level,
100%
of their LTCP award is in the form of time-based RSUs. For all employees at or above the manager level,
25%
of their total LTCP award is in the form of time-based RSUs and the remaining
75%
is a performance-based award that is paid out at the end of the respective three-year cycle in cash, equity or any combination thereof pursuant to the Long-Term Incentive Plan (“LTIP”) component of the LTCP. Where the allocation has not been determined at the beginning of the cycle, as in the case of Cycles 5, 6, and 7 (as defined below), the allocation is assumed to be
100%
cash for accounting purposes. The terms of the current LTCP are discussed further below.
For LTCP cycles that began prior to 2010, RSU awards vested over three years according to the following schedules:
79
|
Year 1
|
Year 2
|
Year 3
|
||||||
|
Time-Based Awards
|
|
|
|
|
|
|
||
|
- Employees below manager level (represents 100% of the total award)
|
33
|
%
|
33
|
%
|
34
|
%
|
||
|
- Managers and technical equivalents (represents 75% of the total award)
|
25
|
%
|
25
|
%
|
25
|
%
|
||
|
- Senior Officers (represents 50% of the total award)
|
—
|
%
|
—
|
%
|
50
|
%
|
||
|
Performance-Based Awards
|
|
|
|
|
|
|
||
|
- Managers and technical equivalents (remaining 25% of the total award)
|
—
|
%
|
—
|
%
|
25
|
%
|
||
|
- Senior officers (remaining 50% of the total award)
|
—
|
%
|
—
|
%
|
50
|
%
|
||
Vesting of performance-based RSU awards is subject to attainment of specific goals established by the Compensation Committee of the Board of Directors. Depending upon performance against these goals, the payout range for performance-based RSU awards under the prior LTCP could have been anywhere from
0
to
3
times the value of the award.
Other RSU Grants
We also grant RSUs to all non-management Board members and, in special circumstances, management personnel outside of the LTCP. Grants of this type are supplemental to any awards granted to management personnel through the LTCP.
Information with respect to current RSU activity is summarized as follows (in thousands, except per share amounts):
|
Number of
Unvested
RSUs
|
Weighted
Average Per Share
Grant Date
Fair Value
|
|||||
|
Balance at December 31, 2011
|
498
|
|
$
|
35.93
|
|
|
|
Granted*
|
207
|
|
39.35
|
|
||
|
Forfeited*
|
(140
|
)
|
43.04
|
|
||
|
Vested*
|
(312
|
)
|
32.35
|
|
||
|
Balance at December 31, 2012
|
253
|
|
$
|
38.09
|
|
|
_______________________________________
|
*
|
These numbers include less than
0.1 million
RSUs credited on unvested RSUs as dividend equivalents. Dividend equivalents accrue with respect to unvested RSUs when and as cash dividends are paid on the company's common stock, and vest if and when the underlying RSUs vest.
|
The total vest date fair value of our RSUs that vested in
2012
,
2011
and
2010
was
$12.9 million
,
$8.0 million
and
$7.8 million
, respectively. The weighted average per share grant date fair value in
2012
,
2011
and
2010
was
$39.35
,
$42.17
and
$31.77
, respectively.
Compensation Programs
We use a variety of compensation programs to both attract and retain employees and more closely align employee compensation with company performance. These programs include both cash and share-based components, as discussed further below. We issue new shares of our common stock to satisfy our obligations under the share-based components of these programs from the 2009 Plan discussed above. However, our Board of Directors has the right to authorize the issuance of treasury shares to satisfy such obligations in the future. We recognized
$8.3 million
,
$1.8 million
and
$11.2 million
of compensation expense in
2012
,
2011
and
2010
, respectively, related to the performance-based cash incentive component of our LTCP, discussed in greater detail below. The majority of the share-based compensation expense, for all years, relates to RSU awards granted under our LTCP. The 2012 amount includes a charge of
$4.4 million
to adjust the accrual rate on Cycle 5 (as defined below) to
100%
. The 2011 amount includes a credit of
$5.7 million
to reduce the accrual rates for the performance-based incentive under Cycles 5 and 6 (each as defined below) from
100%
to
50%
, based on revised expectations for a lower payout. The
$5.7 million
adjustment represents a reduction to the accrual established for LTCP Cycles 5 and 6 in 2010 and 2011, respectively. The
2011
amount includes a charge of
$1.3 million
to increase the accrual rate for LTCP Cash Cycle 3 (as defined below) from the previously estimated payout of
50%
to the actual payout of
86%
. The
2010
amount includes a credit of
$3.3 million
to reduce the accrual rate for Cash Cycle 3 from
100%
to
50%
based on revised expectations for a lower payout. This
$3.3 million
adjustment related to the reduction of our accrual established in the prior year. We also recognized share-based compensation expense of
$6.5 million
,
$8.1 million
and
$5.8 million
in
2012
,
2011
and
2010
, respectively.
80
Long-Term Compensation Program
Prior to
2011
, the LTCP, which consists of overlapping cycles that are generally three years in length, was designed to alternate annually between equity and cash cycles, with equity cycles including both time-based and performance-based components and cash cycles consisting of a performance-based cash incentive. Under the equity cycles, executives received
50%
of their awards in the form of performance-based RSUs, and
50%
in the form of time-based RSUs that vested in full at the end of the respective three-year cycle. Employees at or above the manager level received
25%
of their equity awards in the form of performance-based RSUs, and
75%
in the form of time-based RSUs that vested in full at the end of the three-year cycle. Performance-based RSUs vested, if at all, based on the company's level of achievement with respect to goals established for the three-year cycle period. For cycles that began prior to 2010, payouts under the performance-based RSU cycles were capped at
300%
and payouts under performance-based cash incentive cycles were capped at
225%
. Employees below the manager level did not participate in the LTCP, but did receive RSU grants under a separate program. The following cycles were initiated between 2005 and 2009:
|
•
|
Cash Cycle 3:
A long-term performance-based cash incentive covering the period January 1, 2008 through December 31, 2010; and
|
|
•
|
RSU Cycle 4:
Time and performance-based RSUs granted on January 1, 2009, with a target vest date of January 1, 2012.
|
In fourth quarter 2010, the LTCP was amended to, among other things, increase the relative proportion of performance-based compensation for both executives and managers, extend participation to all employees, and eliminate alternating annual RSU and cash cycles.
Under the terms of the current LTCP, effective beginning with the cycle that began on January 1, 2010, all employees below manager level receive
100%
of their LTCP participation in the form of time-based RSUs that vest in full at the end of the respective three-year cycle. Executives and managers receive
25%
of their LTCP award in the form of time-based RSUs that vest in full at the end of the respective three-year cycle and the remaining
75%
in the form of performance-based awards granted under the LTIP component of the LTCP. The LTIP performance-based awards that are applicable to both executives and managers may be paid out in the form of cash or equity, or any combination thereof at the end of the respective three-year cycle. The form of the LTIP award will be determined by the Compensation Committee of our Board of Directors, in its sole discretion, at the beginning or the end of each three-year cycle. The following cycles have been initiated under the current LTCP through December 31, 2011:
|
•
|
Cycle 5:
Time-based RSUs granted on November 1, 2010, which vested on January 1, 2013, and a long-term performance-based incentive covering the period from January 1, 2010 through December 31, 2012;
|
|
•
|
Cycle 6:
Time-based RSUs granted on January 1, 2011, which vest on January 1, 2014, and a long-term performance-based incentive covering the period from January 1, 2011 through December 31, 2013; and
|
|
•
|
Cycle 7
: Time-based RSUs granted on January 1, 2012, which vest on January 1, 2015, and a long-term performance-based incentive covering the period from January 1, 2012 through December 31, 2014.
|
Payouts of performance-based awards will continue to be determined by the Compensation Committee in its sole discretion, based on the company’s achievement of one of more performance goals, previously established and approved by the Compensation Committee, during the respective cycle period. Payouts may exceed or be less than target, depending on the level of the company’s achievement of the performance goal(s). No payout may be made under the LTIP if the company fails to achieve the minimum level of performance for the applicable cycle, and the payout for any particular cycle is capped at
200%
of target.
401(k) and Profit-Sharing
We have a 401(k) plan (“Savings Plan”) wherein employees can elect to defer compensation within federal limits. The company matches a portion of employee contributions. The company’s contribution expense was approximately
$1.0 million
for each of
2012
,
2011
and
2010
. At its discretion, the company may also make a profit-sharing contribution to our employees’ 401(k) accounts. In fourth quarter 2009, the Compensation Committee of the Board of Directors determined that it would not elect to make a profit-sharing contribution to each employee in 2010 or the foreseeable future. In
2010
, we issued
25,563
shares of common stock to satisfy our accrued obligations from the prior year of
$0.6 million
related to our profit-sharing contributions to eligible employees under our Savings Plan.
|
11.
|
TAXES
|
Our income tax provision consists of the following components for
2012
,
2011
and
2010
(in thousands):
81
|
2012
|
2011
|
2010
|
|||||||||
|
Current
|
|
|
|
|
|
|
|||||
|
Federal
|
$
|
93,441
|
|
$
|
30,990
|
|
$
|
85,848
|
|
||
|
State
|
44
|
|
131
|
|
38
|
|
|||||
|
Foreign source withholding tax
|
4,173
|
|
5,453
|
|
35,707
|
|
|||||
|
|
97,658
|
|
36,574
|
|
121,593
|
|
|||||
|
Deferred
|
|
|
|
|
|
|
|||||
|
Federal
|
22,209
|
|
(21,621
|
)
|
(31,747
|
)
|
|||||
|
State
|
(4,494
|
)
|
(416
|
)
|
277
|
|
|||||
|
Foreign source withholding tax
|
21,457
|
|
20,603
|
|
(5,292
|
)
|
|||||
|
|
39,172
|
|
(1,434
|
)
|
(36,762
|
)
|
|||||
|
Total
|
$
|
136,830
|
|
$
|
35,140
|
|
$
|
84,831
|
|
||
The deferred tax assets and liabilities are comprised of the following components at
December 31, 2012
and
2011
(in thousands):
|
|
2012
|
||||||||||||||
|
|
Federal
|
State
|
Foreign
|
Total
|
|||||||||||
|
Net operating losses
|
$
|
—
|
|
$
|
68,640
|
|
$
|
—
|
|
$
|
68,640
|
|
|||
|
Deferred revenue, net
|
24,691
|
|
2,030
|
|
5,467
|
|
32,188
|
|
|||||||
|
Foreign tax credits
|
—
|
|
—
|
|
—
|
|
—
|
|
|||||||
|
Stock compensation
|
6,709
|
|
951
|
|
—
|
|
7,660
|
|
|||||||
|
Patent amortization
|
13,215
|
|
7
|
|
—
|
|
13,222
|
|
|||||||
|
Depreciation
|
1,202
|
|
199
|
|
—
|
|
1,401
|
|
|||||||
|
Other accrued liabilities
|
3,874
|
|
716
|
|
—
|
|
4,590
|
|
|||||||
|
Other employee benefits
|
4,096
|
|
735
|
|
—
|
|
4,831
|
|
|||||||
|
|
53,787
|
|
73,278
|
|
5,467
|
|
132,532
|
|
|||||||
|
Less: valuation allowance
|
—
|
|
(68,378
|
)
|
—
|
|
(68,378
|
)
|
|||||||
|
Net deferred tax asset
|
$
|
53,787
|
|
$
|
4,900
|
|
$
|
5,467
|
|
$
|
64,154
|
|
|||
|
|
2011
|
||||||||||||||
|
|
Federal
|
State
|
Foreign
|
Total
|
|||||||||||
|
Net operating losses
|
$
|
—
|
|
$
|
73,754
|
|
$
|
—
|
|
$
|
73,754
|
|
|||
|
Deferred revenue, net
|
56,128
|
|
435
|
|
22,751
|
|
79,314
|
|
|||||||
|
Foreign tax credits
|
—
|
|
—
|
|
—
|
|
—
|
|
|||||||
|
Stock compensation
|
10,748
|
|
1,686
|
|
—
|
|
12,434
|
|
|||||||
|
Patent amortization
|
11,909
|
|
35
|
|
—
|
|
11,944
|
|
|||||||
|
Depreciation
|
1,182
|
|
162
|
|
—
|
|
1,344
|
|
|||||||
|
Other accrued liabilities
|
2,726
|
|
447
|
|
—
|
|
3,173
|
|
|||||||
|
Other employee benefits
|
938
|
|
159
|
|
—
|
|
1,097
|
|
|||||||
|
|
83,631
|
|
76,678
|
|
22,751
|
|
183,060
|
|
|||||||
|
Less: valuation allowance
|
(2,225
|
)
|
(76,272
|
)
|
—
|
|
(78,497
|
)
|
|||||||
|
Net deferred tax asset
|
$
|
81,406
|
|
$
|
406
|
|
$
|
22,751
|
|
$
|
104,563
|
|
|||
The following is a reconciliation of income taxes at the federal statutory rate with income taxes recorded by the company for the years ended
December 31, 2012
,
2011
and
2010
(in thousands):
82
|
2012
|
2011
|
2010
|
|||||||||
|
Tax at U.S. statutory rate
|
$
|
143,022
|
|
$
|
43,612
|
|
$
|
83,456
|
|
||
|
Foreign withholding tax, with no U.S. foreign tax credit
|
—
|
|
—
|
|
—
|
|
|||||
|
State tax provision
|
(8,831
|
)
|
(14,251
|
)
|
(1,252
|
)
|
|||||
|
Change in federal and state valuation allowance
|
2,140
|
|
13,608
|
|
1,554
|
|
|||||
|
Adjustment to tax credits
|
—
|
|
—
|
|
—
|
|
|||||
|
Adjustments to uncertain tax positions
|
—
|
|
(6,775
|
)
|
—
|
|
|||||
|
Other
|
499
|
|
(1,054
|
)
|
1,073
|
|
|||||
|
Total tax provision
|
$
|
136,830
|
|
$
|
35,140
|
|
$
|
84,831
|
|
||
Valuation Allowances and Net Operating Losses
We establish a valuation allowance for any portion of our deferred tax assets for which management believes it is more likely than not that we will be unable to utilize the assets to offset future taxes. We believe it is more likely than not that the majority of our state deferred tax assets will not be utilized; therefore and we have maintained a near full valuation allowance against our state deferred tax assets as of
December 31, 2012
.
Under Internal Revenue Code Section 382, the utilization of a corporation’s net operating loss (“NOL”) carryforwards is limited following a change in ownership (as defined by the Internal Revenue Code) of greater than 50% within a three-year NOL period. If it is determined that prior equity transactions limit our NOL carryforwards, the annual limitation will be determined by multiplying the market value of the company on the date of the ownership change by the federal long-term tax-exempt rate. Any amount exceeding the annual limitation may be carried forward to future years for the balance of the NOL carryforward period.
The company recognizes excess tax benefits associated with share-based compensation to shareholders' equity only when realized. When assessing whether excess tax benefits relating to share-based compensation have been realized, the company follows the with and without approach excluding any indirect effects of the excess tax deductions. Under this approach, excess tax benefits related to share-based compensation are not deemed to be realized until after the utilization of all other tax benefits available to the company. During
2012
, the company realized
$0.9 million
of such excess tax benefits for federal purposes, and accordingly recorded a corresponding credit to additional paid in capital. As of
December 31, 2012
, the company had
$12.1 million
of state unrealized tax benefits associated with share-based compensation. At December 31, 2011, this amount was included in NOL with a full valuation allowance. These state tax benefits will be accounted for as a credit to additional paid-in capital, if and when realized, rather than a reduction of the provision for income taxes.
Uncertain Income Tax Positions
The company’s unrecognized tax benefits as of
December 31, 2012
,
2011
and
2010
were
$0.0 million
,
$0.0 million
and
$6.5 million
, respectively, which if recognized, would reduce the company’s effective income tax rate in the period of recognition. The total amount of unrecognized tax benefits could increase within the next twelve months for a number of reasons including audit settlements, tax examination activities and the recognition and measurement considerations under this guidance.
As of January 1, 2009, we had unrecognized tax benefits of
$4.4 million
, primarily related to NOL carryforwards. During 2009, we received a settlement offer from the Internal Revenue Service related to our 2006 Internal Revenue Service audit and we reclassified
$0.6 million
from the reserve to offset our current receivable. In 2011, we settled the 2006 Internal Revenue Service audit and recognized the remaining tax benefit of
$3.8 million
.
During 2009, we established a reserve of
$2.7 million
related to the recognition of a
$19.1 million
gross benefit for amending tax returns for the periods 1999 — 2005 to switch foreign tax payments made during that period from a deduction to a foreign tax credits. In 2011, we recorded an additional tax benefit of
$8.3 million
to eliminate this tax contingency and recognize interest income on the associated refund. As of
December 31, 2012
, our reserve was
$0.0 million
. We do not expect a material change in this estimate in the next twelve months, although a change is possible.
The following is a roll forward of our total gross unrecognized tax benefits, which if reversed would impact the effective tax rate, for the fiscal years
2010
through
2012
(in thousands):
83
|
2012
|
2011
|
2010
|
|||||||||
|
Balance as of January 1
|
$
|
—
|
|
$
|
6,459
|
|
$
|
6,459
|
|
||
|
Tax positions related to current year:
|
|
|
|
|
|
|
|||||
|
Additions
|
—
|
|
—
|
|
—
|
|
|||||
|
Reductions
|
—
|
|
—
|
|
—
|
|
|||||
|
Tax positions related to prior years:
|
|||||||||||
|
Additions
|
—
|
|
—
|
|
—
|
|
|||||
|
Reductions
|
—
|
|
(6,459
|
)
|
—
|
|
|||||
|
Settlements
|
—
|
|
—
|
|
—
|
|
|||||
|
Lapses in statues of limitations
|
—
|
|
—
|
|
—
|
|
|||||
|
Balance as of December 31
|
$
|
—
|
|
$
|
—
|
|
$
|
6,459
|
|
||
Our policy is to recognize interest and or penalties related to income tax matters in income tax expense. In addition to the balance of unrecognized tax benefits in the above table, we have accrued related interest of
$0.0 million
,
$0.0 million
and
$0.3 million
as of
December 31, 2012
,
2011
and
2010
, respectively. The accrued interest was not included in the reserve balances listed above.
The company and its subsidiaries are subject to United States federal income tax, foreign income and withholding taxes and income taxes from multiple state jurisdictions. Our federal income tax returns for 2007 to the present are currently open and will not close until the respective statutes of limitations have expired. The statutes of limitations generally expire three years following the filing of the return or in some cases three years following the utilization or expiration of net operating loss carry forwards. The statute of limitations applicable to our open federal returns will expire at the end of 2015. Specific tax treaty procedures remain open for certain jurisdictions for 2006 and 2007. Many of our subsidiaries have filed state income tax returns on a separate company basis. To the extent these subsidiaries have unexpired net operating losses, their related state income tax returns remain open. These returns have been open for varying periods, some exceeding ten years.
Currently the company is under audit by the State of New York for tax years 2002 through 2008. The State is claiming that prior to 2007 the company should have reported its returns as a combined report instead of as a separate entity as the company had filed. The company has reviewed the findings of the State and believes that it is more likely than not that the company will successfully sustain its separate company reporting and thus has not accrued any tax, interest or penalty exposure under the accounting for uncertain income tax position guidance.
Foreign Taxes
We pay foreign source withholding taxes on patent license royalties and state taxes when applicable. We apply foreign source withholding tax payments against our United States federal income tax obligations to the extent we have foreign source income to support these credits. In
2012
,
2011
and
2010
, we paid
$3.6 million
,
$5.5 million
and
$35.6 million
in foreign source withholding taxes, respectively and applied these payments as credits against our United States federal tax obligation. We previously accrued approximately
$2.8 million
of the
2012
foreign source withholding payments and established a corresponding deferred tax asset representing the associated foreign tax credit that we expect to utilize to offset future U.S. federal income taxes. At
December 31, 2012
, we accrued
$4.0 million
of foreign source withholding taxes payable associated with expected royalty payments from licensees and recorded corresponding deferred tax assets related to the expected foreign tax credits that will result from these payments.
Between 1999 and 2005 we paid approximately
$29.3 million
of foreign taxes. During this period we were in a net operating loss position for U.S. federal income tax purposes and elected to deduct these foreign tax payments as expenses on our United States federal income tax returns rather than take them as foreign tax credits. We elected this strategy because: a) we had no United States cash tax obligations at the time and b) net operating losses can be carried forward significantly longer than foreign tax credits. We utilized most of our net operating losses in 2006 and began to generate United States cash tax obligations. At that time, we began to treat our foreign tax payments as foreign tax credits on our United States federal income tax return.
During fourth quarter 2009, we completed a study to assess the company’s ability to utilize foreign tax credit carryovers into the tax year 2006. As a result of the study, we amended our United States federal income tax returns for the periods 1999 — 2005 to reclassify
$29.3 million
of foreign tax payments we made during those periods from deductions to foreign tax credits. We also amended our federal tax returns for the periods 2006 - 2008 to utilize the resulting tax credits. When we completed the study, we established a basis to support amending the returns and estimated that the maximum
84
incremental benefit would be
$19.1 million
.
We recognized a net benefit of
$16.4 million
after establishing a
$2.7 million
reserve for related tax contingencies. In 2011, we recorded an additional tax benefit of
$8.3 million
to eliminate this $2.7 million reserve and other tax contingencies and recognize interest income on the associated refund.
Between 2006 and 2012, we paid approximately
$145.8 million
in foreign taxes for which we have claimed foreign tax credits against our U.S. tax obligations. It is possible that as a result of tax treaty procedures, the U.S. government may reach an agreement with the related foreign governments that will result in a partial refund of foreign taxes paid with a related reduction in our foreign tax credits. Due to both foreign currency fluctuations and differences in the interest rate charged by the U.S. government compared to the interest rates, if any, used by the foreign governments, any such agreement could result in interest expense and/or foreign currency gain or loss.
|
12.
|
EQUITY TRANSACTIONS
|
Repurchase of Common Stock
During
2012
, we repurchased a cumulative total of
4.9 million
shares of our common stock for an aggregate of
$152.7 million
under the 2009 Repurchase Program and the 2012 Repurchase Program, each as defined below. We made no share repurchases during
2011
or 2010.
In March 2009, our Board of Directors authorized a
100.0 million
share repurchase program (the “2009 Repurchase Program”). The company repurchased shares under the 2009 Repurchase Program through pre-arranged trading plans. During
2012
,
we repurchased
2.3 million
s
hares under the 2009 Repurchase Program for
$75.0 million
.
The 2009 Repurchase Program was completed in second quarter 2012, bringing the cumulative repurchase total under the program to approximately
3.3 million
shares at a cost of
$
100.0 million
.
In May 2012, our Board of Directors authorized a new share repurchase program, which was then expanded in June 2012 to increase the amount of the program from $100.0 million to
$200.0 million
(the "2012 Repurchase Program"). The company may repurchase shares under the 2012 Repurchase Program through open market purchases, pre-arranged trading plans or privately negotiated purchases. During
2012
, we repurchased approximately
2.6 million
shares under the 2012 Repurchase Program for
$77.7 million
.
From January 1, 2013 through February 25, 2013, we did not make any share repurchases under the 2012 Repurchase Program.
Dividends
Prior to 2011, we had not paid any cash dividends on our shares of common stock. In fourth quarter 2010, our Board of Directors approved the company’s initial dividend policy and declared the first quarterly cash dividend of $0.10 per share. On December 5, 2012, we announced that our Board of Directors had declared a special cash dividend of $1.50 per share on InterDigital common stock. The dividend was payable on December 28, 2012 to stockholders of record as of the close of business on December 17, 2012. Cash dividends on outstanding common stock declared in
2012
and
2011
were as follows (in thousands, except per share data):
|
2012
|
Per Share
|
Total
|
Cumulative by Fiscal Year
|
||||||||
|
First quarter
|
$
|
0.10
|
|
$
|
4,469
|
|
$
|
4,469
|
|
||
|
Second quarter
|
0.10
|
|
4,348
|
|
8,817
|
|
|||||
|
Third quarter
|
0.10
|
|
4,095
|
|
12,912
|
|
|||||
|
Fourth quarter
|
1.60
|
|
65,643
|
|
78,555
|
|
|||||
|
$
|
1.90
|
|
$
|
78,555
|
|
||||||
|
2011
|
|||||||||||
|
First quarter
|
$
|
0.10
|
|
$
|
4,535
|
|
$
|
4,535
|
|
||
|
Second quarter
|
0.10
|
|
4,540
|
|
9,075
|
|
|||||
|
Third quarter
|
0.10
|
|
4,549
|
|
13,624
|
|
|||||
|
Fourth quarter
|
0.10
|
|
4,570
|
|
18,194
|
|
|||||
|
$
|
0.40
|
|
$
|
18,194
|
|
||||||
85
On December 5, 2012, we announced that our Board of Directors had declared a special cash dividend of $1.50 per share on InterDigital common stock. The dividend was payable on December 28, 2012 to stockholders of record as of the close of business on December 17, 2012. We currently expect to continue to pay dividends comparable to our quarterly $0.10 cash dividends in the future; however, continued payment of cash dividends and changes in the company’s dividend policy will depend on the company’s earnings, financial condition, capital resources and capital requirements, alternative uses of capital, restrictions imposed by any existing debt, economic conditions and other factors considered relevant by our Board of Directors.
Common Stock Warrants
On March 29, 2011 and March 30, 2011, we entered into privately negotiated warrant transactions with Barclays Bank PLC through its agent, Barclays Capital Inc., whereby we sold to Barclays Bank PLC warrants to acquire, subject to customary anti-dilution adjustments, approximately
3.5 million
and approximately
0.5 million
shares of our common stock, respectively, at a strike price of
$64.0909
per share, also subject to adjustment, as updated. The warrants become exercisable in tranches starting in June 2016. In consideration for the warrants issued on March 29, 2011 and March 30, 2011, the company received
$27.6 million
and
$4.1 million
, respectively, on April 4, 2011.
|
13.
|
SELECTED QUARTERLY RESULTS (Unaudited)
|
The table below presents quarterly data for the years ended
December 31, 2012
and
2011
:
|
First
|
Second
|
Third
|
Fourth
|
||||||||||||
|
|
(In thousands, except per share amounts, unaudited)
|
||||||||||||||
|
2012
|
|
|
|
|
|
|
|
|
|||||||
|
Revenues (a)
|
$
|
69,305
|
|
$
|
71,871
|
|
$
|
434,010
|
|
$
|
87,877
|
|
|||
|
Net income applicable to common shareholders (b)
|
$
|
10,930
|
|
$
|
9,673
|
|
$
|
235,669
|
|
$
|
15,532
|
|
|||
|
Net income per common share — basic
|
$
|
0.24
|
|
$
|
0.22
|
|
$
|
5.61
|
|
$
|
0.38
|
|
|||
|
Net income per common share — diluted
|
$
|
0.24
|
|
$
|
0.22
|
|
$
|
5.56
|
|
$
|
0.38
|
|
|||
|
2011
|
|
|
|
|
|
|
|
|
|||||||
|
Revenues
|
$
|
78,458
|
|
$
|
69,873
|
|
$
|
76,455
|
|
$
|
76,956
|
|
|||
|
Net income applicable to common shareholders (c)
|
$
|
23,339
|
|
$
|
17,156
|
|
$
|
26,206
|
|
$
|
22,767
|
|
|||
|
Net income per common share — basic
|
$
|
0.52
|
|
$
|
0.38
|
|
$
|
0.58
|
|
$
|
0.50
|
|
|||
|
Net income per common share — diluted
|
$
|
0.51
|
|
$
|
0.37
|
|
$
|
0.57
|
|
$
|
0.49
|
|
|||
(a) In third quarter 2012, our revenues included
$375.0 million
related to a patent sale to Intel Corporation.
|
(b)
|
In third quarter 2012, we recognized
$16.5 million
of expense associated with the Intel patent sale. In fourth quarter 2012, we incurred a repositioning charge of
$12.5 million
.
|
(c) In third quarter 2011, our income tax provision included benefits of
$6.8 million
related to the favorable resolution of tax contingencies. Our fourth quarter 2011 income tax provision included a
$1.5 million
benefit associated with after-tax interest income on tax refunds. In fourth quarter 2012 our income tax provision included a benefit of
$4.5 million
related to the release of valuation allowances on deferred tax assets, which we now expect to utilize in future periods.
|
Item 9.
|
CHANGES IN AND DISAGREEMENTS WITH ACCOUNTANTS ON ACCOUNTING AND FINANCIAL DISCLOSURE.
|
None.
86
|
Item 9A.
|
CONTROLS AND PROCEDURES.
|
Evaluation of Disclosure Controls and Procedures
The company’s Chief Executive Officer and its Chief Financial Officer, with the assistance of other members of management, have evaluated the effectiveness of our disclosure controls and procedures (as defined in Rules 13a-15(e) and 15d-15(e) under the Securities Exchange Act of 1934) as of
December 31, 2012
. Based on that evaluation, the Chief Executive Officer and Chief Financial Officer have concluded that our disclosure controls and procedures were effective to ensure that the information required to be disclosed by us in the reports that we file or submit under the Securities Exchange Act of 1934 is recorded, processed, summarized and reported within the time periods specified in the SEC’s rules and forms and to ensure that the information required to be disclosed by us in the reports that we file or submit under the Securities Exchange Act of 1934 is accumulated and communicated to our management, including our Chief Executive Officer and Chief Financial Officer, as appropriate to allow timely decisions regarding required disclosure.
Management’s Annual Report on Internal Control Over Financial Reporting
Management is responsible for establishing and maintaining adequate internal control over financial reporting as defined in Rules 13a-15(f) and 15d-15(f) under the Securities Exchange Act of 1934. The company’s internal control over financial reporting is a process designed to provide reasonable assurance regarding the reliability of financial reporting and the preparation of financial statements for external purposes in accordance with accounting principles generally accepted in the United States of America. Internal control over financial reporting includes those policies and procedures that:
|
•
|
Pertain to the maintenance of records that in reasonable detail accurately and fairly reflect the transactions and dispositions of the assets of the company;
|
|
•
|
Provide reasonable assurance that transactions are recorded as necessary to permit preparation of financial statements in accordance with accounting principles generally accepted in the United States of America, and that receipts and expenditures of the company are being made only in accordance with authorization of management and directors of the company; and
|
|
•
|
Provide reasonable assurance regarding prevention or timely detection of unauthorized acquisition, use or disposition of the company’s assets that could have a material effect on the consolidated financial statements.
|
Management, including the Chief Executive Officer and Chief Financial Officer, assessed the effectiveness of internal control over financial reporting as of
December 31, 2012
. Management based this assessment on criteria for effective internal control over financial reporting described in “
Internal Control — Integrated Framework”
issued by the Committee of Sponsoring Organizations of the Treadway Commission. Based on this assessment, management determined that, as of
December 31, 2012
, the company maintained effective internal control over financial reporting at a reasonable assurance level.
The effectiveness of the company’s internal control over financial reporting as of
December 31, 2012
has been audited by PricewaterhouseCoopers LLP, an independent registered public accounting firm, as stated in their report that appears under Part II, Item 8, of this Form 10-K.
Changes in Internal Control over Financial Reporting
There were no changes in our internal control over financial reporting during fourth quarter
2012
that have materially affected, or are reasonably likely to materially affect, our internal control over financial reporting.
|
Item 9B.
|
OTHER INFORMATION.
|
None.
|
Item 10.
|
DIRECTORS, EXECUTIVE OFFICERS AND CORPORATE GOVERNANCE.
|
The information required by this item is incorporated by reference to the information following the captions "Election of Directors," "EXECUTIVE OFFICERS," "Section 16(a) Beneficial Ownership Reporting Compliance," "Code of Ethics," "Nominating and Corporate Governance Committee" and "Audit Committee" in the definitive proxy statement to be filed pursuant to Regulation 14A in connection with our 2013 annual meeting of shareholders (the "Proxy Statement").
87
|
Item 11.
|
EXECUTIVE COMPENSATION.
|
The information required by this item is incorporated by reference to the information following the captions "EXECUTIVE COMPENSATION" and "DIRECTOR COMPENSATION" in the Proxy Statement.
|
Item 12.
|
SECURITY OWNERSHIP OF CERTAIN BENEFICIAL OWNERS AND MANAGEMENT AND RELATED STOCKHOLDER MATTERS.
|
The information required by this item is incorporated by reference to the information following the captions "EQUITY COMPENSATION PLAN INFORMATION" and "SECURITY OWNERSHIP OF CERTAIN BENEFICIAL OWNERS AND MANAGEMENT" in the Proxy Statement.
|
Item 13.
|
CERTAIN RELATIONSHIPS AND RELATED TRANSACTIONS, AND DIRECTOR INDEPENDENCE.
|
The information required by this item is incorporated by reference to the information following the captions "CERTAIN RELATIONSHIPS AND RELATED TRANSACTIONS" and "Director Independence" in the Proxy Statement.
|
Item 14.
|
PRINCIPAL ACCOUNTANT FEES AND SERVICES.
|
The information required by this item is incorporated by reference to the information following the captions "Fees Paid to Independent Registered Public Accounting Firm" and "Audit Committee Pre-Approval Policy for Audit and Non-Audit Services of Independent Registered Public Accounting Firm" in the Proxy Statement.
|
Item 15.
|
EXHIBITS AND FINANCIAL STATEMENT SCHEDULES.
|
|
(a)
|
The following documents are filed as a part of this Form 10-K:
|
(1)
Financial Statements.
The information required by this item begins on Page 53.
(2)
Financial Statement Schedules.
Valuation and Qualifying Accounts
|
Balance Beginning
of Period
|
Increase/
(Decrease)
|
Reversal of
Valuation
Allowance
|
Balance End
of Period
|
||||||||||||
|
2012 valuation allowance for deferred tax assets
|
$
|
78,497
|
|
$
|
(5,624
|
)
|
(a)
|
$
|
(4,495
|
)
|
(d)
|
$
|
68,378
|
|
|
|
2011 valuation allowance for deferred tax assets
|
$
|
64,034
|
|
$
|
14,463
|
|
(a)
|
$
|
—
|
|
$
|
78,497
|
|
||
|
2010 valuation allowance for deferred tax assets
|
$
|
62,480
|
|
$
|
1,554
|
|
(a)
|
$
|
—
|
|
$
|
64,034
|
|
||
|
2012 reserve for uncollectible accounts
|
$
|
1,750
|
|
$
|
—
|
|
$
|
—
|
|
$
|
1,750
|
|
|||
|
2011 reserve for uncollectible accounts
|
$
|
1,750
|
|
$
|
—
|
|
$
|
—
|
|
$
|
1,750
|
|
|||
|
2010 reserve for uncollectible accounts
|
$
|
1,500
|
|
$
|
1,750
|
|
(b)
|
$
|
(1,500
|
)
|
(c)
|
$
|
1,750
|
|
|
_______________________________________
|
(a)
|
The increase was primarily necessary to maintain a full, or near full, valuation allowance against our state deferred tax assets and did not result in additional tax expense.
|
|
(b)
|
The increase relates to the establishment of reserves against an account receivable associated with our SlimChip modem IP.
|
|
(c)
|
The decrease relates to the receipt of a payment against an account receivable associated with our SlimChip modem IP.
|
|
(d)
|
The decrease relates to the reversal of valuation allowances against state and federal deferred tax assets and net operating losses.
|
88
(3)
Exhibits.
See Item 15(b) below.
|
(b)
|
Exhibit
Number
|
|
Exhibit Description
|
|
|
*2.1
|
|
Plan of Reorganization by and among InterDigital Communications Corporation, InterDigital, Inc. “InterDigital”) and ID Merger Company dated July 2, 2007 (Exhibit 2.1 to InterDigital's Quarterly Report on Form 10-Q dated August 9, 2007).
|
|
|
*2.2
|
|
Agreement and Plan of Merger by and among InterDigital Communications Corporation, InterDigital and ID Merger Company dated July 2, 2007 (Exhibit 2.2 to InterDigital's Quarterly Report on Form 10-Q dated August 9, 2007).
|
|
|
*3.1
|
|
Amended and Restated Articles of Incorporation of InterDigital, Inc. (Exhibit 3.1 to InterDigital's Current Report on Form 8-K dated June 7, 2011).
|
|
|
*3.2
|
|
Amended and Restated Bylaws of InterDigital, Inc. (Exhibit 3.2 to InterDigital's Current Report on Form 8-K dated June 7, 2011).
|
|
|
*4.1
|
|
Indenture, dated April 4, 2011, between InterDigital, Inc. and The Bank of New York Mellon Trust Company, N.A., as trustee (Exhibit 4.1 to InterDigital's Current Report on Form 8-K dated April 4, 2011).
|
|
|
*4.2
|
|
Form of 2.50% Senior Convertible Note due 2016 (Exhibit 4.2 to InterDigital's Current Report on Form 8-K dated April 4, 2011).
|
|
|
*4.3
|
|
Specimen Stock Certificate of InterDigital, Inc. (Exhibit 4.3 to InterDigital's Current Report on Form 8-K dated April 4, 2011).
|
|
|
|
|
Patent and Technology Contracts
|
|
|
*10.1
|
|
Patent License and Settlement Agreement by and among ITC, Tantivy, IPR Licensing, Inc., InterDigital Patent Holdings, Inc., InterDigital Communications, LLC and Samsung Electronics Co., Ltd. effective as of November 24, 2008 (Exhibit 10.18 to InterDigital's Annual Report on Form 10-K for the year ended December 31, 2008). (Confidential treatment has been requested for portions of this agreement.)
|
|
|
|
|
Real Estate Leases
|
|
|
*10.2
|
|
Agreement of Lease dated November 25, 1996 by and between InterDigital and We're Associates Company (Exhibit 10.42 to InterDigital's Annual Report on Form 10-K for the year ended December 31, 2000).
|
|
|
*10.3
|
|
Third Modification to Lease Agreement effective June 1, 2006 by and between InterDigital and Huntington Quadrangle 2, LLC (successor to We're Associates Company). (Exhibit 10.18 to InterDigital's Annual Report on Form 10-K for the year ended December 31, 2006).
|
|
10.4
|
|
Fourth Modification of Lease Agreement effective November 1, 2012 by and between InterDigital, Inc. and Huntington Quadrangle 2, LLC.
|
|
|
10.5
|
|
Lease Agreement effective March 1, 2012 by and between InterDigital, Inc. and Musref Bellevue Parkway, LP.
|
|
|
|
|
|
Benefit Plans
|
|
|
†*10.6
|
|
Non-Qualified Stock Option Plan, as amended (Exhibit 10.4 to InterDigital's Annual Report on Form 10-K for the year ended December 31, 1991).
|
|
|
†*10.7
|
|
Amendment to Non-Qualified Stock Option Plan (Exhibit 10.31 to InterDigital's Quarterly Report on Form 10-Q dated August 14, 2000).
|
|
|
†*10.8
|
|
Amendment to Non-Qualified Stock Option Plan, effective October 24, 2001 (Exhibit 10.6 to InterDigital's Annual Report on Form 10-K for the year ended December 31, 2001).
|
|
|
†*10.9
|
|
1999 Restricted Stock Plan, as amended April 13, 2000 (Exhibit 10.43 to InterDigital's Quarterly Report on Form 10-Q dated August 14, 2000).
|
|
|
†*10.10
|
|
1999 Restricted Stock Plan, Form of Restricted Stock Unit Agreement (Awarded to Independent Directors Upon Re-Election) (Exhibit 10.62 to InterDigital's Quarterly Report on Form 10-Q dated November 9, 2004).
|
|
|
†*10.11
|
|
1999 Restricted Stock Plan, Form of Restricted Stock Unit Agreement (Annual Award to Independent Directors) (Exhibit 10.63 to InterDigital's Quarterly Report on Form 10-Q dated November 9, 2004).
|
89
|
|
†*10.12
|
|
1999 Restricted Stock Plan, Form of Restricted Stock Unit Agreement (Periodically Awarded to Members of the Board of Directors) (Exhibit 10.64 to InterDigital's Quarterly Report on Form 10-Q dated November 9, 2004).
|
|
|
†*10.13
|
|
1999 Restricted Stock Plan, Form of Restricted Stock Agreement (Awarded to Executives and Management as Part of Annual Bonus) (Exhibit 10.65 to InterDigital's Quarterly Report on Form 10-Q dated November 9, 2004).
|
|
|
†*10.14
|
|
1999 Restricted Stock Plan, Form of Restricted Stock Unit Agreement (Awarded to Independent Directors Upon Re-Election) (Exhibit 10.62 to InterDigital's Quarterly Report on Form 10-Q dated August 9, 2005).
|
|
|
†*10.15
|
|
1999 Restricted Stock Plan, Form of Restricted Stock Unit Agreement (Annual Award to Independent Directors) (Exhibit 10.63 to InterDigital's Quarterly Report on Form 10-Q dated August 9, 2005).
|
|
|
†*10.16
|
|
1999 Restricted Stock Plan, Form of Restricted Stock Unit Award Agreement (Exhibit 10.86 to InterDigital's Quarterly Report on Form 10-Q dated November 9, 2006).
|
|
|
†*10.17
|
|
1999 Restricted Stock Plan, Form of Restricted Stock Unit Award Agreement, as amended December 14, 2006 (Exhibit 10.58 to Inter Digital's Annual Report on Form 10-K for the year ended December 31, 2006).
|
|
|
†*10.18
|
|
2000 Stock Award and Incentive Plan (Exhibit 10.28 to InterDigital's Quarterly Report on Form 10-Q dated August 14, 2000).
|
|
|
†*10.19
|
|
2000 Stock Award and Incentive Plan, as amended June 1, 2005 (Exhibit 10.74 to InterDigital's Quarterly Report on Form 10-Q dated August 9, 2005).
|
|
|
†*10.20
|
|
2000 Stock Award and Incentive Plan, Form of Option Agreement (Director Awards) (Exhibit 10.66 to InterDigital's Quarterly Report on Form 10-Q dated November 9, 2004).
|
|
|
†*10.21
|
|
2000 Stock Award and Incentive Plan, Form of Option Agreement (Executive Awards) (Exhibit 10.67 to InterDigital's Quarterly Report on Form 10-Q dated November 9, 2004).
|
|
|
†*10.22
|
|
2000 Stock Award and Incentive Plan, Form of Option Agreement (Inventor Awards) (Exhibit 10.68 to InterDigital's Quarterly Report on Form 10-Q dated November 9, 2004).
|
|
|
†*10.23
|
|
2002 Stock Award and Incentive Plan (Exhibit 10.50 to InterDigital's Quarterly Report on Form 10-Q dated May 15, 2002).
|
|
|
†*10.24
|
|
2002 Stock Award and Incentive Plan, as amended through June 4, 2003 (Exhibit 10.52 to InterDigital's Annual Report on Form 10-K for the year ended December 31, 2003).
|
|
|
†*10.25
|
|
2002 Stock Award and Incentive Plan, as amended June 1, 2005 (Exhibit 10.87 to InterDigital's Quarterly Report on Form 10-Q dated November 9, 2006).
|
|
|
†*10.26
|
|
2002 Stock Award and Incentive Plan, Form of Option Agreement (Inventor Awards) (Exhibit 10.69 to InterDigital's Quarterly Report on Form 10-Q dated November 9, 2004).
|
|
|
†*10.27
|
|
2009 Stock Incentive Plan (Exhibit 99.1 to InterDigital's Registration Statement on Form S-8 filed with the Securities and Exchange Commission (“SEC”) on June 4, 2009 (File No. 333-159743)).
|
|
|
†*10.28
|
|
2009 Stock Incentive Plan, Term Sheet for Restricted Stock Units (Discretionary Award) (Exhibit 10.2 to InterDigital's Current Report on Form 8-K dated June 9, 2009).
|
|
|
†*10.29
|
|
2009 Stock Incentive Plan, Standard Terms and Conditions for Restricted Stock Units (Discretionary Award) (Exhibit 10.3 to InterDigital's Current Report on Form 8-K dated June 9, 2009).
|
|
|
†*10.30
|
|
2009 Stock Incentive Plan, Term Sheet for Restricted Stock Units (Nonemployee Directors - Annual Award) (Exhibit 10.4 to InterDigital's Quarterly Report on Form 10-Q dated July 30, 2009).
|
|
|
†*10.31
|
|
2009 Stock Incentive Plan, Term Sheet for Restricted Stock Units (Nonemployee Directors - Election Award) (Exhibit 10.5 to InterDigital's Quarterly Report on Form 10-Q dated July 30, 2009).
|
|
|
†*10.32
|
|
2009 Stock Incentive Plan, Standard Terms and Conditions for Restricted Stock Units (Nonemployee Directors) (Exhibit 10.6 to InterDigital's Quarterly Report on Form 10-Q dated July 30, 2009).
|
90
|
|
†*10.33
|
|
2009 Stock Incentive Plan, Term Sheet for Restricted Stock (Supplemental Award) (Exhibit 10.1 to InterDigital's Current Report on Form 8-K dated January 22, 2010).
|
|
|
†*10.34
|
|
2009 Stock Incentive Plan, Standard Terms and Conditions for Restricted Stock (Supplemental Award) (Exhibit 10.2 to InterDigital's Current Report on Form 8-K dated January 22, 2010).
|
|
†*10.35
|
|
2009 Stock Incentive Plan, Term Sheet and Standard Terms and Conditions for Restricted Stock Units (Discretionary Award) (Exhibit 10.2 to InterDigital's Current Report on Form 8-K dated January 28, 2013).
|
|
|
†*10.36
|
|
2009 Stock Incentive Plan, Term Sheet and Standard Terms and Conditions for Restricted Stock Units (LTCP Time-Based Award) (Exhibit 10.3 to InterDigital's Current Report on Form 8-K dated January 28, 2013).
|
|
|
†*10.37
|
|
2009 Stock Incentive Plan, Term Sheet and Standard Terms and Conditions for Restricted Stock Units (LTCP Performance-Based Award) (Exhibit 10.4 to InterDigital's Current Report on Form 8-K dated January 28, 2013).
|
|
|
†*10.38
|
|
2009 Stock Incentive Plan, Term Sheet and Standard Terms and Conditions for Stock Options (LTCP Award) (Exhibit 10.5 to InterDigital's Current Report on Form 8-K dated January 28, 2013).
|
|
|
|
†*10.39
|
|
Short-Term Incentive Plan, as amended October 2010 (Exhibit 10.2 to InterDigital's Quarterly Report on Form 10-Q dated October 29, 2010).
|
|
†*10.40
|
|
Short-Term Incentive Plan, as amended May 2012 (Exhibit 10.2 to InterDigital's Quarterly Report on Form 10-Q dated July 27, 2012).
|
|
|
|
†*10.41
|
|
Long-Term Compensation Program, as amended June 2009 (Exhibit 10.1 to InterDigital's Quarterly Report on Form 10-Q dated July 30, 2009).
|
|
|
†*10.42
|
|
Long-Term Compensation Program, as amended December 2009 (Exhibit 10.63 to InterDigital's Annual Report on Form 10-K for the year ended December 31, 2009).
|
|
|
†*10.43
|
|
Long-Term Compensation Program, as amended October 2010 (Exhibit 10.1 to InterDigital's Quarterly Report on Form 10-Q dated October 29, 2010).
|
|
|
†*10.44
|
|
Long-Term Compensation Program, as amended August 2011 (Exhibit 10.1 to InterDigital's Quarterly Report on Form 10-Q dated October 28, 2011).
|
|
|
†*10.45
|
|
Long-Term Compensation Program, as amended December 2011 (Exhibit 10.38 to InterDigital's Annual Report on Form 10-K for the year ended December 31, 2011).
|
|
†*10.46
|
|
Long-Term Compensation Program, as amended May 2012 (Exhibit 10.3 to InterDigital's Quarterly Report on Form 10-Q dated July 27, 2012).
|
|
|
†*10.47
|
|
Long-Term Compensation Program, as amended September 2012 (Exhibit 10.1 to InterDigital's Quarterly Report on Form 10-Q dated October 25, 2012).
|
|
|
†*10.48
|
|
Amended and Restated Long-Term Compensation Program (Exhibit 10.1 to InterDigital's Current Report on Form 8-K dated January 28, 2013).
|
|
|
|
†*10.49
|
|
Compensation Program for Outside Directors, as amended January 2010 (Exhibit 10.67 to InterDigital's Annual Report on Form 10-K for the year ended December 31, 2009).
|
|
|
†*10.50
|
|
Compensation Program for Outside Directors (2011 - 2012 Board Term) (Exhibit 10.2 to InterDigital's Quarterly Report on Form 10-Q dated October 28, 2011).
|
|
†*10.51
|
|
Compensation Program for Outside Directors (2012 - 2013 Board Term) (Exhibit 10.2 to InterDigital's Quarterly Report on Form 10-Q dated October 25, 2012).
|
|
|
†*10.52
|
|
Designated Employee Incentive Separation Pay Plan and Summary Plan Description (Exhibit 10.3 to InterDigital's Quarterly Report on Form 10-Q dated October 25, 2012).
|
|
|
|
|
|
Employment-Related Agreements
|
|
|
†*10.53
|
|
Indemnity Agreement dated as of March 19, 2003 by and between InterDigital and Howard E. Goldberg (pursuant to Instruction 2 to Item 601 of Regulation S-K, the Indemnity Agreements, which are substantially identical in all material respects, except as to the parties thereto and the dates, between the company and the following individuals, were not filed: Gilbert F. Amelio, Jeffrey K. Belk, Steven T. Clontz, Edward B. Kamins, John A. Kritzmacher, Mark A. Lemmo, Scott A. McQuilkin, William J. Merritt, James J. Nolan, Jean F. Rankin, Robert S. Roath and Lawrence F. Shay) (Exhibit 10.47 to InterDigital's Quarterly Report on Form 10-Q dated May 15, 2003).
|
91
|
|
†*10.54
|
|
Assignment and Assumption of Indemnity Agreement dated as of July 2, 2007, by and between InterDigital Communications Corporation, InterDigital, Inc. and Bruce G. Bernstein (pursuant to Instruction 2 to Item 601 of Regulation S-K, the Indemnity Agreements, which are substantially identical in all material respects, except as to the parties thereto, between InterDigital Communications Corporation, InterDigital, Inc. and the following individuals, were not filed: Steven T. Clontz, Edward B. Kamins, Mark A. Lemmo, William J. Merritt, James J. Nolan, Robert S. Roath and Lawrence F. Shay) (Exhibit 10.90 to InterDigital's Quarterly Report on Form 10-Q dated August 9, 2007).
|
|
|
†*10.55
|
|
Employment Agreement dated May 7, 1997 by and between InterDigital and Mark A. Lemmo (Exhibit 10.32 to InterDigital's Quarterly Report on Form 10-Q for the quarter ended March 31, 1997).
|
|
|
†*10.56
|
|
Amendment dated as of April 6, 2000 by and between InterDigital and Mark A. Lemmo (Exhibit 10.37 to InterDigital's Quarterly Report on Form 10-Q dated August 14, 2000).
|
|
|
†*10.57
|
|
Employment Agreement dated as of November 12, 2001 by and between InterDigital and Lawrence F. Shay (Exhibit 10.38 to InterDigital's Annual Report on Form 10-K for the year ended December 31, 2001).
|
|
|
†*10.58
|
|
Amended and Restated Employment Agreement dated May 16, 2005, by and between William J. Merritt and InterDigital (Exhibit 10.1 to InterDigital's Current Report on Form 8-K dated May 16, 2005).
|
|
|
†*10.59
|
|
Employment Agreement dated as of May 16, 2006 by and between James Nolan and InterDigital (Exhibit 10.84 to InterDigital's Quarterly Report on Form 10-Q dated August 7, 2006).
|
|
|
†*10.60
|
|
Amendment and Assignment of Employment Agreement dated as of July 2, 2007 by and among InterDigital Communications Corporation, InterDigital, Inc. and Bruce G. Bernstein (pursuant to Instruction 2 to Item 601 of Regulation S-K, the Amendment and Assignment of Employment Agreements dated as of July 2, 2007 which are substantially identical in all material respects, except as to the parties thereto, between InterDigital Communications Corporation, InterDigital, Inc. and the following individuals, were not filed: William J. Merritt, James Nolan, Mark A. Lemmo and Lawrence F. Shay, respectively) (Exhibit 10.89 to InterDigital's Quarterly Report on Form 10-Q dated August 9, 2007).
|
|
|
†*10.61
|
|
Employment Agreement dated July 9, 2007 by and between InterDigital, Inc. and Scott A. McQuilkin (Exhibit 10.91 to InterDigital's Quarterly Report on Form 10-Q dated August 9, 2007).
|
|
|
†*10.62
|
|
Amendment to Amended and Restated Employment Agreement dated as of November 17, 2008 by and between InterDigital, Inc. and William J. Merritt (pursuant to Instruction 2 to Item 601 of Regulation S-K, the Amendments to Employment Agreement dated as of November 17, 2008, which are substantially identical in all material respects, except as to the parties thereto, by and between InterDigital, Inc. and the following individuals, were not filed: Mark A. Lemmo, Scott A. McQuilkin, James Nolan and Lawrence F. Shay) (Exhibit 10.70 to InterDigital's Annual Report on Form 10-K for the year ended December 31, 2008).
|
|
†*10.63
|
|
Employment Agreement dated May 9, 2012 by and between InterDigital, Inc. and Richard J. Brezski (Exhibit 10.1 to InterDigital's Current Report on Form 8-K dated May 11, 2012).
|
|
|
|
|
|
Other Material Contracts
|
|
|
*10.64
|
|
Bond Hedge Transaction Confirmation, dated March 29, 2011, by and between InterDigital, Inc. and Barclays Bank PLC, through its agent, Barclays Capital Inc. (Exhibit 10.1 to InterDigital's Current Report on Form 8-K dated April 4, 2011).
|
|
|
*10.65
|
|
Bond Hedge Transaction Confirmation, dated March 30, 2011, by and between InterDigital, Inc. and Barclays Bank PLC, through its agent, Barclays Capital Inc. (Exhibit 10.2 to InterDigital's Current Report on Form 8-K dated April 4, 2011).
|
|
|
*10.66
|
|
Warrant Transaction Confirmation, dated March 29, 2011, by and between InterDigital, Inc. and Barclays Bank PLC, through its agent, Barclays Capital Inc. (Exhibit 10.3 to InterDigital's Current Report on Form 8-K dated April 4, 2011).
|
|
|
*10.67
|
|
Warrant Transaction Confirmation, dated March 30, 2011, by and between InterDigital, Inc. and Barclays Bank PLC, through its agent, Barclays Capital Inc. (Exhibit 10.4 to InterDigital's Current Report on Form 8-K dated April 4, 2011).
|
|
|
21
|
|
Subsidiaries of InterDigital.
|
|
|
23.1
|
|
Consent of PricewaterhouseCoopers LLP.
|
92
|
|
31.1
|
|
Certification of Principal Executive Officer pursuant to Rule 13a-14(a) of the Securities Exchange Act of 1934, as amended.
|
|
|
31.2
|
|
Certification of Principal Financial Officer pursuant to Rule 13a-14(a) of the Securities Exchange Act of 1934, as amended.
|
|
|
32.1
|
|
Certification of Principal Executive Officer pursuant to 18 U.S.C. Section 1350.
+
|
|
|
32.2
|
|
Certification of Principal Financial Officer pursuant to 18 U.S.C. Section 1350.
+
|
|
|
101
|
|
fixed-feeThe following financial information from InterDigital's Annual Report on Form 10-K for the year ended December 31, 2012, filed with the SEC on February [27], 2013, formatted in eXtensible Business Reporting Language:
(i) Consolidated Balance Sheets at December 31, 2011 and December 31, 2010, (ii) Consolidated Statements of Income for the years ended December 31, 2011, 2010 and 2009, (iii) Consolidated Shareholders' Equity and Comprehensive Income for the years ended December 31, 2011, 2010 and 2009, (iv) Consolidated Statements of Cash Flows for the years ended December 31, 2011, 2010 and 2009, and (v) Notes to Consolidated Financial Statements. ++ |
|
*
|
Incorporated by reference to the previous filing indicated.
|
|
†
|
Management contract or compensatory plan or arrangement.
|
|
+
|
This exhibit will not be deemed “filed” for purposes of Section 18 of the Securities Exchange Act of 1934, as amended (15 U.S.C. 78r), or otherwise subject to the liability of that section. Such exhibit will not be deemed to be incorporated by reference into any filing under the Securities Act or Securities Exchange Act, except to the extent that InterDigital, Inc. specifically incorporates it by reference.
|
93
SIGNATURES
Pursuant to the requirements of Section 13 or 15(d) of the Securities Exchange Act of 1934, the registrant has duly caused this report to be signed on its behalf by the undersigned, thereunto duly authorized.
INTERDIGITAL, INC.
|
Date: February 26, 2013
|
By:
|
/s/ William J. Merritt
|
|
|
|
William J. Merritt
|
|
|
|
President and Chief Executive Officer
|
Pursuant to the requirements of the Securities Exchange Act of 1934, this report has been signed below by the following persons on behalf of the registrant and in the capacities and on the dates indicated.
|
Date: February 26, 2013
|
/s/ Steven T. Clontz
|
|
|
Steven T. Clontz, Chairman of the Board of Directors
|
|
|
|
|
Date: February 26, 2013
|
/s/ Gilbert F. Amelio
|
|
|
Gilbert F. Amelio, Director
|
|
|
|
|
Date: February 26, 2013
|
/s/ Jeffrey K. Belk
|
|
|
Jeffrey K. Belk, Director
|
|
|
|
|
Date: February 26, 2013
|
/s/ Edward B. Kamins
|
|
|
Edward B. Kamins, Director
|
|
|
|
|
Date: February 26, 2013
|
/s/ John A. Kritzmacher
|
|
|
John A. Kritzmacher, Director
|
|
|
|
|
Date: February 26, 2013
|
/s/ Jean F. Rankin
|
|
|
Jean F. Rankin, Director
|
|
|
|
|
Date: February 26, 2013
|
/s/ Robert S. Roath
|
|
|
Robert S. Roath, Director
|
|
|
|
|
Date: February 26, 2013
|
/s/ William J. Merritt
|
|
|
William J. Merritt, Director, President and Chief Executive Officer
|
|
|
(Principal Executive Officer)
|
|
|
|
|
Date: February 26, 2013
|
/s/ Richard J. Brezski
|
|
|
Richard J. Brezski, Chief Financial Officer
|
|
|
(Principal Financial Officer)
|
94
TABLE OF CONTENTS
Part IItem 1. BusinessItem 1A. Risk FactorsItem 1B. Unresolved Staff CommentsItem 2. PropertiesItem 3. Legal ProceedingsItem 4. Mine Safety DisclosuresPart IIItem 5. Market For Registrant S Common Equity, Related Stockholder Matters and Issuer Purchases Of Equity SecuritiesItem 6. Selected Financial DataItem 7. Management S Discussion and Analysis Of Financial Condition and Results Of OperationsItem 7A. Quantitative and Qualitative Disclosures About Market RiskItem 8. Financial Statements and Supplementary DataItem 9. Changes in and Disagreements with Accountants on Accounting and Financial DisclosureItem 9A. Controls and ProceduresItem 9B. Other InformationPart IIIItem 10. Directors, Executive Officers and Corporate GovernanceItem 11. Executive CompensationItem 12. Security Ownership Of Certain Beneficial Owners and Management and Related Stockholder MattersItem 13. Certain Relationships and Related Transactions, and Director IndependenceItem 14. Principal Accountant Fees and ServicesPart IVItem 15. Exhibits and Financial Statement Schedules