INTERDIGITAL, INC.
10-Ks and 10-Qs
|
|
|
|
|
|
|
|
|
|
|
|
|
|
|
|
|
|
|
|
|
|
|
|
|
|
|
|
|
|
|
|
|
|
|
|
|
|
|
|
|
|
|
|
|
|
|
|
|
|
|
|
|
|
|
|
UNITED STATES SECURITIES AND EXCHANGE COMMISSION
Washington, DC 20549
Form 10-K
|
þ
|
|
ANNUAL REPORT PURSUANT TO SECTION 13 OR 15(d) OF THE SECURITIES EXCHANGE ACT OF 1934
|
|
|
|
For the fiscal year ended December 31, 2018
|
|
OR
|
||
|
o
|
|
TRANSITION REPORT PURSUANT TO SECTION 13 OR 15(d) OF THE SECURITIES EXCHANGE ACT OF 1934
|
|
|
|
For the transition period from to
|
Commission file number 1-33579
INTERDIGITAL, INC.
(Exact name of registrant as specified in its charter)
|
Pennsylvania
|
|
82-4936666
|
|
(State or other jurisdiction of incorporation or organization)
|
|
(IRS Employer Identification No.)
|
|
200 Bellevue Parkway, Suite 300
Wilmington, Delaware
|
|
19809
(Zip Code)
|
|
(Address of principal executive offices)
|
|
|
Registrant’s telephone number, including area code (302) 281-3600
_____________________________________________
Securities registered pursuant to Section 12(b) of the Act:
|
Common Stock (par value $0.01 per share)
(title of class)
|
|
NASDAQ Stock Market LLC
(name of exchange on which registered)
|
Securities registered pursuant to Section 12(g) of the Act: None
____________________________________________
Indicate by check mark if the registrant is a well-known seasoned issuer, as defined in Rule 405 of the Securities Act. Yes
þ
No
o
Indicate by check mark if the registrant is not required to file reports pursuant to Section 13 or Section 15(d) of the Act. Yes
o
No
þ
Indicate by check mark whether the registrant (1) has filed all reports required to be filed by Section 13 or 15(d) of the Securities Exchange Act of 1934 during the preceding 12 months (or for such shorter period that the registrant was required to file such reports), and (2) has been subject to such filing requirements for the past 90 days. Yes
þ
No
o
Indicate by check mark whether the registrant has submitted electronically every Interactive Data File required to be submitted pursuant to Rule 405 of Regulation S-T (§ 232.405 of this chapter) during the preceding 12 months (or for such shorter period that the registrant was required to submit such files). Yes
þ
No
o
Indicate by check mark if disclosure of delinquent filers pursuant to Item 405 of Regulation S-K (§ 229.405) is not contained herein, and will not be contained, to the best of registrant’s knowledge, in definitive proxy or information statements incorporated by reference in Part III of this Form 10-K or any amendment to this Form 10-K.
þ
Indicate by check mark whether the registrant is a large accelerated filer, an accelerated filer, a non-accelerated filer, a smaller reporting company, or an emerging growth company. See the definitions of “large accelerated filer,” “accelerated filer,” “smaller reporting company,” and “emerging growth company” in Rule 12b-2 of the Exchange Act.
|
Large accelerated filer
R
|
Accelerated filer
o
|
|
Non-accelerated filer
o
|
|
|
Smaller reporting company
o
|
|
|
Emerging growth company
o
|
|
If an emerging growth company, indicate by check mark if the registrant has elected not to use the extended transition period for complying with any new or revised financial accounting standards provided pursuant to Section 13(a) of the Exchange Act.
o
Indicate by check mark whether the registrant is a shell company (as defined in Rule 12b-2 of the Act). Yes
o
No
þ
The aggregate market value of the voting and non-voting common equity held by non-affiliates computed by reference to the price at which the common equity was last sold, or the average bid and asked price of such common equity, as of the last business day of the registrant’s most recently completed second fiscal quarter:
$2,688,325,937
as of June 30,
2018
.
The number of shares outstanding of the registrant’s common stock was
32,617,380
as of February 19, 2019.
DOCUMENTS INCORPORATED BY REFERENCE
Portions of the registrant's definitive proxy statement to be filed pursuant to Regulation 14A in connection with the registrant's 2019 annual meeting of shareholders are incorporated by reference into Items 10, 11, 12, 13 and 14 of Part III of this Form 10-K.
TABLE OF CONTENTS
|
|
Page
|
__________
In this Form 10-K, the words “we,” “our,” “us,” “the Company” and “InterDigital” refer to InterDigital, Inc. and/or its subsidiaries, individually and/or collectively, unless otherwise indicated or the context otherwise requires. InterDigital
®
is a registered trademark of InterDigital, Inc. Creating the Living Network, oneMPOWER, oneTRANSPORT and XCellAir are trademarks of InterDigital. All other trademarks, service marks and/or trade names appearing in this Form 10-K are the property of their respective holders.
EXPLANATORY NOTE ABOUT INTERDIGITAL, INC.
On April 3, 2018, for the purpose of reorganizing its holding company structure, InterDigital, Inc., a Pennsylvania corporation and then-existing NASDAQ-listed registrant (the “Predecessor Company”), executed an Agreement and Plan of Merger (“Merger Agreement”) with InterDigital Parent, Inc., a Pennsylvania corporation (the “Successor Company”) 100% owned by the Predecessor Company, and another newly formed Pennsylvania corporation owned 100% by the Successor Company (“Merger Sub”). Pursuant to the Merger Agreement, on April 3, 2018, Merger Sub merged (the “Merger” or “Reorganization”) with and into the Predecessor Company, with the Predecessor Company surviving. As a result of the Merger, the Predecessor Company is now a wholly owned subsidiary of the Successor Company. Neither the business conducted by the Successor Company and the Predecessor Company in the aggregate, nor the consolidated assets and liabilities of the Successor Company and the Predecessor Company in the aggregate, changed as a result of the Reorganization. By virtue of the Merger, each share of the Predecessor Company’s outstanding common stock was converted, on a share-for-share basis,
2
into a share of common stock of the Successor Company. As a result, each shareholder of the Predecessor Company became the owner of an identical number of shares of common stock of the Successor Company. Immediately following the Reorganization, the Successor Company was renamed as “InterDigital, Inc.,” identical to the Predecessor Company’s name prior to the Merger. The Successor Company’s common stock continues to be traded under the name “InterDigital, Inc.” and continues to be listed on the NASDAQ Global Select Market under the ticker symbol “IDCC.” In addition, immediately following the Merger the directors and executive officers of the Successor Company were the same individuals who were directors and executive officers, respectively, of the Predecessor Company immediately prior to the Merger.
For the purpose of this Annual Report on Form 10-K, references to the Company, our Board of Directors or any committee thereof, or our management, employees, business or financial results at or for any period prior to the Merger refer to those of the Predecessor Company and thereafter to those of the Successor Company.
3
PART I
|
Item 1.
|
BUSINESS.
|
Overview
InterDigital, Inc. ("InterDigital") designs and develops advanced technologies that enable and enhance wireless communications and capabilities. Since our founding in 1972, our engineers have designed and developed a wide range of innovations that are used in digital cellular and wireless products and networks, including 2G, 3G, 4G and IEEE 802-related products and networks, as well as video processing, coding and display technology. We are a leading contributor of innovation to the wireless communications industry, as well as a leading holder of patents in the video industry.
Given our long history and focus on advanced research and development, InterDigital has one of the most significant patent portfolios in the wireless and video industries. As of December 31, 2018, InterDigital's wholly owned subsidiaries held a portfolio of approximately 34,000 patents and patent applications related to a range of technologies, including the fundamental technologies that enable wireless communications, video encoding, display technology, and other areas relevant to the wireless and consumer electronics industries. In that portfolio are a number of patents and patent applications that we believe are or may be essential or may become essential to standards in cellular and other wireless communications as well as video encoding. Those wireless standards include 3G, 4G and the IEEE 802 suite of standards, as well as patents and patent applications that we believe are or may become essential to 5G standards that currently exist and are under continued development. In terms of video technology, our portfolio includes patents and applications relating to standards established by the ISO/IEC Moving Picture Expert Group (MPEG), the ITU-T Video Coding Expert Group (VCEG), the Joint Collaborative Team on Video Coding (JCT-VC) and the Joint Video Expert Team (JVET), among others.
The wireless portfolio has largely been built through internal development, supplemented by joint development projects with other companies as well as select acquisitions of patents and companies. Products incorporating our patented inventions in wireless include: mobile devices, such as cellular phones, tablets, notebook computers and wireless personal digital assistants; wireless infrastructure equipment, such as base stations; components, dongles and modules for wireless devices; and IoT devices and software platforms. The video technology portfolio largely represents patents and applications that InterDigital acquired through our purchase of Technicolor SA’s patent licensing business (the "Technicolor Acquisition"), completed in July 2018, supplemented by internal development in the area of video technology. Products incorporating our patented inventions in video include cellular phones, tablets, notebook computers, computers, televisions, gaming consoles, set-top boxes, streaming devices and other consumer electronics.
InterDigital derives revenues primarily from patent licensing, with contributions from patent sales, product sales, technology solutions licensing and sales and engineering services. On January 1, 2018, we adopted the requirements of new revenue accounting guidance, ASU No. 2014-09 "
Revenue from Contracts with Customers (Topic 606)
" ("ASC 606"), using the modified retrospective method. Consistent with the modified retrospective adoption method, our results of operations for periods prior to our adoption of ASC 606 remain unchanged and are presented in accordance with ASC Topic 605, "
Revenue Recognition
" (“ASC 605”).
In 2018, our total revenues under ASC 606 were
$307.4 million
, whereas total revenues under ASC 605 would have been
$382.1 million
. In 2018, our recurring revenues, consisting of current patent royalties and current technology solutions revenue, were
$280.3 million
under ASC 606, and would have been
$365.0 million
under ASC 605. Total revenues in 2017 under ASC 605 were
$532.9 million
, which included
$370.0 million
of recurring revenues. Additional information about our revenues, the impacts of our adoption of ASC 606, profits and assets, as well as additional financial data, is provided in the selected financial data in Part II, Item 6, and in the financial statements and accompanying Notes in Part II, Item 8, of this Form 10-K.
Our Strategy
Our objective is to continue to be a leading designer and developer of technology solutions and innovation for the mobile and consumer electronics industries and to monetize those solutions and innovations through a combination of licensing, sales and other revenue opportunities.
To execute our strategy, we intend to:
|
•
|
Develop and source innovative technologies related to wireless and video.
We intend to grow or maintain a leading position in advanced mobile technology, the Internet of Things (IoT), video processing and coding, and other related technology areas by leveraging our expertise to guide internal research and development capabilities, direct our efforts in partnering with leading inventors and industry players to source new technologies and pursue select acquisitions of technologies, businesses and/or companies.
|
4
|
•
|
Establish and grow our patent-based revenue.
We intend to grow our licensing revenue base by adding licensees, expanding into adjacent and new technology areas that align with our intellectual property position and leveraging the continued growth of the overall mobile technology market. Those licensing efforts can be self-driven or executed in conjunction with licensing partnerships, trusts and other efforts, and may involve the vigorous defense of our intellectual property through litigation and other means. We also believe that our ongoing research efforts and associated patenting activities enable us to sell patent assets that are not vital to our core licensing programs, as well as to execute patent swaps that can strengthen our overall portfolio.
|
|
•
|
Maintain a collaborative relationship with key industry players and worldwide standards bodies.
We intend to continue contributing to the ongoing process of defining mobile and video standards and other industry-wide efforts and incorporating our inventions into those technology areas. Those efforts, and the knowledge gained through them, support internal development efforts and also help guide technology and intellectual property sourcing through partners and other external sources.
|
|
•
|
Pursue
commercial opportunities for our advanced platforms and solutions.
As part of our ongoing research and development efforts, InterDigital often builds out entire functioning platforms in various technology areas. We seek to bring those technologies, as well as other technologies we may develop or acquire, to market through various methods including technology licensing, stand-alone commercial initiatives, joint ventures and partnerships.
|
Technology Research and Development
InterDigital pursues a diversified approach to sourcing the innovations that underpin our business. That approach incorporates internally driven research and development efforts by InterDigital Labs, a research collaboration with Technicolor SA’s Research and Innovation unit as part of the Technicolor Acquisition, and select acquisitions of technology innovations, businesses and/or companies. Our efforts are guided by our vision of the future of technology, Creating the Living Network
TM
,
which is articulated around the variables of content, context and connectivity, and how the interplay of these elements drives future technology capabilities and needs.
As of December 31, 2018, our patent portfolio consisted of approximately 4,400 U.S. patents (approximately 400 of which were issued in 2018) and approximately 20,400 non-U.S. patents (approximately 2,100 of which were issued in 2018). As of the same date, we also had numerous patent applications pending worldwide, with approximately 1,700 applications pending in the United States and approximately 7,200 pending non-U.S. applications. The patents and applications comprising our portfolio relate
to
a broad range of technologies, including digital wireless radiotelephony (including, without limitation, 3G, 4G and 5G technologies) and video coding. Issued patents expire at differing times ranging from 2019 through 2037. We operate ten research and development facilities in five countries: Conshohocken, Pennsylvania, USA; Buffalo and Melville, New York, USA; Rockville, Maryland, USA; San Diego, California, USA; Princeton, New Jersey, USA; Montreal, Quebec, Canada; London, England, United Kingdom; Berlin, Germany; and Seoul, South Korea.
InterDigital Labs
As an early and ongoing participant in the digital wireless market, InterDigital developed pioneering solutions for the primary cellular air interface technologies in use today, TDMA and CDMA. That early involvement, our continued development of those advanced digital wireless technologies and innovations in OFDM/OFDMA and MIMO technologies have enabled us to create our significant worldwide portfolio of patents. In addition, InterDigital was among the first companies to participate in standardization and platform development efforts related to Machine-to-Machine (M2M) communications and IoT technology. In conjunction with our participation in certain standards bodies, we have filed declarations stating that we have patents that we believe are or may be essential or may become essential to cellular and other mobile industry standards and that, with respect to our essential patents, we are prepared to grant licenses on fair, reasonable and non-discriminatory terms or similar terms consistent with the requirements of the respective standards organizations.
Our capabilities in the development of advanced mobile technologies are based on the efforts of a highly specialized engineering team, leveraging leading-edge equipment and software platforms. As of December 31, 2018, InterDigital employed approximately 185 engineers, approximately 80% of whom hold advanced degrees (including 65 doctorate degrees).
Over the last three years, investment in development has ranged from $69.7 million to $75.7 million, and the largest portion of this expense has been personnel costs. Additional information about our development expenses is provided in the results of operations, under the heading "
Operating Expenses
," in Part II, Item 7, of this Form 10-K.
Our current research efforts are focused on a variety of areas related to mobile technology and devices, including cellular wireless technology, Internet of Things ("IoT") technology, advanced video coding and transmission, and advanced sensor and sensor fusion technology.
5
Cellular Wireless Technology
We have a long history of developing cellular technologies, including those related to CDMA and TDMA and, more recently, OFDM/OFDMA and MIMO. A number of our inventions are being used in all 2G, 3G and 4G wireless networks and mobile terminal devices. We led the industry in establishing TDMA-based TIA/EIA/IS-54 as a U.S. digital wireless standard in the 1980s as well as innovative CDMA and OFDM/OFDMA technology solutions and, today, we hold a significant worldwide portfolio of patents and patent applications for these technologies. Similar to our TDMA inventions, we believe that a number of our CDMA and OFDM/OFDMA inventions are, may be or may become essential to the implementation of CDMA and OFDM/OFDMA-based systems in use today.
We also continue to be engaged in development efforts to build and enhance our 3GPP technology portfolio in areas including 5G NR, LTE-Advanced, and cellular IoT. Some of our inventions include or relate to MIMO technologies for reducing interference and increasing data rates; power control; hybrid-ARQ for fast error correction; control channel structures for efficient signaling; multi-carrier operation; vehicular-centric communications (V2X); millimeter wave communications; network slicing; core network procedures, and other areas. We also continue to develop additional technologies in response to existing or perceived challenges of connected devices in the expanding terminal markets. These include technologies for automobiles, wearables, smart homes, drones, and other connected consumer electronic products. We are developing solutions that enable connectivity in both licensed and unlicensed spectrum, and across a large range of frequencies up to the millimeter wave bands.
Our strong wireless network background includes engineering and corporate development activities that focus on solutions that apply to 3GPP and other wireless market segments. Segments outside of 3GPP primarily fall within the scope of the IEEE 802, IETF and ETSI standards. We continue to grow a portfolio of technology related to Wi-Fi, Internet Standards, and Edge Computing, that includes, for example, improvements to the IEEE 802.11 PHY and MAC to increase peak data rates (802.11ax, 802.11ay), integrated access and backhaul, and terminal mobility for edge and fog computing services.
Video Encoding and Transmission Technology
An important and growing segment of wireless traffic is devoted to video streaming, and InterDigital has been active for a number of years in developing advanced technologies that address the challenges of video as it relates to mobile. Specifically, in the area of video research and standards, we have been actively engaged in video standards development work in the ISO/IEC Moving Picture Expert Group (MPEG), the ITU-T Video Coding Expert Group (VCEG), the Joint Collaborative Team on Video Coding (JCT-VC) and the Joint Video Expert Team (JVET). Those efforts have focused on H.265/HEVC versions 1 to 4 and MPEG DASH, as well as FVC/H.266 and the MPEG Immersive (MPEG-I) standards suite going forward. In addition, as part of the Technicolor Acquisition, InterDigital benefits from a research agreement with Technicolor’s Research and Innovation unit pursuant to which InterDigital owns the patents produced through Technicolor’s ongoing research in defined project areas, including FVC/H.266. If our previously announced acquisition of Technicolor's Research and Innovation unit closes, this research agreement would be terminated.
IoT Technology
In the field of IoT applications, we are developing technologies to enable seamless interconnection for multiple access types (cellular, WLAN, LPWA) and IoT service frameworks that can be managed by a customer and leveraged by a diverse set of vertical applications. These technologies build on our expertise in developing platforms and contributing technologies towards the advancement of global M2M and IoT standards. As part of, and in addition to, InterDigital’s standards-focused development, we have two solutions that are being made available commercially.
In October 2017, we launched our Smart City-focused Chordant™ business. The Chordant platform, which was originally introduced in 2015 as the oneMPOWER™ platform, enables interoperability and scalability focusing specifically on the Smart Cities industry segment. This secure and scalable horizontal platform helps businesses launch and manage IoT data and applications, and features a comprehensive suite of application enabling services that span connectivity, device, data, security, and transaction management. The Chordant platform is compliant with oneM2M, the global standard for horizontal IoT platforms, and is designed for interoperability across diverse vertical markets, networks, and devices. The solution is based on an open standard with a long-term features roadmap, which interworks with many existing industry protocols and alliances. In February 2018, we announced the launch in the U.K of the oneTRANSPORT™ data marketplace, which operates on the Chordant platform. This commercial service provides a common interface to multiple service providers, allowing public authorities to control and monetize, and companies to access, IoT data in a simpler fashion via a real-time, low-latency service-oriented architecture. In December 2018, InterDigital announced that an affiliate of Sony Corporation of America (“Sony”) had invested in Chordant as part of entering into a new patent license agreement.
6
Other Technology Areas and Sources
Because mobile technology today and into the future encompasses a very broad range of areas, we are also developing a range of technologies in the areas of security and analytics, sensor technologies, as well as other areas. Some of those efforts are related to technology standards.
In addition, to supplement our own development efforts, the Company pursues an external technology sourcing model based around partnerships with leading research organizations and consortia. Those efforts include a range of universities conducting sponsored research, agreements with various research institutions, and membership and collaborative research in various initiatives such as Platforms for Advanced Wireless Research (PAWR), NYU Wireless, 5Tonic and Bristol is Open.
Our Revenue Sources
Patent-Based Revenue
We believe that companies making, importing, using or selling products compliant with the standards covered by our patent portfolio, including all manufacturers of mobile handsets, tablets and other devices, require a license under our patents and will require licenses under patents that may issue from our pending patent applications. We have successfully entered into license agreements with many of the leading mobile communications companies globally, including Apple Inc. (“Apple”), HTC Corporation, Kyocera Corporation (“Kyocera”), LG Electronics, Inc. (“LG”), Samsung Electronics Co., Ltd. (“Samsung”) and Sony, among others. We also receive revenue under certain license agreements that we assumed as part of the Technicolor Acquisition.
Most of our patent license agreements are structured on a royalty-bearing basis, while others are structured on a paid-up basis or a combination thereof. Upon entering into a new patent license agreement, the licensee typically agrees to pay consideration for sales made prior to the effective date of the license agreement (i.e., non-current patent royalties) and also agrees to pay royalties or license fees on licensed products sold during the term of the agreement. We expect that, for the most part, new license agreements will follow this model. Almost all of our patent license agreements provide for the payment of royalties based on sales of licensed products designed to operate in accordance with particular standards (convenience-based licenses), as opposed to the payment of royalties if the manufacture, sale or use of the licensed product infringes one of our patents (infringement-based licenses).
Some of our patent licenses are paid up, requiring no additional payments relating to designated sales under agreed upon conditions. Those conditions can include paid-up licenses for a period of time (fixed-fee agreements), for a class of products, for a number of products sold, under certain patents or patent claims, for sales in certain countries or a combination thereof. Licenses become paid-up based on the payment of fixed amounts or after the payment of royalties for a term.
Some of our patent license agreements provide for the non-refundable prepayment of royalties that are usually made in exchange for prepayment discounts. As the licensee reports sales of covered products, the royalties are calculated and either applied against any prepayment or become payable in cash or other consideration. Additionally, royalties on sales of licensed products under the license agreement become payable or applied against prepayments based on the royalty formula applicable to the particular license agreement. These formulas include flat dollar rates per unit, a percentage of sales, a percentage of sales with a per-unit cap and other similar measures. The formulas can also vary by other factors, including territory, covered standards, quantity and dates sold. Our license agreements typically contain provisions that give us the right to audit our licensees' books and records to ensure compliance with the licensees' reporting and payment obligations under those agreements. From time to time, these audits reveal underreporting or underpayments under the applicable agreements. In such cases, we seek payment for the amount owed and enter into negotiations with the licensee to resolve the discrepancy.
For a discussion of our revenue recognition policies with respect to patent license agreements, see “Item 7.
Management’s Discussion and Analysis of Financial Condition and Results of Operations - Overview - Critical Accounting Policies and Estimates - Revenue Recognition - Patent License Agreements
.”
In addition, in 2013, InterDigital formed the Signal Trust for Wireless Innovation (the “Signal Trust”). The goal of the Signal Trust is to monetize a large patent portfolio related to cellular infrastructure. More than 500 patents and patent applications were transferred from InterDigital to the Signal Trust, focusing primarily on 3G and LTE technologies and developed by InterDigital's engineers and researchers over more than a decade. A number of these innovations have been contributed to the worldwide standards process, resulting in a portfolio that includes patents for pioneering inventions that we believe are used pervasively in the cellular wireless industry. InterDigital is the primary beneficiary of the Signal Trust. The distributions from the Signal Trust will support continued research related to cellular wireless technologies. A small portion of the proceeds from the Signal Trust will be used to fund, through the Signal Foundation for Wireless Innovation, scholarly analysis of intellectual property rights and the technological, commercial and creative innovations they facilitate.
7
In third quarter 2016, InterDigital joined Avanci, the industry’s first marketplace for the licensing of cellular standards-essential technology for the IoT. The licensing platform brings together some of InterDigital’s peers in standards-essential technology leadership, and makes 2G, 3G and 4G standards-essential patents available to IoT players in specific product segments with one flat-rate license. The Avanci licensing programs in specific product segments for the IoT industry will provide access to the entire applicable standards-essential wireless patent portfolios held by all of the platform participants, as well as any additions to their portfolios during the term of the license. In December 2017, Avanci announced that it had signed a patent license agreement with BMW Group.
We also pursue, on occasion, targeted sales of portions of our patent portfolio. This strategy is based on the expectation that our portfolio and continued research efforts extend well beyond the requirements for a successful licensing program. In addition, the strategy leverages the desire from new entrants in the mobile technology space to build strong intellectual property positions to support their businesses.
Other
Potential Revenue Opportunities
Our strong technology expertise and research and development team also form the basis for other potential revenue opportunities, focused around areas such as engineering services, research joint ventures and the continued development, commercialization and licensing of research and development projects that have progressed to a pre-commercial or commercial phase. We also currently recognize revenue from the licensing of technology that has been developed by our engineering teams and is integrated into other companies’ technology products.
In all of its technology areas, InterDigital works to incubate and commercialize market-ready technologies. These include technologies that were developed as part of our standards development efforts, as well as technologies developed outside the scope of those efforts. Those commercial efforts sometimes include the establishment of a separate commercial initiative focused on the specific opportunity. Although these initiatives are in their early stages, they are potential revenue opportunities for the Company.
In 2012, we formed of a joint venture with Sony called Convida Wireless. The joint venture combined InterDigital's advanced M2M research capabilities with Sony's consumer electronics expertise with the purpose of driving new research in IoT communications and other connectivity areas. This joint venture was renewed in 2015 with its focus expanded to include advanced research and development into 5G and future wireless technologies, and renewed again in 2018 with its focus sharpened on 5G, including IoT and infrastructure research.
Overview of Wireless Communications and Consumer Electronics Industries
The wireless communications industry continues to experience rapid growth worldwide, as well as an expansion of device types entering the market. In addition, new markets are emerging related to wireless connectivity. IoT is an important new market in the technology field, which is expected to result in a significant increase in the number of connections, and unlock new business capabilities. IoT is currently in its earliest stages, and estimates vary broadly as far as how many connections it will yield, but by some estimates there could be as many as 120 billion connected devices by 2030, a significant portion of which will be comprised of 3G, 4G and 5G cellular IoT devices.
To achieve economies of scale and support interoperability among different participants, products for the wireless industry have typically been designed to operate in accordance with certain standards. Wireless communications standards are formal guidelines for engineers, designers, manufacturers and service providers that regulate and define the use of the radio frequency spectrum in conjunction with providing detailed specifications for wireless communications products. A primary goal of the standards is to ensure interoperability of products marketed by multiple companies. A large number of international and regional wireless Standards Development Organizations (“SDOs”), including the ITU, ETSI, TIA (USA), IEEE, ATIS (USA), TTA (Korea), ARIB (Japan) and ANSI, have responsibility for the development and administration of wireless communications standards. New standards are typically adopted with each new generation of products, are often compatible with previous generations and are defined to ensure equipment interoperability and regulatory compliance.
With the completion of the Technicolor Acquisition and the integration of that portfolio into our overall licensing efforts, InterDigital now expects to expand its business into the broader consumer electronics industry. According to data from ABI Research, more than 2 billion devices in the video, audio and IoT/other technology areas were shipped in 2017. Those devices include TV displays, computer displays, set-top boxes, gaming consoles, wireless assistants and headphones, wearables, smart home devices and other types of consumer electronic devices that implement video or wireless technologies, or a combination of both. Some of those technologies are standards-based, such as Wi-Fi and other wireless technologies, various video coding standards and various broadcast standards.
Standards have evolved in response to consumer demand for services and expanded capabilities of mobile devices and other consumer electronics devices. For instance, cellular standards have evolved from voice-oriented services to multimedia
8
services that exploit the higher speeds offered by newer technologies, such as LTE. The wireless communications industry has also made significant advances in non-cellular wireless technologies.
SDOs typically ask participating companies to declare formally whether they believe they hold patents or patent applications essential to a particular standard and whether they are willing to license those patents on either a royalty-bearing basis on fair, reasonable and nondiscriminatory terms or on a royalty-free basis. To manufacture, have made, sell, offer to sell or use such products on a non-infringing basis, a manufacturer or other entity doing so must first obtain a license from the holder of essential patent rights. The SDOs do not have enforcement authority against entities that fail to obtain required licenses, nor do they have the ability to protect the intellectual property rights of holders of essential patents.
InterDigital often publicly characterizes aspects of its business, including license agreements and development projects, as pertaining to broad mobile industry standards such as, for example, 3G, 4G, 5G and Wi-Fi. In doing this, we generally rely on the positions of the applicable standards-setting organizations in defining the relevant standards. However, the definitions may evolve or change over time, including after we have characterized certain transactions.
Business Activities
2018
Patent Licensing Activity
During first quarter 2018 we entered into a multi-year, worldwide, non-exclusive, royalty-bearing patent license agreement with Kyocera Corporation. The agreement covers sales by Kyocera Corporation and its affiliates of terminal unit products designed to operate in accordance with WCDMA and LTE standards, providing Kyocera expanded coverage for products in addition to those covered under their existing license agreement with InterDigital.
Also during first quarter 2018, the Signal Trust, established by the Company in 2013, signed a patent license agreement with a provider of telecommunications infrastructure equipment. The Signal Trust holds a patent portfolio related to cellular infrastructure, and it is a variable interest entity. Based on the terms of the trust agreement, we previously determined that we are the primary beneficiary of the Signal Trust for accounting purposes and, therefore, must consolidate the Signal Trust.
During second quarter 2018, we entered into a multi-year, worldwide, non-exclusive, royalty-bearing patent license agreement with Fujitsu Connected Technologies Limited (“FCNT”). The agreement covers the sale of FCNT’s 2G, 3G and 4G terminal unit products, including LTE and LTE-Advanced products.
Also during second quarter 2018, we entered into a multi-year, world-wide, non-exclusive, royalty bearing patent license agreement with a US-headquartered company. The agreement covers sales by the US company of 802.11 functionality within certain of its products.
During fourth quarter 2018, we entered into a multi-year, worldwide, non-exclusive patent license agreement with Sony (the “Sony PLA”), a global leader and technology innovator in consumer electronics, mobile communications and home appliances. In addition, we renewed our joint venture with Sony, Convida Wireless, and sharpened its focus on 5G, including IoT and infrastructure research. The new Sony PLA covers the sale by Sony of covered products for the three-year period that commenced on December 1, 2018.
Customers Generating Revenues Exceeding 10% of Total 2018 Revenues
Apple, Samsung and LG Electronics comprised approximately 36%, 25% and 10% of our total 2018 revenues, respectively.
In 2016, we entered into a multi-year, royalty-bearing, worldwide and non-exclusive patent license agreement with Apple (the “Apple PLA”). The agreement sets forth terms covering the sale by Apple of its products and services, including, but not limited to, its 3G, 4G and future generation cellular and wireless-enabled products. The Apple PLA gives Apple the right to terminate certain rights and obligations under the license for the period after September 30, 2021, but has the potential to provide a license to Apple for a total of up to six years. During 2018, we recognized a total of $111.7 million of revenue associated with the Apple PLA under ASC 606.
9
In 2014, we entered into a patent license agreement with Samsung (the “Samsung PLA”). The royalty-bearing license agreement sets forth terms covering the sale by Samsung of 3G, 4G and certain future generation wireless products. The Samsung PLA provided Samsung the right to terminate certain rights and obligations under the license for the period after 2017 but had the potential to provide a license to Samsung for a total of ten years, including 2013. Samsung did not elect to terminate such rights and obligations, and the period for such election has expired. Accordingly, the term of our patent license agreement with Samsung ends on December 31, 2022. During 2018, we recognized a total of $78.3 million of revenue associated with the Samsung PLA under ASC 606.
In 2017, we entered into a multi-year, worldwide, non-exclusive patent license agreement with LG (the “LG PLA”), a global leader and technology innovator in consumer electronics, mobile communications and home appliances. The LG PLA covers the 3G, 4G and 5G terminal unit products of LG and its affiliates and sets forth a royalty of cash payments to InterDigital as well as a process for the transfer of patents from LG to InterDigital. The deal also committed the parties to explore cooperation for projects related to the research and development of video and sensor technology for connected and autonomous vehicles. During 2018, we recognized a total of $31.8 million of revenue associated with the LG PLA under ASC 606.
Patent Infringement and Declaratory Judgment Proceedings
From time to time, if we believe a party is required to license our patents in order to manufacture, use and/or sell certain products and such party refuses to do so, we may agree with such party to have royalty rates, or other terms, set by third party adjudicators (such as arbitrators) or, in certain circumstances, we may institute legal action against them. This legal action has typically taken the form of a patent infringement lawsuit or an administrative proceeding such as a Section 337 proceeding before the United States International Trade Commission (“USITC” or the "Commission"). In a patent infringement lawsuit, we would typically seek damages for past infringement and an injunction against future infringement. In a USITC proceeding, we would seek an exclusion order to bar infringing goods from entry into the United States, as well as a cease and desist order to bar further sales of infringing goods that have already been imported into the United States. Parties may bring administrative and/or judicial challenges to the validity, enforceability, essentiality and/or applicability of our patents to their products. Parties may also allege that our efforts to enter into a license with that party do not comply with any obligations we may have in connection with our participation in standards-setting organizations, and therefore that we are not entitled to the relief that we seek. For example, a party may allege that we have not complied with an obligation to offer a license to that party on fair, reasonable and non-discriminatory terms and conditions, and may also file antitrust claims or regulatory complaints on that or other bases, and may seek damages or other relief based on such claims. In addition, a party might file a declaratory judgment action to seek a court's declaration that our patents are invalid, unenforceable, not infringed by the other party's products or are not essential. Our response to such a declaratory judgment action may include claims of infringement. When we include claims of infringement in a patent infringement lawsuit, a favorable ruling for the Company can result in the payment of damages for past patent royalties, the setting of a royalty for future sales or issuance by the court of an injunction enjoining the infringer from manufacturing, using and/or selling the infringing product.
Contractual Arbitration Proceedings
We and our licensees, in the normal course of business, may have disagreements as to the rights and obligations of the parties under applicable agreements. For example, we could have a disagreement with a licensee as to the amount of reported sales and royalties. Our patent license agreements typically provide for audit rights as well as private arbitration as the mechanism for resolving disputes, and we may attempt to resolve such disputes in arbitration. In arbitration, licensees may seek to assert various claims, defenses, or counterclaims, such as claims based on waiver, promissory estoppel, breach of contract, fraudulent inducement to contract, antitrust, and unfair competition. Arbitration proceedings can be resolved through an award rendered by the arbitrators or by settlement between the parties. Parties to arbitration might have the right to have the award reviewed in a court of competent jurisdiction. However, based on public policy favoring the use of arbitration, it is generally difficult to have arbitration awards vacated or modified. The party securing an arbitration award may seek to have that award confirmed as a judgment through an enforcement proceeding. The purpose of such a proceeding is to secure a judgment that can be used for, if need be, seizing assets of the other party.
In addition, arbitration may be a particularly effective means for resolving disputes with prospective licensees concerning the appropriate fair, reasonable and non-discriminatory ("FRAND") terms and conditions for license agreements that include standards-essential patents ("SEPs"), particularly where negotiations have otherwise reached an impasse. Binding arbitration to resolve the terms and conditions of a worldwide FRAND license to our relevant portfolio of SEPs is an efficient and cost-effective mechanism, as it allows the parties to avoid piecemeal litigation in multiple jurisdictions and ensures that an enforceable patent license agreement that is consistent with FRAND commitments will be in place at the end of the arbitration process.
Competition
With respect to our technology development activities and resulting commercialization efforts, we face competition from companies, including in-house development teams at other wireless device companies and semiconductor companies and wireless operators, developing other and similar technologies that are competitive with our products and solutions that we may market or set forth into the standards-setting arena.
Due to the exclusionary nature of patent rights, we do not compete, in a traditional sense, with other patent holders for patent licensing relationships or sale transactions. Other patent holders do not have the same rights to the inventions and
10
technologies encompassed by our patent portfolio. In any device or piece of equipment that contains intellectual property, the manufacturer may need to obtain licenses from multiple holders of intellectual property. In licensing our patent portfolio, we compete with other patent holders for a share of the royalties that certain licensees may argue to be the total royalty that is supported by a certain product or products, which may face practical limitations. We believe that licenses under a number of our patents are required to manufacture and sell 3G, 4G and other wireless products, as well as other consumer electronics devices. However, numerous companies also claim that they hold patents that are or may be essential or may become essential to standards-based technology deployed on wireless products and other consumer electronics devices. To the extent that multiple parties all seek royalties on the same product, the manufacturers could claim to have difficulty in meeting the financial requirements of each patent holder. In the past, certain manufacturers have sought antitrust exemptions to act collectively on a voluntary basis. In addition, certain manufacturers have sought to limit aggregate licensing fees or rates for essential patents. Similarly, potential purchasers of our patents often amass patent portfolios for defensive and/or cross-licensing purposes and could choose to acquire patent assets within the same general technology space from other patent holders.
Employees
As of December 31, 2018, we had approximately 390 employees, including approximately 50 employees in France who were subject to collective bargaining arrangements. We consider our employee relations to be good.
Geographic Concentrations
See Note 4, "
Geographic/Customer Concentration
," in the Notes to Condensed Consolidated Financial Statements included in Part II, Item 8, of this Form 10-K for financial information about geographic areas for the last three years.
Corporate Information
The ultimate predecessor company of InterDigital, Inc. was incorporated in 1972 under the laws of the Commonwealth of Pennsylvania and conducted its initial public offering in November 1981. Our corporate headquarters and administrative offices are located in Wilmington, Delaware, USA. We have research and technology development centers in the following locations: Conshohocken, Pennsylvania, USA; Buffalo and Melville, New York, USA; Rockville, Maryland, USA; San Diego, California, USA; Montreal, Quebec, Canada; London, England, United Kingdom; Berlin, Germany; and Seoul, South Korea. We also have administrative offices in Washington, District of Columbia, USA; San Francisco, California, USA; Indianapolis, Indiana, USA; Princeton, New Jersey, USA; New York City, New York, USA; Brussels, Belgium; Paris and Rennes, France; and Shanghai, China.
Our Internet address is
www.interdigital.com
,
where, in the “Investors” section
,
we make available, free of charge, our Annual Reports on Form 10-K, Quarterly Reports on Form 10-Q, Current Reports on Form 8-K, certain other reports and filings required to be filed under the Securities Exchange Act of 1934, as amended (the "Exchange Act"), and all amendments to those reports or filings as soon as reasonably practicable after such material is electronically filed with or furnished to the United States Securities and Exchange Commission. The information contained on or connected to our website is not incorporated by reference into this Form 10-K.
Item 1A.
RISK FACTORS.
We face a variety of risks that may affect our business, financial condition, operating results, the trading price of our common stock, or any combination thereof. You should carefully consider the following information and the other information in this Form 10-K in evaluating our business and prospects and before making an investment decision with respect to our common stock. If any of these risks were to occur, our business, financial condition, results of operations or prospects could be materially and adversely affected. In such an event, the market price of our common stock could decline and you could lose all or part of your investment. The risks and uncertainties we describe below are not the only ones facing us. Additional risks not presently known to us or that we currently deem immaterial may also affect our business.
Risks Related to Our Business
Our plans to license handset manufacturers in China may be adversely affected by a deterioration in United States-China trade and geopolitical relations, our customers facing economic uncertainty there or our failure to establish a positive reputation in China, which could materially adversely affect our long-term business, financial condition and operating results.
Companies headquartered in China currently comprise a substantial portion of the handset manufacturers that remain unlicensed to our patent portfolio. Our ability to license such manufacturers is, among other things, affected by the macroeconomic and geopolitical climate, as well as our business relationships and perceived reputation in China. The U.S. and Chinese governments are currently engaged in trade negotiations, and the U.S. State Department issued a travel advisory in
11
January 2019 that advises U.S. citizens to exercise increased caution in China due to arbitrary enforcement of local laws. This travel advisory and other security concerns are restricting our ability to conduct in-person negotiations with prospective Chinese licensees. If the U.S.-China trade dispute escalates or relations between the United States and China further deteriorate, these conditions could adversely affect our ability to license our patent portfolio to Chinese handset manufacturers. Our ability to license such manufacturers could also be affected by economic uncertainty, particularly in the handset market, in China or by our failure to establish a positive reputation and relationships in China. The occurrence of any of these events could have an adverse effect on our ability to enter into license agreements with Chinese handset manufacturers, which, in turn, could cause our long-term business, financial condition and operating results to be materially adversely affected.
Potential patent and litigation reform legislation, potential USPTO and international patent rule changes, potential legislation affecting mechanisms for patent enforcement and available remedies, and potential changes to the intellectual property rights (“IPR”) policies of worldwide standards bodies, as well as rulings in legal proceedings, may affect our investments in research and development and our strategies for patent prosecution, licensing and enforcement and could have a material adverse effect on our licensing business as well as our business as a whole.
Potential changes to certain U.S. and international patent laws, rules and regulations may occur in the future, some or all of which may affect our research and development investments, patent prosecution costs, the scope of future patent coverage we secure, the number of forums in which we can seek to enforce our patents, the remedies that we may be entitled to in patent litigation, and attorneys’ fees or other remedies that could be sought against us, and may require us to reevaluate and modify our research and development activities and patent prosecution, licensing and enforcement strategies. Similarly, legislation designed to reduce the jurisdiction and remedial authority of the United States International Trade Commission (the “USITC”) has periodically been introduced in Congress.
Any potential changes in the law, the IPR policies of standards bodies or other developments that reduce the number of forums available or the type of relief available in such forums (such as injunctive relief), restrict permissible licensing practices (such as our ability to license on a worldwide portfolio basis) or that otherwise cause us to seek alternative forums (such as arbitration or state court), would make it more difficult for us to enforce our patents, whether in adversarial proceedings or in negotiations. Because we have historically depended on the availability of certain forms of legal process to enforce our patents and obtain fair and adequate compensation for our investments in research and development and the unauthorized use of our intellectual property, developments that undermine our ability to do so could have a negative impact on future licensing efforts.
Rulings in our legal proceedings as well as those of third parties may affect our strategies for patent prosecution, licensing and enforcement. For example, in recent years, the USITC and U.S. courts, including the U.S. Supreme Court and the U.S. Court of Appeals for the Federal Circuit, have taken some actions that have been viewed as unfavorable to patentees, including the Company. Decisions that occur in U.S. or in international forums may change the law applicable to various patent law issues, such as, for example, patentability, validity, claim construction, patent exhaustion, patent misuse, permissible licensing practices, available forums, and remedies such as damages and injunctive relief, in ways that are detrimental to the abilities of patentees to enforce patents and obtain suitable relief.
We continue to monitor and evaluate our strategies for prosecution, licensing and enforcement with regard to these developments; however, any resulting change in such strategies may have an adverse impact on our business and financial condition.
Royalty rates, or other terms, under our patent license agreements could be subject to determination through arbitration or other third-party adjudications or regulatory or court proceedings, and arbitrators, judges or other third-party adjudicators or regulators could determine that our patent royalty rates should be at levels lower than our agreed or historical rates or otherwise make determinations resulting in less favorable terms and conditions under our patent license agreements.
Historically, the terms of our patent license agreements, including our royalty rates, have been reached through arms-length bilateral negotiations with our licensees. We could agree, as we did with Huawei pursuant to our December 2013 settlement agreement, to have royalty rates, or other terms, set by third party adjudicators (such as arbitrators) and it is also possible that courts or regulators could decide to set or otherwise determine the FRAND consistency of such terms or the manner in which such terms are determined, including by determining a worldwide royalty rate for our standards-essential patents. Changes to or clarifications of our obligations to be prepared to offer licenses to standards-essential patents on FRAND terms and conditions could require such terms, including our royalty rates, to be determined through third party adjudications. Finally, certain of our current and prospective licensees have instigated, and others could in the future instigate, legal proceedings or regulatory proceedings requesting third party adjudicators or regulators, such as the Shenzhen Intermediate People’s Court, China's National Development and Reform Commission and Taiwan's Fair Trade Commission, to set FRAND terms and conditions for, or determine the FRAND-consistency of current terms and conditions in, our patent license agreements, and which could result in such third party adjudicators or regulators determining a worldwide royalty rate for our standards-essential patents. To the extent that our patent royalty rates for our patent license agreements are determined through
12
arbitration or other third party adjudications or regulatory or court proceedings rather than through bilateral negotiations, because such proceedings are inherently unpredictable and uncertain and there are currently few precedents for such determinations, it is possible that royalty rates may be lower than our historical rates, and this could also have a negative impact on royalties we are able to obtain from future licensees, which may have an adverse effect on our revenue and cash flow. In addition, to the extent that other terms and conditions for our patent license agreements are determined through such means, such terms and conditions could be less favorable than our historical terms and conditions, which may have an adverse effect on our licensing business.
Due to the nature of our business, we could continue to be involved in a number of costly litigation, arbitration and administrative proceedings to enforce or defend our intellectual property rights and to defend our licensing practices.
While some companies seek licenses before they commence manufacturing and/or selling devices that use our patented inventions, most do not. Consequently, we approach companies and seek to establish license agreements for using our inventions. We expend significant time and effort identifying users and potential users of our inventions and negotiating license agreements with companies that may be reluctant to take licenses. However, if we believe that a third party is required to take a license to our patents in order to manufacture, sell, offer for sale, import or use products, we have in the past commenced, and may in the future, commence legal or administrative action against the third party if they refuse to enter into a license agreement with us. In turn, we have faced, and could continue to face, counterclaims and other legal proceedings that challenge the essential nature of our patents, or that claim that our patents are invalid, unenforceable or not infringed. Litigation adversaries may allege that we have not complied with certain commitments to standards-setting organizations and therefore that we are not entitled to the relief that we seek. For example, a party may allege that we have not complied with an obligation to offer a license to a party on FRAND terms and conditions, and may also file antitrust claims, unfair competition claims or regulatory complaints on that or other bases, and may seek damages and other relief based on such claims. Litigation adversaries have also filed against us, and other third parties may in the future file, validity challenges such as inter partes proceedings in the USPTO, which can lead to delays of our patent infringement actions as well as potential findings of invalidity.
Litigation may be also required to enforce our intellectual property rights, protect our trade secrets, enforce patent license and confidentiality agreements or determine the validity, enforceability and scope of proprietary rights of others.
Third parties could commence litigation against us seeking to invalidate our patents or obtain a determination that our patents are not infringed, are not essential, are invalid or are unenforceable. In addition, current and prospective licensees have initiated proceedings against us claiming, and others in the future may claim, that we have not complied with our FRAND licensing commitments and/or engaged in anticompetitive or unfair licensing activities.
The cost of enforcing and defending our intellectual property and of defending our licensing practices has been and may continue to be significant. As a result, we could be subject to significant legal fees and costs, including in certain jurisdictions the costs and fees of opposing counsel if we are unsuccessful. In addition, litigation, arbitration and administrative proceedings require significant key employee involvement for significant periods of time, which could divert these employees from other business activities.
Setbacks in defending our patent licensing practices could cause our cash flow and revenue to decline and could have an adverse effect on our licensing business.
Adverse decisions in litigation or regulatory actions relating to our licensing practices, including, but not limited to, findings that we have not complied with our FRAND commitments and/or engaged in anticompetitive or unfair licensing activities or that any of our license agreements are void or unenforceable, could have an adverse impact on our cash flow and revenue. Regulatory bodies may assess fines in the event of adverse findings, and as part of court or arbitration proceedings, a judgment could require us to pay damages (including the possibility of treble damages for antitrust claims). In addition, to the extent that legal decisions find patent license agreements to be void or unenforceable in whole or in part, that could lead to a decrease in the revenue associated with and cash flow generated by such agreements, and, depending on the damages requested, could lead to the refund of certain payments already made. Finally, adverse legal decisions related to our licensing practices could have an adverse effect on our ability to enter into license agreements, which, in turn, could cause our cash flow and revenue to decline.
Royalty rates could decrease for future license agreements due to downward product pricing pressures and competition over patent royalties.
Royalty payments to us under future license agreements could be lower than anticipated. Certain licensees and others in the wireless and consumer electronics industries, individually and collectively, are demanding that royalty rates for patents be lower than historic royalty rates and/or that such rates should be applied to royalty bases smaller than the selling price of an end product (such as the “smallest salable patent practicing unit”). There is also increasing downward pricing pressure on
13
certain wireless products, including handsets, and other consumer electronics devices that we believe implement our patented inventions, and some of our royalty rates are tied to the pricing of these devices. In addition, a number of other companies also claim to hold patents that are essential with respect to products we aim to license. Demands by certain licensees to reduce royalties due to pricing pressure or the number of patent holders seeking royalties on these technologies, could result in a decrease in the royalty rates we receive for use of our patented inventions, thereby decreasing future revenue and cash flow.
Our plans to broaden our revenue opportunities through acquiring or developing technology in new or expanded areas, such as technologies in the consumer electronics and IoT spaces, and enhanced intellectual property sourcing and joint ventures, may not be successful and could materially adversely affect our long-term business, financial condition and operating results.
As part of our business strategy, we are seeking to broaden our revenue opportunities through targeted acquisitions, research partnerships, joint ventures and the continued development of new technologies, such as our binding offer to acquire Technicolor SA's Research & Innovation unit. Increasingly, our future growth in part depends on developing or acquiring technology in new or expanded areas that are used on cellular devices (such as video coding technologies) and adjacent industry segments outside of traditional cellular industries (such as other consumer electronics devices and the IoT, including the connected home and smart cities, automotive, mobile computing, mobile health and sensor technology), and on third parties incorporating our technology and solutions into device types used in these areas and industry segments. There is no guarantee that we will succeed in acquiring or developing technology and patents or partnering with inventors and research organizations to create new revenue opportunities and/or add new dimensions to our existing portfolio of intellectual property and potentially create new patent licensing programs. Also, our development activities may experience delays, which could reduce our opportunities for patent licensing or other avenues of revenue generation related to such development activities. In the event that any of these risks materialize, our long-term business, financial condition and operating results may be materially adversely affected.
Setbacks in defending and enforcing our patent rights could cause our revenue and cash flow to decline.
Some third parties have challenged, and we expect will continue to challenge, the infringement, validity and enforceability of certain of our patents. In some instances, certain of our patent claims could be substantially narrowed or declared invalid, unenforceable, not essential or not infringed. We cannot ensure that the validity and enforceability of our patents will be maintained or that our patents will be determined to be applicable to any particular product or standard. Moreover, third parties could attempt to circumvent certain of our patents through design changes. Any significant adverse finding as to the validity, infringement, enforceability or scope of our patents and/or any successful design-around of our patents could result in the loss of patent licensing revenue from existing licensees, through termination or modification of agreements or otherwise, and could substantially impair our ability to secure new patent licensing arrangements, either at all or on beneficial terms.
Our technologies may not become patented, adopted by wireless standards or widely deployed.
We invest significant resources in the development of advanced technology and related solutions. However, certain of our inventions that we believe will be employed in current and future products, including 4G, 5G and beyond, are the subject of patent applications where no patent has been issued to us yet by the relevant patent issuing authorities. There is no assurance that these applications will issue as patents, either at all or with claims that would be required by products in the market currently or in the future. Our investments may not be recoverable or may not result in meaningful revenue if a sufficient number of our technologies are not patented and adopted by the relevant standards or if products based on the technologies in which we invest are not widely deployed. Competing technologies could reduce the opportunities for the adoption or deployment of technologies we develop. In addition, it is possible that in certain technology areas, such as in the IoT space, the adoption of proprietary systems could compete with or replace standards-based technology. It is also possible in certain technology areas, such as video coding and the IoT, that open source solutions such as AV1 and OCF, respectively, could compete with or replace proprietary standards-based technology. If the technologies in which we invest do not become patented or are not adopted by the relevant standards, or are not adopted by and deployed in the mainstream markets, at all or at the rate or within time periods we expect, or in the case of open source solutions, do not infringe our technology, our business, financial condition and operating results could be adversely affected.
Delays in renewing or an inability to renew existing license agreements could cause our revenue and cash flow to decline.
Many of our license agreements have fixed terms. Although we endeavor to renew license agreements with fixed terms prior to the expiration of the license agreements, due to various factors, including the technology and business needs and competitive positions of our licensees and, at times, reluctance on the part of our licensees to participate in renewal discussions, we may not be able to renegotiate the license agreements on acceptable terms before the expiration of the license agreement, on acceptable terms after the expiration of the license agreement, or at all. If there is a delay in renegotiating and renewing a license agreement prior to its expiration, there could be a gap in time during which we may be unable to recognize revenue
14
from that licensee or we may be forced to renegotiate and renew the license agreement on terms that are more favorable to such licensee, and, as a result, our revenue and cash flow could be materially adversely affected. In addition, if we fail to renegotiate and renew our license agreements at all, we could lose existing licensees, and our revenue and cash flow could be materially adversely affected.
Increased scrutiny by antitrust authorities may affect our strategies for patent prosecution, licensing and enforcement and may increase our costs of doing business and/or lead to monetary fines, penalties or other remedies or sanctions.
Domestic and foreign antitrust authorities have increased their scrutiny of the use of standards-essential patents in the mobile wireless industry, including the enforcement of such patents against competitors and others. Such scrutiny has already resulted in enforcement actions against Qualcomm and could lead to additional investigations of, or enforcement actions against, the Company. Such inquiries and/or enforcement actions could impact the availability of injunctive and monetary relief, which may adversely affect our strategies for patent prosecution, licensing and enforcement and increase our costs of operation. Such inquiries and/or enforcement actions could also result in monetary fines, penalties or other remedies or sanctions that could adversely affect our business and financial condition.
Our commercialization, licensing and/or mergers and acquisitions (“M&A”) activities could lead to patent exhaustion or implied license issues that could materially adversely affect our business.
The legal doctrines of patent exhaustion and implied license may be subject to different judicial interpretations. Our commercialization or licensing of certain technologies and/or our M&A activities could potentially lead to patent exhaustion or implied license issues that could adversely affect our patent licensing program(s) and limit our ability to derive licensing revenue from certain patents under such program(s). In the event of successful challenges by current or prospective licensees based on these doctrines that result in a material decrease to our patent licensing revenue, our financial condition and operating results may be materially adversely affected.
We may experience difficulties or delays integrating, and may not be able to realize all of the anticipated benefits from the integration of, the patent licensing business that we acquired from Technicolor in 2018 and, if consummated, the Research & Innovation unit of Technicolor with respect to which we made a binding offer to purchase (the “Technicolor business”).
We may experience difficulties integrating the Technicolor business, or may fail to realize the anticipated benefits from our integration of the Technicolor business on a timely basis, or at all, for a variety of reasons, including the following:
|
•
|
failure of the acquisitions to materially increase the value of our core handset licensing business by not increasing the royalty amount we would otherwise derive on each handset, not accelerating the pace of licensing, or not allowing us to avoid litigation to protect our intellectual property;
|
|
•
|
unexpected costs and strain on our resources and potential distraction of management arising from our attempts to integrate the Technicolor business;
|
|
•
|
difficulties integrating the patent portfolios and related portfolio management systems of the businesses, or migrating the portfolios to a new patent management system, and the risk that the patent assets could be negatively affected;
|
|
•
|
failure to continue to develop and expand our portfolio of video technology patent assets;
|
|
•
|
failure to develop a successful business plan and licensing program related to consumer electronics;
|
|
•
|
difficulties integrating the personnel of the Technicolor business into our operations, organization, and human resources programs, and the risk that we could lose key employees;
|
|
•
|
challenges associated with managing a geographically remote business;
|
|
•
|
failure to forecast accurately the long-term value and costs of the Technicolor business or of certain assets acquired in the transactions;
|
|
•
|
liabilities that are not covered by, or exceed the coverage under, the indemnification or other provisions of the acquisition-related agreements; and
|
|
•
|
patent validity, infringement, exhaustion or enforcement issues not uncovered during our diligence process.
|
In the event that we experience significant integration difficulties or delays, or fail to realize the anticipated benefits from the integration, our business and results of operations, and our stock price, may be adversely affected.
We have in the past and may in the future make acquisitions or engage in other strategic transactions that could result in significant changes, costs and/or management disruption and that may fail to enhance shareholder value or produce the anticipated benefits.
We have in the past and may in the future acquire companies, businesses, technology and/or intellectual property, enter into joint ventures or other strategic transactions. Acquisitions or other strategic transactions may increase our costs, including
15
but not limited to accounting and legal fees, and may not generate financial returns or result in increased adoption or continued use of our technologies or of any technologies we may acquire.
Achieving the anticipated benefits of acquisitions depends in part upon our ability to integrate the acquired companies, businesses and/or assets in an efficient and effective manner. The integration of acquired companies or businesses may result in significant challenges, including, among others: successfully integrating new employees, technology and/or products; consolidating research and development operations; minimizing the diversion of management’s attention from ongoing business matters; and consolidating corporate and administrative infrastructures. As a result, we may be unable to accomplish the integration smoothly or successfully.
In addition, we cannot be certain that the integration of acquired companies, businesses, technology and/or intellectual property with our business will result in the realization of the full benefits we anticipate will be realized from such acquisitions. Our plans to integrate and/or expand upon research and development programs and technologies obtained through acquisitions may result in products or technologies that are not adopted by the market, or the market may adopt solutions competitive to our products or technologies. We may not derive any commercial value from the acquired technology or intellectual property or from future technologies or products based on the acquired technology and/or intellectual property. In addition, to the extent we are separately seeking a patent license from a customer or customers of an acquired entity, the acquired entity may lose such customers. Following the completion of the acquisition, we may be subject to liabilities that are not covered by, or exceed the coverage under, the indemnification protection we may obtain, and we may encounter patent validity, infringement or enforcement issues or unforeseen expenses not uncovered during our diligence process. Any acquired company or business would be subject to its own risks that may or may not be the same as the risks already disclosed herein.
Challenges relating to our ability to enter into new license agreements could cause our revenue and cash flow to decline.
We face challenges in entering into new patent license agreements. One of the most significant challenges we face is that most potential licensees do not voluntarily seek to enter into license agreements with us before they commence manufacturing and/or selling devices that use our patented inventions. As a result, we must approach companies that are reluctant to take licenses and attempt to establish license agreements with them. The process of identifying potential users of our inventions and negotiating license agreements with reluctant prospective licensees requires significant time, effort and expense. Once discussions with unlicensed companies have commenced, we face the additional challenges imposed by the significant negotiation issues that arise from time to time. Given these challenges relating to our ability to enter into new license agreements, we cannot ensure that all prospective licensees will be identified or, if they are identified, will be persuaded during negotiations to enter into a patent license agreement with us, either at all or on terms acceptable to us, and, as a result, our revenue and cash flow could materially decline. The length of time required to negotiate a license agreement also leads to delays in the receipt of the associated revenue stream, which could also cause our revenue and cash flow to decline.
In addition, as discussed more fully above in these Risk Factors, we are currently operating in a challenging regulatory and judicial environment, which may, under certain circumstances, lead to delays in the negotiation of and entry into new patent license agreements. Also, as discussed above in these Risk Factors and in Item 3, Legal Proceedings, in this Form 10-K, we are also currently, and may in the future be, involved in legal proceedings with potential licensees, with whom we do not yet have a patent license agreement. Any such delays in the negotiation or entry into new patent license agreements and receipt of the associated revenue stream could cause our revenue and cash flow to decline.
Our revenues are derived primarily from a limited number of licensees or customers.
We earn a significant amount of our revenues from a limited number of licensees or customers, and we expect that a significant portion of our revenues will continue to come from a limited number of licensees or customers for the foreseeable future. For example, in 2018, Apple, Samsung and LG Electronics accounted for approximately 36%, 25% and 10% of our total revenues, respectively. In the event that we are unable to renew one or more of such license agreements upon expiration, our future revenue and cash flow could be materially adversely affected. In addition, in the event that one or more of our significant licensees or customers fail to meet their payment or reporting obligations (for example, due to a credit issue or in connection with a legal dispute or similar proceeding) under their respective license agreements, our future revenue and cash flow could be materially adversely affected. In addition, in the event that there is a material decrease in shipments of licensed products by one of our per-unit licensees, our revenues from such licensee could significantly decline and our future revenue and cash flow could be adversely affected.
Our strategy to diversify our patent-based revenue by pursuing alternative patent licensing arrangements and patent sales may not be successful.
There is no guarantee that we will succeed in our pursuit of select patent licensing arrangements or patent sales, and, if we are successful, there is no guarantee that the revenue and cash flow generated through such alternative licensing arrangements (such as the Signal Trust and the Avanci licensing platform) or patent sales will be greater than the revenue and
16
cash flow we would have generated if we had retained and/or licensed the patents ourselves. In addition, potential licensees may be reluctant to enter into new patent license agreements, and current licensees may be reluctant to renew their agreements, either at all or on terms acceptable to the Company, based on the fact that we have sold portions of our patent portfolio or the belief that we plan to sell or transfer some of the patents we are asking them to license.
A portion of our revenue and cash flow are dependent upon our licensees' sales and market conditions and other factors that are beyond our control or are difficult to forecast.
A portion of our licensing revenues is running royalty-based and dependent on sales by our licensees that are outside our control and that could be negatively affected by a variety of factors, including global, regional and/or country-specific economic conditions, country-specific natural disasters impacting licensee manufacturing and sales, buying patterns of end users, which are often driven by replacement and innovation cycles, competition for our licensees' products and any decline in the sale prices our licensees receive for their covered products. In addition, our operating results also could be affected by general economic and other conditions that cause a downturn in the market for the licensees of our products or technologies. Our revenue and cash flow also could be affected by (i) the unwillingness of any licensee to satisfy all of their royalty obligations on the terms or within the timeframe we expect, (ii) a decline in the financial condition of any licensee or (iii) the failure of sales to meet market forecasts due to global or regional economic conditions, political instability, natural disasters, competitive technologies or otherwise. It is also difficult to predict the timing, nature and amount of licensing revenue associated with past infringement and new licenses, strategic relationships and the resolution of legal proceedings. The foregoing factors are difficult to forecast and could adversely affect both our quarterly and annual operating results and financial condition. In addition, some of our patent license agreements provide for upfront fixed payments or prepayments that cover our licensees' future sales for a specified period and reduce future cash receipts from those licensees. As a result, our cash flow has historically fluctuated from period to period. Depending upon the payment structure of any new patent license agreements into which we may enter, such cash flow fluctuations may continue in the future.
Our revenue may be affected by the deployment of future-generation wireless standards in place of 3G, 4G and 5G technologies or future-generation video standards, by the timing of such deployment, or by the need to extend or modify certain existing license agreements to cover subsequently issued patents.
Although we own an evolving portfolio of issued and pending patents related to 3G, 4G and 5G cellular technologies and non-cellular technologies including video coding technologies, our patent portfolio licensing program for future-generation wireless standards or video coding standards may not be as successful in generating licensing income as our current licensing programs. Although we continue to participate in worldwide standards bodies and contribute our intellectual property to future-generation wireless and video coding standards, including standards that will define 5G, our technologies might not be adopted by the relevant standards. In addition, we may not be as successful in the licensing of future-generation products as we have been in licensing products deploying existing wireless and video coding standards, or we may not achieve a level of royalty revenues on such products that is comparable to that which we have historically received on products deploying existing wireless and video coding standards. Furthermore, if there is a delay in the standardization and/or deployment of 5G or future video coding standards, our business and revenue could be negatively impacted.
The licenses that we grant under our patent license agreements typically only cover products designed to operate in accordance with specified technologies and that were manufactured or deployed or anticipated to be manufactured or deployed at the time of entry into the agreement. Also, we have patent license agreements with licensees that now offer for sale types of products that were not sold by such licensees at the time the patent license agreements were entered into and, thus, are not licensed by us. We do not derive patent licensing revenue from the sale of products by our licensees that are not covered by a patent license agreement. In order to grant a patent license for any such products, we will need to extend or modify our patent license agreements or enter into new license agreements with such licensees. We may not be able to extend or modify these license agreements, or enter into new license agreements, on financial terms acceptable to us, without affecting the other material terms and conditions of our license agreements with such licensees or at all. Further, such extensions, modifications or new license agreements may adversely affect our revenue on the sale of products covered by the license prior to any extension, modification or new license.
We face risks from doing business and maintaining offices in international markets.
A significant portion of our licensees, potential licensees and customers are international, and our licensees, potential licensees and customers sell their products to markets throughout the world. In addition, in recent years, we have expanded, and we may continue to expand, our international operations, opening offices in France, the United Kingdom, South Korea, China, Belgium and Germany. Accordingly, we are subject to the risks and uncertainties of operating internationally and could be affected by a variety of uncontrollable and changing factors, including, but not limited to: difficulty in protecting our intellectual property in foreign jurisdictions; enforcing contractual commitments in foreign jurisdictions or against foreign corporations; government regulations, tariffs and other applicable trade barriers; biased enforcement of foreign laws and regulations to promote industrial or economic policies at our expense; currency control regulations and variability in the value
17
of the U.S. dollar against foreign currency; export license requirements and restrictions on the use of technology; social, economic and political instability; natural disasters, acts of terrorism, widespread illness and war; potentially adverse tax consequences; general delays in remittance of and difficulties collecting non-U.S. payments; foreign labor regulations; anti-corruption laws; and difficulty in staffing and managing operations remotely. In addition, we also are subject to risks specific to the individual countries in which we and our licensees, potential licensees and customers do business.
We depend on key senior management, engineering, patent and licensing resources.
Our future success depends largely upon the continued service of our executive officers and other key management and technical personnel, as well as on our ability to put in place adequate succession plans for such key personnel, and/or organizational strategies related to the departure of such key personnel. Our success also depends in part on our ability to continue to attract, retain and motivate qualified personnel with specialized patent, licensing, engineering and other skills. The market for such talent in our industry is extremely competitive. In particular, competition exists for qualified individuals with expertise in patents and in licensing and with significant engineering experience in cellular and air interface technologies, as well as video coding technologies. Our ability to attract and retain qualified personnel could be affected by any adverse decisions in any litigation, arbitration or regulatory proceeding, by our ability to offer competitive cash and equity compensation and work environment conditions and by the geographic location of our various offices. The failure to attract and retain such persons with relevant and appropriate experience or to have in place adequate succession plans and/or organizational strategies related to the departure of certain key personnel could interfere with our ability to enter into new license agreements and undertake additional technology and product development efforts, as well as our ability to meet our strategic objectives.
Our industry is subject to rapid technological change, uncertainty and shifting market opportunities.
Our success depends, in part, on our ability to define and keep pace with changes in industry standards, technological developments and varying customer requirements. Changes in industry standards and needs could adversely affect the development of, and demand for, our technology, rendering our technology currently under development obsolete and unmarketable. The patents and applications comprising our portfolio have fixed terms, and, if we fail to anticipate or respond adequately to these changes through the development or acquisition of new patentable inventions, patents or other technology, we could miss a critical market opportunity, reducing or eliminating our ability to capitalize on our patents, technology solutions or both.
Concentration and consolidation in the wireless communications industry could adversely affect our business.
There is some concentration among participants in the wireless communications industry, and the industry has experienced consolidation of participants and sales of participants or their businesses, and these trends may continue. For example, in 2018, Samsung, Apple and Huawei collectively accounted for approximately 40% of worldwide shipments of 3G and 4G handsets and close to 50% of worldwide smartphone shipments. Any further concentration or sale within the wireless industry among handset providers and/or original design manufacturers ("ODMs") may reduce the number of licensing opportunities or, in some instances, result in the reduction, loss or elimination of existing royalty obligations. We may also face a reduction in the number of licensing opportunities or existing royalty obligations as a result of government-imposed bans or other restrictions on the importation, manufacture and/or sale of cellular handsets by certain companies. In addition, acquisitions of or consolidation among ODMs could cause handset providers who outsource manufacturing to make supply chain changes, which in turn could result in the reduction, loss or elimination of existing royalty obligations (for example, if manufacturing is moved from an ODM with which we have a patent license agreement to an ODM with which we do not). Further, if wireless carriers consolidate with companies that utilize technologies that are competitive with our technologies or that are not covered by our patents, we could lose market opportunities, which could negatively impact our revenues and financial condition.
Our use of open source software could materially adversely affect our business, financial condition, operating results and cash flow.
Certain of our technology and our suppliers’ technology may contain or may be derived from “open source” software, which, under certain open source licenses, may offer accessibility to a portion of a product’s source code and may expose related intellectual property to adverse licensing conditions. Licensing of such technology may impose certain obligations on us if we were to distribute derivative works of the open source software. For example, these obligations may require us to make source code for derivative works available or license such derivative works under a particular type of license that is different from what we customarily use to license our technology. While we believe we have taken appropriate steps and employ adequate controls to protect our intellectual property rights, our use of open source software presents risks that, if we inappropriately use open source software, we may be required to re-engineer our technology, discontinue the sale of our technology, release the source code of our proprietary technology to the public at no cost or take other remedial actions, which could adversely affect our business, operating results and financial condition. There is a risk that open source licenses could be
18
construed in a way that could impose unanticipated conditions or restrictions on our ability to commercialize our solutions, which could adversely affect our business, operating results and financial condition. In addition, developing open source products, while adequately protecting the intellectual property rights upon which our licensing business depends, may prove burdensome and time-consuming under certain circumstances, thereby placing us at a competitive disadvantage.
Changes to our tax assets or liabilities could have an adverse effect on our consolidated financial condition or results of operations.
The calculation of tax assets and liabilities involves significant judgment in estimating the impact of uncertainties in the application of complex tax laws. We are subject to examinations by the Internal Revenue Service ("IRS") and other taxing jurisdictions on various tax matters, including challenges to various positions we assert in our filings and foreign tax liability and withholding. Pursuant to the guidance for accounting for uncertainty in income taxes, certain tax contingencies are recognized when they are determined to be more likely than not to occur. Although we believe we have adequately recorded tax assets and accrued for tax contingencies that meet this criterion, we may not fully recover our tax assets or may be required to pay taxes in excess of the amounts we have accrued. As of December 31, 2018, and 2017, there were certain tax contingencies that did not meet the applicable criteria to record an accrual. In the event that the IRS or another taxing jurisdiction levies an assessment in the future, it is possible the assessment could have an adverse effect on our consolidated financial condition or results of operations.
Changes in financial accounting standards or policies may affect our reported financial condition or results of operations and, in certain cases, could cause a decline and/or fluctuations in the price of our common stock.
From time to time the Financial Accounting Standards Board (the “FASB”) and the Staff of the Securities and Exchange Commission (the "SEC") change their guidance governing the form and content of our external financial statements. In addition, accounting standard setters and those who interpret U.S. generally accepted accounting principles (“GAAP”), such as the FASB and the SEC, may change or even reverse their previous interpretations or positions with regard to how these standards should be applied. A change in accounting principles or their interpretation can have a significant effect on our reported results. In certain cases, we could be required to apply new or revised guidance retroactively or apply existing guidance differently. Potential changes in reporting standards could substantially change our reporting practices in a number of areas, including revenue recognition and recording of assets and liabilities, and affect our reported financial condition or results of operations.
For example, in May 2014, the FASB and International Accounting Standards Board issued revenue guidance, Revenue from Contracts with Customers, that the Company has adopted effective January 1, 2018, which impacts our recognition of revenue from both our fixed-fee and per-unit license agreements. Refer to Note 3, "
Revenue Recognition
," in the consolidated financial statements for further information regarding this adoption. Such changes to our reporting practices could significantly affect our reported financial condition and results of operations going forward, causing the amount of revenue we recognize to vary dramatically from quarter to quarter, and even year to year, depending on the timing of entry into license agreements and whether such agreements are dynamic or static fixed-fee agreements or have per-unit royalty terms. In addition, these changes to our reporting practices and the resulting fluctuations in our reported revenue could cause a decline and/or fluctuations in the price of our common stock.
The high amount of capital required to obtain radio frequency licenses, deploy and expand wireless networks and obtain new subscribers, as well as the cost of new handsets could slow the growth of the wireless communications industry and adversely affect our business.
Our growth is partially dependent upon the increased use of wireless communications services and cellular handsets that utilize our technology. In order to provide wireless communications services, wireless operators must obtain rights to use specific radio frequencies. The allocation of frequencies is regulated in the United States and other countries throughout the world, and limited spectrum space is allocated to wireless communications services. Industry growth may be affected by the amount of capital required to obtain licenses to use new frequencies, deploy wireless networks to offer voice and data services, expand wireless networks to grow voice and data services and obtain new subscribers. The significant cost of licenses, wireless networks and subscriber additions may slow the growth of the industry if wireless operators are unable to obtain or service the additional capital necessary to implement or expand advanced wireless networks. Growth in the number of cellular handsets may slow as the number of people worldwide without a cellular handset declines. In addition, if the cost of cellular handsets increases, customers may be less likely to replace their existing devices with new devices. The growth of our business could be adversely affected if either of these events occur.
Market projections and data are forward-looking in nature.
Our strategy is based on our own projections and on analyst, industry observer and expert projections, which are forward-looking in nature and are inherently subject to risks and uncertainties. The validity of their and our assumptions, the
19
timing and scope of wireless markets, economic conditions, customer buying patterns, timeliness of equipment development, pricing of products, growth in wireless telecommunications services that would be delivered on wireless devices and availability of capital for infrastructure improvements could affect these predictions. In addition, market data upon which we rely is based on third party reports that may be inaccurate. The inaccuracy of any of these projections and/or market data could adversely affect our operating results and financial condition.
We face competition from companies developing other or similar technologies.
We face competition from companies developing other and similar technologies that are competitive with our products and solutions that we may market or set forth into the standards-setting arena. Due to competing products and solutions, our products and solutions may not find a viable commercial marketplace or, where applicable, be adopted by the relevant standards. In addition, in licensing our patent portfolio, we may compete with other companies, many of whom also claim to hold essential patents, for a share of the royalties that certain licensees may argue to be the total royalty that is supported by a certain product or products. In any device or piece of equipment that contains intellectual property, the manufacturer may need to obtain a license from multiple holders of intellectual property. To the extent that multiple parties all seek royalties on the same product, the manufacturers could claim to have difficulty in meeting the financial requirements of each patent holder.
Our engineering services business could subject us to specific costs and risks that we might fail to manage adequately.
We derive a portion of our revenues from engineering services. Any mismanagement of, or negative development in, a number of areas, including, among others, the perceived value of our intellectual property portfolio, our ability to convince customers of the value of our engineering services and our reputation for performance under our service contracts, could cause our revenues from engineering services to decline, damage our reputation and harm our ability to attract future licensees, which would in turn harm our operating results. If we fail to deliver as required under our service contracts, we could lose revenues and become subject to liability for breach of contract. We need to monitor these services adequately in order to ensure that we do not incur significant expenses without generating corresponding revenues. Our failure to monitor these services adequately may harm our business, financial position, results of operations or cash flows.
We may experience difficulties with our new enterprise resource planning (“ERP”) system.
In first quarter 2018, we implemented a new enterprise resource planning (“ERP”) system designed to efficiently maintain our books and records and provide information important to the operation of our business to our management team. We have committed significant resources to this new system, and realizing the full functionality of the system is complex. As a result of the conversion process, we may experience delays or disruptions in the integration of our new systems, procedures or controls. We may also encounter errors in data and security or technical reliability issues. Significant system failures could lead to a delay or error in recording and reporting financial information on a timely and accurate basis or impact our internal control compliance efforts, which could have a material adverse effect on our financial condition or results of operations.
It can be difficult for us to verify royalty amounts owed to us under our per-unit licensing agreements, and this may cause us to lose potential revenue.
The standard terms of our per-unit license agreements require our licensees to document the sale of licensed products and report this data to us on a quarterly basis. Although our standard license terms give us the right to audit books and records of our licensees to verify this information, audits can be expensive, time consuming, incomplete and subject to dispute. From time to time, we audit certain of our licensees to verify independently the accuracy of the information contained in their royalty reports in an effort to decrease the likelihood that we will not receive the royalty revenues to which we are entitled under the terms of our license agreements, but we cannot give assurances that these audits will be numerous enough and/or effective to that end.
Our plans to expand our revenue opportunities through commercializing our market-ready technologies and acquiring and/or developing new technology with commercial applicability may not be successful and could materially adversely affect our long-term business, financial condition and operating results.
As part of our business strategy, we are seeking to expand our revenue opportunities through the continued development, commercialization and licensing of technology projects, including in the IoT space. Our technology development and acquisition activities may experience delays, or the markets for our technology solutions may fail to materialize to the extent or at the rate we expect, if at all, each of which could reduce our opportunities for technology sales and licensing. In addition, there could be fewer applications for our technology and products than we expect. Technology markets also could be affected by general economic conditions, customer buying patterns, timeliness of equipment development, and the availability of capital for, and the high cost of, infrastructure improvements. Additionally, investing in technology development is costly and may require structural changes to the organization that could require additional costs, including without limitation legal and accounting fees. Furthermore, delays or failures to enter into additional partnering relationships to facilitate technology development efforts and secure support for our technologies or delays or failures to enter into technology licensing agreements
20
to secure integration of additional functionality could impair our ability to introduce into the market portions of our technology and resulting products, cause us to miss critical market windows, or decrease our ability to remain competitive.
We have in the past and may in the future make investments that may fail to enhance shareholder value or produce the anticipated benefits.
We have in the past and may in the future make investments in other entities by purchasing minority equity interests or corporate bonds/notes in publicly traded or privately held companies. Most strategic investments entail a high degree of risk and may not become liquid for a period of time, if ever. In some cases, strategic investments may serve as consideration for a license in lieu of cash royalties. In addition, other investments may not generate financial returns or may result in losses due to market volatility, the general level of interest rates and inflation expectations. We have made in the past and may make in the future strategic investments in early-stage companies, which may require us to consolidate or record our share of the earnings or losses of those companies. Our share of any such losses may adversely affect our financial results until we exit from or reduce our exposure to these investments.
Our investments in new commercial initiatives may not be successful or generate meaningful revenues.
We have invested, and may continue to invest, in new businesses focused on commercializing technology that we have developed, incubated internally and/or acquired, such as video coding technology and other technologies for use on consumer electronics devices. Commercial success depends on many factors, including the demand for the technology, the highly competitive markets for our technology products, regulatory issues associated with such technology products, and effective marketing and licensing or product sales. In addition, our new technology offerings may require robust ecosystems of customers and service providers that may fail to materialize. Further, the establishment and operation of these commercial initiatives requires significant support, including technical, legal and financial resources. It is possible that these commercial initiatives will not be successful and/or will not achieve meaningful revenues for a number of years, if at all. Further, we may attempt to develop technologies or services that we believe we would be able to sell or license commercially using inside or outside technical, legal and financial resources. If our new commercial initiatives are not successful, or are not successful in the timeframe we anticipate, we may incur significant costs, our business may not grow as anticipated and/or our reputation may be harmed. In the event that any of these risks materialize, our long-term business, financial condition and operating results may be materially adversely affected.
We may be subject to warranty and/or product liability claims with respect to our products, which could be time-consuming and costly to defend and could expose us to loss and reputational damage.
We may be subject to claims if customers of our product offerings are injured or experience failures or other quality issues. We may from time to time be subject to warranty and product liability claims with regard to product performance and our services. We could incur losses as a result of warranty, support, repair or replacement costs in response to customer complaints or in connection with the resolution of contemplated or actual legal proceedings relating to such claims. In addition to potential losses arising from claims and related legal proceedings, warranty and product liability claims could affect our reputation and our relationship with customers.
Our technology development activities may experience delays.
We may experience technical, financial, resource or other difficulties or delays related to the further development of our technologies. Delays may have adverse financial effects and may allow competitors with comparable technology offerings to gain an advantage over us in the marketplace or in the standards setting arena. There can be no assurance that we will continue to have adequate staffing or that our development efforts will ultimately be successful. Moreover, certain of our technologies have not been fully tested in commercial use, and it is possible that they may not perform as expected. In such cases, our business, financial condition and operating results could be adversely affected, and our ability to secure new licensees and other business opportunities could be diminished.
We rely on relationships with third parties to develop and deploy technology solutions.
Successful exploitation of our technology solutions is partially dependent on the establishment and success of relationships with equipment producers and other industry participants. Delays or failure to enter into licensing or other relationships to facilitate technology development efforts or delays or failure to enter into technology licensing agreements to secure integration of additional functionality could impair our ability to introduce into the market portions of our technology and resulting products, cause us to miss critical market windows or impair our ability to remain competitive.
Our business may be adversely affected if third parties assert that we violate their intellectual property rights with respect to products and/or solutions that we sell or license.
Third parties may claim that we or our customers are infringing upon their intellectual property rights with respect to products and/or solutions we sell or license. Even if we believe that such claims are without merit, they can be time-consuming
21
and costly to defend against and may divert management’s attention and resources away from our business. Furthermore, third parties making such claims may be able to obtain injunctive or other equitable relief that could block our ability to further develop or commercialize some of our technologies or services in the United States and abroad and could cause us to stop selling, delay shipments of, or redesign our products. Claims of intellectual property infringement also might require us to enter into costly settlement or license agreements or pay costly damage awards. Even if we have an agreement that provides for a third party to indemnify us against such costs, the indemnifying party may be unable or unwilling to perform its contractual obligations. If we cannot use valid intellectual property that we infringe at all or on reasonable terms, or substitute similar non-infringing technology from another source, our business, financial position, results of operations or cash flows could be adversely affected.
Currency fluctuations could negatively affect future product sales or royalty revenues or increase the U.S. dollar cost of our activities and international strategic investments.
We are exposed to risk from fluctuations in currencies, which may change over time as our business practices evolve, that could impact our operating results, liquidity and financial condition. We operate and invest globally. Adverse movements in currency exchange rates may negatively affect our business due to a number of situations, including the following:
|
•
|
If the effective price of products sold by our licensees were to increase as a result of fluctuations in the exchange rate of the relevant currencies, demand for the products could fall, which in turn would reduce our royalty revenues.
|
|
•
|
Assets or liabilities of our consolidated subsidiaries may be subject to the effects of currency fluctuations, which may affect our reported earnings. Our exposure to foreign currencies may increase as we expand into new markets.
|
|
•
|
Certain of our operating and investing costs, such as foreign patent prosecution, are based in foreign currencies. If these costs are not subject to foreign exchange hedging transactions, strengthening currency values in selected regions could adversely affect our near-term operating expenses, investment costs and cash flows. In addition, continued strengthening of currency values in selected regions over an extended period of time could adversely affect our future operating expenses, investment costs and cash flows.
|
|
•
|
If as a result of tax treaty procedures, the U.S. government reaches an agreement with certain foreign governments to whom we have paid foreign taxes, resulting in a partial refund of foreign taxes paid with a related reduction in our foreign tax credits, such agreement could result in foreign currency gain or loss.
|
Our business and operations could suffer in the event of security breaches and our business is subject to a variety of domestic and international laws, rules and policies and other obligations regarding data protection.
Attempts by others to gain unauthorized access to information technology systems are becoming more sophisticated. These attempts, which in some cases could be related to industrial or other espionage, include covertly introducing malware to computers and networks and impersonating authorized users, among others. We seek to detect and investigate all security incidents and to prevent their recurrence, but, in some cases, we might be unaware of an incident or its magnitude and effects. While we have not identified any material incidents of unauthorized access to date, the theft, unauthorized use or publication of our intellectual property and/or confidential business or personal information (whether through a breach of our own systems or the breach of a system of a third party that provides services to us) could harm our competitive or negotiating positions, reduce the value of our investment in research and development and other strategic initiatives, compromise our patent enforcement strategies or outlook, damage our reputation or otherwise adversely affect our business. In addition, to the extent that any future security breach results in inappropriate disclosure of our employees’, licensees’, or customers’ confidential and /or personal information, we may incur liability or additional costs to remedy any damages caused by such breach.
We could also be affected by existing and proposed laws and regulations, as well as government policies and practices related to cybersecurity, privacy and data protection. For example, the European General Data Protection Regulation (“GDPR”) adopted by the European Commission became effective in May 2018, and China adopted a new cybersecurity law as of June 2017. Complying with the GDPR and other existing and emerging and changing requirements could cause us to incur substantial costs or require us to change our business practices. Non-compliance could result in monetary penalties or significant legal liability.
If wireless handsets are perceived to pose health and safety risks, demand for products of our licensees could decrease.
Media reports and certain studies have suggested that radio frequency emissions from wireless handsets may be linked to health concerns, such as brain tumors, other malignancies and genetic damage to blood, and may interfere with electronic medical devices, such as pacemakers, telemetry and delicate medical equipment. Growing concerns over radio frequency emissions, even if unfounded, could discourage the use of wireless handsets and cause a decrease in demand for the products of our licensees. In addition, concerns over safety risks posed by the use of wireless handsets while driving and the effect of any resulting legislation could reduce demand for the products of our licensees.
22
Risks Relating to Our Common Stock and the 2020 Notes
The price of our common stock is volatile and may decline regardless of our operating performance.
Historically, we have had large fluctuations in the price of our common stock, and such fluctuations could continue.
From January 2, 2017 to February 19, 2019, the trading price of our common stock has ranged from a low of $62.34 per share to a high of $102.30 per share. The market price for our common stock is volatile and may fluctuate significantly in response to a number of factors, most of which we cannot control, including:
|
•
|
the public's response to press releases or other public announcements by us or third parties, including our filings with the SEC and announcements relating to licensing, technology development, litigation, arbitration and other legal proceedings in which we are involved and intellectual property impacting us or our business;
|
|
•
|
announcements concerning strategic transactions, such as commercial initiatives, joint ventures, strategic investments, acquisitions or divestitures;
|
|
•
|
financial projections we may provide to the public, any changes in these projections or our failure to meet these projections;
|
|
•
|
changes in GAAP, including new accounting standards that may materially affect our revenue recognition;
|
|
•
|
changes in financial estimates or ratings by any securities analysts who follow our common stock, our failure to meet these estimates or failure of those analysts to initiate or maintain coverage of our common stock;
|
|
•
|
investor perceptions as to the likelihood of achievement of near-term goals;
|
|
•
|
changes in market share of significant licensees;
|
|
•
|
changes in operating performance and stock market valuations of other wireless communications companies generally; and
|
|
•
|
market conditions or trends in our industry or the economy as a whole.
|
In the past, shareholders have instituted securities class action litigation following periods of market volatility. If we were involved in securities litigation, we could incur substantial costs and our resources and the attention of management could be diverted from our business.
Our indebtedness could adversely affect our business, financial condition and results of operations and our ability to meet our payment obligations under such indebtedness.
Our total indebtedness as of December 31, 2018 was approximately $334.4 million, inclusive of debt resulting from the Technicolor Acquisition that was completed in third quarter 2018 (refer to Note 5, "
Business Combinations
," in the consolidated financial statements for further information). This level of debt could have significant consequences on our future operations, including:
|
•
|
making it more difficult for us to meet our payment and other obligations under our 1.50% Senior Convertible Notes due 2020 (the "2020 Notes");
|
|
•
|
reducing the availability of our cash flow to fund working capital, capital expenditures, acquisitions and other general corporate purposes, and limiting our ability to obtain additional financing for these purposes;
|
|
•
|
limiting our flexibility in planning for, or reacting to, and increasing our vulnerability to, changes in our business, the industry in which we operate and the general economy; and
|
|
•
|
placing us at a competitive disadvantage compared to our competitors that have less debt or are less leveraged.
|
Any of the above-listed factors could have an adverse effect on our business, financial condition and results of operations and our ability to meet our payment obligations under the 2020 Notes.
Our ability to meet our payment and other obligations under the 2020 Notes depends on our ability to generate significant cash flow in the future. This, to some extent, is subject to general economic, financial, competitive, legislative and regulatory factors as well as other factors that are beyond our control. We cannot be certain that our business will generate cash flow from operations, or that future borrowings will be available to us, in an amount sufficient to enable us to meet our payment obligations under the 2020 Notes and to fund other liquidity needs. If we are not able to generate sufficient cash flow to service our debt obligations, we may need to refinance or restructure our debt, including the 2020 Notes, sell assets, reduce or delay capital investments, or seek to raise additional capital. If we are unable to implement one or more of these alternatives, we may not be able to meet our payment obligations under the 2020 Notes, and this default could cause us to be in default on any other currently existing or future outstanding indebtedness.
Our shareholders may not receive the level of dividends provided for in our dividend policy or any dividend at all, and any decrease in or suspension of the dividend could cause our stock price to decline.
23
Our current dividend policy contemplates the payment of a regular quarterly cash dividend of $0.35 per share on our outstanding common stock. We expect to continue to pay quarterly cash dividends on our common stock at the rate set forth in our current dividend policy. However, the dividend policy and the payment and timing of future cash dividends under the policy are subject to the final determination each quarter by our Board of Directors that (i) the dividend will be made in compliance with laws applicable to the declaration and payment of cash dividends, including Section 1551(b) of the Pennsylvania Business Corporation Law, and (ii) the policy remains in our best interests, which determination will be based on a number of factors, including our earnings, financial condition, capital resources and capital requirements, alternative uses of capital, restrictions imposed by any existing debt, economic conditions and other factors considered relevant by the Board of Directors. Given these considerations, our Board of Directors may increase or decrease the amount of the dividend at any time and may also decide to vary the timing of or suspend or discontinue the payment of cash dividends in the future. Any decrease in the amount of the dividend, or suspension or discontinuance of payment of a dividend, could cause our stock price to decline.
If securities or industry analysts fail to continue publishing research about our business, our stock price and trading volume could decline.
The trading market for our common stock is influenced by the research and reports that industry or securities analysts publish about us or our business. If one or more of these analysts cease coverage of our company or fail to publish reports on us regularly, we could lose visibility in the financial markets, which in turn could cause our stock price or trading volume to decline.
The convertible note hedge transactions and warrant transactions that we entered into in connection with the offering of the 2020 Notes may affect the value of the 2020 Notes and the market price of our common stock.
In connection with each offering of the 2020 Notes, we entered into convertible note hedge transactions with certain financial institutions (the “option counterparties”) and sold warrants to the option counterparties. These transactions will be accounted for as an adjustment to our shareholders’ equity. The convertible note hedge transactions are expected to reduce the potential equity dilution upon conversion of the 2020 Notes. The warrants will have a dilutive effect on our earnings per share to the extent that the market price of our common stock exceeds the applicable strike price of the warrants on any expiration date of the warrants.
In connection with establishing their initial hedge of these transactions, the option counterparties (and/or their affiliates) purchased our common stock in open market transactions and/or privately negotiated transactions and/or entered various cash-settled derivative transactions with respect to our common stock concurrently with, or shortly after, the pricing of the 2020 Notes. These activities could have the effect of increasing (or reducing the size of any decrease in) the price of our common stock concurrently with or following the pricing of the 2020 Notes. In addition, the option counterparties (and/or their affiliates) may modify their respective hedge positions from time to time (including during any observation period related to a conversion of the 2020 Notes) by entering into or unwinding various derivative transactions with respect to our common stock and/or by purchasing or selling our common stock in open market transactions and/or privately negotiated transactions.
The potential effect, if any, of any of these transactions and activities on the market price of our common stock will depend in part on market conditions and cannot be ascertained at this time, but any of these activities could adversely affect the market price of our common stock.
Future sales or other dilution of our equity could depress the market price of our common stock.
Sales of our common stock in the public market, or the perception that such sales could occur, could negatively impact the market price of our common stock. We also have several institutional shareholders that own significant blocks of our common stock. If one or more of these shareholders were to sell large portions of their holdings in a relatively short time, for liquidity or other reasons, the prevailing market price of our common stock could be negatively affected.
Under certain circumstances, shares of our common stock could be issued upon conversion of the 2020 Notes, which would dilute the ownership interest of our existing shareholders. In addition, the issuance of additional common stock, or issuances of securities convertible into or exercisable for our common stock or other equity linked securities, including preferred stock or warrants, would dilute the ownership interest of our common shareholders and could depress the market price of our common stock and impair our ability to raise capital through the sale of additional equity securities.
Approved stock repurchase programs may not result in a positive return of capital to shareholders.
Our board-approved stock repurchase program may not return value to shareholders because the market price of the stock may decline significantly below the levels at which we repurchased shares of stock. Stock repurchase programs are intended to deliver shareholder value over the long term, but stock price fluctuations can reduce the effectiveness of such programs.
24
Provisions of the 2020 Notes could discourage an acquisition of us by a third party.
Certain provisions of the 2020 Notes could make it more difficult or more expensive for a third party to acquire us. Upon the occurrence of certain transactions constituting a fundamental change, holders of the 2020 Notes will have the right, at their option, to require us to repurchase all of their 2020 Notes or any portion of the principal amount of such 2020 Notes in integral multiples of $1,000. We may also be required to issue additional shares upon conversion in the event of certain fundamental change transactions. These provisions could limit the price that some investors might be willing to pay in the future for shares of our common stock.
We are subject to counterparty risk with respect to the convertible note hedge transactions.
The option counterparties are financial institutions or affiliates of financial institutions, and we will be subject to the risk that the option counterparties may default under the respective convertible note hedge transactions. Our exposure to the credit risk of the option counterparties is not secured by any collateral. Recent global economic conditions have resulted in the actual or perceived failure or financial difficulties of many financial institutions. If an option counterparty becomes subject to insolvency proceedings, we will become an unsecured creditor in those proceedings with a claim equal to our exposure at that time under the convertible note hedge transactions. Our exposure will depend on many factors but, generally, the increase in our exposure will be correlated to the increase in our common stock market price and in volatility of our common stock. In addition, upon a default by an option counterparty, we may suffer adverse tax consequences and dilution with respect to our common stock. We can provide no assurance as to the financial stability or viability of the option counterparties.
The accounting method for convertible debt securities, such as the 2020 Notes, could have a material adverse effect on our reported financial results.
In May 2008, the FASB, issued ASC 470-20. Under ASC 470-20, an entity must separately account for the liability and equity components of convertible debt instruments, such as the 2020 Notes, that may be settled partially in cash upon conversion in a manner that reflects the issuer’s economic interest cost. ASC 470-20 requires the fair value of the conversion option of the 2020 Notes be reported as a component of shareholders’ equity and included in the additional paid-in-capital on our consolidated balance sheet. The value of the conversion option of the 2020 Notes will be reported as discount to the 2020 Notes. We will report lower net income in our financial results because ASC 470-20 will require interest to include both the current period’s amortization of the debt discount (non-cash interest) and the instrument’s cash interest, which could adversely affect our reported or future financial results, the trading price of our common stock and the trading price of the 2020 Notes.
|
Item 1B.
|
UNRESOLVED STAFF COMMENTS.
|
None.
|
Item 2.
|
PROPERTIES.
|
Our headquarters are located in Wilmington, Delaware, USA. Our research and development activities are conducted primarily in facilities located in Conshohocken, Pennsylvania, USA; Melville, New York, USA; Rockville, Maryland, USA; San Diego, California, USA; Princeton, New Jersey, USA; and Montreal, Quebec, Canada.
25
The following table sets forth information with respect to our principal properties:
|
Location
|
Approximate Square Feet
|
Principal Use
|
Lease Expiration Date
|
|
Melville, New York
|
44,800
|
Office and research space
|
February 2020
|
|
Wilmington, Delaware
|
36,200
|
Corporate headquarters
|
November 2022
|
|
Conshohocken, Pennsylvania
|
30,300
|
Office and research space
|
September 2026
|
|
Montreal, Quebec
|
17,300
|
Office and research space
|
June 2021
|
|
Rockville, Maryland
|
16,700
|
Office and research space
|
August 2019
|
|
San Diego, California
|
10,600
|
Office and research space
|
September 2025
|
|
Rennes, France
|
12,400
|
Office space
|
June 2019*
|
|
Princeton, New Jersey
|
16,900
|
Office and research space
|
February 2025
|
* We sublease our facility in Rennes from Thomson Licensing SAS.
We are also a party to leases for several smaller spaces, including our offices in Buffalo, New York, USA; Berlin, Germany; Brussels, Belgium; London, England, United Kingdom; Seoul, South Korea; San Francisco, California, USA; New York City, New York, USA; Indianapolis, Indiana, USA; Paris, France; and Shanghai, China, that contain research and/or office space. In addition, we own a building in Washington, District of Columbia, USA, that houses administrative office space.
We believe that the facilities described above are suitable and adequate for our present purposes and our needs in the near future.
|
Item 3.
|
LEGAL PROCEEDINGS.
|
ARBITRATIONS AND COURT PROCEEDINGS (OTHER THAN DE DISTRICT COURT ACTIONS RELATED TO USITC PROCEEDINGS)
2012 Huawei China Proceedings
On February 21, 2012, InterDigital was served with two complaints filed by Huawei Technologies Co., Ltd. in the Shenzhen Intermediate People's Court in China on December 5, 2011. The first complaint named as defendants InterDigital, Inc. and its wholly owned subsidiaries InterDigital Technology Corporation and InterDigital Communications, LLC (now InterDigital Communications, Inc.), and alleged that InterDigital had abused its dominant market position in the market for the licensing of essential patents owned by InterDigital by engaging in allegedly unlawful practices, including differentiated pricing, tying and refusal to deal. The second complaint named as defendants the Company's wholly owned subsidiaries InterDigital Technology Corporation, InterDigital Communications, LLC (now InterDigital Communications, Inc.), InterDigital Patent Holdings, Inc. and IPR Licensing, Inc. and alleged that InterDigital had failed to negotiate on FRAND terms with Huawei. Huawei asked the court to determine the FRAND rate for licensing essential Chinese patents to Huawei and also sought compensation for its costs associated with this matter.
On February 4, 2013, the Shenzhen Intermediate People's Court issued rulings in the two proceedings. With respect to the first complaint, the court decided that InterDigital had violated the Chinese Anti-Monopoly Law by (i) making proposals for royalties from Huawei that the court believed were excessive, (ii) tying the licensing of essential patents to the licensing of non-essential patents, (iii) requesting as part of its licensing proposals that Huawei provide a grant-back of certain patent rights to InterDigital and (iv) commencing a USITC action against Huawei while still in discussions with Huawei for a license. Based on these findings, the court ordered InterDigital to cease the alleged excessive pricing and alleged improper bundling of InterDigital's Chinese essential and non-essential patents, and to pay Huawei 20.0 million RMB (approximately $2.9 million based on the exchange rate as of December 31, 2018) in damages related to attorneys’ fees and other charges, without disclosing a factual basis for its determination of damages. The court dismissed Huawei's remaining allegations, including Huawei's claim that InterDigital improperly sought a worldwide license and improperly sought to bundle the licensing of essential patents on multiple generations of technologies. With respect to the second complaint, the court determined that, despite the fact that the FRAND requirement originates from ETSI's Intellectual Property Rights policy, which refers to French law, InterDigital's license offers to Huawei should be evaluated under Chinese law. Under Chinese law, the court concluded that
26
the offers did not comply with FRAND. The court further ruled that the royalties to be paid by Huawei for InterDigital's 2G, 3G and 4G essential Chinese patents under Chinese law should not exceed 0.019% of the actual sales price of each Huawei product.
On March 11, 2013, InterDigital filed notices of appeal with respect to the judgments in both proceedings, seeking reversal of the court’s February 4, 2013 rulings. On October 16, 2013, the Guangdong Province High Court issued a ruling affirming the ruling of the Shenzhen Intermediate People's Court in the second proceeding, and on October 21, 2013, issued a ruling affirming the ruling of the Shenzhen Intermediate People's Court in the first proceeding.
InterDigital believes that the decisions are seriously flawed both legally and factually. For instance, in determining a purported FRAND rate, the Chinese courts applied an incorrect economic analysis by evaluating InterDigital’s lump-sum 2007 patent license agreement with Apple (the “2007 Apple PLA”) in hindsight to posit a running royalty rate. Indeed, the ALJ in USITC Inv. No. 337-TA-800 rejected that type of improper analysis. Moreover, the Chinese courts had an incomplete record and applied incorrect facts, including with respect to the now-expired and superseded 2007 Apple PLA, which had been found in an arbitration between InterDigital and Apple to be limited in scope.
On April 14, 2014, InterDigital filed a petition for retrial of the second proceeding with the Chinese Supreme People’s Court (“SPC”), seeking dismissal of the judgment or at least a higher, market-based royalty rate for a license to InterDigital’s Chinese SEPs. The petition for retrial argues, for example, that (1) the lower court improperly determined a Chinese FRAND running royalty rate by using as a benchmark the 2007 Apple lump sum fixed payment license agreement, and looking in hindsight at the unexpectedly successful sales of Apple iPhones to construct an artificial running royalty rate that neither InterDigital nor Apple could have intended and that would have varied significantly depending on the relative success or failure in hindsight of Apple iPhone sales; (2) the 2007 Apple PLA was also an inappropriate benchmark because its scope of product coverage was significantly limited as compared to the license that the court was considering for Huawei, particularly when there are other more comparable license agreements; and (3) if the appropriate benchmarks had been used, and the court had considered the range of royalties offered by other similarly situated SEP holders in the wireless telecommunications industry, the court would have determined a FRAND royalty that was substantially higher than 0.019%, and would have found, consistent with findings of the ALJ’s initial determination in the USITC 337-TA-800 proceeding, that there was no proof that InterDigital’s offers to Huawei violated its FRAND commitments.
The SPC held a hearing on October 31, 2014, regarding whether to grant a retrial and requested that both parties provide additional information regarding the facts and legal theories underlying the case. The SPC convened a second hearing on April 1, 2015 regarding whether to grant a retrial. On December 24, 2018, InterDigital was notified that the SPC granted InterDigital’s petition for retrial of the October 16, 2013 Guangdong Province High Court decision. The SPC also issued a mediation order that terminated the proceeding. The SPC’s grant of InterDigital’s retrial petition suspends enforcement of the decision of the Guangdong High Court and, combined with the SPC’s issuance of the mediation order, effectively vacates the Guangdong High Court’s decision. There are no further proceedings in this matter.
ZTE China Proceedings
On July 10 and 11, 2014, InterDigital was served with two complaints filed by ZTE Corporation in the Shenzhen Intermediate People's Court in China on April 3, 2014. The first complaint names as defendants the Company's wholly owned subsidiaries InterDigital Technology Corporation, InterDigital Communications, Inc., InterDigital Patent Holdings, Inc. and IPR Licensing, Inc. This complaint alleges that InterDigital has failed to comply with its FRAND obligations for the licensing of its Chinese standards-essential patents. ZTE is asking the court to determine the FRAND rate for licensing InterDigital’s standards-essential Chinese patents to ZTE and also seeks compensation for its litigation costs associated with this matter. The second complaint names as defendants InterDigital, Inc. and its wholly owned subsidiaries InterDigital Technology Corporation and InterDigital Communications, Inc. This complaint alleges that InterDigital has a dominant market position in China and the United States in the market for the licensing of essential patents owned by InterDigital, and abused its dominant market position in violation of the Chinese Anti-Monopoly Law by engaging in allegedly unlawful practices, including excessively high pricing, tying, discriminatory treatment, and imposing unreasonable trading conditions. ZTE originally sought relief in the amount of 20.0 million RMB (approximately $2.9 million based on the exchange rate as of December 31, 2018), an order requiring InterDigital to cease the allegedly unlawful conduct and compensation for its litigation costs associated with this matter.
On August 7, 2014, InterDigital filed petitions challenging the jurisdiction of the Shenzhen Intermediate People's Court to hear the actions. On August 28, 2014, the court denied InterDigital’s jurisdictional challenge with respect to the anti-monopoly law case. InterDigital filed an appeal of this decision on September 26, 2014. On September 28, 2014, the court denied InterDigital’s jurisdictional challenge with respect to the FRAND case, and InterDigital filed an appeal of that decision on October 27, 2014. On December 18, 2014, the Guangdong High Court issued decisions on both appeals upholding the
27
Shenzhen Intermediate Court’s decisions that it had jurisdiction to hear these cases. On February 10, 2015, InterDigital filed a petition for retrial with the Supreme People’s Court regarding its jurisdictional challenges to both cases.
The Shenzhen Court held hearings on the anti-monopoly law case on May 11, 13, 15 and 18, 2015. At the May hearings, ZTE withdrew its claims alleging discriminatory treatment and the imposition of unfair trading conditions and increased its damages claim to 99.8 million RMB (approximately $14.5 million based on the exchange rate as of December 31, 2018). The Shenzhen Court held hearings in the FRAND case on July 29-31, 2015 and held a second hearing on the anti-monopoly law case on October 12, 2015.
On September 18, 2018, ZTE independently filed a petition with the Shenzhen Court to withdraw the complaint in its FRAND case against InterDigital, and on September 28, 2018, the Shenzhen Court granted ZTE’s petition and dismissed the FRAND case without prejudice. On October 25, 2018, ZTE independently filed a petition with the Shenzhen Court to withdraw the complaint in its anti-monopoly law case against InterDigital, and on October 26, 2018, the Shenzhen Court granted ZTE’s petition and dismissed the anti-monopoly law case without prejudice.
Asustek Actions
On April 15, 2015, Asustek Computer Incorporated (“Asus”) filed a complaint in the CA Northern District Court against InterDigital, Inc., and its subsidiaries InterDigital Communications, Inc., InterDigital Technology Corporation, IPR Licensing, Inc., and InterDigital Patent Holdings, Inc. The complaint asserted the following causes of action: violation of Section Two of the Sherman Act, violation of Section 17200 of the California Business and Professions Code, breach of contract resulting from ongoing negotiations, breach of contract leading to and resulting in the parties’ April 2008 patent license agreement (the “2008 Asus PLA”), promissory estoppel, waiver, and fraudulent inducement to contract. Among other allegations, Asus alleged that InterDigital breached its FRAND commitment. As relief, Asus sought a judgment that the 2008 Asus PLA is void or unenforceable, damages in the amount of excess royalties Asus paid under the 2008 Asus PLA plus interest, a judgment setting the proper FRAND terms and conditions for InterDigital’s patent portfolio, an order requiring InterDigital to grant Asus a license on FRAND terms and conditions, and punitive damages and other relief.
In response, on May 30, 2015, InterDigital filed an Arbitration Demand with the ICDR. InterDigital claimed that Asus breached the 2008 Asus PLA’s dispute resolution provision by filing its CA Northern District Court lawsuit and sought declaratory relief that it is not liable for any of the claims in Asus’s complaint. On June 2, 2015, InterDigital filed in the CA Northern District Court a motion to compel arbitration on each of Asus’s claims. On August 25, 2015, the court granted InterDigital’s motion for all of Asus’s claims except its claim for breach of contract resulting from ongoing negotiations. Aside from this claim, the court ruled that the issue of arbitrability should be decided by an arbitrator, and stayed the proceedings pending that determination.
Asus asserted counterclaims in the arbitration that mirrored its CA Northern District Court claims, except that it did not assert the breach of contract claim that the court determined was not arbitrable and it added a claim of violation of the Delaware Consumer Fraud Act. Asus also contended that its counterclaims were not arbitrable. InterDigital added a claim for breach of the 2008 Asus PLA’s confidentiality provision.
On July 14, 2016, Asus filed a motion to lift the stay in the CA Northern District Court proceeding along with a notice of the arbitral tribunal’s decision on arbitrability, informing the court of the arbitrators’ decision that, other than InterDigital’s breach of contract claims and Asus’s fraudulent inducement claim, no other claim or counterclaim is arbitrable. Asus then filed in the CA Northern District Court an amended complaint on August 18, 2016. This amended complaint includes all of the claims in Asus’s first CA Northern District Court complaint except fraudulent inducement and adds a claim of violation of the Delaware Consumer Fraud Act. It seeks the same relief as its first CA Northern District Court complaint, but also seeks a ruling that each of InterDigital’s patents “declared [to standards-setting organizations] to be essential or potentially essential” is unenforceable and any contracts InterDigital entered into in furtherance of its unlawful conduct are void. On September 8, 2016, InterDigital filed its answer and counterclaims to Asus’s amended complaint. It denied Asus’s claims and filed a counterclaim for declaratory judgment that Asus’s tort claims are invalid or preempted as applied under the First Amendment to the U.S. Constitution, the Patent Clause of the U.S. Constitution, and Title 35 of the U.S. Code. On September 28, 2016, Asus answered and denied InterDigital’s counterclaims.
With respect to its arbitration counterclaim for fraudulent inducement, Asus stated in its pleadings that it was seeking return of excess royalties (which totaled close to $63 million as of the August 2016 date referenced in the pleadings and had increased with additional royalty payments made by Asus since such time), plus interest, costs and attorneys’ fees. The evidentiary hearing in the arbitration was held in January 2017, and the parties presented oral closing arguments on March 22, 2017. On August 2, 2017, the arbitral tribunal issued its Final Award. The tribunal fully rejected Asus’s counterclaim, finding that InterDigital did not fraudulently induce Asus to enter into the 2008 Asus PLA. Accordingly, the tribunal dismissed Asus’s fraudulent inducement counterclaim in its entirety. The tribunal also dismissed InterDigital’s claims that Asus breached the confidentiality provisions and the dispute resolution provisions of the 2008 Asus PLA. On October 20, 2017, InterDigital and
28
Asus jointly moved to confirm both the tribunal’s Final Award and the Interim Award on Jurisdiction in the CA Northern District. The court confirmed both awards on October 25, 2017.
On April 16, 2018, InterDigital filed a motion in the CA Northern District Court proceeding for leave to amend its counterclaims to include a claim of intentional interference with contract. On June 12, 2018, the court denied this motion.
On April 17, 2018, the parties served opening expert reports in the CA Northern District Court proceeding. Asus’s damages expert contends that Asus is currently owed damages in the amount of $75.9 million based on its claims that InterDigital charged royalties inconsistent with its FRAND commitments. Those damages, which represent a substantial portion of the royalties paid by Asus through third quarter 2017, do not reflect Asus’s most recent royalty payments. Asus also seeks interest, costs and attorneys’ fees, as well as, in connection with its Sherman Act claim, treble damages.
On August 16, 2018, the parties filed motions for summary judgment in the CA Northern District Court proceeding. The parties filed oppositions on September 13, 2018 and replies on September 27, 2018, and the court held an oral argument on October 11, 2018.
On December 20, 2018, the CA Northern District Court issued an order on the parties’ motions for summary judgment. InterDigital’s motion was granted in part and denied in part, and Asus’s motion was denied in its entirety. The court: (1) granted summary judgment that Asus is judicially estopped from arguing that the 2008 Asus PLA is not FRAND compliant in light of Asus’s prior inconsistent positions; (2) denied to the extent ruled on by the court InterDigital’s motion that issue preclusion prevents Asus from re-litigating issues decided in the arbitration; (3) granted summary judgment that Asus cannot invalidate the 2008 Asus PLA on the theory that, even if FRAND when signed, the 2008 Asus PLA became non-FRAND thereafter; (4) denied InterDigital’s motion for summary judgment that Asus’s Sherman Act claim fails as a matter of law; and (5) granted summary judgment that Asus’s promissory estoppel and California UCL claims fail as a matter of law. In addition, the court denied Asus’s motion for summary judgment that, as a matter of law, InterDigital breached its contractual obligation to license its essential patents on FRAND terms and conditions by engaging in discriminatory licensing practices. On December 21, 2018, the court referred the case to a magistrate judge for a settlement conference. The settlement conference was held on February 14, 2019. A settlement was not reached. The trial in the CA Northern District Court proceeding is scheduled for May 6-17, 2019.
The Company has not recorded any accrual at December 31, 2018, for contingent losses associated with the CA Northern District Court Proceeding. While a material loss is reasonably possible, the Company cannot estimate the potential range of loss given the range of possible outcomes, as this matter is not at a sufficiently advanced stage to allow for such an estimate.
2019 Huawei China Proceeding
On January 3, 2019, InterDigital was notified that a civil complaint was filed on January 2, 2019, by Huawei Technologies Co., Ltd. and certain of its subsidiaries against InterDigital, Inc. and certain of its subsidiaries in the Shenzhen Intermediate People’s Court. The complaint seeks a ruling that the InterDigital defendants have violated an obligation to license their patents that are essential to 3G, 4G and 5G wireless telecommunication standards on fair, reasonable and non-discriminatory terms and conditions. The complaint also seeks a determination of the terms for licensing all of the InterDigital defendants’ Chinese patents that are essential to 3G, 4G and 5G wireless telecommunication standards to the Huawei plaintiffs for the plaintiffs’ wireless terminal unit products made and/or sold in China from 2019 to 2023. InterDigital’s patent license agreement with Huawei expired on December 31, 2018.
REGULATORY PROCEEDING
Investigation by National Development and Reform Commission of China
On September 23, 2013, counsel for InterDigital was informed by China’s National Development and Reform Commission (“NDRC”) that the NDRC had initiated a formal investigation into whether InterDigital has violated China’s Anti-Monopoly Law (“AML”) with respect to practices related to the licensing of InterDigital’s standards-essential patents to Chinese companies. Companies found to violate the AML may be subject to a cease and desist order, fines and disgorgement of any illegal gains. On March 3, 2014, the Company submitted to NDRC, pursuant to a procedure set out in the AML, a formal application for suspension of the investigation that included proposed commitments by the Company. On May 22, 2014, NDRC formally suspended its investigation of the Company based on the commitments proposed by the Company. The Company’s commitments with respect to the licensing of its patent portfolio for wireless mobile standards to Chinese manufacturers of cellular terminal units (“Chinese Manufacturers”) are as follows:
|
1.
|
Whenever InterDigital engages with a Chinese Manufacturer to license InterDigital’s patent portfolio for 2G, 3G and 4G wireless mobile standards, InterDigital will offer such Chinese Manufacturer the option of taking
|
29
a worldwide portfolio license of only its standards-essential wireless patents, and comply with F/RAND principles when negotiating and entering into such licensing agreements with Chinese Manufacturers.
|
2.
|
As part of its licensing offer, InterDigital will not require that a Chinese Manufacturer agree to a royalty-free, reciprocal cross-license of such Chinese Manufacturer's similarly categorized standards-essential wireless patents.
|
|
3.
|
Prior to commencing any action against a Chinese Manufacturer in which InterDigital may seek exclusionary or injunctive relief for the infringement of any of its wireless standards-essential patents, InterDigital will offer such Chinese Manufacturer the option to enter into expedited binding arbitration under fair and reasonable procedures to resolve the royalty rate and other terms of a worldwide license under InterDigital's wireless standards-essential patents. If the Chinese Manufacturer accepts InterDigital's binding arbitration offer or otherwise enters into an agreement with InterDigital on a binding arbitration mechanism, InterDigital will, in accordance with the terms of the arbitration agreement and patent license agreement, refrain from seeking exclusionary or injunctive relief against such company.
|
The commitments contained in item 3 above will expire five years from the effective date of the suspension of the investigation, or May 22, 2019. With the consolidation of China’s antimonopoly enforcement authorities into the State Administration for Market Regulation ("SAMR") in April 2018, SAMR is now responsible for overseeing InterDigital’s commitments
.
USITC PROCEEDINGS AND RELATED DELAWARE DISTRICT COURT PROCEEDINGS
2013 USITC Proceeding (337-TA-868) and Related ZTE Delaware District Court Proceeding
USITC Proceeding (337-TA-868)
On January 2, 2013, the Company’s wholly owned subsidiaries InterDigital Communications, Inc., InterDigital Technology Corporation, IPR Licensing, Inc. and InterDigital Holdings, Inc. filed a complaint with the United States International Trade Commission (the “USITC” or “Commission”) against Samsung Electronics Co., Ltd., Samsung Electronics America, Inc. and Samsung Telecommunications America, LLC, Nokia Corporation and Nokia Inc., Huawei Technologies Co., Ltd., Huawei Device USA, Inc. and FutureWei Technologies, Inc. d/b/a Huawei Technologies (USA) and ZTE Corporation and ZTE (USA) Inc. (collectively, the “337-TA-868 Respondents”), alleging violations of Section 337 of the Tariff Act of 1930 in that they engaged in unfair trade practices by selling for importation into the United States, importing into the United States and/or selling after importation into the United States certain 3G and 4G wireless devices (including WCDMA-, cdma2000- and LTE-capable mobile phones, USB sticks, mobile hotspots, laptop computers and tablets and components of such devices) that infringe one or more of up to seven of InterDigital’s U.S. patents. The complaint also extended to certain WCDMA and cdma2000 devices incorporating Wi-Fi functionality. InterDigital’s complaint with the USITC sought an exclusion order that would bar from entry into the United States infringing 3G or 4G wireless devices (and components), including LTE devices, that are imported by or on behalf of the 337-TA-868 Respondents, and also sought a cease-and-desist order to bar further sales of infringing products that have already been imported into the United States. Certain of the asserted patents were also asserted against Nokia, Huawei and ZTE in earlier pending USITC proceedings (including the Nokia, Huawei and ZTE 2011 USITC Proceeding (337-TA-800) and the Nokia 2007 USITC Proceeding (337-TA-613), as set forth below) and therefore were not asserted against those 337-TA-868 Respondents in this investigation.
On December 23, 2013, InterDigital and Huawei reached a settlement agreement to enter into binding arbitration to resolve their global patent licensing disputes. Pursuant to the settlement agreement, InterDigital and Huawei moved to dismiss all litigation matters pending between the parties except the action filed by Huawei in China to set a fair, reasonable and non-discriminatory (“FRAND”) rate for the licensing of InterDigital’s Chinese standards-essential patents (discussed above under “Huawei China Proceedings”), the decision in which InterDigital is permitted to further appeal. As a result, effective February 12, 2014, the Huawei Respondents were terminated from the 337-TA-868 investigation.
From February 10 to February 20, 2014, ALJ Essex presided over the evidentiary hearing in this investigation. The patents in issue in this investigation as of the hearing were U.S. Patent Nos. 7,190,966 (the “’966 patent”) and 7,286,847 (the “’847 patent”) asserted against ZTE and Samsung, and U.S. Patent No. 7,941,151 (the “’151 patent”) asserted against ZTE, Samsung and Nokia.
On June 3, 2014, InterDigital and Samsung filed a joint motion to terminate the investigation as to Samsung on the basis of settlement. The ALJ granted the joint motion by initial determination issued on June 9, 2014, and the USITC determined not to review the initial determination on June 30, 2014.
On June 13, 2014, the ALJ issued an Initial Determination (“ID”) in the 337-TA-868 investigation. In the ID, the ALJ found that no violation of Section 337 had occurred in connection with the importation of 3G/4G devices by ZTE or Nokia, on
30
the basis that the accused devices do not infringe asserted claims 1-6, 8-9, 16-21 or 23-24 of the ’151 patent, claims 1, 3, 6, 8, 9, or 11 of the ’966 patent, or claims 3 or 5 of the ’847 patent. The ALJ also found that claim 16 of the ’151 patent was invalid as indefinite. Among other determinations, the ALJ further determined that InterDigital did not violate any FRAND obligations, a conclusion also reached by the ALJ in the 337-TA-800 investigation, and that Respondents have engaged in patent “hold out.”
On June 30, 2014, InterDigital filed a Petition for Review with the USITC seeking review and reversal of certain of the ALJ’s conclusions in the ID. On the same day, Respondents filed a Conditional Petition for Review urging alternative grounds for affirmance of the ID’s finding that Section 337 was not violated and a Conditional Petition for Review with respect to FRAND issues.
In June 2014, Microsoft Mobile Oy (“MMO”) was added as a respondent in the investigation.
On August 14, 2014, the Commission determined to review in part the June 13, 2014 ID but terminated the investigation with a finding of no violation.
On October 10, 2014, InterDigital filed a petition for review with the U.S. Court of Appeals for the Federal Circuit (the “Federal Circuit”), appealing certain of the adverse determinations in the Commission’s August 8, 2014 final determination including those related to the ’966 and ’847 patents. On June 2, 2015, InterDigital moved to voluntarily dismiss the Federal Circuit appeal, because, even if it were to prevail, it did not believe there would be sufficient time following the court’s decision and mandate for the USITC to complete its proceedings on remand such that the accused products would be excluded before the ’966 and ’847 patents expire in June 2016. The court granted the motion and dismissed the appeal on June 18, 2015.
Related Delaware District Court Proceeding
On January 2, 2013, the Company’s wholly owned subsidiaries InterDigital Communications, Inc., InterDigital Technology Corporation, IPR Licensing, Inc. and InterDigital Holdings, Inc. filed four related district court actions in the Delaware District Court against the 337-TA-868 Respondents. The proceedings against Huawei, Samsung and Nokia were subsequently dismissed, as discussed below. The remaining complaint alleges that ZTE infringes the same patents with respect to the same products alleged in the complaint filed by InterDigital in USITC Proceeding (337-TA-868). The complaint seeks a permanent injunction and compensatory damages in an amount to be determined, as well as enhanced damages based on willful infringement, and recovery of reasonable attorneys’ fees and costs.
On January 31, 2013, ZTE filed its answer and counterclaims to InterDigital’s Delaware District Court complaint; ZTE asserted counterclaims for breach of contract, equitable estoppel, waiver of right to enjoin and declarations that InterDigital has not offered ZTE licenses on FRAND terms, declarations seeking the determination of FRAND terms and declarations of noninfringement, invalidity and unenforceability. In addition to the declaratory relief specified in its counterclaims, ZTE seeks specific performance of InterDigital's purported contracts with ZTE and standards-setting organizations, appropriate damages in an amount to be determined at trial, reasonable attorneys’ fees and such other relief as the court may deem appropriate.
On March 21, 2013, pursuant to stipulation, the Delaware District Court granted InterDigital leave to file an amended complaint against ZTE to assert allegations of infringement of the ’244 patent. On March 22, 2013, ZTE filed its answer and counterclaims to InterDigital’s amended Delaware District Court complaint. On April 9, 2013, InterDigital filed a motion to dismiss ZTE’s counterclaims relating to its FRAND allegations. On July 12, 2013, the Delaware District Court held a hearing on InterDigital’s motion to dismiss. By order issued the same day, the Delaware District Court granted InterDigital’s motion, dismissing ZTE's counterclaims for equitable estoppel and waiver of the right to injunction or exclusionary relief with prejudice. It further dismissed the counterclaims for breach of contract and declaratory relief related to InterDigital’s FRAND commitments with leave to amend.
On August 6, 2013, ZTE filed its answer and amended counterclaims for breach of contract and for declaratory judgment seeking determination of FRAND terms. The counterclaims also continue to seek declarations of noninfringement, invalidity, and unenforceability. On August 30, 2013, InterDigital filed a motion to dismiss the declaratory judgment counterclaim relating to the request for determination of FRAND terms. On May 28, 2014, the court granted InterDigital’s motion and dismissed ZTE's FRAND-related declaratory judgment counterclaim, ruling that such declaratory judgment would serve no useful purpose.
On December 30, 2013, InterDigital and Huawei filed a stipulation of dismissal on account of the confidential settlement agreement and agreement to arbitrate their disputes in this action. On the same day, the Delaware District Court granted the stipulation of dismissal and dismissed the action against Huawei.
31
On February 11, 2014, the Delaware District Court judge entered an InterDigital, Nokia, and ZTE stipulated Amended Scheduling Order that bifurcated issues relating to damages, FRAND-related affirmative defenses, and any FRAND-related counterclaims.
On August 28, 2014, the court granted in part a motion by InterDigital for summary judgment that the asserted ’151 patent is not unenforceable by reason of inequitable conduct, holding that only one of the references forming the basis of defendants’ allegations would remain in issue, and granted a motion by InterDigital for summary judgment that the asserted claims of the ’966 and ’847 patents are not invalid for lack of enablement.
On August 5, 2014, InterDigital and Samsung filed a stipulation of dismissal in light of the parties’ settlement agreement. On the same day, the court granted the stipulation of dismissal and dismissed the action against Samsung with prejudice.
By order dated August 28, 2014, MMO was joined in the case against Nokia as a defendant.
The ZTE trial addressing infringement and validity of the ’966, ’847, ’244 and ’151 patents was held from October 20 to October 27, 2014. During the trial, the judge determined that further construction of certain claim language of the ’151 patent was required, and the judge decided to hold another trial as to ZTE's infringement of the ’151 patent at a later date. On October 28, 2014, the jury returned a unanimous verdict in favor of InterDigital, finding that the ’966, ’847 and ’244 patents are all valid and infringed by ZTE 3G and 4G cellular devices. The court issued formal judgment to this effect on October 29, 2014.
On November 26, 2014, ZTE filed a motion for judgment as a matter of law that the asserted claims of the ’966, ’847 and ’244 patents are not infringed and, in the alternative, for a new trial. InterDigital filed an opposition on December 15, 2014, and ZTE filed a reply on January 7, 2015.
The ZTE trial addressing infringement of the ’151 patent was held from April 20 to April 22, 2015. On April 22, 2015, the jury returned a verdict in favor of ZTE, finding that the ’151 patent is not infringed by ZTE 3G and 4G cellular devices.
On May 29, 2015, the court entered a new scheduling order for damages and FRAND-related issues, scheduling the ZTE trial related to damages and FRAND-related issues for October 2016.
On September 14, 2015, a panel of Administrative Law Judges of the United States Patent and Trademark Office Patent Trial and Appeal Board (the “PTAB”) issued a final written decision in two Inter Partes Review (“IPR”) cases concerning the ’244 patent. These IPR proceedings were commenced on petitions filed by ZTE Corporation and ZTE (USA) Inc. and by Microsoft Corporation, respectively. Specifically, the panel determined that a number of claims of the ’244 patent are unpatentable as obvious. IPR Licensing, Inc. appealed to the Federal Circuit seeking review of the PTAB’s decision. Oral argument in the appeal was heard on April 7, 2017. On April 20, 2017, the Federal Circuit affirmed the PTAB’s decision that most of the challenged claims of the ’244 patent are unpatentable as obvious. However, the court vacated and remanded the PTAB’s obviousness finding as to claim 8, which returned the matter to the PTAB for further proceedings as to that claim. On July 28, 2017, IPR Licensing, Inc., filed a petition for a writ of certiorari with the U.S. Supreme Court seeking to appeal the Federal Circuit decision, arguing that the petition should be held pending the Supreme Court’s decision in
Oil States Energy Services, LLC v. Greene’s Energy Group, LLC
, which will determine whether the IPR process as a whole is unconstitutional. On October 2, 2017, ZTE filed a response to the petition for a writ of certiorari in which ZTE agreed that the petition should be held pending the Court’s decision in
Oil States
and then disposed of as appropriate in light of that decision. On April 24, 2018, the Supreme Court rejected the petitioner’s constitutional challenge to the IPR process in the
Oil States
case, and on April 30, 2018 denied IPR Licensing, Inc.’s July 28, 2017 petition for a writ of certiorari. On March 6, 2018, in the PTAB remand proceeding, the PTAB again found claim 8 to be invalid. On April 10, 2018, IPR Licensing, Inc. appealed to the Federal Circuit seeking review of the PTAB’s decision. That appeal (the “’244 patent PTAB remand appeal”) remains pending.
On December 21, 2015, the court entered another scheduling order that vacated the October 2016 date for the ZTE trial related to damages and FRAND-related issues as set forth in the May 2015 scheduling order.
On March 18, 2016, the court denied ZTE’s motion for judgment as a matter of law, or in the alternative for a new trial, with respect to the ’966 and ’847 patents. The court postponed its ruling on ZTE’s motion as to the ’244 patent pending the Federal Circuit’s decision on InterDigital’s appeal of the September 14, 2015 PTAB ruling and administratively closed that portion of the motion.
On April 18, 2016, ZTE filed a stipulated request for dismissal with prejudice of its counterclaims for breach of contract and patent unenforceability based on FRAND and withdrew its corresponding FRAND-related affirmative defenses.
32
The court granted this request the same day. Also on April 18, 2016, ZTE filed a motion under Federal Rule of Civil Procedure 54(b) seeking certification of partial final judgment on the claims for infringement of the ’966 and ’847 patents to allow ZTE to file an immediate appeal as to those patents. The motion was granted on June 7, 2016, and a partial final judgment was entered on June 20, 2016. On July 18, 2016, ZTE filed its notice of appeal with the Federal Circuit regarding the Delaware District Court’s judgment against ZTE with respect to the ’966 and ’847 patents. Oral argument on ZTE’s appeal was heard on October 4, 2017. On November 3, 2017, the Federal Circuit issued its decision affirming the Delaware District Court judgment finding that the ’966 and ’847 patents are not invalid and are infringed by ZTE 3G and 4G cellular devices. On December 4, 2017, ZTE filed a petition for panel rehearing of the Federal Circuit’s decision. The Federal Circuit denied ZTE’s petition on December 20, 2017, and the court’s mandate issued on December 27, 2017.
On May 15, 2017, InterDigital and Nokia/MMO filed a stipulation of dismissal of the case against MMO, Nokia Corporation and Nokia, Inc. pursuant to a Settlement Agreement and Release of Claims among InterDigital, Microsoft Corporation, Microsoft Mobile, Inc., and MMO, dated May 9, 2017, (the “Microsoft Settlement Agreement”). On May 16, 2017, the Delaware District Court granted the stipulation and dismissed the case against MMO, Nokia Corporation and Nokia, Inc. with prejudice.
The case against ZTE remains pending. On January 16, 2018, InterDigital and ZTE filed a joint status report that informed the court of the Federal Circuit’s decision regarding the ’966 and ’847 patents and that the PTAB proceedings regarding the ’244 patent remained pending. The parties jointly requested that the case remain stayed so that the portion of the case related to damages potentially owed by ZTE as to the three patents-in-suit may be coordinated. The court granted this request on January 17, 2018. The case remains stayed pending the conclusion of the 244 patent PTAB remand appeal, including any further proceeding.
2011 USITC Proceeding (337-TA-800) and Related ZTE Delaware District Court Proceeding
USITC Proceeding (337-TA-800)
On July 26, 2011, InterDigital’s wholly owned subsidiaries InterDigital Communications, LLC (now InterDigital Communications, Inc.), InterDigital Technology Corporation and IPR Licensing, Inc. filed a complaint with the USITC against Nokia Corporation and Nokia Inc., Huawei Technologies Co., Ltd. and FutureWei Technologies, Inc. d/b/a Huawei Technologies (USA) and ZTE Corporation and ZTE (USA) Inc. (collectively, the “337-TA-800 Respondents”), alleging violations of Section 337 of the Tariff Act of 1930 in that they engaged in unfair trade practices by selling for importation into the United States, importing into the United States and/or selling after importation into the United States certain 3G wireless devices (including WCDMA- and cdma2000-capable mobile phones, USB sticks, mobile hotspots and tablets and components of such devices) that infringe several of InterDigital’s U.S. patents. The action also extended to certain WCDMA and cdma2000 devices incorporating WiFi functionality. InterDigital’s complaint with the USITC sought an exclusion order that would bar from entry into the United States any infringing 3G wireless devices (and components) that are imported by or on behalf of the 337-TA-800 Respondents, and also sought a cease-and-desist order to bar further sales of infringing products that have already been imported into the United States. In May 2012, Huawei Device USA, Inc. was added as a 337-TA-800 Respondent.
The ALJ held an evidentiary hearing from February 12-21, 2013. The patents in issue as of the hearing were U.S. Patent Nos. 8,009,636 (the “’636 patent”), 7,706, 830 (the “’830 patent”), 7,502,406 (the “’406 patent”), 7,616,970 (the “’970 patent”), 7,706,332 (the “’332 patent”), 7,536,013 (the “’013 patent”) and 7,970,127 (the “’127 patent”). The ALJ’s Initial Determination (“ID”) issued on June 28, 2013, finding no violation because the asserted patents were not infringed and/or invalid. Among other determinations, with respect to the 337-TA-800 Respondents’ FRAND and other equitable defenses, the ALJ found that Respondents had failed to prove either that InterDigital violated any FRAND obligations, that InterDigital failed to negotiate in good faith, or that InterDigital’s licensing offers were discriminatory. The ALJ also found that InterDigital is not precluded from seeking injunctive relief based on any alleged FRAND commitments.
Petitions for review of the ID to the Commission were filed by InterDigital and the 337-TA-800 Respondents on July 15, 2013. On September 4, 2013, the Commission determined to review the ID in its entirety.
On December 19, 2013, the Commission issued its final determination. The Commission adopted, with some modification, the ALJ’s finding of no violation of Section 337 as to Nokia, Huawei, and ZTE. The Commission did not rule on any other issue, including FRAND and domestic industry, and stated that all other issues remain under review.
On December 20, 2013, InterDigital filed in the Federal Circuit a petition for review seeking reversal of the Commission’s final determination. On February 18, 2015, the Federal Circuit issued a decision affirming the USITC’s determinations that the claims of the ’830, ’636, ’406 and ’332 patents were not infringed, that the claims of the ’970 patent are invalid, and that the Respondents did not violate Section 337. On April 6, 2015, InterDigital filed a combined petition for panel
33
rehearing and rehearing e
n banc
as to the ’830 and ’636 patents. The petition was denied on May 12, 2015, and the court’s mandate issued on May 19, 2015.
Related Delaware District Court Proceeding
On July 26, 2011, the same date that InterDigital filed USITC Proceeding (337-TA-800), it filed a parallel action in the United States District Court for the District of Delaware against the 337-TA-800 Respondents alleging infringement of the same asserted patents identified in USITC Proceeding (337-TA-800). The Delaware District Court complaint seeks a permanent injunction and compensatory damages in an amount to be determined, as well as enhanced damages based on willful infringement, and recovery of reasonable attorneys' fees and costs. On September 23, 2011, the defendants in the Delaware District Court complaint filed a motion to stay the Delaware District Court action pending the parallel proceedings in the USITC. Because the USITC has instituted USITC Proceeding (337-TA-800), the defendants have a statutory right to a mandatory stay of the Delaware District Court proceeding pending a final determination in the USITC. On October 3, 2011, InterDigital amended the Delaware District Court complaint, adding LG as a defendant and adding the same additional patent that InterDigital requested be added to USITC Proceeding (337-TA-800). On October 11, 2011, the Delaware District Court granted the defendants' motion to stay. The case is currently stayed through March 11, 2019.
On January 14, 2014, InterDigital and Huawei filed a stipulation of dismissal of their disputes in this action on account of the confidential settlement agreement mentioned above. On the same day, the Delaware District Court granted the stipulation of dismissal.
On May 15, 2017, InterDigital and Nokia filed a stipulation of dismissal of their dispute pursuant to the Microsoft Settlement Agreement discussed above. On May 16, 2017, the Delaware District Court granted the stipulation and dismissed the case with prejudice with respect to Nokia Corporation and Nokia Inc.
In December 2017, InterDigital entered into a patent license agreement with LG, pursuant to which the parties agreed to terms for dismissal by InterDigital of the outstanding litigation among the parties and their affiliates. Accordingly, on December 5, 2017, InterDigital and LG filed a stipulation of dismissal of the case against LG. On the same day, the Delaware District Court granted the stipulation and dismissed the case against LG with prejudice.
The case remains pending with respect to ZTE.
OTHER
We are party to certain other disputes and legal actions in the ordinary course of business, including arbitrations and legal proceedings with licensees regarding the terms of their agreements and the negotiation thereof. We do not currently believe that these matters, even if adversely adjudicated or settled, would have a material adverse effect on our financial condition, results of operations or cash flows. None of the preceding matters have met the requirements for accrual or disclosure of a potential range as of December 31, 2018.
|
Item 4.
|
MINE SAFETY DISCLOSURES.
|
Not applicable.
34
PART II
|
Item 5.
|
MARKET FOR REGISTRANT’S COMMON EQUITY, RELATED STOCKHOLDER MATTERS AND ISSUER PURCHASES OF EQUITY SECURITIES.
|
Market Information
The NASDAQ Stock Market (“NASDAQ”) is the principal market for our common stock, which is traded under the symbol "IDCC."
Holders
As of February 19, 2019, there were 528 holders of record of our common stock.
Dividends
Cash dividends on outstanding common stock declared in
2018
and
2017
were as follows (in thousands, except per share data):
|
2018
|
Per Share
|
Total
|
Cumulative by Fiscal Year
|
||||||||
|
First quarter
|
$
|
0.35
|
|
$
|
12,124
|
|
$
|
12,124
|
|
||
|
Second quarter
|
0.35
|
|
12,192
|
|
24,316
|
|
|||||
|
Third quarter
|
0.35
|
|
11,996
|
|
36,312
|
|
|||||
|
Fourth quarter
|
0.35
|
|
11,610
|
|
47,922
|
|
|||||
|
$
|
1.40
|
|
$
|
47,922
|
|
||||||
|
2017
|
|||||||||||
|
First quarter
|
$
|
0.30
|
|
$
|
10,404
|
|
$
|
10,404
|
|
||
|
Second quarter
|
0.30
|
|
10,413
|
|
20,817
|
|
|||||
|
Third quarter
|
0.35
|
|
12,149
|
|
32,966
|
|
|||||
|
Fourth quarter
|
0.35
|
|
12,156
|
|
45,122
|
|
|||||
|
$
|
1.30
|
|
$
|
45,122
|
|
||||||
In September 2017, we announced that our Board of Directors had approved an increase in the Company’s quarterly cash dividend to $0.35 per share. We currently expect to continue to pay dividends comparable to our quarterly $0.35 per share cash dividend in the future; however, continued payment of cash dividends and changes in the Company's dividend policy will depend on the Company's earnings, financial condition, capital resources and capital requirements, alternative uses of capital, restrictions imposed by any existing debt, economic conditions and other factors considered relevant by our Board of Directors.
Performance Graph
The following graph compares five-year cumulative total returns of the Company, the NASDAQ Composite Index and the NASDAQ Telecommunications Stock Index. The graph assumes $100 was invested in the common stock of InterDigital and each index as of December 31, 2013 and that all dividends were re-invested. Such returns are based on historical results and are not intended to suggest future performance.
35
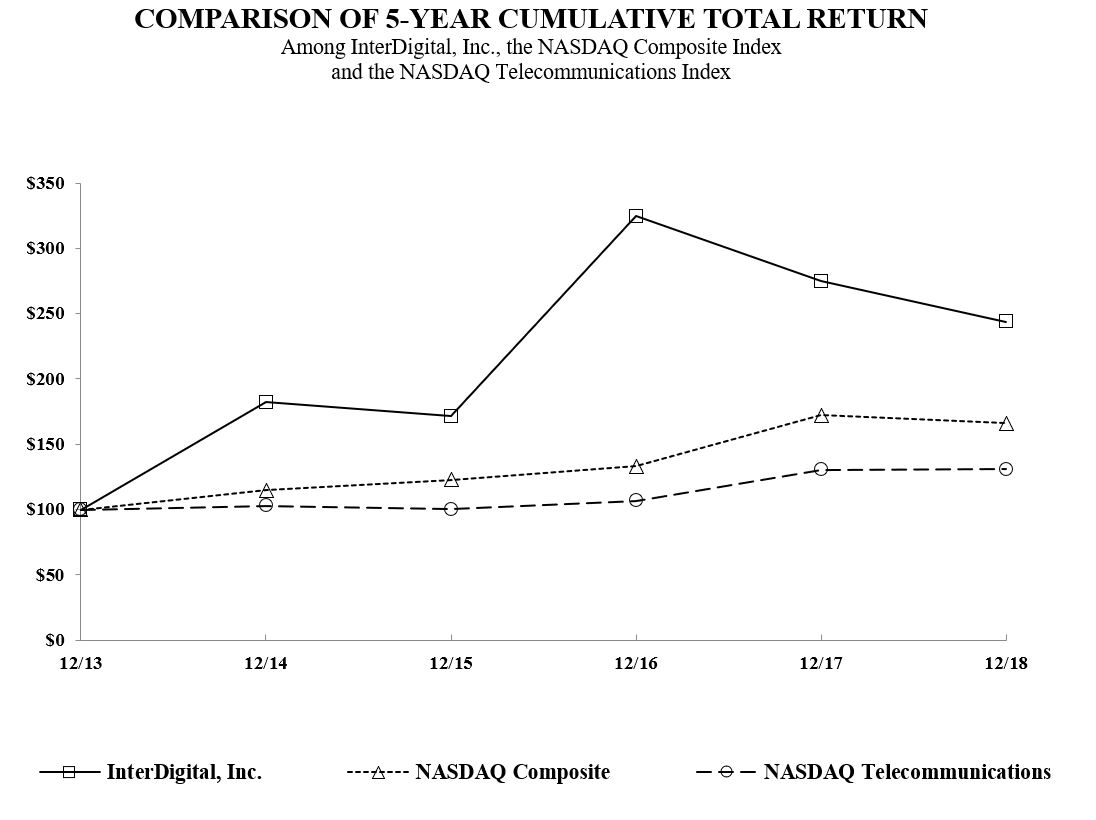
|
|
12/13
|
12/14
|
12/15
|
12/16
|
12/17
|
12/18
|
|
InterDigital, Inc.
|
100.00
|
182.23
|
171.55
|
324.52
|
274.71
|
243.89
|
|
NASDAQ Composite
|
100.00
|
114.62
|
122.81
|
133.19
|
172.11
|
165.84
|
|
NASDAQ Telecommunications
|
100.00
|
102.75
|
100.20
|
106.61
|
130.48
|
130.76
|
The above performance graph shall not be deemed "filed" for purposes of Section 18 of the Exchange Act, or incorporated by reference into any filing of InterDigital under the Securities Act of 1933, as amended, or the Exchange Act, except as shall be expressly set forth by specific reference in such filing.
Issuer Purchases of Equity Securities
Repurchase of Common Stock
The following table provides information regarding Company purchases of its common stock during fourth quarter 2018.
36
|
Period
|
Total Number of Shares (or Units) Purchased (1)
|
Average Price Paid Per Share (or Unit)
|
Total Number of Shares (or Units) Purchases as Part of Publicly Announced Plans or Programs (2)
|
Maximum Number (or Approximate Dollar Value) of Shares (or Units) That May Yet Be Purchased Under the Plans or Programs (3)
|
|||||||||
|
October 1, 2018 - October 31, 2018
|
548,510
|
|
$
|
73.35
|
|
548,510
|
|
$
|
94,835,635
|
|
|||
|
November 1, 2018 - November 30, 2018
|
114,936
|
|
$
|
70.55
|
|
114,936
|
|
$
|
86,724,726
|
|
|||
|
December 1, 2018 - December 31, 2018
|
265,942
|
|
$
|
70.08
|
|
265,942
|
|
$
|
168,082,465
|
|
|||
|
Total
|
929,388
|
|
$
|
72.07
|
|
929,388
|
|
$
|
168,082,465
|
|
|||
(1) Total number of shares purchased during each period reflects share purchase transactions that were completed (i.e., settled) during the period indicated.
(2) Shares were purchased pursuant to the Company’s $600 million share repurchase program (the “2014 Repurchase Program”), $300 million of which was authorized by the Company’s Board of Directors in June 2014, with an additional $100 million authorized by the Company’s Board of Directors in each of June 2015, September 2017, and December 2018, respectively. The 2014 Repurchase Program has no expiration date. The Company may repurchase shares under the 2014 Repurchase Program through open market purchases, pre-arranged trading plans, or privately negotiated purchases.
(3) Amounts shown in this column reflect the amounts remaining under the 2014 Repurchase Program.
|
Item 6.
|
SELECTED FINANCIAL DATA.
|
The following data should be read in conjunction with the Consolidated Financial Statements, related Notes and other financial information contained in this Form 10-K. As discussed above, we adopted new revenue guidance, ASC 606, effective January 1, 2018 using the modified retrospective method. As such, revenue and other related accounts are presented in accordance with ASC 606 for the year ended December 31, 2018 and in accordance with ASC 605 for all prior periods presented. Refer to Note 3, “
Revenue Recognition
,” within the consolidated financial statements for further information regarding our adoption of ASC 606.
37
|
2018
|
2017
|
2016
|
2015
|
2014
|
|||||||||||||||
|
|
(in thousands except per share data)
|
||||||||||||||||||
|
Consolidated statements of operations data:
|
|
|
|
|
|
|
|
|
|
|
|||||||||
|
Revenues (a)
|
$
|
307,404
|
|
$
|
532,938
|
|
$
|
665,854
|
|
$
|
441,435
|
|
$
|
415,821
|
|
||||
|
Income from operations
|
$
|
62,595
|
|
$
|
301,495
|
|
$
|
437,306
|
|
$
|
208,549
|
|
$
|
168,960
|
|
||||
|
Income tax benefit (provision) (b)
|
$
|
27,417
|
|
$
|
(121,676
|
)
|
$
|
(116,791
|
)
|
$
|
(64,621
|
)
|
$
|
(52,108
|
)
|
||||
|
Net income applicable to InterDigital, Inc. common shareholders
|
$
|
63,868
|
|
$
|
174,293
|
|
$
|
309,001
|
|
$
|
119,225
|
|
$
|
104,342
|
|
||||
|
Net income per common share — basic
|
$
|
1.85
|
|
$
|
5.04
|
|
$
|
8.95
|
|
$
|
3.31
|
|
$
|
2.65
|
|
||||
|
Net income per common share — diluted
|
$
|
1.81
|
|
$
|
4.87
|
|
$
|
8.78
|
|
$
|
3.27
|
|
$
|
2.62
|
|
||||
|
Weighted average number of common shares outstanding — basic
|
34,491
|
|
34,605
|
|
34,526
|
|
36,048
|
|
39,420
|
|
|||||||||
|
Weighted average number of common shares outstanding — diluted
|
35,307
|
|
35,779
|
|
35,189
|
|
36,463
|
|
39,879
|
|
|||||||||
|
Cash dividends declared per common share (c)
|
$
|
1.40
|
|
$
|
1.30
|
|
$
|
1.00
|
|
$
|
0.80
|
|
$
|
0.70
|
|
||||
|
Consolidated balance sheets data:
|
|
|
|
|
|
|
|
|
|||||||||||
|
Cash, cash equivalents and restricted cash (d)
|
$
|
488,733
|
|
$
|
433,014
|
|
$
|
404,074
|
|
$
|
510,207
|
|
$
|
428,567
|
|
||||
|
Short-term investments
|
470,724
|
|
724,981
|
|
548,687
|
|
423,501
|
|
275,361
|
|
|||||||||
|
Working capital
|
844,855
|
|
1,019,353
|
|
795,639
|
|
610,994
|
|
582,688
|
|
|||||||||
|
Total assets
|
1,626,558
|
|
1,854,420
|
|
1,727,853
|
|
1,474,485
|
|
1,192,962
|
|
|||||||||
|
Total debt
|
317,377
|
|
285,126
|
|
272,021
|
|
486,769
|
|
216,206
|
|
|||||||||
|
Total InterDigital, Inc. shareholders’ equity
|
927,025
|
|
855,267
|
|
739,709
|
|
510,519
|
|
468,328
|
|
|||||||||
|
Noncontrolling interest
|
10,988
|
|
17,881
|
|
14,659
|
|
11,376
|
|
7,349
|
|
|||||||||
|
Total shareholders’ equity
|
$
|
938,013
|
|
$
|
873,148
|
|
$
|
754,368
|
|
$
|
521,895
|
|
$
|
475,677
|
|
||||
|
(a)
|
In 2018, 2017, 2016, 2015, and 2014, our revenues included
$26.3 million
, $162.9 million, $309.7 million, $65.8 million, and $125.0 million of non-current patent royalties, respectively.
|
|
(b)
|
In 2018, our income tax benefit includes an $18.0 million tax benefit due to our income qualifying as foreign derived intangible income ("FDII"), as well as a $14.7 million benefit as a result of anticipated filings of amended tax returns in connection with the Competent Authority Proceeding defined and discussed below. In 2017, our income tax provision was impacted by the U.S. Tax Cuts and Jobs Act (the “TCJA”) as discussed in our results of operations. For more information, refer to Note 14, "
Taxes"
in the Notes to Financial Statements included in Part II, Item 8, of this Form 10-K. In 2016, our income tax provision included the impact of a $23.6 million net tax benefit primarily related to domestic activity production deductions for prior years. In 2014, our income tax provision included the impact of a $4.2 million net tax benefit, primarily attributable to available U.S. federal research and development tax credits for prior years, which was partially offset by an audit settlement.
|
|
(c)
|
In September 2017, we announced that our Board of Directors had approved an increase in the Company’s quarterly cash dividend to $0.35 per share. In September 2016, we announced that our Board of Directors had approved an increase in the Company’s quarterly cash dividend to $0.30 per share. In June 2014, we announced that our Board of Directors had approved a 100% increase in the Company's quarterly cash dividend, to $0.20 per share.
|
|
(d)
|
Includes restricted cash which is included within "
Prepaid and other current assets
" in the consolidated balance sheets.
|
|
Item 7.
|
MANAGEMENT’S DISCUSSION AND ANALYSIS OF FINANCIAL CONDITION AND RESULTS OF OPERATIONS.
|
OVERVIEW
The following discussion should be read in conjunction with the Selected Financial Data, the Consolidated Financial Statements and the Notes thereto contained in this Form 10-K.
Effective January 1, 2018, we adopted FASB Accounting Standards Codification 606, Revenue from Contracts with Customers ("ASC 606"), which affected our recognition of revenue from both our fixed-fee and per-unit license agreements beginning in first quarter 2018. All periods prior to January 1, 2018 are presented in accordance with ASC Topic 605, Revenue Recognition (“ASC 605”). Refer to Note 3, "
Revenue Recognition
," in the consolidated financial statements for further information regarding this adoption, as well as additional required disclosures under the new guidance.
38
Throughout the following discussion and elsewhere in this Form 10-K, we refer to “recurring revenues” and “non-current patent royalties.” For all periods presented, recurring revenues are comprised of “current patent royalties” and “current technology solutions revenue.” For 2018, non-current patent royalties are comprised of “past patent royalties” and “static fixed-fee" agreement royalties. For periods prior to 2018, non-current patent royalties are comprised of just past patent royalties, whereas static fixed-fee agreement royalties are included as part of recurring revenues.
Business
InterDigital designs and develops advanced technologies that enable and enhance wireless communications and capabilities. Since our founding in 1972, our engineers have designed and developed a wide range of innovations that are used in digital cellular and wireless products and networks, including 2G, 3G, 4G and IEEE 802-related products and networks, as well as video processing, encoding and display technology. We are a leading contributor of innovation to the wireless communications industry, as well as a leading holder of patents in the video industry.
Given our long history and focus on advanced research and development, InterDigital has one of the most significant patent portfolios in the wireless and video industries. As of December 31, 2018, InterDigital's wholly owned subsidiaries held a portfolio of approximately 34,000 patents and patent applications related to a range of technologies, including the fundamental technologies that enable wireless communications, video encoding, display technology, and other areas relevant to the wireless and consumer electronics industries. In that portfolio are a number of patents and patent applications that we believe are or may be essential or may become essential to standards in cellular and other wireless communications as well as video encoding. Those wireless standards include 3G, 4G and the IEEE 802 suite of standards, as well as patents and patent applications that we believe are or may become essential to 5G standards that currently exist and are under continued development. In terms of video technology, our portfolio includes patents and applications relating to standards established by the ISO/IEC Moving Picture Expert Group (MPEG), the ITU-T Video Coding Expert Group (VCEG), the Joint Collaborative Team on Video Coding (JCT-VC) and the Joint Video Expert Team (JVET), among others.
The wireless portfolio has largely been built through internal development, supplemented by joint development projects with other companies as well as select acquisitions of patents and companies. Products incorporating our patented inventions in wireless include: mobile devices, such as cellular phones, tablets, notebook computers and wireless personal digital assistants; wireless infrastructure equipment, such as base stations; components, dongles and modules for wireless devices; and IoT devices and software platforms. The video technology portfolio largely represents patents and applications that InterDigital acquired through our purchase of Technicolor SA’s patent licensing business (the "Technicolor Acquisition"), completed in July 2018, supplemented by internal development in the area of video technology. Products incorporating our patented inventions in video include cellular phones, tablets, notebook computers, computers, televisions, gaming consoles, set-top boxes, streaming devices and other consumer electronics.
InterDigital derives revenues primarily from patent licensing, with smaller contributions from patent sales, product sales, technology solutions licensing and sales and engineering services. On January 1, 2018, we adopted the requirements of ASU No. 2014-09, "
Revenue from Contracts with Customers (Topic 606)
" ("ASC 606") using the modified retrospective method. Refer to the "
Revenue
" section below as well as Note 3, "
Revenue Recognition
," within the consolidated financial statements for further information regarding our adoption of ASC 606.
Acquisition of Technicolor's Patent Licensing Business
On July 30, 2018, we completed the Technicolor Acquisition. The final transaction includes the acquisition by InterDigital of approximately 18,000 patents and applications, across a broad range of technologies, including approximately 3,000 worldwide video coding patents and applications. Refer to Note 5, “
Business Combinations
,” within the consolidated financial statements for more information on this transaction.
Acquisition of Technicolor's Research & Innovation Unit
On February 11, 2019, we announced that we had made a binding offer to acquire the Research & Innovation ("R&I") unit of Technicolor SA. R&I is a premier research lab that conducts fundamental research into video coding, IoT and smart home, imaging sciences, AR and VR and artificial intelligence and machine learning technologies. After completing the required prior consultation with Technicolor’s works council, the companies expect to execute a definitive acquisition agreement, the terms of which have been negotiated. The transaction is expected to close in mid-2019, subject to customary closing conditions.
As consideration for the acquisition, the parties have agreed to terminate the jointly-funded R&D collaboration that was entered into as part of the Technicolor Acquisition. In addition, Technicolor has agreed to reduce its rights to a revenue-sharing arrangement announced as part of the Technicolor Acquisition. There is no cash consideration.
39
Revenue
As discussed above, we adopted new revenue guidance, ASC 606, effective January 1, 2018 using the modified retrospective method. This resulted in a cumulative adjustment of $161.3 million to retained earnings. Consistent with the modified retrospective adoption method, our results of operations for periods prior to our adoption of ASC 606 remain unchanged. As such, revenue is presented in accordance with ASC 606 for the year ended December 31, 2018 and in accordance with ASC 605 for all prior periods presented. Refer to Note 3, “
Revenue Recognition
,” within the consolidated financial statements for further information regarding our adoption of ASC 606.
The adoption of the new guidance affected our recognition of revenue from both our fixed-fee and per-unit license agreements. For accounting purposes under this new guidance, we separate our fixed-fee license agreements into two categories: (i) those agreements that provide rights, over the term of the license, to future technologies that are highly interdependent or highly interrelated to the technologies provided at the inception of the agreement (“Dynamic Fixed-Fee Agreements”) and (ii) those agreements that do not provide for rights to such future technologies (“Static Fixed-Fee Agreements”). As a result of our adoption of the new guidance, we will continue to recognize revenue from Dynamic Fixed-Fee Agreements on a straight-line basis over the term of the related license agreement, while we expect to recognize most or all of the revenue from Static Fixed-Fee Agreements in the quarter the license agreement is signed. We will not recognize any ongoing revenue from Static Fixed-Fee Agreements already in existence at the time the guidance was adopted. Additionally, in the event a significant financing component is determined to exist in any of our agreements, we will recognize more or less revenue and corresponding interest expense or income, as appropriate.
In addition, under our previous accounting practices, we recognized revenue from our per-unit license agreements in the period in which we received the related royalty report, generally one quarter in arrears from the period in which the underlying sales occurred (i.e. on a "quarter-lag"). We are now required to record per-unit royalty revenue in the same period in which the licensee’s underlying sales occur. Because we generally do not receive the per-unit licensee royalty reports for sales during a given quarter within the time frame necessary to adequately review the reports and include the actual amounts in our quarterly results for such quarter, we accrue the related revenue based on estimates of our licensees’ underlying sales, subject to certain constraints on our ability to estimate such amounts. As a result of accruing revenue for the quarter based on such estimates, adjustments will be required in the following quarter to true-up revenue to the actual amounts reported by our licensees. In addition, to the extent we receive non-refundable prepayments related to per-unit license agreements that do not provide rights over the term of the license to future technologies that are highly interdependent or highly interrelated to the technologies provided at the inception of the agreement, we will recognize such prepayments as revenue in the period in which all remaining revenue recognition criteria have been met.
In
2018
,
2017
, and
2016
, our total revenues were
$307.4 million
,
$532.9 million
and
$665.9 million
, respectively. Our recurring revenues in
2018
,
2017
and
2016
were
$280.3 million
,
$370.0 million
and
$356.2 million
, respectively. In each of the years presented, we recognized between $26.3 million and $309.7 million of non-current patent royalties as more fully discussed below. In
2018
, fixed-fee royalties accounted for approximately
85%
of our recurring revenues. These fixed-fee revenues are not affected by the related licensees’ success in the market or the general economic climate. The majority of the remaining portion of our recurring revenue was variable in nature due to the per-unit structure of the related license agreements.
Absent the adoption of ASC 606, and in accordance with ASC 605, we would have recognized
$74.7 million
of additional total revenue and
$16.7 million
less interest expense in 2018, which after taxes would have resulted in
$84.7 million
of additional net income for the year ended December 31, 2018. Refer to the "
Results of Operations
" section below for further discussion of our revenue for the periods presented herein.
New Agreements
During first quarter 2018, we entered into a multi-year, worldwide, non-exclusive, royalty-bearing patent license agreement with Kyocera Corporation. The agreement covers sales by Kyocera Corporation and its affiliates of terminal unit products designed to operate in accordance with WCDMA and LTE standards, providing Kyocera expanded coverage for products in addition to those covered under their existing license agreement with us.
Also during first quarter 2018, the Signal Trust for Wireless Innovation, or Signal Trust, established by the Company in 2013, signed a patent license agreement with a provider of telecommunications infrastructure equipment. The Signal Trust holds a patent portfolio related to cellular infrastructure, and it is a variable interest entity. Based on the terms of the trust agreement, we previously determined that we are the primary beneficiary of the Signal Trust for accounting purposes and, therefore, must consolidate the Signal Trust.
During second quarter 2018, we entered into a multi-year, worldwide, non-exclusive, royalty-bearing patent license agreement with Fujitsu Connected Technologies Limited, or FCNT. The agreement covers the sale of FCNT’s 2G, 3G and 4G terminal unit products, including LTE and LTE-Advanced products.
40
Also during second quarter 2018, we entered into a multi-year, world-wide, non-exclusive, royalty-bearing patent license agreement with a US-headquartered company. The agreement covers sales by the US company of 802.11 functionality within certain of its products.
During fourth quarter 2018, we entered into a multi-year, worldwide, non-exclusive patent license agreement with Sony (the "Sony PLA"), a global leader and technology innovator in consumer electronics, mobile communications and home appliances. In addition, we renewed our joint venture with Sony, Convida Wireless, and sharpened its focus on 5G, including IoT and infrastructure research. The Sony PLA covers the sale by Sony of covered products for the three-year period that commenced on December 1, 2018. A portion of the consideration for the agreement was in the form of patents from Sony, all of which will be contributed to the Convida Wireless joint venture.
All of the agreements above, with the exception of the Signal Trust agreement, were agreements with multiple performance obligations for accounting purposes. Refer to the "
Critical Accounting Policies and Estimates
—
Revenue Recognition"
section below for details of our revenue recognition accounting policies and additional information on agreements with multiple performance obligations, as well as the estimates and methods used to determine the fair value of patents acquired.
Expiration of License Agreements
Our patent license agreements with three licensees expired in whole or in part during 2018. Collectively, these agreements accounted for $3.0 million, or approximately 1%, of our recurring revenue in 2018. Two of these patent license agreements were static fixed-fee agreements, including our patent license agreement with Huawei. Under ASC 606, the new revenue recognition rule that became effective for the Company on January 1, 2018, we did not recognize any revenues under static fixed-fee agreements in 2018. Prior to the adoption of ASC 606, we recognized $86.6 million of recurring revenue in 2017 related to the static fixed-fee agreements discussed above. Refer to Note 3, “
Revenue Recognition
,” within the consolidated financial statements for further information regarding our adoption of ASC 606.
Our patent license agreement with one licensee is scheduled to expire during 2019. This agreement accounted for $0.6 million, or less than 1%, of our revenue in 2018.
Income Tax Reform
On December 22, 2017, the Tax Cuts and Jobs Act, or TCJA, was signed into law. The TCJA significantly revised the U.S. corporate income tax regime by, among other things: lowering the U.S. corporate tax rate from 35% to 21% effective January 1, 2018; imposing a 13.1% tax rate on income that qualifies as Foreign Derived Intangible Income, or FDII; repealing the deduction for domestic production activities; implementing a territorial tax system; and imposing a repatriation tax on deemed repatriated earnings of foreign subsidiaries. The Company is continually monitoring IRS regulations and guidance on tax reform, specifically as it relates to income that qualifies for the favorable FDII rate. GAAP requires that the impact of tax legislation be recognized in the period in which the law was enacted.
As a result of the TCJA, we recorded a tax benefit of $18.0 million in 2018 due to our income qualifying for the favorable FDII rate. During 2017, we recorded a tax charge of $42.6 million due to a re-measurement of deferred tax assets and liabilities. On a go-forward basis, we expect a significant portion of our income to qualify as FDII and thus be subject to the 13.1% tax rate.
Cash and Short-Term Investments
As of
December 31, 2018
, we had
$1.0 billion
of cash, restricted cash and short-term investments and up to an additional
$642.2 million
of payments due under signed agreements, including
$35.0 million
recorded in accounts receivable which includes estimates related to our fourth quarter 2018 variable patent royalty revenue. A portion of our cash and short-term investments include fixed royalty payments we have received related to revenue we will record in the future. As a result, our future cash receipts from existing licenses subject to fixed patent royalties will be lower than if the royalty payments were structured to coincide with the underlying sales. During
2018
, we recorded
$325.4 million
of cash receipts related to patent licensing and technology solutions agreements as follows (in thousands):
|
|
Cash In
|
||
|
Patent royalties
|
$
|
322,835
|
|
|
Technology solutions
|
2,537
|
|
|
|
|
$
|
325,372
|
|
As of December 31, 2018, approximately
$267.0 million
of our
$269.3 million
deferred revenue balance as of December 31, 2018 related to dynamic fixed-fee royalty payments that were scheduled to amortize as follows (in thousands):
41
|
2019
|
$
|
110,314
|
|
|
2020
|
70,896
|
|
|
|
2021
|
70,179
|
|
|
|
2022
|
15,589
|
|
|
|
2023
|
—
|
|
|
|
Thereafter
|
—
|
|
|
|
$
|
266,978
|
|
|
Refer to "
New Accounting Guidance
" below for a discussion regarding our adoption of ASC 606 effective January 1, 2018.
Repurchase of Common Stock
In June 2014, our Board of Directors authorized a $300 million share repurchase program (the “2014 Repurchase Program”). In June 2015, September 2017 and December 2018, our Board of Directors authorized three $100 million increases to the program, respectively, bringing the total amount of the 2014 Repurchase Program to $600 million. The Company may repurchase shares under the 2014 Repurchase Program through open market purchases, pre-arranged trading plans or privately negotiated purchases.
The table below sets forth the total number of shares repurchased and the dollar value of shares repurchased under the 2014 Repurchase Program, in thousands. As of December 31, 2018, there was approximately $168.1 million remaining under the stock repurchase authorization.
|
2014 Repurchase Program
|
|||||||
|
# of Shares
|
Value
|
||||||
|
2018
|
1,478
|
|
$
|
110,505
|
|
||
|
2017
|
|
107
|
|
$
|
7,693
|
|
|
|
2016
|
|
1,304
|
|
64,685
|
|
||
|
2015
|
|
1,836
|
|
96,410
|
|
||
|
2014
|
3,554
|
|
152,625
|
|
|||
|
Total
|
|
8,279
|
|
|
$
|
431,918
|
|
Intellectual Property Rights Enforcement
If we believe a party is required to license our patents in order to manufacture, use and/or sell certain products and such party refuses to do so, we may agree with such party to have royalty rates, or other terms, set by third party adjudicators (such as arbitrators) or, in certain circumstances, we may institute legal action against them to enforce our patent rights. This legal action has typically taken the form of a patent infringement lawsuit or an administrative proceeding. In addition, we and our licensees, in the normal course of business, might seek to resolve disagreements as to the rights and obligations of the parties under the applicable license agreement through arbitration or litigation.
In
2018
, our intellectual property enforcement costs increased to
$17.6 million
from
$15.2 million
and
$16.5 million
in
2017
and
2016
, respectively. These costs represented
14%
of our total patent administration and licensing costs of
$124.1 million
in 2018. Intellectual property enforcement costs will vary depending upon activity levels, and it is likely they will continue to be a significant expense for us in the future.
Comparability of Financial Results
When comparing our
2018
financial results against the financial results of other periods, the following items should be taken into consideration:
|
•
|
absent the adoption of ASC 606, we would have recognized
$74.7 million
of additional revenue and
$16.7 million
less interest expense in 2018, which after taxes would have resulted in
$84.7 million
of additional net income for the year;
|
|
•
|
the Technicolor Acquisition, which closed on July 30, 2018, contributed
$4.5 million
to our 2018 revenue and $34.0 million to our 2018 operating expenses, including
$17.8 million
of one-time transaction-related and integration costs;
|
42
|
•
|
we recorded an aggregate $8.4 million loss in 2018 related to the sale of our entire ownership interest in one of our strategic investments and the impairment of a separate strategic investment; and
|
|
•
|
our
2018
income tax benefit includes:
|
|
◦
|
a $18.0 million tax benefit as a result of our income qualifying for the favorable FDII rate;
|
|
◦
|
a $14.7 million tax benefit as a result of anticipated filings of amended tax returns in connection with the Competent Authority Proceeding, as defined below.
|
Critical Accounting Policies and Estimates
Our consolidated financial statements are based on the selection and application of GAAP, which require us to make estimates and assumptions that affect the amounts reported in both our consolidated financial statements and the accompanying notes. Future events and their effects cannot be determined with absolute certainty. Therefore, the determination of estimates requires the exercise of judgment. Actual results could differ from these estimates and any such differences may be material to the financial statements. Our significant accounting policies are described in Note 2 to our Consolidated Financial Statements and are included in Item 8 of Part II of this Form 10-K. We believe the accounting policies that are of particular importance to
the portrayal of our financial condition and results and that may involve a higher degree of complexity and judgment in their application compared to others are those relating to revenue recognition, compensation, business combinations and goodwill, and income taxes. If different assumptions were made or different conditions existed, our financial results could have been materially different.
Revenue Recognition
On January 1, 2018, we adopted ASU No. 2014-09, "Revenue from Contracts with Customers (Topic 606)" (ASC 606) using the modified retrospective method. Refer to Note 3, "
Revenue Recognition
," within the consolidated financial statements for further information regarding our adoption of this guidance. The discussion that follows below is a description of our revenue recognition practices in effect beginning January 1, 2018 under ASC 606.
We derive the vast majority of our revenue from patent licensing. The timing and amount of revenue recognized from each licensee depends upon a variety of factors, including the specific terms of each agreement and the nature of the deliverables and obligations. Such agreements are often complex and include multiple performance obligations. These agreements can include, without limitation, performance obligations related to the settlement of past patent infringement liabilities, patent and/or know-how licensing royalties on covered products sold by licensees, access to a portfolio of technology as it exists at a point in time, and access to a portfolio of technology at a point in time along with a promises to provide any technology updates to the portfolio during the term.
All of our agreements have been accounted for under ASC 606. This guidance requires the use of a five-step model to achieve the core underlying principle that an entity should recognize revenue to depict the transfer of goods or services to customers at an amount that the entity expects to be entitled to in exchange for those goods or services. These steps include (1) identifying the contract with the customer, (2) identifying the performance obligations, (3) determining the transaction price, (4) allocating the transaction price to the performance obligations, and (5) recognizing revenue as the entity satisfies the performance obligation(s). Additionally, we have elected to utilize certain practical expedients in the application of ASC 606. In evaluating the presence of a significant financing component in our agreements, we utilize the practical expedient to exclude any contracts wherein the gap between payment by our customers and the delivery of our performance obligation is less than one year. We have also elected to utilize the practical expedient related to costs of obtaining a contract where an entity may recognize the incremental costs of obtaining a contract as an expense when incurred if the amortization period of the asset that the entity otherwise would have recognized is one year or less. Timing of revenue recognition may differ significantly from the timing of invoicing to customers. Contract assets are included in accounts receivable and represent unbilled amounts expected to be received from customers in future periods, where the revenue recognized to date (or cumulative adjustments to retained earnings in the initial period of adopting ASC 606) exceeds the amount billed, and right to payment is subject to the underlying contractual terms. Contract assets are classified as long-term assets if the payments are expected to be received more than one year from the reporting date. Contract assets due within less than twelve months of the balance sheet date are included within accounts receivable in our consolidated balance sheets. Contract assets due more than twelve months after the balance sheet date are included within other non-current assets.
Patent License Agreements
Upon signing a patent license agreement, we provide the licensee permission to use our patented inventions in specific applications. We account for patent license agreements in accordance with the guidance indicated above. Under our patent license agreements, we typically receive one or a combination of the following forms of payment as consideration for permitting our licensees to use our patented inventions in their applications and products:
Consideration for Past Patent Royalties
Consideration related to a licensee’s product sales from prior periods may result from a negotiated agreement with a licensee that utilized our patented inventions prior to signing a patent license agreement with us or from the resolution of a disagreement or arbitration with a licensee over the specific terms of an existing license agreement. We may also receive consideration for past patent royalties in connection with the settlement of patent litigation where there was no prior patent license agreement. In each of these cases, we record the consideration as revenue as prescribed by the five-step model.
Fixed-Fee Agreements
43
Fixed-fee agreements include fixed, non-refundable royalty payments that fulfill the licensee’s obligations to us under a patent license agreement for a specified time period or for the term of the agreement for specified products, under certain patents or patent claims, for sales in certain countries, or a combination thereof - in each case for a specified time period (including for the life of the patents licensed under the agreement).
Dynamic fixed-fee license agreements
contain a single performance obligation that represents ongoing access to a portfolio of technology over the license term, since our promise to transfer to the licensee access to the portfolio as it exists at inception of the license, along with promises to provide any technology updates to the portfolio during the term, are not separately identifiable. Upon entering a new agreement, we allocate the transaction price to the performance obligations delivered at signing (e.g. our existing patent portfolio) and future performance obligations (e.g. the technology updates). We use a time-based input method of progress to determine the timing of revenue recognition, and as such we recognize the future deliverables on a straight-line basis over the term of the agreement. We utilize the straight-line method as we believe that it best depicts efforts expended to develop and transfer updates to the customer evenly throughout the term of the agreement.
Static fixed-fee license agreements
are fixed-price contracts that generally do not include updates to technology we create after the inception of the license agreement or in which the customer does not stand to substantively benefit from those updates during the term. Generally, our performance obligations are satisfied at contract signing, and as such revenue is recognized at that time.
Variable Agreements
Upon entering a new variable patent license agreement, the licensee typically agrees to pay royalties or license fees on licensed products sold during the term of the agreement. We utilize the sales- or usage- based royalty exception for these agreements and recognize revenues during the contract term when the underlying sale or usage occurs. Our licensees under variable agreements provide us with quarterly royalty reports that summarize their sales of covered products and their related royalty obligations to us. We typically receive these royalty reports subsequent to the period in which our licensees’ underlying sales occurred. As a result, we are required to estimate revenues, subject to the constraint on our ability to estimate such amounts.
Technology Solutions
Technology solutions revenue consists primarily of revenue from royalty payments. We recognize revenue from royalty payments using the same methods described above under our policy for recognizing revenue from patent license agreements. Technology solutions revenues also consist of revenues from software licenses, engineering services and product sales. The nature of these contracts and timing of payments vary.
Patent Sales
Our business strategy of monetizing our intellectual property includes the sale of select patent assets. As patent sales executed under this strategy represent a component of our ongoing major or central operations and activities, we will record the related proceeds as revenue. We will recognize the revenue in accordance with the five-step model, generally upon closing of the patent sale transaction.
Agreements with Multiple Performance Obligations
During 2018, we signed four new agreements that had multiple performance obligations. Consistent with the revenue recognition policies disclosed above under ASC 606,
we (1) identified the contract with the customer, (2) identified the performance obligations, (3) determined the transaction price, (4) allocated the transaction price to the performance obligations, and (5) recognized revenue as we satisfy the performance obligations. We allocated the transaction price to each performance obligation for accounting purposes using our best estimate of the term and value. The development of a number of these inputs and assumptions in the models requires a significant amount of management judgment and is based upon a number of factors, including the assumed royalty rates, projected sales volumes, discount rate, comparable market transactions which are not directly observable and other relevant factors. Changes in any of a number of these assumptions could have had a substantial impact on the relative fair value assigned to each performance obligation for accounting purposes. These inputs and assumptions represent management's best estimates at the time of the transaction.
The impact that a five percent change in the aggregate amount allocated to past patent royalties under these agreements would have had on 2018 revenue is summarized in the following table (in thousands):
|
Change in amount allocated
|
|||||||
|
Allocation to past patent royalties
|
+5%
|
-%5
|
|||||
|
Change in Revenue
|
$
|
2,324
|
|
$
|
(2,324
|
)
|
|
Revenue from Non-financial Sources
During 2018, 2017 and 2016, our patent licensing royalties were derived from patent license agreements ("PLAs") with 66, 27 and 26 independent licensees, respectively. The number of independent licensees largely increased from 2017 to 2018 due to the Technicolor Acquisition. We recognized revenue from three, five and four PLAs in 2018, 2017 and 2016,
44
respectively, for which patents generally comprised less than one-third of the total consideration paid or due to us under those agreements. In addition, during 2018, 2017 and 2016, we recognized revenue from one PLA that was executed in 2014 in connection with a patent purchase agreement ("PPA") with the licensee. Total cash paid to our licensee under this PPA is approximately 56% of the total cash due to us under this licensee's PLA. During 2018, 2017 and 2016, approximately 3%, 4% and 3%, respectively, of our total revenue was based on the estimated fair value of the patents in the above transactions.
We estimated the fair value of the patents in the above transactions primarily by a combination of a discounted cash flow analysis (the income approach), an analysis of comparable market transactions (the market approach), and/or by quantifying the amount of money required to replace the future service capability of the assets (the cost approach). For the income approach, the inputs and assumptions used to develop these estimates were based on a market participant perspective and included estimates of projected royalties, discount rates, economic lives and income tax rates, among others. For the market approach, judgment was applied as to which market transactions were most comparable to this transaction. For the cost approach, we utilized the historical cost of assets of similar technologies to determine the estimated replacement cost, including research, development, testing and patent application fees. The development of a number of these inputs and assumptions requires a significant amount of management judgment and is based upon a number of factors, including the selection of industry comparables, assumed royalty rates, sales volumes, economic lives of the patents and other relevant factors. Changes in any of a number of these assumptions could have had a substantial impact on the fair value assigned to the patents for accounting purposes. These inputs and assumptions represent management's best estimates at the time of the transaction.
The impact that a five-percent change in the estimated aggregate value of the patents acquired would have had on 2018 revenue, patent amortization and pre-tax income is summarized in the following table (in thousands).
|
Change in estimate
|
|||||||
|
Estimated value of patents acquired in connection with PLAs
|
+5%
|
-%5
|
|||||
|
Revenue
|
$
|
526
|
|
$
|
(526
|
)
|
|
|
Less: Patent amortization
|
644
|
|
(644
|
)
|
|||
|
Pre-tax income
|
$
|
(118
|
)
|
$
|
118
|
|
|
Compensation Programs
We use a variety of compensation programs to both attract and retain employees, and to more closely align employee compensation with company performance. These programs include, but are not limited to, short-term incentive awards tied to performance goals and cash awards to inventors for filed patent applications and patent issuances, as well as stock option awards, time-based restricted stock unit (“RSU”) awards, performance-based awards and cash awards under our long-term compensation program ("LTCP") and pursuant to the terms and conditions of our Equity Plans (as defined in the consolidated financial statements). Our LTCP typically includes annual equity and cash award grants with three- to five-year vesting periods; as a result, in any one year, we are typically accounting for at least three active LTCP cycles.
The aggregate amount of performance compensation expense we record in a period, under both short-term and long-term performance compensation programs, requires the input of subjective assumptions and is a function of our estimated progress toward performance compensation goals at the beginning of the period, and our estimated progress or final assessment of progress toward performance compensation goals at the end of the period. Our estimated progress toward goals under performance equity grants is based on meeting a minimum confidence level in accordance with accounting rules for share-based compensation. Achievement rates can vary by performance cycle and from period to period, resulting in variability in our compensation expense.
If we had accrued all performance compensation cost throughout 2018 on the assumption that all plans and active cycles thereunder would be paid out at 100%, we would have recorded $4.7 million more in compensation expense in 2018 than we actually recorded.
We account for compensation costs associated with share-based transactions based on the fair value of the instruments issued. The estimated value of stock options includes assumptions around expected life, stock volatility and dividends. The expected life of our stock option awards is based on the simplified method as prescribed by Staff Accounting Bulletin Topic 14. In all periods, our policy has been to set the value of RSUs and restricted stock awards equal to the value of our underlying common stock on the date of measurement. For grants with graded vesting, we amortize the associated unrecognized compensation cost using an accelerated method. For grants that cliff vest, we amortize the associated unrecognized compensation cost on a straight-line basis over their vesting term.
45
As a result of our adoption of ASU No. 2016-09, "
Stock Compensation (Topic 718): Improvements to Employee Share-Based Payment Accounting
" in first quarter 2017, we now adjust compensation expense recognized to date in the event of canceled awards as they occur. Tax windfalls and shortfalls related to the tax effects of employee share-based compensation are included in our tax provision. On the consolidated statements of cash flows, tax windfalls and shortfalls related to employee share-based compensation awards are included within operating activities and cash paid to tax authorities for shares withheld are included within financing activities. The inclusion of windfalls and shortfalls in the tax provision could increase our earnings volatility between periods.
The below table summarizes our performance-based and other share-based compensation expense for 2018, 2017 and 2016, in thousands:
|
|
2018
|
2017
|
2016
|
||||||||
|
Short-term incentive compensation
|
$
|
13,045
|
|
$
|
13,994
|
|
$
|
20,516
|
|
||
|
Time-based awards (a)
|
5,985
|
|
6,958
|
|
7,847
|
|
|||||
|
Performance-based awards (a) (b)
|
1,415
|
|
6,883
|
|
12,812
|
|
|||||
|
Other share-based compensation
|
1,768
|
|
4,999
|
|
1,899
|
|
|||||
|
Total performance-based and other share-based compensation expense
|
$
|
22,213
|
|
$
|
32,834
|
|
$
|
43,074
|
|
||
(a) For 2018, 2017 and 2016, approximately 28%, 6%, and 2%, respectively, of the aggregate expense associated with time-based and performance-based awards related to cash awards. The increase in cash awards in 2018 is primarily related to certain cash-based executive retirement awards.
(b) Includes a charge of $0.4 million and $3.0 million in 2017 and 2016, respectively, to increase the accrual rates under our LTCP driven by the Company's success toward achieving goals for the related cycles. There were no changes to the accrual rates under our LTCP during 2018.
Business Combinations and Goodwill
Acquisitions that qualify as a business combination are accounted for using the acquisition method of accounting. The fair value of consideration transferred for an acquisition is allocated to the assets acquired and liabilities assumed based on their fair value as of the acquisition date. Goodwill is recorded as the difference, if any, between the aggregate consideration paid for an acquisition and the fair value of the net tangible and identified intangible assets acquired under a business combination.
Under the acquisition method of accounting, the Company completes valuation procedures for an acquisition to determine the fair value of the assets acquired and liabilities assumed. These valuation procedures require management to make assumptions and apply significant judgment to estimate the fair value of the assets acquired and liabilities assumed. If the estimates or assumptions used should significantly change, the resulting differences could materially affect the fair value of net assets. We estimate the fair value of the intangible assets acquired generally through a combination of a discounted cash flow analysis (the income approach) and an analysis of comparable market transactions (the market approach). For the income approach, we base the inputs and assumptions used to develop these estimates on a market participant perspective which include estimates of projected revenues, discount rates, economic lives and income tax rates, among others, all of which require significant management judgment. For the market approach, we apply judgment to identify the most comparable market transactions to the transaction. Definite-lived intangible assets, which are primarily comprised of patents, are amortized over their estimated useful lives using the straight-line method and are assessed for impairment whenever events or changes in circumstances indicate the carrying value of the asset may not be recoverable.
Goodwill is not amortized, but is reviewed for impairment annually on the first day of the fourth quarter, or when events or changes in the business environment indicate that the carrying value of a reporting unit may exceed its fair value. We first assess qualitative factors to determine whether it is more likely than not that the fair value of a reporting unit is less than its carrying amount as a basis for determining whether a quantitative goodwill impairment test is necessary. If we conclude it is more likely than not that the fair value of a reporting unit exceeds its carrying amount, we need not perform the quantitative assessment. If based on the qualitative assessment we believe it is more likely than not that the fair value of a reporting unit is less than its carrying value, a quantitative assessment test is required to be performed. This assessment requires us to compare the fair value of each reporting unit to its carrying value including allocated goodwill. We determine the fair value of our reporting units generally using a combination of the income and market approaches. If the carrying value of a reporting unit exceeds the reporting unit’s fair value, a goodwill impairment charge will be recorded for the difference up to the carrying value of goodwill.
46
Income Taxes
As discussed above, the Tax Cuts and Jobs Act, or TCJA, was signed into law on December 22, 2017. Pursuant to the Securities and Exchange Commission Staff Accounting Bulletin No. 118, Income Tax Accounting Implications of the TCJA ("SAB 118"), the SEC gave issuers a one year measurement period to finalize accounting adjustments related to the TCJA. As of December 31, 2017, the Company recorded a tax charge of approximately $42.6 million due to a re-measurement of deferred tax assets and liabilities as a provisional amount. This amount is now final as there were no material changes to the provisional amount recorded and the measurement period under SAB 118 has closed.
Income taxes are accounted for under the asset and liability method. Under this method, deferred tax assets and liabilities are recognized for the estimated future tax consequences attributable to differences between the financial statement carrying amounts of existing assets and liabilities and their respective tax bases, and operating loss and tax credit carry forwards. Deferred tax assets and liabilities are measured using enacted tax rates in effect for the year in which those temporary differences are expected to be recovered or settled. The effect on deferred tax assets and liabilities of a change in tax rates is recognized in the Consolidated Statement of Income in the period in which the change was enacted. A valuation allowance is recorded to reduce the carrying amounts of deferred tax assets if management has determined that it is more likely than not that such assets will not be realized.
In addition, the calculation of tax liabilities involves significant judgment in estimating the impact of uncertainties in the application of complex tax laws. We are subject to examinations by the U.S. IRS and other taxing jurisdictions on various tax matters, including challenges to various positions we assert in our filings. In the event that the IRS or another taxing jurisdiction levies an assessment in the future, it is possible the assessment could have a material adverse effect on our consolidated financial condition or results of operations.
The financial statement recognition of the benefit for a tax position is dependent upon the benefit being more likely than not to be sustainable upon audit by the applicable tax authority. If this threshold is met, the tax benefit is then measured and recognized at the largest amount that is greater than 50 percent likely of being realized upon ultimate settlement. In the event that the IRS or another taxing jurisdiction levies an assessment in the future, it is possible the assessment could have a material adverse effect on our consolidated financial condition or results of operations.
Between 2006 and 2018, we paid approximately
$177.5 million
in foreign taxes to foreign governments that have tax treaties with the U.S., for which we have claimed foreign tax credits against our U.S. tax obligations, and for which the tax treaty procedures are still open. It is possible that as a result of tax treaty procedures, the U.S. government may reach an agreement with the related foreign governments that will result in a partial refund of foreign taxes paid with a related reduction in our foreign tax credits. Due to foreign currency fluctuations, any such agreement could result in foreign currency gain or loss.
On July 24, 2018, the Company received notification that its request for competent authority pertaining to Article 27 (Mutual Agreement 14 Table of Contents Procedure) of the United States-Republic of Korea Income Tax Convention had been reviewed by the IRS and an agreement had been reached (the "Competent Authority Proceeding"). As a result of this agreement, the Company received refunds of
$97.4 million
, inclusive of interest. In addition, we have recorded a net tax benefit of
$14.7 million
in our full year 2018 results related to an anticipated refund the Company expects to receive as a result of amending tax returns for tax years covered by this agreement.
New Accounting Guidance
Refer to Note 2, "
Summary of Significant Accounting Policies and New Accounting Guidance
" within the consolidated financial statements for a discussion of recently issued accounting guidance.
Legal Proceedings
We are routinely involved in disputes associated with enforcement and licensing activities regarding our intellectual property, including litigations, arbitrations and other proceedings. These litigations, arbitrations and other proceedings are important means to enforce our intellectual property rights. We are a party to other disputes and legal actions not related to our intellectual property, but also arising in the ordinary course of our business. Refer to Part I, Item 3, of this Form 10-K for a description of our material legal proceedings.
FINANCIAL POSITION, LIQUIDITY AND CAPITAL RESOURCES
Our primary sources of liquidity are cash, cash equivalents and short-term investments, as well as cash generated from operations. We believe we have the ability to obtain additional liquidity through debt and equity financings. Based on our past
47
performance and current expectations, we believe our available sources of funds, including cash, cash equivalents and short-term investments and cash generated from our operations, will be sufficient to finance our operations, capital requirements, debt obligations, existing stock repurchase program and dividend program for the next twelve months.
Cash, cash equivalents, restricted cash and short-term investments
As of
December 31, 2018
and
December 31, 2017
, we had the following amounts of cash, cash equivalents, restricted cash and short-term investments (in thousands):
|
December 31, 2018
|
December 31, 2017
|
Increase /
(Decrease)
|
|||||||||
|
Cash and cash equivalents
|
$
|
475,056
|
|
$
|
433,014
|
|
$
|
42,042
|
|
||
|
Restricted cash included within prepaid and other current assets
|
13,677
|
|
—
|
|
13,677
|
|
|||||
|
Short-term investments
|
470,724
|
|
724,981
|
|
(254,257
|
)
|
|||||
|
Total cash and cash equivalents and short-term investments
|
$
|
959,457
|
|
$
|
1,157,995
|
|
$
|
(198,538
|
)
|
||
The net decrease in cash, cash equivalents, restricted cash and short-term investments was primarily attributable to cash used in financing activities of
$161.1 million
for share repurchases, dividend payments and cash payments for payroll taxes upon vesting of restricted stock units, slightly offset by proceeds received from the exercise of stock options. Additionally, cash used in investing activities of
$186.6 million
was primarily related to the Technicolor Acquisition, and capital investments for patents and fixed assets and additional long-term strategic investments further contributed to the decrease. These decreases were partially offset by
$146.8 million
of cash provided by operating activities. Refer to the sections below for further discussion of these items.
Cash flows from operations
We generated the following cash flows from our operating activities in
2018
and
2017
(in thousands):
|
|
For the Year Ended December 31,
|
||||||||||
|
2018
|
2017
|
Increase / (Decrease)
|
|||||||||
|
Cash flows provided by operating activities
|
$
|
146,792
|
|
$
|
315,800
|
|
$
|
(169,008
|
)
|
||
Our cash flows provided by operating activities are principally derived from cash receipts from patent license and technology solutions agreements offset by cash operating expenses and income tax payments. The decrease in cash flows provided by operating activities of
$169.0 million
was primarily attributable to a decrease in cash receipts of
$183.7 million
.
This decrease in cash receipts was primarily attributable to the fixed-fee payment structures for existing licensees, as well as the final cash receipts in 2017 for certain fixed-fee agreements that expired in 2018. The table below provides the significant items comprising our cash flows provided by operating activities during the years ended December 31, 2018 and 2017 (in thousands).
|
For the Year Ended December 31,
|
|||||||||||
|
|
2018
|
2017
|
Increase / (Decrease)
|
||||||||
|
Cash Receipts:
|
|||||||||||
|
Patent royalties
|
$
|
322,835
|
|
$
|
487,404
|
|
$
|
(164,569
|
)
|
||
|
Technology solutions
|
2,537
|
|
21,676
|
|
(19,139
|
)
|
|||||
|
Total cash receipts
|
$
|
325,372
|
|
$
|
509,080
|
|
$
|
(183,708
|
)
|
||
|
Cash Outflows:
|
|||||||||||
|
Cash operating expenses (a)
|
(167,728
|
)
|
(156,328
|
)
|
(11,400
|
)
|
|||||
|
Income taxes paid, net of refunds (b)
|
(16,426
|
)
|
(66,793
|
)
|
50,367
|
|
|||||
|
Total cash outflows
|
(184,154
|
)
|
(223,121
|
)
|
38,967
|
|
|||||
|
Other working capital adjustments
|
5,574
|
|
29,841
|
|
(24,267
|
)
|
|||||
|
Cash flows provided by operating activities
|
$
|
146,792
|
|
$
|
315,800
|
|
$
|
(169,008
|
)
|
||
(a) Cash operating expenses include operating expenses less depreciation of fixed assets, amortization of patents, non-cash compensation and non-cash changes in fair value.
48
(b) Income taxes paid include foreign withholding taxes. For the year ended December 31, 2018, this amount includes a net cash benefit of $17.5 million related to the Competent Authority Proceeding discussed further above and within Note 14, "
Income Taxes
," in the consolidated financial statements.
Working capital
We believe that working capital, adjusted to exclude cash, cash equivalents, restricted cash and short-term investments and to include current deferred revenue provides additional information about non-cash assets and liabilities that might affect our near-term liquidity. While we believe cash and short-term investments are important measures of our liquidity, the remaining components of our current assets and current liabilities, with the exception of deferred revenue, could affect our near-term liquidity and/or cash flow. We have no material obligations associated with our deferred revenue, and the amortization of deferred revenue has no impact on our future liquidity and/or cash flow. Our adjusted working capital, a non-GAAP financial measure, reconciles to working capital, the most directly comparable GAAP financial measure, at
December 31, 2018
and
December 31, 2017
(in thousands) as follows:
|
For the Year Ended December 31,
|
|||||||||||
|
|
2018
|
2017
|
Increase / (Decrease)
|
||||||||
|
Current assets
|
$
|
1,024,250
|
|
$
|
1,395,794
|
|
$
|
(371,544
|
)
|
||
|
Less
: current liabilities
|
179,395
|
|
376,441
|
|
(197,046
|
)
|
|||||
|
Working capital
|
844,855
|
|
1,019,353
|
|
(174,498
|
)
|
|||||
|
Subtract:
|
|
|
|
||||||||
|
Cash and cash equivalents
|
475,056
|
|
433,014
|
|
42,042
|
|
|||||
|
Restricted cash
|
13,677
|
|
—
|
|
13,677
|
|
|||||
|
Short-term investments
|
470,724
|
|
724,981
|
|
(254,257
|
)
|
|||||
|
Add:
|
|||||||||||
|
Current deferred revenue
|
111,672
|
|
307,142
|
|
(195,470
|
)
|
|||||
|
Adjusted working capital
|
$
|
(2,930
|
)
|
$
|
168,500
|
|
$
|
(171,430
|
)
|
||
The
$171.4 million
net decrease in adjusted working capital in
2018
compared to
2017
is primarily attributable to a decrease in accounts receivable with an offset to deferred revenue as a result of our adoption of ASC 606. Refer to Note 3, "
Revenue Recognition
," in the consolidated financial statements for more information on this adoption.
Cash used in or provided by investing and financing activities
Net cash provided by investing activities was
$70.0 million
in 2018, and net cash used in investing was
$220.3 million
in 2017. We sold
$256.6 million
, net of purchases, of short-term marketable securities in
2018
, compared to purchases of
$178.7 million
, net of sales, in
2017
. We applied a substantial portion of the proceeds from our sale of short-term marketable securities toward the
$143.0 million
of cash paid, net of cash acquired, for the Technicolor Acquisition during the year ended December 31, 2018. Long-term investments increased by $2.1 million due to an increase in strategic investment activity.
Net cash used in financing activities for 2018 was
$161.1 million
, a
$94.5 million
change from
$66.6 million
in 2017. This change was primarily attributable to a
$102.8 million
increase in repurchases of common stock and a
$5.2 million
increase in dividends paid. The increase in dividend payments was attributable to the September 2017 increase in the Company’s regular quarterly cash dividend, from $0.30 per share to $0.35 per share. These increases in cash used in financing activities were partially offset by a
$14.0 million
decrease in payroll taxes upon the vesting of restricted stock units and a
$6.3 million
increase in net proceeds from the exercise of stock options. The decrease in payroll taxes was driven by both a greater number of restricted stock units vested and a higher share price on their vesting date in 2017 as compared to restricted stock unit vestings in 2018.
Other
Our combined short-term and long-term deferred revenue balance at
December 31, 2018
was approximately
$269.3 million
, a
decrease
of
$347.5 million
from
December 31, 2017
. The decrease was primarily due to our adoption of ASC 606. Refer to Note 3, "
Revenue Recognition
," in the consolidated financial statements for more information.
Based on current license agreements, we expect the amortization of dynamic fixed-fee royalty payments to reduce the December 31, 2018 deferred revenue balance of
$269.3 million
by
$110.3 million
over the next twelve months.
49
Convertible Notes
Our 1.50% Senior Convertible Notes due 2020 (the "2020 Notes") are included in the dilutive earnings per share calculation using the treasury stock method. Under the treasury stock method, we must calculate the number of shares of common stock issuable under the terms of the 2020 Notes based on the average market price of our common stock during the applicable reporting period, and include that number in the total diluted shares figure for the period. At the time we issued the 2020 Notes, we entered into convertible note hedge and warrant agreements that together were designed to have the economic effect of reducing the net number of shares that will be issued in the event of conversion of the 2020 Notes by, in effect, increasing the conversion price of the 2020 Notes from our economic standpoint. However, under GAAP, since the impact of the convertible note hedge agreements is anti-dilutive, we exclude from the calculation of fully diluted shares the number of shares of our common stock that we would receive from the counterparties to these agreements upon settlement.
During periods in which the average market price of the Company's common stock is above the applicable conversion price of the 2020 Notes ($71.17 per share as of December 31, 2018) or above the strike price of the warrants ($86.99 per share as of December 31, 2018), the impact of conversion or exercise, as applicable, would be dilutive and such dilutive effect is reflected in diluted earnings per share. As a result, in periods where the average market price of the Company's common stock is above the conversion price or strike price, as applicable, under the treasury stock method, the Company calculates the number of shares issuable under the terms of the 2020 Notes and the warrants based on the average market price of the stock during the period, and includes that number in the total diluted shares outstanding for the period.
Under the treasury stock method, changes in the price per share of our common stock can have a significant impact on the number of shares that we must include in the fully diluted earnings per share calculation. As described in Note 10, "
Obligations,
" it is our current intent and policy to settle all conversions of the 2020 Notes through a combination settlement of cash and shares of common stock, with a specified dollar amount of $1,000 per $1,000 principal amount of the 2020 Notes and any remaining amounts in shares ("net share settlement"). Assuming net share settlement upon conversion, the following table illustrates how, based on the $316.0 million aggregate principal amount of 2020 Notes outstanding as of December 31, 2018 and the approximately 4.4 million warrants outstanding as of the same date, changes in our stock price would affect (i) the number of shares issuable upon conversion of the 2020 Notes, (ii) the number of shares issuable upon exercise of the warrants subject to the warrant agreements, (iii) the number of additional shares deemed outstanding with respect to the 2020 Notes, after applying the treasury stock method, for purposes of calculating diluted earnings per share ("Total Treasury Stock Method Incremental Shares"), (iv) the number of shares of common stock deliverable to us upon settlement of the hedge agreements and (v) the number of shares issuable upon concurrent conversion of the 2020 Notes, exercise of the warrants and settlement of the convertible note hedge agreements:
|
Market Price Per Share
|
Shares Issuable Upon Conversion of 2020 Notes
|
Shares Issuable Upon Exercise of Warrants
|
Total Treasury Stock Method Incremental Shares
|
Shares Deliverable to InterDigital upon Settlement of the Hedge Agreements
|
Incremental Shares Issuable
(a)
|
|
(Shares in thousands)
|
|||||
|
$70
|
—
|
—
|
—
|
—
|
—
|
|
$75
|
227
|
—
|
227
|
(227)
|
—
|
|
$80
|
490
|
—
|
490
|
(490)
|
—
|
|
$85
|
722
|
—
|
722
|
(722)
|
—
|
|
$90
|
929
|
149
|
1,078
|
(929)
|
149
|
|
$95
|
1,114
|
374
|
1,488
|
(1,114)
|
374
|
|
$100
|
1,280
|
578
|
1,858
|
(1,280)
|
578
|
|
$105
|
1,430
|
762
|
2,192
|
(1,430)
|
762
|
|
$110
|
1,567
|
929
|
2,496
|
(1,567)
|
929
|
|
$115
|
1,692
|
1,082
|
2,774
|
(1,692)
|
1,082
|
|
$120
|
1,807
|
1,221
|
3,028
|
(1,807)
|
1,221
|
(a) Represents incremental shares issuable upon concurrent conversion of convertible notes, exercise of warrants and settlement of the hedge agreements.
50
Contractual Obligations
On March 11, 2015, InterDigital entered into an indenture, by and between the Company and The Bank of New York Mellon Trust Company, N.A., as trustee, pursuant to which the 2020 Notes were issued. The 2020 Notes bear interest at a rate of 1.50% per year, payable in cash on March 1 and September 1 of each year, commencing September 1, 2015, and mature on March 1, 2020, unless earlier converted or repurchased.
For more information on the 2020 Notes, see Note 10, “
Obligations
,” in the Notes to Consolidated Financial Statements included in Part II, Item 8, of this Form 10-K.
The following table summarizes our contractual obligations as of
December 31, 2018
(in thousands):
|
|
Payments Due by Period
|
||||||||||||||||||
|
Total
|
Less Than
1 year
|
1-3 Years
|
3-5 Years
|
Thereafter
|
|||||||||||||||
|
2020 Notes
|
$
|
316,000
|
|
$
|
—
|
|
$
|
316,000
|
|
$
|
—
|
|
$
|
—
|
|
||||
|
Contractual interest payments on the 2020 Notes
|
5,530
|
|
4,740
|
|
790
|
|
—
|
|
—
|
|
|||||||||
|
Operating lease obligations
|
22,317
|
|
5,362
|
|
6,269
|
|
5,104
|
|
5,582
|
|
|||||||||
|
Purchase obligations (a)
|
35,917
|
|
25,655
|
|
10,262
|
|
—
|
|
—
|
|
|||||||||
|
Total contractual obligations
|
$
|
379,764
|
|
$
|
35,757
|
|
$
|
333,321
|
|
$
|
5,104
|
|
$
|
5,582
|
|
||||
|
(a)
|
Purchase obligations consist of agreements to purchase goods and services that are legally binding on us, as well as accounts payable. Our consolidated balance sheet as of December 31, 2018 includes a
$4.4 million
noncurrent liability for uncertain tax positions. The future payments related to uncertain tax positions have not been presented in the table above due to the uncertainty of the amounts and timing of cash settlement with the taxing authorities.
|
As of December 31, 2018, we have recorded a contingent consideration liability as well as long-term debt of
$19.8 million
and
$18.4 million
, respectively, related to the Technicolor Acquisition that closed in third quarter 2018. Additionally, as part of the Technicolor Acquisition, we committed to contributing cash, subject to certain requirements, of up to a maximum of
$25.0 million
to fund a collaborative arrangement related to the transaction. Refer to Note 5, "
Business Combinations
," in the consolidated financial statements for further information. Due to the uncertainty regarding the timing and amount of future payments related to these liabilities and funding commitment, these amounts are excluded from the contractual obligations table above.
Off-Balance Sheet Arrangements
We do not have any off-balance sheet arrangements as defined by Item 303(a)(4) of Regulation S-K.
RESULTS OF OPERATIONS
2018 Compared with 2017
Revenues
The following table compares
2018
revenues to
2017
revenues (in thousands). Amounts below for the year ended December 31, 2018 are presented in accordance with ASC 606 and amounts below for the year ended December 31, 2017 are presented in accordance with ASC 605.
51
|
For the Year Ended December 31,
|
Components of
Increase/(Decrease)
|
|||||||||||||||||||||||
|
|
2018
|
2017
|
Total Increase/(Decrease)
|
Due to ASC 606
|
Operational
|
Total
|
||||||||||||||||||
|
Variable patent royalty revenue
|
$
|
36,384
|
|
$
|
47,840
|
|
$
|
(11,456
|
)
|
(24
|
)%
|
$
|
(461
|
)
|
$
|
(10,995
|
)
|
$
|
(11,456
|
)
|
||||
|
Fixed-fee royalty revenue
|
239,347
|
|
301,628
|
|
(62,281
|
)
|
(21
|
)%
|
(79,341
|
)
|
17,060
|
|
(62,281
|
)
|
||||||||||
|
Current patent royalties
a
|
275,731
|
|
349,468
|
|
(73,737
|
)
|
(21
|
)%
|
(79,802
|
)
|
6,065
|
|
(73,737
|
)
|
||||||||||
|
Non-current patent royalties
b
|
26,329
|
|
162,890
|
|
(136,561
|
)
|
(84
|
)%
|
10,000
|
|
(146,561
|
)
|
(136,561
|
)
|
||||||||||
|
Total patent royalties
|
302,060
|
|
512,358
|
|
(210,298
|
)
|
(41
|
)%
|
(69,802
|
)
|
(140,496
|
)
|
(210,298
|
)
|
||||||||||
|
Current technology solutions revenue
a
|
4,594
|
|
20,580
|
|
(15,986
|
)
|
(78
|
)%
|
(4,907
|
)
|
(11,079
|
)
|
(15,986
|
)
|
||||||||||
|
Patent sales
|
750
|
|
—
|
|
750
|
|
—
|
%
|
—
|
|
750
|
|
750
|
|
||||||||||
|
Total revenue
|
$
|
307,404
|
|
$
|
532,938
|
|
$
|
(225,534
|
)
|
(42
|
)%
|
$
|
(74,709
|
)
|
$
|
(150,825
|
)
|
$
|
(225,534
|
)
|
||||
(a)
Recurring revenues consist of current patent royalties, inclusive of Dynamic Fixed-Fee Agreement royalties, and current technology solutions revenue.
(b)
Non-current patent royalties for the year ended December 31, 2018 consist of past patent royalties and royalties from static agreements. For the year ended December 31, 2017, non-current royalties consist of past patent royalties.
As discussed above, we adopted new revenue guidance, ASC 606, effective January 1, 2018. Consistent with the modified retrospective adoption method, our results of operations for periods prior to our adoption of ASC 606 remain unchanged. As a result, the difference in accounting principles attributable to the adoption of ASC 606 accounted for
$74.7 million
of the decrease in net revenue. This decrease was primarily related to pre-existing static fixed-fee license agreements.
The
$150.8 million
"Operational" decrease in total revenue was primarily driven by a decrease in non-current patent royalties. In 2017, non-current patent royalties were primarily attributable to the LG agreement, the recognition of a prepayment balance remaining under a patent license agreement that expired in fourth quarter 2017 and our second quarter 2017 settlement agreement with Microsoft Corporation. The decreases in current technology solutions revenue and variable patent royalties primarily related to the expiration at the end of 2017 of certain royalty obligations under a technology solutions agreement and decreased shipments by certain of our variable licensees, respectively. These decreases were partially offset by the LG dynamic fixed-fee agreement signed in fourth quarter 2017 and new dynamic fixed-fee agreements signed during 2018.
In
2018
and
2017
, 71% and 61% of our total revenues, respectively, were attributable to companies that individually accounted for 10% or more of our total revenues. In
2018
and
2017
, the following licensees or customers accounted for 10% or more of our total revenues:
|
|
For the Year Ended December 31,
|
||
|
|
2018
|
|
2017
|
|
Apple
|
36%
|
21%
|
|
|
Samsung
|
25%
|
13%
|
|
|
LG
|
10%
|
|
< 10%
|
|
Huawei
a
|
—%
|
|
14%
|
|
BlackBerry
b
|
—%
|
13%
|
|
(a) 2017 revenues include $8.4 million of non-current patent royalties.
(b) 2017 revenues include $70.7 million of non-current patent royalties.
Operating Expenses
The following table summarizes the change in operating expenses by category (in thousands):
52
|
For the Year Ended December 31,
|
||||||||||||||
|
|
2018
|
2017
|
Increase/(Decrease)
|
|||||||||||
|
Patent administration and licensing
|
$
|
124,081
|
|
$
|
102,651
|
|
$
|
21,430
|
|
21
|
%
|
|||
|
Development
|
69,698
|
|
75,724
|
|
(6,026
|
)
|
(8
|
)%
|
||||||
|
Selling, general and administrative
|
51,030
|
|
53,068
|
|
(2,038
|
)
|
(4
|
)%
|
||||||
|
Total operating expenses
|
$
|
244,809
|
|
$
|
231,443
|
|
$
|
13,366
|
|
6
|
%
|
|||
Operating expenses increased
6%
to
$244.8 million
in
2018
from
$231.4 million
in
2017
. The
$13.4 million
increase in total operating expenses was primarily due to increases/(decreases) in the following items (in thousands):
|
|
Increase/(Decrease)
|
||
|
Technicolor recurring operations
|
$
|
16,242
|
|
|
Technicolor Acquisition one-time costs
|
15,804
|
|
|
|
Intellectual property enforcement and non-patent litigation
|
2,605
|
|
|
|
Depreciation and amortization
|
2,072
|
|
|
|
Performance-based incentive compensation
|
(7,921
|
)
|
|
|
Consulting services
|
(7,127
|
)
|
|
|
Commercial initiatives
|
(3,738
|
)
|
|
|
Personnel-related costs
|
(2,912
|
)
|
|
|
Patent maintenance and evaluation
|
(2,067
|
)
|
|
|
Other
|
408
|
|
|
|
Total increase in operating expenses
|
$
|
13,366
|
|
The
$13.4 million
increase in operating expenses was primarily driven by the Technicolor Acquisition, which increased 2018 operating expenses by
$32.0 million
. One-time transaction-related costs associated with the Technicolor Acquisition increased
$15.8 million
. Additionally, the Technicolor Acquisition contributed an additional
$16.2 million
for five months of operating expenses for the acquired Technicolor business, of which $6.8 million relates to patent amortization. The
$2.6 million
increase in intellectual property enforcement and non-patent litigation was primarily due to increased activity related to existing licensee disputes. The
$2.1 million
increase of depreciation and amortization, which does not include the previously mentioned amortization from the Technicolor Acquisition, was primarily related to the growth in our patent portfolio driven by both internal patent generation and patent acquisitions. The
$7.9 million
decrease in performance-based incentive compensation was primarily driven by higher accrual rates in the prior year. Consulting services decreased by
$7.1 million
, primarily related to spending on corporate initiatives, including the implementation of a new enterprise resource planning system in 2017. The
$2.9 million
decrease in personnel-related costs and the
$3.7 million
decrease in commercial initiatives were due to a reduction in headcount and reduced spending on the development of commercial solutions in an ongoing effort to optimize our cost structure. The
$2.1 million
decrease in patent maintenance and evaluation costs was a result of our initiatives to more efficiently prosecute and maintain our patent portfolio.
Patent administration and licensing expense:
The
$21.4 million
increase in patent administration and licensing expense primarily resulted from the above-noted increases related to the Technicolor Acquisition, intellectual property enforcement costs and patent amortization expense. These increases were partially offset by a decrease in performance-based compensation and patent maintenance costs.
Development expense:
The
$6.0 million
decrease in development expense primarily resulted from the above-noted decreases in performance-based incentive compensation, personnel-related costs, commercial initiatives, as well as consulting services related to development projects.
Selling, general and administrative expense:
The
$2.0 million
decrease in selling, general and administrative expense primarily resulted from the above-noted decreases in performance-based incentive compensation, consulting services, and personnel-related costs. These decreases were partially offset by the above-noted increases related to the Technicolor Acquisition.
53
Other (Expense) Income
The following table compares
2018
other (expense) income to
2017
other (expense) income (in thousands):
|
For the Year Ended December 31,
|
||||||||||||||
|
2018
|
2017
|
Increase / (Decrease)
|
||||||||||||
|
Interest expense
|
$
|
(35,956
|
)
|
$
|
(17,845
|
)
|
$
|
(18,111
|
)
|
(101
|
)%
|
|||
|
Interest and investment income
|
14,590
|
|
8,488
|
|
6,102
|
|
72
|
%
|
||||||
|
Other
|
(9,171
|
)
|
252
|
|
(9,423
|
)
|
(3,739
|
)%
|
||||||
|
$
|
(30,537
|
)
|
$
|
(9,105
|
)
|
$
|
(21,432
|
)
|
(235
|
)%
|
||||
In 2018, other expense was
$30.5 million
as compared to
$9.1 million
in 2017. As discussed above, the year ended December 31, 2018 includes $16.7 million of interest expense related to significant financing components of patent license agreements resulting from the adoption of ASC 606. Interest expense also increased by $0.7 million due to interest incurred on long-term debt resulting from the Technicolor Acquisition. Other expense for 2018 also includes an aggregate $8.4 million loss related to the sale of one of our strategic long-term investments and the impairment of a separate strategic long-term investment during the year. The remaining change between periods was primarily due to an increase in interest and investment income of
$6.1 million
primarily due to higher average investment balances and higher returns during 2018 as compared to 2017.
Income Taxes
In 2018, based on the statutory federal tax rate net of discrete federal and state taxes, our effective tax rate was a benefit of
85.5%
. The effective tax rate for 2018 was favorably impacted by an $18.0 million benefit associated with the FDII deduction provisions contained within the Tax Cuts and Jobs Act, or TCJA, and a $14.7 million benefit from expected amended returns related to the Competent Authority Proceeding settlement discussed above.
This is compared to an effective tax rate provision of 41.6% in 2017, based on the statutory federal tax rate net of discrete federal and state taxes. The effective tax rate for 2017 was impacted by a $42.6 million tax charge for the revaluation of our net deferred tax assets at the new statutory tax rate of 21% due to the TCJA signed into law in December 2017. The revaluation of our net deferred tax assets contributed approximately 14.6% to the rate increase, which was partially offset by a contribution of approximately 4.0% due to our adoption of ASU 2016-09, "
Improvements to Employee Share-Based Payment Accounting
", as well as by a contribution of 2.7% as a result of the release of unrecognized tax benefits related to the conclusion of the IRS audits for tax years 2011 through 2015.
2017 Compared with 2016
Revenues
The following table compares 2017 revenues to 2016 revenues (in thousands). Amounts below for the years ended December 31, 2017 and 2016 are presented in accordance with ASC 605.
|
For the Year Ended
December 31,
|
||||||||||||||
|
|
2017
|
2016
|
Increase/ (Decrease)
|
|||||||||||
|
Variable patent royalty revenue
|
$
|
47,840
|
|
$
|
168,050
|
|
$
|
(120,210
|
)
|
(72
|
)%
|
|||
|
Fixed-fee royalty revenue
|
301,628
|
|
177,614
|
|
124,014
|
|
70
|
%
|
||||||
|
Current patent royalties
a
|
349,468
|
|
345,664
|
|
3,804
|
|
1
|
%
|
||||||
|
Non-current patent royalties
b
|
162,890
|
|
309,696
|
|
(146,806
|
)
|
(47
|
)%
|
||||||
|
Total patent royalties
|
512,358
|
|
655,360
|
|
(143,002
|
)
|
(22
|
)%
|
||||||
|
Current technology solutions revenue
a
|
20,580
|
|
10,494
|
|
10,086
|
|
96
|
%
|
||||||
|
Total revenue
|
$
|
532,938
|
|
$
|
665,854
|
|
$
|
(132,916
|
)
|
(20
|
)%
|
|||
(a) Recurring revenues consist of current patent royalties, inclusive of Dynamic Fixed-Fee Agreements, and current technology solutions revenue.
(b) For the years ended December 31, 2017 and 2016, non-current patent royalties consist of past patent royalties. Pegatron's fourth quarter 2016 variable patent royalties are included in non-current patent royalties as a result of the new agreement signed with Apple during fourth quarter 2016.
54
The
$132.9 million
decrease in total revenue was primarily driven by the decrease in non-current patent royalties of $146.8 million. In 2016, non-current patent royalties were primarily driven by the patent license agreements with Huawei and Apple signed in third and fourth quarter 2016, respectively, while the 2017 non-current patent royalties were primarily attributable to the LG agreement, the recognition of a prepayment balance remaining under a patent license agreement that expired in fourth quarter 2017 and our second quarter 2017 settlement agreement with Microsoft Corporation. Current technology solutions revenue increased by
$10.1 million
primarily due to increased shipments by one of our technology solutions customers and the inclusion of revenue from Hillcrest Labs.
In 2017 and 2016, 61% and 78% of our total revenues, respectively, were attributable to companies that individually accounted for 10% or more of our total revenues. In 2017 and 2016, the following licensees or customers accounted for 10% or more of our total revenues:
|
For the Year Ended December 31,
|
|||
|
|
2017
|
2016
|
|
|
Apple
a
|
21%
|
25%
|
|
|
Huawei
b
|
14%
|
23%
|
|
|
BlackBerry
c
|
13%
|
< 10%
|
|
|
Samsung
|
13%
|
10%
|
|
|
Pegatron
|
< 10%
|
20%
|
|
(a) 2016 revenues include $141.4 million of non-current patent royalties.
(b) 2017 and 2016 revenues include $8.4 million and $121.5 million, respectively, of non-current patent royalties.
(c) 2017 revenues include $70.7 million of non-current patent royalties.
Operating Expenses
The following table summarizes the change in operating expenses by category (in thousands):
|
|
For the Year Ended December 31,
|
|
|
|||||||||||
|
|
2017
|
2016
|
Increase/(Decrease)
|
|||||||||||
|
Patent administration and licensing
|
$
|
102,651
|
|
$
|
103,363
|
|
$
|
(712
|
)
|
(1
|
)%
|
|||
|
Development
|
75,724
|
|
73,118
|
|
2,606
|
|
4
|
%
|
||||||
|
Selling, general and administrative
|
53,068
|
|
52,067
|
|
1,001
|
|
2
|
%
|
||||||
|
Total operating expenses
|
$
|
231,443
|
|
$
|
228,548
|
|
$
|
2,895
|
|
1
|
%
|
|||
Operating expenses increased 1% to $231.4 million in 2017 from $228.5 million in 2016. The $2.9 million increase in total operating expenses was primarily due to increases/(decreases) in the following items (in thousands):
|
|
Increase / (Decrease)
|
||
|
Commercial initiatives
|
12,139
|
|
|
|
Depreciation and amortization
|
4,300
|
|
|
|
Consulting services
|
4,278
|
|
|
|
Performance-based incentive compensation
|
(13,627
|
)
|
|
|
Patent maintenance and evaluation
|
(2,373
|
)
|
|
|
Intellectual property enforcement and non-patent litigation
|
(1,221
|
)
|
|
|
Other
|
(601
|
)
|
|
|
Total increase in operating expenses
|
$
|
2,895
|
|
The $12.1 million increase in costs associated with commercial initiatives and the $4.3 million increase in depreciation and amortization were primarily related to the acquisition of Hillcrest during fourth quarter 2016. The $4.3 million increase in consulting services primarily related to spending on corporate initiatives including the implementation of a new enterprise
55
resource planning system and corporate development activities. The $13.6 million decrease in performance-based incentive compensation was primarily driven by higher accrual rates in 2016 associated with our short and long-term performance-based compensation plans. Patent maintenance and evaluation costs decreased $2.4 million as a result of initiatives to more efficiently prosecute and maintain our patent portfolio. The $1.2 million decrease in intellectual property enforcement and non-patent litigation primarily related to decreased costs associated with licensee arbitrations.
Patent administration and licensing expense
: The $0.7 million decrease in patent administration and licensing expense primarily resulted from the above-noted decreases in performance-based incentive compensation, patent maintenance and evaluation and intellectual property enforcement and non-patent litigation. These decreases were partially offset by an increase in depreciation and patent amortization expense as discussed above.
Development expense
: The $2.6 million increase in development expense primarily resulted from the above-noted increase in commercial initiatives expenses. This increase was partially offset by the decrease in performance-based incentive compensation as discussed above.
Selling, general and administrative expense
: The $1.0 million increase in selling, general and administrative expense primarily resulted from the above-noted increases in commercial initiatives and consulting services. These increases were partially offset by the decrease in performance-based incentive compensation as discussed above.
Other (Expense) Income
The following table compares
2017
other (expense) income to
2016
other (expense) income (in thousands):
|
For the Year Ended December 31,
|
||||||||||||||
|
2017
|
2016
|
Increase / (Decrease)
|
||||||||||||
|
Interest expense
|
$
|
(17,845
|
)
|
$
|
(21,126
|
)
|
$
|
3,281
|
|
16
|
%
|
|||
|
Other (a)
|
252
|
|
2,343
|
|
(2,091
|
)
|
(89
|
)%
|
||||||
|
Interest and investment income
|
8,488
|
|
3,748
|
|
4,740
|
|
126
|
%
|
||||||
|
$
|
(9,105
|
)
|
$
|
(15,035
|
)
|
$
|
5,930
|
|
39
|
%
|
||||
(a) Includes other-than-temporary impairments.
In 2017, other expense was
$9.1 million
as compared to
$15.0 million
in 2016. The change in total other expense was primarily due higher interest and investment income attributable to higher average investment balances and returns during 2017 as compared to 2016, as well as lower interest expense as a result of the repayment of the 2016 Notes in first quarter 2016. The decrease in other income primarily related to the gain recognized related to the sale of our King of Prussia facility in 2016.
Income Taxes
In 2017, our effective tax rate was approximately 41.6% as compared to 27.7% in 2016, based on the statutory federal tax rate net of discrete federal and state taxes. The increase in the effective tax rate was primarily attributable to the revaluation of our net deferred tax assets at the new statutory tax rate of 21% due to the TCJA signed into law in December 2017. The revaluation resulted in a 2017 charge of approximately $42.6 million and contributed approximately 14.6% to the rate increase, which was partially offset by a contribution of approximately 4.0% due to our adoption of ASU 2016-09, "
Improvements to Employee Share-Based Payment Accounting
", as well as by a contribution of 2.7% as a result of the release of unrecognized tax benefits related to the conclusion of the IRS audits for tax years 2011 through 2015. Our 2016 effective tax rate included a net benefit received from domestic production activities deductions covering the periods 2011 through 2015, which reduced the 2016 effective tax rate by 5.6%.
STATEMENT PURSUANT TO THE PRIVATE SECURITIES LITIGATION REFORM ACT OF 1995 - FORWARD-LOOKING STATEMENTS
This Annual Report on Form 10-K contains forward-looking statements within the meaning of Section 21E of the Securities Exchange Act of 1934, as amended. Such statements include certain information in “Part I, Item 1. Business” and “Part II, Item 7. Management's Discussion and Analysis of Financial Condition and Results of Operations” and other information regarding our current beliefs, plans and expectations, including without limitation the matters set forth below. Words such as “anticipate,” “estimate,” “expect,” “project,” “intend,” “plan,” “forecast,” “believe,” “could,” “would,”
56
“should,” “if,” “may,” “might,” “future,” “target,” “goal,” “trend,” “seek to,” “will continue,” “predict,” “likely,” “in the event,” variations of any such words or similar expressions contained herein are intended to identify such forward-looking statements. Forward-looking statements in this Annual Report on Form 10-K include, without limitation, statements regarding:
(i) Our objective to continue to be a leading designer and developer of technology solutions and innovation for the mobile industry and to monetize those solutions and innovations through a combination of licensing, sales and other revenue opportunities;
(ii) Our plans for executing on our business strategy, including our plans to develop and source innovative technologies related to wireless and video, establish and grow our patent-based revenue, pursue commercial opportunities for our advanced platforms and solutions, and maintain a collaborative relationship with key industry players and worldwide standards bodies;
(iii) Our belief that our portfolio includes a number of patents and patent applications that are or may be essential or may become essential to cellular, other wireless and video standards, including 3G, 4G and the IEEE 802 suite of standards, as well as patents and patent applications that we believe may become essential to 5G standards that are under development;
(iv) Our belief that a number of our CDMA and OFDM/OFDMA inventions are, may be or may become essential to the implementation of CDMA and OFDM/OFDMA-based systems in use today;
(v) Our belief that companies making, importing, using or selling products compliant with the standards covered by our patent portfolio require a license under our patents and will require licenses under patents that may issue from our pending patent applications;
(vi) Our belief that our ongoing research efforts and associated patenting activities enable us to sell patent assets that are not vital to our core licensing programs, as well as to execute patent swaps that can strengthen our overall portfolio;
(vii) Our belief that our commercial initiatives are potential revenue opportunities;
(viii) The estimated growth of the IoT market, including the size of the connected device installed base and number of connected device shipments, over the next several years;
(ix) The types of licensing arrangements and various royalty structure models that we anticipate using under our future license agreements;
(x) The possible outcome of audits of our license agreements when underreporting or underpayment is revealed;
(xi) Our belief that our facilities are suitable and adequate for our present purposes and our needs in the near future;
(xii) Our expectations and estimations regarding the income tax effects, and the impact on the Company, of the Tax Cuts and Jobs Act, or TCJA, and our belief that we currently expect a significant portion of our income to qualify as FDII and thus be subject to the 13.1% tax rate;
(xiii) Our expectation that we will continue to pay a quarterly cash dividend on our common stock comparable to our quarterly $0.35 per share cash dividend in the future;
(xiv) Our belief that intellectual property enforcement costs will likely continue to be a significant expense for us in the future;
(xv) Our belief that we have the ability to obtain additional liquidity through debt and equity financings;
(xvi) Our belief that our available sources of funds will be sufficient to finance our operations, capital requirements, debt obligations, existing stock repurchase program and dividend program for the next twelve months;
(xvii) Our expectations regarding the potential effects of new accounting standards on our financial statements or results of operations;
(xviii) Our expectation that the amortization of fixed-fee royalty payments will reduce our deferred revenue balance over the next twelve months;
(xix) our belief in our ability to expand into the consumer electronics market, and the opportunities that market presents;
(xx) our projections of amounts to be owed to Technicolor under our revenue sharing arrangement; and
(xxi) The expected timing, outcome and impact of our various litigation, arbitration and administrative matters.
57
Although the forward-looking statements in this Form 10-K reflect the good faith judgment of our management, such statements can only be based on facts and factors currently known by us. Consequently, forward-looking statements concerning our business, results of operations and financial condition are inherently subject to risks and uncertainties. We caution readers that actual results and outcomes could differ materially from those expressed in or anticipated by such forward-looking statements due to a variety of factors, including, without limitation, the following:
(i) further decline in U.S.-China relations and/or increased economic uncertainty in China;
(ii) unanticipated difficulties or delays related to the further development of our technologies;
(iii) the failure of the markets for our technologies to materialize to the extent or at the rate that we expect;
(iv) changes in our plans, strategy or initiatives;
(v) the challenges related to entering into new and renewed patent license agreements and unanticipated delays, difficulties or acceleration in the negotiation and execution of patent license agreements;
(vi) our ability to leverage our strategic relationships and secure new patent license and technology solutions agreements on acceptable terms;
(vii) the impact of current trends in the industry that could result in reductions in and/or caps on royalty rates under new patent license agreements;
(viii) changes in the market share and sales performance of our primary licensees, delays in product shipments of our licensees, delays in the timely receipt and final reviews of quarterly royalty reports from our licensees, delays in payments from our licensees and related matters;
(ix) the timing and/or outcome of our various litigation, arbitration, regulatory or administrative proceedings, including any awards or judgments relating to such proceedings, additional legal proceedings, changes in the schedules or costs associated with legal proceedings or adverse rulings in such legal proceedings;
(x) the determination of royalty rates, or other terms, under our patent license agreements through arbitration or other third-party adjudications, or the establishment by arbitrators or other third-party adjudicators of patent royalty rates at levels lower than our agreed or historical rates;
(xi) the impact of potential patent legislation, USPTO rule changes and international patent rule changes on our patent prosecution and licensing strategies;
(xii) the impact of rulings in legal proceedings, potential legislation affecting the jurisdiction and authority of the USITC and potential changes to the IPR policies of worldwide standards bodies on our investments in research and development and our strategies for patent prosecution, licensing and enforcement;
(xiii) changes in our interpretations of, and assumptions and calculations with respect to the impact on the Company of, the Tax Cuts and Jobs Act, or TCJA, as well as further guidance that may be issued regarding the TCJA;
(xiv) the timing and/or outcome of any state or federal tax examinations or audits, changes in tax laws and the resulting impact on our tax assets and liabilities;
(xv) the effects of any dispositions, acquisitions or other strategic transactions by the Company;
(xvi) decreased liquidity in the capital markets; and
(xvii) unanticipated increases in our cash needs or decreases in available cash.
You should carefully consider these factors as well as the risks and uncertainties outlined in greater detail in Part I, Item 1A, in this Form 10-K before making any investment decision with respect to our common stock. These factors, individually or in the aggregate, may cause our actual results to differ materially from our expected and historical results. You should understand that it is not possible to predict or identify all such factors. In addition, you should not place undue reliance on the forward-looking statements contained herein, which are made only as of the date of this Form 10-K. We undertake no obligation to revise or update publicly any forward-looking statement for any reason, except as otherwise required by law.
|
Item 7A.
|
QUANTITATIVE AND QUALITATIVE DISCLOSURES ABOUT MARKET RISK.
|
Cash, cash equivalents, restricted cash and short-term investments
The primary objectives of our investment activities are to preserve principal and maintain liquidity while at the same time capturing a market rate of return. To achieve these objectives, we maintain our portfolio of cash, cash equivalents,
restricted cash and short-term and long-term investments in a variety of securities, including government obligations, corporate bonds and commercial paper.
Interest Rate Risk —
We invest our cash in a number of diversified high quality investment-grade fixed and floating rate securities with a fair value of
$1.0 billion
as of
December 31, 2018
. Our exposure to interest rate risks is not significant due to the short average maturity, quality and diversification of our holdings. We do not hold any derivative, derivative commodity instruments or other similar financial instruments in our investment portfolio. The risk associated with fluctuating interest rates is generally limited to our investment portfolio. We believe that a hypothetical 10% change in period-end interest rates would not have a significant impact on our results of operations or cash flows.
The following table provides information about our interest-bearing securities that are sensitive to changes in interest rates as of
December 31, 2018
. The table presents principal cash flows, weighted-average yield at cost and contractual maturity dates. Additionally, we have assumed that these securities are similar enough within the specified categories to aggregate these securities for presentation purposes.
Interest Rate Sensitivity
Principal Amount by Expected Maturity
Average Interest Rates
(in thousands)
|
2019
|
2020
|
2021
|
2022
|
2023
|
Thereafter
|
Total
|
||||||||||||||
|
Money market and demand accounts
|
$488,733
|
—
|
|
—
|
|
—
|
|
—
|
|
—
|
|
$488,733
|
||||||||
|
Short-term investments
|
$390,932
|
$79,792
|
—
|
|
—
|
|
—
|
|
—
|
|
$470,724
|
|||||||||
|
Average Interest rate
|
1.4
|
%
|
1.8
|
%
|
—
|
%
|
—
|
%
|
—
|
%
|
—
|
%
|
1.5
|
%
|
||||||
Cash and cash equivalents and available-for-sale securities are recorded at fair value.
Bank Liquidity Risk —
As of
December 31, 2018
, we had approximately
$488.7 million
in operating accounts that are held with domestic and international financial institutions. The majority of these balances are held with domestic financial institutions. While we monitor daily cash balances in our operating accounts and adjust the cash balances as appropriate, these cash balances could be lost or become inaccessible if the underlying financial institutions fail or if they are unable to meet the liquidity requirements of their depositors. Notwithstanding, we have not incurred any losses and have had full access to our operating accounts to date.
Foreign Currency Exchange Rate Risk —
We are exposed to limited risk from fluctuations in currencies, which might change over time as our business practices evolve, that could impact our operating results, liquidity and financial condition. We operate and invest globally. Adverse movements in currency exchange rates might negatively affect our business due to a number of situations. Currently, our international licensing agreements are typically made in U.S. dollars and are generally not subject to foreign currency exchange rate risk. We do not engage in foreign exchange hedging transactions at this time.
Between 2006 and 2018, we paid approximately
$177.5 million
in foreign taxes to foreign governments that have tax treaties with the U.S., for which we have claimed foreign tax credits against our U.S. tax obligations, and for which the tax treaty procedures are still open. It is possible that as a result of tax treaty procedures, the U.S. government may reach an agreement with the related foreign governments that will result in a partial refund of foreign taxes paid with a related reduction in our foreign tax credits. Due to foreign currency fluctuations, any such agreement could result in foreign currency gain or loss.
Investment Risk —
We are exposed to market risk as it relates to changes in the market value of our short-term and long-term investments in addition to the liquidity and creditworthiness of the underlying issuers of our investments. We hold a diversified investment portfolio, which includes, fixed and floating-rate, investment-grade marketable securities, mortgage and asset-backed securities and U.S. government and other securities. The instruments included in our portfolio meet high credit quality standards, as specified in our investment policy guidelines. This policy also limits our amount of credit exposure to any one issue, issuer and type of instrument. Given that the guidelines of our investment policy prohibit us from investing in anything but highly rated instruments, our investments are not subject to significant fluctuations in fair value due to the volatility of the credit markets and prevailing interest rates for such securities. Our marketable securities, consisting of government obligations, corporate bonds and commercial paper, are primarily classified as available-for-sale with a fair value of
$470.7 million
as of
December 31, 2018
.
Equity Risk —
We are exposed to changes in the market-traded price of our common stock as it influences the calculation of earnings per share. In connection with the offering of the 2020 Notes, we entered into convertible note hedge transactions
58
with option counterparties. We also sold warrants to the option counterparties. These transactions have been accounted for as an adjustment to our shareholders' equity. The convertible note hedge transactions are expected to reduce the potential equity dilution upon conversion of the 2020 Notes. The warrants along with any shares issuable upon conversion of the 2020 Notes will have a dilutive effect on our earnings per share to the extent that the average market price of our common stock for a given reporting period exceeds the applicable strike price or conversion price of the warrants or convertible 2020 Notes, respectively.
59
|
Item 8.
|
FINANCIAL STATEMENTS AND SUPPLEMENTARY DATA.
|
|
|
PAGE NUMBER
|
|
CONSOLIDATED FINANCIAL STATEMENTS:
|
|
|
SCHEDULES:
|
|
All other schedules are omitted because they are either not required or applicable or equivalent information has been included in the financial statements and notes thereto.
60
Report of Independent Registered Public Accounting Firm
To the Board of Directors and Shareholders of InterDigital, Inc.
Opinions on the Financial Statements and Internal Control over Financial Reporting
We have audited the consolidated financial statements, including the related notes and financial statement schedules, of Interdigital, Inc. and its subsidiaries (the “Company”) as listed in the accompanying index (collectively referred to as the “consolidated financial statements”).
We also have audited the Company's internal control over financial reporting as of
December 31, 2018, based on criteria established in
Internal Control - Integrated Framework
(2013)
issued by the Committee of Sponsoring Organizations of the Treadway Commission (COSO).
In our opinion, the consolidated
financial statements referred to above present fairly, in all material respects, the financial position of the Company as of
December 31, 2018
and
December 31, 2017
,
and the results of its
operations and its
cash flows for each of the three years in the period ended December 31, 2018
in conformity with accounting principles generally accepted in the United States of America. Also in our opinion, the Company maintained, in all material respects, effective internal control over financial reporting as of
December 31, 2018, based on criteria established in
Internal Control - Integrated Framework
(2013)
issued by the COSO.
Change in Accounting Policies
As discussed in Note 2 to the consolidated financial statements, the Company changed the manner in which it accounts for revenue from contracts with customers in 2018.
Basis for Opinions
The Company's management is responsible for these consolidated financial statements, for maintaining effective internal control over financial reporting, and for its assessment of the effectiveness of internal control over financial reporting, included in the accompanying
Management's
Annual
Report on Internal Control over Financial Reporting. Our responsibility is to express opinions on the Company’s consolidated
financial statements and on the Company's internal control over financial reporting based on our audits. We are a public accounting firm registered with the Public Company Accounting Oversight Board (United States) (PCAOB) and are required to be independent with respect to the Company in accordance with the U.S. federal securities laws and the applicable rules and regulations of the Securities and Exchange Commission and the PCAOB.
We conducted our audits in accordance with the standards of the PCAOB. Those standards require that we plan and perform the audits to obtain reasonable assurance about whether the consolidated
financial statements are free of material misstatement, whether due to error or fraud, and whether effective internal control over financial reporting was maintained in all material respects.
Our audits of the consolidated
financial statements included performing procedures to assess the risks of material misstatement of the consolidated
financial statements, whether due to error or fraud, and performing procedures that respond to those risks. Such procedures included examining, on a test basis, evidence regarding the amounts and disclosures in the consolidated
financial statements. Our audits also included evaluating the accounting principles used and significant estimates made by management, as well as evaluating the overall presentation of the consolidated
financial statements. Our audit of internal control over financial reporting included obtaining an understanding of internal control over financial reporting, assessing the risk that a material weakness exists, and testing and evaluating the design and operating effectiveness of internal control based on the assessed risk. Our audits also included performing such other procedures as we considered necessary in the circumstances. We believe that our audits provide a reasonable basis for our opinions.
As described in
Management’s Annual Report on Internal Control over Financial Reporting,
management has excluded the patent licensing business of Technicolor
from its assessment of internal control over financial reporting as of December 31, 2018
because it was acquired by the Company in a purchase business combination during 2018.
We have also excluded the patent licensing business of Technicolor
from our audit of internal control over financial reporting.
The patent licensing business of Technicolor is a wholly-owned subsidiary whose total assets and total revenues excluded from management’s assessment and our audit of internal control over financial reporting represent
2.5%
and 1.5%, respectively, of the related consolidated financial statement amounts as of and for the year ended December 31, 2018.
Definition and Limitations of Internal Control over Financial Reporting
A company’s internal control over financial reporting is a process designed to provide reasonable assurance regarding the reliability of financial reporting and the preparation of financial statements for external purposes in accordance with generally accepted accounting principles. A company’s internal control over financial reporting includes those policies and procedures that (i) pertain to the maintenance of records that, in reasonable detail, accurately and fairly reflect the transactions and dispositions of the assets of the company; (ii) provide reasonable assurance that transactions are recorded as necessary to permit preparation of financial statements in accordance with generally accepted accounting principles, and that receipts and expenditures of the company are being made only in accordance with authorizations of management and directors of the
61
company; and (iii) provide reasonable assurance regarding prevention or timely detection of unauthorized acquisition, use, or disposition of the company’s assets that could have a material effect on the financial statements.
Because of its inherent limitations, internal control over financial reporting may not prevent or detect misstatements. Also, projections of any evaluation of effectiveness to future periods are subject to the risk that controls may become inadequate because of changes in conditions, or that the degree of compliance with the policies or procedures may deteriorate.
/s/ PricewaterhouseCoopers LLP
Philadelphia, Pennsylvania
February 21, 2019
We have served as the Company’s auditor since 2002.
62
INTERDIGITAL, INC. AND SUBSIDIARIES
CONSOLIDATED BALANCE SHEETS
(in thousands, except per share data)
|
DECEMBER 31,
2018 |
DECEMBER 31,
2017 |
||||||
|
ASSETS
|
|
|
|||||
|
CURRENT ASSETS:
|
|
|
|||||
|
Cash and cash equivalents
|
$
|
475,056
|
|
$
|
433,014
|
|
|
|
Short-term investments
|
470,724
|
|
724,981
|
|
|||
|
Accounts receivable, less allowances of $693 and $456
|
35,032
|
|
216,293
|
|
|||
|
Prepaid and other current assets
|
43,438
|
|
21,506
|
|
|||
|
Total current assets
|
1,024,250
|
|
1,395,794
|
|
|||
|
PROPERTY AND EQUIPMENT, NET
|
10,051
|
|
10,673
|
|
|||
|
PATENTS, NET
|
454,567
|
|
325,408
|
|
|||
|
DEFERRED TAX ASSETS
|
77,225
|
|
84,582
|
|
|||
|
OTHER NON-CURRENT ASSETS
|
60,465
|
|
37,963
|
|
|||
|
|
602,308
|
|
458,626
|
|
|||
|
TOTAL ASSETS
|
$
|
1,626,558
|
|
$
|
1,854,420
|
|
|
|
LIABILITIES AND SHAREHOLDERS’ EQUITY
|
|
|
|||||
|
CURRENT LIABILITIES:
|
|
|
|||||
|
Accounts payable
|
19,367
|
|
10,260
|
|
|||
|
Accrued compensation and related expenses
|
26,838
|
|
24,571
|
|
|||
|
Deferred revenue
|
111,672
|
|
307,142
|
|
|||
|
Taxes payable
|
1,508
|
|
14,881
|
|
|||
|
Dividend payable
|
11,627
|
|
12,156
|
|
|||
|
Other accrued expenses
|
8,383
|
|
7,431
|
|
|||
|
Total current liabilities
|
179,395
|
|
376,441
|
|
|||
|
LONG-TERM DEBT
|
317,377
|
|
285,126
|
|
|||
|
LONG-TERM DEFERRED REVENUE
|
157,634
|
|
309,671
|
|
|||
|
OTHER LONG-TERM LIABILITIES
|
34,139
|
|
10,034
|
|
|||
|
TOTAL LIABILITIES
|
688,545
|
|
981,272
|
|
|||
|
COMMITMENTS AND CONTINGENCIES
|
|
|
|||||
|
SHAREHOLDERS’ EQUITY:
|
|
|
|||||
|
Preferred Stock, $0.10 par value, 14,399 shares authorized, 0 shares issued and outstanding
|
—
|
|
—
|
|
|||
|
Common Stock, $0.01 par value, 100,000 shares authorized, 71,134 and 70,749 shares issued and 33,529 and 34,622 shares outstanding
|
711
|
|
707
|
|
|||
|
Additional paid-in capital
|
685,512
|
|
680,040
|
|
|||
|
Retained earnings
|
1,426,266
|
|
1,249,091
|
|
|||
|
Accumulated other comprehensive loss
|
(2,471
|
)
|
(2,083
|
)
|
|||
|
|
2,110,018
|
|
1,927,755
|
|
|||
|
Treasury stock, 37,605 and 36,127 shares of common held at cost
|
1,182,993
|
|
1,072,488
|
|
|||
|
Total InterDigital, Inc. shareholders’ equity
|
927,025
|
|
855,267
|
|
|||
|
Noncontrolling interest
|
10,988
|
|
17,881
|
|
|||
|
Total equity
|
938,013
|
|
873,148
|
|
|||
|
TOTAL LIABILITIES AND SHAREHOLDERS’ EQUITY
|
$
|
1,626,558
|
|
$
|
1,854,420
|
|
|
The accompanying notes are an integral part of these statements.
63
INTERDIGITAL, INC. AND SUBSIDIARIES
CONSOLIDATED STATEMENTS OF INCOME
(in thousands, except per share data)
|
FOR THE YEAR ENDED DECEMBER 31,
|
|||||||||||
|
|
2018
|
2017
|
2016
|
||||||||
|
REVENUES:
|
|||||||||||
|
Patent licensing royalties
|
$
|
302,060
|
|
$
|
512,358
|
|
$
|
655,360
|
|
||
|
Patent sales
|
750
|
|
—
|
|
—
|
|
|||||
|
Technology solutions
|
4,594
|
|
20,580
|
|
10,494
|
|
|||||
|
Total Revenue
|
307,404
|
|
532,938
|
|
665,854
|
|
|||||
|
OPERATING EXPENSES:
|
|
|
|
||||||||
|
Patent administration and licensing
|
124,081
|
|
102,651
|
|
103,363
|
|
|||||
|
Development
|
69,698
|
|
75,724
|
|
73,118
|
|
|||||
|
Selling, general and administrative
|
51,030
|
|
53,068
|
|
52,067
|
|
|||||
|
Total Operating Expenses
|
244,809
|
|
231,443
|
|
228,548
|
|
|||||
|
Income from operations
|
62,595
|
|
301,495
|
|
437,306
|
|
|||||
|
OTHER EXPENSE (NET)
|
(30,537
|
)
|
(9,105
|
)
|
(15,035
|
)
|
|||||
|
Income before income taxes
|
32,058
|
|
292,390
|
|
422,271
|
|
|||||
|
INCOME TAX BENEFIT (PROVISION)
|
27,417
|
|
(121,676
|
)
|
(116,791
|
)
|
|||||
|
NET INCOME
|
$
|
59,475
|
|
$
|
170,714
|
|
$
|
305,480
|
|
||
|
Net loss attributable to noncontrolling interest
|
(4,393
|
)
|
|
(3,579
|
)
|
|
(3,521
|
)
|
|||
|
NET INCOME ATTRIBUTABLE TO INTERDIGITAL, INC.
|
$
|
63,868
|
|
$
|
174,293
|
|
$
|
309,001
|
|
||
|
NET INCOME PER COMMON SHARE — BASIC
|
$
|
1.85
|
|
$
|
5.04
|
|
$
|
8.95
|
|
||
|
WEIGHTED AVERAGE NUMBER OF COMMON SHARES OUTSTANDING — BASIC
|
34,491
|
|
34,605
|
|
34,526
|
|
|||||
|
NET INCOME PER COMMON SHARE — DILUTED
|
$
|
1.81
|
|
$
|
4.87
|
|
$
|
8.78
|
|
||
|
WEIGHTED AVERAGE NUMBER OF COMMON SHARES OUTSTANDING — DILUTED
|
35,307
|
|
35,779
|
|
35,189
|
|
|||||
|
CASH DIVIDENDS DECLARED PER COMMON SHARE
|
$
|
1.40
|
|
$
|
1.30
|
|
$
|
1.00
|
|
||
The accompanying notes are an integral part of these statements.
64
INTERDIGITAL, INC. AND SUBSIDIARIES
CONSOLIDATED STATEMENTS OF COMPREHENSIVE INCOME
(in thousands)
|
|
For the Year Ended December 31,
|
||||||||||
|
|
2018
|
2017
|
2016
|
||||||||
|
Net income
|
$
|
59,475
|
|
$
|
170,714
|
|
$
|
305,480
|
|
||
|
Unrealized gain (loss) on investments, net of tax
|
61
|
|
(1,569
|
)
|
(336
|
)
|
|||||
|
Comprehensive income
|
$
|
59,536
|
|
$
|
169,145
|
|
$
|
305,144
|
|
||
|
Comprehensive loss attributable to noncontrolling interest
|
(4,393
|
)
|
(3,579
|
)
|
(3,521
|
)
|
|||||
|
Total comprehensive income attributable to InterDigital, Inc.
|
$
|
63,929
|
|
$
|
172,724
|
|
$
|
308,665
|
|
||
The accompanying notes are an integral part of these statements.
65
INTERDIGITAL, INC. AND SUBSIDIARIES
CONSOLIDATED STATEMENTS OF SHAREHOLDERS’ EQUITY
(in thousands, except per share data)
|
Accumulated
Other
Comprehensive
Income (Loss)
|
|||||||||||||||||||||||||||||||||
|
Common Stock
|
Additional
Paid-In Capital
|
Retained Earnings
|
Treasury Stock
|
Non-Controlling
Interest
|
Total
Shareholders'
Equity
|
||||||||||||||||||||||||||||
|
|
Shares
|
Amount
|
Shares
|
Amount
|
|||||||||||||||||||||||||||||
|
BALANCE, DECEMBER 31, 2015
|
70,130
|
|
$
|
701
|
|
$
|
663,073
|
|
$
|
847,033
|
|
$
|
(178
|
)
|
34,716
|
|
$
|
(1,000,110
|
)
|
$
|
11,376
|
|
$
|
521,895
|
|
||||||||
|
Net income attributable to InterDigital, Inc.
|
—
|
|
—
|
|
—
|
|
309,001
|
|
—
|
|
—
|
|
—
|
|
—
|
|
309,001
|
|
|||||||||||||||
|
Proceeds from noncontrolling interests
|
—
|
|
—
|
|
—
|
|
—
|
|
—
|
|
—
|
|
—
|
|
6,804
|
|
6,804
|
|
|||||||||||||||
|
Net (loss) income attributable to noncontrolling interest
|
—
|
|
—
|
|
—
|
|
—
|
|
—
|
|
—
|
|
—
|
|
(3,521
|
)
|
(3,521
|
)
|
|||||||||||||||
|
Net change in unrealized gain (loss) on short-term investments
|
—
|
|
—
|
|
—
|
|
—
|
|
(336
|
)
|
—
|
|
—
|
|
—
|
|
(336
|
)
|
|||||||||||||||
|
Dividends Declared ($1.00 per share)
|
—
|
|
—
|
|
907
|
|
(35,268
|
)
|
—
|
|
—
|
|
—
|
|
—
|
|
(34,361
|
)
|
|||||||||||||||
|
Exercise of Common Stock options
|
51
|
|
1
|
|
485
|
|
—
|
|
—
|
|
—
|
|
—
|
|
—
|
|
486
|
|
|||||||||||||||
|
Issuance of Common Stock, net
|
137
|
|
1
|
|
(3,381
|
)
|
—
|
|
—
|
|
—
|
|
—
|
|
—
|
|
(3,380
|
)
|
|||||||||||||||
|
Tax benefit from exercise of stock options
|
—
|
|
—
|
|
625
|
|
—
|
|
—
|
|
—
|
|
—
|
|
—
|
|
625
|
|
|||||||||||||||
|
Amortization of unearned compensation
|
—
|
|
—
|
|
21,840
|
|
—
|
|
—
|
|
—
|
|
—
|
|
—
|
|
21,840
|
|
|||||||||||||||
|
Repurchase of Common Stock
|
—
|
|
—
|
|
—
|
|
—
|
|
—
|
|
1,304
|
|
(64,685
|
)
|
—
|
|
(64,685
|
)
|
|||||||||||||||
|
BALANCE, DECEMBER 31, 2016
|
70,318
|
|
$
|
703
|
|
$
|
683,549
|
|
$
|
1,120,766
|
|
$
|
(514
|
)
|
36,020
|
|
$
|
(1,064,795
|
)
|
$
|
14,659
|
|
$
|
754,368
|
|
||||||||
|
Net income attributable to InterDigital, Inc.
|
—
|
|
—
|
|
—
|
|
174,293
|
|
—
|
|
—
|
|
—
|
|
—
|
|
174,293
|
|
|||||||||||||||
|
Proceeds from noncontrolling interests
|
—
|
|
—
|
|
—
|
|
—
|
|
—
|
|
—
|
|
—
|
|
6,801
|
|
6,801
|
|
|||||||||||||||
|
Net (loss) income attributable to noncontrolling interest
|
—
|
|
—
|
|
—
|
|
—
|
|
—
|
|
—
|
|
—
|
|
(3,579
|
)
|
(3,579
|
)
|
|||||||||||||||
|
Net change in unrealized gain (loss) on short-term investments
|
—
|
|
—
|
|
—
|
|
—
|
|
(1,569
|
)
|
—
|
|
—
|
|
—
|
|
(1,569
|
)
|
|||||||||||||||
|
Dividends Declared ($1.30 per share)
|
—
|
|
—
|
|
846
|
|
(45,968
|
)
|
—
|
|
—
|
|
—
|
|
—
|
|
(45,122
|
)
|
|||||||||||||||
|
Exercise of Common Stock options and warrants
|
9
|
|
1
|
|
381
|
|
—
|
|
—
|
|
—
|
|
—
|
|
—
|
|
382
|
|
|||||||||||||||
|
Issuance of Common Stock, net
|
422
|
|
3
|
|
(22,798
|
)
|
—
|
|
—
|
|
—
|
|
—
|
|
—
|
|
(22,795
|
)
|
|||||||||||||||
|
Amortization of unearned compensation
|
—
|
|
—
|
|
18,062
|
|
—
|
|
—
|
|
—
|
|
—
|
|
—
|
|
18,062
|
|
|||||||||||||||
|
Repurchase of Common Stock
|
—
|
|
—
|
|
—
|
|
—
|
|
—
|
|
107
|
|
(7,693
|
)
|
—
|
|
(7,693
|
)
|
|||||||||||||||
|
BALANCE, DECEMBER 31, 2017
|
70,749
|
|
$
|
707
|
|
$
|
680,040
|
|
$
|
1,249,091
|
|
$
|
(2,083
|
)
|
36,127
|
|
$
|
(1,072,488
|
)
|
$
|
17,881
|
|
$
|
873,148
|
|
||||||||
|
Cumulative effect of change in accounting principle
|
—
|
|
—
|
|
—
|
|
161,701
|
|
(449
|
)
|
—
|
|
—
|
|
—
|
|
161,252
|
|
|||||||||||||||
|
Net income attributable to InterDigital, Inc.
|
—
|
|
—
|
|
—
|
|
63,868
|
|
—
|
|
—
|
|
—
|
|
—
|
|
63,868
|
|
|||||||||||||||
|
Distribution preference
|
—
|
|
—
|
|
—
|
|
—
|
|
—
|
|
—
|
|
—
|
|
(2,500
|
)
|
(2,500
|
)
|
|||||||||||||||
|
Net (loss) income attributable to noncontrolling interest
|
—
|
|
—
|
|
—
|
|
—
|
|
—
|
|
—
|
|
—
|
|
(4,393
|
)
|
(4,393
|
)
|
|||||||||||||||
|
Net change in unrealized gain (loss) on short-term investments
|
—
|
|
—
|
|
—
|
|
—
|
|
61
|
|
—
|
|
—
|
|
—
|
|
61
|
|
|||||||||||||||
|
Dividends Declared ($1.40 per share)
|
—
|
|
—
|
|
472
|
|
(48,394
|
)
|
—
|
|
—
|
|
—
|
|
—
|
|
(47,922
|
)
|
|||||||||||||||
|
Exercise of Common Stock options
|
153
|
|
2
|
|
6,721
|
|
—
|
|
—
|
|
—
|
|
—
|
|
—
|
|
6,723
|
|
|||||||||||||||
|
Issuance of Common Stock, net
|
232
|
|
2
|
|
(8,810
|
)
|
—
|
|
—
|
|
—
|
|
—
|
|
—
|
|
(8,808
|
)
|
|||||||||||||||
|
Amortization of unearned compensation
|
—
|
|
—
|
|
7,089
|
|
—
|
|
—
|
|
—
|
|
—
|
|
—
|
|
7,089
|
|
|||||||||||||||
|
Repurchase of Common Stock
|
—
|
|
—
|
|
—
|
|
—
|
|
—
|
|
1,478
|
|
(110,505
|
)
|
—
|
|
(110,505
|
)
|
|||||||||||||||
|
BALANCE, DECEMBER 31, 2018
|
71,134
|
|
$
|
711
|
|
$
|
685,512
|
|
$
|
1,426,266
|
|
$
|
(2,471
|
)
|
37,605
|
|
$
|
(1,182,993
|
)
|
$
|
10,988
|
|
$
|
938,013
|
|
||||||||
The accompanying notes are an integral part of these statements
66
INTERDIGITAL, INC. AND SUBSIDIARIES
CONSOLIDATED STATEMENTS OF CASH FLOWS
(in thousands)
|
FOR THE YEAR ENDED DECEMBER 31,
|
|||||||||||
|
|
2018
|
2017
|
2016
|
||||||||
|
CASH FLOWS FROM OPERATING ACTIVITIES:
|
|
|
|||||||||
|
Net income
|
$
|
59,475
|
|
$
|
170,714
|
|
$
|
305,480
|
|
||
|
Adjustments to reconcile net income to net cash provided by operating activities:
|
|
||||||||||
|
Depreciation and amortization
|
66,108
|
|
57,053
|
|
52,753
|
|
|||||
|
Non-cash interest expense, net
|
13,509
|
|
13,105
|
|
15,252
|
|
|||||
|
Non-cash change in fair value
|
3,884
|
|
—
|
|
—
|
|
|||||
|
Change in deferred revenue
|
6,966
|
|
(36,892
|
)
|
205,721
|
|
|||||
|
Deferred income taxes
|
(45,426
|
)
|
64,950
|
|
13,261
|
|
|||||
|
Share-based compensation
|
7,089
|
|
18,062
|
|
21,840
|
|
|||||
|
Loss (gain) on disposal of assets
|
8,323
|
|
—
|
|
(3,351
|
)
|
|||||
|
Other
|
(425
|
)
|
(2
|
)
|
(32
|
)
|
|||||
|
(Increase) decrease in assets:
|
|||||||||||
|
Receivables
|
31,615
|
|
12,171
|
|
(169,927
|
)
|
|||||
|
Deferred charges and other assets
|
(6,065
|
)
|
19,426
|
|
(15,222
|
)
|
|||||
|
Increase (decrease) in liabilities:
|
|
|
|||||||||
|
Accounts payable
|
6,203
|
|
(3,789
|
)
|
(5,564
|
)
|
|||||
|
Accrued compensation and other expenses
|
254
|
|
(3,218
|
)
|
5,155
|
|
|||||
|
Accrued taxes payable and other tax contingencies
|
(4,718
|
)
|
4,220
|
|
8,793
|
|
|||||
|
Net cash provided by operating activities
|
146,792
|
|
315,800
|
|
434,159
|
|
|||||
|
CASH FLOWS FROM INVESTING ACTIVITIES:
|
|||||||||||
|
Purchases of short-term investments
|
(142,555
|
)
|
(930,016
|
)
|
(560,075
|
)
|
|||||
|
Sales of short-term investments
|
399,105
|
|
751,308
|
|
434,510
|
|
|||||
|
Purchases of property and equipment
|
(2,576
|
)
|
(2,071
|
)
|
(5,882
|
)
|
|||||
|
Capitalized patent costs
|
(32,069
|
)
|
(34,933
|
)
|
(32,658
|
)
|
|||||
|
Acquisition of patents
|
(2,250
|
)
|
—
|
|
(4,900
|
)
|
|||||
|
Acquisition of business, net of cash acquired
|
(142,985
|
)
|
—
|
|
(48,000
|
)
|
|||||
|
Long-term investments
|
(6,686
|
)
|
(4,585
|
)
|
(2,000
|
)
|
|||||
|
Net cash provided by (used in) investing activities
|
69,984
|
|
(220,297
|
)
|
(219,005
|
)
|
|||||
|
CASH FLOWS FROM FINANCING ACTIVITIES:
|
|||||||||||
|
Net proceeds from exercise of stock options
|
6,723
|
|
382
|
|
485
|
|
|||||
|
Payments on long-term debt
|
—
|
|
—
|
|
(230,000
|
)
|
|||||
|
Proceeds from non-controlling interests
|
—
|
|
6,801
|
|
6,804
|
|
|||||
|
Dividends paid
|
(48,468
|
)
|
(43,255
|
)
|
(31,135
|
)
|
|||||
|
Shares withheld for taxes
|
(8,807
|
)
|
(22,798
|
)
|
(3,381
|
)
|
|||||
|
Tax benefit from share-based compensation
|
—
|
|
—
|
|
625
|
|
|||||
|
Repurchase of common stock
|
(110,505
|
)
|
(7,693
|
)
|
(64,685
|
)
|
|||||
|
Net cash used in financing activities
|
(161,057
|
)
|
(66,563
|
)
|
(321,287
|
)
|
|||||
|
NET INCREASE (DECREASE) IN CASH, CASH EQUIVALENTS AND RESTRICTED CASH
|
55,719
|
|
28,940
|
|
(106,133
|
)
|
|||||
|
CASH, CASH EQUIVALENTS AND RESTRICTED CASH, BEGINNING OF PERIOD
|
433,014
|
|
404,074
|
|
510,207
|
|
|||||
|
CASH, CASH EQUIVALENTS AND RESTRICTED CASH, END OF PERIOD
|
$
|
488,733
|
|
$
|
433,014
|
|
$
|
404,074
|
|
||
|
SUPPLEMENTAL CASH FLOW INFORMATION:
|
|||||||||||
|
Interest paid
|
4,740
|
|
4,740
|
|
7,615
|
|
|||||
|
Income taxes paid, including foreign withholding taxes
|
33,904
|
|
66,793
|
|
108,635
|
|
|||||
|
Non-cash investing and financing activities:
|
|
|
|
|
|
|
|||||
|
Dividend payable
|
11,627
|
|
12,156
|
|
10,290
|
|
|||||
|
Non-cash acquisition of patents
|
—
|
|
32,500
|
|
7,900
|
|
|||||
|
Accrued capitalized patent costs, acquisition of patents and property and equipment
|
(2,789
|
)
|
1
|
|
(146
|
)
|
|||||
_______________
Refer to Note 3, "
Revenue Recognition
" for more information regarding the impact of our adoption of ASC 606 and Note 6, "
Cash, Cash Equivalents, Restricted Cash and Marketable Securities
" for a reconciliation of cash, cash equivalents and restricted cash.
The accompanying notes are an integral part of these statements.
67
INTERDIGITAL, INC. AND SUBSIDIARIES
NOTES TO CONSOLIDATED FINANCIAL STATEMENTS
December 31, 2018
|
1.
|
BACKGROUND
|
InterDigital designs and develops advanced technologies that enable and enhance wireless communications and capabilities. Since our founding in 1972, our engineers have designed and developed a wide range of innovations that are used in digital cellular and wireless products and networks, including 2G, 3G, 4G and IEEE 802-related products and networks, as well as video processing, coding and display technology. We are a leading contributor of innovation to the wireless communications industry, as well as a leading holder of patents in the video industry.
|
2.
|
SUMMARY OF SIGNIFICANT ACCOUNTING POLICIES AND NEW ACCOUNTING GUIDANCE
|
Principles of Consolidation
The accompanying consolidated financial statements include all of our accounts and all entities in which we have a controlling interest and/or are required to be consolidated in accordance with the Generally Accepted Accounting Principles in the United States (“GAAP”). All significant intercompany accounts and transactions have been eliminated in consolidation.
In determining whether we are the primary beneficiary of a variable interest entity and therefore required to consolidate, we apply a qualitative approach that determines whether we have both the power to direct the economically significant activities of the entity and the obligation to absorb losses of, or the right to receive benefits from, the entity that could potentially be significant to that entity. These considerations impact the way we account for our existing collaborative relationships and other arrangements. We continuously assess whether we are the primary beneficiary of a variable interest entity as changes to existing relationships or future transactions may result in us consolidating or deconsolidating our partner(s) to collaborations and other arrangements.
Use of Estimates
The preparation of financial statements in conformity with GAAP requires management to make estimates and assumptions that affect the reported amounts of assets and liabilities, the disclosure of contingent assets and liabilities as of the date of the financial statements and the reported amounts of revenues and expenses during the reporting period. Actual results could differ from these estimates. If different assumptions were made or different conditions had existed, our financial results could have been materially different.
Reclassifications
Certain reclassifications have been made to prior year amounts to conform to the current year presentation.
Foreign Currency Translation
The functional currency of substantially all of the Company's wholly-owned subsidiaries is the U.S. dollar. Certain subsidiaries have monetary assets and liabilities that are denominated in a currency that is different than the functional currency. The gains and losses resulting from this remeasurement and translation of monetary assets denominated in a currency that is different than the functional currency are reflected in the determination of net income (loss).
Cash, Cash Equivalents, Restricted Cash and Marketable Securities
We classify all highly liquid investment securities with original maturities of three months or less at date of purchase as cash equivalents. Cash that is held for a specific purpose and therefore not available to the Company for immediate or general business use is classified as restricted cash. Our investments are comprised of mutual and exchange traded funds, commercial paper, United States and municipal government obligations and corporate securities. Management determines the appropriate classification of our investments at the time of acquisition and re-evaluates such determination at each balance sheet date.
As of
December 31, 2018
and
2017
, the majority of our marketable securities have been classified as available-for-sale and are carried at fair value, with unrealized gains and losses reported net-of-tax as a separate component of shareholders’ equity. Substantially all of our investments are investment grade government and corporate debt securities that have maturities of less than 2 years, and we have both the ability and intent to hold the investments until maturity.
68
Other-than-Temporary Impairments
We review our investment portfolio during each reporting period to determine whether there are identified events or circumstances that would indicate there is a decline in the fair value that is considered to be other-than-temporary. For non-public investments, if there are no identified events or circumstances that would have a significant adverse effect on the fair value of the investment, then the fair value is not estimated. If an investment is deemed to have experienced an other-than-temporary decline below its cost basis, we reduce the carrying amount of the investment to its quoted or estimated fair value, as applicable, and establish a new cost basis for the investment. We charge the impairment to the "
Other Expense (Net)"
line of our consolidated statements of income.
Intangible Assets
Patents
We capitalize external costs, such as filing fees and associated attorney fees, incurred to obtain issued patents and patent license rights. We expense costs associated with maintaining and defending patents subsequent to their issuance in the period incurred. We amortize capitalized patent costs for internally generated patents on a straight-line basis over
ten
years, which represents the estimated useful lives of the patents. The ten-year estimated useful life for internally generated patents is based on our assessment of such factors as: the integrated nature of the portfolios being licensed, the overall makeup of the portfolio over time, and the length of license agreements for such patents. The estimated useful lives of acquired patents and patent rights, however, have been and will continue to be based on a separate analysis related to each acquisition and may differ from the estimated useful lives of internally generated patents. The average estimated useful life of acquired patents is
9.7
years. We assess the potential impairment to all capitalized net patent costs when events or changes in circumstances indicate that the carrying amount of our patent portfolio may not be recoverable.
Goodwill
Goodwill is recorded as the difference, if any, between the aggregate consideration paid for an acquisition and the fair value of the net tangible and identified intangible assets acquired under a business combination. We review impairment of goodwill annually on the first day of the fourth quarter. We first assess qualitative factors to determine whether it is more likely than not that the fair value of a reporting unit is less than its carrying amount as a basis for determining whether a quantitative goodwill impairment test is necessary. If we conclude it is more likely than not that the fair value of a reporting unit exceeds its carrying amount, we need not perform the quantitative assessment.
If based on the qualitative assessment we believe it is more likely than not that the fair value of a reporting unit is less than its carrying value, a quantitative assessment test is required to be performed. This assessment requires us to compare the fair value of each reporting unit to its carrying value including allocated goodwill. We determine the fair value of our reporting units generally using a combination of the income and market approaches. The income approach is estimated through the discounted cash flow method based on assumptions about future conditions such as future revenue growth rates, new product and technology introductions, gross margins, operating expenses, discount rates, future economic and market conditions, and other assumptions. The market approach estimates the fair value of our equity by utilizing the market comparable method which is based on revenue multiples from comparable companies in similar lines of business. If the carrying value of a reporting unit exceeds the reporting unit’s fair value, a goodwill impairment charge will be recorded for the difference up to the carrying value of goodwill.
The Company acquired goodwill from our acquisition of the patent licensing business of Technicolor (the "Technicolor Acquisition") in 2018 and from our acquisition of Hillcrest Laboratories, Inc. ("Hillcrest Labs") in 2016. Refer to Note 5, "
Business Combinations
," for more information regarding these transactions.
The carrying value of goodwill as of December 31, 2018 and 2017 was
$22.4 million
and
$16.0 million
, respectively, which was included within "
Other Non-Current Assets
" in the consolidated balance sheets. No impairments were recorded during 2018, 2017 or 2016 as a result of our annual goodwill impairment assessment.
Other Intangible Assets
We capitalize the cost of technology solutions and platforms we acquire or license from third parties when they have a future benefit and the development of these solutions and platforms is substantially complete at the time they are acquired or licensed.
Intangible assets consist of acquired patents, existing technology, and trade names. Refer to the above
Patents
section for more information on acquired patents and existing technology. Our intangible assets are amortized on a straight-line basis over their estimated useful lives, ranging from 9 to 10 years. We make judgments about the recoverability of purchased finite-lived intangible assets whenever facts and circumstances indicate that the useful life is shorter than originally estimated or that the carrying amount of assets may not be recoverable. If such facts and circumstances exist, we assess recoverability by comparing the projected undiscounted net cash flows associated with the related asset or group of assets over their remaining lives against their respective carrying amounts. Impairments, if any, are based on the excess of the carrying amount over the fair value of those assets. If the useful life is shorter than originally estimated, we would accelerate the rate of amortization and amortize the remaining carrying value over the new shorter useful life.
69
Property and Equipment
Property and equipment are stated at cost. Depreciation and amortization of property and equipment are provided using the straight-line method. The estimated useful lives for computer equipment, computer software, engineering and test equipment and furniture and fixtures are generally
three
to
five
years. Leasehold improvements are amortized over the lesser of their estimated useful lives or their respective lease terms, which are generally
five
to
ten
years. Buildings are being depreciated over
twenty-five
years. Expenditures for major improvements and betterments are capitalized, while minor repairs and maintenance are charged to expense as incurred. Leases meeting certain capital lease criteria are capitalized and the net present value of the related lease payments is recorded as a liability. Amortization of capital leased assets is recorded using the straight-line method over the lesser of the estimated useful lives or the lease terms.
Upon the retirement or disposition of property, plant and equipment, the related cost and accumulated depreciation or amortization are removed, and a gain or loss is recorded.
Internal-Use Software Costs
We capitalize costs associated with software developed for internal use that are incurred during the software development stage. Such costs are limited to expenses incurred after management authorizes and commits to a computer software project, believes that it is more likely than not that the project will be completed, the software will be used to perform the intended function with an estimated service life of
two
years or more, and the completion of conceptual formulation, design and testing of possible software project alternatives (the preliminary design stage). Costs incurred after final acceptance testing has been successfully completed are expensed. Capitalized computer software costs are amortized over their estimated useful life of three years.
All computer software costs capitalized to date relate to the purchase, development and implementation of engineering, accounting and other enterprise software.
Impairment of Long-Lived Assets
We evaluate long-lived assets for impairment when factors indicate that the carrying value of an asset may not be recoverable. When factors indicate that such assets should be evaluated for possible impairment, we review whether we will be able to realize our long-lived assets by analyzing the projected undiscounted cash flows in measuring whether the asset is recoverable. We did not have any long-lived asset impairments in 2018, 2017 or 2016.
Investments in Other Entities
We may make strategic investments in companies that have developed or are developing technologies that are complementary to our business. In conjunction with our adoption of ASU No. 2016-01 "
Financial Instruments (Subtopic 825-10): Recognition and Measurement of Financial Assets and Financial Liabilities
" discussed further below, we made an accounting policy election for a measurement alternative for our equity investments that do not have readily determinable fair values, specifically related to our strategic investments in other entities. Under the alternative, our strategic investments in other entities without readily determinable fair values are measured at cost, less any impairment, plus or minus changes resulting from observable price changes in orderly transactions for an identical or similar investment of the same issuer, if any. On a quarterly basis, we monitor items such as our investment’s financial position and liquidity, performance targets, business plans, and cost trends to assess whether there are any triggering events or indicators present that would be indicative of an impairment, or any other observable price changes as indicated above. We do not adjust our investment balance when the investee reports profit or loss.
Additionally, other investments may be accounted for under the equity method of accounting. Under this method, we initially record our investment in the stock of an investee at cost, and adjust the carrying amount of the investment to recognize our share of the earnings or losses of the investee after the date of acquisition. The amount of the adjustment is included in the determination of net income, and such amount reflects adjustments similar to those made in preparing consolidated statements including adjustments to eliminate intercompany gains and losses, and to amortize, if appropriate, any difference between our cost and underlying equity in net assets of the investee at the date of investment. The investment is also adjusted to reflect our share of changes in the investee’s capital. Dividends received from an investee reduce the carrying amount of the investment. When there are a series of operating losses by the investee or when other factors indicate that a decrease in value of the investment has occurred which is other than temporary, we recognize an impairment equal to the difference between the fair value and the carrying amount of our investment.
The carrying value of our investments in other entities are included within "
Other Non-Current Assets
" on our consolidated balance sheets. During 2018, 2017 and 2016, we made investments in other entities of
$6.7 million
,
$4.6 million
and
$2.0 million
, respectively. The carrying value of our investments in other entities as of December 31, 2018 and 2017 was
70
$17.4 million
and
$19.2 million
, respectively, the majority of which are accounted for under the measurement alternative for equity investments described above.
Revenue Recognition
Refer to Note 3, "
Revenue Recognition
," for further information regarding our adoption of ASU No. 2014-09,
Revenue from Contracts with Customers (Topic 606)
, which we refer to as ASC 606, effective January 1, 2018. The discussion that follows below is a description of our revenue recognition practices in effect beginning January 1, 2018 under ASC 606.
We derive the vast majority of our revenue from patent licensing. The timing and amount of revenue recognized from each licensee depends upon a variety of factors, including the specific terms of each agreement and the nature of the deliverables and obligations. Such agreements are often complex and include multiple performance obligations. These agreements can include, without limitation, performance obligations related to the settlement of past patent infringement liabilities, patent and/or know-how licensing royalties on covered products sold by licensees, access to a portfolio of technology as it exists at a point in time, and access to a portfolio of technology at a point in time along with a promises to provide any technology updates to the portfolio during the term.
All of our agreements have been accounted for under ASC 606. This guidance requires the use of a five-step model to achieve the core underlying principle that an entity should recognize revenue to depict the transfer of goods or services to customers at an amount that the entity expects to be entitled to in exchange for those goods or services. These steps include (1) identifying the contract with the customer, (2) identifying the performance obligations, (3) determining the transaction price, (4) allocating the transaction price to the performance obligations, and (5) recognizing revenue as the entity satisfies the performance obligation(s). Additionally, we have elected to utilize certain practical expedients in the application of ASC 606. In evaluating the presence of a significant financing component in our agreements, we utilize the practical expedient to exclude any contracts wherein the gap between payment by our customers and the delivery of our performance obligation is less than one year. We have also elected to utilize the practical expedient related to costs of obtaining a contract where an entity may recognize the incremental costs of obtaining a contract as an expense when incurred if the amortization period of the asset that the entity otherwise would have recognized is one year or less. Timing of revenue recognition may differ significantly from the timing of invoicing to customers. Contract assets are included in accounts receivable and represent unbilled amounts expected to be received from customers in future periods, where the revenue recognized to date (or cumulative adjustments to retained earnings in the initial period of adopting ASC 606) exceeds the amount billed, and right to payment is subject to the underlying contractual terms. Contract assets are classified as long-term assets if the payments are expected to be received more than one year from the reporting date. Contract assets due within less than twelve months of the balance sheet date are included within accounts receivable in our consolidated balance sheets. Contract assets due more than twelve months after the balance sheet date are included within other non-current assets.
Patent License Agreements
Upon signing a patent license agreement, we provide the licensee permission to use our patented inventions in specific applications. We account for patent license agreements in accordance with the guidance indicated above. Under our patent license agreements, we typically receive one or a combination of the following forms of payment as consideration for permitting our licensees to use our patented inventions in their applications and products:
Consideration for Past Patent Royalties
Consideration related to a licensee’s product sales from prior periods may result from a negotiated agreement with a licensee that utilized our patented inventions prior to signing a patent license agreement with us or from the resolution of a disagreement or arbitration with a licensee over the specific terms of an existing license agreement. We may also receive consideration for past patent royalties in connection with the settlement of patent litigation where there was no prior patent license agreement. In each of these cases, we record the consideration as revenue as prescribed by the five-step model.
Fixed-Fee Agreements
Fixed-fee agreements include fixed, non-refundable royalty payments that fulfill the licensee’s obligations to us under a patent license agreement for a specified time period or for the term of the agreement for specified products, under certain patents or patent claims, for sales in certain countries, or a combination thereof - in each case for a specified time period (including for the life of the patents licensed under the agreement).
Dynamic fixed-fee license agreements
contain a single performance obligation that represents ongoing access to a portfolio of technology over the license term, since our promise to transfer to the licensee access to the portfolio as it exists at inception of the license, along with promises to provide any technology updates to the portfolio during the term, are not separately identifiable. Upon entering a new agreement, we allocate the transaction price to the performance obligations delivered at signing (e.g. our existing patent portfolio) and future performance obligations
71
(e.g. the technology updates). We use a time-based input method of progress to determine the timing of revenue recognition, and as such we recognize the future deliverables on a straight-line basis over the term of the agreement. We utilize the straight-line method as we believe that it best depicts efforts expended to develop and transfer updates to the customer evenly throughout the term of the agreement.
Static fixed-fee license agreements
are fixed-price contracts that generally do not include updates to technology we create after the inception of the license agreement or in which the customer does not stand to substantively benefit from those updates during the term. Generally, our performance obligations are satisfied at contract signing, and as such revenue is recognized at that time.
Variable Agreements
Upon entering a new variable patent license agreement, the licensee typically agrees to pay royalties or license fees on licensed products sold during the term of the agreement. We utilize the sales- or usage- based royalty exception for these agreements and recognize revenues during the contract term when the underlying sale or usage occurs. Our licensees under variable agreements provide us with quarterly royalty reports that summarize their sales of covered products and their related royalty obligations to us. We typically receive these royalty reports subsequent to the period in which our licensees’ underlying sales occurred. As a result, we are required to estimate revenues, subject to the constraint on our ability to estimate such amounts.
Technology Solutions
Technology solutions revenue consists primarily of revenue from royalty payments. We recognize revenue from royalty payments using the same methods described above under our policy for recognizing revenue from patent license agreements. Technology solutions revenues also consist of revenues from software licenses, engineering services and product sales. The nature of these contracts and timing of payments vary.
Patent Sales
Our business strategy of monetizing our intellectual property includes the sale of select patent assets. As patent sales executed under this strategy represent a component of our ongoing major or central operations and activities, we will record the related proceeds as revenue. We will recognize the revenue in accordance with the five-step model, generally upon closing of the patent sale transaction.
Collaborative Arrangements
We record the elements of our collaboration agreements that represent joint operating activities in accordance with ASC 808,
Collaborative Arrangements
(“ASC 808”). Accordingly, the elements of our collaboration agreements that represent activities in which both parties are active participants, and to which both parties are exposed to the significant risks and rewards that are dependent on the commercial success of the activities, are recorded as collaborative arrangements. Generally, the classification of a transaction under a collaborative arrangement is determined based on the nature and contractual terms of the arrangement along with the nature of the operations of the participants. For transactions that are deemed to be a collaborative arrangement under ASC 808, costs incurred and revenues generated on sales to third parties will be reported in our consolidated statement of operations on a gross basis if the Company is deemed to be the principal in the transaction, or on a net basis if the Company is instead deemed to be the agent in the transaction, consistent with the guidance in ASC 606-10-55-36,
Revenue From Contracts with Customers - Principal Agent Considerations
.
72
Deferred Charges
Direct costs of obtaining a contract or fulfilling a contract in a transaction that results in the deferral of revenue may be either expensed as incurred or capitalized, depending on certain criteria. In conjunction with our adoption of ASC 606 effective January 1, 2018, we made a policy election to utilize the practical expedient related to costs of obtaining a contract where an entity may recognize the incremental costs of obtaining a contract as an expense when incurred if the amortization period of the asset that the entity otherwise would have recognized is one year or less. If the amortization period is greater than one year, we capitalize direct costs incurred for the acquisition or fulfillment of a contract through the date of signing if they are directly related to a particular revenue arrangement and are expected to be recovered. The costs are amortized on a straight-line basis over the life of the patent license agreement.
For example, from time to time, we use sales agents to assist us in our licensing and/or patent sale activities. In such cases, we may pay a commission. The commission rate varies from agreement to agreement. Commissions are normally paid shortly after our receipt of cash payments associated with the patent license or patent sale agreements. We defer recognition of commission expense and amortize these expenses in proportion to our recognition of the related revenue. Commission expense is included within the "
Patent administration and licensing"
line of our consolidated statements of income and was immaterial for the years presented. There were no new direct contract costs incurred during 2018, 2017 or 2016.
Incremental direct costs incurred related to a debt financing transaction may be capitalized. In connection with our offering of the 2020 Notes, discussed in detail within Note 10, "
Obligations"
, we incurred directly related costs. The initial purchasers' transaction fees and related offering expenses were allocated to the liability and equity components of the debt in proportion to the allocation of proceeds and accounted for as debt issuance costs. The debt issuance costs allocated to the liability component of the debt were capitalized as deferred financing costs and recorded as a direct reduction of the debt. These costs are being amortized to interest expense over the term of the debt using the effective interest method and are included within the "
Other Expense (Net)"
line of our consolidated statements of income. The costs allocated to the equity component of the debt were recorded as a reduction of the equity component of the debt. The balance of unamortized deferred financing costs as of December 31, 2018 and 2017 was
$1.6 million
and
$3.0 million
, respectively. There were no new debt issuance costs incurred in 2018, 2017 or 2016. Deferred financing expense was
$1.4 million
,
$1.4 million
and
$1.7 million
in
2018
,
2017
and
2016
, respectively.
Research and Development
Research and development expenditures are expensed in the period incurred, except certain software development costs that are capitalized between the point in time that technological feasibility of the software is established and when the product is available for general release to customers. We did not have any capitalized software costs related to research and development in any period presented. Research, development and other related costs were approximately
$69.7 million
,
$75.7 million
and
$73.1 million
in
2018
,
2017
and
2016
, respectively.
Compensation Programs
We use a variety of compensation programs to both attract and retain employees, and to more closely align employee compensation with company performance. These programs include, but are not limited to, short-term incentive awards tied to performance goals and cash awards to inventors for filed patent applications and patent issuances, as well as stock option awards, time-based restricted stock unit (“RSU”) awards, performance-based awards and cash awards under our long-term compensation program ("LTCP") and pursuant to the terms and conditions of our Equity Plans (as defined in Note 13, "
Compensation Plans and Programs
"). Our LTCP typically includes annual equity and cash award grants with three- to five-year vesting periods; as a result, in any one year, we are typically accounting for at least three active LTCP cycles.
We account for compensation costs associated with share-based transactions based on the fair value of the instruments issued. The estimated value of stock options includes assumptions around expected life, stock volatility and dividends. The expected life of our stock option awards is based on the simplified method as prescribed by Staff Accounting Bulletin Topic 14. In all periods, our policy has been to set the value of RSUs and restricted stock awards equal to the value of our underlying common stock on the date of measurement. For grants with graded vesting, we amortize the associated unrecognized compensation cost using an accelerated method. For grants that cliff vest, we amortize the associated unrecognized compensation cost on a straight-line basis over their vesting term.
As a result of our adoption of ASU No. 2016-09, "
Stock Compensation (Topic 718): Improvements to Employee Share-Based Payment Accounting
" in first quarter 2017, we now adjust compensation expense recognized to date in the event of canceled awards as they occur. Tax windfalls and shortfalls related to the tax effects of employee share-based compensation are included in our tax provision. On the consolidated statements of cash flows, tax windfalls and shortfalls related to employee share-based compensation awards are included within operating activities and cash paid to tax authorities for shares withheld are included within financing activities. The inclusion of windfalls and shortfalls in the tax provision could increase our earnings volatility between periods.
Income Taxes
Income taxes are accounted for under the asset and liability method. Under this method, deferred tax assets and liabilities are recognized for the estimated future tax consequences attributable to differences between the financial statement carrying amounts of existing assets and liabilities and their respective tax bases, and operating loss and tax credit carry forwards. Deferred tax assets and liabilities are measured using enacted tax rates in effect for the year in which those temporary differences are expected to be recovered or settled. The effect on deferred tax assets and liabilities of a change in tax rates is recognized in the Consolidated Statement of Income in the period in which the change was enacted. A valuation allowance is recorded to reduce the carrying amounts of deferred tax assets if management has determined that it is more likely than not that such assets will not be realized.
In addition, the calculation of tax liabilities involves significant judgment in estimating the impact of uncertainties in the application of complex tax laws. We are subject to examinations by the U.S. IRS and other taxing jurisdictions on various tax matters, including challenges to various positions we assert in our filings. In the event that the IRS or another taxing jurisdiction levies an assessment in the future, it is possible the assessment could have a material adverse effect on our consolidated financial condition or results of operations.
The financial statement recognition of the benefit for a tax position is dependent upon the benefit being more likely than not to be sustainable upon audit by the applicable tax authority. If this threshold is met, the tax benefit is then measured and recognized at the largest amount that is greater than 50 percent likely of being realized upon ultimate settlement. In the event that the IRS or another taxing jurisdiction levies an assessment in the future, it is possible the assessment could have a material adverse effect on our consolidated financial condition or results of operations.
New Accounting Guidance
Accounting Standards Update: Revenue
In May 2014, the Financial Accounting Standards Board ("FASB") issued ASU No. 2014-09, "
Revenue from Contracts with Customers (Topic 606)
". Refer to Note 3, "
Revenue Recognition
," for information regarding our adoption of this guidance effective January 1, 2018 and a discussion of the impact to revenue information presented herein, as well as additional required disclosures under the new guidance.
Accounting Standards Update: Financial Instruments
In January 2016, the FASB issued ASU No. 2016-01, "
Financial Instruments (Subtopic 825-10): Recognition and Measurement of Financial Assets and Financial Liabilities
," which amends certain measurement, presentation, and disclosure requirements for financial instruments. The new guidance must be adopted by means of a cumulative-effect adjustment to the
73
balance sheet in the year of adoption and became effective for the Company starting in first quarter 2018. We adopted this guidance in first quarter 2018, and it did not have a material effect on the Company's consolidated financial statements.
Accounting Standards Update: Leases
In February 2016, the FASB issued new guidance related to leases that outlines a comprehensive lease accounting model and supersedes the current lease guidance. The new guidance requires lessees to recognize lease liabilities and corresponding right-of-use assets for all leases with lease terms of greater than 12 months. It also changes the definition of a lease and expands the disclosure requirements of lease arrangements.
The Company adopted this guidance on January 1, 2019 using the modified retrospective transition effective date method. As part of that adoption, we have elected the package of three practical expedients, which includes the following: an entity may elect not to reassess whether expired or existing contracts contain a lease under the revised definition of a lease, an entity may elect not to reassess the lease classification for expired or existing leases, and an entity may elect not to reassess whether previously capitalized initial direct costs would qualify for capitalization. Additionally, the Company has elected not to utilize the hindsight expedient in determining the lease term. Based upon our preliminary review, we expect to record lease liabilities and corresponding right-of-use assets between $11.0 million and $18.0 million in the consolidated balance sheet, for leases with lease terms greater than 12 months. We will finalize the necessary adjustments in conjunction with the filing of our Quarterly Report on Form 10-Q for the quarter ended March 31, 2019.
Accounting Standards Update: Reclassification of Certain Tax Effects from Accumulated Other Comprehensive Income
In February 2018, the FASB issued ASU No. 2018-02, "
Reporting Comprehensive Income (Topic 220): Reclassification of Certain Tax Effects from Accumulated Other Comprehensive Income
," which allow a reclassification from accumulated other comprehensive income to retained earnings for stranded tax effects resulting from the Tax Cuts and Jobs Act of 2017 (the "TCJA"). The guidance is effective for fiscal years beginning after December 15, 2018, and early adoption is permitted. We early adopted this guidance in first quarter 2018 and reflected a $0.4 million adjustment to retained earnings during the period.
Accounting Standards Update: Improvements to Nonemployee Share-Based Payment Accounting
In June 2018, the FASB issued ASU No. 2018-07, "
Stock Compensation (Topic 718): Improvements to Nonemployee Share-Based Payment Accountin
g," which is intended to reduce cost and complexity and to improve financial reporting for share-based payments issued to nonemployees. The guidance is effective for fiscal years beginning after December 15, 2018, and will therefore be effective for the Company starting in first quarter 2019. We do not expect the adoption to have a material impact on the Company's consolidated financial statements.
Accounting Standards Update: Fair Value Measurement
In August 2018, the FASB issued ASU No. 2018-13, "
Fair Value Measurement (Topic 820): Disclosure Framework-Changes to the Disclosure Requirements for Fair Value Measurement
". The amendments in this ASU add, modify, and eliminate certain disclosure requirements for fair value measurements under Topic 820. The amendments in this update are effective for fiscal years beginning after December 15, 2019, including interim periods within those fiscal years, and early adoption is permitted. The Company early adopted this guidance in fourth quarter 2018 and it did not have a material impact on the Company's consolidated financial statements.
Accounting Standards Update: Cloud Computing Arrangements
In August 2018, the FASB issued ASU No. 2018-15 “
Intangibles – Goodwill and Other – Internal-Use Software (Subtopic 350-40): Customer’s Accounting for Implementation Costs Incurred in a Cloud Computing Arrangement that is a Service Contract
”. The amendments in this ASU align the requirements for capitalizing implementation costs incurred in a hosting arrangement that is a service contract with the requirements for capitalizing implementation costs incurred to develop or obtain internal-use software. The guidance is effective for fiscal years beginning after December 15, 2019, including interim periods within those fiscal years, and early adoption is permitted. We are in the process of determining the effect the adoption will have on our consolidated financial statements.
Accounting Standards Update: Collaborative Arrangements
In November 2018, the FASB issued ASU No. 2018-18, "
Collaborative Arrangements (Topic 808): Clarifying the Interaction Between Topic 808 and Topic 606
". The amendments in this ASU provide guidance on how to assess whether certain transactions between collaborative arrangement participants should be accounted for within the revenue recognition standard. The amendments in this update are effective for fiscal years beginning after December 15, 2019, including interim periods within those fiscal years, and early adoption is permitted for entities who have previously adopted the new revenue recognition guidance. We are in the process of determining the effect the adoption will have on our consolidated financial statements.
74
3. REVENUE RECOGNITION
In May 2014, the Financial Accounting Standards Board ("FASB") issued ASU No. 2014-09, "Revenue from Contracts with Customers (Topic 606)" ("ASC 606") which superseded most prior revenue recognition guidance, including industry-specific guidance. The underlying principle is that an entity will recognize revenue to depict the transfer of goods or services to customers at an amount that the entity expects to be entitled to in exchange for those goods or services. The guidance also requires enhanced disclosures regarding the nature, amount, timing and uncertainty of revenue and cash flows arising from an entity’s contracts with customers. We adopted the requirements of the new standard as of January 1, 2018 using the modified retrospective transition method applied to those contracts that were not completed as of January 1, 2018. Accordingly, all periods prior to January 1, 2018 are presented in accordance with ASC Topic 605, "Revenue Recognition" (“ASC 605”). See Note 2 "
Summary of Significant Accounting Policies and New Accounting Guidance
" for our revised revenue recognition accounting policy upon adoption of the new guidance.
The adoption of the new guidance affected our recognition of revenue from both our fixed-fee and per-unit license agreements. For accounting purposes under this new guidance, we separate our fixed-fee license agreements into two categories: (i) those agreements that provide rights, over the term of the license, to future technologies that are highly interdependent or highly interrelated to the technologies provided at the inception of the agreement (“Dynamic Fixed-Fee Agreements”) and (ii) those agreements that do not provide for rights to such future technologies (“Static Fixed-Fee Agreements”). Under our previous accounting practices, after the fair value allocation between the past and future components of the agreement, we recognized the future components of revenue from all fixed-fee license agreements on a straight-line basis over the term of the related license agreement. As a result of our adoption of the new guidance, we will continue to recognize revenue from Dynamic Fixed-Fee Agreements on a straight-line basis over the term of the related license agreement, while we expect to recognize most or all of the revenue from Static Fixed-Fee Agreements in the quarter the license agreement is signed. We will not recognize any ongoing revenue from Static Fixed-Fee Agreements already in existence at the time the guidance was adopted. Additionally, in the event a significant financing component is determined to exist in any of our agreements, we will recognize more or less revenue and corresponding interest expense or income, as appropriate.
In addition, under our previous accounting practices, we recognized revenue from our per-unit license agreements in the period in which we received the related royalty report, generally one quarter in arrears from the period in which the underlying sales occurred (i.e. on a "quarter-lag"). We are now required to record per-unit royalty revenue in the same period in which the licensee’s underlying sales occur. Because we generally do not receive the per-unit licensee royalty reports for sales during a given quarter within the time frame necessary to adequately review the reports and include the actual amounts in our quarterly results for such quarter, we accrue the related revenue based on estimates of our licensees’ underlying sales, subject to certain constraints on our ability to estimate such amounts. As a result of accruing revenue for the quarter based on such estimates, adjustments will be required in the following quarter to true-up revenue to the actual amounts reported by our licensees. In addition, to the extent we receive non-refundable prepayments related to per-unit license agreements that do not provide rights over the term of the license to future technologies that are highly interdependent or highly interrelated to the technologies provided at the inception of the agreement, we will recognize such prepayments as revenue in the period in which all remaining revenue recognition criteria have been met.
Finally, under our previous accounting practices, we established a receivable, and any related deferred tax asset for foreign withholding taxes, for payments expected to be received within twelve months from the balance sheet date, based on the terms of the license agreement. Our reporting of such payments resulted in increases to: accounts receivable and deferred revenue; and deferred tax assets and taxes payable. Under ASC 606, we will only recognize those amounts as they become due.
Timing of revenue recognition may differ significantly from the timing of invoicing to customers. Contract assets are included in accounts receivable and represent unbilled amounts expected to be received from customers in future periods, where the revenue recognized to date (or cumulative adjustments to retained earnings in the initial period of adopting ASC 606) exceeds the amount billed, and right to payment is subject to the underlying contractual terms. Contract assets are classified as long-term assets if the payments are expected to be received more than one year from the reporting date.
See below for a summary of adjustments related to our adoption of ASC 606. Amounts are in thousands.
75
|
December 31, 2017
|
Static Fixed-Fee Agreements
|
Static Prepayments
|
Elimination of Quarter-Lag Reporting
|
Significant Financing Component
|
Related Tax Effects and Other Balance Sheet Impact
|
Total Adjustments
|
January 1, 2018
|
||||||||||||||||||||
|
Accounts Receivable
|
$
|
216,293
|
|
$
|
6,000
|
|
$
|
—
|
|
$
|
10,948
|
|
$
|
—
|
|
$
|
(171,727
|
)
|
$
|
(154,779
|
)
|
$
|
61,514
|
|
|||
|
Deferred Tax Assets
|
84,582
|
|
—
|
|
—
|
|
—
|
|
—
|
|
(52,199
|
)
|
(52,199
|
)
|
32,383
|
|
|||||||||||
|
Taxes Payable
|
(14,881
|
)
|
—
|
|
—
|
|
—
|
|
—
|
|
8,655
|
|
8,655
|
|
(6,226
|
)
|
|||||||||||
|
Deferred Revenue
|
(616,813
|
)
|
99,466
|
|
85,146
|
|
—
|
|
3,235
|
|
171,727
|
|
359,574
|
|
(257,239
|
)
|
|||||||||||
|
Retained Earnings
|
(1,249,091
|
)
|
(105,466
|
)
|
(85,146
|
)
|
(10,948
|
)
|
(3,235
|
)
|
43,544
|
|
(161,251
|
)
|
(1,410,342
|
)
|
|||||||||||
Disaggregated Revenue
The following table presents the disaggregation of our revenue for the year ended December 31, 2018 under ASC 606. Revenues for the years ended December 31, 2018, 2017 and 2016 are presented in accordance with ASC 605. Amounts are in thousands.
|
For the Year Ended December 31,
|
||||||||||||
|
|
2018
|
2017
|
2016
|
|||||||||
|
Variable patent royalty revenue
|
$
|
36,384
|
|
$
|
47,840
|
|
$
|
168,050
|
|
|||
|
Fixed-fee royalty revenue
|
239,347
|
|
301,628
|
|
177,614
|
|
||||||
|
Current patent royalties
a
|
275,731
|
|
349,468
|
|
345,664
|
|
||||||
|
Non-current patent royalties
b
|
26,329
|
|
162,890
|
|
309,696
|
|
||||||
|
Total patent royalties
|
302,060
|
|
512,358
|
|
655,360
|
|
||||||
|
Current technology solutions revenue
a
|
4,594
|
|
20,580
|
|
10,494
|
|
||||||
|
Patent sales
|
750
|
|
—
|
|
—
|
|
||||||
|
Total revenue
|
$
|
307,404
|
|
$
|
532,938
|
|
$
|
665,854
|
|
|||
a. Recurring revenues consist of current patent royalties, inclusive of Dynamic Fixed-Fee Agreement royalties, and current technology solutions
revenue.
|
b.
|
Non-current patent royalties for the year ended December 31, 2018 consist of past patent royalties and royalties from static agreements. For the years ended December 31, 2017 and 2016, non-current patent royalties consist of past patent royalties.
|
During the year ended December 31, 2018, we recognized
$101.3 million
of revenue that had been included in deferred revenue as of the beginning of the period. Additionally, upon adoption of ASC 606 on January 1, 2018, we had
$24.7 million
of contract assets. As of December 31, 2018, we had contract assets of
$19.7 million
and
$5.5 million
included within "
Accounts receivable
" and "
Other non-current assets
" in the consolidated balance sheet, respectively.
Impact of Adoption of ASC 606
In accordance with the new revenue standard requirements, the disclosure of the impact of adoption on our current period consolidated income statement and balance sheet is presented below. We believe this additional information is vital during the transition year to allow readers of our financial statements to compare financial results from the preceding financial year given the absence of restatement of the prior period. The adoption of ASC 606 did not affect our reported total amounts of cash flows from operating, investing and financing activities. Amounts contained in the tables below are in thousands, except per share data.
76
|
For the Year Ended December 31,
|
|||||||||||||||||||
|
2018
|
2017
|
2016
|
|||||||||||||||||
|
As Reported ASC 606
|
Adjustment
|
ASC 605
|
As Reported (ASC 605)
|
As Reported (ASC 605)
|
|||||||||||||||
|
REVENUES:
|
|||||||||||||||||||
|
Variable patent royalty revenue
|
$
|
36,384
|
|
$
|
461
|
|
$
|
36,845
|
|
$
|
47,840
|
|
$
|
168,050
|
|
||||
|
Fixed-fee royalty revenue
|
239,347
|
|
79,341
|
|
318,688
|
|
301,628
|
|
177,614
|
|
|||||||||
|
Current patent royalties
|
275,731
|
|
79,802
|
|
355,533
|
|
349,468
|
|
345,664
|
|
|||||||||
|
Non-current patent royalties
|
26,329
|
|
(10,000
|
)
|
16,329
|
|
162,890
|
|
309,696
|
|
|||||||||
|
Total patent royalties
|
302,060
|
|
69,802
|
|
371,862
|
|
512,358
|
|
655,360
|
|
|||||||||
|
Patent sales
|
750
|
|
—
|
|
750
|
|
—
|
|
—
|
|
|||||||||
|
Current technology solutions revenue
|
4,594
|
|
4,907
|
|
9,501
|
|
20,580
|
|
10,494
|
|
|||||||||
|
$
|
307,404
|
|
$
|
74,709
|
|
$
|
382,113
|
|
$
|
532,938
|
|
$
|
665,854
|
|
|||||
|
OPERATING EXPENSES:
|
244,809
|
|
—
|
|
244,809
|
|
231,443
|
|
228,548
|
|
|||||||||
|
Income from operations
|
62,595
|
|
74,709
|
|
137,304
|
|
301,495
|
|
437,306
|
|
|||||||||
|
OTHER EXPENSE (NET)
|
(30,537
|
)
|
16,655
|
|
(13,882
|
)
|
(9,105
|
)
|
(15,035
|
)
|
|||||||||
|
Income before income taxes
|
32,058
|
|
91,364
|
|
123,422
|
|
292,390
|
|
422,271
|
|
|||||||||
|
INCOME TAX BENEFIT (PROVISION)
|
27,417
|
|
(6,686
|
)
|
20,731
|
|
(121,676
|
)
|
(116,791
|
)
|
|||||||||
|
NET INCOME
|
$
|
59,475
|
|
$
|
84,678
|
|
$
|
144,153
|
|
$
|
170,714
|
|
$
|
305,480
|
|
||||
|
Net loss attributable to noncontrolling interest
|
(4,393
|
)
|
—
|
|
(4,393
|
)
|
(3,579
|
)
|
(3,521
|
)
|
|||||||||
|
NET INCOME ATTRIBUTABLE TO INTERDIGITAL, INC.
|
$
|
63,868
|
|
$
|
84,678
|
|
$
|
148,546
|
|
$
|
174,293
|
|
$
|
309,001
|
|
||||
|
NET INCOME PER COMMON SHARE — BASIC
|
$
|
1.85
|
|
$
|
2.46
|
|
$
|
4.31
|
|
$
|
5.04
|
|
$
|
8.95
|
|
||||
|
NET INCOME PER COMMON SHARE — DILUTED
|
$
|
1.81
|
|
$
|
2.40
|
|
$
|
4.21
|
|
$
|
4.87
|
|
$
|
8.78
|
|
||||
|
December 31, 2018
|
December 31, 2017
|
||||||||||||||
|
As Reported ASC 606
|
Adjustment
|
ASC 605
|
As Reported (ASC 605)
|
||||||||||||
|
Accounts Receivable, net
|
$
|
35,032
|
|
$
|
172,940
|
|
$
|
207,972
|
|
$
|
216,293
|
|
|||
|
Deferred Tax Assets
|
77,225
|
|
34,256
|
|
111,481
|
|
84,582
|
|
|||||||
|
Other Non-current Assets
|
60,465
|
|
(5,500
|
)
|
54,965
|
|
37,963
|
|
|||||||
|
Taxes Payable
|
(1,508
|
)
|
(11,075
|
)
|
(12,583
|
)
|
(14,881
|
)
|
|||||||
|
Deferred Revenue
|
(269,306
|
)
|
(277,827
|
)
|
(547,133
|
)
|
(616,813
|
)
|
|||||||
|
Retained Earnings
|
(1,426,266
|
)
|
87,206
|
|
(1,339,060
|
)
|
(1,249,091
|
)
|
|||||||
Contracted Revenue
Based on contracts signed and committed Dynamic Fixed-Fee Agreement payments as of December 31, 2018, we expect to recognize the following amounts of revenue over the term of such contracts (in thousands):
77
|
Revenue
|
|||
|
2019
|
$
|
247,750
|
|
|
2020
|
246,500
|
|
|
|
2021
|
178,583
|
|
|
|
2022
|
85,228
|
|
|
|
2023
|
—
|
|
|
|
Thereafter
|
—
|
|
|
|
$
|
758,061
|
|
|
4. GEOGRAPHIC / CUSTOMER CONCENTRATION
We have one reportable segment. During 2018, 2017 and 2016, the majority of our revenue was derived from a limited number of licensees based outside of the United States, primarily in Asia. Substantially all of these revenues were paid in U.S. dollars and were not subject to any substantial foreign exchange transaction risk. The table below lists the countries of the headquarters of our licensees and customers and the total revenue derived from each country or region for the periods indicated (in thousands):
|
|
For the Year Ended December 31,
|
||||||||||
|
|
2018
|
2017
|
2016
|
||||||||
|
United States
|
$
|
119,159
|
|
$
|
194,184
|
|
$
|
199,928
|
|
||
|
South Korea
|
112,291
|
|
113,059
|
|
69,000
|
|
|||||
|
Japan
|
29,525
|
|
25,210
|
|
27,685
|
|
|||||
|
Taiwan
|
23,326
|
|
36,051
|
|
185,645
|
|
|||||
|
Finland
|
10,000
|
|
—
|
|
—
|
|
|||||
|
Sweden
|
6,933
|
|
6,935
|
|
6,934
|
|
|||||
|
Other Europe
|
4,903
|
|
4,413
|
|
4,713
|
|
|||||
|
Germany
|
490
|
|
1,892
|
|
6,463
|
|
|||||
|
Other Asia
|
468
|
|
—
|
|
—
|
|
|||||
|
China
|
309
|
|
77,087
|
|
154,767
|
|
|||||
|
Canada
|
—
|
|
74,107
|
|
10,719
|
|
|||||
|
Total
|
$
|
307,404
|
|
$
|
532,938
|
|
$
|
665,854
|
|
||
During
2018
,
2017
and
2016
, the following licensees or customers accounted for
10%
or more of total revenues:
|
2018
|
2017
|
2016
|
||||||
|
Apple
(a)
|
36
|
%
|
21
|
%
|
25
|
%
|
||
|
Samsung
|
25
|
%
|
13
|
%
|
10
|
%
|
||
|
LG
|
10
|
%
|
< 10%
|
|
—
|
%
|
||
|
Pegatron
|
< 10%
|
|
< 10%
|
|
20
|
%
|
||
|
Blackberry
(b)
|
—
|
%
|
13
|
%
|
< 10%
|
|
||
|
Huawei
(c)
|
—
|
%
|
14
|
%
|
23
|
%
|
||
(a) 2016 revenues include
$141.4 million
of non-current patent royalties.
(b) 2017 revenues include
$70.7 million
of non-current patent royalties.
(c) 2017 and 2016 revenues include
$8.4 million
and
$121.5 million
, respectively, of non-current patent royalties.
As of December 31, 2018, 2017 and 2016, we held
$464.6 million
,
$336.1 million
and
$287.2 million
, respectively, of our property, equipment and patents, net of accumulated depreciation and amortization, of which greater than 97% of the total was within the United States in each of the years presented. As of December 31, 2018, we held less than
$0.7 million
of property and equipment, net of accumulated depreciation, collectively, in Canada, Europe and Asia.
78
|
5.
|
BUSINESS COMBINATIONS
|
Technicolor Acquisition
On July 30, 2018, we completed our acquisition of the patent licensing business of Technicolor, a worldwide technology leader in the media and entertainment sector (the "Technicolor Acquisition"). Refer to Note 20, "
Subsequent Events
," for information regarding our February 2019 announcement of our binding offer to acquire the Research & Innovation ("R&I") unit of Technicolor SA. R&I is a premier research lab that conducts fundamental research into video coding, IoT and smart home, imaging sciences, AR and VR and artificial intelligence and machine learning technologies.
The Technicolor Acquisition included the acquisition by InterDigital of approximately 18,000 patents and applications, across a broad range of technologies, including approximately 3,000 worldwide video coding patents and applications. The acquisition of Technicolor’s portfolio greatly expands InterDigital’s technology footprint in the mobile industry, and opens new markets in consumer home electronics, display technology and video. The portfolio will also be supplemented by jointly funded R&D collaboration, which will bring together the efforts of hundreds of engineers in InterDigital Labs and Technicolor R&I. Members of Technicolor’s licensing, legal and other support teams in offices in Rennes and Paris, France; Princeton, New Jersey, USA; and other locations joined InterDigital’s team of more than 300 R&D and other staff in locations around the world. In addition, we have assumed Technicolor’s rights and obligations under a joint licensing program with Sony Corporation (“Sony”) relating to digital televisions and standalone computer display monitors (the “Madison Arrangement”), including Technicolor's role as sole licensing agent for the Madison Arrangement. As part of this transaction, we also granted back to Technicolor a perpetual license for patents acquired in the transaction. With respect to patents generated through the jointly funded R&D efforts, we will own the patents, and Technicolor will receive a license back to the patents resulting from the targeted research conducted by its R&I team.
The Technicolor Acquisition meets the definition of a business combination and, as such, was accounted for using the acquisition method of accounting. Under the terms of the agreement, in third quarter 2018, we paid Technicolor
$158.9 million
in cash, inclusive of
$15.9 million
of cash acquired, yielding net cash consideration of
$143.0 million
. We funded this payment with cash on hand. Technicolor will receive 42.5% of all of InterDigital's future cash receipts (net of estimated operating expenses) from InterDigital’s new licensing efforts in the consumer electronics field; there will be no revenue sharing associated with InterDigital’s mobile industry licensing efforts. We account for the portion of the future cash receipts owed to Technicolor relating to patents existing as of the date of the acquisition as a contingent consideration liability, which was valued at
$18.6 million
as of the acquisition date. See below for further discussion of the contingent consideration liability. Additionally, as of the acquisition date, we estimated we will receive payments totaling
$20.2 million
relating to the transaction from Technicolor, of which
$8.5 million
was included within "
Prepaid and other current asset
s" and the remaining balance was included within "
Other non-current asset
s" in the consolidated balance sheet. We account for our assumption of Technicolor’s rights and obligations under the Madison Arrangement as a collaborative arrangement.
We allocated the fair value of consideration transferred to identifiable assets acquired and liabilities assumed based on their estimated fair values as of the acquisition date. We recorded the excess of the fair value of consideration transferred over the net values of these assets and liabilities as goodwill. We estimated the fair value of the intangible assets in this transaction through a combination of a discounted cash flow analysis (the income approach) and an analysis of comparable market transactions (the market approach). For the income approach, we based the inputs and assumptions used to develop these estimates on a market participant perspective and included estimates of projected revenues, discount rates, economic lives and income tax rates, among others, and all of these estimates require significant management judgment. For the market approach, we applied judgment to identify the most comparable market transactions to this transaction. Refer to Note 7 for discussion regarding the valuation methodologies used for the contingent consideration liability.
The following table summarizes the fair value of consideration transferred and our allocation of that consideration based on the estimated fair values of the assets acquired and liabilities assumed as of the date of acquisition (in thousands):
79
|
As of
July 30, 2018
|
||||
|
Cash
|
$
|
158,898
|
|
|
|
Contingent consideration liability
|
18,616
|
|
||
|
$
|
177,514
|
|
`
|
|
|
Less: Transaction-related receivable
|
(20,200
|
)
|
||
|
Net fair value of consideration transferred
|
$
|
157,314
|
|
|
|
Allocation:
|
Estimated useful life (Years)
|
|||
|
Net tangible assets and liabilities:
|
||||
|
Restricted cash
|
$
|
15,913
|
|
|
|
Other current assets
|
5,600
|
|
||
|
Other non-current assets
|
3,116
|
|
||
|
Current liabilities
|
(6,219
|
)
|
||
|
Long-term debt
|
(17,717
|
)
|
||
|
Other long-term liabilities
|
(3,767
|
)
|
||
|
Total net tangible assets and liabilities
|
$
|
(3,074
|
)
|
|
|
Identified intangible assets:
|
||||
|
Patents
|
$
|
154,000
|
|
9 - 10
|
|
Goodwill
(1)
|
6,388
|
|
||
|
Total identified intangible assets
|
$
|
160,388
|
|
|
|
Total fair value of consideration transferred
|
$
|
157,314
|
|
|
(1) Goodwill consists of expected synergies resulting from the combination of our and Technicolor’s patent licensing businesses in the increasingly complementary areas of mobile and video technology. We expect that the majority of the goodwill resulting from the Technicolor Acquisition will be deductible for income tax purposes.
The following table shows the change in the carrying amount of our goodwill balance from December 31, 2017 to December 31, 2018, all of which is allocated to our one reportable segment (in thousands):
|
Goodwill balance as of December 31, 2017
|
$
|
16,033
|
|
|
|
Technicolor Acquisition
|
6,388
|
|
||
|
Goodwill balance as of December 31, 2018
|
$
|
22,421
|
|
|
Since the date of closing, the Technicolor Acquisition resulted in
$4.5 million
of revenue and
$12.5 million
of pre-tax losses, excluding one-time transaction-related costs, that were included in our consolidated statement of income for the year ended December 31, 2018. One-time transaction-related costs for the year ended December 31, 2018 were
$17.8 million
, the majority of which were recorded within “Selling, general and administrative” expenses in the Company's consolidated statement of income.
The amount of revenue and earnings that would have been included in the Company’s consolidated statements of income for the years ended December 31, 2018 and 2017 had the acquisition date been January 1, 2017 are reflected in the table below. These amounts have been calculated after applying the Company's accounting policies and adjusting the results to reflect additional interest expense as well as amortization that would have been charged assuming the fair value adjustments to amortizable intangible assets had been recorded as of January 1, 2017. In addition, pro forma adjustments have been made to reflect the impact of the transaction-related costs discussed above. These unaudited pro forma combined results of operations have been prepared for comparative purposes only, and they do not purport to be indicative of the results of operations that actually would have resulted had the acquisition occurred on the date indicated, or that may result in the future. The amounts in the table are unaudited (in thousands, except per share data):
80
|
For the Year Ended
|
||||||
|
December 31,
|
||||||
|
2018
|
2017
|
|||||
|
(Unaudited)
|
||||||
|
Actual revenue
|
$
|
307,404
|
|
$
|
532,938
|
|
|
Supplemental pro forma revenue
|
$
|
314,096
|
|
$
|
541,921
|
|
|
Actual earnings
|
$
|
63,868
|
|
$
|
174,293
|
|
|
Supplemental pro forma earnings
|
$
|
51,591
|
|
$
|
105,604
|
|
|
Actual diluted earnings per share
|
$
|
1.81
|
|
$
|
4.87
|
|
|
Supplemental pro forma diluted earnings per share
|
$
|
1.46
|
|
$
|
2.95
|
|
Contingent Consideration
As discussed above, in conjunction with the Technicolor Acquisition, Technicolor will receive 42.5% of all of InterDigital's future cash receipts (net of estimated operating expenses) from InterDigital's new licensing efforts in the consumer electronics field; there will be no revenue sharing associated with InterDigital’s mobile industry licensing efforts. The portion of the future cash receipts relating to patents existing as of the date of the acquisition will be accounted for as a contingent consideration liability in accordance with ASC 805-30-25,
Business Combinations - Contingent Consideration.
The revenue sharing arrangement continues through December 31, 2038, and there are no minimum or maximum payments under the arrangement.
The estimated acquisition date fair value of the contingent consideration liability of
$18.6 million
was determined utilizing a Monte Carlo simulation model. This initial fair value measurement was based on the perspective of a market participant and includes significant unobservable inputs that are classified as Level 3 inputs within the fair value hierarchy and are discussed further within Note 7. The contingent consideration is subject to re-measurement each reporting period until it has been fully paid, and any adjustments to the fair value of the contingent consideration are reflected in operating expenses within the consolidated statements of income.
Madison Arrangement
As discussed above, in conjunction with the Technicolor Acquisition, effective July 30, 2018, we have assumed Technicolor’s rights and obligations under the Madison Arrangement, which commenced in 2015. The Madison Arrangement falls under the scope of ASC 808,
Collaborative Arrangements
(“ASC 808”). Refer to Note 2 for our significant accounting policy regarding collaborative arrangements.
Under the Madison Arrangement, Technicolor and Sony combined portions of their respective digital TV (“DTV”) and computer display monitor (“CDM”) patent portfolios and created a combined licensing opportunity to DTV and CDM manufacturers. Per an Agency and Management Services Agreement (“AMSA”) entered into upon the creation of the Madison Arrangement, Technicolor was initially appointed as sole licensing agent of the arrangement, and InterDigital has now assumed that role. As licensing agent, we are responsible for making decisions regarding the prosecution and maintenance of the combined patent portfolio and the licensing and enforcement of the combined patent portfolio in the field of use of DTVs and CDMs on an exclusive basis during the term of the AMSA in exchange for an agent fee.
We were deemed to be the principal in this collaborative arrangement under ASC 808, and, as such, in accordance with ASC 606-10-55-36
Revenue From Contracts with Customers - Principal Agent Considerations
, we record revenues generated on sales to third parties and costs incurred on a gross basis in the consolidated statements of income. Therefore, we recognize all royalties from customers as revenue and payments to Sony for its royalty share as operating expenses within the consolidated statements of income. Cost reimbursements for expenses incurred resulting from fulfilling the duties of the licensing agent are recorded as contra expenses. Amounts attributable to transactions arising from the Madison Arrangement between participants were not material during the year ended December 31, 2018.
Long-term debt
An affiliate of CPPIB Credit Investments Inc. ("CPPIB Credit"), a wholly owned subsidiary of Canada Pension Plan Investment Board, is a third-party investor in the Madison Arrangement. CPPIB Credit has made certain payments to Technicolor and Sony and has agreed to contribute cash to fund certain capital reserve obligations under the arrangement in exchange for a percentage of future revenues, specifically through September 11, 2030 in regard to the Technicolor patents.
Upon our assumption of Technicolor’s rights and obligations under the Madison Arrangement, our relationship with CPPIB Credit meets the criteria in ASC 470-10-25 -
Sales of Future Revenues or Various Other Measures of Income
(“ASC
81
470”), which relates to cash received from an investor in exchange for a specified percentage or amount of revenue or other measure of income of a particular product line, business segment, trademark, patent, or contractual right for a defined period. Under this guidance, we recognized the fair value of our contingent obligation to CPPIB Credit, as of the acquisition date, as long-term debt in our consolidated balance sheet. This initial fair value measurement is based on the perspective of a market participant and includes significant unobservable inputs which are classified as Level 3 inputs within the fair value hierarchy. The fair value of the long-term debt as of December 31, 2018 is disclosed within Note 7. Our repayment obligations are contingent upon future royalty revenues generated from the Madison Arrangement and there are no minimum or maximum payments under the arrangement.
Under ASC 470, amounts recorded as debt shall be amortized under the interest method. At each reporting period, we will review the discounted expected future cash flows over the life of the obligation. The Company made an accounting policy election to utilize the catch-up method when there is a change in the estimated future cash flows, whereby we will adjust the carrying amount of the debt to the present value of the revised estimated future cash flows, discounted at the original effective interest rate, with a corresponding adjustment recognized as interest expense within “
Other Expense (Net)
” in the consolidated statements of income. The effective interest rate as of the acquisition date was approximately 14.5%. This rate represents the discount rate that equates the estimated future cash flows with the fair value of the debt as of the acquisition date, and is used to compute the amount of interest to be recognized each period based on the estimated life of the future revenue streams. During the year ended December 31, 2018, we recognized $0.7 million of interest expense related to this debt which was included within “
Other Expense (Net)
” in the consolidated statements of income. Any future payments made to CPPIB Credit, or additional proceeds received from CPPIB Credit, will decrease or increase the long-term debt balance accordingly.
Restricted cash
Under the Madison Arrangement, the parties reserve cash in bank accounts to fund our activities to manage the portfolios. These accounts are custodial accounts for which the funds are restricted for this purpose. As of December 31, 2018, the Company had
$13.7 million
of restricted cash included within the consolidated balance sheet attributable to the Madison Arrangement. Refer to Note 6 for a reconciliation of cash, cash equivalents and restricted cash within the consolidated balance sheets.
Commitments
To receive consent from both Sony and CPPIB Credit to assume the rights and responsibilities of Technicolor under the Madison Arrangement, we committed to contributing cash to fund shortfalls in the Madison Arrangement, up to a maximum of
$25.0 million
, through 2020. A shortfall funding is only required in the scenario in which the restricted cash is not sufficient to fund current obligations. In the event that we fund a shortfall, any surplus cash resulting from subsequent royalty receipts would be used to repay our shortfall funding plus 25% interest in advance of distributions of royalties to either Sony or CPPIB Credit, assuming they have not participated in the funding of the shortfall. As of December 31, 2018, we have not contributed any shortfall funding.
Hillcrest Labs
On December 20, 2016, we acquired Hillcrest Laboratories, Inc. ("Hillcrest Labs"), a pioneer in sensor processing technology, for approximately
$48.0 million
in cash, net of
$0.4 million
cash acquired. The business combination transaction was accounted for using the acquisition method of accounting. We estimated the fair value of the intangible assets in this transaction through a combination of a discounted cash flow analysis (the income approach) and an analysis of comparable market transactions (the market approach). For the income approach, the inputs and assumptions used to develop these estimates were based on a market participant perspective and included estimates of projected revenues, discount rates, economic lives and income tax rates, among others. For the market approach, we applied judgment to identify the most comparable market transactions to this transaction. The purchase price allocation is now final.
Purchase price allocation
The following table summarizes the purchase price allocation made to the net tangible and intangible assets acquired and liabilities assumed as of the acquisition date, with the excess amount recorded as goodwill, which was representative of the expected synergies from the integration of Hillcrest Labs and its strategic fit within our organization (in thousands):
82
|
Amount
|
Estimated Useful Life (Years)
|
||||
|
Net tangible assets and liabilities:
|
|||||
|
Deferred tax assets and liabilities
|
$
|
2,221
|
|
||
|
Net working capital
|
(8,754
|
)
|
|||
|
$
|
(6,533
|
)
|
|||
|
Identified intangible assets:
|
|||||
|
Patents/existing technology
|
$
|
36,200
|
|
9 - 10
|
|
|
Trade name
|
600
|
|
9
|
||
|
Customer relationships
|
1,700
|
|
10
|
||
|
Goodwill
|
16,033
|
|
N/A
|
||
|
$
|
54,533
|
|
|||
|
Total purchase price
|
$
|
48,000
|
|
||
The amounts of revenue and earnings that would have been included in the Company’s consolidated statement of income for the year ended December 31, 2016 had the acquisition date been January 1, 2015 are as reflected in the table below. These amounts have been calculated after applying the Company's accounting policies and adjusting the results to reflect additional amortization that would have been charged assuming the fair value adjustments to amortizable intangible assets had been recorded as of January 1, 2015. In addition, pro forma adjustments have been made to reflect the impact of
$7.7 million
of transaction related costs. These unaudited pro forma combined results of operations have been prepared for comparative purposes only, and they do not purport to be indicative of the results of operations that actually would have resulted had the acquisition occurred on the date indicated, or that may result in the future. The amounts in the table are unaudited (in thousands, except per share data).
|
For the Year Ended
|
|||
|
December 31,
|
|||
|
2016
|
|||
|
(Unaudited)
|
|||
|
Actual revenue
|
$
|
665,854
|
|
|
Supplemental pro forma revenue
|
$
|
672,695
|
|
|
Actual earnings
|
$
|
309,001
|
|
|
Supplemental pro forma earnings
|
$
|
305,237
|
|
|
Actual diluted earnings per share
|
$
|
8.78
|
|
|
Supplemental pro forma diluted earnings per share
|
$
|
8.67
|
|
6. CASH, CASH EQUIVALENTS, RESTRICTED CASH AND MARKETABLE SECURITIES
Cash, Cash Equivalents and Restricted Cash
Cash, cash equivalents and restricted cash as of
December 31, 2018
and
2017
consisted of the following (in thousands):
|
|
December 31,
|
||||||
|
|
2018
|
2017
|
|||||
|
Money market and demand accounts
|
$
|
488,733
|
|
$
|
417,348
|
|
|
|
Commercial paper
|
—
|
|
15,666
|
|
|||
|
|
$
|
488,733
|
|
$
|
433,014
|
|
|
The following table provides a reconciliation of total cash, cash equivalents and restricted cash as of December 31, 2018 and 2017 within the consolidated balance sheets. The Company had no restricted cash prior to the Technicolor Acquisition which was completed in July 2018 and is discussed further within Note 5, "
Business Combinations
."
83
|
December 31,
|
|||||||
|
2018
|
2017
|
||||||
|
Cash and cash equivalents
|
$
|
475,056
|
|
$
|
433,014
|
|
|
|
Restricted cash included within prepaid and other current assets
|
13,677
|
|
—
|
|
|||
|
Total cash, cash equivalents and restricted cash
|
$
|
488,733
|
|
$
|
433,014
|
|
|
Marketable Securities
As of
December 31, 2018
and
2017
, the majority of our marketable securities have been classified as available-for-sale and are carried at fair value, with unrealized gains and losses reported net-of-tax as a separate component of shareholders’ equity. Substantially all of our investments are investment-grade government and corporate debt securities that have maturities of less than 2 years, and we have both the ability and intent to hold the investments until maturity. During 2016, we recorded other-than-temporary impairments of approximately
$0.2 million
, with no other-than-temporary impairments recorded during 2018 or 2017. The gross realized gains and losses on sales of marketable securities were not significant during the years ended December 31, 2018, 2017 and 2016.
Marketable securities as of
December 31, 2018
and
2017
consisted of the following (in thousands):
|
|
December 31, 2018
|
||||||||||||||
|
Cost
|
Gross Unrealized Gains
|
Gross Unrealized Losses
|
Fair Value
|
||||||||||||
|
Available-for-sale securities
|
|||||||||||||||
|
Commercial paper
|
$
|
14,548
|
|
$
|
—
|
|
$
|
—
|
|
$
|
14,548
|
|
|||
|
U.S. government securities
|
291,157
|
|
—
|
|
(1,581
|
)
|
289,576
|
|
|||||||
|
Corporate bonds, asset backed and other securities
|
167,579
|
|
5
|
|
(984
|
)
|
166,600
|
|
|||||||
|
Total available-for-sale securities
|
$
|
473,284
|
|
$
|
5
|
|
$
|
(2,565
|
)
|
$
|
470,724
|
|
|||
|
Reported in:
|
|||||||||||||||
|
Cash and cash equivalents
|
$
|
—
|
|
||||||||||||
|
Short-term investments
|
470,724
|
|
|||||||||||||
|
Total marketable securities
|
$
|
470,724
|
|
||||||||||||
|
|
December 31, 2017
|
||||||||||||||
|
Cost
|
Gross Unrealized Gains
|
Gross Unrealized Losses
|
Fair Value
|
||||||||||||
|
Available-for-sale securities
|
|||||||||||||||
|
Commercial paper
|
$
|
66,132
|
|
$
|
—
|
|
$
|
—
|
|
$
|
66,132
|
|
|||
|
U.S. government securities
|
513,645
|
|
—
|
|
(2,613
|
)
|
511,032
|
|
|||||||
|
Corporate bonds, asset backed and other securities
|
164,075
|
|
35
|
|
(627
|
)
|
163,483
|
|
|||||||
|
Total available-for-sale securities
|
$
|
743,852
|
|
$
|
35
|
|
$
|
(3,240
|
)
|
$
|
740,647
|
|
|||
|
Reported in:
|
|||||||||||||||
|
Cash and cash equivalents
|
$
|
15,666
|
|
||||||||||||
|
Short-term investments
|
724,981
|
|
|||||||||||||
|
Total marketable securities
|
$
|
740,647
|
|
||||||||||||
As of
December 31, 2018
and
2017
,
$390.9 million
and
$345.0 million
, respectively, of our short-term investments had contractual maturities within one year. The remaining portions of our short-term investments had contractual maturities within one to two years.
84
7. CONCENTRATION OF CREDIT RISK AND FAIR VALUE OF FINANCIAL ASSETS AND FINANCIAL LIABILITIES
Concentration of Credit Risk and Fair Value of Financial Instruments
Financial instruments that potentially subject us to concentration of credit risk consist primarily of cash equivalents, short-term investments and accounts receivable. We primarily place our cash equivalents and short-term investments in highly rated financial instruments and in United States government instruments.
Our accounts receivable are derived principally from patent license and technology solutions agreements. As of
December 31, 2018
and 2017,
five
and
three
licensees comprised
76%
and
96%
, respectively, of our accounts receivable balance. We perform ongoing credit evaluations of our licensees, who generally include large, multinational, wireless telecommunications equipment manufacturers. We believe that the book values of our financial instruments approximate their fair values.
Fair Value Measurements
We use various valuation techniques and assumptions when measuring the fair value of our assets and liabilities. We utilize market data or assumptions that market participants would use in pricing the asset or liability, including assumptions about risk and the risks inherent in the inputs to the valuation technique. This guidance established a hierarchy that prioritizes fair value measurements based on the types of input used for the various valuation techniques (market approach, income approach and cost approach). The levels of the hierarchy are described below:
Level 1 Inputs — Level 1 includes financial instruments for which quoted market prices for identical instruments are available in active markets.
Level 2 Inputs — Level 2 includes financial instruments for which there are inputs other than quoted prices included within Level 1 that are observable for the instrument such as quoted prices for similar instruments in active markets, quoted prices for identical or similar instruments in markets with insufficient volume or infrequent transactions (less active markets) or model-driven valuations in which significant inputs are observable or can be derived principally from, or corroborated by, observable market data, including market interest rate curves, referenced credit spreads and pre-payment rates.
Level 3 Inputs — Level 3 includes financial instruments for which fair value is derived from valuation techniques including pricing models and discounted cash flow models in which one or more significant inputs are unobservable, including the company’s own assumptions. The pricing models incorporate transaction details such as contractual terms, maturity and, in certain instances, timing and amount of future cash flows, as well as assumptions related to liquidity and credit valuation adjustments of marketplace participants.
Our assessment of the significance of a particular input to the fair value measurement requires judgment and may affect the valuation of financial assets and financial liabilities and their placement within the fair value hierarchy. We use quoted market prices for similar assets to estimate the fair value of our Level 2 investments.
Recurring Fair Value Measurements
Our financial assets are included within short-term investments on our consolidated balance sheets, unless otherwise indicated. Our financial assets and liabilities that are accounted for at fair value on a recurring basis are presented in the tables below as of
December 31, 2018
and
December 31, 2017
(in thousands):
85
|
|
Fair Value as of December 31, 2018
|
||||||||||||||
|
|
Level 1
|
Level 2
|
Level 3
|
Total
|
|||||||||||
|
Assets:
|
|
|
|
|
|||||||||||
|
Money market and demand accounts (a)
|
$
|
488,733
|
|
$
|
—
|
|
$
|
—
|
|
$
|
488,733
|
|
|||
|
Commercial paper (b)
|
—
|
|
14,548
|
|
—
|
|
14,548
|
|
|||||||
|
U.S. government securities
|
—
|
|
289,576
|
|
—
|
|
289,576
|
|
|||||||
|
Corporate bonds, asset backed and other securities
|
—
|
|
166,600
|
|
—
|
|
166,600
|
|
|||||||
|
|
$
|
488,733
|
|
$
|
470,724
|
|
$
|
—
|
|
$
|
959,457
|
|
|||
|
Liabilities:
|
|||||||||||||||
|
Contingent consideration resulting from the Technicolor Acquisition
|
—
|
|
—
|
|
19,800
|
|
19,800
|
|
|||||||
|
$
|
—
|
|
$
|
—
|
|
$
|
19,800
|
|
$
|
19,800
|
|
||||
|
|
Fair Value as of December 31, 2017
|
||||||||||||||
|
|
Level 1
|
Level 2
|
Level 3
|
Total
|
|||||||||||
|
Assets:
|
|
|
|
|
|||||||||||
|
Money market and demand accounts (a)
|
$
|
417,348
|
|
$
|
—
|
|
$
|
—
|
|
$
|
417,348
|
|
|||
|
Commercial paper (b)
|
—
|
|
66,132
|
|
—
|
|
66,132
|
|
|||||||
|
U.S. government securities
|
—
|
|
511,032
|
|
—
|
|
511,032
|
|
|||||||
|
Corporate bonds and asset backed securities
|
—
|
|
163,483
|
|
—
|
|
163,483
|
|
|||||||
|
|
$
|
417,348
|
|
$
|
740,647
|
|
$
|
—
|
|
$
|
1,157,995
|
|
|||
_______________
|
(a)
|
Included within cash and cash equivalents.
|
|
(b)
|
Includes
zero
and
$15.7 million
of commercial paper that is included within cash and cash equivalents as of December 31, 2018 and 2017, respectively.
|
Level 3 Fair Value Measurements
Contingent Consideration
As discussed further in Note 5, we completed the Technicolor Acquisition during third quarter 2018. In conjunction with the Technicolor Acquisition, we recognized a contingent consideration liability which is measured at fair value on a recurring basis using significant unobservable inputs classified as Level 3 measurements within the fair value hierarchy. We utilized a Monte Carlo simulation model to determine the estimated fair value of the contingent consideration liability. A Monte Carlo simulation uses random numbers together with volatility assumptions to generate individual paths, or trials, for variables of interest governed by a Geometric Brownian Motion in a risk-neutral framework. Level 3 significant unobservable inputs include the following (in thousands):
|
Significant Unobservable Input
|
Ranges
|
Weighted Average
|
|
Risk-adjusted discount rate for revenue
|
13.5% - 14.2%
|
13.9%
|
|
Credit risk discount rate
|
6.2% - 8.0%
|
7.1%
|
|
Revenue volatility
|
35.0%
|
35.0%
|
|
Projected years of earn out
|
2019 - 2030
|
N/A
|
Significant increases or decreases in any of those inputs in isolation could result in a significantly lower or higher fair value measurement. Adjustments to the fair value of contingent consideration are reflected in operating expenses within our consolidated statements of income.
The following table provides a reconciliation of the beginning and ending balances of our Level 3 fair value measurements from December 31, 2017 to December 31, 2018, which includes the contingent consideration liability resulting from the Technicolor Acquisition discussed further above and within Note 5. As of December 31, 2018, the Level 3 contingent consideration liability is included within "
Other long-term liabilities
" in the consolidated balance sheet.
86
|
Level 3 Fair Value Measurements
|
|||
|
Contingent Consideration Liability
|
|||
|
Balance as of December 31, 2017
|
$
|
—
|
|
|
Technicolor Acquisition - July 30, 2018
|
18,616
|
|
|
|
Reduction for payments
|
—
|
|
|
|
Changes in fair value recognized in the consolidated statements of income
|
1,184
|
|
|
|
Balance as of December 31, 2018
|
$
|
19,800
|
|
Fair Value of Long-Term Debt
2020 Senior Convertible Notes
The principal amount, carrying value and related estimated fair value of the Company's senior convertible debt reported in the consolidated balance sheets as of
December 31, 2018
and
December 31, 2017
was as follows (in thousands). The aggregate fair value of the principal amount of the senior convertible long-term debt is a Level 2 fair value measurement.
|
December 31, 2018
|
December 31, 2017
|
||||||||||||||||||||||
|
Principal
Amount
|
Carrying
Value
|
Fair
Value
|
Principal
Amount
|
Carrying
Value |
Fair
Value
|
||||||||||||||||||
|
Senior Convertible Long-Term Debt
|
$
|
316,000
|
|
$
|
298,951
|
|
$
|
331,595
|
|
$
|
316,000
|
|
$
|
285,126
|
|
$
|
377,029
|
|
|||||
Technicolor Acquisition Long-term Debt
As more fully disclosed in Note 5, we recognized long-term debt in conjunction with the Technicolor Acquisition, which closed in third quarter 2018. The carrying value and related estimated fair value of the Technicolor Acquisition long-term debt reported in the consolidated balance sheet as of
December 31, 2018
was as follows (in thousands). The aggregate fair value of the Technicolor Acquisition long-term debt is a Level 3 fair value measurement.
|
December 31, 2018
|
|||||||
|
Carrying
Value
|
Fair
Value
|
||||||
|
Technicolor Acquisition Long-Term Debt
|
$
|
18,428
|
|
$
|
19,100
|
|
|
Non-Recurring Fair Value Measurements
Investments in Other Entities
As discussed in Note 2, in conjunction with the adoption of ASU 2016-01 in the first quarter of 2018, we made an accounting policy election to utilize a measurement alternative for equity investments that do not have readily determinable fair values, which applies to our strategic investments in other entities. Under the alternative, our strategic investments in other entities that do not have readily determinable fair values are measured at cost, less any impairment, plus or minus changes resulting from observable price changes in orderly transactions for an identical or similar investment of the same issuer. Any adjustments to the carrying value of those investments are considered non-recurring fair value measurements. During the year ended December 31, 2018, we recognized an aggregate
$8.4 million
loss resulting from the sale of our entire ownership interest in one of our strategic investments and the impairment of a separate strategic investment. Certain of our investments in other entities may be seeking additional financing in the next twelve months. We will continue to review and monitor our investments in other entities for any indications of a change in fair value or impairment.
Patents
In fourth quarter 2018, we signed a patent licensing agreement with Sony. A portion of the future consideration for the agreement was in the form of patents that will be contributed to Convida Wireless. We have yet to record these patents on our balance sheet as of December 31, 2018 as they have not yet been transferred. However, we have determined the estimated fair value of the patents for determining the transaction price for revenue recognition purposes, which was estimated to be
$22.5 million
utilizing the cost approach and will be amortized over the patents' estimated useful lives once transferred. Additionally,
87
as previously disclosed, during 2017 and 2016, we entered in patent license agreements with LG and Huawei, respectively, for which a portion of the consideration was patents. The estimated fair value of the LG patents was
$19.7 million
, and the estimated fair value of the Huawei patents was
$20.7 million
. which are being amortized over their estimated useful lives. We estimated the fair value of the patents in the LG and Huawei transactions through a combination of a discounted cash flow analysis (the income approach) and an analysis of comparable market transactions (the market approach).
We estimated the fair value of the patents in these transactions through a combination of a discounted cash flow analysis (the income approach), an analysis of comparable market transactions (the market approach), and/or by quantifying the amount of money required to replace the future service capability of the assets (the cost approach). For the income approach, the inputs and assumptions used to develop these estimates were based on a market participant perspective and included estimates of projected royalties, discount rates, economic lives and income tax rates, among others. For the market approach, judgment was applied as to which market transactions were most comparable to the transaction. For the cost approach, we utilized the historical cost of assets of similar technologies to determine the estimated replacement cost, including research, development, testing and patent application fees.
8. PROPERTY AND EQUIPMENT
Property and equipment, net is comprised of the following (in thousands):
|
|
December 31,
|
||||||
|
|
2018
|
2017
|
|||||
|
Computer equipment and software
|
$
|
20,876
|
|
$
|
20,003
|
|
|
|
Engineering and test equipment
|
4,168
|
|
4,034
|
|
|||
|
Building and improvements
|
3,711
|
|
3,624
|
|
|||
|
Leasehold improvements
|
11,364
|
|
9,711
|
|
|||
|
Furniture and fixtures
|
1,549
|
|
1,279
|
|
|||
|
Property and equipment, gross
|
41,668
|
|
38,651
|
|
|||
|
Less: accumulated depreciation
|
(31,617
|
)
|
(27,978
|
)
|
|||
|
Property and equipment, net
|
$
|
10,051
|
|
$
|
10,673
|
|
|
Depreciation expense was
$3.7 million
,
$3.9 million
and
$4.1 million
in
2018
,
2017
and
2016
, respectively. Depreciation expense included depreciation of computer software costs of
$0.3 million
,
$0.5 million
and
$1.0 million
in
2018
,
2017
and
2016
, respectively. Accumulated depreciation related to computer software costs was
$9.2 million
and
$8.8 million
as of
December 31, 2018
and
2017
, respectively. The net book value of our computer software was
$0.3 million
and
$0.5 million
as of
December 31, 2018
and
2017
, respectively.
During second quarter 2015, we sold our facility in King of Prussia, Pennsylvania, to a third party and entered into a limited leaseback arrangement for a period not to exceed one year, for net consideration of
$4.5 million
. The
$3.4 million
gain related to the sale was recorded within "
Other Expense (Net)
" in our consolidated statements of operations, and the assets sold were removed from Property and Equipment, at the completion of the lease term in second quarter 2016.
9. PATENTS AND OTHER INTANGIBLE ASSETS
Patents
As of December 31, 2018 and 2017, patents consisted of the following (in thousands, except for useful life data):
|
|
December 31,
|
||||||
|
|
2018
|
2017
|
|||||
|
Weighted average estimated useful life (years)
|
10.0
|
|
10.0
|
|
|||
|
Gross patents
|
$
|
851,846
|
|
$
|
660,886
|
|
|
|
Accumulated amortization
|
(397,279
|
)
|
(335,478
|
)
|
|||
|
Patents, net
|
$
|
454,567
|
|
$
|
325,408
|
|
|
Amortization expense related to capitalized patent costs was
$61.8 million
,
$52.9 million
and
$48.6 million
in
2018
,
2017
and
2016
, respectively. These amounts are recorded within the "
Patent administration and licensing"
line of our Consolidated Statements of Income.
88
The estimated aggregate amortization expense for the next five years related to our patents balance as of
December 31, 2018
is as follows (in thousands):
|
2019
|
$
|
70,797
|
|
|
2020
|
65,994
|
|
|
|
2021
|
61,379
|
|
|
|
2022
|
57,084
|
|
|
|
2023
|
51,152
|
|
|
Other Intangible Assets
As of December 31, 2018 and 2017, intangible assets excluding patents are included in "
Other Non-Current Assets
" on the Consolidated Balance Sheets and consisted of the following (in thousands):
|
December 31, 2018
|
December 31, 2017
|
||||||||||||||||||||||||
|
Average Life
(Years)
|
Gross Assets
|
Accumulated Amortization
|
Net
|
Gross Assets
|
Accumulated Amortization
|
Net
|
|||||||||||||||||||
|
Trade Names
|
9
|
$
|
600
|
|
$
|
(133
|
)
|
$
|
467
|
|
$
|
600
|
|
$
|
(67
|
)
|
$
|
533
|
|
||||||
|
Customer Relationships
|
10
|
1,700
|
|
(340
|
)
|
1,360
|
|
1,700
|
|
(170
|
)
|
1,530
|
|
||||||||||||
|
$
|
2,300
|
|
$
|
(473
|
)
|
$
|
1,827
|
|
$
|
2,300
|
|
$
|
(237
|
)
|
$
|
2,063
|
|
||||||||
As of December 31, 2018, the estimated future amortization expense of these intangible assets is as follows (in thousands):
|
2019
|
$
|
237
|
|
|
2020
|
237
|
|
|
|
2021
|
237
|
|
|
|
2022
|
237
|
|
|
|
2023
|
237
|
|
|
|
Thereafter
|
642
|
|
|
|
$
|
1,827
|
|
|
|
10.
|
OBLIGATIONS
|
Refer to Note 5, "
Business Combinations,
" and Note 7, "
Concentration of Credit Risk and Fair Value of Financial Assets and Financial Liabilities
," for information regarding the long-term debt recognized during 2018 resulting from the Technicolor Acquisition.
Long-term debt obligations, excluding the long-term debt resulting from the Technicolor Acquisition, are comprised of the following (in thousands):
|
|
December 31,
|
||||||
|
|
2018
|
2017
|
|||||
|
1.50% Senior Convertible Notes due 2020
|
$
|
316,000
|
|
$
|
316,000
|
|
|
|
Less:
|
|||||||
|
Unamortized interest discount
|
(15,428
|
)
|
(27,863
|
)
|
|||
|
Deferred financing costs
|
(1,621
|
)
|
(3,011
|
)
|
|||
|
Total net carrying amount of 2020 Notes
|
298,951
|
|
285,126
|
|
|||
|
Less: Current portion of long-term debt
|
—
|
|
—
|
|
|||
|
Long-term net carrying amount of 2020 Notes
|
$
|
298,951
|
|
$
|
285,126
|
|
|
There were no capital leases as of
December 31, 2018
or
December 31, 2017
.
89
Maturities of principal of the long-term debt obligations of the Company as of
December 31, 2018
, excluding the long-term debt resulting from the Technicolor Acquisition, are as follows (in thousands):
|
2019
|
$
|
—
|
|
|
2020
|
316,000
|
|
|
|
2021
|
—
|
|
|
|
2022
|
—
|
|
|
|
2023
|
—
|
|
|
|
Thereafter
|
—
|
|
|
|
|
$
|
316,000
|
|
2016 Senior Convertible Notes, and Related Note Hedge and Warrant Transactions
In April 2011, we issued
$230.0 million
in aggregate principal amount of
2.50%
Senior Convertible Notes due 2016 (the “2016 Notes”), which matured and were repaid in full on March 15, 2016.
In connection with the offering of the 2016 Notes, on March 29 and March 30, 2011, we entered into convertible note hedge transactions that covered, subject to customary anti-dilution adjustments, approximately
3.5 million
and approximately
0.5 million
shares of our common stock, respectively, at an initial strike price that corresponded to the initial conversion price of the 2016 Notes and were exercisable upon conversion of the 2016 Notes. In addition, on the same dates, we sold warrants to acquire, subject to customary anti-dilution adjustments, approximately
3.5 million
shares and approximately
0.5 million
shares, respectively, of common stock. The warrants had a final strike price of
$62.95
per share, as adjusted in August 2016. The warrants became exercisable and expired in daily tranches from June 15, 2016 through August 10, 2016. The market price of our common stock did not exceed the strike price of the warrants on any warrant expiration date in second quarter 2016; during third quarter 2016, we issued
23,667
shares of common stock pursuant to these warrants.
Accounting Treatment of the 2016 Notes and Related Convertible Note Hedge and Warrant Transactions
The offering of the 2016 Notes on March 29, 2011 was for
$200.0 million
and included an overallotment option that allowed the initial purchaser to purchase up to an additional
$30.0 million
aggregate principal amount of 2016 Notes. The initial purchaser exercised its overallotment option on March 30, 2011, bringing the total amount of 2016 Notes issued on April 4, 2011 to
$230.0 million
.
In connection with the offering of the 2016 Notes, as discussed above, the Company entered into convertible note hedge transactions with respect to its common stock. The
$42.7 million
cost of the convertible note hedge transactions was partially offset by the proceeds from the sale of the warrants described above, resulting in a net cost of
$10.9 million
.
Existing accounting guidance provides that the March 29, 2011 convertible note hedge and warrant contracts be treated as derivative instruments for the period during which the initial purchaser's overallotment option was outstanding. Once the overallotment option was exercised on March 30, 2011, the March 29, 2011 convertible note hedge and warrant contracts were reclassified to equity, as the settlement terms of the Company's note hedge and warrant contracts both provide for net share settlement. There was no material net change in the value of these convertible note hedges and warrants during the one day they were classified as derivatives and the equity components of these instruments will not be adjusted for subsequent changes in fair value.
Under current accounting guidance, the Company bifurcated the proceeds from the offering of the 2016 Notes between the liability and equity components of the debt. On the date of issuance, the liability and equity components were calculated to be approximately
$187.0 million
and
$43.0 million
, respectively. The initial
$187.0 million
liability component was determined based on the fair value of similar debt instruments excluding the conversion feature. The initial
$43.0 million
(
$28.0 million
net of tax) equity component represents the difference between the fair value of the initial $187.0 million in debt and the
$230.0 million
of gross proceeds. The related initial debt discount of
$43.0 million
was being amortized using the effective interest method over the life of the 2016 Notes. An effective interest rate of
7%
was used to calculate the debt discount on the 2016 Notes.
In connection with the above-noted transactions, the Company incurred
$8.0 million
of directly related costs. The initial purchaser's transaction fees and related offering expenses were allocated to the liability and equity components of the debt in proportion to the allocation of proceeds and accounted for as debt issuance costs. We allocated
$6.5 million
of debt issuance costs to the liability component of the debt, which were capitalized as deferred financing costs. These costs were amortized to interest expense over the term of the debt using the effective interest method. The remaining
$1.5 million
of costs allocated to the equity component of the debt were recorded as a reduction of the equity component of the debt.
90
2020 Senior Convertible Notes, and Related Note Hedge and Warrant Transactions
On March 11, 2015, we issued
$316.0 million
in aggregate principal amount of
1.50%
Senior Convertible Notes due 2020 (the “2020 Notes”). The 2020 Notes bear interest at a rate of
1.50%
per year, payable in cash on March 1 and September 1 of each year, commencing September 1, 2015, and mature on March 1, 2020, unless earlier converted or repurchased.
The 2020 Notes will be convertible into cash, shares of our common stock or a combination thereof, at our election, at a current conversion rate of
14.0506
shares of common stock per
$1,000
principal amount of 2020 Notes (which is equivalent to a conversion price of approximately
$71.17
per share as of December 31, 2018), as adjusted pursuant to the terms of the indenture for the 2020 Notes (the "Indenture"). The conversion rate, and thus the conversion price, may be adjusted under certain circumstances, including in connection with conversions made following certain fundamental changes and under other circumstances set forth in the Indenture. It is our current intent and policy to settle all conversions through combination settlement of cash and shares of common stock, with a specified dollar amount of
$1,000
per
$1,000
principal amount of the 2020 Notes and any remaining amounts in shares.
Prior to 5:00 p.m., New York City time, on the business day immediately preceding December 1, 2019, the 2020 Notes will be convertible only under certain circumstances as set forth in the indenture to the 2020 Notes, including on any date during any calendar quarter (and only during such calendar quarter) if the closing sale price of our common stock was more than 130% of the applicable conversion price (approximately
$92.52
based on the current conversion price) on each applicable trading day for at least 20 trading days in the period of the 30 consecutive trading days ending on the last trading day of the immediately preceding calendar quarter.
Commencing on December 1, 2019, the 2020 Notes will be convertible in multiples of
$1,000
principal amount, at any time prior to 5:00 p.m., New York City time, on the second scheduled trading day immediately preceding the maturity date of the 2020 Notes.
The Company may not redeem the 2020 Notes prior to their maturity date.
On March 5 and March 9, 2015, in connection with the offering of the 2020 Notes, we entered into convertible note hedge transactions that cover approximately
3.8 million
and approximately
0.6 million
shares of our common stock, respectively, and they have a strike price that corresponds to the conversion price of the 2020 Notes and are exercisable upon conversion of the 2020 Notes.
The cost of the March 5 and March 9, 2015 convertible note hedge transactions was approximately
$51.7 million
and approximately
$7.7 million
, respectively.
On March 5 and March 9, 2015, we sold warrants to acquire approximately
3.8 million
and approximately
0.6 million
, respectively, of common stock, subject to customary anti-dilution adjustments. As of December 31, 2018, the warrants had a strike price of approximately
$86.99
per share, as adjusted. The warrants become exercisable and expire in daily tranches over a three-and-a-half-month period starting in June 2020. As consideration for the warrants issued on March 5 and March 9, 2015, we received approximately
$37.3 million
and approximately
$5.6 million
, respectively.
The Company also repurchased
0.8 million
shares of our common stock at
$53.61
per share, the closing price of the stock on March 5, 2015, from institutional investors through one of the initial purchasers and its affiliate, as our agent, concurrently with the pricing of the offering of the 2020 Note
On April 3, 2018, in connection with the reorganization of the Company’s holding company structure, the predecessor company (now known as InterDigital Wireless, Inc., the "Predecessor Company") and the successor company (now known as InterDigital, Inc., the "Successor Company") entered into a First Supplemental Indenture (the “Supplemental Indenture”) to the Indenture with the trustee. The Supplemental Indenture effected certain amendments to the Indenture in connection with the Reorganization, which, among other things, amended the conversion right of the 2020 Notes so that at the effective time of the Reorganization, the holder of each Note outstanding as of the effective time of the Reorganization will have the right to convert, subject to the terms of the Indenture, each $1,000 principal amount of such 2020 Note into the number of shares of the Successor Company’s common stock that a holder of a number of shares of the Predecessor Company’s common stock equal to the conversion rate immediately prior to the effective time of the Reorganization would have been entitled to receive upon the Reorganization. In addition, pursuant to the Supplemental Indenture, the Successor Company guaranteed the Predecessor Company’s obligations under the 2020 Notes and the Indenture.
Accounting Treatment of the 2020 Notes and Related Convertible Note Hedge and Warrant Transactions
The offering of the 2020 Notes on March 5, 2015 was for
$275.0 million
and included an overallotment option that allowed the initial purchasers to purchase up to an additional
$41.0 million
aggregate principal amount of 2020 Notes. The
91
initial purchasers exercised their overallotment option on March 9, 2015, bringing the total amount of 2020 Notes issued on March 11, 2015 to
$316.0 million
.
In connection with the offering of the 2020 Notes, as discussed above, InterDigital entered into convertible note hedge transactions with respect to its common stock. The
$59.4 million
cost of the convertible note hedge transactions was partially offset by the proceeds from the sale of the warrants described above, resulting in a net cost of
$16.5 million
. Both the convertible note hedge and warrants were classified as equity.
The Company bifurcated the proceeds from the offering of the 2020 Notes between liability and equity components. On the date of issuance, the liability and equity components were calculated to be approximately
$256.7 million
and
$59.3 million
, respectively. The initial
$256.7 million
liability component was determined based on the fair value of similar debt instruments excluding the conversion feature. The initial
$59.3 million
(
$38.6 million
net of tax) equity component represents the difference between the fair value of the initial
$256.7 million
in debt and the
$316.0 million
of gross proceeds. The related initial debt discount of
$59.3 million
is being amortized using the effective interest method over the life of the 2020 Notes. An effective interest rate of
5.89%
was used to calculate the debt discount on the 2020 Notes.
In connection with the above-noted transactions, the Company incurred
$9.3 million
of directly related costs. The initial purchasers' transaction fees and related offering expenses were allocated to the liability and equity components in proportion to the allocation of proceeds and accounted for as debt and equity issuance costs, respectively. We allocated
$7.0 million
of debt issuance costs to the liability component, which were capitalized as deferred financing costs. These costs are being amortized to interest expense over the term of the debt using the effective interest method. The remaining
$2.4 million
of costs allocated to the equity component were recorded as a reduction of the equity component.
The following table presents the amount of interest cost recognized
for the years ended
December 31, 2018
, 2017 and 2016 related to the contractual interest coupon, accretion of the debt discount and the amortization of financing costs (in thousands).
|
For the Year Ended December 31,
|
||||||||||||
|
2018
|
2017
|
2016
|
||||||||||
|
Contractual coupon interest
|
$
|
4,740
|
|
$
|
4,740
|
|
$
|
6,178
|
|
|||
|
Accretion of debt discount
|
12,434
|
|
11,715
|
|
13,536
|
|
||||||
|
Amortization of financing costs
|
1,390
|
|
1,390
|
|
1,716
|
|
||||||
|
Total
|
$
|
18,564
|
|
$
|
17,845
|
|
$
|
21,430
|
|
|||
|
11.
|
COMMITMENTS
|
We have entered into various operating lease agreements. Total rent expense, primarily for office space, was
$4.8 million
,
$3.9 million
and
$4.2 million
in
2018
,
2017
and
2016
, respectively. Minimum future payments for operating leases and purchase commitments as of
December 31, 2018
are as follows (in thousands):
|
2019
|
$
|
10,856
|
|
|
2020
|
8,648
|
|
|
|
2021
|
7,883
|
|
|
|
2022
|
2,920
|
|
|
|
2023
|
2,184
|
|
|
|
Thereafter
|
5,582
|
|
|
12. LITIGATION AND LEGAL PROCEEDINGS
ARBITRATIONS AND COURT PROCEEDINGS (OTHER THAN DE DISTRICT COURT ACTIONS RELATED TO USITC PROCEEDINGS)
2012 Huawei China Proceedings
On February 21, 2012, InterDigital was served with two complaints filed by Huawei Technologies Co., Ltd. in the Shenzhen Intermediate People's Court in China on December 5, 2011. The first complaint named as defendants InterDigital,
92
Inc. and its wholly owned subsidiaries InterDigital Technology Corporation and InterDigital Communications, LLC (now InterDigital Communications, Inc.), and alleged that InterDigital had abused its dominant market position in the market for the licensing of essential patents owned by InterDigital by engaging in allegedly unlawful practices, including differentiated pricing, tying and refusal to deal. The second complaint named as defendants the Company's wholly owned subsidiaries InterDigital Technology Corporation, InterDigital Communications, LLC (now InterDigital Communications, Inc.), InterDigital Patent Holdings, Inc. and IPR Licensing, Inc. and alleged that InterDigital had failed to negotiate on FRAND terms with Huawei. Huawei asked the court to determine the FRAND rate for licensing essential Chinese patents to Huawei and also sought compensation for its costs associated with this matter.
On February 4, 2013, the Shenzhen Intermediate People's Court issued rulings in the two proceedings. With respect to the first complaint, the court decided that InterDigital had violated the Chinese Anti-Monopoly Law by (i) making proposals for royalties from Huawei that the court believed were excessive, (ii) tying the licensing of essential patents to the licensing of non-essential patents, (iii) requesting as part of its licensing proposals that Huawei provide a grant-back of certain patent rights to InterDigital and (iv) commencing a USITC action against Huawei while still in discussions with Huawei for a license. Based on these findings, the court ordered InterDigital to cease the alleged excessive pricing and alleged improper bundling of InterDigital's Chinese essential and non-essential patents, and to pay Huawei 20.0 million RMB (approximately $2.9 million based on the exchange rate as of December 31, 2018) in damages related to attorneys’ fees and other charges, without disclosing a factual basis for its determination of damages. The court dismissed Huawei's remaining allegations, including Huawei's claim that InterDigital improperly sought a worldwide license and improperly sought to bundle the licensing of essential patents on multiple generations of technologies. With respect to the second complaint, the court determined that, despite the fact that the FRAND requirement originates from ETSI's Intellectual Property Rights policy, which refers to French law, InterDigital's license offers to Huawei should be evaluated under Chinese law. Under Chinese law, the court concluded that the offers did not comply with FRAND. The court further ruled that the royalties to be paid by Huawei for InterDigital's 2G, 3G and 4G essential Chinese patents under Chinese law should not exceed 0.019% of the actual sales price of each Huawei product.
On March 11, 2013, InterDigital filed notices of appeal with respect to the judgments in both proceedings, seeking reversal of the court’s February 4, 2013 rulings. On October 16, 2013, the Guangdong Province High Court issued a ruling affirming the ruling of the Shenzhen Intermediate People's Court in the second proceeding, and on October 21, 2013, issued a ruling affirming the ruling of the Shenzhen Intermediate People's Court in the first proceeding.
InterDigital believes that the decisions are seriously flawed both legally and factually. For instance, in determining a purported FRAND rate, the Chinese courts applied an incorrect economic analysis by evaluating InterDigital’s lump-sum 2007 patent license agreement with Apple (the “2007 Apple PLA”) in hindsight to posit a running royalty rate. Indeed, the ALJ in USITC Inv. No. 337-TA-800 rejected that type of improper analysis. Moreover, the Chinese courts had an incomplete record and applied incorrect facts, including with respect to the now-expired and superseded 2007 Apple PLA, which had been found in an arbitration between InterDigital and Apple to be limited in scope.
On April 14, 2014, InterDigital filed a petition for retrial of the second proceeding with the Chinese Supreme People’s Court (“SPC”), seeking dismissal of the judgment or at least a higher, market-based royalty rate for a license to InterDigital’s Chinese standards-essential patents (“SEPs”). The petition for retrial argues, for example, that (1) the lower court improperly determined a Chinese FRAND running royalty rate by using as a benchmark the 2007 Apple lump sum fixed payment license agreement, and looking in hindsight at the unexpectedly successful sales of Apple iPhones to construct an artificial running royalty rate that neither InterDigital nor Apple could have intended and that would have varied significantly depending on the relative success or failure in hindsight of Apple iPhone sales; (2) the 2007 Apple PLA was also an inappropriate benchmark because its scope of product coverage was significantly limited as compared to the license that the court was considering for Huawei, particularly when there are other more comparable license agreements; and (3) if the appropriate benchmarks had been used, and the court had considered the range of royalties offered by other similarly situated SEP holders in the wireless telecommunications industry, the court would have determined a FRAND royalty that was substantially higher than 0.019%, and would have found, consistent with findings of the ALJ’s initial determination in the USITC 337-TA-800 proceeding, that there was no proof that InterDigital’s offers to Huawei violated its FRAND commitments.
The SPC held a hearing on October 31, 2014, regarding whether to grant a retrial and requested that both parties provide additional information regarding the facts and legal theories underlying the case. The SPC convened a second hearing on April 1, 2015 regarding whether to grant a retrial. On December 24, 2018, InterDigital was notified that the SPC granted InterDigital’s petition for retrial of the October 16, 2013 Guangdong Province High Court decision. The SPC also issued a mediation order that terminated the proceeding. The SPC’s grant of InterDigital’s retrial petition suspends enforcement of the decision of the Guangdong High Court and, combined with the SPC’s issuance of the mediation order, effectively vacates the Guangdong High Court’s decision. There are no further proceedings in this matter.
93
ZTE China Proceedings
On July 10 and 11, 2014, InterDigital was served with two complaints filed by ZTE Corporation in the Shenzhen Intermediate People's Court in China on April 3, 2014. The first complaint names as defendants the Company's wholly owned subsidiaries InterDigital Technology Corporation, InterDigital Communications, Inc., InterDigital Patent Holdings, Inc. and IPR Licensing, Inc. This complaint alleges that InterDigital has failed to comply with its FRAND obligations for the licensing of its Chinese standards-essential patents. ZTE is asking the court to determine the FRAND rate for licensing InterDigital’s standards-essential Chinese patents to ZTE and also seeks compensation for its litigation costs associated with this matter. The second complaint names as defendants InterDigital, Inc. and its wholly owned subsidiaries InterDigital Technology Corporation and InterDigital Communications, Inc. This complaint alleges that InterDigital has a dominant market position in China and the United States in the market for the licensing of essential patents owned by InterDigital, and abused its dominant market position in violation of the Chinese Anti-Monopoly Law by engaging in allegedly unlawful practices, including excessively high pricing, tying, discriminatory treatment, and imposing unreasonable trading conditions. ZTE originally sought relief in the amount of 20.0 million RMB (approximately $2.9 million based on the exchange rate as of December 31, 2018), an order requiring InterDigital to cease the allegedly unlawful conduct and compensation for its litigation costs associated with this matter.
On August 7, 2014, InterDigital filed petitions challenging the jurisdiction of the Shenzhen Intermediate People's Court to hear the actions. On August 28, 2014, the court denied InterDigital’s jurisdictional challenge with respect to the anti-monopoly law case. InterDigital filed an appeal of this decision on September 26, 2014. On September 28, 2014, the court denied InterDigital’s jurisdictional challenge with respect to the FRAND case, and InterDigital filed an appeal of that decision on October 27, 2014. On December 18, 2014, the Guangdong High Court issued decisions on both appeals upholding the Shenzhen Intermediate Court’s decisions that it had jurisdiction to hear these cases. On February 10, 2015, InterDigital filed a petition for retrial with the Supreme People’s Court regarding its jurisdictional challenges to both cases.
The Shenzhen Court held hearings on the anti-monopoly law case on May 11, 13, 15 and 18, 2015. At the May hearings, ZTE withdrew its claims alleging discriminatory treatment and the imposition of unfair trading conditions and increased its damages claim to 99.8 million RMB (approximately $14.5 million based on the exchange rate as of December 31, 2018). The Shenzhen Court held hearings in the FRAND case on July 29-31, 2015 and held a second hearing on the anti-monopoly law case on October 12, 2015.
On September 18, 2018, ZTE independently filed a petition with the Shenzhen Court to withdraw the complaint in its FRAND case against InterDigital, and on September 28, 2018, the Shenzhen Court granted ZTE’s petition and dismissed the FRAND case without prejudice. On October 25, 2018, ZTE independently filed a petition with the Shenzhen Court to withdraw the complaint in its anti-monopoly law case against InterDigital, and on October 26, 2018, the Shenzhen Court granted ZTE’s petition and dismissed the anti-monopoly law case without prejudice.
Asustek Actions
On April 15, 2015, Asustek Computer Incorporated (“Asus”) filed a complaint in the CA Northern District Court against InterDigital, Inc., and its subsidiaries InterDigital Communications, Inc., InterDigital Technology Corporation, IPR Licensing, Inc., and InterDigital Patent Holdings, Inc. The complaint asserted the following causes of action: violation of Section Two of the Sherman Act, violation of Section 17200 of the California Business and Professions Code, breach of contract resulting from ongoing negotiations, breach of contract leading to and resulting in the parties’ April 2008 patent license agreement (the “2008 Asus PLA”), promissory estoppel, waiver, and fraudulent inducement to contract. Among other allegations, Asus alleged that InterDigital breached its FRAND commitment. As relief, Asus sought a judgment that the 2008 Asus PLA is void or unenforceable, damages in the amount of excess royalties Asus paid under the 2008 Asus PLA plus interest, a judgment setting the proper FRAND terms and conditions for InterDigital’s patent portfolio, an order requiring InterDigital to grant Asus a license on FRAND terms and conditions, and punitive damages and other relief.
In response, on May 30, 2015, InterDigital filed an Arbitration Demand with the ICDR. InterDigital claimed that Asus breached the 2008 Asus PLA’s dispute resolution provision by filing its CA Northern District Court lawsuit and sought declaratory relief that it is not liable for any of the claims in Asus’s complaint. On June 2, 2015, InterDigital filed in the CA Northern District Court a motion to compel arbitration on each of Asus’s claims. On August 25, 2015, the court granted InterDigital’s motion for all of Asus’s claims except its claim for breach of contract resulting from ongoing negotiations. Aside from this claim, the court ruled that the issue of arbitrability should be decided by an arbitrator, and stayed the proceedings pending that determination.
Asus asserted counterclaims in the arbitration that mirrored its CA Northern District Court claims, except that it did not assert the breach of contract claim that the court determined was not arbitrable and it added a claim of violation of the
94
Delaware Consumer Fraud Act. Asus also contended that its counterclaims were not arbitrable. InterDigital added a claim for breach of the 2008 Asus PLA’s confidentiality provision.
On July 14, 2016, Asus filed a motion to lift the stay in the CA Northern District Court proceeding along with a notice of the arbitral tribunal’s decision on arbitrability, informing the court of the arbitrators’ decision that, other than InterDigital’s breach of contract claims and Asus’s fraudulent inducement claim, no other claim or counterclaim is arbitrable. Asus then filed in the CA Northern District Court an amended complaint on August 18, 2016. This amended complaint includes all of the claims in Asus’s first CA Northern District Court complaint except fraudulent inducement and adds a claim of violation of the Delaware Consumer Fraud Act. It seeks the same relief as its first CA Northern District Court complaint, but also seeks a ruling that each of InterDigital’s patents “declared [to standards-setting organizations] to be essential or potentially essential” is unenforceable and any contracts InterDigital entered into in furtherance of its unlawful conduct are void. On September 8, 2016, InterDigital filed its answer and counterclaims to Asus’s amended complaint. It denied Asus’s claims and filed a counterclaim for declaratory judgment that Asus’s tort claims are invalid or preempted as applied under the First Amendment to the U.S. Constitution, the Patent Clause of the U.S. Constitution, and Title 35 of the U.S. Code. On September 28, 2016, Asus answered and denied InterDigital’s counterclaims.
With respect to its arbitration counterclaim for fraudulent inducement, Asus stated in its pleadings that it was seeking return of excess royalties (which totaled close to $63 million as of the August 2016 date referenced in the pleadings and had increased with additional royalty payments made by Asus since such time), plus interest, costs and attorneys’ fees. The evidentiary hearing in the arbitration was held in January 2017, and the parties presented oral closing arguments on March 22, 2017. On August 2, 2017, the arbitral tribunal issued its Final Award. The tribunal fully rejected Asus’s counterclaim, finding that InterDigital did not fraudulently induce Asus to enter into the 2008 Asus PLA. Accordingly, the tribunal dismissed Asus’s fraudulent inducement counterclaim in its entirety. The tribunal also dismissed InterDigital’s claims that Asus breached the confidentiality provisions and the dispute resolution provisions of the 2008 Asus PLA. On October 20, 2017, InterDigital and Asus jointly moved to confirm both the tribunal’s Final Award and the Interim Award on Jurisdiction in the CA Northern District. The court confirmed both awards on October 25, 2017.
On April 16, 2018, InterDigital filed a motion in the CA Northern District Court proceeding for leave to amend its counterclaims to include a claim of intentional interference with contract. On June 12, 2018, the court denied this motion.
On April 17, 2018, the parties served opening expert reports in the CA Northern District Court proceeding. Asus’s damages expert contends that Asus is currently owed damages in the amount of $75.9 million based on its claims that InterDigital charged royalties inconsistent with its FRAND commitments. Those damages, which represent a substantial portion of the royalties paid by Asus through third quarter 2017, do not reflect Asus’s most recent royalty payments. Asus also seeks interest, costs and attorneys’ fees, as well as, in connection with its Sherman Act claim, treble damages.
On August 16, 2018, the parties filed motions for summary judgment in the CA Northern District Court proceeding. The parties filed oppositions on September 13, 2018 and replies on September 27, 2018, and the court held an oral argument on October 11, 2018.
On December 20, 2018, the CA Northern District Court issued an order on the parties’ motions for summary judgment. InterDigital’s motion was granted in part and denied in part, and Asus’s motion was denied in its entirety. The court: (1) granted summary judgment that Asus is judicially estopped from arguing that the 2008 Asus PLA is not FRAND compliant in light of Asus’s prior inconsistent positions; (2) denied to the extent ruled on by the courtInterDigital’s motion that issue preclusion prevents Asus from re-litigating issues decided in the arbitration; (3) granted summary judgment that Asus cannot invalidate the 2008 Asus PLA on the theory that, even if FRAND when signed, the 2008 Asus PLA became non-FRAND thereafter; (4) denied InterDigital’s motion for summary judgment that Asus’s Sherman Act claim fails as a matter of law; and (5) granted summary judgment that Asus’s promissory estoppel and California UCL claims fail as a matter of law. In addition, the court denied Asus’s motion for summary judgment that, as a matter of law, InterDigital breached its contractual obligation to license its essential patents on FRAND terms and conditions by engaging in discriminatory licensing practices. On December 21, 2018, the court referred the case to a magistrate judge for a settlement conference. The settlement conference was held on February 14, 2019. A settlement was not reached. The trial in the CA Northern District Court proceeding is scheduled for May 6-17, 2019.
The Company has not recorded any accrual at December 31, 2018, for contingent losses associated with the CA Northern District Court Proceeding. While a material loss is reasonably possible, the Company cannot estimate the potential range of loss given the range of possible outcomes, as this matter is not at a sufficiently advanced stage to allow for such an estimate.
95
2019 Huawei China Proceeding
On January 3, 2019, InterDigital was notified that a civil complaint was filed on January 2, 2019, by Huawei Technologies Co., Ltd. and certain of its subsidiaries against InterDigital, Inc. and certain of its subsidiaries in the Shenzhen Intermediate People’s Court. The complaint seeks a ruling that the InterDigital defendants have violated an obligation to license their patents that are essential to 3G, 4G and 5G wireless telecommunication standards on fair, reasonable and non-discriminatory terms and conditions. The complaint also seeks a determination of the terms for licensing all of the InterDigital defendants’ Chinese patents that are essential to 3G, 4G and 5G wireless telecommunication standards to the Huawei plaintiffs for the plaintiffs’ wireless terminal unit products made and/or sold in China from 2019 to 2023. InterDigital’s patent license agreement with Huawei expired on December 31, 2018.
REGULATORY PROCEEDINGS
Investigation by National Development and Reform Commission of China
On September 23, 2013, counsel for InterDigital was informed by China’s National Development and Reform Commission (“NDRC”) that the NDRC had initiated a formal investigation into whether InterDigital has violated China’s Anti-Monopoly Law (“AML”) with respect to practices related to the licensing of InterDigital’s standards-essential patents to Chinese companies. Companies found to violate the AML may be subject to a cease and desist order, fines and disgorgement of any illegal gains. On March 3, 2014, the Company submitted to NDRC, pursuant to a procedure set out in the AML, a formal application for suspension of the investigation that included proposed commitments by the Company. On May 22, 2014, NDRC formally suspended its investigation of the Company based on the commitments proposed by the Company. The Company’s commitments with respect to the licensing of its patent portfolio for wireless mobile standards to Chinese manufacturers of cellular terminal units (“Chinese Manufacturers”) are as follows:
|
1.
|
Whenever InterDigital engages with a Chinese Manufacturer to license InterDigital’s patent portfolio for 2G, 3G and 4G wireless mobile standards, InterDigital will offer such Chinese Manufacturer the option of taking a worldwide portfolio license of only its standards-essential wireless patents, and comply with F/RAND principles when negotiating and entering into such licensing agreements with Chinese Manufacturers.
|
|
2.
|
As part of its licensing offer, InterDigital will not require that a Chinese Manufacturer agree to a royalty-free, reciprocal cross-license of such Chinese Manufacturer's similarly categorized standards-essential wireless patents.
|
|
3.
|
Prior to commencing any action against a Chinese Manufacturer in which InterDigital may seek exclusionary or injunctive relief for the infringement of any of its wireless standards-essential patents, InterDigital will offer such Chinese Manufacturer the option to enter into expedited binding arbitration under fair and reasonable procedures to resolve the royalty rate and other terms of a worldwide license under InterDigital's wireless standards-essential patents. If the Chinese Manufacturer accepts InterDigital's binding arbitration offer or otherwise enters into an agreement with InterDigital on a binding arbitration mechanism, InterDigital will, in accordance with the terms of the arbitration agreement and patent license agreement, refrain from seeking exclusionary or injunctive relief against such company.
|
The commitments contained in item 3 above will expire five years from the effective date of the suspension of the investigation, or May 22, 2019. With the consolidation of China’s antimonopoly enforcement authorities into the State Administration for Market Regulation ("SAMR") in April 2018, SAMR is now responsible for overseeing InterDigital’s commitments.
USITC PROCEEDINGS AND RELATED DELAWARE DISTRICT COURT PROCEEDINGS
2013 USITC Proceeding (337-TA-868) and Related ZTE Delaware District Court Proceeding
USITC Proceeding (337-TA-868)
On January 2, 2013, the Company’s wholly owned subsidiaries InterDigital Communications, Inc., InterDigital Technology Corporation, IPR Licensing, Inc. and InterDigital Holdings, Inc. filed a complaint with the United States International Trade Commission (the “USITC” or “Commission”) against Samsung Electronics Co., Ltd., Samsung Electronics America, Inc. and Samsung Telecommunications America, LLC, Nokia Corporation and Nokia Inc., Huawei Technologies Co., Ltd., Huawei Device USA, Inc. and FutureWei Technologies, Inc. d/b/a Huawei Technologies (USA) and ZTE Corporation and ZTE (USA) Inc. (collectively, the “337-TA-868 Respondents”), alleging violations of Section 337 of the Tariff Act of 1930 in that they engaged in unfair trade practices by selling for importation into the United States, importing into the United States and/or selling after importation into the United States certain 3G and 4G wireless devices (including WCDMA-, cdma2000-
96
and LTE-capable mobile phones, USB sticks, mobile hotspots, laptop computers and tablets and components of such devices) that infringe one or more of up to seven of InterDigital’s U.S. patents. The complaint also extended to certain WCDMA and cdma2000 devices incorporating Wi-Fi functionality. InterDigital’s complaint with the USITC sought an exclusion order that would bar from entry into the United States infringing 3G or 4G wireless devices (and components), including LTE devices, that are imported by or on behalf of the 337-TA-868 Respondents, and also sought a cease-and-desist order to bar further sales of infringing products that have already been imported into the United States. Certain of the asserted patents were also asserted against Nokia, Huawei and ZTE in earlier pending USITC proceedings (including the Nokia, Huawei and ZTE 2011 USITC Proceeding (337-TA-800) and the Nokia 2007 USITC Proceeding (337-TA-613), as set forth below) and therefore were not asserted against those 337-TA-868 Respondents in this investigation.
On December 23, 2013, InterDigital and Huawei reached a settlement agreement to enter into binding arbitration to resolve their global patent licensing disputes. Pursuant to the settlement agreement, InterDigital and Huawei moved to dismiss all litigation matters pending between the parties except the action filed by Huawei in China to set a fair, reasonable and non-discriminatory (“FRAND”) rate for the licensing of InterDigital’s Chinese standards-essential patents (discussed above under “Huawei China Proceedings”), the decision in which InterDigital is permitted to further appeal. As a result, effective February 12, 2014, the Huawei Respondents were terminated from the 337-TA-868 investigation.
From February 10 to February 20, 2014, ALJ Essex presided over the evidentiary hearing in this investigation. The patents in issue in this investigation as of the hearing were U.S. Patent Nos. 7,190,966 (the “’966 patent”) and 7,286,847 (the “’847 patent”) asserted against ZTE and Samsung, and U.S. Patent No. 7,941,151 (the “’151 patent”) asserted against ZTE, Samsung and Nokia.
On June 3, 2014, InterDigital and Samsung filed a joint motion to terminate the investigation as to Samsung on the basis of settlement. The ALJ granted the joint motion by initial determination issued on June 9, 2014, and the USITC determined not to review the initial determination on June 30, 2014.
On June 13, 2014, the ALJ issued an Initial Determination (“ID”) in the 337-TA-868 investigation. In the ID, the ALJ found that no violation of Section 337 had occurred in connection with the importation of 3G/4G devices by ZTE or Nokia, on the basis that the accused devices do not infringe asserted claims 1-6, 8-9, 16-21 or 23-24 of the ’151 patent, claims 1, 3, 6, 8, 9, or 11 of the ’966 patent, or claims 3 or 5 of the ’847 patent. The ALJ also found that claim 16 of the ’151 patent was invalid as indefinite. Among other determinations, the ALJ further determined that InterDigital did not violate any FRAND obligations, a conclusion also reached by the ALJ in the 337-TA-800 investigation, and that Respondents have engaged in patent “hold out.”
On June 30, 2014, InterDigital filed a Petition for Review with the USITC seeking review and reversal of certain of the ALJ’s conclusions in the ID. On the same day, Respondents filed a Conditional Petition for Review urging alternative grounds for affirmance of the ID’s finding that Section 337 was not violated and a Conditional Petition for Review with respect to FRAND issues.
In June 2014, Microsoft Mobile Oy (“MMO”) was added as a respondent in the investigation.
On August 14, 2014, the Commission determined to review in part the June 13, 2014 ID but terminated the investigation with a finding of no violation.
On October 10, 2014, InterDigital filed a petition for review with the U.S. Court of Appeals for the Federal Circuit (the “Federal Circuit”), appealing certain of the adverse determinations in the Commission’s August 8, 2014 final determination including those related to the ’966 and ’847 patents. On June 2, 2015, InterDigital moved to voluntarily dismiss the Federal Circuit appeal, because, even if it were to prevail, it did not believe there would be sufficient time following the court’s decision and mandate for the USITC to complete its proceedings on remand such that the accused products would be excluded before the ’966 and ’847 patents expire in June 2016. The court granted the motion and dismissed the appeal on June 18, 2015.
Related Delaware District Court Proceeding
On January 2, 2013, the Company’s wholly owned subsidiaries InterDigital Communications, Inc., InterDigital Technology Corporation, IPR Licensing, Inc. and InterDigital Holdings, Inc. filed four related district court actions in the Delaware District Court against the 337-TA-868 Respondents. The proceedings against Huawei, Samsung and Nokia were subsequently dismissed, as discussed below. The remaining complaint alleges that ZTE infringes the same patents with respect to the same products alleged in the complaint filed by InterDigital in USITC Proceeding (337-TA-868). The complaint seeks a permanent injunction and compensatory damages in an amount to be determined, as well as enhanced damages based on willful infringement, and recovery of reasonable attorneys’ fees and costs.
On January 31, 2013, ZTE filed its answer and counterclaims to InterDigital’s Delaware District Court complaint; ZTE asserted counterclaims for breach of contract, equitable estoppel, waiver of right to enjoin and declarations that InterDigital has not offered ZTE licenses on FRAND terms, declarations seeking the determination of FRAND terms and
97
declarations of noninfringement, invalidity and unenforceability. In addition to the declaratory relief specified in its counterclaims, ZTE seeks specific performance of InterDigital's purported contracts with ZTE and standards-setting organizations, appropriate damages in an amount to be determined at trial, reasonable attorneys’ fees and such other relief as the court may deem appropriate.
On March 21, 2013, pursuant to stipulation, the Delaware District Court granted InterDigital leave to file an amended complaint against ZTE to assert allegations of infringement of the ’244 patent. On March 22, 2013, ZTE filed its answer and counterclaims to InterDigital’s amended Delaware District Court complaint. On April 9, 2013, InterDigital filed a motion to dismiss ZTE’s counterclaims relating to its FRAND allegations. On July 12, 2013, the Delaware District Court held a hearing on InterDigital’s motion to dismiss. By order issued the same day, the Delaware District Court granted InterDigital’s motion, dismissing ZTE's counterclaims for equitable estoppel and waiver of the right to injunction or exclusionary relief with prejudice. It further dismissed the counterclaims for breach of contract and declaratory relief related to InterDigital’s FRAND commitments with leave to amend.
On August 6, 2013, ZTE filed its answer and amended counterclaims for breach of contract and for declaratory judgment seeking determination of FRAND terms. The counterclaims also continue to seek declarations of noninfringement, invalidity, and unenforceability. On August 30, 2013, InterDigital filed a motion to dismiss the declaratory judgment counterclaim relating to the request for determination of FRAND terms. On May 28, 2014, the court granted InterDigital’s motion and dismissed ZTE's FRAND-related declaratory judgment counterclaim, ruling that such declaratory judgment would serve no useful purpose.
On December 30, 2013, InterDigital and Huawei filed a stipulation of dismissal on account of the confidential settlement agreement and agreement to arbitrate their disputes in this action. On the same day, the Delaware District Court granted the stipulation of dismissal and dismissed the action against Huawei.
On February 11, 2014, the Delaware District Court judge entered an InterDigital, Nokia, and ZTE stipulated Amended Scheduling Order that bifurcated issues relating to damages, FRAND-related affirmative defenses, and any FRAND-related counterclaims.
On August 28, 2014, the court granted in part a motion by InterDigital for summary judgment that the asserted ’151 patent is not unenforceable by reason of inequitable conduct, holding that only one of the references forming the basis of defendants’ allegations would remain in issue, and granted a motion by InterDigital for summary judgment that the asserted claims of the ’966 and ’847 patents are not invalid for lack of enablement.
On August 5, 2014, InterDigital and Samsung filed a stipulation of dismissal in light of the parties’ settlement agreement. On the same day, the court granted the stipulation of dismissal and dismissed the action against Samsung with prejudice.
By order dated August 28, 2014, MMO was joined in the case against Nokia as a defendant.
The ZTE trial addressing infringement and validity of the ’966, ’847, ’244 and ’151 patents was held from October 20 to October 27, 2014. During the trial, the judge determined that further construction of certain claim language of the ’151 patent was required, and the judge decided to hold another trial as to ZTE's infringement of the ’151 patent at a later date. On October 28, 2014, the jury returned a unanimous verdict in favor of InterDigital, finding that the ’966, ’847 and ’244 patents are all valid and infringed by ZTE 3G and 4G cellular devices. The court issued formal judgment to this effect on October 29, 2014.
On November 26, 2014, ZTE filed a motion for judgment as a matter of law that the asserted claims of the ’966, ’847 and ’244 patents are not infringed and, in the alternative, for a new trial. InterDigital filed an opposition on December 15, 2014, and ZTE filed a reply on January 7, 2015.
The ZTE trial addressing infringement of the ’151 patent was held from April 20 to April 22, 2015. On April 22, 2015, the jury returned a verdict in favor of ZTE, finding that the ’151 patent is not infringed by ZTE 3G and 4G cellular devices.
On May 29, 2015, the court entered a new scheduling order for damages and FRAND-related issues, scheduling the ZTE trial related to damages and FRAND-related issues for October 2016.
On September 14, 2015, a panel of Administrative Law Judges of the United States Patent and Trademark Office Patent Trial and Appeal Board (the “PTAB”) issued a final written decision in two Inter Partes Review (“IPR”) cases concerning the ’244 patent. These IPR proceedings were commenced on petitions filed by ZTE Corporation and ZTE (USA) Inc. and by Microsoft Corporation, respectively. Specifically, the panel determined that a number of claims of the ’244 patent are unpatentable as obvious. IPR Licensing, Inc. appealed to the Federal Circuit seeking review of the PTAB’s decision. Oral argument in the appeal was heard on April 7, 2017. On April 20, 2017, the Federal Circuit affirmed the PTAB’s decision that
98
most of the challenged claims of the ’244 patent are unpatentable as obvious. However, the court vacated and remanded the PTAB’s obviousness finding as to claim 8, which returned the matter to the PTAB for further proceedings as to that claim. On July 28, 2017, IPR Licensing, Inc., filed a petition for a writ of certiorari with the U.S. Supreme Court seeking to appeal the Federal Circuit decision, arguing that the petition should be held pending the Supreme Court’s decision in
Oil States Energy Services, LLC v. Greene’s Energy Group, LLC
, which will determine whether the IPR process as a whole is unconstitutional. On October 2, 2017, ZTE filed a response to the petition for a writ of certiorari in which ZTE agreed that the petition should be held pending the Court’s decision in
Oil States
and then disposed of as appropriate in light of that decision. On April 24, 2018, the Supreme Court rejected the petitioner’s constitutional challenge to the IPR process in the
Oil States
case, and on April 30, 2018 denied IPR Licensing, Inc.’s July 28, 2017 petition for a writ of certiorari. On March 6, 2018, in the PTAB remand proceeding, the PTAB again found claim 8 to be invalid. On April 10, 2018, IPR Licensing, Inc. appealed to the Federal Circuit seeking review of the PTAB’s decision. That appeal (the “’244 patent PTAB remand appeal”) remains pending.
On December 21, 2015, the district court entered another scheduling order that vacated the October 2016 date for the ZTE trial related to damages and FRAND-related issues as set forth in the May 2015 scheduling order.
On March 18, 2016, the court denied ZTE’s motion for judgment as a matter of law, or in the alternative for a new trial, with respect to the ’966 and ’847 patents. The court postponed its ruling on ZTE’s motion as to the ’244 patent pending the Federal Circuit’s decision on InterDigital’s appeal of the September 14, 2015 PTAB ruling and administratively closed that portion of the motion.
On April 18, 2016, ZTE filed a stipulated request for dismissal with prejudice of its counterclaims for breach of contract and patent unenforceability based on FRAND and withdrew its corresponding FRAND-related affirmative defenses. The court granted this request the same day. Also on April 18, 2016, ZTE filed a motion under Federal Rule of Civil Procedure 54(b) seeking certification of partial final judgment on the claims for infringement of the ’966 and ’847 patents to allow ZTE to file an immediate appeal as to those patents. The motion was granted on June 7, 2016, and a partial final judgment was entered on June 20, 2016. On July 18, 2016, ZTE filed its notice of appeal with the Federal Circuit regarding the Delaware District Court’s judgment against ZTE with respect to the ’966 and ’847 patents. Oral argument on ZTE’s appeal was heard on October 4, 2017. On November 3, 2017, the Federal Circuit issued its decision affirming the Delaware District Court judgment finding that the ’966 and ’847 patents are not invalid and are infringed by ZTE 3G and 4G cellular devices. On December 4, 2017, ZTE filed a petition for panel rehearing of the Federal Circuit’s decision. The Federal Circuit denied ZTE’s petition on December 20, 2017, and the court’s mandate issued on December 27, 2017.
On May 15, 2017, InterDigital and Nokia/MMO filed a stipulation of dismissal of the case against MMO, Nokia Corporation and Nokia, Inc. pursuant to a Settlement Agreement and Release of Claims among InterDigital, Microsoft Corporation, Microsoft Mobile, Inc., and MMO, dated May 9, 2017, (the “Microsoft Settlement Agreement”). On May 16, 2017, the Delaware District Court granted the stipulation and dismissed the case against MMO, Nokia Corporation and Nokia, Inc. with prejudice.
The case against ZTE remains pending. On January 16, 2018, InterDigital and ZTE filed a joint status report that informed the court of the Federal Circuit’s decision regarding the ’966 and ’847 patents and that the PTAB proceedings regarding the ’244 patent remained pending. The parties jointly requested that the case remain stayed so that the portion of the case related to damages potentially owed by ZTE as to the three patents-in-suit may be coordinated. The court granted this request on January 17, 2018. The case remains stayed pending the conclusion of the 244 patent PTAB remand appeal, including any further proceedings.
2011 USITC Proceeding (337-TA-800) and Related ZTE Delaware District Court Proceeding
USITC Proceeding (337-TA-800)
On July 26, 2011, InterDigital’s wholly owned subsidiaries InterDigital Communications, LLC (now InterDigital Communications, Inc.), InterDigital Technology Corporation and IPR Licensing, Inc. filed a complaint with the USITC against Nokia Corporation and Nokia Inc., Huawei Technologies Co., Ltd. and FutureWei Technologies, Inc. d/b/a Huawei Technologies (USA) and ZTE Corporation and ZTE (USA) Inc. (collectively, the “337-TA-800 Respondents”), alleging violations of Section 337 of the Tariff Act of 1930 in that they engaged in unfair trade practices by selling for importation into the United States, importing into the United States and/or selling after importation into the United States certain 3G wireless devices (including WCDMA- and cdma2000-capable mobile phones, USB sticks, mobile hotspots and tablets and components of such devices) that infringe several of InterDigital’s U.S. patents. The action also extended to certain WCDMA and cdma2000 devices incorporating WiFi functionality. InterDigital’s complaint with the USITC sought an exclusion order that would bar from entry into the United States any infringing 3G wireless devices (and components) that are imported by or on behalf of the 337-TA-800 Respondents, and also sought a cease-and-desist order to bar further sales of infringing products that have already been imported into the United States. In May 2012, Huawei Device USA, Inc. was added as a 337-TA-800 Respondent.
99
The ALJ held an evidentiary hearing from February 12-21, 2013. The patents in issue as of the hearing were U.S. Patent Nos. 8,009,636 (the “’636 patent”), 7,706, 830 (the “’830 patent”), 7,502,406 (the “’406 patent”), 7,616,970 (the “’970 patent”), 7,706,332 (the “’332 patent”), 7,536,013 (the “’013 patent”) and 7,970,127 (the “’127 patent”). The ALJ’s Initial Determination (“ID”) issued on June 28, 2013, finding no violation because the asserted patents were not infringed and/or invalid. Among other determinations, with respect to the 337-TA-800 Respondents’ FRAND and other equitable defenses, the ALJ found that Respondents had failed to prove either that InterDigital violated any FRAND obligations, that InterDigital failed to negotiate in good faith, or that InterDigital’s licensing offers were discriminatory. The ALJ also found that InterDigital is not precluded from seeking injunctive relief based on any alleged FRAND commitments.
Petitions for review of the ID to the Commission were filed by InterDigital and the 337-TA-800 Respondents on July 15, 2013. On September 4, 2013, the Commission determined to review the ID in its entirety.
On December 19, 2013, the Commission issued its final determination. The Commission adopted, with some modification, the ALJ’s finding of no violation of Section 337 as to Nokia, Huawei, and ZTE. The Commission did not rule on any other issue, including FRAND and domestic industry, and stated that all other issues remain under review.
On December 20, 2013, InterDigital filed in the Federal Circuit a petition for review seeking reversal of the Commission’s final determination. On February 18, 2015, the Federal Circuit issued a decision affirming the USITC’s determinations that the claims of the ’830, ’636, ’406 and ’332 patents were not infringed, that the claims of the ’970 patent are invalid, and that the Respondents did not violate Section 337. On April 6, 2015, InterDigital filed a combined petition for panel rehearing and rehearing e
n banc
as to the ’830 and ’636 patents. The petition was denied on May 12, 2015, and the court’s mandate issued on May 19, 2015.
Related Delaware District Court Proceeding
On July 26, 2011, the same date that InterDigital filed USITC Proceeding (337-TA-800), it filed a parallel action in the United States District Court for the District of Delaware against the 337-TA-800 Respondents alleging infringement of the same asserted patents identified in USITC Proceeding (337-TA-800). The Delaware District Court complaint seeks a permanent injunction and compensatory damages in an amount to be determined, as well as enhanced damages based on willful infringement, and recovery of reasonable attorneys' fees and costs. On September 23, 2011, the defendants in the Delaware District Court complaint filed a motion to stay the Delaware District Court action pending the parallel proceedings in the USITC. Because the USITC has instituted USITC Proceeding (337-TA-800), the defendants have a statutory right to a mandatory stay of the Delaware District Court proceeding pending a final determination in the USITC. On October 3, 2011, InterDigital amended the Delaware District Court complaint, adding LG as a defendant and adding the same additional patent that InterDigital requested be added to USITC Proceeding (337-TA-800). On October 11, 2011, the Delaware District Court granted the defendants' motion to stay. The case is currently stayed through March 11, 2019.
On January 14, 2014, InterDigital and Huawei filed a stipulation of dismissal of their disputes in this action on account of the confidential settlement agreement mentioned above. On the same day, the Delaware District Court granted the stipulation of dismissal.
On May 15, 2017, InterDigital and Nokia filed a stipulation of dismissal of their dispute pursuant to the Microsoft Settlement Agreement discussed above. On May 16, 2017, the Delaware District Court granted the stipulation and dismissed the case with prejudice with respect to Nokia Corporation and Nokia Inc.
In December 2017, InterDigital entered into a patent license agreement with LG, pursuant to which the parties agreed to terms for dismissal by InterDigital of the outstanding litigation among the parties and their affiliates. Accordingly, on December 5, 2017, InterDigital and LG filed a stipulation of dismissal of the case against LG. On the same day, the Delaware District Court granted the stipulation and dismissed the case against LG with prejudice.
The case remains pending with respect to ZTE.
OTHER
We are party to certain other disputes and legal actions in the ordinary course of business, including arbitrations and legal proceedings with licensees regarding the terms of their agreements and the negotiation thereof. We do not currently believe that these matters, even if adversely adjudicated or settled, would have a material adverse effect on our financial condition, results of operations or cash flows. None of the preceding matters have met the requirements for accrual or disclosure of a potential range as of December 31, 2018.
100
|
13.
|
COMPENSATION PLANS AND PROGRAMS
|
Compensation Programs
We use a variety of compensation programs to both attract and retain employees, and to more closely align employee compensation with company performance. These programs include, but are not limited to, short-term incentive awards tied to performance goals and cash awards to inventors for filed patent applications and patent issuances, as well as stock option awards, time-based RSU awards, performance-based awards and cash awards under our LTCP.
Our LTCP typically includes annual time-based RSU grants and cash award grants with a three-year vesting period, as well as annual performance-based RSU grants and cash award grants with a three to five-year performance period; as a result, in any one year, we are typically accounting for at least three active LTCP cycles. We issue new shares of our common stock to satisfy our obligations under the share-based components of these programs. However, our Board of Directors has the right to authorize the issuance of treasury shares to satisfy such obligations in the future.
Equity Incentive Plans
On June 14, 2017, our shareholders adopted and approved the 2017 Equity Incentive Plan (the "2017 Plan"), under which officers, employees, non-employee directors and consultants can receive share-based awards such as RSUs, restricted stock and stock options as well as other stock or cash awards. From June 2009 through June 14, 2017, we granted such awards pursuant to our 2009 Stock Incentive Plan (the “2009 Plan," and, together with the 2017 Plan, the "Equity Plans"), which was adopted and approved by our shareholders on June 4, 2009, and the material terms of which were re-approved on June 12, 2014. Upon the adoption of the 2017 Plan in June 2017, the 2009 Plan was terminated and all shares remaining available for grant under the 2009 Plan were canceled. The number of shares available for issuance under the 2017 Plan is equal to
2,400,000
shares plus any shares subject to awards granted under the 2009 Plan that, on or after June 14, 2017, expire or otherwise terminate without having been exercised in full, or that are forfeited to or repurchased by us.
The following table summarizes changes in the number of equity instruments available for grant (in thousands) under the Equity Plans for the current year:
|
|
Available for Grant
|
|
|
Balance as of December 31, 2017
|
2,403
|
|
|
RSUs granted (a)
|
(441
|
)
|
|
Options granted (b)
|
(335
|
)
|
|
Options expired and RSUs canceled
|
262
|
|
|
Balance as of December 31, 2018
|
1,889
|
|
|
(a)
|
RSUs granted include time-based RSUs, performance-based RSUs and dividend equivalents credited. Granted amounts include performance-based RSU awards at their maximum potential payout level of 200%.
|
|
(b)
|
Options granted include performance-based options at their maximum potential payout level of 200%.
|
RSUs and Restricted Stock
We may issue RSUs and/or shares of restricted stock to officers, employees, non-employee directors and consultants. Any cancellations of outstanding RSUs granted under the Equity Plans will increase the number of RSUs and/or shares of restricted stock remaining available for grant under the 2017 Plan. Time-based RSUs vest over periods generally ranging from 1 to 3 years from the date of the grant. Performance-based RSUs generally have a vesting period of between 3 and 5 years.
As of December 31, 2018, we had unrecognized compensation cost related to share-based awards of
$9.9 million
, at current performance accrual rates. For grants made that cliff vest, we expect to amortize the associated unrecognized compensation cost as of December 31, 2018, on a straight-line basis generally over a three to five-year period.
Vesting of performance-based RSU awards is subject to attainment of specific goals established by the Compensation Committee of the Board of Directors. Depending upon performance against these goals, the number of shares that vest can be anywhere from 0 to 2 times the target number of shares.
101
Information with respect to current RSU activity is summarized as follows (in thousands, except per share amounts):
|
Number of
Unvested
RSUs
|
Weighted
Average Per Share
Grant Date
Fair Value
|
|||||
|
Balance at December 31, 2017
|
1,005
|
|
$
|
57.95
|
|
|
|
Granted*
|
441
|
|
73.75
|
|
||
|
Forfeited
|
(181
|
)
|
73.49
|
|
||
|
Vested
|
(350
|
)
|
54.75
|
|
||
|
Balance at December 31, 2018
|
915
|
|
$
|
63.70
|
|
|
* These numbers include less than
0.1 million
RSUs credited on unvested RSU awards as dividend equivalents. Dividend equivalents accrue with respect to unvested RSU awards when and as cash dividends are paid on the Company's common stock, and vest if and when the underlying RSUs vest. Granted amounts include performance-based RSU awards at their maximum potential payout level of 200%.
During 2018, 2017 and 2016, we granted approximately
0.3 million
,
0.2 million
and
0.4 million
RSUs under the Equity Plans, respectively, with weighted-average grant date fair values of
$73.75
,
$58.63
and
$62.10
, respectively. The total vest date fair value of the RSUs that vested in 2018, 2017 and 2016 was
$25.2 million
,
$56.0 million
and
$9.8 million
, respectively. The weighted average per share grant date fair value of the awards that vested in 2018, 2017 and 2016 was
$54.75
,
$35.14
and
$44.08
, respectively.
Other Equity Grants
We may also grant equity awards to non-management Board members, certain consultants and, in special circumstances, employees outside of the LTCP. Grants of this type are supplemental to any awards granted through the LTCP.
Stock Options
The 2009 Plan allowed, and the 2017 Plan allows, for the granting of incentive and non-qualified stock options, as well as other securities. The administrator of the Equity Plans, the Compensation Committee of the Board of Directors, determines the number of options to be granted, subject to certain limitations set forth in the 2017 Plan. Annually, since 2013, both incentive and non-qualified stock options have been granted as part of the LTCP, which have generally vested over three years. During the year ended December 31, 2018, performance-based options were granted for the first time. The number of options which cliff vest, if at all, is anywhere from 0 to 2 times the target number of options subject to the attainment of performance goals measured at the end of the performance period. Performance-based options have a vesting period between three and five years.
Under the terms of the Equity Plans, the exercise price per share of each option, other than in the event of options granted in connection with a merger or other acquisition, cannot be less than
100%
of the fair market value of a share of common stock on the date of grant. Options granted under the Equity Plans are generally exercisable for a period of between 7 to 10 years from the date of grant and may vest on the grant date, another specified date, over a period of time and/or dependent upon the attainment of specified performance goals. We also have approximately
0.1 million
options outstanding under a prior stock plan that have an indefinite contractual life.
The fair value for option awards is computed using the Black-Scholes pricing model, whose inputs and assumptions are determined as of the date of grant and which require considerable judgment. Expected volatility was based upon a combination of implied and historic volatilities. The weighted-average grant date fair value per option award granted during the years ended December 31, 2018, 2017 and 2016 was
$24.56
,
$19.90
, and
$13.98
, respectively, based upon the assumptions included in the table below:
|
For the Year Ended December 31,
|
||||||||
|
2018
|
2017
|
2016
|
||||||
|
Expected term (in years)
|
7.7
|
|
4.5
|
|
4.5
|
|
||
|
Expected volatility
|
30.14
|
%
|
28.51
|
%
|
33.11
|
%
|
||
|
Risk-free interest rate
|
2.97
|
%
|
1.93
|
%
|
1.29
|
%
|
||
|
Dividend yield
|
1.77
|
%
|
1.40
|
%
|
1.46
|
%
|
||
102
Information with respect to current year stock option activity is summarized as follows (in thousands, except per share amounts):
|
|
Outstanding Options
|
Weighted
Average Exercise Price |
||||
|
Balance at December 31, 2017
|
531
|
|
$
|
39.55
|
|
|
|
Granted*
|
335
|
|
79.07
|
|
||
|
Forfeited
|
(18
|
)
|
54.92
|
|
||
|
Exercised
|
(153
|
)
|
43.89
|
|
||
|
Balance at December 31, 2018
|
695
|
|
$
|
57.21
|
|
|
* Granted amounts include performance-based option awards at their maximum potential payout level of 200%.
The weighted average remaining contractual life of our outstanding options was
9.7
years as of
December 31, 2018
. We currently have approximately
0.1 million
options outstanding that have an indefinite contractual life. These options were granted between 1983 and 1986 under a prior stock plan. For purposes of calculating the weighted average remaining contractual life, these options were assigned an original life in excess of 50 years. The majority of these options have an exercise price between
$9.00
and
$11.63
.
The total intrinsic value of our outstanding options as of
December 31, 2018
was
$11.2 million
. Of the
0.7 million
outstanding options as of December 31, 2018,
0.3 million
were exercisable with a weighted-average exercise price of
$33.19
. Options exercisable as of December 31, 2018 had total intrinsic value of
$10.9 million
and a weighted average remaining contractual life of
10.3
. The total intrinsic value of stock options exercised during the years ended
December 31, 2018
,
2017
and
2016
was
$5.6 million
,
$0.3 million
and
$1.5 million
, respectively. In
2018
, we recorded cash received from the exercise of options of approximately
$6.7 million
. Upon option exercise, we issued new shares of stock.
As of
December 31, 2018
, we had unrecognized compensation cost on our unvested stock options of
$0.1 million
, at current performance accrual rates. As of
December 31, 2018
and
2017
, we had approximately
0.3 million
and
0.5 million
options outstanding, respectively, that had exercise prices less than the fair market value of our stock at the respective balance sheet date. These options would have generated cash proceeds to the Company of
$11.2 million
and
$21.2 million
, respectively, if they had been fully exercised on those dates.
Defined Contribution Plans
We have a 401(k) plan (“Savings Plan”) wherein employees can elect to defer compensation within federal limits. We match a portion of employee contributions. Our 401(k) contribution expense was approximately
$1.3 million
,
$1.4 million
and
$1.1 million
for
2018
,
2017
and
2016
, respectively. At our discretion, we may also make a profit-sharing contribution to our employees’ 401(k) accounts. Additionally, the company contributed
$0.2 million
,
$0.3 million
and
$0.5 million
in 2018, 2017 and 2016, respectively, to other defined contribution plans.
|
14.
|
TAXES
|
Our income tax provision (benefit) consists of the following components for
2018
,
2017
and
2016
(in thousands):
|
2018
|
2017
|
2016
|
|||||||||
|
Current
|
|
|
|
|
|
|
|||||
|
Federal
|
$
|
(3,148
|
)
|
$
|
3,656
|
|
$
|
14,637
|
|
||
|
State
|
239
|
|
(1
|
)
|
(60
|
)
|
|||||
|
Foreign source withholding tax
|
25,187
|
|
47,592
|
|
79,932
|
|
|||||
|
|
22,278
|
|
51,247
|
|
94,509
|
|
|||||
|
Deferred
|
|
|
|
|
|
|
|||||
|
Federal
|
(63,030
|
)
|
21,671
|
|
(48,086
|
)
|
|||||
|
State
|
(1,554
|
)
|
(1,074
|
)
|
(557
|
)
|
|||||
|
Foreign source withholding tax
|
14,889
|
|
49,832
|
|
70,925
|
|
|||||
|
|
(49,695
|
)
|
70,429
|
|
22,282
|
|
|||||
|
Total
|
$
|
(27,417
|
)
|
$
|
121,676
|
|
$
|
116,791
|
|
||
103
The deferred tax assets and liabilities were comprised of the following components at
December 31, 2018
and
2017
(in thousands):
|
|
2018
|
||||||||||||||
|
|
Federal
|
State
|
Foreign
|
Total
|
|||||||||||
|
Net operating losses
|
$
|
—
|
|
$
|
123,951
|
|
$
|
2,995
|
|
$
|
126,946
|
|
|||
|
Deferred revenue, net
|
48
|
|
391
|
|
39,272
|
|
39,711
|
|
|||||||
|
Stock compensation
|
3,273
|
|
1,764
|
|
—
|
|
5,037
|
|
|||||||
|
Patent amortization
|
18,508
|
|
12
|
|
—
|
|
18,520
|
|
|||||||
|
Depreciation
|
271
|
|
(25
|
)
|
—
|
|
246
|
|
|||||||
|
Other-than-temporary impairment
|
422
|
|
68
|
|
—
|
|
490
|
|
|||||||
|
Other accrued liabilities
|
2,743
|
|
238
|
|
—
|
|
2,981
|
|
|||||||
|
Other employee benefits
|
5,380
|
|
1,025
|
|
—
|
|
6,405
|
|
|||||||
|
|
30,645
|
|
127,424
|
|
42,267
|
|
200,336
|
|
|||||||
|
Less: valuation allowance
|
—
|
|
(122,163
|
)
|
(2,995
|
)
|
(125,158
|
)
|
|||||||
|
Net deferred tax asset
|
$
|
30,645
|
|
$
|
5,261
|
|
$
|
39,272
|
|
$
|
75,178
|
|
|||
|
|
2017
|
||||||||||||||
|
|
Federal
|
State
|
Foreign
|
Total
|
|||||||||||
|
Net operating losses
|
$
|
1,804
|
|
$
|
122,364
|
|
$
|
988
|
|
$
|
125,156
|
|
|||
|
Deferred revenue, net
|
9,058
|
|
35
|
|
29,189
|
|
38,282
|
|
|||||||
|
Stock compensation
|
6,643
|
|
2,293
|
|
—
|
|
8,936
|
|
|||||||
|
Patent amortization
|
16,052
|
|
7
|
|
—
|
|
16,059
|
|
|||||||
|
Depreciation
|
(214
|
)
|
(65
|
)
|
—
|
|
(279
|
)
|
|||||||
|
Other accrued liabilities
|
268
|
|
(26
|
)
|
—
|
|
242
|
|
|||||||
|
Other-than-temporary impairment
|
379
|
|
71
|
|
—
|
|
450
|
|
|||||||
|
Other employee benefits
|
3,449
|
|
649
|
|
—
|
|
4,098
|
|
|||||||
|
|
37,439
|
|
125,328
|
|
30,177
|
|
192,944
|
|
|||||||
|
Less: valuation allowance
|
(1,773
|
)
|
(121,155
|
)
|
(988
|
)
|
(123,916
|
)
|
|||||||
|
Net deferred tax asset
|
$
|
35,666
|
|
$
|
4,173
|
|
$
|
29,189
|
|
$
|
69,028
|
|
|||
Note: Included within the balance sheet, but not reflected in the tables are deferred tax assets primarily related to foreign withholding taxes that are expected to be paid within the next twelve months of $1.5 million and $14.9 million as of December 31, 2018 and December 31, 2017, respectively.
The following is a reconciliation of income taxes at the federal statutory rate with income taxes recorded by the Company for the years ended
December 31, 2018
,
2017
and
2016
(in thousands):
104
|
2018
|
2017
|
2016
|
||||||
|
Tax at U.S. statutory rate
|
21.0
|
%
|
35.0
|
%
|
35.0
|
%
|
||
|
State tax provision
|
(8.9
|
)%
|
—
|
%
|
(0.1
|
)%
|
||
|
Effects of rates different than statutory
|
(1.4
|
)%
|
—
|
%
|
—
|
%
|
||
|
Change in federal and state valuation allowance
|
8.5
|
%
|
0.5
|
%
|
0.1
|
%
|
||
|
Research and development tax credits
|
(4.3
|
)%
|
(0.8
|
)%
|
(0.5
|
)%
|
||
|
Uncertain tax positions
|
3.9
|
%
|
(2.4
|
)%
|
2.1
|
%
|
||
|
Permanent differences
|
4.9
|
%
|
1.0
|
%
|
0.6
|
%
|
||
|
Domestic production activities deduction
|
—
|
%
|
(2.0
|
)%
|
(9.8
|
)%
|
||
|
Stock compensation
|
(5.0
|
)%
|
(4.0
|
)%
|
—
|
%
|
||
|
Rate change (a)
|
—
|
%
|
14.6
|
%
|
—
|
%
|
||
|
Foreign derived intangible income deduction (b)
|
(56.3
|
)%
|
—
|
%
|
—
|
%
|
||
|
Amended return benefit
|
(49.4
|
)%
|
—
|
%
|
—
|
%
|
||
|
Other
|
1.5
|
%
|
(0.3
|
)%
|
0.3
|
%
|
||
|
Total tax provision (benefit) (c)
|
(85.5
|
)%
|
41.6
|
%
|
27.7
|
%
|
||
(a) In 2017, the inclusion of the revaluation of the deferred tax assets attributable to the TCJA signed into law in December 2017 increased the tax provision by
14.6%
.
(b) In 2018, the new Foreign Derived Intangible Income ("FDII") deduction that was enacted as part of the TCJA decreased the tax provision by 56.3%.
(c) In 2016, the inclusion of benefits associated with domestic production activities, net of uncertain tax provisions, related to prior years reduced the tax provision by 5.6%.
Income Tax Reform
On December 22, 2017, the Tax Cuts and Jobs Act, or TCJA, was signed into law. The TCJA significantly revised the U.S. corporate income tax regime by, among other things: lowering the U.S. corporate tax rate from 35% to 21% effective January 1, 2018; imposing a 13.1% tax rate on income that qualifies as FDII; repealing the deduction for domestic production activities; implementing a territorial tax system; and imposing a repatriation tax on deemed repatriated earnings of foreign subsidiaries. The Company is continually monitoring IRS regulations and guidance on tax reform, specifically as it relates to income that qualifies for the favorable FDII rate. GAAP requires that the impact of tax legislation be recognized in the period in which the law was enacted.
As a result of the TCJA, we recorded a tax benefit of $18.0 million in 2018 due to our income qualifying for the favorable FDII rate. During 2017, we recorded a tax charge of $42.6 million due to a re-measurement of deferred tax assets and liabilities. On a go-forward basis, we expect a significant portion of our income to qualify as FDII and thus be subject to the 13.1% tax rate.
Valuation Allowances and Net Operating Losses
We establish a valuation allowance for any portion of our deferred tax assets for which management believes it is more likely than not that we will be unable to utilize the assets to offset future taxes. We believe it is more likely than not that the majority of our state net operating losses and net operating losses in France will not be utilized; therefore we have maintained a near full valuation allowance against our state and French net operating losses as of
December 31, 2018
. All other deferred tax assets are fully benefited.
Uncertain Income Tax Positions
As of December 31, 2018, 2017 and 2016, we had
$4.4 million
,
$3.3 million
and
$10.4 million
, respectively, of unrecognized tax benefits that, if recognized, would impact the Company's effective tax rate. The total amount of unrecognized tax benefits could change within the next twelve months for a number of reasons including audit settlements, tax examination activities and the recognition and measurement considerations under this guidance.
During 2018, we established a reserve of
$1.1 million
related to the recognition of the 2006 to 2010 research and development credits and manufacturing deduction credits.
105
During 2017, we released a reserve of
$6.5 million
as a result of the IRS Joint Committee issuing a letter ruling in acceptance of the refund claims associated with the domestic production activities deduction and research and development credit. Additionally, we reduced the previously established reserve for the 2016 domestic production activities deduction and research and development credit by
$1.6 million
. These reductions in reserves were partially offset by the establishment of a
$1.0 million
reserve related to the 2017 research and development and manufacturing deduction credit, as well an increase for interest and penalty on previously recognized reserves.
During 2016, we established a reserve of
$3.2 million
related to the recognition of the 2016 research and development credit and manufacturing deduction credit. We also established a reserve of
$6.3 million
related to the recognition of a gross benefit for manufacturing deduction credits related to prior years and released a reserve of
$0.6 million
for research and development credits. The 2016 reserve was also increased for interest and penalty on previously recognized reserves.
The following is a roll forward of our total gross unrecognized tax benefits, which if reversed would impact the effective tax rate, for the fiscal years
2016
through
2018
(in thousands):
|
2018
|
2017
|
2016
|
|||||||||
|
Balance as of January 1
|
$
|
3,252
|
|
$
|
10,397
|
|
$
|
1,469
|
|
||
|
Tax positions related to current year:
|
|
|
|||||||||
|
Additions
|
73
|
|
1,009
|
|
3,209
|
|
|||||
|
Reductions
|
—
|
|
—
|
|
—
|
|
|||||
|
Tax positions related to prior years:
|
|||||||||||
|
Additions
|
1,054
|
|
—
|
|
6,281
|
|
|||||
|
Reductions
|
(27
|
)
|
(1,610
|
)
|
—
|
|
|||||
|
Settlements
|
—
|
|
(6,544
|
)
|
(562
|
)
|
|||||
|
Lapses in statues of limitations
|
—
|
|
—
|
|
—
|
|
|||||
|
Balance as of December 31
|
$
|
4,352
|
|
$
|
3,252
|
|
$
|
10,397
|
|
||
Our policy is to recognize interest and/or penalties related to income tax matters in income tax expense. For certain positions that related to years prior to 2018, we have recorded approximately
$0.1 million
of accrued interest during 2018 and 2017.
The Company and its subsidiaries are subject to United States federal income tax, foreign income and withholding taxes and income taxes from multiple state jurisdictions. Our federal income tax returns for 2011 to the present are currently open and will not close until the respective statutes of limitations have expired. The statutes of limitations generally expire three years following the filing of the return or in some cases three years following the utilization or expiration of net operating loss carry forwards. The statute of limitations applicable to our open federal returns will expire at the end of 2021. Excluding the Competent Authority Proceeding described in the section below, specific tax treaty procedures remain open for certain jurisdictions for 2006 and for 2014 to the present. Many of our subsidiaries have filed state income tax returns on a separate company basis. To the extent these subsidiaries have unexpired net operating losses, their related state income tax returns remain open. These returns have been open for varying periods, some exceeding ten years. The total amount of state net operating losses is
$1.7 billion
. In November 2018, the Company received notice that its 2016 U.S. Federal income tax return will be subject to audit. In December 2018, the Company received a notice of proposed assessment related to an ongoing audit of its California tax returns for 2013 through 2015. The Company filed a protest to the California assessment in February 2019.
Foreign Taxes
We pay foreign source withholding taxes on patent license royalties and state taxes when applicable. We apply foreign source withholding tax payments against our United States federal income tax obligations to the extent we have foreign source income to support these credits. In
2018
,
2017
and
2016
, we paid
$25.1 million
,
$46.7 million
and
$79.9 million
in foreign source withholding taxes, respectively, and applied these payments as credits against our United States federal tax obligation.
Between 2006 and 2018, we paid approximately
$177.5 million
in foreign taxes to foreign governments that have tax treaties with the U.S., for which we have claimed foreign tax credits against our U.S. tax obligations, and for which the tax treaty procedures are still open. It is possible that as a result of tax treaty procedures, the U.S. government may reach an agreement with the related foreign governments that will result in a partial refund of foreign taxes paid with a related reduction in our foreign tax credits. Due to foreign currency fluctuations, any such agreement could result in foreign currency gain or loss.
106
On July 24, 2018, the Company received notification that its request for competent authority pertaining to Article 27 (Mutual Agreement 14 Table of Contents Procedure) of the United States-Republic of Korea Income Tax Convention had been reviewed by the IRS and an agreement had been reached (the "Competent Authority Proceeding"). As a result of this agreement, the Company received refunds of
$97.4 million
, inclusive of interest. In addition, we have recorded a net tax benefit of
$14.7 million
in our full year 2018 results related to an anticipated refund the Company expects to receive as a result of amending tax returns for tax years covered by this agreement.
|
15.
|
NET INCOME PER SHARE
|
Basic Earnings Per Share ("EPS") is calculated by dividing net income available to common shareholders by the weighted-average number of common shares outstanding for the period. Diluted EPS reflects the potential dilution that could occur if options or other securities with features that could result in the issuance of common stock were exercised or converted to common stock. The following table reconciles the numerator and the denominator of the basic and diluted net income per share computation (in thousands, except for per share data):
|
|
For the Year Ended December 31,
|
||||||||||||||||||||||
|
|
2018
|
2017
|
2016
|
||||||||||||||||||||
|
|
Basic
|
Diluted
|
Basic
|
Diluted
|
Basic
|
Diluted
|
|||||||||||||||||
|
Numerator:
|
|
|
|
|
|||||||||||||||||||
|
Net income applicable to common shareholders
|
$
|
63,868
|
|
$
|
63,868
|
|
$
|
174,293
|
|
$
|
174,293
|
|
$
|
309,001
|
|
$
|
309,001
|
|
|||||
|
Denominator:
|
|
||||||||||||||||||||||
|
Weighted-average shares outstanding: Basic
|
34,491
|
|
34,491
|
|
34,605
|
|
34,605
|
|
34,526
|
|
34,526
|
|
|||||||||||
|
Dilutive effect of stock options, RSUs and convertible securities
|
816
|
|
1,174
|
|
663
|
|
|||||||||||||||||
|
Weighted-average shares outstanding: Diluted
|
35,307
|
|
35,779
|
|
35,189
|
|
|||||||||||||||||
|
Earnings Per Share:
|
|||||||||||||||||||||||
|
Net income: Basic
|
$
|
1.85
|
|
1.85
|
|
$
|
5.04
|
|
5.04
|
|
$
|
8.95
|
|
8.95
|
|
||||||||
|
Dilutive effect of stock options, RSUs and convertible securities
|
|
(0.04
|
)
|
(0.17
|
)
|
(0.17
|
)
|
||||||||||||||||
|
Net income: Diluted
|
|
$
|
1.81
|
|
$
|
4.87
|
|
$
|
8.78
|
|
|||||||||||||
Certain shares of common stock issuable upon the exercise or conversion of certain securities have been excluded from our computation of earnings per share because the strike price or conversion rate, as applicable, of such securities was greater than the average market price of our common stock for the years ended December 31,
2018
,
2017
and
2016
, as applicable, and, as a result, the effect of such exercise or conversion would have been anti-dilutive. Set forth below are the securities and the weighted average number of shares of common stock underlying such securities that were excluded from our computation of earnings per share for the periods presented (in thousands):
|
For the Year Ended December 31,
|
|||||||||
|
2018
|
2017
|
2016
|
|||||||
|
Restricted stock units and stock options
|
25
|
|
19
|
|
110
|
|
|||
|
Convertible securities
|
—
|
|
—
|
|
4,366
|
|
|||
|
Warrants
|
4,404
|
|
—
|
|
6,534
|
|
|||
|
Total
|
4,429
|
|
19
|
|
11,010
|
|
|||
|
16.
|
EQUITY TRANSACTIONS
|
Repurchase of Common Stock
In June 2014, our Board of Directors authorized a $300 million share repurchase program (the “2014 Repurchase Program”). In June 2015, September 2017 and December 2018, our Board of Directors authorized three $100 million increases to the program, respectively, bringing the total amount of the 2014 Repurchase Program to $600 million. The Company may repurchase shares under the 2014 Repurchase Program through open market purchases, pre-arranged trading plans or privately negotiated purchases.
The table below sets forth the total number of shares repurchased and the dollar value of shares repurchased under the 2014 Repurchase Program, in thousands. As of December 31, 2018, there was approximately $168.1 million remaining under the stock repurchase authorization.
|
2014 Repurchase Program
|
||||||
|
# of Shares
|
Value
|
|||||
|
2018
|
1,478
|
|
$
|
110,505
|
|
|
|
2017
|
107
|
|
$
|
7,693
|
|
|
|
2016
|
1,304
|
|
64,685
|
|
||
|
2015
|
1,836
|
|
96,410
|
|
||
|
2014
|
3,554
|
|
152,625
|
|
||
|
Total
|
8,279
|
|
$
|
431,918
|
|
|
Dividends
Cash dividends on outstanding common stock declared in
2018
and
2017
were as follows (in thousands, except per share data):
107
|
2018
|
Per Share
|
Total
|
Cumulative by Fiscal Year
|
||||||||
|
First quarter
|
$
|
0.35
|
|
$
|
12,124
|
|
$
|
12,124
|
|
||
|
Second quarter
|
0.35
|
|
12,192
|
|
24,316
|
|
|||||
|
Third quarter
|
0.35
|
|
11,996
|
|
36,312
|
|
|||||
|
Fourth quarter
|
0.35
|
|
11,610
|
|
47,922
|
|
|||||
|
$
|
1.40
|
|
$
|
47,922
|
|
||||||
|
2017
|
|||||||||||
|
First quarter
|
$
|
0.30
|
|
$
|
10,404
|
|
$
|
10,404
|
|
||
|
Second quarter
|
0.30
|
|
10,413
|
|
20,817
|
|
|||||
|
Third quarter
|
0.35
|
|
12,149
|
|
32,966
|
|
|||||
|
Fourth quarter
|
0.35
|
|
12,156
|
|
45,122
|
|
|||||
|
$
|
1.30
|
|
$
|
45,122
|
|
||||||
In September 2017, we announced that our Board of Directors had approved an increase in the Company’s quarterly cash dividend to
$0.35
per share. We currently expect to continue to pay dividends comparable to our quarterly
$0.35
per share cash dividend in the future; however, continued payment of cash dividends and changes in the Company's dividend policy will depend on the Company's earnings, financial condition, capital resources and capital requirements, alternative uses of capital, restrictions imposed by any existing debt, economic conditions and other factors considered relevant by our Board of Directors.
Common Stock Warrants
On March 5 and March 9, 2015, we sold warrants to acquire approximately
3.8 million
and approximately
0.6 million
shares of our common stock, respectively, subject to customary anti-dilution adjustments. As of December 31, 2018, the warrants had a strike price of approximately
$86.99
per share, as adjusted. The warrants become exercisable and expire in daily tranches over a three-and-a-half-month period starting in June 2020. As consideration for the warrants issued on March 5 and March 9, 2015, we received approximately
$37.3 million
and approximately
$5.6 million
, respectively.
|
17.
|
OTHER (EXPENSE) INCOME
|
Other expense is comprised of the following (in thousands):
|
For the Year Ended December 31,
|
|||||||||||
|
2018
|
2017
|
2016
|
|||||||||
|
Interest expense
|
$
|
(35,956
|
)
|
$
|
(17,845
|
)
|
$
|
(21,126
|
)
|
||
|
Interest and investment income
|
14,590
|
|
8,488
|
|
3,748
|
|
|||||
|
Other
|
(9,171
|
)
|
252
|
|
2,343
|
|
|||||
|
$
|
(30,537
|
)
|
$
|
(9,105
|
)
|
$
|
(15,035
|
)
|
|||
|
18.
|
SELECTED QUARTERLY RESULTS (UNAUDITED)
|
The table below presents quarterly data for the years ended
December 31, 2018
and
2017
. Quarterly revenue within the year ended December 31, 2018 is presented in accordance with ASC 606, and quarterly revenue within the year ended December 31, 2017 is presented in accordance with ASC 605.
|
First
|
Second
|
Third
|
Fourth
|
||||||||||||
|
|
(In thousands, except per share amounts, unaudited)
|
||||||||||||||
|
2018
|
|
|
|
|
|
|
|
|
|||||||
|
Revenues (a)
|
$
|
87,444
|
|
$
|
69,555
|
|
$
|
75,079
|
|
$
|
75,326
|
|
|||
|
Net income applicable to InterDigital, Inc.'s common shareholders
|
$
|
29,925
|
|
$
|
10,706
|
|
$
|
21,407
|
|
$
|
1,830
|
|
|||
|
Net income per common share — basic
|
$
|
0.86
|
|
$
|
0.31
|
|
$
|
0.62
|
|
$
|
0.05
|
|
|||
|
Net income per common share — diluted
|
$
|
0.84
|
|
$
|
0.30
|
|
$
|
0.60
|
|
$
|
0.05
|
|
|||
|
2017
|
|
|
|
|
|
|
|
|
|||||||
|
Revenues (b)
|
$
|
94,530
|
|
$
|
135,779
|
|
$
|
97,325
|
|
$
|
205,304
|
|
|||
|
Net income applicable to InterDigital, Inc.'s common shareholders
|
$
|
33,756
|
|
$
|
52,499
|
|
$
|
35,536
|
|
$
|
52,502
|
|
|||
|
Net income per common share — basic
|
$
|
0.98
|
|
$
|
1.51
|
|
$
|
1.02
|
|
$
|
1.52
|
|
|||
|
Net income per common share — diluted
|
$
|
0.93
|
|
$
|
1.46
|
|
$
|
1.00
|
|
$
|
1.48
|
|
|||
|
(a)
|
In 2018, we recognized
$26.3 million
of non-current patent royalties primarily attributable to the Kyocera and Signal Trust for Wireless Innovation patent license agreements, both signed in first quarter 2018.
|
108
(b) In 2017, we recognized
$162.9 million
of non-current patent royalties primarily attributable to the LG patent license agreement, the recognition of a prepayment balance remaining under a patent license agreement that expired in fourth quarter 2017 and our second quarter 2017 settlement agreement with Microsoft Corporation.
|
19.
|
VARIABLE INTEREST ENTITIES
|
As further discussed below, we are the primary beneficiary of two variable interest entities. As of December 31, 2018, the combined book values of the assets and liabilities associated with these variable interest entities included in our consolidated balance sheet were
$29.9 million
and
$6.1 million
, respectively. Assets included
$11.7 million
of cash and cash equivalents,
$1.3 million
of accounts receivable,
$14.4 million
of patents, net, and
$2.5 million
of other non-current assets. As of December 31, 2017, the combined book values of the assets and liabilities associated with these variable interest entities included in our consolidated balance sheet were
$34.4 million
and
$0.2 million
, respectively. Assets included
$23.3 million
of cash and cash equivalents and
$11.1 million
of patents, net. We recognized
$10.0 million
of non-current patent royalties during the year ended December 31, 2018 related to a patent license agreement signed by the Signal Trust for Wireless Innovation (the “Signal Trust”).
Convida Wireless
Convida Wireless was launched in 2013 and most recently renewed in 2018 to combine Sony's consumer electronics expertise with our pioneering IoT expertise to drive IoT communications and connectivity. Based on the terms of the agreement, the parties will contribute funding and resources for additional research and platform development, which we will perform. SCP IP Investment LLC, an affiliate of Stephens Inc., is a minority investor in Convida Wireless.
Convida Wireless is a variable interest entity. Based on our provision of research and platform development services to Convida Wireless, we have determined that we are the primary beneficiary for accounting purposes and will continue to consolidate Convida Wireless. For the years ended December 31, 2018, 2017 and 2016, we have allocated approximately
$4.4 million
,
$3.6 million
and
$3.5 million
, respectively, of Convida Wireless' net loss to noncontrolling interests held by other parties.
Signal Trust for Wireless Innovation
In 2013, we established the Signal Trust, the goal of which is to monetize a large InterDigital patent portfolio related to cellular infrastructure. The more than 500 patents and patent applications transferred from InterDigital to the Signal Trust focus primarily on 3G and LTE technologies, and were developed by InterDigital's engineers and researchers over more than a decade, with a number of the innovations contributed to the worldwide standards process.
The distributions from the Signal Trust will support continued research related to cellular wireless technologies. A small portion of the proceeds from the Signal Trust will be used to fund, through the Signal Foundation for Wireless Innovation, scholarly analysis of intellectual property rights and the technological, commercial and creative innovations they facilitate. The Signal Trust is a variable interest entity. Based on the terms of the Trust Agreement, we previously determined that we are the primary beneficiary for accounting purposes and must consolidate the Signal Trust.
|
20.
|
SUBSEQUENT EVENTS
|
On February 11, 2019, we announced that we had made a binding offer to acquire the R&I unit of Technicolor SA. R&I is a premier research lab that conducts fundamental research into video coding, IoT and smart home, imaging sciences, AR and VR and artificial intelligence and machine learning technologies. After completing the required prior consultation with Technicolor’s works council, the companies expect to execute a definitive acquisition agreement, the terms of which have been negotiated. The transaction is expected to close in mid-2019, subject to customary closing conditions.
As consideration for the acquisition, the parties have agreed to terminate the jointly-funded R&D collaboration that was entered into as part of the Technicolor Acquisition. In addition, Technicolor has agreed to reduce its rights to a revenue-sharing arrangement announced as part of the Technicolor Acquisition. There is no cash consideration for the transaction.
|
Item 9.
|
CHANGES IN AND DISAGREEMENTS WITH ACCOUNTANTS ON ACCOUNTING AND FINANCIAL DISCLOSURE.
|
None.
109
|
Item 9A.
|
CONTROLS AND PROCEDURES.
|
Evaluation of Disclosure Controls and Procedures
The Company’s Chief Executive Officer and its Chief Financial Officer, with the assistance of other members of management, have evaluated the effectiveness of our disclosure controls and procedures (as defined in Rules 13a-15(e) and 15d-15(e) under the Securities Exchange Act of 1934) as of
December 31, 2018
. Based on that evaluation, the Chief Executive Officer and Chief Financial Officer have concluded that our disclosure controls and procedures were effective to ensure that the information required to be disclosed by us in the reports that we file or submit under the Securities Exchange Act of 1934 is recorded, processed, summarized and reported within the time periods specified in the SEC’s rules and forms and to ensure that the information required to be disclosed by us in the reports that we file or submit under the Securities Exchange Act of 1934 is accumulated and communicated to our management, including our Chief Executive Officer and Chief Financial Officer, as appropriate to allow timely decisions regarding required disclosure.
Management’s Annual Report on Internal Control Over Financial Reporting
Management is responsible for establishing and maintaining adequate internal control over financial reporting as defined in Rules 13a-15(f) and 15d-15(f) under the Securities Exchange Act of 1934. The Company’s internal control over financial reporting is a process designed to provide reasonable assurance regarding the reliability of financial reporting and the preparation of financial statements for external purposes in accordance with accounting principles generally accepted in the United States of America. Internal control over financial reporting includes those policies and procedures that:
|
•
|
Pertain to the maintenance of records that in reasonable detail accurately and fairly reflect the transactions and dispositions of the assets of the company;
|
|
•
|
Provide reasonable assurance that transactions are recorded as necessary to permit preparation of financial statements in accordance with accounting principles generally accepted in the United States of America, and that receipts and expenditures of the company are being made only in accordance with authorization of management and directors of the company; and
|
|
•
|
Provide reasonable assurance regarding prevention or timely detection of unauthorized acquisition, use or disposition of the company’s assets that could have a material effect on the consolidated financial statements.
|
As discussed in Note 5 to the consolidated financial statements, in July 2018, the Company completed the Technicolor Acquisition. The Company began to integrate the acquisition into our internal control over financial reporting structure subsequent to the acquisition date. As permitted by the SEC, management has elected to exclude this acquisition from our assessment of the effectiveness of our internal control over financial reporting as of December 31, 2018. The Technicolor Acquisition constituted 2.5% of the Company’s assets as of December 31, 2018, and 1.5% of the Company’s revenues for the year then ended.
Management, including the Chief Executive Officer and Chief Financial Officer, assessed the effectiveness of internal control over financial reporting as of
December 31, 2018
. Management based this assessment on criteria for effective internal control over financial reporting described in “
Internal Control — Integrated Framework”
issued by the Committee of Sponsoring Organizations of the Treadway Commission (2013). Based on this assessment, management determined that, as of
December 31, 2018
, the Company maintained effective internal control over financial reporting at a reasonable assurance level.
The effectiveness of the Company’s internal control over financial reporting as of
December 31, 2018
has been audited by PricewaterhouseCoopers LLP, an independent registered public accounting firm, as stated in their report that appears under Part II, Item 8, of this Form 10-K.
Changes in Internal Control over Financial Reporting
There were no changes in our internal control over financial reporting during fourth quarter
2018
that have materially affected, or are reasonably likely to materially affect, our internal control over financial reporting.
|
Item 9B.
|
OTHER INFORMATION.
|
None.
PART III
|
Item 10.
|
DIRECTORS, EXECUTIVE OFFICERS AND CORPORATE GOVERNANCE.
|
The information required by this item is incorporated by reference to the information following the captions "Election of Directors," "EXECUTIVE OFFICERS," "Section 16(a) Beneficial Ownership Reporting Compliance," "Code of Ethics," "Nominating and Corporate Governance Committee" and "Audit Committee" in the definitive proxy statement to be filed pursuant to Regulation 14A in connection with our 2019 annual meeting of shareholders not later than 120 days after the end of the fiscal year covered by this Annual Report on Form 10-K (the "Proxy Statement").
|
Item 11.
|
EXECUTIVE COMPENSATION.
|
The information required by this item is incorporated by reference to the information following the captions "EXECUTIVE COMPENSATION" and "DIRECTOR COMPENSATION" in the Proxy Statement.
|
Item 12.
|
SECURITY OWNERSHIP OF CERTAIN BENEFICIAL OWNERS AND MANAGEMENT AND RELATED STOCKHOLDER MATTERS.
|
The information required by this item is incorporated by reference to the information following the captions "EQUITY COMPENSATION PLAN INFORMATION" and "SECURITY OWNERSHIP OF CERTAIN BENEFICIAL OWNERS AND MANAGEMENT" in the Proxy Statement.
|
Item 13.
|
CERTAIN RELATIONSHIPS AND RELATED TRANSACTIONS, AND DIRECTOR INDEPENDENCE.
|
The information required by this item is incorporated by reference to the information following the captions "CERTAIN RELATIONSHIPS AND RELATED TRANSACTIONS" and "Director Independence" in the Proxy Statement.
|
Item 14.
|
PRINCIPAL ACCOUNTANT FEES AND SERVICES.
|
110
The information required by this item is incorporated by reference to the information following the captions "Fees Paid to Independent Registered Public Accounting Firm" and "Audit Committee Pre-Approval Policy for Audit and Non-Audit Services of Independent Registered Public Accounting Firm" in the Proxy Statement.
111
PART IV
|
Item 15.
|
EXHIBITS AND FINANCIAL STATEMENT SCHEDULES.
|
(a) The following documents are filed as a part of this Form 10-K:
(1)
Financial Statements.
The information required by this item begins on Page 61.
(2)
Financial Statement Schedules.
The following financial statement schedule of InterDigital is included herewith and should be read in conjunction with the Financial Statements included in this Item 15.
Valuation and Qualifying Accounts
|
Balance Beginning
of Period
|
Increase/
(Decrease)
|
Reversal of
Valuation
Allowance
|
Balance End
of Period
|
||||||||||||
|
2018 valuation allowance for deferred tax assets
|
$
|
123,916
|
|
$
|
1,568
|
|
(a)
|
$
|
(326
|
)
|
$
|
125,158
|
|
||
|
2017 valuation allowance for deferred tax assets
|
$
|
89,815
|
|
$
|
34,430
|
|
(b)
|
$
|
(329
|
)
|
$
|
123,916
|
|
||
|
2016 valuation allowance for deferred tax assets
|
$
|
81,893
|
|
$
|
7,922
|
|
(a)
|
$
|
—
|
|
$
|
89,815
|
|
||
|
2018 reserve for uncollectible accounts
|
$
|
456
|
|
$
|
237
|
|
(c)
|
$
|
—
|
|
$
|
693
|
|
||
|
2017 reserve for uncollectible accounts
|
$
|
—
|
|
$
|
456
|
|
$
|
—
|
|
$
|
456
|
|
|||
|
2016 reserve for uncollectible accounts
|
$
|
—
|
|
$
|
—
|
|
$
|
—
|
|
$
|
—
|
|
|||
|
(a)
|
The increase was primarily necessary to maintain a full, or near full, valuation allowance against our state deferred tax assets and did not result in additional tax expense.
|
|
(b)
|
The increase was primarily a result of the Tax Cut and Jobs Act signed into law in December of 2017. There was also a release of a state VA during the year that ran through tax expense. The remainder of the increase was necessary to maintain a full, or near full, valuation allowance against our state deferred tax assets and did not result in additional tax expense.
|
|
(c)
|
The increase relates to recording a reserve for uncollectible accounts of $0.7 million in 2018, partially offset by the write-off of a previously recorded reserve.
|
(3)
Exhibits.
See Item 15(b) below.
(b)
|
Exhibit
Number
|
|
Exhibit Description
|
|
|
|
*3.1
|
|
|
|
|
*3.2
|
|
|
|
|
*4.1
|
|
|
|
*4.2
|
|||
|
*4.3
|
|||
|
|
|
|
Real Estate Leases
|
|
*10.1
|
|
||
|
|
|
|
Benefit Plans
|
112
|
|
†*10.2
|
|
Non-Qualified Stock Option Plan, as amended (Exhibit 10.4 to InterDigital's Annual Report on Form 10-K for the year ended December 31, 1991). (P)
|
|
|
†*10.3
|
|
|
|
|
†*10.4
|
|
|
|
|
†*10.5
|
|
|
|
†*10.6
|
|||
|
†*10.7
|
|||
|
†*10.8
|
|
||
|
†*10.9
|
|||
|
†*10.10
|
|||
|
†*10.11
|
|||
|
†*10.12
|
|||
|
†*10.13
|
|||
|
†*10.14
|
|||
|
†*10.15
|
|||
|
†*10.16
|
|||
|
†*10.17
|
|||
|
†*10.18
|
|||
|
†*10.19
|
|
||
|
†*10.20
|
|
||
|
†*10.21
|
|
||
|
†*10.22
|
|||
|
†*10.23
|
|||
|
†*10.24
|
|||
113
|
†*10.25
|
|
||
|
†*10.26
|
|||
|
†*10.27
|
|||
|
†*10.28
|
|||
|
|
|
|
Employment-Related Agreements
|
|
|
†*10.29
|
|
|
|
|
†*10.30
|
|
|
|
†*10.31
|
|||
|
†*10.32
|
|||
|
†*10.33
|
|||
|
†*10.34
|
|
||
|
†*10.35
|
|
||
|
†*10.36
|
|
||
|
†*10.37
|
|||
|
†*10.38
|
|||
|
†*10.39
|
|||
|
Other Material Contracts
|
|||
|
*10.40
|
|
||
|
*10.41
|
|
||
|
|
21
|
|
|
|
|
23.1
|
|
|
114
|
|
31.1
|
|
|
|
|
31.2
|
|
|
|
|
32.1
|
|
|
|
|
32.2
|
|
|
|
|
101
|
|
The following financial information from InterDigital's Annual Report on Form 10-K for the year ended December 31, 2018, filed with the SEC on February 21, 2019, formatted in eXtensible Business Reporting Language:
(i) Consolidated Balance Sheets at December 31, 2018 and December 31, 2017 (ii) Consolidated Statements of Income for the years ended December 31, 2018, 2017 and 2016, (iii) Consolidated Statements of Comprehensive Income for the years ended December 31, 2018, 2017 and 2016, (iv) Consolidated Statements of Shareholders' Equity for the years ended December 31, 2018, 2017 and 2016, (v) Consolidated Statements of Cash Flows for the years ended December 31, 2018, 2017 and 2016, and (vi) Notes to Consolidated Financial Statements.
|
|
*
|
Incorporated by reference to the previous filing indicated.
|
|
†
|
Management contract or compensatory plan or arrangement.
|
|
+
|
This exhibit will not be deemed “filed” for purposes of Section 18 of the Securities Exchange Act of 1934, as amended (15 U.S.C. 78r), or otherwise subject to the liability of that section. Such exhibit will not be deemed to be incorporated by reference into any filing under the Securities Act or Securities Exchange Act, except to the extent that InterDigital, Inc. specifically incorporates it by reference.
|
115
SIGNATURES
Pursuant to the requirements of Section 13 or 15(d) of the Securities Exchange Act of 1934, the registrant has duly caused this report to be signed on its behalf by the undersigned, thereunto duly authorized.
INTERDIGITAL, INC.
|
Date: February 21, 2019
|
By:
|
/s/ William J. Merritt
|
|
|
|
William J. Merritt
|
|
|
|
President and Chief Executive Officer
|
Pursuant to the requirements of the Securities Exchange Act of 1934, this report has been signed below by the following persons on behalf of the registrant and in the capacities and on the dates indicated.
|
Date: February 21, 2019
|
/s/ S. Douglas Hutcheson
|
|
|
S. Douglas Hutcheson, Chairman of the Board of Directors
|
|
Date: February 21, 2019
|
/s/ Joan H. Gillman
|
|
|
Joan H. Gillman, Director
|
|
|
|
|
Date: February 21, 2019
|
/s/ John A. Kritzmacher
|
|
John A. Kritzmacher, Director
|
|
|
Date: February 21, 2019
|
/s/ John D. Markley, Jr.
|
|
John D. Markley, Jr., Director
|
|
|
Date: February 21, 2019
|
/s/ Jean F. Rankin
|
|
|
Jean F. Rankin, Director
|
|
|
|
|
Date: February 21, 2019
|
/s/ Philip P. Trahanas
|
|
Philip P. Trahanas, Director
|
|
|
Date: February 21, 2019
|
/s/ William J. Merritt
|
|
|
William J. Merritt, Director, President and Chief Executive Officer
|
|
|
(Principal Executive Officer)
|
|
|
|
|
Date: February 21, 2019
|
/s/ Richard J. Brezski
|
|
|
Richard J. Brezski, Chief Financial Officer
|
|
|
(Principal Financial Officer)
|
116
TABLE OF CONTENTS
Part IItem 1. BusinessItem 1A. Risk FactorsItem 1B. Unresolved Staff CommentsItem 2. PropertiesItem 3. Legal ProceedingsItem 4. Mine Safety DisclosuresPart IIItem 5. Market For Registrant S Common Equity, Related Stockholder Matters and Issuer Purchases Of Equity SecuritiesItem 6. Selected Financial DataItem 7. Management S Discussion and Analysis Of Financial Condition and Results Of OperationsItem 7A. Quantitative and Qualitative Disclosures About Market RiskItem 8. Financial Statements and Supplementary DataItem 9. Changes in and Disagreements with Accountants on Accounting and Financial DisclosureItem 9A. Controls and ProceduresItem 9B. Other InformationPart IIIItem 10. Directors, Executive Officers and Corporate GovernanceItem 11. Executive CompensationItem 12. Security Ownership Of Certain Beneficial Owners and Management and Related Stockholder MattersItem 13. Certain Relationships and Related Transactions, and Director IndependenceItem 14. Principal Accountant Fees and ServicesPart IVItem 15. Exhibits and Financial Statement Schedules