IDEX CORP /DE/
10-Ks and 10-Qs
|
|
|
|
|
|
|
|
|
|
|
|
|
|
|
|
|
|
|
|
|
|
|
|
|
|
|
|
|
|
|
|
|
|
|
|
|
|
|
|
|
|
|
|
|
|
|
|
|
|
|
|
|
|
|
|
UNITED STATES SECURITIES AND EXCHANGE COMMISSION
Washington, D.C. 20549
Form 10-K
|
þ
|
ANNUAL REPORT PURSUANT TO SECTION 13 OR 15(d) OF THE SECURITIES EXCHANGE ACT OF 1934
|
|
For the fiscal year ended December 31, 2018
|
|
|
¨
|
TRANSITION REPORT PURSUANT TO SECTION 13 OR 15(d) OF THE SECURITIES EXCHANGE ACT OF 1934
|
|
For the transition period from to
|
|
Commission file number 1-10235
IDEX CORPORATION
(Exact name of registrant as specified in its charter)
|
Delaware
|
|
36-3555336
|
|
(State or other jurisdiction of incorporation or organization)
|
|
(I.R.S. Employer Identification No.)
|
|
1925 West Field Court, Suite 200, Lake Forest, Illinois
|
|
60045
|
|
(Address of principal executive offices)
|
|
(Zip Code)
|
Registrant’s telephone number, including area code:
(847) 498-7070
Securities Registered Pursuant to Section 12(b) of the Act:
|
Title of Each Class
|
|
Name of Each Exchange on Which Registered
|
|
Common Stock, par value $.01 per share
|
|
New York Stock Exchange
|
Securities Registered Pursuant to Section 12(g) of the Act:
None
Indicate by check mark if the registrant is a well-known seasoned issuer, as defined in Rule 405 of the Securities Act. Yes
þ
No
¨
Indicate by check mark if the registrant is not required to file reports pursuant to Section 13 or Section 15(d) of the Act. Yes
¨
No
þ
Indicate by check mark whether the registrant: (1) has filed all reports required to be filed by Section 13 or 15(d) of the Securities Exchange Act of 1934 during the preceding 12 months (or for such shorter period that the registrant was required to file such reports), and (2) has been subject to such filing requirements for the past 90 days. Yes
þ
No
¨
Indicate by check mark whether the registrant has submitted electronically every Interactive Data File required to be submitted pursuant to Rule 405 of Regulation S-T (232.405 of this chapter) during the preceding 12 months (or for such shorter period that the registrant was required to submit such files). Yes
þ
No
¨
Indicate by check mark if disclosure of delinquent filers pursuant to Item 405 of Regulation S-K (229.405 of this chapter) is not contained herein, and will not be contained, to the best of registrant’s knowledge, in definitive proxy or information statements incorporated by reference in Part III of this Form 10-K or any amendment to this Form 10-K.
¨
Indicate by check mark whether the registrant is a large accelerated filer, an accelerated filer, a non-accelerated filer, or a smaller reporting company or an emerging growth company. See the definitions of “large accelerated filer,” “accelerated filer,” “smaller reporting company” and “emerging growth company” in Rule 12b-2 of the Exchange Act. (Check one):
|
Large accelerated filer
þ
|
Accelerated filer
¨
|
Non-accelerated filer
¨
|
Smaller reporting company
¨
|
|||
|
Emerging growth company
¨
|
||||||
|
If an emerging growth company, indicate by check mark if the registrant has elected not to use the extended transition period for complying with any new or revised financial accounting standards provided pursuant to Section 13(a) of the Exchange Act.
¨
|
||||||
Indicate by check mark whether the registrant is a shell company (as defined in Rule 12b-2 of the Act). Yes
¨
No
þ
The aggregate market value, as of the last business day of the registrant’s most recently completed second fiscal quarter, of the common stock (based on the
June 30, 2018
closing price of
$136.48
) held by non-affiliates of IDEX Corporation was
$10,446,083,118
.
The number of shares outstanding of IDEX Corporation’s common stock, par value $.01 per share, as of
February 15, 2019
was
75,792,814
.
DOCUMENTS INCORPORATED BY REFERENCE
Portions of the proxy statement with respect to the IDEX Corporation
2019
annual meeting of stockholders (the “
2019
Proxy Statement”) are incorporated by reference into Part III of this Form 10-K.
Table of Contents
|
PART I.
|
||
|
Item 1.
|
||
|
Item 1A.
|
||
|
Item 1B.
|
||
|
Item 2.
|
||
|
Item 3.
|
||
|
Item 4.
|
||
|
PART II.
|
||
|
Item 5.
|
||
|
Item 6.
|
||
|
Item 7.
|
||
|
Item 7A.
|
||
|
Item 8.
|
||
|
Item 9.
|
||
|
Item 9A.
|
||
|
Item 9B.
|
||
|
PART III.
|
||
|
Item 10.
|
||
|
Item 11.
|
||
|
Item 12.
|
||
|
Item 13.
|
||
|
Item 14.
|
||
|
PART IV.
|
||
|
Item 15.
|
||
|
Item 16.
|
||
PART I
Cautionary Statement Under the Private Securities Litigation Reform Act
This report contains “forward-looking” statements within the meaning of the Private Securities Litigation Reform Act of 1995, as amended. These statements may relate to, among other things, capital expenditures, acquisitions, cost reductions, cash flow, revenues, earnings, market conditions, global economies and operating improvements, and are indicated by words or phrases such as “anticipates,” “estimates,” “plans,” “expects,” “projects,” “forecasts,” “should,” “could,” “will,” “management believes,” “the Company believes,” “the Company intends,” and similar words or phrases. These statements are subject to inherent uncertainties and risks that could cause actual results to differ materially from those anticipated at the date of this report. The risks and uncertainties include, but are not limited to, the following: economic and political consequences resulting from terrorist attacks and wars; levels of industrial activity and economic conditions in the U.S. and other countries around the world; pricing pressures and other competitive factors and levels of capital spending in certain industries, all of which could have a material impact on order rates and the Company’s results, particularly in light of the low levels of order backlogs it typically maintains; the Company’s ability to make acquisitions and to integrate and operate acquired businesses on a profitable basis; the relationship of the U.S. dollar to other currencies and its impact on pricing and cost competitiveness; political and economic conditions in foreign countries in which the Company operates; developments with respect to trade policy and tariffs; interest rates; capacity utilization and the effect this has on costs; labor markets; market conditions and material costs; and developments with respect to contingencies, such as litigation and environmental matters. The forward-looking statements included here are only made as of the date of this report, and management undertakes no obligation to publicly update them to reflect subsequent events or circumstances, except as may be required by law. Investors are cautioned not to rely unduly on forward-looking statements when evaluating the information presented here.
Item 1.
Business.
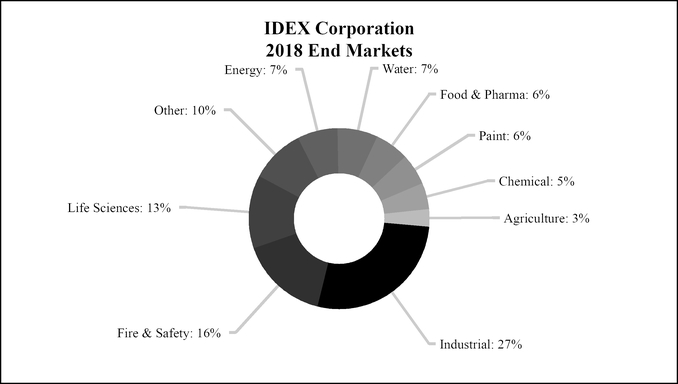
IDEX Corporation (“IDEX,” the “Company,” “us,” “our,” or “we”) is a Delaware corporation incorporated on September 24, 1987. The Company is an applied solutions business that sells an extensive array of pumps, valves, flow meters and other fluidics systems and components and engineered products to customers in a variety of markets around the world. All of the Company’s business activities are carried out through wholly-owned subsidiaries.
The Company has three reportable business segments: Fluid & Metering Technologies (“FMT”), Health & Science Technologies (“HST”) and Fire & Safety/Diversified Products (“FSDP”). Within our three reportable segments, the Company maintains 13 platforms, where we focus on organic growth and strategic acquisitions. Each of our 13 platforms is also a reporting unit that we annually test for goodwill impairment.
1
The Fluid & Metering Technologies segment contains the Energy platform (comprised of Corken, Liquid Controls, SAMPI and Toptech), the Valves platform (comprised of Alfa Valvole, Richter and Aegis), the Water platform (comprised of Pulsafeeder, OBL, Knight, ADS, Trebor and iPEK), the Pumps platform (comprised of Viking and Warren Rupp) and the Agriculture platform (comprised of Banjo). The Health & Science Technologies segment contains the Scientific Fluidics & Optics platform (comprised of Eastern Plastics, Rheodyne, Sapphire Engineering, Upchurch Scientific, ERC, CiDRA Precision Services, thinXXS Microtechnology (“thinXXS”), CVI Melles Griot, Semrock, AT Films and Finger Lakes Instrumentation (“FLI”)), the Sealing Solutions platform (comprised of Precision Polymer Engineering, FTL Seals Technology, Novotema and SFC Koenig), the Gast platform, the Micropump platform and the Material Processing Technologies platform (comprised of Quadro, Fitzpatrick, Microfluidics and Matcon). The Fire & Safety/Diversified Products segment is comprised of the Fire & Safety platform (comprised of Class 1, Hale, Godiva, Akron Brass, Weldon, AWG Fittings, Dinglee, Hurst Jaws of Life, Lukas and Vetter), the Band-It platform and the Dispensing platform.
IDEX believes that each of its reporting units is a leader in its product and service areas. The Company also believes that its strong financial performance has been attributable to its ability to design and engineer specialized quality products, coupled with its ability to identify and successfully consummate and integrate strategic acquisitions.
FLUID & METERING TECHNOLOGIES SEGMENT
The Fluid & Metering Technologies segment designs, produces and distributes positive displacement pumps, flow meters, injectors and other fluid-handling pump modules and systems and provides flow monitoring and other services for the food, chemical, general industrial, water and wastewater, agriculture and energy industries. Fluid & Metering Technologies application-specific pump and metering solutions serve a diverse range of end markets, including industrial infrastructure (fossil fuels, refined and alternative fuels and water and wastewater), chemical processing, agriculture, food and beverage, pulp and paper, transportation, plastics and resins, electronics and electrical, construction and mining, pharmaceutical and bio-pharmaceutical, machinery and numerous other specialty niche markets.
2
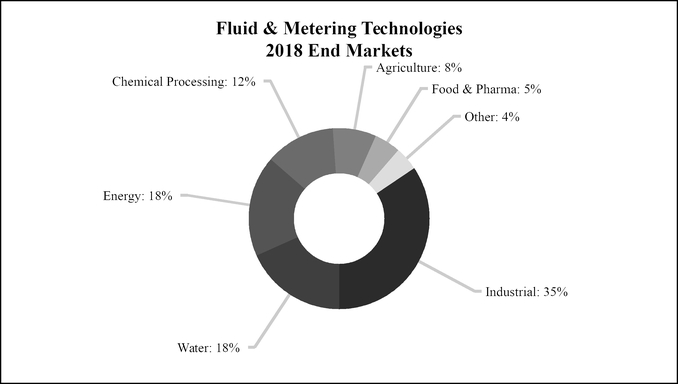
Fluid & Metering Technologies accounted for
38%
, 38% and 40% of IDEX’s sales in
2018
,
2017
and
2016
, respectively, with approximately
43%
of its
2018
sales to customers outside the U.S. The segment accounted for
42%
, 42% and 44% of total segment operating income in
2018
,
2017
and
2016
, respectively.
Energy.
Energy consists of the Company’s Corken, Liquid Controls, SAMPI and Toptech businesses. Energy is a leading supplier of flow meters, electronic registration and control products, rotary vane and turbine pumps, reciprocating piston compressors and terminal automation control systems. Applications for Liquid Controls and SAMPI consist of positive displacement flow meters and electronic registration and control products, including mobile and stationary metering installations for wholesale and retail distribution of petroleum and liquefied petroleum gas, aviation refueling and industrial metering and dispensing of liquids and gases. Corken products consist of positive-displacement rotary vane pumps, single and multistage regenerative turbine pumps and small horsepower reciprocating piston compressors. Toptech supplies terminal automation hardware and software to control and manage inventories as well as transactional data and invoicing to customers in the oil, gas and refined-fuels markets. Energy maintains facilities in Lake Bluff, Illinois (Liquid Controls products); Longwood, Florida and Zwijndrecht, Belgium (Toptech products); Oklahoma City, Oklahoma (Corken products); and Altopascio, Italy (SAMPI products). Approximately
42%
of Energy’s
2018
sales were to customers outside the U.S.
Valves.
Valves consists of the Company’s Alfa Valvole, Richter and Aegis businesses. Valves is a leader in the design, manufacture and sale of specialty valve products for use in the chemical, petro-chemical, energy and sanitary markets as well as a leading producer of fluoroplastic lined corrosion-resistant magnetic drive and mechanical seal pumps, shut-off, control and safety valves for corrosive, hazardous, contaminated, pure and high-purity fluids. Alfa Valvole’s products are used in various industrial fields for fluid control, in both gas and liquid form, in all sectors of plant engineering, cosmetics, detergents, food industry, electric energy, pharmaceutical, chemical plants, petrochemical plants, oil, heating/air conditioning and also on ships, ferries and marine oil platforms. Richter’s products offer superior solutions for demanding and complex pump and valve applications in the process industry. Aegis produces specialty chemical processing valves for use in the chemical, petro-chemical, chlor-alkali and pulp and paper industries. Valves maintains operations in Casorezzo, Italy (Alfa Valvole products); Cedar Falls, Iowa, Kempen, Germany and Suzhou, China (Richter products); and Geismar, Louisiana (Aegis products). Approximately
82%
of Valves’
2018
sales were to customers outside the U.S.
Water.
Water consists of the Company’s ADS, iPEK, Knight, Trebor, Pulsafeeder and OBL businesses. Water is a leading provider of metering technology, flow monitoring products and underground surveillance services for wastewater markets, alloy and non-metallic gear pumps, peristaltic pumps, transfer pumps as well as dispensing equipment for industrial laundries, commercial dishwashing and chemical metering. ADS’ products and services provide comprehensive integrated solutions that enable industry, municipalities and government agencies to analyze and measure the capacity, quality and integrity of wastewater collection systems,
3
including the maintenance and construction of such systems. iPEK supplies remote controlled systems used for infrastructure inspection. Knight is a leading manufacturer of pumps and dispensing equipment for industrial laundries, commercial dishwashing and chemical metering. Trebor is a leader in high-purity fluid handling products, including air-operated diaphragm pumps and deionized water-heating systems. Trebor products are used in the manufacturing of semiconductors, disk drives and flat panel displays. Pulsafeeder products (which also include OBL products) are used to introduce precise amounts of fluids into processes to manage water quality and chemical composition as well as peristaltic pumps. Its markets include water and wastewater treatment, oil and gas, power generation, pulp and paper, chemical and hydrocarbon processing and swimming pools. Water maintains operations in Huntsville, Alabama and various other locations in the United States, Canada and Australia (ADS products and services); Hirschegg, Austria and Sulzberg, Germany (iPEK products); Rochester, New York, Punta Gorda, Florida, and Milan, Italy (Pulsafeeder products); West Jordan, Utah (Trebor products); Irvine, California, Mississauga, Ontario, Canada, and Lewes, England (Knight products); and a maquiladora in Ciudad Juarez, Chihuahua, Mexico (Knight products). Approximately
42%
of Water’s
2018
sales were to customers outside the U.S.
Pumps.
Pumps consists of the Company’s Viking and Warren Rupp businesses. Pumps is a leading manufacturer of rotary internal gear, external gear, vane and rotary lobe pumps, custom-engineered OEM pumps, strainers, gear reducers and engineered pump systems. Viking’s products consist of external gear pumps, strainers and reducers and related controls used for transferring and metering thin and viscous liquids sold under the Viking and Wright Flow brands. Viking products primarily serve the chemical, petroleum, pulp and paper, plastics, paints, inks, tanker trucks, compressor, construction, food and beverage, personal care, pharmaceutical and biotech markets. Warren Rupp products (which include Versa-Matic products) are used for abrasive and semisolid materials as well as for applications where product degradation is a concern or where electricity is not available or should not be used. Warren Rupp products, which include air-operated double diaphragm pumps, primarily serve the chemical, paint, food processing, electronics, construction, utilities, oil and gas, mining and industrial maintenance markets. Pumps maintains operations in Cedar Falls, Iowa (Viking and Wright Flow products); Eastbourne, England (Wright Flow products); Shannon, Ireland (Viking and Blagdon products); and Mansfield, Ohio (Warren Rupp products). Pumps primarily uses independent distributors to market and sell its products. Approximately
38%
of Pumps’
2018
sales were to customers outside the U.S.
Agriculture.
Agriculture consists of the Company’s Banjo business. Banjo is a provider of special purpose, severe-duty pumps, valves, fittings and systems used in liquid handling. Banjo is based in Crawfordsville, Indiana with distribution facilities in Didam, The Netherlands and Valinhos, Brazil. Its products are used in agriculture (approximately 72% of revenue) and industrial (approximately 28% of revenue) applications. Approximately
19%
of Banjo’s
2018
sales were to customers outside the U.S.
HEALTH & SCIENCE TECHNOLOGIES SEGMENT
The Health & Science Technologies segment designs, produces and distributes a wide range of precision fluidics, rotary lobe pumps, centrifugal and positive displacement pumps, roll compaction and drying systems used in beverage, food processing, pharmaceutical and cosmetics, pneumatic components and sealing solutions, including very high precision, low-flow rate pumping solutions required in analytical instrumentation, clinical diagnostics and drug discovery, high performance molded and extruded sealing components, biocompatible medical devices and implantables, air compressors used in medical, dental and industrial applications, optical components and coatings for applications in the fields of scientific research, defense, biotechnology, aerospace, telecommunications and electronics manufacturing, laboratory and commercial equipment used in the production of micro and nano scale materials, precision photonic solutions used in life sciences, research and defense markets and precision gear and peristaltic pump technologies that meet exacting original equipment manufacturer specifications.
4
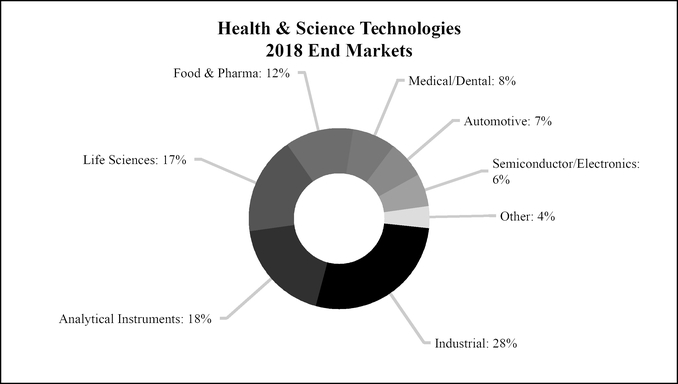
Health & Science Technologies accounted for
36%
, 36% and 35% of IDEX’s sales in
2018
,
2017
and
2016
, respectively, with approximately
56%
of its
2018
sales to customers outside the U.S. The segment accounted for
32%
, 32% and 31% of total segment operating income in
2018
,
2017
and
2016
, respectively.
Scientific Fluidics & Optics.
Scientific Fluidics & Optics consists of the Company’s Eastern Plastics, Rheodyne, Sapphire Engineering, Upchurch Scientific, ERC, CiDRA Precision Services, thinXXS, CVI Melles Griot, Semrock, AT Films (including Precision Photonics products) and FLI businesses. Eastern Plastics products, which consist of high-precision integrated fluidics and associated engineered manifolds, are used in a broad set of end markets including medical diagnostics, analytical instrumentation and laboratory automation. Rheodyne products consist of injectors, valves, fittings and accessories for the analytical instrumentation market. These products are used by manufacturers of high pressure liquid chromatography (“HPLC”) equipment servicing the pharmaceutical, biotech, life science, food and beverage, and chemical markets. Sapphire Engineering and Upchurch Scientific products consist of fluidic components and systems for the analytical, biotech and diagnostic instrumentation markets, such as fittings, precision-dispensing pumps and valves, tubing and integrated tubing assemblies, filter sensors and other micro-fluidic and nano-fluidic components as well as advanced column hardware and accessories for the high performance liquid chromatography market. The products produced by Sapphire Engineering and Upchurch Scientific primarily serve the pharmaceutical, drug discovery, chemical, biochemical processing, genomics/proteomics research, environmental labs, food/agriculture, medical lab, personal care and plastics/polymer/rubber production markets. ERC manufactures gas liquid separations and detection solutions for the life science, analytical instrumentation and clinical chemistry markets. ERC’s products consist of in-line membrane vacuum degassing solutions, refractive index detectors and ozone generation systems. CiDRA Precision Services’ products consist of microfluidic components serving the life science, health and industrial markets and thinXXS is a leader in the design, manufacture and sale of microfluidic components serving the point of care, veterinary and life science markets. CVI Melles Griot is a global leader in the design and manufacture of precision photonic solutions used in the life science, research, semiconductor, security and defense markets. CVI Melles Griot’s innovative products are focused on the generation, control and productive use of light for a variety of key science and industrial applications. Products consist of specialty lasers and light sources, electro-optical components, specialty shutters, opto-mechanical assemblies and components. In addition, CVI Melles Griot produces critical components for life science research, electronics manufacturing, military and other industrial applications including lenses, mirrors, filters and polarizers. These components are utilized in a number of important applications such as spectroscopy, cytometry (cell counting), guidance systems for target designation, remote sensing, menology and optical lithography. Semrock is a provider of optical filters for biotech and analytical instrumentation in the life science market. Semrock’s optical filters are produced using state-of-the-art manufacturing processes which enable it to offer its customers significant improvements in instrument performance and reliability. AT Films specializes in optical components and coatings for applications in the fields of scientific research, defense, aerospace, telecommunications and electronics manufacturing. AT Films’ core competence is the design and manufacture of filters, splitters, reflectors and mirrors with the precise physical properties required to support their
5
customers’ most challenging and cutting-edge optical applications. The Precision Photonics portion of its business specializes in optical components and coatings for applications in the fields of scientific research, aerospace, telecommunications and electronics manufacturing. FLI specializes in the design, development and production of low-noise cooled charge-coupled device (“CCD”) and high speed, high-sensitivity Scientific complementary metal-oxide semiconductor (“CMOS”) cameras for the astronomy and life sciences markets. Scientific Fluidics & Optics has facilities in Bristol, Connecticut (Eastern Plastics products); Rohnert Park, California (Rheodyne products); Middleboro, Massachusetts (Sapphire Engineering products); Oak Harbor, Washington (Upchurch Scientific products); Kawaguchi, Japan (ERC products); Wallingford, Connecticut (CiDRA Precision Services products); Zweibrücken, Germany (thinXXS products); Albuquerque, New Mexico, Rochester, New York, Leicester, England and Didam, The Netherlands (CVI Melles Griot products); Rochester, New York (Semrock products); Boulder, Colorado (AT Films products); and Lima, New York (FLI products). Approximately
51%
of Scientific Fluidics & Optics’
2018
sales were to customers outside the U.S.
Sealing Solutions.
Sealing Solutions consists of the Company’s Precision Polymer Engineering, FTL Seals Technology, Novotema and SFC Koenig businesses. Precision Polymer Engineering is a provider of proprietary high performance seals and advanced sealing solutions for a diverse range of global industries and applications, including hazardous duty, analytical instrumentation, semiconductor, process technologies, oil and gas, pharmaceutical, electronics and food applications. Precision Polymer Engineering is headquartered in Blackburn, England with an additional manufacturing facility in Brenham, Texas. FTL Seals Technology, located in Leeds, England, specializes in the design and application of high integrity rotary seals, specialty bearings and other custom products for the mining, power generation and marine markets. Novotema, located in Villongo, Italy, is a leader in the design, manufacture and sale of specialty sealing solutions for use in the building products, gas control, transportation, industrial and water markets. SFC Koenig is a producer of highly engineered expanders and check valves for critical applications across the transportation, hydraulic, aviation and medical markets. SFC Koenig is based in Dietikon, Switzerland, with additional facilities in North Haven, Connecticut, Illerrieden, Germany, and Suzhou, China. Approximately
77%
of Sealing Solutions’
2018
sales were to customers outside the U.S.
Gast.
The Gast business is a leading manufacturer of air-moving products, including air motors, low-range and medium-range vacuum pumps, vacuum generators, regenerative blowers and fractional horsepower compressors. Gast products are used in a variety of long-life applications requiring a quiet, clean source of moderate vacuum or pressure. Gast products primarily serve the medical equipment, environmental equipment, computers and electronics, printing machinery, paint mixing machinery, packaging machinery, graphic arts and industrial manufacturing markets. Based in Benton Harbor, Michigan, Gast also has a logistics and commercial center in Redditch, England. Approximately
27%
of Gast’s
2018
sales were to customers outside the U.S.
Micropump.
Micropump, headquartered in Vancouver, Washington, is a leader in small, precision-engineered, magnetically and electromagnetically driven rotary gear, piston and centrifugal pumps. Micropump products are used in low-flow abrasive and corrosive applications. Micropump products primarily serve the continuous ink-jet printing, medical equipment, chemical processing, pharmaceutical, refining, laboratory, electronics, textiles, peristaltic metering pumps, analytical process controllers and sample preparation systems markets. Approximately
71%
of Micropump’s
2018
sales were to customers outside the U.S.
Material Processing Technologies.
Material Processing Technologies consists of the Company’s Quadro, Fitzpatrick, Microfluidics and Matcon businesses. Quadro is a leading provider of particle control solutions for the pharmaceutical and bio-pharmaceutical markets. Based in Waterloo, Canada, Quadro’s core capabilities include fine milling, emulsification and special handling of liquid and solid particulates for laboratory, pilot phase and production scale processing. Fitzpatrick is a global leader in the design and manufacture of process technologies for the pharmaceutical, food and personal care markets. Fitzpatrick designs and manufactures customized size reduction, roll compaction and drying systems to support their customers’ product development and manufacturing processes. Fitzpatrick is headquartered in Waterloo, Canada. Microfluidics is a global leader in the design and manufacture of laboratory and commercial equipment used in the production of micro and nano scale materials for the pharmaceutical and chemical markets. Microfluidics is the exclusive producer of the Microfluidizer family of high shear fluid processors for uniform particle size reduction, robust cell disruption and nanoparticle creation. Microfluidics is also based in Waterloo, Canada and has offices in Newton, Massachusetts. Matcon is a global leader in material processing solutions for high value powders used in the manufacture of pharmaceuticals, food, plastics and fine chemicals. Matcon’s innovative products consist of the original cone valve powder discharge system and filling, mixing and packaging systems, all of which support its customers’ automation and process requirements. These products are critical to its customers’ need to maintain clean, reliable and repeatable formulations of prepackaged foods and pharmaceuticals while helping them achieve lean and agile manufacturing. Matcon is located in Evesham, England. Approximately
65%
of Material Processing Technologies’
2018
sales were to customers outside the U.S.
6
FIRE & SAFETY/DIVERSIFIED PRODUCTS SEGMENT
The Fire & Safety/Diversified Products segment designs, produces and distributes firefighting pumps, valves, rescue tools, lifting bags and other components and systems for the fire and rescue industry, engineered stainless steel banding and clamping devices used in a variety of industrial and commercial applications and precision equipment for dispensing, metering and mixing colorants and paints used in a variety of retail and commercial businesses around the world.
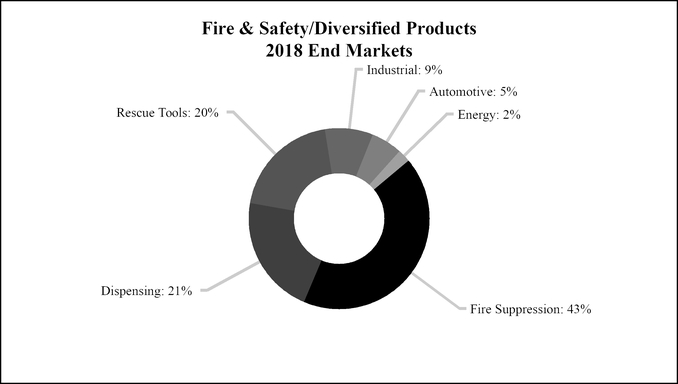
The Fire & Safety/Diversified Products segment accounted for
26%
, 26% and 25% of IDEX’s sales in
2018
,
2017
and
2016
, respectively, with approximately
53%
of its
2018
sales to customers outside the U.S. The segment accounted for
26%
, 26% and 25% of total segment operating income in
2018
,
2017
and
2016
, respectively.
Fire & Safety.
Fire & Safety consists of the Company’s Class 1, Hale, Godiva, Akron Brass, AWG Fittings, Dinglee, Hurst Jaws of Life, Lukas and Vetter businesses, which produce truck-mounted and portable fire pumps, stainless steel valves, monitors, apparatus valves, nozzles, foam and compressed air foam systems, pump modules and pump kits, electronic controls and information systems, conventional and networked electrical systems, mechanical components for the fire, rescue and specialty vehicle markets, hydraulic, battery, gas and electric-operated rescue equipment, hydraulic re-railing equipment, hydraulic tools for industrial applications, recycling cutters, pneumatic lifting and sealing bags for vehicle and aircraft rescue, environmental protection and disaster control and shoring equipment for vehicular or structural collapse. Fire & Safety’s customers are OEMs as well as public and private fire and rescue organizations. Fire & Safety maintains facilities in Ocala, Florida (Class 1 and Hale products); Warwick, England (Godiva products); Wooster and Columbus, Ohio (Akron Brass and Weldon products); Ballendorf, Germany (AWG Fittings products); Shelby, North Carolina (Hurst Jaws of Life products); Tianjin, China (Dinglee products); Erlangen, Germany (Lukas products); and Zulpich, Germany (Vetter products). Approximately
52%
of Fire & Safety’s
2018
sales were to customers outside the U.S.
Band-It.
Band-It is a leading producer of high-quality stainless steel banding, buckles and clamping systems. The BAND-IT brand is highly recognized worldwide. Band-It products are used for securing exhaust system heat and sound shields, industrial hose fittings, traffic signs and signals, electrical cable shielding, identification and bundling and in numerous other industrial and commercial applications. Band-It products primarily serve the automotive, transportation equipment, oil and gas, general industrial maintenance, electronics, electrical, communications, aerospace, utility, municipal and subsea marine markets. Band-It is based in Denver, Colorado, with additional operations in Staveley, England. Approximately
42%
of Band-It’s
2018
sales were to customers outside the U.S.
7
Dispensing.
Dispensing produces precision equipment for dispensing, metering and mixing colorants and paints used in a variety of retail and commercial businesses around the world. Dispensing is a global supplier of precision-designed tinting, mixing, dispensing and measuring equipment for auto refinishing and architectural paints. Dispensing products are used in retail and commercial stores, hardware stores, home centers, department stores, automotive body shops as well as point-of-purchase dispensers. Dispensing maintains facilities in Sassenheim, The Netherlands, Wheeling, Illinois, Unanderra, Australia and Milan, Italy as well as IDEX shared manufacturing facilities in India and China. Approximately
67%
of Dispensing’s
2018
sales were to customers outside the U.S.
INFORMATION APPLICABLE TO THE COMPANY’S BUSINESS IN GENERAL AND ITS SEGMENTS
Competitors
The Company’s businesses participate in highly competitive markets. IDEX believes that the principal points of competition are product quality, design and engineering capabilities, product development, conformity to customer specifications, quality of post-sale support, timeliness of delivery and effectiveness of our distribution channels.
Principal competitors of the Fluid & Metering Technologies segment are the Pumps Group (Maag, Blackmer and Wilden products) of Dover Corporation (with respect to pumps and small horsepower compressors used in liquified petroleum gas distribution facilities, rotary gear pumps and air-operated double-diaphragm pumps); Milton Roy LLC (with respect to metering pumps and controls); and Tuthill Corporation (with respect to rotary gear pumps).
Principal competitors of the Health & Science Technologies segment are the Thomas division of Gardner Denver, Inc. (with respect to vacuum pumps and compressors); Thermo Scientific Dionex products (with respect to analytical instrumentation); Parker Hannifin (with respect to sealing devices); Valco Instruments Co., Inc. (with respect to fluid injectors and valves); and Gooch & Housego PLC (with respect to electro-optic and precision photonics solutions used in the life sciences market).
The principal competitors of the Fire & Safety/Diversified Products segment are Waterous Company, a unit of American Cast Iron Pipe Company (with respect to truck-mounted firefighting pumps); Holmatro, Inc. (with respect to rescue tools); Corob S.p.A. (with respect to dispensing and mixing equipment for the paint industry); and Panduit Corporation (with respect to stainless steel bands, buckles and clamping systems).
Customers
The principal customers for our products are discussed immediately above by product category in each segment. None of our customers in
2018
accounted for more than two percent of net sales.
Employees
At
December 31, 2018
, the Company had
7,352
employees. Approximately 7% of employees were represented by labor unions, with various contracts expiring through October 2022. Management believes that the Company has a positive relationship with its employees. The Company historically has been able to renegotiate its collective bargaining agreements satisfactorily, with its last work stoppage occurring in March 1993.
Suppliers
The Company manufactures many of the parts and components used in its products. Substantially all materials, parts and components purchased by the Company are available from multiple sources.
Inventory and Backlog
The Company regularly and systematically adjusts production schedules and quantities based on the flow of incoming orders. Backlogs typically are limited to one and a half months of production. While total inventory levels also may be affected by changes in orders, the Company generally tries to maintain relatively stable inventory levels based on its assessment of the requirements of the various industries served.
Raw Materials
The Company uses a wide variety of raw materials which are generally available from a number of sources. As a result, shortages from any single supplier have not had, and are not likely to have a material impact on operations.
8
Shared Services
The Company has production facilities in Suzhou, China and Vadodara, India that support multiple business units. IDEX also has personnel in China, India, Dubai, Mexico, Latin America and Singapore that provide sales and marketing, product design and engineering and sourcing support to its business units as well as personnel in various locations in South America, the Middle East, Korea and Japan to support sales and marketing efforts of IDEX businesses in those regions.
Segment Information
For segment financial information for the years
2018
,
2017
and
2016
, including financial information about foreign and domestic sales and operations, see “Management’s Discussion and Analysis of Financial Condition and Results of Operations” and Note 12 of the Notes to Consolidated Financial Statements in Part II, Item 8, “Financial Statements and Supplementary Data.”
Executive Officers of the Registrant
Set forth below are the names of the executive officers of the Company, their ages, years of service, the positions held by them and their business experience during the past five years.
|
Name
|
Age
|
Years of
Service
|
Position
|
|||
|
Andrew K. Silvernail
|
48
|
10
|
Chairman of the Board and Chief Executive Officer
|
|||
|
William K. Grogan
|
40
|
7
|
Senior Vice President and Chief Financial Officer
|
|||
|
Eric D. Ashleman
|
51
|
10
|
Senior Vice President and Chief Operating Officer
|
|||
|
Denise R. Cade
|
56
|
3
|
Senior Vice President, General Counsel and Corporate Secretary
|
|||
|
Daniel J. Salliotte
|
52
|
14
|
Senior Vice President-Corporate Development
|
|||
|
Michael J. Yates
|
53
|
13
|
Vice President and Chief Accounting Officer
|
|||
|
Jeffrey D. Bucklew
|
48
|
7
|
Senior Vice President-Chief Human Resources Officer
|
|||
|
James MacLennan
|
55
|
7
|
Senior Vice President-Chief Information Officer
|
|||
Mr. Silvernail has served as Chief Executive Officer since August 2011 and as Chairman of the Board since January 2012. Prior to that, Mr. Silvernail was Vice President-Group Executive Health & Science Technologies, Global Dispensing and Fire & Safety/Diversified Products from January 2011 to August 2011. From February 2010 to December 2010, Mr. Silvernail was Vice President-Group Executive Health & Sciences Technologies and Global Dispensing. Mr. Silvernail joined IDEX in January 2009 as Vice President-Group Executive Health & Science Technologies.
Mr. Grogan has served as Senior Vice President and Chief Financial Officer since January 2017. Prior to that, Mr. Grogan served as Vice President of Finance, Operations from July 2015 through January 2017. From January 2012 through July 2015, Mr. Grogan was Vice President-Finance for the Company’s Health & Science Technologies and Fire & Safety/Diversified Products segments.
Mr. Ashleman has served as Senior Vice President and Chief Operating Officer since July 2015. Prior to that, Mr. Ashleman served as the Vice President-Group Executive of the Company’s Health & Science Technologies and Fire & Safety/Diversified Products segments from January 2014 through July 2015 and President-Group Executive of the Company’s Fire & Safety/Diversified Products segment from 2011 through January 2014. Mr. Ashleman joined IDEX in 2008 as the President of Gast Manufacturing.
Ms. Cade has served as Senior Vice President, General Counsel and Corporate Secretary since joining IDEX in October 2015. Prior to joining IDEX, Ms. Cade was Senior Vice President, General Counsel, Corporate Secretary and Chief Compliance Officer for SunCoke Energy, Inc. from March 2011 to October 2015 and held various roles at PPG Industries before joining SunCoke.
Mr. Salliotte has served as Senior Vice President-Corporate Development since March 2018. Prior to that, Mr. Salliotte served as Senior Vice President-Corporate Strategy, Mergers & Acquisitions and Treasury since February 2011. Mr. Salliotte joined IDEX in October 2004 as Vice President-Strategy and Business Development.
Mr. Yates has served as Vice President and Chief Accounting Officer since February 2010, and served as interim Chief Financial Officer from September 2016 to December 2016. Mr. Yates joined IDEX as Vice President-Controller in October 2005.
9
Mr. Bucklew has served as the Senior Vice President-Chief Human Resources Officer since joining IDEX in March 2012. Prior to joining IDEX, Mr. Bucklew served as the Vice President of Human Resources for Accretive Health from March 2009 to March 2012.
Mr. MacLennan has served as the Senior Vice President-Chief Information Officer since joining IDEX in March 2012. Prior to joining IDEX, Mr. MacLennan had a dual role as CIO for Pactiv LLC and Vice President of IT for Reynolds Services Inc.
The Company’s executive officers are elected at a meeting of the Board of Directors immediately following the annual meeting of stockholders, and they serve until the meeting of the Board immediately following the next annual meeting of stockholders, or until their successors are duly elected and qualified or until their death, resignation or removal.
Public Filings
Copies of the Company’s annual report on Form 10-K, quarterly reports on Form 10-Q, current reports on Form 8-K and amendments to those reports are made available free of charge at www.idexcorp.com as soon as reasonably practicable after being filed electronically with the United States Securities and Exchange Commission (the “SEC”). Our reports are also available free of charge on the SEC’s website, www.sec.gov. Information on the Company’s website is not incorporated into this Form 10-K.
10
Item 1A.
Risk Factors.
For an enterprise as diverse and complex as the Company, a wide range of factors present risks to the Company and could materially affect future developments and performance. In addition to the factors affecting specific business operations identified in connection with the description of our operations and the financial results of our operations elsewhere in this report, the most significant of these factors are as follows:
Changes in U.S. or International Economic Conditions Could Adversely Affect the Sales and Profitability of Our Businesses.
In
2018
,
49%
of the Company’s sales were derived from domestic operations while
51%
were derived from international operations. The Company’s largest end markets include industrial, life sciences and medical technologies, fire and rescue, oil and gas, paint and coatings, chemical processing, agriculture, water and wastewater treatment and optical filters and components. A slowdown in the U.S. or global economy and, in particular, any of these specific end markets could reduce the Company’s sales and profitability.
Change to Political and Economic Conditions in the U.S. and Foreign Countries in Which We Operate Could Adversely Affect Our Business.
In
2018
, approximately
51%
of our total sales were to customers outside the U.S. We expect our international operations and export sales to continue to be significant for the foreseeable future. Our sales from international operations and our sales from export are both subject in varying degrees to risks inherent in doing business outside the U.S. These risks include the following:
|
•
|
possibility of unfavorable circumstances arising from host country laws or regulations;
|
|
•
|
risks of economic instability;
|
|
•
|
currency exchange rate fluctuations and restrictions on currency repatriation;
|
|
•
|
potential negative consequences from changes to taxation policies;
|
|
•
|
disruption of operations from labor and political disturbances;
|
|
•
|
withdrawal from or renegotiation of international trade agreements and other restrictions on the trade between the United States and other countries;
|
|
•
|
effects of the United Kingdom’s decision to exit the European Union and related potential disruption to trade;
|
|
•
|
changes in tariff and trade barriers, including recently imposed tariffs with respect to certain products imported from China or exported to China, and import or export licensing requirements; and
|
|
•
|
political instability, terrorism, insurrection or war.
|
Any of these events could have an adverse impact on our business and operations.
Our Inability to Continue to Develop New Products Could Limit Our Sales Growth.
Our ability to continue to grow organically is tied in large part to our ability to continue to develop new products. A failure to continue to develop and deliver new, innovative and competitive products to the market could limit our sales growth and negatively impact our business, financial condition, results of operations and cash flow.
Our Growth Strategy Includes Acquisitions and We May Not be Able to Make Acquisitions of Suitable Candidates or Integrate Acquisitions Successfully.
Our historical growth has included, and our future growth is likely to continue to include, acquisitions. We intend to continue to seek acquisition opportunities both to expand into new markets and to enhance our position in existing markets throughout the world. We may not be able to successfully identify suitable candidates, negotiate appropriate acquisition terms, obtain financing needed to consummate those acquisitions, complete proposed acquisitions or successfully integrate acquired businesses into our existing operations. In addition, any acquisition, once successfully integrated, may not perform as planned, be accretive to earnings, or otherwise prove beneficial to us.
Acquisitions involve numerous risks, including the assumption of undisclosed or unindemnified liabilities, difficulties in the assimilation of the operations, technologies, services and products of the acquired companies and the diversion of management’s attention from other business concerns. In addition, prior acquisitions have resulted in, and future acquisitions could result in, the incurrence of substantial additional indebtedness and other expenses.
11
The Markets We Serve are Highly Competitive and this Competition Could Reduce our Sales and Operating Margins.
Most of our products are sold in competitive markets. Maintaining and improving our competitive position will require continued investment by us in manufacturing, engineering, quality standards, marketing, customer service and support and our distribution networks. We may not be successful in maintaining our competitive position. Our competitors may develop products that are superior to our products or may develop methods of more efficiently and effectively providing products and services or may adapt more quickly than us to new technologies or evolving customer requirements. Pricing pressures may require us to adjust the prices of our products to stay competitive. We may not be able to compete successfully with our existing competitors or with new competitors. Failure to continue competing successfully could reduce our sales, operating margins and overall financial performance.
We are Dependent on the Availability of Raw Materials, Parts and Components Used in Our Products.
While we manufacture certain parts and components used in our products, we require substantial amounts of raw materials and purchase some parts and components from suppliers. The availability and prices for raw materials, parts and components may be subject to curtailment or change due to, among other things, suppliers’ allocations to other purchasers, interruptions in production by suppliers, changes in exchange rates and prevailing price levels. Any change in the supply of, or price for, these raw materials or parts and components could materially affect our business, financial condition, results of operations and cash flow.
Significant Movements in Foreign Currency Exchange Rates May Harm Our Financial Results.
We are exposed to fluctuations in foreign currency exchange rates, particularly with respect to the Euro, Swiss Franc, Canadian Dollar, British Pound, Indian Rupee and Chinese Renminbi. Any significant change in the value of the currencies of the countries in which we do business against the U.S. Dollar could affect our ability to sell products competitively and control our cost structure, which could have a material adverse effect on our results of operations. For additional detail related to this risk, see Part II, Item 7A, “Quantitative and Qualitative Disclosure About Market Risk.”
Fluctuations in Interest Rates Could Adversely Affect Our Results of Operations and Financial Position.
Our profitability may be adversely affected during any periods of unexpected or rapid increases in interest rates. We maintain a revolving credit facility, which bears interest at either an alternate base rate or an adjusted LIBOR rate plus, in each case, an applicable margin based on the Company's senior, unsecured, long-term debt rating. A significant increase in LIBOR would significantly increase our cost of borrowings. We are also exposed to risks if the U.S. Federal Reserve raises its benchmark interest rate, which may reduce the availability and increase the cost of obtaining new debt and refinancing existing indebtedness. For additional detail related to this risk, see Part II, Item 7A, "Quantitative and Qualitative Disclosure About Market Risk."
An Unfavorable Outcome of Any of Our Pending Contingencies or Litigation Could Adversely Affect Us.
We are currently involved in pending and threatened legal, regulatory and other proceedings arising in the ordinary course of business. These proceedings may pertain to matters such as product liability or contract disputes, and may also involve governmental inquiries, inspections, audits or investigations relating to issues such as tax matters, intellectual property, environmental, health and safety issues, governmental regulations, employment and other matters. Where it is reasonably possible to do so, we accrue estimates of the probable costs for the resolution of these matters. These estimates are developed in consultation with outside counsel and are based upon an analysis of potential results and the availability of insurance coverage, assuming a combination of litigation and settlement strategies. It is possible, however, that future operating results for any particular quarter or annual period could be materially affected by changes in our assumptions, the continued availability of insurance coverage or the effectiveness of our strategies related to these proceedings. For additional detail related to this risk, see Item 3, “Legal Proceedings” and Note 9 in Part II, Item 8, “Financial Statements and Supplementary Data.”
Our Intangible Assets, Including Goodwill, are a Significant Portion of Our Total Assets and a Write-off of Our Intangible Assets or Goodwill Would Adversely Impact Our Operating Results and Significantly Reduce Our Net Worth.
Our total assets reflect substantial intangible assets, primarily goodwill and identifiable intangible assets. At
December 31, 2018
, goodwill and intangible assets totaled
$1,698.0 million
and
$383.3 million
, respectively. These assets primarily result from our acquisitions, representing the excess of the purchase price over the fair value of the tangible net assets we have acquired. Annually, or when certain events occur that require a more current valuation, we assess whether there has been an impairment in the value of our goodwill and identifiable intangible assets. If future operating performance at one or more of our reporting units were to fall significantly below forecasted levels, we could be required to reflect, under current applicable accounting rules, a non-cash charge to operating income for an impairment. Any determination requiring the write-off of a significant portion of our
12
goodwill or identifiable intangible assets would adversely impact our results of operations and net worth. See Note 5 in Part II, Item 8, “Financial Statements and Supplementary Data” for further discussion on goodwill and intangible assets.
A Significant or Sustained Decline in Commodity Prices, Including Oil, Could Negatively Impact the Levels of Expenditures by Certain of Our Customers.
Demand for our products depends, in part, on the level of new and planned expenditures by certain of our customers. The level of expenditures by our customers is dependent on, among other factors, general economic conditions, availability of credit, economic conditions within their respective industries and expectations of future market behavior. Volatility in commodity prices, including oil, can negatively affect the level of these activities and can result in postponement of capital spending decisions or the delay or cancellation of existing orders. The ability of our customers to finance capital investment and maintenance may also be affected by the conditions in their industries. Reduced demand for our products could result in the delay or cancellation of existing orders or lead to excess manufacturing capacity, which unfavorably impacts our absorption of fixed manufacturing costs. This reduced demand could have a material adverse effect on our business, financial condition and results of operations.
Our Success Depends on Our Executive Management and Other Key Personnel.
Our future success depends to a significant degree on the skills, experience and efforts of our executive management and other key personnel and their ability to provide the Company with uninterrupted leadership and direction. The loss of the services of any of our executive officers or a failure to provide adequate succession plans for key personnel could have an adverse impact. The availability of highly qualified talent is limited and the competition for talent is robust. However, we provide long-term equity incentives and certain other benefits for our executive officers which provide incentives for them to make a long-term commitment to our Company. Our future success will also depend on our ability to have adequate succession plans in place and to attract, retain and develop qualified personnel. A failure to efficiently replace executive management members and other key personnel and to attract, retain and develop new qualified personnel could have an adverse effect on our operations and implementation of our strategic plan.
Challenges with Respect to Labor Availability Could Negatively Impact our Ability to Operate or Grow our Business.
Our success depends in part on the ability of our businesses to proactively attract, motivate and retain a qualified and highly skilled workforce in an intensely competitive labor market. A failure to attract, motivate and retain highly skilled personnel could adversely affect our operating results or our ability to operate or grow our business.
Our Business Operations May Be Adversely Affected by Information Systems Interruptions or Intrusion.
We depend on various information technologies throughout our Company to administer, store and support multiple business activities. If these systems (or the systems of our customers or third-party hosting services) are damaged, cease to function properly or are subject to cyber-security attacks, such as those involving unauthorized access, malicious software and/or other intrusions, we could experience production downtimes, operational delays, other detrimental impacts on our operations or ability to provide products and services to our customers, the compromising of confidential or otherwise protected information, destruction or corruption of data, security breaches, other manipulation or improper use of our systems or networks, financial losses from remedial actions, loss of business or potential liability, penalties, fines and/or damage to our reputation. While we attempt to mitigate these risks by employing a number of measures, including employee training, technical security controls and maintenance of backup and protective systems, our systems, networks, products and services remain potentially vulnerable to known or unknown threats, any of which could have a material adverse effect on our business, financial condition or results of operations. Further, given the unpredictability, nature and scope of cyber-security attacks, it is possible that potential vulnerabilities could go undetected for an extended period.
Failure To Comply with the U.S. Foreign Corrupt Practices Act, the U.K. Bribery Act or Other Applicable Anti-bribery Laws Could Have an Adverse Effect on Our Business.
The U.S. Foreign Corrupt Practices Act, the U.K. Bribery Act and similar anti-bribery laws in other jurisdictions generally prohibit companies and their intermediaries from making improper payments for the purpose of obtaining or retaining business. Recent years have seen a substantial increase in anti-bribery law enforcement activity with more frequent and aggressive investigations and enforcement proceedings by both the Department of Justice and the SEC, increased enforcement activity by non-U.S. regulators and increases in criminal and civil proceedings brought against companies and individuals. Our policies mandate compliance with all anti-bribery laws. However, we operate in certain countries that are recognized as having governmental and commercial corruption. Our internal control policies and procedures may not always protect us from reckless or criminal acts
13
committed by our employees or third-party intermediaries. Violations of these anti-bribery laws may result in criminal or civil sanctions, which could have a material adverse effect on our business, financial condition and results of operations.
Changes in Applicable Tax Regulations and Resolutions of Tax Disputes Could Negatively Affect Our Financial Results.
The Company is subject to taxation in the U.S. and numerous foreign jurisdictions. On December 22, 2017, the U.S. government enacted comprehensive tax legislation commonly referred to as the Tax Cuts and Jobs Act (the “Tax Act”). The changes included in the Tax Act were broad and complex. The Company finalized the impact of the reduction in the corporate rate and the deemed repatriation transition tax based upon the Company’s interpretations of the Tax Act. However, additional guidance issued by the Internal Revenue Service, the U.S. Department of Treasury or any other applicable taxing authority or actions taken by the Company may result in a different impact.
In addition, foreign jurisdictions may enact tax legislation that could significantly affect our ongoing operations. Aspects of U.S. tax reform could also lead foreign jurisdictions to respond by enacting additional tax legislation that is unfavorable to us.
Item 1B.
Unresolved Staff Comments.
None.
Item 2.
Properties
.
The Company’s principal plants and offices have an aggregate floor space area of approximately 4.6 million square feet, of which 3.0 million square feet (65%) is located in the U.S. and approximately 1.6 million square feet (35%) is located outside the U.S., primarily in Germany (9%), U.K. (7%), Italy (6%), India (3%), China (2%), Canada (2%), Switzerland (2%) and The Netherlands (2%). Management considers these facilities suitable and adequate for the Company’s operations. Management believes the Company can meet demand increases over the near term with its existing facilities, especially given its operational improvement initiatives that usually increase capacity. The Company’s executive office occupies 36,588 square feet of leased space in Lake Forest, Illinois and 16,268 square feet of leased space in Chicago, Illinois.
Approximately 3.1 million square feet (68%) of the principal plant and office floor area is owned by the Company and the balance is held under lease. Approximately 1.7 million square feet (38%) of the principal plant and office floor area is held by business units in the Fluid & Metering Technologies segment; 1.4 million square feet (29%) is held by business units in the Health & Science Technologies segment; and 1.3 million square feet (28%) is held by business units in the Fire & Safety/Diversified Products segment. The remaining 0.2 million square feet (5%) include the executive office as well as shared services locations.
Item 3.
Legal Proceedings.
The Company and its subsidiaries are party to legal proceedings as described in Note 9 in Part II, Item 8, “Commitments and Contingencies,” and such disclosure is incorporated by reference into this Item 3, “Legal Proceedings.” In addition, the Company and six of its subsidiaries are presently named as defendants in a number of lawsuits claiming various asbestos-related personal injuries, allegedly as a result of exposure to products manufactured with components that contained asbestos. These components were acquired from third party suppliers and were not manufactured by the Company or any of the defendant subsidiaries. To date, the majority of the Company’s settlements and legal costs, except for costs of coordination, administration, insurance investigation and a portion of defense costs, have been covered in full by insurance, subject to applicable deductibles. However, the Company cannot predict whether and to what extent insurance will be available to continue to cover these settlements and legal costs, or how insurers may respond to claims that are tendered to them. Claims have been filed in jurisdictions throughout the United States and the United Kingdom. Most of the claims resolved to date have been dismissed without payment. The balance of the claims have been settled for various insignificant amounts. Only one case has been tried, resulting in a verdict for the Company’s business unit. No provision has been made in the financial statements of the Company, other than for insurance deductibles in the ordinary course, and the Company does not currently believe the asbestos-related claims will have a material adverse effect on the Company’s business, financial position, results of operations or cash flows.
Item 4.
Mine Safety Disclosures.
Not applicable.
14
PART II
Item 5.
Market for Registrant’s Common Equity, Related Stockholder Matters and Issuer Purchases of Equity Securities.
The Company’s common stock trades on the New York Stock Exchange under the symbol “IEX”. As of
February 15, 2019
, there were approximately
5,151
stockholders of record of our common stock and there were
75,792,814
shares outstanding.
Our payment of dividends in the future will be determined by our Board of Directors and will depend on business conditions, our earnings and other factors.
For information pertaining to securities authorized for issuance under equity compensation plans and the related weighted average exercise price, see Part III, Item 12, “Security Ownership of Certain Beneficial Owners and Management and Related Stockholder Matters.”
The Company’s purchases of common stock during the quarter ended
December 31, 2018
are as follows:
|
Period
|
Total Number of
Shares Purchased
|
Average Price
Paid per Share
|
Total Number of
Shares Purchased as
Part of Publicly
Announced Plans
or Programs
(1)
|
Maximum Dollar
Value that May Yet
be Purchased Under
the Plans
or Programs
(1)
|
|||||||||
|
October 1, 2018 to October 31, 2018
|
172,705
|
|
$
|
132.14
|
|
172,705
|
|
$
|
476,454,817
|
|
|||
|
November 1, 2018 to November 30, 2018
|
420,000
|
|
134.26
|
|
420,000
|
|
420,066,720
|
|
|||||
|
December 1, 2018 to December 31, 2018
|
324,666
|
|
132.62
|
|
324,666
|
|
377,010,479
|
|
|||||
|
Total
|
917,371
|
|
$
|
133.28
|
|
917,371
|
|
$
|
377,010,479
|
|
|||
|
(1)
|
On
December 1, 2015
, the Company’s Board of Directors approved an increase of
$300.0 million
in the authorized level
of repurchases of common stock. This followed the prior Board of Directors approved repurchase authorization of $400.0 million that was announced by the Company on November 6, 2014. These authorizations have no expiration date.
|
15
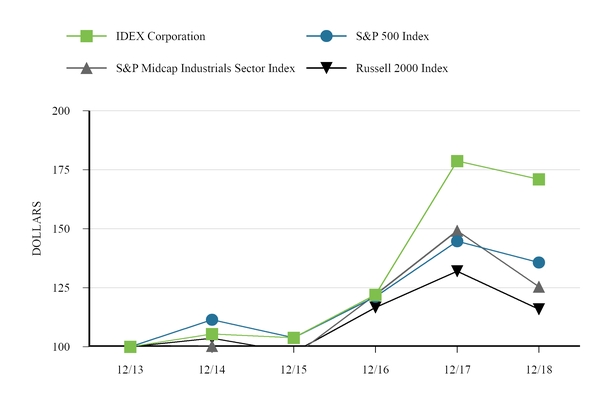
Performance Graph.
The following table compares total stockholder returns over the last five years to the Standard & Poor’s (the “S&P”) 500 Index, the S&P Midcap Industrials Sector Index and the Russell 2000 Index assuming the value of the investment in our common stock and each index was $100 on
December 31, 2013
. Total return values for our common stock, the S&P 500 Index, S&P Midcap Industrials Sector Index and the Russell 2000 Index were calculated on cumulative total return values assuming reinvestment of dividends. The stockholder return shown on the graph below is not necessarily indicative of future performance.
|
12/13
|
12/14
|
12/15
|
12/16
|
12/17
|
12/18
|
|||||||||||||
|
IDEX Corporation
|
$
|
100.00
|
|
$
|
105.40
|
|
$
|
103.74
|
|
$
|
121.95
|
|
$
|
178.70
|
|
$
|
170.97
|
|
|
S&P 500 Index
|
$
|
100.00
|
|
$
|
111.39
|
|
$
|
110.58
|
|
$
|
121.13
|
|
$
|
144.65
|
|
$
|
135.63
|
|
|
S&P Midcap 400 Industrials Sector Index
|
$
|
100.00
|
|
$
|
100.30
|
|
$
|
96.01
|
|
$
|
122.00
|
|
$
|
149.08
|
|
$
|
125.40
|
|
|
Russell 2000 Index
|
$
|
100.00
|
|
$
|
103.53
|
|
$
|
97.62
|
|
$
|
116.63
|
|
$
|
131.96
|
|
$
|
115.89
|
|
16
Item 6.
Selected Financial Data.
(1)
|
(Dollars in thousands, except per share data)
|
2018
|
2017
|
2016
|
2015
|
2014
|
||||||||||||||
|
RESULTS OF OPERATIONS
|
|||||||||||||||||||
|
Net sales
|
$
|
2,483,666
|
|
$
|
2,287,312
|
|
$
|
2,113,043
|
|
$
|
2,020,668
|
|
$
|
2,147,767
|
|
||||
|
Gross profit
|
1,117,895
|
|
1,026,678
|
|
930,767
|
|
904,315
|
|
949,315
|
|
|||||||||
|
Selling, general and administrative expenses
|
536,724
|
|
524,940
|
|
492,398
|
|
474,156
|
|
500,719
|
|
|||||||||
|
Loss (gain) on sale of businesses - net
|
—
|
|
(9,273
|
)
|
22,298
|
|
(18,070
|
)
|
—
|
|
|||||||||
|
Restructuring expenses
|
12,083
|
|
8,455
|
|
3,674
|
|
11,239
|
|
13,672
|
|
|||||||||
|
Operating income
|
569,088
|
|
502,556
|
|
412,397
|
|
436,990
|
|
434,924
|
|
|||||||||
|
Other (income) expense - net
|
(3,985
|
)
|
2,394
|
|
(1,731
|
)
|
3,009
|
|
589
|
|
|||||||||
|
Interest expense
|
44,134
|
|
44,889
|
|
45,616
|
|
41,636
|
|
41,895
|
|
|||||||||
|
Provision for income taxes
|
118,366
|
|
118,016
|
|
97,403
|
|
109,538
|
|
113,054
|
|
|||||||||
|
Net income
|
410,573
|
|
337,257
|
|
271,109
|
|
282,807
|
|
279,386
|
|
|||||||||
|
Earnings per share:
(2)
|
|||||||||||||||||||
|
— basic
|
$
|
5.36
|
|
$
|
4.41
|
|
$
|
3.57
|
|
$
|
3.65
|
|
$
|
3.48
|
|
||||
|
— diluted
|
$
|
5.29
|
|
$
|
4.36
|
|
$
|
3.53
|
|
$
|
3.62
|
|
$
|
3.45
|
|
||||
|
Weighted average shares outstanding:
|
|||||||||||||||||||
|
— basic
|
76,412
|
|
76,232
|
|
75,803
|
|
77,126
|
|
79,715
|
|
|||||||||
|
— diluted
|
77,563
|
|
77,333
|
|
76,758
|
|
77,972
|
|
80,728
|
|
|||||||||
|
Year-end shares outstanding
|
75,953
|
|
76,694
|
|
76,441
|
|
76,535
|
|
78,766
|
|
|||||||||
|
Cash dividends per share
|
$
|
1.72
|
|
$
|
1.48
|
|
$
|
1.36
|
|
$
|
1.28
|
|
$
|
1.12
|
|
||||
|
FINANCIAL POSITION
|
|||||||||||||||||||
|
Current assets
|
$
|
1,092,532
|
|
$
|
1,004,043
|
|
$
|
822,721
|
|
$
|
862,684
|
|
$
|
1,075,791
|
|
||||
|
Current liabilities
|
364,661
|
|
360,975
|
|
309,158
|
|
309,597
|
|
411,968
|
|
|||||||||
|
Current ratio
|
3.0
|
|
2.8
|
|
2.7
|
|
2.8
|
|
2.6
|
|
|||||||||
|
Operating working capital
(3)
|
451,552
|
|
406,823
|
|
396,739
|
|
370,213
|
|
366,209
|
|
|||||||||
|
Total assets
|
$
|
3,473,857
|
|
$
|
3,399,628
|
|
$
|
3,154,944
|
|
$
|
2,805,443
|
|
$
|
2,903,463
|
|
||||
|
Total borrowings
|
848,818
|
|
859,046
|
|
1,015,281
|
|
840,794
|
|
859,345
|
|
|||||||||
|
Shareholders’ equity
|
1,994,640
|
|
1,886,542
|
|
1,543,894
|
|
1,443,291
|
|
1,486,451
|
|
|||||||||
|
PERFORMANCE MEASURES AND OTHER DATA
|
|||||||||||||||||||
|
Percent of net sales:
|
|||||||||||||||||||
|
Gross profit
|
45.0
|
%
|
44.9
|
%
|
44.0
|
%
|
44.8
|
%
|
44.2
|
%
|
|||||||||
|
Selling, general and administrative expenses
|
21.6
|
%
|
23.0
|
%
|
23.3
|
%
|
23.5
|
%
|
23.3
|
%
|
|||||||||
|
Operating income
|
22.9
|
%
|
22.0
|
%
|
19.5
|
%
|
21.6
|
%
|
20.3
|
%
|
|||||||||
|
Income before income taxes
|
21.3
|
%
|
19.9
|
%
|
17.4
|
%
|
19.4
|
%
|
18.3
|
%
|
|||||||||
|
Net income
|
16.5
|
%
|
14.7
|
%
|
12.8
|
%
|
14.0
|
%
|
13.0
|
%
|
|||||||||
|
Capital expenditures
|
$
|
56,089
|
|
$
|
43,858
|
|
$
|
38,242
|
|
$
|
43,776
|
|
$
|
47,997
|
|
||||
|
Depreciation and amortization
|
77,544
|
|
84,216
|
|
86,892
|
|
78,120
|
|
76,907
|
|
|||||||||
|
Return on average assets
(4)
|
11.9
|
%
|
10.3
|
%
|
9.1
|
%
|
9.9
|
%
|
9.7
|
%
|
|||||||||
|
Borrowings as a percent of capitalization
(4)
|
29.9
|
%
|
31.3
|
%
|
39.7
|
%
|
36.8
|
%
|
36.6
|
%
|
|||||||||
|
Return on average shareholders’ equity
(4)
|
21.2
|
%
|
19.7
|
%
|
18.2
|
%
|
19.3
|
%
|
18.3
|
%
|
|||||||||
|
Employees at year end
|
7,352
|
|
7,167
|
|
7,158
|
|
6,801
|
|
6,712
|
|
|||||||||
|
NON-GAAP MEASURES
(5)
|
|||||||||||||||||||
|
EBITDA
|
$
|
650,617
|
|
$
|
584,378
|
|
$
|
501,020
|
|
$
|
512,101
|
|
$
|
511,242
|
|
||||
|
EBITDA margin
|
26.2
|
%
|
25.5
|
%
|
23.7
|
%
|
25.3
|
%
|
23.8
|
%
|
|||||||||
|
Adjusted EBITDA
|
$
|
662,700
|
|
$
|
583,560
|
|
$
|
530,546
|
|
$
|
505,270
|
|
$
|
524,914
|
|
||||
|
Adjusted EBITDA margin
|
26.7
|
%
|
25.5
|
%
|
25.1
|
%
|
25.0
|
%
|
24.4
|
%
|
|||||||||
|
Adjusted operating income
|
$
|
581,171
|
|
$
|
501,738
|
|
$
|
438,369
|
|
$
|
430,159
|
|
$
|
448,596
|
|
||||
|
Adjusted operating margin
|
23.4
|
%
|
21.9
|
%
|
20.7
|
%
|
21.3
|
%
|
20.9
|
%
|
|||||||||
|
Adjusted net income
|
$
|
419,624
|
|
$
|
333,667
|
|
$
|
288,373
|
|
$
|
277,229
|
|
$
|
288,823
|
|
||||
|
Adjusted earnings per share
|
$
|
5.41
|
|
$
|
4.31
|
|
$
|
3.75
|
|
$
|
3.55
|
|
$
|
3.57
|
|
||||
|
(1)
|
For additional detail, see Notes to Consolidated Financial Statements in Part II, Item 8, “Financial Statements and Supplementary Data.”
|
|
(2)
|
Calculated by applying the two-class method of allocating earnings to common stock and participating securities as required by Accounting Standards Codification (“ASC”) 260,
Earnings Per Share
.
|
|
(3)
|
Operating working capital is defined as inventory plus accounts receivable minus accounts payable.
|
|
(4)
|
Return on average assets is calculated as: Net income / (Current year Total assets + Prior year Total assets) / 2; Borrowings as a percent of capitalization is calculated as: (Long-term borrowings + Short-term borrowings) / (Long-term borrowings + Short-term borrowings + Total shareholders’ equity); Return on average shareholders’ equity is calculated as Net Income / (Current year Total shareholders’ equity + Prior year Total shareholders’ equity) / 2.
|
|
(5)
|
Set forth below are reconciliations of Adjusted operating income, Adjusted net income, Adjusted EPS, EBITDA and Adjusted EBITDA to the comparable measures of net income and operating income, as determined in accordance with generally accepted accounting principles in the U.S. (“U.S. GAAP”). We have reconciled Adjusted operating income to Operating income; Adjusted net income to Net income; Adjusted EPS to EPS; consolidated EBITDA, segment EBITDA, adjusted EBITDA and adjusted segment EBITDA to net income. The reconciliation of segment EBITDA to net income was performed on a consolidated basis due to the fact that we do not allocate consolidated interest expense or the consolidated provision for income taxes to our segments.
|
Management uses Adjusted operating income, Adjusted net income and Adjusted EPS as metrics by which to measure performance of the Company since they exclude items that are not reflective of ongoing operations, such as gains/losses on the sale of businesses, restructuring expenses and pension settlements. Management also supplements its U.S. GAAP financial statements with adjusted information to provide investors with greater insight, transparency and a more comprehensive understanding of the information used by management in its financial and operational decision making.
EBITDA means earnings before interest, income taxes, depreciation and amortization. Given the acquisitive nature of the Company which results in a higher level of amortization expense from recently acquired businesses, management uses EBITDA as an internal operating metric to provide another representation of the businesses’ performance across our three segments and for enterprise valuation purposes. EBITDA is also used to calculate certain financial covenants, as discussed in Note 6 of the Notes to Consolidated Financial Statements in Part II, Item 8, “Financial Statements and Supplementary Data.” In addition, EBITDA has been adjusted for items that are not reflective of ongoing operations, such as gains/losses on the sale of businesses, restructuring expenses and pension settlements to arrive at Adjusted EBITDA. Management believes that Adjusted EBITDA is useful as a performance indicator of ongoing operations. We believe that Adjusted EBITDA is also useful to some investors as an indicator of the strength and performance of the Company and its segments’ ongoing business operations and a way to evaluate and compare operating performance and value companies within our industry. The definition of Adjusted EBITDA used here may differ from that used by other companies.
Also set forth below is a reconciliation of the change in organic net sales to the comparable measure of net sales as determined in accordance with U.S. GAAP, which represents the year-over-year consistency in net sales after excluding the impact from acquisitions/divestitures and foreign currency translation.
The non-GAAP financial measures disclosed by the Company should not be considered a substitute for, or superior to, financial measures prepared in accordance with U.S. GAAP. The financial results prepared in accordance with U.S. GAAP and the reconciliations from these results should be carefully evaluated.
|
1. Reconciliations of Consolidated EBITDA
|
|||||||||||||||||||
|
For the Years Ended December 31,
|
|||||||||||||||||||
|
2018
|
2017
|
2016
|
2015
|
2014
|
|||||||||||||||
|
(In thousands)
|
|||||||||||||||||||
|
Net income
|
$
|
410,573
|
|
$
|
337,257
|
|
$
|
271,109
|
|
$
|
282,807
|
|
$
|
279,386
|
|
||||
|
+ Provision for income taxes
|
118,366
|
|
118,016
|
|
97,403
|
|
109,538
|
|
113,054
|
|
|||||||||
|
+ Interest expense
|
44,134
|
|
44,889
|
|
45,616
|
|
41,636
|
|
41,895
|
|
|||||||||
|
+ Depreciation and amortization
|
77,544
|
|
84,216
|
|
86,892
|
|
78,120
|
|
76,907
|
|
|||||||||
|
EBITDA
|
650,617
|
|
584,378
|
|
501,020
|
|
512,101
|
|
511,242
|
|
|||||||||
|
+ Restructuring expenses
|
12,083
|
|
8,455
|
|
3,674
|
|
11,239
|
|
13,672
|
|
|||||||||
|
+ Loss (gain) on sale of businesses - net
|
—
|
|
(9,273
|
)
|
22,298
|
|
(18,070
|
)
|
—
|
|
|||||||||
|
+ Pension settlement
|
—
|
|
—
|
|
3,554
|
|
—
|
|
—
|
|
|||||||||
|
Adjusted EBITDA
|
$
|
662,700
|
|
$
|
583,560
|
|
$
|
530,546
|
|
$
|
505,270
|
|
$
|
524,914
|
|
||||
|
Net sales
|
$
|
2,483,666
|
|
$
|
2,287,312
|
|
$
|
2,113,043
|
|
$
|
2,020,668
|
|
$
|
2,147,767
|
|
||||
|
EBITDA margin
|
26.2
|
%
|
25.5
|
%
|
23.7
|
%
|
25.3
|
%
|
23.8
|
%
|
|||||||||
|
Adjusted EBITDA margin
|
26.7
|
%
|
25.5
|
%
|
25.1
|
%
|
25.0
|
%
|
24.4
|
%
|
|||||||||
|
2. Reconciliations of Segment EBITDA
|
|||||||||||||||||||||||||||||||||||
|
For the Years Ended December 31,
|
|||||||||||||||||||||||||||||||||||
|
2018
|
2017
|
2016
|
|||||||||||||||||||||||||||||||||
|
FMT
|
HST
|
FSDP
|
FMT
|
HST
|
FSDP
|
FMT
|
HST
|
FSDP
|
|||||||||||||||||||||||||||
|
(In thousands)
|
|||||||||||||||||||||||||||||||||||
|
EBITDA
|
$
|
296,079
|
|
$
|
246,810
|
|
$
|
186,538
|
|
$
|
263,610
|
|
$
|
225,649
|
|
$
|
159,610
|
|
$
|
242,892
|
|
$
|
200,980
|
|
$
|
135,400
|
|
||||||||
|
+ Restructuring expenses
|
2,458
|
|
5,904
|
|
2,184
|
|
3,374
|
|
4,696
|
|
255
|
|
932
|
|
1,117
|
|
1,425
|
|
|||||||||||||||||
|
+ Pension settlement
|
—
|
|
—
|
|
—
|
|
—
|
|
—
|
|
—
|
|
2,032
|
|
—
|
|
540
|
|
|||||||||||||||||
|
Adjusted EBITDA
|
$
|
298,537
|
|
$
|
252,714
|
|
$
|
188,722
|
|
$
|
266,984
|
|
$
|
230,345
|
|
$
|
159,865
|
|
$
|
245,856
|
|
$
|
202,097
|
|
$
|
137,365
|
|
||||||||
|
Net sales
|
$
|
951,552
|
|
$
|
896,419
|
|
$
|
637,028
|
|
$
|
880,957
|
|
$
|
820,131
|
|
$
|
587,533
|
|
$
|
849,101
|
|
$
|
744,809
|
|
$
|
520,009
|
|
||||||||
|
EBITDA margin
|
31.1
|
%
|
27.5
|
%
|
29.3
|
%
|
29.9
|
%
|
27.5
|
%
|
27.2
|
%
|
28.6
|
%
|
27.0
|
%
|
26.0
|
%
|
|||||||||||||||||
|
Adjusted EBITDA margin
|
31.4
|
%
|
28.2
|
%
|
29.6
|
%
|
30.3
|
%
|
28.1
|
%
|
27.2
|
%
|
29.0
|
%
|
27.1
|
%
|
26.4
|
%
|
|||||||||||||||||
|
3. Reconciliations of Consolidated Reported-to-Adjusted Operating Income and Margin
|
|||||||||||||||||||
|
For the Years Ended December 31,
|
|||||||||||||||||||
|
2018
|
2017
|
2016
|
2015
|
2014
|
|||||||||||||||
|
(In thousands)
|
|||||||||||||||||||
|
Operating income
|
$
|
569,088
|
|
$
|
502,556
|
|
$
|
412,397
|
|
$
|
436,990
|
|
$
|
434,924
|
|
||||
|
+ Restructuring expenses
|
12,083
|
|
8,455
|
|
3,674
|
|
11,239
|
|
13,672
|
|
|||||||||
|
+ Loss (gain) on sale of businesses - net
|
—
|
|
(9,273
|
)
|
22,298
|
|
(18,070
|
)
|
—
|
|
|||||||||
|
Adjusted operating income
|
$
|
581,171
|
|
$
|
501,738
|
|
$
|
438,369
|
|
$
|
430,159
|
|
$
|
448,596
|
|
||||
|
Net sales
|
$
|
2,483,666
|
|
$
|
2,287,312
|
|
$
|
2,113,043
|
|
$
|
2,020,668
|
|
$
|
2,147,767
|
|
||||
|
Operating margin
|
22.9
|
%
|
22.0
|
%
|
19.5
|
%
|
21.6
|
%
|
20.3
|
%
|
|||||||||
|
Adjusted operating margin
|
23.4
|
%
|
21.9
|
%
|
20.7
|
%
|
21.3
|
%
|
20.9
|
%
|
|||||||||
|
4. Reconciliations of Segment Reported-to-Adjusted Operating Income and Margin
|
|||||||||||||||||||||||||||||||||||
|
For the Years Ended December 31,
|
|||||||||||||||||||||||||||||||||||
|
2018
|
2017
|
2016
|
|||||||||||||||||||||||||||||||||
|
FMT
|
HST
|
FSDP
|
FMT
|
HST
|
FSDP
|
FMT
|
HST
|
FSDP
|
|||||||||||||||||||||||||||
|
(In thousands)
|
|||||||||||||||||||||||||||||||||||
|
Operating income
|
$
|
275,060
|
|
$
|
205,679
|
|
$
|
168,601
|
|
$
|
241,030
|
|
$
|
179,567
|
|
$
|
147,028
|
|
$
|
217,500
|
|
$
|
153,691
|
|
$
|
123,605
|
|
||||||||
|
+ Restructuring expenses
|
2,458
|
|
5,904
|
|
2,184
|
|
3,374
|
|
4,696
|
|
255
|
|
932
|
|
1,117
|
|
1,425
|
|
|||||||||||||||||
|
Adjusted operating income
|
$
|
277,518
|
|
$
|
211,583
|
|
$
|
170,785
|
|
$
|
244,404
|
|
$
|
184,263
|
|
$
|
147,283
|
|
$
|
218,432
|
|
$
|
154,808
|
|
$
|
125,030
|
|
||||||||
|
Net sales
|
$
|
951,552
|
|
$
|
896,419
|
|
$
|
637,028
|
|
$
|
880,957
|
|
$
|
820,131
|
|
$
|
587,533
|
|
$
|
849,101
|
|
$
|
744,809
|
|
$
|
520,009
|
|
||||||||
|
Operating margin
|
28.9
|
%
|
22.9
|
%
|
26.5
|
%
|
27.4
|
%
|
21.9
|
%
|
25.0
|
%
|
25.6
|
%
|
20.6
|
%
|
23.8
|
%
|
|||||||||||||||||
|
Adjusted operating margin
|
29.2
|
%
|
23.6
|
%
|
26.8
|
%
|
27.7
|
%
|
22.5
|
%
|
25.1
|
%
|
25.7
|
%
|
20.8
|
%
|
24.0
|
%
|
|||||||||||||||||
|
5. Reconciliations of Reported-to-Adjusted Net Income and EPS
|
|||||||||||||||||||
|
For the Years Ended December 31,
|
|||||||||||||||||||
|
2018
|
2017
|
2016
|
2015
|
2014
|
|||||||||||||||
|
(In thousands)
|
|||||||||||||||||||
|
Net income
|
$
|
410,573
|
|
$
|
337,257
|
|
$
|
271,109
|
|
$
|
282,807
|
|
$
|
279,386
|
|
||||
|
+ Restructuring expenses
|
12,083
|
|
8,455
|
|
3,674
|
|
11,239
|
|
13,672
|
|
|||||||||
|
+ Tax impact on restructuring expenses
|
(3,032
|
)
|
(2,772
|
)
|
(1,299
|
)
|
(3,586
|
)
|
(4,235
|
)
|
|||||||||
|
+ Loss (gain) on sale of businesses
|
—
|
|
(9,273
|
)
|
22,298
|
|
(18,070
|
)
|
—
|
|
|||||||||
|
+ Tax impact on loss (gain) on sale of businesses
|
—
|
|
—
|
|
(9,706
|
)
|
4,839
|
|
—
|
|
|||||||||
|
+ Pension settlement
|
—
|
|
—
|
|
3,554
|
|
—
|
|
—
|
|
|||||||||
|
+ Tax impact on pension settlement
|
—
|
|
—
|
|
(1,257
|
)
|
—
|
|
—
|
|
|||||||||
|
Adjusted net income
|
$
|
419,624
|
|
$
|
333,667
|
|
$
|
288,373
|
|
$
|
277,229
|
|
$
|
288,823
|
|
||||
|
EPS
|
$
|
5.29
|
|
$
|
4.36
|
|
$
|
3.53
|
|
$
|
3.62
|
|
$
|
3.45
|
|
||||
|
+ Restructuring expenses
|
0.16
|
|
0.11
|
|
0.05
|
|
0.14
|
|
0.17
|
|
|||||||||
|
+ Tax impact on restructuring expenses
|
(0.04
|
)
|
(0.04
|
)
|
(0.02
|
)
|
(0.04
|
)
|
(0.05
|
)
|
|||||||||
|
+ Loss (gain) on sale of businesses
|
—
|
|
(0.12
|
)
|
0.29
|
|
(0.23
|
)
|
—
|
|
|||||||||
|
+ Tax impact on loss (gain) on sale of businesses
|
—
|
|
—
|
|
(0.13
|
)
|
0.06
|
|
—
|
|
|||||||||
|
+ Pension settlement
|
—
|
|
—
|
|
0.05
|
|
—
|
|
—
|
|
|||||||||
|
+ Tax impact on pension settlement
|
—
|
|
—
|
|
(0.02
|
)
|
—
|
|
—
|
|
|||||||||
|
Adjusted EPS
|
$
|
5.41
|
|
$
|
4.31
|
|
$
|
3.75
|
|
$
|
3.55
|
|
$
|
3.57
|
|
||||
|
Diluted weighted average shares
|
77,563
|
|
77,333
|
|
76,758
|
|
77,972
|
|
80,728
|
|
|||||||||
|
6. Reconciliations of EBITDA to Net Income (dollars in thousands)
|
|||||||||||||||||||
|
For the Year Ended December 31, 2018
|
|||||||||||||||||||
|
FMT
|
HST
|
FSDP
|
Corporate
|
IDEX
|
|||||||||||||||
|
Operating income (loss)
|
$
|
275,060
|
|
$
|
205,679
|
|
$
|
168,601
|
|
$
|
(80,252
|
)
|
$
|
569,088
|
|
||||
|
- Other (income) expense - net
|
1,351
|
|
(1,192
|
)
|
(3,444
|
)
|
(700
|
)
|
(3,985
|
)
|
|||||||||
|
+ Depreciation and amortization
|
22,370
|
|
39,939
|
|
14,493
|
|
742
|
|
77,544
|
|
|||||||||
|
EBITDA
|
296,079
|
|
246,810
|
|
186,538
|
|
(78,810
|
)
|
650,617
|
|
|||||||||
|
- Interest expense
|
44,134
|
|
|||||||||||||||||
|
- Provision for income taxes
|
118,366
|
|
|||||||||||||||||
|
- Depreciation and amortization
|
77,544
|
|
|||||||||||||||||
|
Net income
|
$
|
410,573
|
|
||||||||||||||||
|
Net sales (eliminations)
|
$
|
951,552
|
|
$
|
896,419
|
|
$
|
637,028
|
|
$
|
(1,333
|
)
|
$
|
2,483,666
|
|
||||
|
Operating margin
|
28.9
|
%
|
22.9
|
%
|
26.5
|
%
|
n/m
|
|
22.9
|
%
|
|||||||||
|
EBITDA margin
|
31.1
|
%
|
27.5
|
%
|
29.3
|
%
|
n/m
|
|
26.2
|
%
|
|||||||||
|
For the Year Ended December 31, 2017
|
|||||||||||||||||||
|
FMT
|
HST
|
FSDP
|
Corporate
|
IDEX
|
|||||||||||||||
|
Operating income (loss)
|
$
|
241,030
|
|
$
|
179,567
|
|
$
|
147,028
|
|
$
|
(65,069
|
)
|
$
|
502,556
|
|
||||
|
- Other (income) expense - net
|
1,007
|
|
(795
|
)
|
1,959
|
|
223
|
|
2,394
|
|
|||||||||
|
+ Depreciation and amortization
|
23,587
|
|
45,287
|
|
14,541
|
|
801
|
|
84,216
|
|
|||||||||
|
EBITDA
|
263,610
|
|
225,649
|
|
159,610
|
|
(64,491
|
)
|
584,378
|
|
|||||||||
|
- Interest expense
|
44,889
|
|
|||||||||||||||||
|
- Provision for income taxes
|
118,016
|
|
|||||||||||||||||
|
- Depreciation and amortization
|
84,216
|
|
|||||||||||||||||
|
Net income
|
$
|
337,257
|
|
||||||||||||||||
|
Net sales (eliminations)
|
$
|
880,957
|
|
$
|
820,131
|
|
$
|
587,533
|
|
$
|
(1,309
|
)
|
$
|
2,287,312
|
|
||||
|
Operating margin
|
27.4
|
%
|
21.9
|
%
|
25.0
|
%
|
n/m
|
|
22.0
|
%
|
|||||||||
|
EBITDA margin
|
29.9
|
%
|
27.5
|
%
|
27.2
|
%
|
n/m
|
|
25.5
|
%
|
|||||||||
|
For the Year Ended December 31, 2016
|
|||||||||||||||||||
|
FMT
|
HST
|
FSDP
|
Corporate
|
IDEX
|
|||||||||||||||
|
Operating income (loss)
|
$
|
217,500
|
|
$
|
153,691
|
|
$
|
123,605
|
|
$
|
(82,399
|
)
|
$
|
412,397
|
|
||||
|
- Other (income) expense - net
|
3,066
|
|
(1,991
|
)
|
161
|
|
(2,967
|
)
|
(1,731
|
)
|
|||||||||
|
+ Depreciation and amortization
|
28,458
|
|
45,298
|
|
11,956
|
|
1,180
|
|
86,892
|
|
|||||||||
|
EBITDA
|
242,892
|
|
200,980
|
|
135,400
|
|
(78,252
|
)
|
501,020
|
|
|||||||||
|
- Interest expense
|
45,616
|
|
|||||||||||||||||
|
- Provision for income taxes
|
97,403
|
|
|||||||||||||||||
|
- Depreciation and amortization
|
86,892
|
|
|||||||||||||||||
|
Net income
|
$
|
271,109
|
|
||||||||||||||||
|
Net sales (eliminations)
|
$
|
849,101
|
|
$
|
744,809
|
|
$
|
520,009
|
|
$
|
(876
|
)
|
$
|
2,113,043
|
|
||||
|
Operating margin
|
25.6
|
%
|
20.6
|
%
|
23.8
|
%
|
n/m
|
|
19.5
|
%
|
|||||||||
|
EBITDA margin
|
28.6
|
%
|
27.0
|
%
|
26.0
|
%
|
n/m
|
|
23.7
|
%
|
|||||||||
|
7. Reconciliation of the Change in Net Sales to Net Organic Sales
|
|||||||||||||||||||||||||||||||||||
|
For the Year Ended December 31,
|
|||||||||||||||||||||||||||||||||||
|
2018
|
2017
|
2016
|
|||||||||||||||||||||||||||||||||
|
FMT
|
HST
|
FSDP
|
IDEX
|
FMT
|
HST
|
FSDP
|
IDEX
|
FMT
|
HST
|
FSDP
|
IDEX
|
||||||||||||||||||||||||
|
Change in net sales
|
8
|
%
|
9
|
%
|
8
|
%
|
9
|
%
|
4
|
%
|
10
|
%
|
13
|
%
|
8
|
%
|
(1
|
)%
|
1
|
%
|
23
|
%
|
5
|
%
|
|||||||||||
|
- Net impact from acquisitions/divestitures
|
(2
|
)%
|
2
|
%
|
—
|
%
|
—
|
%
|
(2
|
)%
|
3
|
%
|
9
|
%
|
2
|
%
|
1
|
%
|
3
|
%
|
27
|
%
|
7
|
%
|
|||||||||||
|
- Impact from FX
|
1
|
%
|
1
|
%
|
1
|
%
|
1
|
%
|
—
|
%
|
(1
|
)%
|
—
|
%
|
—
|
%
|
(1
|
)%
|
(1
|
)%
|
(1
|
)%
|
(1
|
)%
|
|||||||||||
|
Change in organic net sales
|
9
|
%
|
6
|
%
|
7
|
%
|
8
|
%
|
6
|
%
|
8
|
%
|
4
|
%
|
6
|
%
|
(1
|
)%
|
(1
|
)%
|
(3
|
)%
|
(1
|
)%
|
|||||||||||
Refer to Management’s Discussion and Analysis for definition and further discussion on organic sales.
17
Item 7.
Management’s Discussion and Analysis of Financial Condition and Results of Operations.
2018
Overview and Outlook
IDEX is an applied solutions company specializing in the manufacture of fluid and metering technologies, health and science technologies and fire, safety and other diversified products built to customers’ specifications. IDEX’s products are sold in niche markets across a wide range of industries throughout the world. Accordingly, IDEX’s businesses are affected by levels of industrial activity and economic conditions in the U.S. and in other countries where it does business and by the relationship of the U.S. dollar to other currencies. Levels of capacity utilization and capital spending in certain industries and overall industrial activity are important factors that influence the demand for IDEX’s products.
The Company has three reportable business segments: Fluid & Metering Technologies, Health & Science Technologies and Fire & Safety/Diversified Products. Within our three reportable segments, the Company maintains 13 platforms, where we focus on organic growth and strategic acquisitions. Each of our 13 platforms is also a reporting unit that we annually test goodwill for impairment.
The Fluid & Metering Technologies segment designs, produces and distributes positive displacement pumps, flow meters, injectors and other fluid-handling pump modules and systems and provides flow monitoring and other services for the food, chemical, general industrial, water and wastewater, agriculture and energy industries. The Fluid & Metering Technologies segment contains the Energy platform (comprised of Corken, Liquid Controls, SAMPI and Toptech), the Valves platform (comprised of Alfa Valvole, Richter and Aegis), the Water platform (comprised of Pulsafeeder, OBL, Knight, ADS, Trebor and iPEK), the Pumps platform (comprised of Viking and Warren Rupp) and the Agriculture platform (comprised of Banjo).
The Health & Science Technologies segment designs, produces and distributes a wide range of precision fluidics, rotary lobe pumps, centrifugal and positive displacement pumps, roll compaction and drying systems used in beverage, food processing, pharmaceutical and cosmetics, pneumatic components and sealing solutions, including very high precision, low-flow rate pumping solutions required in analytical instrumentation, clinical diagnostics and drug discovery, high performance molded and extruded sealing components, biocompatible medical devices and implantables, air compressors used in medical, dental and industrial applications, optical components and coatings for applications in the fields of scientific research, defense, biotechnology, aerospace, telecommunications and electronics manufacturing, laboratory and commercial equipment used in the production of micro and nano scale materials, precision photonic solutions used in life sciences, research and defense markets and precision gear and peristaltic pump technologies that meet exacting original equipment manufacturer specifications. The Health & Science Technologies segment contains the Scientific Fluidics & Optics platform (comprised of Eastern Plastics, Rheodyne, Sapphire Engineering, Upchurch Scientific, ERC, CiDRA Precision Services, thinXXS, CVI Melles Griot, Semrock, AT Films and FLI), the Sealing Solutions platform (comprised of Precision Polymer Engineering, FTL Seals Technology, Novotema and SFC Koenig) the Gast platform, the Micropump platform and the Material Processing Technologies platform (comprised of Quadro, Fitzpatrick, Microfluidics and Matcon).
The Fire & Safety/Diversified Products segment designs, produces and develops firefighting pumps, valves and controls, rescue tools, lifting bags and other components and systems for the fire and rescue industry, engineered stainless steel banding and clamping devices used in a variety of industrial and commercial applications and precision equipment for dispensing, metering, and mixing colorants and paints used in a variety of retail and commercial businesses around the world. The Fire & Safety/Diversified Products segment is comprised of the Fire & Safety platform (comprised of Class 1, Hale, Akron Brass, AWG Fittings, Godiva, Dinglee, Hurst Jaws of Life, Lukas and Vetter), the Band-It platform and the Dispensing platform.
Our
2018
financial results were as follows:
|
•
|
Sales of
$2.5 billion
increased
9%
, reflecting an
8%
increase
in organic sales and a
1%
increase
due to foreign currency translation.
|
|
•
|
Operating income of
$569.1 million
was
up
13%
and operating margin of
22.9%
was
up
90
basis points from the prior year.
|
|
•
|
Net income
increased
22%
to
$410.6 million
.
|
|
•
|
Diluted EPS of
$5.29
increased
$0.93
, or
21%
, compared to
2017
.
|
Our
2018
financial results, adjusted for
$12.1 million
of restructuring expense, compared to our
2017
financial results, adjusted for
$8.5 million
of restructuring expense and a
$9.3 million
gain on sale of a business, were as follows (these non-GAAP measures have been reconciled to U.S. GAAP measures in Item 6, “Selected Financial Data”):
18
|
•
|
Adjusted operating income of
$581.2 million
was
up
16%
and adjusted operating margin of
23.4%
was
up
150
basis points from the prior year.
|
|
•
|
Adjusted net income
increased
26%
to
$419.6 million
.
|
|
•
|
Adjusted EPS of
$5.41
was
26%
higher
than prior year adjusted EPS of
$4.31
.
|
Although trade tensions persist and the geopolitical environment remains uncertain, we are confident in our outlook given our market leading positions in our diversified portfolio and our track record of strong execution in volatile times. Consistent with our long-term strategic objective to grow faster than underlying market growth, we are projecting 4 to 5 percent organic revenue growth in 2019 and full year 2019 EPS is expected to be in the range of $5.60 to $5.80.
Results of Operations
The following is a discussion and analysis of our results of operations for each of the three years in the period ended December 31,
2018
. For purposes of this Item, reference is made to the Consolidated Statements of Operations in Part II, Item 8, “Financial Statements and Supplementary Data.” Segment operating income excludes unallocated corporate operating expenses. Management’s primary measurements of segment performance are sales, operating income and operating margin.
In the following discussion, and throughout this report, references to organic sales, a non-GAAP measure, refers to sales from continuing operations calculated according to generally accepted accounting principles in the United States but excludes (1) the impact of foreign currency translation and (2) sales from acquired or divested businesses during the first twelve months of ownership or divestiture. The portion of sales attributable to foreign currency translation is calculated as the difference between (a) the period-to-period change in organic sales and (b) the period-to-period change in organic sales after applying prior period foreign exchange rates to the current year period. Management believes that reporting organic sales provides useful information to investors by helping identify underlying growth trends in our business and facilitating easier comparisons of our revenue performance with prior and future periods and to our peers. The Company excludes the effect of foreign currency translation from organic sales because foreign currency translation is not under management’s control, is subject to volatility and can obscure underlying business trends. The Company excludes the effect of acquisitions and divestitures because they can obscure underlying business trends and make comparisons of long-term performance difficult due to the varying nature, size and number of transactions from period to period and between the Company and its peers.
Performance in
2018
Compared with
2017
|
(In thousands)
|
2018
|
2017
|
Change
|
||||||||
|
Net sales
|
$
|
2,483,666
|
|
$
|
2,287,312
|
|
9
|
%
|
|||
|
Operating income
|
569,088
|
|
502,556
|
|
13
|
%
|
|||||
|
Operating margin
|
22.9
|
%
|
22.0
|
%
|
90
|
|
bps
|
||||
Sales in
2018
were
$2.5 billion
, a
9%
increase
from last year. This
increase
reflects an
8%
increase
in organic sales and a
1%
favorable impact from foreign currency translation. Sales to customers outside the U.S. represented approximately
51%
of total sales in
2018
compared with
49%
in
2017
.
In
2018
, Fluid & Metering Technologies contributed
38%
of sales and
42%
of total segment operating income; Health & Science Technologies contributed
36%
of sales and
32%
of total segment operating income; and Fire & Safety/Diversified Products contributed
26%
of sales and
26%
of total segment operating income.
Gross profit of
$1.1 billion
in
2018
increased
$91.2 million
, or
9%
, from
2017
, while gross margin increased 10 basis points to
45.0
% in
2018
from
44.9%
in
2017
. The increase in gross profit and margin is primarily a result of productivity initiatives and volume leverage, partially offset by higher engineering costs.
Selling, general and administrative (“SG&A”) expenses
increased
to
$536.7 million
in
2018
from
$524.9 million
in
2017
. The
$11.8 million
increase
is mainly attributable to a stamp duty tax in Switzerland associated with the restructuring of intercompany loans and higher stock compensation. As a percentage of sales, SG&A expenses were
21.6%
for
2018
and
23.0%
for
2017
.
In 2017, the Company divested its Faure Herman business for a pre-tax gain of $9.3 million.
In
2018
and
2017
, the Company incurred pre-tax restructuring expenses totaling
$12.1 million
and
$8.5 million
, respectively, as part of initiatives that support the implementation of key strategic efforts designed to facilitate long-term, sustainable growth through cost reduction actions primarily consisting of employee reductions and facility rationalization.
19
Operating income of
$569.1 million
in
2018
increased
from
$502.6 million
in
2017
, primarily due to volume leverage, partially offset by the gain on the sale of a business in 2017 and higher restructuring costs in 2018. Operating margin of
22.9%
in
2018
was
up
90
basis points from
22.0%
in
2017
primarily due to higher volume and productivity initiatives, partially offset by the gain on the sale of a business in 2017 and higher restructuring costs in 2018.
Other (income) expense - net changed by
$6.4 million
, from
expense
of
$2.4 million
in
2017
to
income
of
$4.0 million
in
2018
mainly due to a foreign currency transaction gain on intercompany loans in 2018.
Interest expense
decreased
to
$44.1 million
in
2018
from
$44.9 million
in
2017
. The
decrease
was primarily due to slightly lower borrowings on the revolving credit facility during 2018 compared to 2017.
The provision for income taxes is based upon estimated annual tax rates for the year applied to federal, state and foreign income. The provision for income taxes
increased
to
$118.4 million
in
2018
compared to
$118.0 million
in
2017
. The effective tax rate decreased to 22.4% in 2018 compared to 25.9% in 2017 due to the enactment of the Tax Cuts and Jobs Act (the “Tax Act”), including the one-time Transition Tax incurred in 2017 on the mandatory deemed repatriation of foreign earnings, the 14% decrease in the U.S. statutory income tax rate and the introduction of the Foreign-Derived Intangible Income (“FDII”) deduction, as well as the excess tax benefits related to share-based compensation. These amounts were offset by the removal of the domestic production activities deduction, the new Global Intangible Low-Taxed Income (“GILTI”) provision, increased limitation on the deductibility of executive compensation and the mix of global pre-tax income among jurisdictions.
Net income for the year of
$410.6 million
increased
from
$337.3 million
in
2017
. Diluted earnings per share in
2018
of
$5.29
increased
$0.93
from
$4.36
in
2017
.
Fluid & Metering Technologies Segment
|
(In thousands)
|
2018
|
2017
|
Change
|
||||||||
|
Net sales
|
$
|
951,552
|
|
$
|
880,957
|
|
8
|
%
|
|||
|
Operating income
|
275,060
|
|
241,030
|
|
14
|
%
|
|||||
|
Operating margin
|
28.9
|
%
|
27.4
|
%
|
150
|
|
bps
|
||||
Sales of
$951.6 million
increased
$70.6 million
, or
8%
, in
2018
compared with
2017
. This
increase
reflected a
9%
increase
in organic sales and a
1%
favorable impact from foreign currency translation, partially offset by a
2
%
decline
from a divestiture (Faure Herman - October 2017). In
2018
, sales were up
5%
domestically and
12%
internationally. Sales to customers outside the U.S. were approximately
43%
of total segment sales in
2018
compared with
42%
in
2017
.
Sales within our Pumps platform increased compared to 2017 due to strength in the North American industrial distribution market as well as strength in the oil and gas end market and lease automated custody transfer (“LACT”) products. Sales within the Water platform increased compared to 2017 due to strong international sales and increased project demand. Sales within our Agriculture platform increased year over year due to broad based demand across both OEM and distribution channels in North America and Europe. Sales within the Valves platform increased over 2017 primarily due to strong demand within the chemical end market in Europe and Asia. Sales within our Energy platform decreased slightly compared to 2017 primarily as a result of the divestiture of our Faure Herman business in October 2017, partially offset by strong truck builds and project gains in the LPG end market.
Operating income and operating margin of
$275.1 million
and
28.9%
, respectively, were
higher
than the
$241.0 million
and
27.4%
, respectively, recorded in
2017
, primarily due to higher volume and productivity initiatives, partially offset by higher restructuring expenses in 2018 and the divestiture in 2017.
Health & Science Technologies Segment
|
(In thousands)
|
2018
|
2017
|
Change
|
||||||||
|
Net sales
|
$
|
896,419
|
|
$
|
820,131
|
|
9
|
%
|
|||
|
Operating income
|
205,679
|
|
179,567
|
|
15
|
%
|
|||||
|
Operating margin
|
22.9
|
%
|
21.9
|
%
|
100
|
|
bps
|
||||
Sales of
$896.4 million
increased
$76.3 million
, or
9%
, in
2018
compared with
2017
. This
increase
reflected a
6%
increase
in organic sales, a
2%
increase
from acquisitions (FLI - July 2018 and thinXXS - December 2017) and a
1%
favorable
impact
20
from foreign currency translation. In
2018
, sales increased
7%
domestically and
11%
internationally. Sales to customers outside the U.S. were approximately
56%
of total segment sales in
2018
and
55%
in
2017
.
Sales within our Scientific Fluidics & Optics platform increased compared to 2017 due to new product introductions, market share gains, strong demand across our end markets, including IVD, biotechnology, semiconductor and defense and the Finger Lakes Instrumentation and thinXXS acquisitions. Sales within our Material Processing Technologies platform increased compared to 2017 primarily due to the timing of several large projects in
2018
and continued demand within the pharmaceutical end market in Asia, partially offset by the impact of strategic changes in product focus which resulted in discontinued product offerings in
2017
. Sales within our Sealing Solutions platform increased compared to 2017 due to the extremely strong global demand in the semiconductor end market and strength in the energy, automotive and industrial end markets. Sales in our Gast platform increased compared to 2017 primarily due to the impact of OEM tailwinds and higher distribution volume as well as new product introductions. Sales within our Micropump platform increased compared to 2017 due to increasing demand in the printing end market.
Operating income and operating margin of
$205.7 million
and
22.9%
, respectively, in
2018
were
up
from
$179.6 million
and
21.9%
, respectively, in
2017
, primarily due to higher volume and productivity initiatives, partially offset by higher restructuring expenses in the current year related to site consolidations.
Fire & Safety/Diversified Products Segment
|
(In thousands)
|
2018
|
2017
|
Change
|
||||||||
|
Net sales
|
$
|
637,028
|
|
$
|
587,533
|
|
8
|
%
|
|||
|
Operating income
|
168,601
|
|
147,028
|
|
15
|
%
|
|||||
|
Operating margin
|
26.5
|
%
|
25.0
|
%
|
150
|
|
bps
|
||||
Sales of
$637.0 million
increased
$49.5 million
, or
8%
, in
2018
compared with
2017
. This
increase
reflected a
7%
increase
in organic sales and a
1%
favorable impact from foreign currency translation. In
2018
, sales increased
6%
domestically and
11%
internationally. Sales to customers outside the U.S. were approximately
53%
of total segment sales in
2018
compared with
52%
in
2017
.
Sales within our Dispensing platform increased compared to 2017 due to strong global demand led by the U.S. and Asia. Sales increased in our Band-It platform compared to 2017 due to market share gain across all global regions, strength in the energy, automotive and industrial end markets and several large project gains. Sales within our Fire & Safety platform increased compared to 2017 primarily due to OEM and distribution strength as well as strong demand for rescue tools across all geographies.
Operating income of
$168.6 million
and operating margin of
26.5%
, respectively, were
higher
than the
$147.0 million
and
25.0%
, respectively, in
2017
, primarily due to increased volume and productivity initiatives, partially offset by higher restructuring expenses in 2018.
Performance in
2017
Compared with
2016
|
(In thousands)
|
2017
|
2016
|
Change
|
||||||||
|
Net sales
|
$
|
2,287,312
|
|
$
|
2,113,043
|
|
8
|
%
|
|||
|
Operating income
|
502,556
|
|
412,397
|
|
22
|
%
|
|||||
|
Operating margin
|
22.0
|
%
|
19.5
|
%
|
250
|
|
bps
|
||||
Sales in 2017 were $2.3 billion, an 8% increase from 2016. This increase reflects a 6% increase in organic sales and a 2% increase from acquisitions/divestitures (Acquisitions: thinXXS - December 2017; SFC Koenig - September 2016; AWG Fittings - July 2016 and Akron Brass - March 2016 / Divestitures: Faure Herman - October 2017; CVI Korea - December 2016; IETG - October 2016; CVI Japan - September 2016 and Hydra-Stop - July 2016). Sales to customers outside the U.S. represented approximately 49% of total sales in 2017 compared with 50% in 2016.
In 2017, Fluid & Metering Technologies contributed 38% of sales and 42% of total segment operating income; Health & Science Technologies contributed 36% of sales and 32% of total segment operating income; and Fire & Safety/Diversified Products contributed 26% of sales and 26% of total segment operating income.
21
Gross profit of $1.0 billion in 2017 increased $95.9 million, or 10%, from 2016, while gross margin increased 90 basis points to 44.9% in 2017 from 44.0% in 2016. The increase in gross profit and margin is primarily a result of increased sales volume and the dilutive impact in the prior year attributable to $14.7 million of fair value inventory step-up charges from 2016 acquisitions.
SG&A expenses increased to $524.9 million in 2017 from $492.4 million in 2016. The $32.5 million increase is mainly attributable to $15.2 million of net incremental impact from acquisitions and divestitures as well as higher variable compensation and stock compensation expense. As a percentage of sales, SG&A expenses were 23.0% for 2017 and 23.3% for 2016.
In 2017, the Company divested its Faure Herman business for a pre-tax gain of $9.3 million. In 2016, the Company divested four businesses during the year (Hydra-Stop - July 2016; CVI Japan - September 2016; IETG - October 2016; and CVI Korea - December 2016) for a pre-tax loss-net of $22.3 million.
In 2017 and 2016, the Company incurred pre-tax restructuring expenses totaling $8.5 million and $3.7 million, respectively, as part of initiatives that support the implementation of key strategic efforts designed to facilitate long-term, sustainable growth through cost reduction actions primarily consisting of employee reductions and facility rationalization.
Operating income of $502.6 million in 2017 increased from $412.4 million in 2016, primarily due to a gain on a divestiture in 2017 compared to a net loss on four divestitures in 2016, higher sales volume and the $14.7 million of fair value inventory step- up charges from 2016 acquisitions, partially offset by higher restructuring costs in 2017 and overall higher SG&A costs in 2017 due to higher variable and share-based compensation as well as outside consulting costs. Operating margin of 22.0% in 2017 was up 250 basis points from 19.5% in 2016 primarily due to the gain on the sale of a business in 2017 compared to a net loss on the sale of businesses in 2016, the dilutive impact in the prior year due to $14.7 million of fair value inventory step-up charges from 2016 acquisitions, as well as higher volume and productivity initiatives.
Other (income) expense - net changed by $4.1 million, from income of $1.7 million in 2016 to expense of $2.4 million in 2017 mainly due to a $4.7 million foreign exchange gain on intercompany loans in the prior year that did not repeat in 2017 due to the fact that the Company entered into foreign currency exchange contracts to minimize the earnings impact associated with these intercompany loans.
Interest expense decreased to $44.9 million in 2017 from $45.6 million in 2016. The decrease was primarily due to slightly lower borrowings in 2017 compared with 2016.
The provision for income taxes is based upon estimated annual tax rates for the year applied to federal, state and foreign income. The provision for income taxes increased to $118.0 million in 2017 compared to $97.4 million in 2016. The effective tax rate decreased to 25.9% in 2017 compared to 26.4% in 2016 due to the enactment of the Tax Cuts and Jobs Act (the “Tax Act”), a change in the permanent reinvestment assertion related to certain foreign subsidiaries as well as the incurrence of certain foreign income withholding taxes in the prior year. These amounts were offset by the prior year tax benefits on the divestitures of CVI Korea and CVI Japan, certain return-to-provision adjustments, a partial change in the assertion of permanent reinvestment of certain foreign earnings, as well as the mix of global pre-tax income among jurisdictions.
Net income for the year of $337.3 million increased from $271.1 million in 2016. Diluted earnings per share in 2017 of $4.36 increased $0.83 from $3.53 in 2016.
Fluid & Metering Technologies Segment
|
(In thousands)
|
2017
|
2016
|
Change
|
||||||||
|
Net sales
|
$
|
880,957
|
|
$
|
849,101
|
|
4
|
%
|
|||
|
Operating income
|
241,030
|
|
217,500
|
|
11
|
%
|
|||||
|
Operating margin
|
27.4
|
%
|
25.6
|
%
|
180
|
|
bps
|
||||
Sales of $881.0 million increased $31.9 million, or 4%, in 2017 compared with 2016. This increase reflected a 6% increase in organic sales and a 2% decline from divestitures (Faure Herman - October 2017; IETG - October 2016; and Hydra-Stop - July 2016). In 2017, sales were up 7% domestically and down 1% internationally. Sales to customers outside the U.S. were approximately 42% of total segment sales in 2017 compared with 44% in 2016.
Sales within our Energy platform decreased compared to 2016 primarily due to the impact of the 2017 divestiture as well as a large, non-recurring project in 2016 and weakness in the midstream oil and gas markets, partially offset by continued strength within the aviation market, increased market share in LPG mobile and increasing truck builds. Sales within our Pumps platform
22
increased compared to 2016 due to strength in the upstream oil market and the improving economy as well as a strong U.S. distribution channel. Sales within the Water platform decreased slightly compared to 2016 primarily due to the Hydra-Stop and IETG divestitures, partially offset by increased municipal spending and share gain from new product development. Sales within our Agriculture platform increased year over year due to increased demand across both OEM and distribution channels as well as pre-season order strength in the fourth quarter of 2017. Sales within the Valves platform increased over 2016 as a result of strong global industrial markets as well as an uptick in chemical markets.
Operating income and operating margin of $241.0 million and 27.4%, respectively, were higher than the $217.5 million and 25.6%, respectively, recorded in 2016, primarily due to productivity initiatives and higher volume.
Health & Science Technologies Segment
|
(In thousands)
|
2017
|
2016
|
Change
|
||||||||
|
Net sales
|
$
|
820,131
|
|
$
|
744,809
|
|
10
|
%
|
|||
|
Operating income (loss)
|
179,567
|
|
153,691
|
|
17
|
%
|
|||||
|
Operating margin
|
21.9
|
%
|
20.6
|
%
|
130
|
|
bps
|
||||
Sales of $820.1 million increased $75.3 million, or 10%, in 2017 compared with 2016. This increase reflected an 8% increase in organic sales, a 3% increase from acquisitions / divestitures (Acquisitions: thinXXS - December 2017 and SFC Koenig - September 2016 / Divestitures: CVI Korea - December 2016 and CVI Japan - September 2016) and 1% of favorable foreign currency translation. In 2017, sales increased 10% both domestically and internationally. Sales to customers outside the U.S. were approximately 55% of total segment sales in both 2017 and 2016.
Sales within our Scientific Fluidics & Optics platform increased compared to 2016 due to strong demand in all primary end markets, including analytical instrumentation, in-vitro diagnostics and biotechnology, DNA sequencing and semiconductor, partially offset by the impact of the CVI Japan and CVI Korea divestitures in 2016. Sales within our Material Processing Technologies platform were relatively flat compared to the prior year primarily due to the impact of strategic changes in product focus which resulted in discontinued products, offset by global strength in the food and pharma end markets and a strong project funnel. Sales within our Sealing Solutions platform increased significantly compared to 2016 due to the full year impact of the SFC Koenig acquisition in 2016 as well as strength in the semiconductor market and an uptick in the oil and gas, mining and automotive markets. Sales in our Gast platform remained relatively flat year over year primarily due to the impact of OEM headwinds during the first half of 2017 offset by increasing demand in industrial and dental markets. Sales within our Micropump platform increased year over year due to solid demand in the North American industrial markets.
Operating income and operating margin of $179.6 million and 21.9%, respectively, in 2017 were up from $153.7 million and 20.6%, respectively, in 2016, primarily due to higher volume and the dilutive impact of the inventory step-up charge related to the SFC Koenig acquisition in the prior year, partially offset by higher restructuring expenses in 2017, costs associated with site consolidations within the Material Processing Technologies and the Scientific Fluidics & Optics platforms as well as additional engineering investments and operational challenges as a result of the strong growth within the segment.
Fire & Safety/Diversified Products Segment
|
(In thousands)
|
2017
|
2016
|
Change
|
||||||||
|
Net sales
|
$
|
587,533
|
|
$
|
520,009
|
|
13
|
%
|
|||
|
Operating income
|
147,028
|
|
123,605
|
|
19
|
%
|
|||||
|
Operating margin
|
25.0
|
%
|
23.8
|
%
|
120
|
|
bps
|
||||
Sales of
$587.5 million
increased
$67.5 million
, or
13.0%
, in
2017
compared with
2016
. This increase reflected a 4% increase in organic sales and a 9% decline due to acquisitions (AWG Fittings - July 2016 and Akron Brass - March 2016). In 2017, sales increased 9% domestically and 17% internationally. Sales to customers outside the U.S. were approximately 52% of total segment sales in 2017 compared with 51% in 2016.
Sales within our Dispensing platform decreased slightly compared to 2016 due to declining markets in Latin America and U.S. retail, partially offset by growing strength in Europe and Asia. Sales increased in our Band-It platform compared to the prior year as a result of rebounding energy markets as well as strength across the transportation and industrial markets and increasing demand in Asia and Latin America. Sales within our Fire & Safety platform increased significantly compared to 2016 primarily due to the full year impact of the prior year acquisitions as well as strength in municipal and North American OEM markets.
23
Operating income of $147.0 million and operating margin of 25.0% were higher than the $123.6 million and 23.8%, respectively, in 2016, primarily due to higher volume and productivity, as well as the full year impact of the Akron Brass and AWG Fittings acquisitions on 2017 financial results and the inclusion of $7.5 million of fair value inventory step-up charges related to the acquisitions in the prior year period.
Liquidity and Capital Resources
Operating Activities
Cash flows from operating activities
increased
$46.6 million
, or
11%
, to
$479.3 million
in
2018
, primarily due to higher net income in
2018
, partially offset by investments in working capital to support long-term growth. At
December 31, 2018
, working capital was
$727.9 million
and the Company’s current ratio was
3.0
to 1. At
December 31, 2018
, the Company’s cash and cash equivalents totaled
$466.4 million
, of which
$326.5 million
was held outside of the United States.
Investing Activities
Cash flows
used in
investing activities increased
$26.7 million
to
$81.4 million
in
2018
, primarily due to $12.2 million of higher capital expenditures in 2018, $4.0 million spent on the purchase of intellectual property assets from Phantom Controls, Inc. (“Phantom”), $5.6 million of lower proceeds from the disposal of fixed assets in 2018, $21.8 million of proceeds from the sale of a business in 2017 which did not reoccur in 2018 and lower spending of $18.0 million on acquisitions in 2018 compared to 2017.
Cash flows from operations were more than adequate to fund capital expenditures of
$56.1 million
and
$43.9 million
in
2018
and
2017
, respectively. Capital expenditures were generally for machinery and equipment that supported growth, improved productivity, tooling, business system technology, replacement of equipment and investments in new facilities. Management believes that the Company has ample capacity in its plants and equipment to meet demand increases for future growth in the intermediate term.
Financing Activities
Cash flows
used in
financing activities increased
$12.6 million
to
$290.0 million
in
2018
, primarily due to $16.3 of higher dividend payments and $144.9 million of higher purchases of common stock, partially offset by $156.3 million of lower repayments under the revolving credit facility (net of borrowings).
On June 13, 2016, the Company completed a private placement of a
$100 million
aggregate principal amount of
3.20%
Senior Notes due June 13, 2023 and a
$100 million
aggregate principal amount of
3.37%
Senior Notes due June 13, 2025 (collectively, the “Notes”) pursuant to a Note Purchase Agreement, dated June 13, 2016 (the “Purchase Agreement”). Each series of Notes bears interest at the stated amount per annum, which is payable semi-annually in arrears on each June 13
th
and December 13
th
. The Notes are unsecured obligations of the Company and rank pari passu in right of payment with all of the Company’s other unsecured, unsubordinated debt. The Company may at any time prepay all, or any portion of the Notes; provided that such portion is greater than
5%
of the aggregate principal amount of the Notes then outstanding. In the event of a prepayment, the Company will pay an amount equal to par plus accrued interest plus a make-whole amount. In addition, the Company may repurchase the Notes by making an offer to all holders of the Notes, subject to certain conditions.
The Company maintains a revolving credit facility (the “Revolving Facility”), which is a $700.0 million unsecured, multi-currency bank credit facility expiring on June 23, 2020. At
December 31, 2018
, there was
no
balance outstanding under the Revolving Facility and
$8.8 million
of outstanding letters of credit, resulting in a net available borrowing capacity under the Revolving Facility at
December 31, 2018
of
$691.2 million
. Borrowings under the Revolving Facility bear interest, at either an alternate base rate or an adjusted LIBOR rate plus, in each case, an applicable margin. This applicable margin is based on the Company’s senior, unsecured, long-term debt rating and can range from
.005%
to
1.50%
. Based on the Company’s credit rating at
December 31, 2018
, the applicable margin was
1.10%
. Interest is payable (a) in the case of base rate loans, quarterly, and (b) in the case of LIBOR rate loans, on the maturity date of the borrowing, or quarterly from the effective date for borrowings exceeding three months. The Company may request increases in the lending commitments under the Credit Agreement, but the aggregate lending commitments pursuant to such increases may not exceed $350.0 million. An annual Revolving Facility fee, also based on the Company’s credit rating, is currently 15 basis points and is payable quarterly.
On December 9, 2011, the Company completed a public offering of $350.0 million 4.2% senior notes due December 15, 2021 (“4.2% Senior Notes”). The net proceeds from the offering of $346.2 million, after deducting a $0.9 million issuance discount, a $2.3 million underwriting commission and $0.6 million of offering expenses, were used to repay $306.0 million of outstanding bank indebtedness, with the balance used for general corporate purposes. The 4.2% Senior Notes bear interest at a rate of 4.2% per
24
annum, which is payable semi-annually in arrears on each June 15 and December 15. The Company may redeem all or part of the 4.2% Senior Notes at any time prior to maturity at the redemption prices set forth in the Note Indenture governing the 4.2% Senior Notes. The Company may issue additional debt from time to time pursuant to the Indenture. The Indenture and 4.2% Senior Notes contain covenants that limit the Company’s ability to, among other things, incur certain liens securing indebtedness, engage in certain sale-leaseback transactions, and enter into certain consolidations, mergers, conveyances, transfers or leases of all or substantially all of the Company’s assets. The terms of the 4.2% Senior Notes also require the Company to make an offer to repurchase the 4.2% Senior Notes upon a change of control triggering event (as defined in the Indenture) at a price equal to 101% of their principal amount plus accrued and unpaid interest, if any.
On December 6, 2010, the Company completed a public offering of $300.0 million 4.5% senior notes due December 15, 2020 (“4.5% Senior Notes”). The net proceeds from the offering of $295.7 million, after deducting a $1.6 million issuance discount, a $1.9 million underwriting commission and $0.8 million of offering expenses, were used to repay $250.0 million of outstanding bank indebtedness, with the balance used for general corporate purposes. The 4.5% Senior Notes bear interest at a rate of 4.5% per annum, which is payable semi-annually in arrears on each June 15 and December 15. The Company may redeem all or a portion of the 4.5% Senior Notes at any time prior to maturity at the redemption prices set forth in the Note Indenture governing the 4.5% Senior Notes. The Company may issue additional debt from time to time pursuant to the Indenture. The Indenture and 4.5% Senior Notes contain covenants that limit the Company’s ability to, among other things, incur certain liens securing indebtedness, engage in certain sale-leaseback transactions, and enter into certain consolidations, mergers, conveyances, transfers or leases of all or substantially all of the Company’s assets. The terms of the 4.5% Senior Notes also require the Company to make an offer to repurchase the 4.5% Senior Notes upon a change of control triggering event (as defined in the Indenture) at a price equal to 101% of their principal amount plus accrued and unpaid interest, if any.
There are two key financial covenants that the Company is required to maintain in connection with the Revolving Facility and the Notes, a minimum interest coverage ratio of
3.0
to
1
and a maximum leverage ratio of
3.50
to
1
. At
December 31, 2018
, the Company was in compliance with both of these financial covenants, as the Company’s interest coverage ratio was
15.65
to 1 and the leverage ratio was
1.27
to 1. There are no financial covenants relating to the 4.5% Senior Notes or 4.2% Senior Notes; however, both are subject to cross-default provisions.
On
December 1, 2015
the Company’s Board of Directors approved an increase of
$300.0 million
in the authorized level for repurchases of common stock. This followed the prior Board of Directors approved repurchase authorization of $400.0 million that was announced by the Company on November 6, 2014. Repurchases under the program will be funded with future cash flow generation or borrowings available under the Revolving Facility. During
2018
, the Company purchased a total of
1.3 million
shares at a cost of
$173.9 million
compared to
0.3 million
shares purchased in
2017
at a cost of
$29.1 million
. As of
December 31, 2018
, the amount of share repurchase authorization remaining is
$377.0 million
.
The Company believes current cash, cash from operations and cash available under the Revolving Facility will be sufficient to meet its operating cash requirements, planned capital expenditures, interest and principal payments on all borrowings, pension and postretirement funding requirements, authorized share repurchases and annual dividend payments to holders of the Company’s common stock for the next twelve months. Additionally, in the event that suitable businesses are available for acquisition upon acceptable terms, the Company may obtain all or a portion of the financing for these acquisitions through the incurrence of additional borrowings. As of
December 31, 2018
, there was
no
balance outstanding under the Revolving Facility and
$8.8 million
of outstanding letters of credit, resulting in a net available borrowing capacity under the Revolving Facility at
December 31, 2018
of approximately
$691.2 million
.
Contractual Obligations
Our contractual obligations include pension and postretirement medical benefit plans, rental payments under operating leases, payments under capital leases and other long-term obligations arising in the ordinary course of business. There are no identifiable events or uncertainties, including the lowering of our credit rating, which would accelerate payment or maturity of any of these commitments or obligations.
The following table summarizes our significant contractual obligations and commercial commitments at
December 31, 2018
and the future periods in which such obligations are expected to be settled in cash. In addition, the table reflects the timing of principal and interest payments on outstanding borrowings. Additional detail regarding these obligations is provided in the Notes to Consolidated Financial Statements in Part II, Item 8, “Financial Statements and Supplementary Data.”
25
|
Payments Due by Period
|
Total
|
Less
Than
1 Year
|
1-3
Years
|
3-5
Years
|
More
Than
5 Years
|
||||||||||||||
|
|
(In thousands)
|
||||||||||||||||||
|
Borrowings
(1)
|
$
|
944,398
|
|
$
|
35,265
|
|
$
|
692,538
|
|
$
|
111,540
|
|
$
|
105,055
|
|
||||
|
Lease obligations
|
85,359
|
|
17,509
|
|
23,678
|
|
14,514
|
|
29,658
|
|
|||||||||
|
Purchase obligations
(2)
|
136,040
|
|
133,311
|
|
2,688
|
|
41
|
|
—
|
|
|||||||||
|
Repatriation tax payable
|
17,127
|
|
—
|
|
—
|
|
5,217
|
|
11,910
|
|
|||||||||
|
Pension and post-retirement obligations
|
110,436
|
|
11,357
|
|
22,831
|
|
21,937
|
|
54,311
|
|
|||||||||
|
Total contractual obligations
(3)
|
$
|
1,293,360
|
|
$
|
197,442
|
|
$
|
741,735
|
|
$
|
153,249
|
|
$
|
200,934
|
|
||||
|
(1)
|
Includes interest payments based on contractual terms and current interest rates for variable debt.
|
|
(2)
|
Consists primarily of inventory commitments.
|
|
(3)
|
Comprises liabilities recorded on the balance sheet of $955.1 million and obligations not recorded on the balance sheet of $345.5 million.
|
Critical Accounting Policies
We believe that the application of the following accounting policies, which are important to our financial position and results of operations, require significant judgments and estimates on the part of management. For a summary of all of our accounting policies, including the accounting policies discussed below, see Note 1 of the Notes to Consolidated Financial Statements in Part II, Item 8, “Financial Statements and Supplementary Data.”
Revenue recognition
— Revenue is recognized when control of the promised products or services is transferred to our customers in an amount that reflects the consideration we expect to be entitled to in exchange for transferring those products or providing those services. A performance obligation is a promise in a contract to transfer a distinct product or service to the customer. A contract’s transaction price is allocated to each distinct performance obligation and recognized as revenue when, or as, the performance obligation is satisfied. Our performance obligations are satisfied at a point in time or over time as work progresses. Revenue from products and services transferred to customers at a point in time is recognized when obligations under the terms of the contract with our customer are satisfied. Generally, this occurs with the transfer of control of the asset, which is in line with shipping terms. Certain units recognize revenue over time because control transfers continuously to our customers. Revenue is recognized over time as work is performed based on the relationship between actual costs incurred to date for each contract and the total estimated costs for such contract at completion of the performance obligation (i.e. the cost-to-cost method) or is recognized ratably over the contract term. As a significant change in one or more of these estimates could affect the profitability of our contracts, we review and update our estimates regularly. Due to uncertainties inherent in the estimation process, it is reasonably possible that completion costs will be revised. Such revisions to costs and income are recognized in the period in which the revisions are determined as a cumulative catch-up adjustment. The impact of the adjustment on profit recorded to date on a contract is recognized in the period the adjustment is identified. If at any time the estimate of contract profitability indicates an anticipated loss on the contract, we recognize provisions for estimated losses on uncompleted contracts in the period in which such losses are determined.
The Company records allowances for discounts, product returns and customer incentives at the time of sale as a reduction of revenue as such allowances can be reliably estimated based on historical experience and known trends. The Company also offers product warranties (primarily assurance-type) and accrues its estimated exposure for warranty claims at the time of sale based upon the length of the warranty period, warranty costs incurred and any other related information known to the Company.
Goodwill, long-lived and intangible assets
— The Company evaluates the recoverability of certain noncurrent assets utilizing various estimation processes. An impairment of a long-lived asset exists when the asset’s carrying amount exceeds its fair value and is recorded when the carrying amount is not recoverable through future operations. An impairment of an indefinite-lived intangible asset or goodwill exists when the carrying amount of the intangible asset or goodwill exceeds its fair value. Assessments of possible impairments of long-lived or indefinite-lived intangible assets or goodwill are made if an event occurs or circumstances change that would more likely than not reduce the fair value of a reporting unit below its carrying amount. Additionally, testing for possible impairments of recorded indefinite-lived intangible asset balances and goodwill is performed annually. On October 31, or more frequently if triggering events occur, the Company compares the fair value of each reporting unit to the carrying amount of each reporting unit to determine if a goodwill impairment exists. The amount and
timing of impairment charges for these assets require the estimation of future cash flows to determine the fair value of the related assets. In
2018
and
2017
, the Company concluded that there were no long-lived assets with a fair value that was less than the carrying value.
26
The Company’s business acquisitions result in recording goodwill and other intangible assets, which affect the amount of amortization expense and possible impairment expense that the Company will incur in future periods. The Company follows the guidance prescribed in ASC 350,
Goodwill and Other Intangible Assets
, to test goodwill and intangible assets for impairment. The Company determines the fair value of each reporting unit utilizing an income approach (discounted cash flows) weighted 50% and a market approach (consisting of a comparable public company multiples methodology) weighted 50%. To determine the reasonableness of the calculated fair values, the Company reviews the assumptions to ensure that neither the income approach nor the market approach yielded significantly different valuations.
The key assumptions are updated every year for each reporting unit for the income and market approaches used to determine fair value. Various assumptions are utilized including forecasted operating results, annual operating plans, strategic plans, economic projections, anticipated future cash flows, the weighted average cost of capital, market data and market multiples. The assumptions that have the most significant effect on the fair value calculations are the weighted average cost of capital, market multiples, forecasted EBITDA and terminal growth rates. The
2018
and
2017
ranges for these three assumptions utilized by the Company are as follows:
|
Assumptions
|
2018
Range |
|
2017
Range |
|
Weighted average cost of capital
|
9.5% to 11.0%
|
|
8.75% to 10.5%
|
|
Market multiples
|
11.0x to 17.0x
|
|
11.0x to 20.0x
|
|
Terminal growth rates
|
3.0% to 3.5%
|
|
3.0% to 3.5%
|
In assessing the fair value of the reporting units, the Company considers both the market approach and the income approach. Under the market approach, the fair value of the reporting unit is determined by the respective trailing twelve month EBITDA and the forward looking 2019 EBITDA (50% each), based on multiples of comparable public companies. The market approach is dependent on a number of significant management assumptions including forecasted EBITDA and selected market multiples. Under the income approach, the fair value of the reporting unit is determined based on the present value of estimated future cash flows. The income approach is dependent on a number of significant management assumptions including estimates of operating results, capital expenditures, net working capital requirements, long-term growth rates and discount rates. Weighting was equally attributed to both the market and income approaches (50% each) in arriving at the fair value of the reporting units.
The Banjo trade name and the Akron Brass trade name are indefinite-lived intangible assets which are tested for impairment on an annual basis in accordance with ASC 350 or more frequently if events or changes in circumstances indicate that the assets might be impaired. The Company uses the relief-from-royalty method, a form of the income approach, to determine the fair value of these trade names. The relief-from-royalty method is dependent on a number of significant management assumptions, including estimates of revenues, royalty rates and discount rates.
In
2018
and
2017
, there were no events that occurred or circumstances that changed that would have required a review other than as of our annual test date. In
2018
and
2017
, there were no impairment charges recorded.
Defined benefit retirement plans —
The plan obligations and related assets of the defined benefit retirement plans are presented in Note 16 of the Notes to Consolidated Financial Statements in Part II, Item 8, “Financial Statements and Supplementary Data.” Level 1 assets are valued using unadjusted quoted prices for identical assets in active markets. Level 2 assets are valued using quoted prices or other observable inputs for similar assets. Level 3 assets are valued using unobservable inputs, but reflect the assumptions market participants would use in pricing the assets. Plan obligations and the annual pension expense are determined after consulting with actuaries on a number of key assumptions and on information provided by the Company. Key assumptions in the determination of the annual pension expense include the discount rate, the rate of salary increases and the estimated future return on plan assets. To the extent actual amounts differ from these assumptions and estimated amounts, results could be adversely affected.
The Society of Actuaries releases annual updates to mortality tables, which update life expectancy assumptions. IDEX adopts these annual updates and, in consideration of these tables, we modified the mortality assumptions used in determining our pension and post-retirement benefit obligations as of
December 31, 2018
, which will have a related impact on our annual benefit expense in future years. New mortality tables may result in additional funding requirements dependent upon the funded status of our plans. These expectations presume all other assumptions remain constant and there are no changes to applicable funding regulations.
Changes in the discount rate assumptions will impact the (gain) loss amortization and interest cost components of the projected benefit obligation (“PBO”), which in turn, may impact the Company’s funding decisions if the PBO exceeds plan assets. Each 100 basis point increase in the discount rate will cause a corresponding decrease in the PBO of approximately $25 million based
27
upon the
December 31, 2018
data. Each 100 basis point decrease in the discount rate will cause a corresponding increase in the PBO of approximately $31 million based upon the
December 31, 2018
data.
Item 7A.
Quantitative and Qualitative Disclosures About Market Risk.
The Company is subject to market risk associated with changes in foreign currency exchange rates and interest rates. The Company may, from time to time, enter into foreign currency forward contracts and interest rate swaps on its debt when it believes there is a financial advantage in doing so. A treasury risk management policy, adopted by the Board of Directors, describes the procedures and controls over derivative financial and commodity instruments, including foreign currency forward contracts and interest rate swaps. Under the policy, the Company does not use financial or commodity derivative instruments for trading purposes, and the use of these instruments is subject to strict approvals by senior officers. Typically, the use of derivative instruments is limited to foreign currency forward contracts and interest rate swaps on the Company’s outstanding long-term debt. As of December 31, 2018, the Company did not have any derivative instruments outstanding.
Foreign Currency Exchange Rates
The Company’s foreign currency exchange rate risk is limited principally to the Euro, Swiss Franc, British Pound, Canadian Dollar, Indian Rupee and Chinese Renminbi. The Company manages its foreign exchange risk principally through invoicing customers in the same currency as the source of products. The foreign currency transaction (gains) losses for the years ending
December 31, 2018
,
2017
and
2016
were
$(2.4) million
,
$20.5 million
, and
$(6.2) million
, respectively, and are reported within Other (income) expense-net in the Consolidated Statements of Operations. Of the $(2.4) million and $20.5 million reported as foreign currency transaction (gains) losses for the years ending December 31, 2018 and 2017, $0.9 million and $20.2 million, respectively, were due to intercompany loans established in conjunction with the SFC Koenig acquisition. See Note 7 in Part II, Item 8, “Financial Statements and Supplementary Data,” for further discussion.
Interest Rate Fluctuations
The Company does not have significant interest rate exposure due to substantially all of the
$851,078
of debt outstanding as of
December 31, 2018
being fixed rate debt.
28
Item 8.
Financial Statements and Supplementary Data.
MANAGEMENT’S REPORT ON INTERNAL CONTROL OVER FINANCIAL REPORTING
Our management is responsible for establishing and maintaining adequate internal control over financial reporting. Internal control over financial reporting is a process to provide reasonable assurance regarding the reliability of financial reporting and the preparation of financial statements for external purposes in accordance with accounting principles generally accepted in the United States of America, and as defined in Exchange Act Rule 13a-15(f).
Internal control over financial reporting cannot provide absolute assurance of achieving financial reporting objectives because of its inherent limitations. Because of such limitations, there is a risk that material misstatements may not be prevented or detected on a timely basis by internal control over financial reporting.
Management has used the framework set forth in the report entitled “Internal Control — Integrated Framework” (2013) issued by the Committee of Sponsoring Organizations of the Treadway Commission to assess the effectiveness of the Company’s internal control over financial reporting. Based on that assessment, management has concluded that the Company’s internal control over financial reporting was effective as of
December 31, 2018
.
The effectiveness of the Company’s internal control over financial reporting as of
December 31, 2018
, has been audited by Deloitte & Touche LLP, an independent registered public accounting firm, as stated in their report which appears herein.
29
REPORT OF INDEPENDENT REGISTERED PUBLIC ACCOUNTING FIRM
To the shareholders and the Board of Directors of IDEX Corporation
Opinion on Internal Control over Financial Reporting
We have audited the internal control over financial reporting of IDEX Corporation and subsidiaries (the “Company”) as of
December 31, 2018
, based on criteria established in
Internal Control - Integrated Framework (2013)
issued by the Committee of Sponsoring Organizations of the Treadway Commission (COSO). In our opinion, the Company maintained, in all material respects, effective internal control over financial reporting as of
December 31, 2018
, based on criteria established in
Internal Control - Integrated Framework (2013)
issued by COSO.
We have also audited, in accordance with the standards of the Public Company Accounting Oversight Board (United States) (PCAOB), the consolidated financial statements as of and for the year ended
December 31, 2018
, of the Company and our report dated
February 28, 2019
, expressed an unqualified opinion on those financial statements.
Basis for Opinion
The Company’s management is responsible for maintaining effective internal control over financial reporting and for its assessment of the effectiveness of internal control over financial reporting, included in the accompanying Management’s Report on Internal Control Over Financial Reporting. Our responsibility is to express an opinion on the Company’s internal control over financial reporting based on our audit. We are a public accounting firm registered with the PCAOB and are required to be independent with respect to the Company in accordance with the U.S. federal securities laws and the applicable rules and regulations of the Securities and Exchange Commission and the PCAOB.
We conducted our audit in accordance with the standards of the PCAOB. Those standards require that we plan and perform the audit to obtain reasonable assurance about whether effective internal control over financial reporting was maintained in all material respects. Our audit included obtaining an understanding of internal control over financial reporting, assessing the risk that a material weakness exists, testing and evaluating the design and operating effectiveness of internal control based on the assessed risk, and performing such other procedures as we considered necessary in the circumstances. We believe that our audit provides a reasonable basis for our opinion.
Definition and Limitations of Internal Control over Financial Reporting
A company’s internal control over financial reporting is a process designed to provide reasonable assurance regarding the reliability of financial reporting and the preparation of financial statements for external purposes in accordance with generally accepted accounting principles. A company’s internal control over financial reporting includes those policies and procedures that (1) pertain to the maintenance of records that, in reasonable detail, accurately and fairly reflect the transactions and dispositions of the assets of the company; (2) provide reasonable assurance that transactions are recorded as necessary to permit preparation of financial statements in accordance with generally accepted accounting principles, and that receipts and expenditures of the company are being made only in accordance with authorizations of management and directors of the company; and (3) provide reasonable assurance regarding prevention or timely detection of unauthorized acquisition, use, or disposition of the company’s assets that could have a material effect on the financial statements.
Because of its inherent limitations, internal control over financial reporting may not prevent or detect misstatements. Also, projections of any evaluation of effectiveness to future periods are subject to the risk that controls may become inadequate because of changes in conditions, or that the degree of compliance with the policies or procedures may deteriorate.
|
/s/ DELOITTE & TOUCHE LLP
|
|
|
Chicago, Illinois
|
|
|
February 28, 2019
|
|
30
REPORT OF INDEPENDENT REGISTERED PUBLIC ACCOUNTING FIRM
To the shareholders and the Board of Directors of IDEX Corporation
Opinion on the Financial Statements
We have audited the accompanying consolidated balance sheets of IDEX Corporation and subsidiaries (the "Company") as of
December 31, 2018
and
2017
, the related consolidated statements of operations, comprehensive income, shareholders’ equity, and cash flows, for each of the three years in the period ended
December 31, 2018
, and the related notes (collectively referred to as the "financial statements"). In our opinion, the financial statements present fairly, in all material respects, the financial position of the Company as of
December 31, 2018
and
2017
, and the results of its operations and its cash flows for each of the three years in the period ended
December 31, 2018
, in conformity with accounting principles generally accepted in the United States of America.
We have also audited, in accordance with the standards of the Public Company Accounting Oversight Board (United States) (PCAOB), the Company's internal control over financial reporting as of
December 31, 2018
, based on criteria established in
Internal Control - Integrated Framework (2013)
issued by the Committee of Sponsoring Organizations of the Treadway Commission and our report dated
February 28, 2019
, expressed an unqualified opinion on the Company's internal control over financial reporting.
Basis for Opinion
These financial statements are the responsibility of the Company's management. Our responsibility is to express an opinion on the Company's financial statements based on our audits. We are a public accounting firm registered with the PCAOB and are required to be independent with respect to the Company in accordance with the U.S. federal securities laws and the applicable rules and regulations of the Securities and Exchange Commission and the PCAOB.
We conducted our audits in accordance with the standards of the PCAOB. Those standards require that we plan and perform the audit to obtain reasonable assurance about whether the financial statements are free of material misstatement, whether due to error or fraud. Our audits included performing procedures to assess the risks of material misstatement of the financial statements, whether due to error or fraud, and performing procedures that respond to those risks. Such procedures included examining, on a test basis, evidence regarding the amounts and disclosures in the financial statements. Our audits also included evaluating the accounting principles used and significant estimates made by management, as well as evaluating the overall presentation of the financial statements. We believe that our audits provide a reasonable basis for our opinion.
|
/s/ DELOITTE & TOUCHE LLP
|
|
|
Chicago, Illinois
|
|
|
February 28, 2019
|
|
We have served as the Company’s auditor since 1987.
31
IDEX CORPORATION
CONSOLIDATED BALANCE SHEETS
|
|
As of December 31,
|
||||||
|
|
2018
|
2017
|
|||||
|
|
(In thousands except share and
per share amounts)
|
||||||
|
ASSETS
|
|||||||
|
Current assets
|
|||||||
|
Cash and cash equivalents
|
$
|
466,407
|
|
$
|
375,950
|
|
|
|
Receivables - net
|
312,192
|
|
294,166
|
|
|||
|
Inventories
|
279,995
|
|
259,724
|
|
|||
|
Other current assets
|
33,938
|
|
74,203
|
|
|||
|
Total current assets
|
1,092,532
|
|
1,004,043
|
|
|||
|
Property, plant and equipment - net
|
281,220
|
|
258,350
|
|
|||
|
Goodwill
|
1,697,955
|
|
1,704,158
|
|
|||
|
Intangible assets - net
|
383,327
|
|
414,746
|
|
|||
|
Other noncurrent assets
|
18,823
|
|
18,331
|
|
|||
|
Total assets
|
$
|
3,473,857
|
|
$
|
3,399,628
|
|
|
|
LIABILITIES AND SHAREHOLDERS’ EQUITY
|
|||||||
|
Current liabilities
|
|||||||
|
Trade accounts payable
|
$
|
143,196
|
|
$
|
147,067
|
|
|
|
Accrued expenses
|
187,536
|
|
184,705
|
|
|||
|
Short-term borrowings
|
483
|
|
258
|
|
|||
|
Dividends payable
|
33,446
|
|
28,945
|
|
|||
|
Total current liabilities
|
364,661
|
|
360,975
|
|
|||
|
Long-term borrowings
|
848,335
|
|
858,788
|
|
|||
|
Deferred income taxes
|
128,007
|
|
137,638
|
|
|||
|
Other noncurrent liabilities
|
138,214
|
|
155,685
|
|
|||
|
Total liabilities
|
1,479,217
|
|
1,513,086
|
|
|||
|
Commitments and contingencies (Note 9)
|
|
|
|||||
|
Shareholders’ equity
|
|||||||
|
Preferred stock:
|
|||||||
|
Authorized: 5,000,000 shares, $.01 per share par value; Issued: none
|
—
|
|
—
|
|
|||
|
Common stock:
|
|||||||
|
Authorized: 150,000,000 shares, $.01 per share par value; Issued: 90,112,028 shares at December 31, 2018 and 90,162,211 shares at December 31, 2017
|
901
|
|
902
|
|
|||
|
Additional paid-in capital
|
738,339
|
|
716,906
|
|
|||
|
Retained earnings
|
2,342,079
|
|
2,057,915
|
|
|||
|
Treasury stock at cost: 14,159,251 shares at December 31, 2018 and 13,468,675 shares at December 31, 2017
|
(957,454
|
)
|
(799,674
|
)
|
|||
|
Accumulated other comprehensive loss
|
(129,225
|
)
|
(89,507
|
)
|
|||
|
Total shareholders’ equity
|
1,994,640
|
|
1,886,542
|
|
|||
|
Total liabilities and shareholders’ equity
|
$
|
3,473,857
|
|
$
|
3,399,628
|
|
|
See Notes to Consolidated Financial Statements.
32
IDEX CORPORATION
CONSOLIDATED STATEMENTS OF OPERATIONS
|
|
For the Year Ended December 31,
|
||||||||||
|
|
2018
|
2017
|
2016
|
||||||||
|
|
(In thousands except per share amounts)
|
||||||||||
|
Net sales
|
$
|
2,483,666
|
|
$
|
2,287,312
|
|
$
|
2,113,043
|
|
||
|
Cost of sales
|
1,365,771
|
|
1,260,634
|
|
1,182,276
|
|
|||||
|
Gross profit
|
1,117,895
|
|
1,026,678
|
|
930,767
|
|
|||||
|
Selling, general and administrative expenses
|
536,724
|
|
524,940
|
|
492,398
|
|
|||||
|
Loss (gain) on sale of businesses - net
|
—
|
|
(9,273
|
)
|
22,298
|
|
|||||
|
Restructuring expenses
|
12,083
|
|
8,455
|
|
3,674
|
|
|||||
|
Operating income
|
569,088
|
|
502,556
|
|
412,397
|
|
|||||
|
Other (income) expense - net
|
(3,985
|
)
|
2,394
|
|
(1,731
|
)
|
|||||
|
Interest expense
|
44,134
|
|
44,889
|
|
45,616
|
|
|||||
|
Income before income taxes
|
528,939
|
|
455,273
|
|
368,512
|
|
|||||
|
Provision for income taxes
|
118,366
|
|
118,016
|
|
97,403
|
|
|||||
|
Net income
|
$
|
410,573
|
|
$
|
337,257
|
|
$
|
271,109
|
|
||
|
Earnings per common share:
|
|||||||||||
|
Basic earnings per common share
|
$
|
5.36
|
|
$
|
4.41
|
|
$
|
3.57
|
|
||
|
Diluted earnings per common share
|
$
|
5.29
|
|
$
|
4.36
|
|
$
|
3.53
|
|
||
|
Share data:
|
|||||||||||
|
Basic weighted average common shares outstanding
|
76,412
|
|
76,232
|
|
75,803
|
|
|||||
|
Diluted weighted average common shares outstanding
|
77,563
|
|
77,333
|
|
76,758
|
|
|||||
See Notes to Consolidated Financial Statements.
33
IDEX CORPORATION
CONSOLIDATED STATEMENTS OF COMPREHENSIVE INCOME
|
|
For the Year Ended December 31,
|
||||||||||
|
|
2018
|
2017
|
2016
|
||||||||
|
|
(In thousands)
|
||||||||||
|
Net income
|
$
|
410,573
|
|
$
|
337,257
|
|
$
|
271,109
|
|
||
|
Other comprehensive income (loss):
|
|||||||||||
|
Reclassification adjustments for derivatives, net of tax
|
5,006
|
|
4,210
|
|
4,361
|
|
|||||
|
Pension and other postretirement adjustments, net of tax
|
9,825
|
|
(1,302
|
)
|
3,049
|
|
|||||
|
Foreign currency adjustments:
|
|||||||||||
|
Cumulative translation adjustment
|
(48,114
|
)
|
110,421
|
|
(76,822
|
)
|
|||||
|
Tax effect of reversal of indefinite assertion on certain intercompany loans
|
—
|
|
(3,932
|
)
|
—
|
|
|||||
|
Reclassification of foreign currency translation to earnings upon sale of businesses
|
—
|
|
2,749
|
|
14,257
|
|
|||||
|
Other comprehensive income (loss)
|
(33,283
|
)
|
112,146
|
|
(55,155
|
)
|
|||||
|
Comprehensive income
|
$
|
377,290
|
|
$
|
449,403
|
|
$
|
215,954
|
|
||
See Notes to Consolidated Financial Statements.
34
IDEX CORPORATION
CONSOLIDATED STATEMENTS OF SHAREHOLDERS’ EQUITY
|
|
Common
Stock and
Additional
Paid-In Capital
|
Retained
Earnings
|
Accumulated Other Comprehensive
Income (Loss)
|
Treasury
Stock
|
Total
Shareholders’
Equity
|
||||||||||||||||||||||
|
|
Cumulative
Translation
Adjustment
|
Retirement
Benefits
Adjustments
|
Cumulative
Unrealized
Gain (Loss) on
Derivatives
|
||||||||||||||||||||||||
|
|
(In thousands except share and per share amounts)
|
||||||||||||||||||||||||||
|
Balance, December 31, 2015
|
$
|
680,525
|
|
$
|
1,666,680
|
|
$
|
(92,979
|
)
|
$
|
(30,901
|
)
|
$
|
(22,618
|
)
|
$
|
(757,416
|
)
|
$
|
1,443,291
|
|
||||||
|
Net income
|
—
|
|
271,109
|
|
—
|
|
—
|
|
—
|
|
—
|
|
271,109
|
|
|||||||||||||
|
Cumulative translation adjustment
|
—
|
|
—
|
|
(62,565
|
)
|
—
|
|
—
|
|
—
|
|
(62,565
|
)
|
|||||||||||||
|
Net change in retirement obligations (net of tax of $2,107)
|
—
|
|
—
|
|
—
|
|
3,049
|
|
—
|
|
—
|
|
3,049
|
|
|||||||||||||
|
Net change on derivatives designated as cash flow hedges (net of tax of $2,490)
|
—
|
|
—
|
|
—
|
|
—
|
|
4,361
|
|
—
|
|
4,361
|
|
|||||||||||||
|
Issuance of 594,919 shares of common stock from issuance of unvested shares, performance share units and exercise of stock options (net of tax of $5,305)
|
253
|
|
—
|
|
—
|
|
—
|
|
—
|
|
29,987
|
|
30,240
|
|
|||||||||||||
|
Repurchase of 738,593 shares of common stock
|
—
|
|
(54,950
|
)
|
(54,950
|
)
|
|||||||||||||||||||||
|
Share-based compensation
|
17,337
|
|
—
|
|
—
|
|
—
|
|
—
|
|
—
|
|
17,337
|
|
|||||||||||||
|
Shares surrendered for tax withholding
|
—
|
|
—
|
|
—
|
|
—
|
|
—
|
|
(4,928
|
)
|
(4,928
|
)
|
|||||||||||||
|
Cash dividends declared - $1.36 per common share outstanding
|
—
|
|
(103,050
|
)
|
—
|
|
—
|
|
—
|
|
—
|
|
(103,050
|
)
|
|||||||||||||
|
Balance, December 31, 2016
|
$
|
698,115
|
|
$
|
1,834,739
|
|
$
|
(155,544
|
)
|
$
|
(27,852
|
)
|
$
|
(18,257
|
)
|
$
|
(787,307
|
)
|
$
|
1,543,894
|
|
||||||
|
Net income
|
—
|
|
337,257
|
|
—
|
|
—
|
|
—
|
|
—
|
|
337,257
|
|
|||||||||||||
|
Cumulative translation adjustment
|
—
|
|
—
|
|
113,170
|
|
—
|
|
—
|
|
—
|
|
113,170
|
|
|||||||||||||
|
Net change in retirement obligations (net of tax of $239)
|
—
|
|
—
|
|
—
|
|
(1,302
|
)
|
—
|
|
—
|
|
(1,302
|
)
|
|||||||||||||
|
Net change on derivatives designated as cash flow hedges (net of tax of $2,445)
|
—
|
|
—
|
|
—
|
|
—
|
|
4,210
|
|
—
|
|
4,210
|
|
|||||||||||||
|
Issuance of 557,591 shares of common stock from issuance of unvested shares, performance share units and exercise of stock options (net of tax of $6,027)
|
—
|
|
—
|
|
—
|
|
—
|
|
—
|
|
22,935
|
|
22,935
|
|
|||||||||||||
|
Repurchase of 266,000 shares of common stock
|
—
|
|
—
|
|
—
|
|
—
|
|
—
|
|
(29,074
|
)
|
(29,074
|
)
|
|||||||||||||
|
Share-based compensation
|
19,693
|
|
—
|
|
—
|
|
—
|
|
—
|
|
—
|
|
19,693
|
|
|||||||||||||
|
Shares surrendered for tax withholding
|
—
|
|
—
|
|
—
|
|
—
|
|
—
|
|
(6,228
|
)
|
(6,228
|
)
|
|||||||||||||
|
Tax effect of reversal of indefinite assertion on certain intercompany loans
|
—
|
|
—
|
|
(3,932
|
)
|
—
|
|
—
|
|
—
|
|
(3,932
|
)
|
|||||||||||||
|
Cash dividends declared - $1.48 per common share outstanding
|
—
|
|
(114,081
|
)
|
—
|
|
—
|
|
—
|
|
—
|
|
(114,081
|
)
|
|||||||||||||
|
Balance, December 31, 2017
|
$
|
717,808
|
|
$
|
2,057,915
|
|
$
|
(46,306
|
)
|
$
|
(29,154
|
)
|
$
|
(14,047
|
)
|
$
|
(799,674
|
)
|
$
|
1,886,542
|
|
||||||
|
Net income
|
—
|
|
410,573
|
|
—
|
|
—
|
|
—
|
|
—
|
|
410,573
|
|
|||||||||||||
|
Adjustment for adoption of ASU 2016-16
|
—
|
|
(645
|
)
|
—
|
|
—
|
|
—
|
|
—
|
|
(645
|
)
|
|||||||||||||
|
Adjustment for adoption of ASU 2018-02
|
—
|
|
6,435
|
|
—
|
|
(3,411
|
)
|
(3,024
|
)
|
—
|
|
—
|
|
|||||||||||||
|
Cumulative translation adjustment
|
—
|
|
—
|
|
(48,114
|
)
|
—
|
|
—
|
|
—
|
|
(48,114
|
)
|
|||||||||||||
|
Net change in retirement obligations (net of tax of $3,076)
|
—
|
|
—
|
|
—
|
|
9,825
|
|
—
|
|
—
|
|
9,825
|
|
|||||||||||||
|
Net change on derivatives designated as cash flow hedges (net of tax of $1,469)
|
—
|
|
—
|
|
—
|
|
—
|
|
5,006
|
|
—
|
|
5,006
|
|
|||||||||||||
|
Issuance of 583,385 shares of common stock from issuance of unvested shares, performance share units and exercise of stock options (net of tax of $4,267)
|
—
|
|
—
|
|
—
|
|
—
|
|
—
|
|
27,701
|
|
27,701
|
|
|||||||||||||
|
Repurchase of 1,273,961 shares of common stock
|
—
|
|
—
|
|
—
|
|
—
|
|
—
|
|
(173,926
|
)
|
(173,926
|
)
|
|||||||||||||
|
Share-based compensation
|
21,432
|
|
—
|
|
—
|
|
—
|
|
—
|
|
—
|
|
21,432
|
|
|||||||||||||
|
Shares surrendered for tax withholding
|
—
|
|
—
|
|
—
|
|
—
|
|
—
|
|
(11,555
|
)
|
(11,555
|
)
|
|||||||||||||
|
Cash dividends declared - $1.72 per common share outstanding
|
—
|
|
(132,199
|
)
|
—
|
|
—
|
|
—
|
|
—
|
|
(132,199
|
)
|
|||||||||||||
|
Balance, December 31, 2018
|
$
|
739,240
|
|
$
|
2,342,079
|
|
$
|
(94,420
|
)
|
$
|
(22,740
|
)
|
$
|
(12,065
|
)
|
$
|
(957,454
|
)
|
$
|
1,994,640
|
|
||||||
See Notes to Consolidated Financial Statements.
35
IDEX CORPORATION
CONSOLIDATED STATEMENTS OF CASH FLOWS
|
|
For the Year Ended December 31,
|
||||||||||
|
|
2018
|
2017
|
2016
|
||||||||
|
|
(In thousands)
|
||||||||||
|
Cash flows from operating activities
|
|||||||||||
|
Net income
|
$
|
410,573
|
|
$
|
337,257
|
|
$
|
271,109
|
|
||
|
Adjustments to reconcile net income to net cash provided by operating activities:
|
|||||||||||
|
Loss (gain) on sale of fixed assets - net
|
946
|
|
315
|
|
(28
|
)
|
|||||
|
Loss (gain) on sale of businesses - net
|
—
|
|
(9,273
|
)
|
22,298
|
|
|||||
|
Asset impairments
|
—
|
|
—
|
|
205
|
|
|||||
|
Depreciation and amortization
|
39,049
|
|
38,314
|
|
37,854
|
|
|||||
|
Amortization of intangible assets
|
38,495
|
|
45,902
|
|
49,038
|
|
|||||
|
Amortization of debt issuance expenses
|
1,332
|
|
1,320
|
|
1,295
|
|
|||||
|
Share-based compensation expense
|
24,754
|
|
24,405
|
|
20,326
|
|
|||||
|
Deferred income taxes
|
(4,345
|
)
|
(33,742
|
)
|
(17,308
|
)
|
|||||
|
Non-cash interest expense associated with forward starting swaps
|
6,475
|
|
6,655
|
|
6,851
|
|
|||||
|
Pension settlement
|
—
|
|
—
|
|
3,554
|
|
|||||
|
Changes in (net of the effect from acquisitions and divestitures):
|
|||||||||||
|
Receivables
|
(23,419
|
)
|
(15,803
|
)
|
302
|
|
|||||
|
Inventories
|
(23,031
|
)
|
760
|
|
32,747
|
|
|||||
|
Other current assets
|
25,162
|
|
(20,031
|
)
|
(22,006
|
)
|
|||||
|
Trade accounts payable
|
(1,220
|
)
|
12,556
|
|
73
|
|
|||||
|
Accrued expenses
|
4,148
|
|
19,710
|
|
(5,470
|
)
|
|||||
|
Other - net
|
(19,574
|
)
|
24,408
|
|
(923
|
)
|
|||||
|
Net cash flows provided by operating activities
|
479,345
|
|
432,753
|
|
399,917
|
|
|||||
|
Cash flows from investing activities
|
|||||||||||
|
Purchases of property, plant and equipment
|
(56,089
|
)
|
(43,858
|
)
|
(38,242
|
)
|
|||||
|
Purchase of intellectual property
|
(4,000
|
)
|
—
|
|
—
|
|
|||||
|
Acquisition of businesses, net of cash acquired
|
(20,205
|
)
|
(38,161
|
)
|
(510,001
|
)
|
|||||
|
Proceeds from disposal of fixed assets
|
363
|
|
6,011
|
|
49
|
|
|||||
|
Proceeds from sale of businesses, net of cash sold
|
—
|
|
21,795
|
|
39,064
|
|
|||||
|
Other - net
|
(1,500
|
)
|
(533
|
)
|
(69
|
)
|
|||||
|
Net cash flows used in investing activities
|
(81,431
|
)
|
(54,746
|
)
|
(509,199
|
)
|
|||||
|
Cash flows from financing activities
|
|||||||||||
|
Borrowings under revolving credit facilities
|
—
|
|
33,000
|
|
501,529
|
|
|||||
|
Proceeds from issuance of 3.20% Senior Notes
|
—
|
|
—
|
|
100,000
|
|
|||||
|
Proceeds from issuance of 3.37% Senior Notes
|
—
|
|
—
|
|
100,000
|
|
|||||
|
Payments under revolving credit facilities
|
(11,284
|
)
|
(200,618
|
)
|
(520,125
|
)
|
|||||
|
Debt issuance costs
|
—
|
|
—
|
|
(246
|
)
|
|||||
|
Dividends paid
|
(127,478
|
)
|
(111,172
|
)
|
(102,650
|
)
|
|||||
|
Proceeds from stock option exercises
|
27,639
|
|
22,935
|
|
30,240
|
|
|||||
|
Purchases of common stock
|
(173,926
|
)
|
(29,074
|
)
|
(57,272
|
)
|
|||||
|
Shares surrendered for tax withholding
|
(11,555
|
)
|
(6,228
|
)
|
(4,928
|
)
|
|||||
|
Settlement of foreign exchange contracts
|
6,593
|
|
13,736
|
|
—
|
|
|||||
|
Net cash flows provided by (used in) financing activities
|
(290,011
|
)
|
(277,421
|
)
|
46,548
|
|
|||||
|
Effect of exchange rate changes on cash and cash equivalents
|
(17,446
|
)
|
39,400
|
|
(29,320
|
)
|
|||||
|
Net increase (decrease) in cash
|
90,457
|
|
139,986
|
|
(92,054
|
)
|
|||||
|
Cash and cash equivalents at beginning of year
|
375,950
|
|
235,964
|
|
328,018
|
|
|||||
|
Cash and cash equivalents at end of year
|
$
|
466,407
|
|
$
|
375,950
|
|
$
|
235,964
|
|
||
|
Supplemental cash flow information
|
|||||||||||
|
Cash paid for:
|
|||||||||||
|
Interest
|
$
|
36,327
|
|
$
|
36,818
|
|
$
|
37,067
|
|
||
|
Income taxes - net
|
90,733
|
|
104,852
|
|
109,399
|
|
|||||
|
Significant non-cash activities:
|
|||||||||||
|
Contingent consideration for acquisition
|
3,375
|
|
—
|
|
—
|
|
|||||
|
Capital expenditures for construction of new leased facility
|
11,616
|
|
—
|
|
—
|
|
|||||
See Notes to Consolidated Financial Statements.
36
IDEX CORPORATION
NOTES TO CONSOLIDATED FINANCIAL STATEMENTS
1.
Significant Accounting Policies
Business
IDEX is an applied solutions company specializing in the manufacture of fluid and metering technologies, health and science technologies and fire, safety and other diversified products built to customers’ specifications. IDEX’s products are sold in niche markets across a wide range of industries throughout the world. The Company’s products include industrial pumps, compressors, flow meters, injectors, valves and related controls for use in a wide variety of process applications; precision fluidics solutions, including pumps, valves, degassing equipment, corrective tubing, fittings and complex manifolds, optical filters and specialty medical equipment and devices for use in life science applications; precision-engineered equipment for dispensing, metering and mixing paints; and engineered products for industrial and commercial markets, including fire and rescue, transportation equipment, oil and gas, electronics and communications. These activities are grouped into
three
reportable segments: Fluid & Metering Technologies, Health & Science Technologies and Fire & Safety/Diversified Products.
Principles of Consolidation
The consolidated financial statements include the Company and its subsidiaries. All intercompany transactions and accounts have been eliminated.
Use of Estimates
The preparation of financial statements in conformity with accounting principles generally accepted in the United States of America (“U.S. GAAP”) requires management to make estimates and judgments that affect the reported amounts of assets and liabilities, disclosure of contingent assets and liabilities and reported amounts of revenue and expenses during the reporting period. Actual results could differ from those estimates. The principal areas of estimation reflected in the financial statements are revenue recognition, sales returns and allowances, allowance for doubtful accounts, inventory valuation, recoverability of long-lived assets, valuation of goodwill and intangible assets, income taxes, product warranties, contingencies and litigation, insurance-related items, defined benefit retirement plans and purchase accounting related to acquisitions.
Revenue Recognition
Revenue is recognized when control of the promised products or services is transferred to our customers in an amount that reflects the consideration we expect to be entitled to in exchange for transferring those products or providing those services. A performance obligation is a promise in a contract to transfer a distinct product or service to the customer. A contract’s transaction price is allocated to each distinct performance obligation and recognized as revenue when, or as, the performance obligation is satisfied. Our performance obligations are satisfied at a point in time or over time as work progresses. Revenue from products and services transferred to customers at a point in time is recognized when obligations under the terms of the contract with our customer are satisfied. Generally, this occurs with the transfer of control of the asset, which is in line with shipping terms. Certain units recognize revenue over time because control transfers continuously to our customers. Revenue is recognized over time as work is performed based on the relationship between actual costs incurred to date for each contract and the total estimated costs for such contract at completion of the performance obligation (i.e. the cost-to-cost method) or is recognized ratably over the contract term. As a significant change in one or more of these estimates could affect the profitability of our contracts, we review and update our estimates regularly. Due to uncertainties inherent in the estimation process, it is reasonably possible that completion costs will be revised. Such revisions to costs and income are recognized in the period in which the revisions are determined as a cumulative catch-up adjustment. The impact of the adjustment on profit recorded to date on a contract is recognized in the period the adjustment is identified. If at any time the estimate of contract profitability indicates an anticipated loss on the contract, we recognize provisions for estimated losses on uncompleted contracts in the period in which such losses are determined.
The Company records allowances for discounts, product returns and customer incentives at the time of sale as a reduction of revenue as such allowances can be reliably estimated based on historical experience and known trends. The Company also offers product warranties (primarily assurance-type) and accrues its estimated exposure for warranty claims at the time of sale based upon the length of the warranty period, warranty costs incurred and any other related information known to the Company.
The Company’s other revenue not accounted for under Accounting Standards Codification 606,
Revenue from Contracts with Customers
(“ASC 606”), is not material to its results of operations.
37
Shipping and Handling Costs
Shipping and handling costs are included in Cost of sales and are recognized as a period expense during the period in which they are incurred.
Advertising Costs
Advertising costs of
$17.0 million
,
$15.8 million
and
$15.3 million
for
2018
,
2017
and
2016
, respectively, are expensed as incurred within Selling, general and administrative expenses.
Cash and Cash Equivalents
The Company considers all highly liquid instruments purchased with an original maturity of
3 months or less
to be cash and cash equivalents.
Accounts Receivable and Allowance for Doubtful Accounts
Accounts receivable are recorded at face amounts less an allowance for doubtful accounts. The Company maintains an allowance for doubtful accounts for estimated losses as a result of customers’ inability to make required payments. Management evaluates the aging of the accounts receivable balances, the financial condition of its customers, historical trends and the time outstanding of specific balances to estimate the amount of accounts receivable that may not be collected in the future and records the appropriate provision.
Inventories
The Company states inventories at the lower of cost or net realizable value. Cost, which includes material, labor and factory overhead, is determined on a FIFO basis. We make adjustments to reduce the cost of inventory to its net realizable value, if required, for estimated excess, obsolete or impaired balances. Factors influencing these adjustments include changes in market demand, product life cycle and engineering changes.
Impairment of Long-Lived Assets
A long-lived asset is reviewed for impairment if an event occurs or circumstances change that would more likely than not reduce the fair value of a long-lived asset below its carrying amount, as measured by comparing its net book value to the projected undiscounted future cash flows generated by its use. A long-lived asset impairment exists when the carrying amount of the asset exceeds its fair value. The amount and
timing of the impairment charge for this asset requires the estimation of future cash flows to determine the fair value of the asset. An impaired asset is recorded at its estimated fair value based on a discounted cash flow analysis. In
2018
and
2017
, the Company concluded that there were no long-lived assets with a fair value that was less than the carrying value. In
2016
, the Company concluded that certain long-lived assets had a fair value that was less than the carrying value of the assets, resulting in
$0.2 million
, respectively, of long-lived asset impairment charges.
Goodwill and Indefinite-Lived Intangible Assets
The Company reviews the carrying value of goodwill and indefinite-lived intangible assets annually as of October 31, or if an event occurs or circumstances change that would more likely than not reduce the fair value of a reporting unit below its carrying value. The Company evaluates the recoverability of these assets based on the estimated fair value of each of the
13
reporting units and the indefinite-lived intangible assets. See Note 5 for a further discussion on goodwill and intangible assets.
Borrowing Expenses
Expenses incurred in securing and issuing debt are capitalized and included as a reduction of Long-term borrowings. These amounts are amortized over the life of the related borrowing and the related amortization is included in Interest expense.
Earnings per Common Share
Earnings per common share (“EPS”) is computed by dividing net income by the weighted average number of shares of common stock (basic) plus common stock equivalents (diluted) outstanding during the year. Common stock equivalents consist of stock
38
options, which have been included in the calculation of weighted average shares outstanding using the treasury stock method, restricted stock and performance share units.
ASC 260,
Earnings per Share
, concludes that all outstanding unvested share-based payment awards that contain rights to nonforfeitable dividends participate in undistributed earnings with common shareholders. If awards are considered participating securities, the Company is required to apply the two-class method of computing basic and diluted earnings per share. The Company has determined that its outstanding shares of restricted stock are participating securities. Accordingly, EPS was computed using the two-class method prescribed by ASC 260.
Basic weighted average shares outstanding reconciles to diluted weighted average shares outstanding as follows:
|
2018
|
2017
|
2016
|
||||||
|
|
(In thousands)
|
|||||||
|
Basic weighted average common shares outstanding
|
76,412
|
|
76,232
|
|
75,803
|
|
||
|
Dilutive effect of stock options, restricted stock and performance share units
|
1,151
|
|
1,101
|
|
955
|
|
||
|
Diluted weighted average common shares outstanding
|
77,563
|
|
77,333
|
|
76,758
|
|
||
Options to purchase approximately
0.3 million
,
zero
and
0.9 million
shares of common stock in
2018
,
2017
and
2016
, respectively, were not included in the computation of diluted EPS because the effect of their inclusion would have been antidilutive.
Share-Based Compensation
The Company accounts for share-based payments in accordance with ASC 718,
Compensation-Stock Compensation
. Accordingly, the Company expenses the fair value of awards made under its share-based compensation plans. That cost is recognized in the consolidated financial statements over the requisite service period of the grants. See Note 14 for further discussion on share-based compensation.
Depreciation and Amortization
Property and equipment are stated at cost, with depreciation and amortization provided using the straight-line method over the following estimated useful lives:
|
Land improvements
|
8 to 12 years
|
|
Buildings and improvements
|
8 to 30 years
|
|
Machinery, equipment and other
|
3 to 12 years
|
|
Office and transportation equipment
|
3 to 10 years
|
Certain identifiable intangible assets are amortized over their estimated useful lives using the straight-line method. The estimated useful lives used in the computation of amortization of identifiable intangible assets are as follows:
|
Patents
|
5 to 17 years
|
|
Trade names
|
5 to 20 years
|
|
Customer relationships
|
6 to 20 years
|
|
Unpatented technology and other
|
7 to 20 years
|
Research and Development Expenditures
Costs associated with engineering activities, including research and development, are expensed in the period incurred and are included in Cost of sales.
Total engineering expenses, which include research and development as well as application and support engineering, were
$84.9 million
,
$76.4 million
and
$68.8 million
in
2018
,
2017
and
2016
, respectively. Research and development expenses, which include costs associated with developing new products and major improvements to existing products, were
$48.0 million
,
$42.4 million
and
$39.4 million
in
2018
,
2017
and
2016
, respectively.
39
Foreign Currency
The functional currency of substantially all operations outside the United States is the respective local currency. Accordingly, those foreign currency balance sheet accounts have been translated using the exchange rates in effect as of the balance sheet date. Income statement amounts have been translated using the average exchange rate for the year. The gains and losses resulting from changes in exchange rates from year to year have been reported in Accumulated other comprehensive loss in the Consolidated Balance Sheets. The foreign currency transaction losses (gains) for the periods ending
December 31, 2018
,
2017
and
2016
were
$(2.4) million
,
$20.5 million
and
$(6.2) million
, respectively, and are reported within Other (income) expense - net on the Consolidated Statements of Operations. Of the
$20.5 million
reported as foreign currency transaction losses for the period ending December 31, 2017,
$20.2 million
was due to intercompany loans established in conjunction with the SFC Koenig acquisition. See Note 7 for further discussion.
Income Taxes
Income tax expense includes United States, state, local and international income taxes. Deferred tax assets and liabilities are recognized for the tax consequences of temporary differences between the financial reporting and the tax basis of existing assets and liabilities and for loss carryforwards. The tax rate used to determine the deferred tax assets and liabilities is the enacted tax rate for the year and manner in which the differences are expected to reverse. Valuation allowances are recorded to reduce deferred tax assets to the amount that will more likely than not be realized.
Refer to Note 11 for further discussion on income taxes.
Concentration of Credit Risk
The Company is not dependent on a single customer as its largest customer accounted for less than
2%
of net sales for all years presented.
Recently Adopted Accounting Standards
In February 2018, the Financial Accounting Standards Board (“FASB”) issued Accounting Standards Update (“ASU”) 2018-02,
Reclassification of Certain Tax Effects from Accumulated Other Comprehensive Income
, which allows an entity to reclassify the stranded tax effects in accumulated other comprehensive income (loss) to retained earnings in the statement of shareholders’ equity. The Company early adopted this standard on a retrospective basis on January 1, 2018. The adoption resulted in an increase of
$6.4 million
to Retained earnings and a corresponding change of
$6.4 million
to Accumulated other comprehensive income (loss) at January 1, 2018.
In January 2017, the FASB issued ASU 2017-01,
Clarifying the Definition of a Business
, which clarifies the definition of a business and assists entities with evaluating whether transactions should be accounted for as acquisitions or disposals of assets or businesses. Under this guidance, when substantially all of the fair value of gross assets acquired is concentrated in a single asset or a group of similar assets, the assets acquired would not represent a business. In addition, in order to be considered a business, an acquisition would have to include at a minimum an input and a substantive process that together significantly contribute to the ability to create an output. The amended guidance also narrows the definition of outputs by more closely aligning it with how outputs are described in the FASB guidance for revenue recognition. The Company adopted this standard on January 1, 2018 and accounted for the purchase of the intellectual property assets from Phantom Controls utilizing this guidance. See Note 5 for further information.
In October 2016, the FASB issued ASU 2016-16,
Intra-Entity Transfers of Assets Other Than Inventory
, which amends Accounting Standards Codification (“ASC”) 740,
Income Taxes
. This ASU requires that the income tax consequences of an intra-entity asset transfer other than inventory are recognized at the time of the transfer. An entity will continue to recognize the income tax consequences of an intercompany transfer of inventory when the inventory is sold to a third party. The Company adopted this standard on a modified retrospective basis on January 1, 2018. The adoption resulted in a decrease of
$7.3 million
to Other current assets, a decrease of
$6.7 million
to Deferred income taxes and a decrease of
$0.6 million
to Retained earnings at January 1, 2018.
In August 2016, the FASB issued ASU 2016-15,
Classification of Certain Cash Receipts and Cash Payments
(a consensus of the FASB Emerging Issues Task Force). This ASU addresses the following eight specific cash flow issues: debt prepayment or debt extinguishment costs; settlement of zero-coupon debt instruments or other debt instruments with coupon interest rates that are insignificant in relation to the effective interest rate of the borrowing; contingent consideration payments made after a business
40
combination; proceeds from the settlement of insurance claims; proceeds from the settlement of corporate-owned life insurance policies (including bank-owned life insurance policies); distributions received from equity method investees; beneficial interests in securitization transactions; and separately identifiable cash flows and application of the predominance principle. The Company adopted this standard on January 1, 2018. The adoption of this standard did not have a material impact on our consolidated financial statements.
In May 2014, the FASB issued ASU 2014-09,
Revenue from Contracts with Customers,
which replaces numerous requirements in U.S. GAAP, including industry-specific requirements, and provides companies with a new five-step model for recognizing revenue from contracts with customers. Under ASU 2014-09, an entity should recognize revenue to depict the transfer of promised goods or services to customers in an amount that reflects the consideration to which the entity expects to be entitled in exchange for those goods or services. This ASU also requires disclosures sufficient to enable users to understand the nature, amount, timing, and uncertainty of revenue and cash flows arising from contracts with customers, including qualitative and quantitative disclosures about contracts with customers, significant judgments and changes in judgments, and assets recognized from the costs to obtain or fulfill a contract. The FASB has also issued the following standards which clarify ASU 2014-09 and have the same effective date as the original standard: ASU 2016-08,
Revenue from Contracts with Customers: Principal versus Agent Considerations (Reporting Revenue Gross versus Net)
; ASU 2016-10,
Revenue from Contracts with Customers: Identifying Performance Obligations and Licensing
; ASU 2016-12
,
Revenue from Contracts with Customers: Narrow-Scope Improvements and Practical Expedients
; and ASU 2016-20
, Technical Corrections and Improvements to Topic 606, Revenue from Contracts with Customers.
In 2016, we established an implementation team and analyzed the impact of the standard by surveying business units and performing extensive contract reviews to identify potential differences that may result from applying the requirements of the new standard. The contract reviews generally supported the recognition of revenue at a point in time, which was consistent with the revenue recognition model used by most of our business units. As a result, revenue recognition was unchanged under the new standard. For our business units that previously recognized revenue under a percentage of completion model, revenue recognition was also unchanged as the contract reviews supported the recognition of revenue over time. The Company implemented the appropriate changes to its processes, systems and controls to comply with the new guidance. The Company adopted this standard on January 1, 2018 using the modified retrospective approach applied to contracts that were not completed as of January 1, 2018. The adoption of this standard did not have an impact on our consolidated financial statements, except to provide additional disclosures. The Company elected the following practical expedients: significant financing component, sales tax presentation, contract costs, shipping and handling activities and disclosures. See Note 4 for further details on revenue.
New Accounting Pronouncements
In February 2016, the FASB issued ASU 2016-02,
Leases
, which sets out the principles for the recognition, measurement, presentation and disclosure of leases for both parties to a contract (i.e. lessees and lessors). The standard introduces a new lessee model that will require most leases to be recorded on the balance sheet and eliminates the required use of bright line tests in current U.S. GAAP for determining lease classification. The new standard requires lessors to account for leases using an approach that is substantially equivalent to existing guidance for sales-type leases, direct financing leases and operating leases. This standard is effective for fiscal years beginning after December 15, 2018 and interim periods within those fiscal years. This new guidance requires adoption on a retrospective basis unless it is impracticable to apply, in which case the company would be required to apply the amendments prospectively as of the earliest date practicable. In July 2018, the FASB also issued the following standards which clarify ASU 2016-02 and have the same effective date as the original standard: ASU 2018-10,
Codification Improvements to Topic 842
, Leases and ASU 2018-11,
Leases (Topic 842): Targeted Improvements
. ASU 2018-11 includes an option to not restate comparative periods in transition and elect to use the effective date of ASU 2016-02 as the date of initial application of transition.
We will adopt this standard on January 1, 2019 using the transition method that allows us to apply this standard prospectively as of January 1, 2019. As we will not restate comparative periods, the adoption will have no impact on our previously reported results. We expect to use the package of practical expedients that allows us to not reassess: (1) whether any expired or existing contracts are or contain leases, (2) lease classification for any expired or existing leases and (3) initial direct costs for any expired or existing leases. We additionally expect to use the practical expedient that allows lessees to treat the lease and non-lease components of leases as a single lease component. The adoption of the new standard will have a material impact on our consolidated balance sheet due to the recognition of right of use assets and lease liabilities. Upon adoption, we expect to recognize right of use assets and lease liabilities of approximately
$70 million
that reflect the present value of future lease payments. We do not expect the adoption of this standard to have a material impact on our results of operations or cash flows.
41
2. Acquisitions and Divestitures
All of the Company’s acquisitions of businesses have been accounted for under ASC 805,
Business Combinations
. Accordingly, the accounts of the acquired companies, after adjustments to reflect the fair values assigned to assets and liabilities, have been included in the Company’s consolidated financial statements from their respective dates of acquisition. The results of operations of the acquired companies have been included in the Company’s consolidated results since the date of each acquisition. Supplemental pro forma information has not been provided as the acquisitions did not have a material impact on the Company’s consolidated results of operations individually or in the aggregate.
2018 Acquisition
On July 23, 2018, the Company acquired FLI, a technology leader in the design, development and production of low-noise cooled CCD and high speed, high-sensitivity Scientific CMOS cameras for the astronomy and life science markets. Headquartered in Lima, NY, FLI operates in our Health & Sciences Technologies segment. FLI was acquired for an aggregate purchase price of
$23.6 million
, consisting of
$20.2 million
in cash and contingent consideration valued at
$3.4 million
as of the opening balance sheet date. The contingent consideration is based on the achievement of financial objectives during the
24
-month period following the close of the transaction. The entire purchase price was funded with cash on hand. Goodwill and intangible assets recognized as part of this transaction were
$12.4 million
and
$7.9 million
, respectively. Acquired intangible assets consist of trade names, customer relationships and unpatented technology. The goodwill recorded for the acquisition reflects the strategic fit, revenue and earnings growth potential of this business. The goodwill is deductible for tax purposes.
The Company made an initial allocation of the purchase price for the FLI acquisition as of the acquisition date based on its understanding of the fair value of the acquired assets and assumed liabilities. These nonrecurring fair value measurements are classified as Level 3 in the fair value hierarchy. As the Company continues to obtain additional information about these assets and liabilities, and continues to learn more about the newly acquired business, we will refine the estimates of fair value and more accurately allocate the purchase price. Only items identified as of the acquisition date are considered for subsequent adjustment. The Company will make the appropriate adjustments to the purchase price allocation prior to the completion of the measurement period, as required.
The Company incurred
$3.0 million
of acquisition-related transaction costs in
2018
. These costs were recorded in Selling, general and administrative expenses and were related to completed transactions, pending transactions and potential transactions, including transactions that ultimately were not completed.
2017 Acquisition
On December 8, 2017, the Company acquired the stock of thinXXS, a leader in the design, manufacture, and sale of microfluidic components serving the point of care, veterinary, and life science markets. The business was acquired to complement our existing CiDRA Precision Services business and expand on our microfluidic and nanofluidic capabilities. Headquartered in Zweibrücken, Germany, thinXXS operates in our Health & Science Technologies segment. thinXXS was acquired for cash consideration of
$38.2 million
and the assumption of
$1.2 million
of debt. The purchase price was funded with cash on hand. Goodwill and intangible assets recognized as part of the transaction were
$25.2 million
and
$10.6 million
, respectively. Acquired intangible assets consist of trade names, customer relationships and unpatented technology. The goodwill recorded for the acquisition reflects the strategic fit, revenue and earnings growth potential of this business. The goodwill is not deductible for tax purposes.
The Company finalized its allocation of the purchase price for the thinXXS acquisition as of the acquisition date based on its understanding of the fair value of the acquired assets and assumed liabilities. These nonrecurring fair value measurements were classified as Level 3 in the fair value hierarchy.
The Company incurred
$1.3 million
of acquisition-related transaction costs in 2017. These costs were recorded in Selling, general and administrative expenses and were related to completed transactions, pending transactions and potential transactions, including transactions that ultimately were not completed.
2016 Acquisitions
On March 16, 2016, the Company acquired the stock of Akron Brass, a producer of a large array of engineered life–safety products for the safety and emergency response markets, which includes apparatus valves, monitors, nozzles, specialty lighting, electronic vehicle–control systems and firefighting hand tools. The business was acquired to complement and create synergies
42
with our existing Hale, Class 1, and Godiva businesses. Headquartered in Wooster, Ohio, Akron Brass operates in our Fire & Safety/Diversified Products segment. Akron Brass was acquired for cash consideration of
$221.4 million
. The purchase price was funded with borrowings under the Company’s revolving facilities. Goodwill and intangible assets recognized as part of the transaction were
$124.6 million
and
$90.4 million
, respectively. The goodwill is not deductible for tax purposes.
On July 1, 2016, the Company acquired the stock of AWG Fittings, a producer of engineered products for the safety and emergency response markets, including valves, monitors and nozzles. The business was acquired to complement and create synergies with our existing Hale, Class 1, Godiva and Akron Brass businesses. Headquartered in Ballendorf, Germany, AWG Fittings operates in our Fire & Safety/Diversified Products segment. AWG Fittings was acquired for cash consideration of
$47.5 million
(
€42.8 million
). The purchase price was funded with cash on hand. Goodwill and intangible assets recognized as part of the transaction were
$22.1 million
and
$10.3 million
, respectively. The goodwill is not deductible for tax purposes.
On August 31, 2016, the Company acquired the stock of SFC Koenig, a producer of highly engineered expanders and check valves for critical applications across the transportation, hydraulic, aviation and medical markets. Headquartered in Dietikon, Switzerland, SFC Koenig operates in our Health & Science Technologies segment. SFC Koenig was acquired for cash consideration of
$241.1 million
(
€215.9 million
). The purchase price was funded with cash on hand and borrowings under the Company’s revolving facilities. Goodwill and intangible assets recognized as part of the transaction were
$141.3 million
and
$117.0 million
, respectively. The goodwill is not deductible for tax purposes.
The allocation of the acquisition costs to the assets acquired and liabilities assumed, based on their estimated fair values at their respective acquisition dates, is as follows:
|
Akron Brass
|
AWG Fittings
|
SFC Koenig
|
Total
|
||||||||||||
|
(In thousands)
|
|||||||||||||||
|
Accounts receivable
|
$
|
14,523
|
|
$
|
5,867
|
|
$
|
9,190
|
|
$
|
29,580
|
|
|||
|
Inventory
|
29,157
|
|
11,766
|
|
20,639
|
|
61,562
|
|
|||||||
|
Other assets, net of cash acquired
|
446
|
|
565
|
|
4,501
|
|
5,512
|
|
|||||||
|
Property, plant and equipment
|
12,195
|
|
6,595
|
|
4,637
|
|
23,427
|
|
|||||||
|
Goodwill
|
124,643
|
|
22,055
|
|
141,298
|
|
287,996
|
|
|||||||
|
Intangible assets
|
90,400
|
|
10,279
|
|
116,998
|
|
217,677
|
|
|||||||
|
Deferred income taxes
|
—
|
|
3,928
|
|
—
|
|
3,928
|
|
|||||||
|
Total assets acquired
|
271,364
|
|
61,055
|
|
297,263
|
|
629,682
|
|
|||||||
|
Current liabilities
|
(7,081
|
)
|
(5,117
|
)
|
(11,704
|
)
|
(23,902
|
)
|
|||||||
|
Deferred income taxes
|
(36,439
|
)
|
—
|
|
(36,168
|
)
|
(72,607
|
)
|
|||||||
|
Other noncurrent liabilities
|
(6,445
|
)
|
(8,444
|
)
|
(8,283
|
)
|
(23,172
|
)
|
|||||||
|
Net assets acquired
|
$
|
221,399
|
|
$
|
47,494
|
|
$
|
241,108
|
|
$
|
510,001
|
|
|||
Acquired intangible assets consist of trade names, customer relationships and unpatented technology. The goodwill recorded for the acquisitions reflects the strategic fit, revenue and earnings growth potential of these businesses.
Of the
$217.7 million
of acquired intangible assets,
$28.8 million
was assigned to the Akron Brass trade name and is not subject to amortization. The acquired intangible assets and weighted average amortization periods are as follows:
|
(In thousands, except weighted average life)
|
Total
|
Weighted Average Life
|
|||
|
Trade names
|
$
|
14,078
|
|
15
|
|
|
Customer relationships
|
134,519
|
|
13
|
||
|
Unpatented technology
|
40,280
|
|
13
|
||
|
Amortized intangible assets
|
188,877
|
|
|||
|
Indefinite lived - Akron Brass trade name
|
28,800
|
|
|||
|
Total acquired intangible assets
|
$
|
217,677
|
|
||
43
The Company incurred
$4.7 million
of acquisition-related transaction costs in 2016. These costs were recorded in Selling, general and administrative expenses and were related to completed transactions, pending transactions and potential transactions, including transactions that ultimately were not completed. The Company also incurred
$14.7 million
of non-cash acquisition fair value inventory step-up charges associated with the completed 2016 acquisitions. These charges were recorded in Cost of sales.
Divestitures
The Company periodically reviews its operations for businesses which may no longer be aligned with its strategic objectives and focuses on core business and customers. Any resulting gain or loss recognized due to divestitures is recorded within Loss (gain) on sale of businesses - net. The Company concluded that none of the divestitures that took place during the years ended December 31,
2018
,
2017
and
2016
met the criteria for reporting discontinued operations.
On October 31, 2017, the Company completed the sale of its Faure Herman subsidiary for
$21.8 million
in cash, resulting in a pre-tax gain on the sale of
$9.3 million
. There was
no
income tax expense associated with this transaction. The results of Faure Herman were reported within the Fluid & Metering Technologies segment and generated
$14.1 million
of revenues in 2017 through the date of sale.
On July 29, 2016, the Company completed the sale of its Hydra-Stop product line for
$15.0 million
in cash, resulting in a pre-tax gain on the sale of
$5.8 million
. In addition, the Company earned
$1.0 million
for the achievement of 2016 net sales objectives and
$1.0 million
for the achievement of 2017 net sales objectives, which represents the maximum earn outs for both 2016 and 2017. The Company recorded
$2.8 million
of income tax expense associated with this transaction during the year ended December 31, 2016. The results of Hydra-Stop were reported within the Fluid & Metering Technologies segment and generated
$7.5 million
of revenues in 2016 through the date of sale.
On September 9, 2016, the Company completed the sale of its Melles Griot KK (“CVI Japan”) subsidiary for
$17.5 million
in cash, resulting in a pre-tax loss on the sale of
$7.9 million
. The Company recorded
$3.4 million
of income tax benefit associated with this transaction during the year ended December 31, 2016. The results of CVI Japan were reported within the Health & Science Technologies segment and generated
$13.1 million
of revenues in 2016 through the date of sale.
On October 10, 2016, the Company completed the sale of its IETG and 40Seven subsidiaries for
$2.7 million
in cash, resulting in a pre-tax loss on the sale of
$4.2 million
. There was no income tax impact associated with this transaction. The results of IETG and 40Seven were reported within the Fluid & Metering Technologies segment and generated
$8.3 million
of revenues in 2016 through the date of sale.
On December 30, 2016, the Company completed the sale of its Korea Electro-Optics Co., Ltd. (“CVI Korea”) subsidiary for
$3.8 million
in cash, resulting in a pre-tax loss on the sale of
$16.0 million
. The Company recorded
$9.1 million
of income tax benefit associated with this transaction during the year ended December 31, 2016. The results of CVI Korea were reported within the Health & Science Technologies segment and generated
$11.7 million
of revenues in 2016 through the date of sale.
44
3. Balance Sheet Components
|
|
December 31,
|
||||||
|
|
2018
|
2017
|
|||||
|
|
(In thousands)
|
||||||
|
RECEIVABLES
|
|||||||
|
Customers
|
$
|
313,719
|
|
$
|
297,796
|
|
|
|
Other
|
5,182
|
|
4,134
|
|
|||
|
Total
|
318,901
|
|
301,930
|
|
|||
|
Less allowance for doubtful accounts
|
6,709
|
|
7,764
|
|
|||
|
Total receivables - net
|
$
|
312,192
|
|
$
|
294,166
|
|
|
|
INVENTORIES
|
|||||||
|
Raw materials and components parts
|
$
|
178,805
|
|
$
|
169,676
|
|
|
|
Work in process
|
37,495
|
|
33,668
|
|
|||
|
Finished goods
|
63,695
|
|
56,380
|
|
|||
|
Total
|
$
|
279,995
|
|
$
|
259,724
|
|
|
|
PROPERTY, PLANT AND EQUIPMENT
|
|||||||
|
Land and improvements
|
$
|
32,100
|
|
$
|
32,984
|
|
|
|
Buildings and improvements
|
189,744
|
|
175,467
|
|
|||
|
Machinery, equipment and other
|
372,804
|
|
356,728
|
|
|||
|
Office and transportation equipment
|
96,350
|
|
96,541
|
|
|||
|
Construction in progress
|
24,328
|
|
14,715
|
|
|||
|
Total
|
715,326
|
|
676,435
|
|
|||
|
Less accumulated depreciation and amortization
|
434,106
|
|
418,085
|
|
|||
|
Total property, plant and equipment - net
|
$
|
281,220
|
|
$
|
258,350
|
|
|
|
ACCRUED EXPENSES
|
|||||||
|
Payroll and related items
|
$
|
78,944
|
|
$
|
75,869
|
|
|
|
Management incentive compensation
|
25,321
|
|
24,320
|
|
|||
|
Income taxes payable
|
23,844
|
|
28,033
|
|
|||
|
Insurance
|
10,422
|
|
9,424
|
|
|||
|
Warranty
|
5,303
|
|
6,281
|
|
|||
|
Deferred revenue
|
8,055
|
|
11,031
|
|
|||
|
Restructuring
|
6,170
|
|
4,180
|
|
|||
|
Liability for uncertain tax positions
|
980
|
|
1,745
|
|
|||
|
Accrued interest
|
1,759
|
|
1,759
|
|
|||
|
Other
|
26,738
|
|
22,063
|
|
|||
|
Total accrued expenses
|
$
|
187,536
|
|
$
|
184,705
|
|
|
|
OTHER NONCURRENT LIABILITIES
|
|||||||
|
Pension and retiree medical obligations
|
$
|
80,667
|
|
$
|
99,646
|
|
|
|
Transition tax payable
|
17,127
|
|
27,877
|
|
|||
|
Liability for uncertain tax positions
|
3,183
|
|
1,047
|
|
|||
|
Deferred revenue
|
3,027
|
|
3,297
|
|
|||
|
Liability for construction of new leased facility
|
11,616
|
|
—
|
|
|||
|
Contingent consideration for acquisition
|
3,375
|
|
—
|
|
|||
|
Other
|
19,219
|
|
23,818
|
|
|||
|
Total other noncurrent liabilities
|
$
|
138,214
|
|
$
|
155,685
|
|
|
45
The valuation and qualifying account activity for the years ended
December 31, 2018
,
2017
and
2016
is as follows:
|
2018
|
2017
|
2016
|
|||||||||
|
|
(In thousands)
|
||||||||||
|
ALLOWANCE FOR DOUBTFUL ACCOUNTS
(1)
|
|
||||||||||
|
Beginning balance January 1
|
$
|
7,764
|
|
$
|
8,078
|
|
$
|
7,812
|
|
||
|
Charged to costs and expenses, net of recoveries
|
290
|
|
720
|
|
1,425
|
|
|||||
|
Utilization
|
(1,396
|
)
|
(1,418
|
)
|
(1,585
|
)
|
|||||
|
Currency translation and other
|
51
|
|
384
|
|
426
|
|
|||||
|
Ending balance December 31
|
$
|
6,709
|
|
$
|
7,764
|
|
$
|
8,078
|
|
||
(1)
Includes provision for doubtful accounts and sales discounts granted to customers.
4. Revenue
IDEX is an applied solutions company specializing in the manufacture of fluid and metering technologies, health and science technologies and fire, safety and other diversified products built to customers’ specifications. The Company’s products include industrial pumps, compressors, flow meters, injectors, valves and related controls for use in a wide variety of process applications; precision fluidics solutions, including pumps, valves, degassing equipment, corrective tubing, fittings and complex manifolds, optical filters and specialty medical equipment and devices for use in life science applications; precision-engineered equipment for dispensing, metering and mixing paints; and engineered products for industrial and commercial markets, including fire and rescue, transportation equipment, oil and gas, electronics and communications. The Company’s revenue is accounted for under ASC 606, which we adopted on January 1, 2018 using the modified retrospective method.
Revenue is recognized when control of the promised products or services is transferred to our customers in an amount that reflects the consideration we expect to be entitled to in exchange for transferring those products or providing those services. We account for a contract when it has approval and commitment from both parties, the rights of the parties are identified, payment terms are identified, the contract has commercial substance and collectibility of the consideration is probable. We determine the appropriate revenue recognition for our contracts with customers by analyzing the type, terms and conditions of each contract or arrangement with a customer.
Disaggregation of Revenue
We have a comprehensive offering of products, including technologies, built to customers’ specifications that are sold in niche markets throughout the world. We disaggregate our revenue from contracts with customers by reporting unit and geographical region for each of our segments as we believe it best depicts how the nature, amount, timing and uncertainty of our revenue and cash flows are affected by economic factors. Revenue was attributed to geographic areas based on location of the customer and no country outside the U.S. was greater than 10% of total revenues. The following tables present our revenue disaggregated by reporting unit and geographical region.
46
Revenue by reporting unit for the year ended
December 31, 2018
was as follows:
|
For the Year Ended December 31, 2018
|
|||
|
Energy
|
$
|
163,996
|
|
|
Valves
|
113,136
|
|
|
|
Water
|
251,020
|
|
|
|
Pumps
|
324,222
|
|
|
|
Agriculture
|
99,178
|
|
|
|
Intersegment elimination
|
(277
|
)
|
|
|
Fluid & Metering Technologies
|
951,275
|
|
|
|
Scientific Fluidics & Optics
|
417,859
|
|
|
|
Sealing Solutions
|
200,316
|
|
|
|
Gast
|
126,787
|
|
|
|
Micropump
|
36,827
|
|
|
|
Material Processing Technologies
|
114,630
|
|
|
|
Intersegment elimination
|
(449
|
)
|
|
|
Health & Science Technologies
|
895,970
|
|
|
|
Fire & Safety
|
396,926
|
|
|
|
Band-It
|
105,785
|
|
|
|
Dispensing
|
134,317
|
|
|
|
Intersegment elimination
|
(607
|
)
|
|
|
Fire & Safety/Diversified Products
|
636,421
|
|
|
|
Total net sales
|
$
|
2,483,666
|
|
Revenue by geographical region for the year ended
December 31, 2018
was as follows:
|
For the Year Ended December 31, 2018
|
|||||||||||||||
|
FMT
|
HST
|
FSDP
|
IDEX
|
||||||||||||
|
U.S.
|
$
|
540,697
|
|
$
|
392,140
|
|
$
|
297,717
|
|
$
|
1,230,554
|
|
|||
|
North America, excluding U.S.
|
57,917
|
|
18,770
|
|
28,779
|
|
105,466
|
|
|||||||
|
Europe
|
172,630
|
|
278,634
|
|
164,307
|
|
615,571
|
|
|||||||
|
Asia
|
119,822
|
|
189,342
|
|
111,169
|
|
420,333
|
|
|||||||
|
Other
(1)
|
60,486
|
|
17,533
|
|
35,056
|
|
113,075
|
|
|||||||
|
Intersegment elimination
|
(277
|
)
|
(449
|
)
|
(607
|
)
|
(1,333
|
)
|
|||||||
|
Total net sales
|
$
|
951,275
|
|
$
|
895,970
|
|
$
|
636,421
|
|
$
|
2,483,666
|
|
|||
(1)
Other includes: South America, Middle East, Australia and Africa.
Contract Balances
The timing of revenue recognition, billings and cash collections results in customer receivables, advance payments and billings in excess of revenue recognized. Customer receivables include amounts billed and currently due from customers as well as unbilled amounts (contract assets) and are included in Receivables on our Consolidated Balance Sheets. Amounts are billed in accordance with contractual terms or as work progresses in accordance with contractual terms. Unbilled amounts arise when the timing of billing differs from the timing of revenue recognized, such as when contract provisions require specific milestones to be met before a customer can be billed. Unbilled amounts primarily relate to performance obligations satisfied over time when the cost-to-cost method is utilized and the revenue recognized exceeds the amount billed to the customer as there is not yet a right to payment in accordance with contractual terms. Unbilled amounts are recorded as a contract asset when the revenue associated with the contract is recognized prior to billing and derecognized when billed in accordance with the terms of the contract. Customer receivables are
47
recorded at face amounts less an allowance for doubtful accounts. The Company maintains allowances for doubtful accounts for estimated losses as a result of customers’ inability to make required payments. Management evaluates the aging of the customer receivable balances, the financial condition of its customers, historical trends and the time outstanding of specific balances to estimate the amount of customer receivables that may not be collected in the future and records the appropriate provision.
The composition of Customer receivables was as follows:
|
December 31, 2018
|
January 1, 2018
|
||||||
|
Billed receivables
|
$
|
299,227
|
|
$
|
285,800
|
|
|
|
Unbilled receivables
|
14,492
|
|
11,996
|
|
|||
|
Total customer receivables
|
$
|
313,719
|
|
$
|
297,796
|
|
|
Advance payments and billings in excess of revenue recognized are included in Deferred revenue which is classified as current or noncurrent based on the timing of when we expect to recognize the revenue. The current portion is included in Accrued expenses and the noncurrent portion is included in Other noncurrent liabilities on our Consolidated Balance Sheets. Advance payments and billings in excess of revenue recognized represent contract liabilities and are recorded when customers remit contractual cash payments in advance of us satisfying performance obligations under contractual arrangements, including those with performance obligations satisfied over time. Billings in excess of revenue recognized primarily relate to performance obligations satisfied over time when the cost-to-cost method is utilized and revenue cannot yet be recognized as the Company has not completed the corresponding performance obligation. We generally receive advance payments from customers related to maintenance services which we recognize ratably over the service term. Contract liabilities are derecognized when revenue is recognized and the performance obligation is satisfied.
The composition of Deferred revenue was as follows:
|
December 31, 2018
|
January 1, 2018
|
||||||
|
Deferred revenue - current
|
$
|
8,055
|
|
$
|
11,031
|
|
|
|
Deferred revenue - noncurrent
|
3,027
|
|
3,297
|
|
|||
|
Total deferred revenue
|
$
|
11,082
|
|
$
|
14,328
|
|
|
Performance Obligations
A performance obligation is a promise in a contract to transfer a distinct product or service to the customer. A contract’s transaction price is allocated to each distinct performance obligation and recognized as revenue when, or as, the performance obligation is satisfied. For our contracts that require complex design, manufacturing and installation activities that are not separately identifiable from other promises in the contract and, therefore, not distinct, the entire contract is accounted for as a single performance obligation. For our contracts that include distinct products or services that are substantially the same and have the same pattern of transfer to the customer over time, they are recognized as a series of distinct products or services. Certain of our contracts have multiple performance obligations for which we allocate the transaction price to each performance obligation using an estimate of the standalone selling price of each distinct product or service in the contract. For product sales, each product sold to a customer generally represents a distinct performance obligation. In such cases, the observable standalone sales are used to determine the standalone selling price. In certain cases, we may be required to estimate standalone selling price using the expected cost plus margin approach, under which we forecast our expected costs of satisfying a performance obligation and then add an appropriate margin for that distinct product or service.
Our performance obligations are satisfied at a point in time or over time as work progresses. Performance obligations are supported by contracts with customers that provide a framework for the nature of the distinct products or services or bundle of products and services. We define service revenue as revenue from activities that are not associated with the design, development or manufacture of a product or the delivery of a software license.
Revenue from products and services transferred to customers at a point in time approximated
95%
in the year ended
December 31, 2018
. Revenue recognized at a point in time relates to the majority of our product sales. Revenue on these contracts is recognized when obligations under the terms of the contract with our customer are satisfied. Generally, this occurs with the transfer of control of the asset, which is in line with shipping terms.
48
Revenue from products and services transferred to customers over time approximated
5%
in the year ended
December 31, 2018
. Revenue earned by certain business units within the Water, Energy, Material Processing Technologies (“MPT”) and Dispensing reporting units is recognized over time because control transfers continuously to our customers. When accounting for over-time contracts, we use an input measure to determine the extent of progress towards completion of the performance obligation. For certain business units within the Water, Energy and MPT reporting units, revenue is recognized over time as work is performed based on the relationship between actual costs incurred to date for each contract and the total estimated costs for such contract at completion of the performance obligation (i.e. the cost-to-cost method). We believe this measure of progress best depicts the transfer of control to the customer which occurs as we incur costs on our contracts. Incurred cost represents work performed, which corresponds with the transfer of control to the customer. Contract costs include labor, material and overhead. Contract estimates are based on various assumptions to project the outcome of future events. These assumptions include labor productivity and availability; the complexity of the work to be performed; the cost and availability of materials; the performance of subcontractors; and the availability and timing of funding from the customer. Revenues, including estimated fees or profits, are recorded proportionally as costs are incurred. For certain business units within the Energy and Dispensing reporting units, revenue is recognized ratably over the contract term.
As a significant change in one or more of these estimates could affect the profitability of our contracts, we review and update our estimates regularly. Due to uncertainties inherent in the estimation process, it is reasonably possible that completion costs, including those arising from contract penalty provisions and final contract settlements, will be revised. Such revisions to costs and income are recognized in the period in which the revisions are determined as a cumulative catch-up adjustment. The impact of the adjustment on profit recorded to date on a contract is recognized in the period the adjustment is identified. Revenue and profit in future periods of contract performance are recognized using the adjusted estimate. If at any time the estimate of contract profitability indicates an anticipated loss on the contract, we recognize provisions for estimated losses on uncompleted contracts in the period in which such losses are determined.
The Company records allowances for discounts, product returns and customer incentives at the time of sale as a reduction of revenue as such allowances can be reliably estimated based on historical experience and known trends. The Company also offers product warranties (primarily assurance-type) and accrues its estimated exposure for warranty claims at the time of sale based upon the length of the warranty period, warranty costs incurred and any other related information known to the Company.
5. Goodwill and Intangible Assets
The changes in the carrying amount of goodwill for
2018
and
2017
, by reportable business segment, were as follows:
|
Fluid &
Metering
Technologies
|
Health &
Science
Technologies
|
Fire & Safety/
Diversified
Products
|
Total
|
||||||||||||
|
(In thousands)
|
|||||||||||||||
|
Goodwill
|
$
|
594,158
|
|
$
|
849,119
|
|
$
|
389,946
|
|
$
|
1,833,223
|
|
|||
|
Accumulated goodwill impairment losses
|
(20,721
|
)
|
(149,820
|
)
|
(30,090
|
)
|
(200,631
|
)
|
|||||||
|
Balance at January 1, 2017
|
573,437
|
|
699,299
|
|
359,856
|
|
1,632,592
|
|
|||||||
|
Foreign currency translation
|
15,748
|
|
19,225
|
|
18,206
|
|
53,179
|
|
|||||||
|
Acquisitions
|
—
|
|
23,929
|
|
—
|
|
23,929
|
|
|||||||
|
Disposition of businesses
|
(3,121
|
)
|
—
|
|
—
|
|
(3,121
|
)
|
|||||||
|
Acquisition adjustments
|
—
|
|
(2,421
|
)
|
—
|
|
(2,421
|
)
|
|||||||
|
Balance at December 31, 2017
|
586,064
|
|
740,032
|
|
378,062
|
|
1,704,158
|
|
|||||||
|
Foreign currency translation
|
(5,023
|
)
|
(8,391
|
)
|
(6,505
|
)
|
(19,919
|
)
|
|||||||
|
Acquisitions
|
—
|
|
12,399
|
|
—
|
|
12,399
|
|
|||||||
|
Disposition of businesses
|
—
|
|
—
|
|
—
|
|
—
|
|
|||||||
|
Acquisition adjustments
|
—
|
|
1,317
|
|
—
|
|
1,317
|
|
|||||||
|
Balance at December 31, 2018
|
$
|
581,041
|
|
$
|
745,357
|
|
$
|
371,557
|
|
$
|
1,697,955
|
|
|||
ASC 350 requires that goodwill be tested for impairment at the reporting unit level on an annual basis and between annual tests if an event occurs or circumstances change that would more likely than not reduce the fair value of a reporting unit below its carrying amount. In
2018
and
2017
, there were no events that occurred or circumstances that changed that would have required a
49
review other than as of our annual test date. Goodwill represents the purchase price in excess of the net amount assigned to assets acquired and liabilities assumed.
Goodwill and other acquired intangible assets with indefinite lives were tested for impairment as of October 31,
2018
, the Company’s annual impairment date. In assessing the fair value of the reporting units, the Company considers both the market approach and the income approach. Under the market approach, the fair value of the reporting unit is determined by the respective trailing twelve month EBITDA and the forward looking
2019
EBITDA (50% each), based on multiples of comparable public companies. The market approach is dependent on a number of significant management assumptions including forecasted EBITDA and selected market multiples. Under the income approach, the fair value of the reporting unit is determined based on the present value of estimated future cash flows. The income approach is dependent on a number of significant management assumptions including estimates of operating results, capital expenditures, net working capital requirements, long-term growth rates and discount rates. Weighting was equally attributed to both the market and the income approaches (50% each) in arriving at the fair value of the reporting units.
The following table provides the gross carrying value and accumulated amortization for each major class of intangible asset at
December 31, 2018
and
2017
:
|
|
At December 31, 2018
|
|
At December 31, 2017
|
||||||||||||||||||||||
|
|
Gross
Carrying
Amount
|
Accumulated
Amortization
|
Net
|
Weighted
Average
Life
|
Gross
Carrying
Amount
|
Accumulated
Amortization
|
Net
|
||||||||||||||||||
|
|
|
(In thousands)
|
|
|
|
(In thousands)
|
|
||||||||||||||||||
|
Amortized intangible assets:
|
|||||||||||||||||||||||||
|
Patents
|
$
|
6,468
|
|
$
|
(4,693
|
)
|
$
|
1,775
|
|
12
|
$
|
9,633
|
|
$
|
(7,143
|
)
|
$
|
2,490
|
|
||||||
|
Trade names
|
115,899
|
|
(57,227
|
)
|
58,672
|
|
16
|
117,206
|
|
(50,604
|
)
|
66,602
|
|
||||||||||||
|
Customer relationships
|
256,202
|
|
(85,652
|
)
|
170,550
|
|
14
|
317,316
|
|
(124,566
|
)
|
192,750
|
|
||||||||||||
|
Unpatented technology
|
96,922
|
|
(35,685
|
)
|
61,237
|
|
12
|
91,166
|
|
(29,428
|
)
|
61,738
|
|
||||||||||||
|
Other
|
700
|
|
(507
|
)
|
193
|
|
10
|
839
|
|
(573
|
)
|
266
|
|
||||||||||||
|
Total amortized intangible assets
|
476,191
|
|
(183,764
|
)
|
292,427
|
|
536,160
|
|
(212,314
|
)
|
323,846
|
|
|||||||||||||
|
Indefinite-lived intangible assets:
|
|||||||||||||||||||||||||
|
Banjo trade name
|
62,100
|
|
—
|
|
62,100
|
|
62,100
|
|
—
|
|
62,100
|
|
|||||||||||||
|
Akron Brass trade name
|
28,800
|
|
—
|
|
28,800
|
|
28,800
|
|
—
|
|
28,800
|
|
|||||||||||||
|
Total intangible assets
|
$
|
567,091
|
|
$
|
(183,764
|
)
|
$
|
383,327
|
|
$
|
627,060
|
|
$
|
(212,314
|
)
|
$
|
414,746
|
|
|||||||
On June 22, 2018, the Company acquired the intellectual property assets of Phantom Controls (“Phantom”) for cash consideration of
$4.0 million
. The operational capabilities and innovative pump operation of Phantom’s technology complements our existing water-flow expertise of Hale, Akron Brass and Class 1 to improve fire ground safety and reduce operational complexity during mission critical response. This acquisition of intellectual property assets did not meet the definition of a business under ASU 2017-01 and thus the Company recorded the entire purchase price to the Unpatented technology class of intangible assets on the Consolidated Balance Sheets.
The Banjo trade name and the Akron Brass trade name are indefinite-lived intangible assets which are tested for impairment on an annual basis in accordance with ASC 350 or more frequently if events or changes in circumstances indicate that the assets might be impaired. The Company uses the relief-from-royalty method, a form of the income approach, to determine the fair value of these trade names. The relief-from-royalty method is dependent on a number of significant management assumptions, including estimates of revenues, royalty rates and discount rates.
In
2018
and
2017
, there were no events that occurred or circumstances that changed that would have required a review other than as of our annual test date.
Amortization of intangible assets was
$38.5 million
,
$45.9 million
and
$49.0 million
in
2018
,
2017
and
2016
, respectively. Based on the intangible asset balances as of
December 31, 2018
, amortization expense is expected to approximate
$36.5 million
in
2019
,
$34.8 million
in
2020
,
$33.9 million
in
2021
,
$32.2 million
in
2022
and
$29.3 million
in
2023
.
50
6. Borrowings
Borrowings at
December 31, 2018
and
2017
consisted of the following:
|
2018
|
2017
|
||||||
|
|
(In thousands)
|
||||||
|
Revolving Facility
|
$
|
—
|
|
$
|
10,740
|
|
|
|
4.50% Senior Notes, due December 2020
|
300,000
|
|
300,000
|
|
|||
|
4.20% Senior Notes, due December 2021
|
350,000
|
|
350,000
|
|
|||
|
3.20% Senior Notes, due June 2023
|
100,000
|
|
100,000
|
|
|||
|
3.37% Senior Notes, due June 2025
|
100,000
|
|
100,000
|
|
|||
|
Other borrowings
|
1,078
|
|
1,446
|
|
|||
|
Total borrowings
|
851,078
|
|
862,186
|
|
|||
|
Less current portion
|
483
|
|
258
|
|
|||
|
Less deferred debt issuance costs
|
1,593
|
|
2,204
|
|
|||
|
Less unaccreted debt discount
|
667
|
|
936
|
|
|||
|
Total long-term borrowings
|
$
|
848,335
|
|
$
|
858,788
|
|
|
On June 13, 2016, the Company completed a private placement of
$100 million
aggregate principal amount of
3.20%
Senior Notes due June 13, 2023 and
$100 million
aggregate principal amount of
3.37%
Senior Notes due June 13, 2025 (collectively, the “Notes”) pursuant to a Note Purchase Agreement, dated June 13, 2016 (the “Purchase Agreement”). Each series of Notes bears interest at the stated amount per annum, which is payable semi-annually in arrears on each June 13
th
and December 13
th
. The Notes are unsecured obligations of the Company and rank pari passu in right of payment with all of the Company’s other unsecured, unsubordinated debt. The Company may at any time prepay all, or any portion of the Notes; provided that such portion is greater than
5%
of the aggregate principal amount of the Notes then outstanding. In the event of a prepayment, the Company will pay an amount equal to par plus accrued interest plus a make-whole amount. In addition, the Company may repurchase the Notes by making an offer to all holders of the Notes, subject to certain conditions.
The Purchase Agreement contains certain covenants that restrict the Company’s ability to, among other things, transfer or sell assets, incur indebtedness, create liens, transact with affiliates and engage in certain mergers or consolidations or other change of control transactions. In addition, the Company must comply with a leverage ratio and interest coverage ratio, as further described below, and the Purchase Agreement also limits the outstanding principal amount of priority debt that may be incurred by the Company to
15%
of consolidated assets. The Purchase Agreement provides for customary events of default. In the case of an event of default arising from specified events of bankruptcy or insolvency, all of the outstanding Notes will become due and payable immediately without further action or notice. In the case of payment event of default, any holder of the Notes affected thereby may declare all of the Notes held by it due and payable immediately. In the case of any other event of default, a majority of the holders of the Notes may declare all of the Notes to be due and payable immediately.
On June 23, 2015, the Company entered into a credit agreement (the “Credit Agreement”) along with certain of its subsidiaries, as borrowers (the “Borrowers”), Bank of America, N.A., as administrative agent, swing line lender and an issuer of letters of credit, with other agents party thereto. The Credit Agreement replaced the Company’s existing
five
-year
$700 million
credit agreement, dated as of June 27, 2011, which was due to expire on June 27, 2016.
The Credit Agreement consists of a revolving credit facility (the “Revolving Facility”) in an aggregate principal amount of
$700 million
, with a final maturity date of
June 23, 2020
. The maturity date may be extended under certain conditions for an additional
one
-year term. Up to
$75 million
of the Revolving Facility is available for the issuance of letters of credit. Additionally, up to
$50 million
of the Revolving Facility is available to the Company for swing line loans, available on a same-day basis.
Proceeds of the Revolving Facility are available for use by the Borrowers for acquisitions, working capital and other general corporate purposes, including refinancing existing debt of the Company and its subsidiaries. The Company may request increases in the lending commitments under the Credit Agreement, but the aggregate lending commitments pursuant to such increases may not exceed
$350 million
. The Company has the right, subject to certain conditions set forth in the Credit Agreement, to designate certain foreign subsidiaries of the Company as borrowers under the Credit Agreement. In connection with any such designation, the Company is required to guarantee the obligations of any such subsidiaries.
51
Borrowings under the Credit Agreement bear interest at either an alternate base rate or an adjusted LIBOR rate plus, in each case, an applicable margin. Such applicable margin is based on the Company’s senior, unsecured, long-term debt rating and can range from
.005%
to
1.50%
. Based on the Company’s credit rating at
December 31, 2018
, the applicable margin was
1.10%
. Interest is payable (a) in the case of base rate loans, quarterly, and (b) in the case of LIBOR rate loans, on the maturity date of the borrowing, or quarterly from the effective date for borrowings exceeding three months.
The Credit Agreement requires payment to the lenders of a facility fee based upon (a) the amount of the lenders’ commitments under the credit facility from time to time and (b) the applicable corporate credit ratings of the Company. Voluntary prepayments of any loans and voluntary reductions of the unutilized portion of the commitments under the credit facility are permissible without penalty, subject to break funding payments and minimum notice and minimum reduction amount requirements.
The negative covenants include, among other things, limitations (each of which is subject to customary exceptions for financings of this type) on our ability to grant liens; enter into transactions resulting in fundamental changes (such as mergers or sales of all or substantially all of the assets of the Company); restrict subsidiary dividends or other subsidiary distributions; enter into transactions with the Company’s affiliates; and incur certain additional subsidiary debt.
The Credit Agreement also contains customary events of default (subject to grace periods, as appropriate) including among others: nonpayment of principal, interest or fees; breach of the representations or warranties in any material respect; breach of the financial, affirmative or negative covenants; payment default on, or acceleration of, other material indebtedness; bankruptcy or insolvency; material judgments entered against the Company or any of its subsidiaries; certain specified events under the Employee Retirement Income Security Act of 1974, as amended; certain changes in control of the Company; and the invalidity or unenforceability of the Credit Agreement or other documents associated with the Credit Agreement.
At
December 31, 2018
, there was
no
balance outstanding under the Revolving Facility and
$8.8 million
of outstanding letters of credit, resulting in a net available borrowing capacity under the Revolving Facility at
December 31, 2018
of approximately
$691.2 million
.
On December 9, 2011, the Company completed a public offering of
$350.0 million
4.2%
senior notes due
December 15, 2021
(“
4.2%
Senior Notes”). The net proceeds from the offering of
$346.2 million
, after deducting a
$0.9 million
issuance discount, a
$2.3 million
underwriting commission and
$0.6 million
of offering expenses, were used to repay
$306.0 million
of outstanding bank indebtedness, with the balance used for general corporate purposes. The
4.2%
Senior Notes bear interest at a rate of
4.2%
per annum, which is payable semi-annually in arrears on each June 15th and December 15th. The Company may redeem all or a portion of the
4.2%
Senior Notes at any time prior to maturity at the redemption prices set forth in the Note Indenture governing the
4.2%
Senior Notes. The Company may issue additional debt from time to time pursuant to the Indenture. The Indenture and
4.2%
Senior Notes contain covenants that limit the Company’s ability to, among other things, incur certain liens securing indebtedness, engage in certain sale-leaseback transactions, and enter into certain consolidations, mergers, conveyances, transfers or leases of all or substantially all of the Company’s assets. The terms of the
4.2%
Senior Notes also require the Company to make an offer to repurchase the
4.2%
Senior Notes upon a change of control triggering event (as defined in the Indenture) at a price equal to
101%
of their principal amount plus accrued and unpaid interest, if any.
On December 6, 2010, the Company completed a public offering of
$300.0 million
4.5%
senior notes due
December 15, 2020
(“
4.5%
Senior Notes”). The net proceeds from the offering of
$295.7 million
, after deducting a
$1.6 million
issuance discount, a
$1.9 million
underwriting commission and
$0.8 million
of offering expenses, were used to repay
$250.0 million
of outstanding bank indebtedness, with the balance used for general corporate purposes. The
4.5%
Senior Notes bear interest at a rate of
4.5%
per annum, which is payable semi-annually in arrears on each June 15th and December 15th. The Company may redeem all or a portion of the
4.5%
Senior Notes at any time prior to maturity at the redemption prices set forth in the Note Indenture governing the
4.5%
Senior Notes. The Company may issue additional debt from time to time pursuant to the Indenture. The Indenture and
4.5%
Senior Notes contain covenants that limit the Company’s ability to, among other things, incur certain liens securing indebtedness, engage in certain sale-leaseback transactions, and enter into certain consolidations, mergers, conveyances, transfers or leases of all or substantially all of the Company’s assets. The terms of the
4.5%
Senior Notes also require the Company to make an offer to repurchase the
4.5%
Senior Notes upon a change of control triggering event (as defined in the Indenture) at a price equal to
101%
of their principal amount plus accrued and unpaid interest, if any.
There are two key financial covenants that the Company is required to maintain in connection with the Revolving Facility and the Notes, a minimum interest coverage ratio of
3.0
to
1
and a maximum leverage ratio of
3.50
to
1
, which is the ratio of the Company’s consolidated total debt to its consolidated EBITDA. At
December 31, 2018
, the Company was in compliance with
52
both of these financial covenants. There are no financial covenants relating to the
4.5%
Senior Notes or
4.2%
Senior Notes; however, both are subject to cross-default provisions.
Total borrowings at
December 31, 2018
have scheduled maturities as follows:
|
(In thousands)
|
|||
|
2019
|
$
|
483
|
|
|
2020
|
300,595
|
|
|
|
2021
|
350,000
|
|
|
|
2022
|
—
|
|
|
|
2023
|
100,000
|
|
|
|
Thereafter
|
100,000
|
|
|
|
Total borrowings
|
$
|
851,078
|
|
7. Derivative Instruments
The Company enters into cash flow hedges from time to time to reduce the exposure to variability in certain expected future cash flows. The types of cash flow hedges the Company enters into include foreign currency exchange contracts designed to minimize the earnings impact on certain intercompany loans and interest rate exchange agreements that effectively convert a portion of floating-rate debt to fixed-rate debt and are designed to reduce the impact of interest rate changes on future interest expense.
The effective portion of gains or losses on interest rate exchange agreements is reported in accumulated other comprehensive income (loss) in shareholders’ equity and reclassified into net income in the same period or periods in which the hedged transaction affects net income. The remaining gain or loss in excess of the cumulative change in the present value of future cash flows or the hedged item, if any, is recognized in net income during the period of change. See Note 15 for the amount of loss reclassified into income for interest rate contracts for the years ended
December 31, 2018
,
2017
and
2016
. As of December 31, 2018, the Company did not have any interest rate contracts outstanding.
On April 15, 2010, the Company entered into a forward starting interest rate contract with a notional amount of
$300.0 million
and a settlement date in December 2010. This contract was entered into in anticipation of the issuance of the
4.5%
Senior Notes and was designed to lock in the market interest rate as of April 15, 2010. In December 2010, the Company settled and paid this interest rate contract for
$31.0 million
. The
$31.0 million
is being amortized into interest expense over the
10
year term of the
4.5%
Senior Notes, which results in an effective interest rate of
5.8%
.
On July 12, 2011, the Company entered into a forward starting interest rate contract with a notional amount of
$350.0 million
and a settlement date of
September 30, 2011
. This contract was entered into in anticipation of the issuance of the
4.2%
Senior Notes and was designed to lock in the market interest rate as of July 12, 2011. On September 29, 2011, the Company settled this interest rate contract for
$34.7 million
with a payment made on October 3, 2011. Simultaneously, the Company entered into a separate interest rate contract with a notional amount of
$350.0 million
and a settlement date of
February 28, 2012
. The contract was entered into in anticipation of the expected issuance of the
4.2%
Senior Notes and was designed to maintain the market rate as of July 12, 2011. In December 2011, the Company settled and paid the September interest rate contract for
$4.0 million
, resulting in a total settlement of
$38.7 million
. Of the
$38.7 million
,
$0.8 million
was recognized as other expense in 2011 and the balance of
$37.9 million
is being amortized into interest expense over the
10
year term of the
4.2%
Senior Notes, which results in an effective interest rate of
5.3%
.
The amount of expense reclassified into interest expense for interest rate contracts for the years ended
December 31, 2018
,
2017
and
2016
is
$6.5 million
,
$6.7 million
and
$6.9 million
, respectively.
Approximately
$6.3 million
of the pre-tax amount included in accumulated other comprehensive loss in shareholders’ equity at
December 31, 2018
will be recognized in net income over the next 12 months as the underlying hedged transactions are realized.
At December 31, 2017, the Company had outstanding foreign currency exchange contracts with a combined notional value of
€180 million
that were not designated as hedges for accounting purposes and, as a result, the change in the fair value of these foreign currency exchange contracts and the corresponding foreign currency gain or loss on the revaluation of the intercompany loans are
53
both recorded through earnings within Other (income) expense - net in the Consolidated Statements of Operations each period as incurred.
In April 2018, the Company settled all of its outstanding foreign currency exchange contracts in conjunction with its repayment of the underlying intercompany loans and did not extend these foreign currency exchange contracts. This resulted in the Company receiving
$6.6 million
of proceeds. During the years ended December 31, 2018 and 2017, the Company recorded gains of
$0.9 million
and
$19.8 million
, respectively, within Other (income) expense - net in the Consolidated Statements of Operations related to these foreign currency exchange contracts. During the years ended December 31, 2018 and 2017, the Company recorded foreign currency transaction losses of
$0.9 million
and
$20.2 million
, respectively, within Other (income) expense - net in the Consolidated Statements of Operations related to these intercompany loans. In connection with the elimination of the intercompany loans and their conversion to capital, the Company paid a
$2.2 million
stamp duty in Switzerland which was recorded within Selling, general and administrative expenses in the Consolidated Statements of Operations.
Fair values relating to derivative financial instruments reflect the estimated amounts that the Company would receive or pay to sell or buy the contracts based on quoted market prices of comparable contracts at each balance sheet date.
The following table sets forth the fair value amounts of derivative instruments held by the Company as of December 31,
2018
and
2017
:
|
Fair Value Assets (Liabilities)
|
|||||||||
|
December 31, 2018
|
December 31, 2017
|
Balance Sheet Caption
|
|||||||
|
(In thousands)
|
|||||||||
|
Foreign currency exchange contracts
|
$
|
—
|
|
$
|
5,779
|
|
Other current assets
|
||
8. Fair Value Measurements
ASC 820,
Fair Value Measurements and Disclosures,
defines fair value, provides guidance for measuring fair value and requires certain disclosures. This standard discusses valuation techniques, such as the market approach (comparable market prices), the income approach (present value of future income or cash flow), and the cost approach (cost to replace the service capacity of an asset or replacement cost). The standard utilizes a fair value hierarchy that prioritizes the inputs to valuation techniques used to measure fair value into three broad levels. The following is a brief description of those three levels:
•
Level 1: Observable inputs such as quoted prices (unadjusted) in active markets for identical assets or liabilities.
|
•
|
Level 2: Inputs, other than quoted prices that are observable for the asset or liability, either directly or indirectly. These include quoted prices for similar assets or liabilities in active markets and quoted prices for identical or similar assets or liabilities in markets that are not active.
|
•
Level 3: Unobservable inputs that reflect the reporting entity’s own assumptions.
The following table summarizes the basis used to measure the Company’s financial assets (liabilities) at fair value on a recurring basis in the balance sheets at
December 31, 2018
and
2017
:
|
|
Basis of Fair Value Measurements
|
||||||||||||||
|
|
Balance at December 31, 2018
|
Level 1
|
Level 2
|
Level 3
|
|||||||||||
|
|
(In thousands)
|
||||||||||||||
|
Available for sale securities
|
$
|
7,598
|
|
$
|
7,598
|
|
$
|
—
|
|
$
|
—
|
|
|||
|
Contingent consideration
|
3,375
|
|
—
|
|
—
|
|
3,375
|
|
|||||||
|
Basis of Fair Value Measurements
|
|||||||||||||||
|
Balance at December 31, 2017
|
Level 1
|
Level 2
|
Level 3
|
||||||||||||
|
|
(In thousands)
|
||||||||||||||
|
Available for sale securities
|
$
|
6,742
|
|
$
|
6,742
|
|
$
|
—
|
|
$
|
—
|
|
|||
|
Foreign currency exchange contracts
|
5,779
|
|
—
|
|
5,779
|
|
—
|
|
|||||||
54
There were no transfers of assets or liabilities between Level 1 and Level 2 in
2018
or
2017
.
The Company utilized a Monte Carlo Simulation during the earn-out period to determine the fair value of the contingent consideration associated with the acquisition of FLI. The
$3.4 million
represents management’s best estimate of the liability, based on a range of outcomes of FLI’s two-year operating results, from August 1, 2018 to July 31, 2020, and is expected to be paid during the third quarter of 2020. As of
December 31, 2018
, the
$3.4 million
of contingent consideration is included in Other noncurrent liabilities on the Consolidated Balance Sheets.
The carrying value of our cash and cash equivalents, accounts receivable, accounts payable and accrued expenses approximates their fair values because of the short term nature of these instruments. At
December 31, 2018
, the fair value of the outstanding indebtedness under our
3.2%
Senior Notes,
3.37%
Senior Notes,
4.5%
Senior Notes,
4.2%
Senior Notes and other borrowings based on quoted market prices and current market rates for debt with similar credit risk and maturity was approximately
$851.5 million
compared to the carrying value of
$850.4 million
. At
December 31, 2017
, the fair value of the outstanding indebtedness under our Revolving Facility,
3.2%
Senior Notes,
3.37%
Senior Notes,
4.5%
Senior Notes and
4.2%
Senior Notes based on quoted market prices and current market rates for debt with similar credit risk and maturity was approximately
$886.3 million
compared to the carrying value of
$861.0 million
. These fair value measurements are classified as Level 2 within the fair value hierarchy since they are determined based upon significant inputs observable in the market, including interest rates on recent financing transactions to entities with a credit rating similar to ours.
9. Commitments and Contingencies
The Company leases certain office facilities, warehouses and data processing equipment under operating leases. Rental expense totaled
$21.8 million
,
$19.0 million
and
$18.6 million
in
2018
,
2017
and
2016
, respectively.
The aggregate future minimum lease payments for leases as of
December 31, 2018
were as follows:
|
Lease Obligations
|
|||
|
|
|||
|
2019
|
$
|
17,509
|
|
|
2020
|
13,162
|
|
|
|
2021
|
10,516
|
|
|
|
2022
|
7,979
|
|
|
|
2023
|
6,535
|
|
|
|
2024 and thereafter
|
29,658
|
|
|
|
$
|
85,359
|
|
|
Warranty costs are provided for at the time of sale. The warranty provision is based on historical costs and adjusted for specific known claims. A rollforward of the warranty reserve is as follows:
|
2018
|
2017
|
2016
|
|||||||||
|
|
(In thousands)
|
||||||||||
|
Beginning balance at January 1
|
$
|
6,281
|
|
$
|
5,628
|
|
$
|
7,936
|
|
||
|
Provision for warranties
|
2,334
|
|
2,895
|
|
1,828
|
|
|||||
|
Claim settlements
|
(2,981
|
)
|
(2,317
|
)
|
(3,539
|
)
|
|||||
|
Other adjustments, including acquisitions, divestitures and currency translation
|
(331
|
)
|
75
|
|
(597
|
)
|
|||||
|
Ending balance at December 31
|
$
|
5,303
|
|
$
|
6,281
|
|
$
|
5,628
|
|
||
The Company and certain of its subsidiaries are involved in pending and threatened legal, regulatory and other proceedings arising in the ordinary course of business. These proceedings may pertain to matters such as product liability or contract disputes, and may also involve governmental inquiries, inspections, audits or investigations relating to issues such as tax matters, intellectual property, environmental, health and safety issues, governmental regulations, employment and other matters. Although the results of such legal proceedings cannot be predicted with certainty, the Company believes that the ultimate disposition of these matters
55
will not have a material adverse effect, individually or in the aggregate, on the Company’s business, financial condition, results of operations or cash flows.
10. Common and Preferred Stock
On
December 1, 2015
the Company’s Board of Directors approved a
$300.0 million
increase in the authorized level for repurchases of common stock. Repurchases under the program will be funded with future cash flow generation or borrowings available under the Revolving Facility. During
2018
, the Company repurchased a total of
1.3 million
shares at a cost of
$173.9 million
, compared to
0.3 million
shares purchased at a cost of
$29.1 million
in
2017
. As of
December 31, 2018
, the amount of share repurchase authorization remaining was
$377 million
.
At
December 31, 2018
and
2017
, the Company had
150 million
shares of authorized common stock, with a par value of
$.01
per share, and
five million
shares of authorized preferred stock, with a par value of
$.01
per share.
No
preferred stock was outstanding at
December 31, 2018
and
2017
.
11. Income Taxes
Pretax income for
2018
,
2017
and
2016
was taxed in the following jurisdictions:
|
2018
|
2017
|
2016
|
|||||||||
|
|
(In thousands)
|
||||||||||
|
U.S.
|
$
|
357,585
|
|
$
|
302,515
|
|
$
|
265,260
|
|
||
|
Foreign
|
171,354
|
|
152,758
|
|
103,252
|
|
|||||
|
Total
|
$
|
528,939
|
|
$
|
455,273
|
|
$
|
368,512
|
|
||
The provision (benefit) for income taxes for
2018
,
2017
and
2016
was as follows:
|
2018
|
2017
|
2016
|
|||||||||
|
|
(In thousands)
|
||||||||||
|
Current
|
|||||||||||
|
U.S.
|
$
|
67,793
|
|
$
|
91,641
|
|
$
|
67,668
|
|
||
|
State and local
|
8,056
|
|
9,342
|
|
4,503
|
|
|||||
|
Foreign
|
46,862
|
|
50,775
|
|
42,540
|
|
|||||
|
Total current
|
122,711
|
|
151,758
|
|
114,711
|
|
|||||
|
Deferred
|
|||||||||||
|
U.S.
|
(5,471
|
)
|
(36,390
|
)
|
(6,249
|
)
|
|||||
|
State and local
|
(17
|
)
|
3,305
|
|
(331
|
)
|
|||||
|
Foreign
|
1,143
|
|
(657
|
)
|
(10,728
|
)
|
|||||
|
Total deferred
|
(4,345
|
)
|
(33,742
|
)
|
(17,308
|
)
|
|||||
|
Total provision for income taxes
|
$
|
118,366
|
|
$
|
118,016
|
|
$
|
97,403
|
|
||
56
Deferred tax assets (liabilities) at
December 31, 2018
and
2017
were:
|
2018
|
2017
|
||||||
|
|
(In thousands)
|
||||||
|
Employee and retiree benefit plans
|
$
|
27,615
|
|
$
|
31,804
|
|
|
|
Capital loss carryforwards
|
12,754
|
|
12,853
|
|
|||
|
Depreciation and amortization
|
(168,485
|
)
|
(176,592
|
)
|
|||
|
Inventories
|
5,969
|
|
8,548
|
|
|||
|
Allowances and accruals
|
11,540
|
|
4,572
|
|
|||
|
Interest rate exchange agreement
|
3,543
|
|
5,007
|
|
|||
|
Other
|
(6,388
|
)
|
(8,019
|
)
|
|||
|
Total gross deferred tax (liabilities)
|
(113,452
|
)
|
(121,827
|
)
|
|||
|
Capital loss valuation allowance
|
(12,754
|
)
|
(12,853
|
)
|
|||
|
Total deferred tax (liabilities), net of valuation allowances
|
$
|
(126,206
|
)
|
$
|
(134,680
|
)
|
|
The deferred tax assets and liabilities recognized in the Company’s Consolidated Balance Sheets as of
December 31, 2018
and
2017
were:
|
2018
|
2017
|
||||||
|
|
(In thousands)
|
||||||
|
Noncurrent deferred tax asset - Other noncurrent assets
|
$
|
1,801
|
|
$
|
2,958
|
|
|
|
Noncurrent deferred tax liabilities - Deferred income taxes
|
(128,007
|
)
|
(137,638
|
)
|
|||
|
Net deferred tax liabilities
|
$
|
(126,206
|
)
|
$
|
(134,680
|
)
|
|
The Company had prepaid income taxes, recorded within Other current assets on the Consolidated Balance Sheets, of
$8.3 million
and
$40.9 million
as of December 31,
2018
and
2017
, respectively.
57
The provision for income taxes differs from the amount computed by applying the statutory federal income tax rate to pretax income. The computed amount and the differences for
2018
,
2017
and
2016
are as follows:
|
2018
|
2017
|
2016
|
|||||||||
|
|
(In thousands)
|
||||||||||
|
Pretax income
|
$
|
528,939
|
|
$
|
455,273
|
|
$
|
368,512
|
|
||
|
Provision for income taxes:
|
|||||||||||
|
Computed amount at statutory rate
|
$
|
111,077
|
|
$
|
159,346
|
|
$
|
128,979
|
|
||
|
State and local income tax (net of federal tax benefit)
|
8,280
|
|
5,841
|
|
4,070
|
|
|||||
|
Taxes on non-U.S. earnings-net of foreign tax credits
|
5,725
|
|
(24,914
|
)
|
(6,666
|
)
|
|||||
|
Global Intangible Lowed-Taxed Income
|
2,725
|
|
—
|
|
—
|
|
|||||
|
Foreign-Derived Intangible Income Deduction
|
(5,410
|
)
|
—
|
|
—
|
|
|||||
|
Effect of flow-through entities
|
1,215
|
|
192
|
|
(8,735
|
)
|
|||||
|
U.S. business tax credits
|
(3,056
|
)
|
(1,928
|
)
|
(1,665
|
)
|
|||||
|
Domestic activities production deduction
|
—
|
|
(8,516
|
)
|
(9,043
|
)
|
|||||
|
Capital loss on divestitures
|
—
|
|
(2,275
|
)
|
(23,444
|
)
|
|||||
|
Share-based payments
|
(9,348
|
)
|
(6,844
|
)
|
(6,520
|
)
|
|||||
|
Valuation allowance
|
—
|
|
(361
|
)
|
17,973
|
|
|||||
|
Impact of Tax Act
|
10,298
|
|
(100
|
)
|
—
|
|
|||||
|
Other
|
(3,140
|
)
|
(2,425
|
)
|
2,454
|
|
|||||
|
Total provision for income taxes
|
$
|
118,366
|
|
$
|
118,016
|
|
$
|
97,403
|
|
||
On December 22, 2017, the President signed into law the Tax Cuts and Jobs Act (the “Tax Act”). The Tax Act included significant changes to the existing tax law, including, but not limited to, a permanent reduction to the U.S. federal corporate income tax rate from 35% to 21%, effective January 1, 2018 and the creation of a modified territorial tax system with a one-time repatriation tax on certain deferred foreign income (“Transition Tax”). The income tax effects of the Tax Act on the Company are further described below.
The Company has
$18.2 million
and
$350 million
of permanently reinvested earnings of non-U.S. subsidiaries as of December 31, 2018 and 2017, respectively. The significant decrease in permanently reinvested earnings of non-U.S. subsidiaries was due to the Company’s removal of its permanently reinvested assertion on all non-U.S. subsidiaries except for its entity in India, mainly in response to the deemed distribution and repatriation tax incurred in 2017 as a result of the Tax Act. No deferred U.S. income taxes have been provided on the
$18.2 million
permanently reinvested earnings, as these earnings are considered to be reinvested for an indefinite period of time. It should also be noted that the aforementioned earnings will not incur U.S. taxes when ultimately repatriated other than potentially U.S. state and local taxes and/or U.S. federal income taxes on foreign exchange gains or losses crystalized on the distribution of such earnings. Such distributions could also be subject to additional foreign withholding and foreign income taxes. The amount of unrecognized deferred income tax liabilities on currently permanently reinvested earnings is estimated to be
$3.7 million
as of December 31, 2018.
During the years ended December 31, 2018, 2017 and 2016, the Company repatriated
$135 million
,
$3.3 million
and
$28.8 million
of foreign earnings, respectively. These actual distributions resulted in
no
incremental income tax expense,
$6.4 million
of incremental income tax benefit and
$2.7 million
of incremental income tax expense in 2018, 2017 and 2016, respectively. These repatriations represent distributions of previously taxed income as well as distributions from liquidating subsidiaries.
Because the changes included in the Tax Act were broad and complex, on December 22, 2017, the SEC issued Staff Accounting Bulletin (“SAB 118”), which provided guidance on accounting for the tax effects of the Tax Act. SAB 118 provided a measurement period that should not extend beyond one year from the Tax Act enactment date for companies to complete the accounting under ASC 740. In accordance with SAB 118, a company was required to reflect the income tax effects of those aspects of the Tax Act for which the accounting under ASC 740 was complete. To the extent that a company’s accounting for certain income tax effects of the Tax Act was incomplete but it was able to determine a reasonable estimate, it was required to record a provisional estimate to be included in the financial statements. As of December 31, 2018, the Company, as required under SAB 118, has completed the accounting for all of the enactment-date income tax effects of the Tax Act. The Company’s completed accounting of the enactment-date income tax effects of the Tax Act is as follows:
58
Deemed Repatriation Transition Tax:
The Deemed Repatriation Transition Tax is a tax on previously untaxed accumulated and current earnings and profits of certain foreign subsidiaries. To determine the amount of the Transition Tax, the Company had to determine, in addition to other factors, the amount of post-1986 earnings and profits of the relevant subsidiaries, as well as the amount of non-U.S. income taxes paid on such earnings. The Company was able to make a reasonable estimate of the Transition Tax and recorded a provisional Transition Tax obligation of
$30.3 million
for the year ended December 31, 2017. During the first quarter, the IRS released Revenue Procedure 2018-17 and Notice 2018-26, the effects of which increased the provisional Transition Tax by
$0.1 million
. The Company finalized its Transaction Tax obligation in the fourth quarter 2018 recording a
$3.9 million
tax benefit which, together with the first quarter adjustment, resulted in a final Transition Tax obligation of
$26.5 million
.
Reduction of U.S. federal corporate tax rate
: The Tax Act reduces the corporate tax rate to 21%, effective January 1, 2018. The Company recorded a decrease in its deferred tax liability of
$40.6 million
, with a corresponding adjustment to deferred income tax benefit of
$40.6 million
for the year ended December 31, 2017. The Company finalized the impact of the rate change on its deferred tax liability in the fourth quarter of 2018 recording an additional
$1.1 million
tax benefit. The total reduction to the deferred tax liability related to the rate change was
$41.7 million
.
Removal of Permanent Reinvestment Representation on certain undistributed foreign earnings
: As a result of the enactment of the Tax Act, the Company had decided to remove the Permanent Reinvestment Representation with respect to certain of its subsidiaries in Canada, Italy and Germany as of December 31, 2017. Under the mandatory repatriation provisions of the Tax Act, post-1986 undistributed earnings were taxed in the U.S. as if they were distributed before December 31, 2017. However, with the removal of the Permanent Reinvestment Representation with respect to select subsidiaries in Canada, Italy and Germany, the non-creditable withholding taxes and any local country taxes associated with future dividends from these subsidiaries were required to be recorded as deferred tax liabilities as of the end of 2017. The Company recorded a provisional increase in its deferred tax liability of
$9.2 million
, with a corresponding adjustment to deferred income tax expense of
$9.2 million
for the year ending December 31, 2017. During the second quarter, the deferred tax liability was reduced by
$1.4 million
to
$7.8 million
.
No
adjustments were made to the deferred tax liability during the third quarter of 2018. The Company removed the Permanent Reinvestment Representation during the fourth quarter of 2018 for all remaining non-U.S. subsidiaries except for its entity in India. This change resulted in an additional
$9.1 million
increase to its deferred tax liability with a corresponding adjustment to deferred tax expense.
Global intangible low taxed income (GILTI)
: The Tax Act creates a new requirement that certain income (i.e. GILTI) earned by controlled foreign corporations (CFCs) must be included currently in the gross income of the CFC’s U.S. shareholder. GILTI is the excess of the U.S. shareholder’s “net CFC tested income” over the net deemed intangible income return, which is currently defined as the excess of (1) 10% of the aggregate of the U.S. shareholder’s pro rata share of the qualified business asset investment of each CFC with respect to which it is a U.S. shareholder over (2) the amount of certain interest expense taken into account in the determination of net CFC-tested income. In January 2018, FASB released guidance on the accounting for the GILTI tax. The guidance indicates that either accounting for deferred taxes related to GILTI tax inclusions or treating the GILTI tax as a period cost are both acceptable methods subject to an accounting policy election. The Company will treat the GILTI tax as a period cost.
A reconciliation of the beginning and ending amount of unrecognized tax benefits for
2018
,
2017
and
2016
is as follows:
|
2018
|
2017
|
2016
|
|||||||||
|
|
(In thousands)
|
||||||||||
|
Beginning balance January 1
|
$
|
2,722
|
|
$
|
3,775
|
|
$
|
7,228
|
|
||
|
Gross increases for tax positions of prior years
|
2,308
|
|
537
|
|
201
|
|
|||||
|
Gross decreases for tax positions of prior years
|
(229
|
)
|
(587
|
)
|
(93
|
)
|
|||||
|
Settlements
|
(160
|
)
|
(604
|
)
|
(2,014
|
)
|
|||||
|
Lapse of statute of limitations
|
(571
|
)
|
(399
|
)
|
(1,547
|
)
|
|||||
|
Ending balance December 31
|
$
|
4,070
|
|
$
|
2,722
|
|
$
|
3,775
|
|
||
The Company recognizes interest and penalties related to uncertain tax positions in income tax expense. As of
December 31, 2018
,
2017
and
2016
, we had approximately
$0.1 million
,
$0.1 million
and
$0.1 million
, respectively, of accrued interest related
59
to uncertain tax positions. As of December 31, 2018 and 2017, the Company had
no
accrued penalties related to uncertain tax positions, while in 2016 we had approximately
$0.1 million
.
The total amount of unrecognized tax benefits that would affect the Company’s effective tax rate if recognized is
$3.0 million
,
$0.9 million
and
$1.8 million
as of
December 31, 2018
,
2017
and
2016
, respectively. The tax years 2012-2017 remain open to examination by major taxing jurisdictions. Due to the potential for resolution of federal, state and foreign examinations and the expiration of various statutes of limitation, it is reasonably possible that the Company’s gross unrecognized tax benefits balance may change within the next 12 months by a range of
zero
to
$1 million
.
The Company had net operating loss and credit carryforwards related to prior acquisitions for U.S. federal purposes at
December 31, 2018
and
2017
of
$1.3 million
and
$2.4
million, respectively. The U.S. federal net operating loss carryforwards are available for use against the Company’s consolidated U.S. federal taxable income and expire between 2021 and 2028. For non-U.S. purposes, the Company had net operating loss carryforwards at
December 31, 2018
and
2017
of
$29.5 million
and
$24.5
million, respectively, the majority of which relates to acquisitions. The entire balance of the non-U.S. net operating losses is available to be carried forward. At
December 31, 2018
and
2017
, the Company had U.S. state net operating loss carryforwards of approximately
$15.8 million
and
$6.7 million
, respectively. If unutilized, the U.S. state net operating loss will expire between 2019 and 2038. At
December 31, 2018
and
2017
, the Company recorded a valuation allowance against the deferred tax asset attributable to the U.S. state net operating loss of
$0.6 million
and
$0.1 million
, respectively.
The Company had a capital loss carryover for U.S. federal purposes at
December 31, 2018
and
2017
of approximately
$46.1 million
and
$46.0 million
, respectively. U.S. federal capital loss carryovers can be carried back three years and forward five years, thus, if unutilized, the U.S. federal capital loss carryover will expire in 2021. At
December 31, 2018
and
2017
, the Company recorded a valuation allowance against the deferred tax asset attributable to the U.S. federal capital loss carryover of
$9.7 million
and
$9.7 million
, respectively. At
December 31, 2018
and
2017
, the Company had U.S. state capital loss carryovers of
$62.7 million
and
$62.7 million
, respectively. If unutilized, the U.S. state capital loss carryovers will expire between 2021 and 2031. At
December 31, 2018
and
2017
, the Company recorded a valuation allowance against the deferred tax assets attributable to the U.S. state capital loss carryovers of
$0.8 million
and
$0.8 million
, respectively. At
December 31, 2018
and
2017
, the Company had a foreign capital loss carryforward of approximately
$13.4 million
and
$14.2 million
, respectively. The foreign capital loss can be carried forward indefinitely. At both
December 31, 2018
and
2017
, the Company has a full valuation allowance against the deferred tax asset attributable to the foreign capital loss.
12. Business Segments and Geographic Information
IDEX has
three
reportable business segments: Fluid & Metering Technologies, Health & Science Technologies and Fire & Safety/Diversified Products.
The Fluid & Metering Technologies segment designs, produces and distributes positive displacement pumps, flow meters, injectors, and other fluid-handling pump modules and systems and provides flow monitoring and other services for the food, chemical, general industrial, water & wastewater, agriculture and energy industries.
The Health & Science Technologies segment designs, produces and distributes a wide range of precision fluidics, rotary lobe pumps, centrifugal and positive displacement pumps, roll compaction and drying systems used in beverage, food processing, pharmaceutical and cosmetics, pneumatic components and sealing solutions, including very high precision, low-flow rate pumping solutions required in analytical instrumentation, clinical diagnostics and drug discovery, high performance molded and extruded sealing components, biocompatible medical devices and implantables, air compressors used in medical, dental and industrial applications, optical components and coatings for applications in the fields of scientific research, defense, biotechnology, aerospace, telecommunications and electronics manufacturing, laboratory and commercial equipment used in the production of micro and nano scale materials, precision photonic solutions used in life sciences, research and defense markets, and precision gear and peristaltic pump technologies that meet exacting original equipment manufacturer specifications.
The Fire & Safety/Diversified Products segment designs, produces and distributes firefighting pumps, valves and controls, rescue tools, lifting bags and other components and systems for the fire and rescue industry, engineered stainless steel banding and clamping devices used in a variety of industrial and commercial applications and precision equipment for dispensing, metering and mixing colorants and paints used in a variety of retail and commercial businesses around the world.
60
Information on the Company’s business segments is presented below based on the nature of products and services offered. The Company evaluates performance based on several factors, of which sales, operating income and operating margin are the primary financial measures. Intersegment sales are accounted for at fair value as if the sales were to third parties.
|
2018
|
2017
|
2016
|
|||||||||
|
|
(In thousands)
|
||||||||||
|
NET SALES
|
|||||||||||
|
Fluid & Metering Technologies
|
|||||||||||
|
External customers
|
$
|
951,275
|
|
$
|
880,648
|
|
$
|
848,708
|
|
||
|
Intersegment sales
|
277
|
|
309
|
|
393
|
|
|||||
|
Total segment sales
|
951,552
|
|
880,957
|
|
849,101
|
|
|||||
|
Health & Science Technologies
|
|||||||||||
|
External customers
|
895,970
|
|
819,719
|
|
744,380
|
|
|||||
|
Intersegment sales
|
449
|
|
412
|
|
429
|
|
|||||
|
Total segment sales
|
896,419
|
|
820,131
|
|
744,809
|
|
|||||
|
Fire & Safety/Diversified Products
|
|||||||||||
|
External customers
|
636,421
|
|
586,945
|
|
519,955
|
|
|||||
|
Intersegment sales
|
607
|
|
588
|
|
54
|
|
|||||
|
Total segment sales
|
637,028
|
|
587,533
|
|
520,009
|
|
|||||
|
Intersegment eliminations
|
(1,333
|
)
|
(1,309
|
)
|
(876
|
)
|
|||||
|
Total net sales
|
$
|
2,483,666
|
|
$
|
2,287,312
|
|
$
|
2,113,043
|
|
||
|
OPERATING INCOME (LOSS)
(1)
|
|||||||||||
|
Fluid & Metering Technologies
|
$
|
275,060
|
|
$
|
241,030
|
|
$
|
217,500
|
|
||
|
Health & Science Technologies
|
205,679
|
|
179,567
|
|
153,691
|
|
|||||
|
Fire & Safety/Diversified Products
|
168,601
|
|
147,028
|
|
123,605
|
|
|||||
|
Corporate office
(2)
|
(80,252
|
)
|
(65,069
|
)
|
(82,399
|
)
|
|||||
|
Total operating income
|
569,088
|
|
502,556
|
|
412,397
|
|
|||||
|
Interest expense
|
44,134
|
|
44,889
|
|
45,616
|
|
|||||
|
Other (income) expense - net
|
(3,985
|
)
|
2,394
|
|
(1,731
|
)
|
|||||
|
Income before taxes
|
$
|
528,939
|
|
$
|
455,273
|
|
$
|
368,512
|
|
||
61
|
2018
|
2017
|
2016
|
|||||||||
|
|
(In thousands)
|
||||||||||
|
ASSETS
|
|||||||||||
|
Fluid & Metering Technologies
|
$
|
1,107,777
|
|
$
|
1,101,580
|
|
$
|
1,065,670
|
|
||
|
Health & Science Technologies
|
1,329,368
|
|
1,323,373
|
|
1,266,036
|
|
|||||
|
Fire & Safety/Diversified Products
|
806,075
|
|
744,515
|
|
705,735
|
|
|||||
|
Corporate office
|
230,637
|
|
230,160
|
|
117,503
|
|
|||||
|
Total assets
|
$
|
3,473,857
|
|
$
|
3,399,628
|
|
$
|
3,154,944
|
|
||
|
DEPRECIATION AND AMORTIZATION
(3)
|
|||||||||||
|
Fluid & Metering Technologies
|
$
|
22,370
|
|
$
|
23,587
|
|
$
|
28,458
|
|
||
|
Health & Science Technologies
|
39,939
|
|
45,287
|
|
45,298
|
|
|||||
|
Fire & Safety/Diversified Products
|
14,493
|
|
14,541
|
|
11,956
|
|
|||||
|
Corporate office and other
|
742
|
|
801
|
|
1,180
|
|
|||||
|
Total depreciation and amortization
|
$
|
77,544
|
|
$
|
84,216
|
|
$
|
86,892
|
|
||
|
CAPITAL EXPENDITURES
|
|||||||||||
|
Fluid & Metering Technologies
|
$
|
19,541
|
|
$
|
18,218
|
|
$
|
16,389
|
|
||
|
Health & Science Technologies
|
26,039
|
|
16,340
|
|
15,665
|
|
|||||
|
Fire & Safety/Diversified Products
|
10,318
|
|
6,363
|
|
5,945
|
|
|||||
|
Corporate office and other
|
191
|
|
2,937
|
|
243
|
|
|||||
|
Total capital expenditures
|
$
|
56,089
|
|
$
|
43,858
|
|
$
|
38,242
|
|
||
|
(1)
|
Segment operating income (loss) excludes net unallocated corporate operating expenses.
|
|
(2)
|
2017 includes a
$9.3 million
gain on the sale of a business and 2016 includes a
$22.3 million
loss on the sale of businesses - net.
|
|
(3)
|
Excludes amortization of debt issuance expenses.
|
Information about the Company’s long-lived assets in different geographical regions for the years ended
December 31, 2018
,
2017
and
2016
is shown below.
|
2018
|
2017
|
2016
|
|||||||||
|
|
(In thousands)
|
||||||||||
|
LONG-LIVED ASSETS — PROPERTY, PLANT AND EQUIPMENT
|
|||||||||||
|
U.S.
|
$
|
171,111
|
|
$
|
145,808
|
|
$
|
152,504
|
|
||
|
North America, excluding U.S.
|
3,398
|
|
3,627
|
|
1,533
|
|
|||||
|
Europe
|
85,100
|
|
85,932
|
|
71,681
|
|
|||||
|
Asia
|
21,355
|
|
22,613
|
|
21,793
|
|
|||||
|
Other
|
256
|
|
370
|
|
305
|
|
|||||
|
Total long-lived assets - net
|
$
|
281,220
|
|
$
|
258,350
|
|
$
|
247,816
|
|
||
62
13. Restructuring
During 2018, the first and fourth quarters of 2017 and the fourth quarter of 2016, the Company recorded restructuring costs as part of restructuring initiatives that support the implementation of key strategic efforts designed to facilitate long-term, sustainable growth through cost reduction actions, primarily consisting of employee reductions and facility rationalization. The costs incurred related to these initiatives were included in Restructuring expenses in the Consolidated Statements of Operations while the related accruals were included in Accrued expenses in the Consolidated Balance Sheets. Severance costs primarily consisted of severance benefits through payroll continuation, COBRA subsidies, outplacement services, conditional separation costs and employer tax liabilities, while exit costs primarily consisted of asset disposals or impairments and lease exit and contract termination costs.
2018
Initiative
During
2018
, the Company recorded pre-tax restructuring expenses totaling
$12.1 million
related to the
2018
restructuring initiative. These expenses consisted of employee severance related to employee reductions across various functional areas as well as facility rationalization and contract termination costs. Severance payments will be substantially paid by the end of 2019 using cash from operations.
Pre-tax restructuring expenses by segment for the
2018
initiative were as follows:
|
Severance
Costs |
Exit Costs
|
Total
|
|||||||||
|
|
(In thousands)
|
||||||||||
|
Fluid & Metering Technologies
|
$
|
2,305
|
|
$
|
153
|
|
$
|
2,458
|
|
||
|
Health & Science Technologies
|
5,454
|
|
450
|
|
5,904
|
|
|||||
|
Fire & Safety/Diversified Products
|
2,184
|
|
—
|
|
2,184
|
|
|||||
|
Corporate/Other
|
1,537
|
|
—
|
|
1,537
|
|
|||||
|
Total restructuring costs
|
$
|
11,480
|
|
$
|
603
|
|
$
|
12,083
|
|
||
2017
Initiative
During the fourth quarter of
2017
, the Company recorded pre-tax restructuring expenses totaling
$3.7 million
related to the
2017
restructuring initiative. These expenses consisted of employee severance related to employee reductions across various functional areas as well as facility rationalization and contract termination costs. Severance payments were fully paid by the end of 2018 using cash from operations.
Pre-tax restructuring expenses by segment for the
2017
initiative were as follows:
|
Severance Costs
|
Exit Costs
|
Total Restructuring Costs
|
|||||||||
|
|
(In thousands)
|
||||||||||
|
Fluid & Metering Technologies
|
$
|
1,375
|
|
$
|
433
|
|
$
|
1,808
|
|
||
|
Health & Science Technologies
|
1,510
|
|
158
|
|
1,668
|
|
|||||
|
Fire & Safety/Diversified Products
|
182
|
|
—
|
|
182
|
|
|||||
|
Corporate/Other
|
—
|
|
—
|
|
—
|
|
|||||
|
Total restructuring costs
|
$
|
3,067
|
|
$
|
591
|
|
$
|
3,658
|
|
||
2016
Initiative
During the first quarter of 2017, the Company recorded pre-tax restructuring expenses totaling
$4.8 million
related to the 2016 restructuring initiative. During the fourth quarter of 2016, the Company recorded pre-tax restructuring expenses totaling
$3.7 million
related to the 2016 restructuring initiative. These expenses consisted of employee severance related to employee reductions across various functional areas as well as facility rationalization costs. Severance payments were substantially paid by the end of 2017 using cash from operations.
63
Pre-tax restructuring expenses by segment for the
2016
initiative were as follows:
|
2017
|
2016
|
||||||||||||||
|
Severance Costs
|
Exit Costs
|
Total Restructuring Costs
|
Total Restructuring Costs
|
||||||||||||
|
|
(In thousands)
|
||||||||||||||
|
Fluid & Metering Technologies
|
$
|
1,566
|
|
$
|
—
|
|
$
|
1,566
|
|
$
|
932
|
|
|||
|
Health & Science Technologies
|
2,470
|
|
558
|
|
3,028
|
|
1,117
|
|
|||||||
|
Fire & Safety/Diversified Products
|
73
|
|
—
|
|
73
|
|
1,425
|
|
|||||||
|
Corporate/Other
|
130
|
|
—
|
|
130
|
|
200
|
|
|||||||
|
Total restructuring costs
|
$
|
4,239
|
|
$
|
558
|
|
$
|
4,797
|
|
$
|
3,674
|
|
|||
Restructuring accruals of
$6.2 million
and
$4.2 million
at December 31,
2018
and
2017
, respectively, are reflected in Accrued expenses in our Consolidated Balance Sheets as follows:
|
Restructuring
Initiatives |
|||
|
|
(In thousands)
|
||
|
Balance at January 1, 2017
|
$
|
3,893
|
|
|
Restructuring expenses
|
8,455
|
|
|
|
Payments, utilization and other
|
(8,168
|
)
|
|
|
Balance at December 31, 2017
|
4,180
|
|
|
|
Restructuring expenses
|
12,083
|
|
|
|
Payments, utilization and other
|
(10,093
|
)
|
|
|
Balance at December 31, 2018
|
$
|
6,170
|
|
14. Share-Based Compensation
The Company maintains
two
share-based compensation plans for executives, non-employee directors and certain key employees that authorize the granting of stock options, restricted stock, performance share units and other types of awards consistent with the purpose of the plans. The number of shares authorized for issuance under the Company’s plans as of
December 31, 2018
totaled
15.6 million
, of which
4.3 million
shares were available for future issuance. The Company’s policy is to recognize compensation cost on a straight-line basis, assuming forfeitures, over the requisite service period for the entire award.
Stock Options
Stock options granted under the Company’s plans are generally non-qualified and are granted
with an exercise price equal to the market price of the Company’s stock at the date of grant. The majority of the options issued to employees become exercisable in four equal installments, beginning one year from the date of grant, and generally expire
10 years
from the date of grant. Stock options granted to non-employee directors cliff vest after
one year
.
Weighted average option fair values and assumptions for the period are as follows:
|
|
Years Ended December 31,
|
||||
|
|
2018
|
2017
|
2016
|
||
|
Weighted average fair value of grants
|
$38.13
|
$24.19
|
$18.56
|
||
|
Dividend yield
|
1.07%
|
1.45%
|
1.69%
|
||
|
Volatility
|
28.46%
|
29.41%
|
29.70%
|
||
|
Risk-free interest rate
|
2.03% - 3.17%
|
0.83% - 3.04%
|
0.53% - 2.49%
|
||
|
Expected life (in years)
|
5.83
|
5.83
|
5.91
|
||
64
The assumptions are as follows:
|
•
|
The Company estimated volatility using its historical share price performance over the contractual term of the option.
|
|
•
|
The Company uses historical data to estimate the expected life of the option. The expected life assumption for the years ended
December 31, 2018
,
2017
and
2016
is an output of the Binomial lattice option-pricing model, which incorporates vesting provisions, rate of voluntary exercise and rate of post-vesting termination over the contractual life of the option to define expected employee behavior.
|
|
•
|
The risk-free interest rate is based on the U.S. Treasury yield curve in effect at the time of grant for periods within the contractual life of the option. For the years ended
December 31, 2018
,
2017
and
2016
, we present the range of risk-free one-year forward rates, derived from the U.S. treasury yield curve, utilized in the Binomial lattice option-pricing model.
|
|
•
|
The expected dividend yield is based on the Company’s current dividend yield as the best estimate of projected dividend yield for periods within the contractual life of the option.
|
A summary of the Company’s stock option activity as of
December 31, 2018
, and changes during the year ended
December 31, 2018
is presented as follows:
|
Stock Options
|
Shares
|
Weighted
Average Price |
Weighted-Average
Remaining Contractual Term |
Aggregate
Intrinsic Value |
||||||||
|
Outstanding at January 1, 2018
|
1,924,683
|
|
$
|
71.07
|
|
6.87
|
$
|
117,209,218
|
|
|||
|
Granted
|
314,895
|
|
138.40
|
|
||||||||
|
Exercised
|
(455,558
|
)
|
60.81
|
|
||||||||
|
Forfeited/Expired
|
(70,017
|
)
|
97.68
|
|
||||||||
|
Outstanding at December 31, 2018
|
1,714,003
|
|
$
|
85.08
|
|
6.70
|
$
|
74,191,783
|
|
|||
|
Vested and expected to vest at December 31, 2018
|
1,635,247
|
|
$
|
83.77
|
|
6.61
|
$
|
72,632,325
|
|
|||
|
Exercisable at December 31, 2018
|
836,917
|
|
$
|
66.52
|
|
5.26
|
$
|
50,027,326
|
|
|||
The intrinsic value for stock options outstanding and exercisable is defined as the difference between the market value of the Company’s common stock as of the end of the period and the grant price. The total intrinsic value of options exercised in
2018
,
2017
and
2016
was
$38.0 million
,
$26.1 million
and
$26.5 million
, respectively. In
2018
,
2017
and
2016
, cash received from options exercised was
$27.6 million
,
$22.9 million
and
$30.2 million
, respectively, while the actual tax benefit realized for the tax deductions from stock options exercised totaled
$8.0 million
,
$9.5 million
and
$9.6 million
, respectively.
Total compensation cost for stock options is recorded in the Consolidated Statements of Operations as follows:
|
|
Years Ended December 31,
|
||||||||||
|
|
2018
|
2017
|
2016
|
||||||||
|
|
(In thousands)
|
||||||||||
|
Cost of goods sold
|
$
|
470
|
|
$
|
428
|
|
$
|
427
|
|
||
|
Selling, general and administrative expenses
|
8,313
|
|
7,347
|
|
6,561
|
|
|||||
|
Total expense before income taxes
|
8,783
|
|
7,775
|
|
6,988
|
|
|||||
|
Income tax benefit
|
(1,616
|
)
|
(2,485
|
)
|
(2,213
|
)
|
|||||
|
Total expense after income taxes
|
$
|
7,167
|
|
$
|
5,290
|
|
$
|
4,775
|
|
||
As of
December 31, 2018
, there was
$13.7 million
of total unrecognized compensation cost related to stock options that is expected to be recognized over a weighted-average period of
1.3 years
.
Restricted Stock
Restricted stock awards generally cliff vest after
three
years for employees and non-employee directors. Unvested restricted stock carries dividend and voting rights and the sale of the shares is restricted prior to the date of vesting. Dividends are paid on restricted stock awards and their fair value is equal to the market price of the Company’s stock at the date of the grant. A summary of the Company’s restricted stock activity as of December 31,
2018
, and changes during the year ending December 31,
2018
is as follows:
65
|
Restricted Stock
|
Shares
|
Weighted-Average
Grant Date Fair Value |
||||
|
Unvested at January 1, 2018
|
182,023
|
|
$
|
83.37
|
|
|
|
Granted
|
46,460
|
|
138.30
|
|
||
|
Vested
|
(68,172
|
)
|
79.19
|
|
||
|
Forfeited
|
(12,270
|
)
|
95.79
|
|
||
|
Unvested at December 31, 2018
|
148,041
|
|
$
|
101.50
|
|
|
Total compensation cost for restricted stock is recorded in the Consolidated Statements of Operations as follows:
|
|
Years Ended December 31,
|
||||||||||
|
|
2018
|
2017
|
2016
|
||||||||
|
|
(In thousands)
|
||||||||||
|
Cost of goods sold
|
$
|
367
|
|
$
|
335
|
|
$
|
390
|
|
||
|
Selling, general and administrative expenses
|
4,201
|
|
4,772
|
|
4,401
|
|
|||||
|
Total expense before income taxes
|
4,568
|
|
5,107
|
|
4,791
|
|
|||||
|
Income tax benefit
|
(825
|
)
|
(1,654
|
)
|
(1,410
|
)
|
|||||
|
Total expense after income taxes
|
$
|
3,743
|
|
$
|
3,453
|
|
$
|
3,381
|
|
||
As of
December 31, 2018
, there was
$5.5 million
of total unrecognized compensation cost related to restricted stock that is expected to be recognized over a weighted-average period of
1.1 years
.
Cash-Settled Restricted Stock
The Company also maintains a cash-settled share based compensation plan for certain employees. Cash-settled restricted stock awards generally cliff vest after
three years
. Dividend equivalents are paid on certain cash-settled restricted stock awards. A summary of the Company’s unvested cash-settled restricted stock activity as of December 31,
2018
, and changes during the year ending December 31,
2018
is as follows:
|
Cash-Settled Restricted Stock
|
Shares
|
Weighted-Average
Fair Value |
||||
|
Unvested at January 1, 2018
|
94,730
|
|
$
|
131.97
|
|
|
|
Granted
|
30,795
|
|
137.82
|
|
||
|
Vested
|
(27,880
|
)
|
137.11
|
|
||
|
Forfeited
|
(9,420
|
)
|
126.26
|
|
||
|
Unvested at December 31, 2018
|
88,225
|
|
$
|
126.26
|
|
|
Total compensation cost for cash-settled restricted stock is recorded in the Consolidated Statements of Operations as follows:
|
Years Ended December 31,
|
|||||||||||
|
2018
|
2017
|
2016
|
|||||||||
|
|
(In thousands)
|
||||||||||
|
Cost of goods sold
|
$
|
809
|
|
$
|
1,357
|
|
$
|
764
|
|
||
|
Selling, general and administrative expenses
|
2,391
|
|
3,241
|
|
2,224
|
|
|||||
|
Total expense before income taxes
|
3,200
|
|
4,598
|
|
2,988
|
|
|||||
|
Income tax benefit
|
(337
|
)
|
(808
|
)
|
(419
|
)
|
|||||
|
Total expense after income taxes
|
$
|
2,863
|
|
$
|
3,790
|
|
$
|
2,569
|
|
||
At December 31,
2018
and
2017
, the Company has
$4.5 million
and
$4.5 million
, respectively, included in Accrued expenses in the Consolidated Balance Sheets and
$2.4 million
and
$3.0 million
, respectively, included in Other non-current liabilities.
66
Performance Share Units
Beginning in 2013, the Company granted performance share units to selected key employees that may be earned based on IDEX total shareholder return over the three-year period following the date of grant. Performance share units are expected to be made annually and are paid out at the end of a
three
-year period based on the Company’s performance. Performance is measured by determining the percentile rank of the total shareholder return of IDEX common stock in relation to the total shareholder return of the S&P Midcap 400 Industrial Group (for awards granted prior to 2016) or the Russell Midcap Index (for awards granted in 2016 - 2018) for the three-year period following the date of grant. The payment of awards following the three-year award period will be based on performance achieved in accordance with the scale set forth in the plan agreement and may range from
0
percent to
250
percent of the initial grant. A target payout of
100
percent is earned if total shareholder return is equal to the 50
th
percentile of the peer group. Performance share units earn dividend equivalents for the award period, which will be paid to participants with the award payout at the end of the period based on the actual number of performance share units that are earned. Payments made at the end of the award period will be in the form of stock for performance share units and will be in cash for dividend equivalents. The Company’s performance share awards are considered performance condition awards and the grant date fair value of the awards, based on a Monte Carlo simulation model, is expensed ratably over the three-year term of the awards. The Company granted approximately
0.1 million
of performance share units in each of
2018
,
2017
and
2016
.
Weighted average performance share unit fair values and assumptions for the period specified are as follows:
|
Years Ended December 31,
|
|||||
|
|
2018
|
2017
|
2016
|
||
|
Weighted average fair value of grants
|
$216.59
|
$115.74
|
$111.42
|
||
|
Dividend yield
|
—%
|
—%
|
—%
|
||
|
Volatility
|
17.42%
|
17.36%
|
17.99%
|
||
|
Risk-free interest rate
|
2.40%
|
1.45%
|
0.89%
|
||
|
Expected life (in years)
|
2.85
|
2.85
|
2.86
|
||
The assumptions are as follows:
|
•
|
The Company estimated volatility using its historical share price performance over the remaining performance period as of the grant date.
|
|
•
|
The Company uses a Monte Carlo simulation model that uses an expected life commensurate with the performance period. As a result, the expected life of the performance share units was assumed to be the period from the grant date to the end of the performance period.
|
|
•
|
The risk-free interest rate is based on the U.S. Treasury yield curve in effect at the time of grant with a term commensurate with the remaining performance period.
|
|
•
|
Total Shareholder Return is determined assuming that dividends are reinvested in the issuing entity over the performance period, which is mathematically equivalent to utilizing a
0%
dividend yield.
|
A summary of the Company’s performance share unit activity as of
December 31, 2018
, and changes during the year ending
December 31, 2018
, is as follows:
|
Performance Share Units
|
Shares
|
Weighted-Average
Grant Date Fair Value |
||||
|
Unvested at January 1, 2018
|
136,870
|
|
$
|
113.81
|
|
|
|
Granted
|
52,375
|
|
216.59
|
|
||
|
Vested
|
(69,995
|
)
|
111.42
|
|
||
|
Forfeited
|
(8,095
|
)
|
139.17
|
|
||
|
Unvested at December 31, 2018
|
111,155
|
|
$
|
142.42
|
|
|
Awards that vested in
2018
will result in
174,994
shares being issued in
2019
.
67
Total compensation cost for performance share units is as follows:
|
Years Ended December 31,
|
|||||||||||
|
2018
|
2017
|
2016
|
|||||||||
|
(In thousands)
|
|||||||||||
|
Cost of goods sold
|
$
|
—
|
|
$
|
—
|
|
$
|
—
|
|
||
|
Selling, general and administrative expenses
|
8,203
|
|
6,925
|
|
5,559
|
|
|||||
|
Total expense before income taxes
|
8,203
|
|
6,925
|
|
5,559
|
|
|||||
|
Income tax benefit
|
(1,586
|
)
|
(2,342
|
)
|
(1,859
|
)
|
|||||
|
Total expense after income taxes
|
$
|
6,617
|
|
$
|
4,583
|
|
$
|
3,700
|
|
||
As of
December 31, 2018
, there was
$8.2 million
of total unrecognized compensation cost related to performance shares that is expected to be recognized over a weighted-average period of
1.0 year
.
15. Other Comprehensive Income (Loss)
The components of Other comprehensive income (loss) are as follows:
|
|
For the Year Ended December 31, 2018
|
For the Year Ended December 31, 2017
|
|||||||||||||||||||||
|
|
Pre-tax
|
Tax
|
Net of tax
|
Pre-tax
|
Tax
|
Net of tax
|
|||||||||||||||||
|
|
(In thousands)
|
||||||||||||||||||||||
|
Foreign currency translation adjustments
|
|||||||||||||||||||||||
|
Cumulative translation adjustment
|
$
|
(48,114
|
)
|
$
|
—
|
|
$
|
(48,114
|
)
|
$
|
110,421
|
|
$
|
—
|
|
$
|
110,421
|
|
|||||
|
Reclassification of foreign currency translation to earnings upon sale of business
|
—
|
|
—
|
|
—
|
|
2,749
|
|
—
|
|
2,749
|
|
|||||||||||
|
Tax effect of reversal of indefinite assertion on certain intercompany loans
|
—
|
|
—
|
|
—
|
|
(3,932
|
)
|
—
|
|
(3,932
|
)
|
|||||||||||
|
Foreign currency translation adjustments
|
(48,114
|
)
|
—
|
|
(48,114
|
)
|
109,238
|
|
—
|
|
109,238
|
|
|||||||||||
|
Pension and other postretirement adjustments
|
|||||||||||||||||||||||
|
Net gain (loss) arising during the year
|
9,963
|
|
(2,375
|
)
|
7,588
|
|
(5,355
|
)
|
828
|
|
(4,527
|
)
|
|||||||||||
|
Amortization/recognition of settlement loss
|
2,938
|
|
(701
|
)
|
2,237
|
|
3,814
|
|
(589
|
)
|
3,225
|
|
|||||||||||
|
Pension and other postretirement adjustments
|
12,901
|
|
(3,076
|
)
|
9,825
|
|
(1,541
|
)
|
239
|
|
(1,302
|
)
|
|||||||||||
|
Reclassification adjustments for derivatives
|
6,475
|
|
(1,469
|
)
|
5,006
|
|
6,655
|
|
(2,445
|
)
|
4,210
|
|
|||||||||||
|
Total other comprehensive income (loss)
|
$
|
(28,738
|
)
|
$
|
(4,545
|
)
|
$
|
(33,283
|
)
|
$
|
114,352
|
|
$
|
(2,206
|
)
|
$
|
112,146
|
|
|||||
68
|
|
For the Year Ended December 31, 2016
|
||||||||||
|
|
Pre-tax
|
Tax
|
Net of tax
|
||||||||
|
|
(In thousands)
|
||||||||||
|
Foreign currency translation adjustments
|
|||||||||||
|
Cumulative translation adjustment
|
$
|
(76,822
|
)
|
$
|
—
|
|
$
|
(76,822
|
)
|
||
|
Reclassification of foreign currency translation to
earnings upon sale of business
|
14,257
|
|
—
|
|
14,257
|
|
|||||
|
Tax effect of reversal of indefinite assertion on
certain intercompany loans
|
—
|
|
—
|
|
—
|
|
|||||
|
Foreign currency translation adjustments
|
(62,565
|
)
|
—
|
|
(62,565
|
)
|
|||||
|
Pension and other postretirement adjustments
|
|||||||||||
|
Net gain (loss) arising during the year
|
(1,927
|
)
|
789
|
|
(1,138
|
)
|
|||||
|
Amortization/recognition of settlement loss
|
7,083
|
|
(2,896
|
)
|
4,187
|
|
|||||
|
Pension and other postretirement adjustments, net
|
5,156
|
|
(2,107
|
)
|
3,049
|
|
|||||
|
Reclassification adjustments for derivatives
|
6,851
|
|
(2,490
|
)
|
4,361
|
|
|||||
|
Total other comprehensive income (loss)
|
$
|
(50,558
|
)
|
$
|
(4,597
|
)
|
$
|
(55,155
|
)
|
||
Amounts reclassified from accumulated other comprehensive income (loss) to net income are summarized as follows:
|
|
For the Year Ended December 31,
|
|
||||||||||
|
|
2018
|
2017
|
2016
|
Income Statement Caption
|
||||||||
|
Foreign currency translation:
|
||||||||||||
|
Reclassification upon sale of business
|
$
|
—
|
|
$
|
2,749
|
|
$
|
14,257
|
|
Loss (gain) on sale of businesses - net
|
||
|
Total before tax
|
—
|
|
2,749
|
|
14,257
|
|
||||||
|
Provision for income taxes
|
—
|
|
—
|
|
—
|
|
||||||
|
Total net of tax
|
$
|
—
|
|
$
|
2,749
|
|
$
|
14,257
|
|
|||
|
Pension and other postretirement plans:
|
||||||||||||
|
Amortization of service cost
|
$
|
3,246
|
|
$
|
3,580
|
|
$
|
3,529
|
|
Other (income) expense - net
|
||
|
Recognition of settlement loss
|
(308
|
)
|
234
|
|
3,554
|
|
Other (income) expense - net
|
|||||
|
Total before tax
|
2,938
|
|
3,814
|
|
7,083
|
|
||||||
|
Provision for income taxes
|
(701
|
)
|
(589
|
)
|
(2,896
|
)
|
||||||
|
Total net of tax
|
$
|
2,237
|
|
$
|
3,225
|
|
$
|
4,187
|
|
|||
|
Derivatives:
|
||||||||||||
|
Reclassification adjustments
|
$
|
6,475
|
|
$
|
6,655
|
|
$
|
6,851
|
|
Interest expense
|
||
|
Total before tax
|
6,475
|
|
6,655
|
|
6,851
|
|
||||||
|
Provision for income taxes
|
(1,469
|
)
|
(2,445
|
)
|
(2,490
|
)
|
||||||
|
Total net of tax
|
$
|
5,006
|
|
$
|
4,210
|
|
$
|
4,361
|
|
|||
16. Retirement Benefits
The Company sponsors several qualified and nonqualified pension plans and other postretirement plans for its employees. The Company uses a measurement date of December 31 for its defined benefit pension plans and post retirement medical plans. The Company employs the measurement date provisions of ASC 715,
Compensation-Retirement Benefits
, which require the measurement date of plan assets and liabilities to coincide with the sponsor’s year end.
During 2016, the Company offered a voluntary lump-sum pension payment opportunity to certain terminated vested U.S. pension plan participants. Total lump-sum payments of
$11.0 million
were made for those participants electing to receive lump sums using pension plan assets. The Company recognized pretax settlement losses of
$3.5 million
in the fourth quarter of 2016 for those plans where the settlement payment exceeded the sum of the plans’ service and interest costs.
69
The following table provides a reconciliation of the changes in the benefit obligations and fair value of plan assets over the two-year period ended
December 31, 2018
and a statement of the funded status at December 31 for both years.
|
|
Pension Benefits
|
Other Benefits
|
|||||||||||||||||||||
|
|
2018
|
2017
|
2018
|
2017
|
|||||||||||||||||||
|
|
U.S.
|
Non-U.S.
|
U.S.
|
Non-U.S.
|
|
|
|||||||||||||||||
|
|
(In thousands)
|
||||||||||||||||||||||
|
CHANGE IN BENEFIT OBLIGATION
|
|||||||||||||||||||||||
|
Obligation at January 1
|
$
|
91,335
|
|
$
|
97,451
|
|
$
|
90,256
|
|
$
|
87,764
|
|
$
|
26,068
|
|
$
|
24,636
|
|
|||||
|
Service cost
|
886
|
|
2,105
|
|
976
|
|
1,975
|
|
668
|
|
610
|
|
|||||||||||
|
Interest cost
|
2,634
|
|
1,389
|
|
2,677
|
|
1,283
|
|
810
|
|
818
|
|
|||||||||||
|
Plan amendments
|
—
|
|
52
|
|
—
|
|
—
|
|
|
|
—
|
|
|||||||||||
|
Benefits paid
|
(5,171
|
)
|
(2,791
|
)
|
(6,258
|
)
|
(1,942
|
)
|
(847
|
)
|
(738
|
)
|
|||||||||||
|
Actuarial loss (gain)
|
(4,497
|
)
|
(3,378
|
)
|
3,684
|
|
(15
|
)
|
(3,930
|
)
|
592
|
|
|||||||||||
|
Currency translation
|
—
|
|
(3,335
|
)
|
—
|
|
9,323
|
|
(176
|
)
|
150
|
|
|||||||||||
|
Settlements
|
(12
|
)
|
(2,313
|
)
|
—
|
|
(2,452
|
)
|
|
|
—
|
|
|||||||||||
|
Acquisition/Divestiture
|
—
|
|
—
|
|
—
|
|
(482
|
)
|
|
|
—
|
|
|||||||||||
|
Other
|
—
|
|
609
|
|
—
|
|
1,997
|
|
|
|
—
|
|
|||||||||||
|
Obligation at December 31
|
$
|
85,175
|
|
$
|
89,789
|
|
$
|
91,335
|
|
$
|
97,451
|
|
$
|
22,593
|
|
$
|
26,068
|
|
|||||
|
CHANGE IN PLAN ASSETS
|
|||||||||||||||||||||||
|
Fair value of plan assets at January 1
|
$
|
76,041
|
|
$
|
36,316
|
|
$
|
73,688
|
|
$
|
32,586
|
|
$
|
—
|
|
$
|
—
|
|
|||||
|
Actual return on plan assets
|
2,070
|
|
496
|
|
5,046
|
|
1,792
|
|
—
|
|
—
|
|
|||||||||||
|
Employer contributions
|
10,652
|
|
2,345
|
|
3,565
|
|
2,702
|
|
847
|
|
738
|
|
|||||||||||
|
Benefits paid
|
(5,171
|
)
|
(2,791
|
)
|
(6,258
|
)
|
(1,942
|
)
|
(847
|
)
|
(738
|
)
|
|||||||||||
|
Currency translation
|
|
|
(1,130
|
)
|
—
|
|
2,446
|
|
—
|
|
—
|
|
|||||||||||
|
Settlements
|
|
|
(2,313
|
)
|
—
|
|
(2,452
|
)
|
—
|
|
—
|
|
|||||||||||
|
Acquisition/Divestiture
|
|
|
|
|
—
|
|
—
|
|
—
|
|
—
|
|
|||||||||||
|
Other
|
(12
|
)
|
609
|
|
—
|
|
1,184
|
|
—
|
|
—
|
|
|||||||||||
|
Fair value of plan assets at December 31
|
$
|
83,580
|
|
$
|
33,532
|
|
$
|
76,041
|
|
$
|
36,316
|
|
$
|
—
|
|
$
|
—
|
|
|||||
|
Funded status at December 31
|
$
|
(1,595
|
)
|
$
|
(56,257
|
)
|
$
|
(15,294
|
)
|
$
|
(61,135
|
)
|
$
|
(22,593
|
)
|
$
|
(26,068
|
)
|
|||||
|
COMPONENTS ON THE CONSOLIDATED BALANCE SHEETS
|
|||||||||||||||||||||||
|
Other noncurrent assets
|
$
|
3,058
|
|
$
|
—
|
|
$
|
—
|
|
$
|
—
|
|
$
|
—
|
|
$
|
—
|
|
|||||
|
Current liabilities
|
$
|
(556
|
)
|
$
|
(1,174
|
)
|
$
|
(658
|
)
|
$
|
(1,159
|
)
|
$
|
(1,116
|
)
|
$
|
(1,034
|
)
|
|||||
|
Other noncurrent liabilities
|
(4,097
|
)
|
(55,083
|
)
|
(14,636
|
)
|
(59,976
|
)
|
(21,477
|
)
|
(25,034
|
)
|
|||||||||||
|
Net liability at December 31
|
$
|
(1,595
|
)
|
$
|
(56,257
|
)
|
$
|
(15,294
|
)
|
$
|
(61,135
|
)
|
$
|
(22,593
|
)
|
$
|
(26,068
|
)
|
|||||
The accumulated benefit obligation (“ABO”) for all defined benefit pension plans was
$169.5 million
and
$182.7 million
at
December 31, 2018
and
2017
, respectively.
The weighted average assumptions used in the measurement of the Company’s benefit obligation at
December 31, 2018
and
2017
were as follows:
|
|
U.S. Plans
|
Non-U.S. Plans
|
Other Benefits
|
||||||||||||||
|
|
2018
|
2017
|
2018
|
2017
|
2018
|
2017
|
|||||||||||
|
Discount rate
|
4.10
|
%
|
3.46
|
%
|
2.07
|
%
|
1.82
|
%
|
4.11
|
%
|
3.50
|
%
|
|||||
|
Rate of compensation increase
|
4.00
|
%
|
4.00
|
%
|
2.13
|
%
|
2.37
|
%
|
4.00
|
%
|
4.00
|
%
|
|||||
70
The pretax amounts recognized in Accumulated other comprehensive income (loss) on the Consolidated Balance Sheets as of
December 31, 2018
and
2017
were as follows:
|
|
Pension Benefits
|
Other Benefits
|
|||||||||||||||||||||
|
|
2018
|
2017
|
2018
|
2017
|
|||||||||||||||||||
|
|
U.S.
|
Non-U.S.
|
U.S.
|
Non-U.S.
|
|
|
|||||||||||||||||
|
|
(In thousands)
|
||||||||||||||||||||||
|
Prior service cost (credit)
|
$
|
62
|
|
$
|
64
|
|
$
|
86
|
|
$
|
18
|
|
$
|
(117
|
)
|
$
|
(483
|
)
|
|||||
|
Net loss
|
22,478
|
|
12,955
|
|
27,789
|
|
17,986
|
|
(6,386
|
)
|
(2,866
|
)
|
|||||||||||
|
Total
|
$
|
22,540
|
|
$
|
13,019
|
|
$
|
27,875
|
|
$
|
18,004
|
|
$
|
(6,503
|
)
|
$
|
(3,349
|
)
|
|||||
The amounts in Accumulated other comprehensive income (loss) on the Consolidated Balance Sheet as of
December 31, 2018
that are expected to be recognized as components of net periodic benefit cost during
2019
are as follows:
|
U.S. Pension
Benefit Plans
|
Non-U.S.
Pension Benefit
Plans
|
Other
Benefit Plans
|
Total
|
||||||||||||
|
|
(In thousands)
|
||||||||||||||
|
Prior service cost (credit)
|
$
|
15
|
|
$
|
6
|
|
$
|
(70
|
)
|
$
|
(49
|
)
|
|||
|
Net loss
|
1,931
|
|
1,131
|
|
(564
|
)
|
2,498
|
|
|||||||
|
Total
|
$
|
1,946
|
|
$
|
1,137
|
|
$
|
(634
|
)
|
$
|
2,449
|
|
|||
The components of, and the weighted average assumptions used to determine, the net periodic benefit cost for the plans in
2018
,
2017
and
2016
are as follows:
|
|
Pension Benefits
|
||||||||||||||||||||||
|
|
2018
|
2017
|
2016
|
||||||||||||||||||||
|
|
U.S.
|
Non-U.S.
|
U.S.
|
Non-U.S.
|
U.S.
|
Non-U.S.
|
|||||||||||||||||
|
|
(In thousands)
|
||||||||||||||||||||||
|
Service cost
|
$
|
886
|
|
$
|
2,105
|
|
$
|
976
|
|
$
|
1,975
|
|
$
|
1,016
|
|
$
|
1,627
|
|
|||||
|
Interest cost
|
2,634
|
|
1,389
|
|
2,677
|
|
1,283
|
|
3,043
|
|
1,429
|
|
|||||||||||
|
Expected return on plan assets
|
(3,943
|
)
|
(1,120
|
)
|
(3,832
|
)
|
(1,088
|
)
|
(4,777
|
)
|
(993
|
)
|
|||||||||||
|
Settlement loss recognized
|
(1
|
)
|
(307
|
)
|
—
|
|
234
|
|
3,339
|
|
215
|
|
|||||||||||
|
Net amortization
|
2,712
|
|
1,271
|
|
2,566
|
|
1,809
|
|
3,226
|
|
1,008
|
|
|||||||||||
|
Net periodic benefit cost
|
$
|
2,288
|
|
$
|
3,338
|
|
$
|
2,387
|
|
$
|
4,213
|
|
$
|
5,847
|
|
$
|
3,286
|
|
|||||
|
|
Other Benefits
|
||||||||||
|
|
2018
|
2017
|
2016
|
||||||||
|
|
(In thousands)
|
||||||||||
|
Service cost
|
$
|
668
|
|
$
|
610
|
|
$
|
601
|
|
||
|
Interest cost
|
810
|
|
818
|
|
811
|
|
|||||
|
Net amortization
|
(737
|
)
|
(795
|
)
|
(705
|
)
|
|||||
|
Net periodic benefit cost
|
$
|
741
|
|
$
|
633
|
|
$
|
707
|
|
||
|
|
U.S. Plans
|
Non-U.S. Plans
|
|||||||||||||||
|
|
2018
|
2017
|
2016
|
2018
|
2017
|
2016
|
|||||||||||
|
Discount rate
|
3.46
|
%
|
3.91
|
%
|
4.12
|
%
|
1.82
|
%
|
1.76
|
%
|
2.99
|
%
|
|||||
|
Expected return on plan assets
|
5.50
|
%
|
5.50
|
%
|
6.50
|
%
|
3.09
|
%
|
3.20
|
%
|
4.58
|
%
|
|||||
|
Rate of compensation increase
|
4.00
|
%
|
4.00
|
%
|
4.00
|
%
|
2.37
|
%
|
2.29
|
%
|
2.98
|
%
|
|||||
71
|
|
Other Benefits
|
|||||||
|
|
2018
|
2017
|
2016
|
|||||
|
Discount rate
|
3.50
|
%
|
3.94
|
%
|
4.10
|
%
|
||
|
Expected return on plan assets
|
—
|
%
|
—
|
%
|
—
|
%
|
||
|
Rate of compensation increase
|
4.00
|
%
|
4.00
|
%
|
4.00
|
%
|
||
The pretax change recognized in Accumulated other comprehensive income (loss) on the Consolidated Balance Sheet in
2018
is as follows:
|
|
Pension Benefits
|
Other
Benefits |
|||||||||
|
|
U.S.
|
Non-U.S.
|
|||||||||
|
|
(In thousands)
|
||||||||||
|
Net gain (loss) in current year
|
$
|
2,624
|
|
$
|
2,754
|
|
$
|
3,930
|
|
||
|
Prior service cost
|
—
|
|
(52
|
)
|
—
|
|
|||||
|
Amortization of prior service cost (credit)
|
24
|
|
3
|
|
(366
|
)
|
|||||
|
Amortization of net loss (gain)
|
2,687
|
|
961
|
|
(371
|
)
|
|||||
|
Exchange rate effect on amounts in OCI
|
—
|
|
746
|
|
(39
|
)
|
|||||
|
Total
|
$
|
5,335
|
|
$
|
4,412
|
|
$
|
3,154
|
|
||
The discount rates for our plans are derived by matching the plan’s cash flows to a yield curve that provides the equivalent yields on zero-coupon bonds for each maturity. The discount rate selected is the rate that produces the same present value of cash flows.
In selecting the expected rate of return on plan assets, the Company considers the historical returns and expected returns on plan assets. The expected returns are evaluated using asset return class, variance and correlation assumptions based on the plan’s target asset allocation and current market conditions.
Prior service costs are amortized on a straight-line basis over the average remaining service period of active participants. Gains and losses in excess of
10%
of the greater of the benefit obligation or the market value of assets are amortized over the average remaining service period of active participants.
Costs of defined contribution plans were
$12.2 million
,
$10.2 million
and
$10.1 million
for
2018
,
2017
and
2016
, respectively.
The Company, through its subsidiaries, participates in certain multi-employer pension plans covering approximately
343
participants under U.S. collective bargaining agreements. None of these plans are considered individually significant to the Company as contributions to these plans totaled
$1.1 million
,
$1.0 million
, and
$1.3 million
for
2018
,
2017
and
2016
, respectively.
For measurement purposes, a
6.04%
weighted average annual rate of increase in the per capita cost of covered health care benefits was assumed for
2018
. The rate was assumed to decrease gradually each year to a rate of
4.50%
for
2038
, and remain at that level thereafter. Assumed health care cost trend rates have an effect on the amounts reported for the health care plans. A
1%
increase in the assumed health care cost trend rates would increase the service and interest cost components of the net periodic benefit cost by
$0.2 million
and the health care component of the accumulated postretirement benefit obligation by
$1.9 million
. A
1%
decrease in the assumed health care cost trend rate would decrease the service and interest cost components of the net periodic benefit cost by
$0.1 million
and the health care component of the accumulated postretirement benefit obligation by
$1.6 million
.
72
Plan Assets
The Company’s pension plan weighted average asset allocations at
December 31, 2018
and
2017
, by asset category, were as follows:
|
U.S. Plans
|
Non-U.S. Plans
|
||||||||||
|
2018
|
2017
|
2018
|
2017
|
||||||||
|
Equity securities
|
9
|
%
|
47
|
%
|
13
|
%
|
14
|
%
|
|||
|
Fixed income securities
|
90
|
%
|
51
|
%
|
31
|
%
|
30
|
%
|
|||
|
Cash/Commingled Funds/Other
(1)
|
1
|
%
|
2
|
%
|
56
|
%
|
56
|
%
|
|||
|
Total
|
100
|
%
|
100
|
%
|
100
|
%
|
100
|
%
|
|||
The basis used to measure the defined benefit plans’ assets at fair value at
December 31, 2018
and
2017
is summarized as follows:
|
|
Basis of Fair Value Measurement
|
||||||||||||||
|
|
Outstanding
Balances
|
Level 1
|
Level 2
|
Level 3
|
|||||||||||
|
As of December 31, 2018
|
(In thousands)
|
||||||||||||||
|
Equity
|
|||||||||||||||
|
U.S. Large Cap
|
$
|
3,759
|
|
$
|
3,759
|
|
$
|
—
|
|
$
|
—
|
|
|||
|
U.S. Small / Mid Cap
|
770
|
|
—
|
|
770
|
|
—
|
|
|||||||
|
International
|
7,532
|
|
4,445
|
|
3,087
|
|
—
|
|
|||||||
|
Fixed Income
|
|||||||||||||||
|
U.S. Intermediate
|
581
|
|
—
|
|
581
|
|
—
|
|
|||||||
|
U.S. Long Term
|
75,096
|
|
—
|
|
75,096
|
|
—
|
|
|||||||
|
U.S. High Yield
|
1,098
|
|
—
|
|
1,098
|
|
—
|
|
|||||||
|
International
|
8,604
|
|
244
|
|
8,360
|
|
—
|
|
|||||||
|
Other Commingled Funds
(1)
|
15,555
|
|
—
|
|
—
|
|
15,555
|
|
|||||||
|
Cash and Equivalents
|
1,944
|
|
1,074
|
|
870
|
|
—
|
|
|||||||
|
Other
|
2,173
|
|
—
|
|
2,173
|
|
—
|
|
|||||||
|
$
|
117,112
|
|
$
|
9,522
|
|
$
|
92,035
|
|
$
|
15,555
|
|
||||
|
(1)
|
Other commingled funds represent pooled institutional investments in non-U.S. plans.
|
73
|
|
Basis of Fair Value Measurement
|
||||||||||||||
|
|
Outstanding
Balances |
Level 1
|
Level 2
|
Level 3
|
|||||||||||
|
As of December 31, 2017
|
(In thousands)
|
||||||||||||||
|
Equity
|
|||||||||||||||
|
U.S. Large Cap
|
$
|
16,402
|
|
$
|
16,402
|
|
$
|
—
|
|
$
|
—
|
|
|||
|
U.S. Small / Mid Cap
|
7,966
|
|
7,051
|
|
915
|
|
—
|
|
|||||||
|
International
|
16,844
|
|
13,205
|
|
3,639
|
|
—
|
|
|||||||
|
Fixed Income
|
|||||||||||||||
|
U.S. Intermediate
|
13,568
|
|
13,483
|
|
85
|
|
—
|
|
|||||||
|
U.S. Short Duration
|
13,362
|
|
13,362
|
|
—
|
|
—
|
|
|||||||
|
U.S. High Yield
|
9,529
|
|
8,462
|
|
1,067
|
|
—
|
|
|||||||
|
International
|
13,311
|
|
3,767
|
|
9,544
|
|
—
|
|
|||||||
|
Other Commingled Funds
(1)
|
16,059
|
|
—
|
|
—
|
|
16,059
|
|
|||||||
|
Cash and Equivalents
|
2,613
|
|
1,346
|
|
1,267
|
|
—
|
|
|||||||
|
Other
|
2,851
|
|
—
|
|
2,851
|
|
—
|
|
|||||||
|
$
|
112,505
|
|
$
|
77,078
|
|
$
|
19,368
|
|
$
|
16,059
|
|
||||
|
(1)
|
Other commingled funds represent pooled institutional investments in non-U.S. plans.
|
Equities that are valued using quoted prices are valued at the published market prices. Equities in a common collective trust or a registered investment company that are valued using significant other observable inputs are valued at the net asset value (“NAV”) provided by the fund administrator. The NAV is based on the value of the underlying assets owned by the fund minus its liabilities. Fixed income securities that are valued using significant other observable inputs are valued at prices obtained from independent financial service industry-recognized vendors.
Investment Policies and Strategies
The investment objective of the U.S. plan, consistent with prudent standards for preservation of capital and maintenance of liquidity, is to earn the highest possible total rate of return consistent with the plan’s tolerance for risk. The general asset allocation guidelines for plan assets are that “equities” will constitute
10%
and “fixed income” obligations, including cash, will constitute from
90%
of the market value of total fund assets. The investment objective of the UK plan, consistent with prudent standards for preservation of capital and maintenance of liquidity, is to earn a target return of UK Gilts plus
2%
per year. The general asset allocation guidelines for plan assets are that “equities” will constitute from
40%
to
50%
of the market value of total fund assets with a target of
40%
, and “fixed income” obligations, including cash, will constitute from
50%
to
60%
with a target of
60%
. The term “equities” includes common stock, while the term “fixed income” includes obligations with contractual payments and a specific maturity date. The Company, through the use of a professional independent advisor, will monitor the asset allocation daily and maintain an asset allocation that closely replicates the designated targets. Diversification of assets is employed to ensure that adverse performance of one security or security class does not have an undue detrimental impact on the portfolio as a whole. Diversification is interpreted to include diversification by type, characteristic and number of investments as well as by investment style of designated investment fund managers. No restrictions are placed on the selection of individual investments by the investment fund managers. The total fund performance and the performance of the investment fund managers is reviewed on a regular basis using an appointed professional independent advisor. As of December 31, 2018, there were no shares of the Company’s stock held in plan assets.
Cash Flows
The Company expects to contribute approximately
$0.6 million
to its defined benefit plans and
$1.1 million
to its other postretirement benefit plans in
2019
. The Company also expects to contribute approximately
$12.0 million
to its defined contribution plan and
$9.7 million
to its 401(k) savings plan in
2019
.
74
Estimated Future Benefit Payments
The future estimated benefit payments for the next five years and the five years thereafter are as follows:
2019
—
$11.4 million
;
2020
—
$11.5 million
;
2021
—
$11.3 million
;
2022
—
$11.0 million
;
2023
—
$10.9 million
; 2024 to 2028 —
$54.3 million
.
17. Quarterly Results of Operations (Unaudited)
The unaudited quarterly results of operations for the years ended
December 31, 2018
and
2017
are as follows:
|
|
2018 Quarters (1)
|
2017 Quarters (1)
|
|||||||||||||||||||||||||||||
|
|
First
|
Second
|
Third
|
Fourth
|
First
|
Second
|
Third
|
Fourth
|
|||||||||||||||||||||||
|
|
(In thousands, except per share amounts)
|
||||||||||||||||||||||||||||||
|
Net sales
|
$
|
612,324
|
|
$
|
634,360
|
|
$
|
622,888
|
|
$
|
614,094
|
|
$
|
553,552
|
|
$
|
573,366
|
|
$
|
574,490
|
|
$
|
585,904
|
|
|||||||
|
Gross profit
|
276,652
|
|
287,367
|
|
280,233
|
|
273,643
|
|
250,941
|
|
256,925
|
|
257,930
|
|
260,882
|
|
|||||||||||||||
|
Operating income
|
136,683
|
|
147,831
|
|
145,133
|
|
139,441
|
|
115,671
|
|
125,133
|
|
126,504
|
|
135,248
|
|
|||||||||||||||
|
Net income
|
98,958
|
|
107,126
|
|
106,352
|
|
98,137
|
|
75,899
|
|
83,844
|
|
83,768
|
|
93,746
|
|
|||||||||||||||
|
Basic EPS
|
$
|
1.29
|
|
$
|
1.40
|
|
$
|
1.39
|
|
$
|
1.29
|
|
$
|
0.99
|
|
$
|
1.10
|
|
$
|
1.09
|
|
$
|
1.23
|
|
|||||||
|
Diluted EPS
|
$
|
1.27
|
|
$
|
1.38
|
|
$
|
1.37
|
|
$
|
1.27
|
|
$
|
0.99
|
|
$
|
1.08
|
|
$
|
1.08
|
|
$
|
1.21
|
|
|||||||
|
Basic weighted average shares outstanding
|
76,419
|
|
76,539
|
|
76,562
|
|
76,128
|
|
76,115
|
|
76,220
|
|
76,309
|
|
76,283
|
|
|||||||||||||||
|
Diluted weighted average shares outstanding
|
77,739
|
|
77,704
|
|
77,709
|
|
77,100
|
|
76,894
|
|
77,320
|
|
77,523
|
|
77,597
|
|
|||||||||||||||
|
(1)
Quarterly data includes acquisition of thinXXS (December 2017) and Finger Lakes Instrumentation (July 2018) from the date of acquisition. Quarterly data also includes the gain on the sale of Faure Herman (October 2017) and the results of the divested business through the date of disposition. See Note 2 for further discussion.
|
|||||||||||||||||||||||||||||||
Item 9.
Changes in and Disagreements with Accountants on Accounting and Financial Disclosure.
None.
Item 9A.
Controls and Procedures.
The Company maintains disclosure controls and procedures that are designed to ensure that information required to be disclosed in the Company’s Exchange Act reports is recorded, processed, summarized and reported within the time periods specified in the SEC’s rules and forms, and that such information is accumulated and communicated to the Company’s management, including its Chief Executive Officer and Chief Financial Officer, as appropriate, to allow timely decisions regarding required disclosure.
As required by SEC Rule 13a-15(b), the Company carried out an evaluation, under the supervision and with the participation of the Company’s management, including the Company’s Chief Executive Officer and Chief Financial Officer, of the effectiveness of the design and operation of the Company’s disclosure controls and procedures as of the end of the period covered by this report. Based on the foregoing, the Company’s Chief Executive Officer and Chief Financial Officer concluded that the Company’s disclosure controls and procedures were effective as of
December 31, 2018
.
Management’s Report on Internal Control Over Financial Reporting appearing on page
34
of this report is incorporated into this Item 9A by reference.
There has been no change in the Company’s internal control over financial reporting during the Company’s most recent fiscal quarter that has materially affected, or is reasonably likely to materially affect, the Company’s internal control over financial reporting.
Item 9B.
Other Information.
None.
75
PART III
Item 10.
Directors, Executive Officers and Corporate Governance.
Information under the headings “Election of Directors”; “Board Committees”; “Section 16(a) Beneficial Ownership Reporting Compliance”; and “Corporate Governance” in the
2019
Proxy Statement is incorporated into this Item 10 by reference. Information regarding executive officers of the Company is located in Part I, Item 1, of this report under the caption “Executive Officers of the Registrant.”
The Company has adopted a Code of Business Conduct and Ethics applicable to the Company’s directors, officers (including the Company’s principal executive officer, principal financial officer and principal accounting officer) and employees. The Code of Business Conduct and Ethics, along with the Audit Committee Charter, Nominating and Corporate Governance Committee Charter, Compensation Committee Charter and Corporate Governance Guidelines are available on the Company’s website at
www.idexcorp.com
under “Investor Relations.” In the event we amend or waive any of the provisions of the Code of Business Conduct and Ethics applicable to our principal executive officer, principal financial officer or principal accounting officer, we intend to disclose the same on the Company’s website.
Item 11.
Executive Compensation.
Information under the heading “Executive Compensation” in the
2019
Proxy Statement is incorporated into this Item 11 by reference.
Item 12.
Security Ownership of Certain Beneficial Owners and Management and Related Stockholder Matters.
Information under the heading “Security Ownership” in the
2019
Proxy Statement is incorporated into this Item 12 by reference.
Equity Compensation Plan Information
Information with respect to the Company’s equity compensation plans as of
December 31, 2018
is as follows:
|
Plan Category
|
Number of Securities
To be Issued Upon Exercise of Outstanding Options, Warrants and Rights |
Weighted-Average
Exercise Price of Outstanding Options, Warrants and Rights |
Number of Securities
Remaining Available for Future Issuance Under Equity Compensation Plans (1) |
||||||
|
Equity compensation plans approved by the Company’s stockholders
|
2,030,145
|
|
$
|
85.08
|
|
4,287,423
|
|
||
|
(1)
|
Includes an indeterminate number of shares underlying deferred compensation units (“DCUs”) granted under the Directors Deferred Compensation Plan and Deferred Compensation Plan for Non-officer Presidents which are issuable under the Company’s Incentive Award Plan. Also includes an indeterminate number of shares underlying DCUs granted under the Deferred Compensation Plan for Officers, which shares are issuable under the Incentive Award Plan. The number of DCUs granted under these plans is determined by dividing the amount deferred by the closing price of the common stock the day before the date of deferral. The DCUs are entitled to receive dividend equivalents which are reinvested in DCUs based on the same formula for investment of a participant’s deferral.
|
Item 13.
Certain Relationships and Related Transactions, and Director Independence.
Information under the headings, “Corporate Governance” and “Board Committees” in the
2019
Proxy Statement is incorporated into this Item 13 by reference.
Item 14.
Principal Accountant Fees and Services.
Information under the heading “Principal Accountant Fees and Services” in the
2019
Proxy Statement is incorporated into this Item 14 by reference.
76
PART IV
Item 15.
Exhibits and Financial Statement Schedules.
|
(A)
|
1. Financial Statements
|
Consolidated financial statements filed as part of this report are listed under Part II. Item 8. “Financial Statements and Supplementary Data.”
2. Financial Statement Schedules
Financial statement schedules are omitted because they are not applicable, not required, or because the required information is included in the Consolidated Financial Statements of the Company or the Notes thereto.
3. Exhibits
The exhibits filed with this report are listed on the “Exhibit Index.”
|
(B)
|
Exhibit Index
|
|
Exhibit
Number
|
|
Description
|
|
|
3.1
|
|
|
|
|
3.2
|
|
|
|
|
4.1
|
|
|
|
|
4.2
|
|
|
|
|
4.3
|
|
|
|
|
4.4
|
|
|
|
|
4.5
|
|
||
|
10.1**
|
|
|
|
|
10.2**
|
|
||
|
10.3**
|
|
|
|
77
|
Exhibit
Number
|
|
Description
|
|
10.4**
|
||
|
|
||
|
10.5**
|
||
|
10.6**
|
|
|
|
10.7**
|
|
|
|
10.8**
|
|
|
|
10.9**
|
|
|
|
10.10**
|
||
|
10.11**
|
||
|
10.12**
|
||
|
10.13**
|
||
|
10.14**
|
||
|
10.15**
|
||
|
10.16**
|
||
|
10.17**
|
||
|
10.18**
|
||
78
|
Exhibit
Number
|
|
Description
|
|
|
10.19**
|
|
|
|
|
10.20**
|
|
|
|
|
10.21
|
|
||
|
10.22**
|
|
Letter Agreement between IDEX Corporation and William K. Grogan, dated December 30, 2016
(incorporated by reference to Exhibit 10.22 to the Annual Report of IDEX Corporation on Form 10-K for the fiscal year ended December 31, 2016, Commission File No. 1-10235)
|
|
|
10.23**
|
|
||
|
10.24**
|
|
||
|
10.25**
|
|
||
|
10.26**
|
|
||
|
10.27**
|
|
||
|
10.28**
|
|
||
|
10.29**
|
|
||
|
10.30**
|
|
||
|
10.31**
|
|
||
|
10.32**
|
|
||
|
10.33**
|
|
||
|
10.34**
|
|
||
79
|
21
|
|
|
|
|
23
|
|
|
|
|
31.1
|
|
|
|
|
31.2
|
|
|
|
|
***32.1
|
|
|
|
|
***32.2
|
|
|
|
|
****101
|
|
|
The following materials from IDEX Corporation’s Annual Report on Form 10-K for the year ended December 31, 2018 formatted in XBRL (Extensible Business Reporting Language): (i) the Consolidated Balance Sheets at December 31, 2018 and 2017, (ii) the Consolidated Statements of Operations for the three years ended December 31, 2018, (iii) the Consolidated Statements of Comprehensive Income for the three years ended December 31, 2018, (iv) the Consolidated Statements of Shareholders’ Equity for the three years ended December 31, 2018, (v) the Consolidated Statements of Cash Flows for the three years ended December 31, 2018, and (vi) Notes to the Consolidated Financial Statements.
|
|
**
|
Management contract or compensatory plan or agreement.
|
|
|
***
|
Furnished herewith.
|
|
|
****
|
In accordance with Rule 406T of Regulation S-T, the XBRL related information in Exhibit 101 to this Annual Report on Form 10-K shall not be deemed to be “filed” for purposes of Section 18 of the Exchange Act, or otherwise subject to the liability of that section, and shall not be part of any registration statement or other document filed under the Securities Act or the Exchange Act, except as shall be expressly set forth by specific reference in such filing.
|
|
80
Item 16.
Form 10-K Summary.
None.
81
SIGNATURES
Pursuant to the requirements of Section 13 or 15(d) of the Securities Exchange Act of 1934, the Registrant has duly caused this report to be signed on its behalf by the undersigned, thereunto duly authorized.
|
IDEX CORPORATION
|
||
|
By:
|
/s/ WILLIAM K. GROGAN
|
|
|
William K. Grogan
|
||
|
Senior Vice President and Chief Financial Officer
|
||
Date:
February 28, 2019
Pursuant to the requirements of the Securities Exchange Act of 1934, this report has been signed below by the following persons on behalf of the Registrant and in the capacities and on the dates indicated.
|
Signature
|
Title
|
Date
|
||
|
/s/ ANDREW K. SILVERNAIL
|
Chairman of the Board and
Chief Executive Officer
(Principal Executive Officer)
|
|||
|
Andrew K. Silvernail
|
February 28, 2019
|
|||
|
/s/ WILLIAM K. GROGAN
|
Senior Vice President and Chief Financial
Officer (Principal Financial Officer)
|
|||
|
William K. Grogan
|
February 28, 2019
|
|||
|
/s/ MICHAEL J. YATES
|
Vice President and
Chief Accounting Officer
(Principal Accounting Officer)
|
|||
|
Michael J. Yates
|
February 28, 2019
|
|||
|
/s/ MARK A. BECK
|
Director
|
|||
|
Mark A. Beck
|
February 28, 2019
|
|||
|
/s/ MARK A. BUTHMAN
|
Director
|
|||
|
Mark A. Buthman
|
February 28, 2019
|
|||
|
/s/ WILLIAM M. COOK
|
Director
|
|||
|
William M. Cook
|
February 28, 2019
|
|||
|
/s/ KATRINA L. HELMKAMP
|
Director
|
|||
|
Katrina L. Helmkamp
|
February 28, 2019
|
|||
|
/s/ ERNEST J. MROZEK
|
Director
|
|||
|
Ernest J. Mrozek
|
February 28, 2019
|
|||
|
/s/ DAVID C. PARRY
|
Director
|
|||
|
David C. Parry
|
February 28, 2019
|
|||
|
/s/ LIVINGSTON L. SATTERTHWAITE
|
Director
|
|||
|
Livingston L. Satterthwaite
|
February 28, 2019
|
|||
|
/s/ CYNTHIA J. WARNER
|
Director
|
|||
|
Cynthia J. Warner
|
February 28, 2019
|
|||
82
TABLE OF CONTENTS
Part IItem 1. BusinessItem 1A. Risk FactorsItem 1B. Unresolved Staff CommentsItem 2. PropertiesItem 3. Legal ProceedingsItem 4. Mine Safety DisclosuresPart IIItem 5. Market For Registrant S Common Equity, Related Stockholder Matters and Issuer Purchases Of Equity SecuritiesItem 6. Selected Financial Data.(1)Item 7. Management S Discussion and Analysis Of Financial Condition and Results Of OperationsItem 7A. Quantitative and Qualitative Disclosures About Market RiskItem 8. Financial Statements and Supplementary DataItem 9. Changes in and Disagreements with Accountants on Accounting and Financial DisclosureItem 9A. Controls and ProceduresItem 9B. Other InformationPart IIIItem 10. Directors, Executive Officers and Corporate GovernanceItem 11. Executive CompensationItem 12. Security Ownership Of Certain Beneficial Owners and Management and Related Stockholder MattersItem 13. Certain Relationships and Related Transactions, and Director IndependenceItem 14. Principal Accountant Fees and ServicesPart IVItem 15. Exhibits and Financial Statement SchedulesItem 16. Form 10-k Summary