|
|
|
|
|
|
|
|
|
|
|
|
|
|
|
|
|
|
|
|
|
|
|
|
|
|
|
|
|
|
|
|
|
|
|
|
|
|
|
|
|
|
|
|
|
|
|
|
|
|
|
|
|
|
|
|
Table of Contents
SECURITIES AND EXCHANGE COMMISSION
| þ | ANNUAL REPORT PURSUANT TO SECTION 13 OR 15(d) OF THE SECURITIES EXCHANGE ACT OF 1934 |
| o | TRANSITION REPORT PURSUANT TO SECTION 13 OR 15(d) OF THE SECURITIES EXCHANGE ACT OF 1934 |
|
NEW YORK
(State or other jurisdiction of incorporation or organization) |
13-1432060
(I.R.S. Employer Identification No.) |
|
|
521 WEST 57TH STREET, NEW YORK, N.Y.
(Address of principal executive offices) |
10019
(Zip Code) |
| Title of Each Class | Name of Each Exchange on Which Registered | |
|
Common Stock, par value
12 1 / 2 ¢ per share |
New York Stock Exchange |
None
| Large accelerated filer þ | Accelerated filer o | Non-accelerated filer o | Smaller reporting company o |
| PAGE | ||||||||
|
|
||||||||
| PART I | ||||||||
|
|
||||||||
| 3 | ||||||||
|
|
||||||||
| 7 | ||||||||
|
|
||||||||
| 10 | ||||||||
|
|
||||||||
| 11 | ||||||||
|
|
||||||||
| 12 | ||||||||
|
|
||||||||
| 14 | ||||||||
|
|
||||||||
| PART II | ||||||||
|
|
||||||||
| 14 | ||||||||
|
|
||||||||
| 17 | ||||||||
|
|
||||||||
| 19 | ||||||||
|
|
||||||||
| 37 | ||||||||
|
|
||||||||
| 38 | ||||||||
|
|
||||||||
| 38 | ||||||||
|
|
||||||||
| 38 | ||||||||
|
|
||||||||
| 39 | ||||||||
|
|
||||||||
| PART III | ||||||||
|
|
||||||||
| 40 | ||||||||
|
|
||||||||
| 40 | ||||||||
|
|
||||||||
| 40 | ||||||||
|
|
||||||||
| 40 | ||||||||
|
|
||||||||
| 41 | ||||||||
|
|
||||||||
| PART IV | ||||||||
|
|
||||||||
| 41 | ||||||||
|
|
||||||||
| 83 | ||||||||
|
|
||||||||
| Exhibit 10.8 | ||||||||
| Exhibit 10.29 | ||||||||
| Exhibit 10.33 | ||||||||
| Exhibit 21 | ||||||||
| Exhibit 23 | ||||||||
| Exhibit 31.1 | ||||||||
| Exhibit 31.2 | ||||||||
| Exhibit 32 | ||||||||
| EX-101 INSTANCE DOCUMENT | ||||||||
| EX-101 SCHEMA DOCUMENT | ||||||||
| EX-101 CALCULATION LINKBASE DOCUMENT | ||||||||
| EX-101 LABELS LINKBASE DOCUMENT | ||||||||
| EX-101 PRESENTATION LINKBASE DOCUMENT | ||||||||
| EX-101 DEFINITION LINKBASE DOCUMENT | ||||||||
2
Table of Contents
| ITEM 1. | BUSINESS. |
3
Table of Contents
4
Table of Contents
5
Table of Contents
| Year | ||||||||||
| First | ||||||||||
| Became | ||||||||||
| Name | Office and Other Business Experience (1) | Age | Officer | |||||||
|
|
||||||||||
|
Douglas D. Tough
|
Chairman of the Board and Chief Executive Officer since March 2010; Director since October 2008; Chief Executive Officer and Managing Director of Ansell Limited prior thereto. | 61 | 2010 | |||||||
|
|
||||||||||
|
Kevin C. Berryman
|
Executive Vice President and Chief Financial Officer since May 2009; Chief Financial Officer, Nestle Professional, Americas, a global foodservice manufacturer, from October 2008 to May 2009; Senior Vice President Group Controller, Nestle S.A., an international food and beverage company, from June 2006 to September 2008; Chief Financial Officer, Nestle Purina Petcare prior thereto. | 52 | 2009 | |||||||
|
|
||||||||||
|
Beth E. Ford
|
Executive Vice President, Supply Chain since October 2008; Executive Vice President and Chief Operating Officer, Hachette Book Group, a leading US trade publisher, from September 2007 to September 2008; Senior Vice President, Global Operations and Information Technology, Scholastic, Inc., a global publishing, education and media company, prior thereto. | 46 | 2008 | |||||||
|
|
||||||||||
|
Nicolas Mirzayantz
|
Group President, Fragrances since January 2007; Senior Vice President, Fine Fragrance and Beauty Care and Regional Manager, North America, from April 2005 to December 2006; Senior Vice President, Fine Fragrance and Beauty Care prior thereto. | 48 | 2002 | |||||||
|
|
||||||||||
|
Hernan Vaisman
|
Group President, Flavors since January 2007; Vice President, Latin America, from October 2004 to December 2006; Regional Finance Director, Latin America Region, prior thereto. | 52 | 2004 | |||||||
|
|
||||||||||
|
Ahmet Baydar
|
Senior Vice President, Research and Development since September 2010; Vice President, Global Fragrance Research from February 2009 to August 2010; Director of Shave Care and Integrated Shaving Systems, The Procter & Gamble Company, prior thereto. | 58 | 2010 | |||||||
|
|
||||||||||
|
Angelica T. Cantlon
|
Senior Vice President, Human Resources since August 2009; Senior Vice President-International Chief Administrative Officer, MetLife, Inc., an insurance and financial services company, from June 2005 to August 2009; Senior Vice President-Human Resources Business Leader, prior thereto. | 59 | 2009 | |||||||
|
|
||||||||||
|
Richard A. O’Leary
|
Vice President and Controller since June 2009; Interim Chief Financial Officer from July 2008 to May 2009; Vice President, Corporate Development from July 2007 to May 2009; Finance Director, International Paper’s, a paper and packaging company, Brazilian affiliate prior thereto. | 50 | 2007 | |||||||
| (1) | Employed by the Company or an affiliated company for the last five years, except as otherwise indicated. |
6
Table of Contents
| Item 1A. | RISK FACTORS. |
7
Table of Contents
8
Table of Contents
9
Table of Contents
| ITEM 1B. | UNRESOLVED STAFF COMMENTS. |
10
Table of Contents
| ITEM 2. | PROPERTIES. |
| Location | Operation | |
|
United States
|
||
|
Augusta, GA
|
Production of fragrance ingredients. | |
|
Carrollton, TX(1)
|
Production of flavor compounds; flavor laboratories. | |
|
Hazlet, NJ(1)
|
Production of fragrance compounds; fragrance laboratories. | |
|
Jacksonville, FL
|
Production of fragrance ingredients. | |
|
New York, NY(1)
|
Fragrance laboratories; corporate headquarters | |
|
South Brunswick, NJ(1)
|
Production of flavor compounds and ingredients; flavor laboratories. | |
|
Union Beach, NJ
|
Research and development center. | |
|
|
||
|
France
|
||
|
Neuilly(1)
|
Fragrance laboratories. | |
|
Grasse
|
Production of flavor and fragrance ingredients; fragrance laboratories. | |
|
|
||
|
Great Britain
|
||
|
Haverhill
|
Production of flavor compounds and ingredients, and fragrance ingredients; flavor laboratories. | |
|
|
||
|
Ireland
|
||
|
Drogheda(7)
|
Production of fragrance compounds. | |
|
|
||
|
Netherlands
|
||
|
Hilversum
|
Flavor and fragrance laboratories. | |
|
Tilburg
|
Production of flavor compounds and ingredients, and fragrance compounds. | |
|
|
||
|
Spain
|
||
|
Benicarlo
|
Production of fragrance ingredients. | |
|
|
||
|
Argentina
|
||
|
Garin
|
Production of flavor compounds and ingredients, and fragrance compounds; flavor laboratories. | |
|
|
||
|
Brazil
|
||
|
Rio de Janeiro
|
Production of fragrance compounds. | |
|
São Paulo
|
Flavor and fragrance laboratories. | |
|
Taubate
|
Production of flavor compounds and ingredients. | |
|
|
||
|
Mexico
|
||
|
Tlalnepantla
|
Production of flavor and fragrance compounds; flavor and fragrance laboratories. | |
|
|
||
|
India
|
||
|
Chennai(2)
|
Production of flavor compounds and ingredients, and fragrance compounds; flavor laboratories. | |
|
|
||
|
Australia
|
||
|
Dandenong
|
Production of flavor compounds and flavor ingredients. | |
|
|
||
|
China
|
||
|
Guangzhou(4)
|
Production of flavor and fragrance compounds. | |
|
Shanghai(6)
|
Flavor and fragrance laboratories. | |
|
Xin’anjiang(5)
|
Production of fragrance ingredients. | |
|
Zhejiang(4)
|
Production of fragrance ingredients. | |
|
|
||
|
Indonesia
|
||
|
Jakarta(3)
|
Production of flavor compounds and ingredients, and fragrance compounds and ingredients; flavor and fragrance laboratories. | |
|
|
||
|
Japan
|
||
|
Gotemba
|
Production of flavor compounds. | |
|
Tokyo
|
Flavor and fragrance laboratories. | |
|
|
||
|
Singapore
|
||
|
Jurong (6)
|
Production of flavor and fragrance compounds. | |
|
Science Park(1)
|
Flavor and fragrance laboratories. |
| (1) | Leased. | |
| (2) | We have a 93.4% interest in the subsidiary company that owns this facility. | |
| (3) | Land is leased and building is partially leased and partially owned. | |
| (4) | Land is leased and building and machinery and equipment are owned. | |
| (5) | We have a 90% interest in the subsidiary company that leases the land and owns the buildings and machinery. | |
| (6) | Building is leased and machinery and equipment are owned. | |
| (7) | Manufacturing operations have ceased effective September 30, 2010. |
11
Table of Contents
| ITEM 3. | LEGAL PROCEEDINGS. |
12
Table of Contents
13
Table of Contents
| ITEM 4. | (REMOVED AND RESERVED) |
| ITEM 5. | MARKET FOR REGISTRANT’S COMMON EQUITY, RELATED STOCKHOLDER MATTERS AND ISSUER PURCHASES OF EQUITY SECURITIES. |
| 2010 | 2009 | |||||||||||||||
| Quarter | High | Low | High | Low | ||||||||||||
|
First
|
$ | 48.83 | $ | 39.28 | $ | 32.35 | $ | 25.30 | ||||||||
|
Second
|
51.77 | 42.00 | 33.51 | 29.84 | ||||||||||||
|
Third
|
49.51 | 41.59 | 39.15 | 31.21 | ||||||||||||
|
Fourth
|
56.10 | 48.31 | 41.85 | 36.85 | ||||||||||||
| (B) | ||||
| (A) | Number of shareholders of record | |||
| Title of Class | as of February 12, 2011 | |||
|
Common stock, par value 12
1
/
2
¢ per share
|
2,740 | |||
14
Table of Contents
| Quarter | 2010 | 2009 | ||||||
|
First
|
$ | 0.25 | $ | 0.25 | ||||
|
Second
|
0.25 | 0.25 | ||||||
|
Third
|
0.27 | 0.25 | ||||||
|
Fourth
|
0.27 | 0.25 | ||||||
(Includes reinvestment of dividends)
| ANNUAL RETURN PERCENTAGE | ||||||||||||||||||||
| Years Ending | ||||||||||||||||||||
| Company Name / Index | 2006 | 2007 | 2008 | 2009 | 2010 | |||||||||||||||
|
International Flavors & Fragrances
|
49.64 | -0.36 | -36.64 | 42.43 | 38.06 | |||||||||||||||
|
S&P 500 Index
|
15.79 | 5.49 | -37.00 | 26.46 | 15.06 | |||||||||||||||
|
Peer Group
|
18.66 | 22.37 | -16.32 | 18.05 | 15.44 | |||||||||||||||
| Base | INDEXED RETURNS | |||||||||||||||||||||||
| Period | Years Ending | |||||||||||||||||||||||
| Company Name / Index | 2005 | 2006 | 2007 | 2008 | 2009 | 2010 | ||||||||||||||||||
|
International Flavors & Fragrances
|
$ | 100 | $ | 149.64 | $ | 149.10 | $ | 94.47 | $ | 134.54 | $ | 185.75 | ||||||||||||
|
S&P 500 Index
|
100 | 115.79 | 122.16 | 76.96 | 97.33 | 111.99 | ||||||||||||||||||
|
Peer Group
|
100 | 118.66 | 145.20 | 121.51 | 143.64 | 165.81 | ||||||||||||||||||
| Peer Group Companies (2) | ||||
|
Alberto Culver Company
|
Hormel Foods Corp. | Unilever NV | ||
|
Avon Products
|
Kellogg Co. | YUM Brands, Inc. | ||
|
Campbell Soup Co.
|
Estee Lauder Companies, Inc. | |||
|
Church & Dwight Inc.
|
McCormick & Company, Inc. | |||
|
Clorox Company
|
McDonald’s Corp. | |||
|
Coca-Cola Company
|
Nestle SA | |||
|
Colgate-Palmolive Co.
|
Pepsico Inc. | |||
|
ConAgra Foods, Inc.
|
Procter & Gamble Co. | |||
|
General Mills Inc.
|
Revlon Inc. | |||
|
H.J. Heinz Co.
|
Sara Lee Corp. | |||
|
Hershey Company
|
Sensient Technologies Corp. |
15
Table of Contents

| (1) | The Cumulative Shareholder Return assumes that the value of an investment in our Common Stock and each index was $100 on December 31, 2005, and that all dividends were reinvested. | |
| (2) | Due to the international scope and breadth of our business, we believe that a Peer Group comprised of international public companies, which are representative of the customer group to which we sell our products, is the most appropriate group against which to compare shareholder returns. Wm. Wrigley Jr. Company has been eliminated from the Peer Group for all years presented above due to its acquisition by Mars, Incorporated in October 2008. |
| Total Number of | ||||||||||||||||
| Total | Shares Purchased | Maximum Number | ||||||||||||||
| Number of | Average | as Part of Publicly | of Shares That May | |||||||||||||
| Shares | Price Paid | Announced | Yet Be Purchased | |||||||||||||
| Purchased | per Share | Program | Under the Program | |||||||||||||
|
October 1 – 31, 2010
|
— | — | — | — | ||||||||||||
|
November 1 – 30, 2010
|
— | — | — | — | ||||||||||||
|
December 1 – 31, 2010
|
— | — | — | — | ||||||||||||
|
Total shares purchased
|
— | — | — | |||||||||||||
16
Table of Contents
| ITEM 6. | SELECTED FINANCIAL DATA. |
QUARTERLY FINANCIAL DATA (UNAUDITED)
(DOLLARS IN THOUSANDS EXCEPT PER SHARE AMOUNTS)
| Net Income Per Share (b) | ||||||||||||||||||||||||||||||||||||||||
| Net Sales | Gross Profit | Net Income (a) | Basic | Diluted | ||||||||||||||||||||||||||||||||||||
| Quarter | 2010 | 2009 | 2010 | 2009 | 2010 | 2009 | 2010 | 2009 | 2010 | 2009 | ||||||||||||||||||||||||||||||
|
First
|
$ | 653,909 | $ | 559,630 | $ | 270,207 | $ | 222,065 | $ | 63,789 | $ | 47,197 | $ | 0.80 | $ | 0.60 | $ | 0.80 | $ | 0.60 | ||||||||||||||||||||
|
Second
|
665,800 | 568,261 | 285,001 | 227,914 | 67,152 | 48,083 | 0.84 | 0.61 | 0.83 | 0.60 | ||||||||||||||||||||||||||||||
|
Third
|
673,283 | 612,634 | 285,048 | 248,854 | 77,038 | 52,800 | 0.96 | 0.67 | 0.95 | 0.66 | ||||||||||||||||||||||||||||||
|
Fourth
|
629,870 | 585,633 | 252,346 | 235,412 | 55,578 | 47,446 | 0.69 | 0.60 | 0.68 | 0.59 | ||||||||||||||||||||||||||||||
|
|
||||||||||||||||||||||||||||||||||||||||
|
|
$ | 2,622,862 | $ | 2,326,158 | $ | 1,092,602 | $ | 934,245 | $ | 263,557 | $ | 195,526 | $ | 3.29 | $ | 2.48 | $ | 3.26 | $ | 2.46 | ||||||||||||||||||||
|
|
||||||||||||||||||||||||||||||||||||||||
| (a) | Net Income Q1-2010 included $4,408 of restructuring related costs associated with facility rationalizations within our European Fragrance business. Q2-2010 includes $1,594 of restructuring related costs associated with facility rationalizations within our European Fragrance business. Q3-2010 includes $2,049 of restructuring related costs associated with facility rationalizations within our European Fragrance business. Q4-2010 includes $877 of additional costs associated with the ongoing reorganization of our European businesses. | |
| Net Income Q2-2009 included $2,685 related to restructuring costs driven by weak economic conditions impacting our Fragrance business and $680 pertaining to employee separation costs. Q3-2009 includes $9,186 of restructuring related costs associated with facility rationalizations within our European Fragrance business. Q3-2009 also includes $3,348 of costs associated with the change in our Chief Executive Officer. Q4-2009 includes $2,892 of additional costs associated with the ongoing reorganization of our European businesses and $4 million of expense related to out-of-period tax adjustments. | ||
| (b) | The sum of the 2009 quarters’ Net Income per diluted share does not equal the earnings per diluted share for the full year due to changes in average shares outstanding. |
17
Table of Contents
FIVE-YEAR SUMMARY
(DOLLARS IN THOUSANDS EXCEPT PER SHARE AMOUNTS)
| 2010 | 2009 | 2008 | 2007 | 2006 | ||||||||||||||||
|
Consolidated Statement of Income Data
|
||||||||||||||||||||
|
Net sales
|
$ | 2,622,862 | $ | 2,326,158 | $ | 2,389,372 | $ | 2,276,638 | $ | 2,095,390 | ||||||||||
|
|
||||||||||||||||||||
|
Cost of goods sold
|
1,530,260 | 1,391,913 | 1,418,441 | 1,325,226 | 1,211,453 | |||||||||||||||
|
Research and development expenses
|
218,772 | 184,771 | 196,863 | 186,271 | 173,303 | |||||||||||||||
|
Selling and administrative expenses
|
447,392 | 390,885 | 400,723 | 397,985 | 376,781 | |||||||||||||||
|
Curtailment loss
|
— | — | — | 5,943 | — | |||||||||||||||
|
Restructuring and other charges, net (a)
|
10,077 | 18,301 | 18,212 | — | 2,680 | |||||||||||||||
|
Interest expense
|
48,709 | 61,818 | 74,008 | 41,535 | 25,549 | |||||||||||||||
|
Other expense (income), net
|
8,059 | 1,921 | (2,797 | ) | (11,136 | ) | (9,838 | ) | ||||||||||||
|
|
||||||||||||||||||||
|
|
2,263,269 | 2,049,609 | 2,105,450 | 1,945,824 | 1,779,928 | |||||||||||||||
|
|
||||||||||||||||||||
|
Income before taxes
|
359,593 | 276,549 | 283,922 | 330,814 | 315,462 | |||||||||||||||
|
Taxes on income
|
96,036 | 81,023 | 54,294 | 83,686 | 88,962 | |||||||||||||||
|
|
||||||||||||||||||||
|
Net income
|
$ | 263,557 | $ | 195,526 | $ | 229,628 | $ | 247,128 | $ | 226,500 | ||||||||||
|
|
||||||||||||||||||||
|
Percentage of net sales
|
10.0 | 8.4 | 9.6 | 10.9 | 10.8 | |||||||||||||||
|
Percentage of average shareholders’ equity
|
29.7 | 28.9 | 38.0 | 32.0 | 24.6 | |||||||||||||||
|
Net income per share — basic
|
$ | 3.29 | $ | 2.48 | $ | 2.89 | $ | 2.84 | $ | 2.50 | ||||||||||
|
Net income per share — diluted
|
$ | 3.26 | $ | 2.46 | $ | 2.86 | $ | 2.81 | $ | 2.48 | ||||||||||
|
Average number of diluted shares (thousands)
|
80,440 | 79,094 | 79,723 | 87,528 | 91,639 | |||||||||||||||
|
|
||||||||||||||||||||
|
Consolidated Balance Sheet Data
|
||||||||||||||||||||
|
Cash and cash equivalents
|
$ | 131,322 | $ | 80,135 | $ | 178,467 | $ | 151,471 | $ | 114,508 | ||||||||||
|
Receivables, net
|
451,804 | 444,265 | 400,971 | 400,527 | 357,155 | |||||||||||||||
|
Inventories
|
531,675 | 444,977 | 479,567 | 484,222 | 446,606 | |||||||||||||||
|
Property, plant and equipment, net
|
538,118 | 501,293 | 496,856 | 508,820 | 495,124 | |||||||||||||||
|
Goodwill and intangible assets, net
|
714,416 | 720,530 | 726,683 | 732,836 | 745,716 | |||||||||||||||
|
Total assets (c)
|
2,872,455 | 2,644,774 | 2,749,913 | 2,726,314 | 2,478,904 | |||||||||||||||
|
Bank borrowings, overdrafts and
current portion of long-term debt
|
133,899 | 76,780 | 101,982 | 152,473 | 15,897 | |||||||||||||||
|
Long-term debt
|
787,668 | 934,749 | 1,153,672 | 1,060,168 | 791,443 | |||||||||||||||
|
Total Shareholders’ equity (b) (c) (e)
|
1,003,155 | 771,910 | 580,642 | 626,359 | 916,056 | |||||||||||||||
|
|
||||||||||||||||||||
|
Other Data
|
||||||||||||||||||||
|
Current ratio (d)
|
2.0 | 2.3 | 2.6 | 2.1 | 2.4 | |||||||||||||||
|
Gross additions to property, plant and
equipment
|
$ | 106,301 | $ | 66,819 | $ | 85,395 | $ | 65,614 | $ | 58,282 | ||||||||||
|
Depreciation and amortization expense
|
79,242 | 78,525 | 75,986 | 82,788 | 89,733 | |||||||||||||||
|
Cash dividends declared
|
83,056 | 78,962 | 75,902 | 76,465 | 68,956 | |||||||||||||||
|
per share
|
$ | 1.04 | $ | 1.00 | $ | 0.96 | $ | 0.88 | $ | 0.77 | ||||||||||
|
Number of shareholders of record at year-end
|
2,758 | 3,004 | 3,167 | 3,248 | 3,393 | |||||||||||||||
|
Number of employees at year-end
|
5,514 | 5,377 | 5,338 | 5,315 | 5,087 | |||||||||||||||
| (a) | Restructuring and other charges ($8,928 after tax) in 2010, ($14,763 after tax) in 2009, ($12,583 after tax) in 2008 and ($1,982 after tax) in 2006 were the result of various restructuring and reorganization programs of the Company. | |
| (b) | The 2006 amounts reflect adoption of ASC 715 “Compensation — Retirement Benefits”. | |
| (c) | The 2007 amounts reflect adoption of ASC 740 “Income Taxes”. | |
| (d) | Current ratio is equal to current assets divided by current liabilities. | |
| (e) | Includes noncontrolling interests for all periods presented. | |
| (f) | The 2006 — 2008 periods have been revised to properly recognize R&D expense, net of R&D credits. Previously, these credits were reflected as a reduction of tax expense. | |
| (g) | Certain reclassifications have been made to the prior periods, within cost of goods sold, research and development expenses and selling and administrative expenses, to conform with the 2010 presentation. |
18
Table of Contents
| ITEM 7. | MANAGEMENT’S DISCUSSION AND ANALYSIS OF FINANCIAL CONDITION AND RESULTS OF OPERATIONS. |
| • | Executive Overview |
| • | Sales Commentary |
| • | Consolidated Operating Results |
| • | Goodwill and Intangible Assets |
| • | Restructuring and Other Charges |
| • | Income Taxes |
| • | Financial Condition |
| • | Critical Accounting Policies and Use of Estimates |
| • | New Accounting Standards |
| • | Non-GAAP Financial Measures |
| • | Cautionary Statement Under The Private Securities Litigation Reform Act of 1995 |
19
Table of Contents
| • | created for the exclusive use by a specific customer; |
| • | sold in powder or liquid form, in amounts ranging from a few pounds to several tons depending on the nature of the end product in which they are used; |
| • | a small percentage of the volume and cost of the end product sold to the consumer; and |
| • | a major factor in consumer selection and acceptance of the product. |
20
Table of Contents
| Percent | Percent | |||||||||||||||||||
| Net Sales | 2010 | Change | 2009 | Change | 2008 | |||||||||||||||
|
Fragrances
|
$ | 1,420 | 14 | % | $ | 1,245 | -4 | % | $ | 1,297 | ||||||||||
|
Flavors
|
1,203 | 11 | % | 1,081 | -1 | % | 1,092 | |||||||||||||
|
|
||||||||||||||||||||
|
Total net sales
|
$ | 2,623 | 13 | % | $ | 2,326 | -3 | % | $ | 2,389 | ||||||||||
|
|
||||||||||||||||||||
21
Table of Contents
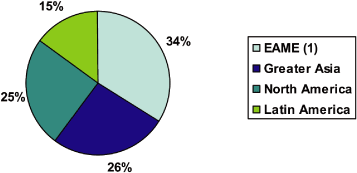
| Percent | Percent | |||||||||||||||||||
| Sales by Destination | 2010 | Change | 2009 | Change | 2008 | |||||||||||||||
|
EAME
(1)
|
$ | 897 | 11 | % | $ | 808 | -11 | % | $ | 907 | ||||||||||
|
Greater Asia
|
677 | 18 | % | 575 | 5 | % | 547 | |||||||||||||
|
North America
|
651 | 8 | % | 600 | 0 | % | 601 | |||||||||||||
|
Latin America
|
398 | 16 | % | 343 | 3 | % | 334 | |||||||||||||
|
|
||||||||||||||||||||
|
Total net sales,
as reported
|
$ | 2,623 | 13 | % | $ | 2,326 | -3 | % | $ | 2,389 | ||||||||||
|
|
||||||||||||||||||||
| (1) | Europe, Africa and Middle East |
22
Table of Contents
| % Change in Sales — 2010 vs 2009 | ||||||||||||||||||||||||||
| Fine & | ||||||||||||||||||||||||||
| Beauty Care | Functional | Ingredients | Total Frag. | Flavors | Total | |||||||||||||||||||||
|
North America
|
Reported | 11 | % | 2 | % | 23 | % | 11 | % | 6 | % | 8 | % | |||||||||||||
|
|
||||||||||||||||||||||||||
|
EAME
|
Reported | 25 | % | 1 | % | 12 | % | 12 | % | 10 | % | 11 | % | |||||||||||||
|
|
Local Currency | 31 | % | 6 | % | 17 | % | 17 | % | 13 | % | 15 | % | |||||||||||||
|
|
||||||||||||||||||||||||||
|
Latin America
|
Reported | 44 | % | 5 | % | 14 | % | 20 | % | 10 | % | 16 | % | |||||||||||||
|
|
Local Currency | 40 | % | 5 | % | 14 | % | 18 | % | 6 | % | 14 | % | |||||||||||||
|
|
||||||||||||||||||||||||||
|
Greater Asia
|
Reported | 22 | % | 19 | % | 11 | % | 18 | % | 17 | % | 18 | % | |||||||||||||
|
|
Local Currency | 20 | % | 17 | % | 10 | % | 17 | % | 12 | % | 14 | % | |||||||||||||
|
|
||||||||||||||||||||||||||
|
Total
|
Reported | 24 | % | 6 | % | 15 | % | 14 | % | 11 | % | 13 | % | |||||||||||||
|
|
Local Currency | 26 | % | 7 | % | 18 | % | 16 | % | 10 | % | 13 | % | |||||||||||||
| • | North America Fine & Beauty sales growth was driven by 16% growth in Fine Fragrance associated with general demand recovery (including some elements of re-stocking) as well as weaker year ago comparison levels (mostly in the first half of the year) combined with good market success for new business launches. The strong performance in Ingredients reflects broad-based volume gains, re-stocking and weak market conditions last year. Functional Fragrance sales increased as strong new business wins across all categories more than offset volume erosion in Fabric Care, with the strongest gain within the Home Care category. Double-digit growth in Beverages (volume) and Confectionery (net new wins) categories led the growth in the Flavors business, with Savory also contributing solid growth. | ||
| • | EAME delivered strong sales gains across all categories (except Personal Wash), led by new business and demand recovery in Fine Fragrance, Ingredients and Fabric Care plus net new wins and higher volume for Flavors, notably within the Beverage category, which grew 27%. The Flavors business also benefited from double-digit growth in Confectionery and Dairy. Re-stocking also supported growth in the developed countries within the region across most categories. | ||
| • | Latin America’s sales performance was led by general recovery in demand and new business in Fine Fragrance, which grew 50%. Double-digit growth in Beauty Care, Confectionery, Dairy and Savory categories more than offset the effect of non-strategic Flavors’ business lost last year. The Functional Fragrance category improvement benefited from both new business and volume recovery in Home Care and Fabric Care. | ||
| • | Greater Asia delivered double-digit LC sales growth in all categories. Fine & Beauty Care gains were driven by demand recovery and new business wins in Hair Care and Toiletries. Fine Fragrance’s growth of 40% also benefited from demand recovery and a weaker prior year base. Within Functional Fragrances, Fabric, Home Care and Personal Wash all achieved double-digit gains reflecting both strong commercial performance and solid demand growth. Flavor sales growth was driven by new product introductions and volume growth mainly in Savory, Beverage and Confectionery, with all major categories producing double-digit gains. |
23
Table of Contents
| % Change in Sales — 2009 vs 2008 | ||||||||||||||||||||||||||
| Fine & | ||||||||||||||||||||||||||
| Beauty Care | Functional | Ingredients | Total Frag. | Flavors | Total | |||||||||||||||||||||
|
North America
|
Reported | -14 | % | 1 | % | 5 | % | -3 | % | 3 | % | 0 | % | |||||||||||||
|
|
||||||||||||||||||||||||||
|
EAME
|
Reported | -24 | % | -3 | % | -11 | % | -13 | % | -7 | % | -11 | % | |||||||||||||
|
|
Local Currency | -18 | % | 2 | % | -6 | % | -8 | % | 0 | % | -5 | % | |||||||||||||
|
|
||||||||||||||||||||||||||
|
Latin America
|
Reported | 8 | % | 4 | % | -2 | % | 5 | % | 0 | % | 3 | % | |||||||||||||
|
|
Local Currency | 9 | % | 5 | % | -1 | % | 5 | % | 4 | % | 5 | % | |||||||||||||
|
|
||||||||||||||||||||||||||
|
Greater Asia
|
Reported | 17 | % | 14 | % | -1 | % | 12 | % | 1 | % | 5 | % | |||||||||||||
|
|
Local Currency | 20 | % | 16 | % | -3 | % | 13 | % | 4 | % | 7 | % | |||||||||||||
|
|
||||||||||||||||||||||||||
|
Total
|
Reported | -12 | % | 3 | % | -4 | % | -4 | % | -1 | % | -3 | % | |||||||||||||
|
|
Local Currency | -8 | % | 5 | % | -2 | % | -1 | % | 2 | % | 0 | % | |||||||||||||
| • | North America sales were flat as the erosion and volume declines in Fine Fragrance and Flavors compounds offset more than $40 million in new product introductions, plus modest price realization in Flavors and Functional Fragrances. Ingredient sales growth was mainly attributable to cost driven price increases. |
| • | EAME sales declines in LC were driven by de-stocking and weak underlying demand for Fine Fragrance and Ingredients that more than offset solid win performance in Functional Fragrances. Flavor sales were effectively flat as new wins in Savory and Confectionary plus pricing were offset by customer inventory reductions across most categories. |
| • | Latin America sales growth was 5% in LC led by near double-digit growth in the Fine Fragrances and Beauty Care and solid performance in the Functional Fragrances and Flavors categories. The growth was primarily driven by new product introductions of approximately $15 million combined with price increases across both businesses. |
| • | Greater Asia LC sales growth was largely driven by more than $15 million in new product introductions in Fabric and Hair Care, combined with approximately $10 million in new product introductions in Flavors which more than offset the effects of customer inventory reductions in the Ingredients category supply chain. |
24
Table of Contents
| 2010 | 2009 | 2008 | ||||||||||
|
Cost of goods sold
|
58.3 | % | 59.8 | % | 59.4 | % | ||||||
|
Research and
development expenses
|
8.3 | % | 7.9 | % | 8.2 | % | ||||||
|
Selling and
administrative
expenses
|
17.1 | % | 16.8 | % | 16.8 | % | ||||||
25
Table of Contents
26
Table of Contents
27
Table of Contents
28
Table of Contents
| Restructuring Charges | ||||||||||||||||||||||||
| ( In Thousands) | Positions Affected | |||||||||||||||||||||||
| 2010 | 2009 | 2008 | 2010 | 2009 | 2008 | |||||||||||||||||||
|
Flavors
|
$ | — | $ | 637 | $ | 3,538 | — | 7 | 36 | |||||||||||||||
|
Fragrances
|
10,077 | 18,046 | 4,396 | (10 | ) | 200 | 38 | |||||||||||||||||
|
Global
|
— | (382 | ) | 10,278 | — | 5 | 144 | |||||||||||||||||
|
|
||||||||||||||||||||||||
|
Total
|
$ | 10,077 | $ | 18,301 | $ | 18,212 | (10 | ) | 212 | 218 | ||||||||||||||
|
|
||||||||||||||||||||||||
| Asset- | ||||||||||||
| Related | ||||||||||||
| Employee- | and | |||||||||||
| (In Millions) | Related | Other | Total | |||||||||
|
Balance January 1, 2008
|
$ | 3 | $ | — | $ | 3 | ||||||
|
Additional charges, net of reversal
|
18 | — | 18 | |||||||||
|
Payments and other
|
(6 | ) | — | (6 | ) | |||||||
|
|
||||||||||||
|
Balance December 31, 2008
|
15 | — | 15 | |||||||||
|
Additional charges, net of reversal
|
17 | 1 | 18 | |||||||||
|
Payments and other
|
(13 | ) | — | (13 | ) | |||||||
|
Non-cash charges
|
— | (1 | ) | (1 | ) | |||||||
|
|
||||||||||||
|
Balance December 31, 2009
|
19 | — | 19 | |||||||||
|
Additional charges, net of reversal
|
4 | 6 | 10 | |||||||||
|
Payments and other
|
(19 | ) | (1 | ) | (20 | ) | ||||||
|
Non-cash charges
|
— | (5 | ) | (5 | ) | |||||||
|
|
||||||||||||
|
Balance December 31, 2010
|
$ | 4 | $ | — | $ | 4 | ||||||
|
|
||||||||||||
29
Table of Contents
30
Table of Contents
31
Table of Contents
| (1) | Adjusted EBITDA and Net Debt, which are non-GAAP measures used for these covenants, are calculated in accordance with the definition in the debt agreements. In this context, these measures are used solely to provide information on the extent to which we are in compliance with debt covenants and may not be comparable to adjusted EBITDA and Net Debt used by other companies. Reconciliations of adjusted EBITDA to net income and net debt to total debt are as follows: |
| 12 Months Ended December 31, | ||||||||
| (In Millions) | 2010 | 2009 | ||||||
|
Net income
|
$ | 263.6 | $ | 195.5 | ||||
|
Interest expense
|
48.7 | 61.8 | ||||||
|
Income taxes
|
96.0 | 81.0 | ||||||
|
Depreciation
|
73.1 | 72.3 | ||||||
|
Amortization
|
6.1 | 6.2 | ||||||
|
Specified items
(1)
|
10.1 | 24.6 | ||||||
|
|
||||||||
|
Adjusted EBITDA
|
$ | 497.6 | $ | 441.4 | ||||
|
|
||||||||
| (1) | Specified items for the 12 months ended December 31, 2010 of $10.1 million consist of restructuring charges. Specified items for the 12 months ended December 31, 2009 of $24.6 million consist principally of restructuring charges ($18.3 million) and employee separation costs ($6.3 million). |
| December 31, | ||||||||
| (In Millions) | 2010 | 2009 | ||||||
|
Total Debt
|
$ | 921.6 | $ | 1,011.5 | ||||
|
Adjustments:
|
||||||||
|
Deferred gain on interest rate swaps
|
(12.9 | ) | (15.0 | ) | ||||
|
Cash and cash equivalents
|
(131.3 | ) | (80.1 | ) | ||||
|
|
||||||||
|
Net Debt
|
$ | 777.4 | $ | 916.4 | ||||
|
|
||||||||
32
Table of Contents
| Payments Due | ||||||||||||||||||||
| Contractual Obligations | 2016 and | |||||||||||||||||||
| (In Millions) | Total | 2011 | 2012-2013 | 2014-2015 | thereafter | |||||||||||||||
|
Borrowings
(1)
|
$ | 909 | $ | 134 | $ | 150 | $ | — | $ | 625 | ||||||||||
|
Interest on borrowings
(1)
|
373 | 49 | 88 | 79 | 157 | |||||||||||||||
|
Operating leases
(2)
|
270 | 25 | 44 | 37 | 164 | |||||||||||||||
|
Purchase commitments
(3)
|
15 | 15 | — | — | — | |||||||||||||||
|
Pension funding obligations
(4)
|
78 | 26 | 52 | — | — | |||||||||||||||
|
Postretirement obligations
(5)
|
75 | 6 | 13 | 15 | 41 | |||||||||||||||
|
|
||||||||||||||||||||
|
Total
|
$ | 1,720 | $ | 255 | $ | 347 | $ | 131 | $ | 987 | ||||||||||
|
|
||||||||||||||||||||
| (1) | See Note 8 to the Consolidated Financial Statements for a further discussion of our various borrowing facilities. | |
| (2) | Operating leases include facility and other lease commitments executed in the normal course of the business, including sale leaseback obligations included in Note 7 of the Notes to the Consolidated Financial Statements. Further details concerning worldwide aggregate operating leases are contained in Note 16 of the Notes to the Consolidated Financial Statements. | |
| (3) | Purchase obligations and capital project commitments are not recorded on our consolidated balance sheet. | |
| (4) | See Note 13 to the Consolidated Financial Statements for a further discussion of our retirement plans. Anticipated funding obligations are based on current actuarial assumptions. The projected contributions beyond fiscal year 2013 are not currently determinable. | |
| (5) | Amounts represent expected future benefit payments for our postretirement benefit plans. |
33
Table of Contents
34
Table of Contents
35
Table of Contents
36
Table of Contents
| ITEM 7A. | QUANTITATIVE AND QUALITATIVE DISCLOSURES ABOUT MARKET RISK. |
37
Table of Contents
| ITEM 8. | FINANCIAL STATEMENTS AND SUPPLEMENTARY DATA. |
| ITEM 9. | CHANGES IN AND DISAGREEMENTS WITH ACCOUNTANTS ON ACCOUNTING AND FINANCIAL DISCLOSURE. |
| ITEM 9A. | CONTROLS AND PROCEDURES. |
38
Table of Contents
| ITEM 9B. | OTHER INFORMATION. |
39
Table of Contents
| ITEM 10. | DIRECTORS, EXECUTIVE OFFICERS AND CORPORATE GOVERNANCE. |
| ITEM 11. | EXECUTIVE COMPENSATION. |
| ITEM 12. | SECURITY OWNERSHIP OF CERTAIN BENEFICIAL OWNERS AND MANAGEMENT AND RELATED STOCKHOLDER MATTERS. |
| ITEM 13. | CERTAIN RELATIONSHIPS AND RELATED TRANSACTIONS, AND DIRECTOR INDEPENDENCE. |
40
Table of Contents
| ITEM 14. | PRINCIPAL ACCOUNTING FEES AND SERVICES. |
| ITEM 15. | EXHIBITS AND FINANCIAL STATEMENT SCHEDULES. |
| (a)(1) FINANCIAL STATEMENTS: The following consolidated financial statements, related notes, and independent registered public accounting firm’s report are included in this report on Form 10-K: |
| 42 | ||||
|
|
||||
| 43 | ||||
|
|
||||
| 44 | ||||
|
|
||||
| 45 | ||||
|
|
||||
| 46 | ||||
|
|
||||
| 47-78 | ||||
|
|
||||
|
(a)(2) FINANCIAL STATEMENT SCHEDULES
|
||||
|
|
||||
| S-1 |
41
Table of Contents
|
/s/ PricewaterhouseCoopers LLP
|
||
|
New York, New York
|
||
|
February 24, 2011
|
42
Table of Contents
| Year Ended December 31, | ||||||||||||
| (DOLLARS IN THOUSANDS EXCEPT PER SHARE AMOUNTS) | 2010 | 2009 | 2008 | |||||||||
|
Net sales
|
$ | 2,622,862 | $ | 2,326,158 | $ | 2,389,372 | ||||||
|
|
||||||||||||
|
Cost of goods sold
|
1,530,260 | 1,391,913 | 1,418,441 | |||||||||
|
Research and development expenses
|
218,772 | 184,771 | 196,863 | |||||||||
|
Selling and administrative expenses
|
447,392 | 390,885 | 400,723 | |||||||||
|
Restructuring and other charges, net
|
10,077 | 18,301 | 18,212 | |||||||||
|
Interest expense
|
48,709 | 61,818 | 74,008 | |||||||||
|
Other expense (income), net
|
8,059 | 1,921 | (2,797 | ) | ||||||||
|
|
||||||||||||
|
|
2,263,269 | 2,049,609 | 2,105,450 | |||||||||
|
|
||||||||||||
|
Income before taxes
|
359,593 | 276,549 | 283,922 | |||||||||
|
Taxes on income
|
96,036 | 81,023 | 54,294 | |||||||||
|
|
||||||||||||
|
Net income
|
263,557 | 195,526 | 229,628 | |||||||||
|
Other comprehensive income:
|
||||||||||||
|
Foreign currency translation adjustments
|
(6,220 | ) | 81,240 | (116,856 | ) | |||||||
|
Gains (losses) on derivatives
qualifying as hedges
|
(1,442 | ) | 1,091 | (1,989 | ) | |||||||
|
Pension and postretirement liability adjustment
|
3,285 | (28,200 | ) | (61,913 | ) | |||||||
|
|
||||||||||||
|
Comprehensive income
|
$ | 259,180 | $ | 249,657 | $ | 48,870 | ||||||
|
|
||||||||||||
| 2010 | 2009 | 2008 | ||||||||||
|
Net income per share — basic
|
$ | 3.29 | $ | 2.48 | $ | 2.89 | ||||||
|
Net income per share — diluted
|
$ | 3.26 | $ | 2.46 | $ | 2.86 | ||||||
43
Table of Contents
| (DOLLARS IN THOUSANDS) | December 31, | |||||||
| ASSETS | 2010 | 2009 | ||||||
|
Current Assets:
|
||||||||
|
Cash and cash equivalents
|
$ | 131,332 | $ | 80,135 | ||||
|
Receivables:
|
||||||||
|
Trade
|
458,128 | 454,528 | ||||||
|
Allowance for doubtful accounts
|
(6,324 | ) | (10,263 | ) | ||||
|
Inventories
|
531,675 | 444,977 | ||||||
|
Deferred income taxes
|
74,160 | 55,002 | ||||||
|
Prepaid expenses and other current assets
|
136,224 | 103,687 | ||||||
|
|
||||||||
|
Total Current Assets
|
1,325,195 | 1,128,066 | ||||||
|
|
||||||||
|
|
||||||||
|
Property, plant and equipment, net
|
538,118 | 501,293 | ||||||
|
Goodwill
|
665,582 | 665,582 | ||||||
|
Other intangible assets, net
|
48,834 | 54,948 | ||||||
|
Deferred income taxes
|
122,800 | 129,720 | ||||||
|
Other assets
|
171,926 | 165,165 | ||||||
|
|
||||||||
|
Total Assets
|
$ | 2,872,455 | $ | 2,644,774 | ||||
|
|
||||||||
| December 31, | ||||||||
| LIABILITIES AND SHAREHOLDERS’ EQUITY | 2010 | 2009 | ||||||
|
Current Liabilities:
|
||||||||
|
Bank borrowings, overdrafts
and current portion of long-term debt
|
$ | 133,899 | $ | 76,780 | ||||
|
Accounts payable
|
200,153 | 161,027 | ||||||
|
Dividends payable
|
21,657 | 19,786 | ||||||
|
Restructuring and other charges
|
3,977 | 18,914 | ||||||
|
Other current liabilities
|
301,265 | 207,947 | ||||||
|
|
||||||||
|
Total Current Liabilities
|
660,951 | 484,454 | ||||||
|
|
||||||||
|
Other Liabilities:
|
||||||||
|
Long-term debt
|
787,668 | 934,749 | ||||||
|
Deferred gains
|
50,917 | 54,884 | ||||||
|
Retirement liabilities
|
221,985 | 240,950 | ||||||
|
Other liabilities
|
147,779 | 157,827 | ||||||
|
|
||||||||
|
Total Other Liabilities
|
1,208,349 | 1,388,410 | ||||||
|
|
||||||||
|
|
||||||||
|
Commitments and Contingencies (Note 16)
|
||||||||
|
|
||||||||
|
Shareholders’ Equity:
|
||||||||
|
Common stock 12 1/2¢ par value; authorized 500,000,000 shares; issued
115,761,840 shares as of December 31, 2010 and 2009; and outstanding
80,210,365 and 79,157,393 shares as of December 31, 2010 and 2009
|
14,470 | 14,470 | ||||||
|
Capital in excess of par value
|
123,809 | 110,374 | ||||||
|
Retained earnings
|
2,519,706 | 2,339,205 | ||||||
|
Accumulated other comprehensive (loss) income:
|
||||||||
|
Cumulative translation adjustment
|
(74,826 | ) | (68,606 | ) | ||||
|
Accumulated losses on derivatives qualifying as hedges
|
(4,183 | ) | (2,741 | ) | ||||
|
Pension and postretirement liability adjustment
|
(196,342 | ) | (199,627 | ) | ||||
|
|
||||||||
|
|
2,382,634 | 2,193,075 | ||||||
|
Treasury stock, at cost — 35,551,475 and 36,604,447 shares as of
December 31, 2010 and 2009
|
(1,383,212 | ) | (1,424,072 | ) | ||||
|
|
||||||||
|
Total Shareholders’ Equity
|
999,422 | 769,003 | ||||||
|
|
||||||||
|
Noncontrolling interest
|
3,733 | 2,907 | ||||||
|
|
||||||||
|
Total Shareholders’ Equity including noncontrolling interest
|
1,003,155 | 771,910 | ||||||
|
|
||||||||
|
Total Liabilities and Shareholders’ Equity
|
$ | 2,872,455 | $ | 2,644,774 | ||||
|
|
||||||||
44
Table of Contents
| Year Ended December 31, | ||||||||||||
| (DOLLARS IN THOUSANDS) | 2010 | 2009 | 2008 | |||||||||
|
Cash flows from operating activities:
|
||||||||||||
|
Net income
|
$ | 263,557 | $ | 195,526 | $ | 229,628 | ||||||
|
Adjustments to reconcile to net cash provided by operating activities
|
||||||||||||
|
Depreciation and amortization
|
79,242 | 78,525 | 75,986 | |||||||||
|
Deferred income taxes
|
(13,301 | ) | (17,354 | ) | 7,261 | |||||||
|
Gain on disposal of assets
|
(3,681 | ) | (2,324 | ) | (2,160 | ) | ||||||
|
Equity based compensation
|
22,001 | 19,652 | 17,246 | |||||||||
|
Changes in assets and liabilities:
|
||||||||||||
|
Current receivables
|
(12,143 | ) | (27,380 | ) | (34,368 | ) | ||||||
|
Inventories
|
(86,250 | ) | 47,090 | (19,736 | ) | |||||||
|
Current payables
|
116,817 | 56,676 | (30,585 | ) | ||||||||
|
Changes in other assets
|
(53,917 | ) | (85,809 | ) | (25,825 | ) | ||||||
|
Changes in other liabilities
|
2,811 | 27,035 | 3,166 | |||||||||
|
|
||||||||||||
|
Net cash provided by operations
|
315,136 | 291,637 | 220,613 | |||||||||
|
|
||||||||||||
|
Cash flows from investing activities:
|
||||||||||||
|
Additions to property, plant and equipment
|
(106,301 | ) | (66,819 | ) | (85,395 | ) | ||||||
|
Proceeds from disposal of assets
|
1,657 | 1,784 | 2,848 | |||||||||
|
Termination / maturity of net investment hedges
|
1,719 | (13,604 | ) | — | ||||||||
|
Purchase of investments
|
(3,858 | ) | (2,249 | ) | (7,198 | ) | ||||||
|
|
||||||||||||
|
Net cash used in investing activities
|
(106,783 | ) | (80,888 | ) | (89,745 | ) | ||||||
|
|
||||||||||||
|
Cash flows from financing activities:
|
||||||||||||
|
Cash dividends paid to shareholders
|
(81,181 | ) | (78,841 | ) | (74,865 | ) | ||||||
|
Net change in bank borrowings and overdrafts
|
(103,190 | ) | (37,292 | ) | 2,902 | |||||||
|
Net proceeds from long-term debt
|
— | — | 139,167 | |||||||||
|
Repayments of long-term debt
|
— | (201,102 | ) | (139,364 | ) | |||||||
|
Proceeds from issuance of stock under stock plans
|
26,224 | 7,010 | 7,353 | |||||||||
|
Excess tax benefits on share-based payments
|
1,403 | — | 133 | |||||||||
|
Purchase of treasury stock
|
— | (1,967 | ) | (29,995 | ) | |||||||
|
|
||||||||||||
|
Net cash used in financing activities
|
(156,744 | ) | (312,192 | ) | (94,669 | ) | ||||||
|
|
||||||||||||
|
Effect of exchange rate changes on cash and cash equivalents
|
(412 | ) | 3,111 | (9,203 | ) | |||||||
|
Net change in cash and cash equivalents
|
51,197 | (98,332 | ) | 26,996 | ||||||||
|
Cash and cash equivalents at beginning of year
|
80,135 | 178,467 | 151,471 | |||||||||
|
|
||||||||||||
|
Cash and cash equivalents at end of year
|
$ | 131,332 | $ | 80,135 | $ | 178,467 | ||||||
|
|
||||||||||||
|
|
||||||||||||
|
Cash paid for:
|
||||||||||||
|
Interest
|
$ | 54,087 | $ | 70,847 | $ | 87,340 | ||||||
|
Taxes
|
$ | 70,807 | $ | 58,055 | $ | 50,280 | ||||||
45
Table of Contents
| Accumu- | ||||||||||||||||||||||||||||
| Capital in | lated other | |||||||||||||||||||||||||||
| Common | excess of | Retained | comprehensive | Treasury stock | Noncontrolling | |||||||||||||||||||||||
| (DOLLARS IN THOUSANDS) | stock | par value | earnings | (loss) income | Shares | Cost | Interest | |||||||||||||||||||||
|
Balance at December 31, 2007
|
$ | 14,470 | $ | 54,995 | $ | 2,078,937 | $ | (144,347 | ) | (34,766,612 | ) | $ | (1,386,858 | ) | $ | 9,162 | ||||||||||||
|
|
||||||||||||||||||||||||||||
|
Net income
|
229,628 | (1,631 | ) | |||||||||||||||||||||||||
|
EITF 06-4 adoption adjustment; net
of tax: $(5,529)
|
(10,022 | ) | ||||||||||||||||||||||||||
|
Cumulative translation adjustment
|
(116,856 | ) | ||||||||||||||||||||||||||
|
Losses on derivatives
qualifying as hedges
|
(1,989 | ) | ||||||||||||||||||||||||||
|
Pension liability and postretirement
adjustment; net of tax: $(34,159)
|
(61,913 | ) | ||||||||||||||||||||||||||
|
Cash dividends declared ($0.96 per share)
|
(75,902 | ) | ||||||||||||||||||||||||||
|
Stock options
|
(299 | ) | 157,376 | 6,295 | ||||||||||||||||||||||||
|
Reacquired shares
|
45,000 | (2,762,058 | ) | (74,995 | ) | |||||||||||||||||||||||
|
Vested restricted stock units and awards
|
(10,003 | ) | 165,277 | 6,826 | ||||||||||||||||||||||||
|
Stock based compensation
|
16,380 | 105,239 | 3,764 | |||||||||||||||||||||||||
|
|
||||||||||||||||||||||||||||
|
Balance at December 31, 2008
|
$ | 14,470 | $ | 106,073 | $ | 2,222,641 | $ | (325,105 | ) | (37,100,778 | ) | $ | (1,444,968 | ) | $ | 7,531 | ||||||||||||
|
Net income
|
195,526 | (4,624 | ) | |||||||||||||||||||||||||
|
Cumulative translation adjustment
|
81,240 | |||||||||||||||||||||||||||
|
Gains on derivatives
qualifying as hedges
|
1,091 | |||||||||||||||||||||||||||
|
Pension liability and postretirement
adjustment; net of tax: $(8,876)
|
(28,200 | ) | ||||||||||||||||||||||||||
|
Cash dividends declared ($1.00 per share)
|
(78,962 | ) | ||||||||||||||||||||||||||
|
Stock options
|
(1,294 | ) | 207,435 | 8,098 | ||||||||||||||||||||||||
|
Reacquired shares
|
(75,000 | ) | (1,967 | ) | ||||||||||||||||||||||||
|
Vested restricted stock units and awards
|
(13,026 | ) | 236,462 | 9,190 | ||||||||||||||||||||||||
|
Stock based compensation
|
18,621 | 127,434 | 5,575 | |||||||||||||||||||||||||
|
|
||||||||||||||||||||||||||||
|
Balance at December 31, 2009
|
$ | 14,470 | $ | 110,374 | $ | 2,339,205 | $ | (270,974 | ) | (36,604,447 | ) | $ | (1,424,072 | ) | $ | 2,907 | ||||||||||||
|
|
||||||||||||||||||||||||||||
|
Net income
|
263,557 | 826 | ||||||||||||||||||||||||||
|
Cumulative translation adjustment
|
(6,220 | ) | ||||||||||||||||||||||||||
|
Losses on derivatives
qualifying as hedges
|
(1,442 | ) | ||||||||||||||||||||||||||
|
Pension liability and postretirement
adjustment; net of tax: $(2,429)
|
3,285 | |||||||||||||||||||||||||||
|
Cash dividends declared ($1.04 per share)
|
(83,056 | ) | ||||||||||||||||||||||||||
|
Stock options/SSAR’s
|
(333 | ) | 779,317 | 30,461 | ||||||||||||||||||||||||
|
Vested restricted stock units and awards
|
(11,544 | ) | 111,484 | 4,337 | ||||||||||||||||||||||||
|
Stock based compensation
|
13,844 | 162,171 | 6,062 | |||||||||||||||||||||||||
|
Other
|
11,468 | |||||||||||||||||||||||||||
|
|
||||||||||||||||||||||||||||
|
Balance at December 31, 2010
|
$ | 14,470 | $ | 123,809 | $ | 2,519,706 | $ | (275,351 | ) | (35,551,475 | ) | $ | (1,383,212 | ) | $ | 3,733 | ||||||||||||
|
|
||||||||||||||||||||||||||||
46
Table of Contents
| December 31, | ||||||||
| (DOLLARS IN THOUSANDS) | 2010 | 2009 | ||||||
|
Raw materials
|
$ | 270,191 | $ | 228,999 | ||||
|
Work in process
|
6,211 | 9,173 | ||||||
|
Finished goods
|
255,273 | 206,805 | ||||||
|
|
||||||||
|
Total
|
$ | 531,675 | $ | 444,977 | ||||
|
|
||||||||
47
Table of Contents
48
Table of Contents
| Number of Shares | ||||||||||||
| (SHARES IN THOUSANDS) | 2010 | 2009 | 2008 | |||||||||
|
Basic
|
79,495 | 78,403 | 79,032 | |||||||||
|
Assumed dilution under stock plans
|
945 | 691 | 691 | |||||||||
|
|
||||||||||||
|
Diluted
|
80,440 | 79,094 | 79,723 | |||||||||
|
|
||||||||||||
49
Table of Contents
50
Table of Contents
| Asset- | ||||||||||||
| Employee- | Related | |||||||||||
| (In Millions) | Related | and Other | Total | |||||||||
|
Balance January 1, 2008
|
$ | 3 | $ | — | $ | 3 | ||||||
|
Additional charges, net of reversal
|
18 | — | 18 | |||||||||
|
Payments and other
|
(6 | ) | — | (6 | ) | |||||||
|
|
||||||||||||
|
Balance December 31, 2008
|
15 | — | 15 | |||||||||
|
Additional charges, net of reversal
|
17 | 1 | 18 | |||||||||
|
Payments and other
|
(13 | ) | — | (13 | ) | |||||||
|
Non-cash charges
|
— | (1 | ) | (1 | ) | |||||||
|
|
||||||||||||
|
Balance December 31, 2009
|
19 | — | 19 | |||||||||
|
Additional charges, net of reversal
|
4 | 6 | 10 | |||||||||
|
Payments and other
|
(19 | ) | (1 | ) | (20 | ) | ||||||
|
Non-cash charges
|
— | (5 | ) | (5 | ) | |||||||
|
|
||||||||||||
|
Balance December 31, 2010
|
$ | 4 | $ | — | $ | 4 | ||||||
|
|
||||||||||||
| Asset Type | December 31, | |||||||
| (DOLLARS IN THOUSANDS) | 2010 | 2009 | ||||||
|
Land
|
$ | 26,450 | $ | 28,223 | ||||
|
Buildings and Improvements
|
286,780 | 271,970 | ||||||
|
Machinery and Equipment
|
694,842 | 688,007 | ||||||
|
Information Technology
|
231,934 | 225,079 | ||||||
|
CIP
|
104,877 | 52,606 | ||||||
|
|
||||||||
|
|
1,344,883 | 1,265,885 | ||||||
|
Accumulated Depreciation
|
(806,765 | ) | (764,592 | ) | ||||
|
|
||||||||
|
|
$ | 538,118 | $ | 501,293 | ||||
|
|
||||||||
| DOLLARS IN THOUSANDS | Amount | |||
|
Flavors
|
$ | 319,479 | ||
|
Fragrances
|
346,103 | |||
|
|
||||
|
Total
|
$ | 665,582 | ||
|
|
||||
51
Table of Contents
| December 31, | ||||||||
| (DOLLARS IN THOUSANDS) | 2010 | 2009 | ||||||
|
Gross carrying value
(1)
|
$ | 165,406 | $ | 165,406 | ||||
|
Accumulated amortization
|
116,572 | 110,458 | ||||||
|
|
||||||||
|
Total
|
$ | 48,834 | $ | 54,948 | ||||
|
|
||||||||
| (1) | Includes patents, trademarks and other intellectual property, valued at acquisition, primarily through independent appraisals. |
| December 31, | ||||||||
| (DOLLARS IN THOUSANDS) | 2010 | 2009 | ||||||
|
Pension assets
|
$ | 66,274 | $ | 61,881 | ||||
|
Other
|
105,652 | 103,284 | ||||||
|
|
||||||||
|
Total
|
$ | 171,926 | $ | 165,165 | ||||
|
|
||||||||
| December 31, | ||||||||
| (DOLLARS IN THOUSANDS) | 2010 | 2009 | ||||||
|
Accrued payrolls and bonuses
|
$ | 95,135 | $ | 49,022 | ||||
|
Workers compensation and general
liability
|
20,061 | 21,111 | ||||||
|
Interest payable
|
17,550 | 17,993 | ||||||
|
Other
|
168,519 | 119,821 | ||||||
|
|
||||||||
|
Total
|
$ | 301,265 | $ | 207,947 | ||||
|
|
||||||||
52
Table of Contents
| (DOLLARS IN THOUSANDS) | Rate | Maturities | 2010 | 2009 | ||||||||||
|
Bank borrowings and overdrafts
|
0.42 | % | $ | 11,625 | $ | 76,780 | ||||||||
|
Current portion of long-term debt
|
5.39 | % | 122,274 | — | ||||||||||
|
|
||||||||||||||
|
Total current debt
|
133,899 | 76,780 | ||||||||||||
|
|
||||||||||||||
|
Senior Notes
— 2007
|
6.40 | % | 2017-27 | 500,000 | 500,000 | |||||||||
|
Senior Notes — 2006
|
6.10 | % | 2013-16 | 225,000 | 325,000 | |||||||||
|
Bank borrowings
|
0.38 | % | 2012 | 49,771 | 75,182 | |||||||||
|
Japanese Yen notes
|
— | 19,614 | ||||||||||||
|
Deferred realized gains on interest rate swaps
|
12,897 | 14,953 | ||||||||||||
|
|
||||||||||||||
|
Total long-term debt
|
787,668 | 934,749 | ||||||||||||
|
|
||||||||||||||
|
Total debt
|
$ | 921,567 | $ | 1,011,529 | ||||||||||
|
|
||||||||||||||
53
Table of Contents
54
Table of Contents
| (DOLLARS IN THOUSANDS) | 2010 | 2009 | 2008 | |||||||||
|
U.S. loss before taxes
|
$ | (82,112 | ) | $ | (80,345 | ) | $ | (90,819 | ) | |||
|
Foreign income before taxes
|
441,705 | 356,894 | 374,741 | |||||||||
|
|
||||||||||||
|
Total income before taxes
|
$ | 359,593 | $ | 276,549 | $ | 283,922 | ||||||
|
|
||||||||||||
| (DOLLARS IN THOUSANDS) | 2010 | 2009 | 2008 | |||||||||
|
Current
|
||||||||||||
|
Federal
|
$ | 5,379 | $ | 3,829 | $ | (8,363 | ) | |||||
|
State and local
|
507 | 413 | (94 | ) | ||||||||
|
Foreign
|
103,451 | 94,135 | 55,490 | |||||||||
|
|
||||||||||||
|
|
109,337 | 98,377 | 47,033 | |||||||||
|
|
||||||||||||
|
|
||||||||||||
|
Deferred
|
||||||||||||
|
Federal
|
(21,865 | ) | (13,817 | ) | 1,634 | |||||||
|
State and local
|
2,310 | 6,845 | (1,766 | ) | ||||||||
|
Foreign
|
6,254 | (10,382 | ) | 7,393 | ||||||||
|
|
||||||||||||
|
|
(13,301 | ) | (17,354 | ) | 7,261 | |||||||
|
|
||||||||||||
|
Total income taxes
|
$ | 96,036 | $ | 81,023 | $ | 54,294 | ||||||
|
|
||||||||||||
| 2010 | 2009 | 2008 | ||||||||||
|
Statutory tax rate
|
35.0 | % | 35.0 | % | 35.0 | % | ||||||
|
Difference in effective tax rate on foreign earnings and remittances
|
(8.1 | ) | (8.0 | ) | (15.0 | ) | ||||||
|
State and local taxes
|
0.6 | 1.7 | (0.7 | ) | ||||||||
|
Other, net
|
(0.8 | ) | 0.6 | (1) | (0.2 | ) | ||||||
|
|
||||||||||||
|
Effective tax rate
|
26.7 | % | 29.3 | % | 19.1 | % | ||||||
|
|
||||||||||||
| (1) | The 2009 results include $6 million of tax expense due to the recognition of out-of-period tax adjustments arising from periods 2006 and prior. The Company did not adjust the prior periods as it concluded that such adjustments were not material to the prior periods’ consolidated financial statements. |
55
Table of Contents
| December 31, | ||||||||
| (DOLLARS IN THOUSANDS) | 2010 | 2009 | ||||||
|
ASSETS
|
||||||||
|
Employee and retiree benefits
|
$ | 126,009 | $ | 116,471 | ||||
|
Credit and net operating loss carryforwards
|
190,690 | 209,161 | ||||||
|
Property, plant and equipment
|
4,152 | 2,559 | ||||||
|
Trademarks and other
|
96,373 | 29,508 | ||||||
|
Amortizable R&D expenses
|
22,278 | — | ||||||
|
Other, net
|
27,690 | 16,302 | ||||||
|
|
||||||||
|
Gross deferred tax assets
|
467,192 | 374,001 | ||||||
|
Valuation allowance
|
(288,182 | ) | (212,705 | ) | ||||
|
|
||||||||
|
Total deferred tax assets
|
179,010 | 161,296 | ||||||
|
LIABILITIES
|
||||||||
|
Trademarks and other
|
— | — | ||||||
|
|
||||||||
|
Total net deferred tax assets
|
$ | 179,010 | $ | 161,296 | ||||
|
|
||||||||
| (DOLLARS IN THOUSANDS) | 2010 | 2009 | 2008 | |||||||||
|
Balance of unrecognized tax benefits at beginning of year
|
$ | 64,673 | $ | 57,616 | $ | 80,645 | ||||||
|
Gross amount of increases in unrecognized tax benefits as a
result of positions taken during a prior year
|
2 | — | 4,265 | |||||||||
|
Gross amount of decreases in unrecognized tax benefits as a
result of positions taken during a prior year
|
— | (26 | ) | (2,200 | ) | |||||||
|
Gross amount of increases in unrecognized tax benefits as a
result of positions taken during the current year
|
4,706 | 8,827 | 8,394 | |||||||||
|
The amounts of decreases in unrecognized benefits relating to
settlements with taxing authorities
|
(4,945 | ) | (509 | ) | (31,877 | ) | ||||||
|
Reduction in unrecognized tax benefits due to the lapse of
applicable statute of limitation
|
(508 | ) | (1,235 | ) | (1,611 | ) | ||||||
|
|
||||||||||||
|
Balance of unrecognized tax benefits at end of year
|
$ | 63,928 | $ | 64,673 | $ | 57,616 | ||||||
|
|
||||||||||||
56
Table of Contents
57
Table of Contents
58
Table of Contents
| 2010 | 2009 | 2008 | ||||||||||
|
Weighted average fair value of
SSAR’s granted during the period
|
$ | 10.41 | $ | 7.08 | $ | 9.93 | ||||||
|
Assumptions:
|
||||||||||||
|
Risk-free interest rate
|
2.2 | % | 2.5 | % | 3.2 | % | ||||||
|
Expected volatility
|
29.8 | % | 30.9 | % | 25.7 | % | ||||||
|
Expected dividend yield
|
2.2 | % | 3.2 | % | 2.2 | % | ||||||
|
Expected life, in years
|
5 | 5 | 5 | |||||||||
|
Termination rate
|
1.09 | % | 0.91 | % | 0.46 | % | ||||||
|
Exercise multiple
|
1.38 | 1.46 | 1.52 | |||||||||
| Weighted | Options/ | |||||||||||
| Shares Subject to | Average Exercise | SSAR’s | ||||||||||
| (SHARE AMOUNTS IN THOUSANDS) | Options/SSAR’s | Price | Exercisable | |||||||||
|
Balance at December 31, 2009
|
2,228 | $ | 35.27 | 1,763 | ||||||||
|
Granted
|
197 | 44.92 | ||||||||||
|
Exercised
|
(939 | ) | 33.82 | |||||||||
|
Cancelled
|
(46 | ) | 37.11 | |||||||||
|
|
||||||||||||
|
Balance at December 31, 2010
|
1,440 | $ | 37.46 | 883 | ||||||||
|
|
||||||||||||
59
Table of Contents
| Weighted Average | ||||||||||||||||
| Number | Remaining | Weighted | Aggregate | |||||||||||||
| Outstanding | Contractual Life (in | Average | Intrinsic Value | |||||||||||||
| Price Range | (in thousands) | years) | Exercise Price | (in thousands) | ||||||||||||
|
$26-$30
|
410 | 3.7 | $ | 29.77 | ||||||||||||
|
$31-$35
|
344 | 2.3 | 33.31 | |||||||||||||
|
$36-$40
|
130 | 4.0 | 37.01 | |||||||||||||
|
$41-$45
|
397 | 5.4 | 43.54 | |||||||||||||
|
$46-$55
|
159 | 5.4 | 51.47 | |||||||||||||
|
|
||||||||||||||||
|
|
1,440 | $ | 37.46 | $ | 26,104 | |||||||||||
|
|
||||||||||||||||
| Weighted Average | ||||||||||||||||
| Number | Remaining | Weighted | Aggregate | |||||||||||||
| Outstanding | Contractual Life (in | Average | Intrinsic Value | |||||||||||||
| Price Range | (in thousands) | years) | Exercise Price | (in thousands) | ||||||||||||
|
$26-$30
|
257 | 1.8 | $ | 29.35 | ||||||||||||
|
$31-$35
|
344 | 2.3 | 33.31 | |||||||||||||
|
$36-$40
|
95 | 3.4 | 37.36 | |||||||||||||
|
$41-$45
|
28 | 4.1 | 42.12 | |||||||||||||
|
$46-$55
|
159 | 5.4 | 51.47 | |||||||||||||
|
|
||||||||||||||||
|
|
883 | $ | 36.14 | $ | 17,162 | |||||||||||
|
|
||||||||||||||||
| Weighted-Average | ||||||||
| Number of | Grant Date Fair | |||||||
| (SHARE AMOUNTS IN THOUSANDS) | Shares | Value Per Share | ||||||
|
Balance at December 31, 2009
|
978 | $ | 37.42 | |||||
|
Granted
|
305 | 48.09 | ||||||
|
Vested
|
(209 | ) | 48.41 | |||||
|
Forfeited
|
(45 | ) | 37.44 | |||||
|
|
||||||||
|
Balance at December 31, 2010
|
1,029 | $ | 40.29 | |||||
|
|
||||||||
60
Table of Contents
| Weighted-Average | ||||||||
| Number of | Grant Date Fair | |||||||
| (SHARE AMOUNTS IN THOUSANDS) | Shares | Value Per Share | ||||||
|
Balance at December 31, 2009
|
498 | $ | 15.44 | |||||
|
Granted
|
214 | 22.54 | ||||||
|
Vested
|
(181 | ) | 25.89 | |||||
|
Forfeited
|
(6 | ) | 15.24 | |||||
|
|
||||||||
|
Balance at December 31, 2010
|
525 | $ | 19.32 | |||||
|
|
||||||||
61
Table of Contents
| Year Ended December 31, | ||||||||||||
| (DOLLARS IN THOUSANDS) | 2010 | 2009 | 2008 | |||||||||
|
Net sales
|
||||||||||||
|
Flavors
|
$ | 1,203,274 | $ | 1,081,488 | $ | 1,092,544 | ||||||
|
Fragrances
|
1,419,588 | 1,244,670 | 1,296,828 | |||||||||
|
|
||||||||||||
|
Consolidated
|
$ | 2,622,862 | $ | 2,326,158 | $ | 2,389,372 | ||||||
|
|
||||||||||||
| Year Ended December 31, | ||||||||||||
| (DOLLARS IN THOUSANDS) | 2010 | 2009 | 2008 | |||||||||
|
Operating income (expense)
|
||||||||||||
|
Flavors
|
$ | 242,528 | $ | 208,329 | $ | 197,838 | ||||||
|
Fragrances
|
234,889 | 170,515 | 202,081 | |||||||||
|
Global expenses
|
(61,056 | ) | (38,556 | ) | (44,786 | ) | ||||||
|
|
||||||||||||
|
Consolidated operating income
|
$ | 416,361 | $ | 340,288 | $ | 355,133 | ||||||
|
Interest expense
|
(48,709 | ) | (61,818 | ) | (74,008 | ) | ||||||
|
Miscellaneous other (expense)
income, net
|
(8,059 | ) | (1,921 | ) | 2,797 | |||||||
|
|
||||||||||||
|
Income before taxes
|
$ | 359,593 | $ | 276,549 | $ | 283,922 | ||||||
|
|
||||||||||||
| December 31, | ||||||||
| (DOLLARS IN THOUSANDS) | 2010 | 2009 | ||||||
|
Segment assets
|
||||||||
|
Flavors
|
$ | 1,273,126 | $ | 1,154,489 | ||||
|
Fragrances
|
1,449,001 | 1,359,031 | ||||||
|
Global assets
|
150,328 | 131,254 | ||||||
|
|
||||||||
|
Consolidated
|
$ | 2,872,455 | $ | 2,644,774 | ||||
|
|
||||||||
| Capital Expenditures | Depreciation and Amortization | |||||||||||||||||||||||
| (DOLLARS IN THOUSANDS) | 2010 | 2009 | 2008 | 2010 | 2009 | 2008 | ||||||||||||||||||
|
Flavors
|
$ | 46,776 | $ | 23,463 | $ | 31,858 | $ | 31,634 | $ | 29,874 | $ | 29,816 | ||||||||||||
|
Fragrances
|
53,969 | 40,122 | 50,523 | 45,713 | 46,410 | 44,203 | ||||||||||||||||||
|
Unallocated assets
|
5,556 | 3,234 | 3,014 | 1,895 | 2,241 | 1,967 | ||||||||||||||||||
|
|
||||||||||||||||||||||||
|
Consolidated
|
$ | 106,301 | $ | 66,819 | $ | 85,395 | $ | 79,242 | $ | 78,525 | $ | 75,986 | ||||||||||||
|
|
||||||||||||||||||||||||
62
Table of Contents
| Net Sales | ||||||||||||
| (DOLLARS IN MILLIONS) | 2010 | 2009 | 2008 | |||||||||
|
Geographic areas
|
||||||||||||
|
EAME (1)
|
$ | 897 | $ | 808 | $ | 907 | ||||||
|
Greater Asia
|
677 | 575 | 547 | |||||||||
|
North America
|
651 | 600 | 601 | |||||||||
|
Latin America
|
398 | 343 | 334 | |||||||||
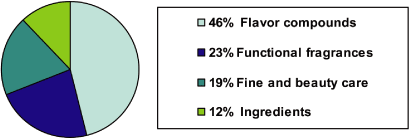
|
|
||||||||||||
|
Total
|
$ | 2,623 | $ | 2,326 | $ | 2,389 | ||||||
|
|
||||||||||||
| (1) | Europe, Africa and Middle East |
63
Table of Contents
| U.S. Plans | Non-U.S. Plans | |||||||||||||||||||||||
| (DOLLARS IN THOUSANDS) | 2010 | 2009 | 2008 | 2010 | 2009 | 2008 | ||||||||||||||||||
|
Components of net periodic benefit cost
|
||||||||||||||||||||||||
|
Service cost for benefits earned
|
$ | 3,781 | $ | 4,080 | $ | 4,569 | $ | 9,804 | $ | 8,678 | $ | 10,266 | ||||||||||||
|
Interest cost on projected benefit
obligation
|
24,191 | 23,685 | 23,883 | 32,954 | 30,978 | 36,270 | ||||||||||||||||||
|
Expected return on plan assets
|
(24,146 | ) | (24,616 | ) | (25,101 | ) | (41,569 | ) | (40,589 | ) | (51,256 | ) | ||||||||||||
|
Net amortization and deferrals
|
7,441 | 6,413 | 4,618 | 5,214 | 3,004 | 3,020 | ||||||||||||||||||
|
Settlement and curtailment
|
— | — | — | 182 | 440 | — | ||||||||||||||||||
|
Special termination benefits
|
— | — | — | 178 | — | — | ||||||||||||||||||
|
|
||||||||||||||||||||||||
|
Expense
|
11,267 | 9,562 | 7,969 | 6,763 | 2,511 | (1,700 | ) | |||||||||||||||||
|
Defined contribution and other
retirement plans
|
7,169 | 6,255 | 6,220 | 4,459 | 4,135 | 4,367 | ||||||||||||||||||
|
|
||||||||||||||||||||||||
|
Total pension expense
|
$ | 18,436 | $ | 15,817 | $ | 14,189 | $ | 11,222 | $ | 6,646 | $ | 2,667 | ||||||||||||
|
|
||||||||||||||||||||||||
|
|
||||||||||||||||||||||||
|
Changes in plan assets and benefit
obligations recognized in OCI
|
||||||||||||||||||||||||
|
Net actuarial (gain) loss
|
$ | 10,891 | $ | 5,026 | ||||||||||||||||||||
|
Actuarial loss
|
(6,951 | ) | (5,254 | ) | ||||||||||||||||||||
|
Prior service cost
|
(490 | ) | (142 | ) | ||||||||||||||||||||
|
Currency translation adjustment
|
— | (5,191 | ) | |||||||||||||||||||||
|
|
||||||||||||||||||||||||
|
Total recognized in OCI (before tax effects)
|
$ | 3,450 | $ | (5,561 | ) | |||||||||||||||||||
|
|
||||||||||||||||||||||||
| Postretirement Benefits | ||||||||||||
| (DOLLARS IN THOUSANDS) | 2010 | 2009 | 2008 | |||||||||
|
Components of net periodic benefit cost
|
||||||||||||
|
Service cost for benefits earned
|
$ | 1,378 | $ | 1,644 | $ | 2,694 | ||||||
|
Interest cost on projected benefit obligation
|
6,468 | 6,166 | 7,079 | |||||||||
|
Net amortization and deferrals
|
(2,232 | ) | (2,012 | ) | (723 | ) | ||||||
|
|
||||||||||||
|
Expense
|
$ | 5,614 | $ | 5,798 | $ | 9,050 | ||||||
|
|
||||||||||||
|
|
||||||||||||
|
Changes in plan assets and benefit
obligations recognized in OCI
|
||||||||||||
|
Net actuarial (gain) loss
|
$ | (5,426 | ) | |||||||||
|
Actuarial loss
|
(2,487 | ) | ||||||||||
|
Prior service credit
|
4,719 | |||||||||||
|
|
||||||||||||
|
Total recognized in OCI (before tax effects)
|
$ | (3,194 | ) | |||||||||
|
|
||||||||||||
| Postretirement | ||||||||||||
| (DOLLARS IN THOUSANDS) | U.S. Plans | Non-U.S. Plans | Benefits | |||||||||
|
Loss recognition
|
$ | 10,773 | $ | 5,084 | $ | 2,032 | ||||||
|
Prior service cost recognition
|
515 | 143 | (4,719 | ) | ||||||||
64
Table of Contents
| Weighted-average actuarial | U.S. Plans | Non-U.S. Plans | ||||||||||||||||||||||
| assumption used to determine expense | 2010 | 2009 | 2008 | 2010 | 2009 | 2008 | ||||||||||||||||||
|
Discount rate
|
6.10 | % | 6.00 | % | 6.10 | % | 5.66 | % | 6.11 | % | 5.78 | % | ||||||||||||
|
Expected return on plan assets
|
8.25 | % | 8.25 | % | 8.25 | % | 6.63 | % | 6.76 | % | 7.02 | % | ||||||||||||
|
Rate of compensation increase
|
3.25 | % | 3.50 | % | 4.00 | % | 3.00 | % | 2.56 | % | 2.98 | % | ||||||||||||
| U.S. Plans | Non-U.S. Plans | Postretirement Benefits | ||||||||||||||||||||||
| (DOLLARS IN THOUSANDS) | 2010 | 2009 | 2010 | 2009 | 2010 | 2009 | ||||||||||||||||||
|
Benefit obligation at beginning of year
|
$ | 406,901 | $ | 404,902 | $ | 621,259 | $ | 499,004 | $ | 110,512 | $ | 106,166 | ||||||||||||
|
Service cost for benefits earned
|
3,781 | 4,080 | 9,804 | 8,678 | 1,378 | 1,644 | ||||||||||||||||||
|
Interest cost on projected
benefit obligation
|
24,191 | 23,685 | 32,954 | 30,978 | 6,468 | 6,166 | ||||||||||||||||||
|
Actuarial (gain) loss
|
28,018 | (4,316 | ) | 16,432 | 79,704 | (5,426 | ) | 1,170 | ||||||||||||||||
|
Adjustments for expense/tax contained
in service cost
|
— | — | (2,153 | ) | (1,694 | ) | — | — | ||||||||||||||||
|
Plan participants’ contributions
|
— | — | 2,256 | 2,120 | 944 | 927 | ||||||||||||||||||
|
Benefits paid
|
(22,245 | ) | (21,450 | ) | (26,549 | ) | (24,761 | ) | (5,166 | ) | (5,561 | ) | ||||||||||||
|
Curtailments / settlements
|
— | — | (3,325 | ) | (1,537 | ) | — | — | ||||||||||||||||
|
Special terminaion benefits
|
— | — | 178 | — | — | — | ||||||||||||||||||
|
Translation adjustments
|
— | — | (25,804 | ) | 28,767 | — | — | |||||||||||||||||
|
|
||||||||||||||||||||||||
|
Benefit obligation at end of year
|
$ | 440,646 | $ | 406,901 | $ | 625,052 | $ | 621,259 | $ | 108,710 | $ | 110,512 | ||||||||||||
|
|
||||||||||||||||||||||||
|
|
||||||||||||||||||||||||
|
Fair value of plan assets at beginning of year
|
$ | 304,890 | $ | 248,151 | $ | 660,176 | $ | 574,886 | ||||||||||||||||
|
Actual return on plan assets
|
41,273 | 42,174 | 48,553 | 60,992 | ||||||||||||||||||||
|
Employer contributions
|
23,166 | 36,015 | 17,827 | 15,848 | ||||||||||||||||||||
|
Participants’ contributions
|
— | — | 2,256 | 2,120 | ||||||||||||||||||||
|
Benefits paid
|
(22,245 | ) | (21,450 | ) | (26,549 | ) | (24,761 | ) | ||||||||||||||||
|
Settlements
|
— | — | (1,056 | ) | (1,537 | ) | ||||||||||||||||||
|
Translation adjustments
|
— | — | (29,648 | ) | 32,628 | |||||||||||||||||||
|
|
||||||||||||||||||||||||
|
Fair value of plan assets at end of year
|
$ | 347,084 | $ | 304,890 | $ | 671,559 | $ | 660,176 | ||||||||||||||||
|
|
||||||||||||||||||||||||
|
Funded status at end of year
|
$ | (93,562 | ) | $ | (102,011 | ) | $ | 46,507 | $ | 38,917 | ||||||||||||||
|
|
||||||||||||||||||||||||
| U.S. Plans | Non-U.S. Plans | |||||||||||||||
| (DOLLARS IN THOUSANDS) | 2010 | 2009 | 2010 | 2009 | ||||||||||||
|
Amounts recognized
in the balance sheet:
|
||||||||||||||||
|
Non-current assets
|
$ | — | $ | — | $ | 66,274 | $ | 61,881 | ||||||||
|
Current liabilities
|
(3,291 | ) | (3,175 | ) | (608 | ) | (636 | ) | ||||||||
|
Non-current liabilities
|
(90,271 | ) | (98,836 | ) | (19,159 | ) | (22,328 | ) | ||||||||
|
|
||||||||||||||||
|
Net amount recognized
|
$ | (93,562 | ) | $ | (102,011 | ) | $ | 46,507 | $ | 38,917 | ||||||
|
|
||||||||||||||||
65
Table of Contents
| U.S. Plans | Non-U.S. Plans | Postretirement Benefits | ||||||||||||||||||||||
| (DOLLARS IN THOUSANDS) | 2010 | 2009 | 2010 | 2009 | 2010 | 2009 | ||||||||||||||||||
|
Amounts Recognized in
AOCI consist of:
|
||||||||||||||||||||||||
|
Net actuarial loss
|
$ | 129,916 | $ | 125,975 | $ | 155,305 | $ | 160,738 | $ | 30,217 | $ | 38,130 | ||||||||||||
|
Prior service cost (credit)
|
2,045 | 2,536 | 17 | 145 | (29,159 | ) | (33,878 | ) | ||||||||||||||||
|
|
||||||||||||||||||||||||
|
Total AOCI (before tax effects)
|
$ | 131,961 | $ | 128,511 | $ | 155,322 | $ | 160,883 | $ | 1,058 | $ | 4,252 | ||||||||||||
|
|
||||||||||||||||||||||||
| U.S. Plans | Non-U.S. Plans | |||||||||||||||
| (DOLLARS IN THOUSANDS) | 2010 | 2009 | 2010 | 2009 | ||||||||||||
|
Accumulated Benefit Obligation — end of year
|
$ | 435,123 | $ | 402,130 | $ | 598,025 | $ | 589,317 | ||||||||
|
|
||||||||||||||||
|
|
||||||||||||||||
|
Information for Pension Plans with
an ABO in excess of Plan Assets:
|
||||||||||||||||
|
Projected benefit obligation
|
$ | 440,646 | $ | 406,901 | $ | 23,840 | $ | 46,943 | ||||||||
|
Accumulated benefit obligation
|
435,123 | 402,130 | 21,852 | 41,636 | ||||||||||||
|
Fair value of plan assets
|
347,084 | 304,890 | 4,073 | 23,979 | ||||||||||||
|
|
||||||||||||||||
|
Weighted-average assumptions used to determine
obligations at December 31
|
||||||||||||||||
|
Discount rate
|
5.60 | % | 6.10 | % | 5.37 | % | 5.66 | % | ||||||||
|
Rate of compensation increase
|
3.25 | % | 3.25 | % | 2.66 | % | 3.00 | % | ||||||||
| U.S Plans | Non-U.S. Plans | |||||||||||||||
| Percentage of assets invested in: | 2010 | 2009 | 2010 | 2009 | ||||||||||||
|
Equities
|
64 | % | 60 | % | 31 | % | 30 | % | ||||||||
|
Fixed income
|
36 | % | 40 | % | 54 | % | 56 | % | ||||||||
|
Property
|
n/a | n/a | 11 | % | 12 | % | ||||||||||
|
Other investments
|
n/a | n/a | 4 | % | 2 | % | ||||||||||
| Postretirement | ||||||||||||
| (DOLLARS IN THOUSANDS) | U.S. Plans | Non-U.S. Plans | Benefits | |||||||||
|
Estimated Future Benefit Payments
|
||||||||||||
|
2011
|
$ | 23,460 | $ | 24,773 | $ | 5,982 | ||||||
|
2012
|
25,086 | 27,450 | 6,269 | |||||||||
|
2013
|
26,153 | 27,600 | 6,713 | |||||||||
|
2014
|
27,407 | 27,533 | 7,133 | |||||||||
|
2015
|
28,484 | 28,459 | 7,434 | |||||||||
|
2016-2020
|
158,946 | 157,386 | 41,213 | |||||||||
|
|
||||||||||||
|
Contributions
|
||||||||||||
|
Required Company Contributions in the Following
Year (2011)
|
$ | 3,381 | $ | 22,168 | $ | 5,982 | ||||||
|
|
||||||||||||
66
Table of Contents
67
Table of Contents
| U.S. Plans for the year ended | ||||||||||||||||
| December 31, 2010 | ||||||||||||||||
| (DOLLARS IN THOUSANDS) | Level 1 | Level 2 | Level 3 | Total | ||||||||||||
|
|
||||||||||||||||
|
Cash Equivalents
|
$ | — | $ | 3,642 | $ | — | $ | 3,642 | ||||||||
|
Equity Securities
|
||||||||||||||||
|
U.S. Common Stock
|
38,890 | — | — | 38,890 | ||||||||||||
|
Balanced Funds
|
— | 7,693 | — | 7,693 | ||||||||||||
|
Pooled Funds
|
— | 175,898 | — | 175,898 | ||||||||||||
|
Fixed Income Securities
|
||||||||||||||||
|
Government & Government Agency Bonds
|
— | 58,814 | — | 58,814 | ||||||||||||
|
Corporate Bonds
|
— | 52,794 | — | 52,794 | ||||||||||||
|
Municipal Bonds
|
— | 5,605 | — | 5,605 | ||||||||||||
|
Mortgage Backed Securities
|
— | 995 | — | 995 | ||||||||||||
|
Asset Backed Securities
|
— | 987 | — | 987 | ||||||||||||
|
|
||||||||||||||||
|
|
||||||||||||||||
|
Total
|
$ | 38,890 | $ | 306,428 | $ | — | $ | 345,318 | ||||||||
|
|
||||||||||||||||
|
Receivables
|
$ | 1,766 | ||||||||||||||
|
|
||||||||||||||||
|
Total
|
$ | 347,084 | ||||||||||||||
|
|
||||||||||||||||
| U.S. Plans for the year ended | ||||||||||||||||
| December 31, 2009 | ||||||||||||||||
| (DOLLARS IN THOUSANDS) | Level 1 | Level 2 | Level 3 | Total | ||||||||||||
|
|
||||||||||||||||
|
Cash Equivalents
|
$ | — | $ | 7,908 | $ | — | $ | 7,908 | ||||||||
|
Equity Securities
|
||||||||||||||||
|
IFF Common Stock
|
12,095 | — | — | 12,095 | ||||||||||||
|
U.S. Common Stock
|
13,850 | — | — | 13,850 | ||||||||||||
|
Non-U.S. Common Stock
|
1,160 | — | — | 1,160 | ||||||||||||
|
Mutual Funds
|
43,024 | — | — | 43,024 | ||||||||||||
|
Pooled Funds
|
— | 136,943 | — | 136,943 | ||||||||||||
|
Fixed Income Securities
|
||||||||||||||||
|
Government &
Government Agency
Bonds
|
— | 40,032 | — | 40,032 | ||||||||||||
|
Corporate Bonds
|
— | 46,139 | — | 46,139 | ||||||||||||
|
Municipal Bonds
|
— | 1,760 | — | 1,760 | ||||||||||||
|
Asset Backed Securities
|
— | 573 | — | 573 | ||||||||||||
|
|
||||||||||||||||
|
|
||||||||||||||||
|
Total
|
$ | 70,129 | $ | 233,355 | $ | — | $ | 303,484 | ||||||||
|
|
||||||||||||||||
|
Receivables
|
$ | 1,406 | ||||||||||||||
|
|
||||||||||||||||
|
Total
|
$ | 304,890 | ||||||||||||||
|
|
||||||||||||||||
68
Table of Contents
| Non-U.S. Plans for the year ended | ||||||||||||||||
| December 31, 2010 | ||||||||||||||||
| (DOLLARS IN THOUSANDS) | Level 1 | Level 2 | Level 3 | Total | ||||||||||||
|
|
||||||||||||||||
|
Cash
|
$ | 24,345 | $ | — | $ | — | $ | 24,345 | ||||||||
|
Equity Securities
|
||||||||||||||||
|
U.S. Large Cap
|
26,404 | — | — | 26,404 | ||||||||||||
|
Non-U.S. Large Cap
|
150,103 | — | — | 150,103 | ||||||||||||
|
Non-U.S. Mid Cap
|
6,040 | — | — | 6,040 | ||||||||||||
|
Non-U.S. Small Cap
|
2,223 | — | — | 2,223 | ||||||||||||
|
Emerging Markets
|
15,182 | — | — | 15,182 | ||||||||||||
|
Fixed Income Securities
|
||||||||||||||||
|
U.S. Treasuries/Government Bonds
|
104 | — | — | 104 | ||||||||||||
|
U.S. Corporate Bonds
|
— | 8,286 | — | 8,286 | ||||||||||||
|
Non-U.S. Treasuries/Government
Bonds
|
170,188 | — | — | 170,188 | ||||||||||||
|
Non-U.S. Corporate Bonds
|
72,957 | 87,731 | — | 160,688 | ||||||||||||
|
Non-U.S. Mortgage-Backed Securities
|
— | — | — | — | ||||||||||||
|
Non-U.S. Asset-Backed Securities
|
— | 8,280 | — | 8,280 | ||||||||||||
|
Non-U.S. Other Fixed Income
|
— | 23,559 | — | 23,559 | ||||||||||||
|
Alternative Types of Investments
|
||||||||||||||||
|
Insurance Contracts
|
— | 316 | — | 316 | ||||||||||||
|
Derivative Financial Instruments
|
— | 3,086 | — | 3,086 | ||||||||||||
|
Private Equity
|
— | — | 1 | 1 | ||||||||||||
|
Real Estate
|
||||||||||||||||
|
Non-U.S. Real Estate
|
— | 71,537 | 1,217 | 72,754 | ||||||||||||
|
|
||||||||||||||||
|
|
||||||||||||||||
|
Total
|
$ | 467,546 | $ | 202,795 | $ | 1,218 | $ | 671,559 | ||||||||
|
|
||||||||||||||||
69
Table of Contents
| Non-U.S. Plans for the year ended | ||||||||||||||||
| December 31, 2009 | ||||||||||||||||
| (DOLLARS IN THOUSANDS) | Level 1 | Level 2 | Level 3 | Total | ||||||||||||
|
|
||||||||||||||||
|
Cash
|
$ | 13,134 | $ | — | $ | — | $ | 13,134 | ||||||||
|
Equity Securities
|
||||||||||||||||
|
U.S. Large Cap
|
26,938 | — | — | 26,938 | ||||||||||||
|
Non-U.S. Large Cap
|
138,491 | — | — | 138,491 | ||||||||||||
|
Non-U.S. Mid Cap
|
7,660 | — | — | 7,660 | ||||||||||||
|
Non-U.S. Small Cap
|
1,622 | — | — | 1,622 | ||||||||||||
|
Emerging Markets
|
9,786 | — | — | 9,786 | ||||||||||||
|
Pooled Funds
|
12,934 | — | — | 12,934 | ||||||||||||
|
Fixed Income Securities
|
||||||||||||||||
|
U.S. Treasuries/Government Bonds
|
86 | — | — | 86 | ||||||||||||
|
Non-U.S. Treasuries/Government
Bonds
|
153,892 | — | — | 153,892 | ||||||||||||
|
Non-U.S. Corporate Bonds
|
79,659 | 93,671 | — | 173,330 | ||||||||||||
|
Non-U.S. Mortgage-Backed Securities
|
8,540 | — | — | 8,540 | ||||||||||||
|
Non-U.S. Asset-Backed Securities
|
5,693 | 8,674 | — | 14,367 | ||||||||||||
|
Non-U.S. Other Fixed Income
|
4,270 | 20,569 | — | 24,839 | ||||||||||||
|
Alternative Types of Investments
|
||||||||||||||||
|
Insurance Contracts
|
— | 322 | — | 322 | ||||||||||||
|
Private Equity Funds
|
— | — | 2 | 2 | ||||||||||||
|
Real Estate
|
||||||||||||||||
|
Non-U.S. Real Estate
|
1,202 | 72,655 | 376 | 74,233 | ||||||||||||
|
|
||||||||||||||||
|
|
||||||||||||||||
|
Total
|
$ | 463,907 | $ | 195,891 | $ | 378 | $ | 660,176 | ||||||||
|
|
||||||||||||||||
70
Table of Contents
| Non-U.S. Plans | ||||||||||||
| Real | Private | |||||||||||
| (DOLLARS IN THOUSANDS) | Estate | Equity | Total | |||||||||
|
|
||||||||||||
|
Beginning balance as of December 31, 2009
|
$ | 376 | $ | 2 | $ | 378 | ||||||
|
Actual return on plan assets:
|
||||||||||||
|
Relating to assets still held at the
reporting date
|
841 | (1 | ) | 840 | ||||||||
|
|
||||||||||||
|
Ending balance as of December 31, 2010
|
$ | 1,217 | $ | 1 | $ | 1,218 | ||||||
|
|
||||||||||||
| Expense | Liability | |||||||||||||||
| 2010 | 2009 | 2010 | 2009 | |||||||||||||
|
Discount rate
|
6.10 | % | 6.00 | % | 5.50 | % | 6.10 | % | ||||||||
|
Current medical cost trend rate
|
9.00 | % | 8.00 | % | 8.00 | % | 9.00 | % | ||||||||
|
Ultimate medical cost trend rate
|
4.75 | % | 4.75 | % | 4.75 | % | 4.75 | % | ||||||||
|
Medical cost trend rate decreases to ultimate rate in year
|
2016 | 2014 | 2016 | 2016 | ||||||||||||
| Sensitivity of Disclosures to Changes in Selected Assumptions | ||||||||||||||||
| 25 BP Decrease in | ||||||||||||||||
| 25 BP Decrease in Discount | 25 BP Decrease in | Long-Term Rate of | ||||||||||||||
| Rate | Discount Rate | Return | ||||||||||||||
| Change in | Change in | Change in | Change in | |||||||||||||
| (DOLLARS IN THOUSANDS) | PBO | ABO | pension expense | pension expense | ||||||||||||
|
U.S. Pension Plans
|
$ | 10,523 | $ | 10,302 | $ | 657 | $ | 739 | ||||||||
|
Non-U.S. Pension Plans
|
$ | 26,309 | $ | 22,996 | $ | 2,077 | $ | 1,675 | ||||||||
|
Postretirement Benefit Plan
|
N/A | $ | 2,938 | $ | 112 | N/A | ||||||||||
71
Table of Contents
| • | Level 1—Quoted prices for identical instruments in active markets. |
| • | Level 2—Quoted prices for similar instruments in active markets; quoted prices for identical or similar instruments in markets that are not active; and model-derived valuations in which all significant inputs and significant value drivers are observable in active markets. |
| • | Level 3—Valuations derived from valuation techniques in which one or more significant inputs or significant value drivers are unobservable . |
72
Table of Contents
| For the years ended December 31, | ||||||||
| 2010 | 2009 | |||||||
|
|
||||||||
|
Forward currency contracts
|
$ | 141,050 | $ | 50,000 | ||||
|
Interest rate swaps
|
$ | 116,209 | $ | 16,209 | ||||
73
Table of Contents
| December 31, 2010 | ||||||||||||
| Fair Value of | Fair Value of | |||||||||||
| Derivatives | Derivatives Not | |||||||||||
| Designated as | Designated as | |||||||||||
| Hedging | Hedging | Total Fair | ||||||||||
| Instruments | Instruments | Value | ||||||||||
|
|
||||||||||||
|
Derivative assets (a)
|
||||||||||||
|
Foreign currency contracts
|
$ | 2,984 | $ | 1,491 | $ | 4,475 | ||||||
|
Interest rate swaps
|
112 | — | 112 | |||||||||
|
|
||||||||||||
|
|
$ | 3,096 | $ | 1,491 | $ | 4,587 | ||||||
|
|
||||||||||||
|
Derivative liabilities (b)
|
||||||||||||
|
Foreign currency contracts
|
$ | 7,086 | $ | 9,276 | $ | 16,362 | ||||||
|
Interest rate swaps
|
348 | — | 348 | |||||||||
|
|
||||||||||||
|
|
$ | 7,434 | $ | 9,276 | $ | 16,710 | ||||||
|
|
. | |||||||||||
| December 31, 2009 | ||||||||||||
| Fair Value of | Fair Value of | |||||||||||
| Derivatives | Derivatives Not | |||||||||||
| Designated as | Designated as | |||||||||||
| Hedging | Hedging | Total Fair | ||||||||||
| Instruments | Instruments | Value | ||||||||||
|
Derivative assets (a)
|
||||||||||||
|
Foreign currency contracts
|
$ | — | $ | 174 | $ | 174 | ||||||
|
Interest rate swap
|
166 | — | 166 | |||||||||
|
|
||||||||||||
|
|
$ | 166 | $ | 174 | $ | 340 | ||||||
|
|
||||||||||||
|
Derivative liabilities (b)
|
||||||||||||
|
Foreign currency contracts
|
$ | 4,467 | $ | 906 | $ | 5,373 | ||||||
|
|
||||||||||||
| (a) | Derivative assets are recorded to Prepaid expenses and other current assets in the Consolidated Balance Sheet. | |
| (b) | All derivative liabilities are recorded as Other current liabilities in the Consolidated Balance Sheet. |
74
Table of Contents
| Amount of Gain or (Loss) | ||||||||||||
| Recognized in Income on | Location of Gain | |||||||||||
| Derivative | or (Loss) | |||||||||||
| Derivatives Not Designated as | For the years ended | Recognized in | ||||||||||
| Hedging Instruments under | December 31, | Income on | ||||||||||
| ASC 815 | 2010 | 2009 | Derivative | |||||||||
|
|
||||||||||||
|
Foreign currency contract
|
$ | 8,233 | $ | (1,991 | ) | Other expense (income), net | ||||||
75
Table of Contents
| Location of Gain or | Amount of Gain or | |||||||||||||||||||
| Amount of Gain or | (Loss) Reclassified | (Loss) Reclassified | ||||||||||||||||||
| (Loss) Recognized in | from Accumulated | from Accumulated | ||||||||||||||||||
| OCI on Derivative | OCI into Income | OCI into Income | ||||||||||||||||||
| (Effective Portion) | (Effective Portion) | (Effective Portion) | ||||||||||||||||||
| For the years ended | For the years ended | |||||||||||||||||||
| December 31, | December 31, | |||||||||||||||||||
| 2010 | 2009 | 2010 | 2009 | |||||||||||||||||
|
|
||||||||||||||||||||
|
Derivatives in Cash Flow Hedging Relationships:
|
||||||||||||||||||||
|
|
||||||||||||||||||||
|
Cross currency swap (1)
|
$ | (539 | ) | $ | 1,072 | Other expense (income), net | $ | (1,593 | ) | $ | (862 | ) | ||||||||
|
Forward currency contract
|
$ | (894 | ) | $ | — | Cost of goods sold | $ | (216 | ) | $ | — | |||||||||
|
|
||||||||||||||||||||
|
Derivatives in Net Investment Hedging
Relationships:
|
||||||||||||||||||||
|
|
||||||||||||||||||||
|
Forward currency contract
|
$ | (3,788 | ) | $ | — | N/A | $ | — | $ | — | ||||||||||
|
|
||||||||||||||||||||
|
|
||||||||||||||||||||
|
Total
|
$ | (5,221 | ) | $ | 1,072 | $ | (1,809 | ) | $ | (862 | ) | |||||||||
|
|
||||||||||||||||||||
| (1) | Ten year swap executed in 2003. |
76
Table of Contents
77
Table of Contents
78
Table of Contents
| Number | ||||
|
|
||||
| 3(i) |
Restated Certificate of Incorporation of the Company,
incorporated by reference to Exhibit 10(g) to Registrant’s
Report on Form 10-Q filed on August 12, 2002 (SEC file number
reference 001-04858).
|
|||
|
|
||||
| 3(ii) |
By-laws of the Registrant, incorporated by reference to
Exhibit 3.2 to Registrant’s Report on Form 8-K filed on
February 7, 2011.
|
|||
|
|
||||
| 4.1 |
Shareholder Protection Rights Agreement, dated as of March 21,
2000, between Registrant and The Bank of New York, as Rights
Agent, incorporated by reference to Exhibit 4.1 to
Registrant’s Report on Form 10-K filed on March 13, 2006.
|
|||
|
|
||||
| 4.1a |
First Amendment dated September 26, 2000, to Shareholder
Protection Rights Agreement, incorporated by reference to
Exhibit 4.1a to Registrant’s Report on Form 10-K filed on
March 13, 2006.
|
|||
|
|
||||
| 4.1b |
Letter Agreement between the Registrant and Wachovia Bank,
National Association (“Wachovia”), dated as of October 31,
2002, appointing Wachovia as Successor Rights Agent pursuant
to the Shareholder Protection Rights Agreement, dated as of
March 21, 2000 and amended as of September 26, 2000,
incorporated by reference to Exhibit 4(a) to Registrant’s
Report on Form 10-Q filed on November 12, 2002 (SEC file
number reference 001-04858).
|
|||
|
|
||||
| 4.2 |
Specimen Certificate of Registrant’s Common Stock bearing
legend notifying of Shareholder Protection Rights Agreement,
incorporated by reference to Exhibit 4(b) to Registrant’s
Registration Statement on Form S-3 filed on September 29,
2000. (Reg. No. 333-46932).
|
|||
|
|
||||
| 4.3 |
Note Purchase Agreement, dated as of July 12, 2006, by and
among International Flavors & Fragrances Inc. and the various
purchasers named therein, incorporated by reference to Exhibit
4.7 to Registrant’s Report on Form 8-K filed on July 13, 2006.
|
|||
|
|
||||
| 4.4 |
Form of Series A, Series B, Series C and Series D Senior Notes
incorporated by reference to Exhibit 4.8 to Registrant’s
Report on Form 8-K filed on July 13, 2006.
|
|||
|
|
||||
| 4.5 |
Note Purchase Agreement, dated as of September 27, 2007, by
and among International Flavors & Fragrances Inc. and the
various purchasers named therein, incorporated by reference to
Exhibit 4.7 to Registrant’s Report on Form 8-K filed on
October 1, 2007.
|
|||
|
|
||||
| 4.6 |
Form of Series A, Series B, Series C and Series D Senior Notes
incorporated by reference to Exhibit 4.8 of Registrant’s
Report on Form 8-K filed on October 1, 2007.
|
|||
|
|
||||
| 4.7 |
Credit Agreement dated as of November 18, 2008 among
International Flavors & Fragrances (Japan) Ltd., as Borrower,
International Flavors & Fragrances Inc., as Guarantor, and The
Bank of Tokyo-Mitsubishi UFJ, Ltd., as Lender, incorporated by
reference to Exhibit 10.1 to Registrant’s Report on Form 8-K
filed on November 21, 2008.
|
|||
79
Table of Contents
| Number | ||||
|
|
||||
| *10.1 |
Separation Agreement between International Flavors &
Fragrances Inc. and Robert M. Amen dated October 14, 2009,
incorporated by reference to Registrant’s Report on Form 8-K
filed on October 19, 2009.
|
|||
|
|
||||
| *10.2 |
Letter Agreement between International Flavors & Fragrances
Inc. and Douglas D. Tough, dated September 8, 2009,
incorporated by reference to Exhibit 10.1 to the Registrant’s
Report on Form 8-K filed on September 14, 2009.
|
|||
|
|
||||
| *10.3 |
Compensation arrangements of Kevin Berryman, effective as of
May 15, 2009, incorporated by reference to the Registrant’s
report on Form 8-K filed on April 16, 2009.
|
|||
|
|
||||
| *10.4 |
Compensation arrangements of Richard A. O’Leary, effective as
of April 28, 2009, incorporated by reference to the
Registrant’s report on Form 8-K filed on May 1, 2009.
|
|||
|
|
||||
| *10.5 |
Compensation arrangements of Nicolas A. Mirzayantz and Beth E.
Ford incorporated by reference to Exhibit 10.1 to Registrant’s
Report on form 10-Q filed on May 6, 2010.
|
|||
|
|
||||
| *10.6 |
Supplemental Retirement Plan, adopted by the Registrant’s
Board of Directors on October 29, 1986 as amended and restated
through October 9, 2007, incorporated by reference to Exhibit
10.5 to Registrant’s Report on Form 10-K filed on February 27,
2008.
|
|||
|
|
||||
| *10.7 |
2000 Stock Award and Incentive Plan, adopted by the
Registrant’s Board of Directors on March 9, 2000 as amended
and restated through October 9, 2007, incorporated by
reference to Exhibit 10.6 to Registrant’s Report on Form 10-K
filed on February 27, 2008.
|
|||
|
|
||||
| *10.8 |
2010 Stock Award and Incentive Plan as amended.
|
|||
|
|
||||
| *10.9 |
2000 Supplemental Stock Award Plan, adopted by the
Registrant’s Board of Directors on November 14, 2000 as
amended and restated through October 9, 2007, incorporated by
reference to Exhibit 10.7 to Registrant’s Report on Form 10-K
filed on February 27, 2008.
|
|||
|
|
||||
| *10.10 |
Registrant’s Executive Death Benefit Plan, effective July 1,
1990, incorporated by reference to Exhibit 10.6 to
Registrant’s Report on Form 10-K filed on March 13, 2006.
|
|||
|
|
||||
| *10.11 |
Registrant’s Vision 2001 Compensation Program, adopted by the
Registrant’s Board of Directors on December 12, 2000 and
amended in 2005, incorporated by reference to Exhibit 10.2 to
Registrant’s Report on Form 8-K filed on January 28, 2005 (SEC
file number reference 001-04858).
|
|||
|
|
||||
| *10.12 |
Long Term Equity Choice Program Summary, incorporated by
reference to Exhibit 10.3 to Registrant’s Report on Form 8-K
filed on March 10, 2006.
|
|||
|
|
||||
| *10.13 |
Performance Criteria for the 2008-2010 cycle under the
Company’s Long Term Incentive Plan, incorporated by reference
to Registrant’s Report on Form 8-K filed on February 1, 2008,
as further amended by a one-year supplemental performance
metric incorporated by reference to Registrant’s Report on
Form 8-K filed on February 5, 2010.
|
|||
|
|
||||
| *10.14 |
Performance Criteria for the 2009-2011 cycle under the
Company’s Long Term Incentive Plan, incorporated by reference
to Registrant’s Report on Form 10-Q filed on May 6, 2010.
|
|||
|
|
||||
| *10.15 |
Performance Criteria for the 2010-2012 cycle under the
Company’s Long Term Incentive Plan, incorporated by reference
to Registrant’s Report on Form 10-Q filed on May 6, 2010.
|
|||
|
|
||||
| *10.16 |
Performance Criteria for the 2011-2013 cycle under the
Company’s Long Term Incentive Plan, incorporated by reference
to Registrant’s Report on Form 10-Q filed on May 6, 2010.
|
|||
|
|
||||
| *10.17 |
Performance Criteria for the Registrant’s Annual Incentive
Plan for 2010, incorporated by reference to Exhibit 10.1 to
Registrant’s Report on form 10-Q filed on May 6, 2010.
|
|||
80
Table of Contents
| Number | ||||
|
|
||||
| *10.18 |
Performance Criteria for the Registrant’s Equity Choice
Program relating to Senior Executives incorporated by
reference to Exhibit 10.1 to Registrant’s Report on form 10-Q
filed on May 6, 2010.
|
|||
|
|
||||
| *10.19 |
Form of Non-Employee Director’s Restricted Stock Units
Agreement under International Flavors & Fragrances Inc. 2000
Stock Award and Incentive Plan, incorporated by reference to
Exhibit 10.7 to Registrant’s Report on Form 10-Q filed on
October 31, 2007.
|
|||
|
|
||||
| *10.20 |
Form of U.S. Restricted Stock Units Agreement under
International Flavors & Fragrances Inc. 2000 Stock Award and
Incentive Plan incorporated by reference to Exhibit 10.5 to
Registrant’s Report on Form 10-Q filed on October 31, 2007.
|
|||
|
|
||||
| *10.21 |
Form of U.S. Purchased Restricted Stock Agreement under
International Flavors & Fragrances Inc. 2000 Stock Award and
Incentive Plan, incorporated by reference to Exhibit 10.4 to
Registrant’s Report on Form 10-Q filed on October 31, 2007.
|
|||
|
|
||||
| *10.22 |
Form of U.S. Stock Settled Appreciation Rights Agreement under
International Flavors & Fragrances Inc. 2000 Stock Award and
Incentive Plan, incorporated by reference to Exhibit 10.6 to
Registrant’s Report on Form 10-Q filed on October 31, 2007.
|
|||
|
|
||||
| *10.23 |
Non-Employee Director Compensation Arrangements, adopted by
the Company’s Board of Directors on March 6, 2007,
incorporated by reference to Registrant’s Report on Form 8-K
filed on March 12, 2007.
|
|||
|
|
||||
| *10.24 |
Form of Restricted Stock Units Agreement under International
Flavors & Fragrances Inc. 2000 Stock Award and Incentive Plan
incorporated by reference to Registrant’s Report on 10-Q filed
on August 5, 2009.
|
|||
|
|
||||
| *10.25 |
Form of Purchased Restricted Stock Agreement under
International Flavors & Fragrances Inc. 2000 Stock Award and
Incentive Plan incorporated by reference to Registrant’s
Report on 10-Q filed on August 5, 2009.
|
|||
|
|
||||
| *10.26 |
Form of U.S. Performance-Based Restricted Stock Units
Agreement under International Flavors & Fragrances Inc. 2000
Stock Award and Incentive Plan, incorporated by reference to
Exhibit 10.8b to Registrant’s Report on Form 8-K filed on
October 7, 2004 (SEC file number reference 001-04858).
|
|||
|
|
||||
| *10.27 |
Form of Employee Stock Option Agreement under International
Flavors & Fragrances Inc. 2000 Stock Award and Incentive Plan,
incorporated by reference to Exhibit 10.1 to Registrant’s
Report on Form 10-Q filed on November 9, 2004 (SEC file number
reference 001-04858).
|
|||
|
|
||||
| *10.28 |
Form of International Flavors & Fragrances Inc. Stock Option
Agreement under 2000 Stock Option Plan for Non-Employee
Directors, incorporated by reference to Exhibit 10.2 to
Registrant’s Report on Form 10-Q filed on November 9, 2004
(SEC file number reference 001-04858).
|
|||
|
|
||||
| *10.29 |
Restated and Amended Executive Separation Policy as amended
through and including December 14, 2010.
|
|||
|
|
||||
| *10.30 |
1997 Employee Stock Option Plan, incorporated by reference to
Exhibit 10.18 to Registrant’s Report on
Form 10-K
filed on
March 13, 2006.
|
|||
81
Table of Contents
| Number | ||||
|
|
||||
| *10.31 |
Amendment to 1997 Employee Stock Option Plan as amended by
Registrant’s Board of Directors on February 8, 2000,
incorporated by reference to Exhibit 10.19 to Registrant’s
Report on Form 10-K filed on March 13, 2006.
|
|||
|
|
||||
| *10.32 |
Resolutions Relating to Equity Awards as approved by the Board
of Directors of the Registrant on January 29, 2007
incorporated by reference to Exhibit 10.25 to Registrant’s
Report on Form 10-K filed on February 23, 2007.
|
|||
|
|
||||
| *10.33 |
Deferred Compensation Plan adopted by Registrant’s Board of
Directors on December 12, 2000 as amended and restated through
February 2, 2010.
|
|||
|
|
||||
| *10.34 |
Trust Agreement dated October 4, 2000 among Registrant, First
Union National Bank and Buck Consultants Inc. approved by
Registrant’s Board of Directors on September 12, 2000,
incorporated by reference to Exhibit 10.21 to Registrant’s
Report on Form 10-K filed on March 13, 2006.
|
|||
|
|
||||
| *10.35 |
Amendment dated August 2, 2005 to the Trust Agreement dated
October 4, 2000 among Registrant, Wachovia Bank, N.A.
(formerly First Union National Bank) and Buck Consultants LLC
(formerly Buck Consultants Inc.), incorporated by reference to
Exhibit 10.1 to Registrant’s Report on Form 10-Q filed on
August 5, 2005 (SEC file number reference 001-04858).
|
|||
|
|
||||
| *10.36 |
1990 Stock Option Plan for Non-Employee Directors,
incorporated by reference to Exhibit 10.23 to Registrant’s
Report on Form 10-K filed on March 13, 2006.
|
|||
|
|
||||
| *10.37 |
2000 Stock Option Plan for Non-Employee Directors as amended
and restated as of December 15, 2004, incorporated by
reference to Exhibit 10.2 to Registrant’s Report on Form 8-K
filed on December 20, 2004 (SEC file number reference
001-04858).
|
|||
|
|
||||
| *10.38(a) |
Director Charitable Contribution Program, adopted by the Board
of Directors on December 8, 2009, incorporated by reference to Exhibit 10.38 to Registrant’s Report on Form 10-K filed on February 25, 2010.
|
|||
|
|
||||
| *10.38(b) |
Summary of director charitable contribution arrangement
between the Registrant and Arthur C. Martinez incorporated by
reference to Exhibit 10.33(b) to Registrant’s Report on Form
10-K filed on February 27, 2008.
|
|||
|
|
||||
| *10.39 |
Resolutions approving Non-Employee Directors’ Annual Stock
Grant Program, adopted by Registrant’s Board of Directors on
September 12, 2000, incorporated by reference to Exhibit 99(c)
to Registrant’s Registration Statement on Form S-3 filed on
September 29, 2000 (Reg. No. 333-46932).
|
|||
|
|
||||
| 10.40 |
Multi-currency Revolving Credit Facility Agreement, dated
November 23, 2005, among the Registrant, International Flavors
& Fragrances (Luxembourg) S.A.R.L., certain subsidiaries, the
banks named therein, including Citigroup Global Markets
Limited, Fortis Bank S.A./N.V., Bank of America N.A., Bank of
Tokyo-Mitsubishi Trust Company, BNP Paribas, ING Bank N.V.,
J.P. Morgan Chase and Wachovia Bank, National Association, as
mandated lead arrangers, and Citibank International PLC, as
Facility Agent, incorporated by reference to Exhibit 4.1 to
Registrant’s Report on Form 8-K filed on November 29, 2005
(SEC file number reference 001-04858).
|
|||
|
|
||||
| 10.41 |
Amendment Agreement dated September 17, 2007 to the
Multicurrency Revolving Credit Facility Agreement dated
November 23, 2005 among the Company, certain subsidiaries of
the Company, and Citibank International PLC as agent on behalf
of itself and others, incorporated by reference to Exhibit
10.1 to Registrant’s Report on Form 10-Q filed on October 31,
2007.
|
|||
82
Table of Contents
| Number | ||||
|
|
||||
| 10.42 |
Amendment dated September 27, 2007 (and confirmed on November
6, 2007) to the Multi-currency Revolving Credit Facility
Agreement dated November 23, 2005, extending the Termination
Date for an additional period of 365 days until 2012,
incorporated by reference to Exhibit 10.40 to Registrant’s
Report on Form 10-Q filed on February 27, 2008.
|
|||
|
|
||||
| 10.43 |
Confirmation, dated September 14, 2007, between International
Flavors & Fragrances Inc. and Morgan Stanley & Co.
Incorporated, incorporated by reference to Exhibit 10.1 to
Registrant’s Form 8-K filed with the SEC on September 18,
2007.
|
|||
|
|
||||
| 10.44 |
Confirmation, dated September 14, 2007, between International
Flavors & Fragrances Inc. and Morgan Stanley & Co.
Incorporated, incorporated by reference to Exhibit 10.2 to
Registrant’s Form 8-K filed with the SEC on September 18,
2007.
|
|||
|
|
||||
| 21 |
List of Principal Subsidiaries.
|
|||
|
|
||||
| 23 |
Consent of PricewaterhouseCoopers LLP.
|
|||
|
|
||||
| 31.1 |
Certification of Douglas D. Tough pursuant to Section 302 of
the Sarbanes-Oxley Act of 2002.
|
|||
|
|
||||
| 31.2 |
Certification of Kevin C. Berryman pursuant to Section 302 of
the Sarbanes-Oxley Act of 2002.
|
|||
|
|
||||
| 32 |
Certification of Douglas D. Tough and Kevin C. Berryman
pursuant to 18 U.S.C. Section 1350 as adopted pursuant to the
Sarbanes-Oxley Act of 2002.
|
|||
| * | Management contract or compensatory plan or arrangement |
|
INTERNATIONAL FLAVORS & FRAGRANCES INC.
(Registrant) |
||||
| By: | /s/ Kevin C. Berryman | |||
| Kevin C. Berryman | ||||
|
Executive Vice President and
Chief Financial Officer |
||||
|
Principal Executive Officer:
|
||
|
|
||
|
/s/ Douglas D. Tough
|
||
|
Chairman of the Board and
|
||
|
Chief Executive Officer
|
||
|
|
||
|
Principal Financial and Accounting Officer:
|
||
|
|
||
|
/s/ Kevin C. Berryman
|
||
|
Executive Vice President
|
||
|
and Chief Financial Officer
|
83
Table of Contents
|
/s/ Margaret Hayes Adame
|
||
|
|
||
|
/s/ Marcello V. Bottoli
|
||
|
|
||
|
/s/ Linda B. Buck
|
||
|
|
||
|
/s/ J. Michael Cook
|
||
|
|
||
|
/s/ Roger W. Ferguson, JR.
|
||
|
|
||
|
/s/ Peter A. Georgescu
|
||
|
|
||
|
/s/ Alexandra A. Herzan
|
||
|
|
||
|
/s/ Henry W. Howell, Jr.
|
||
|
|
||
|
/s/ Katherine M. Hudson
|
||
|
|
||
|
/s/ Arthur C. Martinez
|
||
|
|
||
|
/s/ Douglas D. Tough
|
84
Table of Contents
| For the Year Ended December 31, 2010 | ||||||||||||||||||||
| Additions | ||||||||||||||||||||
| Balance at | charged to | Balance at | ||||||||||||||||||
| Beginning | costs and | Accounts | Translation | end of | ||||||||||||||||
| of period | expenses | written off | adjustments | period | ||||||||||||||||
|
Allowance for doubtful accounts
|
$ | 10,263 | $ | (1,352 | ) | $ | 2,716 | $ | 129 | $ | 6,324 | |||||||||
|
Valuation allowance on credit and
operating loss carryforwards
and certain net deferred tax assets
|
212,705 | 91,632 | — | (16,155 | ) | 288,182 | ||||||||||||||
|
|
||||||||||||||||||||
|
|
$ | 222,968 | $ | 90,280 | $ | 2,716 | $ | (16,026 | ) | $ | 294,506 | |||||||||
|
|
||||||||||||||||||||
| For the Year Ended December 31, 2009 | ||||||||||||||||||||
| Additions | ||||||||||||||||||||
| Balance at | charged to | Balance at | ||||||||||||||||||
| Beginning | costs and | Accounts | Translation | end of | ||||||||||||||||
| of period | expenses | written off | adjustments | period | ||||||||||||||||
|
Allowance for doubtful accounts
|
$ | 11,156 | $ | 2,928 | $ | 4,853 | $ | 1,032 | $ | 10,263 | ||||||||||
|
Valuation allowance on credit and
operating loss carryforwards
and certain net deferred tax assets
|
178,921 | 31,651 | — | 2,133 | 212,705 | |||||||||||||||
|
|
||||||||||||||||||||
|
|
$ | 190,077 | $ | 34,579 | $ | 4,853 | $ | 3,165 | $ | 222,968 | ||||||||||
|
|
||||||||||||||||||||
| For the Year Ended December 31, 2008 | ||||||||||||||||||||
| Additions | ||||||||||||||||||||
| Balance at | charged to | Balance at | ||||||||||||||||||
| Beginning | costs and | Accounts | Translation | end of | ||||||||||||||||
| of period | expenses | written off | adjustments | period | ||||||||||||||||
|
Allowance for doubtful accounts
|
$ | 11,694 | $ | 4,630 | $ | 3,932 | $ | (1,236 | ) | $ | 11,156 | |||||||||
|
Valuation allowance on credit and
operating loss carryforwards
|
171,600 | 12,750 | — | (5,429 | ) | 178,921 | ||||||||||||||
|
|
||||||||||||||||||||
|
|
$ | 183,294 | $ | 17,380 | $ | 3,932 | $ | (6,665 | ) | $ | 190,077 | |||||||||
|
|
||||||||||||||||||||
S-1
Table of Contents
INVESTOR INFORMATION
59 Maiden Lane
New York, New York 10038
800-937-5449
www.amstock.com