INDIA GLOBALIZATION CAPITAL, INC.
10-Ks and 10-Qs
|
|
|
|
|
|
|
|
|
|
|
|
|
|
|
|
|
|
|
|
|
|
|
|
|
|
|
|
|
|
|
|
|
|
|
|
|
|
|
|
|
|
|
|
|
|
|
|
|
|
|
|
|
|
|
|
UNITED STATES
SECURITIES AND EXCHANGE COMMISSION
Washington, D.C. 20549
FORM 10-K
|
☒
|
|
Annual report pursuant to Section 13 or 15(d) of the Securities Exchange Act of 1934
|
|
|
|
For the fiscal year ended March 31, 2018.
|
|
☐
|
|
Transition report pursuant to Section 13 or 15(d) of the Exchange Act of 1934
For the transition period from _____ to _____
|
Commission file number: 001-32830
INDIA GLOBALIZATION CAPITAL, INC.
(Exact Name of Registrant as Specified in Its Charter)
|
(State or other jurisdiction of
incorporation or organization)
|
|
20-2760393
(I.R.S. Employer
Identification No.)
|
|
4336 Montgomery Avenue, Bethesda, Maryland
(Address of Principal Executive Offices)
|
20814
(Zip Code)
|
(301) 983-0998
(Registrant’s telephone number, including area code)
Securities registered pursuant to Section 12(b) of the Act:
|
Common Stock
|
|
NYSE American LLC
|
|
(Title of each class)
|
|
(Name of each exchange on which registered)
|
Securities registered pursuant to Section 12(g) of the Act:
Common Stock Purchase Warrants
(Title of class)
Indicate by check mark if the registrant is a well-known seasoned issuer, as defined in Rule 405 of the Securities Act.
☐
Yes
☑
No
Indicate by check mark if the registrant is not required to file reports pursuant to Section 13 or Section 15(d) of the Act.
☐
Yes
☑
No
Indicate by check mark whether the registrant (1) has filed all reports required to be filed by Section 13 or 15(d) of the Securities Exchange Act of 1934 during the preceding 12 months (or for such shorter period that the registrant was required to file such reports), and (2) has been subject to such filing requirements for the past 90 days.
☑
Yes
☐
No
Indicate by check mark whether the registrant has submitted electronically and posted on its corporate Web site, if any, every Interactive Data File required to be submitted and posted pursuant to Rule 405 of Regulation S-T (§232.405 of this chapter) during the preceding 12 months (or for such shorter period that the registrant was required to submit and post such files).
☑
Yes
☐
No
Indicate by check mark disclosure of delinquent filers pursuant to Item 405 of Regulation S-K (§229.405 of this chapter) is not contained herein, and will not be contained herein, and will not be contained, to the best of registrant’s knowledge, in definitive proxy or information statements incorporated by reference in Part III of this Form 10-K or any amendment to this Form 10-K.
☑
Indicate by check mark whether the registrant is a large accelerated filer, an accelerated filer, a non-accelerated filer, a smaller reporting company, or an emerging growth company. See the definitions of “large accelerated filer,” “accelerated filer,” “smaller reporting company,” and “emerging growth company” in Rule 12b-2 of the Exchange Act.
|
Large accelerated filer
☐
|
|
Accelerated filer
☐
|
|
Non-accelerated filer
☐
|
(Do not check if a smaller reporting company)
|
Smaller reporting company
☑
|
|
Emerging growth company
☐
|
|
|
If an emerging growth company, indicate by check mark if the registrant has elected not to use the extended transition period for complying with any new or revised financial accounting standards provided pursuant to Section 13(a) of the Exchange Act.
☐
Indicate by check mark whether the registrant is a shell company (as defined in Rule 12b-2 of the Exchange Act).
☐
Yes
☑
No
The aggregate market value of the voting and non-voting common equity held by non-affiliates as of September 29, 2017 (the last business day of the registrant’s most recently completed second fiscal quarter was $8,376,895 based on the last reported sale price of the registrant’s common stock (its only outstanding equity security) of $0.36 per share on that date. All executive officers and directors of the registrant and all 10% or greater stockholders have been deemed, solely for the purpose of the foregoing calculation, to be “affiliates” of the registrant.
31,028,473 shares of our common stock were issued and outstanding as of June 15, 2018.
DOCUMENTS INCORPORATED BY REFERENCE
None
INDIA GLOBALIZATION CAPITAL, INC.
FORM 10-K
FOR THE FISCAL YEAR ENDED MARCH 31, 2018
|
|
|
Page
|
|
PART I
|
|
|
|
|
|
|
|
Item 1.
|
5
|
|
|
Item 1A.
|
13
|
|
|
Item 1B.
|
19
|
|
|
Item 2.
|
20
|
|
|
Item 3.
|
20
|
|
|
Item 4
|
20
|
|
|
|
|
|
|
PART II
|
|
|
|
|
|
|
|
Item 5.
|
21
|
|
|
Item 6.
|
21
|
|
|
Item 7.
|
22
|
|
|
Item 8.
|
27
|
|
|
Item 9.
|
54
|
|
|
Item 9A.
|
54
|
|
|
Item 9B.
|
55
|
|
|
|
|
|
|
PART III
|
|
|
|
|
|
|
|
Item 10.
|
56
|
|
|
Item 11.
|
59
|
|
|
Item 12.
|
63
|
|
|
Item 13.
|
64
|
|
|
Item 14.
|
65
|
|
|
PART IV
|
|
|
|
|
|
|
|
Item 15.
|
67
|
|
|
Item 16.
|
68
|
|
|
69
|
FORWARD-LOOKING STATEMENTS AND IMPORTANT FACTORS
The Private Securities Litigation Reform Act of 1995 provides a safe harbor for forward-looking statements. This report and the documents incorporated in this report by reference contain “forward-looking statements” within the meaning of Section 27A of the Securities Act of 1933, as amended (the “Securities Act”) and Section 21E of the Securities Exchange Act of 1934, as amended (the “Exchange Act”). Additionally, we or our representatives may, from time to time, make other written or verbal forward-looking statements. In this report and the documents incorporated by reference, we discuss plans, expectations and objectives regarding our business, financial condition and results of operations. Without limiting the foregoing, statements that are in the future tense, and all statements accompanied by terms such as “believe,” “project,” “expect,” “trend,” “estimate,” “forecast,” “assume,” “intend,” “plan,” “target,” “anticipate,” “outlook,” “preliminary,” “will likely result,” “will continue” and variations of them and similar terms are intended to be “forward-looking statements” as defined by federal securities laws. This document contains statements and claims that are not approved by the FDA. These statements and claims are in compliance with state laws, specifically in states where medical cannabis is approved, and Alzheimer's and other diseases are approved conditions for treatment with cannabis. We caution you not to place undue reliance on forward-looking statements, which are based upon assumptions, expectations, plans and projections. Forward-looking statements are subject to risks and uncertainties, including those identified in the “Risk Factors” included in this report and in the documents incorporated by reference that may cause actual results to differ materially from those expressed or implied in the forward-looking statements. Forward-looking statements speak only as of the date when they are made. Except as required by federal securities law, we do not undertake any obligation to update forward-looking statements to reflect events, circumstances, changes in expectations or the occurrence of unanticipated events after the date of those statements. We intend that all forward-looking statements made will be subject to safe harbor protection of the federal securities laws pursuant to Section 27A of the Securities Act and Section 21E of the Exchange Act.
Forward-looking statements are based upon, among other things, our assumptions with respect to:
| · |
our ability to successfully register patents, create and market new products and services, including but not limited to trading in Hong Kong and other part of south Asia, leasing equipment in India, and achieve customer acceptance in the industries we serve;
|
| · |
our ability to accurately predict the future demand for our products and services;
|
| · |
competition in using phytocannabinoids for alternative, pharmaceutical, and nutraceutical therapies;
|
| · |
federal and state legislation and administrative policy regulating phytocannabinoids;
|
| · |
our ability (based in part on regulatory concerns) to license our products to processors that can produce pharmaceutical grade phytocannabinoids;
|
| · |
our ability to obtain and protect patents for the use of phytocannabinoids in our formulations;
|
| · |
current and future economic and political conditions, in specifically but not limited to North America, Malaysia, and India; and
|
| · |
other assumptions described in this prospectus supplement underlying or relating to any forward-looking statements.
|
You should consider the limitations on, and risks associated with, forward-looking statements and not unduly rely on the accuracy of predictions contained in such forward-looking statements. As noted above, these forward-looking statements speak only as of the date when they are made. Moreover, in the future, we may make forward-looking statements through our senior management that involve the risk factors and other matters described in this report, as well as other risk factors subsequently identified, including, among others, those identified in our filings with the SEC in our quarterly reports on Form 10-Q and our current reports on Form 8-K.
PART I
Unless the context requires otherwise, all references in this report to “IGC,” “the Company,” “we,” “our” and “us” refer to India Globalization Capital, Inc., together with the subsidiaries listed on the Company’s Annual Report on Form 10-K. We exclude our investments and minority non-controlling interests, and any information provided by them is not incorporated by reference in this report, and you should not consider it a part of this report.
Company Background
We are a Maryland corporation formed in April 2005. Our principal office in the U.S. is in Bethesda, Maryland, in addition we have a facility in Washington State. Our back office is in Kochi, Kerala India. In addition, many of our staff and advisors work from their home offices. We maintain our main website at
www.igcinc.us
and our telephone number is +1-301-983-0998. The information contained on any of our websites is not incorporated by reference in this report, and you should not consider it a part of this report unless we specifically refer to it. Our operational subsidiaries are in Hong Kong, India and Malaysia. Our filings are available on
www.sec.gov
.
For more on corporate history, please check our websites at (i)
www.igcinc.us
and (ii)
www.igcpharma.com
.
Our Business
The Company’s main focus is to develop and commercialize cannabinoid based alternative therapies for indications such as Alzheimer’s disease, Parkinson’s disease, and pain. Its lead product is Hyalolex, an alternative oral therapy for the treatment of symptoms associated with Alzheimer’s disease. The Company has filed several patents for its pipeline of products including ones for the treatment of Parkinson’s Central Nervous System related disorders, eating disorders, and seizures in cats and dogs. The commercialization of Hyalolex through medical dispensaries is expected to commence in the second half of calendar 2018. Since its inception, the Company operates a legacy business that involves trading commodities and heavy equipment rental.
In addition, the Company plans to leverage its technology and cannabis expertise to build meaningful solutions to address issues facing the cannabis industry using distributed ledgers inherent in blockchain technology. These would include addressing issues such as product identification assurance (PIA) and product origin assurance, transactional difficulties, and inadequate product labeling. Please see Note 1 in the Financial statements for further information.
Business Segments and Revenue Contribution
The Company has two business segments: legacy infrastructure, and medical cannabis based alternative therapies. The legacy business has two drivers a) trading of infrastructure commodities like steel, and iron ore, among others and b) rental of heavy equipment. The legacy infrastructure business contributed 100% of the revenue in fiscal year 2017 and fiscal year 2018. In fiscal year 2017, our lead product Hyalolex was in its research and development phase and in fiscal 2018 we began production in anticipation of commercialization in the second half of 2018.
|
Segments
|
Fiscal Year Ended
March 31, 2018
|
|||
|
Legacy infrastructure
|
$
|
2,192,590
|
||
|
Alternative therapies
|
-
|
|||
|
Total IGC
|
$
|
2,192,590
|
||
Segment 1:
Legacy Infrastructure
Since our inception, we have participated in various aspects of the infrastructure industry. During the fiscal year 2018, we streamlined our legacy infrastructure business to infrastructure commodity trading, and heavy equipment rental. We trade infrastructure commodities like steel and iron ore, among others, and we rent heavy equipment. Our subsidiary, Techni Bharathi Private Ltd (“TBL”) in India is responsible for heavy equipment rental, and its subsidiary IGC Enterprises Ltd. in Hong Kong is responsible for infrastructure trading.
For the rental business, we supply equipment and operators to construction companies. This business is very small and limited to the city of Kochi in Kerala, India. In fiscal year 2018 we have three customers all of which are construction companies. For the trading business we have four customers and no principal supplier. We are opportunistic and will buy from any of the South Asian countries. In fiscal 2018 our suppliers are companies based in India and Hong Kong. For the level of business and the value of each trade, the number of customers we have is adequate and does not constitute inordinate customer risk. Revenue from our legacy infrastructure business including heavy equipment rental and commodity trading is less than 1% based on revenue of both the rental and trading markets. This business is highly competitive, and our differentiation is based primarily on price and industry knowledge of commodity requirements for infrastructure projects. Our strategy in fiscal 2019 for the legacy business is to maintain annual revenue of $3-$5 million and focus on growing margin by reducing the cost of money and by modest investments in heavy equipment.
The pricing for steel and iron ore are heavily influenced by tariffs and demand for infrastructure development. In fiscal year 2018, steel prices although down from fiscal 2017, fluctuated in a relatively narrow band as did iron ore prices. We do not hedge or take long term positions on commodities. We limit our exposure by contractually ensuring that every purchase has a vetted legitimate buyer and ensuring rapid closing of transactions. On a transaction basis, this business does not require special government approvals. We have the requisite business licenses that allow us to operate in this segment.
In the fiscal years ending March 31, 2018 and 2017, we funded our subsidiary TBL $75,000 and $43,000 for working capital, respectively. For the trading business our sales team is in Hong Kong and the sales cycle lasts between two and three months. For our equipment leasing business our sales team is in Kochi, India, where the sales cycle lasts around two months. In Malaysia, through our subsidiary Cabaran Ultima, we operated a real estate management business. During the fiscal year 2018, we decided to exit this business and as of March 31, 2018, we have accounted for our investment in Cabaran Ultima as “Investment Held for Sale” at a fair value of $147,500. We hope to sell Cabaran Ultima during fiscal year 2019. Please see Note-22, “Investment Held for Sale” for more information.
Segment 2: Alternative therapies (Complementary and Alternative Medicine, “CAM”)
We focus on the
development and commercialization of cannabinoid-based combination therapies.
Cannabinoids are chemical compounds that exert a range of effects on the body, including impacting the immune response, gastrointestinal maintenance and motility, muscle functioning, and nervous system response and functioning. Phytocannabinoids are cannabinoids that occur naturally in the cannabis plant. Phytocannabinoids are abundant in the viscous resin produced by glandular structures called trichomes. There are over 480 different compounds in the cannabis plant. Many of them have been identified as cannabinoids. Of these, THC (delta-9-tetrahydrocannabinol) is the main psychoactive component in the plant with many therapeutic uses. The other broadly pursued non-psychoactive phytocannabinoid, CBD (Cannabidiol), is pleiotropic influencing many pathways in humans, dogs, and cats, and may be used to provide relief to a variety of symptoms including pain, seizures, and eating disorders. In medical applications, cannabinoids are extracted from the cannabis plant using a variety of well-established technologies, including using CO2, butane, alcohol, among others, as solvents. The refined extracted material is isolated for specific active ingredients like THC and CBD, among others, and used in formulations as the primary or secondary active ingredient.
Our work and strategy are to use cannabinoids synergistically with other active ingredients that in many cases have been established to treat specific conditions. We seek, through the synergies for our combination therapies, to decrease side effects, increase bio-availability, and enhanced efficacy. This strategy in some cases leads to “new and improved” products, and in others it results in totally novel products with surprising results, as in the case of Hyalolex
tm
.
We have filed eight provisional patents with the United States Patent and Trademark Office (“USPTO”), in the phytocannabinoid-based combination therapy space, for the indications of pain, medical refractory epilepsy, and cachexia. In addition, in May 2017, we acquired an exclusive license to a patent filed by the University of South Florida Research Foundation entitled “Cannabidiol and Synthetic Dronabinol for treatment of Alzheimer’s Disease.”
Hyalolex
tm
Hyalolex
tm
is not approved by the Federal Drug Administration (FDA), and therefore is not considered an approved pharmaceutical drug. It is a Complimentary Alternative Medicine (“CAM”)
.
The name of IGC’s lead product Hyalolex
tm,
is based on the Greek roots
hyalo
and
lex
that broadly mean clear, clarity, glass-like, and words, reading, respectively. In Alzheimer’s cell lines, Alzheimer’s animal models, and in some human studies the active ingredients in Hyalolex
tm
have been shown to alleviate many of the symptoms associated with Alzheimer’s. Patients with Alzheimer’s suffer from a variety of symptoms including dementia, anxiety, agitation, and sleep disorder, among others. These symptoms often result in hard-to-manage patients and caregiver distress. As set out below, about 30% of the overall cost of managing Alzheimer’s patients is attributed to caregiver cost. We believe that our product can reduce caregiver distress by helping to better manage patients.
Market Overview of Alzheimer’s Disease
Alzheimer’s is known as America’s most expensive disease. The estimated cost in 2017 to Medicare and Medicaid was about $175 billion. There are currently over 5.3 million Americans with Alzheimer’s disease (“AD”) and around 35 million worldwide. The cost of Alzheimer’s is skyrocketing as the baby-boomers age: the number of AD patients is expected to double over the next 20 years and the direct costs are expected to exceed $450 billion in the next 12 years. Although the speed of progression can vary, the average life expectancy following diagnosis is believed to be between three and nine years. It is the most common cause of dementia among older adults. Currently, no treatment can stop or reverse the progression of the disease and there is still no accepted cure for AD.
Data for Hyalolex
tm
Our research into cannabinoid-based combination therapies led us to work done at the University of South Florida using cannabinoids on Alzheimer’s disease. The professor working on this unique approach was featured on CNN on Dr. Sanjay Gupta’s show Weed 2. The work, specifically, reported several novel findings that were subsequently filed as a patent. In the fiscal year 2018, IGC acquired exclusive rights to the data and the patent filing. The research reported that micro-dosing of the cannabinoid THC, in combination with another naturally occurring compound, works synergistically to reduce the buildup of plaques and tangles, through allegedly new pathways. These results were shown using Alzheimer’s cell lines. Plaques and tangles are hallmarks of Alzheimer’s disease. It is known that patients get plaques and tangles between 15 to 20 years before any Alzheimer’s related symptoms manifest. The work further showed, on Alzheimer’s cell lines, that micro dosing of THC can increase the functioning of mitochondria. The findings are unique as all previous research showed the opposite effect at higher doses, for example, loss of mitochondrial functioning.
We claim that the novelty is two-fold: one, that micro dosing of THC affects the brain radically differently from normal dosing that is prescribed (FDA approved Dronabinol) or consumed by individuals; the second is that micro doses of THC can synergistically work with other naturally occurring compounds to increase efficacy and reduce side effects. For example, the research showed that at these therapeutic micro-doses, THC is non-toxic to neurons, a finding that is contrary to massive amounts of research and data showing that THC is neuro-toxic at normally ingested levels. The research was extended to include a Morris Water Maze test for measuring spatial memory impairment on Alzheimer’s mice. It was found that Alzheimer’s mice treated with THC were significantly better at negotiating the water maze than untreated mice. Of course, as expected, neither group were anywhere close to the performance of healthy mice. Preliminary findings have also reported that THC can play a role in triggering neurogenesis,
the growth and development of nervous tissue.
After a great deal of in-depth research and experiments, our team created an oral formulation, a medicinal syrup, by adding excipients and synergistic ingredients. The formulation has evolved into market-ready Hyalolex
tm
to help patients suffering from Alzheimer’s disease.
Marketing plan for Hyalolex
tm
Hyalolex
tm
is formulated for a dose of 1 ml either two or three times a day. It is currently available in 30 ml bottles. We plan to derive revenue by licensing the technology, data, research, brand, and selling the excipients and non-cannabinoid compounds to resellers in various states. As the final product contains a controlled substance, although in micro-doses, it can only be manufactured by a state licensed entity that conforms to all relevant state regulations. The reseller will have the product manufactured and delivered to state licensed dispensaries where they can be sold consistent with state laws governing the sale of products containing cannabinoids. The product will only be available to patients in medical states that are registered through specific state sanctioned programs.
To ensure compliance and product assurance we are developing a QR code (Quick Response code) supported system that will track the product and allow patients to access information about the product and also provide feedback. To this, we plan to add a backend based on blockchain technology that will go much further in ensuring compliance, product authenticity and product origin.
Growth and Expansion Strategy
Our growth and expansion strategies are to commercialize and license Hyalolex
tm
in states and countries where we can legally enter the market. Our immediate plans are to commercialize Hyalolex
tm
in 10 states starting with Puerto Rico, Maryland, District of Columbia, and California.
Sales, Distribution and Marketing
We plan to license Hyalolex
tm
to resellers in medical states and other countries. Under the licensing agreement, the U.S. based reseller will market and manufacture Hyalolex
tm
and,
either directly or indirectly, distribute the product to medical dispensaries where it can be sold. Individuals with medical cards approved by the state will have access to the product.
Manufacturing and Supply
Hyalolex
tm
is manufactured in each medical state separately, by a licensed processor (manufacturer). The manufacturer then sells the products to dispensaries that in turn sell the product to the end user. The active ingredients are manufactured (grown and extracted) within the state, procured within the state, processed within the state, distributed within the state, and sold to individuals with medical cards within the state. The state programs are strictly controlled and licensed. For example, in each state entities must undergo background checks and obtain a license to grow, process, and/or operate a medical dispensary. Individuals that desire to purchase products from dispensaries must obtain a medical card and, in most states, register with the state as a patient. Further, medical states use software platforms to track plants, extracts, and products very closely to ensure compliance. In addition, all products are tested by an independent state licensed lab, on a batch basis, for cannabinoid profiles and a host of other measurements that are specific to individual states.
Other products: IGC-501, Serosapse, Caesafin, and Natrinol
Other products that we have in the pipeline are IGC-501 for indications of neuropathic pain; Serosapse for indications of Parkinson’s and other Central Nervous System (CNS) disorders; Caesafin for seizures in cats and dogs; and Natrinol for indications of cancer and AIDS induced nausea and vomiting. None of these are FDA approved and they are not considered to be pharmaceutical drugs. They fall in the category of complimentary alternative medicines or CAMS.
Overview and Target Market for Other Products
The pain management market represents a significant component of the healthcare system. In September 2012,
The Journal of Pain
reported that the annual estimated national cost of pain ranges from $560 billion to $635 billion. This figure exceeds the entire cost of the nation’s priority health conditions. Additionally, The American Pain Society recommends that pain be made more visible and be categorized as the fifth vital sign, recognizing that terminal illnesses are often accompanied by unbearable levels that are so severe and difficult to treat that death seems preferable. According to the Arthritis Foundation, arthritis has been particularly problematic for women; since 1999 there has been a 22% increase in the number of women who attribute their disability to arthritis. Current treatment protocols such as the utilization of opioid-based drug therapies present several challenges and may result in debilitating consequences that affect patients’ day-to-day functioning and patients’ productivity. Commonly reported side effects include hallucinations, constipation, sedation, nausea, respiratory depression, and dysphoria. Our patent filing is based on a novel therapy that uses extracts from the cannabis plant for the treatment of psoriatic arthritis and scleroderma pain. The therapy uses a cream that is applied to the joints using a variety of delivery mechanisms including a bio-adhesive patch.
There are over one million adults suffering from Parkinson’s disease (PD) in the U.S. PD is the second most common neurodegenerative disorder worldwide with an estimated 1% of adults over 60 suffering from the disease. The market for curing the disease is very large. We are testing products for end points associated with Parkinson’s disease like REM sleep disorder, anxiety, and dyskinesia. The PD treatment market is expected to reach $5.69 billion by 2022 from $4.24 billion in 2017, at a CAGR of 6.1%. The market is being driven by the growth in aging population and the associated increase in the prevalence of Parkinson’s disease and government funding for research. (Ref: https://www.marketsandmarkets.com/PressReleases/parkinson-disease-treatment.asp).
Approximately 50 million people worldwide are affected by epilepsy (Sanders, 2003). Epilepsy is thought to be due to multiple factors that include the alteration of many ion channels like sodium, potassium, and NMDA (N-Methyl-d-aspartate) and neurotransmitters like GABA (gamma amino butyric acid). It is believed, for example, that to maximally control epilepsy, modulation of one or more of these channels and receptors is required and that monotherapy is adequate in up to 25% of patients. The onset of epileptic seizures can be life threatening, including long-term implications (Lutz, 2004) such as mental health problems, cognitive deficits and morphological changes (Swann, 2004, Avoli et. al., 2005). The onset of epilepsy also greatly affects lifestyle as sufferers live in fear of consequential injury or the inability to perform daily tasks (Fisher et. al., 2000). The scientific community (1980 Cunha et. al., 1986 Ames, 1990 Trembly et. al. recent testing by GW Pharmaceuticals, among others) have shown that Cannabidiol (CBD) has anti-convulsive properties in humans. Other studies (Davis and Ramsey) have shown that tetrahydrocannabinol (THC) can also help reduce seizures. Three of our patent filings involving novel therapies use phytocannabinoid extracts from cannabis, in combination with other generic drugs, to treat medical refractory epilepsy in humans and seizures in dogs and cats.
Cachexia is a condition that accompanies severe illness such as cancer and results in the weakness and wasting away of the body. Cachexia physically weakens patients to the extent that response to standard treatments is poor. In the U.S., it is estimated that a population of approximately 1.3 million are experiencing cachexia associated with cancer, multiple sclerosis, Parkinson’s disease, HIV/AIDS, and other progressive illnesses. Cachexia is secondary to an underlying disease such as cancer or AIDS and is a positive risk factor for death. As an example, cancer induced anorexia cachexia is responsible for about 20% of all cancer deaths. Our patent filing involves a novel therapy that uses phytocannabinoids to stimulate senses (smell and taste) with a combination of drugs to stimulate appetite. Our approach addresses the veterinarian market as dogs and cats also suffer from pain, epilepsy, and cachexia and getting a product to market for the veterinarian industry is significantly less time consuming than getting products approved for human healthcare. There are 160 million domesticated dogs and cats in the U.S. and about 1% suffer from seizures. Our veterinarian product uses combination therapy for the treatment of seizures in dogs and cats.
QR code-based blockchain PIA
The Company has developed and deployed a QR code-based system that allows patients to access a website with specific information on our
alternative medicine
products. Each QR code is specific to a state and displays information specific to that state. We are in the process of creating a mobile optimized version that will expand the product information available to patients to include location of dispensaries that carry our products, based on zip code, and in turn also allow us to gather information through surveys and obtain feedback from patients.
As the number of states in which the product is available increases, we expect to expand the backend to a blockchain that allows for inputs directly from growers, processors, and dispensaries. This information will collectively display product identification, and product origination, by providing the patient with information regarding the origin, chemicals, and processes used to manufacture the product. We expect to expand the QR code-based system in several phases over fiscal 2019.
Research and Development
In the fiscal years 2017 and 2018, IGC identified combinations of Tetrahydrocannabinol (THC) and the non-psychoactive, medically useful compound Cannabidiol (CBD) to address symptoms of Parkinson’s disease and other diseases. The costs associated with this work is mostly in-house research. For example, looking for combinations of plant extracts that could work and data to support the claims that certain combinations and formulations can alleviate symptoms associated with diseases. The estimated amount spent for research and development was approximately $114,000 and $137,000 in the fiscal years 2017 and 2018, respectively. All research and development costs are expensed in the quarter in which they are incurred.
Competition
The development of phytocannabinoid-based therapies is currently not very competitive. The largest amount of research in this area is done in Israel. The most significant research and FDA approved trials are done by one large pharmaceutical company, and to a lesser extent, by two other large firms. In the United States, there is very little wide spread research while most of the research is concentrated in Israel. This is mostly because the United States Drug Enforcement Administrating (“DEA”) classifies phytocannabinoid extracts as a Schedule 1 drug. This means that phytocannabinoids are characterized as substances with “high potential for abuse” and with “no currently accepted medical use.” Further, any study conducted in the US must be registered and approved by the DEA and raw materials purchased through the National Institute of Drug Abuse (NIDA).
We view competition in two ways. First, we compete with about fifteen publicly listed companies and two private companies that have articulated a business plan to develop phytocannabinoid-based therapies, two large publicly-listed and well-funded pharmaceutical companies, and three small listed companies. There are several microcap companies trading on the OTC market and two private ones that also competing in this space. We have limited competition in the areas of Alzheimer’s, Parkinson’s, and seizures for dogs and cats using phytocannabinoid- based therapies. In the field of epilepsy in humans there is significant competition and so we are focused on seizures in dogs and cats where there is limited competition. Second, we have competition from non-phytocannabinoid-based therapies: there is severe competition in all areas that we are working on including for example Alzheimer’s, with almost all the massive and well- financed pharmaceutical companies and four pure play listed companies working on the disease, albeit all of them without the use of phytocannabinoids.
Competitive Advantage
We believe that there are three factors coalescing to create entrepreneurial opportunities in the cannaceutical industry. The first is deregulation of the industry. This is taking place in the U.S., Canada, Germany, and other parts of the world. We believe that during any major deregulation, it takes several years for market equilibrium to be achieved. Most large companies don’t react quickly and that creates entrepreneurial opportunities, including as a first mover. The second factor is that the plant has cannabinoids that work on several pathways, in humans and animals, and that these cannabinoids can potentially be used to treat many diseases and aliments. The third factor is a rising awareness and demand for natural products including natural complementary and alternative medicines.
Our competitive advantage with products such as Hyalolex
tm
emerges from the following: a) first to market, b) proprietary data, c) patent filings, d) deep understanding of synergies, e) several years of research, f) a pipeline of other products, and f) a well differentiated strategy. Apart from these competitive advantages specific to Hyalolex
tm
, our management has experience and deep knowledge of deregulating industries; access to foreign markets where testing has less regulatory hurdles; access to intellectual property experts; access to a network of doctors and PhDs; knowledge of FDA trials, extraction techniques, and plant strains.
Core Business Competencies
Our core competencies include the following:
|
•
|
A network of doctors, PhDs, and intellectual property legal experts that have a sophisticated understanding of drug discovery, research, FDA filings, intellectual protection and product formulation.
|
|
•
|
Knowledge of various cannabis strains, their phytocannabinoid profile, extraction methodology, and impact on various pathways.
|
|
•
|
Knowledge of cannabinoid-based combination therapies.
|
Patents, Development Pipeline, and Licenses
The success of most of our product candidates will depend in large part on our ability to:
|
•
|
obtain and maintain patent and other legal protections for the proprietary technology, inventions, and improvements we consider important to our business;
|
|
•
|
prosecute our patent applications and defend our issued patents;
|
|
•
|
preserve the confidentiality of our trade secrets; and
|
|
•
|
operate without infringing the patents and proprietary rights of third parties.
|
We intend to continue to seek appropriate patent protection for certain of our product candidates, drug delivery systems, molecular modifications, as well as other proprietary technologies and their uses by filing patent applications in the United States and selected other countries. We intend for these patent applications to cover, where possible, claims for medical uses, processes for preparation, processes for delivery and formulations.
Although, the Company believes the registration of patents is an important part of its business strategy and its success depends in part on such registration, the Company cannot guarantee that such patent filings will result in a successful registration with the USPTO. Please see Item 1A, Risk Factors.
The table below provides a status of the patent filings:
|
Formulation
|
Indication
|
Provisional Filing
|
PCT Filing
|
Subsequent Activity
|
|
IGC-501
|
Pain
|
9/16/14
|
9/16/15
|
US National Case Filed on 6/15/16
|
|
IGC-502
|
Seizures
|
1/25/15
|
1/14/16
|
US National Case Filed on 6/15/16
|
|
IGC-503
|
Seizures
|
4/1/15
|
3/25/16
|
PCT Application Published on 10/6/16
|
|
IGC-504
|
Eating Disorders
|
8/12/15
|
8/11/16
|
US and National Filing on 2/12/18
|
|
IGC-505
|
Seizures
|
6/15/16
|
6/15/16
|
US National Filing Anticipated on 12/15/18
|
|
IGC-506
|
Eating Disorders
|
2/28/17
|
2/27/18
|
US and National Filing Anticipated on 8/28/19
|
|
IGC-507
IGC-AD1
|
Alzheimer’s Disease
|
7/30/2015
|
Anticipated in 2018
|
US and National Filing Anticipated in 2018
|
|
IGC-508
|
CNS Disorders
|
3/29/2018
|
Anticipated in 2019
|
US and National Filing Anticipated in 2019
|
Technology and Intellectual Property
We have intellectual property attorneys that file patents or provisional patent applications, copyright, trademark and trade secret laws of general applicability, employee confidentiality, and invention assignment agreements, and other intellectual property protection methods to safeguard our technology, research and development. The Company holds all rights to the patents that have been filed by us with the USPTO.
Governmental Regulations and Approvals
Marijuana is a Schedule I controlled substance and possession, manufacturing, and growing are all illegal under federal law. Even in those states in which the use of marijuana has been legalized for medical and or recreational use, it remains a violation of federal law.
A Schedule I controlled substance is defined as a substance that has no currently accepted medical use in the United States, a lack of safety for use under medical supervision and a high potential for abuse. The Department of Justice defines Schedule 1 controlled substances as “the most dangerous drugs of all the drug schedules with potentially severe psychological or physical dependence.” If the federal government decides to enforce the Controlled Substances Act in Colorado with respect to marijuana, persons that are charged with distributing, possessing with intent to distribute, or growing marijuana could be subject to fines and terms of imprisonment, the maximum being life imprisonment and a $50 million fine.
In the United States, 29 states, Guam, Puerto Rico and District of Columbia have allowed (subject to licensing) the cultivation, processing and sale of cannabis
. The state laws are in conflict with the federal Controlled Substances Act, which makes marijuana use and possession illegal on a national level.
The previous administration under President Obama had effectively stated that it was not an efficient use of resources to direct federal law enforcement agencies to prosecute those lawfully abiding by state-designated laws allowing the use and distribution of medical cannabis. In this regard, the prior DOJ Deputy Attorney General of the Obama administration issued a memorandum (the “Cole Memo”) to all United States Attorneys providing updated guidance to federal prosecutors concerning cannabis enforcement under the CSA.
The Cole Memo noted that the Department of Justice is committed to using its investigative and prosecutorial resources to address the most significant threats in the most effective, consistent, and rational way. In furtherance of those objectives, the Cole Memo provided guidance to Department of Justice attorneys and law enforcement to focus their enforcement resources on persons or organizations whose conduct interferes with any one or more of the following in preventing:
|
·
|
the distribution of cannabis to minors;
|
|
·
|
revenue from the sale of cannabis from going to criminal enterprises, gangs and cartels;
|
|
·
|
the diversion of cannabis from states where it is legal under state law in some for to other states;
|
|
·
|
state-authorized cannabis activity from being used as a cover or pretext for the trafficking of other illegal drugs or other illegal activity;
|
|
·
|
violence and the use of firearms in the cultivation and distribution of cannabis;
|
|
·
|
drugged driving and the exacerbation of other adverse public health consequences associated with cannabis use;
|
|
·
|
the growing of cannabis on public lands and the attendant public safety and environmental dangers posed by cannabis production on public lands; and
|
|
·
|
cannabis possession or use on federal property.
|
On January 4, 2018, the U.S. Attorney General Jeff Sessions issued the Sessions Memo stating that the Cole Memo was rescinded effectively immediately. In particular, Mr. Sessions stated that “prosecutors should follow the well-established principles that govern all federal prosecutions,” which require “federal prosecutors deciding which cases to prosecute to weigh all relevant considerations, including federal law enforcement priorities set by the Attorney General, the seriousness of the crime, the deterrent effect of criminal prosecution, and the cumulative impact of particular crimes on the community.” Mr. Sessions went on to state in the memorandum that “previous nationwide guidance specific to marijuana is unnecessary and is rescinded, effective immediately.”
It is unclear at this time whether the Sessions Memo indicates that the Trump administration will strongly enforce the federal laws applicable to cannabis or what types of activities will be targeted for enforcement.
However, on March 31, 2018 President Trump signed a $1.3 trillion budget bill that includes a provision that prevents the Justice Department, including the Drug Enforcement Administration, from using funds to arrest or prosecute patients, caregivers and businesses that are acting in compliance with state medical marijuana laws. This provision, known as the Rohrabacher-Blumenauer Amendment, prohibits the Justice Department from using federal funds to interfere with state medical marijuana programs.
Our business is impacted by state regulators some of whom must approve our products for sale in their dispensaries. For example, the Washington DC Department of Health must approve Hyalolex
tm
before it can be manufactured and sold in Washington DC. Some states also require that marketing material be reviewed. We face scrutiny by the NYSE American regarding our products, including the modes of operation. FDA has been regulating CBD companies and this could possibly expand to other cannabis derivatives as well.
Compliance with federal, state, and local laws and regulations is expensive requiring attorneys and experts, however such compliance is not expected to have, an adverse effect on our capital expenditures, competitive position, financial condition, or results of operations.
Employees and Consultants
As of March 31, 2018, we employed 16 employees and a total work force of approximately 26 including employees, seasonal contract workers, and advisors in the United States, India, and Malaysia. These numbers include both the legacy and the alternative therapy segments.
Reclassification
In fiscal year 2018, land valued at $5.2 million was previously recorded as investment under non-current asserts. This land has been reclassified as Property, Plant, and Equipment under non-current assets as we are pursuing options to monetize this asset. In the fiscal year 2018, a Note Payable in the amount of $1.8 Million was reclassified to current liabilities from non-current liabilities.
Please see “Note 7 – Note Payable and Loans – Others” in Part II, Item 8 in our Consolidated Financial Statements contained herein for more information.
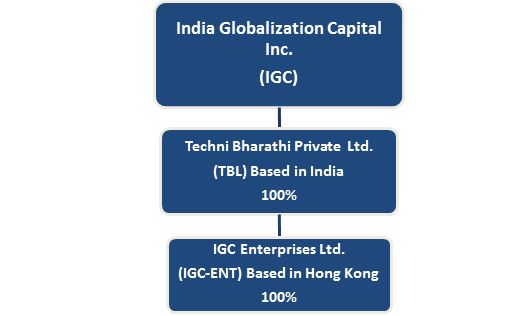
Operating Subsidiaries
The following chart presents our Company’s current direct and indirect consolidated operating subsidiaries.
Available Information
The Company’s Annual Report on Form 10-K, Quarterly Reports on Form 10-Q, Current Reports on Form 8-K, and amendments to reports filed pursuant to Sections 13(a) and 15(d) of the Securities Exchange Act of 1934, as amended (the “Exchange Act”), are filed with the Securities and Exchange Commission (the “SEC”). The Company is subject to the informational requirements of the Exchange Act and files or furnishes reports, proxy statements and other information with the SEC. Such reports and other information filed by the Company with the SEC are available free of charge on the Company’s website at www.igcinc.us when such reports are available on the SEC’s website. The public may read and copy any materials filed by the Company with the SEC at the SEC’s Public Reference Room at 100 F Street, NE, Room 1580, Washington, DC 20549. The public may obtain information on the operation of the Public Reference Room by calling the SEC at 1-800-SEC-0330. The SEC maintains an Internet site that contains reports, proxy and information statements and other information regarding issuers that file electronically with the SEC at www.sec.gov. The contents of these websites are not incorporated into this filing. Further, the Company’s references to the URLs for these websites are intended to be inactive textual references only.
You should carefully consider the following risk factors, together with all of the other information included in this report in evaluating our company and our common stock. If any of the following risks and uncertainties develops into actual events, they could have a material adverse effect on our business, financial condition or results of operations. In that case, the trading price of our common stock and other securities also could be adversely affected. We make various statements in this section, which constitute “forward-looking statements.” See “Forward-Looking Statements.”
Risks Related to Our Business and Expansion Strategy
Our cannaceutical strategy makes it difficult to find, retain, and attract management.
The environment we work in is heavily regulated and we have experience in regulated industries. However, this industry is not just heavily regulated, it is also heavily scrutinized. This takes a massive toll on management and makes it very difficult to attract and retain talent. Management spends a great deal of time and money explaining and justifying actions, strategy, and business plans to regulators. A myriad of complex factors including regulations regarding money laundering, inter-state commerce, DOJ, FDA, NYSE, SEC, state laws, among others, affect every decision. Navigating this complex set of landmines and staying focused on generating shareholder value is an arduous task and there can be no assurance that we will be successful in steering clear of all the potential issues, any of which could adversely impact the stock price or lead to delisting from the NYSE American.
Our cannaceutical strategy makes it difficult to raise money as a public company.
Despite having no direct involvement in selling cannabis or any controlled substances, despite being listed on a national exchange, and despite being current on SEC filings, the Company is often considered a “cannabis company” with all the nuances that accompany that label, including being blacklisted by banks, investments banks, and by the largest clearing services company. Due to the near-monopoly nature of some of these institutions like clearing houses, it makes it very difficult for the Company to raise money, deposit share certificates, or even have investment banking relationships. While we believe that we will be able to raise the capital we need to continue our operations, there can be no assurance that we will be successful in these efforts or will be able to raise enough capital for planned expansion.
We have a history of operating losses and there can be no assurance that we can again achieve or maintain profitability.
Our short-term focus is to become profitable by marketing our products. However, we have had a history of operating losses. For the fiscal year ended 2018 and 2017, we have a net loss of
$1,786,274
and $1
,852,861,
respectively. Accordingly, there can be no guarantee that our efforts will be successful. Continue losses will require us to seek additional financing. No assurance can be given the we can raise any such financing and such financing could be dilutive to our shareholders.
We expect to acquire companies and we are subject to evolving and often expensive corporate governance regulations and requirements. Our failure to adequately adhere to these requirements, and comply with them with regard to acquired companies, some of which may be non-reporting entities, or the failure or circumvention of our controls and procedures could seriously harm our business and affect our status as a reporting company listed on a national securities exchange.
As a public reporting company whose shares are listed for trading on the NYSE American, we are subject to various regulations. Compliance with these evolving regulations is costly and requires a significant diversion of management time and attention, particularly with regard to our disclosure on controls and procedures and our internal control over financial reporting. As we have made and continue to make acquisitions in foreign countries, our internal controls and procedures may not be able to prevent errors or fraud in the future. We cannot guarantee that we can establish internal controls over financial reporting immediately on companies that we acquire. Thus, faulty judgments, simple errors or mistakes, or the failure of our personnel to enforce controls over acquired companies or to adhere to established controls and procedures, may make it difficult for us to ensure that the objectives of our control systems are met. A failure of our controls and procedures to detect other than inconsequential errors or fraud could seriously harm our ability to continue as a reporting company listed on a national securities exchange.
We may engage in strategic transactions that could impact our liquidity, increase our expenses and present significant distractions to our management, and which ultimately may not be successful.
From time to time we may consider strategic transactions, such as acquisitions of companies, asset purchases and out-licensing or in-licensing of products, product candidates or technologies, particularly those arrangements that seek to leverage other organizations’ internal platforms or competencies for the benefit of our products or potential products. Additional potential transactions that we may consider include a variety of different business arrangements, including spin-offs, strategic partnerships, joint ventures, restructurings, divestitures, business combinations and investments. Any such transaction may require us to incur non-recurring or other charges, may increase our near and long-term expenditures and may pose significant integration challenges or disrupt our management or business, which could adversely affect our operations and financial results. For example, these transactions may entail numerous operational and financial risks, including:
|
•
|
exposure to unknown or unanticipated liabilities, including foreign laws we are unfamiliar with;
|
|
•
|
disruption of our business and diversion of our management’s time and attention in order to develop acquired products, product candidates or technologies;
|
|
•
|
incurrence of substantial debt or dilutive issuances of equity securities to pay for acquisitions, which we may not be able to obtain on favorable terms, if at all;
|
|
•
|
higher than expected acquisition and integration costs;
|
|
•
|
write-downs of assets or goodwill or impairment charges;
|
|
•
|
increased amortization expenses;
|
|
•
|
difficulty and cost in combining the operations and personnel of any acquired businesses with our operations and personnel;
|
|
•
|
entering into a long-term relationship with a partner that proves to be unreliable or counterproductive;
|
|
•
|
impairment of relationships with key suppliers or customers of any acquired businesses due to changes in management and ownership; and
|
|
•
|
inability to retain key employees of any acquired businesses. Accordingly, although there can be no assurance that we will undertake or successfully complete any transactions of the nature described above, any transactions that we do complete could have a material adverse effect on our business, results of operations, financial condition and prospects if we are unable to execute on the planned objectives or capitalize on the relationship in the manner that was originally contemplated.
|
We have a limited senior management team size that may hamper our ability to effectively manage a publicly traded company and manage acquisitions and that may harm our business.
Since we operate in several foreign countries, we use consultants, including lawyers and accountants, to help us comply with regulatory requirements and public company compliance on a timely basis. As we expand, we expect to increase the size of our senior management. However, we cannot guarantee that in the interim period our senior management can adequately manage the requirements of a public company and the integration of acquisitions, and any failure to do so could lead to the imposition of fines, penalties, harm our business, status as a reporting company and our listing on the NYSE American.
Our expansion is dependent on laws pertaining to the legal cannabis industry.
We expect to acquire companies and hire management in the areas that we have identified. These include, among others, bio-pharmaceuticals with a focus on capitalizing on specific niches within these areas such as phytocannabinoid-based therapies. Entry into any of these areas requires special knowledge of the industry and products. In the event that we are perceived to be entering the legal cannabis sector, even indirectly or remotely, we could be subject to increased scrutiny by regulators because, among other things, marijuana is a Schedule-1 controlled substance and is illegal under federal law. Our failure to adequately manage the risk associated with these businesses and adequately manage the requirements of the regulators can adversely affect our business, our status as a reporting company and our listing on the NYSE American. Further, any adverse pronouncements from regulators about businesses related to the legal cannabis sector could adversely affect our stock price if we are perceived to be in a company in the cannabis sector.
Our company is in a very new and highly regulated industry. Significant and unforeseen changes in policy may have material impacts on our business.
Continued development in the phytocannabinoids industry is dependent upon continued state legislative authorization of cannabis as well as legislation and regulatory policy at the federal level. The federal Controlled Substances Act currently makes cannabis use and possession illegal on a national level. While there may be ample public support for legislative authorization, numerous factors impact the legislative process. Any one of these factors could slow or halt use and handling of cannabis in the United States or in other jurisdictions, which would negatively impact our development of phytocannabinoid-based therapies and our ability to test and productize these therapies.
Many U.S. state laws are in conflict with the federal Controlled Substances Act. While we do not intend to distribute or sell cannabis in the United States, it is unclear whether regulatory authorities in the United States would object to the registration or public offering of securities in the United States by our company, to the status of our company as a reporting company, or even to investors investing in our company if we engage in legal cannabis production and supply pursuant to the laws and authorization of the jurisdiction where the activity takes place. In addition, the status of cannabis under the Controlled Substances Act may have an adverse effect on federal agency approval of pharmaceutical use of phytocannabinoid products. Any such objection or interference could delay indefinitely or increase substantially the costs to access the equity capital markets, test our therapies, or create products from these phytocannabinoid-based therapies.
Banks and clearing houses may make it difficult for us to trade and clear our stock because they believe we are in the cannabis industry.
Continued development of the cannabis industry is dependent upon continued legislative authorization of cannabis. While there may be plenty public support for legislative authorization, several factors impact the legislative process. Additionally, many U.S. state laws are in conflict with the federal Controlled Substances Act, which makes cannabis use and possession illegal on a national level. While we do not intend to harvest, distribute, or sell cannabis in the United States, our presence in the pharmaceutical space can be misunderstood as being in the sale and distribution part of the cannabis industry. This could lead banks, regulators and others to mislabel our company. As such our stock could suffer if investors are unable to deposit their shares with a broker dealer and have those share clear.
Our business is dependent on continuing relationships with clients and strategic partners.
Our business requires developing and maintaining strategic alliances with contractors that undertake turnkey contracts for infrastructure development projects and with government organizations. The business and our results could be adversely affected if we are unable to maintain continuing relationships and pre-qualified status with key clients and strategic partners.
Currency fluctuations may reduce our assets and profitability.
We have assets located in foreign countries that are valued in foreign currencies. Fluctuation of the U.S. dollar relative to the foreign currency may adversely affect our assets and profit.
Our business relies heavily on our management team and any unexpected loss of key officers may adversely affect our operations.
The continued success of our business is largely dependent on the continued services of our key employees. The loss of the services of certain key personnel, without adequate replacement, could have an adverse effect on our performance. Our senior management, as well as the senior management of our subsidiaries, plays a significant role in developing and executing the overall business plan, maintaining client relationships, proprietary processes and technology. While no one is irreplaceable, the loss of the services of any would be disruptive to our business.
Our quarterly revenue, operating results and profitability will vary.
Factors that may contribute to the variability of quarterly revenue, operating results or profitability include:
| • |
Fluctuations in revenue due to seasonality of the market place, which results in uneven revenue and operating results over the year;
|
| • |
Additions and departures of key personnel; and
|
| • |
Strategic decisions made by us and our competitors, such as acquisitions, divestitures, spin-offs, joint ventures, strategic investments and changes in business strategy.
|
We may not successfully register the provisional patents with the United States Patent and Trademark Office
We have filed eight provisional patents with the United States Patent and Trademark Office (“USPTO”), in the combination therapy space, for the indications of pain, medical refractory epilepsy, eating disorders, and cachexia as part of our intellectual property strategy focused on the phytocannabinoid-based health care industry. There is no guarantee that our applications will result in a successful registration with the USPTO. If we are unsuccessful in registering patents, our ability to create a valuable line of products can be adversely affected. This in turn may have a material and adverse impact on the trading price of our common stock.
We may face risks relating to Health Care Privacy and Security Laws
We may be subject to various privacy and security regulations, including but not limited to HIPAA, as amended by HITECH, and their respective implementing regulations, including the related final published omnibus rule. HIPAA mandates, among other things, the adoption of uniform standards for the electronic exchange of information in common health care transactions, as well as standards relating to the privacy and security of individually identifiable health information, which require the adoption of administrative, physical and technical safeguards to protect such information. Among other things, HITECH makes HIPAA’s privacy and security standards directly applicable to “business associates” — independent contractors or agents of covered entities that receive or obtain protected health information in connection with providing a service on behalf of a covered entity. HITECH also increased the civil and criminal penalties that may be imposed against covered entities, business associates and possibly other persons, and gave state attorneys general new authority to file civil actions for damages or injunctions in federal courts to enforce the federal HIPAA laws and seek attorney’s fees and costs associated with pursuing federal civil actions. In addition, state laws govern the privacy and security of health information in certain circumstances, some of which are more stringent then HIPAA and many of which differ from each other in significant ways and may not have the same effect, thus complicating compliance efforts. Failure to comply with these laws, where applicable, can result in the imposition of significant civil and criminal penalties.
We are dependent on numerous third parties in our supply chain for the commercialization of Hyalolex
tm
, and if we fail to maintain our supply and manufacturing relationships with these third parties or fail to develop new relationships with other third parties, we may be unable to continue to commercialize Hyalolex
tm
or to develop other product candidates
.
We rely on a number of third parties for the commercial supply of
Hyalolex
tm
and the supply of certain of our product candidates. Our ability to commercially supply
Hyalolex
tm
and to develop our product candidates depend, in part, on our ability to successfully obtain the materials for our products and outsource most, if not all of the aspects of their manufacturing, at competitive costs, in accordance with regulatory requirements and in sufficient quantities for commercialization and clinical testing. If we fail to develop and maintain supply relationships with these third parties, we may be unable to continue to commercialize
Hyalolex
tm
or certain of our other product candidates. We do not own or operate manufacturing facilities for
Hyalolex
tm
and currently lack the licensing to manufacture
Hyalolex
tm
directly.
Some of our lines of business will rely on third-party service providers to host and deliver services and data, and any interruptions or delays in these hosted services, security or privacy breaches, or failures in data collection could expose us to liability claims, increased costs, reduced revenue, and harm our business and reputation.
Our lines of business and services, but especially our development of cannabis-based combination therapies for products, including Hyalolex
tm
for Alzheimer’s disease, and other products for Parkinson’s disease, chronic pain, post-traumatic stress disorder, and eating disorders and our long-term development of blockchain technologies to solve critical issues facing the Cannabis industry, rely on services hosted and controlled directly by our suppliers and distributors and their third-party service providers. We do not have redundancy for all of our systems, many of our critical applications reside in only one of our data centers, and our disaster recovery planning may not account for all eventualities. These facts could cause reputational harm, loss of customers and future business, thereby reducing our revenue.
Our suppliers and distributors and their third-party service providers hold customer data, some of which is hosted in third-party facilities. A security incident at those facilities or ours may compromise the confidentiality, integrity or availability of customer data. Unauthorized access to customer data stored on our computers or networks may be obtained through break-ins, breaches of our secure network by an unauthorized party, employee theft or misuse or other misconduct. It is also possible that unauthorized access to customer data may be obtained through inadequate use of security controls by customers. Accounts created with weak passwords could allow cyber-attackers to gain access to customer data. If there were an inadvertent disclosure of customer information, or if a third party were to gain unauthorized access to the information we possess on behalf of our customers, our operations could be disrupted, our reputation could be damaged, and we could be subject to claims or other liabilities. In addition, such perceived or actual unauthorized disclosure of the information we collect, or breach of our security could damage our reputation, result in the loss of customers and harm our business.
Hardware or software failures or errors in our systems or those of our suppliers and distributors or their third-party service providers, could result in data loss or corruption, cause the information that we collect to be incomplete or contain inaccuracies that our customers regard as significant or cause us to fail to meet committed service levels. Furthermore, our ability to collect and report data may be delayed or interrupted by several factors, including access to the Internet, the failure of our network or software systems or security breaches. In addition, computer viruses or other malware may harm our systems, causing us to lose data, and the transmission of computer viruses or other malware could expose us to litigation. We may also find, on occasion, that we cannot deliver data and reports in near real time because of several factors, including failures of our network or software. If we supply inaccurate information or experience interruptions in our ability to capture, store and supply information in near real time or at all, our reputation could be harmed, and we could lose customers, or we could be found liable for damages or incur other losses.
The states in which we and our distributers and suppliers and their service providers operate require that we maintain certain information about our customers and transactions. If we fail to maintain such information, we could be in violation of state laws.
Risks Related to Ownership of Our Common Stock
Our accounting personnel may make unintentional errors.
Given our small size and foreign operations, a small unrectified mistake in the preparation of financial statements and the maintenance of our books and records in accordance with U.S. GAAP and SEC rules and regulations may constitute a material weakness in our internal controls over financial reporting. For more information, please see Item 9A, “Controls and Procedures.”
Future sales of common stock by us could cause our stock price to decline and dilute your ownership in our company.
There are currently 11,656,668 outstanding public warrants to purchase 1,165,667 shares of our common stock at an exercise price of $50.00 a share. We also have outstanding option to buy 650,000 shares, expiring between October 31, 2022 and October 31, 2023, with a weighted average exercise price of $0.34. We are not restricted from issuing additional shares of our common stock or preferred stock, including any securities that are convertible into or exchangeable for, or that represent the right to receive, common stock or preferred stock or any substantially similar securities. The market price of our common stock could decline as a result of sales of a large number of shares of our common stock by us in the market or the perception that such sales could occur. If we raise funds by issuing additional securities in the future or the outstanding warrants or stock options to purchase our common stock are exercised, the newly-issued shares will also dilute your percentage ownership in our company.
The market price for our common stock may be volatile.
The trading volume in our common stock may fluctuate and cause significant price variations to occur. Fluctuations in our stock price may not be correlated in a predictable way to our performance or operating results. Our stock price may fluctuate as a result of a number of events and factors such as those described elsewhere in this “Risk Factors” section, events described in this report, and other factors that are beyond our control. In addition, the stock market, in general, has historically experienced significant price and volume fluctuations. Our common stock has also been volatile, with our 52-week price range being at a low of $0.30 and a high of $1.63 per share. These fluctuations are often unrelated to the operating performance of particular companies. These broad market fluctuations may cause declines in the market price of our common stock. In addition, it is possible, given our current trading price, that we may fail to comply with the minimum trading price required to trade our shares on the NYSE American.
Our publicly-filed reports are subject to review by the SEC, and any significant changes or amendments required as a result of any such review may result in material liability to us and may have a material adverse impact on the trading price of our common stock.
The reports of publicly-traded companies are subject to review by the SEC from time to time for the purpose of assisting companies in complying with applicable disclosure requirements, and the SEC is required to undertake a comprehensive review of a company’s reports at least once every three years under the Sarbanes-Oxley Act of 2002. SEC reviews may be initiated at any time. We could be required to modify, amend, or reformulate information contained in prior filings as a result of an SEC review, as well as state in filings that we have inadequate control or expertise over financial reporting. Any modification, amendment, or reformulation of information contained in such reports could be significant and result in material liability to us and have a material and adverse impact on the trading price of our common stock.
We do not anticipate declaring any cash dividends on our common stock.
We have never declared or paid cash dividends on our common stock and do not plan to pay any cash dividends in the near future. Our current policy is to retain all funds and earnings for use in the operation and expansion of our business. In addition, the terms of our debt agreement prohibit the payment of cash dividends or other distributions on any of our capital stock except dividends payable in additional shares of capital stock.
Maryland anti-takeover provisions and certain anti-takeover effects of our Charter and Bylaws may inhibit a takeover at a premium price that may be beneficial to our stockholders.
Maryland anti-takeover provisions and certain anti-takeover effects of our charter and bylaws may be utilized, under some circumstances, as a method of discouraging, delaying or preventing a change of control of our company at a premium price that would be beneficial to our stockholders. For more detailed information about these provisions, please see “Anti-takeover Law, Limitations of Liability and Indemnification” as following:
Business Combinations
Under the Maryland General Corporation Law, some business combinations, including a merger, consolidation, share exchange or, in some circumstances, an asset transfer or issuance or reclassification of equity securities, are prohibited for a period of time and require an extraordinary vote. These transactions include those between a Maryland corporation and the following persons (a “Specified Person”):
| • |
an interested stockholder, which is defined as any person (other than a subsidiary) who beneficially owns 10% or more of the corporation’s voting stock, or who is an affiliate or an associate of the corporation who, at any time within a two-year period prior to the transaction, was the beneficial owner of 10% or more of the voting power of the corporation’s voting stock; or an affiliate of an interested stockholder.
|
A person is not an interested stockholder if the board of directors approved in advance the transaction by which the person otherwise would have become an interested stockholder. The board of directors of a Maryland corporation also may exempt a person from these business combination restrictions prior to the time the person becomes a Specified Person and may provide that its exemption be subject to compliance with any terms and conditions determined by the board of directors. Transactions between a corporation and a Specified Person are prohibited for five years after the most recent date on which such stockholder becomes a Specified Person. After five years, any business combination must be recommended by the board of directors of the corporation and approved by at least 80% of the votes entitled to be cast by holders of voting stock of the corporation and two-thirds of the votes entitled to be cast by holders of shares other than voting stock held by the Specified Person with whom the business combination is to be effected, unless the corporation’s stockholders receive a minimum price as defined by Maryland law and other conditions under Maryland law are satisfied.
A Maryland corporation may elect not to be governed by these provisions by having its board of directors exempt various Specified Persons, by including a provision in its charter expressly electing not to be governed by the applicable provision of Maryland law or by amending its existing charter with the approval of at least 80% of the votes entitled to be cast by holders of outstanding shares of voting stock of the corporation and two-thirds of the votes entitled to be cast by holders of shares other than those held by any Specified Person. Our Charter does not include any provision opting out of these business combination provisions.
Control Share Acquisitions
The Maryland General Corporation Law also prevents, subject to exceptions, an acquirer who acquires sufficient shares to exercise specified percentages of voting power of a corporation from having any voting rights except to the extent approved by two-thirds of the votes entitled to be cast on the matter not including shares of stock owned by the acquiring person, any directors who are employees of the corporation and any officers of the corporation. These provisions are referred to as the control share acquisition statute.
The control share acquisition statute does not apply to shares acquired in a merger, consolidation or share exchange if the corporation is a party to the transaction, or to acquisitions approved or exempted prior to the acquisition by a provision contained in the corporation’s charter or bylaws. Our Bylaws include a provision exempting us from the restrictions of the control share acquisition statute, but this provision could be amended or rescinded either before or after a person acquired control shares. As a result, the control share acquisition statute could discourage offers to acquire our common stock and could increase the difficulty of completing an offer.
Board of Directors
The Maryland General Corporation Law provides that a Maryland corporation which is subject to the Exchange Act and has at least three outside directors (who are not affiliated with an acquirer of the company) under certain circumstances may elect by resolution of the board of directors or by amendment of its charter or bylaws to be subject to statutory corporate governance provisions that may be inconsistent with the corporation’s charter and bylaws. Under these provisions, a board of directors may divide itself into three separate classes without the vote of stockholders such that only one-third of the directors are elected each year. A board of directors classified in this manner cannot be altered by amendment to the charter of the corporation. Further, the board of directors may, by electing to be covered by the applicable statutory provisions and notwithstanding the corporation’s charter or bylaws:
| • |
provide that a special meeting of stockholders will be called only at the request of stockholders entitled to cast at least a majority of the votes entitled to be cast at the meeting,
|
| • |
reserve for itself the right to fix the number of directors,
|
| • |
provide that a director may be removed only by the vote of at least two-thirds of the votes entitled to be cast generally in the election of directors, and
|
| • |
retain for itself sole authority to fill vacancies created by an increase in the size of the board or the death, removal or resignation of a director.
|
In addition, a director elected to fill a vacancy under these provisions serves for the balance of the unexpired term instead of until the next annual meeting of stockholders. A board of directors may implement all or any of these provisions without amending the charter or bylaws and without stockholder approval. Although a corporation may be prohibited by its charter or by resolution of its board of directors from electing any of the provisions of the statute, we have not adopted such a prohibition. We have adopted a staggered board of directors with three separate classes in our charter and given the board the right to fix the number of directors, but we have not prohibited the amendment of these provisions. The adoption of the staggered board may discourage offers to acquire our common stock and may increase the difficulty of completing an offer to acquire our stock. If our Board chose to implement the statutory provisions, it could further discourage offers to acquire our common stock and could further increase the difficulty of completing an offer to acquire our common stock.
Effect of Certain Provisions of our Charter and Bylaws
In addition to the Charter and Bylaws provisions discussed above, certain other provisions of our Bylaws may have the effect of impeding the acquisition of control of our company by means of a tender offer, proxy fight, open market purchases or otherwise in a transaction not approved by our Board of Directors. These provisions of Bylaws are intended to reduce our vulnerability to an unsolicited proposal for the restructuring or sale of all or substantially all of our assets or an unsolicited takeover attempt, which our Board believes is otherwise unfair to our stockholders. These provisions, however, also could have the effect of delaying, deterring or preventing a change in control of our company.
Our Bylaws provide that with respect to annual meetings of stockholders, (i) nominations of individuals for election to our Board of Directors and (ii) the proposal of business to be considered by stockholders may be made only pursuant to our notice of the meeting, by or at the direction of our Board of Directors, or by a stockholder who is entitled to vote at the meeting and has complied with the advance notice procedures set forth in our Bylaws.
Special meetings of stockholders may be called only by the chief executive officer, the board of directors or the secretary of our company (upon the written request of the holders of a majority of the shares entitled to vote). At a special meeting of stockholders, the only business that may be conducted is the business specified in our notice of meeting. With respect to nominations of persons for election to our Board of Directors, nominations may be made at a special meeting of stockholders only pursuant to our notice of meeting, by or at the direction of our Board of Directors, or if our Board of Directors has determined that directors will be elected at the special meeting, by a stockholder who is entitled to vote at the meeting and has complied with the advance notice procedures set forth in our Bylaws.
These procedures may limit the ability of stockholders to bring business before a stockholders meeting, including the nomination of directors and the consideration of any transaction that could result in a change in control and that may result in a premium to our stockholders.
None.
ITEM 2. PROPERTIES
Our facilities are located in Maryland and Washington States. Our back office is located at Techni Bharathi Private Limited’s headquarters in Kochi, India. Cabaran Ultima was located in Kuala Lumpur, Malaysia. IGC Enterprise is located in Hong Kong. Our subsidiary TBL owns (i) an office space of about 1,500 sq. feet in Nagpur, India, which was acquired in 2010 and has an approximate gross value of $53,755 and (ii) an apartment located in Kochi, India, with an approximate fair market value of $61,434, but recorded in books at only $1,536.
The land owned in Nagpur by IGC’s wholly owned subsidiary TBL, which was recorded as an Investment under non-current assets, has been reclassified as Property, Plant, and Equipment in the fiscal year 2018. The Company is exploring strategies to monetize the investment. However, we are not involved in real estate mortgages, or securities of or interests in persons primarily engaged in real estate activities. In India and in the U.S., we rent housing (apartments and homes) to host staff members for an aggregate annual rental of $17,443.
We pay an affiliate of our CEO $4,500 per month for office space and certain general and administrative services rendered in Maryland. In addition, we pay another affiliate of our CEO $6,100 per month for office and facilities in Washington State. We believe, based on rents and fees for similar services in the Washington, D.C. metropolitan area and Washington State, that the fee charged by the affiliates are at least as favorable as we could have obtained from an unaffiliated third-party and these payments are not considered or meant to be compensation. The rental agreement for the Maryland location is on a month-to-month basis and may be terminated by our Board of Directors of the Company at any time without notice. The rental agreement for Washington State facilities was renewed on January 1, 2018 for a period of one year, expiring on December 31, 2018, unless renewed by mutual consent, at $6,100 per month and for a one-time mutually-agreed renewal fee of $106,283. During fiscal year ended March 31, 2018, the total rent paid to the affiliates was $54,000 for the office space (and services) in Maryland and $73,200 for the facilities in Washington State. We expect that these expenses will remain at approximately this level during the fiscal year ending March 31, 2019.
The table below summarizes the nature of activity, type of license required and held and encumbrances in obtaining permit for each location where the company operated through its subsidiaries in the fiscal year 2018:
|
Location
|
|
Nature of Activity
|
|
Type of License Required
|
|
Type of License held
|
|
Encumbrances in Obtaining Permit
|
|
USA
|
|
General management
|
|
General business, States approval for Hyalolex
tm
|
|
General business licenses
|
|
None
|
|
India
|
|
Rental of heavy equipment and land
|
|
General business license
|
|
All appropriate business registrations with tax authorities in various states in India
|
|
None.
|
|
Hong Kong
|
|
Trading of commodities
|
|
General business license
|
|
General business license
|
|
None.
|
|
Malaysia
|
|
Real estate management
|
|
General business license to construct and manage real estate
|
|
General business license to construct and manage real estate
|
|
None.
|
There are no material pending or threatened legal proceedings against IGC. Please see “Note 25 – Subsequent Event” in Part II, Item 8 in our Consolidated Financial Statements contained herein for more information
Not Applicable.
PART II
ITEM 5. MARKET FOR REGISTRANT’S COMMON EQUITY, RELATED STOCKHOLDER MATTERS AND ISSUER PURCHASES OF EQUITY SECURITIES
Our common stock trades on the NYSE American under the symbol “IGC” with CUSIP number 45408X308. The Common stock of the Company is also available for trading on the Frankfurt, Berlin, and Stuttgart (XETRA2) stock exchanges in Germany. Our warrants and units now trade on the OTC Markets.
The following table sets forth, for the calendar quarter indicated, the quarterly high and low bid information of our common stock, as reported on the U.S. exchanges.
|
|
|
2018
|
|
2017
|
|
|||||||||||
|
|
High
|
|
Low
|
|
High
|
|
|
Low
|
|
|||||||
|
First Quarter
|
|
|
0.80
|
|
|
0.33
|
|
0.56
|
|
0.30
|
|
|||||
|
Second Quarter
|
|
|
0.46
|
0.30
|
|
0.61
|
|
0.35
|
|
|||||||
|
Third Quarter
|
|
|
1.63
|
0.36
|
|
0.49
|
|
0.19
|
|
|||||||
|
Fourth Quarter
|
|
|
1.29
|
0.53
|
|
0.52
|
|
0.24
|
|
|||||||
On June 15, 2018, the last reported sale price of our common stock, as reported on the NYSE American, was $0.55 per share.
The trading history for the warrants is not available. No warrants were issued in fiscal 2018. The exercise of a warrant allows the holder to purchase one tenth of a share of common stock. Therefore, 10 warrants are needed to purchase one share of common stock.
Securities Authorized for Issuance Under Equity Compensation Plans
As of March 31, 2018, there are no exercisable options outstanding under any of our Equity Compensation Plans.
Holders
As of March 31, 2018, we had approximately 10,000 holders of record of our common stock, and approximately 4 registered holders of record of our warrants. The number of record holders does not include persons who held our common stock in nominee or “street name” accounts through brokers.
Continental Stock Transfer & Trust Company is the transfer agent and registrar for our common stock and warrants.
Dividend Policy
We have not paid any dividends on our common stock to date and do not intend to pay dividends prior to the completion of a business combination. The payment of dividends in the future will be contingent upon our revenues and earnings, if any, capital requirements and general financial condition subsequent to completion of a business combination. The payment of any dividends subsequent to a business combination will be within the discretion of our then Board of Directors. It is the present intention of our Board of Directors to retain all earnings, if any, for use in our business operations and, accordingly, our Board does not anticipate declaring any dividends in the foreseeable future.
In addition, the terms of our debt agreement prohibit the payment of cash dividends or other distributions on any of our capital stock except dividends payable in additional shares of capital stock.
Unregistered Sales of Equity Securities
None.
Purchases of Equity Securities by the Issuer and Affiliated Purchasers
None.
Item 6 does not apply to us because we are a smaller reporting company.
ITEM 7. MANAGEMENT’S DISCUSSION AND ANALYSIS OF FINANCIAL CONDITION AND RESULTS OF OPERATIONS
The following discussion and analysis should be read in conjunction with our consolidated financial statements and the related notes that appear elsewhere in this Annual Report on Form 10-K. The Company’s actual results could differ materially from those discussed here. Factors that could cause differences include those discussed in the “Risk Factors” section, as well as discussed elsewhere in this report.
Critical Accounting Policies and Estimates
The preparation of financial statements and related disclosures in conformity with U.S. GAAP and the Company’s discussion and analysis of its financial condition and operating results require the Company’s management to make judgments, assumptions, and estimates that affect the amounts reported in its consolidated financial statements and accompanying notes. We base our estimates on historical experience, as appropriate, and on various other assumptions that we believe to be reasonable under the circumstances. Actual results may differ from these estimates, and such differences may be material.
Our significant accounting policies are presented in Note 2. Management believes that the following accounting policies are the most critical to understanding and evaluating our consolidated financial condition and results of operations.
Revenue Recognition
IGC recognizes revenue from trading, rental, or product sales when (i) persuasive evidence of an arrangement exists, (ii) delivery has occurred and title has passed, (iii) the price is fixed or determinable, and (iv) collectability is reasonably assured.
We had $2,192,590 in revenue from trading and rental and no revenue from the sale and licensing of alternative therapy products in the fiscal year 2018.
Goodwill
Goodwill represents the excess cost of an acquisition over the fair value of our share of net identifiable assets of the acquired subsidiary at the date of acquisition. Goodwill on acquisition of subsidiaries is disclosed separately. Goodwill is stated at cost less impairment losses incurred, if any. In fiscal year 2018, IGC decided to exit the business conducted by its Malaysia-based subsidiary, Cabaran Ultima. As of March 31, 2018, there is no goodwill recorded.
Inventories
We provide for inventory obsolescence, excess inventory, and inventories with carrying values in excess of market values based on our assessment of the future demands, market conditions, and our specific inventory management procedures. If market conditions and actual demands are less favorable than our estimates, additional inventory write-downs may be required. In all cases inventory is carried at the lower of historical cost or market value. We have about $486,497 and $Nil in inventory for the fiscal years 2018 and 2017, respectively. Please see “Note 4 - Inventory” in Part II, Item 8 in our Consolidated Financial Statements contained herein.
Accounts receivable
We make estimates of the collectability of our accounts receivable by analyzing historical payment patterns, customer concentrations, customer credit-worthiness, and current economic trends. If the financial condition of a customer deteriorates, additional allowances may be required.
Regarding our collection policy on commodity trading receivables, there are three types of trades: (1) payment guaranteed through letters of credit, (2) deposit or spot payment on delivery or (3) delivery on credit. With the first type of trade: our policy for collection was to ask the customer to open a letter of credit with a bank. The typical terms of the letter of credit were that 100% of the payment was made when the material was shipped. With the second type of trade, customers paid on delivery. On the third type of trade, our policy was to allow the customer to have a payment credit term of 90 days. We had $557,813 of account receivable net of provision for doubtful debt in the amount of $15,614 as of March 31, 2018.
Impairment of investment
The Company regularly reviews its investment portfolio to determine if any security is other-than-temporarily impaired, which would require the Company to record an impairment charge in the period any such determination is made. In making this determination, the Company evaluates, among other things, the duration and extent to which the fair value of a security is less than its cost; the financial condition of the issuer and any changes thereto; and the Company’s intent to sell, or whether it will more likely than not be required to sell, the security before recovery of its amortized cost basis. The Company’s assessment of whether a security is other-than-temporarily impaired could change in the future due to new developments or changes in assumptions related to any particular security, which would have an adverse impact on the Company’s financial condition and operating results.
The fair value of real estate is determined based on an independent appraisal. The estimated amount of liability is based on the information available with us with respect of bank debt and other borrowings. In 1995, TBL, now an IGC’s subsidiary, made an investment of $46,076 (INR 3,000,000) in Bhagheeratha Developers Limited. Based on the review of the balance sheet of this entity, we impaired this investment by $410 in the fiscal year 2017 for a cumulative impairment of $20,265. There was no impairment in the fiscal year 2018.
Impairment of long-lived assets
The Company reviews its long-lived assets, with finite lives, for impairment whenever events or changes in business circumstances indicate that the carrying amount of assets may not be fully recoverable. Such circumstances include, though are not limited to, significant or sustained declines in revenues or earnings, future anticipated cash flows, business plans and material adverse changes in the economic climate, such as changes in operating environment, competitive information, impact of change in government policies, etc. For assets that the Company intends to hold for use, if the total of the expected future undiscounted cash flows produced by the assets or subsidiary company is less than the carrying amount of the assets, a loss is recognized for the difference between the fair value and carrying value of the assets. For assets, the Company intends to dispose of by sale, a loss is recognized for the amount by which the estimated fair value less cost to sell is less than the carrying value of the assets. Fair value is determined based on quoted market prices, if available, or other valuation techniques including discounted future net cash flows. We had no impairment of our long-lived assets in either the fiscal year 2017 or 2018.
Stock-based compensation
Stock-based compensation expense is measured at the grant date, based on the estimated fair value of the award. The cost is recognized in our Consolidated Financial Statements as expense ratably over the employee’s requisite service period or vesting period, which is generally one or two years, on a straight-line basis. We account for forfeitures when they occur. Equity awards issued to non-employees are recorded at their fair value on the grant date as they are immediately exercisable and not forfeitable on the date of grant.
Expense recognized for consultants and advisors stock options and employee stock grants was $0.26 million for the year ended March 31, 2018 and was immaterial for the year ended March 31, 2017.
Recording for Stock – Based Compensation
|
1.
|
We currently record stock-based compensation to employees on the fair value. As a listed company fair value of our shares are readily available. Closing share price on the date of Board Approval for stock-based compensation is consider fair-value of the share.
|
|
2.
|
We currently use the Black-Scholes option-pricing model to estimate the fair value of our stock-based option awards to our advisors. This model requires the input of highly subjective assumptions, including the fair value of the underlying common stock, the expected volatility of the price of our common stock, risk- free interest rates, the expected term of the option and the expected dividend yield of our common stock. These estimates involve inherent uncertainties and the application of management’s judgment. If factors change and different assumptions are used, our stock-based compensation expense could be materially different in the future. These assumptions are estimated as follows:
|
| • |
Expected Volatility —We have an active trading market in our stock, and sufficient historical data to estimate volatility for the period equivalent to the expected term of the stock option grants.
|
| • |
Risk-Free Interest Rate — The risk-free interest rate assumption is based on observed interest rates appropriate for the expected terms of our awards. The risk-free interest rate assumption is based on the yields of U.S. Treasury securities with maturities similar to the expected term of the options for each option group.
|
| • |
Expected Term — The expected term represents the period that our stock-based awards are expected to be outstanding.
|
| • |
Expected Dividend Yield — We have never declared or paid any cash dividends and do not presently plan to pay cash dividends in the foreseeable future. Consequently, we use an expected dividend yield of zero.
|
In fiscal years 2018 and 2017, we gave to our advisors options to purchase 490,000 and 160,000 shares, respectively, expiring between October 31, 2022 and October 31, 2023, with a weighted average exercise price of $0.34.
Please see “Note 16. Stock – Based Compensation” in our Consolidated Financial Statements contained herein in Part II, Item 8.
Cyber Security
All our data, except accounting data, is stored in the cloud on multiple servers that helps us mitigate the overall risk of losing data. We are moving our accounting system to the cloud and this transition will take six months to implement and adequately train our accounting staff. We are in the process of implementing tighter cyber security measures to safe guard against hackers and expect to do so in fiscal year 2019. In the fiscal year 2018 there were no breaches in cyber security.
Recently issued and adopted accounting pronouncements
Changes to U.S. GAAP are established by the Financial Accounting Standards Board (“FASB”) in the form of accounting standards updates (“ASUs”) to the FASB’s Accounting Standards Codification. The Company considers the applicability and impact of all ASUs. Newly issued ASUs not listed are expected to have no impact on the Company’s consolidated financial position and results of operations, because either the ASU is not applicable, or the impact is expected to be immaterial.
Recent accounting pronouncements which may be applicable to us are described in “Note 2. Significant Accounting Policies” in our Consolidated Financial Statements contained herein in Part II, Item 8.
Results of Operations
Fiscal Year Ended March 31, 2018 compared to Fiscal Year Ended March 31, 2017
The following table presents an overview of our results of operations for the fiscal years ended March 31, 2018 and 2017:
Statement of Operations
|
Year Ended March 31,
|
||||||||||||||||
|
2018
|
2017
|
Change
|
Percent Change
|
|||||||||||||
|
Revenu
e
|
$
|
2,192,590
|
$
|
580,372
|
$
|
1,612,218
|
277.79
|
|||||||||
|
Cost of revenues
|
(2,111,066
|
)
|
(362,135
|
)
|
(1,748,931
|
)
|
482.95
|
|||||||||
|
Selling, general and administrative expenses
|
(1,870,477
|
)
|
(2,271,690
|
)
|
401,213
|
(17.66
|
)
|
|||||||||
|
Loss from investment /associates/ joint ventures
|
-
|
(932
|
)
|
932
|
(100.00
|
)
|
||||||||||
|
Operating income/(loss)
|
$
|
(1,788,953
|
)
|
$
|
(2,054,385
|
)
|
$
|
265,432
|
(12.92
|
)
|
||||||
|
Other income - net
|
3,143
|
215,955
|
(212,812
|
)
|
(98.54
|
)
|
||||||||||
|
Income before income taxes and minority interest attributable to non-controlling interest
|
$
|
(1,785,810
|
)
|
$
|
(1,838,430
|
)
|
$
|
52,621
|
(2.86
|
)
|
||||||
|
Tax
expense
/(
benefit
)
|
(464
|
)
|
(14,431
|
)
|
13,967
|
(96.78
|
)
|
|||||||||
|
Income/(loss) after income taxes
|
$
|
(1,786,274
|
)
|
$
|
(1,852,861
|
)
|
$
|
66,588
|
(3.59
|
)
|
||||||
Revenue
– Total revenue was approximately $2.19 million and $580 thousand for the fiscal years 2018 and 2017, respectively. This represents an increase of $1.61 million or 277.8%. In the fiscal year 2018, the contribution to revenue arose from trading commodities and the equipment rental businesses. In the fiscal year 2017, part of the revenue also arose from the real estate management business in Malaysia. In the fiscal year 2018, we did not consolidate revenue from the real estate management business but accounted for it as “held for sale,” instead. The increase in total revenue was attributable to an increase in the volume of trading in different types of steel and other infrastructure related material in and outside of India.
Cost of revenue
– Cost of revenue increased approximately $1.74 million, or 483%, to $2.11 million for the year end March 31, 2018 compared to $ 360 thousand in for the year ended March 31, 2017. This increase in cost of revenue was attributable to increased revenue with margins remaining stable for the trading business.
Selling, general and administrative expenses
– These consist primarily of depreciation, research and development, employee related expenses, professional fees, other corporate expenses, allocated overhead and provisions, and write-offs relating to doubtful accounts and advances. SG&A expenses decreased approximately $400 thousand, or 17.66%, to $1.87 million for the year ended March 31, 2018 compared to $2.27 million in the year ended March 31, 2017. The decrease in Selling, General and Administrative expenses is attributable to decreased in depreciation as we exited certain businesses and related mining assets in late 2017.
Operating income/(loss)–
Loss from operations decreased approximately $265 thousand, or 12.92%, to $1.78 million for the fiscal year 2018 compared to $2.05 million for the fiscal year 2017. The decrease in operating loss was attributable to decreased depreciation and other SG&A expenses in the fiscal year 2018.
Other Income, net
– Other income decreased approximately $212 thousand, or 98.54%, to $3.0 thousand for the year ended March 31, 2018 compared to $215 thousand. In the fiscal year 2017 we had a one-time other non-cash income from two sources that we did not have in the fiscal year 2018.
Deferred income tax credit
– We had no income tax credit for either fiscal year ended March 31, 2018 or 2017. The deferred income tax credit in the fiscal year 2018 is not shown on the financial statements but remains with the Company for a potential offset against future earnings. Deferred income tax assets, net of valuation allowances, are expected to be realized through future taxable income. The company intends to maintain valuation allowances for deferred tax assets until there is sufficient evidence to support the reversal of the valuation allowance.
Net income/(loss)
– Net loss decreased approximately $70,000, or 3.59%, to $1.78 million for the fiscal year 2018 compared with $1.85 million for the fiscal year 2017. The decrease in net loss is attributable to decreased SG&A and decreased finance cost.
Balance sheet
|
Year Ended March 31,
|
||||||||||||||||
|
|
2018
|
2017
|
Change
|
Percent Change
|
||||||||||||
|
Cash and cash equivalents
|
$
|
1,658,496
|
$
|
538,029
|
$
|
1,120,467
|
208.25
|
|||||||||
|
Short term investments
|
-
|
1,880,000
|
(1,880,000
|
)
|
(100.00
|
)
|
||||||||||
|
Investments
|
798,922
|
6,011,114
|
(5,212,192
|
)
|
(86.71
|
)
|
||||||||||
|
Property, plant and equipment, net
|
6,236,839
|
953,936
|
5,282,903
|
553.80
|
||||||||||||
|
Account receivables
|
557,813
|
752,926
|
(195,113
|
)
|
(25.91
|
)
|
||||||||||
|
Inventory
|
486,497
|
-
|
486,497
|
100.00
|
||||||||||||
|
Intangible assets
|
127,826
|
-
|
127,826
|
100.00
|
||||||||||||
|
Investments held for sale
|
147,500
|
-
|
147,500
|
100.00
|
||||||||||||
|
Total liabilities
|
$
|
2,788,350
|
$
|
3,934,017
|
$
|
(1,145,667
|
)
|
(29.12
|
)
|
|||||||
Cash and cash equivalents -
Cash and cash equivalents increased $1.12 million, or about 208%, to $1.65 million for the fiscal year 2018 compared to $538 thousand for the fiscal year 2017. The increase is attributable to fund raising activity in the fiscal year 2018 through the sale of common stock.
Short –term investment -
Short term investment
decreased by $1.88 million, or 100%, to $Nil for the fiscal year 2018 compared to $1.88 million for the fiscal year 2017. The decrease is attributable to the sale of our investment in Brilliant Hallmark. The Company did not record a profit or a loss for the sale of Brilliant Hallmark.
Investments
–
Investments
decreased approximately $5.21 million, or about 86%, to $798 thousand for the fiscal year 2018 compared to $6.01 million for the fiscal year 2017. The decrease in
investment
was attributable to a reclassification of land from Investments to PP&E.
Property, plant and equipment, net
–
PP&E
increased approximately $5.28 million, or 553.8%, to $6.23 million for the fiscal year 2018 compared to $953 thousand for the fiscal year 2017. The increase in
PP&E
is due to a reclassification of land assets from Investment in Land to PP&E. In addition, we will operationalize some Construction in Progress (CIP) in the first quarter of fiscal year 2019.
Accounts receivable
–
Our accounts receivable for the fiscal years 2018 and 2017 amount to $557 thousand and $752 thousand, respectively. The primary component of our accounts receivable in fiscal year 2018 is a receivable from a construction claim in the amount of approximately $470 thousand that has been awarded to our subsidiary in India. We expect to collect the award in the next 12 months.
Inventory
–
Inventory in the fiscal year 2018 is $486 thousand compared to $Nil in the fiscal year 2017. The increase in inventory is entirely due to the production of various components of Hyalolex
tm
. As of March 31,2018, the components of Hyalolex
tm
are still in production and shown as Work-In-Progress in Inventory.
Intangible assets
– The value of intangible assets as of the fiscal year 2018 amounted to $127 thousand as compared to about $Nil as of the fiscal year 2017. Increase in intangible assets are attributable to the cost of acquisition and filing of patents.
Investment held for sale
– The investment held for sale in the fiscal year 2018 is $147 thousand compared to $Nil in the fiscal year 2017. The investment held for sale is the fair value of our ownership in Cabaran Ultima.
Total liability
–
Total liability
decreased about approximately $1.14 million, or 29.12%, to $2.78 million for the fiscal year 2018 compared to $3.93 million for the fiscal year 2017. The decrease in
total liability
was attributable to the repayment of loans by IGC and IGC’s subsidiaries.
Liquidity and Capital Resources
This liquidity and capital resources discussion compares the consolidated company results for the fiscal years ending March 31, 2018 and 2017.
|
Year Ended March 31,
|
||||||||||||||||
|
2018
|
2017
|
Change
|
Percent Change
%
|
|||||||||||||
|
Cash, cash equivalents and marketable securities
|
$
|
1,658,496
|
$
|
538,029
|
$
|
1,120,467
|
208.25
|
|||||||||
|
Cash in foreign subsidiaries
|
29,838
|
465,978
|
(436,140
|
)
|
(93.60
|
)
|
||||||||||
|
Property, plant and equipment, net
|
6,236,839
|
953,936
|
5,282,903
|
553.80
|
||||||||||||
|
Working capital
|
858,993
|
2,291,652
|
(1,432,659
|
)
|
(62.52
|
)
|
||||||||||
|
Cash generated by operating activities
|
(1,931,078
|
)
|
(1,391,077
|
)
|
(540,001
|
)
|
38.82
|
|||||||||
|
Cash used in investing activities
|
(657,113
|
)
|
(241,354
|
)
|
(415,759
|
)
|
172.26
|
|||||||||
|
Cash used in financing activities
|
$
|
3,714,912
|
707,564
|
$
|
3,007,348
|
425.03
|
||||||||||
At the end of fiscal year 2018, the Company had approximately $1.65 million in cash and cash equivalents. In fiscal 2018, the non-GAAP total cash burn after adjusting for non-cash items that include ESOPs and other payments paid with common stock, is about $1.3 million. The cash burn is primarily associated with public company expenses, with our operating subsidiaries at breakeven, or near breakeven. It does not include cash spent on investments or construction in progress.
The Company has adequate cash on hand to meet its obligations. However, in order to initiate any medical trials, the Company will need to raise additional capital. We have put in place an At-the-Market (ATM) and a Form S-3 that allows us to raise capital opportunistically and at our discretion based on liquidity and stock price. To the extent that we believe that raising capital for general corporate purposes is prudent, we have the option of using the ATM and the bank lines.
During the fiscal year 2018, cash used in operating activities of approximately $1.9 million was a result of $1.78 million of net loss, non- cash adjustments to net income of $600 thousand and a decrease in the net change in operating assets and liabilities of $750 thousand.
Cash used in investing activities of approximately $650 thousand during the fiscal year 2018 consisted of cash used for addition in facilities and acquisition of the patent from the University of South Florida. It also included a onetime deconsolidation adjustment of our subsidiary Cabaran Ultima.
Cash generated from financing activities of approximately $3.71 million during the fiscal year 2018 consisted primarily of cash generated from sale of new common stock and amounted to $3.74 million..
Off-balance Sheet Arrangements
We do not have any investments in special purpose entities or undisclosed borrowings or debt.
|
Index to Consolidated Financial Statements
|
Page
|
|
|
|
| 28 | |
| 31 | |
| 30 | |
| 32 | |
| 33 | |
| 34 | |
| 35 | |
|
|
|
To the Shareholders and Board of Directors of India Globalization Capital, Inc
Opinion on the Financial Statements
We have audited the accompanying consolidated balance sheet of India Globalization Capital, Inc and its subsidiaries (“the Company") as of March 31, 2018, the related consolidated statements of operations, comprehensive income, stockholders’ equity and cash flows, for the year ended March 31, 2018, and the related notes (collectively referred to as the ‘consolidated financial statements’). The consolidated financial statements of the Company for the year ended March 31, 2017 were audited by other independent auditors. Those independent auditors expressed an unqualified opinion on the consolidated financial statements referred to in their report dated July 13, 2017.
In our opinion, the consolidated financial statements present fairly, in all material respects, the consolidated financial position of the Company as of March 31, 2018, and the consolidated results of its operations and its cash flows for the year ended March 31, 2018, in conformity with accounting principles generally accepted in United States of America.
Basis for Opinion
These financial statements are the responsibility of the Company's management. Our responsibility is to express an opinion on the Company's financial statements based on our audits. We are a public accounting firm registered with the Public Company Accounting Oversight Board (United States) ("PCAOB") and are required to be independent with respect to the Company in accordance with the U.S. federal securities laws and the applicable rules and regulations of the Securities and Exchange Commission and the PCAOB.
We conducted our audits in accordance with the standards of the PCAOB. Those standards require that we plan and perform the audit to obtain reasonable assurance about whether the financial statements are free of material misstatement, whether due to error or fraud. Our audit included performing procedures to assess the risks of material misstatement of the financial statements, whether due to error or fraud, and performing procedures that respond to those risks. Such procedures included examining, on a test basis, evidence regarding the amounts and disclosures in the financial statements. Our audits also included evaluating the accounting principles used and significant estimates made by management, as well as evaluating the overall presentation of the financial statements. We believe that our audit provides a reasonable basis for our opinion.
We are serving as the Company's auditor for the first year.
Manohar Chowdhry & Associates
Chartered Accountants
Chennai, India
Date: June 21, 2018
Report of Independent Registered Public Accounting Firm for Fiscal year Ended March 31, 2017
To the Board of Directors and Stockholders of India Globalization Capital, Inc. and Subsidiaries:
We have audited the accompanying consolidated balance sheets of India Globalization Capital, Inc. and its subsidiaries (the “Company”) as of March 31, 2017, and the related consolidated statements of income, comprehensive income, cash flows, and stockholders’ equity for the year ended March 31, 2017. These financial statements are the responsibility of the Company’s management. Our responsibility is to express an opinion on these financial statements based on our audits.
We conducted our audits in accordance with the standards of the Public Company Accounting Oversight Board (United States). Those standards require that we plan and perform the audit to obtain reasonable assurance about whether the financial statements are free of material misstatement. An audit includes examining, on a test basis, evidence supporting the amounts and disclosures in the financial statements. An audit also includes assessing the accounting principles used and significant estimates made by management, as well as evaluating the overall financial statement presentation. We believe that our audits provide a reasonable basis for our opinion.
In our opinion, the consolidated financial statements referred to in the first paragraph above present fairly, in all material respects, the financial position of the Company as of March 31, 2017, and the results of their operations and their cash flows for each of the one-year period ended March 31, 2017, in conformity with accounting principles generally accepted in the United States of America.
AJSH & Co LLP
Delhi, India,
Independent Auditors registered with
Public Company Accounting Oversight Board
July 13, 2017
India Globalization Capital, Inc.
(All amounts in USD, except number of shares)
|
Years Ended March 31,
|
||||||||
|
|
2018
|
2017
|
||||||
|
Revenues
|
$
|
2,192,590
|
$
|
580,372
|
||||
|
Cost of revenues
|
(2,111,066
|
)
|
(362,135
|
)
|
||||
|
Gross profit/(loss)
|
81,524
|
218,237
|
||||||
|
Selling, general and administrative expenses
|
(1,870,477
|
)
|
(2,271,690
|
)
|
||||
|
Loss on investments / associates /joint ventures
|
-
|
(932
|
)
|
|||||
|
Operating income/(loss)
|
$
|
(1,788,953
|
)
|
$
|
(2,054,385
|
)
|
||
|
Other Income (Net)
|
3,143
|
215,955
|
||||||
|
Income before income taxes and minority interest attributable to
non-controlling interest
|
$
|
(1,785,810
|
)
|
$
|
(1,838,430
|
)
|
||
|
Income taxes benefit/(expense)
|
(464
|
)
|
(14,431
|
)
|
||||
|
Net income/(loss)
|
$
|
(1,786,274
|
)
|
$
|
(1,852,861
|
)
|
||
|
Non-controlling interests in earnings of subsidiaries
|
-
|
14,399
|
||||||
|
Net income/(loss) attributable to common stockholders
|
$
|
(1,786,274
|
)
|
$
|
(1,867,260
|
)
|
||
|
Earnings/(loss) per share attributable to common stockholders:
|
||||||||
|
Basic and Diluted
|
$
|
(0.06
|
)
|
$
|
(0.07
|
)
|
||
|
Weighted-average number of shares used in computing earnings per share amounts:
|
||||||||
|
Basic and Diluted
|
27,937,287
|
25,658,544
|
||||||
The accompanying notes should be read in connection with these consolidated financial statements.
|
India Globalization Capital, Inc.
|
||||||||
|
(All amounts in USD, except share data)
|
||||||||
|
|
March 31, 2018
|
March 31, 2017
|
||||||
|
ASSETS
|
||||||||
|
Current assets:
|
||||||||
|
Cash and cash equivalents
|
$
|
1,658,496
|
$
|
538,029
|
||||
|
Accounts receivable, net of allowances
|
557,813
|
752,926
|
||||||
|
Inventories
|
486,497
|
-
|
||||||
|
Investments held for sale
|
147,500
|
-
|
||||||
|
Other current assets
|
354,641
|
410,408
|
||||||
|
Short -term investments
|
-
|
1,880,000
|
||||||
|
Total current assets
|
$
|
3,204,947
|
$
|
3,581,363
|
||||
|
Long-term assets:
|
||||||||
|
Goodwill
|
-
|
198,169
|
||||||
|
Intangible Assets
|
127,826
|
-
|
||||||
|
Property, plant and equipment, net
|
6,236,839
|
953,936
|
||||||
|
Investments
|
798,922
|
6,011,114
|
||||||
|
Other non-current assets
|
484,562
|
539,720
|
||||||
|
Total long-term assets
|
$
|
7,648,149
|
$
|
7,702,939
|
||||
|
Total assets
|
$
|
10,853,096
|
$
|
11,284,302
|
||||
|
LIABILITIES AND STOCKHOLDERS' EQUITY
|
||||||||
|
Current liabilities:
|
||||||||
|
Trade payables
|
52,270
|
416,532
|
||||||
|
Other current liabilities
|
493,684
|
873,179
|
||||||
|
Notes payable
|
1,800,000
|
-
|
||||||
|
Total current liabilities
|
$
|
2,345,954
|
$
|
1,289,711
|
||||
|
Non-current liabilities:
|
||||||||
|
Loans - others
|
427,500
|
844,306
|
||||||
|
Notes payable
|
-
|
1,800,000
|
||||||
|
Other liabilities
|
14,896
|
-
|
||||||
|
Total non-current liabilities
|
$
|
442,396
|
$
|
2,644,306
|
||||
|
Total liabilities
|
$
|
2,788,350
|
$
|
3,934,017
|
||||
|
Stockholders' equity:
|
||||||||
|
Common stock and additional paid-in capital, $0.0001 par value: 150,000,000 shares authorized; 28,272,667 and 30,764,192 shares issued and outstanding, respectively.
|
$
|
63,917,035
|
$
|
61,416,360
|
||||
|
Accumulated other comprehensive income/(loss)
|
(2,056,556
|
)
|
(2,047,780
|
)
|
||||
|
Retained earnings /(deficit)
|
(53,795,733
|
)
|
(52,009,459
|
)
|
||||
|
Total equity attributable to Parent
|
$
|
8,064,746
|
$
|
7,359,121
|
||||
|
Non-controlling interest
|
$
|
-
|
$
|
(8,836
|
)
|
|||
|
Total stockholders' equity
|
$
|
8,064,746
|
$
|
7,350,285
|
||||
|
Total liabilities and stockholders' equity
|
$
|
10,853,096
|
$
|
11,284,302
|
||||
The accompanying notes should be read in connection with these consolidated financial statements.
|
India Globalization Capital, Inc.
|
|
(All amounts in USD)
|
|
|
Years Ended March 31,
|
|||||||||||||||||||||||
|
|
2018
|
2017
|
||||||||||||||||||||||
|
|
IGC
|
Non-controlling interest
|
Total
|
IGC
|
Non-controlling interest
|
Total
|
||||||||||||||||||
|
Net income/(loss)
|
$
|
(1,786,274
|
)
|
$
|
-
|
$
|
(1,786,274
|
)
|
$
|
(1,867,260
|
)
|
$
|
14,399
|
$
|
(1,852,861
|
)
|
||||||||
|
Foreign currency translation adjustments
|
(8,776
|
)
|
-
|
(8,776
|
)
|
221,577
|
-
|
221,577
|
||||||||||||||||
|
Comprehensive income/(loss)
|
$
|
(1,795,050
|
)
|
$
|
-
|
$
|
(1,795,050
|
)
|
$
|
(1,645,683
|
)
|
$
|
14,399
|
$
|
(1,631,284
|
)
|
||||||||
The accompanying notes should be read in connection with these consolidated financial statements.
India Globalization Capital, Inc.
(All amounts in USD, except share data)
|
|
Number of Shares
|
Amount
|
Additional Paid in Capital
|
Accumulated Earnings/ (Deficit)
|
Accumulated Other Comprehensive Income/(loss)
|
Non-Controlling Interest
|
Total Stockholders' Equity
|
|||||||||||||||||||||
|
Balances as of March 31, 2016
|
23,265,531
|
$
|
2,327
|
$
|
65,885,243
|
$
|
(50,142,199
|
)
|
$
|
(2,269,357
|
)
|
$
|
472,057
|
$
|
13,948,071
|
|||||||||||||
|
Bricoleur Note penalty shares
|
333,956
|
33
|
129,783
|
-
|
-
|
-
|
129,816
|
|||||||||||||||||||||
|
ATM sales
|
1,697,021
|
169
|
641,995
|
-
|
-
|
-
|
642,164
|
|||||||||||||||||||||
|
ESOP shares
|
1,270,000
|
127
|
203,073
|
-
|
-
|
-
|
203,200
|
|||||||||||||||||||||
|
Acquisition of Brilliant Hallmark
|
4,000,000
|
400
|
1,832,923
|
-
|
-
|
-
|
1,833,323
|
|||||||||||||||||||||
|
ESOP, IR, consultancy
|
340,000
|
34
|
63,366
|
-
|
-
|
-
|
63,400
|
|||||||||||||||||||||
|
Loss on foreign currency translation
|
-
|
-
|
-
|
-
|
221,577
|
1,345
|
222,922
|
|||||||||||||||||||||
|
Non-controlling interest adjustment
|
-
|
-
|
-
|
-
|
-
|
14,399
|
14,399
|
|||||||||||||||||||||
|
Net income/(loss)
|
-
|
-
|
-
|
(1,867,260
|
)
|
-
|
-
|
(1,867,260
|
)
|
|||||||||||||||||||
|
H&F Ironman and IGC International
|
(2,633,841
|
)
|
(263
|
)
|
(7,342,850
|
)
|
-
|
-
|
(496,637
|
)
|
(7,839,750
|
)
|
||||||||||||||||
|
Balances as of March 31, 2017
|
28,272,667
|
$
|
2,827
|
$
|
61,413,533
|
$
|
(52,009,459
|
)
|
$
|
(2,047,780
|
)
|
$
|
(8,836
|
)
|
$
|
7,350,285
|
||||||||||||
|
Bricoleur Note penalty shares
|
360,000
|
36
|
191,064
|
-
|
-
|
-
|
191,100
|
|||||||||||||||||||||
|
ATM sales
|
4,851,531
|
485
|
3,739,121
|
-
|
-
|
-
|
3,739,606
|
|||||||||||||||||||||
|
Common stock issued to employees
|
1,179,994
|
118
|
306,680
|
-
|
306,798
|
|||||||||||||||||||||||
|
Cancellation of shares of Brilliant Hallmark
|
(4,000,000
|
)
|
(400
|
)
|
1,879,600
|
)
|
-
|
-
|
-
|
(1,880,000
|
)
|
|||||||||||||||||
|
Share based compensation & options to advisors
|
-
|
-
|
352,240
|
-
|
-
|
-
|
352,240
|
|||||||||||||||||||||
|
Loss on foreign currency translation
|
-
|
-
|
-
|
-
|
(8,776
|
)
|
-
|
(8,776
|
)
|
|||||||||||||||||||
| Net Income for non-controlling interest | - | - | - | - | - | - | - | |||||||||||||||||||||
|
Non-controlling interest adjustment
|
-
|
-
|
-
|
-
|
-
|
8,836
|
8,836
|
|||||||||||||||||||||
|
Net income/(loss)
|
-
|
-
|
-
|
(1,786,274
|
)
|
-
|
-
|
(1,786,274
|
)
|
|||||||||||||||||||
|
Payment for acquisition of patent
|
100,000
|
10
|
41,990
|
-
|
-
|
-
|
42,000
|
|||||||||||||||||||||
|
Expenses related to issuance of stock
|
-
|
-
|
(251,069
|
)
|
-
|
-
|
-
|
(251,069
|
)
|
|||||||||||||||||||
|
Balances as of March 31, 2018
|
30,764,192
|
$
|
3,076
|
$
|
63,913,959
|
$
|
(53,795,733
|
)
|
$
|
(2,056,556
|
)
|
$
|
-
|
$
|
8,064,746
|
|||||||||||||
The accompanying notes should be read in connection with these consolidated financial statements.
|
India Globalization Capital, Inc.
|
|
|
|
(All amounts in USD)
|
|
|
Years Ended March 31,
|
|||||||
|
|
2018
|
2017
|
||||||
|
Cash flows from operating activities:
|
||||||||
|
Net income/(loss)
|
$
|
(1,786,274
|
)
|
$
|
(1,852,861
|
)
|
||
|
Adjustment to reconcile net income/(loss) to net cash:
|
||||||||
|
Deferred taxes
|
-
|
18,968
|
||||||
|
Depreciation
|
19,414
|
396,346
|
||||||
|
Write back of liability (net)
|
(1,508
|
)
|
(34,367
|
)
|
||||
|
Bad debts and provision for bad debts
|
15,614
|
6,980
|
||||||
|
Loss from investments/joint venture/associates
|
-
|
932
|
||||||
|
Profit from investments/joint venture/associates
|
-
|
(317,742
|
)
|
|||||
|
Non-cash interest expenses
|
-
|
129,816
|
||||||
|
Share based compensation expenses
|
576,251
|
250,600
|
||||||
|
Changes in:
|
||||||||
|
Accounts receivable
|
(33,768
|
)
|
(144,711
|
)
|
||||
|
Inventories
|
(424,710
|
)
|
||||||
|
Other current & non-current assets
|
65,206
|
(83,288
|
)
|
|||||
|
Trade payables
|
(12,544
|
)
|
191,044
|
|||||
|
Other current & non-current liabilities
|
(348,759
|
)
|
47,206
|
|||||
|
Net cash provided/(used) in operating activities
|
$
|
(1,931,078
|
)
|
$
|
(1,391,077
|
)
|
||
|
|
||||||||
|
Cash flow from investing activities:
|
||||||||
|
Proceeds from short term investment
|
-
|
(95,677
|
)
|
|||||
|
Purchase/addition of property and equipment
|
(135,731
|
)
|
(145,677
|
)
|
||||
|
Deconsolidation adjustment
|
(456,556
|
)
|
-
|
|||||
|
Payment for acquisition and filing of patents
|
(64,826
|
)
|
-
|
|||||
|
Net cash provided/(used) by investing activities
|
$
|
(657,113
|
)
|
$
|
(241,354
|
)
|
||
|
Cash flows from financing activities:
|
||||||||
|
Issuance of equity stock
|
3,739,606
|
642,164
|
||||||
|
Net proceeds/(repayment) from long-term borrowing
|
-
|
(476,190
|
)
|
|||||
|
Expenses for raising fund & issue of stock
|
(251,068
|
)
|
-
|
|||||
|
Non-cash interest/penalty expenses
|
191,100
|
-
|
||||||
|
Deconsolidation adjustment
|
-
|
(137,292
|
)
|
|||||
|
Net proceeds from loan
|
35,274
|
678,882
|
||||||
|
Net cash provided/(used) by financing activities
|
$
|
3,714,912
|
$
|
707,564
|
||||
|
Effects of exchange rate changes on cash and cash equivalents
|
(6,254
|
)
|
(27,797
|
)
|
||||
|
Net increase/(decrease) in cash and cash equivalents
|
1,120,467
|
(952,664
|
)
|
|||||
|
Cash and cash equivalent at the beginning of the period
|
538,029
|
1,490,693
|
||||||
|
Cash and cash equivalent at the end of the period
|
$
|
1,658,496
|
$
|
538,029
|
||||
|
|
||||||||
|
Supplementary information:
|
||||||||
|
Cash paid for interest
|
$
|
30,742
|
$
|
119,687
|
||||
|
Cash paid for taxes
|
$
|
-
|
$
|
14,431
|
||||
|
Non-cash items:
|
||||||||
|
Common stock issued as penalty on notes payable
|
$
|
191,100
|
$
|
129,816
|
||||
|
Common stock issued including ESOP, consultancy, patent acquisition, etc.
|
701,038
|
$
|
266,600
|
|||||
|
Supplementary information for non-cash financing activities
|
||||||||
|
Investment in Brilliant Hallmark
|
$
|
-
|
1,833,323
|
|||||
The accompanying notes should be read in connection with these consolidated financial statements.
India Globalization Capital, Inc.
For Fiscal Years Ended March 31, 2018 and 2017
Unless the context requires otherwise, all references in this report to “IGC,” “we,” “our” and “us” refer to India Globalization Capital, Inc., together with our subsidiaries.
NOTE 1 – BUSINESS ORGANIZATION AND CORPORATE UPDATE
a)
Business
IGC’s specialty alternative medicine business line commenced in late 2013 and includes eight patent filings with a lead, market-ready product called "Hyalolex
tm
." In studies, the active ingredients in Hyalolex
tm
, a unique formulation that utilizes micro non-toxic doses of cannabinoids in combination with other natural ingredients, has been shown to help alleviate symptoms of Alzheimer’s. IGC's product portfolio also include compounds intended to treat end points of Parkinson’s, pain, nausea, eating disorders, and epilepsy in dogs and cats. The Company has a legacy infrastructure commodity trading and heavy equipment rental business platform located in India and Hong Kong.
b)
Business Organization
IGC is a Maryland corporation formed in April 2005. The Company’s principal office in the U.S. is in Bethesda, Maryland, and in addition, it has a facility in Washington State. IGC’s back office is located in Kochi, Kerala India and many of the staff and advisors work from their home offices. The Company maintains a main website at http://www.igcinc.us and the corporate telephone number is +1-301-983-0998. The information contained on our websites,
www.igcinc.us
,
www.igcpharma.com
, and
www.hyalolex.com
, is not incorporated by reference in this report, and you should not consider it a part of this report.
As of March 31, 2018, the Company has operational subsidiaries located in India and Hong Kong with the subsidiary in Malaysia held for sale. The Company’s filings are available on
www.sec.gov
.
For more on corporate history, please check the website at
www.igcinc.us/igcpharma.com/companyoverview
.
c)
Corporate update
In February 2016, IGC acquired Cabaran Ultima Sdn. Bhd., a corporation organized and existing under the laws of Malaysia, from RGF Land Sdn. Bhd. in exchange of 998,571 shares of IGC’s common stock valued at $169,757 on closing date of the Share Purchase Agreement. We decided to exit the business at the end of March 2018 and expect to sell the subsidiary in the fiscal year 2019. As of March 31, 2018, we accounted the investment in Cabaran Ultima as “Investment Held for Sale” in the amount of $147,500.
In April 2017, we closed a non-operational Hong Kong based subsidiary that we incorporated in January 2013 named IGC Cleantech Ltd (“IGC-CT”). In November 30, 2017, TBL beneficially incorporated IGC Enterprises Ltd (“IGC-ENT”) in Hong Kong to keep conducting the commodity trading businesses, but from a more tax efficient structure. IGC-ENT reported $1.79 million in revenue in the fiscal year 2018.
In May 2017, the Company acquired exclusive rights to a patent filed by the University of South Florida titled “Cannabidiol and Synthetic Dronabinol for treatment of Alzheimer’s Disease.”
In the fiscal year 2018 the Company announced plans to build meaningful solutions to address issues facing the cannabis industry using distributed ledgers inherent in blockchain technology. These would include addressing issues such as product identification assurance (PIA) and product origin assurance, transactional difficulties, and inadequate product labeling. According to a recent study that was published in JAMA and detailed on
www.pennmedicine.org
, nearly 70% of all cannabidiol products sold online are either over or under labeled.
d)
Basis of Presentation and Preparation
The accompanying consolidated financial statements include the accounts of the Company. Intercompany accounts and transactions have been eliminated. In the opinion of the Company’s management, the consolidated financial statements reflect all adjustments, which are normal and recurring in nature, necessary for fair financial statement presentation. The preparation of these consolidated financial statements in conformity with U.S. generally accepted accounting principles (“GAAP”) requires management to make estimates and assumptions that affect the amounts reported in these consolidated financial statements and accompanying notes. Actual results could differ materially from those estimates.
e)
Company’s Fiscal Year
The Company’s fiscal year is the 52 or 53-week period that ends on the last day of March. The Company’s fiscal year 2018 consists of the 52 weeks ended on March 31, 2018. Unless otherwise stated, references to particular years, quarters, months and periods refer to the Company’s fiscal years ended in March and the associated quarters, months and periods of those fiscal years.
d)
Company’s Securities and Listings
We have one security listed on the NYSE American: Common Stock, $.0001 par value (ticker symbol: IGC) (“Common Stock”). This security is also available for trading on the Frankfurt, Stuttgart, and Berlin stock exchanges (ticker symbol: IGS1). We have redeemable warrants listed on the OTC markets (ticker symbol: IGC.WT. CUSIP number 45408X118 expiring on March 6, 2019) to purchase Common Stock.
We have Units consisting of one share of Common Stock and two redeemable warrants to purchase Common Stock that are not listed. The Unit holders are requested to contact the Company to get their existing Units separated into Common Stock and Warrants. The Company’s outstanding warrants are exercisable and may be exercised by contacting IGC or the transfer agent, Continental Stock Transfer & Trust Company. The Company has a right to call the warrants, provided the Common Stock has traded at a closing price of at least $8.50 per share for any 20 trading days within a 30-trading day period ending on the third business day prior to the date on which notice of redemption is given. If the Company calls the warrants, either the holder will have to exercise the warrants by purchasing the Common Stock from the Company for $5.00 or the warrants will expire. In accordance with the terms of the outstanding warrant agreements between the Company and its warrant holders, the Company in its sole discretion may lower the price of its warrants at any time prior to their expiration date.
e)
Securities Update
On May 20, 2016, IGC entered into an At The Market (“ATM”) Agency Agreement with IFS Securities, Inc. (dba Brinson Patrick, a division of IFS Securities, Inc.) to offer and sell shares of our common stock having an aggregate offering price of up to $10 million from time to time through Brinson Patrick. During fiscal year 2017 and up to October 2017, the Company issued a total of 1,697,021 and 2,305,812 shares of common stock valued at $642,164 and $1,031,656 , respectively. On December 20, 2017, we entered into an At-the-Market Offering Agreement with The Benchmark Company LLC and Joseph Gunnar & Co., LLC, pursuant to which the Managers acted as the Company's sales agents with respect to the issuance and sale of up to $10,000,000 of the Company's shares of common stock, par value $0.0001 per share (the "Shares"), from time to time in an at-the-market public offering (the "Offering"). As of March 31, 2018, the Company has issued an aggregate 2,545,719 shares of common stock valued at $2,707,950.
Under the December 18, 2014 Purchase Agreement with Apogee, we issued to Apogee 1,200,000 shares of IGC’s common stock, valued at $888,000 for the purchase of 24.9% ownership interest in Midtown Partners & Co., LLC. The Purchase Agreement expired, and the Company is pursuing its rights under the terms of the Purchase Agreement to recover certain damages.
Under the February 11, 2016 Purchase Agreement with Cabaran Ultima, we issued 998,571 shares of IGC’s common stock valued at $169,757 for the purchase of 100% ownership interest in Ultima. We decided to exit the business at the end of March 2018 and sell Cabaran. This entity is held for sale.
For a description of the Bricoleur Partners, L.P. loan and shares issued to Bricoleur please see Note 7 Notes Payable and Loans-Others.
As previously reported, in August 2016, we subscribed to 10% of Brilliant Hallmark, Sdn. Bhd. a corporation organized and existing under the laws of Malaysia (“Brilliant”) by issuing 4,000,000 shares of IGC’s common stock with a fair market value of $1,880,000. On April 3, 2017, IGC sold back its ten percent holding in Brilliant Hallmark for a consideration of 4,000,000 shares of IGC’s Common Stock that were returned and retired, thereby reducing the outstanding IGC common stock. The Brilliant Hallmark investment reduced our balance sheet by $1.88 million, once the IGC common stock that we received in exchange for the asset, was retired. The Company did not record a gain or loss from this transaction.
As of March 31, 2018, the Company has 99,227 Units and 30,764,192 shares of Common Stock issued and outstanding. In addition, the Company has 11,656,668 outstanding public Warrants to purchase 1,165,667 shares of common stock at $50.00 a share, which trade on the OTC markets and are set to expire on March 6, 2019. In fiscal years 2018 and 2017, to attract and retain our advisors, we issued 490,000 and 160,000 stock options, respectively, at a weighted average exercise price of $0.34 and expiring in 2023. For more information please see “Note 16. Stock – Based Compensation” in our Consolidated Financial Statements contained herein in Part II, Item 8
.
f)
List of Subsidiaries
The table below lists our subsidiaries.
|
Subsidiaries (3)
|
|
Immediate
holding company
|
|
Country of
Incorporation
|
|
Percentage of holding
as of March 31, 2018
|
|
|
Percentage of holding
as of March 31, 2017
|
|
||
|
IGC – Mauritius
(“IGC-M”)
|
|
IGC
|
|
Mauritius
|
100
|
100
|
|
|||||
|
Techni Bharathi Private Limited
(“TBL”)
|
|
IGC-M
|
|
India
|
0
|
100
|
|
|||||
|
Techni Bharathi Private Limited
(“TBL”)
|
|
IGC
|
|
India
|
100
|
0
|
||||||
|
India Mining and Trading Private Limited
(“IGC-IMT”)
|
|
IGC-M
|
|
India
|
100
|
100
|
|
|||||
|
IGC Materials Private Limited
(“IGC-MPL”)
|
|
IGC-M
|
|
India
|
100
|
100
|
|
|||||
|
IGC Logistic Private Limited
(“IGC-LPL”)
|
|
IGC-M
|
|
India
|
100
|
100
|
|
|||||
|
IGC Cleantech Limited
(“IGC-CT”)
|
|
IGC-M
|
|
Hong Kong
|
0
|
100
|
|
|||||
|
IGC Enterprises Limited
(“IGC-ENT”) (1)
|
TBL
|
Hong Kong
|
100
|
0
|
|
|||||||
|
Cabaran Ultima Sdn. Bhd.,
(“Ultima”) (2)
|
|
IGC
|
|
Malaysia
|
100
|
100
|
|
|||||
|
RGF Cabaran Sdn. Bhd. (“RGF”)
|
|
Ultima
|
|
Malaysia
|
0
|
51
|
|
|||||
|
RGF Construction Sdn. Bhd.
|
|
RGF
|
|
Malaysia
|
0
|
75
|
|
|||||
|
(1)
|
Beneficially owned by Techni Bharathi Private Limited (“TBL”)
|
|
(2)
|
Cabaran Ultima is recorded as investment held for sale in the balance sheet for the year ended March 31, 2018. Hence, it is not consolidated.
|
|
(3)
|
IGC-M, IGC-IMT, IGC-LPL, IGC-MPL are non-operating subsidiaries and don’t have a material impact on the balance sheet or statement of operations.
|
NOTE 2 – SUMMARY OF SIGNIFICANT ACCOUNTING POLICIES
a) Principles of consolidation
The consolidated financial statements include the accounts of the Company and all of its subsidiaries that are more than 50% owned and controlled. The financial statements of the parent company and its majority owned or controlled subsidiaries have been combined on a line by line basis by adding together the book values of all items of assets, liabilities, incomes and expenses after eliminating all inter-company balances and transactions and resulting unrealized gain or loss. Operating results of companies acquired are included from the dates of acquisition. Transactions between the Company and its subsidiaries are eliminated in the consolidated financial statements.
b) Non-controlling interests
Non-controlling interests in the Company’s consolidated financial statements result from the accounting for non-controlling interests in its subsidiaries. Non-controlling interests represent the subsidiaries’ earnings and components of other comprehensive income that are attributed to the non-controlling parties’ equity interests. The non-controlling interest disclosed in the accompanying financial statements for fiscal year 2017 represented the non-controlling interest in Cabaran Ultima’s subsidiaries and the profits or losses associated with the non-controlling interest in those operations. As of the year end March 31, 2018, IGC does not have any non- controlling interest in its books of accounts.
c) Reclassifications
In the fiscal year 2018, land owned by IGC’s wholly owned subsidiary Techni Bharathi Private Limited in Nagpur, India, previously recorded as investment under non-current asset, has been reclassified as Property, Plant and Equipment under non-current assets as we are pursuing options to monetize this asset. In the fiscal year 2018, $1.8 million Note Payable was reclassified to current liabilities from non-current liabilities. Please see “Note 25 – Subsequent Event” in Part II, Item 8 in our Consolidated Financial Statements contained herein for more information.
d) Use of estimates
The preparation of financial statements in conformity with accounting principles generally accepted in the United States of America (U.S. GAAP) requires management to make estimates and assumptions that affect the reported amounts of assets and liabilities and disclosure of contingent assets and liabilities at the date of the financial statements and the reported amounts of revenue and expenses during the reporting period. Actual results could differ from those estimates.
Management believes that the estimates and assumptions used in the preparation of the consolidated financial statements are prudent and reasonable. Significant estimates and assumptions are used for, but not limited to: allowance for uncollectible accounts receivable; future obligations under employee benefit plans; the useful lives of property, plant, equipment; intangible assets; the valuation of assets and liabilities acquired in a business combination; impairment of goodwill and investments; recoverability of advances; the valuation of options granted and warrants issued; and income tax and deferred tax valuation allowances. Actual results could differ from those estimates. Appropriate changes in estimates are made as management becomes aware of changes in circumstances surrounding the estimates. Critical accounting estimates could change from period to period and could have a material impact on IGC’s results, operations, financial position and cash flows. Changes in estimates are reflected in the financial statements in the period in which changes are made and, if material, their effects are disclosed in the notes to the consolidated financial statements.
e) Revenue recognition
IGC recognizes revenue when persuasive evidence of an arrangement exists, delivery has occurred, the sales price is fixed or determinable, and collectability of the sales price is reasonably assured. Revenue from sale of goods is recognized when substantial risks and rewards of ownership are transferred to the buyer under the terms of the contract.
In May 2014, the FASB issued ASU No. 2014-09, Revenue from Contracts with Customers, which requires an entity to recognize the amount of revenue to which it expects to be entitled for the transfer of promised goods or services to customers. The ASU will replace most existing revenue recognition guidance in GAAP and is effective on January 1, 2017. The standard permits the use of either the retrospective or cumulative effect transition method. The Company is evaluating the effect that ASU 2014-09 will have on its consolidated financial statements and related disclosures. The Company has not yet selected a transition method nor has it determined the effect of the standard on its financial statements.
f) Basic and diluted loss per share
In accordance with ASC Topic 280 – "Earnings Per Share", the basic loss per common share is computed by dividing net loss available to common stockholders by the weighted average number of common stock outstanding. Diluted loss per common share is computed similar to basic loss per common share except that the denominator is increased to include the number of additional shares of common stock that would have been outstanding if the potential common stock had been issued and if the additional shares of common stock were dilutive.
Potential common stock consists of the incremental common stock issuable upon the exercise of common stock warrants (using the if-converted method). The computation of basic loss per share for the year ended March 31, 2018 excludes potentially dilutive securities of 1,836,335 shares underlying share purchase warrants, options, and convertible notes, because their inclusion would be antidilutive. As a result, the computations of net loss per share for each period presented is the same for both basic and fully diluted. Please refer “Note – 20, Reconciliation of EPS” for more information.
g) Income taxes
The Company accounts for income taxes under the asset and liability method, in accordance with ASC 740, Income Taxes, which requires an entity to recognize deferred tax liabilities and assets. Deferred tax assets and liabilities are recognized for the future tax consequence attributable to the differences between the financial statement carrying amounts of existing assets and liabilities and their tax bases and operating loss and tax credit carry forwards. Deferred tax assets and liabilities are measured using the enacted tax rate expected to apply to taxable income in the years in which those temporary differences are expected to be recovered or settled. The effect on deferred tax assets and liabilities of a change in tax rates is recognized in income in the period that included the enactment date. A valuation allowance is established and recorded when management determines that some or all of the deferred tax assets are not likely to be realized and therefore, it is necessary to reduce deferred tax assets to the amount expected to be realized.
In evaluating a tax position for recognition, management evaluates whether it is more-likely-than-not that a position will be sustained upon examination, including resolution of related appeals or litigation processes, based on technical merits of the position. If the tax position meets the more-likely-than-not recognition threshold, the tax position is measured and recognized in the Company’s financial statements as the largest amount of tax benefit that, in management’s judgment, is greater than 50% likely of being realized upon settlement. As of March 31, 2018, and 2017, there was no significant liability for income tax associated with unrecognized tax benefits.
h) Cash and cash equivalents
For financial statement purposes, the Company considers all highly liquid debt instruments with maturity of three months or less, to be cash equivalents. The Company maintains its cash in bank accounts in the United States of America, Mauritius, India, Hong Kong, and Malaysia, which at times may exceed applicable insurance limits.
i) Foreign currency transactions
IGC operates in India, Hong Kong and Malaysia and a substantial portion of the Company’s sales are denominated in INR, HKD and RM, as of those respective operations. As a result, changes in the relative values of the U.S. dollar and the INR, the HKD or the RM affect revenues and profits as the results are translated into U.S. dollars in the consolidated and pro forma financial statements.
The accompanying financial statements are reported in U.S. dollars. The INR, HKD, and the RM are the functional currencies for the Company. The translation of the functional currencies into U.S. dollars is performed for assets and liabilities using the exchange rates in effect at the balance sheet date and for revenues, costs and expenses using average exchange rates prevailing during the reporting periods. Adjustments resulting from the translation of functional currency financial statements to reporting currency are accumulated and reported as other comprehensive income/(loss), a separate component of shareholders’ equity. The exchange rates used for translation purposes are as follows:
|
|
|
|
|
Period End Average Rate
|
|
|
|
Period End Rate
|
|
||||||||
|
Period
|
|
|
|
(P&L rate)
|
|
|
|
(Balance sheet rate)
|
|
||||||||
|
Year ended March 31, 2018
|
|
INR
|
|
64.46
|
|
per
|
|
USD
|
|
INR
|
|
65.11
|
|
per
|
|
USD
|
|
|
|
|
|
|
|
|
|
|
|
|
||||||||
|
|
|
HKD
|
|
7.55
|
|
per
|
|
USD
|
|
HKD
|
|
7.85
|
|
per
|
|
USD
|
|
|
|
|
RM
|
|
4.17
|
|
per
|
|
USD
|
|
RM
|
|
3.86
|
|
per
|
|
USD
|
|
|
|
|
|
|
|
|
|
|
|
|
|
|
|
|
|
|
|
|
|
Year ended March 31, 2017
|
|
INR
|
|
67.01
|
|
per
|
|
USD
|
|
INR
|
|
64.85
|
|
per
|
|
USD
|
|
|
|
|
RMB
|
|
6.69
|
|
per
|
|
USD
|
|
RMB
|
|
6.95
|
|
per
|
|
USD
|
|
|
|
|
HKD
|
|
7.76
|
|
per
|
|
USD
|
|
HKD
|
|
7.77
|
|
per
|
|
USD
|
|
|
|
|
RM
|
|
4.20
|
|
per
|
|
USD
|
|
RM
|
|
4.42
|
|
per
|
|
USD
|
|
j) Accounts receivable
Accounts receivable from customers in the renting and trading business were recorded at the invoiced amount, taking into consideration any adjustments made for returns. Also, the Company evaluates the collectability of selected accounts receivable on a case-by-case basis and makes adjustments to the bad debt reserve for expected losses. For all other accounts, the Company estimates reserves for bad debts based on general aging, experience and past-due status of the accounts. When applicable, the Company maintains an allowance for doubtful accounts for estimated losses resulting from the inability of clients to make required payments. The allowance for doubtful accounts is determined by evaluating the relative credit worthiness of each client, historical collections experience and other information, including the aging of the receivables. If circumstances related to customers change, estimates of recoverability would be further adjusted.
Regarding our collection policy on commodity trading receivables, there are three types of trades: (1) payment guaranteed through letters of credit, (2) deposit or spot payment on delivery or (3) delivery on credit. With the first type of trade: our policy for collection was to ask the customer to open a letter of credit with a bank. The typical terms of the letter of credit were that 100% of the payment was made when the material was shipped. With the second type of trade, customers paid on delivery. On the third type of trade, our policy was to allow the customer to have a payment credit term of 90 days.
k)
Short-term and long-term investments
Our policy for short-term and long-term investments is to establish a high-quality portfolio that preserves principal, meets liquidity needs, avoids inappropriate concentrations and delivers an appropriate yield in relationship to our investment guidelines and market conditions. Short-term and long-term investments consist of corporate, various government agency and municipal debt securities, as well as certificates of deposit that have maturity dates that are greater than 90 days. Certificates of deposit and commercial paper are carried at cost which approximates fair value. We classify our marketable securities as available-for-sale in accordance with FASB ASC Topic 320, “Investments — Debt and Equity Securities”. Available-for-sale securities are carried at fair value with unrealized gains and losses reported in stockholders’ equity, net of related tax effects.
We have recorded our investment in Cabaran Ultima as “Investment held for sale” in the amount of $147,500. Management expects to sell 100% of its stake in Cabaran Ultima in the fiscal year 2019.
Other Investments are initially measured at cost, which is the fair value of the consideration given for them, including transaction costs. The Company’s equity in the earnings/(losses) of affiliates is included in the statement of income and the Company’s share of net assets of affiliates is included in the balance sheet. Where the Company’s ownership interest is in excess of 20% and the Company enjoys significant interest, the Company has accounted for the investment based on the equity method. In the fiscal year 2018, the Company concluded that it does not have significant influence over Midtown Partner LLC (“MTP”). Hence, we did not reflect any changes in MTP’s earnings/(losses) in our books. The investment is valued at the same value as in 2017.
l) Property, plant and equipment (PP&E)
Property and equipment are recorded at cost net of accumulated depreciation and depreciated over their estimated useful lives using the straight-line method. The estimated useful lives of assets are as follows:
|
Land
|
More than 100 years
|
|
Buildings
|
5-25 years
|
|
Plant and machinery
|
10-20 years
|
|
Computer equipment
|
3-5 years
|
|
Office equipment
|
3-5 years
|
|
Furniture and fixtures
|
5-10 years
|
|
Vehicles
|
5-10 years
|
|
Working Facility
|
10-20 years
|
Upon retirement or disposition, cost and related accumulated depreciation of the property and equipment are de-recognized from the books of accounts and the gain or loss is reflected in the results of operation. Cost of additions and substantial improvements to property and equipment are capitalized in the books of accounts. The cost of maintenance and repairs of the property and equipment are charged to operating expenses as incurred.
m) Fair value of financial instruments
FASB ASC No. 820, “Fair Value Measurement” defines fair value as the exchange price that would be received for an asset or paid to transfer a liability (an exit price) in the principal or most advantageous market for the asset or liability in an orderly transaction between market participants on the measurement date. It also establishes a three-tier fair value hierarchy, which prioritizes the inputs used in measuring fair value as follows:
Level 1: Observable inputs such as quoted prices in active markets;
Level 2: Inputs, other than the quoted prices in active markets, that are observable either directly or indirectly; and
Level 3: Unobservable inputs in which there is little or no market data, which require the reporting entity to develop its own assumptions.
As of March 31, 2018, and 2017, the carrying amounts of the Company’s financial instruments, which included cash and cash equivalents, accounts receivable, unbilled accounts receivable, restricted cash, accounts payable, accrued employee compensation and benefits and other accrued expenses, approximate their fair values due to the nature of the items.
n) Concentration of credit risk and significant customers
Financial instruments, which potentially expose the Company to concentrations of credit risk, are primarily comprised of cash and cash equivalents, investments, derivatives, accounts receivable and unbilled accounts receivable. The Company places its cash, investments and derivatives in highly rated financial institutions. The Company adheres to a formal investment policy with the primary objective of preservation of principal, which contains credit rating minimums and diversification requirements. Management believes its credit policies reflect normal industry terms and business risk. The Company does not anticipate non-performance by the counterparties and, accordingly, does not require collateral. During the fiscal year 2018, sales were spread across customers in Asia and the credit concentration risk is low.
o)
Segment information
FASB ASC No. 280, “Segment Reporting” establishes standards for reporting information about reportable segments. Operating segments are defined as components of an enterprise about which separate financial information is available that is evaluated regularly by the chief operating decision maker, or decision-making group (“CODM”), in deciding how to allocate resources and in assessing performance. The CODM evaluates revenues and gross profits based on product lines and routes to market. Based on our integration and management strategies, we operate in two reportable segments:
legacy infrastructure and specialty alternative medicine.
p) Employee benefits plan
In the United States, we provide health insurance, life insurance, and a 401-K plan wherein the Company matches up to 6% of the employee’s pretax contribution up a maximum of $18,000. In accordance with applicable Indian laws, the Company provides for gratuity, a defined benefit retirement plan (Gratuity Plan) covering certain categories of employees. The Gratuity Plan provides a lump sum payment to vested employees, at retirement or termination of employment, an amount based on the respective employee’s last drawn salary and the years of employment with the Company. In addition, all employees receive benefits from a provident fund, a defined contribution plan. The employee and employer each make monthly contributions to the plan equal to 12% of the covered employee’s salary. The contribution is made to the Government’s provident fund.
q) Commitments and contingencies
Liabilities for loss contingencies arising from claims, assessments, litigations, fines and penalties and other sources are recorded when it is probable that a liability has been incurred and the amount of the assessment and/or remediation can be reasonably estimated.
r)
Accounting for goodwill and related impairment
Goodwill represents the excess cost of an acquisition over the fair value of our share of net identifiable assets of the acquired subsidiary at the date of acquisition. Goodwill on acquisition of subsidiaries is disclosed separately. Goodwill is stated at cost less impairment losses incurred, if any.
The Company adopted the provisions of ASC 350, “Intangibles – Goodwill and Others” (previously referred to as SFAS No. 142, “Goodwill and Other Intangible Assets,” which sets forth the accounting for goodwill and intangible assets subsequent to their acquisition. ASC 350 requires that goodwill and indefinite-lived intangible assets be allocated to the reporting unit level, which the Company defines as each subsidiary. ASC 350 also prohibits the amortization of goodwill and indefinite-lived intangible assets upon adoption but requires that they be tested for impairment at least annually, or more frequently as warranted, at the reporting unit level. The Company does not have any goodwill on March 31, 2018.
The analysis of fair value is based on the estimate of the recoverable value of the underlying assets. For long-lived assets such as land, the Company obtains appraisals from independent professional appraisers to determine the recoverable value. For other assets such as receivables, the recoverable value is determined based on an assessment of the collectability and any potential losses due to default by the counter parties. Unlike goodwill, long-lived assets are assessed for impairment only where there are any specific indicators for impairment.
s) Impairment of long – lived assets
The Company reviews its long-lived assets, with finite lives, for impairment whenever events or changes in business circumstances indicate that the carrying amount of assets may not be fully recoverable. Such circumstances include, though are not limited to, significant or sustained declines in revenues or earnings, future anticipated cash flows, business plans and material adverse changes in the economic climate, such as changes in operating environment, competitive information and impact of changes in government policies. For assets that the Company intends to hold for use, if the total of the expected future undiscounted cash flows produced by the assets or subsidiary company is less than the carrying amount of the assets, a loss is recognized for the difference between the fair value and carrying value of the assets. For assets the Company intends to dispose of by sale, a loss is recognized for the amount by which the estimated fair value less cost to sell is less than the carrying value of the assets. Fair value is determined based on quoted market prices, if available, or other valuation techniques including discounted future net cash flows.
t) Recently issued and adopted accounting pronouncements
Changes to U.S. GAAP are established by the Financial Accounting Standards Board (“FASB”) in the form of accounting standards updates (“ASUs”) to the FASB’s Accounting Standards Codification. The Company considers the applicability and impact of all ASUs. Newly issued ASUs not listed below are expected to have no impact on the Company’s consolidated financial position and results of operations, because either the ASU is not applicable, or the impact is expected to be immaterial.
Recognition and Measurement of Financial Assets and Financial Liabilities:
In January 2016, the FASB issued Accounting Standards Update (ASU) No. 2016-01, Financial Instruments—Overall (Subtopic 825-10): Recognition and Measurement of Financial Assets and Financial Liabilities, which addresses certain aspects of recognition, measurement, presentation, and disclosure of financial instruments. This ASU requires entities to present separately in OCI the portion of the total change in the fair value of a liability resulting from a change in the instrument-specific credit risk (DVA) when the entity has elected to measure the liability at fair value in accordance with the fair value option for financial instruments. It will also require equity investments (except those accounted for under the equity method of accounting or those that result in consolidation of the investee) to be measured at fair value with changes in fair value recognized in net income, thus eliminating eligibility for the current available-for-sale category. The Company is evaluating the effect that ASU 2015-03 will have on its Consolidated Financial Statements.
Leases
: In February 2016, the FASB issued Accounting Standards Update No. 2016-02 (Topic 842) "Leases." Topic 842 supersedes the lease recognition requirements in Accounting Standards Codification (ASC) Topic 840, "Leases." Under Topic 842, lessees are required to recognize assets and liabilities on the balance sheet for most leases and provide enhanced disclosures. Leases will continue to be classified as either finance or operating. As currently issued, entities are required to use a modified retrospective approach for leases that exist or are entered into after the beginning of the earliest comparative period in the financial statements. There are additional optional practical expedients that an entity may elect to apply. We anticipate that the adoption of Topic 842 will materially affect our Consolidated Balance Sheets. We are in the process of implementing changes to our systems and processes in conjunction with our review of existing lease agreements. We will adopt Topic 842 effective January 1, 2019 and expect to elect certain available transitional practical expedients.
Income Tax
:
In October 2016, the FASB issued Accounting Standards Update No. 2016-16 (ASU 2016-16) "Income Taxes (Topic 740): Intra-Entity Transfers of Assets Other than Inventory." ASU 2016-16 generally accelerates the recognition of income tax consequences for asset transfers between entities under common control. Entities are required to adopt using a modified retrospective approach with a cumulative adjustment to open retained earnings in the year of adoption for previously unrecognized income tax expense. We adopted ASU 2016-16 effective January 1, 2018.
Intangibles-Goodwill and Other
:
In January 2017, the FASB issued Accounting Standards Update No. 2017-04 (ASU 2017-04) “Intangibles-Goodwill and Other (Topic 350): Simplifying the Test for Goodwill Impairment.” ASU 2017-04 eliminates step two of the goodwill impairment test and specifies that goodwill impairment should be measured by comparing the fair value of a reporting unit with its carrying amount. Additionally, the amount of goodwill allocated to each reporting unit with a zero or negative carrying amount of net assets should be disclosed. ASU 2017-04 is effective for annual or interim goodwill impairment tests performed in fiscal years beginning after December 15, 2019; early adoption is permitted. We currently do not anticipate that the adoption of ASU 2017-04 will have a material impact on our consolidated financial statements.
Stock Based Compensation
: In March 2016, the FASB issued ASU No. 2016-09, Compensation – Stock Compensation (Topic 718): Improvements to Employee Share-Based Payment Accounting (“ASU 2016-09”), which modifies certain aspects of the accounting for share-based payment transactions, including income taxes, classification of awards, and classification in the statement of cash flows. The Company will adopt ASU 2016-09 in its first quarter of 2018. Currently, excess tax benefits or deficiencies from the Company’s equity awards are recorded as additional paid-in capital in its Consolidated Balance Sheets. Upon adoption, the Company will record any excess tax benefits or deficiencies from its equity awards in its Consolidated Statements of Operations in the reporting periods in which vesting occurs. As a result, subsequent to adoption the Company’s income tax expense and associated effective tax rate will be impacted by fluctuations in stock price between the grant dates and vesting dates of equity awards.
NOTE 3 – ACQUISITIONS
Cabaran Ultima Sdn. Bhd.
On February 11, 2016, we completed the acquisition of 100% of the outstanding share capital of Cabaran Ultima Sdn. Bhd., a corporation organized and existing under the laws of Malaysia (“Ultima”). The purchase price of the acquisition consisted of 998,571 shares of our common stock, valued at approximately $169,757 on the closing date of the Share Purchase Agreement.
In 2017, the Company sold Brilliant Hallmark and therefore some of the real estate management business of Cabaran was curtailed. Hence, rather than look for new business opportunities, the IGC Board decided to exit the
real estate management industry and sell Cabaran. In fiscal year ended March 31, 2018, Cabaran is held for sale. The investment in Cabaran has been valued at $147,500 and the Company is confident that it can sell Cabaran for its carrying value.
NOTE 4 –
INVENTORY
|
|
As of March 31,
|
|||||||
|
|
2018
|
2017
|
||||||
|
WIP of components for Hyalolex
tm
|
$
|
486,497
|
-
|
|||||
|
Total
|
$
|
486,497
|
$
|
-
|
||||
The Company’s policy, consistent with ASC 300, is to book the cost of producing components and completed products as inventory. The products and its components have a dual purpose over the next 24 months: they will either be sold or used to demonstrate the product to various entities including dispensary owners, growers, processors, doctors, nurse practitioners, among others.
Management will evaluate the policy with regard to inventory periodically. We had
$486,497 of inventory and
no inventory
in the fiscal years ending 2018
and 2017, respectively.
NOTE 5 – OTHER CURRENT AND NON-CURRENT ASSETS
Prepaid expenses and other current assets consist of the following:
|
As of March 31,
|
||||||||
|
2018
|
2017
|
|||||||
|
Advance to suppliers & for services
|
$
|
298,853
|
$ |
240,968
|
||||
|
Statutory advances
|
44,439
|
14,216
|
||||||
|
Deposit and other current assets
|
11,349
|
155,224
|
||||||
|
Total
|
$
|
354,641
|
$
|
410,408
|
||||
Other Non-current assets consist of the following:
|
As of March 31,
|
||||||||
|
2018
|
2017
|
|||||||
|
Non-current deposits
|
$
|
18,051
|
-
|
|||||
|
Other advances
|
466,511
|
$
|
539,720
|
|||||
|
Total
|
$
|
484,562
|
$
|
539,720
|
||||
On May 21, 2012, TBL entered into an agreement with Weave & Weave for the purchase of land valued at $614,350. TBL gave Weave and Weave an advance of $376,286. As of the date of this filing, the parties are in the process of negotiating a settlement that includes the purchase and sale of land or the refund of the advance given by TBL. We believe the amount is recoverable.
NOTE 6 – INTENTIONALLY LEFT IN BLANK
NOTE 7 – NOTES PAYABLE AND LOANS - OTHERS
Since October 16, 2009, the Company has had a no-interest note with Bricoleur Partners, L.P. (‘Bricoleur’) in the amount of $1.8 million. The maturity date of the loan has been extended various times, and, as of March 31, 2018, Bricoleur’s position is that the loan is outstanding. From 2009 to March 31, 2018, the Company has paid shares for renewals and as a “penalty” for every month that the loan has been outstanding. From October 16, 2009 through March 31, 2018, the Company has issued approximately 1.9 million shares valued at approximately $2.7 million, based on the market value of the shares at each instance of issuance. According to the IRS rules these amounts are non-deductible for the Company. Since August 2016, the Company has issued 30,000 shares for every month the loan has been outstanding. In fiscal years 2017 and 2018, the Company issued a total of 333,956 and 360,000 shares valued at $129,816 and $191,100, respectively. In November 2017, the Company asked the shareholders to vote for a resolution that allowed the Company to deliver up to an additional 2,000,000 shares of the Company to Bricoleur. After several adjournments to garnish support from shareholders, this resolution failed to pass. Despite the categorization of the share issuances under the broad category of interest on past financial statements, the Company believes that these payments of shares constitute a repayment of debt, at least in substantial part. The Company expects to aggressively pursue this position. However, there can be no guarantee of success. Please see Note 25 – Subsequent Events for an update on the matter.
The Company’s total cash interest expense for the years ended March 31, 2018 and 2017 was $30,742 and $93,648. The cash interest in fiscal 2018 was reduced because we were able to repay some high interest loans.
As of March 31, 2018, the Company has four loans categorized as Loans Others from related parties totaling $427,500 at an average annual interest rate of 7.5%:
Loan 1: We have a loan from an individual for $50,000, at an annual interest rate of 15%, due February 23, 2022. There is no prepayment penalty. The assets of the Company secure the loan.
Loan 2: We have a loan of $70,000 from an affiliate of our CEO, at an annual interest rate of 15%, due February 23, 2022. There is no prepayment penalty. The assets of the Company secure the loan.
Loan 3: We have a working capital loan with a balance of $107,500 as of March 31, 2018, from an affiliate of our CEO, at an annual interest rate of zero percent, due February 23, 2022. There is no prepayment penalty. The assets of the Company secure the loan.
Loan 4: We have a working capital loan with a balance of $200,000 as of March 31, 2018, from the spouse of our CEO, at an annual interest rate of zero percent, due October 31, 2022. There is no prepayment penalty. The assets of the Company secure the loan.
NOTE 8 – OTHER CURRENT AND NON-CURRENT LIABILITIES
Other current liabilities consist of the following:
|
|
As of March 31,
|
|||||||
|
Particulars
|
2018
|
2017
|
||||||
|
Statutory payables
|
$
|
3,899
|
$
|
15,203
|
||||
|
Employee related liabilities
|
203,731
|
676,511
|
||||||
|
Accrued expenses
|
286,054
|
181,465
|
||||||
|
Total
|
$
|
493,684
|
$
|
873,179
|
||||
Employee related liabilities consists of unpaid salary payable to employees. Accrued expenses consist primarily of amounts payable against services related to audit, legal, marketing, etc., in the normal course of business.
Other non-current liabilities consist of the following:
|
As of March 31,
|
||||||||
|
|
2018
|
2017
|
||||||
|
Statutory reserve
|
$
|
14,896
|
$
|
-
|
||||
|
Total
|
$
|
14,896
|
$
|
-
|
||||
NOTE 9 – OTHER INCOME (NET) & INVESTMENTS / ASSOCIATES / JOINT VENTURES
The total other income for the fiscal years 2018 and 2017 is $3,143 and $215,955, respectively. In the fiscal year 2018, other income (net) consists of $30,742 interest paid for loans, $4,824 interest received from cash deposits, and $29,061 other income like rent and others. In the fiscal year 2017 other income (net) consists of $223,464 interest paid, $121,677 interest and other income received and $317,742 as one- time non-cash gain.
NOTE 10 – FAIR VALUE OF FINANCIAL INSTRUMENTS
The fair value of the Company’s current assets and current liabilities approximate their carrying value because of their short-term maturity. Such financial instruments are classified as current and are expected to be liquidated within the next twelve months.
NOTE 11 – INTANGIBLE ASSETS & GOODWILL
The movement in goodwill and intangible assets is given below:
|
As of March 31,
|
||||||||
|
2018
|
2017
|
|||||||
|
Intangible assets
|
$
|
-
|
$
|
113,321
|
||||
|
Amortization
|
-
|
(113,321
|
)
|
|||||
|
Cost of Patent Acquisition and Filing
|
127,826
|
-
|
||||||
|
Total Intangible assets
|
$
|
127,826
|
$
|
-
|
||||
|
Goodwill
|
-
|
198,169
|
||||||
|
Total Goodwill
|
$
|
-
|
$
|
198,169
|
||||
The value of intangible assets for the fiscal years 2018 and 2017 amounted to $127,826 and $Nil, respectively. The value of the intangibles includes the acquisition of patent rights, data, and the filing of patents. The amortization of intangibles is over 15 years. The amount of goodwill in fiscal 2017 is associated with Cabaran Ultima.
NOTE 12 – RELATED PARTY TRANSACTIONS
We pay an affiliate of our CEO $4,500 per month for office space and certain general and administrative services rendered in Maryland. In addition, we pay another affiliate of our CEO $6,100 per month for office and facilities in Washington State. We believe, based on rents and fees for similar services in the Washington, D.C. metropolitan area, and Washington State that the fee charged by the affiliates are at least as favorable as we could have obtained from an unaffiliated third party and these payments are not considered, or meant to be compensation to our CEO. The rental agreement for the Maryland location is on a month-to-month basis and may be terminated by our Board of Directors of the Company at any time without notice. The rental agreement for Washington State facilities expires on December 31, 2018 and may be renewed by mutual consent. During the fiscal year ended March 31, 2018, the total rent paid to the affiliates were $54,000 for the office space (and services) in Maryland, and $73,200, plus a one-time renewal fee of $106,283, for the facilities in Washington State. We expect that these expenses will remain at approximately this level during the fiscal year ending March 31, 2019. As of March 31, 2018, the Company has a net unpaid balance of $97,379 in compensation to our CEO.
Please refer to Note 7 for information about
Loans by Related Parties.
Loans to Related Parties
On April 30, 2015, , we loaned Apogee Financial Services $70,000 as working capital for Midtown partners. The loan is outstanding as of March 31, 2018.
NOTE 13 – COMMITMENTS AND CONTINGENCIES
No significant commitments or contingencies were made or existed during fiscal years 2018 or 2017.
NOTE 14 – PROPERTY, PLANT, AND EQUIPMENT
Property, plant, and equipment consist of the following:
|
As of March 31,
|
||||||||||||
|
Category
|
Useful Life (years)
|
2018
|
2017
|
|||||||||
|
Land
|
N/A
|
$
|
5,174,611
|
-
|
||||||||
|
Buildings & Facilities
|
25
|
954,801
|
$
|
241,181
|
||||||||
|
Plant and machinery
|
20
|
1,703,226
|
$
|
1,710,055
|
||||||||
|
Computer equipment
|
3
|
159,473
|
157,349
|
|||||||||
|
Office equipment
|
5
|
114,979
|
119,528
|
|||||||||
|
Furniture and fixtures
|
5
|
64,851
|
70,368
|
|||||||||
|
Vehicles
|
5
|
291,884
|
292,764
|
|||||||||
|
Facility under construction
|
N/A
|
374,045
|
957,880
|
|||||||||
|
Total
|
$
|
8,837,870
|
3,549,125
|
|||||||||
|
Less: Accumulated depreciation
|
$
|
(2,601,031
|
)
|
$
|
(2,595,189
|
)
|
||||||
|
Total Net PP&E
|
$
|
6,236,839
|
$
|
953,936
|
||||||||
Depreciation and amortization expense for the fiscal years ended March 31, 2018 and March 31, 2017 was $19,414 and $396,346, respectively. Capital work-in-progress represents advances paid towards the acquisition of property and equipment and the cost of property and equipment not used before the balance sheet date.
NOTE 15 – SELLING, GENERAL AND ADMINISTRATIVE EXPENSES
During the fiscal years 2018 and 2017, the Company recorded selling, general and administrative expenses of $1,870,477 and $2,271,690, respectively. Selling, general and administrative expenses consist of expenses related to public company, research and development, employee related expenses and depreciation.
NOTE 16 – STOCK-BASED COMPENSATION
As of March 31, 2018, a total of 1,455,000 shares of common stock have been awarded and there are no shares of common stock available for future grants of options or stock awards. As of March 31, 2018, we also have outstanding options to purchase 650,000 common stock, expiring between October 31, 2022 and October 31, 2023, with weighted average exercise price of $0.34 per share.
The fair value of options was valued at $0.2 million using a Black-Scholes Pricing Model with the following assumptions:
|
|
Granted in Fiscal 2018
|
|||
|
Expected life of options
|
7 years
|
|||
|
Vested options
|
100
|
%
|
||
|
Risk free interest rate
|
0.70
|
%
|
||
|
Expected volatility
|
119.5
|
%
|
||
|
Expected dividend yield
|
Nil
|
|||
Amounts recognized in the additional paid up capital with respect to our stock-based compensation plans and option-based compensation were as follows:
Stock-based compensation
|
Year ended March 31
|
||||||||
|
2018
|
2017
|
|||||||
|
Cost of Sales
|
$
|
40,600
|
$
|
-
|
||||
|
Selling, general and Administrative (including Research and Development)
|
218,623
|
306,680
|
||||||
|
Total stock-based compensation to employees
|
$
|
259,223
|
$
|
306,680
|
||||
|
Option-based compensation
|
||||||||
|
Cost of Sales
|
$
|
29,209
|
$
|
-
|
||||
|
Selling, general and Administrative (including Research and Development)
|
42,808
|
9,396
|
||||||
|
Intangible Assets
|
21,000
|
13,600
|
||||||
|
Total option-based compensation to advisors & contractors
|
$
|
93,017
|
$
|
22,996
|
The cost associated with stock compensation to employees is allocated over one-year, consistent with the current vesting period of one-year. Over the next three quarters, we expect to recognize a total of $439,599 and $105,884 of stock-based compensation and option-based compensation, respectively.
NOTE 17 – EMPLOYEE BENEFITS
In accordance with applicable Indian laws, the Company provides for gratuity, a defined benefit retirement plan (Gratuity Plan) covering certain categories of employees. The Gratuity Plan provides a lump sum payment to vested employees, at retirement or termination of employment, an amount based on the respective employee’s last drawn salary and the years of employment with the Company.
|
|
Year Ended March 31,
|
|||||||
|
|
2018
|
2017
|
||||||
|
Projected Benefit Obligation (PBO) at the beginning of the year
|
$
|
12,459
|
$
|
11,877
|
||||
|
Service cost
|
700
|
696
|
||||||
|
interest cost
|
1003
|
971
|
||||||
|
Benefits paid
|
-
|
(1,018
|
)
|
|||||
|
Actuarial (gain)/loss
|
811
|
(67
|
)
|
|||||
|
PBO at the end of the year
|
$
|
14,973
|
$
|
12,459
|
||||
|
Funded status
|
$
|
14,399
|
$
|
12,852
|
||||
Net gratuity cost for the years ended March 31, 2018 and 2017 included:
|
|
Year Ended March 31,
|
|||||||
|
|
2018
|
2017
|
||||||
|
Service cost
|
$
|
700
|
$
|
696
|
||||
|
Interest cost
|
1,003
|
971
|
||||||
|
Expected return on plan assets
|
(1,020
|
)
|
(1,045
|
)
|
||||
|
Actuarial (gain)/loss
|
811
|
|
(67
|
)
|
||||
|
Net gratuity cost
|
$
|
1,494
|
|
$
|
555
|
|||
The weighted average actuarial assumptions used to determine benefit obligations and net periodic gratuity cost are:
|
|
|
Year Ended March 31,
|
|
|||||
|
|
|
|
2018
|
|
|
|
2017
|
|
|
Discount rate
|
|
|
7.50
|
%
|
|
|
8
|
%
|
|
Rate of increase in compensation levels
|
|
|
7
|
%
|
|
|
7
|
%
|
The Company assesses these assumptions with its projected long-term plans of growth and prevalent industry standards.
The expected payout of the accumulated benefit obligation as of March 31 is as follows.
|
|
As of March 31,
|
|||||||
|
|
2018
|
2017
|
||||||
|
Expected contribution during the year ending Year 1
|
$
|
4,826
|
$
|
4,642
|
||||
|
Expected benefit payments for the years ending March 31:
|
||||||||
|
Year 2
|
$
|
1,522
|
$
|
1,464
|
||||
|
Year 3
|
497
|
478
|
||||||
|
Year 4
|
4,473
|
4,303
|
||||||
|
Year 5
|
337
|
324
|
||||||
|
Thereafter
|
$
|
5,643
|
$
|
5,428
|
||||
Provident fund
.
In addition to the above benefits, all employees in India receive benefits from a provident fund, a defined contribution plan. The employee and employer each make monthly contributions to the plan equal to 12% of the covered employee’s salary. The contribution is made to the Government’s provident fund.
NOTE 18 – INCOME TAXES
Income tax expense/(benefit) for each of the years ended March 31 consists of the following:
|
|
March 31,
|
|||||||
|
|
2018
|
2017
|
||||||
|
Current:
|
||||||||
|
Federal
|
$
|
-
|
$
|
-
|
||||
|
Foreign
|
464
|
14,431
|
||||||
|
State
|
-
|
-
|
||||||
|
Net Current
|
$
|
464
|
14,431
|
|||||
|
|
||||||||
|
Deferred:
|
||||||||
|
Federal
|
-
|
-
|
||||||
|
Foreign
|
-
|
-
|
||||||
|
State
|
-
|
-
|
||||||
|
Net Deferred
|
-
|
|||||||
|
Total tax provision
|
$
|
464
|
$
|
14,431
|
||||
The significant components of deferred income tax expense/(benefit) from operations before non-controlling interest for each of the years ended March 31 are approximated as following:
|
|
March 31,
|
|||||||
|
|
2018
|
2017
|
||||||
|
Deferred tax expense/(benefit)
|
$ |
$
|
-
|
|||||
|
Net operating loss carry forward
|
577,111
|
652,283
|
||||||
|
Foreign Tax Credits
|
-
|
|||||||
|
Less: Valuation Allowance
|
577,111
|
652,283
|
||||||
|
Net deferred tax expense
|
$
|
-
|
$
|
-
|
||||
The table below sets forth the approximate income tax expense/(benefit) for 2018 and 2017 computed by applying the applicable United States federal income tax rate and is reconciled to the tax expense/(benefit) computed at the effective income tax rate:
|
|
March 31,
|
|||||||
|
|
2018
|
2017
|
||||||
|
Computed expected income tax expense/(benefit)
|
$
|
577,111
|
$
|
652,283
|
||||
|
State tax benefit net of federal tax
|
-
|
|||||||
|
Change in valuation allowance
|
577,111
|
652,283
|
||||||
|
Deferred expenses from foreign acquisition
|
-
|
-
|
||||||
|
Impairment loss on goodwill
|
-
|
-
|
||||||
|
Impairment loss on investments
|
-
|
410
|
||||||
|
Capitalized interest costs
|
-
|
-
|
||||||
|
Deferred tax assets from foreign subsidiaries
|
-
|
-
|
||||||
|
Other
|
-
|
-
|
||||||
|
Effective income tax rate
|
(0.0
|
%)
|
(0.0
|
%)
|
||||
The approximate deferred tax assets and liabilities as of March 31 consist of the following tax effects relating to temporary differences and carry forwards:
|
|
March 31,
|
|||||||
|
|
2018
|
2017
|
||||||
|
Current deferred tax liabilities/(assets):
|
||||||||
|
Deferred Acquisition Costs – Foreign taxes
|
$
|
-
|
$
|
-
|
||||
|
Valuation allowance
|
-
|
-
|
||||||
|
Net current deferred tax liabilities/(assets)
|
$
|
-
|
$
|
-
|
||||
|
|
||||||||
|
Noncurrent deferred tax liabilities/(assets):
|
||||||||
|
Deferred acquisition costs- foreign taxes
|
$
|
-
|
$
|
-
|
||||
|
Net operating losses
|
577,111
|
652,283
|
||||||
|
Valuation allowance
|
(577,111
|
)
|
(652,283
|
)
|
||||
|
Non-current net deferred tax liabilities/(assets)
|
$
|
-
|
$
|
-
|
||||
The company provides a full allowance against any tax benefit which may be realized in the future, if ever. Therefore, the financial statements do not reflect any current or deferred provisions for income taxes.
NOTE 19 – SEGMENT INFORMATION
Accounting pronouncements establish standards for the manner in which public companies report information about operating segments in annual and interim financial statements. Operating segments are component of an enterprise that have distinct financial information available and evaluated regularly by the chief operating decision-maker (“CODM”) to decide how to allocate resources and evaluate performance. The Company’s CODM is considered to be the Company’s chief executive officer (“CEO”). The CEO reviews financial information presented on an entity level basis for purposes of making operating decisions and assessing financial performance. Therefore, the Company has determined that it operates in a single operating and reportable segment.
The following provides information required by ASC 280-10-50-38 Entity-Wide Information:
1) The table below shows revenue reported by product and service:
Product & Service
|
Segments
|
Fiscal Year Ended
March 31, 2018
|
Percentage of Total Revenue
|
||||||
|
Legacy infrastructure
|
$
|
2,192,590
|
100
|
%
|
||||
|
Alternative therapies
|
-
|
0
|
%
|
|||||
|
Total
|
$
|
2,192,590
|
100
|
%
|
||||
2(a) The table below shows the revenue attributed to the country of domicile (USA) and foreign countries. Revenue is attributed to an individual country if the invoice made to the customer originates in that country. The basis for originating an invoice is the underlining agreement.
|
Segments
|
Country
|
Fiscal Year Ended
March 31, 2018
|
Percentage of
Total Revenue
|
|||||||
|
|
||||||||||
|
Asia (1)
|
India
|
$
|
395,444
|
18
|
%
|
|||||
|
(2)
|
Hong Kong
|
1,797,146
|
82
|
%
|
||||||
|
U.S.A
|
0.0
|
0
|
%
|
|||||||
|
Total
|
|
$
|
2,192,590
|
100
|
%
|
|||||
2(b) The table below shows the long-term assets other than financial instruments held in the country of domicile and foreign countries.
|
Nature of Assets
|
USA (Country of Domicile)
|
Foreign Countries (India)
|
Total
|
|||||||||
|
Intangible assets
|
$
|
127,826
|
$
|
127,826
|
||||||||
|
Property, plant and equipment, net
|
1,000,962
|
5,235,877
|
6,236,839
|
|||||||||
|
Investments
|
773,111
|
25,811
|
798,922
|
|||||||||
|
Other non-current assets
|
-
|
484,562
|
484,562
|
|||||||||
|
Total long-term assets
|
$
|
1,901,899
|
$
|
5,746,250
|
$
|
7,648,149
|
||||||
NOTE 20 – RECONCILIATION OF EPS
For the fiscal years 2018 and 2017, the basic shares include founder’s shares, shares sold in the market, shares sold in a private placement, shares sold in the IPO, shares sold in the registered direct, shares arising from the exercise of warrants issued in the placement of debt, shares issued in connection with debt, shares issued for investments and acquisitions, and shares issued to employees, directors, advisors and vendors.
The weighted average number of shares outstanding for the fiscal years 2018 and 2017 used for the computation of basic EPS is 27,937,287 and 25,658,544 shares, respectively.
Due to the loss incurred during the year ended March 31, 2018, the computation of fully diluted loss per share excludes potentially dilutive securities of 1,806,567 shares consisting of options, warrants, and 29,768 shares from the conversion of outstanding units, because their inclusion would be anti-dilutive.
NOTE 21 – INVESTMENTS – OTHERS
Investments – others for each of the years ended March 31, 2018 and 2017 consists of the following:
|
Year Ended March 31,
|
||||||||
|
2018
|
2017
|
|||||||
|
Investment in equity shares of unlisted company & associates
|
$
|
25,811
|
$
|
63,392
|
||||
|
Investment in affiliate
|
773,111
|
773,111
|
||||||
|
Investment in land
|
-
|
5,174,611
|
||||||
|
Total
|
$
|
798,922
|
$
|
6,011,114
|
||||
Investment in land has been reclassified to Property Plant and Equipment.
NOTE 22 – INVESTMENT HELD FOR SALE
In Malaysia, our wholly owned subsidiary Cabaran Ultima, operates a real estate management business. Our board decided to exit this business and as of March 31, 2018, we accounted for our investment in Cabaran Ultima as “Investment Held for Sale” amounting to $147,500. We expect to sell Cabaran Ultima in the fiscal year 2019.
Below is the balance sheet of unaudited financials of Cabaran Ultima as of March 31, 2018.
|
Particulars
|
FYE March 31, 2018 (unaudited)
|
FYE March 31, 2017
(audited)
|
||||||
|
ASSETS
|
||||||||
|
Current Assets:
|
||||||||
|
Cash & cash equivalents
|
$
|
663
|
$
|
456,556
|
||||
|
Accounts receivable, net of allowances
|
-
|
230,136
|
||||||
|
Prepaid expenses and other current assets
|
-
|
30,103
|
||||||
|
Total current assets
|
$
|
663
|
716,795
|
|||||
|
Property, plant & equipment (net)
|
-
|
8,128
|
||||||
|
Investment-others
|
-
|
37,479
|
||||||
|
Total assets
|
$
|
663
|
762,402
|
|||||
|
LIABILITIES AND STOCKHOLDERS' EQUITY
|
||||||||
|
Current liabilities:
|
-
|
|||||||
|
Trade payable
|
$
|
15,892
|
$
|
351,466
|
||||
|
Other current liabilities
|
34,753
|
15,840
|
||||||
|
Total current liabilities
|
$
|
50,645
|
367,306
|
|||||
|
Long term borrowings
|
-
|
452,080
|
||||||
|
Total liabilities
|
50,645
|
819,386
|
||||||
|
Stockholders' equity:
|
-
|
-
|
||||||
|
Common stock
|
517,866
|
452,080
|
||||||
|
Retained Earnings
|
(567,848
|
)
|
(500,228
|
)
|
||||
|
Total equity
|
(49,982
|
)
|
(48,148
|
)
|
||||
|
Non-controlling interest
|
-
|
(8,836
|
)
|
|||||
|
Total stockholders' equity
|
(49,982
|
)
|
(56,984
|
)
|
||||
|
Total liabilities and stockholder's equity
|
$
|
663
|
$
|
762,402
|
||||
Below is the unaudited profit and loss for Cabaran Ultima for the fiscal year ended March 31, 2018.
|
Year ended March 31,
|
||||||||
|
|
2018
(unaudited)
|
2017
(audited)
|
||||||
|
Revenues
|
$
|
12
|
$
|
244,152
|
||||
|
Cost of revenues
|
-
|
(183,186
|
)
|
|||||
|
Gross profit/(loss)
|
12
|
60,966
|
||||||
|
Selling, general and administrative expenses
|
(4,051
|
)
|
(64,208
|
)
|
||||
|
Loss on investments / associates /joint ventures
|
(527
|
)
|
||||||
|
Operating income/(loss)
|
$
|
(4,039
|
)
|
$
|
(3,769
|
)
|
||
|
Other Income/(net)
|
-
|
14
|
||||||
|
Income before income taxes and minority interest attributable to non-controlling interest
|
$
|
(4,039
|
)
|
$
|
(3,755
|
)
|
||
|
Income taxes benefit/ (expense)
|
-
|
(14,535
|
)
|
|||||
|
Net income/(loss)
|
$
|
(4,039
|
)
|
$
|
(18,290
|
)
|
||
|
Non-controlling interests in earnings of subsidiaries
|
- |
2,074
|
||||||
|
Net income / (loss) attributable to common stockholders
|
$
|
(4,039
|
)
|
$
|
(20,364
|
)
|
||
NOTE 23 – CERTAIN AGED RECEIVABLES
The receivable and other assets as of March 31, 2018 and 2017, include certain aged receivables in the amount of $428,969. The aged receivables are due from the Cochin International Airport. Cochin International Airport is partially owned by the State Government of Kerala. The receivables have been due for periods in excess of one year as of March 31, 2018. These receivables are included in Accounts Receivable and have been classified as current for the following reasons:
The Company’s subsidiary in India, TBL, worked on the building of an airport runway at the Cochin International Airport. During the execution of these projects the clients of the Company requested several changes to the engineering drawings. The claims of the Company against each of the clients involve reimbursement of expenses associated with the change orders and variances as well as compensation for delays caused by the client. The delay part of the claim involves equipment that is idle on the job, including interest or lease charges for the equipment while it is idle, and workers that are idle, among others. The expense reimbursement involves cost of new material including any escalation in the cost of materials, usage of equipment, personnel and other charges that were incurred as a result of the delays caused by the change orders. These invoices were disputed by the clients and referred to arbitration. The process of arbitration involves each party choosing an arbitrator and the arbitrators appointing a third chief arbitrator. Each party then presents its case over several months and the arbitrator makes an award.
The receivables occurred and became due when TBL won the arbitration award against Cochin International Airport on July 22, 2009. The arbitration awards stipulate that interest be accrued for the period of non-payment. However, the receivables do not have an interest component as the Company will try and use the accrued interest as negotiating leverage for an earlier payment. Although the receivables are contractually due, and hence its classification as current, it may take the Company anywhere from the next 30 days to 6 months to actually realize the funds, depending on final verdict to happen in few months. The Company continues to carry the full value of the receivables without interest and without any impairment because it believes that there is minimal risk that these organizations will become insolvent and unable to make payment.
NOTE 24 – INVESTMENT IN AFFILIATES
Pursuant to the December 18, 2014 Purchase Agreement with Apogee, we issued Apogee 1,200,000 of IGC’s Common Stock valued at $888,000 for the purchase of 24.9% ownership interest in Midtown Partners & Co., LLC (MTP). During the fiscal year 2018, after considering several factors, the Company concluded that it no longer had considerable influence over MTP. Hence, we did not record any impact of MTP’s earnings/(losses) and instead we maintained the same value as of March 31, 2017 or ($773,111). Please see Note 12-Related Party Transactions for more information on Midtown Partner.
NOTE 25 – SUBSEQUENT EVENTS
On May 11, 2018, the SEC declared effective the Company’s registration statement on Form S3 for $30,000,000 filed on April 2, 2018.
On May 2, 2018, the Company filed a lawsuit in the Circuit Court for Montgomery County, Maryland, seeking a declaratory judgment that the shares issued to Bricoleur by the Company represent payment on the loan and damages for improper lending practices under Maryland law. The lawsuit is currently pending.
On April 11, 2018, the Audit Committee of our Board of Directors approved the appointment of Manohar Chowdhry & Associates (“MCA”) as our new independent registered public accounting firm for the fiscal years ended March 31, 2018 and March 31, 2019.
ITEM 9 – CHANGES IN AND DISAGREEMENTS WITH ACCOUNTANTS ON ACCOUNTING AND FINANCIAL DISCLOSURE
Dismissal of Independent Public Accounting Firm
IGC’s Audit Committee of our Board of Directors determined, that after five years with the same independent public accounting firm, as a matter of good corporate governance, it was appropriate to change to a different firm. Therefore, effective March 16, 2018, the Audit Committee resolved to dismiss AJSH & Co LLP (“AJSH”) as the Company’s independent auditors.
The reports of AJSH on the Company’s consolidated financial statements as of and for the years ended March 31, 2013, 2014, 2015, 2016 and 2017 did not contain an adverse opinion or disclaimer of opinion, and were not qualified or modified as to uncertainty, audit scope or accounting principles.
During the two most recent fiscal years ended March 31, 2016 and March 31, 2017, and through March 16, 2018, (i) there were no disagreements with AJSH on any matter of accounting principles or practices, financial statement disclosure, or audit scope or procedure, which disagreements, if not resolved to the satisfaction of AJSH, would have caused AJSH to make reference to the subject matter of the disagreements in its reports on the consolidated financial statements for such years; and (ii) there were no events requiring reporting in this Current Report on Form 8-K under Item 304(a)(1)(v) of Regulation S-K.
The Company provided AJSH with a copy of the disclosures it is making in this Current Report on Form 8-K and requested from AJSH a letter addressed to the Securities and Exchange Commission indicating whether it agrees with such disclosures. A copy of such letter dated March 16, 2018 is attached as Exhibit 16.1 to the Current Report on Form 8-K filed on March 19, 2018.
Engagement of New Independent Public Accounting Firm
On April 11, 2018 the Audit Committee of our Board of Directors approved the appointment of Manohar Chowdhry & Associates (“MCA”) as our new independent registered public accounting firm for the fiscal year ending March 31, 2018 and March 31, 2019. The appointment is subject to ratification by the IGC stockholders at the 2018 Annual Meeting of Stockholders.
Manohar Chowdhry & Associates is a public accounting firm registered with the PCAOB and is based in India, where they have 12 offices including Bangalore, Chennai and Kochi, plus one office in Dubai. The firm has 24 partners and about 350 employees and trainees. Their clients include companies based out of US. Manohar Chowdhry & Associates is ranked as one of the premier firms in South India.
During the two most recent fiscal years ended March 31, 2018 and 2017, and the subsequent interim period through June 20, 2018, neither we nor anyone acting on our behalf consulted with MCA regarding either (i) the application of accounting principles to a specified transaction, either completed or proposed, or the type of audit opinion that might be rendered on our financial statements, and neither a written report nor oral advice was provided to the Company that MCA concluded was an important factor considered by the Company in reaching a decision as to the accounting, auditing or financial reporting issue, or (ii) any matter that was either the subject of a disagreement (as defined in Item 304(a)(1)(iv) of Regulation S-K and the related instructions to Item 304 of Regulation S-K) or a reportable event (as defined in Item 304(a)(1)(v) of Regulation S-K).
Evaluation of Disclosure Controls and Procedures
As of the end of the period covered by this report, management conducted an evaluation, under the supervision and with the participation of its Chief Executive Officer (CEO) and its principal accounting officer (PAO), of the effectiveness of the design and operation of our disclosure controls and procedures pursuant to Rules 13a-15 and 15d-15 of the Securities Exchange Act of 1934. Based upon that evaluation, our CEO and PAO concluded that our disclosure controls and procedures are effective.
Disclosure controls and procedures are defined by Rules 13a-15(e) and 15d-15(e) of the Exchange Act as controls and other procedures that are designed to ensure that information required to be disclosed by us in reports filed with the SEC under the Exchange Act is recorded, processed, summarized and reported within the time periods specified in the SEC’s rules and forms. Disclosure controls and procedures include, without limitation, controls and procedures designed to ensure that information required to be disclosed by us in reports filed under the Exchange Act is accumulated and communicated to our management, including our CEO and PAO, or persons performing similar functions, as appropriate, to allow timely decisions regarding required disclosure.
Changes in Internal Controls Over Financial Reporting
There were no changes in our internal controls over financial reporting during our fiscal year ended March 31, 2018, which were identified in conjunction with management’s evaluation required by paragraph (d) of Rule 13a-15 and 15d-15 under the Exchange Act that have materially affected or are reasonably likely to materially affect our internal controls over financial reporting.
Limitations on the Effectiveness of Disclosure Controls and Procedures
Our management, including our CEO and PAO, do not expect that our internal control over financial reporting will prevent all errors and all fraud. Because of its inherent limitations, internal control over financial reporting may not prevent or detect misstatements. Also, projections of any evaluation of effectiveness to future periods are subject to the risk that controls may become inadequate because of changes in conditions, or that the degree or compliance with the policies or procedures may deteriorate.
Management’s Annual Report on Internal Control over Financial Reporting
Our management is responsible for establishing and maintaining adequate internal control over financial reporting, as such term is defined in Exchange Act Rules 13a15(f) and 15(d)-15(f) promulgated under the Exchange Act. These rules define internal control over financial reporting as a process designed to provide reasonable assurance regarding the reliability of financial reporting and the preparation of financial statements for external purposes in accordance with generally accepted accounting principles and includes those policies and procedures that:
1. pertain to the maintenance of records that in reasonable detail accurately and fairly reflect the transactions and dispositions of our assets;
2. provide reasonable assurance the transactions are recorded as necessary to permit preparation of financial statements in accordance with generally accepted accounting principles, and the receipts and expenditures of our company are being made only in accordance with authorizations of management and directors of the company; and
3. provide reasonable assurance regarding prevention or timely detection of unauthorized acquisitions, use or disposition of our company’s assets that could have a material effect on the financial statements.
Because of the inherent limitations, internal controls over financial reporting may not prevent or detect misstatements. Projections of any evaluation of effectiveness to future periods are subject to the risk that controls may become inadequate because of changes in conditions, or that the degree of compliance with the policies or procedures may deteriorate.
Management assessed the effectiveness of our internal control over financial reporting as of March 31, 2018. In making this assessment, our management used the criteria established in Internal Control-Integrated Framework issued by the Committee of Sponsoring Organizations of the Treadway Commission (COSO).
Based on an assessment carried out between March and May 2018, management believes that as of March 31, 2018, our internal control over financial reporting was effective.
None.
PART III
Executive Officers and Directors
The names, ages, and positions of our executive officers and directors as of May 31, 2018 are as follows:
|
Name
|
|
Positions
|
|
Age
|
|
|
Director Since
|
|
|
Term will Expire
|
|
||
|
|
|
|
|
|
|
|
|
|
|
|
|
||
|
Ram Mukunda
|
|
President, Chief Executive Officer and Director (Class C director)
|
|
59
|
|
|
|
2005
|
|
|
|
2019
|
|
|
|
|
|
|
|
|
|
|
|
|
|
|
|
|
|
Claudia Grimaldi
|
Vice-President and Principal Financial Officer
|
47
|
—
|
|
|
|
—
|
||||||
|
|
|
|
|
|
|
|
|
|
|
|
|
|
|
|
Rohit Goel
|
|
Principal Accounting Officer
|
|
24
|
|
|
|
—
|
|
|
|
—
|
|
|
|
|
|
|
|
|
|
|
|
|
|
|
|
|
|
Dr. Jagadeesh Rao
|
Scientific Officer
|
51
|
—
|
|
|
|
—
|
|
|||||
|
Richard Prins
|
|
Chairman of the Board of Directors (Class B director)
|
|
61
|
|
|
|
2007
|
|
|
|
2018
|
|
|
Sudhakar Shenoy
|
|
Director (Class A director)
|
|
69
|
|
|
|
2005
|
|
|
|
2020
|
|
The principal occupations for the past five years (and, in some instances, for prior years) of each of our executive officers and directors are as follows:
Mr. Ram Mukunda
has served as our CEO and in other capacities since April 29, 2005. Mr. Mukunda is responsible for general management and over the past five years has been largely responsible for the Company’s strategy and positioning in the medical cannabis industry. He has been the chief-inventor and architect of all patent filings by the Company including the creation of the Company’s lead product Hyalolex
tm
. Prior to IGC, from January 1990 to May 2004, Mr. Mukunda served as Founder and CEO of Startec Global Communications, that he took public in 1997 on NASDAQ. Prior to Startec, he served as Strategic Planning Advisor at Intelsat, a communications satellite services provider and prior to that worked in the bond market for a boutique firm on Wall Street. Mr. Mukunda serves as an Emeritus member on the Board of Visitors at the University of Maryland, School of Engineering. From 2001 to 2003, he was a Council Member at Harvard’s Kennedy School of Government, Belfer Center of Science and International Affairs. Mr. Mukunda is the recipient of several awards including, among others, the 2013 University of Maryland’s International Alumnus of the year award, the 2001 Distinguished Engineering Alumnus Award, the 1998 Ernst & Young, LLP’s Entrepreneur of the Year Award. He holds a B.S. degree in Electrical Engineering, a B.S degree in Mathematics, and a M.S. in Engineering from the University of Maryland. Mr. Mukunda has traveled extensively, and managed companies in Europe and Asia. He has more than 20 years of experience managing public companies and has acquired and integrated more than 20 companies. His in-depth business experience in the medical cannabis industry, his knowledge of U.S. capital markets, capital structuring, international joint ventures and broad science and engineering background make him well qualified to serve as a director of our company.
Ms. Claudia Grimaldi
, Vice-president and PFO, is responsible for coordinating the staff in various countries and ensuring timely and accurate statutory and regulatory compliance (SEC, FINRA, NYSE, IRS, XETRA 2, among others). She is also a Director of Cabaran Ultima in Malaysia, as well as a Director for some of our overseas subsidiaries. Before assuming her current role in 2018, from 2013 to May 9, 2018, she served as the General Manager and prior to that from April 20, 2010 to 2013, she managed the office of the CEO. Ms. Grimaldi graduated Summa Cum Laude from Javeriana University, a top five University in Colombia, with a Bachelor of Arts in Psychology. She holds an MBA in General Management, graduating with Highest Honors, from Meredith College, in North Carolina. She is a member of Delta Mu Delta International Honor Society. She is also fluent in both English and Spanish.
Mr. Rohit Goel
has been our Principal Accounting Officer (PAO) since September 2017. As the Principal Accounting Officer, he is responsible for all accounting matters relating to the Company. His previous experience includes leading USGAAP audit teams and leading or assisting in the statutory audit of limited and private companies in various industries including telecom, stock brokerage, manufacturing, education, banking and digital marketing. He has worked on preparing process, workflow, implementation of SAP based accounting systems, worked on several accounting projects for clients based in US, Spain and UK, and assisted an audit team that conducted an asset audit for clients in Africa. In 2012 and 2013 he passed the CA CPT and CA IPCC exams. From September 2013 to March 2014 he worked as a Chartered Accountant (CA) trainee for Mahesh K Aggarwal & Co. And from April 2014 to September 11, 2016 he worked as a Chartered Accountant trainee, with AJSH & Co. In September 2016, he founded BnA Consultancy to provide accounting, taxation and statutory compliance services. In 2015, Mr. Goel graduated with a B. Com (honors) in Accounting and Tax (Commerce) from Delhi University, India, in 2015. He is currently pursuing a Masters, in Commerce (Accounting) at IGNOU, India. Mr. Goel is based in India along with the rest of the accounting team.
Dr. Jagadeesh Rao
has been our Scientific Officer since October 2017. He leads our product development in the areas of Alzheimer’s disease, Parkinson’s disease, neuroscience, and other neuropsychiatric disorders. He has extensive experience working at various centers of the National Institute of Health (NIH). From 2014 to 2017, Dr. Rao was Scientific Review Officer at the National Institute of Drug Abuse; Previously, he held various positions including Staff Scientist at the Brain Physiology and Metabolism Section. Prior to that Dr. Rao worked on herbal drugs and characterized the biological efficacy of various plant extractions at Himalaya Drug Company and was also part of the Drug Discover Group at Johnson and Johnson. Dr. Rao received his Ph.D. in Neurochemistry, in 1998, from the National Institute of Mental Health & Neurosciences, India. He did his post-doctoral training at the University of Illinois at Chicago, where he worked on major depression and bipolar disorder projects as well as animal models of depression. Dr. Rao is an elected associate member to the American College of Neuropsychopharmacology.
Mr. Richard Prins
has been our Chairman and Audit Committee Chairman since 2012 and has served as a Director since May 2007. Mr. Prins has extensive experience in private equity investing and investment banking. From March 1996 to 2008, he was the Director of Investment Banking at Ferris, Baker Watts, Incorporated (FBW). Mr. Prins served in a consulting role to RBC until January 2009. Mr. Prins currently serves on several boards, volunteers full time with a non-profit organization, Advancing Native Missions, and is a private investor. Since February 2003, he has been on the board of Amphastar Pharmaceuticals, Inc. From March 2010 until 2016, he was on the board of Hilbert Technologies. Mr. Prins holds a B.A. degree from Colgate University and an M.B.A. from Oral Roberts University. Mr. Prins has substantial knowledge and experience with U.S. capital markets, has served on and chaired audit and compensation committees of boards, has extensive experience in finance, accounting, and internal controls over financial reporting. His knowledge of the pharmaceutical industry and experience with U.S. capital markets make him well qualified to serve as a director of our company.
Mr. Sudhakar Shenoy
has been our Compensation Committee Chairman since 2012 and has served as a Director since the inception of IGC in May 2005. Mr. Shenoy is the Chairman and CEO of Reston, Virginia based Alyx Technologies, Inc., a business solutions and technology provider with operations in the United States and India. He was a member of the Non-Resident Indian Advisory Group that advised the former Prime Minister of India on strategies for attracting foreign direct investment. He was selected for the U.S. Presidential Trade and Development Mission to India in 1995. Mr. Shenoy was inducted into the Alumni Hall of Fame at the University of Connecticut School of Business and the School of Engineering. He was recognized as a Distinguished Alumnus of the Indian Institute of Technology (IIT) in Bombay, India in 1997. Shenoy has been named one of the Most Influential People in Washington, D.C. high tech industry as well as being awarded the 2004 Executive of the Year by the Northern Virginia Government Contractors Council. He holds a B. Tech (Hons.) in electrical engineering from the Indian Institute of Technology and an M.S. in Electrical Engineering and an M.B.A. from the University of Connecticut Schools of Engineering and Business Administration, respectively. Shenoy’s extensive business contacts and his experience serving on the boards of public and private companies in the United States make him well qualified to serve as a director of our company.
Executive officers are appointed by our Board of Directors. Each executive officer holds his office until he resigns or is removed by the Board or his successor is elected and qualified.
All directors hold office until the annual meeting of the stockholders in the year set forth above in the table and until their successors have been duly elected or qualified.
There are no family relationships between any of our executive officers or directors.
Board of Directors; Independence
Our Board of Directors is divided into three classes (Class A, Class B and Class C) with only one class of directors being elected in each year and each class serving a three-year term. The term of office of the Class A director, consisting of Sudhakar Shenoy, will expire at the 2020 annual meeting of stockholders. The term of office of the Class B director, currently consisting of Richard Prins, will expire at the 2018 annual meeting of stockholders. The term of office of the Class C director, currently consisting of Ram Mukunda, will expire at the 2019 annual meeting of stockholders. These individuals have played a key role in identifying and evaluating prospective acquisition candidates, selecting the target businesses, and structuring, negotiating and consummating acquisitions.
The NYSE American, upon which our shares are listed, requires the majority of our Board to be “independent.” The NYSE American listing standards define an “independent director” generally as a person, other than an officer or an employee of the company, who does not have a relationship with the company that would interfere with the director’s exercise of independent judgment. Consistent with these standards, the Board of Directors has determined that Messrs. Prins and Shenoy are independent directors.
Audit Committee
Our Board of Directors has established an Audit Committee currently composed of two independent directors who report to the Board of Directors. Messrs. Prins and Shenoy, each of whom is an independent director under the NYSE American listing standards, serve as members of our Audit Committee. Mr. Prins is the Chairman of our Audit Committee. In addition, we have determined that Messrs. Prins and Shenoy are “audit committee financial experts,” as that term is defined under Item 407 of Regulation S-K of the Securities Exchange Act of 1934. The Audit Committee is responsible for meeting with our independent accountants regarding, among other issues, audits and the adequacy of our accounting and control systems.
Compensation Committee
Our Board of Directors has established a Compensation Committee composed of two independent directors, Messrs. Shenoy and Prins. Mr. Shenoy is the current Chairman of our Compensation Committee. The Compensation Committee’s purpose is to review and approve compensation paid to our officers and directors and to administer our 2018 Omnibus Incentive Plan.
Compensation Committee Interlocks and Insider Participation
Our Compensation Committee is comprised of two independent members of the Board of Directors, Richard Prins and Sudhakar Shenoy. No executive officer of the Company served as a director or member of the compensation committee of any other entity.
The Compensation Committee was responsible for determining executive compensation and the award of stock, and stock options to employees, advisors, and directors during the fiscal year ended March 31, 2018. No consultants were used by the Compensation Committee during this fiscal year.
Nominating and Corporate Governance Committee
In the future, we intend to establish a nominating and corporate governance committee. The primary purpose of the nominating and corporate governance committee will be to identify individuals qualified to become directors, recommend to the Board of Directors the candidates for election by stockholders or appointment by the Board of Directors to fill a vacancy, recommend to the Board of Directors the composition and chairs of Board of Directors committees, develop and recommend to the Board of Directors guidelines for effective corporate governance, and lead an annual review of the performance of the Board of Directors and each of its committees. We do not have any formal process for stockholders to nominate a director for election to our Board of Directors. Currently, nominations are selected or recommended by a majority of the independent directors as stated in Section 804(a) of the NYSE American Company Guide.
Audit Committee Financial Expert
The Audit Committee will at all times be composed exclusively of “independent directors” who are “financially literate,” as defined under the NYSE American listing standards. The NYSE American’s listing standards define “financially literate” as being able to read and understand fundamental financial statements, including a company’s balance sheet, income statement and cash flow statement. In addition, we must certify to the NYSE American that the Audit Committee has, and will continue to have, at least one member who has past employment experience in finance or accounting, requisite professional certification in accounting, or other comparable experience or background that results in the individual’s financial sophistication. The Board of Directors has determined that Messrs. Prins and Shenoy satisfy the NYSE American’s definition of financial sophistication and qualify as “audit committee financial experts,” as defined under rules and regulations of the Securities and Exchange Commission.
Board and Committee Meetings
During the fiscal year ended March 31, 2018, there were sixteen Board meetings, sixteen meetings of the Audit Committee and six Compensation Committee meetings, all of which were attended by all our directors of the Board and all of the members of the committees, respectively.
Communications with Directors
Any director may be contacted by writing to him c/o the Secretary of the Company at the Company’s principal executive offices. Communications to the non-management directors as a group may be sent to the Independent Directors c/o the Secretary of the Company at the same address. We will promptly forward, without screening other than normal security procedures for all our mail, all correspondence to the indicated director or directors.
Indemnification Agreements
We are party to indemnification agreements with each of the executive officers and directors. Such indemnification agreements require us to indemnify these individuals to the fullest extent permitted by law. Under the terms of the indemnification agreements, we intend to agree to indemnify our officers and directors against expenses, judgments, fines, penalties or other amounts actually and reasonably incurred by the independent director in connection with any proceeding if the officer or director acted in good faith and did not derive an improper personal benefit from the transaction or occurrence that is the basis of the proceeding.
Annual Meeting Attendance
We do not have a formal policy requiring directors to attend stockholder meetings, but we encourage members of the Board of Directors to attend the annual meeting of stockholders.
Code of Conduct and Ethics
A code of business conduct and ethics is a written standard designed to deter wrongdoing and to promote (a) honest and ethical conduct, (b) full, fair, accurate, timely and understandable disclosure in regulatory filings and public statements, (c) compliance with applicable laws, rules and regulations, (d) the prompt reporting violation of the code and (e) accountability for adherence to the code. The Company has adopted a written code of ethics (the “Code of Ethics”) that applies to the Company’s Chief Executive Officer and senior financial officers, including the Company’s Principal Accounting Officer, Controller, and persons performing similar functions (collectively, the “Senior Financial Officers”), in accordance with applicable federal securities laws and the rules of the NYSE American, and to all employees. Investors may view our Code of Ethics on the corporate governance subsection of the investor relations portion of our website at
www.igcpharma.com
. The Company has established separate audit and compensation committees that are described elsewhere in this report. The Company does not have a separate nominating committee. Accordingly, Board of Director nominations occur by either selection or recommendation of a majority of the independent directors.
Section 16(a) Beneficial Ownership Reporting Compliance
Section 16(a) of the Securities Exchange Act of 1934, as amended, requires our directors, executive officers and persons who beneficially own more than 10% of our common stock to file reports of their ownership of shares with the Securities and Exchange Commission. Such executive officers, directors and stockholders are required by SEC regulation to furnish us with copies of all Section 16(a) reports they file. Based solely upon review of the copies of such reports received by us, our senior management believes that all reports required to be filed under Section 16(a) for the fiscal year ended March 31, 2018 were filed in a timely manner.
Compensation Discussion and Analysis
Overview of Compensation Policy
Our Compensation Committee is empowered to review and approve, or in some cases recommend for the approval of the full Board of Directors the annual compensation for the executive officers of our company. This Committee has the responsibility for establishing, implementing and monitoring our compensation strategy and policy. Among its principal duties, the Committee ensures that the total compensation of the executive officers is fair, reasonable and competitive.
Objectives and Philosophies of Compensation
The primary objective of our compensation policy, including the executive compensation policy, is to help attract and retain qualified, energetic managers who are enthusiastic about our mission and products and services. The policy is designed to reward the achievement of specific annual and long-term strategic goals aligning executive performance with company growth and stockholder value. In addition, the Board of Directors strives to promote an ownership mentality among key leaders and the Board of Directors.
Setting Executive Compensation
The compensation policy is designed to reward performance. In measuring executive officers’ contribution to our company, the Compensation Committee considers numerous factors including our growth and financial performance as measured by revenue, gross margin and net income before taxes, among other key performance indicators. Regarding most compensation matters, including executive and director compensation, management provides recommendations to the Compensation Committee; however, the Compensation Committee does not delegate any of its functions to others in setting compensation. The Compensation Committee does not currently engage any consultant related to executive or director compensation matters.
Stock price performance has not been a factor in determining annual compensation because the trading price of shares of our common stock is subject to a variety of factors outside of management’s control. We do not subscribe to an exact formula for allocating cash and non-cash compensation. However, a significant percentage of total executive compensation is performance-based. Historically, the majority of the incentives to executives have been in the form of non-cash incentives in order to better align the goals of executives with the goals of stockholders.
Elements of Company’s Compensation Plan
|
•
|
base salary,
|
|
•
|
performance-based incentive cash and stock and stock option compensation, and
|
|
•
|
401-K plan with matching contribution up to 6%, and
|
|
•
|
other benefits including health insurance and health saving accounts, among others.
|
Base Salary
We provide named executive officers and other employees with base salary to compensate them for services rendered during the fiscal year. Base salary ranges for named executive officers are determined for each executive based on his or her position and responsibility. During its review of base salaries for executives, the Committee primarily considers:
|
•
|
market data,
|
|
•
|
internal review of the executives’ compensation, both individually and relative to other officers, and
|
|
•
|
individual performance of the executive.
|
Salary levels are typically evaluated annually as part of our performance review process, as well as upon a promotion or other change in job responsibility.
Performance-Based Incentive Compensation
The management incentive plan gives the Committee the latitude to design cash and stock-based incentive compensation programs to promote high performance and achievement of corporate goals, encourage the growth of stockholder value and allow key employees to participate in the long-term growth and profitability of our company.
Ownership Guidelines
To align the interests of the Board of Directors directly with the interests of the stockholders, the Committee recommends that each Board member maintain a minimum ownership interest in our company. Currently, the Compensation Committee recommends that each Board member own a minimum of 5,000 shares of our common stock with such stock to be acquired within a reasonable time following election to the Board.
Employee Stock Option Program
The Company’s 2018 Employee Stock Option Plan, approved by the shareholders in 2017, assists us to:
|
•
|
enhance the link between the creation of stockholder value and long-term executive incentive compensation,
|
|
•
|
provide an opportunity for increased equity ownership by executives, and
|
|
•
|
maintain competitive levels of total compensation.
|
Stock option award levels will be determined based on market data and will vary among participants based on their positions within the company and are granted at the Committee’s regularly scheduled meeting.
As of March 31, 2018, a total of 1.455 million shares of common stock have been awarded and there are no options outstanding and exercisable awarded to employees. As of March 31, 2018, there are no shares of common stock available for future grants of options or stock awards.
Perquisites and Other Personal Benefits
We provide some executive officers with perquisites and other personal benefits that we and the Committee believe are reasonable and consistent with our overall compensation program to enable us to attract and retain superior employees for key positions. The Committee periodically reviews the levels of perquisites and other personal benefits provided to named executive officers. Some executive officers receive the use of company automobiles and an assistant among other perquisites. Each employee of our company is entitled, to participate in a Company sponsored 401K plan, subject to vesting, and to term life insurance, premiums for which are paid by us. In addition, each employee is entitled to receive medical and dental benefits.
Accounting and Tax Considerations
Our stock option grant policy will be impacted by the implementation of FASB ASC 718 (previously referred to as SFAS No. 123R), which was adopted in the first quarter of fiscal year 2006. Under this accounting pronouncement, we are required to value unvested stock options granted prior to the adoption of FASB ASC 718 under the fair value method and expense those amounts in the income statement over the stock option’s remaining vesting period.
Section 162(m) of the Internal Revenue Code restricts deductibility of executive compensation paid to our chief executive officer and each of the four other most highly compensated executive officers holding office at the end of any year to the extent such compensation exceeds $1,000,000 for any of such officers in any year and does not qualify for an exception under Section 162(m) or related regulations. The Committee’s policy is to qualify its executive compensation for deductibility under applicable tax laws to the extent practicable. In the future, the Committee will continue to evaluate the advisability of qualifying its executive compensation for full deductibility.
Compensation for Executive Officers of the Company
The following table sets forth information concerning all cash and non-cash compensation awarded to, earned by or paid to (i) all individuals serving as the Company’s principal executive officer or acting in a similar capacity during the last two completed fiscal years, regardless of compensation level, and (ii) the Company’s three most highly compensated executive officers other than the principal executive officers serving at the end of the last two completed fiscal years (collectively, the “Named Executive Officers”).
Summary Compensation Table
|
Name and Principal Position
|
Year
|
Salary
|
Bonus
|
Stock Award (1)
|
Total Compensation
|
|||||||||||||
|
Ram Mukunda (2)
|
2018
|
$
|
300,000
|
$
|
-
|
$
|
148,198
|
$
|
448,198
|
|||||||||
|
President and CEO
|
2017
|
$
|
300,000
|
$
|
-
|
$
|
125,000
|
$
|
425,000
|
|||||||||
|
|
|
|||||||||||||||||
|
Claudia Grimaldi (3)
|
2018
|
$
|
120,000
|
$
|
92,000
|
$
|
212,000
|
|||||||||||
|
2017
|
$
|
120,000
|
$
|
88,930
|
$
|
208,930
|
||||||||||||
|
Rohit Goel (4)
|
2018
|
$
|
-
|
$
|
41,000
|
$
|
41,000
|
|||||||||||
|
Principal Accounting Officer
|
2017
|
$
|
-
|
$
|
-
|
$
|
-
|
|||||||||||
|
Jagadeesh Rao (5)
|
2018
|
$
|
120,000
|
$
|
55,600
|
$
|
175,600
|
|||||||||||
|
Science Officer
|
||||||||||||||||||
|
(1)
|
The Stock Award amounts reported represent the fair value of stock awards to the named executive officer as computed using the closing price for the day the issuance was granted.
|
|
(2)
|
The Company owes the CEO eight months of salary or about $198,000. The 2018 stock award vests over one year. We pay an affiliate of our CEO $4,500 per month for office space and certain general and administrative services, provided in Maryland, and $6,100 per month for facilities and services provided in Washington State including in fiscal 2018 a one-time renewal fee of $106,283. These amounts are not intended as compensation to our CEO and therefore not included in the table.
|
|
(3)
|
Ms. Grimaldi served as General Manager through May 9, 2018 when she was promoted to Vice president and Principal Financial Officer. The 2018 stock award vests over one year.
|
|
(4)
|
Mr. Goel was not employed by IGC in the fiscal year 2017. He joined IGC on September 29, 2017 at an annual salary of INR 936,000. He is based in India. The stock award vests over two years.
|
|
(5)
|
Dr. Rao was not employed by IGC in the fiscal year 2017, he joined IGC on October 10, 2017. The salary reported in the table is his annualized compensation and not what he received in the fiscal year 2018. The stock award vests over two years.
|
Outstanding Equity Awards at Fiscal Year End
The following table sets forth information with respect to outstanding equity awards held by the Company’s named Executive Officers as of March 31, 2018.
|
Name
|
Shares
|
Number of
Securities
Underlying
Unexercised
Options (#)
Exercisable
|
Number of
Securities
Underlying
Unexercised
Options (#)
Unexercisable
|
Option
Exercise
Price
($)
|
Option
Expiration
Date
|
|||||||||||||||
|
Ram Mukunda (1)
|
2,425,994
|
-
|
-
|
-
|
-
|
|||||||||||||||
|
|
||||||||||||||||||||
|
Claudia Grimaldi (2)
|
644,007
|
-
|
-
|
-
|
-
|
|||||||||||||||
|
Rohit Goel (3)
|
100,000
|
-
|
-
|
-
|
-
|
|||||||||||||||
|
Jagadeesh Rao (4)
|
85,000
|
-
|
-
|
-
|
-
|
|||||||||||||||
|
(1)
|
These shares include 250,000 shares that vest, on April 30, 2019.
|
|
(2)
|
These shares include 200,000 shares that vest on April 30, 2019.
|
|
(3)
|
Includes 50,000 shares that vest on September 30, 2018, and 50,000 shares that vest on September 30, 2019.
|
|
(4)
|
Includes 50,000 shares that vest on December 12, 2018 and 35,000 that vest on December 12, 2019.
|
Compensation of Directors
No cash compensation was awarded to, earned by or paid to the directors in the fiscal year ended March 31, 2018 for service as directors. In the fiscal years ended 2018 and 2017, our non-employee directors each received 150,000 and 150,000 shares of our common stock from the 2008 Omnibus Incentive Plan, respectively. All compensation paid to our employee director is set forth in the tables summarizing executive officer compensation above. The Option Awards column reflects the grant date fair value, in accordance with Accounting Standards Codification (ASC) Topic 718, Compensation — Stock Compensation (formerly Statement of Financial Accounting Standards (SFAS) No. 123R) for awards pursuant to the Company’s equity incentive program. No options are issued and outstanding to our Directors.
Assumptions used in the calculation of these amounts for the fiscal year ended March 31, 2018 are included in Note 16, “Stock-Based Compensation” to the Company’s audited financial statements for the fiscal year ended March 31, 2017, included in this report. The Company cautions that the amounts reported in the Director Compensation Table for these awards may not represent the amounts that the directors will actually realize from the awards. Whether, and to what extent, a director realizes value will depend on the Company’s actual operating performance and stock price fluctuations.
Please see Note 12-Related Party Transactions for more information.
Employment Contracts
Ram Mukunda has served as President and Chief Executive Officer of our company since its inception. On May 22, 2008, we, IGC-M and Mr. Mukunda entered into an Employment Agreement that expired on May 21, 2014. On July 14, 2014 we, IGC-M and Mr. Mukunda entered into the 2014 Employment Agreement. Pursuant to the 2014 Employment Agreement, which will be effective until July 2019, we pay Mr. Mukunda a base salary of $300,000 per year. The Employment Agreement provides that the Board of Directors of our company may review and update the targets and amounts for the net revenue and salary and contract bonuses on an annual basis. Mr. Mukunda is entitled to benefits, including insurance, participation in company-wide 401(K), reimbursement of business expenses, 20 days of annual paid vacation, sick leave, domestic help, driver, cook and a car (subject to partial reimbursement by Mr. Mukunda of lease payments for the car and reimbursement of business expenses).
The term of the Employment Agreement is five years, extended by one year after which employment will become at-will. The Employment Agreement is terminable by us for death, disability and cause. In the event of a termination without cause, including a change of control, we would be required to pay Mr. Mukunda his full compensation for three years.
Compensation Risk Assessment
In setting compensation, the Compensation Committee considers the risks to our stockholders and to achievement of our goals that may be inherent in our compensation programs. The Compensation Committee reviewed and discussed its assessment with management and outside legal counsel and concluded that our compensation programs are within industry standards and are designed with the appropriate balance of risk and reward to align employees’ interests with those of our company and do not incent employees to take unnecessary or excessive risks. Although a portion of our executives’ and employees’ compensation is performance-based and “at risk,” we believe our compensation plans are appropriately structured and are not reasonably likely to result in a material adverse effect on our company.
Securities Authorized for Issuance Under Equity Compensation Plans
The following table shows, as of March 31, 2018, information regarding outstanding awards available under our compensation plans (including individual compensation arrangements) under which our equity securities may be delivered.
|
Plan category
|
(a)
Number of
securities to be
issued upon
exercise of
outstanding
options,
warrants and
rights (1)
|
(b)
Weighted-
average exercise
price of
outstanding
options,
warrants and
rights
|
(c)
Number of
securities
available for
future
issuance
(excluding
shares in
column (a)(1)
|
|||||||||
|
Equity compensation plans approved by security holders:
|
||||||||||||
|
|
||||||||||||
|
2018 Omnibus Incentive Plan (2)
|
$
|
-
|
$
|
-
|
$
|
-
|
||||||
| (1) |
Consists of our 2008 and 2018 Omnibus Incentive Plans, as approved by our stockholders on September 12, 2014 and November 8, 2017, respectively. See Note 16, “Stock-Based Compensation” of the Notes to the Consolidated Financial Statements included in this report.
|
| (2) |
There are no options outstanding as of March 31, 2018.
|
Item 12. Security Ownership of Certain Beneficial Owners and Management and Related Stockholder Matters
The following table sets forth information regarding the beneficial ownership of our common stock as of May 31, 2018 by each person known by us to be the beneficial owner of more than 5% of our outstanding shares of common stock, each of our executive officers and directors, and all our officers and directors as a group.
Beneficial ownership is determined in accordance with the rules of the Securities and Exchange Commission and does not necessarily indicate beneficial ownership for any other purpose. Under these rules, beneficial ownership includes those shares of common stock over which the stockholder has sole or shared voting or investment power. It also includes shares of common stock that the stockholder has a right to acquire within 60 days through the exercise of any option, warrant or other right. The percentage ownership of the outstanding common stock, which is based upon shares of common stock outstanding as of May 31, 2018, is based on the assumption, expressly required by the rules of the Securities and Exchange Commission, that only the person or entity whose ownership is being reported has exercised options or warrants to purchase shares of our common stock.
Unless otherwise indicated, we believe that all persons named in the table have sole voting and investment power with respect to all shares of common stock beneficially owned by them. Unless otherwise noted, the nature of the ownership set forth in the table below is common stock of the Company. The table below sets forth as of May 31, 2018, except as noted in the footnotes to the table, certain information with respect to the beneficial ownership of the Company’s common stock by (i) all persons or groups, according to the most recent Schedule 13D or Schedule 13G filed with the Securities and Exchange Commission or otherwise known to us, to be the beneficial owners of more than 5% of the outstanding common stock of the Company, (ii) each director of the Company, (iii) the executive officers named in the Summary Compensation Table, and (iv) all such executive officers and directors of the Company as a group.
|
|
Shares Owned
|
|||||||
|
Name and Address of Beneficial Owner (1)
|
Number of Shares
Beneficially Owned
|
Percentage
of Class*
|
||||||
|
Ram Mukunda (2)
|
2,668,683
|
8.1
|
%
|
|||||
|
|
||||||||
|
Claudia Grimaldi
|
444,007
|
1.4
|
%
|
|||||
|
|
||||||||
|
Richard Prins
|
268,000
|
0.8
|
%
|
|||||
|
|
||||||||
|
Sudhakar Shenoy
|
830,000
|
2.5
|
%
|
|||||
|
All Executive Officers and Directors as a group (4 persons)
|
4,210,690
|
12.8
|
%
|
|||||
*Based on fully diluted 32,854,140 shares of common stock outstanding as of May 31, 2018.
|
(1)
|
Unless otherwise indicated, the address of each of the individuals listed in the table is c/o India Globalization Capital, Inc., 4336 Montgomery Avenue, Bethesda, MD 20814.
|
|
(2)
|
The beneficial ownership table includes 492,689 shares of common stock that is owned by Mr. Mukunda’s spouse for which Mr. Mukunda has no voting or financial rights.
|
During the last two fiscal years, we have not entered into any material transactions or series of transactions that would be considered material in which any officer, director or beneficial owner of 5% or more of any class of our capital stock, or any immediate family member of any of the preceding persons, had direct or indirect material interest, nor are there any such transactions presently proposed, other than the agreements with the affiliates of our CEO, and ex-CFO as described under “Executive Compensation – Compensation for Executive Officers of the Company.”
Review, Approval or Ratification of Related Party Transactions
We do not maintain a formal written procedure for the review and approval of transactions with related persons. It is our policy for the disinterested members of our Board to review all related party transactions on a case-by-case basis. To receive approval, a related-party transaction must have a business purpose for us and be on terms that are fair and reasonable to us and as favorable to us as would be available from non-related entities in comparable transactions.
Director Independence
The NYSE American, upon which our shares are listed, requires the majority of our Board to be “independent.” The NYSE American listing standards define an “independent director” generally as a person, other than an officer or an employee of the company, who does not have a relationship with the company that would interfere with the director’s exercise of independent judgment. Consistent with these standards, the Board of Directors has determined that Richard Prins and Sudhakar Shenoy are independent directors.
Manohar Chowdhry & Associates (“MCA) is our Principal Independent Registered Public Accounting Firm engaged to examine our financial statements for the fiscal year ended March 31, 2018. During the Company’s most two recent fiscal years ended March 31, 2017 and 2018, and through May 25, 2018, the Company did not consult with MCA on (i) the application of accounting principles to a specified transaction, either completed or proposed, or the type of audit opinion that may be rendered on the Company’s financial statements, and MCA has not provided either a written report or oral advice to the Company that was an important factor considered by the Company in reaching a decision as to any accounting, auditing, or financial reporting issue; or (ii) the subject of any disagreement, as defined in Item 304(a)(1)(iv) of Regulation S-K and the related instructions, or a reportable event within the meaning set forth in Item 304(a)(1)(v) of Regulation S-K.
Audit Related and Other Fees
The table below shows the fees that we paid or accrued for the audit and other services provided by
Manohar Chowdhry & Associates and
AJSH & Co LLP for the fiscal years ended March 31, 2018 and 2017, respectively. Except as specified otherwise in the table, we paid the corresponding fees to
Manohar Chowdhry & Associates and
AJSH & Co LLP.
Audit Fees
This category includes the audit of our annual financial statements, review of financial statements included in our annual and quarterly reports and services that are normally provided by the independent registered public accounting firms in connection with engagements for those fiscal years. This category also includes advice on audit and accounting matters that arose during, or as a result of, the audit or the review of interim financial statements.
Audit-Related Fees
This category consists of assurance and related services by the independent registered public accounting firms that are reasonably related to the performance of the audit or review of our financial statements and are not reported above under “Audit Fees.” The services for the fees disclosed under this category include services relating to our registration statement and consultation regarding our correspondence with the SEC.
Tax Fees
This category consists of professional services rendered for tax compliance, tax planning and tax advice. These services include tax return preparation and advice on state and local tax issues.
All Other Fees
This category consists of fees for other miscellaneous items.
|
March 31,
|
||||||||
|
|
2018
|
2017
|
||||||
|
Audit Fees - Manohar Chowdhry & Associates
|
$
|
31,500
|
$
|
-
|
||||
|
Audit Fees – AJSH & Co LLP
|
27,500
|
80,000
|
||||||
|
Audit-Related Fees – AJSH & Co. LLP
|
7,200
|
-
|
||||||
|
Audit-Related Fees - Manohar Chowdhry & Associates
|
3,150
|
5,000
|
||||||
|
Tax Fees
|
-
|
-
|
||||||
|
All other Fees
|
-
|
-
|
||||||
|
Total
|
$
|
69,350
|
$
|
85,000
|
||||
Policy on Pre-Approval of Audit and Permissible Non-audit Services of Independent Auditors
Consistent with SEC policies regarding auditor independence, the audit committee of our Board of Directors has responsibility for appointing, setting compensation and overseeing the work of the independent auditor. In recognition of this responsibility, our Board of Directors has established a policy to pre-approve all audit and permissible non-audit services provided by the independent auditor. Prior to engagement of the independent auditor for the next year’s audit, management may submit, if necessary, an aggregate of services expected to be rendered during that year for each of the following four categories of services to our Board of Directors for approval.
| 1. |
Audit
services include audit work performed in the preparation of financial statements, as well as work that generally only the independent auditor can reasonably be expected to provide, including comfort letters, statutory audits, and attest services and consultation regarding financial accounting and/or reporting standards.
|
| 2. |
Audit-Related
services are for assurance and related services that are traditionally performed by the independent auditor, including due diligence related to mergers and acquisitions, employee benefit plan audits, and special procedures required to meet certain regulatory requirements.
|
| 3. |
Tax
services include all services performed by the independent auditor’s tax personnel except those services specifically related to the audit of the financial statements, and includes fees in the areas of tax compliance, tax planning and tax advice.
|
| 4. |
Other
Fees are those associated with services not captured in the other categories.
|
Prior to engagement, our Board of Directors pre-approves these services by category of service. The fees are budgeted, and our Board of Directors requires the independent auditor and management to report actual fees versus the budget periodically throughout the year by category of service. During the year, circumstances may arise when it may become necessary to engage the independent auditor for additional services not contemplated in the original pre-approval. In those instances, our Board of Directors requires specific pre-approval before engaging the independent auditor.
Our audit committee may delegate pre-approval authority to one or more of its members. The member to whom such authority is delegated must report, for informational purposes only, any pre-approval decisions to our Board of Directors at its next scheduled meeting.
Pre-Approved Services
The Audit Committee’s charter provides for pre-approval of audit, audit-related and tax services to be performed by the independent auditors. The Audit Committee approved the audit, audit-related and tax services to be performed by independent auditors and tax professionals in 2018. The charter also authorizes the Audit Committee to delegate to one or more of its members pre-approval authority with respect to permitted services. The decisions of any Audit Committee member to whom pre-approval authority is delegated must be presented to the full Audit Committee at its next scheduled meeting. The Audit Committee has not delegated such authority to its members.
Audit Committee Report
The Audit Committee of the Board is composed of two directors, each of whom meets the current NYSE American test for independence. The Committee acts under a written charter adopted by the Board. The Audit Committee has prepared the following report on its activities with respect to the Company’s audited financial statements for the fiscal year ended March 31, 2018 (the “Audited Financial Statements”):
| • |
The Audit Committee reviewed and discussed the Company’s Audited Financial Statements with management;
|
| • |
The Audit Committee discussed with Manohar Chowdhry & Associates, the Company’s independent auditors for fiscal year 2018, the matters required to be discussed by Statements on Auditing Standards No. 61 (Codification of Statements on Auditing Standards, AU §380), as adopted by the Public Company Accounting Oversight Board in Rule 3200T;
|
| • |
The Audit Committee received from the independent auditors the written disclosures regarding auditor independence and the letter required by Independence Standards Board Standard No. 1 (Independence Discussions with Audit Committees), discussed with Manohar Chowdhry & Associates, its independence from the Company and its management, and considered whether Manohar Chowdhry & Associates’ provision of non-audit services to the Company was compatible with the auditor’s independence; and
|
| • |
Based on the review and discussion referred to above, and in reliance thereon, the Audit Committee recommended to the Board that the Audited Financial Statements be included in the Company’s Annual Report on Form 10-K for the fiscal year ended March 31, 2018, for filing with the U.S. Securities and Exchange Commission.
|
All members of the Audit Committee concur in this report.
AUDIT COMMITTEE:
Richard Prins
Sudhakar Shenoy
PART IV
The exhibits listed in the accompanying index to exhibits are filed, furnished, or incorporated by reference as part of this Annual Report on Form 10-K.
(a
) All Financial Statements
|
Index to Consolidated Financial Statements
|
Page
|
|
Report of Independent Registered Public Accounting Firms
|
28 |
|
Consolidated Balance Sheets
|
31 |
|
Consolidated Statements of Operations
|
30 |
|
Consolidated Statements of Income
|
32 |
|
Consolidated Statements of Changes in Stockholder’s Equity
|
33 |
|
Consolidated Statements of Cash Flows
|
34 |
|
Notes to Consolidated Financial Statements
|
35 |
(b)
Exhibits
required by Item 601 of Regulation S-K
|
3.1
|
|
|
3.2
|
|
|
10.01**
|
|
|
10.02
|
|
|
10.03
|
|
|
10.04
|
|
|
10.05
|
|
|
10.06
|
|
|
10.07
|
|
|
10.08
|
|
|
10.09**
|
|
|
10.10
|
|
|
10.11
|
|
|
10.12
|
|
|
21.1*
|
|
|
23.1*
|
|
|
23.2*
|
|
31.1*
|
|
|
31.2*
|
|
|
31.3*
|
|
|
32.1*
|
|
|
32.2*
|
|
|
32.3*
|
|
|
101.INS***
|
XBRL Instance Document.
|
|
101.SCH***
|
XBRL Taxonomy Extension Schema Document.
|
|
101.CAL***
|
XBRL Taxonomy Extension Calculation Linkbase Document.
|
|
101.DEF***
|
XBRL Taxonomy Extension Definition Linkbase Document.
|
|
101.LAB***
|
XBRL Taxonomy Extension Label Linkbase Document.
|
|
101.PRE***
|
XBRL Taxonomy Extension Presentation Linkbase Document.
|
| * |
Filed herewith.
|
** Indicates management contract or compensatory plan or arrangement.
*** Furnished herewith
None
SIGNATURES
Pursuant to the requirements of Section 13 or 15(d) of the Exchange Act of 1934, the registrant has duly caused this report to be signed on its behalf by the undersigned, thereunto duly authorized.
|
|
INDIA GLOBALIZATION CAPITAL, INC.
|
|
|
|
|
|
|
Date: June 21, 2018
|
By:
|
/s/ Ram Mukunda
|
|
|
|
Ram Mukunda
|
|
|
|
President and Chief Executive Officer
(Principal Executive Officer)
|
|
|
|
|
|
Date: June 21, 2018
|
By:
|
/s/ Claudia Grimaldi
|
|
|
|
Claudia Grimaldi
|
|
|
|
Vice-president
(Principal Financial Officer)
|
|
|
|
|
|
Date: June 21, 2018
|
By:
|
/s/ Rohit Goel
|
|
|
|
Rohit Goel
|
|
|
|
(Principal Accounting Officer)
|
|
|
|
|
Pursuant to the requirements of the Securities Exchange Act of 1934, this report has been signed below by the following persons on behalf of the registrant and in the capacities and on the dates indicated.
|
Date: June 21, 2018
|
|
/s/ Ram Mukunda
|
|
|
|
Ram Mukunda
|
|
|
|
President, Chief Executive Officer and Director
(Principal Executive Officer)
|
|
Date: June 21, 2018
|
|
/s/ Claudia Grimaldi
|
|
|
|
Claudia Grimaldi
Vice-president
|
|
|
|
(Principal Financial Officer)
|
|
Date: June 21, 2018
|
|
/s/ Rohit Goel
|
|
|
|
Rohit Goel
|
|
|
|
(Principal Accounting Officer)
|
|
Date: June 21, 2018
|
|
/s/ Richard Prins
|
|
|
|
Richard Prins
|
|
|
|
Chairman of the Board of Directors
|
|
Date: June 21, 2018
|
|
/s/ Sudhakar Shenoy
|
|
|
|
Sudhakar Shenoy
|
|
|
|
Director
|
69
 |
2018 Form 10-K
|
2018 Form 10-K
|
2018 Form 10-K
TABLE OF CONTENTS
Part IItem 1. BusinessItem 1A. Risk FactorsItem 1B. Unresolved Staff CommentsItem 2. PropertiesItem 3. Legal ProceedingsItem 4. Mine Safety DisclosuresPart IIItem 5. Market For Registrant S Common Equity, Related Stockholder Matters and Issuer Purchases Of Equity SecuritiesItem 6. Selected Financial Data & Supplementary Financial InformationItem 6 Does Not Apply To Us Because We Are A Smaller Reporting CompanyItem 7. Management S Discussion and Analysis Of Financial Condition and Results Of OperationsItem 8. Financial Statements and Supplementary DataNote 1 Business Organization and Corporate UpdateNote 2 Summary Of Significant Accounting PoliciesNote 3 AcquisitionsNote 4 InventoryNote 5 Other Current and Non-current AssetsNote 6 Intentionally Left in BlankNote 7 Notes Payable and Loans - OthersNote 8 Other Current and Non-current LiabilitiesNote 9 Other Income (net) & Investments / Associates / Joint VenturesNote 10 Fair Value Of Financial InstrumentsNote 11 Intangible Assets & GoodwillNote 12 Related Party TransactionsNote 13 Commitments and ContingenciesNote 14 Property, Plant, and EquipmentNote 15 Selling, General and Administrative ExpensesNote 16 Stock-based CompensationNote 17 Employee BenefitsNote 18 Income TaxesNote 19 Segment InformationNote 20 Reconciliation Of EpsNote 21 Investments OthersNote 22 Investment Held For SaleNote 23 Certain Aged ReceivablesNote 24 Investment in AffiliatesNote 25 Subsequent EventsItem 9 Changes in and Disagreements with Accountants on Accounting and Financial DisclosureItem 9A. Controls and ProceduresItem 9B. Other InformationPart IIIItem 10. Directors, Executive Officers and Corporate GovernanceItem 11. Executive CompensationItem 12. Security Ownership Of Certain Beneficial Owners and Management and Related Stockholder MattersItem 13. Certain Relationships and Related Transactions, and Director IndependenceItem 14. Principal Accountant Fees and ServicesPart IVItem 15. Exhibits and Financial Statement SchedulesItem 16. Form 10 - K Summary