IHEARTMEDIA, INC.
10-Ks and 10-Qs
|
|
|
|
|
|
|
|
|
|
|
|
|
|
|
|
|
|
|
|
|
|
|
|
|
|
|
|
|
|
|
|
|
|
|
|
|
|
|
|
|
|
|
|
|
|
|
|
|
|
UNITED STATES
SECURITIES AND EXCHANGE COMMISSION
WASHINGTON, D.C. 20549
FORM 10-K
|
[X]
|
Annual report pursuant to Section 13 or 15(d) of the Securities Exchange Act of 1934
|
|
For the fiscal year ended December 31, 2019, or
|
|
|
[ ]
|
Transition report pursuant to Section 13 or 15(d) of the Securities Exchange Act of 1934
For the transition period from ________ to _________.
|
Commission File Number
000-53354
IHEARTMEDIA, INC.
(Exact name of registrant as specified in its charter)
|
Delaware
|
26-0241222
|
|
(State or other jurisdiction of incorporation or organization)
|
(I.R.S. Employer Identification No.)
|
|
20880 Stone Oak Parkway
San Antonio, Texas
|
78258
|
|
(Address of principal executive offices)
|
(Zip code)
|
(210) 822-2828
(Registrant’s telephone number, including area code)
Securities registered pursuant to Section 12(b) of the Act:
|
Title of each class
|
Trading Symbol(s)
|
Name of each exchange on which registered
|
|
Class A Common Stock, par value $0.001 per share
|
iHRT
|
The Nasdaq Stock Market LLC
|
Securities registered pursuant to Section 12(g) of the Act: None
|
Indicate by check mark if the registrant is a well-known seasoned issuer, as defined in Rule 405 of the Securities Act. YES [ ] NO [X]
|
|
Indicate by check mark if the registrant is not required to file reports pursuant to Section 13 or Section 15(d) of the Exchange Act. YES [ ] NO [X]
|
|
Indicate by check mark whether the registrant (1) has filed all reports required to be filed by Section 13 or 15(d) of the Securities Exchange Act of 1934 during the preceding 12 months (or for such shorter period that the registrant was required to file such reports), and (2) has been subject to such filing requirements for the past 90 days. YES [X] NO [ ]
|
|
Indicate by check mark whether the registrant has submitted electronically every Interactive Data File required to be submitted pursuant to Rule 405 of Regulation S-T during the preceding 12 months (or for such shorter period that the registrant was required to submit such files).YES [X] NO [ ]
|
|
Indicate by check mark whether the registrant is a large accelerated filer, an accelerated filer, a non-accelerated filer, a smaller reporting company, or an emerging growth company. See the definitions of “large accelerated filer,” “accelerated filer,” “smaller reporting company” and "emerging growth company" in Rule 12b-2 of the Exchange Act. Large accelerated filer [X] Accelerated filer [ ] Non-accelerated filer [ ] Smaller reporting company [ ] Emerging growth company [ ]
|
|
If an emerging growth company, indicate by check mark if the registrant has elected not to use the extended transition period for complying with any new or reviews financial accounting standards provided pursuant to Section 13(a) of the Exchange Act. [ ]
|
|
Indicate by check mark whether the registrant is a shell company (as defined in Exchange Act Rule 12b-2). YES [ ] NO [X]
|
|
Indicate by check mark whether the registrant has filed all documents and reports required to be filed by Section 12, 13 or 15(d) of the Securities Exchange Act of 1934 subsequent to the distribution of securities under a plan confirmed by a court. YES [X] NO [ ]
|
|
The aggregate market value of the Class A Common Stock held by non-affiliates of the registrant, based on the closing sales price of $15.05 on June 28, 2019, was approximately $854.9 million.
|
|
On February 21, 2020, there were 58,538,442 outstanding shares of Class A common stock, 6,901,987 outstanding shares of Class B common stock, and 80,175,925 outstanding Special Warrants.
|
DOCUMENTS INCORPORATED BY REFERENCE
Portions of the registrant’s Definitive Proxy Statement for the registrant’s 2020 Annual Meeting of Stockholders to be filed with the Securities and Exchange Commission within 120 days after the end of the fiscal year ended December 31, 2019 are incorporated herein by reference in Part III of this Annual Report on Form 10-K.
IHEARTMEDIA, INC.
INDEX TO FORM 10-K
|
Page
Number
|
||
|
PART I
|
||
|
Item 1.
|
||
|
Item 1A.
|
||
|
Item 1B.
|
||
|
Item 2.
|
||
|
Item 3.
|
||
|
Item 4.
|
||
|
PART II
|
||
|
Item 5.
|
||
|
Item 6.
|
||
|
Item 7.
|
||
|
Item 7A.
|
||
|
Item 8.
|
||
|
Item 9.
|
||
|
Item 9A.
|
||
|
Item 9B.
|
||
|
PART III
|
||
|
Item 10.
|
||
|
Item 11.
|
||
|
Item 12.
|
||
|
Item 13.
|
||
|
Item 14.
|
||
|
PART IV
|
||
|
Item 15.
|
||
|
Item 16.
|
||
Basis of Presentation
As used in this Annual Report on Form 10-K (this “Form 10-K”), unless the context otherwise requires, references to: “we,” “us,” “our,” the “Company,” “iHeartMedia” and similar references refer to iHeartMedia, Inc.
On March 14, 2018 (the “Petition Date”), the Company, iHeartCommunications, Inc. (“iHeartCommunications”) and certain of the Company’s direct and indirect domestic subsidiaries (collectively, the “Debtors”) filed voluntary petitions for relief (the “Chapter 11 Cases”) under Chapter 11 of the United States Bankruptcy Code. On May 1, 2019 (the “Effective Date”), the Company emerged from Chapter 11 of the Bankruptcy Code through (a) a series of transactions (the “Separation”) through which our former subsidiary, Clear Channel Outdoor Holdings, Inc. (“CCOH”), its parent Clear Channel Holdings, Inc. (“CCH”) and its subsidiaries (collectively with CCOH and CCH, the “Outdoor Group”) were separated from, and ceased to be controlled by, us and our subsidiaries (the “iHeart Group”), and (b) a series of transactions (the “Reorganization”) through which iHeartCommunications’ debt was reduced from approximately $16 billion to approximately $5.8 billion and a global compromise and settlement among holders of claims (“Claimholders”) in connection with the Chapter 11 Cases was effected (collectively, the “Plan of Reorganization”). All of the Company’s equity existing as of the Effective Date was canceled on such date and 56,861,941 shares of Class A common stock, 6,947,567 shares of Class B common stock, and 81,453,648 special warrants were issued on the Effective Date pursuant to our Plan of Reorganization.
Upon the Company's emergence from the Chapter 11 Cases, the Company adopted fresh start accounting, which resulted in a new basis of accounting and the Company becoming a new entity for financial reporting purposes. As a result of the application of fresh start accounting and the effects of the implementation of the Plan of Reorganization, the consolidated financial statements after the Effective Date, are not comparable with the consolidated financial statements on or before that date. Refer to Note 3, Fresh Start Accounting, for additional information.
References to “Successor” or “Successor Company” relate to the financial position and results of operations of the Company after the Effective Date. References to "Predecessor" or "Predecessor Company" refer to the financial position and results of operations of the Company on or before the Effective Date.
PART I
ITEM 1.
BUSINESS
Overview
iHeartMedia is the number one audio media company in the U.S. based on consumer reach.
Within the audio industry, companies operate in two primary sectors:
|
•
|
The ‘music collection’ sector, which essentially replaced downloads and CDs and
|
|
•
|
The radio-‘companionship’ sector, in which people regard their favorite broadcast radio personalities as trusted friends and companions on whom they rely to provide news on everything from entertainment and local content to points of view, information about new music and artists, weather, traffic and more.
|
We operate in the second sector and have used our large scale and national reach in broadcast radio to build additional complementary platforms. We are now the only major multi‑platform audio media company, with each platform building on and extending our companionship relationship with the consumer.
Our product strategy is ‘be where our listeners are with the products and services they expect from us’. Our reach now extends across more than 250 platforms and over 2,000 different connected devices-and that reach continues to grow.
The platforms we lead in are:
|
•
|
Broadcast radio
: We have a strong relationship with our consumers, and our broadcast radio audience is almost twice as large as that of the next largest commercial broadcast radio company, as measured by Nielsen.
|
|
•
|
Digital
: Our iHeartRadio digital platform is the number one streaming broadcast radio platform-with five times the digital listening hours of the next largest commercial broadcast radio company, as measured by Triton.
|
|
•
|
Podcasts
: We are the number one commercial podcast publisher-and we are two times the size of the next largest commercial podcaster as measured by downloads, according to Podtrac.
|
|
•
|
Social media
: Our personalities, stations and brands have a social footprint that includes 215 million fans and followers as measured by Shareablee, which is nine times the size of the next largest commercial broadcast audio media company. This social footprint was at the heart of delivering 310 billion social media impressions for our 2019 iHeartRadio Music Awards and its associated activities.
|
|
•
|
Events
: We have over 20,000 local live events per year and eight major nationally‑recognized tentpole events, which provide significant opportunities for consumer promotion, advertising and social amplification.
|
We have been able to unify all of our local brands under a master brand "iHeartRadio". Using that umbrella has allowed us to build our other platforms as well as extend into third‑party platforms like Snapchat, YouTube and cable and broadcast television.
Our business model has been to build strong consumer relationships at scale and monetize them by renting those relationships to unaffiliated third parties. We are transforming our sales process to be more competitive with the major digital players that have brought data, targeting and technology into the media buying process. Additionally, we have built out a strong marketing sales function to support the marketing needs of advertisers and agencies in addition to the more traditional media buying transactional relationships.
Our History
iHeartMedia, Inc. was formed as a Delaware corporation in May 2007 by private equity funds sponsored by Bain Capital Partners, LLC and Thomas H. Lee Partners, L.P. for the purpose of acquiring the business of iHeartCommunications, Inc., a Texas corporation (“iHeartCommunications”). The acquisition was completed on July 30, 2008 pursuant to an Agreement and Plan of Merger, dated November 16, 2006, as amended on April 18, 2007, May 17, 2007 and May 13, 2008. Prior to the consummation of our acquisition of iHeartCommunications, we had not conducted any activities, other than activities incident to our formation and in connection with the acquisition, and did not have any assets or liabilities, other than those related to the acquisition.
1
On the Petition Date, we and certain of our subsidiaries filed the Chapter 11 Cases under Chapter 11 of the United States Bankruptcy Code (“Chapter 11”). We emerged from Chapter 11 on the Effective Date. On June 28, 2019, we announced that The Nasdaq Stock Market LLC had approved the direct listing of the Company’s post-emergence Class A common stock, par value $0.001 per share, on the Nasdaq Global Select Market under the ticker symbol “IHRT”. The Class A common stock began trading on the Nasdaq Global Select Market on July 18, 2019. For additional information regarding our recent emergence from Chapter 11, see “Basis of Presentation” and Note 2, Emergence from Voluntary Reorganization under Chapter 11 Proceedings to our consolidated financial statements located in Item 8 of Part II of this Annual Report on Form 10-K.
Our Business Segments
As part of the Separation and Reorganization, we re-evaluated our segment reporting and have determined that our current business segments are:
|
•
|
Audio
, which provides media and entertainment services via broadcast and digital delivery and also includes our events and national syndication businesses; and
|
|
•
|
Audio & Media Services
, which provides other audio and media services, including our media representation business, Katz Media Group (“Katz Media”), and our provider of scheduling and broadcast software, Radio Computing Services (“RCS”).
|
Audio Segment
Our Audio segment operations include broadcast radio, digital, mobile, podcasts, social, live events including mobile platforms and products, program syndication, traffic, weather, news and sports data distribution and on-demand entertainment. Our Audio segment revenue was
$3,454.5 million
in
2019
,
$3,353.8 million
in
2018
and
$3,357.2 million
in
2017
.
Our radio stations and content can be heard on AM/FM stations, HD digital radio stations, satellite radio, on the Internet at iHeartRadio.com and our radio stations’ websites, and through our iHeartRadio mobile application in enhanced automotive dashes, on tablets, wearables and smartphones, on gaming consoles, via in-home entertainment and voice-controlled devices. As of December 31, 2019, we owned and operated
856
live broadcast radio stations and had a local sales force servicing approximately 160 U.S. markets, including 48 of the top 50 markets (with three markets embedded in larger markets), and 86 of the top 100 markets, (with four markets embedded in larger markets). We are also the beneficiary of Aloha Station Trust, LLC, Ocean Station Trust, LLC (the “Ocean Trust”) and Sun and Snow Station Trust, LLC which own and operates 4, 1 and 1 radio stations, respectively, all of which we were required to divest in order to comply with Federal Communication Commission (“FCC”) media ownership rules, and which are being marketed for sale.
According to Nielsen's Spring 2019 book, we have the most number one ranked stations across the top 160 markets, and across the largest 50 markets, with 74 and 28 number one ranked stations in these markets, respectively. With our broadcast radio platform alone, we have almost twice the broadcast radio audience of our next closest broadcast competitor. We also have five times the digital listening hours of our next closest commercial radio broadcast competitor.
We generate advertising revenue through three primary channels. The first is a transactional media relationship with national agencies where the Company is selling defined advertising units and impressions, primarily of inventory on our broadcast radio stations. The second is through a direct marketing relationship with both local and national clients and agencies where we use our diverse portfolio of assets to help develop a specific marketing solution tailored to the defined needs of the advertising partner. The third channel is the newest and smallest, but fastest growing, channel using data to develop specific targets and often executed over a technology platform. These three channels can all be used in varying degrees of efficiency over our multiple platforms including broadcast radio, digital streaming and display, podcast, social amplification and events. Our national scale and structure allows us to offer these solutions at a national, regional or local level, or any combination thereof. Our advertisers cover a wide range of categories, including consumer services, retailers, entertainment, health and beauty products, telecommunications, automotive, media and political. Our contracts with our advertisers range from less than one-year to multi-year terms.
Our Audio segment has the following businesses and revenue streams:
Broadcast Radio
: Our primary source of revenue is derived from selling local and national advertising time on our domestic radio stations, generating local and national broadcast revenue of
$2,233.2 million
in
2019
,
$2,264.1 million
in
2018
and
$2,292.1 million
in
2017
. Advertising rates are principally based on the length of the spot and how many people in a targeted audience listen to our stations, as measured by independent ratings services.
2
Increasingly, across both national and local markets, our advertisers are demanding data rich, analytics‑driven advertising solutions. iHeartMedia offers a comprehensive suite of tech‑enabled advertising solutions (that provide advanced attribution and analytics capability), including:
|
•
|
SoundPoint
: Our digital-like ad-buying solution that allows clients to view the available broadcast inventory across various cohorts to address their specific needs;
|
|
•
|
SmartAudio
: Our application of data science to aggregate business data from broadcasts and the user insights that come from listeners using our digital platform; and
|
|
•
|
iHeartMedia Analytics
: Our tools to present the effectiveness of clients' broadcast radio advertising campaigns by providing detailed digital dashboards on the results of the advertising spend
|
We expect these programmatic, data and analytic and attribution solutions to account for an increasing proportion of ad buying in the future.
3
Radio Stations
As of December 31,
2019
, we owned and operated
856
radio stations, including
243
AM and
613
FM radio stations. All of our radio stations are located in the United States. No one station is material to our overall operations. We believe that our properties are in good condition and suitable for our operations.
Radio broadcasting is subject to the jurisdiction of the Federal Communications Commission (“FCC”) under the Communications Act of 1934, as amended (the “Communications Act”). As described in “Regulation of Our iHeartMedia Business” below, the FCC grants us licenses in order to operate our radio stations. The following table provides the number of owned and operated radio stations in the top 25 Nielsen-ranked markets:
|
Nielsen
|
Number
|
|||
|
Market
|
of
|
|||
|
Rank
(1)
|
Market
|
Stations
(2)
|
||
|
1
|
New York, NY
|
6
|
||
|
2
|
Los Angeles, CA
|
8
|
||
|
3
|
Chicago, IL
|
6
|
||
|
4
|
San Francisco, CA
|
6
|
||
|
5
|
Dallas-Ft. Worth, TX
|
6
|
||
|
6
|
Houston-Galveston, TX
|
6
|
||
|
7
|
Washington, DC
|
5
|
||
|
8
|
Atlanta, GA
|
7
|
||
|
9
|
Philadelphia, PA
|
6
|
||
|
10
|
Boston, MA
|
8
|
||
|
11
|
Miami-Ft. Lauderdale-Hollywood, FL
|
7
|
||
|
12
|
Seattle-Tacoma, WA
|
8
|
||
|
13
|
Detroit, MI
|
6
|
||
|
14
|
Phoenix, AZ
|
8
|
||
|
15
|
Minneapolis-St. Paul, MN
|
6
|
||
|
16
|
San Diego, CA
|
7
|
||
|
17
|
Tampa-St. Petersburg-Clearwater, FL
|
8
|
||
|
18
|
Denver-Boulder, CO
|
8
|
||
|
20
|
Nassau-Suffolk, NY
|
1
|
||
|
21
|
Portland, OR
|
7
|
||
|
22
|
Baltimore, MD
|
4
|
||
|
23
|
Charlotte-Gastonia-Rock Hill, NC-SC
|
4
|
||
|
24
|
St. Louis, MO
|
6
|
||
|
25
|
San Antonio, TX
|
7
|
||
|
Total Top 25 Markets
|
150
(3)
|
|||
|
(1)
|
Source: Fall 2019 NielsenAudio Radio Market Rankings.
|
|
(2)
|
Excludes stations held in trust for sale.
|
|
(3)
|
Our station in the Nassau-Suffolk, NY market is also represented in the New York, NY Nielsen market. Thus, the actual number of stations in the top 25 markets is 150.
|
Digital:
Our Company’s reach now extends across more than 250 platforms, and 2,000 different connected devices. We generated digital revenue of
$376.2 million
in
2019
,
$284.6 million
in
2018
and
$248.7 million
in
2017
, comprised of streaming, subscription, display advertisements, podcasting and other content that is disseminated over digital platforms. Our leading streaming product, iHeartRadio, is a free downloadable mobile app and web‑based service that allows users to listen to their favorite radio stations, as well as digital‑only stations, custom artist stations, and podcasts. Monetization on the free streaming application occurs through national and local advertising. We also have two subscription-based offerings-iHeartRadio Plus and iHeartRadio All Access.
Within our digital business, our multi-platform strategy has also enabled us to extend our leadership into the rapidly
4
growing podcasting sector. Overall podcasting industry revenue is expected to increase to $0.9 billion by 2020, according to the iAB, from an estimated $0.5 billion in 2018. Podcasts continue to expand the audio landscape, and the number of users has increased to 90 million in the U.S. in 2019, with 32% of the U.S. population aged 12 and above having listened to a podcast in the last month (compared to 9% in 2008), according Edison in January 2019. By focusing on this trend, iHeartMedia has become the number one commercial podcast publisher, as measured by Podtrac with 150 million global monthly downloads and streams and 23 million U.S. unique monthly users, in December 2019. We also have one of the first and only podcasts to pass 1 billion downloads with Stuff You Should Know, as measured by Podtrac.
Networks:
We enable advertisers to engage with consumers through our Premiere Networks and Total Traffic & Weather services. We generate broadcast advertising revenue from selling local and national advertising on our programs featuring top personalities, and also generate revenue through the syndication of our programming to other media companies. Premiere Networks and Total Traffic & Weather generated revenue of
$614.7 million
in
2019
,
$582.3 million
in
2018
and
$581.7 million
in
2017
.
|
•
|
Premiere Networks
is a national radio network that produces, distributes or represents
more than 120
syndicated radio programs and services for more than
6,200
radio station affiliates. Our broad distribution capabilities enable us to attract and retain top programming talent. Some of our more popular syndicated programs feature top talent including Rush Limbaugh, Ryan Seacrest, Sean Hannity, Steve Harvey, Glenn Beck, Bobby Bones, Elvis Duran, Delilah, Colin Cowherd and Big Boy. We believe recruiting and retaining top talent is an important component of the success of our radio networks.
|
|
•
|
Total Traffic & Weather Network
delivers real‑time local traffic flow and incident information along with weather updates, sports and news to more than
2,100
radio stations and approximately
117
television affiliates, as well as through Internet and mobile partnerships, reaching over
210
million consumers each month. Total Traffic & Weather Network services
more than 220
markets in the U.S. and Canada. It operates the largest broadcast traffic navigation network in North America.
|
Sponsorship & Events:
Through our 20,000 local events per year and eight major nationally‑recognized tent pole events, as well as endorsement and appearance fees generated by on‑air talent, we generated
$209.5 million
of revenue in 2019,
$200.6 million
of revenue in 2018 and
$201.8 million
of revenue in 2017 from sponsorship, endorsement and other advertising revenue, as well as ticket sales and licensing. Our eight major tent pole events are: the iHeartRadio Music Festival, the iHeartRadio Music Awards, the iHeartRadio Wango Tango, the iHeartRadio Jingle Ball Tour, the iHeartCountry Festival, iHeartRadio ALTer Ego, the iHeartRadio Podcast Awards and the iHeartRadio Fiesta Latina.
Other
: Other revenue streams connected to our core broadcast and digital radio operations include fees earned for miscellaneous services such as on‑site promotions, activations, local marketing agreement (“LMA”) fees and tower rental provided to advertisers and other media companies. These services generated revenue of
$20.8 million
in 2019,
$22.2 million
in 2018 and
$32.8 million
in 2017.
Audio & Media Services Segment:
We also provide services to broadcast industry participants through our Katz Media and RCS businesses, which accounted for
$236.7 million
of revenue in 2019,
$264.1 million
of revenue in 2018 and
$236.0 million
of revenue in 2017.
|
•
|
Katz Media Group
is a leading media representation firm in the U.S. Katz Media represents more than
3,300
non‑iHeartMedia radio stations and over
800
television stations and their respective digital platforms. Katz generates revenue via commissions on media sold.
|
|
•
|
RCS
is a leading provider of broadcast and webcast software. Our software (radio station automation, music scheduling, HD2 solutions, newsroom software, audio logging and archiving, single station automation and contest tracking software) and technology (real‑time audio recognition technology) is used by more than
8,800
radio stations, television music channels, cable companies, satellite music networks and Internet stations worldwide.
|
Ultimately, our superior local, national, and online sales force combined with our leading digital, events, content, and representation business position us to cover a wide range of advertiser categories, including consumer services, retailers, entertainment, health and beauty products, telecommunications, automotive, media and political. Our contracts with our advertisers range from less than one‑year to multi‑year terms.
Our Growth Strategy
Our strategy is centered on building strong consumer relationships with national reach. Providing this kind of at-scale
5
companionship creates high-value advertising inventory for current audio advertisers as well as new advertisers and delivers superior returns to both. Moreover, we believe that we can leverage our investments in technology and data-informed decision making to capture increasing market share of the long tail of national and local revenue. The key elements of this growth strategy are:
Continued capture of advertising spend from all mediums
We intend to take advantage of our national scale, the brand power of "iHeartRadio," and product innovation to capture additional share of the overall radio advertising pool. We also believe our enhanced audience data and related analytics tools should drive capture of additional revenue from other advertising sectors, including digital and television, as advertisers are able to target audiences and measure the efficacy of their ad spend in a manner that mirrors the capabilities of these other mediums. We believe our advertising partners value the unique reach, engagement and return potential of audio, as well as iHeartMedia's differentiated platforms and marketing expertise, positioning the Company to capitalize on this trend.
We have made, and continue to make, significant investments so we can provide an ad-buying experience similar to that which was once only available from digital-only companies. Our programmatic solution for broadcast radio, SoundPoint, provides improved planning and automated ad-buying by relying on sophisticated planning algorithms and a cloud-based network across all of iHeartMedia's broadcast radio inventory to deliver highly optimized plans to our advertising customers. SmartAudio is our audio data analytics advertising platform for broadcast radio which can be executed through the SoundPoint product. With SmartAudio, advertisers can do impression-based audience planning and dynamic radio advertising that utilizes real-time triggers such as weather, pollen counts, sports scores, mortgage rates and more to deploy different campaign messages based on what is happening in a specific market at a specific moment. SmartAudio has allowed brands to use broadcast radio advertisements to dynamically serve the most relevant message in each market, at each moment, just as they do with digital campaigns, to ensure increased relevance and impact. In 2018, we launched iHeartMedia Analytics, the first fully digital measurement and attribution service for broadcast radio that we believe can transform the way advertisers plan, buy and measure much of their audio campaigns to better optimize the extensive reach of radio. We continue to look for ways to further develop our advertising capabilities in order to expand our share of advertising partners' budgets.
Increasing share of national advertising market
Broadcast radio is the number one consumer reach medium, and advertisers have a renewed appreciation for its scale, diverse demographic access and impact. We intend to complement our current local advertising presence in approximately 160 U.S. markets by further growing our stake in national advertising campaigns through our multi-platform portfolio of audio assets, roster of on-air talent, and the amplifying effect of our listeners' social engagement. As a result of our ongoing technology investments, national advertisers can now look to our audio offerings with their extensive reach, efficient pricing and digital-like analytics as powerful alternatives to other national ad mediums.
Broadening the scope of audio engagement
We continue to expand the spectrum of choices for our listeners-both in terms of compelling content and the array of ways in which it can be consumed. The proliferation of smart speakers and other connected devices greatly increases the range of options for accessing and interacting with our content. We are also very focused on rapidly growing content categories, such as our leadership position in podcasting. These initiatives not only improve the listener experience-they facilitate further engagement and heightened frequency of advertising impressions.
Notably, iHeartRadio, our all-in-one digital music, podcast and live streaming digital radio service, is available on an expansive range of platforms and devices including smart speakers, digital auto dashes, tablets, wearables, smartphones, virtual assistants, televisions and gaming consoles.
With the acquisition of Stuff Media, LLC in October 2018, we significantly extended our position as the largest commercial podcast publisher. We believe that podcasting is to talk what streaming is to music and is the next strategic audio platform. Our podcasting platform will allow us to capture incremental revenue as well as extend station brands, personalities and events onto a new platform-ultimately extending and deepening our consumer relationships and our opportunities for additional advertising revenue.
Employing technology to gain greater penetration of the long tail of advertising markets
In addition to having sellers in approximately 160 local markets across the U.S., which few media companies can claim, we intend to extend our technology platform to address the smaller clients that we do not currently reach through direct sales
6
operations. As indication of the size of the potential opportunity, we currently have approximately 60,000 total clients compared to millions of clients for some of our largest social and search competitors which utilize technology solutions for smaller advertisers.
Utilizing our unique bundle of advertising inventory to drive uplift
By adding other high cost per
mille
, the cost of every 1,000 advertisement impressions (“CPM”), platforms into our mix, as well as providing unique and differentiated solutions for advertisers, we believe that we have the potential to see a CPM uplift. Although our primary focus is revenue, we also aim to maximize the value of our inventory. Moreover, we are continuing to develop platforms (including podcasts) that independently garner superior CPMs.
Leveraging the iHeartRadio master brand to expand our high-profile live events platform
Audio is a social experience and an important extension of the medium is live events. For our listeners, live events are an opportunity to interact with fellow fans and engage with their favorite artists. For our advertising partners, they are a chance to reach a captivated and highly targeted audience directly tied to our high reach and strong engagement broadcast radio platform. They also provide an opportunity to extend into platforms like cable and broadcast television, create ancillary licensing revenue streams and serve as an opportunity for ticket revenue. As with all of our platforms, the data collection from these sources is valuable to both our product creation process and our advertisers. Through our portfolio of major award shows, festivals and 20,000 local live events, we intend to continue to find innovative ways to integrate sponsorships and deliver unique advertising moments. In so doing, we will seek to create additional revenue opportunities through this platform.
Competition
We compete for share of our listeners’ time and engagement, a challenging task in today’s fragmented and multi‑tasking world. We believe our national reach, the strength of our brand and assets, the quality of our programming and personalities, and the companionship nature of our medium allows us to compete effectively against both our legacy competition-cable and broadcast television, and other broadcast radio operators-as well the new, digital competition, including streaming music and video services, social media, and other digital companies.
Similarly, we compete for advertising and marketing dollars in the U.S. advertising market against an increasingly diverse set of competitors. Our legacy competition for the radio, podcast and digital advertising market includes legacy broadcast radio operators, as well as satellite radio companies, podcasters and streaming music companies with ad supported components of their business. We also compete in the larger U.S. advertising market-inclusive of the radio, podcast and digital opportunity-by developing and offering competitive advertising products intended to attract advertising and marketing dollars that might otherwise go to companies in the cable and broadcast television, digital, search, Internet, audio, print, newspaper, sponsorship and other advertising spaces.
Intellectual Property
Our success is dependent on our ability to obtain and maintain proprietary protection for our technology and the know‑how related to our business, defend and enforce our intellectual property rights and operate our business without infringing, misappropriating or otherwise violating valid and enforceable intellectual property rights of others. We seek to protect our investments made into the development of our technology by relying on a combination of patents, trademarks, copyrights, trade secrets, know‑how, confidentiality agreements and procedures, non‑disclosure agreements with third parties, employee disclosure and invention assignment agreements and other contractual rights.
As of December 31, 2019, we own approximately 170 issued U.S. patents, 130 pending U.S. patent applications, 10 issued foreign patents and 10 pending foreign patent applications, in addition to 350 U.S. trademarks registrations, 30 U.S. trademark applications, 850 state trademark registrations, 30 state trademark applications, 530 foreign registered trademarks and 40 foreign trademark applications. The duration of our intellectual property rights vary from country to country, but our U.S. patents expire 20 years from the patent filing date and we expect that our trademarks would expire between 2020 and 2034 assuming all required fees are paid.
We have filed and acquired dozens of issued patents and active patent applications in the U.S. and we continue to pursue additional patent protection where appropriate and cost effective. We intend to hold these patents as part of our strategy to protect and defend the Company’s technology, including to protect and defend the Company in patent‑related litigation. Our registered trademarks in the U.S. include our primary mark “iHeartRadio” and various versions of the iHeart word marks and logos. We have a portfolio of internet domain names, including our primary domains www.iheart.com and www.iheartmedia.com. We also have licenses with various rights holders to stream sound recordings and the musical compositions embodied therein, as further described
7
under “-Regulation of our Business-Content, Licenses and Royalties” below.
We believe that our intellectual property has significant value and is important to our brand‑building efforts and the marketing of our products and services. We cannot predict, however, whether steps taken by us to protect our proprietary rights will be adequate to prevent misappropriation of these rights. In addition to the forms of intellectual property listed above, we own rights to proprietary processes and trade secrets, including those underlying the iHeartRadio digital platform. While we use contractual and technological means to control the use and distribution of our proprietary software, trade secrets, and other confidential information, both internally and externally, including by entering into confidentiality agreements with our employees, contractors, and partners and maintaining physical security of our premises and physical and electronic security of our information technology systems, such measures can be breached, and we may not have adequate remedies for any such breach. In addition, our trade secrets may otherwise become known or be independently discovered by competitors.
Employees
As of
February 21, 2020
, we had approximately
11,400
employees. Approximately
700
of our employees are subject to collective bargaining agreements. We are a party to numerous collective bargaining agreements, none of which represent a significant number of employees. We believe that our relationship with our union and non-union employees is good.
Seasonality
For information regarding the seasonality of our business, please refer to Item 7 of Part II of this Annual Report on Form 10-K.
Regulation of our Business
General
Radio broadcasting is subject to extensive regulation, including by the FCC under the Communications Act. The Communications Act permits the operation of a radio broadcast station only under a license issued by the FCC upon a finding that grant of the license would serve the public interest, convenience and necessity. Among other things, the Communications Act empowers the FCC to: issue, renew, revoke and modify broadcast licenses; assign frequency bands for broadcasting; determine stations’ technical parameters; impose penalties and sanctions for violation of its regulations, including monetary forfeitures and, in extreme cases, license revocation; impose annual regulatory and application processing fees; and adopt and implement regulations and policies affecting the ownership, program content, employment practices and many other aspects of broadcast station operations.
This following summary does not comprehensively cover all current and proposed statutes, regulations and policies affecting our business. Reference should be made to the Communications Act, FCC rules, public notices and rulings and other relevant statutes, regulations, policies and proceedings for further information concerning the nature and extent of regulation of our business.
Transfer or Assignment of Licenses
The Communications Act prohibits the assignment of a license or the transfer of control of an FCC licensee without prior FCC approval. In determining whether to grant such approval, the FCC considers a number of factors pertaining to the existing licensee and the proposed licensee, including compliance with FCC’ rules and the “character” of the proposed licensees. Applications for license assignments or transfers involving a substantial change in ownership are subject to a 30‑day period for public comment, during which parties may petition to such applications.
License Renewal
The FCC grants broadcast licenses for a term of up to eight years. The FCC will renew a license for an additional eight‑year term if, after consideration of the renewal application and any objections thereto, it finds that the station has served the public interest, convenience and necessity and that, with respect to the station seeking renewal, there have been no serious violations of the Communications Act or the FCC’s rules and pattern of abuse of the Communications Act or FCC rules. The FCC may grant the license renewal application with or without conditions, including renewal for a term less than eight years, although renewal for less than the full eight‑year term is rare. While we cannot guarantee the unconditional grant of any future renewal application, our stations’ licenses historically have been renewed for the full eight‑year term.
8
Ownership Regulation
FCC rules and policies define the interests of individuals and entities, known as “attributable” interests, which implicate FCC rules governing ownership of broadcast stations. Under these rules, attributable interests generally include: (1) officers and directors of a licensee and of its direct and indirect parents; (2) general partners and limited liability company managers; (3) limited partners and limited liability company members, unless properly “insulated” from management activities; (4) a 5 percent or more direct or indirect voting stock interest in a corporate licensee or parent, except that, for a narrowly defined class of passive investors (, the attribution threshold is 20 percent voting; and (5) combined equity and debt interests in excess of 33 percent of a licensee’s total asset value, if certain other conditions are met (the “EDP Rule”). An entity that owns one or more radio stations in a market and programs more than 15 percent of the broadcast time under a local marketing agreement (“LMA”), or sells more than 15 percent per week of the advertising time under a joint sales agreement (“JSA”), on a radio station in the same market is also generally deemed to have an attributable interest in that station.
Debt instruments, non‑voting corporate stock, minority voting stock interests in corporations having a single majority stockholder, and properly insulated limited partnership and limited liability company interests generally are not subject to attribution unless such interests implicate the EDP Rule. To the best of our knowledge at present, none of our officers, directors or 5 percent or greater stockholders holds an interest in another broadcast station that is inconsistent with the FCC’s ownership rules.
The current FCC ownership rules relevant to our business are summarized below.
|
•
|
Local Radio Ownership Rule
. The maximum allowable number of radio stations that may be commonly owned in a market is based on the number of stations in the market. In markets with 45 or more stations, one entity may have an attributable interest in up to eight stations, of which no more than five are in the same radio service (AM or FM). In markets with 30-44 stations, one entity may have an attributable interest in up to seven stations, of which no more than four are in the same service. In markets with 15-29 stations, one entity may have an attributable interest in up to six stations, of which no more than four are in the same service. In markets with 14 or fewer stations, one entity may have an attributable interest in up to five stations, of which no more than three are in the same service, so long as the entity does not have an interest in more than 50 percent of all stations in the market. To apply these ownership tiers, the FCC relies on Nielsen Metro Survey Areas, where they exist, and a signal contour‑overlap methodology where they do not exist.
|
|
•
|
Newspaper‑Broadcast Cross‑Ownership Rule
. FCC rules currently prohibit an individual or entity from having an attributable interest in either a radio or television station and a daily newspaper located in the same market, subject to certain exceptions and with waivers available in particular cases.
|
|
•
|
Radio‑Television Cross‑Ownership Rule
. FCC rules currently limit the common ownership of television stations and same‑market radio stations. In general, an individual or entity may hold attributable interests in one television station and up to seven same-market radio stations (or two television stations and up to six same-market radio stations), depending on the number of independently owned radio, television and other specified media “voices” in the market.
|
The Communications Act requires the FCC to periodically review its media ownership rules, and those reviews have been and continue to be the subject of litigation and follow-on regulatory proceedings. Most recently, the United States Court of Appeals for the Third Circuit issued a decision that resulted in reinstatement of the radio-television and newspaper-broadcast cross-ownership rules, which the FCC had previously eliminated. There may be future litigation regarding this decision.
In December 2018, the FCC commenced its 2018 quadrennial review of its media ownership regulations. Among other things, the FCC is seeking comment on all aspects of the local radio ownership rule’s implementation and whether the current version of the rule remains necessary in the public interest. We cannot predict the outcome of the FCC’s media ownership proceedings or their effects on our business in the future.
Irrespective of the FCC’s media ownership rules, the Antitrust Division of the U.S. Department of Justice (“DOJ”) and the U.S. Federal Trade Commission (“FTC”) have the authority to determine that a particular transaction presents antitrust concerns. In particular, where the proposed purchaser already owns one or more radio stations in a particular market and seeks to acquire radio stations in that market, the DOJ has, in some cases, obtained consent decrees requiring radio station divestitures.
Alien Ownership Restrictions
The Communications Act and FCC regulations prohibit foreign entities or individuals from indirectly (i.e., through a parent company) owning or voting more than 25 percent of a licensee’s equity, unless the FCC determines that greater indirect foreign
9
ownership is in the public interest. The FCC generally will not make such a determination absent favorable executive branch review, and has not historically taken into account warrants and other future interests in determining foreign ownership compliance.
To the extent that our aggregate foreign ownership or voting percentages would exceed 25 percent, any foreign holder or “group” of holders, defined pursuant to FCC regulations, of our common stock whose ownership or voting percentage would exceed 5 percent or 10 percent (with the applicable percentage determined pursuant to FCC rules) must also obtain the FCC’s “specific approval.”
On July 25, 2019, we filed a Petition for Declaratory Ruling (“PDR”) requesting FCC consent to exceed the 25 percent foreign ownership and voting benchmarks that currently apply to us, on which the FCC has requested public comment. We cannot predict whether the FCC will issue a ruling granting the PDR, the amount of foreign equity and voting rights any such a ruling will allow us to have, or how long it will take to obtain such a ruling. See “Item 3. Legal Proceedings- Alien Ownership Restrictions and FCC Petition for Declaratory Ruling.”
Programming and Content Regulation
The Communications Act requires broadcasters to serve the “public interest.” A licensee must present programming that is responsive to issues in the station’s community of license and maintain records demonstrating this responsiveness. Federal law also regulates the broadcast of obscene, indecent or profane material. The FCC has authority to impose fines exceeding $400,000 per utterance with a cap exceeding $3.75 million for a continuing violation. In June 2012, the U.S. Supreme Court ruled on the appeals of several FCC indecency enforcement actions, but declined to rule on the constitutionality of the FCC’s indecency policies. The FCC has since solicited public comment on those policies in a proceeding which remains pending. In addition, the FCC regulates the conduct of on‑air station contests, requiring in general that the material rules and terms of the contest be broadcast periodically or posted online and that the contest be conducted substantially as announced. The FCC also regulates, among other things, political advertising, sponsorship identification, and the advertisement of contests and lotteries.
Equal Employment Opportunity
The FCC’s rules require broadcasters to engage in broad equal employment opportunity recruitment efforts, retain data concerning such efforts and report much of this data to the FCC and to the public via periodic reports filed with the FCC or placed in stations’ public files and websites. Broadcasters could be sanctioned for noncompliance.
Technical Rules
Numerous FCC rules govern the technical operating parameters of radio stations, including permissible operating frequency, power and antenna height and interference protections between stations. Changes to these rules could negatively affect the operation of our stations.
Content, Licenses and Royalties
We must pay royalties to copyright owners of musical compositions (typically, songwriters and publishers) whenever we broadcast or stream musical compositions. Copyright owners of musical compositions most often rely on intermediaries known as performing rights organizations (“PROs”) to negotiate licenses with copyright users for the public performance of their compositions, collect royalties under such licenses and distribute them to copyright owners. We have obtained public performance licenses from, and pay license fees to, the four major PROs in the U.S., which are the American Society of Composers, Authors and Publishers (“ASCAP”), Broadcast Music, Inc. (“BMI”), SESAC Performing Rights Organization (“SESAC”) and Global Music Rights LLC (“GMR”). There is no guarantee that additional PROs will not emerge, which could impact, and in some circumstances increase, our royalty rates and negotiation costs. The DOJ Antitrust Division is in the process of reviewing the consent decrees governing ASCAP and BMI to determine whether modification or sunset of those decrees is warranted. Material modification or sunset of the ASCAP and BMI decrees may increase our negotiation and licensing costs.
10
To secure the rights to stream music content over the Internet, we also must obtain performance rights licenses and pay public performance royalties to copyright owners of sound recordings (typically, performing artists and record companies). Under Federal statutory licenses, we are permitted to stream any lawfully released sound recordings and to make ephemeral reproductions of these recordings on our computer servers without having to separately negotiate and obtain direct licenses with each individual copyright owner as long as we operate in compliance with the rules of those statutory licenses and pay the applicable royalty rates to SoundExchange, the organization designated by the Copyright Royalty Board (“CRB”) to collect and distribute royalties under these statutory licenses. From time to time, SoundExchange notifies us that certain calendar years are subject to routine audits of our royalty payments. The results of such audits could result in higher royalty payments for the subject years. Sound recordings fixed on or after February 15, 1972 are protected by federal copyright law. Sound recording copyright owners have asserted that state law historically provided copyright protection for recordings fixed before that date (“pre-72 recordings”). Sound recording copyright owners have sued radio broadcasters and digital audio transmission services (including us) for unauthorized public performances and reproductions of pre-72 recordings under various state laws. In October 2018, federal legislation was signed into law that applies a statutory licensing regime to pre-72 recordings similar to that which governs post-72 recordings. Among other things, the new law extends remedies for copyright infringement to owners of pre-72 recordings when recordings are used without authorization. The new law creates a public performance right for pre-72 recordings streamed online that may increase our licensing costs. It also preempts state law infringement claims both prospectively and, in certain circumstances, retrospectively.
The rates at which we pay royalties to copyright owners are privately negotiated or set pursuant to a regulatory process. In addition, we have business arrangements directly with some copyright owners to receive deliveries of and, in some cases, to directly license their sound recordings for use in our Internet operations. There is no guarantee that the licenses and associated royalty rates that currently are available to us will be available to us in the future. Congress may consider and adopt legislation that would require us to pay royalties to sound recording copyright owners for broadcasting those recordings on our terrestrial radio stations. In addition, the CRB has issued a final determination establishing copyright royalty rates for the public performance and ephemeral reproduction of sound recordings by various non‑interactive webcasters, including radio broadcasters that simulcast their terrestrial programming online, to apply to the period January 1, 2016‑December 31, 2020 under the so‑called webcasting statutory license. A proceeding to establish the rates for 2021‑2025 began in 2019. Increased royalty rates could significantly increase our expenses, which could adversely affect our business. Additionally, there are conditions applicable to the webcasting statutory license. Some, but not all, record companies have agreed to waive or provide limited relief from certain of these conditions under certain circumstances for set periods of time. Some of these conditions may be inconsistent with customary radio broadcasting practices.
Proposed Changes
Congress, the FCC and other government agencies and regulatory bodies may in the future adopt new laws, regulations and policies that could affect, directly or indirectly, the operation, profitability and ownership of our broadcast stations and Internet‑based audio music services. In addition to the regulations, proceedings and procedures noted above, such matters may include, for example: proposals to impose spectrum use or other fees on FCC licensees; changes to the political broadcasting rules, including the adoption of proposals to provide free air time to candidates; restrictions on the advertising of certain products, such as beer and wine; spectrum reallocations and changes in technical rules; and the adoption of significant new programming and operational requirements designed to increase local community‑responsive programming and enhance public interest reporting requirements.
Antitrust and Market Concentration Considerations
Pending and potential future acquisitions, to the extent they meet specified size thresholds, will be subject to applicable waiting periods and possible review under the Hart‑Scott‑Rodino Act (the “HSR Act”) by the DOJ or the FTC, either of which can be required to, or can otherwise decide to, evaluate a transaction to determine whether that transaction should be challenged under the federal antitrust laws. Transactions generally are subject to the HSR Act if the acquisition price or fair market value of the stations to be acquired is $90 million or more (such threshold effective April 3, 2019). Acquisitions that are not required to be reported under the HSR Act may still be investigated by the DOJ or the FTC under the antitrust laws before or after consummation. At any time before or after the consummation of a proposed acquisition, the DOJ or the FTC could take such action under the antitrust laws as it deems necessary, including seeking to enjoin the acquisition or seeking divestiture of the business acquired or certain of our other assets. The DOJ has reviewed numerous potential radio station acquisitions where an operator proposed to acquire additional stations in its existing markets or multiple stations in new markets, and has challenged a number of such transactions. Some of these challenges have resulted in consent decrees requiring the sale of certain stations, the termination of LMAs or other relief. In general, the DOJ has more closely scrutinized radio mergers and acquisitions resulting in local market shares in excess of 35 percent of local radio advertising revenues, depending on format, signal strength and other factors. There is no precise numerical rule, however, and certain transactions resulting in more than 35 percent revenue shares have not been challenged, while certain other transactions may be challenged based on other criteria such as audience shares in one or more
11
demographic groups as well as the percentage of revenue share. We estimate that we have more than a 35% share of radio advertising revenues in many of our markets.
There can be no assurance that future acquisitions will not be the subject of an investigation or enforcement action by the DOJ or the FTC. Similarly, there can be no assurance that the DOJ, the FTC or the FCC will not prohibit such acquisitions, require that they be restructured, or in appropriate cases, require that we divest stations we already own in a particular market or divest specific lines of business. In addition, private parties may under certain circumstances bring legal action to challenge an acquisition under the antitrust laws.
As part of its review of certain radio station acquisitions, the DOJ has stated publicly that it believes that commencement of operations under LMAs, JSAs and other similar agreements customarily entered into in connection with radio station sale transactions prior to the expiration of the waiting period under the HSR Act could violate the HSR Act. In connection with acquisitions subject to the waiting period under the HSR Act, we will not commence operation of any affected station to be acquired under an LMA, a JSA, or similar agreement until the waiting period has expired or been terminated.
No assurances can be provided that actual, threatened or possible future DOJ or FTC action in connection with potential transactions would not have a material adverse effect on our ability to enter into or consummate various transactions, or operate any acquired stations at any time in the future.
Privacy and Data Protection
Privacy and data protection legislation and regulation play a significant role in our business. We obtain information from users of our technology platforms, including, without limitation, our websites, web pages, interactive features, applications, social media pages, and mobile application (“Platforms”), in accordance with the privacy policies and terms of use posted on the applicable Platform. We collect personally identifiable information directly from Platform users in several ways, including when a user purchases our products or services, registers to use our services, fills out a listener profile, posts comments, uses our social networking features, participates in polls and contests and signs up to receive email newsletters. We also may obtain information about our listeners from other listeners and third parties. We use and share this information for a variety of business purposes including for analytics, attribution and to manage and execute digital advertising campaigns in a variety of ways, including delivering advertisements to Internet users based on their geographic locations, the type of device they are using, their interests as inferred from their web browsing or app usage activity. Outside our radio business, we collect personally identifiable information from our employees, from our business partners and from consumers who interact with our digital panels, including the use of behavioral analysis software. In addition, we obtain anonymous and aggregated audience behavior information from third‑party data providers who represent to us that they are compliant with applicable laws.
We are subject to a number of laws and regulations relating to consumer protection, information security, data protection and privacy. Many of these laws and regulations are still evolving and could be interpreted in ways that could harm our business or limit the services we are able to offer. In the area of information security and data protection, the laws in several states in the United States and most countries require companies to implement specific information security controls and legal protections to protect certain types of personally identifiable information. Likewise, most states in the United States and most countries have laws in place requiring companies to notify users if there is a security breach that compromises certain categories of their personally identifiable information. Any failure on our part to comply with these laws may subject us to significant liabilities. For example, the California Consumer Privacy Act (“CCPA”) establishes a new privacy framework that expands the definition of personal information, establishes new data privacy rights for consumers residing in the State of California, imposes special rules on the collection of consumer data from minors, creates new notice obligations and new limits on the sale of personal information, and creates a new and potentially severe statutory damages framework for (i) violations of the CCPA and (ii) businesses that fail to implement reasonable security procedures and practices to prevent data breaches.
We regularly review and implement commercially reasonable organizational and technical physical and electronic security measures that are designed to protect against the loss, misuse, and alteration of our listeners’, employees’, clients’ and customers’ personally identifiable information and to protect our proprietary business information. Despite our best efforts, no security measures are perfect or impenetrable. Any failure or perceived failure by us to protect our information or information about our listeners, employees, clients and customers or to comply with our policies or applicable regulatory requirements could result in damage to our business and loss of confidence in us, damage to our brands, the loss of users of our services, including listeners, consumers, business partners and advertisers, as well as proceedings against us by governmental authorities or others, which could harm our business.
12
Available Information
You can find more information about us at our Internet website located at www.iheartmedia.com. Our Annual Report on Form 10-K, our Quarterly Reports on Form 10-Q, our Current Reports on Form 8-K and any amendments to those reports are available free of charge through our Internet website as soon as reasonably practicable after we electronically file such material with, or furnish such material to, the Securities and Exchange Commission (“SEC”). The contents of our websites are not deemed to be part of this Annual Report on Form 10-K or any of our other filings with the SEC.
ITEM 1A. RISK FACTORS
Our results have been in the past, and could be in the future, adversely affected by economic uncertainty or deteriorations in economic conditions.
We derive revenues from the sale of advertising. Expenditures by advertisers tend to be cyclical, reflecting economic conditions and budgeting and buying patterns. Periods of a slowing economy or recession, or periods of economic uncertainty, may be accompanied by a decrease in advertising. For example, the global economic downturn that began in 2008 resulted in a decline in advertising and marketing by our customers, which resulted in a decline in advertising revenues across our businesses. This reduction in advertising revenues had an adverse effect on our revenue, profit margins, cash flow and liquidity. If economic uncertainty increases or economic conditions deteriorate again, global economic conditions may once again adversely impact our revenue, profit margins, cash flow and liquidity. Furthermore, because a significant portion of our revenue is derived from local advertisers, our ability to generate revenues in specific markets is directly affected by local and regional conditions, and unfavorable regional economic conditions also may adversely impact our results. In addition, even in the absence of a downturn in general economic conditions, an individual business sector or market may experience a downturn, causing it to reduce its advertising expenditures, which also may adversely impact our results.
We face intense competition in our business.
We operate in a highly competitive industry, and we may not be able to maintain or increase our current audience ratings and advertising revenues. Our business competes for audiences and advertising revenues with other radio businesses, as well as with other media, such as streaming audio services, satellite radio, podcasts, other Internet-based services, television, live entertainment, newspapers, magazines and direct mail, within their respective markets. Audience ratings and market shares are subject to change for various reasons, including through consolidation of our competitors through processes such as mergers and acquisitions, which could have the effect of reducing our revenues in a specific market. Our competitors may develop technology, services or advertising media that are equal or superior to those we provide or that achieve greater market acceptance and brand recognition than we achieve. For example, our competitors may develop analytic products for programmatic advertising, and data and research tools, that are superior to those that we provide or that achieve greater market acceptance. It also is possible that new competitors may emerge and rapidly acquire significant market share in our business or make it more difficult for us to increase our share of advertising partners’ budgets. The advertiser/agency ecosystem is diverse and dynamic, with advertiser/agency relationships subject to change. This could have an adverse effect on us if an advertiser client shifts its relationship to an agency with whom we do not have as good a relationship. An increased level of competition for advertising dollars may lead to lower advertising rates as we attempt to retain customers or may cause us to lose customers to our competitors who offer lower rates that we are unable or unwilling to match.
Our ability to compete effectively depends in part on our ability to achieve a competitive cost structure. If we cannot do so, then our business, financial condition and operating results would be adversely affected.
Alternative media platforms and technologies may continue to increase competition with our broadcasting operations.
Our terrestrial radio broadcasting operations face increasing competition from alternative media platforms and technologies, such as broadband wireless, satellite radio, audio broadcasting by cable television systems, podcasts and Internet-based streaming music services, as well as consumer products, such as portable digital audio players and other mobile devices, smart phones and tablets, gaming consoles, in-home entertainment and enhanced automotive platforms. These technologies and alternative media platforms, including those used by us, compete with our broadcast radio stations for audience share and advertising revenues. We are unable to predict the effect that such technologies and related services and products will have on our broadcasting and digital operations. The capital expenditures necessary to implement these or other technologies could be substantial and we cannot assure you that we will continue to have the resources to acquire new technologies or to introduce new services to compete with other new technologies or services, or that our investments in new technologies or services will provide the desired returns.
13
Other companies employing new technologies or services could more successfully implement such new technologies or services or otherwise increase competition with our businesses.
Our business is dependent upon the performance of on-air talent and program hosts.
We employ or independently contract with many on-air personalities and hosts of syndicated radio programs, podcasts and other audio platforms, with significant loyal audiences in their respective markets. Although we have entered into long-term agreements with some of our key on-air talent and program hosts to protect our interests in those relationships, we can give no assurance that all or any of these persons will remain with us, will be able to continue to perform their duties or will retain their audiences. Competition for these individuals is intense and many of these individuals are under no legal obligation to remain with us. Our competitors may choose to extend offers to any of these individuals on terms which we may be unwilling to meet. Furthermore, the popularity and audience loyalty of our key on-air talent and program hosts is highly sensitive to rapidly changing public tastes. A loss of such popularity or audience loyalty is beyond our control and could have a material adverse effect on our ability to attract local and/or national advertisers and on our revenue and/or ratings, and could result in increased expenses.
If events occur that damage our reputation and brand, our ability to grow our user base, advertiser relationships, and partnerships may be impaired and our business may be harmed.
We have developed a brand that we believe has contributed to our success. We also believe that maintaining and enhancing our brand is critical to growing our user base, advertiser relationships and partnerships. The iHeartRadio master brand ties together our radio stations, digital platforms, social, podcasts and live events in a unified manner that reflects the quality and compelling nature of our listener experiences. Maintaining and enhancing our brand depends on many factors, including factors that are not entirely within our control. If we fail to successfully promote and maintain our brand or if we suffer damage to the public perception of our brand, our business may be harmed.
Our business is dependent on our management team and other key individuals.
Our business is dependent upon the performance of our management team and other key individuals. Although we have entered into agreements with members of our senior management team and certain other key individuals, we can give no assurance that any or all of them will remain with us, or that we will not continue to make changes to the composition of, and the roles and responsibilities of, our management team. Competition for these individuals is intense and many of our key employees are at-will employees who are under no obligation to remain with us, and may decide to leave for a variety of personal or other reasons beyond our control. If members of our management or key individuals decide to leave us in the future, if we decide to make further changes to the composition of, or the roles and responsibilities of, these individuals, or if we are not successful in attracting, motivating and retaining other key employees, our business could be adversely affected.
Our financial performance may be adversely affected by many factors beyond our control.
Certain factors that could adversely affect our financial performance by, among other things, decreasing overall revenues, the numbers of advertising customers, advertising fees or profit margins include:
|
•
|
unfavorable fluctuations in operating costs, which we may be unwilling or unable to pass through to our customers;
|
|
•
|
our inability to successfully adopt or our being late in adopting technological changes and innovations that offer more attractive advertising or listening alternatives than what we offer, which could result in
|
|
•
|
a loss of advertising customers or lower advertising rates, which could have a material adverse effect on our operating results and financial performance;
|
|
•
|
the impact of potential new or increased royalties or license fees charged for terrestrial radio broadcasting or the provision of our digital services, which could materially increase our expenses;
|
|
•
|
unfavorable shifts in population and other demographics, which may cause us to lose advertising customers as people migrate to markets where we have a smaller presence or which may cause advertisers to be willing to pay less in advertising fees if the general population shifts into a less desirable age or geographical demographic from an advertising perspective;
|
|
•
|
continued dislocation of advertising agency operations from new technologies and media buying trends;
|
|
•
|
adverse political effects and acts or threats of terrorism or military conflicts; and
|
|
•
|
unfavorable changes in labor conditions, which may impair our ability to operate or require us to spend more to retain and attract key employees.
|
14
Our substantial indebtedness may adversely affect our financial health and operating flexibility.
We currently have a
$450.0 million
undrawn senior secured asset-based revolving credit facility,
$4,322.3 million
in principal amount of secured debt and
$1,462.6 million
in principal amount of unsecured debt. This substantial amount of indebtedness could have important consequences to us, including:
|
•
|
increase our vulnerability to adverse general economic, industry, or competitive developments;
|
|
•
|
require us to dedicate a more substantial portion of our cash flows from operations to payments on our indebtedness, thereby reducing the availability of our cash flows to fund working capital, investments, acquisitions, capital expenditures, and other general corporate purposes;
|
|
•
|
limit our ability to make required payments under our existing contractual commitments, including our existing long-term indebtedness;
|
|
•
|
require us to sell certain assets;
|
|
•
|
restrict us from making strategic investments, including acquisitions, or causing us to make non-strategic divestitures;
|
|
•
|
limit our flexibility in planning for, or reacting to, changes in our business and the industry in which we operate;
|
|
•
|
place us at a competitive disadvantage compared to our competitors that have less debt;
|
|
•
|
cause us to incur substantial fees from time to time in connection with debt amendments or refinancings;
|
|
•
|
increase our exposure to rising interest rates because a substantial portion of our borrowings is at variable interest rates; and
|
|
•
|
limit our ability to borrow additional funds or to borrow on terms that are satisfactory to us.
|
Our financing agreements also contain covenants that may restrict our or our subsidiaries’ ability to, among other things, incur additional indebtedness, create liens on assets, engage in mergers, consolidations, liquidations and dissolutions, sell assets, pay dividends and distributions, make investments, loans, or advances, prepay certain junior indebtedness, engage in certain transactions with affiliates, amend material agreements governing certain junior indebtedness, and change lines of business. Although the covenants in our financing agreements are subject to various exceptions, we cannot assure you that these covenants will not adversely affect our ability to finance future operations, capital needs, or to engage in other activities that may be in our best interest. In addition, in certain circumstances, our long-term debt may require us to maintain specified financial ratios, which may require that we take action to reduce our debt or to act in a manner contrary to our business objectives. A breach of any of these covenants could result in a default under our financing agreements.
In addition, we may be able to incur additional indebtedness in the future. To the extent we incur additional indebtedness, the risks associated with our leverage described above would increase.
Uncertainty relating to the LIBOR calculation process and potential phasing out of LIBOR after 2021 may adversely affect the market value of our current or future debt obligations.
The London Inter-bank Offered Rate (“LIBOR”) and certain other interest “benchmarks” may be subject to regulatory guidance and/or reform that could cause interest rates under our current or future debt agreements to perform differently than in the past or cause other unanticipated consequences. The United Kingdom’s Financial Conduct Authority, which regulates LIBOR, has announced that it intends to stop encouraging or requiring banks to submit LIBOR rates after 2021, and it is unclear if LIBOR will cease to exist or if new methods of calculating LIBOR will evolve. If LIBOR ceases to exist or if the methods of calculating LIBOR change from their current form, interest rates on our debt obligations may be adversely affected.
Future acquisitions, dispositions and other strategic transactions could pose risks.
We frequently evaluate strategic opportunities both within and outside our existing lines of business. We expect from time to time to pursue acquisitions of certain businesses as well as strategic dispositions. These acquisitions or dispositions could be material. Acquisitions or dispositions involve numerous risks, including:
|
•
|
our acquisitions may prove unprofitable and fail to generate anticipated cash flows:
|
|
•
|
to successfully manage our business, we may need to:
|
|
•
|
recruit additional senior management as we cannot be assured that senior management of acquired businesses will continue to work for us and we cannot be certain that our recruiting efforts will succeed, and
|
|
•
|
expand corporate infrastructure to facilitate the integration of our operations with those of acquired businesses, because failure to do so may cause us to lose the benefits of any expansion that we decide to undertake by leading to disruptions in our ongoing businesses or by distracting our management;
|
|
•
|
we may enter into markets and geographic areas where we have limited or no experience;
|
|
•
|
we may encounter difficulties in the integration of new management teams, operations and systems;
|
15
|
•
|
our management’s attention may be diverted from other business concerns;
|
|
•
|
our dispositions may negatively impact revenues from our national, regional and other sales networks; and
|
|
•
|
our dispositions may make it difficult to generate cash flows from operations sufficient to meet our anticipated cash requirements, including debt service requirements.
|
Acquisitions and dispositions of media and entertainment businesses may require antitrust review by U.S. federal antitrust agencies and may require review by foreign antitrust agencies under the antitrust laws of foreign jurisdictions. We can give no assurances that the Department of Justice (“DOJ”), the U.S. Federal Trade Commission (“FTC”) or foreign antitrust agencies will not seek to bar us from acquiring or disposing of media and entertainment businesses or impose stringent undertakings on our business as a condition to the completion of an acquisition in any market where we already have a significant position.
Further, radio acquisitions are subject to FCC approval. Such transactions must comply with the Communications Act and FCC regulatory requirements and policies. The FCC’s media ownership rules remain subject to ongoing agency and court proceedings. Future changes could restrict our ability to dispose of or acquire new radio assets or businesses. See “Business-Regulation of our Business.”
Extensive current government regulation, and future regulation, may limit our radio broadcasting and other operations or adversely affect our business and financial results.
The domestic radio industry is heavily regulated by federal laws and regulations of several agencies, including the FCC. For example, the FCC could impact our profitability by imposing large fines on us if, in response to pending or future complaints, it finds that we broadcast indecent programming or violated other FCC regulations. The FCC’s enforcement priorities are subject to change, and we cannot predict whether the FCC may focus on other areas of legal compliance in the future. We have received, and may receive in the future, letters of inquiry and other notifications from the FCC concerning compliance with the Communications Act and FCC rules, and we cannot predict the outcome of any outstanding or future letters of inquiry and notifications from the FCC or the nature or extent of future FCC enforcement actions.
Additionally, we cannot be sure that the FCC will approve renewal of the licenses we must have in order to operate our stations. Nor can we be assured that our licenses will be renewed without conditions and for a full term. Beginning in June 2019 and continuing through April 2022, we (along with all other FCC radio broadcast licensees) are submitting applications to renew the FCC licenses for each of our broadcast radio stations on an every two-month rolling schedule by state. The non-renewal, or conditioned renewal, of a substantial number of these FCC licenses could have a materially adverse impact on our operations. Furthermore, possible changes in interference protections, spectrum allocations and other technical rules may negatively affect the operation of our stations. In addition, Congress, the FCC and other regulatory agencies have considered, and may in the future consider and adopt, new laws, regulations and policies that could, directly or indirectly, have an adverse effect on our business operations and financial performance.
Legislation and certain ongoing litigation may require us to pay additional royalties, including to additional parties such as record labels or recording artists.
We currently pay royalties to song composers and publishers, including through BMI, ASCAP, SESAC and GMR. We also pay royalties to record companies and their representative, SoundExchange, for digital music transmissions. Currently, Congress does not require that broadcasters pay royalties associated with the public performance of sound recordings for over-the-air transmissions. From time to time, however, Congress considers legislation that could change this.
Moreover, it is possible that our license fees and negotiating costs associated with obtaining rights to use musical compositions and sound recordings in our programming could materially increase as a result of private negotiations, one or more regulatory rate-setting processes, or administrative and court decisions. For example, we are involved in pending litigation and/or negotiations with ASCAP, BMI and SESAC related to royalty payments for the public performance of musical compositions, the outcome of which could cause us to owe increased royalty payments and adversely impact our business.
We are also involved in a proceeding before the CRB to determine statutory rates and terms for the public performance and ephemeral reproduction of sound recordings by various non-interactive webcasters, including iHeart, for the period from January 1, 2021 to December 31, 2025. Also, in October 2018, legislation was signed into law that creates a public performance right under federal law for pre-February 15, 1972 recordings streamed online. This law may increase our licensing costs.
Increased royalty rates could significantly increase our expenses, which could adversely affect our business and results of operations. Various other regulatory matters relating to our business are now, or may become, the subject of court litigation, and we cannot predict the outcome of any such litigation or its impact on our business.
16
Regulations and consumer concerns regarding data privacy and data protection, or any failure to comply with these regulations, could hinder our operations.
We utilize personal, demographic and other information from and about our listeners, consumers, business partners and advertisers as they interact with us. For example: (1) our broadcast radio station websites and our iHeartRadio digital platform collect personal information as users register for our services, fill out their listener profiles, post comments, use our social networking features, participate in polls and contests and sign-up to receive email newsletters; (2) we use tracking technologies, such as “cookies,” to manage and track our listeners’ interactions with us so that we can deliver relevant music content and advertising; (3) we collect credit card or debit card information from consumers, business partners and advertisers who use our services; and (4) we collect precise location data about certain of our Platform users for analytics, attribution and advertising purposes.
We are subject to numerous federal, state and foreign laws and regulations relating to consumer protection, information security, data protection and privacy, among other things. Many of these laws are still evolving, new laws may be enacted and any of these laws could be amended or interpreted by the courts or regulators in ways that could harm our business. For example, our ongoing efforts to comply with the European Union (“E.U.”) General Data Protection Regulation (“GDPR”), effective as of May 2018, or the new California Consumer Privacy Act (“CCPA”) effective as of January 2020 entail substantial expenses, and is diverting resources from other initiatives and projects, and could limit the services we are able to offer. The CCPA provides for a private right of action for unauthorized access, theft or disclosure of personal information in certain situations with possible damage awards of $100 to $750 per consumer per incident, or actual damages, whichever is greater, and also permits class action lawsuits. The California Attorney General may also impose penalties of up to $7,500 for each intentional violation of the CCPA. In addition, changes in consumer rights, expectations and demands regarding privacy and data protection could restrict our ability to collect, use, disclose and derive economic value from demographic and other information related to our listeners, consumers, business partners and advertisers, or to transfer employee data within the corporate group. New consumer rights, including the right for consumers to prevent the sale of their data or have their data deleted could lead to a depletion of our consumer database. Such new consumer rights and restrictions on our use of consumer data could limit our ability to provide customized music content to our listeners, interact directly with our listeners and consumers and offer targeted advertising opportunities to our business partners and advertisers. Although we have implemented and are implementing policies and procedures designed to comply with these laws and regulations, any failure or perceived failure by us to comply with our policies or applicable regulatory requirements related to consumer protection, information security, data protection and privacy could result in a loss of confidence in us, damage to our brands, the loss of listeners, consumers, business partners and advertisers, as well as proceedings against us by governmental authorities or others, which could hinder our operations and adversely affect our business.
If our security measures are breached, we could lose valuable information, suffer disruptions to our business, and incur expenses and liabilities including damages to our relationships with listeners, consumers, business partners, employees and advertisers.
We may be unable to anticipate or prevent unauthorized access. Our websites and digital platforms are vulnerable to software bugs, computer viruses, internet worms, break-ins, phishing attacks, attempts to overload servers with denial-of-service, or other attacks and similar disruptions from unauthorized use of our and third-party computer systems, any of which could lead to system interruptions, delays, or shutdowns, causing loss of critical data or the unauthorized access to personal data. A security breach could occur due to the actions of outside parties, employee error, malfeasance or a combination of these or other actions. Though it is difficult to determine what, if any, harm may directly result from any specific interruption or attack, any failure to maintain performance, reliability, security, and availability of our services and technical infrastructure to the satisfaction of our listeners may harm our reputation and our ability to retain existing listeners and attract new listeners. We cannot assure you that the systems and processes that we have designed to protect our data and our listeners’ data, to prevent data loss and to prevent or detect security breaches will provide absolute security, and we may incur significant costs in protecting against or remediating cyber-attacks. If an actual or perceived breach of our security occurs, we may face regulatory or civil liability, lose competitively sensitive business information or suffer disruptions to our business operations, information processes and internal controls. In addition, the public perception of the effectiveness of our security measures or services could be harmed, we could lose listeners, consumers, business partners and advertisers. In the event of a security breach, we could suffer financial exposure in connection with penalties, remediation efforts, investigations and legal proceedings and changes in our security and system protection measures. In the event an EU regulator were to determine we had not adequately complied with GDPR standards, we may (i) incur regulatory financial penalties or (ii) be required to notify European Data Protection Authorities, within strict time periods, about any personal data breaches, unless the personal data breach is unlikely to result in a risk to the rights and freedoms of the affected individuals. We may also be required to notify the affected individuals of the personal data breach where there is a high risk to their rights and freedoms. If we suffer a personal data breach, we could be fined up to EUR 20 million or 4% of worldwide annual turnover of the preceding financial year, whichever is greater. Any data breach by service providers that are acting as data processors (i.e., processing personal data on our behalf) could also mean that we are subject to these fines and have to comply with the notification obligations set out above.
17
Environmental, health, safety and land use laws and regulations may limit or restrict some of our operations.
As the owner or operator of various real properties and facilities, we must comply with various foreign, federal, state and local environmental, health, safety and land use laws and regulations. We and our properties are subject to such laws and regulations relating to the use, storage, disposal, emission and release of hazardous and non-hazardous substances and employee health and safety as well as zoning restrictions. Historically, we have not incurred significant expenditures to comply with these laws. However, additional laws which may be passed in the future, or a finding of a violation of or liability under existing laws, could require us to make significant expenditures and otherwise limit or restrict some of our operations.
Risks Related to our Recent Emergence from the Chapter 11 Cases
The ongoing effects of the Chapter 11 Cases following our emergence could adversely affect our business and relationships.
We have only recently emerged from bankruptcy. Our ability to change the public perception relating to our recently consummated Chapter 11 Cases may have an impact on our ability to continue to attract our audience, which is critical to our ability to achieve long-term profitability, and a negative public perception of our business due to our recently consummated bankruptcy proceedings may have a materially adverse effect on our results of operations and financial condition, particularly because our ability to achieve long-term profitability depends on our ability to reach our audience.
Our actual financial results following our emergence from the Chapter 11 Cases are not comparable to our historical financial information.
Following the Separation and Reorganization, we began to operate under a new capital structure. As a result of the Separation and Reorganization, we no longer include CCOH in our consolidated financial statements following the Effective Date. In addition, we adopted fresh-start accounting and, as a result, at the Effective Date, our assets and liabilities were recorded at fair value, which resulted in values that are different than the values recorded in our historical financial statements. Accordingly, our financial condition and results of operations from and after the Effective Date are not comparable to the financial condition or results of operations reflected in our historical financial statements. As a result of all these factors, our historical financial information is not indicative of our future financial performance.
It is possible that the Chapter 11 Cases may give rise to unfavorable tax consequences for us.
The tax treatment of the transactions consummated in the Chapter 11 Cases, including the Separation and cancellation of existing indebtedness, is highly complex. Although we have not yet filed the relevant income tax returns and we are continuing to update our analysis, we currently anticipate that the Separation resulted in the recognition of a loss for federal and most state income tax purposes (although we may recognize a gain in certain states) and, therefore, such transactions did not result in material cash tax liability. However, the Internal Revenue Service or other taxing authorities could assert in connection with a subsequent audit that additional cash tax liabilities may have arisen in connection with such transactions. To the extent the transactions do give rise to any cash tax liability, CCOH, iHeartCommunications, the Company and various other entities would be jointly and severally liable under applicable law for any such amounts. The allocation of any such liabilities among the Company and its subsidiaries post-consummation of the Plan of Reorganization and CCOH are addressed by the new tax matters agreement that was entered into in connection with the Separation.
We have substantially reduced or eliminated certain of our tax attributes, including NOL carryforwards, as a result of any cancellation of indebtedness income realized in connection with the Chapter 11 Cases.
The consummation of the Chapter 11 Cases resulted in an “ownership change,” as defined in Section 382 of the U.S. Internal Revenue Code of 1986, as amended. As a result, even if any NOLs or other tax attributes are not eliminated by cancellation of indebtedness income arising as a result of the Chapter 11 Cases, our ability to utilize any such attributes may be limited in the future.
In connection with the Separation, the Outdoor Group agreed to indemnify us and we agreed to indemnify the Outdoor Group for certain liabilities. There can be no assurance that the indemnities from the Outdoor Group will be sufficient to insure us against the full amount of such liabilities.
Pursuant to agreements that we entered into with the Outdoor Group in connection with the Separation, the Outdoor Group agreed to indemnify us for certain liabilities, and we agreed to indemnify the Outdoor Group for certain liabilities. For example, we will indemnify the Outdoor Group for liabilities to the extent such liabilities related to the business, assets and liabilities of iHeartMedia as well as liabilities relating to a breach of the Separation Agreement. We will also indemnify the Outdoor
18
Group for 50% of certain tax liabilities imposed on the Outdoor Group in connection with the Separation on or prior to the third anniversary of the Separation in excess of $5.0 million, with our aggregate liability limited to $15.0 million, and will reimburse the Outdoor Group for one-third of potential costs relating to certain agreements between the Outdoor Group and third parties in excess of $10.0 million up to the first $35.0 million of such costs such that we will not bear more than $8.33 million of such costs. However, third parties might seek to hold us responsible for liabilities that the Outdoor Group agreed to retain, and there can be no assurance that the Outdoor Group will be able to fully satisfy their respective indemnification obligations under these agreements. In addition, indemnities that we may be required to provide to the Outdoor Group could be significant and could adversely affect our business.
Risks Related to our Class A Common Stock
We have a significant number of outstanding warrants, which may cause significant dilution to our shareholders, adversely impact the market price of our Class A common stock and make it more difficult for us to raise funds through future equity offerings.
A majority of our equity was issued in the form of Special Warrants, which have no voting rights, and Class B common stock, which have only limited voting rights. As of
February 21, 2020
, we had
58,538,442
shares of Class A common stock,
6,901,987
shares of Class B common stock and
80,175,925
Special Warrants outstanding. The Special Warrants are currently exercisable into Class A common stock or Class B common stock at an exercise price of $0.001 per share, and the Class B common stock is currently convertible into Class A common stock on a share-for-share basis, in each case subject to the Ownership Restrictions described in Item 1. Business of this report. Upon the exercise of any Special Warrants or the conversion of any shares of Class B common stock, your voting rights as a holder of Class A common stock will be proportionately diluted. The issuance of shares of Class A common stock upon the exercise of warrants would dilute the percentage ownership interest of all holders of our Class A common stock and would increase the number of our publicly traded shares, which could depress the market price of our Class A common stock.
We do not intend to pay dividends on our Class A common stock for the foreseeable future.
We currently have no intention to pay dividends on our Class A common stock at any time in the foreseeable future. Any decision to declare and pay dividends in the future will be made at the discretion of our Board and will depend on, among other things, our results of operations, financial condition, cash requirements, contractual restrictions and other factors that our Board may deem relevant.
We are a holding company and rely on dividends, distributions and other payments, advances and transfers of funds from our subsidiaries to meet our obligations.
We are a holding company that does not conduct any business operations of our own. As a holding company, our investments in our operating subsidiaries constitute all of our operating assets. Our subsidiaries conduct all of our consolidated operations and own substantially all of our consolidated assets. As a result, we must rely on dividends and other advances, distributions and transfers of funds from our subsidiaries to meet our obligations. The ability of our subsidiaries to pay dividends or make other advances, distributions and transfers of funds will depend on their respective results of operations and may be restricted by, among other things, applicable laws limiting the amount of funds available for payment of dividends and certain restrictive covenants contained in the agreements of those subsidiaries. The deterioration of income from, or other available assets of, our subsidiaries for any reason could limit or impair their ability to pay dividends or other distributions to us.
Delaware law and certain provisions in our certificate of incorporation may prevent efforts by our stockholders to change the direction or management of our company.
Our certificate of incorporation and our by-laws contain provisions that may make the acquisition of our company more difficult without the approval of our Board, including, but not limited to, the following:
|
•
|
for the first three years following the Effective Date, our board of directors will be divided into three equal classes, with members of each class elected in different years for different terms, making it impossible for stockholders to change the composition of our entire Board in any given year;
|
|
•
|
action by stockholders may only be taken at an annual or special meeting duly called by or at the direction of a majority of our Board;
|
|
•
|
advance notice for all stockholder proposals is required;
|
|
•
|
subject to the rights of holders of any outstanding shares of our preferred stock, for so long as our board remains classified our directors may only be removed for cause and upon the affirmative vote of holders of a majority of the
|
19
voting power of the outstanding shares of our Class A common stock; and
|
•
|
for the first three years following the Effective Date, any amendment, alteration, rescission or repeal of the anti-takeover provisions of the charter, requires the affirmative vote of at least 66 2/3% in voting power of the outstanding shares of our stock entitled to vote generally in the election of directors.
|
We are also subject to the anti-takeover provisions contained in Section 203 of the General Corporation Law of the State of Delaware. Under these provisions, a corporation may not, in general, engage in a business combination with any holder of 15% or more of its voting stock unless the holder has held the stock for three years or, among other exceptions, the board of directors has approved the business combination or the transaction by which the person became an interested stockholder.
These and other provisions in our certificate of incorporation, bylaws and Delaware law could make it more difficult for stockholders or potential acquirers to obtain control of our Board or initiate actions that are opposed by our Board, including actions to delay or impede a merger, tender offer or proxy contest involving our company. The existence of these provisions could negatively affect the price of our common stock and limit opportunities for you to realize value in a corporate transaction.
Our certificate of incorporation designates the Court of Chancery of the State of Delaware, subject to certain exceptions, as the sole and exclusive forum for certain types of actions and proceedings that may be initiated by our stockholders, which could limit our stockholders’ ability to obtain a favorable judicial forum for disputes with us or our directors, officers or employees.
Our certificate of incorporation provides that the Court of Chancery of the State of Delaware, subject to certain exceptions, is the sole and exclusive forum for (i) any derivative action or proceeding brought on our behalf, (ii) any action asserting a claim of breach of a fiduciary duty owed by any of our directors, officers or other employees to us or our stockholders, (iii) any action asserting a claim against the company or any director or officer or employee of the company arising pursuant to any provision of the DGCL, our certificate of incorporation or our bylaws or (iv) any other action asserting a claim against us that is governed by the internal affairs doctrine. Any person or entity purchasing or otherwise acquiring any interest in shares of our capital stock shall be deemed to have notice of and to have consented to the provisions of our certificate of incorporation described above. This choice of forum provision may limit a stockholder’s ability to bring a claim in a judicial forum that it finds favorable for disputes with us or our directors, officers or other employee, which may discourage such lawsuits against us and our directors, officers and employees. Alternatively, if a court were to find these provisions of our certificate of incorporation inapplicable to, or unenforceable in respect of, one or more of the specified types of actions or proceedings, we may incur additional costs associated with resolving such matters in other jurisdictions, which could adversely affect our business and financial condition.
Regulations imposed by the Communications Act and the FCC limit the amount of foreign individuals or entities that may invest in our capital stock.
The Communications Act and FCC regulations restrict foreign ownership or control of any entity licensed to provide broadcast and certain other communications services. Among other prohibitions, foreign entities may not have direct or indirect ownership or voting rights of more than 25 percent in a corporation controlling the licensee of a radio broadcast station if the FCC finds that the public interest will be served by the refusal or revocation of such a license due to foreign ownership or voting rights exceeding that threshold. The FCC has interpreted this provision to mean that it must make an affirmative public interest finding before a broadcast license may be held by a corporation that is more than 25 percent owned or controlled, directly or indirectly, by foreign persons or other non-U.S. entities.
The FCC calculates foreign voting rights separately from equity ownership, and both must be at or below the 25 percent threshold unless the FCC has issued a declaratory ruling allowing foreign ownership or voting in excess of that threshold. Warrants and other future interests typically are not taken into account in determining foreign ownership compliance. To the extent that our aggregate foreign ownership or voting percentages would exceed 25 percent, any individual foreign holder of our common stock whose ownership or voting percentage would exceed 5 percent or 10 percent (with the applicable percentage determined pursuant to FCC rules) will additionally be required to obtain the FCC’s specific approval.
On July 25, 2019, we filed a PDR requesting FCC consent to exceed the 25 percent foreign ownership and voting benchmarks that currently apply to us, on which the FCC has requested public comment. We cannot predict whether the FCC will issue a ruling granting the PDR, the amount of foreign equity and voting rights any such a ruling will allow us to have, or how long it will take to obtain such a ruling.
Direct or indirect ownership of our securities could result in the violation of the FCC’s media ownership rules by investors with “attributable interests” in other radio stations or in the same market as one or more of our broadcast stations.
Under the FCC’s media ownership rules, a direct or indirect owner of our securities could violate and/or cause us to
20
violate the FCC’s structural media ownership limitations if that person owns or acquires an “attributable” interest in other radio stations in the same market as one or more of our radio stations. Under the FCC’s “attribution” policies the following relationships and interests generally are cognizable for purposes of the substantive media ownership restrictions: (1) ownership of 5 percent or more of a media company’s voting stock (except that, for a narrowly defined class of passive investors, the attribution threshold is 20 percent ); (2) officers and directors of a media company and its direct or indirect parent(s); (3) any general partnership or limited liability company manager interest; (4) any limited partnership interest or limited liability company member interest that is not “insulated,” pursuant to FCC-prescribed criteria, from material involvement in the management or operations of the media company; (5) certain same-market time brokerage agreements; (6) certain same-market joint sales agreements; and (7) under the FCC’s “equity/debt plus” standard, otherwise non-attributable equity or debt interests in a media company if the holder’s combined equity and debt interests amount to more than 33 percent of the “total asset value” of the media company and the holder has certain other interests in the media company or in another media property in the same market. Under the FCC’s rules, discrete ownership interests under common ownership, management, or control must be aggregated to determine whether or not an interest is “attributable.”
Our certificate of incorporation grants us broad authority to comply with FCC Regulations.
To the extent necessary to comply with the Communications Act, FCC rules and policies, and any FCC declaratory ruling related to our PDR, and in accordance with our certificate of incorporation, we may request information from any stockholder or proposed stockholder to determine whether such stockholder’s ownership of shares of capital stock may result in a violation of the Communications Act, FCC rules and policies, or any FCC declaratory ruling. We may further take the following actions, among others, to help ensure compliance with and to remedy any actual or potential violation of the Communications Act, FCC rules and policies, or any FCC declaratory ruling, or to prevent the loss or impairment of any of our FCC licenses: (i) prohibit, suspend or rescind the ownership, voting or transfer of any portion of our outstanding capital stock; (ii) redeem capital stock; and (iii) exercise any and all appropriate remedies, at law or in equity, in any court of competent jurisdiction, against any stockholder, to cure any such actual or potential violation or impairment.
FORWARD-LOOKING STATEMENTS
This report contains forward-looking statements that are subject to risks and uncertainties. All statements other than statements of historical fact included in this report are forward-looking statements. Forward-looking statements give our current expectations and projections relating to our financial condition, results of operations, plans, objectives, future performance and business. You can identify forward-looking statements by the fact that they do not relate strictly to historical or current facts. These statements may include words such as “anticipate,” “estimate,” “expect,” “project,” “plan,” “intend,” “believe,” “may,” “will,” “should,” “can have,” “likely” and other words and terms of similar meaning in connection with any discussion of the timing or nature of future operating or financial performance or other events. For example, all statements we make relating to our estimated and projected costs, expenditures, cash flows, growth rates and financial results, our plans and objectives for future operations, growth or initiatives, strategies or the expected outcome or impact of pending or threatened litigation are forward-looking statements. All forward-looking statements are subject to risks and uncertainties that may cause actual results to differ materially from those that we expected, including:
|
•
|
risks associated with weak or uncertain global economic conditions and their impact on the level of expenditures for advertising;
|
|
•
|
intense competition including increased competition from alternative media platforms and technologies;
|
|
•
|
dependence upon the performance of on-air talent, program hosts and management as well as maintaining or enhancing our master brand;
|
|
•
|
fluctuations in operating costs;
|
|
•
|
technological changes and innovations;
|
|
•
|
shifts in population and other demographics;
|
|
•
|
the impact of our substantial indebtedness;
|
|
•
|
the impact of future acquisitions, dispositions and other strategic transactions;
|
|
•
|
legislative or regulatory requirements;
|
|
•
|
the impact of legislation or ongoing litigation on music licensing and royalties;
|
|
•
|
regulations and consumer concerns regarding privacy and data protection, and breaches of information security measures;
|
|
•
|
risks associated with our recent emergence from the Chapter 11 Cases;
|
|
•
|
risks related to our Class A common stock, including our significant number of outstanding warrants;
|
|
•
|
regulations impacting our business and the ownership of our securities; and
|
|
•
|
other factors disclosed in the section entitled “Risk Factors” and elsewhere in this report.
|
21
We derive many of our forward-looking statements from our operating budgets and forecasts, which are based on many detailed assumptions. While we believe that our assumptions are reasonable, we caution that it is very difficult to predict the impact of known factors, and it is impossible for us to anticipate all factors that could affect our actual results. Important factors that could cause actual results to differ materially from our expectations, or cautionary statements, are disclosed under the sections entitled “Risk Factors,” and “Management’s Discussion and Analysis of Financial Condition and Results of Operations” in this report. All written and oral forward-looking statements attributable to us, or persons acting on our behalf, are expressly qualified in their entirety by these cautionary statements as well as other cautionary statements that are made from time to time in our other SEC filings and public communications. You should evaluate all forward-looking statements made in this report in the context of these risks and uncertainties.
We caution you that the important factors referenced above may not contain all of the factors that are important to you. In addition, we cannot assure you that we will realize the results or developments we expect or anticipate or, even if substantially realized, that they will result in the consequences or affect us or our operations in the way we expect. The forward-looking statements included in this report are made only as of the date hereof. We undertake no obligation to update or revise any forward-looking statement as a result of new information, future events or otherwise, except as otherwise required by law.
ITEM 1B. UNRESOLVED STAFF COMMENTS
None.
ITEM 2. PROPERTIES
Corporate
Our corporate headquarters are located in San Antonio, Texas, where we lease space for executive offices and a data and administrative service center. In addition, certain of our executive and other operations are located in New York, New York.
Audio
The types of properties required to support each of our radio stations include offices, studios, transmitter sites and antenna sites. We either own or lease our transmitter and antenna sites. A radio station’s studios are generally housed with its offices in downtown or business districts. A radio station’s transmitter sites and antenna sites are generally positioned in a manner that provides maximum market coverage.
The studios and offices of our radio stations are located in leased or owned facilities. These leases generally have expiration dates that range from one to 40 years. We do not anticipate any difficulties in renewing those leases that expire within the next several years or in leasing other space, if required. We lease substantially all of our towers and antennas and own substantially all of the other equipment used in our Audio business. For additional information regarding our Audio properties, see “Item 1. Business.”
ITEM 3. LEGAL PROCEEDINGS
Although we are involved in a variety of legal proceedings in the ordinary course of business, a large portion of our litigation arises in the following contexts: commercial disputes; defamation matters; employment and benefits related claims; governmental fines; intellectual property claims; and tax disputes.
For additional information regarding legal proceedings, refer to Note 10,
Commitments and Contingencies
“-Chapter 11 Cases” and -Stockholder Litigation”
to our Consolidated Financial Statements included in Part II of this Annual Report on Form 10-K.
Alien Ownership Restrictions and FCC Petition for Declaratory Ruling
The Communications Act and FCC regulation prohibit foreign entities and individuals from having direct or indirect ownership or voting rights of more than 25 percent in a corporation controlling the licensee of a radio broadcast station if the unless the FCC finds greater foreign ownership is in the public interest (the “Foreign Ownership Rule”). Under our Plan of Reorganization, we committed to file a PDR, but the FCC’s granting our PDR was not a condition to our emergence.
The equity allocation mechanism (“Equity Allocation Mechanism”) set forth in the Plan of Reorganization was intended to enable us to comply with the Foreign Ownership Rule and other FCC ownership restrictions in connection with our emergence. The Equity Allocation Mechanism imposed an obligation on each Claimholder to provide written certification sufficient for us to
22
determine whether issuance of common stock to such Claimholder would cause us to violate the Foreign Ownership Rule, and restricted us from issuing common stock to Claimholders such that it would cause us to exceed an aggregate alien ownership or voting percentage of 22.5 percent (the “22.5 Percent Threshold”).
After emerging from bankruptcy, we discovered that a group of Claimholders that had certified to having no foreign ownership or voting control in connection with the Equity Allocation Mechanism had subsequently undergone a separate merger transaction outside without our knowledge or control. As a result of this merger, these Claimholders’ interests in iHeartMedia (amounting to approximately nine percent of our issued and outstanding Class A common stock) can be voted by a U.S. subsidiary of a foreign parent. We notified the FCC of this development in writing promptly after discovering and confirming it. The FCC responded to our notification on July 9, 2019, indicating that (1) the FCC has not determined that this development is contrary to the public interest, and (2) the FCC has deemed us to be in compliance with the FCC’s foreign ownership reporting rules, pending its decision on our PDR. On July 25, 2019 we filed our PDR, which requests the FCC to permit up to 100% of our voting and equity to be owned by non‑U.S. individuals and entities. The FCC has requested public comment on the PDR, and we cannot predict the result or timing of the FCC’s decision on our PDR or the terms of a Declaratory Ruling if one is granted.
ITEM 4. MINE SAFETY DISCLOSURES
Not Applicable.
INFORMATION ABOUT OUR DIRECTORS
The following information with respect to our Board of Directors (the "Board") is presented as of
February 27, 2020
:
|
Name
|
Age
|
Position
|
||
|
Robert W. Pittman
|
66
|
Chairman of the Board
|
||
|
Gary Barber
|
62
|
Director
|
||
|
Richard J. Bressler
|
62
|
Director
|
||
|
Brad Gerstner
|
48
|
Director
|
||
|
Sean Mahoney
|
57
|
Director
|
||
|
James A. Rasulo
|
64
|
Director
|
||
|
Kamakshi Sivaramakrishnan
|
44
|
Director
|
||
Robert W. Pittman
was appointed the Company's Chairman on May 17, 2013. Prior to adding the Chairmanship, he became the Chief Executive Officer of the Company in October 2011. Mr. Pittman was also the Chairman and Chief Executive Officer of CCOH from March 2015 to May 2019 and a director of CCOH beginning in October 2011. Prior to October 2011, Mr. Pittman served as Chairman of Media and Entertainment Platforms for the Company and iHeartCommunications since November 2010. He was the founding member and investor in the Pilot Group LP ("Pilot Group"), a private equity investment company, since April 2003. Mr. Pittman was formerly Chief Operating Officer of AOL Time Warner, Inc. from May 2002 to July 2002. He also served as Co-Chief Operating Officer of AOL Time Warner, Inc. from January 2001 to May 2002, and earlier, as President and Chief Operating Officer of America Online, Inc. from February 1998 to January 2001. Earlier in his career, he was the programmer who led the team that created MTV and was later CEO of MTV Networks, Inc. and CEO of Six Flags Theme Parks, Inc., Time Warner Enterprises, Inc. and Century 21 Real Estate Corporation. Mr. Pittman was selected to serve as a member of our Board because of his service as our Chief Executive Officer, as well as his extensive media experience gained through the course of his career.
Gary Barber
has served as the Chairman and Chief Executive Officer of Spyglass Media Group, LLC, a premium content company, since March 2019. Mr. Barber served as the Chairman and CEO of Metro-Goldwyn-Mayer Inc. ("MGM"), a media company, from 2010 through March 2018 leading its turn-around out of bankruptcy. Prior to his role at MGM, he was Co-Chairman and Chief Executive Officer of Spyglass Entertainment Group, LLC, which he co-founded in 1998. Prior to Spyglass Entertainment Group, LLC, Mr. Barber served as Vice Chairman and Chief Operating Officer of Morgan Creek Productions and President of Vestron International Group. Mr. Barber received his undergraduate and post-graduate degrees from the University of Witwatersrand in South Africa and he practiced as a chartered accountant and certified public accountant in both South Africa and the U.S. with Price Waterhouse. We believe Mr. Barber’s extensive experience in finance and media brings tremendous value to the Board.
23
Richard J. Bressler
is the President, Chief Operating Officer, Chief Financial Officer and Director of the Company. Mr. Bressler was appointed as the Chief Financial Officer and President of the Company on July 29, 2013 and as Chief Operating Officer of the Company in February 2015. Mr. Bressler also served at the Chief Financial Officer of CCOH from July 2013 to May 2019. Prior thereto, Mr. Bressler was a Managing Director at the private equity investment company, Thomas H. Lee Partners, L.P. (“THL”). Prior to joining THL, Mr. Bressler was the Senior Executive Vice President and Chief Financial Officer of Viacom, Inc. from 2001 through 2005. He also served as Chairman and Chief Executive Officer of Time Warner Digital Media and, from 1995 to 1999, was Executive Vice President and Chief Financial Officer of Time Warner Inc. Prior to joining Time Inc. in 1988, Mr. Bressler was a partner with the accounting firm of Ernst & Young LLP. Mr. Bressler has been one of our directors since May of 2007. Mr. Bressler also currently is a director of Gartner, Inc., where he sits on the Audit Committee. Mr. Bressler previously served as a member of the boards of directors of Nielsen Holdings B.V. and Warner Music Group Corp. and as a member of the J.P. Morgan Chase National Advisory Board. Mr. Bressler holds a B.B.A. in Accounting from Adelphi University. Mr. Bressler was selected to serve as a member of our Board for his experience in and knowledge of the industry gained through his various positions with Viacom and Time Warner as well as his knowledge of finance and accounting gained from his experience at THL, Gartner, Inc. and Ernst & Young LLP.
Brad Gerstner
has served, since 2008, as the CEO and CIO of Altimeter Capital Management, LP, an internet, software, and travel focused investment firm that he founded in 2008. Prior to launching Altimeter, Mr. Gerstner was an internet entrepreneur, co-founding two internet search start-ups. Additionally, Mr. Gerstner previously served as a board member and compensation committee member of Orbitz, Inc. He has also served on the boards of SilverRail Technologies, Duetto Research and HotelTonight. Mr. Gerstner earned a B.S. in economics and political science from Wabash College, a J.D. from Indiana University School of Law and an M.B.A. from Harvard Business School. Mr. Gerstner has advised a broad range of companies on business, financial and value-creation strategies. Mr. Gerstner’s proven financial acumen and background in analyzing financial markets brings a depth of knowledge and practical experience to the Board.
Sean Mahoney
has extensive experience in capital markets and business strategy across a wide variety of companies and sectors. Since 2008, Mr. Mahoney has been a private investor in public and private securities. Prior to 2008, Mr. Mahoney spent 17 years in investment banking at Goldman, Sachs & Co., where he was a partner and head of the Financial Sponsors Group, followed by four years at Deutsche Bank Securities, where he served as Vice Chairman, Global Banking. Mr. Mahoney currently serves on the board of directors of Arconic, Inc., where he sits on the Audit Committee and Finance Committee, and Aptiv Plc, where he sits on the Nominating and Corporate Governance Committee and Finance Committee. In addition, Mr. Mahoney has served on the post-bankruptcy board of Lehman Brothers Holdings Inc. since 2012. Mr. Mahoney was previously a director of Delphi Automotive PLC, Alcoa, Inc., Cooper-Standard Holdings, Inc., and Formula One Holdings. Mr. Mahoney holds a Master of Letters Degree from Oxford University and a B.A. from University of Chicago. Mr. Mahoney has advised a broad range of companies on business, financial and value-creation strategies. He has served as senior advisor on a range of major equity, debt and M&A projects during his career. Mr. Mahoney’s proven business and investment acumen brings valuable insight and perspectives to the Board.
James A. Rasulo
was formerly an executive at Walt Disney Company from 1986 through 2015, having spent his last five years at Disney as the Chief Financial Officer and Senior Executive Vice President. During his tenure at Walt Disney, among other roles, he served as the Chairman of Walt Disney Parks & Resorts. Mr. Rasulo has been a Director at Saban Capital Acquisition Corporation since September 2016, where he also sits on the Audit Committee. Mr. Rasulo serves on numerous charitable organizations, including the board of the Los Angeles Philharmonic Association, Director and Treasurer of HeritX cancer research foundation. Mr. Rasulo is a graduate of Columbia University and holds an M.A. & M.B.A. from the University of Chicago. Mr. Rasulo’s proven business acumen and extensive experience serving in executive management roles at a large publicly traded company brings tremendous value to the Board.
Kamakshi Sivaramakrishnan
has been leading an integration and identity charter at LinkedIn since 2019. Prior to this role, Ms. Sivaramakrishnan was the founder and CEO of Drawbridge, the leading identity management company that enables brands and enterprises to create personalized online and offline experiences. Drawbridge was acquired by LinkedIn in 2019 and will now be offered as a part of the Microsoft and LinkedIn ecosystem. Prior to founding Drawbridge in November 2010, Ms. Sivaramakrishnan was a Senior Research Scientist at AdMob, which was acquired by Google in 2010. Ms. Sivaramakrishnan has been named one of Business Insider’s “Most Powerful Women in Mobile Advertising” for five consecutive years. Ms. Sivaramakrishnan received the Women of Vision ABIE Award for Technology Entrepreneurship from the Anita Borg Institute, and has been named one of the San Francisco Business Times’ Most Admired CEOs and a Mar-Tech Trailblazer by AdWeek. Ms. Sivaramakrishnan also has the unique distinction of her work being onboard NASA’s New Horizons mission to Pluto and the outer planetary system. Ms. Sivaramakrishnan received her Ph.D. in Information Theory and Algorithms from Stanford University. Ms. Sivaramakrishnan’s entrepreneurial experience and business acumen bring extensive knowledge to the Board.
24
INFORMATION ABOUT OUR EXECUTIVE OFFICERS
The following information with respect to our executive officers is presented as of
February 27, 2020
:
|
Name
|
Age
|
Position
|
||
|
Robert W. Pittman*
|
66
|
Chairman and Chief Executive Officer
|
||
|
Richard J. Bressler*
|
62
|
President, Chief Operating Officer, Chief Financial Officer and Director
|
||
|
Michael B. McGuinness
|
43
|
Executive Vice President – Finance and Deputy Chief Financial Officer
|
||
|
Scott D. Hamilton
|
50
|
Senior Vice President, Chief Accounting Officer and Assistant Secretary
|
||
|
Paul M. McNicol
|
63
|
Executive Vice President, General Counsel and Secretary
|
||
*See “Information About Our Directors” for more information about Mr. Pittman and Mr. Bressler.
The officers named above serve until their respective successors are chosen and qualified, in each case unless the officer sooner dies, resigns, is removed or becomes disqualified.
Michael B. McGuinness
has served as the Executive Vice President - Finance and Deputy Chief Financial Officer of the Company since September 5, 2019. Prior to that time, Mr. McGuinness served as Senior Vice President, Chief Accounting Officer and Treasurer of The Hain Celestial Group, a multinational organic and natural product company, since March 2016. From 2008 to 2016, Mr. McGuinness spent over seven years with Monster Worldwide, Inc., a global online employment solutions company, in various finance positions within the company, most recently as Executive Vice President and Chief Financial Officer. Mr. McGuinness holds a B.S. in 1999 from the State University of New York, Albany and is a Certified Public Accountant.
Scott D. Hamilton
has served as the Senior Vice President, Chief Accounting Officer and Assistant Secretary of the Company since April 2010. Mr. Hamilton was also the Senior Vice President, Chief Accounting Officer and Assistant Secretary of CCOH from April 2010 to May 2019. Prior to April 26, 2010, Mr. Hamilton served as Controller and Chief Accounting Officer of Avaya Inc., a multinational telecommunications company, from October 2008 to April 2010 and served in various accounting and finance positions beginning in October 2004. Prior thereto, Mr. Hamilton was employed by PwC from September 1992 until September 2004 in various roles including audit, global capital markets transaction services based in London, UK and technical accounting consulting services as part of PwC's national office. Mr. Hamilton holds a B.B.A. in Accounting from Abilene Christian University and is a Certified Public Accountant.
Paul M. McNicol
has served as the Executive Vice President, General Counsel and Secretary of the Company since May 2019. From August 2016 until May 2019, Mr. McNicol served as the Executive Vice President and Deputy General Counsel. Prior to 2016, Mr. McNicol served as the Managing Partner of the private equity firm, Pilot Group, from 2003 to 2016. From 2000 to 2003, Mr. McNicol was the Senior Vice President of AOL, Digital Advertising Sales Group. Prior thereto, Mr. McNicol was the Senior Vice President and General Counsel of the real estate division for HSF Corporation (succeeded by Cendant Corporation) from 1997 to 2000. Prior thereto, Mr. McNicol was the Senior Vice President and General Counsel for Six Flags Theme Parks from 1994 to 1997. Mr. McNicol was a lawyer in private practice in New York from 1982 to 1994. Mr. McNicol holds a B.A. from Harvard College and a J.D. from Fordham School of Law.
Robert W. Pittman, Richard J. Bressler, and Scott D. Hamilton were executive officers when the Company filed the Chapter 11 Cases.
25
PART II
ITEM 5.
MARKET FOR REGISTRANT’S COMMON EQUITY, RELATED STOCKHOLDER MATTERS AND ISSUER PURCHASES OF EQUITY SECURITIES
Market Information
On the Effective Date, Shares of the Predecessor Company’s issued and outstanding common stock immediately prior to the Effective Date were canceled, and on the Effective Date, reorganized iHeartMedia issued an aggregate of 56,861,941 shares of iHeartMedia Class A common stock, 6,947,567 shares of Class B common stock and special warrants to purchase 81,453,648 shares of Class A common stock or Class B common stock (the “Special Warrants”) to holders of claims pursuant to the Plan of Reorganization. For more information regarding our emergence from the Chapter 11 Cases and our Plan of Reorganization, refer to Note 2,
Emergence from Voluntary Reorganization under Chapter 11 Proceedings
.
Shares of our Class A common stock are quoted for trading on the Nasdaq Global Select Market ("Nasdaq") under the symbol “IHRT.” There were 39 stockholders of record of our Class A common stock as of
February 21, 2020
. This figure does not include an estimate of the indeterminate number of beneficial holders whose shares may be held of record by brokerage firms and clearing agencies.
There is no established public trading market for our Class B common stock. There were
6,901,987
shares of our Class B common stock outstanding on
February 21, 2020
. Holders of shares of the Successor Company's Class B common stock are generally entitled to convert shares of Class B common stock into shares of Class A common stock on a one-for-one basis, subject to the Company’s ability to restrict conversion in order to comply with the Communications Act of 1934, as amended (the “Communications Act”) and Federal Communications Commission (“FCC”) regulations. There were 13 stockholders of record of our Class B common stock as of
February 21, 2020
. This figure does not include an estimate of the indeterminate number of beneficial holders whose shares may be held of record by brokerage firms and clearing agencies.
Each Special Warrant issued under the special warrant agreement entered into in connection with the Reorganization may be exercised by its holder to purchase one share of the Company's Class A common stock or Class B common stock at an exercise price of $0.001 per share, unless the Company in its sole discretion believes such exercise would, alone or in combination with any other existing or proposed ownership of common stock, result in, subject to certain exceptions, (a) such exercising holder owning more than 4.99 percent of the Successor Company's outstanding Class A common stock, (b) more than 22.5 percent of the Successor Company's capital stock or voting interests being owned directly or indirectly by foreign individuals or entities, (c) the Company exceeding any foreign ownership threshold set by the FCC pursuant to a declaratory ruling or specific approval requirement or (d) the Company violating any provision of the Communications Act or restrictions on ownership or transfer imposed by the Company's certificate of incorporation or the decisions, rules and policies of the FCC. Any holder exercising Special Warrants must complete and timely deliver to the warrant agent the required exercise forms and certifications required under the special warrant agreement. There were
80,175,925
Special Warrants outstanding on
February 21, 2020
.
For more information regarding our emergence from the Chapter 11 Cases and our Class A common Stock, Class B common stock and Special Warrants, refer to Note 12,
Stockholders' Equity (Deficit)
.
We currently have no intention to pay dividends on our Class A common stock at any time in the foreseeable future. Any decision to declare and pay dividends in the future will be made at the discretion of our Board and will depend on, among other things, our results of operations, financial condition, cash requirements, contractual restrictions and other factors that our Board may deem relevant.
26
Stock Performance Graph
The following chart provides a comparison of the cumulative total returns, adjusted for any stock splits and dividends, for iHeartMedia, Inc., our Radio Index* and the Nasdaq Stock Market Index for the period from July 18, 2019, the day our Class A common stock was listed and began trading on the Nasdaq, through December 31, 2019.
Indexed Monthly Stock Price Close
(Price Adjusted for Stock Splits and Dividends)
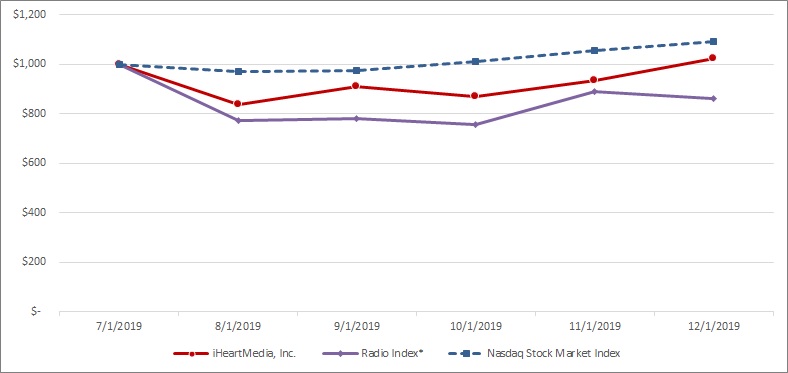
Source: FactSet Research Systems, Inc.; Bloomberg
* Includes Cumulus Media, Emmis Communications and Entercom Communications
|
7/18/19
|
8/31/19
|
9/30/19
|
10/31/19
|
11/30/19
|
12/31/19
|
|||||||||||||||||||
|
iHeartMedia, Inc.
|
$
|
1,000
|
|
$
|
836
|
|
$
|
909
|
|
$
|
869
|
|
$
|
933
|
|
$
|
1,024
|
|
||||||
|
Radio Index*
|
$
|
1,000
|
|
$
|
772
|
|
$
|
780
|
|
$
|
756
|
|
$
|
890
|
|
$
|
860
|
|
||||||
|
Nasdaq Stock Market Index
|
$
|
1,000
|
|
$
|
970
|
|
$
|
975
|
|
$
|
1,010
|
|
$
|
1,056
|
|
$
|
1,093
|
|
||||||
Purchases of Equity Securities
The following table sets forth the purchases made during the quarter ended December 31,
2019
by or on behalf of us or an affiliated purchaser of shares of our Class A common stock registered pursuant to Section 12 of the Exchange Act:
|
Period
|
Total Number of Shares Purchased
(1)
|
Average Price Paid per Share
(1)
|
Total Number of Shares Purchased as Part of Publicly Announced Plans or Programs
|
Maximum Number (or Approximate Dollar Value) of Shares that May Yet Be Purchased Under the Plans or Programs
|
||||||||||
|
October 1 through October 31
|
1,990
|
|
$
|
15.09
|
|
—
|
|
$
|
—
|
|
||||
|
November 1 through November 30
|
—
|
|
—
|
|
—
|
|
—
|
|
||||||
|
December 1 through December 31
|
874
|
|
14.58
|
|
—
|
|
—
|
|
||||||
|
Total
|
2,864
|
|
$
|
14.93
|
|
—
|
|
—
|
|
|||||
27
(1)
The shares indicated consist of shares of our Class A common stock tendered by employees to us during the three months ended December 31,
2019
to satisfy the employees’ tax withholding obligation in connection with the vesting and release of restricted shares, which are repurchased by us based on their fair market value on the date the relevant transaction occurs.
28
ITEM 6.
SELECTED FINANCIAL DATA
The following tables set forth our selected historical consolidated financial and other data as of the dates and for the periods indicated. The selected historical financial data are derived from our audited consolidated financial statements. Certain prior period amounts have been reclassified to conform to the
2019
presentation. Historical results are not necessarily indicative of the results to be expected for future periods. Acquisitions and dispositions impact the comparability of the historical consolidated financial data reflected in this schedule of Selected Financial Data.
The selected historical consolidated financial and other data should be read in conjunction with “Management’s Discussion and Analysis of Financial Condition and Results of Operations” and our consolidated financial statements and the related notes thereto located within Item 8 of Part II of this Annual Report on Form 10-K.
|
(In thousands, except per share data)
|
Successor Company
|
Predecessor Company
|
||||||||||||||||||||||
|
Period from May 2, 2019 through December 31,
|
Period from January 1, 2019 through May 1,
|
For the Years Ended December 31,
|
||||||||||||||||||||||
|
2019
|
2019
|
2018
|
2017
|
2016
|
2015
|
|||||||||||||||||||
|
Results of Operations Data:
|
||||||||||||||||||||||||
|
Revenue
|
$
|
2,610,056
|
|
$
|
1,073,471
|
|
$
|
3,611,323
|
|
$
|
3,586,647
|
|
$
|
3,574,633
|
|
$
|
3,438,056
|
|
||||||
|
Operating expenses:
|
||||||||||||||||||||||||
|
Direct operating expenses (excludes depreciation and amortization)
|
807,409
|
|
359,696
|
|
1,062,373
|
|
1,059,123
|
|
976,718
|
|
976,211
|
|
||||||||||||
|
Selling, general and administrative expenses (excludes depreciation and amortization)
|
936,806
|
|
436,345
|
|
1,376,931
|
|
1,346,063
|
|
1,212,621
|
|
1,175,592
|
|
||||||||||||
|
Corporate expenses (excludes depreciation and amortization)
|
168,582
|
|
66,020
|
|
227,508
|
|
208,648
|
|
225,167
|
|
198,620
|
|
||||||||||||
|
Depreciation and amortization
|
249,623
|
|
52,834
|
|
211,951
|
|
275,304
|
|
291,103
|
|
298,029
|
|
||||||||||||
|
Impairment charges
(1)
|
—
|
|
91,382
|
|
33,150
|
|
6,040
|
|
726
|
|
—
|
|
||||||||||||
|
Other operating income (expense), net
|
(8,000
|
)
|
(154
|
)
|
(9,266
|
)
|
9,313
|
|
(1,132
|
)
|
98,825
|
|
||||||||||||
|
Operating income
|
439,636
|
|
67,040
|
|
690,144
|
|
700,782
|
|
|
867,166
|
|
888,429
|
|
|||||||||||
|
Interest expense (income), net
|
266,773
|
|
(499
|
)
|
334,798
|
|
1,484,435
|
|
1,475,090
|
|
1,449,827
|
|
||||||||||||
|
Loss on investments
|
(20,928
|
)
|
(10,237
|
)
|
(472
|
)
|
(3,827
|
)
|
(13,438
|
)
|
(4,421
|
)
|
||||||||||||
|
Equity in earnings (loss) of nonconsolidated affiliates
|
(279
|
)
|
(66
|
)
|
116
|
|
(1,865
|
)
|
(15,044
|
)
|
(613
|
)
|
||||||||||||
|
Gain (loss) on extinguishment of debt
|
—
|
|
—
|
|
100
|
|
1,271
|
|
157,556
|
|
(2,201
|
)
|
||||||||||||
|
Other income (expense), net
|
(18,266
|
)
|
23
|
|
(23,107
|
)
|
(45,122
|
)
|
(2,420
|
)
|
669
|
|
||||||||||||
|
Reorganization items, net
|
—
|
|
9,461,826
|
|
(356,119
|
)
|
—
|
|
—
|
|
—
|
|
||||||||||||
|
Income (loss) from continuing operations before income taxes
|
133,390
|
|
9,519,085
|
|
(24,136
|
)
|
(833,196
|
)
|
(481,270
|
)
|
(567,964
|
)
|
||||||||||||
|
Income tax benefit (expense)
|
(20,091
|
)
|
(39,095
|
)
|
(13,836
|
)
|
177,188
|
|
127,130
|
|
(37,014
|
)
|
||||||||||||
|
Income (loss) from continuing operations
|
113,299
|
|
9,479,990
|
|
(37,972
|
)
|
(656,008
|
)
|
(354,140
|
)
|
(604,978
|
)
|
||||||||||||
|
Income (loss) from discontinued operations, net of tax
|
—
|
|
1,685,123
|
|
(164,667
|
)
|
197,297
|
|
107,568
|
|
(120,154
|
)
|
||||||||||||
|
Net income (loss)
|
113,299
|
|
11,165,113
|
|
(202,639
|
)
|
(458,711
|
)
|
(246,572
|
)
|
(725,132
|
)
|
||||||||||||
|
Less amount attributable to noncontrolling interest
|
751
|
|
(19,028
|
)
|
(729
|
)
|
(60,651
|
)
|
55,484
|
|
18,269
|
|
||||||||||||
|
Net income (loss) attributable to the Company
|
$
|
112,548
|
|
$
|
11,184,141
|
|
$
|
(201,910
|
)
|
$
|
(398,060
|
)
|
$
|
(302,056
|
)
|
$
|
(743,401
|
)
|
||||||
29
|
(In thousands, except per share data)
|
Successor Company
|
Predecessor Company
|
||||||||||||||||||||||
|
Period from May 2, 2019 through December 31,
|
Period from January 1, 2019 through May 1,
|
For the Years Ended December 31,
|
||||||||||||||||||||||
|
2019
|
2019
|
2018
|
2017
|
2016
|
2015
|
|||||||||||||||||||
|
Net income (loss) per common share:
|
||||||||||||||||||||||||
|
Basic:
|
||||||||||||||||||||||||
|
From continuing operations
|
$
|
0.77
|
|
$
|
109.92
|
|
$
|
(0.44
|
)
|
$
|
(7.71
|
)
|
$
|
(4.19
|
)
|
$
|
(7.18
|
)
|
||||||
|
From discontinued operations
|
—
|
|
19.76
|
|
(1.93
|
)
|
3.02
|
|
0.62
|
|
(1.64
|
)
|
||||||||||||
|
Basic net income (loss) per share
|
$
|
0.77
|
|
$
|
129.68
|
|
$
|
(2.36
|
)
|
$
|
(4.68
|
)
|
$
|
(3.57
|
)
|
$
|
(8.82
|
)
|
||||||
|
Diluted:
|
||||||||||||||||||||||||
|
From continuing operations
|
$
|
0.77
|
|
$
|
109.92
|
|
$
|
(0.44
|
)
|
$
|
(7.71
|
)
|
$
|
(4.19
|
)
|
$
|
(7.18
|
)
|
||||||
|
From discontinued operations
|
—
|
|
19.76
|
|
(1.93
|
)
|
3.02
|
|
0.62
|
|
(1.64
|
)
|
||||||||||||
|
Diluted net income (loss) per share
|
$
|
0.77
|
|
$
|
129.68
|
|
$
|
(2.36
|
)
|
$
|
(4.68
|
)
|
$
|
(3.57
|
)
|
$
|
(8.82
|
)
|
||||||
|
(1)
|
We recorded non-cash impairment charges of
$0.0 million
,
$91.4 million
,
$33.2 million
,
$6.0 million
, $0.7 million and $0.0 million during the period from May 2, 2019 through December 31,
2019
, the period from January 1, 2019 through May 1, 2019,
2018
,
2017
,
2016
and
2015
, respectively. Our impairment charges are discussed more fully in Item 8 of Part II of this Annual Report on Form 10-K.
|
|
(In thousands)
|
Successor Company
|
Predecessor Company
|
||||||||||||||||||
|
As of December 31,
|
As of December 31,
|
|||||||||||||||||||
|
2019
|
2018
|
2017
|
2016
|
2015
|
||||||||||||||||
|
Balance Sheet Data:
|
||||||||||||||||||||
|
Current assets
|
$
|
1,416,348
|
|
$
|
2,235,017
|
|
$
|
2,067,347
|
|
$
|
2,494,229
|
|
$
|
2,767,302
|
|
|||||
|
Property, plant and equipment, net
|
846,876
|
|
502,202
|
|
489,685
|
|
535,329
|
|
584,570
|
|
||||||||||
|
Total assets
|
11,021,099
|
|
12,269,515
|
|
12,260,431
|
|
12,851,789
|
|
13,662,302
|
|
||||||||||
|
Current liabilities
|
667,398
|
|
1,247,649
|
|
16,354,597
|
|
1,674,574
|
|
1,659,228
|
|
||||||||||
|
Long-term debt, net of current maturities
|
5,756,504
|
|
—
|
|
410,661
|
|
14,912,060
|
|
15,432,586
|
|
||||||||||
|
Liabilities subject to compromise
|
—
|
|
16,480,256
|
|
—
|
|
—
|
|
—
|
|
||||||||||
|
Stockholders' equity (deficit)
|
2,945,441
|
|
(11,560,342
|
)
|
(11,344,344
|
)
|
(10,901,861
|
)
|
(10,617,494
|
)
|
||||||||||
30
ITEM 7. MANAGEMENT’S DISCUSSION AND ANALYSIS OF FINANCIAL CONDITION AND RESULTS OF OPERATIONS
OVERVIEW
Format of Presentation
Management’s discussion and analysis of our financial condition and results of operations (“MD&A”) should be read in conjunction with the consolidated financial statements and related footnotes contained in Item 8 of this Annual Report on Form 10-K.
Our primary business provides media and entertainment services via broadcast and digital delivery, including our networks businesses, through our Audio segment. We also operate businesses that provide audio and media services through our Audio and Media Services segment, including our full-service media representation business, Katz Media Group (“Katz Media”) and our provider of scheduling and broadcast software and services, Radio Computing Services ("RCS"). Following the Separation, we ceased to operate the outdoor business, which prior to the Separation was presented as our Americas outdoor segment and our International outdoor segment. The historical results of the outdoor business have been reclassified as results from discontinued operations.
On May 1, 2019, we consummated the Separation and Reorganization, resulting in a substantial reduction in our long-term indebtedness and corresponding cash interest expenses, and significantly extending the maturities of our outstanding indebtedness, as more fully described under “Liquidity and Capital Resources” below. Over the past ten years, we have transitioned our Audio business from a single platform radio broadcast operator to a company with multiple platforms including podcasting, networks and live events. We have also invested in numerous technologies and businesses to increase the competitiveness of our inventory with our advertisers and our audience. We believe that our ability to generate free cash flow from these business initiatives coupled with the significant reduction in our indebtedness and our continued efforts to lower interest rates by refinancing our indebtedness will enable us to generate sufficient cash flows to operate our businesses and de-lever our balance sheet over time.
Certain prior period amounts have been reclassified to conform to the
2019
presentation.
Our Business
Our Audio strategy centers on delivering entertaining and informative content across multiple platforms, including broadcast, digital and live events. Our primary source of revenue is derived from selling local and national advertising time on our radio stations, with contracts typically less than one year in duration. The programming formats of our radio stations are designed to reach audiences with targeted demographic characteristics. We work closely with our advertising and marketing partners to develop tools and leverage data to enable advertisers to effectively reach their desired audiences. We continue to expand the choices for listeners and we deliver our content and sell advertising across multiple distribution channels, including digitally via our iHeartRadio mobile application and other digital platforms which reach national, regional and local audiences. We also generate revenues from network syndication, our nationally recognized live events, our station websites and other miscellaneous transactions.
Management monitors average advertising rates and cost per mille, the cost of every 1,000 advertisement impressions (“CPM”), which are principally based on the length of the spot and how many people in a targeted audience listen to our stations, as measured by an independent ratings service. In addition, our advertising rates are influenced by the time of day the advertisement airs, with morning and evening drive-time hours typically priced the highest. Our price and yield information systems enable our station managers and sales teams to adjust commercial inventory and pricing based on local market demand, as well as to manage and monitor different commercial durations in order to provide more effective advertising for our customers at what we believe are optimal prices given market conditions. Yield is measured by management in a variety of ways, including revenue earned divided by minutes of advertising sold.
Management looks at our Audio operations’ overall revenue as well as the revenue from each type of advertising, including local advertising, which is sold predominately in a station’s local market, and national advertising, which is sold across multiple markets. Local advertising is sold by each radio station’s sales staff while national advertising is sold by our national sales team. Local advertising, which is our largest source of advertising revenue, and national advertising revenues are tracked separately because these revenue streams have different sales teams and respond differently to changes in the economic environment. We periodically review and refine our selling structures in all regions and markets in an effort to maximize the value of our offering to advertisers and, therefore, our revenue.
31
Management also looks at Audio's revenue by region and market size. Typically, larger markets can reach larger audiences with wider demographics than smaller markets. Additionally, management reviews our share of Audio advertising revenues in markets where such information is available, as well as our share of target demographics listening in an average quarter hour. This metric gauges how well our formats are attracting and retaining listeners.
Management also monitors revenue generated through our programmatic ad-buying platform, Soundpoint, and our data analytics advertising product, SmartAudio, to measure the success of our enhanced marketing optimization tools. We have made significant investments so we can provide the same ad-buying experience that once was only available from digital-only companies and enable our clients to better understand how our assets can successfully reach their target audiences.
A portion of our Audio segment’s expenses vary in connection with changes in revenue. These variable expenses primarily relate to costs in our sales department, such as commissions, and bad debt. Our content costs, including music royalty and license fees for music delivered via broadcast or digital streaming, vary with the volume and mix of songs played on our stations and the listening hours on our digital platforms. Our programming and general and administrative departments incur most of our fixed costs, such as utilities and office salaries. We incur discretionary costs in our advertising, marketing and promotions, which we primarily use in an effort to maintain and/or increase our audience share. Lastly, we have incentive systems in each of our departments which provide for bonus payments based on specific performance metrics, including ratings, revenue and overall profitability.
Our advertising revenue is highly correlated to changes in gross domestic product (“GDP”) as advertising spending has historically trended in line with GDP.
In January 2020, the Company announced its modernization initiatives, which will take advantage of the significant investments we have made in new technologies to build an operating infrastructure that provides better quality and newer products and delivers new cost efficiencies. We expect our investment in these modernization initiatives to result in an increase in incremental capital expenditures related to real estate optimization of approximately $40 to $50 million during 2020. While we expect some additional capital expenditures impact from our modernization in 2021, the majority of this investment in capital expenditures is expected to impact 2020 and will be weighted to the second-half of the year.
Combined Results
Our financial results for the periods from January 1, 2019 through May 1, 2019, the year ended
December 31, 2018
and the year ended
December 31, 2017
are referred to as those of the “Predecessor” period. Our financial results for the period from May 2, 2019 through
December 31, 2019
are referred to as those of the “Successor” period. Our results of operations as reported in our Consolidated Financial Statements for these periods are prepared in accordance with GAAP. Although GAAP requires that we report our results for the period from January 1, 2019 through May 1, 2019 and the period from May 2, 2019 through
December 31, 2019
separately, management views the Company’s operating results for the year ended
December 31, 2019
by combining the results of the applicable Predecessor and Successor periods because such presentation provides the most meaningful comparison of our results to prior periods.
The Company cannot adequately benchmark the operating results of the period from May 2, 2019 through
December 31, 2019
against any of the previous periods reported in its Consolidated Financial Statements without combining it with the period from January 1, 2019 through May 1, 2019 and does not believe that reviewing the results of this period in isolation would be useful in identifying trends in or reaching conclusions regarding the Company’s overall operating performance. Management believes that the key performance metrics such as revenue, operating income and Adjusted EBITDA for the Successor period when combined with the Predecessor period provide more meaningful comparisons to other periods and are useful in identifying current business trends. Accordingly, in addition to presenting our results of operations as reported in our Consolidated Financial Statements in accordance with GAAP, the tables and discussion below also present the combined results for the year ended
December 31, 2019
.
The combined results for the year ended
December 31, 2019
, which we refer to herein as the results for the "year ended
December 31, 2019
" represent the sum of the reported amounts for the Predecessor period from January 1, 2019 through May 1, 2019 and the Successor period from May 2, 2019 through
December 31, 2019
. These combined results are not considered to be prepared in accordance with GAAP and have not been prepared as pro forma results per applicable regulations. The combined operating results do not reflect the actual results we would have achieved absent our emergence from bankruptcy and may not be indicative of future results. Accordingly, the results for the years ended
December 31, 2019
and
2018
may not be comparable, particularly for statement of operations line items significantly impacted by the Reorganization and Separation transactions, the impact of fresh start accounting on depreciation and amortization and the impact of interest expense not being recognized while we were in Chapter 11 bankruptcy protection from the Petition Date of March 14, 2018 to May 1, 2019.
32
Executive Summary
The key developments in our business for the year ended December 31,
2019
are summarized below:
|
•
|
Our Plan of Reorganization became effective May 1, 2019 resulting in the Separation of the Outdoor business and emerging from the Chapter 11 Cases with a significantly de-leveraged capital structure.
|
|
•
|
As a result of our emergence from the Chapter 11 Cases, we reduced our long-term debt from approximately $16 billion to approximately $5.8 billion.
|
|
•
|
Revenue of
$3,683.5 million
increased
$72.2 million
during
2019
compared to
2018
.
|
|
•
|
Operating income of
$506.7 million
was
down
from
$690.1 million
in 2018, primarily as a result of higher depreciation and amortization due to the application of fresh start accounting and higher non-cash impairment charges.
|
|
•
|
Net income of
$11.3 billion
in 2019 including the
$9.5 billion
net gain from the Reorganization and the
$1.7 billion
gain on the Separation of CCOH.
|
|
•
|
Adjusted EBITDA
(1)
of
$1,000.7 million
, was
up
2.5%
year-over-year.
|
|
•
|
Cash flows provided by operating activities from continuing operations of
$461.4 million
decreased
$279.8 million
or
37.8%
compared to
2018
driven by higher cash interest payments as a result of the timing of our Chapter 11 bankruptcy petition and emergence.
|
|
•
|
Free cash flow
(2)
of
$349.2 million
decreased
$306.8 million
or
46.8%
compared to
2018
driven by higher cash interest payments as a result of the timing of our Chapter 11 bankruptcy petition and emergence.
|
|
•
|
iHeartCommunications issued $750.0 million of new 5.25% Senior Secured Notes due 2027. Proceeds from the new notes, together with cash on hand, were used to prepay at par $740.0 million of borrowings outstanding under our $3.5 billion aggregate principal amount of senior term loans (the "Term Loan Facility").
|
|
•
|
iHeartCommunications issued $500.0 million of new 4.75% Senior Secured Notes due 2028. Proceeds from the new notes, together with cash on hand, were used to prepay at par $500.0 million of borrowings outstanding under the Term Loan Facility.
|
The table below presents a summary of our historical results of operations for the periods presented:
|
(In thousands)
|
Successor Company
|
Predecessor Company
|
Non-GAAP Combined
|
Predecessor Company
|
|||||||||||||||
|
Period from May 2, 2019 through December 31,
|
Period from January 1, 2019 through May 1,
|
Year Ended December 31,
|
Year Ended December 31,
|
%
|
|||||||||||||||
|
2019
|
2019
|
2019
|
2018
|
Change
|
|||||||||||||||
|
Revenue
|
$
|
2,610,056
|
|
$
|
1,073,471
|
|
$
|
3,683,527
|
|
$
|
3,611,323
|
|
2.0
|
%
|
|||||
|
Operating income
|
$
|
439,636
|
|
$
|
67,040
|
|
$
|
506,676
|
|
$
|
690,144
|
|
(26.6
|
)%
|
|||||
|
Net income (loss)
|
$
|
113,299
|
|
$
|
11,165,113
|
|
$
|
11,278,412
|
|
$
|
(202,639
|
)
|
nm
|
|
|||||
|
Cash provided by (used in) operating activities from continuing operations
|
$
|
468,905
|
|
$
|
(7,505
|
)
|
$
|
461,400
|
|
$
|
741,219
|
|
(37.8
|
)%
|
|||||
|
Adjusted EBITDA
(1)
|
$
|
775,549
|
|
$
|
225,149
|
|
$
|
1,000,698
|
|
$
|
976,655
|
|
2.5
|
%
|
|||||
|
Free cash flow from (used for) continuing operations
(2)
|
$
|
392,912
|
|
$
|
(43,702
|
)
|
$
|
349,210
|
|
$
|
655,974
|
|
(46.8
|
)%
|
|||||
(1)
Adjusted EBITDA is a non-GAAP financial measure. For a definition of Adjusted EBITDA, a statement of the reasons why management believes Adjusted EBITDA provides useful information to investors, a reconciliation to Operating income and to Net Income (Loss), please see "Reconciliation of Operating Income to Adjusted EBITDA" and "Reconciliation of Net Income (Loss) to EBITDA and Adjusted EBITDA" in this MD&A.
(2)
Free cash flow from (used in) continuing operations is a non-GAAP financial measure. For a definition of Free cash flow from (used in) continuing operations, a statement of the reasons why management believes Free cash flow from (used in) continuing operations provides useful information to investors and a reconciliation to Cash provided by operating activities from continuing operations, the most closely comparable GAAP measure, please see “Reconciliation of Cash provided by (used in) operating activities from continuing operations to Free cash flow from (used in) continuing operations” in this MD&A.
33
Results of Operations
The table below presents the comparison of our historical results of operations for the periods presented:
|
(In thousands)
|
Successor Company
|
Predecessor Company
|
Non-GAAP Combined
|
Predecessor Company
|
|||||||||||||||
|
Period from May 2, 2019 through December 31,
|
Period from January 1, 2019 through May 1,
|
Year Ended December 31,
|
Year Ended December 31,
|
%
|
|||||||||||||||
|
2019
|
2019
|
2019
|
2018
|
Change
|
|||||||||||||||
|
Revenue
|
$
|
2,610,056
|
|
$
|
1,073,471
|
|
$
|
3,683,527
|
|
$
|
3,611,323
|
|
2.0
|
%
|
|||||
|
Operating expenses:
|
|||||||||||||||||||
|
Direct operating expenses (excludes depreciation and amortization)
|
807,409
|
|
359,696
|
|
1,167,105
|
|
1,062,373
|
|
9.9
|
%
|
|||||||||
|
Selling, general and administrative expenses (excludes depreciation and amortization)
|
936,806
|
|
436,345
|
|
1,373,151
|
|
1,376,931
|
|
(0.3
|
)%
|
|||||||||
|
Corporate expenses (excludes depreciation and amortization)
|
168,582
|
|
66,020
|
|
234,602
|
|
227,508
|
|
3.1
|
%
|
|||||||||
|
Depreciation and amortization
|
249,623
|
|
52,834
|
|
302,457
|
|
211,951
|
|
42.7
|
%
|
|||||||||
|
Impairment charges
|
—
|
|
91,382
|
|
91,382
|
|
33,150
|
|
175.7
|
%
|
|||||||||
|
Other operating expense, net
|
(8,000
|
)
|
(154
|
)
|
(8,154
|
)
|
(9,266
|
)
|
(12.0
|
)%
|
|||||||||
|
Operating income
|
439,636
|
|
67,040
|
|
506,676
|
|
690,144
|
|
(26.6
|
)%
|
|||||||||
|
Interest expense (income), net
|
266,773
|
|
(499
|
)
|
266,274
|
|
334,798
|
|
|||||||||||
|
Loss on investments, net
|
(20,928
|
)
|
(10,237
|
)
|
(31,165
|
)
|
(472
|
)
|
|||||||||||
|
Equity in earnings (loss) of nonconsolidated affiliates
|
(279
|
)
|
(66
|
)
|
(345
|
)
|
116
|
|
|||||||||||
|
Other income (expense), net
|
(18,266
|
)
|
23
|
|
(18,243
|
)
|
(23,007
|
)
|
|||||||||||
|
Reorganization items, net
|
—
|
|
9,461,826
|
|
9,461,826
|
|
(356,119
|
)
|
|||||||||||
|
Income (loss) from continuing operations before income taxes
|
133,390
|
|
9,519,085
|
|
9,652,475
|
|
(24,136
|
)
|
|||||||||||
|
Income tax expense
|
(20,091
|
)
|
(39,095
|
)
|
(59,186
|
)
|
(13,836
|
)
|
|||||||||||
|
Income (loss) from continuing operations
|
113,299
|
|
9,479,990
|
|
9,593,289
|
|
(37,972
|
)
|
|||||||||||
|
Income (loss) from discontinued operations, net of tax
|
—
|
|
1,685,123
|
|
1,685,123
|
|
(164,667
|
)
|
|||||||||||
|
Net income (loss)
|
113,299
|
|
11,165,113
|
|
11,278,412
|
|
(202,639
|
)
|
|||||||||||
|
Less amount attributable to noncontrolling interest
|
751
|
|
(19,028
|
)
|
(18,277
|
)
|
(729
|
)
|
|||||||||||
|
Net income (loss) attributable to the Company
|
$
|
112,548
|
|
$
|
11,184,141
|
|
$
|
11,296,689
|
|
$
|
(201,910
|
)
|
|||||||
34
The table below presents the comparison of our revenue streams for the periods presented:
|
(In thousands)
|
Successor Company
|
Predecessor Company
|
Non-GAAP Combined
|
Predecessor Company
|
||||||||||||
|
Period from May 2, 2019 through December 31,
|
Period from January 1, 2019 through May 1,
|
Year Ended December 31,
|
Year Ended December 31,
|
|||||||||||||
|
2019
|
2019
|
2019
|
2018
|
|||||||||||||
|
Broadcast Radio
|
$
|
1,575,382
|
|
$
|
657,864
|
|
$
|
2,233,246
|
|
$
|
2,264,058
|
|
||||
|
Digital
|
273,389
|
|
102,789
|
|
376,178
|
|
284,565
|
|
||||||||
|
Networks
|
425,631
|
|
189,088
|
|
614,719
|
|
582,302
|
|
||||||||
|
Sponsorship and Events
|
159,187
|
|
50,330
|
|
209,517
|
|
200,605
|
|
||||||||
|
Audio and Media Services
|
167,292
|
|
69,362
|
|
236,654
|
|
264,061
|
|
||||||||
|
Other
|
14,211
|
|
6,606
|
|
20,817
|
|
22,240
|
|
||||||||
|
Eliminations
|
(5,036
|
)
|
(2,568
|
)
|
(7,604
|
)
|
(6,508
|
)
|
||||||||
|
Revenue, total
|
$
|
2,610,056
|
|
$
|
1,073,471
|
|
$
|
3,683,527
|
|
$
|
3,611,323
|
|
||||
Combined results for the year ended
December 31, 2019
compared to the consolidated results for the year ended
December 31, 2018
were as follows:
Revenue
Revenue
increased
$72.2 million
during the year ended
December 31, 2019
compared to
2018
. The increase in revenue is primarily due to higher digital revenue of
$91.6 million
driven by growth in podcasting, including the impact of our acquisition of Stuff Media in October 2018, as well as other digital revenue, including live radio and other on-demand services, and revenue from our Network businesses, which
increased
$32.4 million
. Broadcast revenue
decreased
$30.8 million
, due to a $38.2 million decrease in political revenue as a result of 2018 being a mid-term congressional election year, partially offset by growth generated by our programmatic offerings. Audio and Media Services revenue decreased
$27.4 million
due to a
$34.5 million
decrease in political revenue. Political revenue for the years ended
December 31, 2019
and
2018
was
$28.8 million
and
$103.0 million
, respectively.
Direct Operating Expenses
Direct operating expenses
increased
$104.7 million
during the year ended
December 31, 2019
compared to
2018
. Higher direct operating expenses were driven primarily by higher compensation-related expenses, including from the acquisitions of Stuff Media and Jelli in the fourth quarter of 2018, as well as higher music license fees, digital royalties and content costs from higher podcasting, subscription and other digital revenue. Included in this increase is the impact of updated estimates to music license fee expenses primarily related to prior years for which payments were made under interim agreements with performance rights organizations and that are subject to ongoing negotiations. The increase in direct operating expenses also includes a $6.3 million increase in lease expense due to the impact of the adoption of the new leasing standard in the first quarter of 2019 and the adoption of fresh start accounting.
Selling, General and Administrative (“SG&A”) Expenses
SG&A expenses
decreased
$3.8 million
during the year ended
December 31, 2019
compared to
2018
. The decrease in our SG&A expenses was due primarily to lower commissions as a result of our revenue mix, lower bad debt expense, resulting from improved collections, and lower trade and barter expenses, primarily resulting from timing. The decrease in SG&A expenses was partially offset by higher third-party digital fees, driven by the increase in digital revenue, along with higher employee costs, primarily resulting from the acquisitions of Stuff Media and Jelli in the fourth quarter of 2018.
Corporate Expenses
Corporate expenses
increased
$7.1 million
during the year ended
December 31, 2019
compared to
2018
, as a result of higher share-based compensation expense, which increased
$24.8 million
as a result of our new equity compensation plan entered
35
into in connection with our Plan of Reorganization. This increase was partially offset by lower employee benefit costs and lower amortization of retention bonuses related to the bankruptcy for which amortization ceased on the Effective Date.
Depreciation and Amortization
Depreciation and amortization
increased
$90.5 million
during
2019
compared to
2018
, primarily as a result of the application of fresh start accounting, which resulted in significantly higher values of our tangible and intangible long-lived assets.
Impairment Charges
We perform our annual impairment test on our goodwill, Federal Communication Commission ("FCC") licenses and other intangible assets as of July 1 of each year. No impairment charges were recorded in the third quarter of 2019 in connection with our annual impairment test. In addition, we test for impairment of intangible assets whenever events and circumstances indicate that such assets might be impaired. We recognized non-cash impairment charges of
$91.4 million
in the first quarter of 2019 on our indefinite-lived FCC licenses as a result of an increase in the weighted average cost of capital. During 2018 we recorded impairment charges of
$33.2 million
related primarily to several of our Audio markets. See Note 7,
Property, Plant and Equipment, Intangible Assets and Goodwill
to the consolidated financial statements located in Item 8 of this Annual Report on Form 10-K for a further description of the impairment charges.
Other Operating Expense, Net
Other operating
expense
, net of
$8.2 million
in
2019
was primarily related to net losses recognized on the disposal of assets.
Other operating expense, net of
$9.3 million
in
2018
was primarily related to net losses recognized on the disposal of assets.
Interest Expense, Net
Interest expense, net
decreased
$68.5 million
during
2019
compared to
2018
as a result of the interest recognized in the period from January 1, 2018 to the March 14, 2018 petition date on our pre-petition debt exceeding the interest recognized in the period from May 2, 2019 to December 31, 2019 on our new debt issued in connection with our emergence from the Chapter 11 Cases. During the period from March 14, 2018 to May 1, 2019, while the Company was a debtor-in-possession, no interest expense was recognized on pre-petition debt.
Loss on Investments, net
During the year ended
December 31, 2019
, we recognized a loss of
$31.2 million
, primarily in connection with other-than-temporary declines in the values of certain of our investments.
Equity in Loss of Nonconsolidated Affiliates
During the year ended December 31,
2019
we recognized a net loss of
$0.3 million
related to equity-method investments. During the year ended December 31,
2018
, we recognized net earnings of
$0.1 million
related to equity-method investments.
Other Expense, Net
Other expense, net was
$18.2 million
for the year ended
December 31, 2019
, which related primarily to professional fees incurred in connection with the Chapter 11 Cases in the Successor period. Such expenses were included within Reorganization items, net in the Predecessor period while the Company was a debtor-in-possession.
Other expense, net was
$23.0 million
for the year ended
December 31, 2018
, which related primarily to professional fees incurred directly in connection with the Chapter 11 Cases before the March 14, 2018 Petition Date. Such expenses were included within Reorganization items, net in the post-petition period while the Company was a debtor-in-possession.
36
Reorganization Items, Net
During
2019
, we recognized Reorganization items, net of
$9,461.8 million
related to our emergence from the Chapter 11 Cases, which consisted primarily of the net gain from the consummation of the Plan of Reorganization and the related settlement of liabilities. In addition, Reorganization items, net included professional fees recognized between the March 14, 2018 Petition Date and the May 1, 2019 Effective Date in connection with the Chapter 11 Cases. See Note 3 to our Consolidated Financial Statements included in Item 8 of this Annual Report on Form 10-K.
Income Tax Expense (Benefit)
The Successor Company’s effective tax rate for the period from May 2, 2019 through December 31, 2019 is
15.1%
. The effective tax rate for the Successor period was primarily impacted by deferred tax benefits recorded for changes in estimates related to the carryforward tax attributes that are expected to survive the emergence from bankruptcy and deferred tax adjustments associated with the filing of the Company’s 2018 tax returns during the fourth quarter of 2019. The primary change to the 2018 tax return filings, when compared to the provision estimates, was the Company's decision to elect out of the first-year bonus depreciation rules for the 2018 year for all qualified capital expenditures. This resulted in less tax depreciation deductions for tax purposes for the 2018 year and higher adjusted tax basis for our fixed assets as of the Effective Date.
The Predecessor Company’s effective tax rate for the period from January 1, 2019 through May 1, 2019 is
0.4%
. The income tax expense for the period from January 1, 2019 through May 1, 2019 (Predecessor) primarily consists of the income tax impacts from reorganization and fresh start adjustments, including adjustments to our valuation allowance. The Company recorded income tax benefits of $102.9 million for reorganization adjustments in the Predecessor period, primarily consisting of: (1) tax expense for the reduction in federal and state net operating loss (“NOL”) carryforwards from the cancellation of debt income ("CODI") realized upon emergence; (2) tax benefit for the reduction in deferred tax liabilities attributed primarily to long-term debt that was discharged upon emergence; (3) tax benefit for the effective settlement of liabilities for unrecognized tax benefits that were discharged upon emergence; and (4) tax benefit for the reduction in valuation allowance resulting from the adjustments described above. The Company recorded income tax expense of $185.4 million for fresh start adjustments in the Predecessor period, consisting of $529.1 million tax expense for the increase in deferred tax liabilities resulting from fresh start accounting adjustments, which was partially offset by $343.7 million tax benefit for the reduction in the valuation allowance on our deferred tax assets.
The effective tax rate for the year ended December 31, 2018 was
(57.3)%
. The effective tax rate for 2018 was primarily impacted by $11.3 million of deferred tax expense attributed to the valuation allowance recorded against federal and state deferred tax assets generated in the period due to the uncertainty of the ability to realize those assets in future periods.
Net Income (Loss) Attributable to the Company
Net income attributable to the Company increased
$11.5 billion
to
$11.3 billion
during the year ended December 31, 2019 compared to a net loss of
$201.9 million
during the year ended December 31, 2018, primarily due to the net gain from the consummation of the Plan of Reorganization and the related settlement of liabilities.
37
The comparison of our historical results of operations for the year ended December 31,
2018
to the year ended December 31,
2017
is as follows:
|
(In thousands)
|
Predecessor Company
|
||||||||
|
|
Years Ended December 31,
|
%
|
|||||||
|
2018
|
2017
|
Change
|
|||||||
|
Revenue
|
$
|
3,611,323
|
|
$
|
3,586,647
|
|
0.7%
|
||
|
Operating expenses:
|
|||||||||
|
Direct operating expenses (excludes depreciation and amortization)
|
1,062,373
|
|
1,059,123
|
|
0.3%
|
||||
|
Selling, general and administrative expenses (excludes depreciation and amortization)
|
1,376,931
|
|
1,346,063
|
|
2.3%
|
||||
|
Corporate expenses (excludes depreciation and amortization)
|
227,508
|
|
208,648
|
|
9.0%
|
||||
|
Depreciation and amortization
|
211,951
|
|
275,304
|
|
(23.0)%
|
||||
|
Impairment charges
|
33,150
|
|
6,040
|
|
448.8%
|
||||
|
Other operating income (expense), net
|
(9,266
|
)
|
9,313
|
|
(199.5)%
|
||||
|
Operating income
|
690,144
|
|
700,782
|
|
(1.5)%
|
||||
|
Interest expense, net
|
334,798
|
|
1,484,435
|
|
|||||
|
Loss on investments, net
|
(472
|
)
|
(3,827
|
)
|
|||||
|
Equity in gain (loss) of nonconsolidated affiliates
|
116
|
|
(1,865
|
)
|
|||||
|
Other expense, net
|
(23,007
|
)
|
(43,851
|
)
|
|||||
|
Reorganization items, net
|
(356,119
|
)
|
—
|
|
|||||
|
Loss from continuing operations before income taxes
|
(24,136
|
)
|
(833,196
|
)
|
|||||
|
Income tax benefit (expense)
|
(13,836
|
)
|
177,188
|
|
|||||
|
Loss from continuing operations
|
(37,972
|
)
|
(656,008
|
)
|
|||||
|
Income (loss) from discontinued operations, net of tax
|
(164,667
|
)
|
197,297
|
|
|||||
|
Net loss
|
(202,639
|
)
|
(458,711
|
)
|
|||||
|
Less amount attributable to noncontrolling interest
|
(729
|
)
|
(60,651
|
)
|
|||||
|
Net loss attributable to the Company
|
$
|
(201,910
|
)
|
$
|
(398,060
|
)
|
|||
The table below presents the comparison of our revenue streams for the year ended December 31,
2018
to the year ended December 31,
2017
is as follows:
|
(In thousands)
|
Predecessor Company
|
||||||
|
Year Ended December 31,
|
|||||||
|
2018
|
2017
|
||||||
|
Broadcast Radio
|
$
|
2,264,058
|
|
$
|
2,292,116
|
|
|
|
Digital
|
284,565
|
|
248,736
|
|
|||
|
Networks
|
582,302
|
|
581,733
|
|
|||
|
Sponsorship and Events
|
200,605
|
|
201,775
|
|
|||
|
Audio and Media Services
|
264,061
|
|
235,951
|
|
|||
|
Other
|
22,240
|
|
32,847
|
|
|||
|
Eliminations
|
(6,508
|
)
|
(6,511
|
)
|
|||
|
Revenue, total
|
$
|
3,611,323
|
|
$
|
3,586,647
|
|
|
38
Revenue
Revenue increased $24.7 million, primarily driven by political revenue, which increased $75.4 million in connection with the 2018 mid-term election cycle. Of the increase in political revenue, $39.6 million was generated by our Audio business and $35.8 million was generated by our Audio and Media Services business. Digital revenue, including subscription revenue from our iHeartRadio on-demand service, increased $35.8 million. These increases were partially offset by lower broadcast revenue, which decreased $28.1 million, driven primarily by lower local agency revenue partially offset by growth generated by our programmatic offerings. We believe disruption to our business resulting from the Chapter 11 Cases negatively impacted our revenue in the first half of the year.
Direct Operating Expenses
Direct operating expenses increased $3.3 million during 2018 compared to 2017. Higher digital royalties and content costs, driven primarily by revenue growth of our iHeartRadio on-demand service and podcasting, and higher employee-related expenses were partially offset by lower music license fees.
SG&A Expenses
SG&A expenses increased $30.9 million during 2018 compared to 2017. Higher third-party sales activation fees, trade and barter expenses and variable compensation expense, were partially offset by lower bad debt expense.
Corporate Expenses
Corporate expenses increased $18.9 million during 2018 compared to 2017. The increase was primarily as a result of higher employee-related expenses, including variable incentive compensation resulting from higher profitability as well as employee benefits expense. These increases were partially offset by lower management fees and lower spending on efficiency initiatives.
Depreciation and Amortization
Depreciation and amortization decreased $63.4 million during 2018 compared to 2017 primarily due to assets becoming fully depreciated or fully amortized, including intangible assets that were recorded as part of the merger of iHeartCommunications with iHeartMedia, Inc. in 2008.
Impairment Charges
During 2018 we recorded impairment charges of
$33.2 million
related primarily to several of our Audio markets and during 2017 we recorded an impairment charge of
$6.0 million
related to FCC licenses in one of our markets in connection with our annual impairment testing.
Other Operating Income (Expense), Net
Other operating expense, net of
$9.3 million
in 2018 was primarily related to net losses recognized on the disposal of assets. Other operating income, net of
$9.3 million
in 2017 was primarily related to the gain on the exchange of four radio stations in Chattanooga, TN and six radio stations in Richmond, VA for four radio stations in Boston, MA and three radio stations in Seattle, WA.
Interest Expense, Net
Interest expense decreased
$1,149.6 million
during 2018 compared to 2017 as a result of the Company ceasing to accrue interest expense on long-term debt reclassified as Liabilities subject to compromise as of the Petition Date.
Other Expense, Net
Other expense, net was
$23.0 million
for the year ended
December 31, 2018
related primarily to expenses incurred in connection with negotiations with lenders and other activities related to our capital structure which were incurred prior to the filing of the Chapter 11 Cases. Other expense, net was
$43.9 million
for the year 2017 related primarily to expenses incurred in connection with negotiations with lenders and other activities related to our capital structure, including $41.8 million related to the notes exchange offers and term loan offers that were launched in early 2017.
39
Income Tax Benefit (Expense)
The effective tax rate for the year ended December 31, 2018 was
(57.3)%
The effective tax rate for 2018 was primarily impacted by $11.3 million of deferred tax expense attributed to the valuation allowance recorded against federal and state deferred tax assets generated in the period due to the uncertainty of the ability to realize those assets in future periods.
The effective tax rate for the year ended December 31, 2017 was 21.3%. The effective tax benefit rate for 2017 was impacted by the effects of U.S. corporate tax reform which resulted in a tax benefit of $282.1 million recorded in connection with the reduction in the U.S. federal corporate tax rate. In partial offset to this tax benefit, the Company recorded tax expense of $202.0 million in connection with the valuation allowance recorded against federal and state deferred tax assets generated in the period due to the uncertainty of the ability to realize those assets in future periods.
Net Loss Attributable to the Company
Net loss attributable to the Company decreased $196.2 million to $201.9 million during the year ended December 31, 2018 compared to a net loss of $398.1 million during the year ended December 31, 2017, primarily due to the factors discussed above.
Non-GAAP Financial Measures
Reconciliations of Operating Income to Adjusted EBITDA
|
(In thousands)
|
Successor Company
|
Predecessor Company
|
Non-GAAP Combined
2
|
Predecessor Company
|
|||||||||||||||
|
Period from May 2, 2019 through December 31,
|
Period from January 1, 2019 through May 1,
|
Year Ended December 31,
|
Year Ended December 31,
|
%
|
|||||||||||||||
|
2019
|
2019
|
2019
|
2018
|
Change
|
|||||||||||||||
|
Operating income
|
$
|
439,636
|
|
$
|
67,040
|
|
$
|
506,676
|
|
$
|
690,144
|
|
(26.6
|
)%
|
|||||
|
Depreciation and amortization
(1)
|
249,623
|
|
52,834
|
|
302,457
|
|
211,951
|
|
|
|
|||||||||
|
Impairment charges
|
—
|
|
91,382
|
|
91,382
|
|
33,150
|
|
|
|
|||||||||
|
Other operating expense, net
|
8,000
|
|
154
|
|
8,154
|
|
9,266
|
|
|
|
|||||||||
|
Share-based compensation expense
(2)
|
26,411
|
|
498
|
|
26,909
|
|
2,066
|
|
|
|
|||||||||
|
Restructuring and reorganization expenses
|
25,663
|
|
13,241
|
|
38,904
|
|
30,078
|
|
|
|
|||||||||
|
Music license fees adjustment
(3)
|
26,216
|
|
—
|
|
26,216
|
|
—
|
|
|||||||||||
|
Adjusted EBITDA
(4)
|
$
|
775,549
|
|
$
|
225,149
|
|
$
|
1,000,698
|
|
$
|
976,655
|
|
2.5
|
%
|
|||||
|
(In thousands)
|
Predecessor Company
|
|||||||||
|
Year Ended December 31,
|
Year Ended December 31,
|
%
|
||||||||
|
2018
|
2017
|
Change
|
||||||||
|
Operating income
|
$
|
690,144
|
|
$
|
700,782
|
|
(1.5
|
)%
|
||
|
Depreciation and amortization
|
211,951
|
|
275,304
|
|
||||||
|
Impairment charges
|
33,150
|
|
6,040
|
|
||||||
|
Other operating (income) expense, net
|
9,266
|
|
(9,313
|
)
|
||||||
|
Share-based compensation expense
|
2,066
|
|
2,488
|
|
||||||
|
Restructuring and reorganization expenses
|
30,078
|
|
43,573
|
|
||||||
|
Adjusted EBITDA
(4)
|
$
|
976,655
|
|
$
|
1,018,874
|
|
(4.1
|
)%
|
||
40
Reconciliations of Net Income (Loss) to EBITDA and Adjusted EBITDA
|
(In thousands)
|
Successor Company
|
Predecessor Company
|
Non-GAAP Combined
|
Predecessor Company
|
||||||||||||
|
Period from May 2, 2019 through December 31,
|
Period from January 1, 2019 through May 1,
|
Year Ended December 31,
|
Year Ended December 31,
|
|||||||||||||
|
2019
|
2019
|
2019
|
2018
|
|||||||||||||
|
Net income (loss)
|
$
|
113,299
|
|
$
|
11,165,113
|
|
$
|
11,278,412
|
|
$
|
(202,639
|
)
|
||||
|
(Income) loss from discontinued operations, net of tax
|
—
|
|
(1,685,123
|
)
|
(1,685,123
|
)
|
164,667
|
|
||||||||
|
Income tax expense
|
20,091
|
|
39,095
|
|
59,186
|
|
13,836
|
|
||||||||
|
Interest expense (income), net
|
266,773
|
|
(499
|
)
|
266,274
|
|
334,798
|
|
||||||||
|
Depreciation and amortization
(1)
|
249,623
|
|
52,834
|
|
302,457
|
|
211,951
|
|
||||||||
|
EBITDA
|
$
|
649,786
|
|
$
|
9,571,420
|
|
$
|
10,221,206
|
|
$
|
522,613
|
|
||||
|
Reorganization items, net
|
—
|
|
(9,461,826
|
)
|
(9,461,826
|
)
|
356,119
|
|
||||||||
|
Loss on investments, net
|
20,928
|
|
10,237
|
|
31,165
|
|
472
|
|
||||||||
|
Other income (expense), net
|
18,266
|
|
(23
|
)
|
18,243
|
|
23,007
|
|
||||||||
|
Equity in (earnings) loss of nonconsolidated affiliates
|
279
|
|
66
|
|
345
|
|
(116
|
)
|
||||||||
|
Impairment charges
|
—
|
|
91,382
|
|
91,382
|
|
33,150
|
|
||||||||
|
Other operating expense, net
|
8,000
|
|
154
|
|
8,154
|
|
9,266
|
|
||||||||
|
Share-based compensation expense
(2)
|
26,411
|
|
498
|
|
26,909
|
|
2,066
|
|
||||||||
|
Restructuring and reorganization expenses
|
25,663
|
|
13,241
|
|
38,904
|
|
30,078
|
|
||||||||
|
Music license fees adjustment
(3)
|
26,216
|
|
—
|
|
26,216
|
|
—
|
|
||||||||
|
Adjusted EBITDA
(4)
|
$
|
775,549
|
|
$
|
225,149
|
|
$
|
1,000,698
|
|
$
|
976,655
|
|
||||
|
(In thousands)
|
Predecessor Company
|
||||||
|
Year Ended December 31,
|
Year Ended December 31,
|
||||||
|
2018
|
2017
|
||||||
|
Net loss
|
$
|
(202,639
|
)
|
$
|
(458,711
|
)
|
|
|
(Income) loss from discontinued operations, net of tax
|
164,667
|
|
(197,297
|
)
|
|||
|
Income tax (benefit) expense
|
13,836
|
|
(177,188
|
)
|
|||
|
Interest expense, net
|
334,798
|
|
1,484,435
|
|
|||
|
Depreciation and amortization
|
211,951
|
|
275,304
|
|
|||
|
EBITDA
|
$
|
522,613
|
|
$
|
926,543
|
|
|
|
Reorganization items, net
|
356,119
|
|
—
|
|
|||
|
Loss on investments, net
|
472
|
|
3,827
|
|
|||
|
Other expense, net
|
23,007
|
|
43,851
|
|
|||
|
Equity in (earnings) loss of nonconsolidated affiliates
|
(116
|
)
|
1,865
|
|
|||
|
Impairment charges
|
33,150
|
|
6,040
|
|
|||
|
Other operating (income) expense, net
|
9,266
|
|
(9,313
|
)
|
|||
|
Share-based compensation expense
|
2,066
|
|
2,488
|
|
|||
|
Restructuring and reorganization expenses
|
30,078
|
|
43,573
|
|
|||
|
Adjusted EBITDA
(4)
|
$
|
976,655
|
|
$
|
1,018,874
|
|
|
|
(1)
|
Increase in Depreciation and amortization is driven by the application of fresh start accounting, resulting in significantly higher values of our tangible and intangible assets.
|
41
|
(2)
|
Increase in Share-based compensation expense is due to our new equity compensation plan entered into in connection with our Plan of Reorganization.
|
|
(3)
|
Music license fees adjustment represents the impact of updated estimates to music license fee expenses primarily related to the Predecessor periods, which was recorded in the fourth quarter of 2019 and is not representative of the Company's operations during a normal business cycle.
|
|
(4)
|
We define Adjusted EBITDA as
consolidated Operating income adjusted to exclude restructuring and reorganization expenses included within Direct operating expenses, Selling, General and Administrative expenses, (“SG&A”) and Corporate expenses and share-based compensation expenses included within Corporate expenses, as well as the following line items presented in our Statements of Operations: Depreciation and amortization, Impairment charges and Other operating income (expense), net. Alternatively, Adjusted EBITDA is calculated as Net income (loss), adjusted to exclude (Income) loss from discontinued operations, net of tax, Income tax (benefit) expense, Interest expense, Depreciation and amortization, Reorganization items, net, Loss on investments, net, Other (income) expense, net, Equity in earnings (loss) of nonconsolidated affiliates, net, Impairment charges, Other operating (income) expense, net, Share-based compensation, restructuring and reorganization expenses and music license fees adjustment. Restructuring expenses primarily include severance expenses incurred in connection with cost saving initiatives, as well as certain expenses, which, in the view of management, are outside the ordinary course of business or otherwise not representative of the Company's operations during a normal business cycle. Reorganization expenses primarily include the amortization of retention bonus amounts paid or payable to certain members of management directly as a result of the Reorganization.
We use Adjusted EBITDA, among other measures, to evaluate the Company’s operating performance. This measure is among the primary measures used by management for the planning and forecasting of future periods, as well as for measuring performance for compensation of executives and other members of management. We believe this measure is an important indicator of our operational strength and performance of our business because it provides a link between operational performance and operating income. It is also a primary measure used by management in evaluating companies as potential acquisition targets. We believe the presentation of this measure is relevant and useful for investors because it allows investors to view performance in a manner similar to the method used by management. We believe it helps improve investors’ ability to understand our operating performance and makes it easier to compare our results with other companies that have different capital structures or tax rates. In addition, we believe this measure is also among the primary measures used externally by our investors, analysts and peers in our industry for purposes of valuation and comparing our operating performance to other companies in our industry. Since Adjusted EBITDA is not a measure calculated in accordance with GAAP, it should not be considered in isolation of, or as a substitute for, operating income or net income (loss) as an indicator of operating performance and may not be comparable to similarly titled measures employed by other companies. Adjusted EBITDA is not necessarily a measure of our ability to fund our cash needs. Because it excludes certain financial information compared with operating income and compared with consolidated net income (loss), the most directly comparable GAAP financial measures, users of this financial information should consider the types of events and transactions which are excluded.
|
Reconciliations of Cash provided by (used for) operating activities from continuing operations to Free cash flow from (used for) continuing operations
|
(In thousands)
|
Successor Company
|
Predecessor Company
|
Non-GAAP Combined
|
Predecessor Company
|
||||||||||||
|
Period from May 2, 2019 through December 31,
|
Period from January 1, 2019 through May 1,
|
Year Ended December 31,
|
Year Ended December 31,
|
|||||||||||||
|
2019
|
2019
|
2019
|
2018
|
|||||||||||||
|
Cash provided by (used for) operating activities from continuing operations
(1)
|
$
|
468,905
|
|
$
|
(7,505
|
)
|
$
|
461,400
|
|
$
|
741,219
|
|
||||
|
Less: Purchases of property, plant and equipment by continuing operations
|
(75,993
|
)
|
(36,197
|
)
|
(112,190
|
)
|
(85,245
|
)
|
||||||||
|
Free cash flow from (used for) continuing operations
(2)
|
$
|
392,912
|
|
$
|
(43,702
|
)
|
$
|
349,210
|
|
$
|
655,974
|
|
||||
|
(In thousands)
|
Predecessor Company
|
||||||
|
Year Ended December 31,
|
Year Ended December 31,
|
||||||
|
2018
|
2017
|
||||||
|
Cash provided by (used for) operating activities from continuing operations
|
$
|
741,219
|
|
$
|
(619,187
|
)
|
|
|
Less: Purchases of property, plant and equipment by continuing operations
|
(85,245
|
)
|
(67,728
|
)
|
|||
|
Free cash flow from (used for) continuing operations
(2)
|
$
|
655,974
|
|
$
|
(686,915
|
)
|
|
42
|
(1)
|
Cash provided by operating activities from continuing operations for the year ended December 31, 2019 was impacted primarily by an increase of
$165.1 million
in cash paid for interest. Our debt issued upon emergence was outstanding from the period of May 2, 2019 to December 31, 2019, resulting in cash interest payments of $183.8 million. In 2018, we made cash interest payments of $22.5 million on our pre-petition debt, which was outstanding for the period from January 1, 2018 to March 14, 2018. Cash provided by operating activities was also impacted by a
$97.9 million
increase in cash payments for Reorganization items, which consisted primarily of bankruptcy-related professional fees, as well as payments for settlement of pre-petition liabilities upon our emergence from bankruptcy.
|
|
(2)
|
We define Free cash flow from (used for) continuing operations ("Free Cash Flow") as
Cash provided by (used for) operating activities from continuing operations less capital expenditures, which is disclosed as Purchases of property, plant and equipment by continuing operations in the Company's Consolidated Statements of Cash Flows.
We use Free Cash Flow, among other measures, to evaluate the Company’s liquidity and its ability to generate cash flow. We believe that Free Cash Flow is meaningful to investors because we review cash flows generated from operations after taking into consideration capital expenditures due to the fact that these expenditures are considered to be a necessary component of ongoing operations. In addition, we believe that Free Cash Flow helps improve investors' ability to compare our liquidity with other companies. Since Free Cash Flow is not a measure calculated in accordance with GAAP, it should not be considered in isolation of, or as a substitute for, Cash provided by operating activities and may not be comparable to similarly titled measures employed by other companies. Free Cash Flow is not necessarily a measure of our ability to fund our cash needs.
|
Share-Based Compensation Expense
Historically, we had granted restricted shares of the Company's Class A common stock to certain key individuals. In connection with the effectiveness of our Plan of Reorganization, all unvested restricted shares were canceled.
Pursuant to the new equity incentive plan (the "Post-Emergence Equity Plan") we adopted in connection with the effectiveness of our Plan of Reorganization, we have granted restricted stock units and options to purchase shares of the Company's Class A common stock to certain key individuals.
Share-based compensation expenses are recorded in corporate expenses and were
$26.9 million
,
$2.1 million
and
$2.5 million
for the years ended December 31,
2019
,
2018
and
2017
, respectively.
As of December 31,
2019
, there was
$57.6 million
of unrecognized compensation cost related to unvested share-based compensation arrangements that will vest based on service conditions. This cost is expected to be recognized over a weighted average period of approximately
3.4
years.
LIQUIDITY AND CAPITAL RESOURCES
Cash Flows
The following discussion highlights cash flow activities during the periods presented:
|
(In thousands)
|
Successor Company
|
Predecessor Company
|
Non-GAAP Combined
|
Predecessor Company
|
||||||||||||||||
|
Period from May 2, 2019 through December 31,
|
Period from January 1, 2019 through May 1,
|
Year Ended December 31,
|
Year Ended December 31,
|
|||||||||||||||||
|
2019
|
2019
|
2019
|
2018
|
2017
|
||||||||||||||||
|
Cash provided by (used for):
|
||||||||||||||||||||
|
Operating activities
|
$
|
468,905
|
|
$
|
(40,186
|
)
|
$
|
428,719
|
|
$
|
966,672
|
|
$
|
(491,210
|
)
|
|||||
|
Investing activities
|
$
|
(73,278
|
)
|
$
|
(261,144
|
)
|
$
|
(334,422
|
)
|
$
|
(345,478
|
)
|
$
|
(214,692
|
)
|
|||||
|
Financing activities
|
$
|
(58,033
|
)
|
$
|
(55,557
|
)
|
$
|
(113,590
|
)
|
$
|
(491,799
|
)
|
$
|
151,335
|
|
|||||
|
Free Cash Flow
(1)
|
$
|
392,912
|
|
$
|
(43,702
|
)
|
$
|
349,210
|
|
$
|
655,974
|
|
$
|
(686,915
|
)
|
|||||
|
(1)
|
See definition of Free Cash Flow under
Non-GAAP Financial Measures.
|
Operating Activities
2019
43
Cash
provided by
operating activities was
$428.7 million
in
2019
compared to
$966.7 million
of cash
provided by
operating activities in
2018
. The primary driver for the change in cash provided by operating activities was a
$258.1 million
decrease in operating cash flows provided by discontinued operations, which decreased from a cash inflow of
$225.5 million
in the
year ended
December 31, 2018
to a cash outflow of
$32.7 million
in the
year ended
December 31, 2019
.
Cash provided by operating activities from continuing operations decreased from
$741.2 million
in
2018
to
$461.4 million
in
2019
primarily as a result of cash interest payments made by continuing operations, which increased
$165.1 million
as a result of interest payments on our debt issued upon our emergence compared to pre-petition interest payments made in the prior year. The Company ceased paying interest on long-term debt classified as Liabilities subject to compromise after the March 14, 2018 petition date. In addition, cash decreased as a result of cash payments for Reorganization items, including payments for pre-petition liabilities and for bankruptcy-related professional fees, upon our emergence from bankruptcy on May 1, 2019. Such payments for Reorganization items were
$97.9 million
higher in the
year ended
December 31, 2019
compared to the
year ended
December 31, 2018
.
2018
Cash provided by operating activities was
$966.7 million
in 2018 compared to
$491.2 million
of cash used for operating activities in 2017.
Cash provided by operating activities from continuing operations was
$741.2 million
in 2018 compared to
$619.2 million
of cash used for operating activities from continuing operations in 2017.
The increase in cash provided by operating activities is primarily attributed to the
$1,374.4 million
decrease in cash paid for interest. Cash paid for interest was
$398.0 million
during 2018 compared to
$1,772.4 million
during 2017. In addition, cash provided by operating activities increased as a result of changes in working capital balances, particularly accounts receivable, which were affected by improved collections as well as accounts payable and accrued expenses which were impacted by the timing of payments. Cash paid for Reorganization items, net was
$103.7 million
during 2018. As part of our liquidity measures taken in anticipation of our March 14, 2018 bankruptcy filing, we did not make scheduled interest payments on our 9.0% Priority Guarantee Notes due 2021, 11.25% Priority Guarantee Notes due 2021 and 14.0% Senior Notes due 2021 and we extended certain accounts payable to conserve cash. Subsequent to the bankruptcy filing, interest payments on our debt classified as "Liabilities subject to compromise" were stayed and only limited pre-petition payments on accounts payable were made.
2017
Cash used for operating activities was $491.2 million in 2017 compared to $15.8 million of cash used for operating activities in 2016. The increase in cash used for operating activities is primarily attributed to lower operating income as well as changes in working capital balances, particularly accounts receivable, which was impacted by slower collections, and prepaid assets, partially offset by accrued interest and accounts payable due to the timing of payments.
Investing Activities
2019
Cash
used for
investing activities of
$334.4 million
in
2019
primarily reflects
$222.4 million
in cash
used for
investing activities from discontinued operations. In addition, we used
$112.2 million
for capital expenditures, primarily related to IT software and infrastructure.
2018
Cash used for investing activities of
$345.5 million
in
2018
primarily reflects
$203.6 million
in cash
used for
investing activities from discontinued operations. In addition, we used
$85.2 million
for capital expenditures, primarily related to IT software and infrastructure.
2017
Cash used for investing activities of
$214.7 million
in
2017
primarily reflects
$154.5 million
in cash used for investing activities from discontinued operations. In addition, we used
$67.7 million
for capital expenditures, partially offset by net cash proceeds from the sale of assets of
$10.9 million
. Capital expenditures consisted primarily of leasehold improvements and IT infrastructure costs.
Financing Activities
44
2019
Cash
used for
financing activities of
$113.6 million
in
2019
primarily resulted from the net payment by iHeartCommunications to CCOH as CCOH's recovery of its claims under the Due from iHeartCommunications Note and settlement of the post-petition intercompany note balance, partially offset by $60.0 million in proceeds received from the issuance of the iHeart Operations Preferred Stock.
2018
Cash used for financing activities of
$491.8 million
in
2018
primarily resulted from payments on long-term debt and on our receivables based credit facility. In connection with the replacement of the iHeartCommunications' receivables based credit facility with a new Debtor-in-Possession Facility (“DIP Facility”) on June 14, 2018, we repaid the outstanding $306.4 million and $74.3 million balances of the receivables based credit facility's term loan and revolving credit commitments, respectively. An additional $125.0 million principal amount was repaid under the DIP Facility during the third quarter of 2018.
2017
Cash provided by financing activities of
$151.3 million
in
2017
primarily reflects
$101.2 million
in cash provided by financing activities from discontinued operations. Cash provided by financing activities from continuing operations of
$50.2 million
was primarily driven by net proceeds from borrowings on our receivables-based credit facility.
Anticipated Cash Requirements
Our primary sources of liquidity are cash on hand, which consisted of
$400.3 million
as of
December 31, 2019
, cash flow from operations and borrowing capacity under our $450.0 million senior secured asset-based revolving credit facility (the "ABL Facility"). As of
December 31, 2019
, we had a facility size of
$450.0 million
under iHeartCommunications' ABL Facility, had no borrowings outstanding and
$48.1 million
of outstanding letters of credit, resulting in
$401.9 million
of availability.
We expect that our primary anticipated uses of liquidity will be to fund our working capital, make interest payments and voluntary prepayments of principal on our long-term debt and to fund capital expenditures and other obligations. These other obligations include dividend payments to be due to the investor of preferred stock of iHeart Operations, the terms of which are further described in Note 9 to our financial statements included herein. We anticipate that we will have approximately
$356 million
of cash interest payments in 2020. Over the past ten years, we have transitioned our Audio business from a single platform radio broadcast operator to a company with multiple platforms, including podcasting, networks and live events. We have also invested in numerous technologies and businesses to increase the competitiveness of our inventory with our advertisers and our audience. We believe that our ability to generate cash flow from operations from these business initiatives and borrowing capacity under our ABL Facility, taken together, will provide sufficient resources to fund and operate our business, fund capital expenditures and other obligations and make interest payments on our long-term debt for at least the next 12 months and thereafter for the foreseeable future.
The Separation and Reorganization resulted in a new capital structure with significantly lower levels of long-term debt and a corresponding decrease in debt service requirements after emergence compared to historical debt levels. As a result of the Separation and Reorganization, our consolidated long-term debt decreased from approximately $16 billion to $5.8 billion.
In connection with the Separation and Reorganization, we paid CCOH $115.8 million in settlement of intercompany payable balances, including settlement of the Due from iHeartCommunications Note and post-petition intercompany balances, $15.8 million to cure contracts, $17.5 million for a general unsecured claims reserve, and $201.6 million for professional fees (of which $126.3 million was paid on the Effective Date).
On August 7, 2019, iHeartCommunications completed the sale of $750.0 million in aggregate principal amount of 5.25% Senior Secured Notes due 2027 (the "5.25% Senior Secured Notes") in a private placement. We used the net proceeds from the 5.25% Senior Secured Notes, together with cash on hand, to prepay at par $740.0 million of borrowings outstanding under our Term Loan Facility.
On November 22, 2019, iHeartCommunications completed the sale of $500.0 million in aggregate principal amount of 4.75% Senior Secured Notes due 2028 (the "4.75% Senior Secured Notes") in a private placement. We used the net proceeds from the 4.75% Senior Secured Notes, together with cash on hand, to prepay at par $500.0 million of borrowings outstanding under our Term Loan Facility.
45
On February 3, 2020, iHeartCommunications made a $150.0 million prepayment using cash on hand and entered into an agreement to amend the Term Loan Facility to reduce the interest rate to LIBOR plus a margin of 3.00%, or the Base Rate (as defined in the Credit Agreement) plus a margin of 2.00% and to modify certain covenants contained in the Credit Agreement.
Also in connection with the Separation and Reorganization, we entered into the following transactions which may require ongoing capital commitments:
Transition Services Agreement
Pursuant to the Transition Services Agreement between us, iHeartMedia Management Services, Inc. (“iHM Management Services”), iHeartCommunications and CCOH, for one year from the Effective Date (subject to certain rights of Clear Channel Outdoor Holdings, Inc. (“New CCOH”) to extend up to one additional year, as described below), iHM Management Services has agreed to provide, or cause us, iHeartCommunications, iHeart Operations or any member of the iHeart Group to provide, CCH with certain administrative and support services and other assistance which CCH will utilize in the conduct of its business as such business was conducted prior to the Separation. The transition services may include, among other things, (a) treasury, payroll and other financial related services, (b) certain executive officer services, (c) human resources and employee benefits, (d) legal and related services, (e) information systems, network and related services, (f) investment services and (g) procurement and sourcing support.
The charges for the transition services will generally be intended to be consistent with the Corporate Services Agreement. The allocation of cost is based on various measures depending on the service provided, which measures include relative revenue, employee headcount or number of users of a service. New CCOH may request an extension of the term for all services or individual services for one‑month periods for up to an additional 12 months, and the price for transition services provided during such extended term will be increased for any service other than those identified in the schedules to the Transition Services Agreement as an “IT Service” or any other service the use and enjoyment of which requires the use of another IT Service.
New CCOH may terminate the Transition Services Agreement with respect to all or any individual service, in whole or in part, upon 30 days’ prior written notice, provided that any co‑dependent services must be terminated concurrently.
New Tax Matters Agreement
In connection with the Separation, we entered into the New Tax Matters Agreement by and among iHeartMedia, iHeartCommunications, iHeart Operations, Inc., CCH, CCOH and Clear Channel Outdoor, Inc., to allocate the responsibility of iHeartMedia and its subsidiaries, on the one hand, and CCOH and its subsidiaries, on the other, for the payment of taxes arising prior and subsequent to, and in connection with, the Separation.
The New Tax Matters Agreement requires that iHeartMedia and iHeartCommunications indemnify CCOH and its subsidiaries, and their respective directors, officers and employees, and hold them harmless, on an after‑tax basis, from and against (i) any taxes other than transfer taxes or indirect gains taxes imposed on iHeartMedia or any of its subsidiaries (other than CCOH and its subsidiaries) in connection with the Separation, (ii) any transfer taxes and indirect gains taxes arising in connection with the Separation, and (iii) fifty percent of the amount by which the amount of taxes (other than transfer taxes or indirect gains taxes) imposed on CCOH or any of its Subsidiaries in connection with the Separation that are paid to the applicable taxing authority on or before the third anniversary of the separation of CCOH exceeds $5 million, provided that, the obligations of iHeartMedia and iHeartCommunications to indemnify CCOH and its subsidiaries with respect taxes (other than transfer taxes or indirect gains taxes) imposed on CCOH or any of its subsidiaries in connection with the Separation will not exceed $15 million. In addition, if iHeartMedia or its subsidiaries use certain tax attributes of CCOH and its subsidiaries (including net operating losses, foreign tax credits and other credits) and such use results in a decrease in the tax liability of iHeartMedia or its subsidiaries, then we are required to reimburse CCOH for the use of such attributes based on the amount of tax benefit realized. The New Tax Matters Agreement provides that any reduction of the tax attributes of CCOH and its subsidiaries as a result of cancellation of indebtedness income realized in connection with the Chapter 11 Cases is not treated as a use of such attributes (and therefore does not require us to reimburse CCOH for such reduction).
The New Tax Matters Agreement also requires that (i) CCOH indemnify iHeartMedia for any income taxes paid by iHeartMedia on behalf of CCOH and its subsidiaries or, with respect to any income tax return for which CCOH or any of its subsidiaries joins with iHeartMedia or any of subsidiaries in filing a consolidated, combined or unitary return, the amount of taxes that would have been incurred by CCOH and its subsidiaries if they had filed a separate return, and (ii) except as described in the preceding paragraph, CCOH will indemnify iHeartMedia and its subsidiaries, and their respective directors, officers and employees, and hold them harmless, on an after‑tax basis, from and against any taxes other than transfer taxes or indirect gains taxes imposed on CCOH or any of its subsidiaries in connection with the Separation Transactions.
46
Any tax liability of CCH attributable to any taxable period ending on or before the date of the completion of the separation of CCOH, other than any such tax liability resulting from CCH being a successor of CCOH in connection with the merger of CCOH with and into CCH or arising from the operation of the business of CCOH and its subsidiaries after the merger of CCOH with and into CCH, will not be treated as a liability of CCOH and its subsidiaries for purposes of the New Tax Matters Agreement. CCOH’s obligations and rights under the New Tax Matters Agreement were assumed by CCH in the merger of CCOH with and into CCH (subject to the note above regarding tax liability of CCH for taxable periods ending on or before the date of the completion of the separation of CCOH).
Sources of Capital
As of December 31,
2019
and December 31,
2018
, we had the following debt outstanding, net of cash and cash equivalents:
|
(In millions)
|
Successor Company
|
Predecessor Company
|
||||||
|
December 31, 2019
|
December 31, 2018
|
|||||||
|
Term Loan Facility due 2026
(1)(2)(3)
|
$
|
2,251.3
|
|
$
|
—
|
|
||
|
Debtors-in-Possession Facility
(4)
|
—
|
|
—
|
|
||||
|
Asset-based Revolving Credit Facility due 2023
(4)
|
—
|
|
—
|
|
||||
|
6.375% Senior Secured Notes due 2026
|
800.0
|
|
—
|
|
||||
|
5.25% Senior Secured Notes due 2027
(1)
|
750.0
|
|
—
|
|
||||
|
4.75% Senior Secured Notes due 2028
(2)
|
500.0
|
|
—
|
|
||||
|
Other Secured Subsidiary Debt
|
21.0
|
|
—
|
|
||||
|
Total Secured Debt
|
4,322.3
|
|
—
|
|
||||
|
8.375% Senior Unsecured Notes due 2027
|
1,450.0
|
|
—
|
|
||||
|
Other Subsidiary Debt
|
12.5
|
|
46.1
|
|
||||
|
Long-term debt fees
|
(19.4
|
)
|
—
|
|
||||
|
Liabilities subject to compromise
(5)
|
—
|
|
15,149.5
|
|
||||
|
Total Debt
|
5,765.4
|
|
15,195.6
|
|
||||
|
Less: Cash and cash equivalents
|
400.3
|
|
224.0
|
|
||||
|
Net Debt
|
$
|
5,365.1
|
|
$
|
14,971.6
|
|
||
|
(1)
|
On August 7, 2019, iHeartCommunications issued the 5.25% Senior Secured Notes, the proceeds of which were used, together with cash on hand, to prepay at par $740.0 million of borrowings outstanding under the Term Loan Facility, plus approximately $0.8 million of accrued and unpaid interest to, but not including, the date of prepayment.
|
|
(2)
|
On November 22, 2019, iHeartCommunications issued the 4.75% Senior Secured Notes, the proceeds of which were used, together with cash on hand, to prepay at par $500.0 million of borrowings outstanding under the Term Loan Facility, plus approximately $1.7 million of accrued and unpaid interest to, but not including, the date of prepayment.
|
|
(3)
|
On February 3, 2020, iHeartCommunications made a $150.0 million prepayment using cash on hand and entered into an agreement to amend the Term Loan Facility to reduce the interest rate to LIBOR plus a margin of 3.00%, or the Base Rate (as defined in the Credit Agreement) plus a margin of 2.00% and to modify certain covenants contained in the Credit Agreement.
|
|
(4)
|
The Debtors-in-Possession Facility (the "DIP" Facility), which terminated with our emergence from the Chapter 11 Cases, provided for borrowings of up to
$450.0 million
. On the Effective Date, the DIP Facility was repaid and canceled and iHeartCommunications entered into the ABL Facility. As of
December 31, 2019
, we had a facility size of
$450.0 million
under the ABL Facility, had
no
outstanding borrowings and had
$48.1 million
of outstanding letters of credit, resulting in
$401.9 million
of availability.
|
|
(5)
|
In connection with our Chapter 11 Cases, the Company's Predecessor long-term debt was reclassified to Liabilities subject to compromise in our Consolidated Balance Sheet as of
December 31, 2018
. As of the Petition Date, we ceased accruing interest expense in relation to long-term debt reclassified as Liabilities subject to compromise.
|
For additional information regarding our debt, including the terms of the governing documents, refer to Note 9,
Long-Term Debt
to our consolidated financial statements located in Item 8 of Part II of this Annual Report on Form 10-K.
47
Supplemental Financial Information under Debt Agreements and Certificate of Designation Governing the iHeart Operations Preferred Stock
Pursuant to iHeartCommunications' material debt agreements, Capital I, the parent guarantor and a subsidiary of iHeartMedia, is permitted to satisfy its reporting obligations under such agreements by furnishing iHeartMedia’s consolidated financial information and an explanation of the material differences between iHeartMedia’s consolidated financial information, on the one hand, and the financial information of Capital I and its consolidated restricted subsidiaries, on the other hand. Because neither iHeartMedia nor iHeartMedia Capital II, LLC, a wholly-owned direct subsidiary of iHeartMedia and the parent of Capital I, have any operations or material assets or liabilities, there are no material differences between iHeartMedia’s consolidated financial information for the year ended
December 31, 2019
, and Capital I’s and its consolidated restricted subsidiaries’ financial information for the same period.
According to the certificate of designation governing the iHeart Operations Preferred Stock, iHeart Operations is required to provide certain supplemental financial information of iHeart Operations in comparison to the Company and its consolidated subsidiaries. iHeart Operations and its subsidiaries comprised
89.2%
of the Company's consolidated assets as of
December 31, 2019
. For the period from May 2, 2019 through
December 31, 2019
, iHeart Operations and its subsidiaries comprised
84.5%
of the Company's consolidated revenues.
Refinancing and Financing Transactions
2019 Financing Transactions
On the Effective Date, the conditions to the effectiveness of the Plan of Reorganization were satisfied and the Company emerged from Chapter 11 through the Reorganization transactions through which iHeartCommunications’ debt was reduced from approximately
$16 billion
to approximately
$5.8 billion
. The Reorganization included the restructuring of iHeartCommunications’ indebtedness by replacing its DIP facility with a
$450.0 million
the ABL Facility and the issuance of
$3.5 billion
aggregate principal amount under the Term Loan Facility, approximately
$1.45 billion
aggregate principal amount of new
8.375%
Senior Notes due 2027 (the “Senior Unsecured Notes”) and approximately
$800 million
aggregate principal amount of new
6.375%
Senior Secured Notes due 2026 (the “
6.375%
Senior Secured Notes”).
On August 7, 2019, iHeartCommunications completed the sale of $750.0 million in aggregate principal amount of 5.25% Senior Secured Notes in a private placement. We used the net proceeds from the 5.25% Senior Secured Notes, together with cash on hand, to prepay at par $740.0 million of borrowings outstanding under our Term Loan Facility.
On November 22, 2019, iHeartCommunications completed the sale of $500.0 million in aggregate principal amount of 4.75% Senior Secured Notes in a private placement. We used the net proceeds from the 4.75% Senior Secured Notes, together with cash on hand, to prepay at par $500.0 million of borrowings outstanding under our Term Loan Facility.
48
Uses of Capital
Capital Expenditures
Capital expenditures for the years ended December 31,
2019
,
2018
and
2017
were as follows:
|
(In millions)
|
Successor Company
|
Predecessor Company
|
Non-GAAP Combined
|
Predecessor Company
|
||||||||||||||||
|
Period from May 2, 2019 through December 31,
|
Period from January 1, 2019 through May 1,
|
Year Ended December 31,
|
Year Ended December 31,
|
|||||||||||||||||
|
2019
|
2019
|
2019
|
2018
|
2017
|
||||||||||||||||
|
Audio
|
$
|
62.0
|
|
$
|
31.2
|
|
$
|
93.2
|
|
$
|
72.4
|
|
$
|
55.7
|
|
|||||
|
Audio and Media Services
|
4.0
|
|
1.3
|
|
5.3
|
|
5.9
|
|
3.2
|
|
||||||||||
|
Corporate
|
10.0
|
|
3.7
|
|
13.7
|
|
6.9
|
|
8.8
|
|
||||||||||
|
Total capital expenditures
|
$
|
76.0
|
|
$
|
36.2
|
|
$
|
112.2
|
|
$
|
85.2
|
|
$
|
67.7
|
|
|||||
See the Contractual Obligations table under “
Commitments, Contingencies and Guarantees
” and Note 10 to our consolidated financial statements located in Item 8 of Part II of this Annual Report on Form 10-K for the Company's future capital expenditure commitments.
Our capital expenditures are not of significant size individually and primarily relate to studio and broadcast equipment and software.
Dividends
Holders of shares of our Class A common stock are entitled to receive dividends, on a per share basis, when and if declared by our Board out of funds legally available therefor and whenever any dividend is made on the shares of our Class B common stock subject to certain exceptions set forth in our certificate. See Note 12 to our consolidated financial statements located in Item 8 of Part II of this Annual Report on Form 10-K.
Acquisitions
During the fourth quarter of 2018, we acquired Stuff Media LLC and Jelli, Inc. for aggregate consideration of
$120.3 million
, of which
$74.3 million
was paid in cash in the fourth quarter of 2018 and
$46.0 million
, plus imputed interest, was paid in cash in the fourth quarter of 2019. The assets acquired as part of these transactions consisted of
$27.0 million
in fixed assets and
$35.2 million
in intangible assets, primarily consisting of technology and content, along with
$77.3 million
in goodwill.
During the fourth quarter of 2017, we exchanged four radio stations in Chattanooga, Tennessee and six radio stations in Richmond, Virginia for four radio stations in Boston, Massachusetts and three radio stations in Seattle, Washington, owned by Entercom Communications Corp. The assets acquired as part of the transaction consisted of
$8.1 million
in fixed assets and
$63.2 million
in intangible assets (including
$2.4 million
in goodwill). The Company recognized a net gain of
$15.4 million
related to the sale, which is included within Other operating income (expense), net. Subsequent to the exchange, the Company placed two of the stations in Seattle and one station in Boston into a newly-formed trust, the Ocean Trust. The Ocean Trust is required to divest these stations in order to comply with FCC media ownership rules. These stations are being marketed for sale.
Certain Relationships with Related Parties
Prior to the Effective Date, we were party to a management agreement with certain affiliates of our former sponsors and certain other parties pursuant to which such affiliates of the former sponsors provided management and financial advisory services until December 31, 2018. These arrangements required management fees to be paid to such affiliates of the former sponsors for such services at a rate not greater than $15.0 million per year, plus reimbursable expenses. The Company did not recognize management fees following the Petition Date. During the years ended December 31,
2018
and
2017
, we recognized management fees and reimbursable expenses of
$2.9 million
and
$15.2 million
, respectively. As of the Effective Date, the 2018 management fees were waived.
49
Commitments, Contingencies and Guarantees
We are currently involved in certain legal proceedings arising in the ordinary course of business and, as required, have accrued our estimate of the probable costs for resolution of those claims for which the occurrence of loss is probable and the amount can be reasonably estimated. These estimates have been developed in consultation with counsel and are based upon an analysis of potential results, assuming a combination of litigation and settlement strategies. It is possible, however, that future results of operations for any particular period could be materially affected by changes in our assumptions or the effectiveness of our strategies related to these proceedings. Please refer to Item 3. “Legal Proceedings” within Part I of this Annual Report on Form 10-K.
Certain agreements relating to acquisitions provide for purchase price adjustments and other future contingent payments based on the financial performance of the acquired companies generally over a one to five-year period. The aggregate of these contingent payments, if performance targets are met, would not significantly impact our financial position or results of operations.
We have future cash obligations under various types of contracts. We lease office space, certain broadcast facilities and equipment. Some of our lease agreements contain renewal options and annual rental escalation clauses (generally tied to the consumer price index), as well as provisions for our payment of utilities and maintenance.
We have non-cancelable contracts in our radio broadcasting operations related to program rights and music license fees.
In the normal course of business, our broadcasting operations have minimum future payments associated with employee and talent contracts. These contracts typically contain cancellation provisions that allow us to cancel the contract with good cause.
The scheduled maturities of
iHeartCommunications'
secured debt, unsecured debt, mandatorily redeemable preferred stock, and our future minimum rental commitments under non-cancelable lease agreements, minimum payments under other non-cancelable contracts, payments under employment/talent contracts and other long-term obligations as of December 31,
2019
were as set forth in the table below.
|
(In thousands)
|
Payments due by Period
|
||||||||||||||||||
|
Contractual Obligations
|
Total
|
2020
|
2021-2022
|
2023-2024
|
Thereafter
|
||||||||||||||
|
Long-term debt:
|
|||||||||||||||||||
|
Secured debt
|
$
|
4,322,263
|
|
$
|
2,416
|
|
$
|
5,037
|
|
$
|
4,775
|
|
$
|
4,310,035
|
|
||||
|
Unsecured debt
|
1,462,581
|
|
6,496
|
|
6,085
|
|
—
|
|
1,450,000
|
|
|||||||||
|
Mandatorily Redeemable Preferred Stock
|
60,000
|
|
—
|
|
—
|
|
—
|
|
60,000
|
|
|||||||||
|
Interest payments on long-term debt and preferred stock
(1)
|
2,340,643
|
|
355,905
|
|
683,795
|
|
675,994
|
|
624,949
|
|
|||||||||
|
Non-cancelable operating leases
|
1,358,925
|
|
129,324
|
|
255,402
|
|
211,388
|
|
762,811
|
|
|||||||||
|
Non-cancelable contracts
|
176,950
|
|
134,440
|
|
37,226
|
|
2,950
|
|
2,334
|
|
|||||||||
|
Employment/talent contracts
|
321,430
|
|
91,868
|
|
159,227
|
|
70,335
|
|
—
|
|
|||||||||
|
Unrecognized tax benefits
(2)
|
20,334
|
|
—
|
|
—
|
|
—
|
|
20,334
|
|
|||||||||
|
Other long-term obligations
|
37,776
|
|
101
|
|
13,006
|
|
4,442
|
|
20,227
|
|
|||||||||
|
Total
|
$
|
10,100,902
|
|
$
|
720,550
|
|
$
|
1,159,778
|
|
$
|
969,884
|
|
$
|
7,250,690
|
|
||||
|
(1)
|
Interest payments on long-term debt and preferred stock reflect the Company's obligations as of
December 31, 2019
, with the exception of the amended terms of the Term Loan Facility effective as of February 3, 2020. Interest payments calculated based on floating rates assume rates are held constant over the remaining term.
|
|
(2)
|
The non-current portion of the unrecognized tax benefits is included in the “Thereafter” column as we cannot reasonably estimate the timing or amounts of additional cash payments, if any, at this time. For additional information, see Note 11 included in Item 8 of Part II of this Annual Report on Form 10-K.
|
50
SEASONALITY
Typically, the Audio segment experiences its lowest financial performance in the first quarter of the calendar year. We expect this trend to continue in the future. Due to this seasonality and certain other factors, the results for the interim periods may not be indicative of results for the full year. In addition, our Audio segment and our Audio and Media Services segment are impacted by political cycles and generally experience higher revenues in congressional election years, and particularly in presidential election years. This cyclicality may affect comparability of results between years.
MARKET RISK
We are exposed to market risks arising from changes in market rates and prices, including movements in interest rates, foreign currency exchange rates and inflation.
Interest Rate Risk
A significant amount of our long-term debt bears interest at variable rates. Accordingly, our earnings will be affected by changes in interest rates. As of
December 31, 2019
, approximately
40%
of our aggregate principal amount of long-term debt bore interest at floating rates. Assuming the current level of borrowings and assuming a 50% change in LIBOR, it is estimated that our interest expense for the period from May 2, 2019 through
December 31, 2019
would have changed by
$17.3 million
.
In the event of an adverse change in interest rates, management may take actions to mitigate our exposure. However, due to the uncertainty of the actions that would be taken and their possible effects, the preceding interest rate sensitivity analysis assumes no such actions. Further, the analysis does not consider the effects of the change in the level of overall economic activity that could exist in such an environment.
Inflation
Inflation is a factor in our business and we continue to seek ways to mitigate its effect. Inflation has affected our performance in terms of higher costs for wages, salaries and equipment. Although the exact impact of inflation is indeterminable, we believe we have offset these higher costs by increasing the effective advertising rates of most of our broadcasting stations in our Audio operations.
NEW ACCOUNTING PRONOUNCEMENTS
For information regarding new accounting pronouncements, refer to Note 1,
Summary of Significant Accounting Policies
.
CRITICAL ACCOUNTING ESTIMATES
The preparation of our financial statements in conformity with U.S. GAAP requires management to make estimates, judgments and assumptions that affect the reported amounts of assets and liabilities and disclosure of contingent assets and liabilities at the date of the financial statements and the reported amount of expenses during the reporting period. On an ongoing basis, we evaluate our estimates that are based on historical experience and on various other assumptions that are believed to be reasonable under the circumstances. The result of these evaluations forms the basis for making judgments about the carrying values of assets and liabilities and the reported amount of expenses that are not readily apparent from other sources. Because future events and their effects cannot be determined with certainty, actual results could differ from our assumptions and estimates, and such difference could be material. Our significant accounting policies are discussed in the notes to our consolidated financial statements included in Item 8 of Part II of this Annual Report on Form 10-K. Management believes that the following accounting estimates are the most critical to aid in fully understanding and evaluating our reported financial results, and they require management’s most difficult, subjective or complex judgments, resulting from the need to make estimates about the effect of matters that are inherently uncertain. The following narrative describes these critical accounting estimates, the judgments and assumptions and the effect if actual results differ from these assumptions.
Reorganization Value
As set forth in the Plan of Reorganization and the Disclosure Statement, the enterprise value of the Successor Company was estimated to be between $8.0 billion and $9.5 billion. Based on the estimates and assumptions discussed below, we estimated the enterprise value to be $8.75 billion, which was the mid-point of the range of enterprise value as of the Effective Date.
51
Management and its valuation advisors estimated the enterprise value of the Successor Company, which was approved by the Bankruptcy Court. The selected publicly traded companies analysis approach, the discounted cash flow analysis (“DCF”) approach and the selected transactions analysis approach were all utilized in estimating enterprise value. The use of each approach provides corroboration for the other approaches. To estimate enterprise value utilizing the selected publicly traded companies analysis method, valuation multiples derived from the operating data of publicly-traded benchmark companies to the same operating data of the Company were applied. The selected publicly traded companies analysis identified a group of comparable companies giving consideration to lines of business and markets served, size and geography. The valuation multiples were derived based on historical and projected financial measures of revenue and earnings before interest, taxes, depreciation and amortization and applied to projected operating data of the Company.
To estimate enterprise value utilizing the discounted cash flow method, an estimate of future cash flows for the period 2019 to 2022 with a terminal value was determined and discounted the estimated future cash flows to present value. The expected cash flows for the period 2019 to 2022 with a terminal value were based upon certain financial projections and assumptions provided to the Bankruptcy Court. The expected cash flows for the period 2019 to 2022 were derived from earnings forecasts and assumptions regarding growth and margin projections, as applicable. A terminal value was included, calculated using the terminal multiple method, which estimates a range of values at which the Successor Company will be valued at the end of the Projection Period based on applying a terminal multiple to final year Adjusted EBITDA, which is defined as consolidated operating income adjusted to exclude non-cash compensation expenses included within corporate expenses, as well as Depreciation and amortization, Impairment charges and Other operating income (expense), net.
To estimate enterprise value utilizing the selected transactions analysis, valuation multiples were derived from an analysis of consideration paid and net debt assumed from publicly disclosed merger or acquisition transactions, and such multiples were applied to the broadcast cash flows of the Successor Company. The selected transactions analysis identified companies and assets involved in publicly disclosed merger and acquisition transactions for which the targets had operating and financial characteristics comparable in certain respects to the Successor Company.
For information regarding the Reorganization, refer to Note 2,
Emergence from Voluntary Reorganization under Chapter 11 Proceedings
to our consolidated financial statements included in Part II of this Annual Report on Form 10-K.
Fresh Start Accounting
In connection with our emergence from bankruptcy and in accordance with ASC 852, we qualified for and adopted fresh start accounting on the Effective Date. We were required to adopt fresh start accounting because (i) the holders of existing voting shares of the Predecessor Company received less than 50% of the voting shares of the Successor Company and (ii) the reorganization value of our assets immediately prior to confirmation of the Plan of Reorganization was less than the post-petition liabilities and allowed claims.
In accordance with ASC 852, with the application of fresh start accounting, we allocated our reorganization value to our individual assets based on our estimated fair values in conformity with ASC 805,
Business Combinations
. The reorganization value represents the fair value of the Successor Company's assets before considering liabilities. The excess reorganization value over the fair value of identified tangible and intangible assets is reported as goodwill.
For information regarding fresh start accounting, refer to Note 3,
Fresh Start Accounting
to our consolidated financial statements included in Part II of this Annual Report on Form 10-K.
Allowance for Doubtful Accounts
We evaluate the collectability of our accounts receivable based on a combination of factors. In circumstances where we are aware of a specific customer’s inability to meet its financial obligations, we record a specific reserve to reduce the amounts recorded to what we believe will be collected. For all other customers, we recognize reserves for bad debt based on historical experience for each business unit, adjusted for relative improvements or deteriorations in the agings and changes in current economic conditions.
If our agings were to improve or deteriorate resulting in a 10% change in our allowance, we estimated that our bad debt expense for the year ended December 31,
2019
would have changed by approximately
$1.3 million
.
52
Leases
The most significant estimates used by management in accounting for leases and the impact of these estimates are as follows:
Expected lease term
Our expected lease term includes both contractual lease periods and cancelable option periods where failure to exercise such options would result in an economic penalty. The expected lease term is used in determining whether the lease is accounted for as an operating lease or a capital lease. A lease is considered a capital lease if the lease term exceeds 75% of the leased asset's useful life. The expected lease term is also used in determining the depreciable life of the asset. An increase in the expected lease term will increase the probability that a lease may be considered a capital lease and will generally result in higher interest and depreciation expense for a leased property recorded on our balance sheet.
Incremental borrowing rate
The incremental borrowing rate is primarily used in determining whether the lease is accounted for as an operating lease or a capital lease. A lease is considered a capital lease if the net present value of the minimum lease payments is greater than 90% of the fair market value of the property. An increase in the incremental borrowing rate decreases the net present value of the minimum lease payments and reduces the probability that a lease will be considered a capital lease.
Fair market value of leased asset
The fair market value of leased property is generally estimated based on comparable market data as provided by third-party sources. Fair market value is used in determining whether the lease is accounted for as an operating lease or a capital lease. A lease is considered a capital lease if the net present value of the minimum lease payments equals or exceeds 90% of the fair market value of the leased property. A higher fair market value reduces the likelihood that a lease will be considered a capital lease.
Long-lived Assets
Long-lived assets, including plant and equipment and definite-lived intangibles, are reported at historical cost less accumulated depreciation and amortization. We estimate the useful lives for various types of advertising structures and other long-lived assets based on our historical experience and our plans regarding how we intend to use those assets. Our experience indicates that the estimated useful lives applied to our portfolio of assets have been reasonable, and we do not expect significant changes to the estimated useful lives of our long-lived assets in the future. When we determine that structures or other long-lived assets will be disposed of prior to the end of their useful lives, we estimate the revised useful lives and depreciate the assets over the revised period. We also review long-lived assets for impairment when events and circumstances indicate that depreciable and amortizable long-lived assets might be impaired and the undiscounted cash flows estimated to be generated by those assets are less than the carrying amounts of those assets. When specific assets are determined to be unrecoverable, the cost basis of the asset is reduced to reflect the current fair market value.
We use various assumptions in determining the remaining useful lives of assets to be disposed of prior to the end of their useful lives and in determining the current fair market value of long-lived assets that are determined to be unrecoverable. Estimated useful lives and fair values are sensitive to factors including contractual commitments, regulatory requirements, future expected cash flows, industry growth rates and discount rates, as well as future salvage values. Our impairment loss calculations require management to apply judgment in estimating future cash flows, including forecasting useful lives of the assets and selecting the discount rate that reflects the risk inherent in future cash flows.
If actual results are not consistent with our assumptions and judgments used in estimating future cash flows and asset fair values, we may be exposed to future impairment losses that could be material to our results of operations.
Annual Goodwill and Indefinite-lived Intangible Asset Impairment Test
We perform our annual impairment test on goodwill and indefinite-lived intangible assets as of July 1 of each year. We also test goodwill or indefinite-lived intangible assets at interim dates if events or changes in circumstances indicate that goodwill or indefinite-lived intangible assets might be impaired.
Generally, our annual impairment test includes a full quantitative assessment, which involves the preparation of a fair value estimate for each of our reporting units based on our most recent projected financial results, market and industry factors, including comparison to peer companies and the application of our current estimated weighted average cost of capital ("WACC"). However, in connection with our emergence from bankruptcy, we qualified for and adopted fresh start accounting on the Effective Date. As of May 1, 2019, we allocated our estimated enterprise fair value to our individual assets and liabilities based on their estimated fair values in conformity with ASC 805, "
Business Combinations.
" As a result of the recent fair value exercise applied in connection with fresh start accounting, we opted to use a qualitative assessment for our annual goodwill and indefinite-lived
53
intangible asset impairment test as of July 1, 2019 in lieu of performing the full quantitative assessment, as permitted by ASC 350, "
Intangibles - Goodwill and Other
".
Indefinite-lived Intangible Assets
In connection with our Plan of Reorganization, we applied fresh start accounting as of May 1, 2019 as required by ASC 852 and recorded all of our assets and liabilities at estimated fair values, including our FCC licenses, which are included within our Audio reporting unit. As of July 1, 2019, the qualitative impairment assessment performed for indefinite-lived intangible assets considered the general macroeconomic environment, industry and market specific conditions, financial performance, including changes in costs and actual versus forecasted results, as well other issues or events specific to the Audio reporting unit.
Based on this assessment and the totality of facts and circumstances, including the business environment in the third quarter of 2019, the Company determined that it was not more likely than not that the fair value of the Company and its reporting units is less than their respective carrying amounts. As such, the Company concluded no impairment of indefinite-lived intangible assets was required as of July 1, 2019.
Goodwill
Upon application of fresh start accounting in accordance with ASC 852 in connection with our emergence from bankruptcy, we recorded goodwill of $3.3 billion, which represented the excess of estimated enterprise fair value over the estimated fair value of our assets and liabilities. Goodwill was further allocated to our reporting units based on the relative fair values of our reporting units as of May 1, 2019. See Note 3 to the consolidated financial statements located in Part II, Item 8 of this Annual Report on Form 10-K for further information.
As of July 1, 2019, the qualitative impairment assessment performed for goodwill considered the general macroeconomic environment, industry and market specific conditions for each reporting unit, financial performance, including changes in costs and actual versus forecasted results, as well other issues or events specific to each reporting unit. In addition, we evaluated the impact of changes in our stock price and the trading values of our publicly-traded debt from May 1, 2019 to July 1, 2019 to determine whether or not any changes would indicate a potential impairment of goodwill allocated to our reporting units.
Based on this assessment and the totality of facts and circumstances, including the business environment in the third quarter of 2019, the Company determined that it was not more likely than not that the fair value of the Company and its reporting units is less than their respective carrying amounts. As such, the Company concluded no impairment of goodwill was required as of July 1, 2019.
Tax Provisions
Our estimates of income taxes and the significant items giving rise to the deferred tax assets and liabilities are shown in the notes to our consolidated financial statements and reflect our assessment of actual future taxes to be paid on items reflected in the financial statements, giving consideration to both timing and probability of these estimates. Actual income taxes could vary from these estimates due to future changes in income tax law or results from the final review of our tax returns by federal, state or foreign tax authorities.
We use our judgment to determine whether it is more likely than not that our deferred tax assets will be realized. Deferred tax assets are reduced by valuation allowances if the Company believes it is more than likely than not that some portion or the entire asset will not be realized.
We use our judgment to determine whether it is more likely than not that we will sustain positions that we have taken on tax returns and, if so, the amount of benefit to initially recognize within our financial statements. We regularly review our uncertain tax positions and adjust our unrecognized tax benefits (UTBs) in light of changes in facts and circumstances, such as changes in tax law, interactions with taxing authorities and developments in case law. These adjustments to our UTBs may affect our income tax expense. Settlement of uncertain tax positions may require use of our cash.
54
Litigation Accruals
We are currently involved in certain legal proceedings. Based on current assumptions, we have accrued an estimate of the probable costs for the resolution of those claims for which the occurrence of loss is probable and the amount can be reasonably estimated. Future results of operations could be materially affected by changes in these assumptions or the effectiveness of our strategies related to these proceedings.
Management’s estimates have been developed in consultation with counsel and are based upon an analysis of potential results, assuming a combination of litigation and settlement strategies.
Insurance Accruals
We are currently self-insured beyond certain retention amounts for various insurance coverages, including general liability and property and casualty. Accruals are recorded based on estimates of actual claims filed, historical payouts, existing insurance coverage and projected future development of costs related to existing claims. Our self-insured liabilities contain uncertainties because management must make assumptions and apply judgment to estimate the ultimate cost to settle reported claims and claims incurred but not reported as of December 31,
2019
.
If actual results are not consistent with our assumptions and judgments, we may be exposed to gains or losses that could be material. A 10% change in our self-insurance liabilities at December 31,
2019
would have affected our net income by approximately
$2.1 million
for the year ended December 31,
2019
.
Share-Based Compensation
Under the fair value recognition provisions of ASC 718-10, share-based compensation cost is measured at the grant date based on the fair value of the award. Determining the fair value of share-based awards at the grant date requires assumptions and judgments, such as expected volatility, among other factors. If actual results differ significantly from these estimates, our results of operations could be materially impacted.
ITEM 7A. QUANTITATIVE AND QUALITATIVE DISCLOSURES ABOUT MARKET RISK
Required information is located within Item 7 of Part II of this Annual Report on Form 10-K.
55
ITEM 8. FINANCIAL STATEMENTS AND SUPPLEMENTARY DATA
Report of Independent Registered Public Accounting Firm
To the
Stockholders
and the Board of
Directors
of
iHeartMedia, Inc.
Opinion on the Financial Statements
We have audited the accompanying consolidated balance sheets of
iHeartMedia, Inc.
and subsidiaries
(the Company)
as of December 31,
2019
(Successor) and
2018
(Predecessor), the related consolidated statements of comprehensive income (loss), changes in
stockholders'
equity (deficit) and cash flows for the period from May 2, 2019 through December 31, 2019 (Successor), the period January 1, 2019 through May 1, 2019 (Predecessor), and each of the two years in the period ended December 31, 2018 (Predecessor), and the related notes and the financial statement schedule listed in the Index at Item 15(a)2 (collectively referred to as the “consolidated financial statements”). In our opinion, the consolidated financial statements present fairly, in all material respects, the financial position of the Company at December 31,
2019
(Successor) and
2018
(Predecessor), and the results of its operations and its cash flows for the period from May 2, 2019 through December 31, 2019 (Successor), the period January 1, 2019 through May 1, 2019 (Predecessor), and the years ended December 31, 2018 and 2017 (Predecessor) in conformity with U.S. generally accepted accounting principles.
We also have audited, in accordance with the standards of the Public Company Accounting Oversight Board (United States) (PCAOB), the Company's internal control over financial reporting as of December 31,
2019
, based on criteria established in Internal Control-Integrated Framework issued by the Committee of Sponsoring Organizations of the Treadway Commission (2013 framework), and our report dated
February 27, 2020
expressed an unqualified opinion thereon.
As discussed in Note 2 and Note 3 to the consolidated financial statements, on January 22, 2019, the Bankruptcy Court entered an order confirming the plan of reorganization, which became effective on May 1, 2019. Accordingly, the accompanying consolidated financial statements have been prepared in conformity with Accounting Standards Codification 852-10, Reorganizations, for the Successor Company as a new entity with assets, liabilities and a capital structure having carrying amounts not comparable with prior periods. See below for discussion of our related critical audit matter.
Adoption of New Accounting Standard
As discussed in Note 1 to the consolidated financial statements, the Company changed its method of accounting for leases in 2019.
Basis for Opinion
These financial statements are the responsibility of the Company's management. Our responsibility is to express an opinion on the Company's financial statements based on our audits. We are a public accounting firm registered with the PCAOB and are required to be independent with respect to the Company in accordance with the U.S. federal securities laws and the applicable rules and regulations of the Securities and Exchange Commission and the PCAOB.
We conducted our audits in accordance with the standards of the PCAOB. Those standards require that we plan and perform the audit to obtain reasonable assurance about whether the financial statements are free of material misstatement, whether due to error or fraud. Our audits included performing procedures to assess the risks of material misstatement of the financial statements, whether due to error or fraud, and performing procedures that respond to those risks. Such procedures included examining, on a test basis, evidence regarding the amounts and disclosures in the financial statements. Our audits also included evaluating the accounting principles used and significant estimates made by management, as well as evaluating the overall presentation of the financial statements. We believe that our audits provide a reasonable basis for our opinion.
Critical Audit Matter
The critical audit matter communicated below is a matter arising from the current period audit of the financial statements that was communicated or required to be communicated to the audit committee and that: (1) relates to accounts or disclosures that are material to the financial statements and (2) involved our especially challenging, subjective or complex judgments. The communication of this critical audit matter does not alter in any way our opinion on the consolidated financial statements, taken as a whole, and we are not, by communicating the critical audit matter below, providing a separate opinion on the critical audit matter or on the accounts or disclosures to which it relates.
56
|
Emergence from Bankruptcy
|
||
|
Description of the Matter
|
As described above and in Note 2 and Note 3 to the Consolidated Financial Statements, on May 1, 2019 the Company emerged from Chapter 11 Bankruptcy. In connection with the Company's emergence from bankruptcy and in accordance with ASC 852, the Company qualified for and adopted fresh start accounting. Management calculated a reorganization value of $10.7 billion, which represents the fair value of the Successor Company's assets before considering liabilities and allocated the value to its individual assets based on their estimated fair values.
Auditing the Company's fresh start accounting was complex due to the significant estimation uncertainty in determining the fair values of the Company’s assets. The identified intangible assets of $4.6 billion, which principally consisted of FCC Licenses and customer relationships, were subject to significant estimation uncertainty primarily due to the sensitivity of the respective fair values to underlying assumptions in the discounted cash flow models used to measure the FCC licenses and customer relationship intangible assets. These significant assumptions included discount rates and certain assumptions that form the basis of the forecasted results such as revenue growth rates, margins, and attrition rates which may be affected by future economic and market conditions. In addition, auditing the Company’s income tax accounting adjustments for the emergence from bankruptcy was challenging as it involved judgment to analyze, interpret and apply complex tax laws and regulations.
|
|
|
How We Addressed the Matter in Our Audit
|
We obtained an understanding, evaluated the design and tested the operating effectiveness of controls over the Company’s processes to account for the emergence from bankruptcy protection. These, included controls over the estimation process supporting the recognition and measurement of the fresh start adjustments of the successor Company, including the intangibles mentioned above, the evaluation of underlying assumptions with regard to the valuation models applied, and application of the technical tax guidance.
To test the estimated fair value of the FCC Licenses and customer-related intangible assets, our audit procedures included, among other things, evaluating the Company's selection of the valuation methodology, evaluating the methods and significant assumptions used by management, and evaluating the completeness and accuracy of the underlying data supporting the significant assumptions and estimates. We compared the significant assumptions mentioned above to the Company’s historical results and third-party industry projections for the broadcast industry. We also involved tax professionals to assess the technical merits of the Company’s tax positions related to the restructuring transactions and the application of fresh start accounting. This included evaluating income tax opinions or other third-party advice obtained by the Company, performing inquiries of certain external tax advisers used by the Company and evaluating the appropriateness of the Company’s accounting for its tax positions taking into consideration relevant federal and state income tax laws. Also, we analyzed the Company’s assumptions and data used to determine the amount of cancellation of debt income to be realized through attribute reduction and tested the accuracy of the calculations. We also evaluated the adequacy of the Company’s financial statement disclosures related to the emergence from bankruptcy and tax matters.
|
|
/s/ Ernst & Young LLP
We have served as the Company's auditor since at least 1986, but we are unable to determine the specific year.
San Antonio, Texas
February 27, 2020
57
CONSOLIDATED BALANCE SHEETS OF
IHEARTMEDIA, INC.
AND SUBSIDIARIES
|
(In thousands, except share and per share data)
|
Successor Company
|
Predecessor Company
|
||||||
|
December 31,
2019 |
December 31,
2018 |
|||||||
|
Cash and cash equivalents
|
$
|
400,300
|
|
$
|
224,037
|
|
||
|
Accounts receivable, net of allowance of $12,629 in 2019 and $26,584 in 2018
|
902,908
|
|
868,861
|
|
||||
|
Prepaid expenses
|
71,764
|
|
99,532
|
|
||||
|
Other current assets
|
41,376
|
|
26,787
|
|
||||
|
Current assets of discontinued operations
|
—
|
|
1,015,800
|
|
||||
|
Total Current Assets
|
1,416,348
|
|
2,235,017
|
|
||||
|
PROPERTY, PLANT AND EQUIPMENT
|
||||||||
|
Property, plant and equipment, net
|
846,876
|
|
502,202
|
|
||||
|
INTANGIBLE ASSETS AND GOODWILL
|
||||||||
|
Indefinite-lived intangibles - licenses
|
2,277,735
|
|
2,417,915
|
|
||||
|
Other intangibles, net
|
2,176,540
|
|
200,422
|
|
||||
|
Goodwill
|
3,325,622
|
|
3,412,753
|
|
||||
|
OTHER ASSETS
|
||||||||
|
Operating lease right-of-use assets
|
881,762
|
|
—
|
|
||||
|
Other assets
|
96,216
|
|
149,736
|
|
||||
|
Long-term assets of discontinued operations
|
—
|
|
3,351,470
|
|
||||
|
Total Assets
|
$
|
11,021,099
|
|
$
|
12,269,515
|
|
||
|
CURRENT LIABILITIES
|
|
|
|
|
||||
|
Accounts payable
|
$
|
87,374
|
|
$
|
49,435
|
|
||
|
Current operating lease liabilities
|
77,756
|
|
—
|
|
||||
|
Accrued expenses
|
270,059
|
|
298,383
|
|
||||
|
Accrued interest
|
83,768
|
|
767
|
|
||||
|
Deferred revenue
|
139,529
|
|
123,143
|
|
||||
|
Current portion of long-term debt
|
8,912
|
|
46,105
|
|
||||
|
Current liabilities of discontinued operations
|
—
|
|
729,816
|
|
||||
|
Total Current Liabilities
|
667,398
|
|
1,247,649
|
|
||||
|
Long-term debt
|
5,756,504
|
|
—
|
|
||||
|
Series A Mandatorily Redeemable Preferred Stock, par value $0.001, authorized 60,000 shares, 60,000 shares issued in 2019 and no shares issued in 2018
|
60,000
|
|
—
|
|
||||
|
Noncurrent operating lease liabilities
|
796,203
|
|
—
|
|
||||
|
Deferred income taxes
|
737,443
|
|
—
|
|
||||
|
Other long-term liabilities
|
58,110
|
|
229,679
|
|
||||
|
Liabilities subject to compromise
|
—
|
|
16,480,256
|
|
||||
|
Long-term liabilities of discontinued operations
|
—
|
|
5,872,273
|
|
||||
|
Commitments and contingent liabilities (Note 10)
|
|
|
|
|
||||
|
STOCKHOLDERS’ EQUITY (DEFICIT)
|
||||||||
|
Noncontrolling interest
|
9,123
|
|
30,868
|
|
||||
|
Predecessor Preferred stock, par value $.001 per share, 150,000,000 shares authorized, no shares issued and outstanding
|
—
|
|
—
|
|
||||
|
Predecessor common stock
|
—
|
|
92
|
|
||||
|
Successor Preferred stock, par value $.001 per share, 100,000,000 shares authorized, no shares issued and outstanding
|
—
|
|
—
|
|
||||
|
Successor Class A Common Stock, par value $.001 per share, authorized 1,000,000,000 shares, 57,776,204 shares issued and outstanding in 2019 and no shares issued and outstanding in 2018
|
58
|
|
—
|
|
||||
|
Successor Class B Common Stock, par value $.001 per share, authorized 1,000,000,000 shares, 6,904,910 shares issued and outstanding in 2019 and no shares issued and outstanding in 2018
|
7
|
|
—
|
|
||||
|
Successor Special Warrants, 81,046,593 issued and outstanding in 2019 and none issued and outstanding in 2018
|
—
|
|
—
|
|
||||
|
Additional paid-in capital
|
2,826,533
|
|
2,074,632
|
|
||||
|
Retained earnings (Accumulated deficit)
|
112,548
|
|
(13,345,346
|
)
|
||||
|
Accumulated other comprehensive loss
|
(750
|
)
|
(318,030
|
)
|
||||
|
Cost of shares (128,074 in 2019 and 805,982 in 2018) held in treasury
|
(2,078
|
)
|
(2,558
|
)
|
||||
|
Total Stockholders' Equity (Deficit)
|
2,945,441
|
|
(11,560,342
|
)
|
||||
|
Total Liabilities and Stockholders' Equity (Deficit)
|
$
|
11,021,099
|
|
$
|
12,269,515
|
|
||
See Notes to Consolidated Financial Statements
58
CONSOLIDATED STATEMENTS OF COMPREHENSIVE INCOME (LOSS) OF
IHEARTMEDIA, INC.
AND SUBSIDIARIES
|
Successor Company
|
Predecessor Company
|
|||||||||||||||
|
(In thousands, except per share data)
|
Period from May 2, 2019 through December 31,
|
Period from January 1, 2019 through May 1,
|
Year Ended December 31,
|
|||||||||||||
|
2019
|
2019
|
2018
|
2017
|
|||||||||||||
|
Revenue
|
$
|
2,610,056
|
|
$
|
1,073,471
|
|
$
|
3,611,323
|
|
$
|
3,586,647
|
|
||||
|
Operating expenses:
|
||||||||||||||||
|
Direct operating expenses (excludes depreciation and amortization)
|
807,409
|
|
359,696
|
|
1,062,373
|
|
1,059,123
|
|
||||||||
|
Selling, general and administrative expenses (excludes depreciation and amortization)
|
936,806
|
|
436,345
|
|
1,376,931
|
|
1,346,063
|
|
||||||||
|
Corporate expenses (excludes depreciation and amortization)
|
168,582
|
|
66,020
|
|
227,508
|
|
208,648
|
|
||||||||
|
Depreciation and amortization
|
249,623
|
|
52,834
|
|
211,951
|
|
275,304
|
|
||||||||
|
Impairment charges
|
—
|
|
91,382
|
|
33,150
|
|
6,040
|
|
||||||||
|
Other operating income (expense), net
|
(8,000
|
)
|
(154
|
)
|
(9,266
|
)
|
9,313
|
|
||||||||
|
Operating income
|
439,636
|
|
67,040
|
|
690,144
|
|
700,782
|
|
||||||||
|
Interest expense (income), net
|
266,773
|
|
(499
|
)
|
334,798
|
|
1,484,435
|
|
||||||||
|
Loss on investments, net
|
(20,928
|
)
|
(10,237
|
)
|
(472
|
)
|
(3,827
|
)
|
||||||||
|
Equity in earnings (loss) of nonconsolidated affiliates
|
(279
|
)
|
(66
|
)
|
116
|
|
(1,865
|
)
|
||||||||
|
Other income (expense), net
|
(18,266
|
)
|
23
|
|
(23,007
|
)
|
(43,851
|
)
|
||||||||
|
Reorganization items, net
|
—
|
|
9,461,826
|
|
(356,119
|
)
|
—
|
|
||||||||
|
Income (loss) from continuing operations before income taxes
|
133,390
|
|
9,519,085
|
|
(24,136
|
)
|
(833,196
|
)
|
||||||||
|
Income tax benefit (expense)
|
(20,091
|
)
|
(39,095
|
)
|
(13,836
|
)
|
177,188
|
|
||||||||
|
Income (loss) from continuing operations
|
113,299
|
|
9,479,990
|
|
(37,972
|
)
|
(656,008
|
)
|
||||||||
|
Income (loss) from discontinued operations, net of tax
|
—
|
|
1,685,123
|
|
(164,667
|
)
|
197,297
|
|
||||||||
|
Net income (loss)
|
113,299
|
|
11,165,113
|
|
(202,639
|
)
|
(458,711
|
)
|
||||||||
|
Less amount attributable to noncontrolling interest
|
751
|
|
(19,028
|
)
|
(729
|
)
|
(60,651
|
)
|
||||||||
|
Net income (loss) attributable to the Company
|
$
|
112,548
|
|
$
|
11,184,141
|
|
$
|
(201,910
|
)
|
$
|
(398,060
|
)
|
||||
|
Other comprehensive income (loss), net of tax:
|
||||||||||||||||
|
Foreign currency translation adjustments
|
(750
|
)
|
(1,175
|
)
|
(15,924
|
)
|
43,851
|
|
||||||||
|
Other adjustments to comprehensive income (loss)
|
—
|
|
—
|
|
(1,498
|
)
|
6,306
|
|
||||||||
|
Reclassification adjustments
|
—
|
|
—
|
|
2,962
|
|
5,441
|
|
||||||||
|
Other comprehensive income (loss)
|
(750
|
)
|
(1,175
|
)
|
(14,460
|
)
|
55,598
|
|
||||||||
|
Comprehensive income (loss)
|
111,798
|
|
11,182,966
|
|
(216,370
|
)
|
(342,462
|
)
|
||||||||
|
Less amount attributable to noncontrolling interest
|
—
|
|
2,784
|
|
(8,713
|
)
|
13,847
|
|
||||||||
|
Comprehensive income (loss) attributable to the Company
|
$
|
111,798
|
|
$
|
11,180,182
|
|
$
|
(207,657
|
)
|
$
|
(356,309
|
)
|
||||
|
Basic net income (loss) per share
|
||||||||||||||||
|
From continuing operations
|
0.77
|
|
109.92
|
|
(0.44
|
)
|
(7.71
|
)
|
||||||||
|
From discontinued operations
|
—
|
|
19.76
|
|
(1.93
|
)
|
3.02
|
|
||||||||
|
Basic net income (loss) per share
|
0.77
|
|
129.68
|
|
(2.36
|
)
|
(4.68
|
)
|
||||||||
|
Weighted average common shares outstanding - Basic
|
145,608
|
|
86,241
|
|
85,412
|
|
84,967
|
|
||||||||
|
Diluted net income (loss) per share
|
||||||||||||||||
|
From continuing operations
|
0.77
|
|
109.92
|
|
(0.44
|
)
|
(7.71
|
)
|
||||||||
|
From discontinued operations
|
—
|
|
19.76
|
|
(1.93
|
)
|
3.02
|
|
||||||||
|
Diluted net income (loss) per share
|
0.77
|
|
129.68
|
|
(2.36
|
)
|
(4.68
|
)
|
||||||||
|
Weighted average common shares outstanding - Diluted
|
145,795
|
|
86,241
|
|
85,412
|
|
84,967
|
|
||||||||
See Notes to Consolidated Financial Statements
59
CONSOLIDATED STATEMENTS OF CHANGES IN STOCKHOLDERS' EQUITY (DEFICIT) OF
IHEARTMEDIA, INC.
AND SUBSIDIARIES
|
(In thousands, except share data)
|
Controlling Interest
|
||||||||||||||||||||||||||||||||||||||
|
Common Shares
(1)
|
Non-
controlling
Interest
|
Common
Stock
|
Additional
Paid-in
Capital
|
Retained Earnings
(Accumulated
Deficit) |
Accumulated
Other
Comprehensive
Loss
|
Treasury
Stock
|
|||||||||||||||||||||||||||||||||
|
Class A
Shares
|
Class B
Shares
|
Class C
Shares
|
Special Warrants
|
Total
|
|||||||||||||||||||||||||||||||||||
|
Balances at
December 31, 2018 (Predecessor) |
32,292,944
|
|
555,556
|
|
58,967,502
|
|
—
|
|
$
|
30,868
|
|
$
|
92
|
|
$
|
2,074,632
|
|
$
|
(13,345,346
|
)
|
$
|
(318,030
|
)
|
$
|
(2,558
|
)
|
$
|
(11,560,342
|
)
|
||||||||||
|
Net income (loss)
|
(19,028
|
)
|
—
|
|
—
|
|
11,184,141
|
|
—
|
|
—
|
|
11,165,113
|
|
|||||||||||||||||||||||||
|
Non-controlling interest - Separation
|
(13,199
|
)
|
—
|
|
—
|
|
—
|
|
—
|
|
—
|
|
(13,199
|
)
|
|||||||||||||||||||||||||
|
Accumulated other comprehensive loss - Separation
|
—
|
|
—
|
|
—
|
|
—
|
|
307,813
|
|
—
|
|
307,813
|
|
|||||||||||||||||||||||||
|
Adoption of ASC 842, Leases
|
—
|
|
—
|
|
—
|
|
128,908
|
|
—
|
|
—
|
|
128,908
|
|
|||||||||||||||||||||||||
|
Issuance of restricted stock
|
196
|
|
—
|
|
—
|
|
—
|
|
—
|
|
(4
|
)
|
192
|
|
|||||||||||||||||||||||||
|
Forfeitures of restricted stock
|
(110,333
|
)
|
—
|
|
—
|
|
—
|
|
—
|
|
—
|
|
—
|
|
—
|
|
|||||||||||||||||||||||
|
Share-based compensation
|
—
|
|
—
|
|
2,028
|
|
—
|
|
—
|
|
—
|
|
2,028
|
|
|||||||||||||||||||||||||
|
Share-based compensation - discontinued operations
|
2,449
|
|
—
|
|
—
|
|
—
|
|
—
|
|
—
|
|
2,449
|
|
|||||||||||||||||||||||||
|
Payments to non-controlling interests
|
(3,684
|
)
|
—
|
|
—
|
|
—
|
|
—
|
|
—
|
|
(3,684
|
)
|
|||||||||||||||||||||||||
|
Other
|
—
|
|
—
|
|
—
|
|
—
|
|
1
|
|
—
|
|
1
|
|
|||||||||||||||||||||||||
|
Other comprehensive income (loss)
|
2,784
|
|
—
|
|
—
|
|
—
|
|
(3,959
|
)
|
—
|
|
(1,175
|
)
|
|||||||||||||||||||||||||
|
Cancellation of Predecessor equity
|
(32,182,611
|
)
|
(555,556
|
)
|
(58,967,502
|
)
|
(386
|
)
|
(92
|
)
|
(2,076,660
|
)
|
2,059,998
|
|
14,175
|
|
2,562
|
|
(403
|
)
|
|||||||||||||||||||
|
Issuance of Successor common stock and warrants
|
56,861,941
|
|
6,947,567
|
|
—
|
|
81,453,648
|
|
8,943
|
|
64
|
|
2,770,108
|
|
(27,701
|
)
|
—
|
|
—
|
|
2,751,414
|
|
|||||||||||||||||
|
Balances at
May 1, 2019 (Predecessor) |
56,861,941
|
|
6,947,567
|
|
—
|
|
81,453,648
|
|
$
|
8,943
|
|
$
|
64
|
|
$
|
2,770,108
|
|
$
|
—
|
|
$
|
—
|
|
$
|
—
|
|
$
|
2,779,115
|
|
||||||||||
|
Balances at
May 2, 2019 (Successor) |
56,861,941
|
|
6,947,567
|
|
—
|
|
81,453,648
|
|
$
|
8,943
|
|
$
|
64
|
|
$
|
2,770,108
|
|
$
|
—
|
|
$
|
—
|
|
$
|
—
|
|
$
|
2,779,115
|
|
||||||||||
|
Net income
|
751
|
|
—
|
|
—
|
|
112,548
|
|
—
|
|
—
|
|
113,299
|
|
|||||||||||||||||||||||||
|
Vesting of restricted stock
|
644,025
|
|
—
|
|
1
|
|
(1
|
)
|
—
|
|
—
|
|
(2,078
|
)
|
(2,078
|
)
|
|||||||||||||||||||||||
|
Share-based compensation
|
—
|
|
—
|
|
26,377
|
|
—
|
|
—
|
|
—
|
|
26,377
|
|
|||||||||||||||||||||||||
|
Conversion of Special Warrants and Class B Shares to Class A Shares
|
270,238
|
|
(42,657
|
)
|
(227,581
|
)
|
—
|
|
—
|
|
—
|
|
—
|
|
—
|
|
—
|
|
—
|
|
|||||||||||||||||||
|
Cancellation of Special Warrants and other
|
(179,474
|
)
|
(571
|
)
|
—
|
|
30,049
|
|
—
|
|
—
|
|
—
|
|
29,478
|
|
|||||||||||||||||||||||
|
Other comprehensive loss
|
—
|
|
—
|
|
—
|
|
—
|
|
(750
|
)
|
—
|
|
(750
|
)
|
|||||||||||||||||||||||||
|
Balances at
December 31, 2019 (Successor) |
57,776,204
|
|
6,904,910
|
|
—
|
|
81,046,593
|
|
$
|
9,123
|
|
$
|
65
|
|
$
|
2,826,533
|
|
$
|
112,548
|
|
$
|
(750
|
)
|
$
|
(2,078
|
)
|
$
|
2,945,441
|
|
||||||||||
(1) The Predecessor Company's Class D Common Stock and Preferred Stock are not presented in the data above as there were no shares issued and outstanding in
2019
or
2018
.
See Notes to Consolidated Financial Statements
60
|
(In thousands, except per share data)
|
Controlling Interest
|
|||||||||||||||||||||||||||||||||||
|
Common Shares
(1)
|
Non-
controlling
Interest
|
Common
Stock
|
Additional
Paid-in
Capital
|
Accumulated
Deficit
|
Accumulated
Other
Comprehensive
Loss
|
Treasury
Stock
|
||||||||||||||||||||||||||||||
|
Class A
Shares |
Class B
Shares |
Class C
Shares |
Total
|
|||||||||||||||||||||||||||||||||
|
Balances at
December 31, 2016 (Predecessor) |
31,502,448
|
|
555,556
|
|
58,967,502
|
|
$
|
128,974
|
|
$
|
91
|
|
$
|
2,070,603
|
|
$
|
(12,743,941
|
)
|
$
|
(355,469
|
)
|
$
|
(2,119
|
)
|
$
|
(10,901,861
|
)
|
|||||||||
|
Net loss
|
(60,651
|
)
|
—
|
|
—
|
|
(398,060
|
)
|
—
|
|
—
|
|
(458,711
|
)
|
||||||||||||||||||||||
|
Issuance of restricted stock and other
|
1,123,720
|
|
(1,468
|
)
|
1
|
|
(1
|
)
|
—
|
|
—
|
|
(355
|
)
|
(1,823
|
)
|
||||||||||||||||||||
|
Share-based compensation
|
—
|
|
—
|
|
2,488
|
|
—
|
|
—
|
|
—
|
|
2,488
|
|
||||||||||||||||||||||
|
Share-based compensation - discontinued operations
|
9,590
|
|
—
|
|
—
|
|
—
|
|
—
|
|
—
|
|
9,590
|
|
||||||||||||||||||||||
|
Purchases of additional noncontrolling interest
|
(703
|
)
|
—
|
|
(524
|
)
|
—
|
|
—
|
|
—
|
|
(1,227
|
)
|
||||||||||||||||||||||
|
Disposal of noncontrolling interest
|
(2,439
|
)
|
—
|
|
—
|
|
—
|
|
—
|
|
—
|
|
(2,439
|
)
|
||||||||||||||||||||||
|
Payments to non-controlling interests
|
(46,151
|
)
|
—
|
|
—
|
|
—
|
|
—
|
|
—
|
|
(46,151
|
)
|
||||||||||||||||||||||
|
Other
|
192
|
|
—
|
|
—
|
|
—
|
|
—
|
|
—
|
|
192
|
|
||||||||||||||||||||||
|
Other comprehensive income
|
13,847
|
|
—
|
|
—
|
|
—
|
|
41,751
|
|
—
|
|
55,598
|
|
||||||||||||||||||||||
|
Balances at
December 31, 2017 (Predecessor) |
32,626,168
|
|
555,556
|
|
58,967,502
|
|
$
|
41,191
|
|
$
|
92
|
|
$
|
2,072,566
|
|
$
|
(13,142,001
|
)
|
$
|
(313,718
|
)
|
$
|
(2,474
|
)
|
$
|
(11,344,344
|
)
|
|||||||||
|
Net loss
|
(729
|
)
|
—
|
|
—
|
|
(201,910
|
)
|
—
|
|
—
|
|
(202,639
|
)
|
||||||||||||||||||||||
|
Issuance of restricted stock and other
|
(333,224
|
)
|
(713
|
)
|
—
|
|
—
|
|
—
|
|
—
|
|
(84
|
)
|
(797
|
)
|
||||||||||||||||||||
|
Share-based compensation
|
—
|
|
—
|
|
2,066
|
|
—
|
|
—
|
|
—
|
|
2,066
|
|
||||||||||||||||||||||
|
Share-based compensation - discontinued operations
|
8,517
|
|
—
|
|
—
|
|
—
|
|
—
|
|
—
|
|
8,517
|
|
||||||||||||||||||||||
|
Payments to non-controlling interests
|
(8,742
|
)
|
—
|
|
—
|
|
—
|
|
—
|
|
—
|
|
(8,742
|
)
|
||||||||||||||||||||||
|
Other
|
57
|
|
—
|
|
—
|
|
(1,435
|
)
|
1,435
|
|
—
|
|
57
|
|
||||||||||||||||||||||
|
Other comprehensive loss
|
(8,713
|
)
|
—
|
|
—
|
|
—
|
|
(5,747
|
)
|
—
|
|
(14,460
|
)
|
||||||||||||||||||||||
|
Balances at
December 31, 2018 (Predecessor) |
32,292,944
|
|
555,556
|
|
58,967,502
|
|
$
|
30,868
|
|
$
|
92
|
|
$
|
2,074,632
|
|
$
|
(13,345,346
|
)
|
$
|
(318,030
|
)
|
$
|
(2,558
|
)
|
$
|
(11,560,342
|
)
|
|||||||||
(1) The Company's Class D Common Stock and Preferred Stock are not presented in the data above as there were no shares issued and outstanding in
2018
,
2017
and
2016
, respectively.
See Notes to Consolidated Financial Statements
61
CONSOLIDATED STATEMENTS OF CASH FLOWS OF
IHEARTMEDIA, INC.
AND SUBSIDIARIES
|
Successor Company
|
Predecessor Company
|
|||||||||||||||
|
(In thousands)
|
Period from May 2, 2019 through December 31,
|
Period from January 1, 2019 through May 1,
|
Year Ended December 31,
|
|||||||||||||
|
2019
|
2019
|
2018
|
2017
|
|||||||||||||
|
Cash flows from operating activities:
|
||||||||||||||||
|
Net income (loss)
|
$
|
113,299
|
|
$
|
11,165,113
|
|
$
|
(202,639
|
)
|
$
|
(458,711
|
)
|
||||
|
(Income) loss from discontinued operations
|
—
|
|
(1,685,123
|
)
|
164,667
|
|
(197,297
|
)
|
||||||||
|
Reconciling items:
|
||||||||||||||||
|
Impairment charges
|
—
|
|
91,382
|
|
33,150
|
|
6,040
|
|
||||||||
|
Depreciation and amortization
|
249,623
|
|
52,834
|
|
211,951
|
|
275,304
|
|
||||||||
|
Deferred taxes
|
9,120
|
|
115,839
|
|
3,643
|
|
(177,105
|
)
|
||||||||
|
Provision for doubtful accounts
|
14,088
|
|
3,268
|
|
21,042
|
|
32,204
|
|
||||||||
|
Amortization of deferred financing charges and note discounts, net
|
1,295
|
|
512
|
|
11,871
|
|
46,947
|
|
||||||||
|
Non-cash Reorganization items, net
|
—
|
|
(9,619,236
|
)
|
252,392
|
|
—
|
|
||||||||
|
Share-based compensation
|
26,377
|
|
498
|
|
2,066
|
|
2,488
|
|
||||||||
|
(Gain) loss on disposal of operating and other assets
|
4,539
|
|
(143
|
)
|
3,233
|
|
(15,114
|
)
|
||||||||
|
Loss on investments
|
20,928
|
|
10,237
|
|
472
|
|
3,827
|
|
||||||||
|
Equity in (earnings) loss of nonconsolidated affiliates
|
279
|
|
66
|
|
(116
|
)
|
1,865
|
|
||||||||
|
Barter and trade income
|
(12,961
|
)
|
(5,947
|
)
|
(10,873
|
)
|
(36,725
|
)
|
||||||||
|
Other reconciling items, net
|
(9,154
|
)
|
(65
|
)
|
(596
|
)
|
(931
|
)
|
||||||||
|
Changes in operating assets and liabilities, net of effects of acquisitions and dispositions:
|
||||||||||||||||
|
(Increase) decrease in accounts receivable
|
(179,479
|
)
|
117,263
|
|
(35,464
|
)
|
(109,557
|
)
|
||||||||
|
(Increase) decrease in prepaid expenses and other current assets
|
15,288
|
|
(24,044
|
)
|
(2,055
|
)
|
(37,985
|
)
|
||||||||
|
(Increase) decrease in other long-term assets
|
7,924
|
|
(7,098
|
)
|
(13,755
|
)
|
(13,699
|
)
|
||||||||
|
Increase (decrease) in accounts payable and accrued expenses
|
127,150
|
|
(156,885
|
)
|
23,699
|
|
31,311
|
|
||||||||
|
Increase in accrued interest
|
84,523
|
|
256
|
|
303,344
|
|
40,575
|
|
||||||||
|
Increase (decrease) in deferred income
|
(8,441
|
)
|
13,377
|
|
(21,455
|
)
|
(13,260
|
)
|
||||||||
|
Increase (decrease) in other long-term liabilities
|
4,507
|
|
(79,609
|
)
|
(3,358
|
)
|
636
|
|
||||||||
|
Cash provided by (used for) operating activities from continuing operations
|
468,905
|
|
(7,505
|
)
|
741,219
|
|
(619,187
|
)
|
||||||||
|
Cash provided by (used for) operating activities from discontinued operations
|
—
|
|
(32,681
|
)
|
225,453
|
|
127,977
|
|
||||||||
|
Net cash provided by (used for) operating activities
|
468,905
|
|
(40,186
|
)
|
966,672
|
|
(491,210
|
)
|
||||||||
|
Cash flows from investing activities:
|
||||||||||||||||
|
Proceeds from disposal of assets
|
8,046
|
|
99
|
|
19,152
|
|
10,938
|
|
||||||||
|
Purchases of businesses
|
—
|
|
(1,998
|
)
|
(74,272
|
)
|
—
|
|
||||||||
|
Purchases of property, plant and equipment
|
(75,993
|
)
|
(36,197
|
)
|
(85,245
|
)
|
(67,728
|
)
|
||||||||
|
Change in other, net
|
(5,331
|
)
|
(682
|
)
|
(1,521
|
)
|
(3,380
|
)
|
||||||||
|
Cash used for investing activities from continuing operations
|
(73,278
|
)
|
(38,778
|
)
|
(141,886
|
)
|
(60,170
|
)
|
||||||||
|
Cash used for investing activities from discontinued operations
|
—
|
|
(222,366
|
)
|
(203,592
|
)
|
(154,522
|
)
|
||||||||
|
Net cash used for investing activities
|
(73,278
|
)
|
(261,144
|
)
|
(345,478
|
)
|
(214,692
|
)
|
||||||||
|
Cash flows from financing activities:
|
||||||||||||||||
|
Proceeds from long-term debt and credit facilities
|
1,250,007
|
|
269
|
|
143,332
|
|
100,000
|
|
||||||||
|
Payments on long-term debt and credit facilities
|
(1,285,408
|
)
|
(8,294
|
)
|
(622,677
|
)
|
(34,198
|
)
|
||||||||
|
Proceeds from Mandatorily Redeemable Preferred Stock
|
—
|
|
60,000
|
|
—
|
|
—
|
|
||||||||
|
Settlement of intercompany related to discontinued operations
|
—
|
|
(159,196
|
)
|
—
|
|
—
|
|
||||||||
|
Dividends and other payments to noncontrolling interests
|
(571
|
)
|
—
|
|
(1,078
|
)
|
(367
|
)
|
||||||||
|
Debt issuance costs
|
(19,983
|
)
|
—
|
|
—
|
|
—
|
|
||||||||
|
Change in other, net
|
(2,078
|
)
|
(5
|
)
|
(79
|
)
|
(15,250
|
)
|
||||||||
|
Cash provided by (used for) financing activities from continuing operations
|
(58,033
|
)
|
(107,226
|
)
|
(480,502
|
)
|
50,185
|
|
||||||||
|
Cash provided by (used for) financing activities from discontinued operations
|
—
|
|
51,669
|
|
(11,297
|
)
|
101,150
|
|
||||||||
|
Net cash provided by (used for) financing activities
|
(58,033
|
)
|
(55,557
|
)
|
(491,799
|
)
|
151,335
|
|
||||||||
|
Effect of exchange rate changes on cash
|
15
|
|
562
|
|
(10,361
|
)
|
10,141
|
|
||||||||
|
Net increase (decrease) in cash, cash equivalents and restricted cash
|
337,609
|
|
(356,325
|
)
|
119,034
|
|
(544,426
|
)
|
||||||||
|
Cash, cash equivalents and restricted cash at beginning of period
|
74,009
|
|
430,334
|
|
311,300
|
|
855,726
|
|
||||||||
|
Cash, cash equivalents and restricted cash at end of period
|
411,618
|
|
74,009
|
|
430,334
|
|
311,300
|
|
||||||||
|
Less cash, cash equivalents and restricted cash of discontinued operations at end of period
|
—
|
|
—
|
|
202,869
|
|
188,310
|
|
||||||||
|
Cash, cash equivalents and restricted cash of continuing operations at end of period
|
$
|
411,618
|
|
$
|
74,009
|
|
$
|
227,465
|
|
$
|
122,990
|
|
||||
|
SUPPLEMENTAL DISCLOSURES:
|
||||||||||||||||
|
Cash paid during the year for interest
|
$
|
183,806
|
|
$
|
137,042
|
|
$
|
397,984
|
|
$
|
1,772,405
|
|
||||
|
Cash paid during the year for taxes
|
5,759
|
|
22,092
|
|
34,203
|
|
35,505
|
|
||||||||
|
Cash paid for Reorganization items, net
|
18,360
|
|
183,291
|
|
103,727
|
|
—
|
|
||||||||
62
IHEARTMEDIA, INC.
AND SUBSIDIARIES
NOTES TO CONSOLIDATED FINANCIAL STATEMENTS
NOTE 1
–
SUMMARY OF SIGNIFICANT ACCOUNTING POLICIES
Nature of Business
iHeartMedia, Inc. (the “Company,” "iHeartMedia," "we" or "us") was formed in May 2007 by private equity funds sponsored by Bain Capital Partners, LLC and Thomas H. Lee Partners, L.P. (together, the “Sponsors”) for the purpose of acquiring the business of iHeartCommunications, Inc., a Texas company (“iHeartCommunications”). The acquisition was completed on July 30, 2008 pursuant to the Agreement and Plan of Merger, dated November 16, 2006, as amended on April 18, 2007, May 17, 2007 and May 13, 2008 (the “Merger Agreement”).
Unless otherwise indicated, information in these notes to the consolidated financial statements relates to continuing operations. Certain of the Company's operations have been presented as discontinued. The Company presents businesses that represent components as discontinued operations when the components meet the criteria for held for sale, are sold, or spun-off and their disposal represents a strategic shift that has, or will have, a major effect on its operations and financial results. See Note 4,
Discontinued Operations
.
As part of the Separation and Reorganization (as defined below), the Company reevaluated its segment reporting, resulting in the presentation of
two
operating segments:
|
▪
|
Audio, which provides media and entertainment services via broadcast and digital delivery and also includes the Company’s events and national syndication businesses and
|
|
▪
|
Audio and Media Services, which provides other audio and media services, including the Company’s media representation business, Katz Media Group (“Katz Media”) and the Company's provider of scheduling and broadcast software, Radio Computing Services (“RCS”).
|
Voluntary Filing under Chapter 11
On March 14, 2018 (the "Petition Date"), the Company, iHeartCommunications and certain of the Company's direct and indirect domestic subsidiaries (collectively, the "Debtors") filed voluntary petitions for relief (the "Chapter 11 Cases") under Chapter 11 of the United States Bankruptcy Code (the "Bankruptcy Code"), in the United States Bankruptcy Court for the Southern District of Texas, Houston Division (the "Bankruptcy Court"). Clear Channel Outdoor Holdings, Inc. (“CCOH”) and its direct and indirect subsidiaries did not file voluntary petitions for reorganization under the Bankruptcy Code and were not Debtors in the Chapter 11 Cases. On April 28, 2018, the Company and the other Debtors filed a plan of reorganization (as amended, the “Plan of Reorganization”) and a related disclosure statement with the Bankruptcy Court, which we subsequently amended by filing the second, third, fourth and fifth amended Plan of Reorganization and amended versions of the Disclosure Statement. On January 22, 2019, the Plan of Reorganization was confirmed by the Bankruptcy Court.
On May 1, 2019 (the “Effective Date”), the conditions to the effectiveness of the Plan of Reorganization were satisfied and the Company emerged from Chapter 11 through (a) a series of transactions (the “Separation”) through which CCOH, its parent Clear Channel Holdings, Inc. (“CCH”) and its subsidiaries (collectively with CCOH and CCH, the “Outdoor Group”) were separated from, and ceased to be controlled by, the Company and its subsidiaries (the “iHeart Group”), and (b) a series of transactions (the “Reorganization”) through which iHeartCommunications’ debt was reduced from approximately
$16 billion
to approximately
$5.8 billion
and a global compromise and settlement among holders of claims (“Claimholders”) in connection with the Chapter 11 Cases was effected. The compromise and settlement involved, among others, (i) the restructuring of iHeartCommunications’ indebtedness by (A) replacing its “debtor-in-possession” credit facility with a
$450 million
senior secured asset-based revolving credit facility (the “ABL Facility”) and (B) issuing to certain Claimholders, on account of their claims, approximately
$3.5 billion
aggregate principal amount of new senior secured term loans (the “Term Loan Facility”), approximately
$1.45 billion
aggregate principal amount of new
8.375%
Senior Notes due 2027 (the “Senior Unsecured Notes”) and approximately
$800 million
aggregate principal amount of new
6.375%
Senior Secured Notes due 2026 (the “
6.375%
Senior Secured Notes”), (ii) the Company’s issuance of new Class A common stock, new Class B common stock and special warrants to purchase shares of new Class A common stock and Class B common stock (“Special Warrants”) to Claimholders, subject to ownership restrictions imposed by the Federal Communications Commission (“FCC”), (iii) the settlement of certain intercompany transactions, and (iv) the sale of the preferred stock (the “iHeart Operations Preferred Stock”) of the Company’s wholly-owned subsidiary iHeart Operations, Inc. (“iHeart Operations”) in connection with the Separation.
All of the Company's equity existing as of the Effective Date was canceled on such date pursuant to the Plan of Reorganization.
63
IHEARTMEDIA, INC.
AND SUBSIDIARIES
NOTES TO CONSOLIDATED FINANCIAL STATEMENTS
Upon the Company's emergence from the Chapter 11 Cases, the Company adopted fresh start accounting, which resulted in a new basis of accounting and the Company becoming a new entity for financial reporting purposes. As a result of the application of fresh start accounting and the effects of the implementation of the Plan of Reorganization, the consolidated financial statements after the Effective Date, are not comparable with the consolidated financial statements on or before that date. Refer to Note 3,
Fresh Start Accounting
, for additional information.
References to “Successor” or “Successor Company” relate to the financial position and results of operations of the Company after the Effective Date. References to "Predecessor" or "Predecessor Company" refer to the financial position and results of operations of the Company on or before the Effective Date.
During the Predecessor period, the Company applied Accounting Standards Codification (“ASC”) 852 -
Reorganizations
(“ASC 852”) in preparing the consolidated financial statements. ASC 852 requires the financial statements, for periods subsequent to the commencement of the Chapter 11 Cases, to distinguish transactions and events that are directly associated with the reorganization from the ongoing operations of the business. Accordingly, certain charges incurred during 2018 and
2019
related to the Chapter 11 Cases, including the write-off of unamortized long-term debt fees and discounts associated with debt classified as liabilities subject to compromise, and professional fees incurred directly as a result of the Chapter 11 Cases are recorded as Reorganization items, net in the Predecessor period.
ASC 852 requires certain additional reporting for financial statements prepared between the bankruptcy filing date and the date of emergence from bankruptcy, including:
|
•
|
Reclassification of Debtor pre-petition liabilities that are unsecured, under-secured or where it cannot be determined that the liabilities are fully secured, to a separate line item in the Consolidated Balance Sheet called, "Liabilities subject to compromise"; and
|
|
•
|
Segregation of Reorganization items, net as a separate line in the Consolidated Statement of Comprehensive Loss, included within income from continuing operations.
|
The accompanying consolidated financial statements have been prepared assuming that the Company will continue as a going concern and contemplate the realization of assets and the satisfaction of liabilities in the normal course of business. During the Chapter 11 Cases, the Company’s ability to continue as a going concern was contingent upon the Company’s ability to successfully implement the Company’s Plan of Reorganization, among other factors. As a result of the effectiveness and implementation of the Plan of Reorganization, there is no longer substantial doubt about the Company's ability to continue as a going concern.
Use of Estimates
The preparation of the consolidated financial statements in conformity with U.S. generally accepted accounting principles (“GAAP”) requires management to make estimates, judgments, and assumptions that affect the amounts reported in the consolidated financial statements and accompanying notes including, but not limited to, legal, tax and insurance accruals. The Company bases its estimates on historical experience and on various other assumptions that are believed to be reasonable under the circumstances. Actual results could differ from those estimates.
Principles of Consolidation
The consolidated financial statements include the accounts of the Company and its subsidiaries. Also included in the consolidated financial statements are entities for which the Company has a controlling financial interest or is the primary beneficiary. Investments in companies in which the Company owns
20%
to
50%
of the voting common stock or otherwise exercises significant influence over operating and financial policies of the Company are accounted for using the equity method of accounting. All significant intercompany accounts have been eliminated in consolidation.
Certain prior period amounts have been reclassified to conform to the
2019
presentation.
The Company is the beneficiary of
two
trusts created to comply with Federal Communications Commission (“FCC”) ownership rules. The radio stations owned by the trusts are managed by independent trustees. The trustees are marketing these stations for sale, and the stations will have to be sold unless any stations may be owned by the Company under then-current FCC rules, in which case the trusts will be terminated with respect to such stations. The trust agreements stipulate that the Company must fund any operating shortfalls of the trust activities, and any excess cash flow generated by the trusts is distributed to the Company. The
64
IHEARTMEDIA, INC.
AND SUBSIDIARIES
NOTES TO CONSOLIDATED FINANCIAL STATEMENTS
Company is also the beneficiary of proceeds from the sale of stations held in the trusts. The Company consolidates the trusts in accordance with ASC 810-10, which requires an enterprise involved with variable interest entities to perform an analysis to determine whether the enterprise’s variable interest or interests give it a controlling financial interest in the variable interest entity, as the trusts were determined to be a variable interest entity and the Company is the primary beneficiary under the trusts.
Cash and Cash Equivalents
Cash and cash equivalents include all highly liquid investments with an original maturity of three months or less.
Accounts Receivable
Accounts receivable are recorded when the Company has an unconditional right to payment, either because it has satisfied a performance obligation prior to receiving payment from the customer or has a non-cancelable contract that has been billed in advance in accordance with the Company’s normal billing terms.
Accounts receivable are recorded at the invoiced amount, net of reserves for sales allowances and allowances for doubtful accounts. The Company evaluates the collectability of its accounts receivable based on a combination of factors. In circumstances where it is aware of a specific customer’s inability to meet its financial obligations, it records a specific reserve to reduce the amounts recorded to what it believes will be collected. For all other customers, it recognizes reserves for bad debt based on historical experience of bad debts as a percent of accounts receivable for each business unit, adjusted for relative improvements or deteriorations in the agings and changes in current economic conditions. The Company believes its concentration of credit risk is limited due to the large number of its customers.
Business Combinations
The Company accounts for its business combinations under the acquisition method of accounting. The total cost of an acquisition is allocated to the underlying identifiable net assets, based on their respective estimated fair values. The excess of the purchase price over the estimated fair values of the net assets acquired is recorded as goodwill. Determining the fair value of assets acquired and liabilities assumed requires management's judgment and often involves the use of significant estimates and assumptions, including assumptions with respect to future cash inflows and outflows, discount rates, asset lives and market multiples, among other items. Various acquisition agreements may include contingent purchase consideration based on performance requirements of the investee. The Company accounts for these payments in conformity with the provisions of ASC 805-20-30, which establish the requirements related to recognition of certain assets and liabilities arising from contingencies.
Property, Plant and Equipment
Property, plant and equipment are stated at cost. Depreciation is computed using the straight-line method at rates that, in the opinion of management, are adequate to allocate the cost of such assets over their estimated useful lives, which are as follows:
Buildings and improvements –
10
to
39
years
Towers, transmitters and studio equipment –
5
to
40
years
Furniture and other equipment –
3
to
7
years
Leasehold improvements – shorter of economic life or lease term assuming renewal periods, if appropriate
For assets associated with a lease or contract, the assets are depreciated at the shorter of the economic life or the lease or contract term, assuming renewal periods, if appropriate. Expenditures for maintenance and repairs are charged to operations as incurred, whereas expenditures for renewal and betterments are capitalized.
The Company tests for possible impairment of property, plant, and equipment whenever events and circumstances indicate that depreciable assets might be impaired and the undiscounted cash flows estimated to be generated by those assets are less than the carrying amounts of those assets. When specific assets are determined to be unrecoverable, the cost basis of the asset is reduced to reflect the current fair market value.
Assets and businesses are classified as held for sale if their carrying amount will be recovered or settled principally through a sale transaction rather than through continuing use. The asset or business must be available for immediate sale and the sale must be highly probable within one year.
65
IHEARTMEDIA, INC.
AND SUBSIDIARIES
NOTES TO CONSOLIDATED FINANCIAL STATEMENTS
Leases
The Company enters into operating lease contracts for land, buildings, structures and other equipment. Arrangements are evaluated at inception to determine whether such arrangements contain a lease. Operating leases primarily include land and building lease contracts and leases of radio towers. Arrangements to lease building space consist primarily of the rental of office space, but may also include leases of other equipment, including automobiles and copiers. Operating leases are reflected on the Company's balance sheet within Operating lease right-of-use assets and the related short-term and long-term liabilities are included within Current and Noncurrent operating lease liabilities, respectively.
The Company's finance leases are included within Property, plant and equipment with the related liabilities included within Long-term debt or within Liabilities subject to compromise.
ROU assets represent the right to use an underlying asset for the lease term, and lease liabilities represent the obligation to make lease payments arising from the lease. Operating lease ROU assets and liabilities are recognized at commencement date based on the present value of lease payments over the respective lease term. Lease expense is recognized on a straight-line basis over the lease term.
Certain of the Company's operating lease agreements include rental payments that are adjusted periodically for inflationary changes. Payments due to changes in inflationary adjustments are included within variable rent expense, which is accounted for separately from periodic straight-line lease expense. Amounts related to insurance and property taxes in lease arrangements when billed on a pass-through basis are allocated to the lease and non-lease components of the lease based on their relative standalone selling prices.
Certain of the Company's leases provide options to extend the terms of the agreements. Generally, renewal periods are excluded from minimum lease payments when calculating the lease liabilities as, for most leases, the Company does not consider exercise of such options to be reasonably certain. As a result, unless a renewal option is considered reasonably assured, the optional terms and related payments are not included within the lease liability. The Company's lease agreements do not contain any material residual value guarantees or material restrictive covenants.
The implicit rate within the Company's lease agreements is generally not determinable. As such, the Company uses the incremental borrowing rate ("IBR") to determine the present value of lease payments at the commencement of the lease. The IBR, as defined in ASC 842, is
"the rate of interest that a lessee would have to pay to borrow on a collateralized basis over a similar term an amount equal to the lease payments in a similar economic environment."
In connection with the Company's emergence from bankruptcy and in accordance with ASC 852, the Company applied the provisions of fresh start accounting to its Consolidated Financial Statements on the Effective Date. As a result, the Company adjusted the IBR used to value the Company's ROU assets and operating lease liabilities at the Effective Date (see Note 3,
Fresh Start Accounting
). In addition, upon adoption of ASC 852 in the first quarter of 2019, the Company did not elect the practical expedient to combine non-lease components with the associated lease components. Upon application of fresh start accounting on the Effective Date, the Company elected to use the practical expedient to not separate non-lease components from the associated lease component for all classes of the Company's assets.
Intangible Assets
The Company’s indefinite-lived intangible assets consist of FCC broadcast licenses in its Audio segment. The Company’s indefinite-lived intangible assets are not subject to amortization, but are tested for impairment at least annually. The Company tests for possible impairment of indefinite-lived intangible assets whenever events or changes in circumstances, such as a significant reduction in operating cash flow or a dramatic change in the manner for which the asset is intended to be used indicate that the carrying amount of the asset may not be recoverable. In connection with the Company's emergence from bankruptcy and in accordance with ASC 852, the Company applied the provisions of fresh start accounting to its Consolidated Financial Statements on the Effective Date. As a result, the Company adjusted its FCC licenses to their respective estimated fair values as of the Effective Date of
$2,281.7 million
(see Note 3,
Fresh Start Accounting
).
The Company normally performs its annual impairment test for its FCC licenses using a direct valuation technique as prescribed in ASC 805-20-S99. The Company engages a third-party valuation firm to assist the Company in the development of these assumptions and the Company’s determination of the fair value of its FCC licenses. In 2019, as a result of the recent fair value exercise applied in connection with fresh start accounting, the Company opted to use a qualitative assessment as permitted by ASC 350,
"Intangibles - Goodwill and Other"
. See Note 7,
Property, Plant and Equipment, Intangible Assets and Goodwill
.
66
IHEARTMEDIA, INC.
AND SUBSIDIARIES
NOTES TO CONSOLIDATED FINANCIAL STATEMENTS
Other intangible assets include definite-lived intangible assets. The Company’s definite-lived intangible assets primarily include customer and advertiser relationships, talent and representation contracts, trademarks and tradenames and other contractual rights, all of which are amortized over the shorter of either the respective lives of the agreements or over the period of time the assets are expected to contribute directly or indirectly to the Company’s future cash flows. The Company periodically reviews the appropriateness of the amortization periods related to its definite-lived intangible assets. These assets are recorded at amortized cost. In connection with the Company's emergence from bankruptcy and in accordance with ASC 852, the Company applied the provisions of fresh start accounting to its Consolidated Financial Statements on the Effective Date. As a result, the Company adjusted Other intangible assets to their respective fair values at the Effective Date (see Note 3,
Fresh Start Accounting
).
The Company tests for possible impairment of other intangible assets whenever events and circumstances indicate that they might be impaired and the undiscounted cash flows estimated to be generated by those assets are less than the carrying amounts of those assets. When specific assets are determined to be unrecoverable, the cost basis of the asset is reduced to reflect the current fair market value.
Goodwill
At least annually, the Company performs its impairment test for each reporting unit’s goodwill. The Company also tests goodwill at interim dates if events or changes in circumstances indicate that goodwill might be impaired.
The Company identified its reporting units in accordance with ASC 350-20-55. Generally, the Company's annual impairment test includes a full quantitative assessment, which involves the preparation of a fair value estimate for each reporting unit based on the most recent projected financial results, market and industry factors, including comparison to peer companies and the application of the Company's current estimated WACC. However, in connection with emergence from bankruptcy, the Company qualified for and adopted fresh start accounting on the Effective Date. As of May 1, 2019, the Company allocated its estimated enterprise fair value to its individual assets and liabilities based on their estimated fair values in conformity with ASC 805, "
Business Combinations
." As a result of the recent fair value exercise applied in connection with fresh start accounting, the Company opted to use a qualitative assessment as permitted by ASC 350,
"Intangibles - Goodwill and Other"
. See Note 7,
Property, Plant and Equipment, Intangible Assets and Goodwill
.
Upon application of fresh start accounting in accordance with ASC 852 in connection with the emergence from bankruptcy, the Company recorded goodwill of
$3.3 billion
, which represented the excess of Reorganization Value over the estimated fair value of the Company's assets and liabilities. Goodwill was further allocated to reporting units based on the relative fair values of the Company's reporting units as of May 1, 2019.
The Company concluded no goodwill impairment was required for the period from May 2, 2019 through December 31, 2019 (Successor), the period from January 1, 2019 through May 1, 2019 (Predecessor), the year ended December 31, 2018 (Predecessor) and the year ended December 31, 2017 (Predecessor).
Nonconsolidated Affiliates
In general, investments in which the Company owns 20% to 50% of the common stock or otherwise exercises significant influence over the investee are accounted for under the equity method. The Company does not recognize gains or losses upon the issuance of securities by any of its equity method investees. The Company reviews the value of equity method investments and records impairment charges in the statement of operations as a component of “Equity in earnings (loss) of nonconsolidated affiliates” for any decline in value that is determined to be other-than-temporary.
Other Investments
Effective January 1, 2018, we adopted Accounting Standards Update ("ASU") 2016-01 Financial Instruments - Overall: Recognition and Measurement of Financial Assets and Financial Liabilities ("ASU 2016-01"), which requires us to measure all equity investments that do not result in consolidation and are not accounted for under the equity method at fair value and recognize any changes in earnings. For equity securities without readily determinable fair values, we have elected the measurement alternative under which we measure these investments at cost minus impairment, if any, plus or minus changes resulting from observable price changes in orderly transactions for the identical or a similar investment of the same issuer. Prior to the adoption of ASU 2016-01, marketable equity securities not accounted for under the equity method were classified as available-for-sale. For equity securities classified as available-for-sale, realized gains and losses were included in net income. Unrealized gains and losses on
67
IHEARTMEDIA, INC.
AND SUBSIDIARIES
NOTES TO CONSOLIDATED FINANCIAL STATEMENTS
equity securities classified as available-for-sale were recognized in accumulated other comprehensive income (loss) ("AOCI"), net of tax. Equity securities without readily determinable fair values were recorded at cost.
The Company recorded noncash impairment charges of
$21.0 million
,
$8.3 million
,
$14.2 million
and
$3.2 million
during the period from May 2, 2019 through December 31,
2019
(Successor), the period from January 1, 2019 through May 1, 2019 (Predecessor), the year ended
2018
(Predecessor) and the year ended
2017
(Predecessor), respectively. Such charge is recorded on the Statement of Comprehensive Income (Loss) in “
Loss on investments, net
”.
Financial Instruments
Due to their short maturity, the carrying amounts of accounts and notes receivable, accounts payable, accrued liabilities, and short-term borrowings approximated their fair values at
December 31, 2019
and
2018
.
Income Taxes
The Company accounts for income taxes using the liability method. Under this method, deferred tax assets and liabilities are determined based on differences between financial reporting bases and tax bases of assets and liabilities and are measured using the enacted tax rates expected to apply to taxable income in the periods in which the deferred tax asset or liability is expected to be realized or settled. Deferred tax assets are reduced by valuation allowances if the Company believes it is more likely than not that some portion or the entire asset will not be realized. The Company has not provided U.S. federal income taxes for temporary differences with respect to investments in foreign subsidiaries. It is not apparent that these temporary differences will reverse in the foreseeable future. If any excess cash held by our foreign subsidiaries were needed to fund operations in the U.S., the Company could presently repatriate available funds without a requirement to accrue or pay U.S. taxes. The Company regularly reviews its tax liabilities on amounts that may be distributed in future periods and provides for foreign withholding and other current and deferred taxes on any such amounts, where applicable.
Revenue Recognition
The Company recognizes revenue when or as it satisfies a performance obligation by transferring a promised good or service to a customer. Where third-parties are involved in the provision of goods and services to a customer, revenue is recognized at the gross amount of consideration the Company expects to receive if the Company controls the promised good or service before it is transferred to the customer; otherwise, revenue is recognized at the net amount the Company retains. The Company receives payments from customers based on billing schedules that are established in its contracts, and deferred revenue is recorded when payment is received from a customer before the Company has satisfied the performance obligation or a non-cancelable contract has been billed in advance in accordance with the Company’s normal billing terms.
The primary source of revenue in the Audio segment is the sale of advertising on the Company’s broadcast radio stations, its iHeartRadio mobile application and website, station websites, and national and local live events. Revenues for advertising spots are recognized at the point in time when the advertisement is broadcast or streamed, while revenues for online display advertisements are recognized over time based on impressions delivered or time elapsed, depending upon the terms of the contract. Revenues for event sponsorships are recognized over the period of the event. Audio also generates revenues from programming talent, network syndication, traffic and weather data, and other miscellaneous transactions, which are recognized when the services are transferred to the customer. Audio's contracts with advertisers are typically a year or less in duration and are generally billed monthly upon satisfaction of the performance obligations.
The Company also generates revenue through contractual commissions realized from the sale of national spot and online advertising on behalf of clients of its full-service media representation business, Katz Media, which is part of the Audio and Media Services business. Revenues from these contracts are recognized at the point in time when the advertisements are broadcast. Because the Company is a representative of its media clients and does not control the advertising inventory before it is transferred to the advertiser, the Company recognizes revenue at the net amount of contractual commissions retained for its representation services.
The Company’s media representation contracts typically have terms up to ten years in duration and are generally billed monthly upon satisfaction of the performance obligations
.
The Company recognizes revenue in amounts that reflect the consideration it expects to receive in exchange for transferring goods or services to customers, excluding sales taxes and other similar taxes collected on behalf of governmental authorities (the "transaction price”). When this consideration includes a variable amount, the Company estimates the amount of consideration it expects to receive and only recognizes revenue to the extent that it is probable it will not be reversed in a future reporting period.
68
IHEARTMEDIA, INC.
AND SUBSIDIARIES
NOTES TO CONSOLIDATED FINANCIAL STATEMENTS
Because the transfer of promised goods and services to the customer is generally within a year of scheduled payment from the customer, the Company is not typically required to consider the effects of the time value of money when determining the transaction price. Advertising revenue is reported net of agency commissions.
In order to appropriately identify the unit of accounting for revenue recognition, the Company determines which promised goods and services in a contract with a customer are distinct and are therefore separate performance obligations. If a promised good or service does not meet the criteria to be considered distinct, it is combined with other promised goods or services until a distinct bundle of goods or services exists. Certain of the Company’s contracts with customers include options for the customer to acquire additional goods or services for free or at a discount, and management judgment is required to determine whether these options are material rights that are separate performance obligations.
For revenue arrangements that contain multiple distinct goods or services, the Company allocates the transaction price to these performance obligations in proportion to their relative standalone selling prices or the best estimate of their fair values. The Company has concluded that the contractual prices for the promised goods and services in its standard contracts generally approximate management’s best estimate of standalone selling price as the rates reflect various factors such as the size and characteristics of the target audience, market location and size, and recent market selling prices. However, where the Company provides customers with free or discounted services as part of contract negotiations, management uses judgment to determine how much of the transaction price to allocate to these performance obligations.
Contract Costs
Incremental costs of obtaining a contract primarily relate to sales commissions, which are included in selling, general and administrative expenses and are generally commensurate with sales. These costs are generally expensed when incurred because the period of benefit is one year or less.
Advertising Expense
The Company records advertising expense as it is incurred. Advertising expenses were
$126.0 million
,
$59.6 million
,
$201.2 million
and
$192.8 million
for the period from May 2, 2019 through December 31, 2019 (Successor), the period from January 1, 2019 through May 1, 2019 (Predecessor),the year ended December 31,
2018
(Predecessor) and the year ended December 31,
2017
(Predecessor), respectively, which include
$105.0 million
,
$46.0 million
,
$155.2 million
and
$146.1 million
in barter advertising, respectively.
Share-Based Compensation
Under the fair value recognition provisions of ASC 718-10, share-based compensation cost is measured at the grant date based on the fair value of the award. For awards that vest based on service conditions, this cost is recognized as expense on a straight-line basis over the vesting period. For awards that will vest based on market or performance conditions, this cost is recognized when it becomes probable that the performance conditions will be satisfied. Determining the fair value of share-based awards at the grant date requires assumptions and judgments, such as expected volatility, among other factors.
Foreign Currency
Results of operations for foreign subsidiaries and foreign equity investees are translated into U.S. dollars using average exchange rates during the year. The assets and liabilities of those subsidiaries and investees are translated into U.S. dollars using the exchange rates at the balance sheet date. The related translation adjustments are recorded in a separate component of
stockholders'
equity (deficit), “Accumulated other comprehensive loss”. Foreign currency transaction gains and losses are included in Other income (expense), net in the Statement of Comprehensive Income (Loss).
69
IHEARTMEDIA, INC.
AND SUBSIDIARIES
NOTES TO CONSOLIDATED FINANCIAL STATEMENTS
New Accounting Pronouncements Recently Adopted
Leases
The Company adopted ASU No. 2016-02, which created ASC 842,
Leases
, and all subsequent ASUs relating to this Topic, as of January 1, 2019 (collectively, "ASC 842"). This new lease accounting standard, which supersedes previous lease accounting guidance under U.S. GAAP, results in significant changes to the balance sheets of lessees, most significantly by requiring the recognition of a right-of-use ("ROU") asset and lease liability by lessees for those leases classified as operating leases. Lessor accounting is also updated to align with certain changes in the lessee model and the revenue recognition standard ("ASC Topic 606"), which was adopted in 2018.
The Company applied the transition provisions of this standard at January 1, 2019 following the optional transition method provided by ASU No. 2018-11; consequently, the consolidated financial statements and notes to the consolidated financial statements for periods before the date of adoption continue to be presented in accordance with ASC Topic 840. In addition, the Company elected the package of practical expedients permitted under the transition guidance within the new standard, which allowed us to not reassess whether expired or existing contracts are or contain leases and to carry forward the historical lease classification for those leases that commenced prior to the date of adoption.
Upon adoption of ASC 842, prepaid and deferred rent balances, which were historically presented separately, were combined and presented net within the ROU asset. Additionally, deferred gains related to previous transactions that were historically accounted for as sale and operating leasebacks in accordance with ASC Topic 840 were eliminated and recognized as a cumulative-effect adjustment to equity, resulting in an increase to equity, net of tax, of
$128.9 million
. Under ASC Topic 840, such gains were recognized ratably over the lease term as a credit to operating lease expense. Operating lease expense for the each of the years ended
December 31, 2018
and 2017 included credits of
$5.3 million
for the amortization of these gains, which were not recognized in any period after January 1, 2019.
Adoption of the new standard had a material impact on our consolidated balance sheets, but it did not have a material impact on our other consolidated financial statements. Additionally, the standard requires disclosures to meet the objective of enabling users of the financial statements to assess the amount, timing, and uncertainty of cash flows arising from leases. Refer to Note 5,
Revenue
, and Note 6,
Leases
, for more information.
Intangible Assets and Goodwill
During the first quarter of 2017, the FASB issued ASU 2017-04,
Intangibles - Goodwill and Other (Topic 350)
. This update eliminated the requirement to calculate the implied fair value of goodwill to measure a goodwill impairment charge. Entities are required to record an impairment charge based on the excess of a reporting unit's carrying amount over its fair value. The standard is effective for annual and any interim impairment tests performed for periods beginning after December 15, 2019. The Company early adopted the proposed guidance under ASU 2017-04 beginning on January 1, 2019 on a prospective basis. The implementation of ASU 2017-04 did not have a material impact on our consolidated financial statements and related disclosures.
During the third quarter of 2018, the FASB issued ASU 2018-15,
Intangibles - Goodwill and Other - Internal-Use Software (Subtopic 350-40), Customer's Accounting for Implementation Costs Incurred in a Cloud Computing Arrangement that is a Service Contract
. This update requires that a customer in a cloud computing arrangement that is a service contract follow the internal use software guidance in Accounting Standards Codification (ASC) 350-402 to determine which implementation costs to capitalize as assets. The standard is effective for fiscal years beginning after December 15, 2019. The Company early adopted the proposed guidance under ASU 2018-15 beginning on January 1, 2019 on a prospective basis. The implementation of ASU 2018-15 did not have a material impact on our consolidated financial statements and related disclosures.
New Accounting Pronouncements Not Yet Adopted
During the second quarter of 2016, the FASB issued ASU 2016-13,
Financial Instruments-Credit Losses (Topic 326): Measurement of Credit Losses on Financial Instruments
and finalized amendments to FASB ASC Subtopic 825-15,
Financial Instruments-Credit Losses
. The amendments of ASU 2016-13 are intended to provide financial statement users with more decision-useful information related to expected credit losses on financial instruments and other commitments to extend credit by replacing the current incurred loss impairment methodology with a methodology that reflects expected credit losses and requires consideration of a broader range of reasonable and supportable information to determine credit loss estimates. The amendments of ASU 2016-13 eliminate the probable initial recognition threshold and, in turn, reflect an entity’s current estimate of all expected credit losses. ASU 2016-13
70
IHEARTMEDIA, INC.
AND SUBSIDIARIES
NOTES TO CONSOLIDATED FINANCIAL STATEMENTS
does not specify the method for measuring expected credit losses, and an entity is allowed to apply methods that reasonably reflect its expectations of the credit loss estimate. Additionally, the amendments of ASU 2016-13 require that credit losses on available for sale debt securities be presented as an allowance rather than as a write-down. The amendments of ASU 2016-13 are effective for interim and annual periods beginning after December 15, 2019. The Company is currently evaluating the impact of the provisions of this new standard on its consolidated financial statements.
Restricted Cash
The following table provides a reconciliation of cash, cash equivalents and restricted cash reported in the Consolidated Balance Sheets to the total of the amounts reported in the Consolidated Statements of Cash Flows:
|
(In thousands)
|
Successor Company
|
Predecessor Company
|
||||||
|
December 31,
2019 |
December 31,
2018 |
|||||||
|
Cash and cash equivalents
|
$
|
400,300
|
|
$
|
224,037
|
|
||
|
Restricted cash included in:
|
||||||||
|
Other current assets
|
11,318
|
|
3,428
|
|
||||
|
Total cash, cash equivalents and restricted cash in the Statement of Cash Flows
(1)
|
$
|
411,618
|
|
$
|
227,465
|
|
||
(1)
The Predecessor Company's Total cash, cash equivalents and restricted cash as of December 31, 2018 in the table above exclude
$202.9 million
classified as current and long-term assets of discontinued operations.
NOTE 2 - EMERGENCE FROM VOLUNTARY REORGANIZATION UNDER CHAPTER 11 PROCEEDINGS
Plan of Reorganization
As described in Note 1, on March 14, 2018, the Company and the other Debtors filed the Chapter 11 Cases and on April 28, 2018, the Company and the other Debtors filed a plan of reorganization, which was subsequently amended as the Plan of Reorganization and was confirmed on January 22, 2019. The Debtors then emerged from bankruptcy upon effectiveness of the Plan of Reorganization on the Effective Date. Capitalized terms not defined in this note are defined in the Plan of Reorganization.
On or following the Effective Date and pursuant to the Plan of Reorganization, the following occurred:
|
▪
|
CCOH was separated from and ceased to be controlled by iHeartCommunications and its subsidiaries.
|
|
▪
|
The existing indebtedness of iHeartCommunications of approximately
$16 billion
was discharged, the Company entered into the Term Loan Facility (
$3,500 million
) and issued the
6.375%
Senior Secured Notes (
$800 million
) and the Senior Unsecured Notes (
$1,450 million
), collectively the “Successor Emergence Debt.”
|
|
▪
|
The Company adopted an amended and restated certificate of incorporation and bylaws.
|
|
▪
|
Shares of the Predecessor Company’s issued and outstanding common stock immediately prior to the Effective Date were canceled, and on the Effective Date, reorganized iHeartMedia issued an aggregate of
56,861,941
shares of iHeartMedia Class A common stock,
6,947,567
shares of Class B common stock and special warrants to purchase
81,453,648
shares of Class A common stock or Class B common stock to holders of claims pursuant to the Plan of Reorganization.
|
|
▪
|
The following classes of claims received the Successor Emergence Debt and
99.1%
of the new equity, as defined in the Plan of Reorganization:
|
|
▪
|
Secured Term Loan / 2019 PGN Claims (Class 4)
|
|
▪
|
Secured Non-
9.0%
PGN Due 2019 Claims Other Than Exchange
11.25%
PGN Claims (Class 5A)
|
71
IHEARTMEDIA, INC.
AND SUBSIDIARIES
NOTES TO CONSOLIDATED FINANCIAL STATEMENTS
|
▪
|
Secured Exchange
11.25%
PGN Claims (Class 5B)
|
|
▪
|
iHC 2021 / Legacy Notes Claims (Class 6)
|
|
▪
|
Guarantor Funded Debt against other Guarantor Debtors Other than CCH and TTWN (Class 7)
|
|
▪
|
The holders of the Guarantor Funded Debt Unsecured Claims Against CCH (Class 7F) received their Pro Rata share of
100 percent
of the CCOH Interests held by the Debtors and CC Finco, LLC and Broader Media, LLC. Refer to the discussion below regarding the Separation Transaction.
|
|
▪
|
Settled the following classes of claims in cash:
|
|
▪
|
General Unsecured Claims Against Non-Obligor Debtors (Class 7A); paid in full
|
|
▪
|
General Unsecured Claims Against TTWN Debtors (Class 7B); paid in full
|
|
▪
|
iHC Unsecured Claims (Class 7D); paid
14.44%
of allowed claim
|
|
▪
|
Guarantor General Unsecured Claims (Class 7G); paid minimum of
45%
and maximum of
55%
of allowed claim
|
|
▪
|
The CCOH Due From Claims (Class 8) represent the negotiated claim between iHeartMedia and CCOH, which was settled in cash on the date of emergence at
14.44%
.
|
|
▪
|
The Predecessor Company’s common stockholders (Class 9) received their pro rata share of
1%
of the new common stock; provided that
0.1%
of the new common stock that otherwise would have been distributed to the Company's former sponsors was instead distributed to holders of Legacy Notes Claims.
|
|
▪
|
The Company entered into a new
$450.0 million
ABL Facility, which was undrawn at emergence.
|
|
▪
|
The Company funded the Guarantor General Unsecured Recovery Cash Pool for
$17.5 million
in order to settle the Class 7G General Unsecured Claims.
|
|
▪
|
The Company funded the Professional Fee Escrow Account.
|
|
▪
|
On the Effective Date, the iHeartMedia, Inc. 2019 Equity Incentive Plan (the “Post-Emergence Equity Plan”) became effective. The Post-Emergence Equity Plan allows the Company to grant stock options and restricted stock units representing up to
12,770,387
shares of Class A common stock for key members of management and service providers and up to
1,596,298
for non-employee members of the board of directors. The amounts of Class A common stock reserved under the Post-Emergence Equity Plan were equal to
8%
and
1%
, respectively, of the Company’s fully-diluted and distributed shares of Class A common stock as of the Effective Date.
|
In addition, as part of the Separation, iHeartCommunications and CCOH consummated the following transactions:
|
▪
|
the cash sweep agreement under the then-existing corporate services agreement and any agreements or licenses requiring royalty payments to iHeartMedia by CCOH for trademarks or other intellectual property (“Trademark License Fees”) were terminated;
|
|
▪
|
iHeartCommunications, iHeartMedia, iHeartMedia Management Services, Inc. (“iHM Management Services”) and CCOH entered into a transition services agreement (the “Transition Services Agreement”) pursuant to which, the Company or its subsidiaries will provide administrative services historically provided to CCOH by iHeartCommunications for a period of one year after the Effective Date, which may be extended under certain circumstances;
|
|
▪
|
the Trademark License Fees charged to CCOH during the post-petition period were waived by iHeartMedia;
|
|
▪
|
iHeartMedia contributed the rights, title and interest in and to all tradenames, trademarks, service marks, common law marks and other rights related to the Clear Channel tradename (the “CC Intellectual Property”) to CCOH;
|
72
IHEARTMEDIA, INC.
AND SUBSIDIARIES
NOTES TO CONSOLIDATED FINANCIAL STATEMENTS
|
▪
|
iHeartMedia paid
$115.8 million
to CCOH, which consisted of the
$149.0 million
payment by iHeartCommunications to CCOH as CCOH’s recovery of its claims under the Due from iHeartCommunications Note, partially offset by the
$33.2 million
net amount payable to iHeartCommunications under the post-petition intercompany balance between iHeartCommunications and CCOH after adjusting for the post-petition Trademark License Fees which were waived as part of the settlement agreement;
|
|
▪
|
iHeartCommunications entered into a revolving loan agreement with Clear Channel Outdoor, LLC (“CCOL”) and Clear Channel International, Ltd., wholly-owned subsidiaries of CCOH, to provide a line of credit in an aggregate amount not to exceed
$200 million
at the prime rate of interest, which was terminated by the borrowers on July 30, 2019 in connection with the closing of an underwritten public offering of common stock by CCOH; and
|
|
▪
|
iHeart Operations, Inc. issued
$60.0 million
in preferred stock to a third party for cash (see Note 9,
Long-term Debt
).
|
NOTE 3 - FRESH START ACCOUNTING
Fresh Start
In connection with the Company's emergence from bankruptcy and in accordance with ASC 852, the Company qualified for and adopted fresh start accounting on the Effective Date. The Company was required to adopt fresh start accounting because (i) the holders of existing voting shares of the Predecessor Company received less than
50%
of the voting shares of the Successor Company and (ii) the reorganization value of the Company's assets immediately prior to confirmation of the Plan of Reorganization was less than the post-petition liabilities and allowed claims.
In accordance with ASC 852, with the application of fresh start accounting, the Company allocated its reorganization value to its individual assets based on their estimated fair values in conformity with ASC 805, "Business Combinations." The reorganization value represents the fair value of the Successor Company's assets before considering liabilities. The excess reorganization value over the fair value of identified tangible and intangible assets is reported as goodwill. As a result of the application of fresh start accounting and the effects of the implementation of the Plan of Reorganization, the consolidated financial statements after May 1, 2019 are not comparable with the consolidated financial statements as of or prior to that date.
Reorganization Value
As set forth in the Plan of Reorganization and the Disclosure Statement, the enterprise value of the Successor Company was estimated to be between
$8.0 billion
and
$9.5 billion
. Based on the estimates and assumptions discussed below, the Company estimated the enterprise value to be
$8.75 billion
, which was the mid-point of the range of enterprise value as of the Effective Date.
Management and its valuation advisors estimated the enterprise value of the Successor Company, which was approved by the Bankruptcy Court. The selected publicly traded companies analysis approach, the discounted cash flow analysis approach and the selected transactions analysis approach were all utilized in estimating the enterprise value. The use of each approach provides corroboration for the other approaches. To estimate enterprise value utilizing the selected publicly traded companies analysis method, valuation multiples derived from the operating data of publicly-traded benchmark companies to the same operating data of the Company were applied. The selected publicly traded companies analysis identified a group of comparable companies giving consideration to lines of business and markets served, size and geography. The valuation multiples were derived based on historical and projected financial measures of revenue and earnings before interest, taxes, depreciation and amortization and applied to projected operating data of the Company.
To estimate enterprise value utilizing the discounted cash flow method, an estimate of future cash flows for the period 2019 to 2022 with a terminal value was determined and discounted the estimated future cash flows to present value. The expected cash flows for the period 2019 to 2022 with a terminal value were based upon certain financial projections and assumptions provided to the Bankruptcy Court. The expected cash flows for the period 2019 to 2022 were derived from earnings forecasts and assumptions regarding growth and margin projections, as applicable. A terminal value was included, calculated using the terminal multiple method, which estimates a range of values at which the Successor Company will be valued at the end of the Projection Period based on applying a terminal multiple to final year Adjusted EBITDA (referred to as "OIBDAN" in the documents filed with the Bankruptcy Court), which is defined as consolidated operating income adjusted to exclude non-cash compensation expenses
73
IHEARTMEDIA, INC.
AND SUBSIDIARIES
NOTES TO CONSOLIDATED FINANCIAL STATEMENTS
included within corporate expenses, as well as Depreciation and amortization, Impairment charges and Other operating income (expense), net.
To estimate enterprise value utilizing the selected transactions analysis, valuation multiples were derived from an analysis of consideration paid and net debt assumed from publicly disclosed merger or acquisition transactions, and such multiples were applied to the broadcast cash flows of the Successor Company. The selected transactions analysis identified companies and assets involved in publicly disclosed merger and acquisition transactions for which the targets had operating and financial characteristics comparable in certain respects to the Successor Company.
The following table reconciles the enterprise value per the Plan of Reorganization to the implied value (for fresh start accounting purposes) of the Successor Company's common stock as of the Effective Date:
|
(In thousands, except per share data)
|
|||
|
Enterprise Value
|
$
|
8,750,000
|
|
|
Plus:
|
|||
|
Cash and cash equivalents
|
63,142
|
|
|
|
Less:
|
|||
|
Debt issued upon emergence
|
(5,748,178
|
)
|
|
|
Finance leases and short-term notes
|
(61,939
|
)
|
|
|
Mandatorily Redeemable Preferred Stock
|
(60,000
|
)
|
|
|
Changes in deferred tax liabilities
(1)
|
(163,910
|
)
|
|
|
Noncontrolling interest
|
(8,943
|
)
|
|
|
Implied value of Successor Company common stock
|
$
|
2,770,172
|
|
|
Shares issued upon emergence
(2)
|
145,263
|
|
|
|
Per share value
|
$
|
19.07
|
|
(1)
Difference in the assumed effect of deferred taxes in the calculation of enterprise value versus the actual effect of deferred taxes as of May 1.
(2)
Includes the Class A Common Stock, Class B Common Stock and Special Warrants issued at emergence.
The reconciliation of the Company’s enterprise value to reorganization value as of the Effective Date is as follows:
|
(In thousands)
|
|||
|
Enterprise Value
|
$
|
8,750,000
|
|
|
Plus:
|
|||
|
Cash and cash equivalents
|
63,142
|
|
|
|
Current liabilities (excluding Current portion of long-term debt)
|
426,944
|
|
|
|
Deferred tax liability
|
596,850
|
|
|
|
Other long-term liabilities
|
54,393
|
|
|
|
Noncurrent operating lease obligations
|
818,879
|
|
|
|
Reorganization value
|
$
|
10,710,208
|
|
74
IHEARTMEDIA, INC.
AND SUBSIDIARIES
NOTES TO CONSOLIDATED FINANCIAL STATEMENTS
Consolidated Balance Sheet
The adjustments set forth in the following consolidated balance sheet as of May 1, 2019 reflect the effect of the Separation (reflected in the column "Separation of CCOH Adjustments"), the consummation of the transactions contemplated by the Plan of Reorganization that are incremental to the Separation (reflected in the column "Reorganization Adjustments") and the fair value adjustments as a result of applying fresh start accounting (reflected in the column "Fresh Start Adjustments"). The explanatory notes highlight methods used to determine fair values or other amounts of the assets and liabilities, as well as significant assumptions or inputs.
75
IHEARTMEDIA, INC.
AND SUBSIDIARIES
NOTES TO CONSOLIDATED FINANCIAL STATEMENTS
|
(In thousands)
|
Separation of CCOH Adjustments
|
Reorganization Adjustments
|
Fresh Start Adjustments
|
||||||||||||||||
|
Predecessor
|
(A)
|
(B)
|
(C)
|
Successor
|
|||||||||||||||
|
CURRENT ASSETS
|
|||||||||||||||||||
|
Cash and cash equivalents
|
$
|
175,811
|
|
$
|
—
|
|
$
|
(112,669
|
)
|
(1)
|
$
|
—
|
|
$
|
63,142
|
|
|||
|
Accounts receivable, net
|
748,326
|
|
—
|
|
—
|
|
(10,810
|
)
|
(1)
|
737,516
|
|
||||||||
|
Prepaid expenses
|
127,098
|
|
—
|
|
—
|
|
(24,642
|
)
|
(2)
|
102,456
|
|
||||||||
|
Other current assets
|
22,708
|
|
—
|
|
8,125
|
|
(2)
|
(1,668
|
)
|
(3)
|
29,165
|
|
|||||||
|
Current assets of discontinued operations
|
1,000,753
|
|
(1,000,753
|
)
|
(1)
|
—
|
|
—
|
|
—
|
|
||||||||
|
Total Current Assets
|
2,074,696
|
|
(1,000,753
|
)
|
(104,544
|
)
|
(37,120
|
)
|
932,279
|
|
|||||||||
|
PROPERTY, PLANT AND EQUIPMENT
|
|||||||||||||||||||
|
Property, plant and equipment, net
|
499,001
|
|
—
|
|
—
|
|
333,991
|
|
(4)
|
832,992
|
|
||||||||
|
INTANGIBLE ASSETS AND GOODWILL
|
|||||||||||||||||||
|
Indefinite-lived intangibles - licenses
|
2,326,626
|
|
—
|
|
—
|
|
(44,906
|
)
|
(5)
|
2,281,720
|
|
||||||||
|
Other intangibles, net
|
104,516
|
|
—
|
|
—
|
|
2,240,890
|
|
(5)
|
2,345,406
|
|
||||||||
|
Goodwill
|
3,415,492
|
|
—
|
|
—
|
|
(92,127
|
)
|
(5)
|
3,323,365
|
|
||||||||
|
OTHER ASSETS
|
|||||||||||||||||||
|
Operating lease right-of-use assets
|
355,826
|
|
—
|
|
—
|
|
554,278
|
|
(6)
|
910,104
|
|
||||||||
|
Other assets
|
139,409
|
|
—
|
|
(384
|
)
|
(3)
|
(54,683
|
)
|
(2)
|
84,342
|
|
|||||||
|
Long-term assets of discontinued operations
|
5,351,513
|
|
(5,351,513
|
)
|
(1)
|
—
|
|
—
|
|
—
|
|
||||||||
|
Total Assets
|
$
|
14,267,079
|
|
$
|
(6,352,266
|
)
|
$
|
(104,928
|
)
|
$
|
2,900,323
|
|
$
|
10,710,208
|
|
||||
|
CURRENT LIABILITIES
|
|
|
|
|
|||||||||||||||
|
Accounts payable
|
$
|
41,847
|
|
$
|
—
|
|
$
|
3,061
|
|
(4)
|
$
|
—
|
|
$
|
44,908
|
|
|||
|
Current operating lease liabilities
|
470
|
|
—
|
|
31,845
|
|
(7)
|
39,092
|
|
(6)
|
71,407
|
|
|||||||
|
Accrued expenses
|
208,885
|
|
—
|
|
(32,250
|
)
|
(5)
|
2,328
|
|
(9)
|
178,963
|
|
|||||||
|
Accrued interest
|
462
|
|
—
|
|
(462
|
)
|
(6)
|
—
|
|
—
|
|
||||||||
|
Deferred revenue
|
128,452
|
|
—
|
|
—
|
|
3,214
|
|
(7)
|
131,666
|
|
||||||||
|
Current portion of long-term debt
|
46,618
|
|
—
|
|
6,529
|
|
(7)
|
40
|
|
(6)
|
53,187
|
|
|||||||
|
Current liabilities of discontinued operations
|
999,778
|
|
(999,778
|
)
|
(1)
|
—
|
|
—
|
|
—
|
|
||||||||
|
Total Current Liabilities
|
1,426,512
|
|
(999,778
|
)
|
8,723
|
|
44,674
|
|
480,131
|
|
|||||||||
|
Long-term debt
|
—
|
|
—
|
|
5,758,516
|
|
(8)
|
(1,586
|
)
|
(8)
|
5,756,930
|
|
|||||||
|
Series A Mandatorily Redeemable Preferred Stock
|
—
|
|
—
|
|
60,000
|
|
(9)
|
—
|
|
60,000
|
|
||||||||
|
Noncurrent operating lease liabilities
|
828
|
|
—
|
|
398,154
|
|
(7)
|
419,897
|
|
(6)
|
818,879
|
|
|||||||
|
Deferred income taxes
|
—
|
|
—
|
|
575,341
|
|
(10)
|
185,419
|
|
(10)
|
760,760
|
|
|||||||
|
Other long-term liabilities
|
121,081
|
|
—
|
|
(64,524
|
)
|
(11)
|
(2,164
|
)
|
(7)
|
54,393
|
|
|||||||
|
Liabilities subject to compromise
|
16,770,266
|
|
—
|
|
(16,770,266
|
)
|
(7)
|
—
|
|
—
|
|
||||||||
|
Long-term liabilities of discontinued operations
|
7,472,633
|
|
(7,472,633
|
)
|
(1)
|
—
|
|
—
|
|
—
|
|
||||||||
|
Commitments and contingent liabilities (Note 10)
|
|||||||||||||||||||
|
STOCKHOLDERS’ EQUITY (DEFICIT)
|
|||||||||||||||||||
|
Noncontrolling interest
|
13,584
|
|
(13,199
|
)
|
(1)
|
—
|
|
8,558
|
|
(11)
|
8,943
|
|
|||||||
|
Predecessor common stock
|
92
|
|
—
|
|
(92
|
)
|
(12)
|
—
|
|
—
|
|
||||||||
|
Successor Class A Common Stock
|
—
|
|
—
|
|
57
|
|
(13)
|
—
|
|
57
|
|
||||||||
|
Successor Class B Common Stock
|
—
|
|
—
|
|
7
|
|
(13)
|
—
|
|
7
|
|
||||||||
|
Predecessor additional paid-in capital
|
2,075,130
|
|
—
|
|
(2,075,130
|
)
|
(12)
|
—
|
|
—
|
|
||||||||
|
Successor additional paid-in capital
|
—
|
|
2,770,108
|
|
(13)
|
—
|
|
2,770,108
|
|
||||||||||
|
Accumulated deficit
|
(13,288,497
|
)
|
1,825,531
|
|
(1)
|
9,231,616
|
|
(14)
|
2,231,350
|
|
(12)
|
—
|
|
||||||
|
Accumulated other comprehensive loss
|
(321,988
|
)
|
307,813
|
|
(1)
|
—
|
|
14,175
|
|
(12)
|
—
|
|
|||||||
|
Cost of share held in treasury
|
(2,562
|
)
|
—
|
|
2,562
|
|
(12)
|
—
|
|
—
|
|
||||||||
|
Total Stockholders' Equity (Deficit)
|
(11,524,241
|
)
|
2,120,145
|
|
9,929,128
|
|
2,254,083
|
|
2,779,115
|
|
|||||||||
|
Total Liabilities and Stockholders' Equity (Deficit)
|
$
|
14,267,079
|
|
$
|
(6,352,266
|
)
|
$
|
(104,928
|
)
|
$
|
2,900,323
|
|
$
|
10,710,208
|
|
||||
76
IHEARTMEDIA, INC.
AND SUBSIDIARIES
NOTES TO CONSOLIDATED FINANCIAL STATEMENTS
A. Separation of CCOH Adjustments
(1) On May 1, 2019, as part of the Separation, the outstanding shares of both classes of CCOH common stock were consolidated such that CCH held all of the outstanding CCOH Class A common stock that was held by subsidiaries of iHeartCommunications, through a series of share distributions by other subsidiaries that held CCOH common stock and a conversion of CCOH Class B common stock that CCH held to CCOH Class A common stock. Prior to the Separation, iHeartCommunications owned approximately
89.1%
of the economic rights and approximately
99%
of the voting rights of CCOH. To complete the Separation, CCOH merged with and into CCH, with CCH surviving the merger and changing its name to Clear Channel Outdoor Holdings, Inc. (“New CCOH”), and pre-merger shares of CCOH Class A common stock (other than shares of CCOH Class A common stock held by CCH or any direct or indirect wholly-owned subsidiary of CCH) were converted into an equal number of shares of post-merger common stock of New CCOH. iHeartCommunications transferred the post-merger common stock of New CCOH it held to Claimholders pursuant to the Plan of Reorganization but retained
31,269,762
shares. Such retained shares were distributed to two affiliated Claimholders on July 18, 2019. Upon completion of the merger and Separation, New CCOH became an independent public company. Upon distribution of the shares held by iHeartCommunications, the Company does not hold any ownership interest in CCOH.
The assets and liabilities of CCOH have been classified as discontinued operations. The discontinued operations reflect the assets and liabilities of CCOH, which are presented as discontinued operations as of the Effective Date. CCOH’s assets and liabilities are adjusted to: (1) eliminate the balance on the Due from iHeartCommunications Note and the balance on the intercompany payable due to iHeartCommunications from CCOH’s consolidated balance sheet, which are intercompany amounts that were eliminated in consolidation; (2) eliminate CCOH’s Noncontrolling interest and treasury shares; and (3) eliminate other intercompany balances.
B. Reorganization Adjustments
In accordance with the Plan of Reorganization, the following adjustments were made:
|
(1)
|
The table below reflects the sources and uses of cash on the Effective Date from implementation of the Plan:
|
|
(In thousands)
|
||||
|
Cash at May 1, 2019 (excluding discontinued operations)
|
$
|
175,811
|
|
|
|
Sources:
|
||||
|
Proceeds from issuance of Mandatorily Redeemable Preferred Stock
|
$
|
60,000
|
|
|
|
Release of restricted cash from other assets into cash
|
3,428
|
|
||
|
Total sources of cash
|
$
|
63,428
|
|
|
|
Uses:
|
||||
|
Payment of Mandatorily Redeemable Preferred Stock issuance costs
|
$
|
(1,513
|
)
|
|
|
Payment of New Term Loan Facility to settle certain creditor claims
|
(1,822
|
)
|
||
|
Payments for Emergence debt issuance costs
|
(7,213
|
)
|
||
|
Funding of the Guarantor General Unsecured Recovery Cash Pool
|
(17,500
|
)
|
||
|
Payments for fully secured claims and general unsecured claims
|
(1,990
|
)
|
||
|
Payment of contract cure amounts
|
(15,763
|
)
|
||
|
Payment of consenting stakeholder fees
|
(4,000
|
)
|
||
|
Payment of professional fees
|
(85,091
|
)
|
(a)
|
|
|
Funding of Professional Fees Escrow Account
|
(41,205
|
)
|
(a)
|
|
|
Total uses of cash
|
$
|
(176,097
|
)
|
|
|
Net uses of cash
|
$
|
(112,669
|
)
|
|
|
Cash upon emergence
|
$
|
63,142
|
|
|
(a) Approximately
$30.5 million
of professional fees paid at emergence were accrued as of May 1, 2019. These payments also reflect both the payment of success fees for
$86.1 million
and other professionals paid directly at emergence.
77
IHEARTMEDIA, INC.
AND SUBSIDIARIES
NOTES TO CONSOLIDATED FINANCIAL STATEMENTS
|
(2)
|
Pursuant to the terms of the Plan of Reorganization, on the Effective Date, the Company funded the Guarantor General Unsecured Recovery Cash Pool account in the amount of
$17.5 million
, which was reclassified as restricted cash within Other current assets. The Company made payments of
$6.0 million
through the Cash Pool at the time of emergence. Additionally,
$3.4 million
of restricted cash previously held to pay critical utility vendors was reclassified to cash.
|
|
(3)
|
Reflects the write-off of prepaid expenses related to the
$2.3 million
of prepaid premium for Predecessor Company's director and officer insurance policy, offset by the accrual of future reimbursements of
$1.9 million
for negotiated discounts related to the professional fee escrow account.
|
(4) Reflects the reinstatement of
$3.1 million
of accounts payable included within Liabilities subject to compromise to be satisfied in the ordinary course of business.
78
IHEARTMEDIA, INC.
AND SUBSIDIARIES
NOTES TO CONSOLIDATED FINANCIAL STATEMENTS
|
(5)
|
Reflects the reduction of accrued expenses related to the
$21.2 million
of professional fees paid directly,
$9.3 million
of professional fees paid through the Professional Fee Escrow Account and other accrued expense items. Additionally, the Company reinstated accrued expenses included within Liabilities subject to compromise to be satisfied in the ordinary course of business.
|
|
(In thousands)
|
|||
|
Reinstatement of accrued expenses
|
$
|
551
|
|
|
Payment of professional fees
|
(21,177
|
)
|
|
|
Payment of professional fees through the escrow account
|
(9,260
|
)
|
|
|
Impact on other accrued expenses
|
(2,364
|
)
|
|
|
Net impact on Accrued expenses
|
$
|
(32,250
|
)
|
|
(6)
|
Reflects the write-off of the DIP facility accrued interest associated with the DIP facility fees paid at emergence.
|
|
(7)
|
As part of the Plan of Reorganization, the Bankruptcy Court approved the settlement of claims reported within Liabilities subject to compromise in the Company's Consolidated balance sheet at their respective allowed claim amounts.
|
The table below indicates the disposition of Liabilities subject to compromise:
|
(In thousands)
|
||||
|
Liabilities subject to compromise pre-emergence
|
$
|
16,770,266
|
|
|
|
To be reinstated on the Effective Date:
|
||||
|
Deferred taxes
|
$
|
(596,850
|
)
|
|
|
Accrued expenses
|
(551
|
)
|
||
|
Accounts payable
|
(3,061
|
)
|
||
|
Finance leases and other debt
|
(16,867
|
)
|
(a)
|
|
|
Current operating lease liabilities
|
(31,845
|
)
|
||
|
Noncurrent operating lease liabilities
|
(398,154
|
)
|
||
|
Other long-term liabilities
|
(14,518
|
)
|
(b)
|
|
|
Total liabilities reinstated
|
$
|
(1,061,846
|
)
|
|
|
Less amounts settled per the Plan of Reorganization
|
||||
|
Issuance of new debt
|
$
|
(5,750,000
|
)
|
|
|
Payments to cure contracts
|
(15,763
|
)
|
||
|
Payments for settlement of general unsecured claims from escrow account
|
(5,822
|
)
|
||
|
Payments for fully secured and other claim classes at emergence
|
(1,990
|
)
|
||
|
Equity issued at emergence to creditors in settlement of Liabilities subject to Compromise
|
(2,742,471
|
)
|
||
|
Total amounts settled
|
(8,516,046
|
)
|
||
|
Gain on settlement of Liabilities Subject to Compromise
|
$
|
7,192,374
|
|
|
79
IHEARTMEDIA, INC.
AND SUBSIDIARIES
NOTES TO CONSOLIDATED FINANCIAL STATEMENTS
(a) Includes finance lease liabilities and other debt of
$6.6 million
and
$10.3 million
classified as current and long-term debt, respectively.
(b) Reinstatement of Other long-term liabilities were as follows:
|
(In thousands)
|
|||
|
Reinstatement of long-term asset retirement obligations
|
$
|
3,527
|
|
|
Reinstatement of non-qualified deferred compensation plan
|
10,991
|
|
|
|
Total reinstated Other long-term liabilities
|
$
|
14,518
|
|
|
(8)
|
The exit financing consists of the Term Loan Facility of approximately
$3.5 billion
and
6.375%
Senior Secured Notes totaling
$800 million
, both maturing
seven years
from the date of issuance, the Senior Unsecured Notes totaling
$1.45 billion
, maturing eight years from the date of issuance, and a
$450 million
ABL Facility with no amount drawn at emergence, which matures on June 14, 2023.
|
Upon emergence, the Company paid cash of
$1.8 million
to settle certain creditor claims for which claims were designated to receive term loans pursuant to the Plan of Reorganization.
The remaining $10.3 million is related to the reinstatement of the Long-term portion of finance leases and other debt as described above.
|
(In thousands)
|
Term
|
Interest Rate
|
Amount
|
||||
|
Term Loan Facility
|
7 years
|
Libor + 4.00%
|
$
|
3,500,000
|
|
||
|
6.375% Senior Secured Notes
|
7 years
|
6.375%
|
800,000
|
|
|||
|
Senior Unsecured Notes
|
8 years
|
8.375%
|
1,450,000
|
|
|||
|
Asset-based Revolving Credit Facility
|
4 years
|
Varies
(a)
|
—
|
|
|||
|
Total Long-Term Debt - Exit Financing
|
$
|
5,750,000
|
|
||||
|
Less:
|
|||||||
|
Payment of Term Loan Facility to settle certain creditor claims
|
(1,822
|
)
|
|||||
|
Net proceeds from exit financing at emergence
|
$
|
5,748,178
|
|
||||
|
Long-term portion of finance leases and other debt reinstated
|
10,338
|
|
|||||
|
Net impact on Long-term debt
|
$
|
5,758,516
|
|
||||
|
(a)
|
Borrowings under the ABL Facility bear interest at a rate per annum equal to the applicable rate plus, at iHeartCommunications’ option, either (x) a eurocurrency rate or (y) a base rate. The applicable margin for borrowings under the ABL Facility range from
1.25%
to
1.75%
for eurocurrency borrowings and from
0.25%
to
0.75%
for base-rate borrowings, in each case, depending on average excess availability under the ABL Facility based on the most recently ended fiscal quarter.
|
|
(9)
|
Reflects the issuance by iHeart Operations of
$60.0 million
in aggregate liquidation preference of its Series A Perpetual Preferred Stock, par value
$0.001
per share. On May 1, 2029, the shares of the Preferred Stock will be subject to mandatory redemption for
$60.0 million
in cash, plus any accrued and unpaid dividends, unless waived by the holders of the Preferred Stock.
|
(10) Reflects the reinstatement of deferred tax liabilities included within Liabilities subject to compromise of
$596.9 million
, offset by an adjustment to net deferred tax liabilities of
$21.5 million
. Upon emergence from the Chapter 11 Cases, iHeartMedia’s federal and state net operating loss carryforwards were reduced in accordance with Section 108 of the U.S. Internal Revenue Code of 1986, as amended (the “Code”), due to cancellation of debt income, which is excluded from U.S. federal taxable income. The estimated remaining deferred tax assets attributed to federal and state net operating loss carryforwards upon emergence totaled
$114.9 million
. The adjustments reflect a reduction in deferred tax assets for federal and state net operating
80
IHEARTMEDIA, INC.
AND SUBSIDIARIES
NOTES TO CONSOLIDATED FINANCIAL STATEMENTS
loss carryforwards as described above, a reduction in deferred tax liabilities attributed to long-term debt as a result of the restructuring of our indebtedness upon emergence and a reduction in valuation allowance.
(11) Reflects the reinstatement of Other long-term liabilities from Liabilities subject to compromise, offset by the reduction of liabilities for unrecognized tax benefits classified as Other long-term liabilities that were discharged and effectively settled upon emergence.
|
(In thousands)
|
|||
|
Reinstatement of long-term asset retirement obligations
|
$
|
3,527
|
|
|
Reinstatement of non-qualified pension plan
|
10,991
|
|
|
|
Reduction of liabilities for unrecognized tax benefits
|
(79,042
|
)
|
|
|
Net impact to Other long-term liabilities
|
$
|
(64,524
|
)
|
(12) Pursuant to the terms of the Plan of Reorganization, as of the Effective Date, all Predecessor common stock and stock-based compensation awards were canceled without any distribution. As a result of the cancellation, the Company recognized
$1.5 million
in compensation expense related to the unrecognized portion of share-based compensation as of the Effective Date.
(13) Reflects the issuance of Successor Company equity, including the issuance of
56,861,941
shares of iHeartMedia Class A common stock,
6,947,567
shares of Class B common stock and special warrants to purchase
81,453,648
shares of Class A common stock or Class B common stock in exchange for claims against or interests in iHeartMedia pursuant to the Plan of Reorganization.
|
(In thousands)
|
|||
|
Equity issued to Class 9 Claimholders (prior equity holders)
|
$
|
27,701
|
|
|
Equity issued to creditors in settlement of Liabilities subject to compromise
|
2,742,471
|
|
|
|
Total equity issued at emergence
|
$
|
2,770,172
|
|
(14) The table reflects the cumulative impact of the reorganization adjustments discussed above:
|
(In thousands)
|
||||
|
Gain on settlement of Liabilities subject to compromise
|
$
|
7,192,374
|
|
|
|
Payment of professional fees upon emergence
|
(11,509
|
)
|
||
|
Payment of success fees upon emergence
|
(86,065
|
)
|
||
|
Cancellation of unvested stock-based compensation awards
|
(1,530
|
)
|
||
|
Cancellation of Predecessor prepaid director and officer insurance policy
|
(2,331
|
)
|
||
|
Write-off of debt issuance and Mandatorily Redeemable Preferred Stock costs incurred at emergence
|
(8,726
|
)
|
||
|
Total Reorganization items, net
|
$
|
7,082,213
|
|
|
|
Income tax benefit
|
$
|
102,914
|
|
|
|
Cancellation of Predecessor Equity
|
2,074,190
|
|
(a)
|
|
|
Issuance of Successor Equity to prior equity holders
|
(27,701
|
)
|
||
|
Net Impact on Accumulated deficit
|
$
|
9,231,616
|
|
|
(a) This value is reflective of Predecessor common stock, Additional paid in capital and the recognition of
$1.5 million
in compensation expense related to the unrecognized portion of share-based compensation, less Treasury stock.
81
IHEARTMEDIA, INC.
AND SUBSIDIARIES
NOTES TO CONSOLIDATED FINANCIAL STATEMENTS
C. Fresh Start Adjustments
We have applied fresh start accounting in accordance with ASC 852. Fresh start accounting requires the revaluation of our assets and liabilities to fair value, including both existing and new intangible assets, such as FCC licenses, developed technology, customer relationships and tradenames. Fresh start accounting also requires the elimination of all predecessor earnings or deficits in Accumulated deficit and Accumulated other comprehensive loss. These adjustments reflect the actual amounts recorded as of the Effective Date.
|
(1)
|
Reflects the fair value adjustment as of May 1, 2019 made to accounts receivable to reflect management's best estimate of the expected collectability of accounts receivable balances.
|
|
(2)
|
Reflects the fair value adjustment as of May 1, 2019 to eliminate certain prepaid expenses related to software implementation costs and other upfront payments. The Company historically incurred third-party implementation fees in connection with installing various cloud-based software products, and these amounts were recorded as prepaid expenses and recognized as a component of selling, general and administrative expense over the term of the various contracts. The Company determined that the remaining unamortized costs related to such implementation fees do not provide any rights that result in future economic benefits. In addition, the Company pays signing bonuses to certain of its on-air personalities, and these amounts were recorded as prepaid expenses and recognized as a component of Direct operating expenses over the terms of the various contracts. To the extent these contracts do not contain substantive claw-back provisions, these prepaid amounts do not provide any enforceable rights that result in future economic benefits. Accordingly, the balances related to these contracts as of May 1, 2019 were adjusted to zero.
|
(3)
Reflects the fair value adjustment to eliminate receivables related to tenant allowances per certain lease agreements. These receivables were incorporated into the recalculated lease obligations per ASC 842.
|
(4)
|
Reflects the fair value adjustment to recognize the Company’s property, plant and equipment as of May 1, 2019 based on the fair values of such property, plant and equipment. Property was valued using a market approach comparing similar properties to recent market transactions. Equipment and towers were valued primarily using a replacement cost approach. Internally-developed and owned software technology assets were valued primarily using the Royalty Savings Method, similar to the approach used in valuing the Company’s tradenames and trademarks. Estimated royalty rates were determined for each of the software technology assets considering the relative contribution to the Company’s overall profitability as well as available public market information regarding market royalty rates for similar assets. The selected royalty rates were applied to the revenue generated by the software technology assets. The forecasted cash flows expected to be generated as a result of the royalty savings were discounted to present value utilizing a discount rate considering overall business risks and risks associated with the asset being valued. For certain of the software technology assets, the Company used the cost approach which utilized historical financial data regarding development costs and expected future profit associated with the assets. The adjustment to the Company’s property, plant and equipment consists of a
$182.9 million
increase in tangible property and equipment and a
$151.0 million
increase in software technology assets
|
(5) Historical goodwill and other intangible assets have been eliminated and the Company has recognized certain intangible assets at estimated current fair values as part of the application of fresh start accounting, with the most material intangible assets being the FCC licenses related to the Company’s
854
radio stations. The Company has also recorded customer-related and marketing-related intangible assets, including the iHeart tradename.
82
IHEARTMEDIA, INC.
AND SUBSIDIARIES
NOTES TO CONSOLIDATED FINANCIAL STATEMENTS
The following table sets forth estimated fair values of the components of these intangible assets and their estimated useful lives:
|
(In thousands)
|
Estimated Fair Value
|
Estimated Useful Life
|
|||
|
FCC licenses
|
$
|
2,281,720
|
|
(a)
|
Indefinite
|
|
Customer / advertiser relationships
|
1,643,670
|
|
(b)
|
5 - 15 years
|
|
|
Talent contracts
|
373,000
|
|
(b)
|
2 - 10 years
|
|
|
Trademarks and tradenames
|
321,928
|
|
(b)
|
7 - 15 years
|
|
|
Other
|
6,808
|
|
(c)
|
||
|
Total intangible assets upon emergence
|
$
|
4,627,126
|
|
||
|
Elimination of historical acquired intangible assets
|
(2,431,142
|
)
|
|||
|
Fresh start adjustment to acquired intangible assets
|
$
|
2,195,984
|
|
||
(a)
FCC licenses.
The fair value of the indefinite-lived FCC licenses was determined primarily using the direct valuation method of the Income Approach and, for smaller markets a combination of the Income approach and the Market Approach. The Company engaged a third-party valuation firm to assist it in the development of the assumptions and the Company’s determination of the fair value of its FCC licenses.
Under the direct valuation method, the fair value of the FCC licenses was calculated at the market level as prescribed by ASC 350. The application of the direct valuation method attempts to isolate the income that is properly attributable to the FCC licenses alone (that is, apart from tangible and identified intangible assets and goodwill). It is based upon modeling a hypothetical “greenfield” build-up to a “normalized” enterprise that, by design, lacks inherent goodwill and whose only other assets have essentially been paid for (or added) as part of the build-up process. Under the direct valuation method, it is assumed that rather than acquiring FCC licenses as part of a going concern business, the buyer hypothetically obtains FCC licenses and builds a new operation with similar attributes from scratch. Thus, the buyer incurs start-up costs during the build-up phase which are normally associated with going concern value. Initial capital costs are deducted from the discounted cash flow model which results in value that is directly attributable to the FCC licenses. In applying the direct valuation method to the Company’s FCC licenses, the licenses are grouped by type (e.g. FM licenses vs. AM licenses) and market size in order to ensure appropriate assumptions are used in valuing the various FCC licenses based on population and demographics that influence the level of revenues generated by each FCC license, using industry projections. The key assumptions used in applying the direct valuation method include market revenue growth rates, market share, profit margin, duration and profile of the build-up period, estimated start-up capital costs and losses incurred during the build-up period, the risk-adjusted discount rate (“WACC”) and terminal values. The WACC was calculated by weighting the required returns on interest-bearing debt and common equity capital in proportion to their estimated percentages based on a market participant capital structure.
For licenses valued using the Market Transaction Method, the Company used publicly available data, which included sales of comparable radio stations and FCC auction data involving radio broadcast licenses to estimate the fair value of FCC licenses. Similar to the application of the Income approach for the FCC licenses, the Company grouped licenses by type and market size for comparison to historical market transactions.
The historical book value of the FCC licenses as of May 1, 2019 was subtracted from the fair value of the FCC licenses to determine the adjustment to decrease the value of Indefinite-lived intangible assets-licenses by
$44.9 million
.
(b)
Other intangible assets.
Definite-lived intangible assets include customer/advertiser relationships, talent contracts for on-air personalities, trademarks and tradenames and other intangible assets. The Company engaged a third-party valuation firm to assist in developing the assumptions and determining the fair values of each of these assets.
For purposes of estimating the fair values of customer/advertiser relationships and talent contracts, the Company primarily utilized the Income Approach (specifically, the multi-period excess earnings method, or MPEEM) to
83
IHEARTMEDIA, INC.
AND SUBSIDIARIES
NOTES TO CONSOLIDATED FINANCIAL STATEMENTS
estimate fair value based on the present value of the incremental after-tax cash flows attributable only to the subject intangible assets after deducting contributory asset charges. The cash flows attributable to each grouping of customer/advertiser relationships were adjusted for the appropriate contributory asset charges (e.g., FCC licenses, working capital, tradenames, technology, workforce, etc.). The discount rate utilized to present-value the after-tax cash flows was selected based on consideration of the overall business risks and the risks associated with the specific assets being valued. Additionally, for certain advertiser relationships the Company used the Cost Approach using historical financial data regarding the sales, administrative and overhead expenses related to the Company’s selling efforts associated with revenue for both existing and new advertisers. The ratio of expenses for selling efforts to revenue was applied to total revenue from new customers to determine an estimated cost per revenue dollar of revenue generated by new customers. This ratio was applied to total revenue from existing customers to estimate the replacement cost of existing customer/advertiser relationships. The historical book value of customer/advertiser relationships as of May 1, 2019 was subtracted from the fair value of the customer/advertiser relationships determined as described above to determine the adjustment to increase the value of the customer/advertiser relationship intangible assets by
$1,604.1 million
.
For purposes of estimating the fair value of trademarks and tradenames, the Company primarily used the Royalty Savings Method, a variation of the Income approach. Estimated royalty rates were determined for each of the trademarks and tradenames considering the relative contribution to the Company’s overall profitability as well as available public information regarding market royalty rates for similar assets. The selected royalty rates were applied to the revenue generated by the trademarks and tradenames to determine the amount of royalty payments saved as a result of owning these assets. The forecasted cash flows expected to be generated as a result of the royalty savings were discounted to present value utilizing a discount rate considering overall business risks and risks associated with the asset being valued. The historical book values of talent contracts, trademarks and tradenames and other intangible assets as of May 1, 2019 were subtracted from the fair values determined as described above to determine the adjustments as follows:
|
(In millions)
|
||||
|
Customer/advertiser relationships
|
$
|
1,604.1
|
|
increase in value
|
|
Talent contracts
|
361.6
|
|
increase in value
|
|
|
Trademarks and tradenames
|
274.4
|
|
increase in value
|
|
|
Other
|
0.8
|
|
increase in value
|
|
|
Total fair value adjustment
|
$
|
2,240.9
|
|
increase in value
|
(c) Included within other intangible assets are permanent easements, which have an indefinite useful life. All other intangible assets are amortized over the respective lives of the agreements, or over the period of time the assets are expected to contribute directly or indirectly to the Company’s future cash flows.
The following table sets forth the adjustments to goodwill:
|
(In thousands)
|
|||
|
Reorganization value
|
$
|
10,710,208
|
|
|
Less: Fair value of assets (excluding goodwill)
|
(7,386,843
|
)
|
|
|
Total goodwill upon emergence
|
3,323,365
|
|
|
|
Elimination of historical goodwill
|
(3,415,492
|
)
|
|
|
Fresh start adjustment to goodwill
|
$
|
(92,127
|
)
|
|
(6)
|
The operating lease obligation as of May 1, 2019 had been calculated using an incremental borrowing rate applicable to the Company while it was a debtor-in-possession before its emergence from bankruptcy. Upon application of fresh start accounting, the lease obligation was recalculated using the incremental borrowing rate applicable to the Company after emergence from bankruptcy and commensurate to its new capital structure. The incremental borrowing rate used decreased from
12.44%
as
|
84
IHEARTMEDIA, INC.
AND SUBSIDIARIES
NOTES TO CONSOLIDATED FINANCIAL STATEMENTS
of March 31, 2019 to
6.54%
as of May 1, 2019. As a result of this decrease, the Company's Operating lease liabilities and corresponding Operating lease right-of-use assets increased by
$541.2 million
to reflect the higher balances resulting from the application of a lower incremental borrowing rate. The Operating lease right-of-use-assets were further adjusted to reflect the resetting of the Company's straight-line lease calculation. In addition, the Company increased the Operating lease right-of-use assets to recognize
$13.1 million
related to the favorable lease contracts.
|
(7)
|
Reflects the fair value adjustment to adjust deferred revenue and other liabilities as of May 1, 2019 to its estimated fair value. The fair value of the deferred revenue was determined using the market approach and the cost approach. The market approach values deferred revenue based on the amount an acquirer would be required to pay a third party to assume the remaining performance obligations. The cost approach values deferred revenue utilizing estimated costs that will be incurred to fulfill the obligation plus a normal profit margin for the level of effort or assumption of risk by the acquirer. Additionally, a deferred gain was recorded at the time of the certain historical sale-leaseback transaction. During the implementation of ASC 842, the operating portion was written off as of January 1, 2019. The financing lease deferred gain remained. As part of fresh start accounting, this balance of
$0.9 million
was written off.
|
(8) Reflects the fair value adjustment to adjust Long-term debt as of May 1, 2019. This adjustment is to state the Company's finance leases and other pre-petition debt at estimated fair values.
(9) Reflects the fair value adjustment to adjust Accrued expenses as of May 1, 2019. This adjustment primarily relates to adjusting vacation accruals to estimated fair values.
(10) Reflects a net increase to deferred tax liabilities for fresh start adjustments attributed primarily to property, plant and equipment and intangible assets, the effects of which are partially offset by a decrease in the valuation allowance. The Company believes it is more likely than not that its deferred tax assets remaining after the Reorganization and emergence will be realized based on taxable income from reversing deferred tax liabilities primarily attributable to property, plant and equipment and intangible assets.
(11) Reflects the adjustment as of May 1, 2019 to state the noncontrolling interest balance at estimated fair value.
85
IHEARTMEDIA, INC.
AND SUBSIDIARIES
NOTES TO CONSOLIDATED FINANCIAL STATEMENTS
(12) The table below reflects the cumulative impact of the fresh start adjustments as discussed above:
|
(In thousands)
|
|||
|
Fresh start adjustment to Accounts receivable, net
|
$
|
(10,810
|
)
|
|
Fresh start adjustment to Other current assets
|
(1,668
|
)
|
|
|
Fresh start adjustment to Prepaid expenses
|
(24,642
|
)
|
|
|
Fresh start adjustment to Property, plant and equipment, net
|
333,991
|
|
|
|
Fresh start adjustment to Intangible assets
|
2,195,984
|
|
|
|
Fresh start adjustment to Goodwill
|
(92,127
|
)
|
|
|
Fresh start adjustment to Operating lease right-of-use assets
|
554,278
|
|
|
|
Fresh start adjustment to Other assets
|
(54,683
|
)
|
|
|
Fresh start adjustment to Accrued expenses
|
(2,328
|
)
|
|
|
Fresh start adjustment to Deferred revenue
|
(3,214
|
)
|
|
|
Fresh start adjustment to Debt
|
1,546
|
|
|
|
Fresh start adjustment to Operating lease obligations
|
(458,989
|
)
|
|
|
Fresh start adjustment to Other long-term liabilities
|
2,164
|
|
|
|
Fresh start adjustment to Noncontrolling interest
|
(8,558
|
)
|
|
|
Total Fresh Start Adjustments impacting Reorganization items, net
|
$
|
2,430,944
|
|
|
Reset of Accumulated other comprehensive income
|
(14,175
|
)
|
|
|
Income tax expense
|
(185,419
|
)
|
|
|
Net impact to Accumulated deficit
|
$
|
2,231,350
|
|
Reorganization Items, Net
The tables below present the Reorganization items incurred and cash paid for Reorganization items as a result of the Chapter 11 Cases during the periods presented:
|
(In thousands)
|
Successor Company
|
Predecessor Company
|
||||||||||
|
Period from May 2, 2019 through December 31,
|
Period from January 1, 2019 through May 1,
|
Year Ended December 31,
|
||||||||||
|
2019
|
2019
|
2018
|
||||||||||
|
Write-off of deferred loans costs
|
$
|
—
|
|
$
|
—
|
|
$
|
(67,079
|
)
|
|||
|
Write-off of original issue discount
|
—
|
|
—
|
|
(131,100
|
)
|
||||||
|
Debtor-in-possession refinancing costs
|
—
|
|
—
|
|
(10,546
|
)
|
||||||
|
Professional fees and other bankruptcy related costs
|
—
|
|
(157,487
|
)
|
(147,119
|
)
|
||||||
|
Net gain on settlement of Liabilities subject to compromise
|
—
|
|
7,192,374
|
|
(275
|
)
|
||||||
|
Impact of fresh start adjustments
|
—
|
|
2,430,944
|
|
—
|
|
||||||
|
Other items, net
|
—
|
|
(4,005
|
)
|
—
|
|
||||||
|
Reorganization items, net
|
$
|
—
|
|
$
|
9,461,826
|
|
$
|
(356,119
|
)
|
|||
|
Cash payments for Reorganization items, net
|
$
|
18,360
|
|
$
|
183,291
|
|
$
|
103,727
|
|
|||
86
IHEARTMEDIA, INC.
AND SUBSIDIARIES
NOTES TO CONSOLIDATED FINANCIAL STATEMENTS
As of
December 31, 2019
,
$0.4 million
of Reorganization items, net were unpaid and accrued in Accounts payable and Accrued expenses in the accompanying Consolidated Balance Sheet. As of
December 31, 2018
,
$47.5 million
of professional fees were unpaid and accrued in Accounts payable and Accrued expenses in the accompanying Consolidated Balance Sheet. The Company incurred additional professional fees related to the bankruptcy, post-emergence, of
$26.5 million
for the period from May 2, 2019 through
December 31, 2019
, respectively, which are included within
Other income (expense), net
in the Company's Consolidated Statements of Comprehensive Income (Loss).
NOTE 4 - DISCONTINUED OPERATIONS
Discontinued operations relate to our domestic and international outdoor advertising businesses and were previously reported as the Americas outdoor and International outdoor segments prior to the Separation. Assets, liabilities, revenue, expenses and cash flows for these businesses are separately reported as assets, liabilities, revenue, expenses and cash flows from discontinued operations in the Company's financial statements for all periods presented.
Financial Information for Discontinued Operations
Income Statement Information
The following shows the revenue, income (loss) from discontinued operations and gain on disposal of the Predecessor Company's discontinued operations for the periods presented:
|
(In thousands)
|
Predecessor Company
|
||||||||||
|
Period from January 1, 2019 through May 1,
|
Year Ended December 31,
|
||||||||||
|
2019
|
2018
|
2017
|
|||||||||
|
Revenue
|
$
|
804,566
|
|
$
|
2,721,705
|
|
$
|
2,588,702
|
|
||
|
Loss from discontinued operations before income taxes
|
$
|
(133,475
|
)
|
$
|
(132,152
|
)
|
$
|
(82,921
|
)
|
||
|
Income tax (benefit) expense
|
(6,933
|
)
|
(32,515
|
)
|
280,218
|
|
|||||
|
Income (loss) from discontinued operations, net of taxes
|
$
|
(140,408
|
)
|
$
|
(164,667
|
)
|
$
|
197,297
|
|
||
|
Gain on disposal before income taxes
|
$
|
1,825,531
|
|
$
|
—
|
|
$
|
—
|
|
||
|
Income tax expense
|
—
|
|
—
|
|
—
|
|
|||||
|
Gain on disposal, net of taxes
|
$
|
1,825,531
|
|
$
|
—
|
|
$
|
—
|
|
||
|
Income (loss) from discontinued operations, net of taxes
|
$
|
1,685,123
|
|
$
|
(164,667
|
)
|
$
|
197,297
|
|
||
87
IHEARTMEDIA, INC.
AND SUBSIDIARIES
NOTES TO CONSOLIDATED FINANCIAL STATEMENTS
Balance Sheet Information
The following table shows the classes of assets and liabilities classified as discontinued operations for the Predecessor Company as of December 31, 2018:
|
(In thousands)
|
Predecessor Company
|
||
|
December 31,
2018 |
|||
|
CURRENT ASSETS
|
|||
|
Cash and cash equivalents
|
$
|
182,456
|
|
|
Accounts receivable, net of allowance of $24,224
|
706,309
|
|
|
|
Prepaid expenses
|
95,734
|
|
|
|
Other current assets
|
31,301
|
|
|
|
Current assets of discontinued operations
|
$
|
1,015,800
|
|
|
LONG-TERM ASSETS
|
|||
|
Structures, net
|
$
|
1,053,016
|
|
|
Property, plant and equipment, net
|
235,922
|
|
|
|
Indefinite-lived intangibles - permits
|
971,163
|
|
|
|
Other intangibles, net
|
252,862
|
|
|
|
Goodwill
|
706,003
|
|
|
|
Other assets
|
132,504
|
|
|
|
Long-term assets of discontinued operations
|
$
|
3,351,470
|
|
|
CURRENT LIABILITIES
|
|||
|
Accounts payable
|
$
|
113,714
|
|
|
Accrued expenses
|
528,482
|
|
|
|
Accrued interest
|
2,341
|
|
|
|
Deferred income
|
85,052
|
|
|
|
Current portion of long-term debt
|
227
|
|
|
|
Current liabilities of discontinued operations
|
$
|
729,816
|
|
|
LONG-TERM LIABILITIES
|
|||
|
Long-term debt
|
$
|
5,277,108
|
|
|
Deferred income taxes
|
335,015
|
|
|
|
Other long-term liabilities
|
260,150
|
|
|
|
Long-term liabilities of discontinued operations
|
$
|
5,872,273
|
|
In connection with the Separation, the Company and its subsidiaries entered into the agreements described below.
Transition Services Agreement
On the Effective Date, the Company, iHM Management Services, iHeartCommunications and CCOH entered into a transition services agreement (the “Transition Services Agreement”), pursuant to which iHM Management Services has agreed to provide, or cause the Company, iHeartCommunications, iHeart Operations or any member of the iHeart Group to provide, CCOH with certain administrative and support services and other assistance which CCOH will utilize in the conduct of its business as such business was conducted prior to the Separation, for one year from the Effective Date (subject to certain rights of CCOH to extend up to one additional year, as described below). The transition services may include, among other things, (a) treasury, payroll and other financial related services, (b) certain executive officer services, (c) human resources and employee benefits, (d) legal and related services, (e) information systems, network and related services, (f) investment services and (g) procurement and sourcing support.
88
IHEARTMEDIA, INC.
AND SUBSIDIARIES
NOTES TO CONSOLIDATED FINANCIAL STATEMENTS
The charges for the transition services are generally consistent with the Corporate Services Agreement, dated as of November 10, 2005, by and between iHM Management Services and CCOH (the “Corporate Services Agreement”), which governed the provision of certain services by the iHeart Group to the Outdoor Group prior to the Separation. The allocation of cost is based on various measures depending on the service provided, which measures include relative revenue, employee headcount, number of users of a service or other factors. CCOH may request an extension of the term for all services or individual services for one-month periods for up to an additional 12 months, and the price for transition services provided during such extended term will be increased for any service other than those identified in the schedules to the Transition Services Agreement as an “IT Service” or any other service the use and enjoyment of which requires the use of another IT Service.
CCOH may terminate the Transition Services Agreement with respect to all or any individual service, in whole or in part, upon 30 days’ prior written notice, provided that any co-dependent services must be terminated concurrently.
New Tax Matters Agreement
On the Effective Date, the Company entered into a new tax matters agreement (the “New Tax Matters Agreement”) by and among the Company, iHeartCommunications, iHeart Operations, CCH, CCOH and CCOL, to allocate the responsibility of the Company and its subsidiaries, on the one hand, and the Outdoor Group, on the other, for the payment of taxes arising prior and subsequent to, and in connection with, the Separation.
The New Tax Matters Agreement requires that the Company and iHeartCommunications indemnify CCOH and its subsidiaries, and their respective directors, officers and employees, and hold them harmless, on an after-tax basis, from and against (i) any taxes other than transfer taxes or indirect gains taxes imposed on the Company or any of its subsidiaries (other than CCOH and its subsidiaries) in connection with the Separation, (ii) any transfer taxes and indirect gains taxes arising in connection with the Separation, and (iii) fifty percent of the amount by which the amount of taxes (other than transfer taxes or indirect gains taxes) imposed on CCOH or any of its subsidiaries in connection with the Separation that are paid to the applicable taxing authority on or before the third anniversary of the separation of CCOH exceeds
$5 million
, provided that, the obligations of the Company and iHeartCommunications to indemnify CCOH and its subsidiaries with respect taxes (other than transfer taxes or indirect gains taxes) imposed on CCOH or any of its subsidiaries in connection with the Separation will not exceed
$15 million
. In addition, if the Company or its subsidiaries use certain tax attributes of CCOH and its subsidiaries (including net operating losses, foreign tax credits and other credits) and such use results in a decrease in the tax liability of the Company or its subsidiaries, then the Company is required to reimburse CCOH for the use of such attributes based on the amount of tax benefit realized. The New Tax Matters Agreement provides that any reduction of the tax attributes of CCOH and its subsidiaries as a result of cancellation of indebtedness income realized in connection with the Chapter 11 Cases is not treated as a use of such attributes (and therefore does not require the Company or iHeartCommunications to reimburse CCOH for such reduction).
The New Tax Matters Agreement also requires that (i) CCOH indemnify the Company for any income taxes paid by the Company on behalf of CCOH and its subsidiaries or, with respect to any income tax return for which CCOH or any of its subsidiaries joins with the Company or any of subsidiaries in filing a consolidated, combined or unitary return, the amount of taxes that would have been incurred by CCOH and its subsidiaries if they had filed a separate return, and (ii) except as described in the preceding paragraph, CCOH indemnify the Company and its subsidiaries, and their respective directors, officers and employees, and hold them harmless, on an after-tax basis, from and against any taxes other than transfer taxes or indirect gains taxes imposed on CCOH or any of its subsidiaries in connection with the Separation.
Any tax liability of CCH attributable to any taxable period ending on or before the date of the completion of the Separation, other than any such tax liability resulting from CCH’s being a successor of CCOH in connection with the merger of CCOH with and into CCOH or arising from the operation of the business of CCOH and its subsidiaries after the merger of CCOH with and into CCH, will not be treated as a liability of CCOH and its subsidiaries for purposes of the New Tax Matters Agreement.
NOTE 5 – REVENUE
The Company generates revenue from several sources:
|
•
|
The primary source of revenue in the Audio segment is the sale of advertising on the Company’s radio stations, its iHeartRadio mobile application and website, station websites, and live events. This segment also generates revenues from programming talent, network syndication, traffic and weather data, and other miscellaneous transactions.
|
89
IHEARTMEDIA, INC.
AND SUBSIDIARIES
NOTES TO CONSOLIDATED FINANCIAL STATEMENTS
|
•
|
The Company also generates revenue through contractual commissions realized from the sale of national spot and online advertising on behalf of clients of its full-service media representation business, Katz Media, which is reported in the Company’s Audio and Media Services segment.
|
Disaggregation of Revenue
The following table shows revenue streams for the Successor Company for the period from May 2, 2019 through
December 31, 2019
:
|
Successor Company
|
|||||||||||||||
|
(In thousands)
|
Audio
|
Audio and Media Services
|
Eliminations
|
Consolidated
|
|||||||||||
|
Period from May 2, 2019 through December 31, 2019
|
|||||||||||||||
|
Revenue from contracts with customers:
|
|||||||||||||||
|
Broadcast Radio
(1)
|
$
|
1,575,382
|
|
$
|
—
|
|
$
|
—
|
|
$
|
1,575,382
|
|
|||
|
Digital
(2)
|
273,389
|
|
—
|
|
—
|
|
273,389
|
|
|||||||
|
Networks
(3)
|
425,631
|
|
—
|
|
—
|
|
425,631
|
|
|||||||
|
Sponsorship and Events
(4)
|
159,187
|
|
—
|
|
—
|
|
159,187
|
|
|||||||
|
Audio and Media Services
(5)
|
—
|
|
167,292
|
|
(4,589
|
)
|
162,703
|
|
|||||||
|
Other
(6)
|
13,017
|
|
—
|
|
(447
|
)
|
12,570
|
|
|||||||
|
Total
|
2,446,606
|
|
167,292
|
|
(5,036
|
)
|
2,608,862
|
|
|||||||
|
Revenue from leases
(7)
|
1,194
|
|
—
|
|
—
|
|
1,194
|
|
|||||||
|
Revenue, total
|
$
|
2,447,800
|
|
$
|
167,292
|
|
$
|
(5,036
|
)
|
$
|
2,610,056
|
|
|||
|
(1)
|
Broadcast Radio revenue is generated through the sale of advertising time on the Company’s domestic radio stations.
|
|
(2)
|
Digital revenue is generated through the sale of streaming and display advertisements on digital platforms, subscriptions to iHeartRadio streaming services, podcasting and the dissemination of other digital content.
|
|
(3)
|
Networks revenue is generated through the sale of advertising on the Company’s Premiere and Total Traffic & Weather network programs and through the syndication of network programming to other media companies.
|
|
(4)
|
Sponsorship and events revenue is generated through local events and major nationally-recognized tent pole events and include sponsorship and other advertising revenue, ticket sales, and licensing, as well as endorsement and appearance fees generated by on-air talent.
|
|
(5)
|
Audio and media services revenue is generated by services provided to broadcast industry participants through the Company’s Katz Media and RCS businesses. As a media representation firm, Katz Media generates revenue via commissions on media sold on behalf of the radio and television stations that it represents, while RCS generates revenue by providing broadcast and webcast software and technology and services to radio stations, television music channels, cable companies, satellite music networks and Internet stations worldwide.
|
|
(6)
|
Other revenue represents fees earned for miscellaneous services, including on-site promotions, activations, and local marketing agreements.
|
|
(7)
|
Revenue from leases is primarily generated by the lease of towers to other media companies, which are all categorized as operating leases.
|
90
IHEARTMEDIA, INC.
AND SUBSIDIARIES
NOTES TO CONSOLIDATED FINANCIAL STATEMENTS
The following table shows revenue streams from continuing operations for the Predecessor Company. The presentation of amounts in the Predecessor periods has been revised to conform to the Successor period presentation.
|
Predecessor Company
|
|||||||||||||||
|
(In thousands)
|
Audio
(1)
|
Audio and Media Services
(1)
|
Eliminations
|
Consolidated
|
|||||||||||
|
Period from January 1, 2019 through May 1, 2019
|
|||||||||||||||
|
Revenue from contracts with customers:
|
|||||||||||||||
|
Broadcast Radio
|
$
|
657,864
|
|
$
|
—
|
|
$
|
—
|
|
$
|
657,864
|
|
|||
|
Digital
|
102,789
|
|
—
|
|
—
|
|
102,789
|
|
|||||||
|
Networks
|
189,088
|
|
—
|
|
—
|
|
189,088
|
|
|||||||
|
Sponsorship and Events
|
50,330
|
|
—
|
|
—
|
|
50,330
|
|
|||||||
|
Audio and Media Services
|
—
|
|
69,362
|
|
(2,325
|
)
|
67,037
|
|
|||||||
|
Other
|
5,910
|
|
—
|
|
(243
|
)
|
5,667
|
|
|||||||
|
Total
|
1,005,981
|
|
69,362
|
|
(2,568
|
)
|
1,072,775
|
|
|||||||
|
Revenue from leases
|
696
|
|
—
|
|
—
|
|
696
|
|
|||||||
|
Revenue, total
|
$
|
1,006,677
|
|
$
|
69,362
|
|
$
|
(2,568
|
)
|
$
|
1,073,471
|
|
|||
|
Year Ended December 31, 2018
|
|||||||||||||||
|
Revenue from contracts with customers:
|
|||||||||||||||
|
Broadcast Radio
|
$
|
2,264,058
|
|
$
|
—
|
|
$
|
—
|
|
$
|
2,264,058
|
|
|||
|
Digital
|
284,565
|
|
—
|
|
—
|
|
284,565
|
|
|||||||
|
Networks
|
582,302
|
|
—
|
|
—
|
|
582,302
|
|
|||||||
|
Sponsorship and Events
|
200,605
|
|
—
|
|
—
|
|
200,605
|
|
|||||||
|
Audio and Media Services
|
—
|
|
264,061
|
|
(6,508
|
)
|
257,553
|
|
|||||||
|
Other
|
19,446
|
|
—
|
|
—
|
|
19,446
|
|
|||||||
|
Total
|
3,350,976
|
|
264,061
|
|
(6,508
|
)
|
3,608,529
|
|
|||||||
|
Revenue from leases
|
2,794
|
|
—
|
|
—
|
|
2,794
|
|
|||||||
|
Revenue, total
|
$
|
3,353,770
|
|
$
|
264,061
|
|
$
|
(6,508
|
)
|
$
|
3,611,323
|
|
|||
|
Year Ended December 31, 2017
|
|||||||||||||||
|
Revenue from contracts with customers:
|
|||||||||||||||
|
Broadcast Radio
|
$
|
2,292,116
|
|
$
|
—
|
|
$
|
—
|
|
$
|
2,292,116
|
|
|||
|
Digital
|
248,736
|
|
—
|
|
—
|
|
248,736
|
|
|||||||
|
Networks
|
581,733
|
|
—
|
|
—
|
|
581,733
|
|
|||||||
|
Sponsorship and Events
|
201,775
|
|
—
|
|
—
|
|
201,775
|
|
|||||||
|
Audio and Media Services
|
—
|
|
235,951
|
|
(6,511
|
)
|
229,440
|
|
|||||||
|
Other
|
28,545
|
|
—
|
|
—
|
|
28,545
|
|
|||||||
|
Total
|
3,352,905
|
|
235,951
|
|
(6,511
|
)
|
3,582,345
|
|
|||||||
|
Revenue from leases
|
4,302
|
|
—
|
|
—
|
|
4,302
|
|
|||||||
|
Revenue, total
|
$
|
3,357,207
|
|
$
|
235,951
|
|
$
|
(6,511
|
)
|
$
|
3,586,647
|
|
|||
|
(1)
|
Due to a re-evaluation of the Company’s internal segment reporting upon the effectiveness of the Plan of Reorganization, the Company’s RCS business is included in the Audio & Media Services results for all periods presented. See Note 1 for further information.
|
91
IHEARTMEDIA, INC.
AND SUBSIDIARIES
NOTES TO CONSOLIDATED FINANCIAL STATEMENTS
Trade and Barter
Trade and barter transactions represent the exchange of advertising spots for merchandise, services, other advertising or other assets in the ordinary course of business. The transaction price for these contracts is measured at the estimated fair value of the non-cash consideration received unless this is not reasonably estimable, in which case the consideration is measured based on the standalone selling price of the advertising spots promised to the customer. Trade and barter revenues and expenses from continuing operations, which are included in consolidated revenue and selling, general and administrative expenses, respectively, were as follows:
|
Successor Company
|
Predecessor Company
|
|||||||||||||||
|
Period from May 2, 2019 through December 31,
|
Period from January 1, 2019 through May 1,
|
Year Ended December 31,
|
||||||||||||||
|
(In thousands)
|
2019
|
2019
|
2018
|
2017
|
||||||||||||
|
Consolidated:
|
||||||||||||||||
|
Trade and barter revenues
|
$
|
151,497
|
|
$
|
65,934
|
|
$
|
202,674
|
|
$
|
226,737
|
|
||||
|
Trade and barter expenses
|
134,865
|
|
58,330
|
|
199,982
|
|
190,906
|
|
||||||||
Deferred Revenue
The following tables show the Company’s deferred revenue balance from contracts with customers, excluding discontinued operations:
|
Successor Company
|
Predecessor Company
|
|||||||||||||||
|
Period from May 2, 2019 through December 31,
|
Period from January 1, 2019 through May 1,
|
Year Ended December 31,
|
||||||||||||||
|
(In thousands)
|
2019
|
2019
|
2018
|
2017
|
||||||||||||
|
Deferred revenue from contracts with customers:
|
||||||||||||||||
|
Beginning balance
(1)
|
$
|
151,475
|
|
$
|
148,720
|
|
$
|
155,228
|
|
$
|
165,037
|
|
||||
|
Impact of fresh start accounting
|
298
|
|
—
|
|
—
|
|
—
|
|
||||||||
|
Revenue recognized, included in beginning balance
|
(102,237
|
)
|
(76,473
|
)
|
(115,930
|
)
|
(119,739
|
)
|
||||||||
|
Additions, net of revenue recognized during period, and other
|
112,532
|
|
79,228
|
|
109,422
|
|
109,930
|
|
||||||||
|
Ending balance
|
$
|
162,068
|
|
$
|
151,475
|
|
$
|
148,720
|
|
$
|
155,228
|
|
||||
|
(1)
|
Deferred revenue from contracts with customers, which excludes other sources of deferred revenue that are not related to contracts with customers, is included within deferred revenue and other long-term liabilities on the Consolidated Balance Sheets, depending upon when revenue is expected to be recognized. As described in Note 3, as part of the fresh start accounting adjustments on May 1, 2019, deferred revenue from contracts with customers was adjusted to its estimated fair value.
|
The Company’s contracts with customers generally have a term of one year or less; however, as of
December 31, 2019
, the Company expects to recognize
$234.9 million
of revenue in future periods for remaining performance obligations from current contracts with customers that have an original expected duration of greater than one year, with substantially all of this amount to be recognized over the next
five years
. Commissions related to the Company’s media representation business have been excluded from this amount as they are contingent upon future sales.
92
IHEARTMEDIA, INC.
AND SUBSIDIARIES
NOTES TO CONSOLIDATED FINANCIAL STATEMENTS
Revenue from Leases
As of
December 31, 2019
, the future lease payments to be received by the Successor Company are as follows:
|
(In thousands)
|
|||
|
2020
|
$
|
1,462
|
|
|
2021
|
1,245
|
|
|
|
2022
|
858
|
|
|
|
2023
|
788
|
|
|
|
2024
|
690
|
|
|
|
Thereafter
|
10,020
|
|
|
|
Total minimum future rentals
|
$
|
15,063
|
|
NOTE 6 – LEASES
The following tables provide the components of lease expense included within the Consolidated Statement of Comprehensive Income (Loss) for the period from May 2, 2019 through
December 31, 2019
(Successor) and the period from January 1, 2019 through May 1, 2019 (Predecessor):
|
Successor Company
|
Predecessor Company
|
|||||||
|
Period from May 2, 2019 through December 31,
|
Period from January 1, 2019 through May 1,
|
|||||||
|
(In thousands)
|
2019
|
2019
|
||||||
|
Operating lease expense
|
$
|
100,835
|
|
$
|
44,667
|
|
||
|
Variable lease expense
|
$
|
15,940
|
|
$
|
476
|
|
||
The following table provides the weighted average remaining lease term and the weighted average discount rate for the Company's leases as of
December 31, 2019
(Successor):
|
December 31,
2019 |
||
|
Operating lease weighted average remaining lease term (in years)
|
13.8
|
|
|
Operating lease weighted average discount rate
|
6.52
|
%
|
93
IHEARTMEDIA, INC.
AND SUBSIDIARIES
NOTES TO CONSOLIDATED FINANCIAL STATEMENTS
As of
December 31, 2019
(Successor), the Company’s future maturities of operating lease liabilities were as follows:
|
(In thousands)
|
|||
|
2020
|
$
|
129,324
|
|
|
2021
|
131,059
|
|
|
|
2022
|
124,343
|
|
|
|
2023
|
110,721
|
|
|
|
2024
|
100,667
|
|
|
|
Thereafter
|
762,811
|
|
|
|
Total lease payments
|
$
|
1,358,925
|
|
|
Less: Effect of discounting
|
484,966
|
|
|
|
Total operating lease liability
|
$
|
873,959
|
|
The following table provides supplemental cash flow information related to leases for the period from May 2, 2019 through
December 31, 2019
(Successor) and the period from January 1, 2019 through May 1, 2019 (Predecessor):
|
Successor Company
|
Predecessor Company
|
|||||||
|
Period from May 2, 2019 through December 31,
|
Period from January 1, 2019 through May 1
|
|||||||
|
(In thousands)
|
2019
|
2019
|
||||||
|
Cash paid for amounts included in measurement of operating lease liabilities
|
$
|
89,567
|
|
$
|
44,888
|
|
||
|
Lease liabilities arising from obtaining right-of-use assets
(1)
|
$
|
29,498
|
|
$
|
913,598
|
|
||
(1)
Lease liabilities from obtaining right-of-use assets include transition liabilities upon adoption of ASC 842, as well as new leases entered into during the period from May 2, 2019 through
December 31, 2019
(Successor) and the period from January 1, 2019 through May 1, 2019 (Predecessor). Upon adoption of fresh start accounting upon emergence from the Chapter 11 Cases, the Company increased its operating lease obligation by
$459.0 million
to reflect its operating lease obligation as estimated fair value (see Note 3,
Fresh Start Accounting
).
The Company reflects changes in the lease liability and changes in the ROU asset on a net basis in the Statements of Cash Flows.
94
IHEARTMEDIA, INC.
AND SUBSIDIARIES
NOTES TO CONSOLIDATED FINANCIAL STATEMENTS
NOTE 7 –
PROPERTY, PLANT AND EQUIPMENT, INTANGIBLE ASSETS AND GOODWILL
Property, Plant and Equipment
The Company’s property, plant and equipment consisted of the following classes of assets as of
December 31, 2019
(Successor) and
2018
(Predecessor), respectively:
|
(In thousands)
|
Successor Company
|
Predecessor Company
|
||||||
|
December 31,
2019 |
December 31,
2018 |
|||||||
|
Land, buildings and improvements
|
$
|
385,017
|
|
$
|
427,501
|
|
||
|
Towers, transmitters and studio equipment
|
156,739
|
|
365,991
|
|
||||
|
Furniture and other equipment
|
361,527
|
|
591,601
|
|
||||
|
Construction in progress
|
21,287
|
|
43,809
|
|
||||
|
924,570
|
|
1,428,902
|
|
|||||
|
Less: accumulated depreciation
|
77,694
|
|
926,700
|
|
||||
|
Property, plant and equipment, net
|
$
|
846,876
|
|
$
|
502,202
|
|
||
In connection with the Company's emergence from bankruptcy and in accordance with ASC 852, the Company applied the provisions of fresh start accounting to its Consolidated Financial Statements on the Effective Date. As a result, the Company adjusted Property, plant and equipment to their respective fair values at the Effective Date (see Note 3,
Fresh Start Accounting
).
Indefinite-lived Intangible Assets
The Company’s indefinite-lived intangible assets consist of FCC broadcast licenses. FCC broadcast licenses are granted to radio stations for up to eight years under the Telecommunications Act of 1996 (the “Act”). The Act requires the FCC to renew a broadcast license if the FCC finds that the station has served the public interest, convenience and necessity, there have been no serious violations of either the Communications Act of 1934 or the FCC’s rules and regulations by the licensee, and there have been no other serious violations which taken together constitute a pattern of abuse. The licenses may be renewed indefinitely at little or no cost. The Company does not believe that the technology of wireless broadcasting will be replaced in the foreseeable future. In connection with the Company's emergence from bankruptcy and in accordance with ASC 852, the Company applied the provisions of fresh start accounting to its Consolidated Financial Statements on the Effective Date. As a result, the Company adjusted its FCC licenses to their respective estimated fair values as of the Effective Date of
$2,281.7 million
(see Note 3,
Fresh Start Accounting
).
Annual Impairment Test on Indefinite-lived Intangible Assets
The Company performs its annual impairment test on indefinite-lived intangible assets as of July 1 of each year. The Company also tests indefinite-lived intangible assets at interim dates if events or changes in circumstances indicate that indefinite-lived intangible assets might be impaired.
In connection with emergence from bankruptcy, the Company qualified for and adopted fresh start accounting on the Effective Date. As of May 1, 2019, the Company allocated its estimated enterprise fair value to its individual assets and liabilities based on their estimated fair values in conformity with ASC 805, "Business Combinations." Generally, the annual impairment test for indefinite-lived intangible assets includes a full quantitative assessment, which involves the preparation of fair value estimates for the company’s FCC licenses within each geographic market. The assessment is based upon a direct valuation method as prescribed by ASC 350 and incorporates third party market data, other market and industry factors including data derived from peer companies, and the application of an industry WACC to determine the assets’ fair values. As a result of the recent fair value exercise applied in connection with fresh start accounting, the Company opted to use a qualitative assessment for its annual indefinite-lived intangible asset impairment test as of July 1, 2019 in lieu of performing the full quantitative assessment, as permitted by ASC 350, "Intangibles - Goodwill and Other".
The qualitative impairment assessment performed for indefinite-lived intangible assets considered the general macroeconomic environment, industry and market specific conditions, financial performance, including changes in costs and actual versus forecasted results, as well other issues or events specific to the Audio segment.
95
IHEARTMEDIA, INC.
AND SUBSIDIARIES
NOTES TO CONSOLIDATED FINANCIAL STATEMENTS
Based on this assessment and the totality of facts and circumstances, including the business environment in the third and fourth quarters of 2019, the Company determined that it was not more likely than not that the fair value of the Company's indefinite-lived FCC licenses were less than their respective carrying amounts. As such, the Company concluded no indefinite-lived intangible asset impairment was required for the period from May 2, 2019 through
December 31, 2019
. During the period from January 1, 2019 through May 1, 2019, the Predecessor Company recognized non-cash impairment charges of
$91.4 million
in relation to indefinite-lived FCC licenses as a result of an increase in the WACC used in performing the annual impairment test. The Predecessor Company recognized impairment charges related to its indefinite-lived intangible assets within several iHM radio markets of
$33.2 million
during the year ended
December 31, 2018
. During 2017, the Company recognized an impairment charge of
$6.0 million
related to its indefinite-lived intangible assets in one market.
Other Intangible Assets
Other intangible assets include definite-lived intangible assets. The Company’s definite-lived intangible assets primarily include customer and advertiser relationships, talent and representation contracts, trademarks and tradenames and other contractual rights, all of which are amortized over the shorter of either the respective lives of the agreements or over the period of time the assets are expected to contribute directly or indirectly to the Company’s future cash flows. The Company periodically reviews the appropriateness of the amortization periods related to its definite-lived intangible assets. These assets are recorded at amortized cost. In connection with the Company's emergence from bankruptcy and in accordance with ASC 852, the Company applied the provisions of fresh start accounting to its Consolidated Financial Statements on the Effective Date. As a result, the Company adjusted Other intangible assets to their respective fair values at the Effective Date (see Note 3,
Fresh Start Accounting
).
The following table presents the gross carrying amount and accumulated amortization for each major class of other intangible assets as of
December 31, 2019
(Successor) and
December 31, 2018
(Predecessor), respectively:
|
(In thousands)
|
Successor Company
|
Predecessor Company
|
||||||||||||||
|
December 31, 2019
|
December 31, 2018
|
|||||||||||||||
|
Gross Carrying Amount
|
Accumulated Amortization
|
Gross Carrying Amount
|
Accumulated Amortization
|
|||||||||||||
|
Customer / advertiser relationships
|
$
|
1,629,236
|
|
$
|
(114,280
|
)
|
$
|
1,326,636
|
|
$
|
(1,278,885
|
)
|
||||
|
Talent and other contracts
|
375,399
|
|
(33,739
|
)
|
164,933
|
|
(148,578
|
)
|
||||||||
|
Trademarks and tradenames
|
321,977
|
|
(21,661
|
)
|
—
|
|
—
|
|
||||||||
|
Other
|
21,394
|
|
(1,786
|
)
|
376,978
|
|
(240,662
|
)
|
||||||||
|
Total
|
$
|
2,348,006
|
|
$
|
(171,466
|
)
|
$
|
1,868,547
|
|
$
|
(1,668,125
|
)
|
||||
Total amortization expense related to definite-lived intangible assets for the Successor Company for the period from May 2, 2019 through
December 31, 2019
was
$171.5 million
. Total amortization expense related to definite-lived intangible assets for the Predecessor Company for the period from January 1, 2019 through May 1, 2019, the year ended
December 31, 2018
and the year ended
December 31, 2017
was
$12.7 million
,
$110.9 million
and
$169.3 million
, respectively.
As acquisitions and dispositions occur in the future, amortization expense may vary. The following table presents the Company’s estimate of amortization expense for each of the five succeeding fiscal years for definite-lived intangible assets:
|
(In thousands)
|
|||
|
2020
|
$
|
257,053
|
|
|
2021
|
256,655
|
|
|
|
2022
|
255,874
|
|
|
|
2023
|
247,522
|
|
|
|
2024
|
246,832
|
|
|
96
IHEARTMEDIA, INC.
AND SUBSIDIARIES
NOTES TO CONSOLIDATED FINANCIAL STATEMENTS
Annual Impairment Test to Goodwill
The Company performs its annual impairment test on goodwill as of July 1 of each year. The Company also tests goodwill at interim dates if events or changes in circumstances indicate that goodwill might be impaired.
Generally, the Company's annual impairment test includes a full quantitative assessment, which involves the preparation of a fair value estimate for each reporting unit based on the most recent projected financial results, market and industry factors, including comparison to peer companies and the application of the Company's current estimated WACC. However, in connection with emergence from bankruptcy, the Company qualified for and adopted fresh start accounting on the Effective Date. As of May 1, 2019, the Company allocated its estimated enterprise fair value to its individual assets and liabilities based on their estimated fair values in conformity with ASC 805, "Business Combinations."
Upon application of fresh start accounting in accordance with ASC 852 in connection with the emergence from bankruptcy, the Company recorded goodwill of
$3.3 billion
, which represented the excess of Reorganization Value over the estimated fair value of the Company's assets and liabilities. Goodwill was further allocated to reporting units based on the relative fair values of the Company's reporting units as of May 1, 2019.
As a result of the recent fair value exercise applied in connection with fresh start accounting, the Company opted to use a qualitative assessment for its annual goodwill impairment test as of July 1, 2019 in lieu of performing the full quantitative assessment, as permitted by ASC 350, "Intangibles - Goodwill and Other".
As of July 1, 2019, the qualitative impairment assessment performed for goodwill considered the general macroeconomic environment, industry and market specific conditions for each reporting unit, financial performance, including changes in costs and actual versus forecasted results, as well other issues or events specific to each reporting unit. In addition, the Company evaluated the impact of changes in the Company's stock price and the trading values of its publicly-traded debt from May 1, 2019 to July 1, 2019 to determine whether or not any changes would indicate a potential impairment of goodwill allocated to its reporting units.
Based on this assessment and the totality of facts and circumstances, including the business environment in the third and fourth quarters of 2019, the Company determined that it was not more likely than not that the fair value of the Company and its reporting units is less than their respective carrying amounts. As such, the Company concluded no goodwill impairment was required during the period from May 2, 2019 through
December 31, 2019
(Successor), the period from January 1, 2019 through May 1, 2019 (Predecessor) the year ended
December 31, 2018
(Predecessor) and the year ended
December 31, 2017
(Predecessor).
97
IHEARTMEDIA, INC.
AND SUBSIDIARIES
NOTES TO CONSOLIDATED FINANCIAL STATEMENTS
The following table presents the changes in the carrying amount of goodwill:
|
(In thousands)
|
Audio
|
Audio & Media Services
|
Consolidated
|
||||||||
|
Balance as of December 31, 2017 (Predecessor)
|
$
|
3,255,208
|
|
$
|
81,831
|
|
$
|
3,337,039
|
|
||
|
Acquisitions
|
77,320
|
|
—
|
|
77,320
|
|
|||||
|
Dispositions
|
(1,606
|
)
|
—
|
|
(1,606
|
)
|
|||||
|
Balance as of December 31, 2018 (Predecessor)
|
$
|
3,330,922
|
|
$
|
81,831
|
|
$
|
3,412,753
|
|
||
|
Acquisitions
|
—
|
|
2,767
|
|
2,767
|
|
|||||
|
Foreign currency
|
—
|
|
(28
|
)
|
(28
|
)
|
|||||
|
Balance as of May 1, 2019 (Predecessor)
|
$
|
3,330,922
|
|
$
|
84,570
|
|
$
|
3,415,492
|
|
||
|
Impact of fresh start accounting
|
(111,712
|
)
|
19,585
|
|
(92,127
|
)
|
|||||
|
Balance as of May 2, 2019 (Successor)
|
$
|
3,219,210
|
|
$
|
104,155
|
|
$
|
3,323,365
|
|
||
|
Acquisitions
|
4,637
|
|
—
|
|
4,637
|
|
|||||
|
Dispositions
|
(9,466
|
)
|
—
|
|
(9,466
|
)
|
|||||
|
Foreign currency
|
—
|
|
(1
|
)
|
(1
|
)
|
|||||
|
Other
|
7,087
|
|
—
|
|
7,087
|
|
|||||
|
Balance as of December 31, 2019 (Successor)
|
$
|
3,221,468
|
|
$
|
104,154
|
|
$
|
3,325,622
|
|
||
The balance at December 31,
2017
(Predecessor) is net of cumulative impairments of
$3.5 billion
and
$212.0 million
in the Company’s iHM and Audio and Media Service segments, respectively.
98
IHEARTMEDIA, INC.
AND SUBSIDIARIES
NOTES TO CONSOLIDATED FINANCIAL STATEMENTS
NOTE 8 – INVESTMENTS
The following table summarizes the Company's investments in nonconsolidated affiliates and other securities:
|
(In thousands)
|
Notes Receivable
|
Equity Method Investments
|
Other Investments
|
Marketable Equity Securities
|
Total Investments
|
||||||||||||||
|
Balance at December 31, 2017 (Predecessor)
|
$
|
13,792
|
|
$
|
19,050
|
|
$
|
75,623
|
|
$
|
—
|
|
$
|
108,465
|
|
||||
|
Purchases of investments
|
14,823
|
|
4,737
|
|
1,348
|
|
—
|
|
20,908
|
|
|||||||||
|
Equity in earnings
|
—
|
|
116
|
|
—
|
|
—
|
|
116
|
|
|||||||||
|
Disposals
|
—
|
|
—
|
|
(28,389
|
)
|
—
|
|
(28,389
|
)
|
|||||||||
|
Impairment of investments
|
(2,064
|
)
|
—
|
|
(14,158
|
)
|
—
|
|
(16,222
|
)
|
|||||||||
|
Fair value adjustments
|
—
|
|
—
|
|
4,389
|
|
—
|
|
4,389
|
|
|||||||||
|
Other
|
(728
|
)
|
201
|
|
—
|
|
—
|
|
(527
|
)
|
|||||||||
|
Balance at December 31, 2018 (Predecessor)
|
$
|
25,823
|
|
$
|
24,104
|
|
$
|
38,813
|
|
$
|
—
|
|
$
|
88,740
|
|
||||
|
Purchases of investments
|
—
|
|
591
|
|
103
|
|
—
|
|
694
|
|
|||||||||
|
Equity in loss
|
—
|
|
(66
|
)
|
—
|
|
—
|
|
(66
|
)
|
|||||||||
|
Impairment of investments
|
(1,895
|
)
|
—
|
|
(8,342
|
)
|
—
|
|
(10,237
|
)
|
|||||||||
|
Other
|
(3
|
)
|
—
|
|
—
|
|
—
|
|
(3
|
)
|
|||||||||
|
Balance at May 1, 2019 (Predecessor)
|
$
|
23,925
|
|
$
|
24,629
|
|
$
|
30,574
|
|
$
|
—
|
|
$
|
79,128
|
|
||||
|
Impact of fresh start accounting
|
(8,842
|
)
|
(14,986
|
)
|
(1,062
|
)
|
—
|
|
(24,890
|
)
|
|||||||||
|
Balance at May 2, 2019 (Successor)
|
$
|
15,083
|
|
$
|
9,643
|
|
$
|
29,512
|
|
$
|
—
|
|
$
|
54,238
|
|
||||
|
Purchases of investments
|
24,103
|
|
1,588
|
|
2,425
|
|
3,440
|
|
31,556
|
|
|||||||||
|
Equity in loss
|
—
|
|
(279
|
)
|
—
|
|
—
|
|
(279
|
)
|
|||||||||
|
Impairment of investments
|
—
|
|
—
|
|
(21,003
|
)
|
—
|
|
(21,003
|
)
|
|||||||||
|
Loss on marketable equity securities
|
—
|
|
—
|
|
—
|
|
(740
|
)
|
(740
|
)
|
|||||||||
|
Other
|
(6,058
|
)
|
—
|
|
6,055
|
|
—
|
|
(3
|
)
|
|||||||||
|
December 31, 2019 (Successor)
|
$
|
33,128
|
|
$
|
10,952
|
|
$
|
16,989
|
|
$
|
2,700
|
|
$
|
63,769
|
|
||||
Equity method investments in the table above are not consolidated, but are accounted for under the equity method of accounting. The Company records its investments in these entities on the balance sheet as “Other assets.” The Company's interests in the operations of equity method investments are recorded in the statement of comprehensive income (loss) as “
Equity in earnings (loss) of nonconsolidated affiliates
.” Other investments includes various investments in companies for which there is no readily determinable market value.
During the period from May 2, 2019 through December 31,
2019
, the Successor Company recorded
$30.0 million
in its Audio segment for investments made in
eleven
companies in exchange for advertising services and cash.
Two
of these investments are being accounted for under the equity method of accounting,
one
of these investments is being accounted for at amortized cost, one of these investments is being accounted for as an available-for-sale security and
six
of these investments are notes receivable that are convertible into cash or equity. During
2018
, the Predecessor Company recorded
$20.8 million
in its Audio segment for investments made in
twelve
private companies in exchange for advertising services and cash.
Two
of these investments are being accounted for under the equity method of accounting,
five
of these investments are being accounted for at amortized cost and
five
of these investments are notes receivable that are convertible into equity.
The Successor Company recognized barter revenue of
$13.0 million
in the period from May 2, 2019 through
December 31, 2019
. The Predecessor Company recognized barter revenue of
$6.0 million
and
$10.8 million
in the period from January 1, 2019 through May 1, 2019 and the year ended December 31,
2018
, respectively, in connection with these investments as services were provided. The Successor Company recognized non-cash investment impairments totaling
$21.0 million
on our investments for the period from May 2, 2019 through
December 31, 2019
, which were recorded in “Loss on investments, net.” The Predecessor Company
99
IHEARTMEDIA, INC.
AND SUBSIDIARIES
NOTES TO CONSOLIDATED FINANCIAL STATEMENTS
recognized non-cash investment impairments totaling
$10.2 million
and
$16.2 million
on our investments for the period from January 1, 2019 through May 1, 2019 and the year ended December 31,
2018
, respectively, which were recorded in “Loss on investments, net.” The Predecessor Company recognized a net gain of
$4.4 million
related to the acquisition of Jelli, Inc., which the Company acquired during the fourth quarter of 2018. The gain is included within "Loss on investments, net."
NOTE 9 – LONG-TERM DEBT
In connection with the Company's Chapter 11 Cases, the indebtedness of the Debtors was reclassified to Liabilities subject to compromise at December 31, 2018. As a part of the Company's emergence from the Chapter 11 Cases, iHeartCommunications' debt was reduced to approximately
$5.8 billion
.
Long-term debt outstanding as of
December 31, 2019
(Successor) and
December 31, 2018
(Predecessor) consisted of the following:
|
(In thousands)
|
Successor Company
|
Predecessor Company
|
||||||
|
December 31,
2019 |
December 31,
2018 |
|||||||
|
Term Loan Facility due 2026
(1)(2)(3)
|
$
|
2,251,271
|
|
$
|
—
|
|
||
|
Debtors-in-Possession Facility
(4)
|
—
|
|
—
|
|
||||
|
Asset-based Revolving Credit Facility due 2023
(4)
|
—
|
|
—
|
|
||||
|
6.375% Senior Secured Notes due 2026
|
800,000
|
|
—
|
|
||||
|
5.25% Senior Secured Notes due 2027
(1)
|
750,000
|
|
—
|
|
||||
|
4.75% Senior Secured Notes due 2028
(2)
|
500,000
|
|
—
|
|
||||
|
Other secured subsidiary debt
(5)
|
20,992
|
|
—
|
|
||||
|
Total consolidated secured debt
|
4,322,263
|
|
—
|
|
||||
|
8.375% Senior Unsecured Notes due 2027
|
1,450,000
|
|
—
|
|
||||
|
Other unsecured subsidiary debt
|
12,581
|
|
46,105
|
|
||||
|
Long-term debt fees
|
(19,428
|
)
|
—
|
|
||||
|
Long-term debt, net subject to compromise
(6)
|
—
|
|
15,149,477
|
|
||||
|
Total debt, prior to reclassification to Liabilities subject to compromise
|
5,765,416
|
|
15,195,582
|
|
||||
|
Less: Current portion
|
8,912
|
|
46,105
|
|
||||
|
Less: Amounts reclassified to Liabilities subject to compromise
|
—
|
|
15,149,477
|
|
||||
|
Total long-term debt
|
$
|
5,756,504
|
|
$
|
—
|
|
||
|
(1)
|
On August 7, 2019, iHeartCommunications issued
$750.0 million
of
5.25%
Senior Secured Notes due 2027 (the “
5.25%
Senior Secured Notes”), the proceeds of which were used, together with cash on hand, to prepay at par
$740.0 million
of borrowings outstanding under the Term Loan Facility, plus
$0.8 million
of accrued and unpaid interest to, but not including, the date of prepayment.
|
|
(2)
|
On November 22, 2019, iHeartCommunications issued the
4.75%
Senior Secured Notes, the proceeds of which were used, together with cash on hand, to prepay at par
$500.0 million
of borrowings outstanding under the Term Loan Facility, plus approximately
$1.7 million
of accrued and unpaid interest to, but not including, the date of prepayment.
|
|
(3)
|
On February 3, 2020, iHeartCommunications made a
$150.0 million
prepayment using cash on hand and entered into an agreement to amend the Term Loan Facility to reduce the interest rate to LIBOR plus a margin of
3.00%
, or the Base Rate (as defined in the Credit Agreement) plus a margin of
2.00%
and to modify certain covenants contained in the Credit Agreement.
|
|
(4)
|
The DIP Facility, which terminated with the emergence from the Chapter 11 Cases, provided for borrowings of up to
$450.0 million
. On the Effective Date, the DIP Facility was repaid and canceled and the Successor Company entered into the ABL Facility. As of
December 31, 2019
, the Successor Company had a facility size of
$450.0 million
under iHeartCommunications' ABL Facility, had
no
outstanding borrowings and had
$48.1 million
of outstanding letters of credit, resulting in
$401.9 million
of availability.
|
|
(5)
|
Other secured subsidiary debt consists of finance lease obligations maturing at various dates from
2020
through 2045.
|
|
(6)
|
In connection with the Company's Chapter 11 Cases, the Company's Predecessor long-term debt was reclassified to Liabilities subject to compromise in our Consolidated Balance Sheet as of
December 31, 2018
. As of the Petition Date, the Company ceased making principal and interest payments, and ceased accruing interest expense in relation to long-term debt reclassified as Liabilities subject to compromise.
|
100
IHEARTMEDIA, INC.
AND SUBSIDIARIES
NOTES TO CONSOLIDATED FINANCIAL STATEMENTS
The Company’s weighted average interest rate was
6.4%
and
9.9%
as of
December 31, 2019
(Successor) and
December 31, 2018
(Predecessor), respectively. The aggregate market value of the Company’s debt based on market prices for which quotes were available was approximately
$6.1 billion
and
$8.7 billion
as of
December 31, 2019
(Successor) and
December 31, 2018
(Predecessor), respectively. Under the fair value hierarchy established by ASC 820-10-35, the fair market value of the Successor Company’s debt is classified as either Level 1 or Level 2.
Asset-based Revolving Credit Facility due 2023
On the Effective Date, iHeartCommunications, as borrower, entered into a Credit Agreement (the “ABL Credit Agreement”) with iHeartMedia Capital I, LLC, the direct parent of iHeartCommunications (“Capital I”), as guarantor, certain subsidiaries of iHeartCommunications, as guarantors, Citibank, N.A., as administrative and collateral agent, and the lenders party thereto from time to time, governing the ABL Facility. The ABL Facility includes a letter of credit sub-facility and a swingline loan sub-facility.
Size and Availability
The ABL Facility provides for a senior secured asset-based revolving credit facility in the aggregate principal amount of up to
$450.0 million
, with amounts available from time to time (including in respect of letters of credit) equal to the lesser of (A) the borrowing base, which equals the sum of (i)
90.0%
of the eligible accounts receivable of iHeartCommunications and the subsidiary guarantors and (ii)
100%
of qualified cash, each subject to customary reserves and eligibility criteria, and (B) the aggregate revolving credit commitments. Subject to certain conditions, iHeartCommunications may at any time request one or more increases in the amount of revolving credit commitments, in an amount up to the sum of (x)
$150.0 million
and (y) the amount by which the borrowing base exceeds the aggregate revolving credit commitments.
Interest Rate and Fees
Borrowings under the ABL Facility bear interest at a rate per annum equal to the applicable margin plus, at iHeartCommunications’ option, either (1) a eurocurrency rate or (2) a base rate. The applicable margin for borrowings under the ABL Facility range from
1.25%
to
1.75%
for eurocurrency borrowings and from
0.25%
to
0.75%
for base-rate borrowings, in each case, depending on average excess availability under the ABL Facility based on the most recently ended fiscal quarter.
In addition to paying interest on outstanding principal under the ABL Facility, iHeartCommunications is required to pay a commitment fee to the lenders under the ABL Facility in respect of the unutilized commitments thereunder. The commitment fee rate ranges from
0.25%
to
0.375%
per annum dependent upon average unused commitments during the prior quarter. iHeartCommunications may also pay customary letter of credit fees.
Maturity
Borrowings under the ABL Facility will mature, and lending commitments thereunder will terminate on June 14, 2023.
Prepayments
If at any time, the sum of the outstanding amounts under the ABL Facility exceeds the lesser of (i) the borrowing base and (ii) the aggregate commitments under the facility (such lesser amount, the “line cap”), iHeartCommunications is required to repay outstanding loans and cash collateralize letters of credit in an aggregate amount equal to such excess. iHeartCommunications may voluntarily repay outstanding loans under the ABL Facility at any time without premium or penalty, other than customary “breakage” costs with respect to eurocurrency rate loans. Any voluntary prepayments made by iHeartCommunications will not reduce iHeartCommunications’ commitments under the ABL Facility.
Guarantees and Security
The ABL Facility is guaranteed by, subject to certain exceptions, the guarantors of iHeartCommunications’ Term Loan Facility. All obligations under the ABL Facility, and the guarantees of those obligations, are secured by a perfected security interest in the accounts receivable and related assets of iHeartCommunications’ and the guarantors’ accounts receivable, qualified cash and related assets and proceeds thereof that is senior to the security interest of iHeartCommunications’ Term Loan Facility in such accounts receivable, qualified cash and related assets and proceeds thereof, subject to permitted liens and certain exceptions.
101
IHEARTMEDIA, INC.
AND SUBSIDIARIES
NOTES TO CONSOLIDATED FINANCIAL STATEMENTS
Certain Covenants and Events of Default
If borrowing availability is less than the greater of (a)
$40.0 million
and (b)
10%
of the aggregate commitments under the ABL Facility, in each case, for two consecutive business days (a “Trigger Event”), iHeartCommunications will be required to comply with a minimum fixed charge coverage ratio of at least
1.00
to 1.00, and must continue to comply with this minimum fixed charge coverage ratio for fiscal quarters ending after the occurrence of the Trigger Event until borrowing availability exceeds the greater of (x)
$40.0 million
and (y)
10%
of the aggregate commitments under the ABL Facility, in each case, for 20 consecutive calendar days, at which time the Trigger Event shall no longer be deemed to be occurring.
Term Loan Facility due 2026
On the Effective Date, iHeartCommunications, as borrower, entered into a Credit Agreement (the “Term Loan Credit Agreement”) with Capital I, as guarantor, certain subsidiaries of iHeartCommunications, as guarantors, and Citibank N.A., as administrative and collateral agent, governing the Term Loan Facility. On the Effective Date, iHeartCommunications issued an aggregate of approximately
$3.5 billion
principal amount of senior secured term loans under the Term Loan Facility to certain Claimholders pursuant to the Plan of Reorganization. As described below, on August 7, 2019, the proceeds from the issuance of
$750.0 million
in aggregate principal amount of
5.25%
Senior Secured Notes due 2027 were used, together with cash on hand, to prepay at par
$740.0 million
of borrowings outstanding under the Term Loan Facility due 2026. On November 22, 2019, the proceeds from the issuance of
$500.0 million
in aggregate principal amount of
4.75%
Senior Secured Notes due 2028 were used, together with cash on hand, to prepay at par
$500.0 million
of borrowings outstanding under the Term Loan Facility due 2026. The Term Loan Facility matures on May 1, 2026.
On February 3, 2020, iHeartCommunications made a
$150.0 million
prepayment using cash on hand and entered into an agreement to amend the Term Loan Facility to reduce the interest rate to LIBOR plus a margin of
3.00%
, or the Base Rate (as defined in the Credit Agreement) plus a margin of
2.00%
and to modify certain covenants contained in the Credit Agreement.
Interest Rate and Fees
Term loans under the Term Loan Facility bear interest at a rate per annum equal to the applicable margin plus, at iHeartCommunications’ option, either (1) a base rate or (2) a eurocurrency rate. As of
December 31, 2019
, the applicable margin for such term loans was
3.00%
with respect to base rate loans and
4.00%
with respect to eurocurrency rate loans. Following the amendment made on February 3, 2020, the interest rate was reduced to LIBOR plus a margin of
3.00%
, or the Base Rate plus a margin of
2.00%
.
Collateral and Guarantees
The Term Loan Facility is guaranteed by Capital I and each of iHeartCommunications’ existing and future material wholly-owned restricted subsidiaries, subject to certain exceptions. All obligations under the Term Loan Facility, and the guarantees of those obligations, are secured, subject to permitted liens and other exceptions, by a first priority lien in substantially all of the assets of iHeartCommunications and all of the guarantors’ assets, including a lien on the capital stock of iHeartCommunications and certain of its subsidiaries owned by a guarantor, other than the accounts receivable and related assets of iHeartCommunications and all of the subsidiary guarantors, and by a second priority lien on accounts receivable and related assets securing iHeartCommunications’ ABL Facility.
102
IHEARTMEDIA, INC.
AND SUBSIDIARIES
NOTES TO CONSOLIDATED FINANCIAL STATEMENTS
Prepayments
iHeartCommunications is required to prepay outstanding term loans under the Term Loan Facility, subject to certain exceptions, with:
|
•
|
50%
(which percentage may be reduced to
25%
and to
0%
based upon iHeartCommunications’ first lien leverage ratio) of iHeartCommunications’ annual excess cash flow, subject to customary credits, reductions and exclusions;
|
|
•
|
100%
(which percentage may be reduced to
50%
and
0%
based upon iHeartCommunications’ first lien leverage ratio) of the net cash proceeds of sales or other dispositions of the assets of iHeartCommunications or its wholly owned restricted subsidiaries, subject to reinvestment rights and certain other exceptions; and
|
|
•
|
100%
of the net cash proceeds of any incurrence of debt, other than debt permitted under the Term Loan Facility.
|
iHeartCommunications may voluntarily repay outstanding loans under the Term Loan Facility at any time, without prepayment premium or penalty, except in connection with a repricing event within nine months of the Effective Date and subject to customary “breakage” costs with respect to eurocurrency loans.
Certain Covenants and Events of Default
The Term Loan Facility does not include any financial covenants. However, the Term Loan Facility includes negative covenants that, subject to significant exceptions, limit Capital I’s ability and the ability of its restricted subsidiaries (including iHeartCommunications) to, among other things:
• incur additional indebtedness;
• create liens on assets;
• engage in mergers, consolidations, liquidations and dissolutions;
• sell assets;
• pay dividends and distributions or repurchase Capital I’s capital stock;
• make investments, loans, or advances;
• prepay certain junior indebtedness;
• engage in certain transactions with affiliates;
• amend material agreements governing certain junior indebtedness; and
• change lines of business.
The Term Loan Facility includes certain customary representations and warranties, affirmative covenants and events of default, including but not limited to, payment defaults, breach of representations and warranties, covenant defaults, cross defaults to certain indebtedness, certain bankruptcy-related events, certain events under ERISA, material judgments and a change of control. If an event of default occurs, the lenders under the Term Loan Facility are entitled to take various actions, including the acceleration of all amounts due under the Term Loan Facility and all actions permitted to be taken under the loan documents relating thereto or applicable law.
6.375% Senior Secured Notes due 2026
On the Effective Date, iHeartCommunications entered into an indenture (the “Senior Secured Notes Indenture”) with Capital I, as guarantor, the subsidiary guarantors party thereto, and U.S. Bank National Association, as trustee and collateral agent, governing the
$800.0 million
aggregate principal amount of
6.375%
Senior Secured Notes due 2026 that were issued to certain Claimholders pursuant to the Plan of Reorganization. The
6.375%
Senior Secured Notes mature on May 1, 2026 and bear interest at a rate of
6.375%
per annum, payable semi-annually in arrears on February 1 and August 1 of each year, beginning on February 1, 2020.
The
6.375%
Senior Secured Notes are guaranteed on a senior secured basis by Capital I and the subsidiaries of iHeartCommunications that guarantee the Term Loan Facility or other credit facilities or capital markets debt securities. The
6.375%
Senior Secured Notes and the related guarantees rank equally in right of payment with all of iHeartCommunications’ and the
103
IHEARTMEDIA, INC.
AND SUBSIDIARIES
NOTES TO CONSOLIDATED FINANCIAL STATEMENTS
guarantors’ existing and future indebtedness that is not expressly subordinated to the
6.375%
Senior Secured Notes (including the Senior Unsecured Notes), effectively equal with iHeartCommunications’ and the guarantors’ existing and future indebtedness secured by a first priority lien on the collateral securing the
6.375%
Senior Secured Notes, effectively subordinated in right of payment to all of iHeartCommunications’ and the guarantors’ existing and future indebtedness that is secured by assets that are not part of the collateral securing the
6.375%
Senior Secured Notes, to the extent of the value of such assets, and structurally subordinated in right of payment to all existing and future indebtedness and other liabilities of any subsidiary of iHeartCommunications that is not a guarantor of the
6.375%
Senior Secured Notes.
The
6.375%
Senior Secured Notes and the related guarantees are secured, subject to permitted liens and certain other exceptions, by a first priority lien on the capital stock of iHeartCommunications and substantially all of the assets of iHeartCommunications and the guarantors, other than accounts receivable and related assets, and by a second priority lien on accounts receivable and related assets securing the ABL Facility.
iHeartCommunications may redeem the
6.375%
Senior Secured Notes at its option, in whole or in part, at any time prior to May 1, 2022, at a price equal to
100%
of the principal amount of the
6.375%
Senior Secured Notes being redeemed, plus an applicable premium and plus accrued and unpaid interest to the redemption date. iHeartCommunications may redeem the
6.375%
Senior Secured Notes at its option, in whole or in part, on or after May 1, 2022, at the redemption prices set forth in the
6.375%
Senior Secured Notes Indenture plus accrued and unpaid interest to the redemption date. At any time prior to May 1, 2022, iHeartCommunications may redeem at its option, up to
40%
of the aggregate principal amount of the
6.375%
Senior Secured Notes at a redemption price equal to
106.375%
of the principal amount thereof, plus accrued and unpaid interest to the redemption date, with the proceeds of one or more equity offerings.
The
6.375%
Senior Secured Notes Indenture contains covenants that limit the ability of Capital I and its restricted subsidiaries, including iHeartCommunications, to, among other things:
|
•
|
incur or guarantee additional debt or issue certain preferred stock;
|
|
•
|
create liens on certain assets;
|
|
•
|
redeem, purchase or retire subordinated debt;
|
|
•
|
make certain investments;
|
|
•
|
create restrictions on the payment of dividends or other amounts from iHeartCommunications’ restricted subsidiaries;
|
|
•
|
enter into certain transactions with affiliates;
|
|
•
|
merge or consolidate with another person, or sell or otherwise dispose of all or substantially all of iHeartCommunications’ assets;
|
|
•
|
sell certain assets, including capital stock of iHeartCommunications’ subsidiaries;
|
|
•
|
designate iHeartCommunications’ subsidiaries as unrestricted subsidiaries, and
|
|
•
|
pay dividends, redeem or repurchase capital stock or make other restricted payments.
|
5.25% Senior Secured Notes due 2027
On August 7, 2019, iHeartCommunications entered into an indenture (the “New Senior Secured Notes Indenture”) with Capital I, as guarantor, the subsidiary guarantors party thereto, and U.S. Bank National Association, as trustee and collateral agent, governing the
$750.0 million
aggregate principal amount of
5.25%
Senior Secured Notes due 2027 that were issued in a private placement to qualified institutional buyers under Rule 144A under the Securities Act, and to persons outside the United States pursuant to Regulation S under the Securities Act. The
5.25%
Senior Secured Notes mature on August 15, 2027 and bear interest at a rate of
5.25%
per annum. Interest is payable semi-annually on February 15 and August 15 of each year, beginning on February 15, 2020.
The
5.25%
Senior Secured Notes are guaranteed on a senior secured basis by Capital I and the subsidiaries of iHeartCommunications that guarantee the Term Loan Facility. The
5.25%
Senior Secured Notes and the related guarantees rank equally in right of payment with all of iHeartCommunications’ and the guarantors’ existing and future indebtedness that is not expressly subordinated to the
5.25%
Senior Secured Notes (including the Term Loan Facility, the
6.375%
Senior Secured Notes, the
4.75%
Senior Secured Notes and the Senior Unsecured Notes), effectively equal with iHeartCommunications’ and the guarantors’ existing and future indebtedness secured by a first priority lien on the collateral securing the
5.25%
Senior Secured Notes, effectively subordinated to all of iHeartCommunications’ and the guarantors’ existing and future indebtedness that is secured by assets that are not part of the collateral securing the
5.25%
Senior Secured Notes, to the extent of the value of such collateral, and structurally subordinated
104
IHEARTMEDIA, INC.
AND SUBSIDIARIES
NOTES TO CONSOLIDATED FINANCIAL STATEMENTS
to all existing and future indebtedness and other liabilities of any subsidiary of iHeartCommunications that is not a guarantor of the
5.25%
Senior Secured Notes.
The
5.25%
Senior Secured Notes and the related guarantees are secured, subject to permitted liens and certain other exceptions, by a first priority lien on the capital stock of iHeartCommunications and substantially all of the assets of iHeartCommunications and the guarantors, other than accounts receivable and related assets, and by a second priority lien on accounts receivable and related assets securing the ABL Facility.
iHeartCommunications may redeem the
5.25%
Senior Secured Notes at its option, in whole or part, at any time prior to August 15, 2022, at a price equal to
100%
of the principal amount of the
5.25%
Senior Secured Notes redeemed, plus a make-whole premium, plus accrued and unpaid interest to the redemption date. iHeartCommunications may redeem the
5.25%
Senior Secured Notes, in whole or in part, on or after August 15, 2022, at the redemption prices set forth in the
5.25%
Senior Secured Notes Indenture plus accrued and unpaid interest to the redemption date. At any time on or before August 15, 2022, iHeartCommunications may elect to redeem up to
40%
of the aggregate principal amount of the
5.25%
Senior Secured Notes at a redemption price equal to
105.25%
of the principal amount thereof, plus accrued and unpaid interest to the redemption date, with the net proceeds of one or more equity offerings.
The
5.25%
Senior Secured Notes Indenture contains covenants that limit the ability of iHeartCommunications and its restricted subsidiaries, to, among other things:
|
•
|
incur or guarantee additional debt or issue certain preferred stock;
|
|
•
|
create liens on certain assets;
|
|
•
|
redeem, purchase or retire subordinated debt;
|
|
•
|
make certain investments;
|
|
•
|
create restrictions on the payment of dividends or other amounts from iHeartCommunications’ restricted subsidiaries;
|
|
•
|
enter into certain transactions with affiliates;
|
|
•
|
merge or consolidate with another person, or sell or otherwise dispose of all or substantially all of iHeartCommunications’ assets;
|
|
•
|
sell certain assets, including capital stock of iHeartCommunications’ subsidiaries;
|
|
•
|
designate iHeartCommunications’ subsidiaries as unrestricted subsidiaries, and
|
|
•
|
pay dividends, redeem or repurchase capital stock or make other restricted payments.
|
4.75% Senior Secured Notes due 2028
On November 22, 2019, iHeartCommunications entered into an indenture (the “
4.75%
Senior Secured Notes Indenture”) with Capital I, as guarantor, the subsidiary guarantors party thereto, and U.S. Bank National Association, as trustee and collateral agent, governing the
$500.0 million
aggregate principal amount of
4.75%
Senior Secured Notes due 2028 that were issued in a private placement to qualified institutional buyers under Rule 144A under the Securities Act, and to persons outside the United States pursuant to Regulation S under the Securities Act. The
4.75%
Senior Secured Notes mature on January 15, 2028 and bear interest at a rate of
4.75%
per annum. Interest is payable semi-annually on January 15 and July 15 of each year, beginning on July 15, 2020.
The
4.75%
Senior Secured Notes are guaranteed on a senior secured basis by Capital I and the subsidiaries of iHeartCommunications that guarantee the Term Loan Facility. The
4.75%
Senior Secured Notes and the related guarantees rank equally in right of payment with all of iHeartCommunications’ and the guarantors’ existing and future indebtedness that is not expressly subordinated to the
4.75%
Senior Secured Notes (including the Term Loan Facility, the
6.375%
Senior Secured Notes, the
5.25%
Senior Secured Notes and the Senior Unsecured Notes), effectively equal with iHeartCommunications’ and the guarantors’ existing and future indebtedness secured by a first priority lien on the collateral securing the
4.75%
Senior Secured Notes, effectively subordinated to all of iHeartCommunications’ and the guarantors’ existing and future indebtedness that is secured by assets that are not part of the collateral securing the
4.75%
Senior Secured Notes, to the extent of the value of such collateral, and structurally subordinated to all existing and future indebtedness and other liabilities of any subsidiary of iHeartCommunications that is not a guarantor of the
5.25%
Senior Secured Notes.
The
4.75%
Senior Secured Notes and the related guarantees are secured, subject to permitted liens and certain other exceptions, by a first priority lien on the capital stock of iHeartCommunications and substantially all of the assets of iHeartCommunications
105
IHEARTMEDIA, INC.
AND SUBSIDIARIES
NOTES TO CONSOLIDATED FINANCIAL STATEMENTS
and the guarantors, other than accounts receivable and related assets, and by a second priority lien on accounts receivable and related assets securing the ABL Facility.
iHeartCommunications may redeem the
4.75%
Senior Secured Notes at its option, in whole or part, at any time prior to January 15, 2023, at a price equal to
100%
of the principal amount of the
4.75%
Senior Secured Notes redeemed, plus a make-whole premium, plus accrued and unpaid interest to the redemption date. iHeartCommunications may redeem the
4.75%
Senior Secured Notes, in whole or in part, on or after January 15, 2023, at the redemption prices set forth in the
4.75%
Senior Secured Notes Indenture plus accrued and unpaid interest to the redemption date. At any time on or before November 15, 2022, iHeartCommunications may elect to redeem up to
40%
of the aggregate principal amount of the
4.75%
Senior Secured Notes at a redemption price equal to
104.75%
of the principal amount thereof, plus accrued and unpaid interest to the redemption date, with the net proceeds of one or more equity offerings.
The
4.75%
Senior Secured Notes Indenture contains covenants that limit the ability of iHeartCommunications and its restricted subsidiaries, to, among other things:
|
•
|
incur or guarantee additional debt or issue certain preferred stock;
|
|
•
|
create liens on certain assets;
|
|
•
|
redeem, purchase or retire subordinated debt;
|
|
•
|
make certain investments;
|
|
•
|
create restrictions on the payment of dividends or other amounts from iHeartCommunications’ restricted subsidiaries;
|
|
•
|
enter into certain transactions with affiliates;
|
|
•
|
merge or consolidate with another person, or sell or otherwise dispose of all or substantially all of iHeartCommunications’ assets;
|
|
•
|
sell certain assets, including capital stock of iHeartCommunications’ subsidiaries;
|
|
•
|
designate iHeartCommunications’ subsidiaries as unrestricted subsidiaries, and
|
|
•
|
pay dividends, redeem or repurchase capital stock or make other restricted payments.
|
8.375% Senior Unsecured Notes due 2027
On the Effective Date, iHeartCommunications entered into an indenture (the “Senior Unsecured Notes Indenture”) with Capital I, as guarantor, the subsidiary guarantors party thereto, and U.S. Bank National Association, as trustee, governing the
$1,450.0 million
aggregate principal amount of
8.375%
Senior Notes due 2027 that were issued to certain Claimholders pursuant to the Plan of Reorganization. The Senior Unsecured Notes mature on May 1, 2027 and bear interest at a rate of
8.375%
per annum, payable semi-annually in arrears on May 1 and November 1 of each year, beginning on November 1, 2019.
The Senior Unsecured Notes are guaranteed on a senior unsecured basis by Capital I and the subsidiaries of iHeartCommunications that guarantee the Term Loan Facility or other credit facilities or capital markets debt securities. The Senior Unsecured Notes and the related guarantees rank equally in right of payment with all of iHeartCommunications’ and the guarantors’ existing and future indebtedness that is not expressly subordinated to the Senior Unsecured Notes, effectively subordinated in right of payment to all of iHeartCommunications’ and the guarantors’ existing and future indebtedness that is secured (including the
6.375%
Senior Secured Notes, the
5.25%
Senior Secured Notes, the
4.75%
Senior Secured Notes and borrowings under the ABL Facility and the Term Loan Facility), to the extent of the value of the collateral securing such indebtedness, and structurally subordinated in right of payment to all existing and future indebtedness and other liabilities of any subsidiary of iHeartCommunications that is not a guarantor of the Senior Unsecured Notes.
iHeartCommunications may redeem the Senior Unsecured Notes at its option, in whole or in part, at any time prior to May 1, 2022, at a price equal to
100%
of the principal amount of the Senior Unsecured Notes being redeemed, plus an applicable premium and plus accrued and unpaid interest to the redemption date. iHeartCommunications may redeem the Senior Unsecured Notes at its option, in whole or in part, on or after May 1, 2022, at the redemption prices set forth in the Senior Unsecured Notes Indenture plus accrued and unpaid interest to the redemption date. At any time prior to May 1, 2022, iHeartCommunications redeem at its option, up to
40%
of the aggregate principal amount of the Senior Unsecured Notes at a redemption price equal to
108.375%
of the principal amount thereof, plus accrued and unpaid interest to the redemption date, with the proceeds of one or more equity offerings.
106
IHEARTMEDIA, INC.
AND SUBSIDIARIES
NOTES TO CONSOLIDATED FINANCIAL STATEMENTS
The Senior Unsecured Notes Indenture contains covenants that limit the ability of Capital I and its restricted subsidiaries, including iHeartCommunications, to, among other things:
|
•
|
incur or guarantee additional debt or issue certain preferred stock;
|
|
•
|
create liens on certain assets;
|
|
•
|
redeem, purchase or retire subordinated debt;
|
|
•
|
make certain investments;
|
|
•
|
create restrictions on the payment of dividends or other amounts from iHeartCommunications’ restricted subsidiaries;
|
|
•
|
enter into certain transactions with affiliates;
|
|
•
|
merge or consolidate with another person, or sell or otherwise dispose of all or substantially all of iHeartCommunications’ assets;
|
|
•
|
sell certain assets, including capital stock of iHeartCommunications’ subsidiaries;
|
|
•
|
designate iHeartCommunications’ subsidiaries as unrestricted subsidiaries, and
|
|
•
|
pay dividends, redeem or repurchase capital stock or make other restricted payments.
|
Mandatorily Redeemable Preferred Stock
On the Effective Date, in accordance with the Plan of Reorganization, iHeart Operations issued
60,000
shares of its Series A Perpetual Preferred Stock, par value
$0.001
per share (the "iHeart Operations Preferred Stock"), having an aggregate initial liquidation preference of
$60.0 million
for a cash purchase price of
$60.0 million
. The iHeart Operations Preferred Stock was purchased by a third party investor. As of December 31, 2019, the liquidation preference of the iHeart Operations Preferred Stock was
$60.0 million
. As further described below, the iHeart Operations Preferred Stock is mandatorily redeemable for cash at a date certain and therefore is classified as a liability in the Company's balance sheet.
There are no sinking fund provisions applicable to the iHeart Operations Preferred Stock. Shares of the iHeart Operations Preferred Stock, upon issuance, were fully paid and non-assessable. The shares of the iHeart Operations Preferred Stock are not convertible into, or exchangeable for, shares of any other class or series of stock or other securities of iHeart Operations. The holders of shares of the iHeart Operations Preferred Stock have no pre-emptive rights with respect to any shares of our capital stock or any of iHeart Operations’ other securities convertible into or carrying rights or options to purchase any such capital stock.
Holders of the iHeart Operations Preferred Stock are entitled to receive, as declared by the board of directors of iHeart Operations, in respect of each share, cumulative dividends accruing daily and payable quarterly at a per annum rate equal to the sum of (1) the greater of (a) LIBOR and (b)
two
percent, plus (2) the applicable margin, which is calculated as a function of iHeartMedia’s consolidated total leverage ratio. Dividends are payable on the liquidation preference. Unless all accrued and unpaid dividends on the iHeart Operations Preferred Stock are paid in full, no dividends or distributions may be paid on any equity interests of iHeartMedia or its subsidiaries other than iHeart Operations, and no such equity interests may be repurchased or redeemed (subject to certain exceptions that are specified in the certificate of designation for the iHeart Operations Preferred Stock). Dividends, if declared, will be payable on March 31, June 30, September 30 and December 31 of each year (or on the next business day if such date is not a business day). During the period from May 1, 2019 through
December 31, 2019
the Company recognized
$5.5 million
, respectively, of interest expense related to dividends on mandatorily redeemable preferred stock.
Other than as set forth below, iHeart Operations may not redeem the iHeart Operations Preferred Stock at its option prior to the third anniversary of the issue date of the iHeart Operations Preferred Stock. Upon consummation of certain equity offerings, iHeart Operations may, at its option, redeem all or a part of the iHeart Operations Preferred Stock for the liquidation preference plus a make-whole premium. At any time on or after the third anniversary of the issue date, the iHeart Operations Preferred Stock may be redeemed at the option of iHeart Operations, in whole or in part, for cash at a redemption price equal to the liquidation preference per share.
Upon (i) a liquidation, dissolution or winding up of iHeart Operations, iHeartMedia or iHeartCommunications, together with the subsidiaries of such entity, taken as a whole, (ii) a bankruptcy event, (iii) a change of control, (iv) a sale or transfer of all or substantially all of iHeart Operations’, iHeartMedia’s or iHeartCommunications’ assets and the assets of such entity’s subsidiaries, taken as a whole in a single transaction (other than to iHeartMedia or any of its subsidiaries), or a series of transactions, (v) an acceleration or payment default of indebtedness of iHeart Operations, iHeartMedia or any of its subsidiaries of
$100 million
or more or (vi) consummation of certain equity offerings of iHeartMedia, iHeart Operations or iHeartCommunications or certain significant subsidiaries, then any holder of shares of iHeart Operations Preferred Stock may require iHeartMedia to purchase such
107
IHEARTMEDIA, INC.
AND SUBSIDIARIES
NOTES TO CONSOLIDATED FINANCIAL STATEMENTS
holder’s shares of iHeart Operations Preferred Stock at a purchase price equal to (a) the liquidation preference plus a make-whole premium, if such purchase is consummated prior to the third anniversary of the issue date or (b) the liquidation preference, if the purchase is consummated on or after the third anniversary of the issue date.
The shares of iHeart Operations Preferred Stock include repurchase rights, pursuant to which the holders may require iHeartMedia or iHeartCommunications to purchase the iHeart Operations Preferred Stock after the fifth anniversary of the issue date.
On the tenth anniversary of the issue date, the shares of iHeart Operations Preferred Stock will be subject to mandatory redemption for an amount equal to the liquidation preference.
If a default occurs or dividends payable on the shares of iHeart Operations Preferred Stock have not been paid in cash for twelve consecutive quarters, the holders of the iHeart Operations Preferred Stock will have the right, voting as a class, to elect one director to iHeartMedia’s Board of Directors. Upon any termination of the rights of the holders of shares of the iHeart Operations Preferred Stock as a class to vote for a director as described above, the director so elected to iHeartMedia’s Board of Directors will cease to be qualified as a director and the term of such director’s office shall terminate immediately.
Future Maturities of Long-term Debt
Future maturities of long-term debt at
December 31, 2019
are as follows:
|
(in thousands)
|
|||
|
2020
|
$
|
8,912
|
|
|
2021
|
8,320
|
|
|
|
2022
|
2,802
|
|
|
|
2023
|
2,441
|
|
|
|
2024
|
2,334
|
|
|
|
Thereafter
|
5,760,035
|
|
|
|
Total
(1)(2)
|
$
|
5,784,844
|
|
|
(1)
|
Excludes long-term debt fees of
$19.4 million
, which are amortized through interest expense over the life of the underlying debt obligations.
|
|
(2)
|
Effective February 3, 2020 with the amendment to the Term Loan Facility, the Company is required to make quarterly prepayments of
$5.3 million
beginning in March 2020. In addition, the Company made a
$150.0 million
prepayment of the Term Loan Facility using cash on hand. Such prepayments are not reflected in the table above.
|
Surety Bonds and Letters of Credit
As of
December 31, 2019
,
iHeartCommunications
had outstanding surety bonds and commercial standby letters of credit of
$17.1 million
and
$48.1 million
, respectively. Included within the Successor Company's outstanding commercial standby letters of credit were
$0.9 million
held on behalf of CCOH. These surety bonds and letters of credit relate to various operational matters including insurance, lease and performance bonds as well as other items.
NOTE 10 – COMMITMENTS AND CONTINGENCIES
Commitments and Contingencies
The Company accounts for its rentals that include renewal options, annual rent escalation clauses, minimum franchise payments and maintenance related to displays under the guidance in ASC 842.
The Company accounts for annual rent escalation clauses included in the lease term on a straight-line basis under the guidance in ASC 840-20-25. The Company considers renewal periods in determining its lease terms if at inception of the lease there is reasonable assurance the lease will be renewed. Expenditures for maintenance are charged to operations as incurred, whereas expenditures for renewal and betterments are capitalized. Non-cancelable contracts that provide the lessor with a right to fulfill
108
IHEARTMEDIA, INC.
AND SUBSIDIARIES
NOTES TO CONSOLIDATED FINANCIAL STATEMENTS
the arrangement with property, plant and equipment not specified within the contract are not a lease and have been included within non-cancelable contracts within the table below.
The Company leases office space, certain broadcasting facilities and equipment under long-term operating leases. The Company accounts for these leases in accordance with the policies described above.
As of
December 31, 2019
, the Company's future minimum rental commitments under non-cancelable operating lease agreements with terms in excess of one year, minimum payments under non-cancelable contracts in excess of one year, capital expenditure commitments and employment/talent contracts consist of the following:
|
(In thousands)
|
|||||||||||
|
Non-Cancelable
|
Non-Cancelable
|
Employment/Talent
|
|||||||||
|
Operating Leases
|
Contracts
|
Contracts
|
|||||||||
|
2020
|
$
|
129,324
|
|
$
|
134,440
|
|
$
|
91,868
|
|
||
|
2021
|
131,059
|
|
31,442
|
|
89,903
|
|
|||||
|
2022
|
124,343
|
|
5,784
|
|
69,324
|
|
|||||
|
2023
|
110,721
|
|
1,775
|
|
35,175
|
|
|||||
|
2024
|
100,667
|
|
1,175
|
|
35,160
|
|
|||||
|
Thereafter
|
762,811
|
|
2,334
|
|
—
|
|
|||||
|
Total
|
$
|
1,358,925
|
|
$
|
176,950
|
|
$
|
321,430
|
|
||
Rent expense charged to operations for the period from May 2, 2019 through
December 31, 2019
(Successor), the period from January 1, 2019 through May 1, 2019 (Predecessor), the year ended December 31,
2018
(Predecessor) and the year ended December 31,
2017
(Predecessor) was
$128.3 million
,
$59.2 million
,
$169.9 million
and
$173.4 million
, respectively.
The Company and its subsidiaries are involved in certain legal proceedings arising in the ordinary course of business and, as required, have accrued an estimate of the probable costs for the resolution of those claims for which the occurrence of loss is probable and the amount can be reasonably estimated. These estimates have been developed in consultation with counsel and are based upon an analysis of potential results, assuming a combination of litigation and settlement strategies. It is possible, however, that future results of operations for any particular period could be materially affected by changes in the Company’s assumptions or the effectiveness of its strategies related to these proceedings. Additionally, due to the inherent uncertainty of litigation, there can be no assurance that the resolution of any particular claim or proceeding would not have a material adverse effect on the Company’s financial condition or results of operations.
Although the Company is involved in a variety of legal proceedings in the ordinary course of business, a large portion of its litigation arises in the following contexts: commercial disputes; defamation matters; employment and benefits related claims; governmental fines; intellectual property claims; and tax disputes.
Chapter 11 Cases
iHeartCommunications' filing of the Chapter 11 Cases constituted an event of default that accelerated its obligations under its debt agreements. Due to the Chapter 11 Cases, however, the creditors' ability to exercise remedies under iHeartCommunications' debt agreements were stayed as of March 14, 2018, the Petition Date. On March 21, 2018, Wilmington Savings Fund Society, FSB ("WSFS"), solely in its capacity as successor indenture trustee to the
6.875%
Senior Notes due 2018 and
7.25%
Senior Notes due 2027, and not in its individual capacity, filed an adversary proceeding against the Company in the Chapter 11 Cases. In the complaint, WSFS alleged, among other things, that the "springing lien" provisions of the priority guarantee notes indentures and the priority guarantee notes security agreements amounted to "hidden encumbrances" on the Company's property, to which the holders of the
6.875%
Senior Notes due 2018 and
7.25%
Senior Notes due 2027 were entitled to "equal and ratable" treatment. On March 26, 2018, Delaware Trust Co. ("Delaware Trust"), in its capacity as successor indenture trustee to the
14%
Senior Notes due 2021, filed a motion to intervene as a plaintiff in the adversary proceeding filed by WSFS. In the complaint, Delaware Trust alleged, among other things, that the indenture governing the
14%
Senior Notes due 2021 also had its own "negative pledge" covenant, and, therefore, to the extent the relief sought by WSFS in its adversary proceeding was warranted, the holders of the
14%
Senior Notes due 2021 would also be entitled to the same "equal and ratable" liens on the same property. On January 15, 2019, the Bankruptcy Court entered judgment in the Company's favor denying all relief sought by WSFS and all other parties. Pursuant to
109
IHEARTMEDIA, INC.
AND SUBSIDIARIES
NOTES TO CONSOLIDATED FINANCIAL STATEMENTS
a settlement (the “Legacy Plan Settlement”) with WSFS and certain consenting Legacy Noteholders of all issues related to confirmation of the Plan of Reorganization, on May 1, 2019 upon the Company's confirmed Plan of Reorganization becoming effective, this adversary proceeding was deemed withdrawn and/or dismissed, with respect to all parties thereto, with prejudice and in its entirety.
On October 9, 2018, WSFS, solely in its capacity as successor indenture trustee to the
6.875%
Senior Notes due 2018 and
7.25%
Senior Notes due 2027, and not in its individual capacity, filed an adversary proceeding against Clear Channel Holdings, Inc. (“CCH”) and certain shareholders of iHeartMedia. The named shareholder defendants were Bain Capital LP; Thomas H. Lee Partners L.P.; Abrams Capital L.P.; and Highfields Capital Management L.P. In the complaint, WSFS alleged, among other things, that the shareholder defendants engaged in a “pattern of inequitable and bad faith conduct, including the abuse of their insider positions to benefit themselves at the expense of third-party creditors including particularly the Legacy Noteholders.” The complaint asked the court to grant relief in the form of equitable subordination of the shareholder defendants’ term loan, priority guarantee notes and 2021 notes claims to any and all claims of the legacy noteholders. In addition, the complaint sought to have any votes to accept the Plan of Reorganization by Abrams and Highfields on account of their 2021 notes claims, and any votes to accept the Plan of Reorganization by defendant CCH on account of its junior notes claims, to be designated and disqualified. On May 1, 2019, pursuant to the Legacy Plan Settlement, upon the Company's confirmed Plan of Reorganization becoming effective, this adversary proceeding was deemed withdrawn and/or dismissed, with respect to all parties thereto, with prejudice and in its entirety.
Stockholder Litigation
On May 9, 2016, a stockholder of CCOH filed a derivative lawsuit in the Court of Chancery of the State of Delaware, captioned GAMCO Asset Management Inc. v. iHeartMedia, Inc. et al., C.A. No. 12312-VCS. The complaint named as defendants the Company, iHeartCommunications, Bain Capital Partners, LLC and Thomas H. Lee Partners, L.P.,
the Company's
pre-bankruptcy private equity sponsors and pre-bankruptcy majority owners (together, the "Former Sponsor Defendants"), and the members of CCOH's board of directors. CCOH also was named as a nominal defendant. The complaint alleged that CCOH had been harmed by the intercompany agreements with
iHeartCommunications
, CCOH’s lack of autonomy over its own cash and the actions of the defendants in serving the interests of
the Company, iHeartCommunications
and the Former Sponsor Defendants to the detriment of CCOH and its minority stockholders.
On November 23, 2016, the Court granted defendants' motion to dismiss all claims brought by the plaintiff, which was appealed. On October 12, 2017, the Supreme Court of Delaware affirmed the lower court's ruling, dismissing the case.
On December 29, 2017, another stockholder of CCOH filed a derivative lawsuit (the “Norfolk Lawsuit”) in the Court of Chancery of the State of Delaware, captioned Norfolk County Retirement System, v. iHeartMedia, Inc., et al., C.A. No. 2017-0930-JRS. The complaint named as defendants the Company, iHeartCommunications, the Former Sponsor Defendants, and the members of CCOH's board of directors. CCOH was named as a nominal defendant. The complaint alleged that CCOH had been harmed by the CCOH Board’s November 2017 decision to extend the maturity date of the intercompany revolving note (the “Third Amendment”) at what the complaint described as far-below-market interest rates.
On March 7, 2018, the defendants filed a motion to dismiss plaintiff's verified derivative complaint for failure to state a claim upon which relief can be granted. On March 16, 2018, the Company filed a Notice of Suggestion of Pendency of Bankruptcy and Automatic Stay of Proceedings. Oral argument on the motion to dismiss was held on September 20, 2018.
On August 27, 2018, the same stockholder of CCOH that had filed a derivative lawsuit against the Company and others in 2016 (GAMCO Asset Management Inc.) filed a putative class action lawsuit (the “GAMCO II Lawsuit”) in the Court of Chancery of the State of Delaware, captioned GAMCO Asset Management, Inc. v. Hendrix, et al., C.A. No. 2018-0633-JRS. The complaint named as defendants the Former Sponsor Defendants and the members of CCOH’s board of directors. The complaint alleged that minority shareholders in CCOH during the period November 8, 2017 to March 14, 2018 were harmed by decisions of the CCOH Board and the intercompany note committee of the Board relating to the Intercompany Note.
On December 16, 2018, the Debtors, CCOH, GAMCO Asset Management, Inc., and Norfolk County Retirement System entered into a settlement (the “CCOH Separation Settlement”) of all claims, objections, and other causes of action that have been or could be asserted by or on behalf of CCOH, GAMCO Asset Management, Inc., and/or Norfolk County Retirement System by and among the Debtors, CCOH, GAMCO Asset Management, Inc., certain individual defendants in the GAMCO Asset Management, Inc. action and/or the Norfolk County Retirement System action, and the Former Sponsor Defendants in such actions. The CCOH Separation Settlement provided for the consensual separation of the Debtors and CCOH, including approximately
$149.0 million
of recovery to CCOH on account of its claim against iHeartCommunications in the Chapter 11 cases, a
$200 million
unsecured
110
IHEARTMEDIA, INC.
AND SUBSIDIARIES
NOTES TO CONSOLIDATED FINANCIAL STATEMENTS
revolving line of credit from certain of the Debtors to CCOH for a period of up to
three years
, the transfer of certain of the Debtors’ intellectual property to CCOH, the waiver by the Debtors of the setoff for the value of the transferred intellectual property, mutual releases, the termination of the cash sweep under the existing Corporate Services Agreement, the termination of any agreements or licenses requiring royalty payments from CCOH to the Debtors for trademarks or other intellectual property, the waiver of any post-petition amounts owed by CCOH relating to such trademarks or other intellectual property, and the execution of a new transition services agreement and other separation documents. The CCOH Separation Settlement was approved by the Bankruptcy Court and the United States District Court for the Southern District of Texas on January 22, 2019. On May 1, 2019, the Debtors’ Plan of Reorganization went effective, and the Norfolk Lawsuit and GAMCO II Lawsuit were each subsequently dismissed with prejudice.
NOTE 11 – INCOME TAXES
As a result of steps in the Plan of Reorganization described in Note 2 and the fresh start accounting adjustments described in Note 3, there were significant tax adjustments recorded in the period from January 1, 2019 through May 1, 2019. The Company recorded income tax benefits of
$102.9 million
for reorganization adjustments in the Predecessor period, primarily consisting of: (1)
$483.0 million
in tax expense for the reduction in federal and state net operating loss (“NOL”) carryforwards from the cancellation of debt income ("CODI") realized upon emergence; (2)
$275.2 million
in tax benefit for the reduction in deferred tax liabilities attributed primarily to long-term debt that was discharged upon emergence; (3)
$62.3 million
in tax benefit for the effective settlement of liabilities for unrecognized tax benefits that were discharged upon emergence; and (4)
$263.8 million
in tax benefit for the reduction in valuation allowance resulting from the adjustments described above. The Company recorded income tax expense of
$185.4 million
for fresh start adjustments in the Predecessor period, consisting of
$529.1 million
tax expense for the increase in deferred tax liabilities resulting from fresh start accounting adjustments, which was partially offset by
$343.7 million
tax benefit for the reduction in the valuation allowance on our deferred tax assets.
Significant components of the provision for income tax benefit (expense) from continuing operations are as follows:
|
(In thousands)
|
Successor Company
|
Predecessor Company
|
||||||||||||||
|
|
Period from May 2, 2019 through December 31,
|
Period from January 1, 2019 through May 1,
|
Year Ended December 31,
|
|||||||||||||
|
2019
|
2019
|
2018
|
2017
|
|||||||||||||
|
Current - Federal
|
$
|
(172
|
)
|
$
|
2,264
|
|
$
|
1
|
|
$
|
(2,049
|
)
|
||||
|
Current - foreign
|
(754
|
)
|
(282
|
)
|
(969
|
)
|
(729
|
)
|
||||||||
|
Current - state
|
(10,045
|
)
|
74,762
|
|
(9,225
|
)
|
2,861
|
|
||||||||
|
Total current benefit (expense)
|
(10,971
|
)
|
76,744
|
|
(10,193
|
)
|
83
|
|
||||||||
|
Deferred - Federal
|
(14,470
|
)
|
(109,511
|
)
|
1,276
|
|
185,161
|
|
||||||||
|
Deferred - foreign
|
23
|
|
(8
|
)
|
(1
|
)
|
(12
|
)
|
||||||||
|
Deferred - state
|
5,327
|
|
(6,320
|
)
|
(4,918
|
)
|
(8,044
|
)
|
||||||||
|
Total deferred benefit (expense)
|
(9,120
|
)
|
(115,839
|
)
|
(3,643
|
)
|
177,105
|
|
||||||||
|
Income tax benefit (expense)
|
$
|
(20,091
|
)
|
$
|
(39,095
|
)
|
$
|
(13,836
|
)
|
$
|
177,188
|
|
||||
The current tax
expense
of
$11.0 million
recorded in the Successor period from May 2, 2019 through December 31, 2019 was primarily related to state income taxes on operating profits generated in certain state jurisdictions during the period. The federal current tax expense for the Successor period was not significant due to the net operating loss carryforwards that were available to offset taxable income.
The current tax benefit of
$76.7 million
recorded for the Predecessor period from January 1, 2019 through May 1, 2019 relates primarily to the effective settlement of liabilities for unrecognized tax benefits that were discharged upon the Company's emergence from bankruptcy for certain state jurisdictions.
111
IHEARTMEDIA, INC.
AND SUBSIDIARIES
NOTES TO CONSOLIDATED FINANCIAL STATEMENTS
Current tax
expense
for the Predecessor period ended December 31, 2018 was
$10.2 million
compared to a current tax
benefit
of
$0.1 million
for the same period in
2017
. The current tax expense recorded in 2018 was primarily related to state income tax expense and exceeded the amount in 2017 due to current tax benefits recorded for effectively settled tax examinations and statute of limitations expiring for certain state filings.
The deferred tax expense of
$9.1 million
recorded in the Successor period from May 2, 2019 through December 31, 2019 related primarily to the utilization of federal and state net operating loss carryforwards which offset taxable income during the period.
The deferred tax expense of
$115.8 million
recorded in the Predecessor period from January 1, 2019 through May 1, 2019 related primarily to the impact of reorganization and fresh start adjustments described above.
Deferred tax
expense
for the Predecessor period ended December 31, 2018 was
$3.6 million
compared with deferred tax benefit of
$177.1 million
for the same period in
2017
. The decrease in deferred tax benefit during 2018 was primarily attributed to the
$282.1 million
deferred tax benefit recorded in connection with the remeasurement of our U.S. deferred tax balances upon the enactment of the Tax Cuts and Jobs Act.
Significant components of the Company's deferred tax liabilities and assets as of
December 31, 2019
(Successor) and
2018
(Predecessor) are as follows:
|
Successor Company
|
Predecessor Company
|
|||||||
|
(In thousands)
|
2019
|
2018
|
||||||
|
Deferred tax liabilities:
|
||||||||
|
Intangibles and fixed assets
|
$
|
1,163,310
|
|
$
|
681,030
|
|
||
|
Long-term debt
|
—
|
|
259,324
|
|
||||
|
Investments
|
—
|
|
319
|
|
||||
|
Operating lase right-of-use assets
|
130,123
|
|
—
|
|
||||
|
Other
|
—
|
|
4,031
|
|
||||
|
Total deferred tax liabilities
|
1,293,433
|
|
944,704
|
|
||||
|
Deferred tax assets:
|
||||||||
|
Accrued expenses
|
24,525
|
|
80,997
|
|
||||
|
Net operating loss carryforwards
|
167,008
|
|
621,528
|
|
||||
|
Interest expense carryforwards
|
324,481
|
|
280,745
|
|
||||
|
Operating lease liability
|
109,503
|
|
—
|
|
||||
|
Capital loss carryforwards
|
601,309
|
|
—
|
|
||||
|
Investments
|
26,071
|
|
—
|
|
||||
|
Bad debt reserves
|
9,916
|
|
8,731
|
|
||||
|
Other
|
13,799
|
|
1,318
|
|
||||
|
Total gross deferred tax assets
|
1,276,612
|
|
993,319
|
|
||||
|
Less: Valuation allowance
|
720,622
|
|
693,541
|
|
||||
|
Total deferred tax assets
|
555,990
|
|
299,778
|
|
||||
|
Net deferred tax liabilities
|
$
|
737,443
|
|
$
|
644,926
|
|
||
The deferred tax liability related to intangibles and fixed assets primarily relates to the difference in book and tax basis of FCC licenses and other intangible assets that were adjusted for book purposes to estimated fair values as part of the application of fresh start accounting. In accordance with ASC 350-10,
Intangibles—Goodwill and Other
, the Company does not amortize FCC licenses. As a result, this deferred tax liability will not reverse over time unless the Company recognizes future impairment charges or sells its FCC licenses. As the Company continues to amortize its tax basis in its FCC licenses, the deferred tax liability will increase
112
IHEARTMEDIA, INC.
AND SUBSIDIARIES
NOTES TO CONSOLIDATED FINANCIAL STATEMENTS
over time. The Company’s net foreign deferred tax assets for the period ending December 31,
2019
were
$0.3 million
and the net foreign deferred tax liabilities for the period ending December 31,
2018
were
$2.9 million
.
At
December 31, 2019
, the Successor Company had recorded net operating loss carryforwards (tax effected) for federal and state income tax purposes of approximately
$167.0 million
, expiring in various amounts through 2039 or in some cases with no expiration date. In connection with the tax reform legislation passed in December of 2017, Section 163(j) of the Internal Revenue Code was amended, thereby establishing new rules governing a U.S. taxpayer’s ability to deduct interest expense beginning in 2018. Section 163(j), as amended, generally limits the deduction for business interest expense to thirty percent of adjusted taxable income, and provides that any disallowed interest expense may be carried forward indefinitely. In applying the new rules under Section 163(j), the Successor Company recorded a deferred tax asset for federal and state interest limitation carryforward of
$324.5 million
as of December 31, 2019. In connection with the taxable separation of the Outdoor division as part of the restructuring, the Successor Company realized a
$2.4 billion
capital loss (gross after attribute reduction calculations). For federal tax purposes the capital loss can be carried forward
5 years
and only be used to offset capital gains. For state tax purposes, the capital loss has various carryforward periods. The Successor Company has recorded a full valuation allowance against the deferred tax asset associated with the federal and state capital loss carryforward as it is not expected to be realized. The Successor Company expects to realize the benefits of a portion of its remaining deferred tax assets based upon expected future taxable income from deferred tax liabilities that reverse in the relevant federal and state jurisdictions and carryforward periods. As of
December 31, 2019
, the Successor Company had recorded a valuation allowance of
$720.6 million
against a portion of these U.S. federal and state deferred tax assets which it does not expect to realize, relating primarily to capital loss carryforwards and certain state net operating loss carryforwards. After considering the deferred tax adjustments in connection with the utilization of net operating losses, the creation of interest limitation carryforwards, the creation of the capital loss carryforward and the fresh start accounting adjustments to the Successor Company's U.S. federal and state deferred tax valuation allowance increased by
$1.1 million
during the Successor period of May 2, 2019 through December 31, 2019. Any deferred tax liabilities associated with acquired FCC licenses and tax-deductible goodwill intangible assets are now relied upon as sources of future taxable income for those carryforwards that have an indefinite life such as the Section 163(j) interest carryforward.
At
December 31, 2019
, net deferred tax liabilities include a deferred tax asset of
$2.3 million
relating to stock-based compensation expense under ASC 718-10,
Compensation—Stock Compensation
. Full realization of this deferred tax asset requires stock options to be exercised at a price equal to or exceeding the sum of the grant price plus the fair value of the option at the grant date and restricted stock to vest at a price equaling or exceeding the fair market value at the grant date. Accordingly, there can be no assurance that the stock price of the Successor Company’s common stock will rise to levels sufficient to realize the entire deferred tax benefit currently reflected in its balance sheet.
The reconciliations of income tax on income (loss) from continuing operations computed at the U.S. federal statutory tax rates to the recorded income tax benefit (expense) for the Successor Company and Predecessor Company are:
|
Successor Company
|
||||||
|
(In thousands)
|
Period from May 2, 2019 through December 31,
|
|||||
|
|
2019
|
|||||
|
Amount
|
Percent
|
|||||
|
Income tax benefit at statutory rates
|
$
|
(28,012
|
)
|
21.0
|
%
|
|
|
State income taxes, net of federal tax effect
|
(4,718
|
)
|
3.5
|
%
|
||
|
Foreign income taxes
|
(1,593
|
)
|
1.2
|
%
|
||
|
Nondeductible items
|
(7,345
|
)
|
5.5
|
%
|
||
|
Changes in valuation allowance and other estimates
|
24,439
|
|
(18.2
|
)%
|
||
|
Other, net
|
(2,862
|
)
|
2.1
|
%
|
||
|
Income tax benefit (expense)
|
$
|
(20,091
|
)
|
15.1
|
%
|
|
113
IHEARTMEDIA, INC.
AND SUBSIDIARIES
NOTES TO CONSOLIDATED FINANCIAL STATEMENTS
|
Predecessor Company
|
||||||||||||||||||||
|
Period from January 1, 2019 through May 1,
|
Years Ended December 31,
|
|||||||||||||||||||
|
(In thousands)
|
2019
|
2018
|
2017
|
|||||||||||||||||
|
Amount
|
Percent
|
Amount
|
Percent
|
Amount
|
Percent
|
|||||||||||||||
|
Income tax benefit at statutory rates
|
$
|
(1,999,008
|
)
|
21.0
|
%
|
$
|
5,069
|
|
21.0
|
%
|
$
|
291,619
|
|
35.0
|
%
|
|||||
|
State income taxes, net of federal tax effect
|
68,442
|
|
(0.7
|
)%
|
(14,958
|
)
|
(62.0
|
)%
|
(15,711
|
)
|
(1.9
|
)%
|
||||||||
|
Foreign income taxes
|
(270
|
)
|
—
|
%
|
(3,076
|
)
|
(12.7
|
)%
|
(572
|
)
|
(0.1
|
)%
|
||||||||
|
Nondeductible items
|
(1,793
|
)
|
—
|
%
|
(4,834
|
)
|
(20.0
|
)%
|
(6,012
|
)
|
(0.7
|
)%
|
||||||||
|
Changes in valuation allowance and other estimates
|
648,384
|
|
(6.8
|
)%
|
10,958
|
|
45.4
|
%
|
(202,018
|
)
|
(24.2
|
)%
|
||||||||
|
U.S. tax reform
|
—
|
|
—
|
%
|
—
|
|
—
|
%
|
282,053
|
|
33.9
|
%
|
||||||||
|
Tax impact of outdoor charges eliminated in discontinued operations
|
—
|
|
—
|
%
|
(8,017
|
)
|
(33.2
|
)%
|
(172,472
|
)
|
(20.7
|
)%
|
||||||||
|
Reorganization and fresh start adjustments
|
1,245,282
|
|
(13.1
|
)%
|
—
|
|
—
|
%
|
—
|
|
—
|
%
|
||||||||
|
Other, net
|
(132
|
)
|
—
|
%
|
1,022
|
|
4.2
|
%
|
301
|
|
—
|
%
|
||||||||
|
Income tax benefit (expense)
|
$
|
(39,095
|
)
|
0.4
|
%
|
$
|
(13,836
|
)
|
(57.3
|
)%
|
$
|
177,188
|
|
21.3
|
%
|
|||||
The Successor Company’s effective tax rate for the period from May 2, 2019 through
December 31, 2019
is
15.1%
. The effective tax rate for the Successor period was primarily impacted by deferred tax benefits recorded for changes in estimates related to the carryforward tax attributes that are expected to survive the emergence from bankruptcy and deferred tax adjustments associated with the filing of the Company’s 2018 tax returns during the fourth quarter of 2019. The primary change to the 2018 tax return filings, when compared to the provision estimates, was the Company's decision to elect out of the first-year bonus depreciation rules for the 2018 year for all qualified capital expenditures. This resulted in less tax depreciation deductions for tax purposes for the 2018 year and higher adjusted tax basis for our fixed assets as of the Effective Date.
The Predecessor Company’s effective tax rate for the period from January 1, 2019 through May 1, 2019 is
0.4%
. The income tax expense for the period from January 1, 2019 through May 1, 2019 (Predecessor) primarily consists of the income tax impacts from reorganization and fresh start adjustments, including adjustments to our valuation allowance. The Company recorded income tax benefits of
$102.9 million
for reorganization adjustments in the Predecessor period, primarily consisting of: (1) tax expense for the reduction in federal and state net operating loss (“NOL”) carryforwards from the cancellation of debt income ("CODI") realized upon emergence; (2) tax benefit for the reduction in deferred tax liabilities attributed primarily to long-term debt that was discharged upon emergence; (3) tax benefit for the effective settlement of liabilities for unrecognized tax benefits that were discharged upon emergence; and (4) tax benefit for the reduction in valuation allowance resulting from the adjustments described above. The Company recorded income tax expense of
$185.4 million
for fresh start adjustments in the Predecessor period, consisting of
$529.1 million
tax expense for the increase in deferred tax liabilities resulting from fresh start accounting adjustments, which was partially offset by
$343.7 million
tax benefit for the reduction in the valuation allowance on our deferred tax assets. In addition to the above mentioned adjustments, the Reorganization and fresh start adjustments line above includes the reversal of the
$2.0 billion
in tax benefits that are presented in the reconciliation table in the Income tax benefit at statutory rates line.
The Predecessor Company’s effective tax rate for the year ended
December 31, 2018
was
(57.3)%
. The effective tax rate for 2018 was primarily impacted by
$11.3 million
of deferred tax expense attributed to the valuation allowance recorded against federal and state deferred tax assets generated in the period due to the uncertainty of the ability to realize those assets in future periods. In addition, the Company did not record a tax effect for charges between the iHeartMedia group and the Outdoor Group that were eliminated in the presentation of discontinued operations as these charges are respected for income tax purposes under the Tax Matters Agreement.
114
IHEARTMEDIA, INC.
AND SUBSIDIARIES
NOTES TO CONSOLIDATED FINANCIAL STATEMENTS
The Predecessor Company’s effective tax rate for the year ended
December 31, 2017
was
21.3%
. The effective tax benefit rate for 2017 was impacted by the effects of U.S. corporate tax reform which resulted in a tax benefit of
$282.1 million
recorded in connection with the reduction in the U.S. federal corporate tax rate. In partial offset to this tax benefit, the Company recorded tax expense of
$202.0 million
in connection with the valuation allowance recorded against federal and state deferred tax assets generated in the period due to the uncertainty of the ability to realize those assets in future periods. In addition, the Company did not record a tax effect for charges between the iHeartMedia group and the Outdoor Group that were eliminated in the presentation of discontinued operations as these charges are respected for income tax purposes under the Tax Matters Agreement. The adjustment of
$172.5 million
included above was primarily related to the
$855.7 million
loss on the intercompany note between the iHeartMedia group and the Outdoor group.
The Company continues to record interest and penalties related to unrecognized tax benefits in current income tax expense. The total amount of interest accrued at
December 31, 2019
(Successor) and
2018
(Predecessor) was
$6.9 million
and
$50.6 million
, respectively. The total amount of unrecognized tax benefits including accrued interest and penalties at
December 31, 2019
(Successor) and
2018
(Predecessor) was
$20.5 million
and
$103.7 million
, respectively, of which
$20.3 million
and
$94.1 million
is included in “Other long-term liabilities” and
$0.0 million
and
$1.3 million
is included in “Accrued expenses” on the Company’s consolidated balance sheets, respectively. In addition,
$0.2 million
and
$8.4 million
of unrecognized tax benefits are recorded net with the Company’s deferred tax assets for its net operating losses as opposed to being recorded in “Other long-term liabilities” at
December 31, 2019
(Successor) and
2018
(Predecessor), respectively. The total amount of unrecognized tax benefits at
December 31, 2019
(Successor) and
2018
(Predecessor) that, if recognized, would impact the effective income tax rate is
$15.5 million
and
$59.3 million
, respectively.
|
(In thousands)
|
Successor Company
|
Predecessor Company
|
||||||
|
Years Ended December 31,
|
Years Ended December 31,
|
|||||||
|
Unrecognized Tax Benefits
|
2019
|
2018
|
||||||
|
Balance at beginning of period
|
$
|
53,156
|
|
$
|
53,234
|
|
||
|
Increases for tax position taken in the current year
|
4,070
|
|
3,228
|
|
||||
|
Increases for tax positions taken in previous years
|
2,534
|
|
177
|
|
||||
|
Decreases for tax position taken in previous years
|
(2,948
|
)
|
(1,372
|
)
|
||||
|
Decreases due to settlements with tax authorities
|
(1,183
|
)
|
—
|
|
||||
|
Decreases due to lapse of statute of limitations
|
(41,965
|
)
|
(2,111
|
)
|
||||
|
Balance at end of period
|
$
|
13,664
|
|
$
|
53,156
|
|
||
The Company and its subsidiaries file income tax returns in the U.S. federal jurisdiction and various state and foreign jurisdictions. During 2019 the Company settled several state and local tax and foreign tax examinations resulting is a reduction of unrecognized tax benefits of
$1.2 million
, excluding interest. In addition, during 2019 the statute of limitations for certain tax years expired upon our emergence from bankruptcy resulting in the reduction to unrecognized tax benefits of
$42.0 million
, excluding interest. During 2018, the statute of limitations for certain tax years expired in the U.S. and certain states resulting in the reduction to unrecognized tax benefits of
$2.1 million
, excluding interest. All federal income tax matters through 2015 are closed. The majority of all material state, local, and foreign income tax matters have been concluded for years through 2017 with the exception of a current examination in Texas that covers the 2008-2016 tax years.
NOTE 12 –
STOCKHOLDERS’ EQUITY (DEFICIT)
As described in Note 2 -
Emergence from Voluntary Reorganization under Chapter 11 Proceedings
and Note 3 -
Fresh Start Accounting
, the Company emerged from bankruptcy upon the effectiveness of the Plan of Reorganization on May 1, 2019, at which time all shares of the Predecessor Company’s issued and outstanding common stock immediately prior to the Effective Date were canceled, and reorganized iHeartMedia issued an aggregate of
56,861,941
shares of iHeartMedia Class A common stock,
6,947,567
shares of Class B common stock and special warrants to purchase
81,453,648
shares of Class A common stock or Class B common stock to holders of claims pursuant to the Plan of Reorganization. The value of these shares and warrants issued to claimholders in settlement of Liabilities subject to compromise was based on the difference between the Enterprise Value of the Company and the and new debt and mandatorily redeemable preferred stock issued upon emergence, adjusted as necessary for
115
IHEARTMEDIA, INC.
AND SUBSIDIARIES
NOTES TO CONSOLIDATED FINANCIAL STATEMENTS
cash and cash equivalents, noncontrolling interest and changes in deferred taxes. The impact of finalization of deferred tax amounts related to the Reorganization is reflected within the Consolidated Statement of Changes in Stockholders’ Equity (Deficit).
Historically, the Company granted restricted shares of the Company's Class A common stock to certain key individuals. In connection with the effectiveness of the Plan of Reorganization, all unvested restricted shares were canceled.
Pursuant to the Post-Emergence Equity Plan the Company adopted in connection with the effectiveness of our Plan of Reorganization, the Company has granted restricted stock units and options to purchase shares of the Company's Class A common stock to certain key individuals.
This Post-Emergence Equity Plan is designed to provide an incentive to certain key members of management and service providers of the Company or any of its subsidiaries and non-employee members of the Board of Directors and to offer an additional inducement in obtaining the services of such individuals. The Post-Emergence Equity Plan provides for the grant of (a) options and (b) restricted stock units, which, in each case, may be subject to contingencies or restrictions as set forth under the plan and applicable award agreement.
The aggregate number of shares of Class A common stock that may be issued or used for reference purposes with respect to which awards may be granted under the plan shall be equal to the sum of (a)
12,770,387
shares of Class A common stock for awards to key members of management and service providers plus (b)
1,596,298
shares of Class A common stock for awards to non-employee members of the Board. Such shares of common stock may, in the discretion of the Board of Directors, consist either in whole or in part of authorized but unissued shares of common stock or shares of common stock held in the treasury of the Company. The Company shall at all times during the term of the plan reserve and keep available such number of shares of common stock as will be sufficient to satisfy the requirements of the plan.
The Company granted
5,542,668
stock options and
3,205,360
restricted stock units on May 30, 2019 in connection with the Company's emergence from bankruptcy (the "Emergence Awards").
Share-Based Compensation
Successor
Stock Options
The term of each option granted pursuant to the plan may not exceed (a) six (6) years from the date of grant thereof in the case of the awards granted upon emergence and (b) ten (10) years from the date of grant thereof in the case of all other options; subject, however, in either case, to earlier termination as hereinafter provided.
Options granted under the plan are exercisable at such time or times and subject to such terms and conditions as shall be determined by the Compensation Committee of the Board (the "Committee") at the time of grant.
The options granted as Emergence Awards vest (or vested, as applicable), subject to a participant’s continued full-time employment or service with the Company through each applicable vesting date, (a)
20%
on July 22, 2019, and (b) an additional
20%
vesting on each of the next four anniversaries of the grant date.
No options granted under the plan will provide for any dividends or dividend equivalents thereon.
The Company accounts for its share-based payments using the fair value recognition provisions of ASC 718-10. The fair value of options that vest based on continued service is estimated on the grant date using a Black-Scholes option-pricing model. Expected volatilities were based on historical volatility of peer companies’ stock, including
the Company
, over the expected life of the options. The expected life of the options granted represents the period of time that the options granted are expected to be outstanding. The risk free interest rate is based on the U.S. Treasury yield curve in effect at the time of grant for periods equal to the expected life of the option. The Company does not estimate forfeitures at grant date, but rather has elected to account for forfeitures when they occur.
116
IHEARTMEDIA, INC.
AND SUBSIDIARIES
NOTES TO CONSOLIDATED FINANCIAL STATEMENTS
The following assumptions were used to calculate the fair value of the Successor Company's options on the date of grant:
|
Period from May 2, 2019 through December 31,
|
|
|
2019
|
|
|
Expected volatility
|
44% – 45%
|
|
Expected life in years
|
4.0 – 4.1
|
|
Risk-free interest rate
|
1.40% – 2.02%
|
|
Dividend yield
|
—%
|
The following table presents a summary of the Successor Company's stock options outstanding at and stock option activity during the period from May 2, 2019 through
December 31, 2019
("Price" reflects the weighted average exercise price per share):
|
(In thousands, except per share data)
|
Options
|
Price
|
Weighted
Average
Remaining
Contractual Term
|
||||
|
Granted
|
5,656
|
|
18.93
|
|
|||
|
Forfeited
|
(9
|
)
|
19.00
|
|
|||
|
Expired
|
(2
|
)
|
19.00
|
|
|||
|
Outstanding, December 31, 2019 (Successor)
|
5,645
|
|
18.93
|
|
5.4 years
|
||
|
Exercisable
|
1,128
|
|
18.96
|
|
5.4 years
|
||
|
Expected to Vest
|
4,517
|
|
18.92
|
|
5.4 years
|
||
A summary of the Successor Company's unvested options and changes during the period from May 2, 2019 through
December 31, 2019
is presented below:
|
(In thousands, except per share data)
|
Options
|
Weighted Average Grant Date Fair Value
|
|||
|
Granted
|
5,656
|
|
5.28
|
|
|
|
Vested
(1)
|
(1,130
|
)
|
5.27
|
|
|
|
Forfeited
|
(9
|
)
|
5.27
|
|
|
|
Unvested, December 31, 2019 (Successor)
|
4,517
|
|
5.28
|
|
|
|
(1)
|
The total fair value of the options vested during the period from May 2, 2019 through
December 31, 2019
(Successor) was
$6.0 million
.
|
Restricted Stock Units ("RSUs")
RSUs may be issued either alone or in addition to other awards granted under the plan.
The RSUs granted in respect of the Emergence Awards vest or vested (as applicable), subject to a participant’s continued full-time employment or service with the Company through each applicable vesting date, (a)
20%
on July 22, 2019, and (b) an additional
20%
vesting on each of the next four anniversaries of the grant date.
Each RSU (representing one share of common stock) awarded to a participant will be credited with dividends paid in respect of one share of common stock (“Dividend Equivalents”). Dividend Equivalents will be withheld by the Company for the participant’s
117
IHEARTMEDIA, INC.
AND SUBSIDIARIES
NOTES TO CONSOLIDATED FINANCIAL STATEMENTS
account, and interest may be credited on the amount of cash Dividend Equivalents withheld at a rate and subject to such terms as determined by the Committee. Dividend Equivalents credited to a participant’s account and attributable to any particular RSU (and earnings thereon, if applicable) shall be distributed to the participant upon settlement of such RSU and, if such RSU is forfeited, the participant shall have no right to such Dividend Equivalents.
The following table presents a summary of the Successor Company's restricted stock outstanding and restricted stock activity as of and during the year ended
December 31, 2019
(“Price” reflects the weighted average share price at the date of grant):
|
(In thousands, except per share data)
|
Awards
|
Price
|
|||
|
Granted
|
3,301
|
|
16.47
|
|
|
|
Vested (restriction lapsed)
|
(644
|
)
|
16.48
|
|
|
|
Forfeited
|
(9
|
)
|
16.50
|
|
|
|
Outstanding, December 31, 2019 (Successor)
|
2,648
|
|
16.47
|
|
|
Predecessor
Prior to the Emergence Date, the Predecessor Company had granted share-based awards that were canceled upon emergence from bankruptcy. In conjunction with the cancellation, the Predecessor Company accelerated the unrecognized share-based compensation expense and recorded
$1.5 million
of compensation expense in the period from January 1, 2019 through May 1, 2019 (Predecessor), principally reflected in Reorganization costs, net.
Stock Options
The Predecessor Company granted options to purchase its shares of Class A common stock to certain key executives under its equity incentive plan at no less than the fair value of the underlying stock on the date of grant. These options were granted for a term not to exceed ten years and were forfeited, except in certain circumstances, in the event the executive terminated his or her employment or relationship with the Predecessor Company or one of its affiliates. Approximately three-fourths of the options outstanding at December 31, 2017 vested based solely on continued service over a period of up to five years with the remainder becoming eligible to vest over a period of up to five years if certain predetermined performance targets are met. The equity incentive plan contains antidilutive provisions that permitted an adjustment for any change in capitalization.
As of December 31, 2018, the Predecessor Company had
690,994
options outstanding with a weighted average exercise price of
$33.70
. During the period from January 1, 2019 through May 1, 2019 (Predecessor), the year ended December 31, 2018 and the year ended December 31, 2017 there were no options vested, granted or exercised and the
690,994
options outstanding were canceled upon the Company’s emergence from bankruptcy.
Restricted Stock Awards (RSAs)
The Predecessor Company granted restricted stock awards to certain of its employees and affiliates under its equity incentive plan. The restricted stock awards were restricted in transferability for a term of up to five years. Restricted stock awards were forfeited, except in certain circumstances, in the event the employee terminates his or her employment or relationship with the Company prior to the lapse of the restriction.
As of December 31, 2018, the Predecessor Company had
5,258,526
RSAs outstanding with a weighted average share price at the date of the grant of
$3.74
. During the period from January 1, 2019 through May 1, 2019 (Predecessor), there were
18,600
RSA's vested at a weighted average share price at the date of the grant of
$1.42
and
110,333
RSA's forfeited at a weighted average share price at the date of the grant of
$3.16
. Outstanding RSA's of
5,129,593
were canceled upon the Company’s emergence from bankruptcy.
118
IHEARTMEDIA, INC.
AND SUBSIDIARIES
NOTES TO CONSOLIDATED FINANCIAL STATEMENTS
Predecessor Common Stock
The following table presents the balances of the Predecessor Company's Class A, Class B, Class C and Class D Common Stock as of
December 31, 2019
(Successor) and December 31, 2018 (Predecessor):
|
(In thousands, except share and per share data)
|
Successor Company
|
Predecessor Company
|
||||
|
December 31,
2019 |
December 31,
2018 |
|||||
|
Predecessor Class A Common Stock, par value $.001 per share, authorized 400,000,000 shares, no shares issued in 2019 and 32,292,944 shares issued in 2018
|
—
|
|
32
|
|
||
|
Predecessor Class B Common Stock, par value $.001 per share, authorized 150,000,000 shares, no shares issued in 2019 and 555,556 shares issued in 2018
|
—
|
|
1
|
|
||
|
Predecessor Class C Common Stock, par value $.001 per share, authorized 100,000,000 shares, no shares issued in 2019 and 58,967,502 shares issued in 2018
|
—
|
|
59
|
|
||
|
Predecessor Class D Common Stock, par value $.001 per share, authorized 200,000,000 shares, no shares issued in 2019 and 2018
|
—
|
|
—
|
|
||
Successor Common Stock and Special Warrants
The following table presents the Successor Company's Class A Common Stock, Class B Common Stock and Special Warrants issued and outstanding as of
December 31, 2019
:
|
(In thousands, except share and per share data)
|
December 31,
2019 |
|
|
Successor Class A Common Stock, par value $.001 per share,1,000,000,000 shares authorized
|
57,776,204
|
|
|
Successor Class B Common Stock, par value $.001 per share, 1,000,000,000 shares authorized
|
6,904,910
|
|
|
Successor Special Warrants
|
81,046,593
|
|
|
Total Successor Class A Common Stock, Class B Common Stock and Special Warrants issued and outstanding
|
145,727,707
|
|
Class A Common Stock
Holders of shares of the Successor Company's Class A common stock are entitled to one vote for each share held of record on all matters submitted to a vote of stockholders. Holders of the Successor Company's Class A common stock will have the exclusive right to vote for the election of directors. There will be no cumulative voting rights in the election of directors.
Holders of shares of the Successor Company's Class A common stock are entitled to receive dividends, on a per share basis, when and if declared by the Company's Board out of funds legally available therefor and whenever any dividend is made on the shares of the Successor Company's Class B common stock subject to certain exceptions set forth in our certificate.
The Successor Company may not subdivide or combine (by stock split, reverse stock split, recapitalization, merger, consolidation or any other transaction) its shares of Class A common stock or Class B common stock without subdividing or combining its shares of Class B common stock or Class A common stock, respectively, in a similar manner.
Upon our dissolution or liquidation or the sale of all or substantially all of the Successor Company's assets, after payment in full of all amounts required to be paid to creditors and to the holders of preferred stock having liquidation preferences, if any, the holders of shares of the Successor Company's Class A common stock will be entitled to receive pro rata together with holders of the Successor Company's Class B common stock our remaining assets available for distribution.
New Class A common stock certificates issued upon transfer or new issuance of Class A common stock shares will contain a legend stating that such shares of Class A common stock are subject to the provisions of our amended and restated certificate of incorporation, including but not limited to provisions governing compliance with requirements of the Communications Act and regulations thereunder, including, without limitation, those concerning foreign ownership and media ownership.
On July 18, 2019, the Company’s Class A common stock was listed and began trading on the Nasdaq Global Select Market ("Nasdaq") under the ticker symbol “IHRT”.
119
IHEARTMEDIA, INC.
AND SUBSIDIARIES
NOTES TO CONSOLIDATED FINANCIAL STATEMENTS
Class B Common Stock
Holders of shares of the Successor Company's Class B common stock are not entitled to vote for the election of directors or, in general, on any other matter submitted to a vote of the Company’s stockholders, but are entitled to one vote per share on the following matters: (a) any amendment or modification of any specific rights or obligations of the holders of Class B common stock that does not similarly affect the rights or obligations of the holders of Class A common stock, in which case the holders of Class B Common Stock will be entitled to a separate class vote, with each share of Class B common stock having one vote; and (b) to the extent submitted to a vote of our stockholders, (i) the retention or dismissal of outside auditors by the Company, (ii) any dividends or distributions to our stockholders, (ii) any material sale of assets, recapitalization, merger, business combination, consolidation, exchange of stock or other similar reorganization of the Company or any of its subsidiaries, (iv) the adoption of any amendment to our certificate of incorporation, (v) other than in connection with any management equity or similar plan adopted by the Company's Board, any authorization or issuance of equity interests, or any security or instrument convertible into or exchangeable for equity interests, in the Company or any of its subsidiaries, and (vi) the liquidation of the Company, in which case in respect to any such vote concerning the matters described in clause (b), the holders of Class B common stock are entitled to vote with the holders of the Class A common stock, with each share of common stock having one vote and voting together as a single class.
Holders of shares of the Successor Company's Class B common stock are generally entitled to convert shares of Class B common stock into shares of Class A common stock on a one-for-one basis, subject to the Company’s ability to restrict conversion in order to comply with the Communications Act and FCC regulations.
Holders of shares of the Successor Company's Class B common stock are entitled to receive dividends when and if declared by the Company's Board out of funds legally available therefor and whenever any dividend is made on the shares of the Successor Company's Class A common stock subject to certain exceptions set forth in our certificate of incorporation. Upon our dissolution or liquidation or the sale of all or substantially all of our assets, after payment in full of all amounts required to be paid to creditors and to the holders of preferred stock having liquidation preferences, if any, the holders of shares of the Successor Company's Class B common stock will be entitled to receive pro rata with holders of the Successor Company's Class A common stock our remaining assets available for distribution.
During the period from May 2, 2019 to
December 31, 2019
,
42,657
shares of the Class B common stock were converted into Class A common stock.
Special Warrants
Each Special Warrant issued under the special warrant agreement entered into in connection with the Reorganization may be exercised by its holder to purchase one share of Successor Class A common stock or Successor Class B common stock at an exercise price of
$0.001
per share, unless the Company in its sole discretion believes such exercise would, alone or in combination with any other existing or proposed ownership of common stock, result in, subject to certain exceptions, (a) such exercising holder owning more than
4.99 percent
of the Successor Company's outstanding Class A common stock, (b) more than
22.5 percent
of the Successor Company's capital stock or voting interests being owned directly or indirectly by foreign individuals or entities, (c) the Company exceeding any foreign ownership threshold set by the FCC pursuant to a declaratory ruling or specific approval requirement or (d) the Company violating any provision of the Communications Act or restrictions on ownership or transfer imposed by the Company's certificate of incorporation or the decisions, rules and policies of the FCC. Any holder exercising Special Warrants must complete and timely deliver to the warrant agent the required exercise forms and certifications required under the special warrant agreement.
To the extent there are any dividends declared or distributions made with respect to the Successor Class A common stock or Successor Class B common stock, those dividends or distributions will also be made to holders of Special Warrants concurrently and on a
pro rata
basis based on their ownership of common stock underlying their Special Warrants on an as-exercised basis;
provided
, that no such distribution will be made to holders of Special Warrants if (x) the Communications Act or an FCC rule prohibits such distribution to holders of Special Warrants or (y) our FCC counsel opines that such distribution is reasonably likely to cause (i) the Company to violate the Communications Act or any applicable FCC rule or (ii) any such holder not to be deemed to hold a noncognizable (under FCC rules governing foreign ownership) future equity interest in the Company;
provided further
, that, if any distribution of common stock or any other securities to a holder of Special Warrants is not permitted pursuant to clauses (x) or (y), the Company will cause economically equivalent warrants to be distributed to such holder in lieu thereof, to the extent that such distribution of warrants would not violate the Communications Act or any applicable FCC rules.
120
IHEARTMEDIA, INC.
AND SUBSIDIARIES
NOTES TO CONSOLIDATED FINANCIAL STATEMENTS
The Special Warrants will expire on the earlier of the twentieth anniversary of the issuance date and the occurrence of a change in control of the Company.
During the period from May 2, 2019 through ended
December 31, 2019
,
227,581
shares of the Special Warrants were converted into Class A common stock.
Share-Based Compensation Cost
The share-based compensation cost is measured at the grant date based on the fair value of the award and is recognized as expense on a straight-line basis over the vesting period. Share-based compensation payments are recorded in corporate expenses and were
$26.4 million
for the Successor Company for the period from May 2, 2019 through
December 31, 2019
. Share-based compensation expenses for the Predecessor Company were
$0.5 million
,
$2.1 million
and
$2.5 million
, during the period from January 1, 2019 through May 1, 2019, the year ended
December 31, 2018
and the year ended
December 31, 2017
, respectively.
The tax benefit related to the share-based compensation expense for the Successor Company for the period from May 1, 2019 through
December 31, 2019
was
$4.1 million
. The tax benefit related to the share-based compensation expense for the Predecessor Company for the period from January 1, 2019 through May 1, 2019, the year ended
December 31, 2018
and the year ended
December 31, 2017
was
$0.1 million
,
$0.5 million
and
$0.9 million
, respectively.
As of
December 31, 2019
, there was
$57.6 million
of unrecognized compensation cost related to unvested share-based compensation arrangements that will vest based on service conditions. This cost is expected to be recognized over a weighted average period of approximately
3.4
years.
Income (Loss) per Share
|
(In thousands, except per share data)
|
Successor Company
|
Predecessor Company
|
||||||||||||||
|
Period from May 2, 2019 through December 31,
|
Period from January 1, 2019 through May 1,
|
Year Ended December 31,
|
||||||||||||||
|
|
2019
|
2019
|
2018
|
2017
|
||||||||||||
|
NUMERATOR:
|
|
|
||||||||||||||
|
Net income (loss) attributable to the Company – common shares
|
$
|
112,548
|
|
$
|
11,184,141
|
|
$
|
(201,910
|
)
|
$
|
(398,060
|
)
|
||||
|
Exclude:
|
||||||||||||||||
|
Income (loss) from discontinued operations, net of tax
|
$
|
—
|
|
$
|
1,685,123
|
|
$
|
(164,667
|
)
|
$
|
197,297
|
|
||||
|
Noncontrolling interest from discontinued operations, net of tax - common shares
|
—
|
|
19,028
|
|
124
|
|
59,425
|
|
||||||||
|
Total income (loss) from discontinued operations, net of tax - common shares
|
$
|
—
|
|
$
|
1,704,151
|
|
$
|
(164,543
|
)
|
$
|
256,722
|
|
||||
|
Total income (loss) from continuing operations
|
$
|
112,548
|
|
$
|
9,479,990
|
|
$
|
(37,367
|
)
|
$
|
(654,782
|
)
|
||||
|
Noncontrolling interest from continuing operations, net of tax - common shares
|
(751
|
)
|
—
|
|
605
|
|
1,226
|
|
||||||||
|
Income (loss) from continuing operations
|
$
|
113,299
|
|
$
|
9,479,990
|
|
$
|
(37,972
|
)
|
$
|
(656,008
|
)
|
||||
|
DENOMINATOR
(1)
:
|
|
|
|
|
||||||||||||
|
Weighted average common shares outstanding - basic
|
145,608
|
|
86,241
|
|
85,412
|
|
84,967
|
|
||||||||
|
Stock options and restricted stock
(2)
:
|
187
|
|
—
|
|
—
|
|
—
|
|
||||||||
|
Weighted average common shares outstanding - diluted
|
145,795
|
|
86,241
|
|
85,412
|
|
84,967
|
|
||||||||
|
Net income (loss) attributable to the Company per common share:
|
|
|
|
|
||||||||||||
|
From continuing operations - Basic
|
$
|
0.77
|
|
$
|
109.92
|
|
$
|
(0.44
|
)
|
$
|
(7.71
|
)
|
||||
|
From discontinued operations - Basic
|
$
|
—
|
|
$
|
19.76
|
|
$
|
(1.93
|
)
|
$
|
3.02
|
|
||||
|
From continuing operations - Diluted
|
$
|
0.77
|
|
$
|
109.92
|
|
$
|
(0.44
|
)
|
$
|
(7.71
|
)
|
||||
|
From discontinued operations - Diluted
|
$
|
—
|
|
$
|
19.76
|
|
$
|
(1.93
|
)
|
$
|
3.02
|
|
||||
121
IHEARTMEDIA, INC.
AND SUBSIDIARIES
NOTES TO CONSOLIDATED FINANCIAL STATEMENTS
|
(1)
|
All of the outstanding Special Warrants issued at emergence are included in both the basic and diluted weighted average common shares outstanding of the Successor Company for the period from May 2, 2019 through
December 31, 2019
.
|
|
(2)
|
Outstanding equity awards representing
5.9 million
shares of Class A common stock of the Successor Company for the period from May 2, 2019 through
December 31, 2019
were not included in the computation of diluted earnings per share because to do so would have been antidilutive. Outstanding equity awards representing
5.9 million
,
7.2 million
and
8.3 million
shares of Class A common stock of the Predecessor Company for the period for the period from January 1, 2019 through May 1, 2019, the year ended
December 31, 2018
and the year ended
December 31, 2017
, respectively, were not included in the computation of diluted earnings per share because to do so would have been antidilutive.
|
NOTE 13 – EMPLOYEE STOCK AND SAVINGS PLANS
iHeartCommunications
has various 401(k) savings and other plans for the purpose of providing retirement benefits for substantially all employees. Under these plans, an employee can make pre-tax contributions and
iHeartCommunications
will match a portion of such an employee’s contribution. Employees vest in these
iHeartCommunications
matching contributions based upon their years of service to
iHeartCommunications
. Contributions of
$8.6 million
,
$6.1 million
,
$13.5 million
and
$13.7 million
were made to these plans for period from May 2, 2019 through December 31, 2019 (Successor), the period from January 1, 2019 through May 1, 2019 (Predecessor), the year ended December 31,
2018
(Predecessor) and the year ended December 31,
2017
(Predecessor), respectively, were expensed.
iHeartCommunications
offers a non-qualified deferred compensation plan for a select group of management or highly compensated employees, under which such employees were able to make an annual election to defer up to
50%
of their annual salary and up to
80%
of their bonus before taxes.
iHeartCommunications
suspended all salary and bonus deferrals and company matching contributions to the deferred compensation plan on January 1, 2010.
iHeartCommunications
accounts for the plan in accordance with the provisions of ASC 710-10. Matching credits on amounts deferred may be made in
iHeartCommunications'
sole discretion and
iHeartCommunications
retains ownership of all assets until distributed. Participants in the plan have the opportunity to allocate their deferrals and any
iHeartCommunications
matching credits among different investment options, the performance of which is used to determine the amounts to be paid to participants under the plan. In accordance with the provisions of ASC 710-10, the assets and liabilities of the non-qualified deferred compensation plan are presented in “Other assets” and “Other long-term liabilities” in the accompanying consolidated balance sheets, respectively. The asset and liability under the deferred compensation plan at
December 31, 2019
(Successor) was approximately
$11.3 million
recorded in “Other assets” and
$11.3 million
recorded in “Other long-term liabilities”, respectively. The asset and liability under the deferred compensation plan at
December 31, 2018
(Predecessor) was approximately
$11.2 million
recorded in “Other assets” and
$11.2 million
recorded in “Liabilities subject to compromise”, respectively.
NOTE 14 — OTHER INFORMATION
OTHER INCOME (EXPENSE), NET
The following table discloses the components of "Other income (expense)" for the years ended
December 31, 2019
,
2018
and
2017
, respectively:
|
(In thousands)
|
Successor Company
|
Predecessor Company
|
||||||||||||||
|
Period from May 2, 2019 through December 31,
|
Period from January 1, 2019 through May 1,
|
Year Ended December 31,
|
||||||||||||||
|
2019
|
2019
|
2018
|
2017
|
|||||||||||||
|
Foreign exchange gain (loss)
|
$
|
(96
|
)
|
$
|
65
|
|
$
|
496
|
|
$
|
(340
|
)
|
||||
|
Gain on extinguishment of debt
|
—
|
|
—
|
|
100
|
|
1,271
|
|
||||||||
|
Other
|
(18,170
|
)
|
(42
|
)
|
(23,603
|
)
|
(44,782
|
)
|
||||||||
|
Total other income (expense), net
|
$
|
(18,266
|
)
|
$
|
23
|
|
$
|
(23,007
|
)
|
$
|
(43,851
|
)
|
||||
Other income (expense), net for the years ended December 31, 2018 and 2017 includes
$23.1 million
and
$41.8 million
, respectively, in expenses incurred in connection with negotiations with lenders and other activities related to our capital structure.
122
IHEARTMEDIA, INC.
AND SUBSIDIARIES
NOTES TO CONSOLIDATED FINANCIAL STATEMENTS
OTHER CURRENT ASSETS
The following table discloses the components of “Other current assets” as of
December 31, 2019
and
2018
, respectively:
|
(In thousands)
|
Successor Company
|
Predecessor Company
|
||||||
|
As of December 31,
|
As of December 31,
|
|||||||
|
2019
|
2018
|
|||||||
|
Inventory
|
$
|
507
|
|
$
|
355
|
|
||
|
Deposits
|
2,944
|
|
5,243
|
|
||||
|
Restricted cash
|
11,318
|
|
3,428
|
|
||||
|
Due from related parties
|
1,480
|
|
—
|
|
||||
|
Other receivables
|
24,326
|
|
16,506
|
|
||||
|
Other
|
801
|
|
1,255
|
|
||||
|
Total other current assets
|
$
|
41,376
|
|
$
|
26,787
|
|
||
OTHER ASSETS
The following table discloses the components of “Other assets” as of
December 31, 2019
and
2018
, respectively:
|
Successor Company
|
Predecessor Company
|
|||||||
|
(In thousands)
|
As of December 31,
|
As of December 31,
|
||||||
|
2019
|
2018
|
|||||||
|
Investments in, and advances to, nonconsolidated affiliates
|
$
|
10,952
|
|
$
|
24,104
|
|
||
|
Other investments
|
19,689
|
|
38,813
|
|
||||
|
Notes receivable
|
33,128
|
|
25,823
|
|
||||
|
Prepaid expenses
|
233
|
|
7,105
|
|
||||
|
Deposits
|
4,481
|
|
4,345
|
|
||||
|
Prepaid rent
|
6,284
|
|
24,567
|
|
||||
|
Non-qualified plan assets
|
11,343
|
|
11,200
|
|
||||
|
Other
|
10,106
|
|
13,779
|
|
||||
|
Total other assets
|
$
|
96,216
|
|
$
|
149,736
|
|
||
123
IHEARTMEDIA, INC.
AND SUBSIDIARIES
NOTES TO CONSOLIDATED FINANCIAL STATEMENTS
OTHER LONG-TERM LIABILITIES
The following table discloses the components of “Other long-term liabilities” as of
December 31, 2019
and
2018
, respectively:
|
(In thousands)
|
Successor Company
|
Predecessor Company
|
||||||
|
As of December 31,
|
As of December 31,
|
|||||||
|
2019
|
2018
|
|||||||
|
Unrecognized tax benefits
|
$
|
20,334
|
|
$
|
94,051
|
|
||
|
Asset retirement obligation
|
3,722
|
|
—
|
|
||||
|
Non-qualified plan liabilities
|
11,343
|
|
—
|
|
||||
|
Deferred income
|
22,588
|
|
135,450
|
|
||||
|
Other
|
123
|
|
178
|
|
||||
|
Total other long-term liabilities
|
$
|
58,110
|
|
$
|
229,679
|
|
||
ACCUMULATED OTHER COMPREHENSIVE INCOME (LOSS)
The following table discloses the components of “Accumulated other comprehensive income (loss),” net of tax, as of
December 31, 2019
and
2018
, respectively:
|
(In thousands)
|
Successor Company
|
Predecessor Company
|
||||||
|
As of December 31,
|
As of December 31,
|
|||||||
|
2019
|
2018
|
|||||||
|
Cumulative currency translation adjustment
|
$
|
(750
|
)
|
$
|
(288,413
|
)
|
||
|
Cumulative other adjustments
|
—
|
|
(29,617
|
)
|
||||
|
Total accumulated other comprehensive income (loss)
|
$
|
(750
|
)
|
$
|
(318,030
|
)
|
||
NOTE 15 – SEGMENT DATA
The Company’s primary business is included in its Audio segment. Revenue and expenses earned and charged between Audio, Corporate and the Company's Audio & Media Services businesses are eliminated in consolidation. The Audio segment provides media and entertainment services via broadcast and digital delivery and also includes the Company’s events and national syndication businesses. The Audio & Media Services business provides other audio and media services, including the Company’s media representation business (Katz Media) and its provider of scheduling and broadcast software (RCS). Corporate includes infrastructure and support, including executive, information technology, human resources, legal, finance and administrative functions for the Company’s businesses. Share-based compensation is recorded within Corporate expenses.
In connection with the Separation and the Reorganization, the Company revised its segment reporting, as discussed in Note 1 and all prior periods have been restated to conform to this presentation.
124
IHEARTMEDIA, INC.
AND SUBSIDIARIES
NOTES TO CONSOLIDATED FINANCIAL STATEMENTS
The following table presents the Company's segment results for the Successor Company for the period from May 2, 2019 through
December 31, 2019
:
|
Successor Company
|
|||||||||||||||||||
|
(In thousands)
|
Audio
|
Audio and Media Services
|
Corporate and other reconciling items
|
Eliminations
|
Consolidated
|
||||||||||||||
|
Period from May 2, 2019 through December 31, 2019
|
|||||||||||||||||||
|
Revenue
|
$
|
2,447,800
|
|
$
|
167,292
|
|
$
|
—
|
|
$
|
(5,036
|
)
|
$
|
2,610,056
|
|
||||
|
Direct operating expenses
|
787,050
|
|
21,106
|
|
—
|
|
(747
|
)
|
807,409
|
|
|||||||||
|
Selling, general and administrative expenses
|
852,203
|
|
88,860
|
|
—
|
|
(4,257
|
)
|
936,806
|
|
|||||||||
|
Corporate expenses
|
—
|
|
—
|
|
168,614
|
|
(32
|
)
|
168,582
|
|
|||||||||
|
Depreciation and amortization
|
229,404
|
|
14,776
|
|
5,443
|
|
—
|
|
249,623
|
|
|||||||||
|
Other operating expense, net
|
—
|
|
—
|
|
(8,000
|
)
|
—
|
|
(8,000
|
)
|
|||||||||
|
Operating income (loss)
|
$
|
579,143
|
|
$
|
42,550
|
|
$
|
(182,057
|
)
|
$
|
—
|
|
$
|
439,636
|
|
||||
|
Segment assets
|
$
|
10,035,720
|
|
$
|
372,955
|
|
$
|
616,202
|
|
$
|
(3,778
|
)
|
$
|
11,021,099
|
|
||||
|
Intersegment revenues
|
$
|
447
|
|
$
|
4,589
|
|
$
|
—
|
|
$
|
—
|
|
$
|
5,036
|
|
||||
|
Capital expenditures
|
$
|
62,016
|
|
$
|
3,980
|
|
$
|
9,997
|
|
$
|
—
|
|
$
|
75,993
|
|
||||
|
Share-based compensation expense
|
$
|
—
|
|
$
|
—
|
|
$
|
26,411
|
|
$
|
—
|
|
$
|
26,411
|
|
||||
The following table presents the Company's segment results for the Predecessor Company for the periods indicated. The presentation of prior period amounts has been restated to conform to the presentation of the Successor period.
125
IHEARTMEDIA, INC.
AND SUBSIDIARIES
NOTES TO CONSOLIDATED FINANCIAL STATEMENTS
|
Predecessor Company
|
|||||||||||||||||||
|
(In thousands)
|
Audio
|
Audio and Media Services
|
Corporate and other reconciling items
|
Eliminations
|
Consolidated
|
||||||||||||||
|
Period from January 1, 2019 through May 1, 2019
|
|||||||||||||||||||
|
Revenue
|
$
|
1,006,677
|
|
$
|
69,362
|
|
$
|
—
|
|
$
|
(2,568
|
)
|
$
|
1,073,471
|
|
||||
|
Direct operating expenses
|
350,501
|
|
9,559
|
|
—
|
|
(364
|
)
|
359,696
|
|
|||||||||
|
Selling, general and administrative expenses
|
396,032
|
|
42,497
|
|
—
|
|
(2,184
|
)
|
436,345
|
|
|||||||||
|
Corporate expenses
|
66,040
|
|
(20
|
)
|
66,020
|
|
|||||||||||||
|
Depreciation and amortization
|
40,982
|
|
5,266
|
|
6,586
|
|
—
|
|
52,834
|
|
|||||||||
|
Impairment charges
|
—
|
|
—
|
|
91,382
|
|
—
|
|
91,382
|
|
|||||||||
|
Other operating expense, net
|
—
|
|
—
|
|
(154
|
)
|
—
|
|
(154
|
)
|
|||||||||
|
Operating income (loss)
|
$
|
219,162
|
|
$
|
12,040
|
|
$
|
(164,162
|
)
|
$
|
—
|
|
$
|
67,040
|
|
||||
|
Intersegment revenues
|
$
|
243
|
|
$
|
2,325
|
|
$
|
—
|
|
$
|
—
|
|
$
|
2,568
|
|
||||
|
Capital expenditures
|
$
|
31,177
|
|
$
|
1,263
|
|
$
|
3,757
|
|
$
|
—
|
|
$
|
36,197
|
|
||||
|
Share-based compensation expense
|
$
|
—
|
|
$
|
—
|
|
$
|
498
|
|
$
|
—
|
|
$
|
498
|
|
||||
|
Year Ended December 31, 2018
|
|||||||||||||||||||
|
Revenue
|
$
|
3,353,770
|
|
$
|
264,061
|
|
$
|
—
|
|
$
|
(6,508
|
)
|
$
|
3,611,323
|
|
||||
|
Direct operating expenses
|
1,034,224
|
|
28,360
|
|
—
|
|
(211
|
)
|
1,062,373
|
|
|||||||||
|
Selling, general and administrative expenses
|
1,248,671
|
|
134,490
|
|
—
|
|
(6,230
|
)
|
1,376,931
|
|
|||||||||
|
Corporate expenses
|
—
|
|
—
|
|
227,575
|
|
(67
|
)
|
227,508
|
|
|||||||||
|
Depreciation and amortization
|
172,991
|
|
18,286
|
|
20,674
|
|
—
|
|
211,951
|
|
|||||||||
|
Impairment charges
|
—
|
|
—
|
|
33,150
|
|
—
|
|
33,150
|
|
|||||||||
|
Other operating expense, net
|
—
|
|
—
|
|
(9,266
|
)
|
—
|
|
(9,266
|
)
|
|||||||||
|
Operating income (loss)
|
$
|
897,884
|
|
$
|
82,925
|
|
$
|
(290,665
|
)
|
$
|
—
|
|
$
|
690,144
|
|
||||
|
Segment assets
(1)
|
$
|
7,081,172
|
|
$
|
443,548
|
|
$
|
377,731
|
|
$
|
(206
|
)
|
$
|
7,902,245
|
|
||||
|
Intersegment revenues
|
$
|
—
|
|
$
|
6,508
|
|
$
|
—
|
|
$
|
—
|
|
$
|
6,508
|
|
||||
|
Capital expenditures
|
$
|
72,392
|
|
$
|
5,965
|
|
$
|
6,888
|
|
$
|
—
|
|
$
|
85,245
|
|
||||
|
Share-based compensation expense
|
$
|
—
|
|
$
|
—
|
|
$
|
2,066
|
|
$
|
—
|
|
$
|
2,066
|
|
||||
|
Year Ended December 31, 2017
|
|||||||||||||||||||
|
Revenue
|
$
|
3,357,207
|
|
$
|
235,951
|
|
$
|
—
|
|
$
|
(6,511
|
)
|
$
|
3,586,647
|
|
||||
|
Direct operating expenses
|
1,031,203
|
|
28,233
|
|
—
|
|
(313
|
)
|
1,059,123
|
|
|||||||||
|
Selling, general and administrative expenses
|
1,221,597
|
|
130,664
|
|
—
|
|
(6,198
|
)
|
1,346,063
|
|
|||||||||
|
Corporate expenses
|
—
|
|
—
|
|
208,648
|
|
—
|
|
208,648
|
|
|||||||||
|
Depreciation and amortization
|
228,591
|
|
20,133
|
|
26,580
|
|
—
|
|
275,304
|
|
|||||||||
|
Impairment charges
|
—
|
|
—
|
|
6,040
|
|
—
|
|
6,040
|
|
|||||||||
|
Other operating income, net
|
—
|
|
—
|
|
9,313
|
|
—
|
|
9,313
|
|
|||||||||
|
Operating income (loss)
|
$
|
875,816
|
|
$
|
56,921
|
|
$
|
(231,955
|
)
|
$
|
—
|
|
$
|
700,782
|
|
||||
|
Segment assets
(1)
|
$
|
7,084,134
|
|
$
|
402,300
|
|
$
|
315,427
|
|
$
|
(222
|
)
|
$
|
7,801,639
|
|
||||
|
Intersegment revenues
|
$
|
—
|
|
$
|
6,511
|
|
$
|
—
|
|
$
|
—
|
|
$
|
6,511
|
|
||||
|
Capital expenditures
|
$
|
55,691
|
|
$
|
3,256
|
|
$
|
8,781
|
|
$
|
—
|
|
$
|
67,728
|
|
||||
|
Share-based compensation expense
|
$
|
—
|
|
$
|
—
|
|
$
|
2,488
|
|
$
|
—
|
|
$
|
2,488
|
|
||||
(1)
The Predecessor Company's Segment assets exclude
$4,367.3 million
and
$4,458.8 million
of assets related to discontinued operations as of December 31, 2018 and 2017, respectively.
126
IHEARTMEDIA, INC.
AND SUBSIDIARIES
NOTES TO CONSOLIDATED FINANCIAL STATEMENTS
NOTE 16 — QUARTERLY RESULTS OF OPERATIONS (Unaudited)
|
(In thousands, except per share data)
|
Predecessor Company
|
Successor Company
|
||||||||||||||||||
|
Three Months Ended
March 31,
|
Period from April 1, 2019 through May 1,
|
Period from May 2, 2019 through June 30,
|
Three Months Ended
September 30,
|
Three Months Ended
December 31,
|
||||||||||||||||
|
2019
|
2019
|
2019
|
2019
|
2019
|
||||||||||||||||
|
Revenue
|
$
|
795,797
|
|
$
|
277,674
|
|
$
|
635,646
|
|
$
|
948,338
|
|
$
|
1,026,072
|
|
|||||
|
Operating expenses:
|
||||||||||||||||||||
|
Direct operating expenses
|
267,115
|
|
92,581
|
|
184,291
|
|
290,971
|
|
332,147
|
|
||||||||||
|
Selling, general and administrative expenses
|
332,793
|
|
103,552
|
|
227,140
|
|
341,353
|
|
368,313
|
|
||||||||||
|
Corporate expenses
|
47,041
|
|
18,979
|
|
34,390
|
|
70,044
|
|
64,148
|
|
||||||||||
|
Depreciation and amortization
|
38,290
|
|
14,544
|
|
59,383
|
|
95,268
|
|
94,972
|
|
||||||||||
|
Impairment charges
|
91,382
|
|
—
|
|
—
|
|
—
|
|
—
|
|
||||||||||
|
Other operating income (expense), net
|
(27
|
)
|
(127
|
)
|
3,246
|
|
(9,880
|
)
|
(1,366
|
)
|
||||||||||
|
Operating income
|
19,149
|
|
47,891
|
|
133,688
|
|
140,822
|
|
165,126
|
|
||||||||||
|
Interest expense (income), net
|
(99
|
)
|
(400
|
)
|
69,711
|
|
100,967
|
|
96,095
|
|
||||||||||
|
Gain (loss) on investments, net
|
(10,237
|
)
|
—
|
|
—
|
|
1,735
|
|
(22,663
|
)
|
||||||||||
|
Equity in loss of nonconsolidated affiliates
|
(7
|
)
|
(59
|
)
|
(24
|
)
|
(1
|
)
|
(254
|
)
|
||||||||||
|
Other income (expense), net
|
(127
|
)
|
150
|
|
(9,157
|
)
|
(12,457
|
)
|
3,348
|
|
||||||||||
|
Reorganization items, net
|
(36,118
|
)
|
9,497,944
|
|
—
|
|
—
|
|
—
|
|
||||||||||
|
Income (loss) from continuing operations before income taxes
|
(27,241
|
)
|
9,546,326
|
|
54,796
|
|
29,132
|
|
49,462
|
|
||||||||||
|
Income tax benefit (expense)
|
61,194
|
|
(100,289
|
)
|
(16,003
|
)
|
(16,758
|
)
|
12,670
|
|
||||||||||
|
Income from continuing operations
|
33,953
|
|
9,446,037
|
|
38,793
|
|
12,374
|
|
62,132
|
|
||||||||||
|
Income (loss) from discontinued operations, net of tax
|
(169,554
|
)
|
1,854,677
|
|
—
|
|
—
|
|
—
|
|
||||||||||
|
Net income (loss)
|
(135,601
|
)
|
11,300,714
|
|
38,793
|
|
12,374
|
|
62,132
|
|
||||||||||
|
Less amount attributable to noncontrolling interest
|
(21,218
|
)
|
2,190
|
|
—
|
|
—
|
|
751
|
|
||||||||||
|
Net income (loss) attributable to the Company
|
$
|
(114,383
|
)
|
$
|
11,298,524
|
|
$
|
38,793
|
|
$
|
12,374
|
|
$
|
61,381
|
|
|||||
|
Net income (loss) attributable to the Company per common share:
|
||||||||||||||||||||
|
From continuing operations - Basic
|
$
|
0.40
|
|
$
|
110.28
|
|
$
|
0.27
|
|
$
|
0.08
|
|
$
|
0.42
|
|
|||||
|
From discontinued operations - Basic
|
$
|
(1.73
|
)
|
$
|
21.63
|
|
$
|
—
|
|
$
|
—
|
|
$
|
—
|
|
|||||
|
From continuing operations - Diluted
|
$
|
0.40
|
|
$
|
110.28
|
|
$
|
0.27
|
|
$
|
0.08
|
|
$
|
0.42
|
|
|||||
|
From discontinued operations - Diluted
|
$
|
(1.73
|
)
|
$
|
21.63
|
|
$
|
—
|
|
$
|
—
|
|
$
|
—
|
|
|||||
|
The Successor Company's Class A common shares are quoted for trading on the Nasdaq Global Select Market under the symbol IHRT. The Predecessor Company's Class A common shares were quoted for trading on the OTC / Pink Sheets Bulletin Board under the symbol IHRT.
|
||||||||||||||||||||
127
IHEARTMEDIA, INC.
AND SUBSIDIARIES
NOTES TO CONSOLIDATED FINANCIAL STATEMENTS
|
(In thousands, except per share data)
|
Predecessor Company
|
||||||||||||||
|
Three Months Ended
March 31,
|
Three Months Ended
June 30,
|
Three Months Ended
September 30,
|
Three Months Ended
December 31,
|
||||||||||||
|
2018
|
2018
|
2018
|
2018
|
||||||||||||
|
Revenue
|
$
|
772,772
|
|
$
|
891,764
|
|
$
|
920,492
|
|
$
|
1,026,295
|
|
|||
|
Operating expenses:
|
|||||||||||||||
|
Direct operating expenses
|
241,066
|
|
263,752
|
|
268,606
|
|
288,949
|
|
|||||||
|
Selling, general and administrative expenses
|
346,092
|
|
328,200
|
|
329,436
|
|
373,203
|
|
|||||||
|
Corporate expenses
|
52,898
|
|
52,478
|
|
56,699
|
|
65,433
|
|
|||||||
|
Depreciation and amortization
|
67,374
|
|
64,877
|
|
43,295
|
|
36,405
|
|
|||||||
|
Impairment charges
|
—
|
|
—
|
|
33,150
|
|
—
|
|
|||||||
|
Other operating expense, net
|
(3,232
|
)
|
(1,218
|
)
|
(2,462
|
)
|
(2,354
|
)
|
|||||||
|
Operating income
|
62,110
|
|
181,239
|
|
186,844
|
|
259,951
|
|
|||||||
|
Interest expense
|
321,133
|
|
10,613
|
|
2,097
|
|
955
|
|
|||||||
|
Gain (loss) on investments, net
|
—
|
|
9,175
|
|
186
|
|
(9,833
|
)
|
|||||||
|
Equity in earnings (loss) of nonconsolidated affiliates
|
(31
|
)
|
(32
|
)
|
(30
|
)
|
209
|
|
|||||||
|
Other expense, net
|
(20,416
|
)
|
(2,058
|
)
|
(281
|
)
|
(252
|
)
|
|||||||
|
Reorganization items, net
|
(192,055
|
)
|
(68,740
|
)
|
(52,475
|
)
|
(42,849
|
)
|
|||||||
|
Income (loss) from continuing operations before income taxes
|
(471,525
|
)
|
108,971
|
|
132,147
|
|
206,271
|
|
|||||||
|
Income tax benefit (expense)
|
162,733
|
|
(142,032
|
)
|
(10,873
|
)
|
(23,664
|
)
|
|||||||
|
Income (loss) from continuing operations
|
(308,792
|
)
|
(33,061
|
)
|
121,274
|
|
182,607
|
|
|||||||
|
Income (loss) from discontinued operations
|
(124,248
|
)
|
(33,229
|
)
|
(49,491
|
)
|
42,301
|
|
|||||||
|
Net income (loss)
|
(433,040
|
)
|
(66,290
|
)
|
71,783
|
|
224,908
|
|
|||||||
|
Less amount attributable to noncontrolling interest
|
(16,046
|
)
|
3,609
|
|
1,705
|
|
10,003
|
|
|||||||
|
Net income (loss) attributable to the Company
|
$
|
(416,994
|
)
|
$
|
(69,899
|
)
|
$
|
70,078
|
|
$
|
214,905
|
|
|||
|
Net income (loss) to the Company per common share:
|
|||||||||||||||
|
From continuing operations - Basic
|
$
|
(3.62
|
)
|
$
|
(0.39
|
)
|
$
|
1.42
|
|
$
|
2.14
|
|
|||
|
From discontinued operations - Basic
|
$
|
(1.27
|
)
|
$
|
(0.43
|
)
|
$
|
(0.60
|
)
|
$
|
0.37
|
|
|||
|
From continuing operations - Diluted
|
$
|
(3.62
|
)
|
$
|
(0.39
|
)
|
$
|
1.42
|
|
$
|
2.14
|
|
|||
|
From discontinued operations - Diluted
|
$
|
(1.27
|
)
|
$
|
(0.43
|
)
|
$
|
(0.60
|
)
|
$
|
0.37
|
|
|||
|
The Predecessor Company's Class A common shares were quoted for trading on the OTC / Pink Sheets Bulletin Board under the symbol IHRT.
|
|||||||||||||||
NOTE 17
– CERTAIN RELATIONSHIPS AND RELATED PARTY TRANSACTIONS
iHeartCommunications Line of Credit
On the Effective Date, iHeartCommunications entered into a revolving loan agreement with CCOL and Clear Channel International, Ltd., both subsidiaries of CCOH, governing a revolving credit facility that provided for borrowings of up to
$200 million
. The iHeartCommunications line of credit was unsecured. On July 30, 2019, in connection with the consummation of an underwritten public offering of common stock of CCOH, the borrowers terminated the iHeartCommunications line of credit. As of the date of termination there were no amounts drawn under the facility.
Transition Services Agreement
On the Effective Date, the Company, iHM Management Services, iHeartCommunications and CCOH entered into the Transition Services Agreement. For information regarding the Transition Services Agreement, refer to Note 4,
Discontinued Operations
.
128
IHEARTMEDIA, INC.
AND SUBSIDIARIES
NOTES TO CONSOLIDATED FINANCIAL STATEMENTS
New Tax Matters Agreement
On the Effective Date, the Company entered into the New Tax Matters Agreement by and among the Company, iHeartCommunications, iHeart Operations, CCH, CCOH and Clear Channel Outdoor, Inc., to allocate the responsibility of the Company and its subsidiaries, on the one hand, and the Outdoor Group, on the other, for the payment of taxes arising prior and subsequent to, and in connection with, the Separation. For information regarding the New Tax Matters Agreement, refer to Note 4,
Discontinued Operations
.
129
ITEM 9. Changes in and Disagreements with Accountants on Accounting and Financial Disclosure
Not Applicable
ITEM 9A. Controls and Procedures
Disclosure Controls and Procedures
Limitations on Effectiveness of Controls and Procedures
In designing and evaluating our disclosure controls and procedures, management recognizes that any controls and procedures, no matter how well designed and operated, can provide only reasonable assurance of achieving the desired control objectives. In addition, the design of disclosure controls and procedures must reflect that there are resource constraints and that management is required to apply judgment in evaluating the benefits of possible controls and procedures relative to their costs.
Evaluation of Disclosure Controls and Procedures
Our management, with the participation of our Chief Executive Officer and Chief Financial Officer, conducted an evaluation of our disclosure controls and procedures (as such term is defined in Rules 13a-15(e) and 15d-15(e) under the Exchange Act). Based on this evaluation, our Chief Executive Officer and Chief Financial Officer concluded that our disclosure controls and procedures were effective at the reasonable assurance level as of December 31,
2019
.
Management’s Annual Report on Internal Control over Financial Reporting
Management is responsible for establishing and maintaining adequate internal control over financial reporting, as such term is defined in Rule 13a-15(f) under the Securities Exchange Act of 1934, as amended.
There are inherent limitations to the effectiveness of any control system, however well designed, including the possibility of human error and the possible circumvention or overriding of controls. Further, the design of a control system must reflect the fact that there are resource constraints, and the benefits of controls must be considered relative to their costs. The design of a control system also is based in part upon assumptions and judgments made by management about the likelihood of future events, and there can be no assurance that a control will be effective under all potential future conditions. As a result, even an effective system of internal control over financial reporting can provide no more than reasonable assurance with respect to the fair presentation of financial statements and the processes under which they were prepared.
As of December 31,
2019
, management assessed the effectiveness of our internal control over financial reporting based on the criteria for effective internal control over financial reporting established in Internal Control - Integrated Framework issued by the Committee of Sponsoring Organizations of the Treadway Commission (2013 Framework). Based on the assessment, management concluded that our internal control over financial reporting was effective as of December 31,
2019
, based on those criteria.
Ernst & Young LLP, our independent registered public accounting firm, has issued an attestation report on our internal control over financial reporting, which appears in this Item under the heading “Report of Independent Registered Public Accounting Firm.”
Changes in Internal Control over Financial Reporting
There were no changes in our internal control over financial reporting that occurred during the quarter ended
December 31, 2019
that have materially affected, or are reasonably likely to materially affect, our internal control over financial reporting.
130
Report of Independent Registered Public Accounting Firm
To the
Stockholders
and the Board of
Directors
of
iHeartMedia, Inc.
Opinion on Internal Control over Financial Reporting
We have audited
iHeartMedia, Inc.
and subsidiaries' (the Company) internal control over financial reporting as of December 31,
2019
, based on criteria established in Internal Control-Integrated Framework issued by the Committee of Sponsoring Organizations of the Treadway Commission (2013 framework) (the COSO criteria). In our opinion, the Company maintained, in all material respects, effective internal control over financial reporting as of December 31,
2019
, based on the COSO criteria.
We also have audited, in accordance with the standards of the Public Company Accounting Oversight Board (United States) (PCAOB), the
2019
consolidated financial statements of the Company and our report dated
February 27, 2020
expressed an unqualified opinion thereon that included an explanatory paragraph regarding the Company’s ability to continue as a going concern.
Basis for Opinion
The Company's management is responsible for maintaining effective internal control over financial reporting and for its assessment of the effectiveness of internal control over financial reporting included in the accompanying Management's Annual Report on Internal Control over Financial Reporting. Our responsibility is to express an opinion on the Company's internal control over financial reporting based on our audit. We are a public accounting firm registered with the PCAOB and are required to be independent with respect to the Company in accordance with the U.S. federal securities laws and the applicable rules and regulations of the Securities and Exchange Commission and the PCAOB.
We conducted our audit in accordance with the standards of the PCAOB. Those standards require that we plan and perform the audit to obtain reasonable assurance about whether effective internal control over financial reporting was maintained in all material respects.
Our audit included obtaining an understanding of internal control over financial reporting, assessing the risk that a material weakness exists, testing and evaluating the design and operating effectiveness of internal control based on the assessed risk, and performing such other procedures as we considered necessary in the circumstances. We believe that our audit provides a reasonable basis for our opinion.
Definition and Limitations on Internal Control over Financial Reporting
A company's internal control over financial reporting is a process designed to provide reasonable assurance regarding the reliability of financial reporting and the preparation of financial statements for external purposes in accordance with generally accepted accounting principles. A company's internal control over financial reporting includes those policies and procedures that (1) pertain to the maintenance of records that, in reasonable detail, accurately and fairly reflect the transactions and dispositions of the assets of the company; (2) provide reasonable assurance that transactions are recorded as necessary to permit preparation of financial statements in accordance with generally accepted accounting principles, and that receipts and expenditures of the company are being made only in accordance with authorizations of management and directors of the company; and (3) provide reasonable assurance regarding prevention or timely detection of unauthorized acquisition, use, or disposition of the company's assets that could have a material effect on the financial statements.
Because of its inherent limitations, internal control over financial reporting may not prevent or detect misstatements. Also, projections of any evaluation of effectiveness to future periods are subject to the risk that controls may become inadequate because of changes in conditions, or that the degree of compliance with the policies or procedures may deteriorate.
/s/ Ernst & Young LLP
San Antonio, Texas
February 27, 2020
131
ITEM 9B. Other Information
None
132
PART III
ITEM 10.
Directors, Executive Officers and Corporate Governance
The information required by this item with respect to our executive officers is set forth at the end of Part I of this Annual Report on Form 10-K.
Our Code of Business Conduct and Ethics (the “Code of Conduct”) applies to all of our officers, directors and employees, including our principal executive officer, principal financial officer and principal accounting officer. The Code of Conduct is publicly available on our Internet website at www.iheartmedia.com. We intend to satisfy the disclosure required by law or Nasdaq Stock Market listing standards regarding any amendment to, or waiver from, a provision of the Code of Conduct by posting such information on our website at www.iheartmedia.com.
All other information required by this item is incorporated by reference to the sections captioned “Election of Directors” and “Corporate Governance” set forth in our Definitive Proxy Statement for our 2020 Annual Meeting of Stockholders (the “Definitive Proxy Statement”), which we expect to file with the SEC within 120 days after our fiscal year end.
ITEM 11. Executive Compensation
The information required by this item is incorporated by reference to the sections captioned “Executive Compensation,” “Director Compensation” and “Corporate Governance” set forth in our Definitive Proxy Statement, which we expect to file with the SEC within 120 days after our fiscal year end.
ITEM 12.
Security Ownership of Certain Beneficial Owners and Management and Related Stockholder Matters
|
Plan Category
|
Number of Securities to be issued upon exercise of outstanding options, warrants and rights (Column A)
|
Weighted-Average exercise price of outstanding options, warrants and rights
(1)
|
Number of Securities remaining available for future issuance under equity compensation plans (excluding securities reflected in Column A)
|
|||||||
|
Equity Compensation Plans approved by security holders
(2)
|
8,293,503
(3)
|
|
$
|
18.93
|
|
5,557,231
|
|
|||
|
Equity Compensation Plans not approved by security holders
|
—
|
—
|
—
|
|||||||
|
Total
|
8,293,503
|
|
$
|
18.93
|
|
5,557,231
|
|
|||
|
(1)
|
The weighted-average exercise price is calculated based solely on the exercise prices of the outstanding options and does not reflect the shares that will be issued upon the vesting of outstanding awards of restricted stock, which have no exercise price.
|
|
(2)
|
Represents the 2019 Incentive Equity Plan.
|
|
(3)
|
This number includes shares subject to outstanding awards granted, of which 5,645,468 shares are subject to outstanding options and 2,648,035 shares are subject to outstanding RSUs.
|
All other information required by this item is incorporated by reference to the section captioned “Security Ownership of Certain Beneficial Owners and Management” in our Definitive Proxy Statement, which we expect to file with the SEC within 120 days after our fiscal year end.
ITEM 13. Certain Relationships and Related Transactions, and Director Independence
The information required by this item is incorporated by reference to the sections captioned “Corporate Governance” and “Certain Relationships and Related Person Transactions” in our Definitive Proxy Statement, which we expect to file with the SEC within 120 days after our fiscal year end.
133
ITEM 14. Principal Accounting Fees and Services
The information required by this item is incorporated by reference to the section captioned “Principal Accountant Fees and Services” and “Pre-Approval Policies and Procedures” in our Definitive Proxy Statement, which we expect to file with the SEC within 120 days after our fiscal year end.
134
PART IV
ITEM 15. Exhibits and Financial Statement Schedules
(a)1. Financial Statements.
The following consolidated financial statements are included in Item 8:
Consolidated Balance Sheets.
Consolidated Statements of Comprehensive Income (Loss).
Consolidated Statements of Changes in
Stockholders'
Equity (Deficit).
Consolidated Statements of Cash Flows.
Notes to Consolidated Financial Statements
2. Financial Statement Schedule.
The following financial statement schedule and related report of independent auditors is filed as part of this report and should be read in conjunction with the consolidated financial statements.
Schedule II Valuation and Qualifying Accounts
All other schedules for which provision is made in the applicable accounting regulation of the Securities and Exchange Commission are not required under the related instructions or are inapplicable, and therefore have been omitted.
135
SCHEDULE II
VALUATION AND QUALIFYING ACCOUNTS
Allowance for Doubtful Accounts
|
(In thousands)
|
||||||||||||||||||||||||
|
Description
|
Balance at Beginning of Period
|
Charges to Costs, Expenses and Other
|
Write-off of Accounts Receivable
|
Impact of Fresh Start Accounting
|
Other
(1)
|
Balance at End of Period
|
||||||||||||||||||
|
Year ended December 31, 2017 (Predecessor)
|
$
|
11,484
|
|
$
|
32,204
|
|
$
|
17,743
|
|
$
|
—
|
|
$
|
18
|
|
$
|
25,963
|
|
||||||
|
Year ended December 31, 2018 (Predecessor)
|
$
|
25,963
|
|
$
|
21,042
|
|
$
|
20,409
|
|
$
|
—
|
|
$
|
(12
|
)
|
$
|
26,584
|
|
||||||
|
Period from January 1, 2019 through May 1, 2019 (Predecessor)
|
$
|
26,584
|
|
$
|
4,728
|
|
$
|
8,622
|
|
$
|
(22,689
|
)
|
$
|
(1
|
)
|
$
|
—
|
|
||||||
|
Period from May 2, 2019 through December 31, 2019 (Successor)
|
$
|
—
|
|
$
|
12,628
|
|
$
|
—
|
|
$
|
—
|
|
$
|
1
|
|
$
|
12,629
|
|
||||||
|
(1)
|
Primarily foreign currency adjustments and acquisition and/or divestiture activity.
|
Deferred Tax Asset Valuation Allowance
|
(In thousands)
|
||||||||||||||||||||||||
|
Description
|
Balance at Beginning of Period
|
Charges to Costs, Expenses and Other
|
Reversal
(2)
|
Impact of Fresh Start Accounting
|
Adjustments
(3)
|
Balance at End of Period
|
||||||||||||||||||
|
Year ended December 31, 2017 (Predecessor)
|
$
|
853,885
|
|
$
|
160,572
|
|
$
|
—
|
|
$
|
—
|
|
$
|
(336,339
|
)
|
$
|
678,118
|
|
||||||
|
Year ended December 31, 2018 (Predecessor)
|
$
|
678,118
|
|
$
|
11,277
|
|
$
|
—
|
|
$
|
—
|
|
$
|
4,146
|
|
$
|
693,541
|
|
||||||
|
Period from January 1, 2019 through May 1, 2019 (Predecessor)
|
$
|
693,541
|
|
$
|
714,520
|
|
$
|
(316,374
|
)
|
$
|
(343,662
|
)
|
$
|
(28,539
|
)
|
$
|
719,486
|
|
||||||
|
Period from May 2, 2019 through December 31, 2019 (Successor)
|
$
|
719,486
|
|
$
|
1,870
|
|
$
|
(734
|
)
|
$
|
—
|
|
$
|
—
|
|
$
|
720,622
|
|
||||||
|
(1)
|
During
2017
and
2018
, the Predecessor Company recorded a valuation allowance of
$160.6 million
and
$11.3 million
, respectively, on a portion of its deferred tax assets attributable to federal and state net operating loss carryforwards due to the uncertainty of the ability to utilize those losses in future periods. During the period from January 1 through May 1, 2019, the Predecessor Company recorded a valuation allowance of
$714.5 million
on the federal and state capital losses and separate state net operating losses generated in connection with the restructuring transactions.
|
|
(2)
|
During the period from January 1 through May 1, 2019, the Predecessor Company reversed certain valuation allowances as a result of the restructuring transaction which resulted in reduction of federal and state net operating losses due to the cancellation of debt income realized.
|
|
(3)
|
During 2017, the Predecessor Company adjusted the carrying value of its U.S. federal deferred tax balance due to the U.S. federal tax reform bill that was enacted in 2017. The tax bill reduced the U.S. federal corporate tax rate to 21% and resulted in a reduction to the valuation allowance balance of
$336.3 million
during the period. During the period from
|
136
January 1 through May 1, 2019, the Predecessor Company adopted the new lease standard which resulted in a reduction in deferred tax assets and the release of
$28.5 million
in valuation allowance.
137
3. Exhibits.
|
Exhibit
Number
|
Description
|
|
|
2.1
|
|
|
|
3.1
|
||
|
3.2
|
||
|
4.1
|
|
|
|
4.2
|
|
|
|
4.3
|
|
|
|
4.4
|
|
|
|
4.5
|
||
|
4.6
|
|
|
|
4.7
|
|
|
|
4.8
|
|
|
|
4.9
|
|
|
|
4.10
|
|
|
|
4.11*
|
|
|
|
10.1
|
|
|
138
|
10.2
|
|
|
|
10.3
|
|
|
|
10.4
|
|
|
|
10.5
|
|
|
|
10.6
|
|
|
|
10.7
|
|
|
|
10.8
|
||
|
10.9
|
|
|
|
10.10
|
|
|
|
10.11
|
|
|
|
10.12
|
|
|
|
10.13§
|
|
|
|
10.14§
|
|
|
139
|
10.15§
|
|
|
|
10.16§*
|
|
|
|
10.17§
|
|
|
|
10.18§*
|
|
|
|
10.19§
|
|
|
|
10.20§
|
|
|
|
10.21§
|
|
|
|
10.22§
|
|
|
|
10.23§
|
|
|
|
10.24§
|
|
|
|
10.25*
|
|
|
|
10.26*
|
|
|
|
10.27§
|
|
|
|
10.28§
|
|
|
|
10.29
|
|
|
|
10.30*
|
|
|
|
10.31*
|
|
|
|
21*
|
|
|
|
23*
|
||
140
|
24*
|
Power of Attorney (included on signature page).
|
|
|
31.1*
|
|
|
|
31.2*
|
|
|
|
32.1**
|
|
|
|
32.2**
|
|
|
|
101.INS*
|
XBRL Instance Document.
|
|
|
101.SCH*
|
XBRL Taxonomy Extension Schema Document.
|
|
|
101.CAL*
|
XBRL Taxonomy Extension Calculation Linkbase Document.
|
|
|
101.DEF*
|
XBRL Taxonomy Extension Definition Linkbase Document.
|
|
|
101.LAB*
|
XBRL Taxonomy Extension Label Linkbase Document.
|
|
|
101.PRE*
|
XBRL Taxonomy Extension Presentation Linkbase Document.
|
|
_________________
* Filed herewith.
** This exhibit is furnished herewith and shall not be deemed “filed” for purposes of Section 18 of the Securities Exchange Act of 1934, or otherwise subject to the liability of that section, and shall not be deemed to be incorporated by reference into any filing under the Securities Act of 1933 or the Securities Exchange Act of 1934.
§ A management contract or compensatory plan or arrangement required to be filed as an exhibit pursuant to Item 601 of Regulation S-K.
ITEM 16. Form 10-K Summary
None.
141
SIGNATURES
Pursuant to the requirements of Section 13 or 15(d) of the Securities Exchange Act of 1934, the Registrant has duly caused this report to be signed on its behalf by the undersigned, thereunto duly authorized.
IHEARTMEDIA, INC.
|
By:
|
/s/ Robert W. Pittman
|
|
|
Name:
|
Robert W. Pittman
|
|
|
Title:
|
Chairman and Chief Executive Officer
|
|
|
Date:
|
February 27, 2020
|
|
Power of Attorney
Each person whose signature appears below authorizes Robert W. Pittman, Richard J. Bressler and Scott D. Hamilton, or any one of them, each of whom may act without joinder of the others, to execute in the name of each such person who is then an officer or
director
of the Registrant and to file any amendments to this Annual Report on Form 10-K necessary or advisable to enable the Registrant to comply with the Securities Exchange Act of 1934, as amended, and any rules, regulations and requirements of the Securities and Exchange Commission in respect thereof, which amendments may make such changes in such report as such attorney-in-fact may deem appropriate.
Pursuant to the requirements of the Securities Exchange Act of 1934, this report has been signed by the following persons on behalf of the Registrant and in the capacities and on the dates indicated.
|
Name
|
Title
|
Date
|
|
/s/ Robert W. Pittman
Robert W. Pittman
|
Chairman and Chief Executive Officer (Principal Executive Officer) and Director
|
February 27, 2020
|
|
/s/ Richard J. Bressler
Richard J. Bressler
|
President, Chief Operating Officer, Chief Financial Officer (Principal Financial Officer) and Director
|
February 27, 2020
|
|
/s/ Scott D. Hamilton
Scott D. Hamilton
|
Senior Vice President, Chief Accounting Officer (Principal Accounting Officer) and Assistant Secretary
|
February 27, 2020
|
|
/s/ James A. Rasulo
James A. Rasulo
|
Director
|
February 27, 2020
|
|
/s/ Gary Barber
Gary Barber
|
Director
|
February 27, 2020
|
|
/s/ Brad Gerstner
Brad Gerstner
|
Director
|
February 27, 2020
|
|
/s/ Sean Mahoney
Sean Mahoney
|
Director
|
February 27, 2020
|
|
/s/ Kamakshi Sivaramakrishnan
Kamakshi Sivaramakrishnan
|
Director
|
February 27, 2020
|
142
TABLE OF CONTENTS
Part IItem 1. BusinessItem 1A. Risk FactorsItem 1B. Unresolved Staff CommentsItem 2. PropertiesItem 3. Legal ProceedingsItem 4. Mine Safety DisclosuresPart IIItem 5. Market For Registrant S Common Equity, Related Stockholder Matters and Issuer Purchases Of Equity SecuritiesItem 6. Selected Financial DataItem 7. Management S Discussion and Analysis Of Financial Condition and Results Of OperationsItem 7A. Quantitative and Qualitative Disclosures About Market RiskItem 8. Financial Statements and Supplementary DataNote 1 Summary Of Significant Accounting PoliciesNote 2 - Emergence From Voluntary Reorganization Under Chapter 11 ProceedingsNote 3 - Fresh Start AccountingNote 4 - Discontinued OperationsNote 5 RevenueNote 6 LeasesNote 7 Property, Plant and Equipment, Intangible Assets and GoodwillNote 8 InvestmentsNote 9 Long-term DebtNote 10 Commitments and ContingenciesNote 11 Income TaxesNote 12 Stockholders Equity (deficit)Note 13 Employee Stock and Savings PlansNote 14 Other InformationNote 15 Segment DataNote 16 Quarterly Results Of Operations (unaudited)Note 17 Certain Relationships and Related Party TransactionsItem 9. Changes in and Disagreements with Accountants on Accounting and Financial DisclosureItem 9A. Controls and ProceduresItem 9B. Other InformationPart IIIItem 10. Directors, Executive Officers and Corporate GovernanceItem 11. Executive CompensationItem 12. Security Ownership Of Certain Beneficial Owners and Management and Related Stockholder MattersItem 13. Certain Relationships and Related Transactions, and Director IndependenceItem 14. Principal Accounting Fees and ServicesPart IVItem 15. Exhibits and Financial Statement SchedulesItem 16. Form 10-k Summary