NUZEE, INC.
10-Ks and 10-Qs
|
|
|
|
|
|
|
|
|
|
|
|
|
|
|
|
|
|
|
|
|
|
|
UNITED STATES
SECURITIES AND EXCHANGE COMMISSION
WASHINGTON, D.C. 20549
FORM 10-K
☒
ANNUAL REPORT PURSUANT TO SECTION 13 OR 15(d) OF THE SECURITIES EXCHANGE ACT OF 1934
For the fiscal year ended
September 30, 2017
or
☐
TRANSITION REPORT PURSUANT TO SECTION 13 OR 15(d) OF THE SECURITIES EXCHANGE ACT OF 1934
For the transition period from
to
Commission File No. 333-176684
|
NUZEE, INC.
|
|
(exact name of registrant as specified in its charter)
|
|
NEVADA
|
|
38-3849791
|
|
(State or other jurisdiction of incorporation or organization)
|
|
(I.R.S. Employer Identification Number)
|
|
2865 Scott Street
Suite 107
Vista, CA 92081
|
|
(Address of principal executive offices)
|
Registrant's telephone number, including area code --
(760) 295-2408
Indicate by check mark if the registrant is a well-known seasoned issuer, as defined in Rule 405 of the Securities Act. Yes ☐ No ☒
Indicate by check mark if the registrant is not required to file reports pursuant to Section 13 or Section 15(d) of the Act. Yes ☐ No ☒
Note
– Checking the box above will not relieve any registrant required to file reports pursuant to Section 13 or 15(d) of the Exchange Act from their obligations under those Sections.
Indicate by check mark whether the registrant (1) has filed all reports required to be filed by Section 13 or 15(d) of the Securities Exchange Act of 1934 during the preceding 12 months (or for such shorter period that the Registrant was required to file such reports), and (2) has been subject to such filing requirements for the past 90 days. Yes ☒ No ☐
Indicate by check mark whether the registrant has submitted electronically and posted on its corporate Web site, if any, every Interactive Data File required to be submitted and posted pursuant to Rule 405 of Regulation S-T (§232.405 of this chapter) during the preceding 12 months (or for such shorter period that the registrant was required to submit and post such files). Yes ☒ No ☐
Indicate by check mark if disclosure of delinquent filers pursuant to Item 405 of Regulation S-K (§ 229.405 of this chapter) is not contained herein, and will not be contained, to the best of registrant's knowledge, in definitive proxy or information statements incorporated by reference in Part III of this Form 10-K or any amendment to this Form 10-K. ☐
Indicate by check mark whether the registrant is a large accelerated filer, an accelerated filer, a non-accelerated filer or a smaller reporting company. See definitions of "large accelerated filer," "accelerated filer" and "smaller reporting company" in Rule 12b-2 of the Exchange Act.
|
Large accelerated filer
|
☐
|
|
|
Accelerated filer
|
☐
|
|
Non-accelerated filer
|
☐
|
(Do not check if smaller reporting company)
|
|
Smaller reporting company
|
☒
|
Indicate by check mark whether the registrant is a shell company (as defined in Rule 12b-2 of the Exchange Act). Yes ☐ No ☒
As of February 20, 2018, NuZee, Inc. had 36,062,321shares of common stock outstanding.
SPECIAL NOTE REGARDING FORWARD LOOKING STATEMENTS
This document contains forward-looking statements which reflect the views of NuZee, Inc. (formerly, Havana Furnishings, Inc.) (hereinafter "NuZee" or the "Company") and with respect to future events and financial performance. These forward-looking statements are subject to certain uncertainties and other factors that could cause actual results to differ materially from such statements. From time to time, our management or persons acting on our behalf may make forward-looking statements to inform existing and potential security holders about our Company. All statements other than statements of historical facts included in this report regarding our financial position, business strategy, plans and objectives of management for future operations, industry conditions, and indebtedness covenant compliance are forward-looking statements. When used in this report, forward-looking statements are generally accompanied by terms or phrases such as "estimate," "expects", "project," "predict," "believe," "expect," "anticipate," "target," "plan," "intend," "seek," "goal," "will," "should," "may," "targets" or other words and similar expressions that convey the uncertainty of future events or outcomes. Items contemplating or making assumptions about, actual or potential future sales, market size, collaborations, and trends or operating results also constitute such forward-looking statements. We undertake no obligation to update or revise any forward-looking statements, whether as a result of new information, future events, or otherwise.
Forward-looking statements involve inherent risks and uncertainties, and important factors (many of which are beyond our control) that could cause actual results to differ materially from those set forth in the forward-looking statements, including the following: general economic or industry conditions, nationally and/or in the communities in which we conduct business, changes in the interest rate environment, legislation or regulatory requirements, conditions of the securities markets, our ability to raise capital, changes in accounting principles, policies or guidelines, financial or political instability, acts of war or terrorism, other economic, competitive, governmental, regulatory and technical factors affecting our operations, products, services, and prices.
We have based these forward-looking statements on our current expectations and assumptions about future events. While our management considers these expectations and assumptions to be reasonable, they are inherently subject to significant business, economic, competitive, regulatory and other risks, contingencies and uncertainties, most of which are difficult to predict and many of which are beyond our control. Accordingly, results actually achieved may differ materially from expected results in these statements. Forward-looking statements speak only as of the date they are made. You should consider carefully the statements in the section below entitled "Risk Factors" and other sections of this report, which describe factors that could cause our actual results to differ from those set forth in the forward-looking statements. We do not undertake, and specifically disclaims, any obligation to update any forward-looking statements to reflect events or circumstances occurring after the date of such statements.
Readers are urged not to place undue reliance on these forward-looking statements, which speak only as of the date of this report. We assume no obligation to update any forward-looking statements in order to reflect any event or circumstance that may arise after the date of this report, other than as may be required by applicable law or regulation. Readers are urged to carefully review and consider the various disclosures made by us in our reports filed with the Securities and Exchange Commission which attempt to advise interested parties of the risks and factors that may affect our business, financial condition, results of operation and cash flows. If one or more of these risks or uncertainties materialize, or if the underlying assumptions prove incorrect, our actual results may vary materially from those expected or projected.
REFERENCES
As used in this annual report: (i) the terms "we", "us", "our", "NuZee" and the "Company" mean NuZee, Inc.; (ii) "SEC" refers to the Securities and Exchange Commission; (iii) "Securities Act" refers to the United States
Securities Act of 1933
, as amended; (iv) "Exchange Act" refers to the United States
Securities Exchange Act of 1934
, as amended; and (v) all dollar amounts refer to United States dollars unless otherwise indicated.

Overview
NuZee-CA was established in 2011 as an importer and distributor of natural spring water and skincare products as well as energy drinks.
Up until September 30, 2013, our primary business was the distribution of natural and organic products produced by 3
rd
parties. These legacy product lines which included New Zealand bottled spring water, natural and organic skincare from New Zealand as well as the Torque
TM
energy drinks were phased out and/or discontinued in 2014 as the Company believed its best near and long term success was to focus resources on our own product line of functional beverages which will enable the Company to control, develop, manufacture and promote its brands from the United States.
During the 2013 fiscal year we began researching and investigating the viability of a new product platform for functional beverages and started producing our first family of functional beverages in early 2014. These products are considered healthy alternatives, with all-natural ingredients and provide an added wellness benefit when compared to the traditional non-fortified version of the same beverage.
As a result, NuZee's mission is to be a good-for-you company focused on building beverage brands that offer functional and nutritional benefits.
As of September, 2017, we have opened over 2,000 retail accounts with large chains including; Safeway, Whole Foods, HEB, Rouses, Jewel Osco, Lunardi's, Akin's, Buy For Less, Tony's Finer Foods, Lowe's, Albertsons, Kings, Meijers, Longs Drugs and many other smaller independent stores. We have obtained these customers by working with brokers, distributors and attending multiple trade show events where there are endless networking and business opportunities. In addition to the wholesale grocery chains we are working with Amazon exclusives and other online retailers, as well as contract co-packing and private labeling with an increased number of coffee roasters nationwide.
Our operational approach has and will remain to develop and manufacture our products under strict guidelines for good manufacturing and food safety practices before releasing our products to the market. We own our formulas and work with experts in beverage, nutrition and flavoring sciences to ensure our products not only taste delicious but are also good-for-you products using quality and natural ingredients with proven clinical research to support the functional efficacy. We are using multiple manufacturing partners, known in the industry as co-packers, to scale our manufacturing capabilities.
We sell our products directly to consumers through our
www.coffeeblenders.com
and
www.twinpeaksroasters.com
websites as well as through affiliate online stores and retailers.
Market Opportunity
As an emerging company in the functional beverage sector we are participating in a large growing market with historically growing sales. The functional beverage category is expected to reach $105 Billion Dollars by 2021. NuZee's products fall within the nutraceutical drink portion of the functional beverage market which accounts for approximately 6% or $1 billion in the United States annually.
Principal Products
After careful study and research conducted in 2014 the Company determined its first functional beverage will be a line of single-serve gourmet coffees. Our decision was based on numerous factors including the market for coffee and its continued growth, the ability to serve a cup of coffee quickly and conveniently as well as the ability for precise dosage of our active ingredients in pre-portioned packs. Our knowhow is tied to our formula, process and use of natural flavoring to mask the undesired off-notes produced by the added functional ingredients such that the original beverage is preserved and there are no deficiencies in the taste and aroma profile. Our family of products all utilize GRAS (Generally Recognized As Safe) ingredients that are also supported by clinical studies using the exact strength and dosage recommended by our ingredient partner's claims and research.
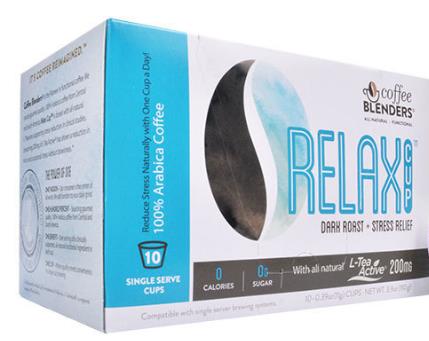
The Company made Coffee Blenders
(®)
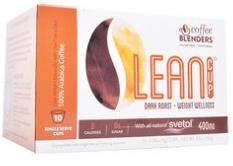
available in the first quarter of 2014. We believe Coffee Blenders to be the first line of gourmet specialty grade coffee offered in convenient single serve cups using only natural ingredients with clinically supported branded nutraceuticals. We initially launched three functional varieties of Coffee Blenders called Lean Cup
(®)
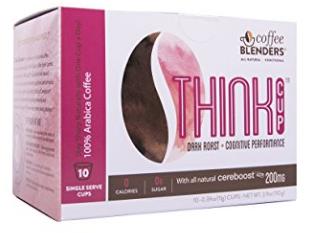
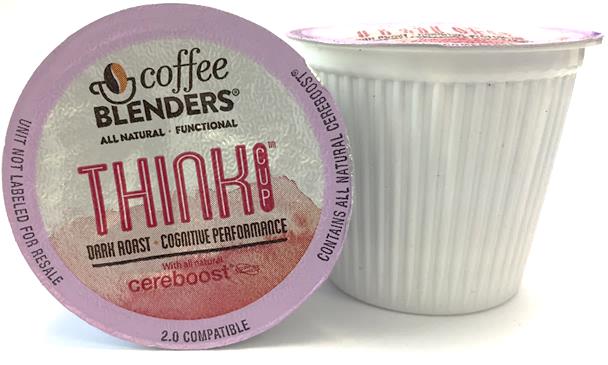
(for weight loss), Think Cup
(®)
(for cognitive performance) and Relax Cup
(®)
(for stress reduction), and recently launched one more functional variety called Active Cup
(®)
(for a pre-workout boost of energy).
Coffee Blenders are sold as single serve cup that are compatible with popular Keurig K-Cup
1
brewers and systems. Until late 2012, Keurig Green Mountain, Inc. enjoyed patent protection of the K-Cup. Expiration of the patent in September 2012 enabled 3rd party companies such as ours to produce K-Cup compatible packs for an existing installed base of brewers totaling more than 16 million units.
2
Each Coffee Blenders K-cup compatible pod includes a total of 11 grams of coffee plus natural ingredients and comes in retail packaging of 10 K-Cup compatible pods per box.
1
We are not affiliated with Keurig Green Mountain, Inc. Keurig
(®)
and K-Cup
(®)
are registered trademarks of Keurig Green Mountain, Inc.
2
Source: Form 10-K filed with the SEC by Keurig Green Mountain, Inc. on November 28th, 2012.
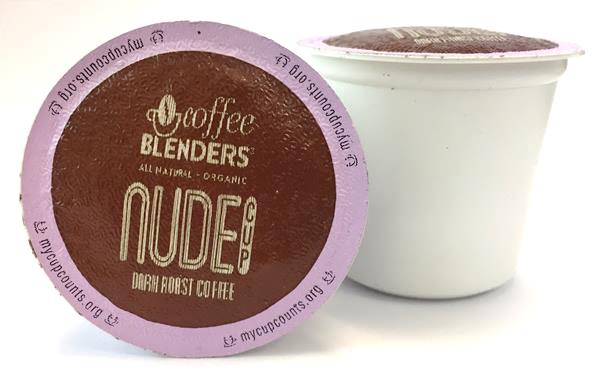
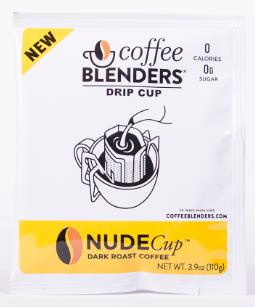
Since 2014 we have grown our line tremendously. In 2015, we started our Lotus Cup line, which is a gourmet pour-over coffee. The product name changed from Lotus Cup to Drip Cup in 2015, with our first cup being the Nude Cup
(®)
Gourmet Pour-Over. The Drip Cup quickly gained popularity within the coffee industry throughout 2015 and 2016. We have now extended the Drip Cup line to also include the functional varietals: Lean Cup, Think Cup and Relax Cup. Each Drip Cup includes a total of 11 grams of coffee plus natural ingredients and comes in retail packaging of 10 Drip Cup pouches per box.
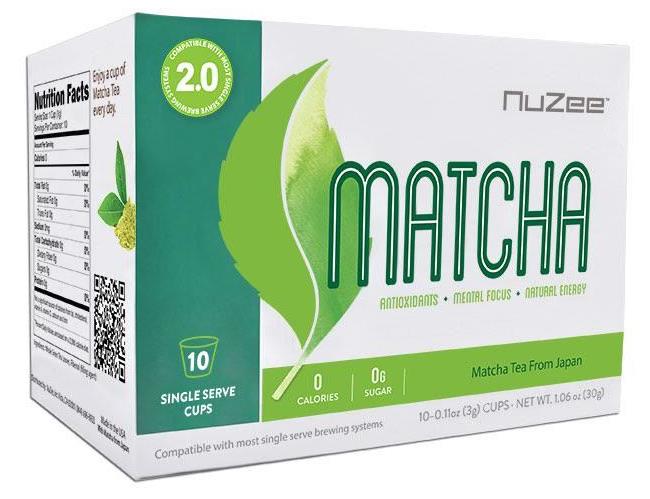
While our brand Coffee Blenders has gained name recognition in the coffee beverages market, we also wanted to expand into tea. Our only tea product, which was launched in July of 2016 is our Matcha Cup, which is available in single serve K-Cup compatible cups.
In October of 2016 we launched our Whole Bean coffee line and extended the line in early 2017 to include our Lean, Think, Relax functional SKU's using 100% arabica coffee.
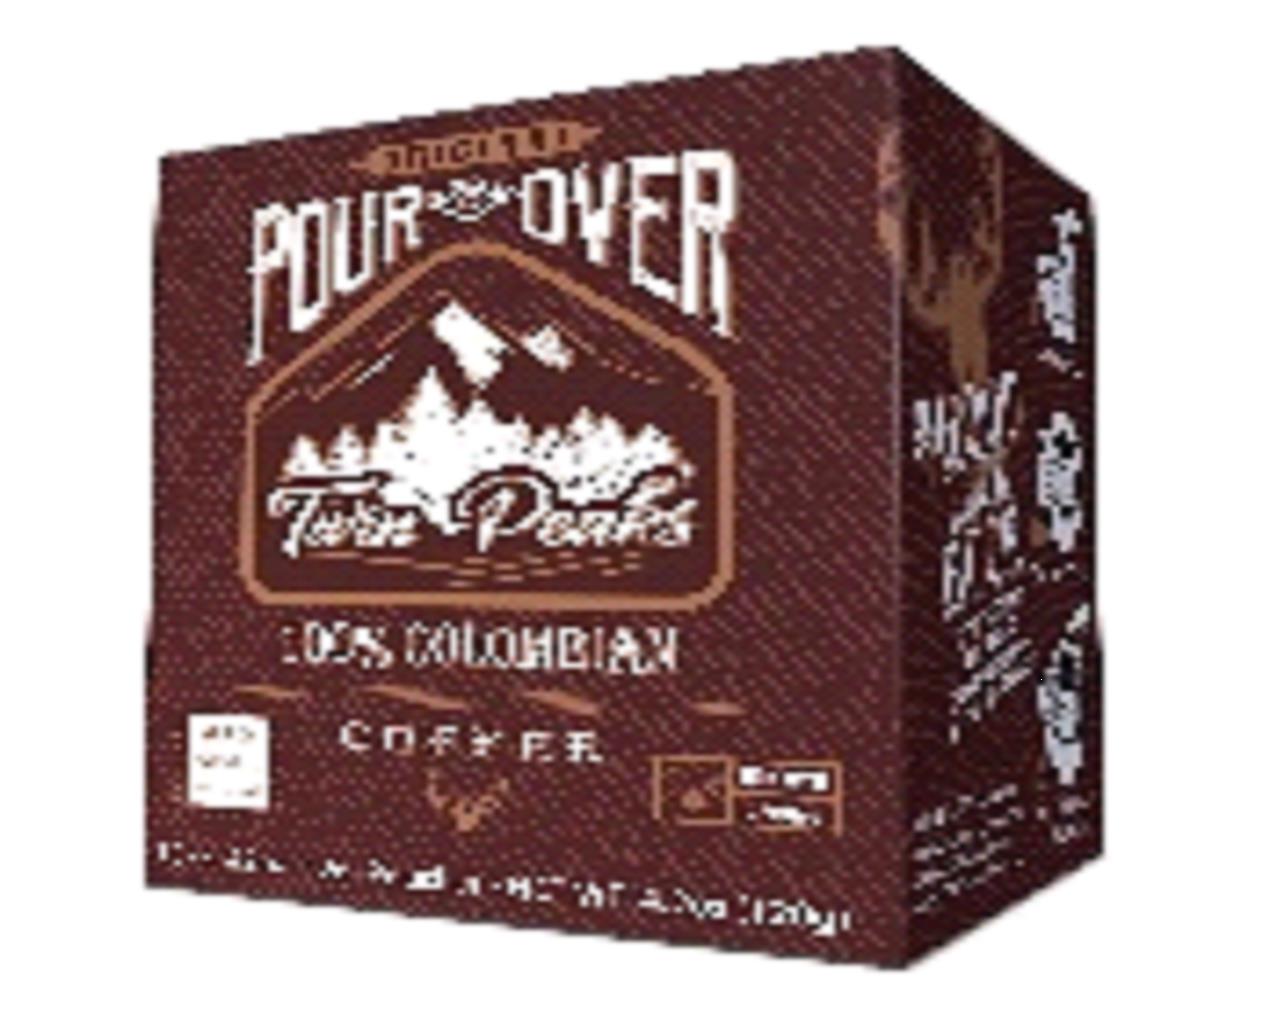
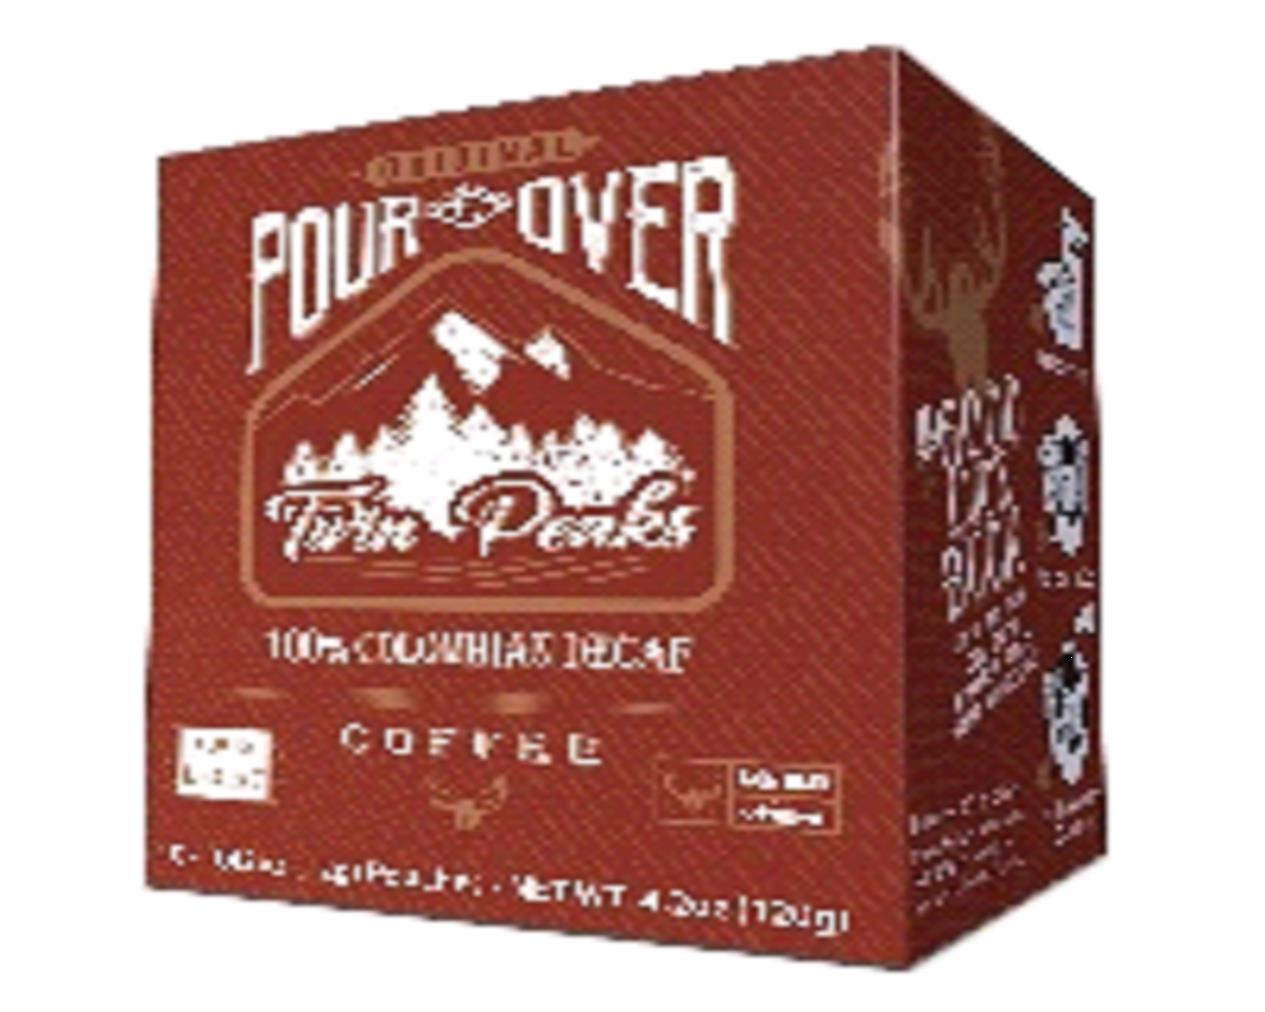
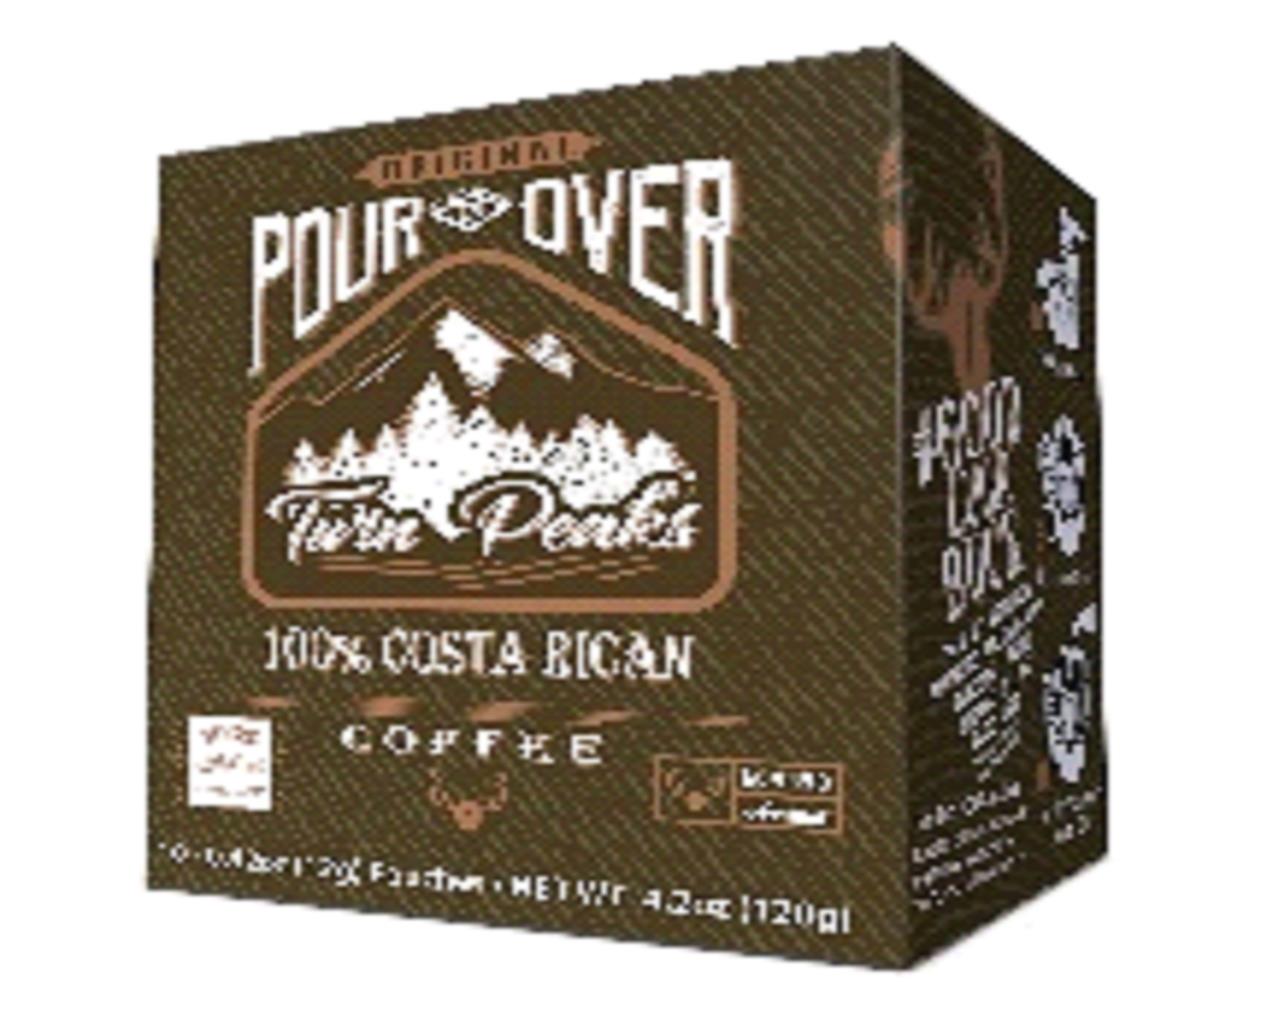
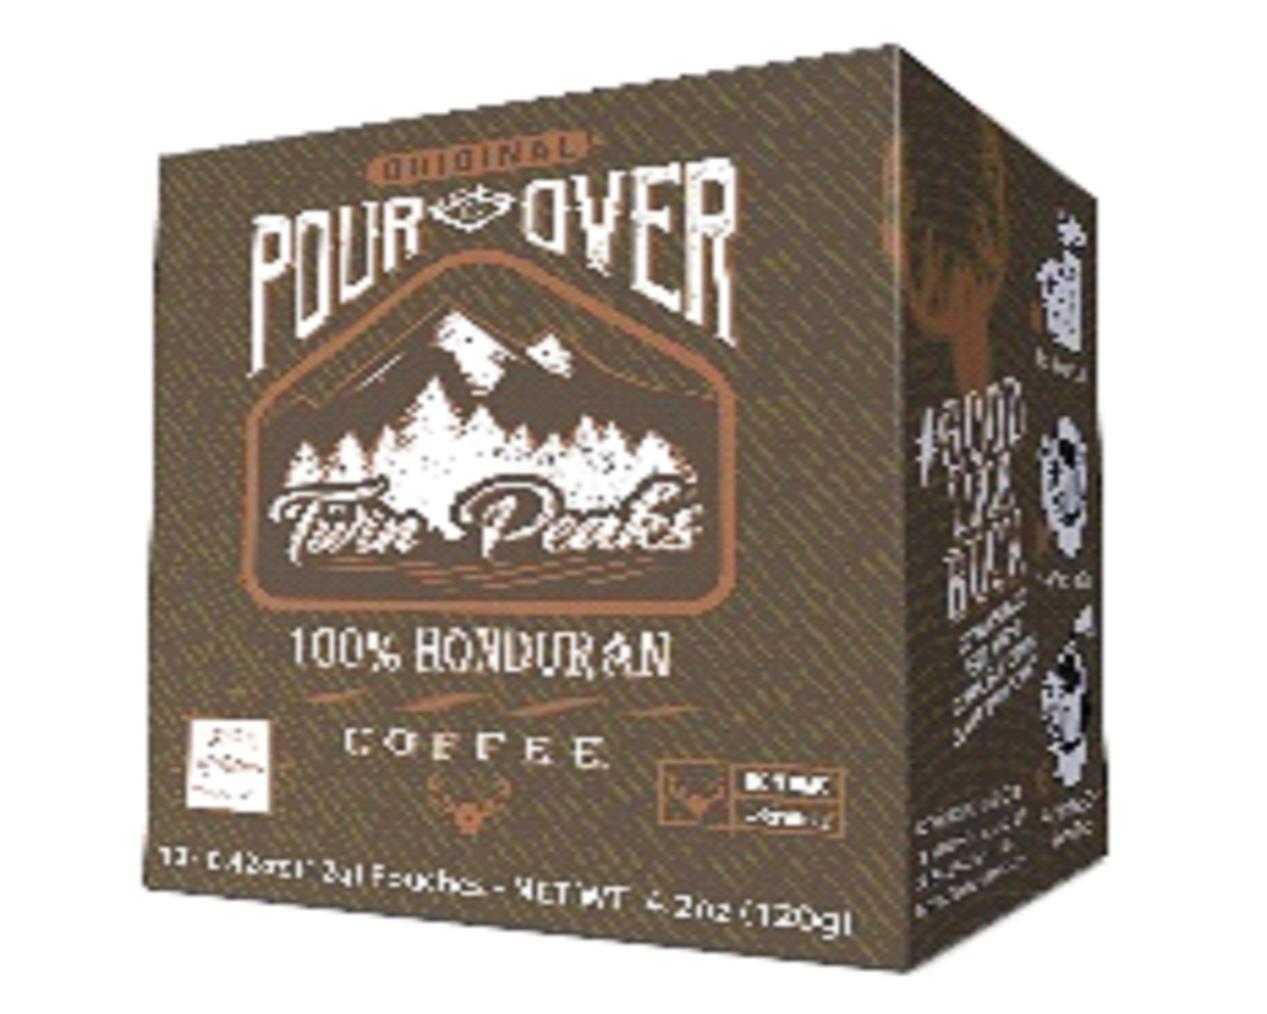
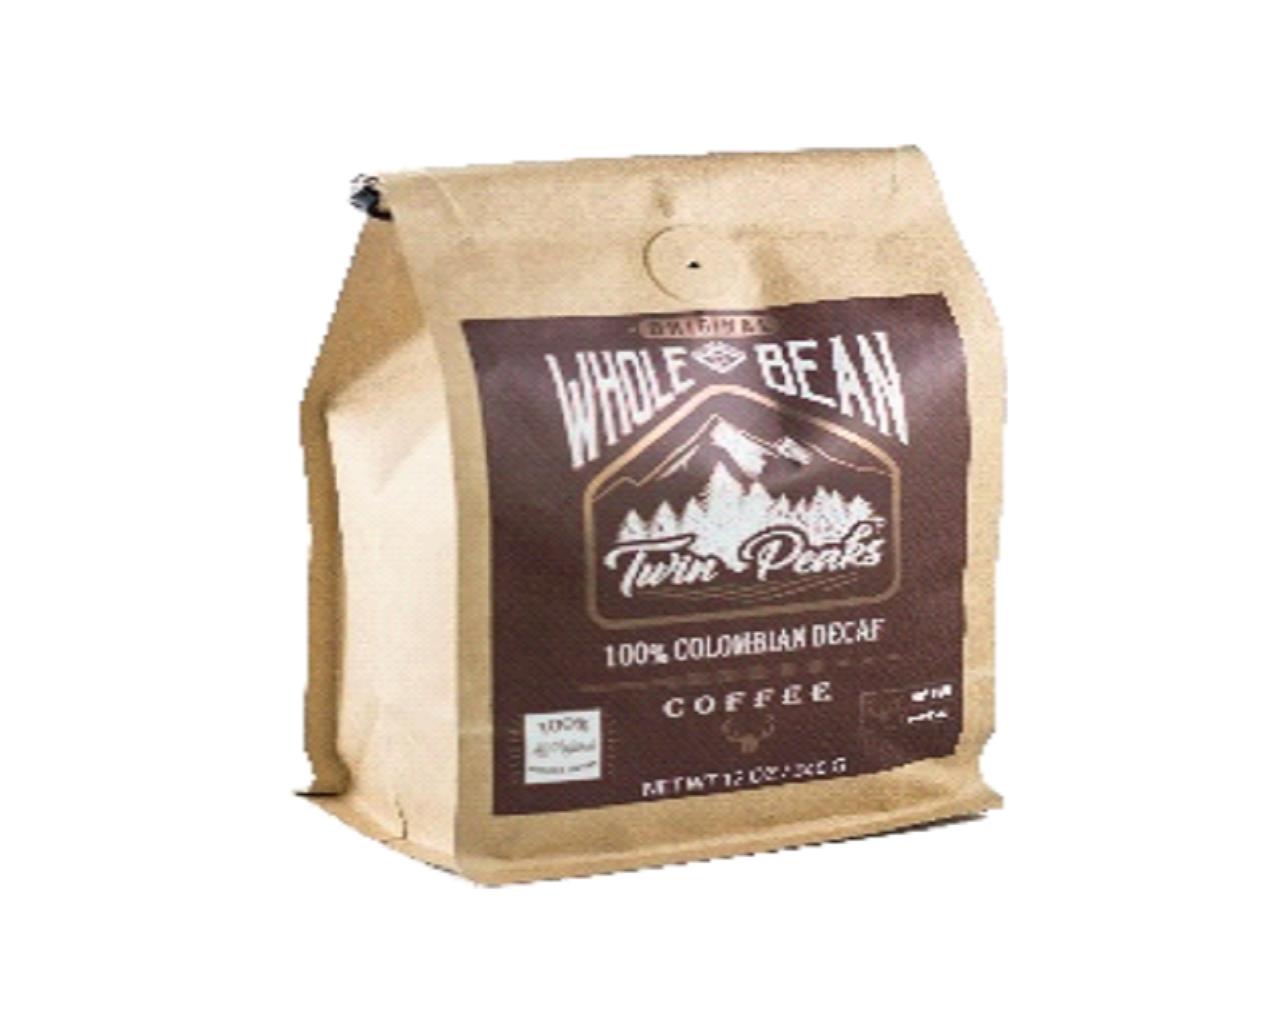
In August of 2017 we launched our Twin Peaks™ line of pour over drip coffee and our 12 oz bagged whole bean in 4 different SKU's. Colombian, Colombian Decaf, Honduran, & Costa Rican. The Twin Peaks fine line of coffees is marketed towards an outdoor active lifestyle consumer.
With all our products being the "hot coffee" category we also discussed breaking into the cold brew market which appears to be showing substantial growth in the beverage industry, and in November of 2017 we launched our line of ready-to-drink functional cold brew coffee's in 10oz glass bottles. With the success of our functional line of single serve cups and drip cups this was a natural line extension for Coffee Blenders.
Altogether, we currently have a total of 25 SKU's.
In 2018, we intend to focus our efforts on building our co-packing business for single serve pour over drip cup manufacturing and expanding our current operation further.
|
Coffee Blenders
®
|
Product Branding and Packaging for the Single Serve Line
|
|
www.CoffeeBlenders.com
|

|
|
Relax Cup
(®)
for Stress Reduction |

|
|
Lean Cup
(®)
for Weight Loss |

|
|
Think Cup
(®)
for Improved Cognitive Performance |
|
|
Nude Cup
(®)
Organic Coffee |

|
|
Active Cup
(®)
for Improved Workout Performance |


|
|
Matcha Cup
Green Tea |

|
|
Coffee Blenders --
®
|
Product Branding and Packaging for the Drip Cup Line
|
|
www.CoffeeBlenders.com
The Gourmet Pour-Over
|

|
|
Nude Cup
(®)
Organic Coffee
|

|
|
Relax Cup
(®)
for Stress Reduction |


|
|
Lean Cup
(®)
for Weight Loss |


|
|
Think Cup
(®)
for Improved Cognitive Performance |


|

|

|
|
Coffee Blenders
®
|
Product Branding and Packaging for Whole Bean Coffee Bag
|
|
Honduran Blend
Organic Dark Roast Coffee |

|
|
Honduran Blend
LEAN, THINK, & RELAX 12 oz bagged ground coffee |


|
|
Coffee Blenders Ready-To-Drink Cold Brew in NUDE, LEAN, THINK, & RELAX
|

|
|
Twin Peaks Single Serve Pour Over Coffee
|
|
|
Twin Peaks Bagged 12oz Coffee
|


|
Our Strategy
Our objective is to be a profitable, leading provider of functional beverages and gourmet pour-over coffees. Elements of our business strategy for 2018 include:
|
●
|
Secure additional working capital to support growth and development of NuZee, Inc. sales and support operations
|
|
●
|
Build onto our existing product and brand awareness through marketing and communication programs
|
|
●
|
Continue to build our enthusiast and loyal base of consumers for Coffee Blenders
|
|
●
|
Expand our co-packing operation
|
|
●
|
Expand distribution across retail, online and affiliate channels
|
|
●
|
Contract with multiple manufacturing partners to scale production as required
|
|
●
|
Work with brokers to help quicken the process our product gets to distributors and grocery chains
|
|
●
|
Work alongside with other roasters, nationwide, and co-pack their roasts into our Drip Cups
|
|
●
|
Build up our coffee extraction business
|
Customers
Our customers range from B2B (Business-to-business means one business makes a commercial transaction with another) multi-store retail chains to wholesale distributors that deliver to both chain and independent stores regionally. We also sell to office and home delivery services that deliver coffee and water to homes and businesses locally. Another portion of our business is online sales through our own B2C (Business-to-consumer is an Internet and electronic commerce (e-commerce) model that denotes a financial transaction or online sale between a business and consumer. It involves a service or product exchange from a business to a consumer) site through organic as well as paid marketing campaigns through our affiliate network along with sales stemming from online retail accounts like Amazon.com.
Sales
In 2017 Coffee Blenders maintained a healthy relationship with our top retailers, distributors, & partners and added on over a dozen new retail chains. In addition to expanding our shelf space in Safeway Eastern, our product is now in Albertsons, Meijer's, Spartan Nash, HEB, Lowes, Rouses, Jewel-Osco, Whole Foods, Piggly Wiggly's, King's, Tony's Finer Foods and other smaller independent grocery chains. Many of these accounts were gained through KeHE & UNFI, our main distributors as of 2017.
While Coffee Blenders has been on the market for over three years, we still believe that a significant amount of capital will be required to generate additional sales and help support the current accounts that we currently have. Our sales approach will be maintained by following the 4 stages below:
1. Expand our co-packing operations to accommodate national roasters
2. Generate consumer trial
3. Drive repeat sales through heavy in-store promotions
4. Increase our velocity with our current customers
We have learned that by working with the retailers on providing proper employee training on the product, using heavy couponing and doing in store demo's the sales are driven higher and there are more repeat customers. Our main focus for 2018 will be to continue our effective approach of attending trade shows to acquire new B2B commercial business. We have added on to our inside sales force to incubate and curate new accounts. We plan to expand our affiliate network and online advertising as well as cross promoting via social media to drive our B2C sales through our www.coffeeblenders.com &
www.twinpeaksroasters.com
domains.
At this time, most of the products sold will be under the "Coffee Blenders," "Twin Peaks" and "NuZee" trademarks. We have expanded our production capabilities at our headquarters facility in Vista, CA to attract other companies that are interested in producing single serve pour over coffee to produce them at our facility, as well as meet consumer demands. Our co-packing service is intended to increase market awareness and to help position our company as the leader in the U.S. for the pour over drip pouch coffee market.
Manufacturing
We have a primary manufacturing facility in Vista, California located at 2865 Scott St Suite 107 which is used for the production of our Single Serve Pour-Over Drip Cup line. We also partner with three third-party manufacturers to manufacture finished products. We have agreements in place with suppliers and partners for all components required to deliver a finished Coffee Blenders product. Currently, the Company has not made any long-term commitments to any suppliers or production partners that will burden or impair the Company's ability to operate.
We purchase Green Whole Bean Coffee from Serengeti Trading Company located in Dripping Springs, TX on a contractual basis. The green whole bean is then sent to our roaster at San Diego Coffee, Tea, & Spice, located in Oceanside, CA.
All the raw products (roasted ground coffee and nutraceuticals) are sent to Global Health Trax ("GHT") for mixing into our proprietary blends. We do not have a written agreement with GHT. Rather, all services performed by GHT are on a purchase order basis. After GHT mixes our coffees, the final product is shipped to our co-packer Intelligent Blends, or our other co-packer Cafejo, for packaging into single-serving containers commonly known as "K cups" as well as our coffee blenders single serve drip cups and Twin Peaks pour-over and boxed for retail sales.
We also work with Pod Pack, located in Baton Rouge, LA, in which green whole bean coffee from our contract with Serengeti Trading Company is then sent to their roaster that they work with, the coffee is roasted/ground/blended with nutraceuticals and then packaged into single-serve containers commonly known as "K cups" and boxed for retail sales. Pod Pack's roaster can store our nutraceuticals for production in Louisiana.
GHT also ships the blended coffee to our location for packing into our new proprietary single serve consumer product, the "Drip Cup".
Purchasing of packaging material is well diversified among two suppliers: Fleetwood Fibre & Landsberg. We conduct business with these vendors on a purchase order basis.
Machinery for production at our Vista location comes from some of the most respected vendors in the industry: Air compression equipment comes from Kaeser Compressor, manufactured in Germany with a local sales and support office in Los Angeles. Nitrogen generation equipment is manufactured by On-Site Gas Systems, and our Drip Cup production is produced on the leading Japanese manufacturer of packaging machines from NASA Corporation. Nitrogen and air compression machinery is capable of handling expansion as the company expands as well to minimize any ongoing capital expenditures for machinery.
Research and Development
We focus our research and development efforts on developing innovative functional beverages that not only taste delicious but also include a health-wellness benefit.
Over the course of the last fiscal year NuZee has maintained a modest R&D budget. With the advent of the functional beverage and new product ideas, the Company plans to invest more to secure unique flavor and formula profiles but anticipates the out of pocket expense will not be significant as the Company has agreements with flavor and formula design partners to waive development fees in exchange for purchasing the flavorings and ingredients.
In 2017, our research and development activities focused on:
|
●
|
Drip Cup Kona Blend Coffee Blenders line extension
|
|
●
|
Coffee Blenders ready-to-drink line of functional cold brew
|
|
●
|
Twin Peaks single serve pour-over and whole bean coffee lines
|
For 2018, our research and development initiatives include:
|
●
|
Expanding our contract co-packing operation in Vista, CA to accommodate national coffee roasters and grocery chain
|
|
●
|
Continuing the exploration of our coffee extraction technologies
|
Intellectual Property
NuZee currently owns the following United States trademarks: "Coffee Blenders," "It's Coffee Reimagined," "Nude Cup," "Lean Cup," "Think Cup," "Relax Cup," "Active Cup," "Twin Peaks" (pending), "NuZee," and "Torque.". The Company intends to continue growing its trademark portfolio in the United States with other related slogans and brands as those products come closer to launch.
The Company further intends to expand its brand protections outside of the United States in line with its prospective international growth. As of the date of this report, the Company had registered trademarks
"Coffee Blenders", "Nude Cup", "Lean Cup", "Think Cup", "Relax Cup" and "Twin Peaks" in Japan
and registered trademarks "Lean Cup" and "Think Cup" in Korea.
NuZee intends to aggressively protect, police and assert its intellectual property rights, including product designs, proprietary product research and concepts as well as its trademark portfolio. Although asserting NuZee's rights may result in a substantial cost to the Company, NuZee's management strongly believes that the protection of our intellectual property rights is a key component of our operating strategy. As a result of our company's continuing R&D efforts, the Company may decide to seek additional protection, if applicable, relating to its formulas, process know-how and proprietary flavors.
In exiting the Torque energy supplement product businesses NuZee ceased using and abandon its registered TORQ and TORQ WRENCH trademarks acquired from the HydroPouch Corporation. The Company also plans to not pursue or contest the use of NuZee as a product brand in association with water and skincare product as we exit those businesses.
Competition
The beverage industry in general, and the coffee sector in particular, is extremely competitive. The principal areas of competition include pricing, packaging, development of new products and flavors, and marketing campaigns. Our Coffee Blenders product is competing directly with Green Mountain brands and licensed brands as well as 3
rd
party single pour over coffees. While there are more than 200 varieties of single pour over coffees to choose from there are few, if any functional coffees dedicated to weight-loss, stress reduction, cognitive performance and enhanced workout performance. Green Mountain brands have enjoyed broad, well-established national distribution through well-funded advertising, and product awareness. In addition, companies and brands manufacturing these products generally have far greater financial, marketing, and distribution resources than we do.
Important factors that will affect our ability to compete successfully include taste and functional delivery of our product, trade and consumer promotions, the development of new, unique functions in new and various packaging formats, attractive and unique promotions, branded product advertising, pricing, and the success of our distribution network.
We will also be competing to secure distributors who will agree to market our product over those of our competitors, provide stable and reliable distribution, and secure adequate shelf space in retail outlets and search placement in online stores.
Our Coffee Blenders products will compete generally with all hot liquid refreshments, including specialty coffees and teas as well as nutraceutical beverages such as BulletProof Coffee, Green Mountain Wellness Coffee, Organo Gold Herbal Coffee, Nuvia Trim Coffee, South Beach Java, Javita, and NatureGift Instant Coffee. As a result, we continue to look for significant niche markets where our close attention to customer requirements and superior performance are valued.
Employees
As of September 30, 2017, we had a total of 6 full-time employees and 4 part-time employees. All employees are located in Vista, CA.
Our operations are overseen directly by management that engages our employees to carry on our business. Our management oversees all responsibilities in the areas of corporate administration, product development, marketing, and research. We intend to expand our current management to retain other skilled directors, officers, and employees with experience relevant to our business focus. Our management's relationships will provide the foundation through which we expect to grow our business in the future. We believe that the skill-set of our core management team will be a primary asset in the development of our brands and trademarks.
We have never had a work stoppage, and none of our employees are represented by a labor organization or under any collective bargaining arrangements. We believe our relationships with our employees are good.
Governmental Regulation
Our Coffee Blenders products are marketed and sold as conventional food or beverages for regulatory purposes. Such products are regulated by the U.S. Food and Drug Administration ("FDA"). Ingredients in such products must be approved food additives or "Generally Regarded as Safe" ("GRAS"). We have been careful to utilize ingredients that are approved food additives or GRAS. We also intend to work with ingredient suppliers, manufacturers, and other trade partners that are compliant with the laws and regulation enforced by the FDA. We have not received, nor are we aware of, any inquiries or other regulatory action from the FDA or any other governmental agency regarding our products and we believe we are in full compliance with all FDA regulations.
The advertising, distribution, labeling, production, safety, sale, and transportation in the United States of our products are subject to the Federal Food, Drug, and Cosmetic Act, the Federal Trade Commission Act, the Lanham Act, state consumer protection laws, competition laws, federal, state and local workplace health and safety laws, various federal, state and local environmental protection laws, and various other federal, state and local statutes and regulations.
Available Information
Our annual and quarterly reports, along with all other reports and amendments filed with or furnished to the SEC, are publicly available free of charge on the Investor Relations section of our website at www.MYNUZEE.com as soon as reasonably practicable after these materials are filed with or furnished to the SEC. Our corporate governance policies, ethics code and board of directors' committee charters are posted under Corporate Governance section of the website. The information on our website is not part of this or any other report we file with, or furnish to, the SEC. The SEC also maintains an Internet site that contains reports, proxy and information statements, and other information regarding issuers that file electronically with the SEC. The address of that site is www.sec.gov.
In addition to the other information set forth in this report, you should carefully consider the following factors, which could materially affect our business, financial condition or results of operations in future periods. The risks described below are not the only risks facing our company. Additional risks not currently known to us or that we currently deem to be immaterial also may materially adversely affect our business, financial condition or results of operations in future periods.
If we cannot sustain profitable operations, we will need to raise additional capital to continue our operations, which may not be available on commercially reasonable terms, or at all, and which may dilute your investment.
We generated a net loss of $1,767,139 for the year ended September 30, 2017 and therefore we cannot guarantee that we will be successful in building a functional beverage business in future periods, which raises substantial doubt about the Company's ability to continue as a going concern.
If we are unable to generate sufficient revenues to pay our expenses and our existing sources of cash and cash flows are otherwise insufficient to fund our activities, we will need to raise additional funds to continue our operations. We do not have any arrangements in place to provide additional funds. If needed, those funds may not be available on favorable terms, or at all. Furthermore, if we issue equity or debt securities to raise additional funds, our existing stockholders may experience dilution, and the new equity or debt securities may have rights, preferences and privileges senior to those of our existing stockholders.
If we are unsuccessful in sustaining profitability and reducing our accumulated deficit, and we cannot obtain additional funds on commercially reasonable terms or at all, we may be required to curtail significantly or cease our operations.
Because we have a limited operating history, our ability to fully and successfully develop our business is unknown.
We have only recently begun developing and producing our functional products, and do not have a significant operating history with which investors can evaluate our business. Our ability to successfully develop our products, and to realize consistent, meaningful revenues and profit has not been established and cannot be assured. For us to achieve success, our products must receive broad market acceptance by consumers. Without this market acceptance, we will not be able to generate sufficient revenue to continue our business operation. If our products are not widely accepted by the market, our business may fail.
Our ability to achieve and maintain profitability and positive cash flow is dependent upon our ability to generate revenues, manage development costs and expenses, and compete successfully with our direct and indirect competitors
Based upon current plans, we expect to incur operating losses in future periods. This will happen because there are expenses associated with the development, production, marketing, and sales of our product. As a result, we may not generate significant revenues in the future. Failure to generate significant revenues in near future may cause us to suspend or cease activities.
We will need additional funds to produce, market, and distribute our product.
We will have to spend additional funds to produce, market and distribute our product. If we cannot raise sufficient capital, we may have to cease operations and you could lose your investment.
There is no guarantee that sufficient sale levels will be achieved.
There is no guarantee that the expenditure of money on distribution and marketing efforts will translate into sales or sufficient sales to cover our expenses and result in profits. Consequently, there is a risk that you may lose all of your investment.
Our development, marketing, and sales activities are limited by our size.
Because we are small and do not have significant capital reserves, we must limit our product development, marketing, and sales activities. As such we may not be able to scale our production and business development activities to the level required. If this becomes a reality, we may not ever generate revenues and you will lose your investment.
Changes in the nutritional beverage business environment and retail landscape could adversely impact our financial results.
The nutritional and functional beverage business environment is rapidly evolving as a result of, among other things, changes in consumer preferences, including changes based on health and nutrition considerations and obesity concerns; shifting consumer tastes and needs; changes in consumer lifestyles; and competitive product and pricing pressures. In addition, the nutritional beverage retail landscape is very dynamic and constantly evolving, not only in emerging and developing markets, where modern trade is growing at a faster pace than traditional trade outlets, but also in developed markets, where discounters and value stores, as well as the volume of transactions through e-commerce, are growing at a rapid pace. If we are unable to successfully adapt to the rapidly changing environment and retail landscape, our share of sales, volume growth and overall financial results could be negatively affected.
Intense competition and increasing competition in the commercial beverage market could hurt our business.
The commercial retail beverage industry, and in particular the functional beverage segment, is still nascent and viewed as highly competitive. Market participants are of various sizes, with various market shares and geographical reach, some of whom have access to substantially more sources of capital.
We will compete generally with many liquid refreshments, including numerous specialty beverages, such as hot and cold coffee and teas.
We will compete indirectly with major international beverage companies including but not limited to: Green Mountain Coffee Roasters, the Coca-Cola Company, PepsiCo, Inc., Nestlé, Kraft Foods Group, Inc., and Starbucks. These companies have established market presence in the United States and offer a variety of beverages that are substitutes to our product. We face potential direct competition from such companies, because they have the financial resources, and access to manufacturing and distribution channels to rapidly enter the health food and beverage market.
We will compete directly with other consumer products participants in the emerging functional beverage sector including BulletProof Coffee, Green Mountain Wellness Coffee, Organo Gold Herbal Coffee, Nuvia Trim Coffee, South Beach Java, Javita, and NatureGift Instant Coffee. These companies could bolster their position in the sector through additional expenditure and promotion.
As a result of both direct and indirect competition, our ability to successfully distribute, market and sell our product, and to gain sufficient market share in the United States and internationally to realize profits may be limited, greatly diminished, or totally diminished, which may lead to partial or total loss of your investments in our company.
Our growth and profitability depend on the performance of third-parties and our relationship with them.
A significant portion of our distribution network and its success depend on the performance of third-parties. Any non-performance or deficient performance by such parties may undermine our operations, profitability, and result in total loss to your investment. To distribute our product, we will use a broker-distributor-retailer network whereby brokers represent our products to distributors and retailers who will in turn sell our product to consumers. The success of this network will depend on the performance of the brokers, distributors and retailers of this network. There is a risk that a broker, distributor, or retailer may refuse to or cease to market or carry our product. There is a risk that the mentioned entities may not adequately perform their functions within the network by, without limitation, failing to distribute to sufficient retailers or positioning our product in localities that may not be receptive to our product.
Furthermore, such third-parties' financial position or market share may deteriorate, which could adversely affect our distribution, marketing and sale activities. We also need to maintain good commercial relationships with third-party brokers, distributors and retails so that they will promote and carry our product. Any adverse consequences resulting from the performance of third-parties or our relationship with them could undermine our operations, profitability and may result in total loss of your investment.
We depend on third party manufacturers and ingredients providers to produce all of our products.
Our reliance on third party manufacturers and providers exposes us to a number of risks that are beyond our control, including:
|
●
|
Unexpected increases in production costs;
|
|
●
|
Unexpected scheduling delays;
|
|
●
|
Unexpected shortage of ingredients;
|
|
●
|
Loss of priority assignment of any and all supplies and materials;
|
|
●
|
The failure from any of our partners to deliver components or finished goods.
|
Health benefits of the functional ingredients are not guaranteed.
Although we use ingredient backed by clinical studies that support our claims such health benefits to individuals are not guaranteed. Consequently, negative studies and publicity surrounding any of our ingredients may result in loss of market share or potential market share and hence loss of your investment.
Significant additional labeling or warning requirements or limitations on the availability of our product may inhibit sales of affected products.
Various jurisdictions may seek to adopt significant additional product labeling or warning requirements or limitations on the availability of our product relating to the content or perceived adverse health consequences of our product. If these types of requirements become applicable to our product under current or future environmental or health laws or regulations, they may inhibit sales of our product.
Unfavorable general economic conditions in the United States or elsewhere could negatively impact our financial performance.
Unfavorable general economic conditions, such as a recession or economic slowdown, in the United States could negatively affect the affordability of, and consumer demand for, our product in the United States. Under difficult economic conditions, consumers may seek to reduce discretionary spending by forgoing purchases of our products or by shifting away from our beverages to lower-priced products offered by other companies. Lower consumer demand for our product in the United States could reduce our profitability.
We will rely primarily on the United States and Keurig brewer households to generate adoption and use in our products.
The consumer acceptance for Keurig brewers could decline and negatively impact the market size and growth potential. We are attempting to develop other geographic markets and single-serve brewer platforms for our products, in Asia and other markets. We are looking for opportunities to generate additional significant customers to reduce our risk associated with customer concentration. We can make no assurance, however, that we will succeed in diversifying our customer base, developing other geographic markets or in becoming less reliant on a small number of significant customers.
If we do not compete effectively in the functional beverage market, our revenues and market share will decline.
The markets for Coffee Blenders are highly competitive. We face competition from larger and better capitalized competitors such as Green Mountain Coffee Roasters, Inc. and many nutraceutical beverage firms which have significantly greater penetration in key markets than we do. Economies of scale allow these competitors to offer product pricing and related incentives that we may be unable to match. We also face competition from a number of smaller competitors. These competitors may be able to:
|
●
|
develop better and more variety of products
|
|
●
|
develop less expensive products
|
|
●
|
develop broader channels
|
|
●
|
as well as the ability to respond more rapidly to changing market conditions
|
If we are not successful in enhancing our products, maintaining customer relationships and managing our cost structure so that we can provide competitive prices, we may experience reduced sales and our potential market share may decline.
Our competitive position could be seriously damaged and we may incur substantial expenses if we become party to lawsuits alleging that our products infringe the intellectual property rights of others.
The technology around K-CUP®, K-Cup Brewers and related Keurig know-how and processes may impact our ability and/or our partner's ability to deliver finished goods. If we are forced to take any of the foregoing legal actions to defend our products, we could face substantial costs and shipment delays and our business could be seriously harmed. Although we carry general liability insurance, our insurance may not cover potential claims of this type or be adequate to indemnify us for all liability that may be imposed.
In addition, it is possible that our distribution partners or manufacturing partners may seek indemnity from us in the event that our products are found or alleged to infringe upon the intellectual property rights of others. Any such claim for indemnity could result in substantial expenses to us that could harm our operating results.
Our international sales and operations subject us to various risks associated with, among other things, foreign laws, policies, economies, and exchange rate fluctuations.
All of our international sales and operations are subject to inherent risks, which could have a material adverse effect on our financial condition or results of operations. Each country has their own regulations regarding food safety and ingredient panel disclosures. Our ability to meet those requirements may prevent us from launching products or force us to reverse orders and business.
Adverse weather conditions could reduce the supply or demand for our products.
The sales of our products are influenced to some extent by weather conditions in the markets in which we operate. Also, the supply of our raw ingredients could be impacted by adverse weather that increase cost or reduce availability. Because the majority of our sales are denominated in United States dollars, changes in foreign currency exchange rates affect the market price for our products in countries in which they are sold. If the currency of a particular country weakens against the United States dollar, the cost of our products in that country may increase.
If we are unable to attract and retain key personnel necessary to operate our business, our ability to develop and market our products successfully could be harmed.
We have a small employee base and depend substantially on our current executive officers and key sales, and operational employees. The loss of key employees or the inability to attract or retain qualified personnel, could delay product development and harm our ability to sell our products. Our success depends on our ability to identify, attract and retain qualified management, sales, and marketing personnel.
A substantial portion of our sales are completed on a purchase order basis. Although these purchase orders are generally not cancelable, customers may decide to delay or cancel orders, which could negatively impact our revenues.
Orders covered by firm purchase orders are generally not cancelable; however, customers may decide to delay or cancel orders. In the event that we experience any delays or cancellations, we may have difficulty enforcing the provisions of the purchase order and our revenues could decline substantially. Any such decline could result in us incurring net losses, increasing our accumulated deficit and needing to raise additional capital to fund our operations.
Changes in, or failure to comply with, the laws and regulations applicable to our products or our business operations could increase our costs or reduce our net operating revenues.
The advertising, distribution, labeling, production, safety, sale, and transportation in the United States of our company's product will be subject to: the Federal Food, Drug, and Cosmetic Act; the Federal Trade Commission Act, the Lanham Act, state consumer protection laws, competition laws, federal, state, and local workplace health and safety laws, such as the Occupational Safety and Health Act, various federal, state and local environmental protection laws, and various other federal, state, and local statutes and regulations. Legal requirements also apply in many jurisdictions in the United States requiring that deposits or certain eco taxes or fees be charged for the sale, marketing, and use of certain non-refillable beverage containers. The precise requirements imposed by these measures vary. Other types of statutes and regulations relating to beverage container deposits, recycling, eco taxes and/or product stewardship also apply in various jurisdictions in the United States. We anticipate that additional, similar legal requirements may be proposed or enacted in the future at the local, state and federal levels in the United States. Changes to such laws and regulations could increase our costs or reduce or net operating revenues.
Risk Related to Our Stock
Because our sole director controls a large percentage of our common stock, he has the ability to influence matters affecting our stockholders.
Our sole director controls a large percentage of our common stock. As a result, he has the ability to influence matters affecting our stockholders, including the election of our directors, the acquisition or disposition of our assets, and the future issuance of our shares of common stock. Because he controls such shares, investors may find it difficult to replace our management if they disagree with the way our business is being operated. Because their interest could result in management making decisions that are in their best interest and not in the best interest of the general investor base, you may lose some or all of the value of your investment in our common stock.
Because we can issue additional shares of common stock, our stockholders may experience dilution in the future.
We are authorized to issue up to 100,000,000 shares of common stock and 100,000,000 shares of preferred stock, of which
36,062,321
shares of common stock and no share of preferred stock are issued and outstanding as of the date hereof. Our board of directors has the authority to cause us to issue additional shares of common stock, and to determine the rights, preferences and privileges of such shares, without consent of any of our stockholders. Consequently, the stockholders may experience more dilution in their ownership of our stock in the future.
Our common stock is quoted on the OTC Markets, which may be detrimental to investors.
Our common stock is currently quoted on the OTC Markets under the symbol "NUZE." Stocks quoted on the OTC Markets generally have limited trading volume and exhibit a wider spread between the bids and ask quotations as compared to stocks traded on national exchanges. Accordingly, you may not be able to sell your shares quickly or at the market price if trading in our stock is not active.
Trading on the OTC Markets and Bulletin Board exchanges may be volatile and sporadic, which could depress the market price of our common stock and make it difficult for our stockholders to resell their shares.
Our common stock is quoted on the OTC Markets. Trading in stock quoted on the OTC Markets is often thin and characterized by wide fluctuations in trading prices, due to many factors that may have little to do with our operations or business prospects. This volatility could depress the market price of our common stock for reasons unrelated to operating performance. Moreover, the OTC Markets is not a stock exchange, and trading of securities on the OTC Markets is often more sporadic than the trading of securities listed on a quotation system like NASDAQ a stock exchange like the NYSE. Accordingly, stockholders may have difficulty reselling any of the shares.
A decline in the price of our common stock could affect our ability to raise further working capital, it may adversely impact our ability to continue operations and we may go out of business.
A prolonged decline in the price of our common stock could result in a reduction in the liquidity of our common stock and a reduction in our ability to raise capital. Because we may attempt to acquire a significant portion of the funds we need in order to conduct our planned operations through the sale of equity securities, a decline in the price of our common stock could be detrimental to our liquidity and our operations because the decline may cause investors not to choose to invest in our stock. If we are unable to raise the funds we require for all our planned operations, we may be forced to reallocate funds from other planned uses and may suffer a significant negative effect on our business plan and operations, including our ability to develop new products and continue our current operations. As a result, our business may suffer, and not be successful and we may go out of business. We also might not be able to meet our financial obligations if we cannot raise enough funds through the sale of our common stock and we may be forced to go out of business.
Because we do not intend to pay any cash dividends on our shares of common stock in the near future, our stockholders will not be able to receive a return on their shares unless they sell them.
We intend to retain any future earnings to finance the development and expansion of our business. We do not anticipate paying any cash dividends on our common stock in the near future. The declaration, payment and amount of any future dividends will be made at the discretion of the board of directors, and will depend upon, among other things, the results of operations, cash flows and financial condition, operating and capital requirements, and other factors as the board of directors considers relevant. There is no assurance that future dividends will be paid, and if dividends are paid, there is no assurance with respect to the amount of any such dividend. Unless we pay dividends, our stockholders will not be able to receive a return on their shares unless they sell them.
Our stock is a penny stock. Trading of our stock may be restricted by the SEC's penny stock regulations which may limit a stockholder's ability to buy and sell our stock.
Our stock is a penny stock. The Securities and Exchange Commission ("SEC") has adopted Rule 15g-9 which generally defines "penny stock" to be any equity security that has a market price (as defined) less than $5.00 per share or an exercise price of less than $5.00 per share, subject to certain exceptions. Our securities are covered by the penny stock rules, which impose additional sales practice requirements on broker-dealers who sell to persons other than established customers and "accredited investors." The term "accredited investor" refers generally to institutions with assets in excess of $5,000,000 or individuals with a net worth in excess of $1,000,000 or annual income exceeding $200,000 or $300,000 jointly with their spouse. The penny stock rules require a broker-dealer, prior to a transaction in a penny stock not otherwise exempt from the rules, to deliver a standardized risk disclosure document in a form prepared by the SEC which provides information about penny stocks and the nature and level of risks in the penny stock market. The broker-dealer also must provide the customer with current bid and offer quotations for the penny stock, the compensation of the broker-dealer and its salesperson in the transaction and monthly account statements showing the market value of each penny stock held in the customer's account. The bid and offer quotations, and the broker-dealer and salesperson compensation information, must be given to the customer orally or in writing prior to effecting the transaction and must be given to the customer in writing before or with the customer's confirmation. In addition, the penny stock rules require that prior to a transaction in a penny stock not otherwise exempt from these rules; the broker-dealer must make a special written determination that the penny stock is a suitable investment for the purchaser and receive the purchaser's written agreement to the transaction. These disclosure requirements may have the effect of reducing the level of trading activity in the secondary market for the stock that is subject to these penny stock rules. Consequently, these penny stock rules may affect the ability of broker-dealers to trade our securities. We believe that the penny stock rules discourage investor interest in and limit the marketability of our common stock.
FINRA sales practice requirements may also limit a stockholder's ability to buy and sell our stock.
In addition to the "penny stock" rules promulgated by the SEC, the Financial Industry Regulatory Authority ("FINRA") has adopted rules that require that in recommending an investment to a customer, a broker-dealer must have reasonable grounds for believing that the investment is suitable for that customer. Prior to recommending speculative low-priced securities to their non-institutional customers, broker-dealers must make reasonable efforts to obtain information about the customer's financial status, tax status, investment objectives and other information. Under interpretations of these rules, the FINRA believes that there is a high probability that speculative low-priced securities will not be suitable for at least some customers. The FINRA requirements make it more difficult for broker-dealers to recommend that their customers buy our common stock, which may limit your ability to buy and sell our stock.
Our principal executive office is located at 2865 Scott Street, Suite 105, 106, & 107 Vista, CA 92081. We lease these facilities on an annual basis at a cost of $4,685 per month. We believe these facilities are suitable for our current needs.
None.
None.
ITEM 5. MARKET FOR REGISTRANT'S COMMON EQUITY, RELATED STOCKHOLDER MATTERS AND ISSUER PURCHASES OF EQUITY SECURITIES.
Market Information
We are currently list on OCTQB market with symbol "NUZE." The following table shows the reported high and low closing bid prices per share for our common stock based on information provided by OTC Markets. The over-the-counter market quotations set forth for our common stock reflect inter-dealer prices, without retail mark-up, mark-down or commission and may not necessarily represent actual transactions.
|
|
|
BID PRICE PER SHARE
|
|
|
Quarters Ended
|
|
HIGH
|
LOW
|
|
September 30, 2017
|
0.51
|
0.51
|
|
|
June 30, 2017
|
0.51
|
0.51
|
|
|
March 31, 2017
|
0.51
|
0.51
|
|
|
December 31, 2016
|
0.78
|
0.78
|
|
|
September 30, 2016
|
0.225
|
0.225
|
|
|
June 30, 2016
|
0.40
|
0.15
|
|
|
March 31, 2016
|
0.6
|
0.2
|
|
|
December 31, 2015
|
0.6
|
0.2
|
|
Number of Shareholders
As of September 30, 2017, the stockholders list for our common stock showed 273 registered stockholders and 34,720,538 shares of common stock issued and outstanding. The transfer agent of our common stock is QuickSilver Stock Transfer, One Summerlin, 1980 Festival Plaza Drive, Suite 530, Las Vegas, Nevada, 89135.
Dividends
We have never declared or paid cash dividends on our capital stock. We currently intend to retain any future earnings to finance the growth and development of our business. Payment of future dividends, if any, will be at the discretion of our board of directors and will depend on our financial condition, results of operations, capital requirements and such other factors as the board of directors deems relevant.
Sales of Unregistered Securities
During July to August 2017, the Company sold 1,147,971 shares of treasury stock at $0.51 per share, for an aggregate purchase price of $585,465 paid to the Company in cash.
During August 2017, the Company issued 34,602 shares of treasury stock at $0.43 per share, for compensation and an aggregate price of $14,879.
During August to September 2017, the Company sold 352,029 shares of common stock at $0.51 per share, for an aggregate purchase price of $179,535 paid to the Company in cash.
All of the proceeds received from the sales of our common stock will be used by the Company for the Company's business operations.
Other than the noted exceptions, the above-mentioned sales of our securities were made to non-U.S. persons (as the term is defined in Regulation S of the Securities Act of 1933, as amended) in offshore transactions in which we relied on the registration exemption provide for in Regulation S and/or Section 4(a)(2) of the Securities Act of 1933, as amended.
Equity Compensation Plans Information
|
Equity Compensation Plan Information
|
|||
|
Plan category
|
Number of securities to be issued upon exercise of outstanding options, warrants and rights
|
Weighted-average exercise price of outstanding options, warrants and rights
|
Number of securities remaining available for future issuance under equity compensation plans (excluding securities reflected in column (a))
|
|
(a)
|
(b)
|
(c)
|
|
|
Equity compensation plans approved by security holders
|
3,064,500
|
0.58
|
6,935,500
|
|
Equity compensation plans not approved by security holders
|
n/a
|
n/a
|
n/a
|
|
Total
|
3,064,500
|
0.58
|
6,935,500
|
We are a smaller reporting company as defined by Rule 12b-2 of the Securities Exchange Act of 1934 and are not required to provide the information under this item.
The following plan of operation provides information which management believes is relevant to an assessment and understanding of our results of operations and financial condition. The discussion should be read along with our financial statements and notes thereto. This section includes a number of forward-looking statements that reflect our current views with respect to future events and financial performance. Forward-looking statements are often identified by words like believe, expect, estimate, anticipate, intend, project and similar expressions, or words which, by their nature, refer to future events. You should not place undue certainty on these forward-looking statements. These forward-looking statements are subject to certain risks and uncertainties that could cause actual results to differ materially from our predictions.
Plan of Operations
Short Term Goals (12 Months)
Over the next 6 months, the Company's growth plans include continuing efforts to:
1.
Leverage our network of potential (and current) customers that we have been introduced to during our extensive trade show campaigns.
Participating in trade shows and conferences has been a huge success for the Company so far. At each tradeshow there are between 2,000 and 10,000 attendees and exhibitors depending on its size – which gives the company ample opportunity to meet, talk and most importantly educate the consumer on the benefits of our product as well as the proper usage and applications. Another benefit of attending trade shows is that there are a lot of the same companies/buyers at each coffee event. The more these buyers see our face and the product, the more likely they are to trust and do business with us. We are able to create relationships through the shows and networking events, many of these relationships have turned into business opportunities.
2.
Complete the expansion of our co-packing operation in Vista, CA
3.
Continue the exploration of our coffee extraction technologies
4.
Fulfill the current demand of our current customer base and complete transactions with customers that have expressed a strong interest in our company and brands
.
With recent development of new innovative products, we have good reason to reach back out to our current and new customers to gain more distribution points.
5.
Maximize the effectiveness of our current distributors by implementing sales and marketing road-maps
.
Currently, we are working closely with United Natural Foods, Inc. ("UNFI") and KeHE Distributors ("KeHE"), both natural and organic foods distributors. Through UNFI and KeHE we are able to meet with hundreds of sales reps and buyers for the grocery channel across the US at Table Top events. KeHE offers a sales and marketing "Roadmap" which we are actively participating in. These roadmaps are made to help the vendor maximize and increase their sales by putting promotions and other discounts into place ahead of time. So far, we have gained three new accounts in the short few weeks that our New@KeHE promo has launched.
6.
Work with our chosen brokers to build new relationships and strengthen existing relationships.
By working with a broker who has a strong connectivity to retailers, it ensures that a unique and appropriate strategy is developed and executed with speed and precision for our brand. In addition, the broker will be able to guide us in which strategies and tactics will work at each specific retailer, this is vital to the growth of a brand. Additionally, a retailer's strategy and tactics can change over time and knowing this in real time is critical to success.
7.
Continue to increase the awareness for Coffee Blenders/NuZee brand and products by submitting articles to Coffee Roasters magazines as well as continually submit blogs/content to several social media platforms
Through participating in all of the tradeshows in 2017, we were able to create relationships with journalists and magazine owners like Bevnet & Vending Times who will often post articles and product reviews in their publication for free. With the coffee industry being as large as it is, there are numerous coffee magazines and websites out there and even more eyes reading the content produced by trusted sources. In addition, we are actively creating new content for our social media pages.
We have retained and expanded our sales and marketing team who have continuously contributed to our network of US and international channels as such seeding our product and maintaining relationships is a top priority. We have developed working relationships with key online and national distributors who serve the coffee and single-serve pod consumers. We have also expanded our SKU count with the addition of our cold brew, whole bean, ground coffee & tea products to meet the wants and needs of all consumers. We plan to accelerate our traction by continuing to work with manufacturer representatives with food and beverage experience.
We have entered into several different channels for distribution and are planning to expand into the hospitality channel in 2018. Our current and forecasted company directed channels include;
|
●
|
Direct – coffeeblenders.com shopping via search and digital marketing
|
|
●
|
E-commerce affiliates (Amazon Exclusives, Groupon, Jet.com, Bulu box)
|
|
●
|
Select health and wellness retailers
|
|
●
|
Key mass/grocery retailers – Kroger, HEB, Safeway, Whole Foods, Lowes, Jewel-Osco, Rouses
|
|
●
|
Co-Packing with other coffee roasters on our pour-over drip cup
|
If we are unable to receive funding our plans will be dramatically and negatively impacted such that we will prioritize go to market strategies based on reduced operations and available capital.
Long Term Goals (Five Years)
The Company believes that our limited resources may pose a challenge to our expansion goals and therefore anticipates that it may require additional capital in future years to fund expansion. There can be no assurance that our expansion strategy will be accretive to our earnings within a reasonable period of time. However, the Company believes that it can improve its operational efficiencies and reduce the need for new capital by carefully managing the business based on the following economic fundamentals within accretive margin and cost contribution modeling.
Results of Operations
For the year ended September 30, 2017, we generated net losses attributable to NuZee, Inc. of $1,767,139. This loss was attributed to $2,076,654 of operating expenses. Compared with fiscal year end September 30, 2016, the net loss increased by $491,846 and operating expense increased by $751,191. Operating expenses on income statement included all costs associated with company's day-to-day operations, but not directly associated with production.
From October 1, 2016 to September 30, 2017, we earned revenues of $1,628,410 from sales of our products to retailers, wholesalers and distributors, such as Safeway, HEB and Japan Post Co., Ltd. The revenues earned during 2016 fiscal year was $455,491. This increase was primary from the acquisition of
NuZee JAPAN Co., Ltd ("NuZee JP"). The revenues earned by NuZee, Inc was $465,244 for the year ended September 30, 2017.
We expect sales in 2017-2018 fiscal year from our new products through a combination of direct to consumer through our website portal, product awareness as well as through affiliate online stores and retailers. As of September 30
th
, 2017, we have opened several accounts with large wholesalers and distributors, such as UNFI, C&S, KeHE Distributor, LLC, who are some of the largest distributors in the United States.
Liquidity and Capital Resources
The Company had a cash balance of $347,327 and $40,613 as of September 30, 2017 and 2016, respectively. This increase was primarily from the acquisition of NuZee Japan and the financing through the sale of equity securities.
On September 30, 2017, NuZee Japan had $173,908 cash, which accounts for 50% of consolidated cash balance. Accounts receivable and accounts receivable from related parties increased by $98,562 as well as inventories by $60,264 since September 30, 2016 mainly because of this acquisition.
The Company had the total current liabilities of $0.350 million and $0.945 million as of September 30, 2017 and 2016, respectively. During March 2017, Masateru Higashida, CEO of NuZee, Inc., sold the $600,000 convertible note to Miura Kenichi, shareholder of NuZee, Inc. Mr. Miura converted the note (principal and accrued interest) to 1,188,236 shares of the Company's common stock at the same day. As a result, the convertible note became $0, which led to the decrease of current liabilities.
Our current ratio increased by 207% since September 30, 2017, due to the significant increase of the current assets and decrease of the current liabilities.
As of September 30, 2017, the Company had an approximate $133,644 non-current liability from NuZee Japan's loans from Tono Sinyon Bank and Nihon Seisaku Kouko to support daily operation as well as pay back accounts payable of NuZee Japan.
During November 2017, the Company signed contract for purchasing a new equipment with amount of $205,280 for future production.
Our auditor has indicated that the Company has suffered recurring losses from operations and negative cash flows from operations that raise substantial doubt about its ability to continue as a going concern. Our financial statements do not include any adjustments that might result from the outcome of this uncertainty.
Critical Accounting Policies and Estimates
Our discussion and analysis of our financial condition and results of operations are based upon our financial statements that have been prepared in accordance with generally accepted accounting principles in the United States of America ("US GAAP"). This preparation requires management to make estimates and assumptions that affect the reported amounts of assets, liabilities, revenues and expenses, and the disclosure of contingent assets and liabilities. US GAAP provides the framework from which to make these estimates, assumption and disclosures. We choose accounting policies within US GAAP that management believes are appropriate to accurately and fairly report our operating results and financial position in a consistent manner. Management regularly assesses these policies in light of current and forecasted economic conditions. While there are a number of significant accounting policies affecting our financial statements, we believe the following critical accounting policies involve the most complex, difficult and subjective estimates and judgments:
Revenue Recognition
Revenue is recognized in accordance with Staff Accounting Bulletin ("SAB") No. 101, Revenue Recognition in Financial Statements, as revised by SAB No. 104. We recognize revenue when persuasive evidence of an arrangement exists, delivery has occurred, the sales price is fixed or determinable and collectability is reasonably assured. Ownership and title of our products pass to customers upon shipping products out to customers or ultimate delivery to customers' delivery sites depends on the terms of the sale.
Cost of Sales
The Company records the cost of the materials used in creating the good as well as direct labor cost used to produce the good
.
The Company also includes write-offs for all past due and unsellable inventories as well as loss on inventory due to obsolescence in cost of sales.
Inventories
Inventories are stated at the lower of cost or net realizable value. Cost is being measured using the weighted average cost method. We regularly review whether the realizable value of our inventory is lower than its book value. If our valuation shows that the realizable value is lower than book value, we take a charge to expense and directly reduce the value of the inventory.
The Company estimates its reserves for inventory obsolescence by examining its inventories on a quarterly basis to determine if there are indicators that the carrying values exceed net realizable value. Indicators that could result in additional inventory write downs include age of inventory, damaged inventory, slow moving products and products at the end of their life cycles. While management believes that the reserve for obsolete inventory is adequate, significant judgment is involved in determining the adequacy of this reserve.
Recent Accounting Pronouncements
Recent accounting pronouncements which may be applicable to us are described in Note 2 to the Consolidated Financial Statements included as part of this report.
W
e are a smaller reporting company as defined by Rule 12b-2 of the Securities Exchange Act of 1934 and are not required to provide the information under this item.
The Index to our Financial Statements and the Report of Independent Registered Public Accounting Firm appears in Part III of this Form 10-K.
There have been no disagreements with our Independent Registered Public Accounting Firm on any matter of accounting principles or financial disclosures.
|
(a)
|
Evaluation on Disclosure Controls and Procedures
|
Disclosure controls and procedures are controls and other procedures that are designed to ensure that information required to be disclosed by our Company is recorded, processed, summarized and reported, within the time periods specified in the rules and forms of the SEC. Our Chief Executive Officer and Chief Financial Officer are responsible for establishing and maintaining disclosure controls and procedures for our Company.
Our management, with the participation of our Chief Executive Officer and Chief Financial Officer, carried out an evaluation of the effectiveness of our "disclosure controls and procedures" (as defined in the Securities Exchange Act of 1934 (the "Exchange Act") Rules 13a-15(e) and 15d-15(e)) as of the end of the period covered by this annual report on Form 10-K (the "Evaluation Date"). Based upon that evaluation, our Chief Executive Officer and Chief Financial Officer concluded that, as of the Evaluation Date, our disclosure controls and procedures are not effective, at the reasonable assurance level, to ensure that information required to be disclosed by us in the reports that we file or submit under the Exchange Act (i) is recorded, processed, summarized and reported, within the time periods specified in the SEC rules and forms and (ii) is accumulated and communicated to our management, including our Chief Executive Officer and Chief Financial Officer, as appropriate to allow timely decisions regarding required disclosure.
|
(b)
|
Management's report on internal control over financial reporting
|
Our Chief Executive Officer as well as our Chief Financial Officer, Masateru Higashida, is responsible for establishing and maintaining adequate internal control over financial reporting. Mr. Higashida has accessed the effectiveness of the Company's internal control over financial reporting as of the end of the period covered by this annual report on Form 10-K based on the criteria for effective internal control described Internal Control-Integrated Framework issued by the Committee of Sponsoring Organization of the Treadway Commission. Based on this assessment, Mr. Higashida has concluded the Company's internal controls over the financial reporting is not effective due to the following material weaknesses, which existed as of September 30, 2017:
|
●
|
Financial Reporting Systems: We did not maintain a fully integrated financial reporting system throughout the period and as a result, extensive manual analysis, reconciliation and adjustments were required in order to produce financial statements for external reporting purposes.
|
|
●
|
Segregation of Duties: We do not currently have a sufficient complement of technical accounting and external reporting personal commensurate to support standalone external financial reporting under public company or SEC requirements. Specifically, the Company did not effectively segregate certain accounting duties due to the small size of its accounting staff, and inability to maintain a sufficient number of adequately trained personnel who have the knowledge and experience with GAAP and SEC reporting necessary to anticipate and identify risks critical to financial reporting and the closing process. In addition, there were inadequate reviews and approvals by the Company's personnel of certain reconciliations and other processes in day-to-day operations due to the lack of a full complement of accounting staff.
|
We believe that our weaknesses in internal control over financial reporting and our disclosure controls relate in part to the fact that we are an emerging business with limited personnel. Management and the Board of Directors believe that the Company must allocate additional human and financial resources to address these matters. Throughout the year, the Company has been continuously improving its monitoring of current reporting systems and its personnel. The Company intends to continue to make improvements in its internal controls over financial reporting and disclosure controls until its material weaknesses are remediated.
REMEDIATION OF MATERIAL WEAKNESS
As our current financial condition allows, we are in the process of analyzing and developing our processes for the establishment of formal policies and procedures with necessary segregation of duties, which will establish mitigating controls to compensate for the risk due to lack of segregation of duties.
CHANGES IN INTERNAL CONTROL OVER FINANCIAL REPORTING
There was no change in the Company's internal control over financial reporting that occurred during the fiscal quarter ended September 30, 2017, that has materially affected, or is reasonably likely to materially affect, its internal control over financial reporting. The Company is not an "accelerated filer" for the fiscal year ended September 30, 2017 because it is qualified as a "small business issuer." Hence, under current law, the internal controls certification and attestation requirements of Section 404 of the Sarbanes-Oxley act will not apply to the Company. This Annual report on Form 10-K does not include an attestation report of our registered public accounting firm regarding internal control over financial reporting. Management's report was not subject to attestation by our registered public accounting firm pursuant to temporary rules of the Securities and Exchange Commission that permit us to provide only management's report in this Annual Report on Form 10-K.
None.
The following table sets forth the name, age and position of each of our directors, executive officers and significant employees for the fiscal year ended September 30, 2017. Except as noted below each director will hold office until the next annual meeting of our stockholders or until his or her successor has been elected and qualified. Our executive officers are appointed by, and serve at the discretion of, the Board of Directors.
|
NAME
|
AGE
|
POSITION(S) AND OFFICE(S) HELD
|
||
|
Masa Higashida
|
46
|
Chief Executive Officer, Secretary, Treasurer, Chief Financial Officer, Director (Chairman)
|
||
|
Travis Gorney
|
37 |
President, & Chief Operations Officer
|
Set forth below is a brief description of the background and business experience of each of our current executive officers and directors.
Masa Higashida, Chief Executive Officer, Secretary, Treasurer, Chief Financial Officer, Director and Chairman of the Board
Masa Higashida is a successful business executive who has started numerous companies in the financial and consumer product industries. Mr. Higashida started his career in the financial industry in Nagoya Japan and quickly saw an opportunity to expand operations and moved to Seoul, Korea where he established Won Cashing in 2002. He served as their CEO and grew Won Cashing became the number three consumer loan company in Korea. He successfully sold the company to a major financial institution in October of 2010. Following Won Cashing exit, Mr. Higashida established FROM EAST PTE LTD., in Singapore as an investment company where he is the Managing Director. Mr. Higashida then moved to New Zealand and established iSpring LTD. to help provide quality drinking water in Japan following the Tsunami of 2011. From iSpring Mr. Higashida helped establish NuZee to market and distribute quality products in the United States.
Travis Gorney, President and Chief Operations Officer
Travis Gorney started his career in the beverage industry in 2002 where Gorney worked as national sales manager for a start-up independent energy beverage company named Rollin X, LLC ("RXL"). In 2004, Mr. Gorney formed Point Blank Beverage, Inc. ("Point Blank") where, as Point Blank's President and CEO, he developed a premium energy drink by the name of Torque. From 2008 through present, Mr. Gorney has acted as President and CEO of Left Coast Threads, Inc. ("Left Coast"). Left Coast is in the business of operating retail clothing stores in San Diego County, California.
In 2011, Mr. Gorney was approached by Mr. Higashida of NuZee Co., Ltd. a California corporation, to consult for a project concerning bottled spring water from New Zealand as well as a line of certified organic beauty products. In April 2013, NuZee Co., Ltd. became NuZee, Inc. and Mr. Gorney became a full-time employee of the Company. In February 2016, Gorney was promoted to VP of Sales and Supply Chain Management, and in January 2017, Mr. Gorney was promoted to Senior VP of Sales and Marketing. On August 28, 2017, Mr. Gorney was appointed the Company's President and COO.
Term of Office
Our directors are appointed for a one-year term to hold office until the next annual general meeting of our shareholders or until removed from office in accordance with our bylaws. Our officers are appointed by our board of directors and hold office until removed by the board.
Significant Employees
We have no significant employees other than the officers described above.
Family Relationships
There are no family relationships among our directors or officers.
Involvement in Certain Legal Proceedings
Our directors, executive officers and control persons have not been involved in any of the following events during the past five years:
|
1.
|
any bankruptcy petition filed by or against any business of which such person was a general partner or executive officer either at the time of the bankruptcy or within two years prior to that time;
|
|
2.
|
any conviction in a criminal proceeding or being subject to a pending criminal proceeding (excluding traffic violations and other minor offenses);
|
|
3.
|
being subject to any order, judgment, or decree, not subsequently reversed, suspended or vacated, of any court of competent jurisdiction, permanently or temporarily enjoining, barring, suspending or otherwise limiting his involvement in any type of business, securities or banking activities; or
|
|
4.
|
being found by a court of competent jurisdiction (in a civil action), the Securities and Exchange Commission or the Commodity Futures Trading Commission to have violated a federal or state securities or commodities law, and the judgment has not been reversed, suspended, or vacated.
|
Committees of the Board of Directors
Audit Committee
The functions of the Audit Committee are to recommend to the Board of Directors the appointment of independent auditors for the Company and to analyze the reports and recommendations of such auditors. The committee also monitors the adequacy and effectiveness of the Company's financial controls and reporting procedures. The Company established an Audit Committee in December 2013, after the end of our Fiscal 2013 year-end. The Audit Committee does not meet on a regular basis, but only as circumstances require. The Company has not designated any member of its Audit Committee as a Financial Expert.
Limitation of Liability of Directors and Officers
Pursuant to Nevada Law, our Articles of Incorporation exclude personal liability for our Directors and Officers for monetary damages based upon any violation of their fiduciary duties as Directors, except as to liability for any breach of the duty of loyalty, acts or omissions not in good faith or which involve intentional misconduct or a knowing violation of law, or any transaction from which a Director or Officer receives an improper personal benefit. This exclusion of liability does not limit any right which a Director or Officer may have to be indemnified and does not affect any Director's or Officer's liability under federal or applicable state securities laws. We have agreed to indemnify our directors and officers against expenses, judgments, and amounts paid in settlement in connection with any claim against a Director or officer if he or she acted in good faith and in a manner he believed to be in our best interests.
The following table sets for forth the compensation paid by us for the last two fiscal years. This information includes the dollar value of base salaries, bonus awards and number of stock options granted, and certain other compensation, if any. The compensation discussed addresses all compensation awarded to, earned by, or paid or named executive officers.
|
SUMMARY COMPENSATION TABLE
|
|||||||||
|
Name and
principal position
(a)
|
Year
(b)
|
Salary
(US$)
(c)
|
Bonus
(US$)
(d)
|
Stock Awards
(US$)
(e)
|
Option
Awards
(US$)
(f)
|
Non-Equity
Incentive Plan
Compensation
(US$)
(g)
|
Nonqualified
Deferred
Compensation
Earnings
(US$)
(h)
|
All Other
Compensation
(US$)
(i)
|
Total
(US$)
(j)
|
|
Masateru Higashida
CEO, CFO, Secretary, Treasurer (1)
|
2017
2016
|
15,000
0
|
100,000
0
|
0
0
|
617,485
0
|
0
0
|
0
0
|
0
0
|
732,485
0
|
|
Travis Gorney
President, COO
(2)
|
2017 | 83,450 | 0 | 0 | 15,134 | 0 | 0 | 0 | 98,584 |
|
(1)
|
Masateru Higashida was appointed as the Company's President, Chief Executive Officer, Chief Financial Officer, Treasurer, Secretary, and Chief Operations Officer ("COO") on August 19, 2014. Mr. Higashida resigned as the Company's President and COO on August 28, 2017.
|
|
(2)
|
Travis Gorney was appointed as the Company's President & Chief Operations Officer on August 28, 2017.
|
Narrative Disclosure to the Summary Compensation Table
There are no arrangements or plans in which we provide pension, retirement or similar benefits for directors or executive officers. Our directors and executive officers may receive stock options at the discretion of our board of directors in the future. We do not have any material bonus or profit sharing plans pursuant to which cash or non-cash compensation is or may be paid to our directors or executive officers, except that stock options may be granted at the discretion of our board of directors from time to time. We have no plans or arrangements in respect of remuneration received or that may be received by our executive officers to compensate such officers in the event of termination of employment (as a result of resignation, retirement, change of control) or a change of responsibilities following a change of control.
Outstanding Equity Awards At Fiscal Year-End
No named executive officer or director holds exercisable or exercisable options, as of the years ended September 30, 2017 and 2016.
Long-Term Incentive Plan Awards
We do not have any long-term incentive plans that provide compensation intended to serve as incentive for performance.
ITEM 12. SECURITY OWERSHIIP OF CERTAIN BENEFICIAL OWNERS AND MANAGEMENT AND RELATED STOCKHOLDER MATTERS.
The following table sets forth, as of February 16, 2018, the beneficial ownership of our common stock by each executive officer and director, by each person known by us to beneficially own more than 5% of our common stock and by the executive officers and directors as a group. Except as otherwise indicated, all shares are owned directly, and the percentage shown is based on 36,062,321 shares of common stock issued and outstanding on February 16, 2018.
|
Title of Class
|
Name and Address of Beneficial Owner
|
Amount of Beneficial Ownership
|
Percent of Class
(1)
|
|
Executive Officers and Directors
|
|||
|
Common
|
Masateru Higashida
|
14,233,633
|
39.47%
|
|
Common
|
Travis Gorney
|
1,642,000
|
4.55%
|
|
Total of All Executive Officers and Directors
|
15,875,633
|
44.02%
|
|
|
Shareholders Holding 5% or Greater
|
|||
|
Common
|
Masateru Higashida
|
14,233,633
|
39.47%
|
|
Total of All Shareholders With 5% or Greater
|
14,233,633
|
39.47%
|
|
(1) As used in this table, "beneficial ownership" means the sole or shared power to vote, or to direct the voting of, a security, or the sole or shared investment power with respect to a security (i.e., the power to dispose of, or to direct the disposition of, a security). In addition, for purposes of this table, a person is deemed, as of any date, to have "beneficial ownership" of any security that such person has the right to acquire within 60 days after such date.
The persons named above have full voting and investment power with respect to the shares indicated. Under the rules of the Securities and Exchange Commission, a person (or group of persons) is deemed to be a "beneficial owner" of a security if he or she, directly or indirectly, has or shares the power to vote or to direct the voting of such security, or the power to dispose of or to direct the disposition of such security. Accordingly, more than one person may be deemed to be a beneficial owner of the same security. A person is also deemed to be a beneficial owner of any security, which that person has the right to acquire within 60 days, such as options or warrants to purchase our common stock.
Director Independence
We are not currently a "listed company" under SEC rules and are therefore not required to have a Board comprised of a majority of independent directors or separate committees comprised of independent directors. We do not consider our sole director as "independent" as the term "independent" is defined by the rules of the NASDAQ Stock Market.
Review, Approval Or Ratification Of Transactions With Related Persons
We are a smaller reporting company as defined by Rule 12b-2 of the Securities Exchange Act of 1934 and are not required to provide the information under this item.
The following is a summary of the fees billed to us by MaloneBailey LLP for professional services rendered for the fiscal years ended September 30, 2017 and 2016:
|
2017
|
2016
|
|||||||
|
FEE CATEGORY
|
||||||||
|
Audit Fees (Malone &Bailey)
|
$
|
52,036
|
$
|
43,922
|
||||
|
Tax Fee
|
-
|
-
|
||||||
|
Audit-Related Fees
|
-
|
-
|
||||||
|
TOTAL FEES
|
$
|
52,036
|
$
|
43,922
|
||||
Audit Fees
consist of fees billed for professional services rendered for the audit of our company's financial statements and review of our interim financial statements included in quarterly reports and services that are normally provided by our auditors in connection with statutory and regulatory filings or engagements.
Audit Related Fees
consist of fees billed for assurance and related services that are reasonably related to the performance of the audit or review of our financial statements and are not reported under "Audit Fees".
Tax Fees
consist of fees billed for professional services for tax compliance, tax advice and tax planning.
The following documents are filed as part of this Form 10-K:
|
|
Page
|
|
|
Consolidated Financial Statements For The Fiscal Year Ended September 30, 2017
|
|
|
|
|
||
|
|
||
|
|
||
|
|
||
|
|
||
|
|
The following exhibits are hereby filed as part of this Annual Report on Form 10-K or incorporated by reference:
|
EXHIBIT NO.
|
|
DESCRIPTION
|
Pursuant to the requirements of Section 13 or 15(d) of the Exchange Act, the registrant caused this report to be signed on its behalf by the undersigned, thereunto duly authorized on February 20, 2018.
| NuZee, Inc. | |||
|
|
By:
|
/s/ Masateru Higashida | |
| Name: | Masateru Higashida | ||
| Title: | Chief Executive Officer (Principal Executive Officer), Chief Financial Officer (Principal Financial Officer), Secretary, Treasurer, and Director | ||
Pursuant to the requirements of the Securities Exchange Act of 1934, this report has been signed by the following persons on behalf of the registrant and in the capacities and on February 20, 2018.
To the Board of Directors and Stockholders
Nuzee, Inc.
Vista, California
We have audited the accompanying consolidated balance sheets of Nuzee Inc. and its subsidiary (collectively, the "Company") as of September 30, 2017 and 2016, and the related consolidated statements of operations, comprehensive loss, changes in stockholders' equity (deficit), and cash flows for the years then ended. These consolidated financial statements are the responsibility of the entity's management. Our responsibility is to express an opinion on these consolidated financial statements based on our audits.
We conducted our audits in accordance with the standards of the Public Company Accounting Oversight Board (United States). Those standards require that we plan and perform an audit to obtain reasonable assurance about whether the financial statements are free of material misstatement. The Company is not required to have, nor were we engaged to perform, an audit of its internal control over financial reporting. Our audits included consideration of internal control over financial reporting as a basis for designing audit procedures that are appropriate in the circumstances, but not for the purpose of expressing an opinion on the effectiveness of the Company's internal control over financial reporting. Accordingly, we express no such opinion. An audit also includes examining, on a test basis, evidence supporting the amounts and disclosures in the financial statements, assessing the accounting principles used and significant estimates made by management, as well as evaluating the overall financial statement presentation. We believe that our audits provide a reasonable basis for our opinion.
In our opinion, the consolidated financial statements referred to above present fairly, in all material respects, the financial position of Nuzee, Inc. and its subsidiary as of September 30, 2017 and 2016, and the consolidated results of their operations and their cash flows for the years then ended, in conformity with accounting principles generally accepted in the United States of America.
The accompanying consolidated financial statements have been prepared assuming that the Company will continue as a going concern. As discussed in Note 2 to the consolidated financial statements, the Company has suffered recurring losses from operations and negative cash flows from operations that raise substantial doubt about its ability to continue as a going concern. Management's plans in regard to these matters are also described in Note 2. The consolidated financial statements do not include any adjustments that might result from the outcome of this uncertainty.
/s/ MaloneBailey, LLP
www.malonebailey.com
Houston, Texas
February 20, 2018
|
NuZee, Inc.
|
||||||||
|
|
||||||||
|
September 30, 2017
|
September 30, 2016
|
|||||||
|
ASSETS
|
||||||||
|
Current assets:
|
||||||||
|
Cash
|
$
|
347,327
|
$
|
40,613
|
||||
|
Accounts receivable, net
|
143,893
|
57,711
|
||||||
|
Accounts receivable - Related party
|
12,380
|
-
|
||||||
|
Inventories, net
|
266,620
|
206,356
|
||||||
|
Other current assets
|
102,926
|
65,726
|
||||||
|
Other current assets - Related party
|
29,378
|
- | ||||||
|
Total current assets
|
902,524
|
370,406
|
||||||
|
Property and equipment, net
|
277,987
|
151,946
|
||||||
|
Other assets:
|
||||||||
|
Goodwill
|
17,112
|
-
|
||||||
|
Customer List, net
|
45,899
|
-
|
||||||
|
Investment in unconsolidated affiliate
|
10,733
|
-
|
||||||
|
73,744
|
-
|
|||||||
|
Total assets
|
$
|
1,254,255
|
$
|
522,352
|
||||
|
LIABILITIES AND STOCKHOLDERS' EQUITY (DEFICIT)
|
||||||||
|
Current liabilities:
|
||||||||
|
Accounts payable
|
$
|
104,973
|
$
|
189,317
|
||||
|
Loan payable - short term - Related party
|
200
|
145,377
|
||||||
|
Current portion of long-term loan payable
|
44,681
|
-
|
||||||
|
Convertible Notes payable - Related party
|
-
|
603,008
|
||||||
|
Other current liabilities
|
126,687
|
717
|
||||||
|
Other current liabilities - Related party
|
1,089
|
-
|
||||||
|
Deferred revenue
|
72,750
|
6,620
|
||||||
|
Total current liabilities
|
350,380
|
945,039
|
||||||
|
Non-current liabilities:
|
||||||||
|
Loan payable - long term, net of current portion
|
$
|
133,644
|
$
|
-
|
||||
|
Other noncurrent liabilities
|
9,610
|
-
|
||||||
|
143,254
|
-
|
|||||||
|
Total liabilities
|
493,634
|
945,039
|
||||||
|
Stockholders' equity (deficit):
|
||||||||
|
Common stock; 100,000,000 shares authorized, $0.00001 par value;
|
||||||||
|
34,720,538 and 31,154,951 shares issued
|
$
|
347
|
$
|
311
|
||||
|
Additional paid in capital
|
9,718,648
|
6,909,523
|
||||||
|
Accumulated deficit
|
(9,030,551
|
)
|
(7,263,412
|
)
|
||||
|
Less: treasury stock, at cost
|
||||||||
|
(0 and 1,800,844 shares held in treasury)
|
-
|
(69,109
|
)
|
|||||
|
Accumulated other comprehensive loss
|
(20,680
|
)
|
-
|
|||||
|
Total NuZee, Inc. shareholders' equity (deficit)
|
667,764
|
(422,687
|
)
|
|||||
|
Noncontrolling interest
|
92,857
|
-
|
||||||
|
Total stockholders' equity (deficit)
|
760,621
|
(422,687
|
)
|
|||||
|
Total liabilities and stockholders' equity (deficit)
|
$
|
1,254,255
|
$
|
522,352
|
||||
The accompanying notes are an integral part of these consolidated financial statements
|
NuZee, Inc.
|
||||||||
|
|
||||||||
|
Year Ended
September 30,
2017
|
Year Ended
September 30,
2016
|
|||||||
|
Revenues, net
|
$
|
1,628,410
|
$
|
455,491
|
||||
|
Cost of sales
|
1,319,232
|
408,150
|
||||||
|
Gross Profit
|
309,178
|
47,341
|
||||||
|
Operating expenses
|
2,076,654
|
1,325,463
|
||||||
|
Loss from operations
|
(1,767,476
|
)
|
(1,278,122
|
)
|
||||
|
Other income
|
40,764
|
11,897
|
||||||
|
Equity in loss of unconsolidated affiliate
|
(39,267
|
)
|
-
|
|||||
|
Other expense
|
(3,235
|
)
|
(5,683
|
)
|
||||
|
Interest expense
|
(6,976
|
)
|
(3,385
|
)
|
||||
|
Net loss
|
(1,776,190
|
)
|
(1,275,293
|
)
|
||||
|
Net loss attributable to noncontrolling interest
|
(9,051
|
)
|
-
|
|||||
|
Net loss attributable to NuZee, Inc.
|
$
|
(1,767,139
|
)
|
$
|
(1,275,293
|
)
|
||
|
Basic and diluted loss per common share
|
$
|
(0.05
|
)
|
$
|
(0.04
|
)
|
||
|
Basic and diluted weighted average number of common stock outstanding
|
32,135,363 | 30,752,267 | ||||||
The accompanying notes are an integral part of these consolidated financial statements
|
NuZee, Inc.
|
||||||||||||||||||||||||
|
Noncontrolling
|
||||||||||||||||||||||||
|
NuZee, Inc.
|
Interests
|
Total
|
||||||||||||||||||||||
|
For the year eneded September 30, 2017
|
2017
|
2016
|
2017
|
2016
|
2017
|
2016
|
||||||||||||||||||
|
Net loss
|
$
|
(1,767,139
|
)
|
$
|
(1,275,293
|
)
|
$
|
(9,051
|
)
|
$
|
-
|
$
|
(1,776,190
|
)
|
$
|
(1,275,293
|
)
|
|||||||
|
Foreign currency translation
|
(20,680
|
)
|
-
|
(8,863
|
)
|
-
|
(29,543
|
)
|
-
|
|||||||||||||||
|
Total other comprehensive loss, net of tax
|
(20,680
|
)
|
-
|
(8,863
|
)
|
-
|
(29,543
|
)
|
-
|
|||||||||||||||
|
Comprehensive loss
|
$
|
(1,787,819
|
)
|
$
|
(1,275,293
|
)
|
$
|
(17,914
|
)
|
$
|
-
|
$
|
(1,805,733
|
)
|
$
|
(1,275,293
|
)
|
|||||||
The accompanying notes are an integral part of these consolidated financial statements
|
NuZee, Inc.
|
||||||||||||||||||||||||||||||||||||
|
For the period from October 1, 2015 to September 30, 2017
|
||||||||||||||||||||||||||||||||||||
|
Additional
|
Total
|
|||||||||||||||||||||||||||||||||||
|
Common Stock
|
Paid-in
|
Treasury Stock
|
Accumulated
|
Noncontrolling
|
|
Stockholders'
|
||||||||||||||||||||||||||||||
|
Shares
|
Amount
|
Capital
|
Shares
|
Amount
|
Deficit
|
Interest
|
OCI |
Equity
|
||||||||||||||||||||||||||||
|
Balance September 30, 2015
|
30,124,951
|
$
|
301
|
$
|
5,940,337
|
2,016,000
|
$
|
(77,366
|
)
|
$
|
(5,988,119
|
)
|
$
|
-
|
$
|
-
|
$
|
(124,847
|
)
|
|||||||||||||||||
|
Common stock issued for cash
|
1,025,000
|
10
|
800,991
|
-
|
-
|
-
|
-
|
-
|
801,001
|
|||||||||||||||||||||||||||
|
Treasury stock issued for cash
|
-
|
-
|
129,442
|
(215,156
|
)
|
8,257
|
-
|
-
|
-
|
137,699
|
||||||||||||||||||||||||||
|
Stock option expense
|
-
|
-
|
37,253
|
-
|
-
|
-
|
-
|
-
|
37,253
|
|||||||||||||||||||||||||||
|
Stock options-exercised
|
5,000
|
-
|
1,500
|
-
|
-
|
-
|
-
|
-
|
1,500
|
|||||||||||||||||||||||||||
|
Net loss
|
-
|
-
|
-
|
-
|
-
|
(1,275,293
|
)
|
-
|
-
|
(1,275,293
|
)
|
|||||||||||||||||||||||||
|
Balance September 30, 2016
|
31,154,951
|
311
|
6,909,523
|
(1,800,844
|
)
|
(69,109
|
)
|
(7,263,412
|
)
|
-
|
-
|
(422,687
|
)
|
|||||||||||||||||||||||
|
Common stock issued for cash
|
1,032,539
|
11
|
860,034
|
-
|
-
|
-
|
-
|
-
|
860,045
|
|||||||||||||||||||||||||||
|
Treasury stock issued for cash
|
-
|
-
|
833,002
|
1,766,242
|
67,781
|
-
|
-
|
-
|
900,783
|
|||||||||||||||||||||||||||
|
Treasury stock issued for service
|
-
|
-
|
13,551
|
34,602
|
1,328
|
-
|
-
|
-
|
14,879
|
|||||||||||||||||||||||||||
|
Common stock issued for conversion of note payable
|
1,384,314
|
14
|
705,986
|
-
|
-
|
-
|
-
|
-
|
706,000
|
|||||||||||||||||||||||||||
|
Stock option expense
|
-
|
-
|
138,098
|
-
|
-
|
-
|
-
|
-
|
138,098
|
|||||||||||||||||||||||||||
|
Stock issued for NuZee JP acquisition
|
1,148,734
|
11
|
258,454
|
-
|
-
|
-
|
110,771
|
-
|
369,236
|
|||||||||||||||||||||||||||
|
NuZee Japan foreign currency gain(loss)
|
-
|
-
|
-
|
-
|
-
|
-
|
(8,863
|
)
|
(20,680
|
)
|
(29,543
|
)
|
||||||||||||||||||||||||
|
Net loss
|
-
|
-
|
-
|
-
|
-
|
(1,767,139
|
)
|
(9,051
|
)
|
-
|
(1,776,190
|
)
|
||||||||||||||||||||||||
|
Balance September 30, 2017
|
34,720,538
|
$
|
347
|
$
|
9,718,648
|
-
|
$
|
-
|
$
|
(9,030,551
|
)
|
$
|
92,857
|
$
|
(20,680
|
)
|
$
|
760,621
|
||||||||||||||||||
The accompanying notes are an integral part of these consolidated financial statements
|
NuZee, Inc.
|
||||||||
|
|
||||||||
|
For the Year Ended
September 30,
2017
|
For the Year Ended
September 30,
2016
|
|||||||
|
Operating activities:
|
||||||||
|
Net loss
|
$
|
(1,776,190
|
)
|
$
|
(1,275,293
|
)
|
||
|
Adjustments to reconcile net loss to net cash used by operating activities:
|
||||||||
|
Depreciation and Amortization
|
87,392
|
41,921
|
||||||
|
Loss on disposition of equipments
|
-
|
2,715
|
||||||
|
Share issued for services
|
14,879
|
-
|
||||||
|
Option expense
|
138,098
|
37,253
|
||||||
|
Interest expense
|
2,615
|
3,385
|
||||||
|
Inventory impairment
|
9,086
|
49,223
|
||||||
|
Provision for sales returns and chargebacks
|
86,487
|
-
|
||||||
|
Equity in loss of unconsolidated affiliate
|
39,267
|
-
|
||||||
|
Change in operating assets and liabilities:
|
||||||||
|
Accounts receivable
|
(165,614
|
)
|
(39,506
|
)
|
||||
|
Accounts receivable - Related party
|
35,174
|
-
|
||||||
|
Inventories
|
140,784
|
(53,816
|
)
|
|||||
|
Other current assets
|
31,564
|
(44,194
|
)
|
|||||
|
Other current assets - Related party
|
(29,378
|
)
|
-
|
|||||
|
Accounts payable
|
(159,859
|
)
|
123,796
|
|||||
|
Other current liabilities
|
80,648
|
6,730
|
||||||
|
Other current liabilities - Related party
|
1,089
|
-
|
||||||
|
Deferred revenue
|
66,130
|
-
|
||||||
|
Net cash used by operating activities
|
(1,397,828
|
)
|
(1,147,786
|
)
|
||||
|
Investing activities:
|
||||||||
|
Purchase of equipment
|
(186,973
|
)
|
(4,479
|
)
|
||||
|
Acquisition of investment in unconsolidated affiliate
|
(50,000
|
)
|
-
|
|||||
|
Net cash acquired from business acquisition
|
201,676
|
-
|
||||||
|
Net cash used by investing activities
|
(35,297
|
)
|
(4,479
|
)
|
||||
|
Financing activities:
|
||||||||
|
Proceeds from issuance of Loan - short term - Related party
|
572,306
|
-
|
||||||
|
Repayment of loans - short term - Related party
|
(617,106
|
)
|
-
|
|||||
|
Proceeds from issuance of Loan - short term
|
87,268
|
200,000
|
||||||
|
Repayment of loans - short term
|
(37,600
|
)
|
(55,000
|
)
|
||||
|
Payments on capital lease
|
(7,866
|
)
|
- | |||||
|
Proceeds from issuance of common stock
|
860,045
|
801,001
|
||||||
|
Proceeds from issuance of exercise of options
|
-
|
1,500
|
||||||
|
Proceeds from issuance of treasury stock
|
900,783
|
137,699
|
||||||
|
Net cash provided by financing activities
|
1,757,830
|
1,085,200
|
||||||
|
Effect of foreign exchange on cash
|
(17,991
|
)
|
-
|
|||||
|
Net change in cash
|
306,714
|
(67,065
|
)
|
|||||
|
Cash, beginning of period
|
40,613
|
107,678
|
||||||
|
Cash, end of period
|
$
|
347,327
|
$
|
40,613
|
||||
|
Supplemental disclosure of cash flow information:
|
||||||||
|
Cash paid for interest
|
$
|
2,649
|
$
|
-
|
||||
|
Cash paid for taxes
|
$
|
800
|
$
|
800
|
||||
|
Noncash investing and financing activities:
|
||||||||
|
Acquisition of NuZee JAPAN Co., Ltd through issuance of common shares
|
$ | 258,465 | $ | - | ||||
|
Conversion of note payable to common stock
|
$
|
606,000
|
$
|
-
|
||||
|
Conversion of note payable to common stock - Related party
|
$ | 100,000 | $ | - | ||||
The accompanying notes are an integral part of these consolidated financial statements
NuZee, Inc.
Notes to Consolidated Financial Statements
September 30, 2017
1. Organization
NuZee, Inc. (the "Company", "we", "our") was incorporated on November 9, 2011 in Nevada. The Company is a start-up organization which markets and distributes consumer products primarily in the beverage segment. Additionally, while the Company primarily intends to purchase its proprietary products and resell, the Company may also engage in contract manufacturing where the Company purchases raw materials and retains a contract converter to process the raw materials into finished products for resale.
On August 16, 2016, the Company entered into a Share Exchange Agreement with NuZee JAPAN Co., Ltd ("NuZee JP") and its shareholders whereby the Company will exchange 1,148,734 shares of its common stock, par value $0.00001 per share, for seventy percent (70%) of the issued and outstanding common stock of NuZee JP. The acquisition of NuZee JP closed on October 3, 2016.
NuZee JP was incorporated on December 16, 2013 in Aichi, Japan and is a start-up organization which markets and distributes consumer products primarily in the beverage segment. NuZee JP primarily intends to purchase and resell its proprietary products directly to consumers through its website portal as well as through online stores such as Rakuten and Japan Post online shop.
2. BASIS OF PRESENTATION AND SUMMARY OF SIGNIFICANT ACCOUNTING POLICIES
The summary of significant accounting policies presented below is designed to assist in understanding the Company's financial statements. Such financial statements and accompanying notes are the representations of the Company's management, who are responsible for their integrity and objectivity. These accounting policies conform to accounting principles generally accepted in the United States of America ("GAAP") in all material respects and have been consistently applied in preparing the accompanying financial statements.
Earnings per Share
Basic earnings per common share equal net earnings or loss divided by the weighted average of shares outstanding during the reporting period. Diluted earnings per share reflects the potential dilution that could occur if stock options and other commitments to issue common stock were exercised or equity awards vest resulting in the issuance of common stock that could share in the earnings of the Company. The Company incurred a net loss for the years ended September 30, 2017 and 2016, respectively and therefore, basic and diluted earnings per share for those periods are the same because all potential common equivalent shares would be antidilutive.
Going Concern and Capital Resources
Since its inception, the Company has devoted substantially all of its efforts to business planning, research and development, recruiting management and technical staff, acquiring operating assets and raising capital. The Company has suffered recurring losses from operations, and negative cash flows from operations.
As of September 30, 2017, the Company had cash (operating capital) of $347,327 and had $200 short-term loan payable. The Company has not attained profitable operations since inception.
The accompanying consolidated financial statements have been prepared in accordance with accounting principles generally accepted in the United States of America, which contemplates continuation of the Company as a going concern. The Company has had limited revenues, recurring losses, an accumulated deficit and is dependent on the shareholder to provide additional funding for operating expenses. These items raise substantial doubt as to the Company's ability to continue as a going concern.
The accompanying consolidated financial statements do not include any adjustments that might result from the outcome of this uncertainty. The Company's continued existence is dependent upon management's ability to develop profitable operations, continued contributions from the Company's executive officers to finance its operations and the ability to obtain additional funding sources to explore potential strategic relationships and to provide capital and other resources for the further development and marketing of the Company's products and business.
Use of Estimates
In preparing these consolidated financial statements, management is required to make estimates and assumptions that affect the reported amounts of assets and liabilities and disclosure of contingent assets and liabilities as of the date of the financial statements and the reported amount of revenues and expenses during the reporting periods. Actual results could differ from those estimates.
Fair Value of Financial Instruments
Fair value is an estimate of the exit price, representing the amount that would be received to, sell an asset or paid to transfer a liability in an orderly transaction between market participants (i.e., the exit price at the measurement date). Fair value measurements are not adjusted for transaction cost. Fair value measurement under generally accepted accounting principles provides for use of a fair value hierarchy that prioritizes inputs to valuation techniques used to measure fair value into three levels:
Level 1: Unadjusted quoted prices in active markets for identical assets or liabilities.
Level 2: Inputs other than quoted market prices that are observable, either directly or indirectly, and reasonably available. Observable inputs reflect the assumptions market participants would use in pricing the asset or liability and are developed based on market data obtained from sources independent of the Company.
Level 3: Unobservable inputs reflect the assumptions that the Company develops based on available information about what market participants would use in valuing the asset or liability.
The Company does not have any assets or liabilities that are required to be measured and recorded at fair value on a recurring basis.
The carrying amounts of cash, accounts receivable, notes receivable, accounts payable, accrued liabilities and short-term debt approximate fair value because of the short-term nature of these instruments. The carrying amount of long-term debt approximates fair value because the debt is based on current rates at which the Company could borrow funds with similar remaining maturities. Fair value estimates are made at a specific point in time, based on relevant market information about the financial instruments when available. These estimates are subjective in nature and involve uncertainties and matters of significant judgment and therefore, cannot be determined with precision. Changes in assumptions could significantly affect the estimates.
Cash and Cash Equivalents
The Company considers all highly-liquid investments with original maturities of three months or less when purchased to be cash equivalents. The Company had no cash equivalents as of September 30, 2017
and 2016.
Concentration of Credit Risk
Financial instruments that potentially subject the Company to concentrations of credit risk consist principally of cash and cash equivalents. The Company places its cash with high quality banking institutions. From time to time, the Company may or may not maintain cash balances at certain institutions in excess of the Federal Deposit Insurance Corporation limit.
Accounts Receivable
Trade accounts receivable are periodically evaluated for collectability based on past credit history with customers and their current financial condition. Bad debts expense or write offs of receivables are determined on the basis of loss experience, known and inherent risks in the receivable portfolio and current economic conditions. The Company recognized a reserve of $86,487 and $0 as of September 30, 2017 and 2016, respectively, for estimated chargebacks from retailers.
Major Customers
For the years ended September 30, 2017 and 2016, revenue was primarily from major customers disclosed below. Besides those revenues, there were $106,413 accounts receivable owed by customer PO and $6,280 accounts receivable owed by customer N which is a related party of the Company as of September 30, 2017 and $51,384 accounts receivable owed by customer S and $0 accounts receivable owed by H and C as of September 30, 2016.
| For the year ended September 30, 2017: | ||||||||
|
Customer Name
|
Sales Amount
|
% of Total Revenue
|
||||||
|
Customer PO
|
$
|
536,511
|
33
|
%
|
||||
|
Customer N
|
$
|
489,058
|
30
|
%
|
||||
|
For the year ended September 30, 2016:
|
||||||||
|
Customer Name
|
Sales Amount
|
% of Total Revenue
|
||||||
|
Customer S
|
$
|
259,104
|
57
|
%
|
||||
|
Customer H
|
$
|
91,712
|
21
|
%
|
||||
|
Customer C
|
$
|
70,462
|
15
|
%
|
||||
Lease
The Company evaluates each lease for classification as either a capital lease or an operating lease. If substantially all of the benefits and risks of ownership have been transferred to the Company as lessee, the Company records the lease as a capital lease at its inception. The Company performs this evaluation at the inception of the lease and when a modification is made to a lease. If the lease agreement calls for a scheduled rent increase during the lease term, the Company recognizes the lease expense on a straight-line basis over the lease term.
NuZee JAPAN Co., Ltd is the lessee of certain equipment under a capital lease extending through 2020. The asset and liability under the capital lease are recorded at the lower of the present value of the minimum lease payments, or the fair value of the asset. Leased equipment is depreciated over a 6-year life. The leased equipment is reported in the accompanying consolidated balance sheets in property and equipment of $11,465 as of September 30, 2017. The capital lease liability is included in other current liabilities on the consolidated balance sheets.
Future minimum lease payments under capital lease as of September 30, 2017 for each of the remaining years are as follows:
|
2017
|
$
|
4,271
|
||
|
2018
|
$
|
4,271
|
||
|
2019
|
$
|
4,271
|
||
|
2020
|
$
|
1,068
|
||
|
Total Minimum Lease Payments
|
$
|
13,881
|
The Company leases office space under leases expiring on May 31, 2020. Rent expense included in general and administrative expense for the year ended September 30, 2017 and 2016 was $88,903 and $49,592 respectively.
Future minimum rents as of September 30, 2017 for each of the remaining years are as follows:
|
2017
|
$
|
56,784
|
||
|
2018
|
$
|
58,488
|
||
|
2019
|
$
|
39,760
|
||
|
Total Minimum Lease Payments
|
$
|
155,032
|
Principles of Consolidation
The Company prepares its financial statements on the accrual basis of accounting. The accompanying consolidated financial statements include the accounts of the Company and its majority owned subsidiary which has a fiscal year end of September 30. All significant intercompany accounts, balances and transactions have been eliminated in the consolidation.
The Company consolidates its subsidiary in accordance with ASC 810, and specifically ASC 810-10-15-8 which states, the usual condition for a controlling financial interest is ownership of a majority voting interest, and, therefore, as a general rule ownership by one reporting entity, directly or indirectly, or over 50% of the outstanding voting shares of another entity is a condition pointing toward consolidation.
Foreign Currency Translation
The financial position and results of operations of the Company's foreign subsidiary is measured using the foreign subsidiary's local currency as the functional currency. Revenues and expenses of such subsidiary has been translated into U.S. dollars at average exchange rates prevailing during the period. Assets and liabilities have been translated at the rates of exchange on the balance sheet date. The resulting translation gain and loss adjustments are recorded directly as a separate component of stockholders' equity, unless there is a sale or complete liquidation of the underlying foreign investment. Foreign currency translation adjustment recorded to other comprehensive loss amounted to $20,680 and $0 as of September 30, 2017 and 2016, respectively.
Transaction gains and losses that arise from exchange rate fluctuations on transactions denominated in a currency other than the functional currency are included in the results of operations as incurred. Foreign currency transaction losses included in the consolidated statements of operations totaled $3,235 and $2,968 for the years ended September 30, 2017 and 2016, respectively.
Equity Method
Investee companies that are not consolidated, but over which the Company exercises significant influence, are accounted for under the equity method of accounting. Whether or not the Company exercises significant influence with respect to an investee depends on an evaluation of several factors including, among others, representation on the investee company's board of directors and ownership level, which is generally a 20% to 50% interest in the voting securities of the investee company. Under the equity method of accounting, an investee company's accounts are not reflected within the Company's consolidated balance sheets and consolidated statements of operations; however, the Company's share of the earnings or losses of the Investee company is reflected in the caption ''Equity in loss of unconsolidated affiliate'' in the consolidated statements of operations. The Company's carrying value in an equity method investee company is reflected in the caption ''Investment in unconsolidated affiliate'' in the company's consolidated balance sheets.
When the Company's carrying value in an equity method investee company is reduced to zero, no further losses are recorded in the Company's consolidated financial statements unless the Company guaranteed obligations of the investee company or has committed additional funding. When the investee company subsequently reports income, the Company will not record its share of such income until it equals the amount of its share of losses not previously recognized.
Goodwill
The Company evaluates goodwill on an annual basis or more frequently if management believes indicators of impairment exist. Such indicators could include, but are not limited to (1) a significant adverse change in legal factors or in business climate, (2) unanticipated competition, or (3) an adverse action or assessment by a regulator. The Company first assesses qualitative factors to determine whether it is more likely than not that the fair value of a reporting unit is less than its carrying amount, including goodwill. If management concludes that it is more likely than not that the fair value of a reporting unit is less than its carrying amount, management conducts a two-step quantitative goodwill impairment test. The first step of the impairment test involves comparing the fair value of the applicable reporting unit with its carrying value. The Company estimates the fair values of its reporting units using a combination of the income, or discounted cash flows, approach and the market approach, which utilizes comparable companies' data. If the carrying amount of a reporting unit exceeds the reporting unit's fair value, management performs the second step of the goodwill impairment test. The second step of the goodwill impairment test involves comparing the implied fair value of the affected reporting unit's goodwill with the carrying value of that goodwill. The amount, by which the carrying value of the goodwill exceeds its implied fair value, if any, is recognized as an impairment loss.
Revenue Recognition
The Company recognizes revenue only when all of the following criteria have been met:
|
●
|
Persuasive evidence of an arrangement exists;
|
|
●
|
Delivery has occurred or services have been rendered;
|
|
●
|
The fee for the arrangement is fixed or determinable; and
|
|
●
|
Collectability is reasonably assured.
|
Persuasive Evidence of an Arrangement
—the Company documents all terms of an arrangement in a written contract signed by partial customer prior to recognizing revenue. For those customers do not have signed contracts with us, we did business with them based on purchase orders received, which include online orders.
Delivery Has Occurred or Services Have Been Performed
—The Company performs delivery of all products to customers and recognize revenue upon shipment or ultimate delivery to customers' delivery sites depending on the terms of the sale.
Collectability Is Reasonably Assured
—The Company determines that collectability is reasonably assured prior to recognizing revenue. Collectability is assessed on a customer by customer basis based on criteria outlined by management. New customers are subject to a credit review process, which evaluates the customer's financial position and ultimately its ability to pay. The Company does not enter into arrangements unless collectability is reasonably assured at the outset. Existing customers are subject to ongoing credit evaluations based on payment history and other factors. If it is determined during the arrangement that collectability is not reasonably assured, revenue is recognized on a cash basis.
Return and Exchange Policy
The Company provides a 30-day money-back guarantee if a buyer is not satisfied with a product. All of the products are thoroughly inspected and securely packaged before they are shipped to ensure buyers receive the best possible product. If for any reason buyers are unsatisfied with the products, they can return them and the Company will exchange or refund the purchase minus any shipping charges. For the wholesale customers, return policies varies based on their specific agreements with customers. Under chargebacks agreements with the customers, the Company agrees to reimburse the seller for a portion of the costs incurred by the seller to advertise and promote certain of the Company's products. The Company estimates, accrues and recognized such chargebacks. These amounts are included in the determination of net sales.
As of September 30
,
2017, the Company had $155,854 of sales allowances for estimated chargebacks and returns. Revenue recognized is net of sales allowances.
Cost Recognition
Cost of products sold is primarily comprised of direct materials consumed in the manufacturing of primary coffee blender products. Cost of products sold also includes directly related labors' salaries and other overhead cost.
Selling, General and Administrative Expense
Selling, general and administrative expense (SG&A) is primarily comprised of marketing expenses, research and development costs, administrative and other indirect overhead costs, depreciation expense and other miscellaneous operating items. Personnel expenses, occupying a majority portion of SG&A, were $741,550 and $308,631 for the years ended September 30, 2017 and 2016, respectively. Company covers shipping fees for wholesalers and distributors and the shipping and handling expenses are recorded under operating expenses in the consolidated statements of operations.
The Company expenses advertising costs when incurred. Advertising expense for the years ended September 30, 2017 and 2016 is as follows:
|
September 30, 2017
|
September 30, 2016
|
|||||||
|
Advertising
|
$
|
61,202
|
$
|
33,030
|
||||
The consolidated statements of cash flows are prepared using the indirect method, which reconciles net loss to cash flow from operating activities. The reconciliation adjustments include the removal of timing differences between the occurrence of operating receipts and payments and their recognition in net loss. The adjustments also remove cash flows arising from investing and financing activities, which are presented separately from operating activities.
Research and Development
Research and development expenses are expensed in the consolidated statements of operations as incurred in accordance with FASB ASC 730, Research and Development. Research and development expenses for the years ended September 30, 2017 and 2016 amounted to $18,908 and $9,423 respectively.
Inventory
Inventory, consisting principally of raw materials, work in process and finished goods held for production and sale, is stated at the lower of cost or net realizable value, cost being determined using the weighted average cost method. The Company reviews inventory levels at least quarterly and records a valuation allowance when appropriate.
At September 30, 2017 and 2016, the carrying value of inventory of $266,620 and $
206,356
respectively, reflected on the consolidated balance sheets is net of this adjustment.
| September 30, 2017 |
September 30, 2016
|
|||||||
|
Raw materials
|
$
|
111,043
|
$
|
124,035
|
||||
| Work in process | 5,535 | 14,366 | ||||||
|
Finished goods
|
159,128
|
67,955 | ||||||
| Less - Inventory reserve | 9,086 | 0 | ||||||
|
Total
|
$ | 266,620 |
$
|
206,356
|
||||
Property and
Equipment
Property and equipment is stated at cost, net of accumulated depreciation. The Company depreciates equipment on a straight-line basis over the estimated useful lives of the assets after the assets are placed in service. Office equipment is depreciated over a 3-year life, furniture over a 7-year life, and other equipment over a 7-year life. Depreciation expense for the years ended September 30, 2017 and 2016 was $75,917 and $41,921 respectively. Repair and maintenance costs are expensed as incurred. Expenditures associated with upgrades and enhancements that improve, add functionality, or otherwise extend the life of property and equipment that exceed $1,000 are capitalized. Property and equipment as of September 30, 2017 and 2016 consist of:
|
|
September 30, 2017
|
September 30, 2016
|
||||||
|
Furniture & Fixture
|
$
|
31,514
|
$
|
31,514
|
||||
|
Machinery & Equipment
|
$
|
323,706
|
$
|
169,864
|
||||
|
Vehicles
|
$
|
44,657
|
$
|
9,657
|
||||
|
Software
|
$
|
14,807
|
$
|
0
|
||||
|
Accumulated Depreciation
|
$
|
(136,697
|
)
|
$
|
(59,089
|
)
|
||
|
Net PP & E
|
$
|
277,987
|
$
|
151,946
|
||||
Samples
The Company distributes samples of its products as a component of its marketing program. Costs for samples are expensed at the time the samples are shipped and recorded under operating expenses in the consolidated statements of operations.
Long-Lived Assets
The Company tests long-lived assets or asset groups for recoverability when events or changes in circumstances indicated that their carrying amount may not be recoverable. Circumstances which could trigger a review include, but are not limited to: significant decreases in the market price of the asset; significant adverse changes in the business climate or legal factors; accumulation of costs significantly in excess of the amount originally expected for the acquisition or construction of the asset; current period cash flow or operating losses combined with a history of losses or a forecast of continuing losses associated with the use of the asset; and a current expectation that the asset will more likely than not be sold or disposed significantly before the end of its estimated useful life.
Recoverability is assessed based on the carrying amount of the asset and its fair value which is generally determined based on the sum of the undiscounted cash flows expected to result from the use and the eventual disposal of the asset, as well as specific appraisal in certain instances.
Intangible Assets
Intangible assets have either an identifiable or indefinite useful life. Intangible assets with identifiable useful lives are amortized on a straight-line basis over their economic or legal life, whichever is shorter. The Company's amortizable intangible asset consists of customer list which, recognized as a result of the acquisition of NuZee JAPAN Co., Ltd, which has an estimated useful life of 5 years.
As of September 30, 2017,the intangible assets consist of :
|
September 30, 2017
|
||||||||||||
|
Gross Carrying
|
Accumulated
|
Net Carrying
|
||||||||||
|
Amount
|
Amortization
|
Amount
|
||||||||||
|
Amortized intangible assets:
|
||||||||||||
|
Customer List
|
$
|
57,374
|
$
|
(11,475
|
)
|
$
|
45,899
|
|||||
|
Total
|
$
|
57,374
|
$
|
(11,475
|
)
|
$
|
45,899
|
|||||
No significant residual value is estimated for the intangible asset. Aggregate amortization expense for the years ended September 30, 2017, and September 30, 2016, totaled $11,475 and $0, respectively. The following table represents the total estimated amortization of intangible assets for the next five years:
|
For the Year Ending September 30
|
Estimated Amortization Expense
|
|
2018
|
$11,475
|
|
2019
|
$11,475
|
|
2020
|
$11,475
|
|
2021
|
$11,474
|
Income Taxes
In accordance with ASC 740 - Income Taxes, the provision for income taxes is computed using the asset and liability method. Under the asset and liability method, deferred income tax assets and liabilities are determined based on the differences between the financial reporting and tax bases of assets and liabilities and are measured using the currently enacted tax rates and laws. A valuation allowance is provided for the amount of deferred tax assets that, based on available evidence, are not expected to be realized.
The Company also follows the guidance related to accounting for income tax uncertainties. In accounting for uncertainty in income taxes, the Company recognizes the financial statement benefit of a tax position only after determining that the relevant tax authority would more likely than not sustain the position following an audit. For tax positions meeting the more likely than not threshold, the amount recognized in the financial statements is the largest benefit that has a greater than 50% likelihood of being realized upon ultimate settlement with the relevant tax authority. No liability for unrecognized tax benefits was recorded as of September 30, 2017 and 2016.
Related parties
A party is considered to be related to the Company if the party directly or indirectly or through one or more intermediaries, controls, is controlled by, or is under common control with the Company. Related parties also include principal owners of the Company, its management, members of the immediate families of principal owners of the Company and its management and other parties with which the Company may deal if one party controls or can significantly influence the management or operating policies of the other to an extent that one of the transacting parties might be prevented from fully pursuing its own separate interests. A party which can significantly influence the management or operating policies of the transacting parties or if it has an ownership interest in one of the transacting parties and can significantly influence the other to an extent that one or more of the transacting parties might be prevented from fully pursuing its own separate interests is also a related party.
Stock-based Compensation
We account for share-based awards issued to employees in accordance with Accounting Standards Codification (ASC) 718, "Compensation-Stock Compensation". Accordingly, employee share-based payment compensation is measured at the grant date, based on the fair value of the award, and is recognized as an expense over the requisite service period, which is normally the vesting period. Share-based compensation to directors is treated in the same manner as share-based compensation to employees, regardless of whether the directors are also employees. We account for share-based compensation to persons other than employees in accordance with FASB ASC 505-50. Equity instruments issued to other than employees are valued at the earlier of a commitment date or upon completion of the services, based on the fair value of the equity instruments and is recognized as expense over the service period. We estimate the fair value of share-based payments using the Black Scholes option-pricing model for common stock options and warrants and the closing price of our common stock for common share issuances. We recognized forfeitures as they occurred.
Comprehensive income/loss
Comprehensive income/loss is defined to include all changes in equity except those resulting from investments by owners and distributions to owners. Among other disclosures, all items that are required to be recognized under current accounting standards as components of comprehensive income/loss are required to be reported in a financial statement that is presented with the same prominence as other financial statements. The Company's current component of other comprehensive income/loss is the foreign currency translation adjustment.
Noncontrolling Interests
Noncontrolling interests represent third-party ownership in the net assets of the Company's consolidated subsidiary and are presented as a component of equity.
Segment Information
ASC Topic 280, "Disclosures about Segments of an Enterprise and Related Information," established standards for the way that public business enterprises report information about operating segments in annual financial statements and requires those enterprises to report selected information about operating
segments in interim financial reports issued to stockholders. Management has determined that the Company operates in one business segment, which is the commercialization and development of functional beverages.
Reclassifications have been made to conform with the current year presentation.
Recent Accounting Pronouncements
In May 2014 the FASB issued ASU 2014-09, Revenue from Contracts with Customers (Topic 606). The new standard will replace all current GAAP guidance on this topic and eliminate all industry-specific guidance. The new revenue recognition standard provides a unified model to determine when and how revenue is recognized. The core principle is that a company should recognize revenue to depict the transfer of promised goods or services to customers in an amount that reflects the consideration for which the entity expects to be entitled in exchange for those goods or services. In March 2016, the FASB issued ASU 2016-08, Revenue from Contracts with Customers (Topic 606): Principal versus Agent Considerations (Reporting Revenue Gross versus Net), which clarifies the implementation guidance on principal versus agent considerations. The collective guidance is effective for interim and annual periods in the first annual period beginning after December 15, 2017, with early adoption permitted. The standard may be applied either retrospectively to each period presented or as a cumulative-effect adjustment as of the date of adoption. The Company has not selected a transition method and is currently evaluating the impact of the pending adoption of this ASU on its ongoing financial reporting.
In February 2016, the FASB issued ASU No. 2016-02, Leases (Topic 842), to provide guidance on recognizing lease assets and lease liabilities on the consolidated balance sheet and disclosing key information about leasing arrangements, specifically differentiating between different types of leases. The core principle of Topic 842 is that a lessee should recognize the assets and liabilities that arise from all leases. The recognition, measurement, and presentation of expenses and cash flows arising from a lease by a lessee have not significantly changed from previous GAAP. There continues to be a differentiation between finance leases and operating leases. However, the principal difference from previous guidance is that the lease assets and lease liabilities arising from operating leases should be recognized in the consolidated balance sheet. The accounting applied by a lessor is largely unchanged from that applied under previous GAAP. The amendments will be effective for fiscal years beginning after December 15, 2018, including interim periods within those fiscal years, and early adoption is permitted. In transition, lessees and lessors are required to recognize and measure leases at the beginning of the earliest period presented using a modified retrospective approach. The modified retrospective approach includes a number of optional practical expedients that entities may elect to apply. These practical expedients relate to the identification and classification of leases that commenced before the effective date, initial direct costs for leases that commenced before the effective date, and the ability to use hindsight in evaluating lessee options to extend or terminate a lease or to purchase the underlying asset. An entity that elects to apply the practical expedients will, in effect, continue to account for leases that commence before the effective date in accordance with previous GAAP unless the lease is modified, except that lessees are required to recognize a right-of-use asset and a lease liability for all operating leases at each reporting date based on the present value of the remaining minimum rental payments that were tracked and disclosed under previous GAAP. The Company is currently evaluating the impact of these amendments on its consolidated financial statements.
In March 2016, the FASB issued ASU No. 2016-09, Compensation-Stock Compensation (Topic 718): Improvements to Employee Share-Based Payment Accounting, to reduce complexity in accounting standards involving several aspects of the accounting for employee share-based payment transactions, including (1) the income tax consequences, (2) classification of awards as either equity or liabilities, and
(3) classification on the statement of cash flows. The amendments will be effective for consolidated financial statements issued for fiscal years beginning after December 15, 2016, including interim periods within those fiscal years, and early adoption is permitted. Amendments related to the timing of when excess tax benefits are recognized, minimum statutory withholding requirements, forfeitures, and intrinsic value should be applied using a modified retrospective transition method, amendments related to the presentation of employee taxes paid on the statement of cash flows when an employer withholds shares to meet the minimum statutory withholding requirement should be applied retrospectively, amendments requiring recognition of excess tax benefits and tax deficiencies in the income statement and the practical expedient for estimating expected term should be applied prospectively, and amendments related to the presentation of excess tax benefits on the statement of cash flows can be applied using either a prospective transition method or a retrospective transition method. The Company has adopted ASU No. 2016-09 with no impact on its consolidated financial statements.
In August 2016, the FASB issued ASU No. 2016-15, Statement of Cash Flows (Topic 230): Classification of Certain Cash Receipts and Cash Payments, to clarify how certain cash receipts and cash payments are presented and classified in the statement of cash flows. The amendments should be applied using a retrospective transition method, and are effective for fiscal years beginning after December 15, 2017, including interim periods within those fiscal years. The Company is currently evaluating the impact of these amendments on its consolidated financial statements.
In January 2017, the FASB issued ASU No. 2017-03, Accounting Changes and Error Corrections (Topic 250). The ASU adds SEC disclosure requirements for both the quantitative and qualitative impacts that certain recently issued accounting standards will have on the consolidated financial statements of a registrant when such standards are adopted in a future period. Specifically, these disclosure requirements apply to the adoption of ASU No. 2014- 09, Revenue from Contracts with Customers (Topic 606); ASU No. 2016-02, Leases (Topic 842); and ASU No. 2016-13, Financial Instruments—Credit Losses (Topic 326): Measurement of Credit Losses on Financial Instruments. The Company is currently evaluating the impact of these amendments on its consolidated financial statements.
In May 2017, the FASB issued ASU No. 2017-09, Compensation—Stock Compensation (Topic 718): Scope of Modification Accounting, to provide clarity and reduce both (1) diversity in practice and (2) cost and complexity when applying the guidance in Topic 718, Compensation—Stock Compensation, to a change to the terms or conditions of a share-based payment award. The ASU provides guidance about which changes to the terms or conditions of a share-based payment award require an entity to apply modification accounting in ASC Topic 718. The amendments are effective for fiscal years beginning after December 15, 2017, and should be applied prospectively to an award modified on or after the adoption date. Early adoption is permitted, including adoption in an interim period. The Company is currently evaluating the impact of these amendments on its consolidated financial statements.
In July 2017, the FASB issued ASU No. 2017-11, Earnings Per Share (Topic 260); Distinguishing Liabilities from Equity (Topic 480); Derivatives and Hedging (Topic 815): (Part I) Accounting for Certain Financial Instruments with Down Round Features, (Part II) Replacement of the Indefinite Deferral for Mandatorily Redeemable Financial Instruments of Certain Nonpublic Entities and Certain Mandatorily Redeemable Noncontrolling Interests with a Scope Exception. The ASU was issued to address the complexity associated with applying generally accepted accounting principles (GAAP) for certain financial instruments with characteristics of liabilities and equity. The ASU, among other things, eliminates the need to consider the effects of down round features when analyzing convertible debt, warrants and other
financing instruments. As a result, a freestanding equity-linked financial instrument (or embedded conversion option) no longer would be accounted for as a derivative liability at fair value as a result of the existence of a down round feature. The amendments are effective for fiscal years beginning after December 15, 2018, and should be applied retrospectively. Early adoption is permitted, including adoption in an interim period. The Company is currently evaluating the impact of this amendment on its consolidated financial statements.
3. ACQUISITION
NuZee JAPAN Co., Ltd
On August 16, 2016, the Company entered into a Share Exchange Agreement with NuZee JAPAN Co., Ltd ("NuZee JP") and its shareholders whereby the Company will exchange 1,148,734 shares of its common stock, par value $0.00001 per share, for seventy percent (70%) of the issued and outstanding common stock of NuZee JP. The Company's issued shares had an acquisition date fair value of $258,465. The remaining thirty percent (30%) of NuZee JP's issued and outstanding common stock is, and will be at the closing, owned by NuZee JP's current President and Chairman of its Board of Directors. The reason for this acquisition is to extend our market shares as well as obtain more business opportunities in both USA and Japan market. This transaction closed on October 3, 2016.
The Company applied the acquisition method to the business combination and valued each of the assets acquired and liabilities assumed at fair value as of the acquisition date. The following table shows the estimated fair value of the assets acquired and liabilities assumed at the date of acquisition:
|
Acquisition of NuZee Japan Co., Ltd.
|
||||
|
Assets acquired:
|
||||
|
Cash
|
$
|
201,676
|
||
|
Accounts receivable
|
60,770
|
|||
|
Inventories
|
233,845
|
|||
|
Other current assets
|
76,524
|
|||
|
Customer list
|
57,374
|
|||
|
Property and equipment
|
16,677
|
|||
|
Goodwill
|
17,112
|
|||
|
Total assets acquired
|
663,978
|
|||
|
Less liabilities assumed
|
||||
|
Accounts payable and accrued liabilities
|
(153,820
|
)
|
||
|
Loan payable
|
(140,922
|
)
|
||
|
Total liabilities assumed
|
(294,742
|
)
|
||
|
Less noncontrolling interest
|
(110,771
|
)
|
||
|
Net assets acquired from NuZee JP acquisition
|
258,465
|
|||
Since the date of acquisition, revenues of $1,170,368 and net loss of $30,172 were included in the Company's consolidated net loss for the year ended September 30, 2017.
In accordance with ASC 805-10-50, the Company is providing the following unaudited pro-forma information to present a summary of the combined results of the Company's consolidated operations as if the acquisitions had been completed as of October 1, 2015. Adjustments were made to eliminate any inter-company transactions in the periods presented. There is no pro forma information for 2017 as NuZee JP was acquired at the beginning of the period.
|
NuZee, Inc.
|
||||
|
CONSOLIDATED STATEMENTS OF OPERATIONS
|
||||
|
(UNAUDITED)
|
||||
|
Year Ended
|
||||
|
September 30,
2016
|
||||
|
(Pro Forma)
|
||||
|
Revenues
|
$
|
1,526,057
|
||
|
Cost of sales
|
1,141,403
|
|||
|
Gross Profit
|
384,654
|
|||
|
Operating expenses
|
1,656,796
|
|||
|
Loss from operations
|
(1,272,142
|
)
|
||
|
Other income
|
39,686
|
|||
|
Other expense
|
(22,704
|
)
|
||
|
Net loss
|
(1,255,160
|
)
|
||
|
Net loss attributable to noncontrolling interest
|
-
|
|||
|
Net loss attributable to NuZee, Inc.
|
$
|
(1,255,160
|
)
|
|
|
Net loss per share, basic and fully diluted
|
$
|
(0.04
|
)
|
|
|
Weighted average of shares outstanding
|
31,901,001
|
|||
4. INVESTMENT IN UNCONSOLIDATED AFFILIATE
The Company has an investment in an equity method affiliate which has main businesses related to the production, sale, import and export of coffee & beans, tea & tea leaf, healthy foods and drinks.
The following table is a reconciliation of the Company's investment in equity affiliate as presented on the consolidated balance sheet as of September 30, 2017:
INVESTMENT IN AFFILIATE
|
2017
|
||||
|
Beginning of period
|
$
|
-
|
||
|
Additional investments in unconsolidated affiliate
|
$
|
50,000
|
||
|
Distributions received
|
$
|
-
|
||
|
Sale of investment in unconsolidated affiliate
|
$
|
-
|
||
|
Equity in net income (loss) of unconsolidated affiliate
|
$
|
(39,267
|
)
|
|
|
End of period
|
$
|
10,733
|
||
5. LOAN
On June 30, 2016, NuZee JAPAN Co., Ltd entered into a loan agreement with Tono Shinyo Kinko Bank. The Company borrowed the sum of approximately $145,758 to be repaid on or before June 5, 2021 at an annual interest rate of 1.2%. The loan is unsecured and guaranteed by a director. The Company had $99,973 loan payable at September 30, 2017. On January 27, 2017, NuZee JAPAN Co., Ltd entered into a loan agreement with Nihon Seisaku Kouko. The Company borrowed the sum of approximately $87,268 to be repaid on or before January 20, 2022 at an interest rate of 0.16%. The loan is unsecured and not guaranteed by a director. The Company had $78,352 loan payable at September 30, 2017.
The loan payments required for the next five years are as follows:
|
Tono Shinyo Kinko Bank
|
Nihon Seisaku Kouko
|
|||||||
|
2017
|
$
|
26,660
|
$
|
18,022
|
||||
|
2018
|
$
|
26,660
|
$
|
18,022
|
||||
|
2019
|
$
|
26,660
|
$
|
18,022
|
||||
|
2020
|
$
|
19,993
|
$
|
18,022
|
||||
|
2012
|
$
|
-
|
$
|
6,264
|
||||
|
Total Loan Payment
|
$
|
99,973
|
$
|
78,352
|
||||
6. Geographic Concentrations
The Company is organized based on fundamentally one business segment although it does sell its products on a world-wide basis. The revenues earned and long-lived assets in Japan increased due to the acquisition of NuZee JP.
Information about the Company's geographic operations for 2016 and 2017 are as follows:
|
Net Revenue:
|
2017
|
2016
|
||||||
|
North America
|
$
|
458,042
|
$
|
194,150
|
||||
|
Japan
|
1,170,368
|
2,237
|
||||||
|
South Korea
|
0
|
259,104
|
||||||
|
$
|
1,628,410
|
$
|
455,491
|
|||||
|
Property and equipment, net:
|
||||||||
|
North America
|
$
|
266,522
|
$
|
151,946
|
||||
|
Japan
|
11,465
|
0
|
||||||
|
$
|
277,987
|
$
|
151,946
|
|||||
7. Related Party Transactions
Loans
During February 2015, the Company issued a secured convertible promissory note in the sum of $600,000 to Masateru Higashida, the Company's major shareholder. Interest was calculated at the annual rate of zero percent (0%) for the period until April 2016. During March 2016, the Company and Masateru Higashida decided to extend the repayment date to March 31, 2017 so that Company has more funds for production and marketing to fulfill customers' requirements, which is in the best interest of the Company and its shareholders. The annual rate of repayment is at an interest rate of one percent (1%) for the period until March 31, 2017. This promissory note will convert to 1,176,471 shares of the Company's common stock at $0.51 per share if the Company is unable to pay back the note by then. A beneficial conversion feature does not arise because the conversion price of the note is above the per share fair value of the Company's stock. The conversion feature was evaluated as a derivative and the Company determined that derivative accounting did not apply. During the year ended September 30, 2016, the Company accrued interest of $3,008 relating to this related party note.
On March 31, 2017, Masateru Higashida (Lender, a/k/a the "Seller") deemed it beneficial to engage in a private sale (the "Sale") and to sell the Amended Note to Kenichi Miura (the "Purchaser") upon the terms and conditions of the Convertible Note Purchase Agreement. The Amended Note shall continue to bear interest on the principal amount at the annual interest rate of one percent (1%) per year; and the Amended Note shall continue to be convertible in whole or in part to shares of the Corporation's common stock, at the election of the Lender (now at the election of Purchaser), at a price of $0.51 per share, on or after March 31, 2017. On March 31, 2017, Kenichi Miura exercised his right to convert the Amended Note to shares of the Corporation's common stock (the "Conversion"), at the price of $0.51 per share, in accordance with the terms and conditions of the Convertible Note Purchase Agreement, thus equating to a conversion of $606,000 [i.e., $600,000 principal, plus $6,000 in accrued interest] to the equivalent 1,188,236 shares of the Corporation's common stock.
During March 2016, the Company borrowed the sum of $100,000 unsecured short-term loan from NuZee Co., Ltd to be repaid on or before March 31, 2017 at an interest rate of one percent (1%). The Company accrued interest of $230 and $262 for the years ended September 30, 2017 and 2016, respectively. The Company paid back $55,000 of this short-term loan during the year ended September 30, 2016 and the balance of $45,000 during the year ended September 30, 2017. As of September 30, 2017, the loan had principal and accrued interest balances of $0 and $492, respectively.
During August 2016, the Company borrowed the sum of $100,000 unsecured short-term loan from Masateru Higashida to be repaid on or before August 31, 2017 at an interest rate of one percent (1%). During March 2017, the Company borrowed the sum of $44,000 unsecured short-term loan from Masateru Higashida to be repaid on or before March 14, 2018 at an interest rate of one percent (1%). During June 2017, the Company borrowed the sum of $1,200 unsecured short-term loan from Masateru Higashida to be repaid on or before June 14, 2018 at an interest rate of one percent (1%). The Company accrued interest of $443 and $115 for the years ended September 30, 2017 and 2016, respectively. The Company paid back $0 of the short-term loan during the year ended September 30, 2016 and $145,000 during the year ended September 30, 2017. As of September 30, 2017, the loan had principal and accrued interest balances of $200 and $558, respectively.
During December 2016, the Company borrowed the sum of $18,384 unsecured short-term loan from NuZee Co., Ltd to be repaid on or before December 14, 2017 at an interest rate of one percent (1%). Between February and March 2017, the Company borrowed the sum of $ 14,440 short-term loan from NuZee Co., Ltd to be repaid on or before March 23, 2018 at an interest rate of one percent (1%). During June 2017, the Company borrowed 5,500,000 JPY ($47,361) and $150,000 unsecured short-term loan from NuZee Co., Ltd to be repaid on or before June 30, 2018 at an interest rate of one percent (1%). During August 2017, the Company borrowed the sum of $30,000 unsecured short term loan from NuZee Co., Ltd. For the year ended the September 30, 2017, the Company accrued interest of $334. The Company paid back the full principal amount of the loans as of September 30, 2017. As of September 30, 2017, the loans had principal and accrued interest balances of $0 and $272, respectively.
During February 2017, the Company borrowed the sum of $4,000 unsecured short-term loan from Travis Gorney to be repaid on or before February 14, 2018 at an interest rate of one percent (1%). The Company paid back the total principal amount of $4,000 and accrued interest of $5 on March 31, 2017.
During March 2017, the Company borrowed the sum of $100,000 secured short-term loan from Takayuki Nagashima to be repaid on or before June 30, 2017 at an interest rate of one percent (1%). On or about May 9, 2017, the Board of Directors amended the terms of the bridge loan in order to permit Takayuki Nagashima to convert the loan and to receive a ("Note") evidencing his right, exercisable at this election, to convert, his loan to shares of the Corporation's stock at $0.51 per share at any time upon reasonable notice to the Corporation. On or about May 9, 2017, Takayuki Nagashima exercised his right to convert the Amended Note to shares of the Corporation's common stock at the price of $0.51 per share, thus equating to a conversion of $100,000 [i.e., $100,000 principal] to the equivalent 196,078 shares of the Corporation's common stock. There is $121 interest balance left as of September 30, 2017.
During April, 2017, the Company borrowed the sum of $50,000 unsecured short-term loan from Eguchi Holdings Co.,Ltd ("EHCL") and the sum of $50,000 unsecured short-term loan from Eguchi Steel Co.,Ltd ("ESCL") to be repaid on or before June 30,2017 at an interest rate of one percent (1%). Both of the two short-term loans as well as incurred interests have been paid back as of September 30, 2017.
During July, 2017, NuZee JP borrowed the sum of $62,921 unsecured short-term loan from Katsuyoshi Eguchi. Interest was calculated at the annual rate of zero percent (0%). As of September 30, 2017, NuZee JP paid back the full principal amount.
All convertible promissory note payable and short-term loans are related party transactions since Masateru Higashida is the Company's major shareholder and he holds 100% ownership of NuZee Co., Ltd. Travis Gorney is an officer of the Company and Takayuki Nagashima is the co-owner of the equity method affiliate. Katsuyoshi Eguchi is a director and the minority owner of NuZee JP. EHCL and ESCL are controlled by Katsuyoshi Eguchi. Masateru Higashida, NuZee Co., Ltd, Travis Gorney, Takyuki Nagashima, EHCL, ESCL and Masayoshi Eguchi are related parties of the Company.
Sales, Purchases and Operating Expenses
For the year ended September 30, 2017, NuZee JP sold their products to NuZee Co., Ltd., EHCL and ESCL and the sales to them totaled approximately $488,670, $49,703 and $932, respectively. The corresponding accounts receivable balance from them was $6,280, $6,100 and $0 as of September 30, 2017, respectively.
For the year ended September 30, 2017, NuZee JP purchased goods from Eguchi Holdings Co.,Ltd totaling to $15,535. The corresponding accounts payable balance to them was $1,089 as of September 30, 2017.
NuZee JP had a professional expense of $39,544 to EHCL for the audit related fee paid by them on behalf of the Company. The Company fully paid off the liability as of September 30, 2017.
NuZee JP leased an employee to NuZee Co., Ltd. for Contlus during October 2016 to January 2017 for $10,936 and sold greeting cards to NuZee Co., Ltd. for $7,418 during the year ended September 30, 2017. The related receivables outstanding was $14,020 as of September 30, 2017.
NuZee JP leased an employee to Contlus. During the year ended September 30, 2017, NuZee JP billed $24,973 for this arrangement and $15,358 remains outstanding as of September 30, 2017. Contlus is the Company's related party as the Company holds 50% of their issued shares.
Rent
During October 2016, NuZee JP entered into a rental agreement of an office space with NuZee Co., Ltd. The Company agrees to pay $1,169 per month for the office on the last day of each month. There is no set expiration date on the agreement.
During September 2016, the Company entered into a rental agreement of an office space and warehouse with EHCL. The Company agrees to pay $1,213 per month for the office and the warehouse on the last day of each month. The term of this agreement is 3 years and will be automatically renewed.
During February 2015, the Company entered into a rental agreement of a warehouse with ESCL. The Company agrees to pay $449 per month for the warehouse on the last day of each month. There is no set expiration date on the agreement.
8. COMMON STOCK
During the year ended September 30, 2016, the Company sold 1,025,000 shares of common stock at prices ranging from $0.70 to $0.80 per share for an aggregate purchase price of $801,001.
In April 2016, Michael Billing exercised 5,000 stock options with a purchase price of $1,500 at $0.30 per share.
During the year ended September 30, 2016, the Company sold 215,156 shares of our treasury stock, with cost of $0.03838, at $0.64 per share, for an aggregate purchase price of $137,699.
On October 3, 2016, the Company exchanged 1,148,734 shares of its common stock, par value $0.00001 per share, for seventy percent (70%) of the issued and outstanding common stock of NuZee JP.
During the year ended September 30, 2017, the Company sold 1,032,539 shares of common stock at prices ranging from $0.51 to $1.00 per share for an aggregate purchase price of $860,045.
On March 31, 2017, Kenichi Miura exercised his right to convert the Amended Note to shares of the Corporation's common stock (the "Conversion"), at the price of $0.51 per share, in accordance with the terms and conditions of the Convertible Note Purchase Agreement, thus equating to a conversion of $606,000 [i.e., $600,000 principal, plus $6,000in accrued interest] to the equivalent 1,188,236 shares of the Corporation's common stock.
During the year ended September 30, 2017, the Company sold 1,766,242 shares of treasury stock at $0.51 per share, for an aggregate purchase price of $900,783.
During May 2017, the Company agreed to amend Nagashima Takayuki's $100,000 short-term loan to a convertible loan with a conversion price of $0.51 per share. Nagashima Takayuki then converted this loan to 196,078 shares of the Company's common stock.
During August 2017, the Company issued 34,602 shares of treasury stock at $0.43 per share, for services and recognized stock compensation expense of $14,879.
9. STOCK OPTIONS
During February 2016, the Company issued 275,500 options to directors, employees and consultants. Among those shares, 125,500 shares were issued to employees and 150,000 shares were issued to non-employees, which are consultants. The right to exercise these options shall vest and become exercisable from February 23, 2016 to February 1, 2017. The vesting date varies for each option agreements. The options have exercise prices ranging from $0.30-$0.80 per share and will expire ten years from the grant date, unless terminated earlier as provided by the option agreements.
During April 2016, the Company agreed to extend an employee's previously issued stock options of 22,500 until April 29, 2016. In April 2016, this employee exercised 5,000 shares of their stock options at $0.30 per share. The remaining shares of their stock options expired by the end of April 2016.
During July 2016, the Company issued 320,000 options to an employee. The right to exercise these options shall vest and become exercisable on December 31, 2021. The exercise price is $0.88 per share and will expire ten years from the grant date, unless terminated earlier as provided by the option agreements.
During January 2017, the Company issued 84,000 options to employees. The right to exercise these options shall vest and become exercisable on January 2018. The exercise price is $0.40-$0.51 per share and will expire ten years from the grant date, unless terminated earlier as provided by the option agreements.
During July 2017, the Company issued 2,170,000 options to employees and 430,000 options to non-employees. The right to exercise these options shall vest and become exercisable on January 2018. The exercise price is $0.51-$0.56 per share and will expire ten years from the grant date, unless terminated earlier as provided by the option agreements.
The fair value of each option award was estimated on the date of grant using the Black-Scholes option valuation model using the assumptions noted as follows: expected volatility was based on a representative peer group of small public companies in their industry segment as the Company has a limited stock history. The expected term of options granted was determined using the simplified method under SAB 107 and represents the mid-point between the vesting term and the contractual term. The risk-free rate is calculated using the U.S. Treasury yield curve, and is based on the expected term of the option.
The Black-Scholes option pricing model was used with the following weighted average assumptions for options granted during the twelve months ended September 30, 2017 and 2016, respectively:
|
For employees
|
September 30, 2017
|
September 30, 2016
|
||||||
|
Risk-free interest rate
|
1.64% - 1.75
|
%
|
1.11% - 1.43
|
%
|
||||
|
Expected option life
|
5.5 - 6.5 years
|
4.5 years
|
||||||
|
Expected volatility
|
97.6% - 99.1
|
%
|
80.2% - 83.6
|
%%
|
||||
|
Expected dividend yield
|
0.00
|
%
|
0.00
|
%
|
||||
|
Exercise price
|
$
|
0.40 - $0.56
|
$
|
0.30 - $0.88
|
||||
|
For non-employees
|
September 30, 2017
|
September 30, 2016
|
||||||
|
Risk-free interest rate
|
2.27
|
%
|
1.74
|
%
|
||||
|
Expected option life
|
10 years
|
10 years
|
||||||
|
Expected volatility
|
115.70
|
%
|
104.70
|
%
|
||||
|
Expected dividend yield
|
0.00
|
%
|
0.00
|
%
|
||||
|
Exercise price
|
$
|
0.51 - $0.56
|
$
|
0.30 - $0.60
|
||||
The Company is expensing these stock option awards on a straight-line basis over the requisite service period. The Company recognized stock option expense of $138,098 for the year ended September 30, 2017. Unamortized option expense as of September 30, 2017, for all options outstanding amounted to approximately $993,358. These costs are expected to be recognized over a weighted-average period of 3 years. The Company recognized stock option expenses of $37,253 for the year ended September 30, 2016, which relates to vesting of options that were granted in 2015.
The following table summarizes stock option activity for the year ended September 30, 2017.
|
|
|
Weighted
|
||||||||||||||
|
|
Weighted
|
Average
|
||||||||||||||
|
|
|
Average
|
Remaining
|
Aggregate
|
||||||||||||
|
|
Number of
Shares
|
Exercise
Price
|
Contractual Life (years)
|
Intrinsic
Value
|
||||||||||||
|
Outstanding at September 30, 2016
|
573,000
|
$
|
0.54
|
|||||||||||||
|
Granted
|
2,684,000
|
0.48
|
||||||||||||||
|
Exercised
|
-
|
-
|
||||||||||||||
|
Expired
|
(192,500
|
)
|
0.48
|
|||||||||||||
|
Forfeited
|
-
|
-
|
||||||||||||||
|
Outstanding at September 30, 2017
|
3,064,500
|
$
|
0.58
|
9.6
|
17,425
|
|||||||||||
|
|
||||||||||||||||
|
Exercisable at September 30, 2017
|
180,500
|
$
|
0.48
|
8.4
|
17,425
|
|||||||||||
The following table summarizes stock option activity for the year ended of September 30, 2016.
|
|
Weighted
|
Weighted
|
||||||||||||||
|
|
Average
|
Average
|
||||||||||||||
|
|
|
|
Remaining
|
Aggregate
|
||||||||||||
|
|
Number of
Shares
|
Exercise
Price
|
Contractual Life (years)
|
Intrinsic
Value
|
||||||||||||
|
Outstanding at September 30, 2015
|
2,833,333
|
$
|
0.48
|
|||||||||||||
|
Granted
|
618,000
|
0.67
|
||||||||||||||
|
Exercised
|
(5,000
|
)
|
0.30
|
|||||||||||||
|
Expired
|
(40,000
|
)
|
0.30
|
|||||||||||||
|
Forfeited
|
(2,833,333
|
)
|
0.48
|
|||||||||||||
|
Outstanding at September 30, 2016
|
573,000
|
$
|
0.70
|
9.6
|
$
|
-
|
||||||||||
|
|
||||||||||||||||
|
Exercisable at September 30, 2016
|
195,000
|
$
|
0.42
|
9.6
|
$
|
-
|
||||||||||
A summary of the status of the Company's unvested shares as of September 30, 2017 and 2016, are presented below:
|
Nonvested options
|
||||
|
|
Number of
|
|||
|
|
Nonvested Shares
|
|||
|
Nonvested shares at September 30, 2015
|
-
|
|||
|
Granted
|
618,000
|
|||
|
Exercised
|
(5,000
|
)
|
||
|
Forfeited
|
(40,000
|
)
|
||
|
Vested
|
(195,000
|
)
|
||
|
Nonvested shares at September 30, 2016
|
378,000
|
|||
|
Granted
|
2,684,000
|
|||
|
Exercised
|
-
|
|||
|
Forfeited
|
(120,000
|
)
|
||
|
Vested
|
(58,000
|
)
|
||
|
Nonvested shares at September 30, 2017
|
2,884,000
|
|||
10. INCOME TAX
As of September 30, 2017, and, 2016, there were no differences between financial reporting and tax bases of assets and liabilities. The Company will have tax losses available to be applied against future years' income as result of the losses incurred. However, due to the losses incurred in the period and expected future operating results, management determined that it is more likely than not that the deferred tax asset resulting from the tax losses available for carry forward will not be realized through the reduction of future income tax payments. Accordingly, a 100% valuation allowance has been recorded for deferred income tax assets. Cumulative net operating loss carry forward is $8,710,253 and $7,185,378 as of September 30, 2017 and 2016, respectively, and will begin expiring in 2033. The earliest tax year which remains subject to examination is 2013.
Deferred tax assets consisted of the following as of September 30, 2017 and 2016
|
|
2017
|
2016
|
||||||
|
Net Operating Losses
|
3,048,589
|
2,514,882
|
||||||
|
Valuation Allowance
|
(3,048,589
|
)
|
(2,514,882
|
)
|
||||
11. SUBSEQUENT EVENTS
Common Stock
During October to December 2017, the Company sold 1,341,783 shares of common stock at $0.51 per share, for an aggregate purchase price of $684,310.
Related Party Transaction
During October to December 2017, the Company borrowed the sum of $254,000 unsecured short-term loan from NuZee Co., Ltd to be repaid on or before January 31, 2019 at an interest rate of one percent (1%).
During December 2017, the Company borrowed the sum of $2,000 unsecured short-term loan from Masateru Higashida to be repaid on or before December 31, 2018 at an interest rate of one percent (1%). The Company paid back the total principal during December 2017.
F - 29
TABLE OF CONTENTS
Part IItem 1. BusinessItem 1A. Risk FactorsItem 2. PropertiesItem 3. Legal ProceedingsItem 4. Submission Of Matters To A Vote Of The Security HoldersPart IIItem 5. Market For Registrant's Common Equity, Related Stockholder Matters and Issuer Purchases Of Equity SecuritiesItem 6. Selected Financial DataItem 7. Management's Discussion Of and Analysis Of Financial Condition and Results Of OperationItem 7A. Quantitative and Qualitative Disclosures About Market RiskItem 8. Financial Statements and Supplementary DataItem 9. Changes in and Diagreements with Accountants on Accounting and Financial DisclosureItem 9a(i). Controls and ProceduresItem 9B. Other InformationPart IIIItem 10. Directors, Executive Officers and Corporate GovernanceItem 11. Executive CompensationItem 12. Security Owershiip Of Certain Beneficial Owners and Management and Related Stockholder MattersItem 13. Certain Relationships and Related Transactions, Director IndependenceItem 14. Principal Accounting Fees and ServicesItem 15. Exhibits, Financial Statement Schedules