Table of Contents
As filed with the Securities and Exchange Commission on April 19, 2018
UNITED STATES
SECURITIES AND EXCHANGE COMMISSION
Washington, D.C. 20549
FORM 20-F
| ☐ | REGISTRATION STATEMENT PURSUANT TO SECTION 12(b) OR 12(g) OF THE SECURITIES EXCHANGE ACT OF 1934 |
OR
| ☒ | ANNUAL REPORT PURSUANT TO SECTION 13 OR 15(d) OF THE SECURITIES EXCHANGE ACT OF 1934 |
For the fiscal year ended December 31, 2017
OR
| ☐ | TRANSITION REPORT PURSUANT TO SECTION 13 OR 15(d) OF THE SECURITIES EXCHANGE ACT OF 1934 |
For the transition period from to
OR
| ☐ | SHELL COMPANY REPORT PURSUANT TO SECTION 13 OR 15(d) OF THE SECURITIES EXCHANGE ACT OF 1934 |
Date of event requiring this shell company report
Commission file number 001–37928

(Exact Name of Registrant as Specified in Its Charter)
ChipMOS TECHNOLOGIES INC.
(Translation of Registrant’s Name into English)
Republic of China
(Jurisdiction of Incorporation or Organization)
No. 1, R&D Road 1, Hsinchu Science Park
Hsinchu, Taiwan
Republic of China
(Address of Principal Executive Offices)
Silvia Su
Senior Director, Finance and Accounting Management Center
ChipMOS TECHNOLOGIES INC.
No. 1, R&D Road 1, Hsinchu Science Park
Hsinchu, Taiwan
Republic of China
Telephone: (886) 3 577 0055
Facsimile: (886) 3 566 8981
(Name, Telephone, E-mail and/or Facsimile Number and Address of Company Contact Person)
Securities registered or to be registered pursuant to Section 12(b) of the Act:
|
Title of Each Class |
Name of Each Exchange on Which Registered |
|
| Common Shares, par value NT$10 per share* | The NASDAQ Global Select Market* |
Securities registered or to be registered pursuant to Section 12(g) of the Act:
None
(Title of Class)
Securities for which there is a reporting obligation pursuant to Section 15(d) of the Act:
None
(Title of Class)
Indicate the number of outstanding shares of each of the issuer’s classes of capital or common stock as of the close of the period covered by the annual report.
As of December 31, 2017, 856,059,061 Common Shares, par value NT$10 each, were outstanding (not including 30,238,000 Common Shares held by the Company).
Indicate by check mark if the registrant is a well-known seasoned issuer, as defined in Rule 405 of the Securities Act. Yes ☐ No ☒
If this report is an annual or transition report, indicate by check mark if the registrant is not required to file reports pursuant to Section 13 or (15)(d) of the Securities Exchange Act of 1934. Yes ☐ No ☒
Indicate by check mark whether the registrant: (1) has filed all reports required to be filed by Section 13 or 15(d) of the Securities Exchange Act of 1934 during the preceding 12 months (or for such shorter period that the registrant was required to file such reports), and (2) has been subject to such filing requirements for the past 90 days. Yes ☒ No ☐
Indicate by check mark whether the registrant has submitted electronically and posted on its corporate Web site, if any, every Interactive Data File required to be submitted and posted pursuant to Rule 405 of Regulation S-T (§232.405 of this chapter) during the preceding 12 months (or for such shorter period that the registrant was required to submit and post such files). Yes ☒ No ☐
Indicate by check mark whether the registrant is a large accelerated filer, an accelerated filer, a non-accelerated filer, or an emerging growth company. See definition of “large accelerated filer”, “accelerated filer”, and “emerging growth company” in Rule 12b-2 of the Exchange Act. (Check one):
Large Accelerated Filer ☐ Accelerated Filer ☒ Non-Accelerated Filer ☐ Emerging growth company ☐
If an emerging growth company that prepares its financial statements in accordance with U.S. GAAP, indicate by check mark if the registrant has elected not to use the extended transition period for complying with any new or revised financial accounting standards provided pursuant to Section 13(a) of the Exchange Act. ☐
Indicate by check mark which basis of accounting the registrant has used to prepare the financial statements included in this filing.
| US GAAP ☐ |
International Financial Reporting Standards as issued by the International Accounting Standards Board ☒ |
Other ☐ |
If this is an annual report, indicate by check mark whether the registrant is a shell company (as defined in Rule 12b-2 of the Exchange Act). Yes ☐ No ☒
* Not for trading, but only in connection with the listing on The NASDAQ Global Select Market of American Depositary Receipts evidencing American Depositary Shares (the “ADSs”), each representing twenty common shares of ChipMOS TECHNOLOGIES INC.
Table of Contents
ChipMOS TECHNOLOGIES INC.
Table of Contents
CAUTIONARY STATEMENT FOR PURPOSES OF THE “SAFE HARBOR” PROVISIONS OF
THE PRIVATE SECURITIES LITIGATION REFORM ACT OF 1995
Except for historical matters, the matters discussed in this Annual Report on Form 20-F are forward-looking statements that are subject to a number of significant risks and uncertainties and are based on information as of the date hereof. These statements are generally indicated by the use of forward-looking terminology such as the words “anticipate”, “believe”, “estimate”, “expect”, “intend”, “may”, “plan”, “project”, “will”, “could”, “might”, “should” and other words and phrases of similar import that express an indication of actions or results of actions that may or are expected to occur in the future. These statements appear in a number of places throughout this Annual Report on Form 20-F and include statements regarding our intentions, beliefs or current expectations concerning, among other things, our results of operations, financial condition, liquidity, prospects, growth, strategies and the industries in which we operate.
By their nature, forward-looking statements involve risks and uncertainties because they relate to events and depend on circumstances that may or may not occur in the future. Forward-looking statements are not guarantees of future performance and our actual results of operations, financial condition and liquidity, and the development of the industries in which we operate may differ materially from those made in or suggested by the forward-looking statements contained in this Annual Report on Form 20-F. Important factors that could cause those differences include, but are not limited to:
| • | the volatility of the semiconductor industry and the market for end-user applications for semiconductor products; |
| • | overcapacity in the semiconductor assembly and test markets; |
| • | the increased competition from other companies and our ability to retain and increase our market share; |
| • | our ability to successfully develop new technologies and remain a technological leader; |
| • | our ability to maintain control over capacity expansion and facility modifications; |
| • | our ability to generate growth or profitable growth; |
| • | our ability to hire and retain qualified personnel; |
| • | our ability to acquire required equipment and supplies to meet customer demand; |
| • | our ability to raise debt or equity financing as required to meet certain existing obligations; |
| • | our reliance on the business and financial condition of certain major customers; |
| • | the success of any of our future acquisitions, investments or joint ventures; |
| • | the outbreak of contagious disease and occurrence of earthquakes, typhoons and other natural disasters, as well as industrial accidents; |
| • | the political stability of the regions in which we conduct operations; |
| • | general local and global economic and financial conditions; and |
| • | other factors set forth under the heading “Item 3. Key Information—Risk Factors” of this Annual Report on Form 20-F. |
The factors identified above are believed to be important factors (but not necessarily all of the important factors) that could cause actual results to differ materially from those expressed in any forward-looking statement made by us. Other factors not discussed herein could also have material adverse effects on us. All forward-looking statements included in this Annual Report on Form 20-F are expressly qualified in their entirety by the foregoing cautionary statements. We undertake no obligation to update any forward-looking statement (or its associated cautionary language), whether as a result of new information or future events.
Forward-looking statements include, but are not limited to, statements regarding our strategy and future plans, future business condition and financial results, our capital expenditure plans, our capacity expansion plans, our investments in Mainland China, technological upgrades, investment in research and development, future market demand, future regulatory or other developments in our industry. Please see “Item 3. Key Information—Risk Factors” for a further discussion of certain factors that may cause actual results to differ materially from those indicated by our forward-looking statements.
This Annual Report on Form 20-F includes, refers to, or incorporates by reference, as applicable, financial statements and other financial information based on International Financial Reporting Standards (“IFRSs”).
1
Table of Contents
| Item 1. | Identity of Directors, Senior Management and Advisers |
Not applicable.
| Item 2. | Offer Statistics and Expected Timetable |
Not applicable.
| Item 3. | Key Information |
Selected Financial Data
The following tables set forth our selected consolidated financial data. As a result of the unprecedented transaction of the merger with ChipMOS TECHNOLOGIES (Bermuda) LTD. (“ChipMOS Bermuda”) accounted as capital reorganization and the joint-venture agreement which reclassified ChipMOS TECHNOLOGIES (Shanghai) LTD. (“ChipMOS Shanghai”) as discontinued operations (see “Item 5. Operating and Financial Review and Prospects—Recent Acquisitions”), the following financial data as of and for the years ended December 31, 2014 and 2015 were restated retrospectively. The selected consolidated statements of financial position data as of December 31, 2016 and 2017 and our consolidated income statements and cash flows data for the years ended December 31, 2015, 2016 and 2017 are derived from our audited consolidated financial statements included herein, and should be read in conjunction with, and are qualified in their entirety by reference to, these audited consolidated financial statements and related notes beginning on page F-1 of this Annual Report on Form 20-F. The selected consolidated statements of financial position data as of December 31, 2014 and 2015 are derived from our consolidated financial statements not included herein. However, the selected consolidated statements of financial position data as of December 31, 2013, and the consolidated income statements and cash flows data for the year ended December 31, 2013 are omitted from disclosure due to the Company cannot restate these financial data without unreasonable effort and expenses.
2
Table of Contents
| Year ended December 31, | ||||||||||||||||||||
| 2014 | 2015 | 2016 | 2017 | 2017 | ||||||||||||||||
| NT$ | NT$ | NT$ | NT$ | US$ | ||||||||||||||||
| (in millions, except per share and per ADS data) | ||||||||||||||||||||
|
Consolidated Income Statements Data: |
||||||||||||||||||||
|
Revenue |
$ | 20,829.0 | $ | 18,837.1 | $ | 18,387.6 | $ | 17,940.9 | $ | 605.3 | ||||||||||
|
Cost of revenue |
(15,716.5 | ) | (14,685.5 | ) | (14,745.5 | ) | (14,703.7 | ) | (496.1 | ) | ||||||||||
|
|
|
|
|
|
|
|
|
|
|
|||||||||||
|
Gross profit |
5,112.5 | 4,151.6 | 3,642.1 | 3,237.2 | 109.2 | |||||||||||||||
|
Research and development expenses |
(678.8 | ) | (747.8 | ) | (838.9 | ) | (985.9 | ) | (33.2 | ) | ||||||||||
|
Sales and marketing expenses |
(96.3 | ) | (90.3 | ) | (72.9 | ) | (64.4 | ) | (2.2 | ) | ||||||||||
|
General and administrative expenses |
(712.8 | ) | (770.1 | ) | (822.1 | ) | (639.8 | ) | (21.6 | ) | ||||||||||
|
Other operating income, net |
26.2 | 105.1 | 90.3 | 692.8 | 23.4 | |||||||||||||||
|
|
|
|
|
|
|
|
|
|
|
|||||||||||
|
Operating profit |
3,650.8 | 2,648.5 | 1,998.5 | 2,239.9 | 75.6 | |||||||||||||||
|
Finance costs |
(133.8 | ) | (142.5 | ) | (179.1 | ) | (217.3 | ) | (7.3 | ) | ||||||||||
|
Other non-operating income (expenses), net |
1,185.9 | 340.1 | (119.0 | ) | (490.2 | ) | (16.6 | ) | ||||||||||||
|
|
|
|
|
|
|
|
|
|
|
|||||||||||
|
Profit before income tax |
4,702.9 | 2,846.1 | 1,700.4 | 1,532.4 | 51.7 | |||||||||||||||
|
Income tax expense |
(1,036.2 | ) | (935.9 | ) | (177.1 | ) | (550.5 | ) | (18.6 | ) | ||||||||||
|
|
|
|
|
|
|
|
|
|
|
|||||||||||
|
Profit from continuing operations |
3,666.7 | 1,910.2 | 1,523.3 | 981.9 | 33.1 | |||||||||||||||
|
Profit (loss) from discontinued operations |
82.2 | (34.2 | ) | (122.1 | ) | 1,815.0 | 61.3 | |||||||||||||
|
|
|
|
|
|
|
|
|
|
|
|||||||||||
|
Profit for the year |
$ | 3,748.9 | $ | 1,876.0 | $ | 1,401.2 | $ | 2,796.9 | $ | 94.4 | ||||||||||
|
|
|
|
|
|
|
|
|
|
|
|||||||||||
|
Attributable to: |
||||||||||||||||||||
|
Equity holders of the Company—continuing operations |
$ | 3,274.0 | $ | 2,164.5 | $ | 1,829.3 | $ | 981.9 | $ | 33.1 | ||||||||||
|
Equity holders of the Company—discontinued operations |
82.2 | (34.2 | ) | (122.1 | ) | 1,815.0 | 61.3 | |||||||||||||
|
Predecessors’ interests |
(142.0 | ) | (291.4 | ) | (306.0 | ) | — | — | ||||||||||||
|
Non-controlling interests |
534.7 | 37.1 | — | — | — | |||||||||||||||
|
|
|
|
|
|
|
|
|
|
|
|||||||||||
| $ | 3,748.9 | $ | 1,876.0 | $ | 1,401.2 | $ | 2,796.9 | $ | 94.4 | |||||||||||
|
|
|
|
|
|
|
|
|
|
|
|||||||||||
|
Basic earnings per share: |
||||||||||||||||||||
|
Equity holders of the Company—continuing operations |
$ | 3.81 | $ | 2.47 | $ | 2.13 | $ | 1.16 | $ | 0.04 | ||||||||||
|
Equity holders of the Company—discontinued operations |
0.10 | (0.04 | ) | (0.14 | ) | 2.14 | 0.07 | |||||||||||||
|
|
|
|
|
|
|
|
|
|
|
|||||||||||
|
Equity holders of the Company |
3.91 | 2.43 | 1.99 | 3.30 | 0.11 | |||||||||||||||
|
Predecessors’ interests |
(0.17 | ) | (0.33 | ) | (0.35 | ) | — | — | ||||||||||||
|
|
|
|
|
|
|
|
|
|
|
|||||||||||
| $ | 3.74 | $ | 2.10 | $ | 1.64 | $ | 3.30 | $ | 0.11 | |||||||||||
|
|
|
|
|
|
|
|
|
|
|
|||||||||||
|
Diluted earnings per share: |
||||||||||||||||||||
|
Equity holders of the Company—continuing operations |
$ | 3.78 | $ | 2.44 | $ | 2.11 | $ | 1.13 | $ | 0.04 | ||||||||||
|
Equity holders of the Company—discontinued operations |
0.09 | (0.04 | ) | (0.14 | ) | 2.10 | 0.07 | |||||||||||||
|
|
|
|
|
|
|
|
|
|
|
|||||||||||
|
Equity holders of the Company |
3.87 | 2.40 | 1.97 | 3.23 | 0.11 | |||||||||||||||
|
Predecessors’ interests |
(0.16 | ) | (0.33 | ) | (0.35 | ) | — | — | ||||||||||||
|
|
|
|
|
|
|
|
|
|
|
|||||||||||
| $ | 3.71 | $ | 2.07 | $ | 1.62 | $ | 3.23 | $ | 0.11 | |||||||||||
|
|
|
|
|
|
|
|
|
|
|
|||||||||||
|
Basic earnings per equivalent ADS: |
||||||||||||||||||||
|
Equity holders of the Company—continuing operations |
$ | 76.25 | $ | 49.34 | $ | 42.56 | $ | 23.20 | $ | 0.78 | ||||||||||
|
Equity holders of the Company—discontinued operations |
1.92 | (0.78 | ) | (2.84 | ) | 42.87 | 1.45 | |||||||||||||
|
|
|
|
|
|
|
|
|
|
|
|||||||||||
|
Equity holders of the Company |
78.17 | 48.56 | 39.72 | 66.07 | 2.23 | |||||||||||||||
|
Predecessors’ interests |
(3.31 | ) | (6.64 | ) | (7.12 | ) | — | — | ||||||||||||
|
|
|
|
|
|
|
|
|
|
|
|||||||||||
| $ | 74.86 | $ | 41.92 | $ | 32.60 | $ | 66.07 | $ | 2.23 | |||||||||||
|
|
|
|
|
|
|
|
|
|
|
|||||||||||
|
Diluted earnings per equivalent ADS: |
||||||||||||||||||||
|
Equity holders of the Company—continuing operations |
$ | 75.62 | $ | 48.73 | $ | 42.21 | $ | 22.68 | $ | 0.77 | ||||||||||
|
Equity holders of the Company—discontinued operations |
1.90 | (0.77 | ) | (2.82 | ) | 41.93 | 1.41 | |||||||||||||
|
|
|
|
|
|
|
|
|
|
|
|||||||||||
|
Equity holders of the Company |
77.52 | 47.96 | 39.39 | 64.61 | 2.18 | |||||||||||||||
|
Predecessors’ interests |
(3.28 | ) | (6.56 | ) | (7.06 | ) | — | — | ||||||||||||
|
|
|
|
|
|
|
|
|
|
|
|||||||||||
| $ | 74.24 | $ | 41.40 | $ | 32.33 | $ | 64.61 | $ | 2.18 | |||||||||||
|
|
|
|
|
|
|
|
|
|
|
|||||||||||
|
Weighted-average number of shares outstanding: |
||||||||||||||||||||
|
Basic |
858.7 | 877.4 | 859.6 | 846.7 | 846.7 | |||||||||||||||
|
Diluted |
865.8 | 888.3 | 866.8 | 865.8 | 865.8 | |||||||||||||||
3
Table of Contents
| As of December 31, | ||||||||||||||||||||
| 2014 | 2015 | 2016 | 2017 | 2017 | ||||||||||||||||
| NT$ | NT$ | NT$ | NT$ | US$ | ||||||||||||||||
| (in millions) | ||||||||||||||||||||
|
Consolidated Statements of Financial Position Data: |
||||||||||||||||||||
|
Non-current assets: |
||||||||||||||||||||
|
Available-for-sale financial assets |
$ | 217.7 | $ | 10.0 | $ | 10.0 | $ | 20.9 | $ | 0.7 | ||||||||||
|
Investment in associates |
— | 346.3 | 369.3 | 3,433.3 | 115.8 | |||||||||||||||
|
Property, plant and equipment |
13,604.1 | 14,211.6 | 13,497.2 | 15,265.3 | 515.0 | |||||||||||||||
|
Other non-current assets |
315.9 | 341.6 | 523.5 | 339.4 | 11.5 | |||||||||||||||
|
|
|
|
|
|
|
|
|
|
|
|||||||||||
| 14,137.7 | 14,909.5 | 14,400.0 | 19,058.9 | 643.0 | ||||||||||||||||
|
|
|
|
|
|
|
|
|
|
|
|||||||||||
|
Current assets: |
||||||||||||||||||||
|
Inventories |
1,704.7 | 1,667.7 | 1,878.0 | 1,929.2 | 65.1 | |||||||||||||||
|
Accounts and notes receivable |
4,876.7 | 3,890.5 | 4,140.2 | 4,015.8 | 135.5 | |||||||||||||||
|
Other current assets |
1,088.5 | 422.8 | 201.3 | 220.3 | 7.4 | |||||||||||||||
|
Cash and cash equivalents |
15,265.2 | 12,127.4 | 7,571.4 | 8,035.7 | 271.1 | |||||||||||||||
|
|
|
|
|
|
|
|
|
|
|
|||||||||||
| 22,935.1 | 18,108.4 | 13,790.9 | 14,201.0 | 479.1 | ||||||||||||||||
|
Non-current assets held for sale |
— | — | 3,105.1 | — | — | |||||||||||||||
|
|
|
|
|
|
|
|
|
|
|
|||||||||||
| 22,935.1 | 18,108.4 | 16,896.0 | 14,201.0 | 479.1 | ||||||||||||||||
|
|
|
|
|
|
|
|
|
|
|
|||||||||||
|
Total assets |
$ | 37,072.8 | $ | 33,017.9 | $ | 31,296.0 | $ | 33,259.9 | $ | 1,122.1 | ||||||||||
|
|
|
|
|
|
|
|
|
|
|
|||||||||||
|
Equity and liabilities: |
||||||||||||||||||||
|
Equity attributable to equity holders of the Company |
$ | 18,083.9 | $ | 18,906.9 | $ | 16,247.7 | $ | 18,120.9 | $ | 611.4 | ||||||||||
|
Non-controlling interests |
2,621.6 | — | — | — | — | |||||||||||||||
|
Predecessors’ interests |
2,490.7 | 2,127.5 | — | — | — | |||||||||||||||
|
|
|
|
|
|
|
|
|
|
|
|||||||||||
|
Total equity |
23,196.2 | 21,034.4 | 16,247.7 | 18,120.9 | 611.4 | |||||||||||||||
|
|
|
|
|
|
|
|
|
|
|
|||||||||||
|
Non-current liabilities: |
||||||||||||||||||||
|
Bank loans—non-current |
4,560.0 | 4,985.8 | 9,687.7 | 7,498.9 | 253.0 | |||||||||||||||
|
Lease payable—non-current |
— | — | 29.3 | 18.1 | 0.6 | |||||||||||||||
|
Other non-current liabilities |
586.9 | 610.8 | 641.0 | 679.0 | 22.9 | |||||||||||||||
|
|
|
|
|
|
|
|
|
|
|
|||||||||||
| 5,146.9 | 5,596.6 | 10,358.0 | 8,196.0 | 276.5 | ||||||||||||||||
|
|
|
|
|
|
|
|
|
|
|
|||||||||||
|
Current liabilities: |
||||||||||||||||||||
|
Accounts payable |
1,074.9 | 708.5 | 825.1 | 688.2 | 23.2 | |||||||||||||||
|
Payable to contractors and equipment suppliers |
1,307.5 | 524.0 | 550.3 | 713.3 | 24.1 | |||||||||||||||
|
Other payables |
1,905.3 | 1,868.7 | 1,412.1 | 1,980.2 | 66.8 | |||||||||||||||
|
Other current liabilities |
1,165.5 | 588.1 | 241.6 | 436.9 | 14.7 | |||||||||||||||
|
Lease payable—current portion |
— | — | 11.3 | 11.8 | 0.4 | |||||||||||||||
|
Bank loans—current portion |
1,508.2 | 1,548.7 | 1,062.3 | 2,143.2 | 72.3 | |||||||||||||||
|
Short-term bank loans |
1,768.3 | 1,148.9 | — | 969.4 | 32.7 | |||||||||||||||
|
|
|
|
|
|
|
|
|
|
|
|||||||||||
| 8,729.7 | 6,386.9 | 4,102.7 | 6,943.0 | 234.2 | ||||||||||||||||
|
Liabilities directly related to non-current assets held for sale |
— | — | 587.6 | — | — | |||||||||||||||
|
|
|
|
|
|
|
|
|
|
|
|||||||||||
| 8,729.7 | 6,386.9 | 4,690.3 | 6,943.0 | 234.2 | ||||||||||||||||
|
|
|
|
|
|
|
|
|
|
|
|||||||||||
|
Total liabilities |
13,876.6 | 11,983.5 | 15,048.3 | 15,139.0 | 510.7 | |||||||||||||||
|
|
|
|
|
|
|
|
|
|
|
|||||||||||
|
Total equity and liabilities |
$ | 37,072.8 | $ | 33,017.9 | $ | 31,296.0 | $ | 33,259.9 | $ | 1,122.1 | ||||||||||
|
|
|
|
|
|
|
|
|
|
|
|||||||||||
4
Table of Contents
| Year ended December 31, | ||||||||||||||||||||
| 2014 | 2015 | 2016 | 2017 | 2017 | ||||||||||||||||
| NT$ | NT$ | NT$ | NT$ | US$ | ||||||||||||||||
| (in millions) | ||||||||||||||||||||
|
Consolidated Statement of Cash Flows Data: |
||||||||||||||||||||
|
Capital expenditures |
$ | 3,568.2 | $ | 3,644.6 | $ | 4,691.0 | $ | 4,849.3 | $ | 163.6 | ||||||||||
|
Depreciation and amortization |
2,909.0 | 3,021.9 | 3,231.3 | 2,899.3 | 97.8 | |||||||||||||||
|
Net cash provided by (used in): |
||||||||||||||||||||
|
Operating activities |
5,599.9 | 5,395.8 | 3,688.0 | 4,157.3 | 140.3 | |||||||||||||||
|
Investing activities |
(3,325.4 | ) | (4,504.2 | ) | (4,556.7 | ) | (3,493.4 | ) | (117.9 | ) | ||||||||||
|
Financing activities |
(418.8 | ) | (4,028.9 | ) | (3,223.9 | ) | (550.8 | ) | (18.6 | ) | ||||||||||
|
Effect of exchange rate changes |
36.7 | (0.5 | ) | (73.5 | ) | (38.6 | ) | (1.3 | ) | |||||||||||
|
Net increase (decrease) in cash and cash equivalents |
$ | 1,892.4 | $ | (3,137.8 | ) | $ | (4,166.1 | ) | $ | 74.5 | $ | 2.5 | ||||||||
Exchange Rates
References to “US$” and “US dollars” are to United States dollars and references to “NT$” and “NT dollars” are to New Taiwan dollars. This Annual Report on Form 20-F contains translations of certain NT dollar amounts into US dollars at specified rates solely for the convenience of the reader. Unless otherwise noted, all translations from NT dollars to US dollars and from US dollars to NT dollars were made at the noon buying rate in The City of New York for cable transfers in NT dollars per US dollar as certified for customs purposes by the Federal Reserve Bank of New York as of December 29, 2017, which was NT$29.64 to US$1.00. We make no representation that the NT dollar or US dollar amounts referred to in this Annual Report on Form 20-F could have been or could be converted into US dollars or NT dollars, as the case may be, at any particular rate or at all. On April 13, 2018, the noon buying rate was NT$29.32 to US$1.00.
The following table sets out, for the years and the months indicated, information concerning the number of NT dollars for which one US dollar could be exchanged based on the noon buying rate for cable transfers in NT dollars as certified for customs purposes by the Federal Reserve Bank of New York.
| NT dollars per US dollar noon buying rate | ||||||||||||||||
| Average | High | Low | Period-end | |||||||||||||
|
2013 |
29.68 | 30.20 | 28.93 | 29.83 | ||||||||||||
|
2014 |
30.30 | 31.80 | 29.85 | 31.60 | ||||||||||||
|
2015 |
31.74 | 33.17 | 30.37 | 32.79 | ||||||||||||
|
2016 |
32.23 | 33.74 | 31.05 | 32.40 | ||||||||||||
|
2017 |
30.40 | 32.37 | 29.64 | 29.64 | ||||||||||||
|
October |
30.25 | 30.44 | 30.12 | 30.12 | ||||||||||||
|
November |
30.08 | 30.21 | 29.97 | 29.98 | ||||||||||||
|
December |
29.95 | 30.05 | 29.64 | 29.64 | ||||||||||||
|
2018 |
||||||||||||||||
|
January |
29.40 | 29.61 | 29.05 | 29.16 | ||||||||||||
|
February |
29.25 | 29.42 | 29.03 | 29.32 | ||||||||||||
|
March |
29.20 | 29.35 | 29.10 | 29.10 | ||||||||||||
|
April (through 13, 2018) |
29.23 | 29.32 | 29.14 | 29.32 | ||||||||||||
Sources: Federal Reserve Bank of New York.
5
Table of Contents
Risk Factors
Risks Relating to Economic Conditions and the Financial Markets
Global credit and financial markets disruptions could materially and adversely affect our business and results of operations.
Disruptions in global credit and financial markets may occur that cause diminished liquidity and limited availability of credit, reduced consumer confidence, reduced economic growth, increased unemployment rates and uncertainty about economic stability. Limited availability of credit in financial markets may lead consumers and businesses to postpone spending. This in turn may cause our customers to cancel, decrease or delay their existing and future orders with us. Financial difficulties experienced by our customers or suppliers as a result of these conditions could lead to production delays and delays or defaults in payment of accounts receivable. Continuing credit markets disruption restricts our access to capital and limits our ability to fund operations or to refinance maturing obligations as they become due through additional borrowing or other sources of financing. We are not able to predict the occurrence, frequency, duration or extent of disruptions in global credit and financial markets. These conditions increase the difficulty of accurately forecasting and planning our business activities. If these conditions and uncertainties occur or continue, or if credit and financial markets and confidence in economic conditions deteriorate, our business and results of operations could be materially and adversely affected.
Risks Relating to Our Industry
Because we depend on the highly cyclical semiconductor industry, which is characterized by significant and sometimes prolonged downturns from time to time, our revenue and earnings may fluctuate significantly, which in turn could adversely affect our results of operations and could cause the market price of our common shares or of our ADSs to decline.
Because our business is, and will continue to be, dependent on the requirements of semiconductor companies for independent assembly and test services, any downturn in the highly cyclical semiconductor industry may reduce demand for our services and adversely affect our results of operations. All of our customers operate in this industry and variations in order levels and in service fee from our customers may result in volatility in our revenue and earnings. For instance, during periods of decreased demand for assembled semiconductors, some of our customers may simplify, delay or forego final testing of certain types of semiconductors, such as dynamic random access memory or DRAM, which in turn may result in reduced demand for our services, adversely affecting our results of operations. From time to time, the semiconductor industry has experienced significant, and sometimes prolonged, downturns which have adversely affected our results of operations. Reduced commodity DRAM demand for our services contributed to decreases in our revenue for 2016 and 2017. Our revenue for 2016 decreased 2.4% from 2015 levels. Our revenue for 2017 decreased by 2.4% from 2016 levels and generated a profit attributable to equity holders of the Company of NT$2,797 million (US$94 million) in 2017. We cannot give any assurances that there will not be any downturn in the future or that any future downturn will not materially and adversely affect our results of operations.
Any deterioration in the market for end-user applications for semiconductor products would reduce demand for our services and may result in a decrease in our earnings.
Market conditions in the semiconductor industry track, to a large degree, those for their end-user applications. Any deterioration in the market conditions for the end-user applications of semiconductors we test and assemble could reduce demand for our services and, in turn, could materially adversely affect our financial condition and results of operations. Our revenue is largely attributable to fees derived from testing and assembling semiconductors for use in personal computers, communications equipment, consumer electronic products and display applications. A significant decrease in demand for products in these markets could put pricing pressure on our assembly and test services and negatively affect our revenue and earnings. The LCD driver market often aligns with broader economic trend, we cannot give any assurances that there will not be any downturn in the future or that any future downturn will not affect our results of operations. Any significant decrease in demand for end-user applications of semiconductors will negatively affect our revenue and earnings.
A decline in average selling prices for our services could result in a decrease in our earnings.
Historically, prices for our assembly and test services in relation to any given semiconductor tend to decline over the course of its product and technology life cycle. See also “—A decrease in market demand for LCD and other flat-panel display driver semiconductors may adversely affect our capacity utilization rates and thereby negatively affect our profitability”. If we cannot reduce the cost of our assembly and test services, or introduce higher-margin assembly and test services for new package types, to offset the decrease in average selling prices for our services, our earnings could decrease.
6
Table of Contents
A reversal or slowdown in the outsourcing trend for semiconductor assembly and test services could reduce our profitability.
Integrated device manufacturers, or IDMs, continue to increasingly outsource stages of the semiconductor production process, including assembly and test, to independent companies like us to shorten production cycles. In addition, the availability of advanced independent semiconductor manufacturing services has also enabled the growth of so-called “fabless” semiconductor companies that focus exclusively on design and marketing and outsource their manufacturing, assembly and test requirements to independent companies. A substantial portion of our revenue is indirectly generated from providing semiconductor assembly and test services to these IDMs and fabless companies. We cannot assure you that these companies will continue to outsource their assembly and test requirements to independent companies like us. A reversal of, or a slowdown in, this outsourcing trend could result in reduced demand for our services, which in turn could reduce our profitability.
Risks Relating to Our Business
If we are unable to compete effectively in the highly competitive semiconductor assembly and test markets, we may lose customers and our income may decline.
The semiconductor assembly and test markets are very competitive. We face competition from a number of IDMs with in-house assembly and test capabilities and other independent semiconductor assembly and test companies. Our competitors may have access to more advanced technologies and greater financial and other resources than we do. Many of our competitors have shown a willingness to reduce prices quickly and sharply in the past to maintain capacity utilization in their facilities during periods of reduced demand. In addition, an increasing number of our competitors conduct their operations in lower cost centers in Asia such as Mainland China, Thailand, Vietnam and the Philippines. Any renewed or continued erosion in the prices or demand for our assembly and test services as a result of increased competition could adversely affect our profits.
We are highly dependent on the market for memory products. A downturn in market prices for these products could significantly reduce our revenue and profit.
A significant portion of our revenue is derived from testing and assembling memory semiconductors. Our revenue derived from the assembly and test of memory semiconductors accounted for 48% and 46% of our revenue in 2016 and 2017, respectively. In the past, our service fees for testing and assembling memory semiconductors were sharply reduced in tandem with the decrease in the average selling price of DRAM in the semiconductor industry. Oversupply of DRAM products and weak demand in the DRAM market may result in significant reductions in the price of DRAM products, which in turn may drive down the average prices for our assembly and test services for DRAM products and further reduce our revenue and profit. We cannot assure you that there will not be further downturns in DRAM prices in the future.
A decrease in market demand for LCD and other flat-panel display driver semiconductors may adversely affect our capacity utilization rates and thereby negatively affect our profitability.
Our assembly and test services for LCD and other flat-panel display driver semiconductors generated revenue of NT$4,920 million and NT$4,790 million (US$162 million) in 2016 and 2017, respectively. We invested NT$910 million and NT$2,615 million (US$88 million) in 2016 and 2017, respectively, on equipment for tape carrier package, or TCP, chip-on-film, or COF and chip-on-glass, or COG, technologies, which are used in assembly and test services for LCD and other flat-panel display driver semiconductors. Most of this equipment may not be used for technologies other than TCP, COF or COG. The market demand for LCD and other flat-panel display driver semiconductors and related assembly and test services particularly TDDI and 12” COF increased in 2017. Any significant decrease in demand for these products and our related services would significantly impair our capacity utilization rates. That may result in our inability to generate sufficient revenue to cover the significant depreciation expenses for the equipment used in testing and assembling LCD and other flat-panel display driver semiconductors, thereby negatively affecting our profitability. See also “—Because of our high fixed costs, if we are unable to achieve relatively high capacity utilization rates, our earnings and profitability may be adversely affected”.
7
Table of Contents
Our significant amount of indebtedness and interest expense will limit our cash flow and could adversely affect our operations.
We have a significant level of debt and interest expense. As of December 31, 2017, we had approximately NT$9,642 million (US$325 million) and NT$969 million (US$33 million) outstanding long-term and short-term indebtedness, respectively. Our long-term indebtedness as of December 31, 2017, represented bank loans with an interest rate of 1.7895%. As of December 31, 2017, NT$7,175 million (US$242 million) of our indebtedness was secured by collateral comprised of our assets.
Our significant indebtedness poses risks to our business, including the risks that:
| • | we may have to use a substantial portion of our consolidated cash flow from operations to pay principal and interest on our debt, thereby reducing the funds available for working capital, capital expenditures, acquisitions and other general corporate purposes; |
| • | insufficient cash flow from operations may force us to sell assets, or seek additional capital, which we may be unable to do at all or on terms favorable to us; |
| • | our ability to sell assets or seek additional capital may be adversely affected by security interests in our assets granted to our lenders as collateral; and |
| • | our level of indebtedness may make us more vulnerable to economic or industry downturns. |
For additional information on our indebtedness, see “Item 5. Operating and Financial Review and Prospects—Liquidity and Capital Resources”.
Our results of operations may fluctuate significantly and may cause the market price of our common shares or of our ADSs to be volatile.
Our results of operations have varied significantly from period to period and may continue to vary in the future. Among the more important factors affecting our quarterly and annual results of operations are the following:
| • | our ability to accurately predict customer demand, as we must commit significant capital expenditures in anticipation of future orders; |
| • | our ability to quickly adjust to unanticipated declines or shortfalls in demand and market prices for our assembly and test services, due to our high percentage of fixed costs; |
| • | changes in prices for our assembly and test services; |
| • | volume of orders relative to our assembly and test capacity; |
| • | capital expenditures and production uncertainties relating to the roll-out of new assembly and test services; |
| • | our ability to obtain adequate assembly and test equipment on a timely basis; |
| • | changes in costs and availability of raw materials, equipment and labor; |
| • | changes in our product mix; and |
| • | earthquakes, drought and other natural disasters, as well as industrial accidents. |
Because of the factors listed above, our future results of operations or growth rates may be below the expectations of research analysts and investors. If so, the market price of our common shares or of our ADSs, and the market value of your investment, may fall.
We depend on key customers for a substantial portion of our revenue and a loss of, or deterioration of the business from, or delayed payment by, any one of these customers could result in decreased revenue and materially adversely affect our results of operations and financial condition.
We depend on a small group of customers for a substantial portion of our business. In 2017, our top five customers collectively accounted for 61% of our revenue. As part of our strategy, we have been focusing on sales to key customers through long-term service agreements. We also focus on our business with smaller customers and customers who do not place orders on a regular basis. We expect that we will continue to depend on a relatively limited number of customers for a significant portion of our revenue. Any adverse development in our key customers’ operations, competitive position or customer base could materially reduce our revenue and materially adversely affect our business and profitability.
8
Table of Contents
Since semiconductor companies generally rely on service providers with whom they have established relationships to meet their assembly and test needs for their applications and new customers usually require us to pass a lengthy and rigorous qualification process, if we lose any of our key customers, we may not be able to replace them in a timely manner. We cannot assure you that receivable collection difficulties experienced by us will not occur in the future. If any of our key customers reduces or cancels its orders or terminates existing contractual arrangements, and if we are unable to attract new customers and establish new contractual arrangements with existing or new customers, our revenue could be reduced and our business and results of operations may be materially adversely affected.
Because of our high fixed costs, if we are unable to achieve relatively high capacity utilization rates, our earnings and profitability may be adversely affected.
Our operations are characterized by a high proportion of fixed costs. For memory and logic/mixed-signal semiconductor testing services, our fixed costs represented 49% and 48% of our total cost of revenue in 2016 and 2017, respectively. For memory and logic/mixed-signal semiconductor assembly services, our fixed costs represented 23% and 25% of our total cost of revenue in 2016 and 2017, respectively. For LCD and other flat-panel display driver semiconductor assembly and test services, our fixed costs represented 47% and 46% of our total cost of revenue in 2016 and 2017, respectively. For bumping services, our fixed costs represented 28% and 27% of our total cost of revenue in 2016 and 2017, respectively. Our profitability depends in part not only on absolute pricing levels for our services, but also on the utilization rates for our assembly and test equipment, commonly referred to as “capacity utilization rates”. Increases or decreases in our capacity utilization rates can significantly affect our gross margins as unit costs generally decrease as the fixed costs are allocated over a larger number of units. In the past, our capacity utilization rates have fluctuated significantly as a result of the fluctuations in the market demand for semiconductors. If we fail to increase or maintain our capacity utilization rates, our earnings and profitability may be adversely affected. In addition, the long-term assembly and test services agreements we entered with certain customers may require us to incur significant capital expenditures. If we are unable to achieve high capacity utilization rates for the equipment purchased pursuant to these agreements, our gross margins may be materially and adversely affected.
The assembly and test process is complex and our production yields and customer relationships may suffer as a result of defects or malfunctions in our testing and assembly equipment and the introduction of new packages.
Semiconductor testing and assembly are complex processes that require significant technological and process expertise. Semiconductor testing involves sophisticated test equipment and computer software. We develop computer software to test our customers’ semiconductors. We also develop conversion software programs that enable us to test semiconductors on different types of testers. Similar to most software programs, these software programs are complex and may contain programming errors or “bugs”. In addition, the testing process is subject to human error by our employees who operate our test equipment and related software. Any significant defect in our testing or conversion software, malfunction in our test equipment or human error could reduce our production yields and damage our customer relationships.
The assembly process involves a number of steps, each of which must be completed with precision. Defective packages primarily result from:
| • | contaminants in the manufacturing environment; |
| • | human error; |
| • | equipment malfunction; |
| • | defective raw materials; or |
| • | defective plating services. |
These and other factors have, from time to time, contributed to lower production yields. They may do so in the future, particularly as we expand our capacity or change our processing steps. In addition, to be competitive, we must continue to expand our offering of packages. Our production yields on new packages typically are significantly lower than our production yields on our more established packages. Our failure to maintain high standards or acceptable production yields, if significant and prolonged, could result in a loss of customers, increased costs of production, delays, substantial amounts of returned goods and related claims by customers. Further, to the extent our customers have set target production yields, we may be required to compensate our customers in a pre-agreed manner. Any of these problems could materially adversely affect our business reputation and result in reduced revenue and profitability.
9
Table of Contents
Because of the highly cyclical nature of our industry, our capital requirements are difficult to plan. If we cannot obtain additional capital when we need it, we may not be able to maintain or increase our current growth rate and our profits will suffer.
As our industry is highly cyclical and rapidly changing, our capital requirements are difficult to plan. To remain competitive, we may need capital to fund the expansion of our facilities as well as to fund our equipment purchases and research and development activities. To meet our liquidity, capital spending and other capital needs, we have taken and plan to take certain measures to generate additional working capital and to save cash. See “Item 5. Operating and Financial Review and Prospects—Liquidity and Capital Resources”. We cannot assure you that these plans and measures will be implemented or will provide sufficient sources of capital.
In addition, future capacity expansions or market or other developments may require additional funding. Our ability to obtain external financing in the future depends on a number of factors, many of which are beyond our control. They include:
| • | our future financial condition, results of operations and cash flows; |
| • | general market conditions for financing activities by semiconductor assembly and test companies; and |
| • | economic, political and other conditions in Taiwan and elsewhere. |
If we are unable to obtain funding in a timely manner or on acceptable terms, our growth prospects and potential future profitability will suffer.
Disputes over intellectual property rights could be costly, deprive us of technologies necessary for us to stay competitive, render us unable to provide some of our services and reduce our opportunities to generate revenue.
Our ability to compete successfully and achieve future growth will depend, in part, on our ability to protect our proprietary technologies and to secure, on commercially acceptable terms, critical technologies that we do not own. We cannot assure you that we will be able to independently develop, or secure from any third party, the technologies required for our assembly and test services. Our failure to successfully obtain these technologies may seriously harm our competitive position and render us unable to provide some of our services.
Our ability to compete successfully also depends on our ability to operate without infringing upon the proprietary rights of others. The semiconductor assembly and test industry is characterized by frequent litigation regarding patent and other intellectual property rights. We may incur legal liabilities if we infringe upon the intellectual property or other proprietary rights of others. We are not able to ascertain what patent applications have been filed in the United States or elsewhere, however, until they are granted. If any third party succeeds in its intellectual property infringement claims against us or our customers, we could be required to:
| • | discontinue using the disputed process technologies, which would prevent us from offering some of our assembly and test services; |
| • | pay substantial monetary damages; |
| • | develop non-infringing technologies, which may not be feasible; or |
| • | acquire licenses to the infringed technologies, which may not be available on commercially reasonable terms, if at all. |
Any one of these developments could impose substantial financial and administrative burdens on us and hinder our business. We are, from time to time, involved in litigation in respect of intellectual property rights. Any litigation, whether as plaintiff or defendant, is costly and diverts our resources. If we fail to obtain necessary licenses on commercially reasonable terms or if litigation, regardless of the outcome, relating to patent infringement or other intellectual property matters occurs, our costs could be substantially increased to impact our margins. Any such litigation could also prevent us from testing and assembling particular products or using particular technologies, which could reduce our opportunities to generate revenue.
10
Table of Contents
If we are unable to obtain raw materials and other necessary inputs from our suppliers in a timely and cost-effective manner, our production schedules would be delayed and we may lose customers and growth opportunities and become less profitable.
Our operations require us to obtain sufficient quantities of raw materials at acceptable prices in a timely and cost-effective manner. We source most of our raw materials, including critical materials like leadframes, organic substrates, epoxy, gold wire and molding compound for assembly, and tapes for TCP/COF, from a limited group of suppliers. We purchase all of our materials on a purchase order basis and have no long-term contracts with any of our suppliers. From time to time, suppliers have extended lead times, increased the price or limited the supply of required materials to us because of market shortages. Consequently, we may, from time to time, experience difficulty in obtaining sufficient quantities of raw materials on a timely basis. In addition, from time to time, we may reject materials that do not meet our specifications, resulting in declines in output or yield. Although we typically maintain at least two suppliers for each key raw material, we cannot assure you that we will be able to obtain sufficient quantities of raw materials and other supplies of an acceptable quality in the future. It usually takes from three to six months to switch from one supplier to another, depending on the complexity of the raw material. If we are unable to obtain raw materials and other necessary inputs in a timely and cost-effective manner, we may need to delay our production and delivery schedules, which may result in the loss of business and growth opportunities and could reduce our profitability.
If we are unable to obtain additional assembly and test equipment or facilities in a timely manner and at a reasonable cost, we may be unable to fulfill our customers’ orders and may become less competitive and less profitable.
The semiconductor testing and assembly business is capital intensive and requires significant investment in expensive equipment manufactured by a limited number of suppliers. The market for semiconductor assembly and test equipment is characterized, from time to time, by intense demand, limited supply and long delivery cycles. Our operations and expansion plans depend on our ability to obtain equipment from a limited number of suppliers in a timely and cost-effective manner. We have no binding supply agreements with any of our suppliers and we acquire our assembly and test equipment on a purchase order basis, which exposes us to changing market conditions and other significant risks. Semiconductor assembly and test also requires us to operate sizeable facilities. If we are unable to obtain equipment or facilities in a timely manner, we may be unable to fulfill our customers’ orders, which could negatively impact our financial condition and results of operations as well as our growth prospects. Currently, we do not have any long-term service agreements that require our commitment to acquire additional assembly and test equipment or facilities. We cannot assure you, however, that such commitment will not be made in the future. See “Item 4. Information on the Company—Customers”.
If we are unable to manage the expansion of our operations and resources effectively, our growth prospects may be limited and our future profitability may be reduced.
We expect to continue to expand the operations and to increase the number of employees. Rapid expansion puts a strain on our managerial, technical, financial, operational and other resources. As a result of our expansion, we will need to implement additional operational and financial controls and hire and train additional personnel. We cannot assure you that we will be able to do so effectively in the future, and our failure to do so could jeopardize our expansion plans and seriously harm our operations.
Republic of China law may be less protective of shareholder rights than laws of the United States or other jurisdictions.
Our corporate affairs are governed by our articles of incorporation and laws governing corporations incorporated in the Republic of China (“ROC”). The rights of our shareholders to bring shareholders’ suits against us or our board of directors under ROC law are more limited than those of the shareholders of U.S. corporations. For example, the ROC Company Act requires that a shareholder continuously holds at least 3% of our issued and outstanding shares for at least a year may request our audit committee to institute an action against a director on the company’s behalf. In addition, the controlling shareholders of U.S. corporations owe fiduciary duties to minority shareholders, while controlling shareholders in ROC corporations do not. Therefore, our shareholders may be less able under ROC law than they would be under the laws of the United States or other jurisdictions to protect their interests in connection with actions by our management, members of our board of directors or our controlling shareholder.
11
Table of Contents
It may be difficult to bring and enforce suits against us in the United States.
We are incorporated in the ROC and a majority of our directors and most of our officers are not residents of the United States. A substantial portion of our assets is located outside the United States. As a result, it may be difficult for our shareholders to serve notice of a lawsuit on us or our directors and officers within the United States. Because most of our assets are located outside the United States, it may be difficult for our shareholders to enforce the United States judgments of United States courts. Any United States judgments obtained against us will not be enforced by ROC courts if any of the following situations shall apply to such final judgment:
| • | the court rendering the judgment does not have jurisdiction over the subject matter under ROC law; |
| • | the judgment was rendered by default, except where the summons or order necessary for the commencement of the action was duly served on us within the jurisdiction of the court rendering the judgment within a reasonable period of time and in accordance with the laws and regulations of such jurisdiction, or with judicial assistance of the ROC; |
| • | the judgment or the court procedures resulting in the judgment are contrary to the public order or good morals of the ROC; or |
| • | the judgments of ROC courts are not recognized and enforceable in the jurisdiction of the court rendering the judgment on a reciprocal basis. |
Investor confidence and the market price of our common shares or ADSs may be adversely impacted if we are unable to maintain effective internal control over financial reporting in accordance with Section 404 of the Sarbanes-Oxley Act of 2002.
We are required to comply with the ROC and US securities laws and regulations in connection with internal controls. As a public company in the United States, our management is required to assess the effectiveness of our internal control over financial reporting using the criteria established in Internal Control – Integrated Framework (2013) issued by Committee of Sponsoring Organization of the Treadway Commission (COSO), as required by Section 404 of the Sarbanes-Oxley Act of 2002. We carried out an evaluation, under the supervision and with the participation of management, including our President, the principal executive officer and Senior Director of the Finance and Accounting Management Center, the principal financial officer of the effectiveness of the design and operation of our internal controls over financial reporting as of December 31, 2017, and concluded those internal controls over financial reporting were effective as of that date. See “Item 15. Controls and Procedures” for more information. Moreover, even if our management concludes that our internal controls over our financial reporting are effective, our independent public registered accounting firm may disagree. If our independent public registered accounting firm is not satisfied with our internal controls over our financial reporting or the level at which our controls are documented, designed, operated or reviewed, or if the independent public registered accounting firm interprets the requirements, rules or regulations differently from us, it may decline to attest to our management’s assessment or may issue an adverse opinion in the future. Any of these possible outcomes could result in an adverse reaction in the financial marketplace due to a loss of investor confidence in the reliability of our consolidated financial statements, which ultimately could negatively impact the market prices of our common shares or ADSs.
Any environmental claims or failure to comply with any present or future environmental regulations, or any new environmental regulations, may require us to spend additional funds, may impose significant liability on us for present, past or future actions, and may dramatically increase the cost of providing our services to our customers.
We are subject to various laws and regulations relating to the use, storage, discharge and disposal of chemical by-products of, and water used in, our assembly and gold bumping processes. Although we have not suffered material environmental claims in the past, a failure or a claim that we have failed to comply with any present or future regulations could result in the assessment of damages or imposition of fines against us, suspension of production or a cessation of our operations or negative publicity. New regulations could require us to acquire costly equipment or to incur other significant expenses. Any failure on our part to control the use of, or adequately restrict the discharge of, hazardous substances could subject us to future liabilities that may materially reduce our earnings.
On March 4, 2016, due to the malfunction of its wastewater treatment facility, a factory of the Company located in Chupei, Taiwan was found abnormally discharging wastewater. Upon notification, the Company was able to mitigate the environmental impact by immediately ceasing the abnormal discharge and collecting the wastewater that had been discharged. The wastewater treatment facility was also immediately repaired and the factory resumed its normal operations on the next day, March 5, 2016. On April 15, 2016, the Hsinchu County Government imposed an administrative fine of approximately NT$4 million on the Company for the violation of the statutory effluent standards and the fine was paid on April 22, 2016.
12
Table of Contents
Fluctuations in exchange rates could result in foreign exchange losses.
Currently, most of our revenue is denominated in NT dollars. Our cost of revenue and operating expenses, on the other hand, are incurred in several currencies, including NT dollars, Japanese yen, US dollars and Renminbi, or RMB. In addition, a substantial portion of our capital expenditures, primarily for the purchase of assembly and test equipment, has been, and is expected to continue to be, denominated in Japanese yen with much of the remainder in US dollars. We also have debt denominated in NT dollars, Japanese yen, US dollars and RMB. Fluctuations in exchange rates, primarily among the US dollar, the NT dollar and the Japanese yen, will affect our costs and operating margins in NT dollar terms. In addition, these fluctuations could result in exchange losses and increased costs in NT dollar terms. Despite selective hedging and other techniques implemented by us, fluctuations in exchange rates have affected, and may continue to affect, our financial condition and results of operations.
We may not be successful in our acquisitions, investments, joint ventures and dispositions, and may therefore be unable to implement fully our business strategy.
To implement our business strategy requires us to enter into acquisition, investment, joint venture and disposition transactions. These transactions may not be successful to maintain or grow our business. On December 11, 2015, the board of directors of the Company authorized and the Company and Tsinghua Unigroup Ltd. (“Tsinghua Unigroup”) executed a share subscription agreement (the “Tsinghua Share Subscription Agreement”), to issue and sell 299,252,000 common shares of the Company, par value NT$10 per share to Tsinghua Unigroup in a private placement (the “Private Placement”) at a price of NT$40.0 per common share of the Company representing an aggregate purchase price of approximately NT$12.0 billion. On November 30, 2016, the Company and Tsinghua Unigroup mutually agreed to terminate the Tsinghua Share Subscription Agreement and to form a joint-venture. Under the joint-venture, ChipMOS TECHNOLOGIES (BVI) LTD. (“ChipMOS BVI”), a wholly-owned subsidiary of the Company, would sell, for the aggregate purchase price of approximately RMB 484 million, 54.98% of the equity interests of its wholly-owned subsidiary, ChipMOS Shanghai, to strategic investors, including Tibet Unigroup Guowei Investment Co., Ltd. (“Unigroup Guowei”), a subsidiary of Tsinghua Unigroup, which would hold 48% equity interests of ChipMOS Shanghai, and the other strategic investors, including a limited partnership owned by ChipMOS Shanghai’s employees, would own 6.98% equity interest of ChipMOS Shanghai. The transaction was completed in March 2017. ChipMOS Shanghai is no longer the subsidiary of the Company following the completion of equity interest transfer. Please see “Item 4. Information on the Company—Agreements with Tsinghua Unigroup Ltd.” for additional information.
The success of our acquisitions, investments, joint ventures and dispositions depends on a number of factors, including:
| • | our ability to identify suitable investment, acquisition, joint venture or disposition opportunities; |
| • | our ability to reach an agreement for an acquisition, investment, joint venture or disposition opportunity on terms that are satisfactory to us or at all; |
| • | the extent to which we are able to exercise control over the acquired or joint venture company; |
| • | our ability to align the economic, business or other strategic objectives and goals of the acquired company with those of our company; and |
| • | our ability to successfully integrate the acquired or joint venture company or business with our company. |
If we are unsuccessful in our acquisitions, investments, joint ventures and dispositions, we may not be able to implement fully our business strategy to maintain or grow our business.
13
Table of Contents
We depend on key personnel, and our revenue could decrease and our costs could increase if we lose their services.
We depend on the continued service of our executive officers and skilled engineering, technical and other personnel. We will also be required to hire a substantially greater number of skilled employees in connection with our expansion plans. In particular, we depend on a number of skilled employees in connection with our LCD and other flat-panel display driver semiconductor assembly and test services, and the competition for such employees in Taiwan and Mainland China is intense. We may not be able to either retain our present personnel or attract additional qualified personnel as and when needed. Moreover, we do not carry key person insurance for any of our executive officers nor do we have employment contracts with any of our executive officers or employees, and, as a result, none of our executive officers or employees is bound by any non-competition agreement. If we lose any of our key personnel, it could be very difficult to find and integrate replacement personnel, which could affect our ability to provide our services, resulting in reduced revenue and earnings. In addition, we may need to increase employee compensation levels in order to retain our existing officers and employees and to attract additional personnel. As of March 31, 2018, 19% of the workforce at our facilities are foreign workers employed by us under work permits that are subject to government regulations on renewal and other terms. Consequently, if the regulations in Taiwan relating to the employment of foreign workers were to become significantly more restrictive or if we are otherwise unable to attract or retain these workers at reasonable cost, we may be unable to maintain or increase our level of services and may suffer reduced revenue and earnings.
If our security measures are breached and unauthorized access is obtained to our information technology systems, we may lose proprietary data.
Our security measures may be breached as a result of third-party action, including computer hackers, employees error, malfeasance or otherwise, and result in unauthorized access to our customers’ data or our data, including our intellectual property and other confidential business information, or our information technology systems. Because the techniques used to obtain unauthorized access, or to sabotage systems, change frequently, we may be unable to anticipate these techniques or to implement adequate preventative measures. Any security breach could result in disclosure of our trade secrets, confidential customer, supplier or employee data, which could result in legal liability, harm to our reputation and otherwise harm our business.
Risks Relating to Countries in Which We Conduct Operations
ROC laws and regulations limit or prohibit certain technology cooperation between ROC persons or entities with PRC persons or entities, and our current technology transfer arrangements between the Company and ChipMOS Shanghai may be found to be in violation of any such limitation or prohibition, which may result in a fine of between NT$50 thousand and NT$25 million and the termination of such technology transfer arrangements and therefore have a material adverse effect on the operations of ChipMOS Shanghai and our financial condition and results of operations.
ROC laws and regulations previously prohibited any transfer of semiconductor assembly and test technologies to any person or entity located in Mainland China, except for transfers involving certain low-end semiconductor assembly and test technologies, such as conventional wire bond assembly technology, if certain requirements are met. The ROC Ministry of Economic Affairs has the ultimate administrative authority in interpreting such laws and regulations. In February 2010, these restrictions have been relaxed, so that ROC entities may transfer semiconductor assembly and test technologies to any person or entity located in Mainland China after they have obtained approval from the Investment Commission of the ROC Ministry of Economic Affairs (“MOEAIC”). Under a technology transfer agreement, dated August 1, 2002, ChipMOS Bermuda, the parent company of the Company before its merger with and into the Company effective on October 31, 2016, licensed to ChipMOS Shanghai certain assembly and test-related technologies that were then controlled by ChipMOS Bermuda, which included technologies that were licensed to ChipMOS Bermuda by the Company. ChipMOS Bermuda continued to license such technologies to ChipMOS Shanghai pursuant to a technology transfer agreement dated October 3, 2011 with effective date of August 1, 2012. ChipMOS Bermuda also provided ChipMOS Shanghai with technical support and consulting services under this agreement. Following the merger of ChipMOS Bermuda and the Company which was effective on October 31, 2016 (the “Merger”), the Company is the surviving company to provide ChipMOS Shanghai with technical support and consulting services. On May 27, 2016, the Company and ChipMOS Shanghai executed another technology transfer and license agreement under which the Company licensed ChipMOS Shanghai certain technologies relating to LCD driver IC assembly and testing and wafer bumping. The Company and ChipMOS Shanghai further executed the first addendum and the second addendum to such technology transfer and license agreement on August 5, 2016 and January 19, 2017, respectively, to revise the term, and license fee and running royalty of such license arrangement.
14
Table of Contents
In the opinion of Lee and Li, our ROC special counsel, since our technology transfer arrangements as described above have been approved by the MOEAIC, they are in compliance with all applicable ROC laws and regulations. However, substantial uncertainties remain regarding the interpretation and application of those laws and regulations. Accordingly, we cannot assure you that ROC regulatory authorities will not take a view contrary to the opinion of our ROC special counsel. If we were determined to be in violation of applicable ROC laws and regulations governing technology cooperation with PRC persons and entities, we may be subject to a fine of between NT$50 thousand and NT$25 million and may be ordered by the MOEAIC to terminate or rectify such activity within a specified period of time. Any termination of our current technology transfer to ChipMOS Shanghai could materially adversely affect ChipMOS Shanghai’s operations and our financial condition, results of operations or prospects, as well as the market price of our common shares or ADSs.
Our ability to direct the operations we conduct through our affiliated companies that we do not fully own may be limited by legal duties owed to other shareholders of such companies.
Certain of our operations are conducted through companies that we do not fully own. For example, as of March 31, 2017, the Company owned 45.02% equity interests of ChipMOS Shanghai through its wholly-owned subsidiary ChipMOS BVI. On November 12, 2014, the Company made announcement for the contemplated merger with ThaiLin Semiconductor Corp. (“ThaiLin”). The merger was completed on June 17, 2015. We also conduct other activities through our affiliated entities. See also “—Risks Relating to Our Common Shares or ADSs—The Company’s ability to maintain its listing and trading status of common shares on the Taiwan Stock Exchange or ADSs on the NASDAQ Stock Market is dependent on factors outside of the Company’s control and satisfaction of stock exchange requirements. The Company may not be able to overcome such factors that disrupt its trading status of common shares on the Taiwan Stock Exchange or ADSs on the NASDAQ Stock Market or satisfy other eligibility requirements that may be required of it in the future” and “Item 7. Major Shareholders and Related Party Transactions—Related Party Transactions”.
In accordance with the various laws of the relevant jurisdictions in which our subsidiaries and affiliates are organized, each of our subsidiaries and affiliates and their respective directors owe various duties to their respective shareholders. As a result, the actions we wish our subsidiaries or affiliates to take could be in conflict with their or their directors’ legal duties owed to their other shareholders. When those conflicts arise, our ability to cause our subsidiaries or affiliates to take the action that we desire may be limited.
Any future outbreak of health epidemics and outbreaks of contagious diseases, including avian influenza, swine flu, Severe Acute Respiratory Syndrome, or Ebola virus disease, may materially affect our operations and business.
Influenza viruses circulating in animals pose threats to human health. Humans can become ill when infected with viruses from animal sources, such as avian influenza virus subtypes H5N1, H9N2 and H7N9 and swine influenza virus subtypes H1N1 and H3N2. An outbreak of a contagious disease such as New Influenza A or more commonly known as the “bird flu” and “swine flu”, Severe Acute Respiratory Syndrome (SARS), or avian influenza with virus subtype H7N9, for which there is inadequate treatment or no known cure or vaccine, may potentially result in a quarantine of infected employees and related persons, and adversely affect our operations at one or more of our facilities or the operations of our customers or suppliers. We cannot predict the impact that any further future outbreak of the aforementioned influenza viruses or other diseases could have on our business and results of operations.
Also, on July 2, 2017, the World Health Organization declared the end of the most recent outbreak of the largest and most complex Ebola virus disease (EVD) outbreak in the Democratic Republic of Congo since the Ebola virus was first discovered in 1976. There have been more cases and deaths in this outbreak than all others combined. It has also spread between countries starting in Guinea then spreading across land borders to Sierra Leone and Liberia, by air to Nigeria, and by land to Senegal. People remain infectious as long as their blood and body fluids, including semen and breast milk, contain the virus. Men who have recovered from the disease can still transmit the virus through their semen for up to 7 weeks after recovery from illness. There is as yet no proven treatment available for EVD. As such, we cannot predict the impact that any future outbreak of EVD could have on our business and results of operations.
If any of our employees is suspected of having contracted any contagious disease, we may, under certain circumstances, be required to quarantine such employees and the affected areas of our premises. As a result, we may have to suspend part or all of our operations temporarily. In addition, any future outbreak may restrict the level of economic activity in affected regions which may also adversely affect our businesses. As a result, there is no assurance that any future outbreak of contagious diseases would not have a material adverse effect on our business, financial condition and results of operations.
15
Table of Contents
We face substantial political risk associated with doing business in Taiwan, particularly due to the strained relations between the Republic of China and the People’s Republic of China, which could negatively affect our business and the market price of our common shares or ADSs.
Our principal executive offices and our assembly and test facilities are located in Taiwan. As a result, our business, financial condition and results of operations and the market price of our common shares or ADSs may be affected by changes in ROC governmental policies and the political relationship between the ROC and PRC, as well as social instability and diplomatic and social developments in or affecting Taiwan which are beyond our control. For example, the ROC has a unique international political status. The PRC government regards Taiwan as a renegade province and does not recognize the legitimacy of the ROC as an independent country. Although significant economic and cultural relations have been positively strengthened in recent years between the ROC and the PRC, relations have often been strained. In March 2005, the PRC government enacted the “Anti-Secession Law” codifying its policy of retaining the right to use military force to gain control over Taiwan, particularly under what it considers as highly provocative circumstances, such as a declaration of independence by Taiwan or the refusal by the ROC to accept the PRC’s stated “One China” policy. Between March 18 and April 10, 2014, students and certain civic groups initiated the Sunflower Student Movement as a protest movement and occupied the Legislative Yuan and protested the passing of the Cross-Strait Service Trade Agreement (“CSSTA”) proposed by the then-ruling party, the Kuomintang, at the legislature without a clause-by-clause review. The CSSTA has been put on hold ever since the Sunflower Student Movement.
In 2016, Tsai Ing-Wen of the pro-independence Democratic Progressive Party (“DPP”) won Taiwan’s Presidential Election and the DPP gained the majority of the seats in Taiwan’s Legislative Yuan for the first time in its history. President Tsai and the DPP had stressed on how they are keen to maintain the status quo with China. In a statement issued after Tsai’s win, the Chinese Cabinet’s body for handling Taiwan affairs reaffirmed its opposition to Taiwan independence, but said it would work to maintain peace and stability between the two sides of the Taiwan Strait.
Past developments related to the interaction between the ROC and the PRC have on occasion depressed the market prices of the securities of Taiwanese or Taiwan-related companies, including our own. We cannot assure you any contentious situations between Taiwan and China will resolve in maintaining the current status quo or remain peaceful. Relations between the ROC and the PRC and other factors affecting military, political or economic stability in Taiwan could have a material adverse effect on our financial condition and results of operations, as well as the market price and the liquidity of our common shares or ADSs.
The business and operations of our business associates and our own business operations are vulnerable to disruptions that may be caused by natural disasters and other events.
We currently provide most of our test services through our facilities in the Hsinchu Industrial Park and the Hsinchu Science Park in Taiwan, and all of our assembly services through our facility in the Southern Taiwan Science Park. We also have an affiliate provides test and assembly services through its facility in Shanghai Qingpu Industrial Zone. Significant damage or other impediments to these facilities as a result of natural disasters, industrial strikes or industrial accidents could significantly increase our operating costs.
Certain regions we operate in are particularly susceptible to earthquakes and associated natural disasters. For example, in late 1999, Taiwan suffered severe earthquakes which caused significant property damages and loss of life, particularly in the central part of Taiwan. The earthquakes damaged production facilities and adversely affected the operations of many companies involved in the semiconductor and other industries. We experienced an aggregate of NT$8 million in damages to our machinery and equipment, facilities, inventory and five days of delay in production schedule as a result of the event. In March 2011, Sendai of Japan registered an earthquake of 9.0 Mw (moment magnitude scale) off the coast of Japan (the “Sendai Earthquake”). The Sendai Earthquake was recorded as most powerful earthquake to hit Japan and the fourth most powerful earthquake in the world. The earthquake triggered tsunami warnings and evacuations along Japan’s Pacific coast and in at least 20 countries, including Taiwan and Mainland China. In April 2013, an earthquake registering a magnitude of approximately 6.6-7.0 Mw with epicenter located in Lushan County, Ya’an, Sichuan (the “Lushan Earthquake”). ReliefWeb, part of the United Nations Office for the Coordination of Humanitarian Affairs (OCHA) released information on July 23, 2013 confirming 196 deaths and up to 2 persons missing and 14,785 injured victim reports. On February 6, 2016, Meinong District of Kaohsiung, Taiwan registered an earthquake of 6.4 Mw (the “Meinong Earthquake”). The Meinong Earthquake claimed 117 deaths and 551 injured victims. We had a very minor impact at our manufacturing operations in the Southern Taiwan Science Park primarily due to power interruption in the immediate wake of the earthquake.
16
Table of Contents
In January and February 2008, certain parts of Mainland China, particularly in the southern, central and eastern regions, experienced reportedly the most severe winter in the country in recent decades, which resulted in significant and extensive damages to factories, power lines, homes, automobiles, crops and other properties, blackouts, transportation and communications disruptions and other losses in the affected areas. In addition, in May 2008, certain semiconductor companies with facilities in eastern Mainland China experienced production disruption reportedly due to power outages caused by the failure of certain electricity supply system in the area where the plants are located. We cannot assure you that the facilities in the Shanghai Qingpu Industrial Zone will not be adversely affected by future snowstorms, power outages, earthquakes or other similar events.
Natural disasters and other events like aforementioned events cause severe property damages to townships, infrastructures and death and injuries to Civilians. In Sendai Earthquake, many electrical generators were disabled, and at least three nuclear power plant reactors partially melted down and experienced a chemical explosion extensively damaging surrounding buildings. We cannot assure you that our production facilities, operations and market located in Taiwan and Mainland China will not be adversely affected as result of the events that take place overseas like the Sendai Earthquake, including radiation emission from the damaged nuclear power plants or subsequent future earthquakes that may take place.
The production facilities of many of our suppliers, customers and providers of complementary semiconductor manufacturing services, including foundries, are located in Taiwan and Mainland China. If our customers are adversely affected by natural disasters or other events occurring in or affecting these geographic areas, it could result in a decline in the demand for our assembly and test services. If our suppliers and providers of complementary semiconductor manufacturing services are affected by such events, our production schedule could be halted or delayed. As a result, a major earthquake, snowstorm, other natural disaster, industrial strike, industrial accident or other disruptive event occurring in or affecting Taiwan or Mainland China could severely disrupt our normal operation of business and have a material adverse effect on our financial condition and results of operations.
Any future outbreak of radiation-related disease as a result of nuclear power plant reactors damage caused by the Sendai Earthquake may materially adversely affect our operations and business.
The Sendai Earthquake raises tremendous concerns about the possible effects of radiation emission from the damaged nuclear power plants. Japanese official authorities are working with experts in assessing the risk and determining the best courses of actions to implement to escape harmful radiation. The potential health effects due to exposure to harmful radiation may be temporary or permanent harmful effects in nature.
Multiple radioactive gases could possibly be emitted in a situation where uranium attains a “meltdown” state, which is a severe overheating of the core of a nuclear reactor, in which the core melts and radiation and heat are caused to escape. This would occur if the containment system partially or fully fails. The particles that are released with the gases due to the meltdown would be the spewed particles of iodine-131, strontium-90 and cesium-137. These might enter into a human by being swallowed, absorbed through the skin, or inhaled. Depending on the chemical characteristics of each of these and their predilection for certain body tissues, they could cause cancers of such organs as bones, soft tissues near bones, thyroid gland, and the bone marrow (typically known as leukemia).
Acute or very high level radiation exposure can cause a person to become very ill or to die quickly. Ionizing radiation, which is defined as high-energy particles or electromagnetic waves that can break chemical bonds, damage humans by disrupting cellular function, particularly in tissues with rapid growth and turnover of cells. Intense, high level and/or excessive radiation exposure may result in acute radiation syndrome whereby harmful effects to the human body may be evidenced by skin burns, internal organ deterioration, bleeding, vomiting, bone marrow distortion and deaths. If the radiation exposure is less intense and/or more prolonged at a lower level, then the central nervous system, kidneys, thyroid gland, and liver may be affected. Cancer is the most well-known effect, and may affect virtually any significantly exposed tissue.
Certain health effects due to exposure to harmful radiation does not have adequate treatment or known cure or vaccine, consequently, may potentially result in a quarantine of infected employees and related persons, and adversely affect our operations at one or more of our facilities or the operations of our customers or suppliers. We cannot predict the probability of any future outbreak of radiation related diseases as a possible result of nuclear power plants damage caused by the Sendai Earthquake or the extent of the material adverse impact that this could have on our business and results of operations.
17
Table of Contents
Risks Relating to Our Common Shares or ADSs
The Company’s ability to maintain its listing and trading status of common shares on the Taiwan Stock Exchange or ADSs on the NASDAQ Stock Market is dependent on factors outside of the Company’s control and satisfaction of stock exchange requirements. The Company may not be able to overcome such factors that disrupt its trading status of common shares on the Taiwan Stock Exchange or ADSs on the NASDAQ Stock Market or satisfy other eligibility requirements that may be required of it in the future.
The Company became listed and commenced trading its common shares on the main board of Taiwan Stock Exchange (“TWSE”) on April 11, 2014 and its ADSs on the NASDAQ Stock Market (“NASDAQ”) on November 1, 2016. For a TWSE-listed and NASDAQ-listed company to continue trading on the main board of TWSE and NASDAQ depends in part on market conditions and other factors that may not within the control of the Company. For these reasons there can be no assurance that the Company’s shares will continue to be listed or traded on the TWSE or ADSs will continue to be listed or traded on the NASDAQ.
Volatility in the price of our common shares or ADSs may result in shareholder litigation that could in turn result in substantial costs and a diversion of our management’s attention and resources.
The financial markets in the United States and other countries have experienced significant price and volume fluctuations, and market prices of technology companies have been and continue to be extremely volatile. Volatility in the price of our common shares or ADSs may be caused by factors outside of our control and may be unrelated or disproportionate to our results of operations. Shareholders of public companies such as the Company frequently institute securities class action litigations against companies following periods of volatility in the market price of a public company securities including common shares and ADSs. Litigation of this kind against the Company could result in substantial costs and a diversion of our management’s attention and resources.
Certain provisions in our constitutive documents and in our severance agreements with our executive officers make the acquisition of us by another company more difficult and costly and therefore may delay, defer or prevent a change of control.
We entered into change in control severance agreements with certain management pursuant to which we agreed to pay certain severance payments if a change in control event (as defined in the change in control severance agreements) occurs and the employment of such executive officer is terminated by our company other than for cause or by such executive officer for good reasons within two years following the occurrence of the change in control event. These agreements may increase the cost of a party seeking to effect a change in control of our company.
Future sales, pledge or issuance of common shares or ADSs by us or our current shareholders could depress our share price or ADSs price and you may suffer dilution.
Sales of substantial amounts of shares or ADSs in the public market, the perception that future sales may occur, or the pledge of a substantial portion of our common shares or ADSs could depress the prevailing market price of our shares or ADSs. See “Item 7. Major Shareholders and Related Party Transactions—Major Shareholders” for further information about our major shareholders.
The Company was listed and commenced trading of common shares on the main board of TWSE on April 11, 2014. See “—Risks Relating to Our Common Shares or ADSs—The Company’s ability to maintain its listing and trading status of common shares on the Taiwan Stock Exchange or ADSs on the NASDAQ Stock Market is dependent on factors outside of the Company’s control and satisfaction of stock exchange requirements. The Company may not be able to overcome such factors that disrupt its trading status of common shares on the Taiwan Stock Exchange or ADSs on the NASDAQ Stock Market or satisfy other eligibility requirements that may be required of it in the future” for additional information on the Company’s listing on the main board of TWSE. We plan to issue, from time to time, additional shares in connection with employee compensation and to finance possible future capital expenditures, investments or acquisitions. See “Item 6. Directors, Senior Management and Employees—Restricted Shares” for a discussion of the plan of the Restricted Shares that we have adopted for the benefit of our employees. The issuance of additional shares may have a dilutive effect on other shareholders and may cause the price of our common shares or ADSs to decrease.
On December 11, 2015, the Board of the Company authorized and the Company and Tsinghua Unigroup executed the Tsinghua Share Subscription Agreement, to sell and issue 299,252,000 shares of the Company to Tsinghua Unigroup through the Private Placement at a price of NT$40.0 per common share representing an aggregate purchase price of approximately NT$12.0 billion. On November 30, 2016, the Company and Tsinghua Unigroup mutually agreed to terminate the Tsinghua Share Subscription Agreement and to form a joint-venture. Under the joint-venture, ChipMOS BVI, a wholly-owned subsidiary of the Company, would sell 54.98% of the equity interests of its wholly-owned subsidiary, ChipMOS Shanghai, to strategic investors, including Unigroup Guowei, a subsidiary of Tsinghua Unigroup, which will hold 48% equity interests of ChipMOS Shanghai. The transaction was completed in March 2017 and ChipMOS Shanghai is no longer the subsidiary of the Company.
18
Table of Contents
Holders of Our ADSs do not have the same voting rights as holders of our common shares.
Under the ROC Company Act, except under limited circumstances, shareholders have one vote for each common share held. See “Item 10. Additional Information—Voting Rights” for a discussion of voting rights of holders of our common shares. Holders of our ADSs do not have the same voting rights as holders of our common shares. Instead, the voting rights of a holder of our ADSs are governed by the Deposit Agreement and are able to exercise voting rights on an individual basis as follows: if a holder of our ADSs outstanding at the relevant record date instructs the depositary to vote in a particular manner for or against a resolution, including the election of directors, the depositary will cause all the Company shares represented by such holder’s ADSs to be voted in that manner. If the depositary does not receive timely instructions from a holder of our ADSs outstanding at the relevant record date to vote in a particular manner for or against any resolution, including the election of directors, such holders of our ADSs will be deemed to have instructed the depositary or its nominee to give a discretionary proxy to a person designated by the Company to vote all the Company shares represented by such holder’s ADSs at the discretion of such person, which may not be in the interest of holders of our ADSs.
If a non-ROC holder of our ADSs withdraws and holds our shares, such holder of our ADSs will be required to appoint a tax guarantor, local agent and custodian in the ROC and register with the TWSE in order to buy and sell securities on the TWSE.
When a non-ROC holder of our ADSs elects to withdraw and hold our shares represented by our ADSs, such holder of our ADSs will be required to appoint an agent for filing tax returns and making tax payments in the ROC. Such agent will be required to meet the qualifications set by the ROC Ministry of Finance and, upon appointment, will become the guarantor of the withdrawing holder’s tax payment obligations. Evidence of the appointment of a tax guarantor, the approval of such appointment by the ROC tax authorities and tax clearance certificates or evidentiary documents issued by such tax guarantor may be required as conditions to such holder repatriating the profits derived from the sale of our shares. We cannot assure you that a withdrawing holder will be able to appoint, and obtain approval for, a tax guarantor in a timely manner.
In addition, under current ROC law, such withdrawing holder is required to register with the TWSE and appoint a local agent in the ROC to, among other things, open a bank account and open a securities trading account with a local securities brokerage firm, pay taxes, remit funds and exercise such holder’s rights as a shareholder. Furthermore, such withdrawing holder must appoint a local bank or local securities firm to act as custodian for confirmation and settlement of trades, safekeeping of securities and cash proceeds and reporting and declaration of information. Without satisfying these requirements, non-ROC withdrawing holders of our ADSs would not be able to hold or otherwise subsequently sell our shares on TWSE or otherwise. Appointment of an agent or a tax guarantor might also occur additional costs.
Pursuant to Mainland Investors Regulations, only qualified domestic institutional investors (the “QDIIs”, each a “QDII”) or persons that have otherwise obtained the approval from the MOEAIC and registered with the TWSE are permitted to withdraw and hold our shares from a depositary receipt facility. In order to hold our shares, such QDIIs are required to appoint an agent and custodian as required by the Mainland Investors Regulations. If the aggregate amount of our shares held by any QDII or shares received by any QDII upon a single withdrawal accounts for 10.0% of our total issued and outstanding shares, such QDII must obtain the prior approval from the MOEAIC. We cannot assure you that such approval would be granted.
Restriction on the ability to deposit our shares into our ADR facility may adversely affect the liquidity and price of our ADSs.
The ability to deposit our shares into our ADR facility is restricted by ROC law. Under current ROC law, no person or entity, including you and the Company, may deposit our shares into our ADR facility without specific approval of the Financial Supervisory Commission of the ROC, or the FSC, unless:
| (1) | the Company pays stock dividends on our shares; |
| (2) | the Company makes a free distribution of our shares; |
| (3) | holders of our ADSs exercise preemptive rights in the event of capital increases; or |
| (4) | to the extent permitted under the Deposit Agreement and the relevant custody agreement, investors purchase our shares, directly or through the depositary, on the TWSE, and deliver our shares to the custodian for deposit into our ADR facility, or our existing shareholders deliver our shares to the custodian for deposit into our ADR facility. |
With respect to item (4) above, the depositary may issue our ADSs against the deposit of our shares only if the total number of our ADSs outstanding following the deposit will not exceed the number of our ADSs previously approved by the FSC, plus any our ADSs issued pursuant to the events described in items (1), (2) and (3) above.
19
Table of Contents
In addition, in the case of a deposit of our shares requested under item (4) above, the depositary will refuse to accept deposit of such our shares if such deposit is not permitted under any legal, regulatory or other restrictions notified by the Company to the depositary from time to time, which restrictions may include blackout periods during which deposits may not be made, minimum and maximum amounts and frequency of deposits.
The depositary will not offer holders of our ADSs preemptive rights unless the distribution of both the rights and the underlying our shares to our ADS holders are either registered under the Securities Act or exempt from registration under the Securities Act.
The rights of holders of our ADSs to participate in our rights offerings is limited, which could cause dilution to your holdings.
The Company may from time to time distribute rights to its shareholders, including rights to acquire its securities. Under the Deposit Agreement, the depositary will not offer holders of our ADSs those rights unless both the distribution of the rights and the underlying securities to all our ADS holders are either registered under the Securities Act or exempt from the registration under the Securities Act. Although the Company may be eligible to take advantage of certain exemptions under the Securities Act available to certain foreign issuers for rights offering, the Company can give no assurances that it will be able to establish an exemption from registration under the Securities Act, and it is under no obligation to file a registration statement for any of these rights. Accordingly, holders of our ADSs may be unable to participate in our rights offerings and may experience dilution of their holdings.
If the depositary is unable to sell rights that are not exercised or not distributed or if the sale is not lawful or reasonably practicable, it will allow the rights to lapse, in which case holders of our ADSs will receive no value for these rights.
Changes in exchanges controls which restrict your ability to convert proceeds received from your ownership of our ADSs may have an adverse effect on the value of your investment.
Under current ROC law, the depositary, even without obtaining approvals from the Central Bank of the Republic of China (Taiwan) or any other governmental authority or agency of the ROC, may still convert NT dollars into other currencies, including US dollars, for:
| • | the depositary of the sale of common shares represented by ADSs or received as stock dividends from our shares and deposited into the depositary receipt facility; and |
| • | any cash dividends. |
In addition, the depositary may also convert into NT dollars incoming payments for purchase of common shares for deposit in ADR facility against the creation of additional ADSs. However, the depositary may be required to obtain foreign exchange approval from the Central Bank of the Republic of China (Taiwan) on a payment-by-payment basis for conversion from NT dollars into foreign currencies of the proceeds from the sale of subscription rights for new common shares. Although it is expected that the Central Bank of the Republic of China (Taiwan) will grant this approval as a routine manner, we cannot assure you that in the future any approval will be obtained in a timely manner, or at all.
Under the ROC Foreign Exchange Control Law, the Executive Yuan of the ROC government may, without prior notice but subject to subsequent legislative approval, impose foreign exchange controls in the event of, among other things, a material change in international economic conditions. We cannot assure you that foreign exchange controls or other restrictions will not be introduced in the future.
20
Table of Contents
| Item 4. | Information on the Company |
Overview of the Company
We are one of the leading independent providers of semiconductor assembly and test services. Specifically, we are one of the leading independent providers of testing and assembly services for LCD and other flat-panel display driver semiconductors and advanced memory and logic/mixed-signal products in Taiwan. The depth of our engineering expertise and the breadth of our assembly and test technologies enable us to provide our customers with advanced and comprehensive assembly and test services. In addition, our geographic presence in Taiwan is attractive to customers wishing to take advantage of the logistical and cost efficiencies stemming from our close proximity to foundries and producers of consumer electronic products in Taiwan. Our production facilities are located in Hsinchu and Tainan, Taiwan.
Our Structure and History
We are a company limited by shares, incorporated on July 28, 1997, under the ROC Company Act, under the name “ChipMOS TECHNOLOGIES INC.” (“ChipMOS Taiwan”), as a joint venture company between Mosel Vitelic Inc. (“Mosel”) and Siliconware Precision Industries Co., Ltd. (“Siliconware Precision”) and with the participation of other investors. Our operations consist of the assembly and test of semiconductors as well as gold bumping and memory module manufacturing. Our principal place of business is located at No. 1, R&D Road 1, Hsinchu Science Park, Hsinchu, Taiwan, ROC and its phone number is (886) 3 577 0055 and our Internet website address is “http://www.chipmos.com.”
In January 2001, ChipMOS Bermuda acquired an equity interest in the Company issuing its shares to the Company’s shareholders in exchange for their 70.3% shareholding in the Company. In October 2001, the Company issued 6,911,732 common shares as employee bonuses. In December 2002, ChipMOS Bermuda issued 132,793 shares in exchange for 5,633,442 shares of the Company held by these employees. On September 14, 2007, the Company completed a share exchange transaction with ChipMOS Bermuda pursuant to which ChipMOS Bermuda exchanged one common share for every 8.4 common shares of the Company. Following the completion of the share exchange transaction, the Company became ChipMOS Bermuda’s wholly-owned subsidiary. In February 2010, ChipMOS Bermuda agreed to sell 15.8% of the Company’s outstanding shares to Siliconware Precision. The share purchase transaction was completed in January 2011.
As part of the Company’s listing plan on the TWSE, on April 16, 2013, ChipMOS Bermuda completed the sale of 6.5 million common shares of the Company, at the price of NT$15.0 per share to the Company’s underwriters and certain others, including non-US employees of the Company. From September 2, 2013 to October 3, 2013, ChipMOS Bermuda sold 180 million common shares of the Company, at the price of NT$20.0 per shares to investors. The Company became listed and commenced trading on the main board of TWSE on April 11, 2014.
According to the merger agreement, entered between the Company and ChipMOS Bermuda dated January 21, 2016 (the “Merger Agreement”), ChipMOS Bermuda merged with and into the Company, with the Company being the surviving company after the Merger. The transaction was accounted as capital reorganization within the Company and its subsidiaries (the “Group”), please see “Item 5. Operating and Financial Review and Prospects—Recent Acquisitions”. Any common shares of ChipMOS Bermuda issued and outstanding immediately prior to the effective time of the Merger was cancelled and, in exchange, each former holder of such cancelled common shares of ChipMOS Bermuda was entitled to receive, with respect to each such share (i) US$3.71 in cash, without interest, and (ii) 0.9355 ADSs representing 18.71 shares of the Company (each ADS representing 20 new common shares, par value of NT$10 each, to be issued by the Company) in exchange for each of ChipMOS Bermuda’s common share held (the US$3.71 in cash and together with the ADSs, the “Merger Consideration”). The Merger was completed and effective on October 31, 2016. The Company issued 512,405,340 common shares represented by the ADSs and the ADSs were listed on the NASDAQ on November 1, 2016.
21
Table of Contents
The following chart illustrates our corporate structure and our equity interest in each of our principal subsidiaries as of the date of this Annual Report on Form 20-F.
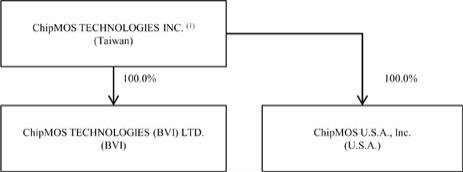
Note:
| (1) | Under IFRS 10 “Consolidated Financial Statements”, we are required to consolidate the financial results of any subsidiaries in which we hold a controlling interest or voting interest in excess of 50% or we have the power to direct or cause the direction of the management and policies, notwithstanding the lack of majority ownership. In 2014, we consolidated the financial results of ChipMOS U.S.A., Inc., or ChipMOS USA, and ChipMOS BVI. We also consolidated ThaiLin before it was merged into the Company on June 17, 2015, and ChipMOS Shanghai, ChipMOS BVI’s previously wholly-owned subsidiary prior to ChipMOS BVI’s sale of its 54.98% equity interests in ChipMOS Shanghai in March 2017. |
Agreements with Tsinghua Unigroup Ltd.
On December 11, 2015, the board of the Company authorized and the Company signed the Tsinghua Share Subscription Agreement, which is included as Exhibit 4.3, to sell the Company’s 299,252,000 shares to Tsinghua Unigroup through a private placement at a price of NT$40.0 per common share of the Company representing an aggregate purchase price of approximately NT$12.0 billion.
On December 11, 2015, the Company and Tsinghua Unigroup also executed the Strategic Alliance Agreement, which is included as Exhibit 4.4, designed to strengthen the long-term cooperation relationship between the two companies. Under the terms of the Strategic Alliance Agreement, Tsinghua Unigroup would assist the Company in expanding and strengthening the relationship between the Company and companies relating to the assembly and test services of LCD drivers and wafer bumping services in the PRC, and would introduce other potential suppliers, customers and business partners in the PRC to the Company.
On February 25, 2016, the Company and Tsinghua Unigroup executed the Subscriber Joinder Agreement, which is included as Exhibit 4.6, under which Tsinghua Unigroup assigned its obligations and liabilities under the Tsinghua Share Subscription Agreement to Tibet MaoYeChaungXin INVESTMENT CO., LIMITED (“Tibet MaoYe”), which is a subsidiary controlled by Tsinghua Unigroup. From the execution of the Subscriber Joinder Agreement, Tibet MaoYe became the “Subscriber” defined in the Tsinghua Share Subscription Agreement and assumed all the rights, benefits, liabilities and obligations incurred from the Tsinghua Share Subscription Agreement. On the same date, the Company and Tibet MaoYe executed the Tibet MaoYe Share Subscription Agreement (included as Exhibit 4.7), the substantive content of which is consistent with the Tsinghua Share Subscription Agreement.
On November 30, 2016, the Company and Tsinghua Unigroup mutually agreed to terminate the Tsinghua Share Subscription Agreement and to form a joint-venture. Under the joint-venture, the Equity Interest Transfer Agreements among ChipMOS BVI, a wholly-owned subsidiary of the Company, and some strategic investors which including Unigroup Guowei, a subsidiary of Tsinghua Unigroup, were executed. Pursuant to the Equity Interest Transfer Agreements, ChipMOS BVI would sell 54.98% equity interests of its wholly-owned subsidiary, ChipMOS Shanghai, to the strategic investors, and Unigroup Guowei would hold 48% equity interests of ChipMOS Shanghai, and the other strategic investors, including a limited partnership owned by ChipMOS Shanghai’s employees, would own approximately 6.98% equity interest of ChipMOS Shanghai. The transaction was completed in March 2017. ChipMOS Shanghai is no longer the subsidiary of the Company following the completion of equity interests transfer. Also pursuant to the agreement, ChipMOS BVI and the strategic investors agreed to further invest RMB 1,074 million into ChipMOS Shanghai. The further investment was completed in two tranches, one in July 2017 at RMB 687 million and one in February 2018 at RMB 387 million.
22
Table of Contents
Our Principal Consolidated Subsidiaries
Below is a description of our principal consolidated subsidiaries:
ChipMOS TECHNOLOGIES (BVI) LTD., or formerly known as MODERN MIND TECHNOLOGY LIMITED and ChipMOS TECHNOLOGIES (Shanghai) LTD. ChipMOS BVI was incorporated in the British Virgin Islands in January 2002. Before the transfer of 54.98% equity interests of ChipMOS Shanghai which was completed in March 2017, ChipMOS BVI conducted its operations through ChipMOS Shanghai, a wholly-owned subsidiary incorporated in Mainland China. See “—Our Structure and History—Agreements with Tsinghua Unigroup Ltd.” for more details. ChipMOS Shanghai is engaged in wafer testing and semiconductor assembly and test. ChipMOS Bermuda acquired a 100% equity interest in ChipMOS BVI on December 12, 2002, and then transferred it to Jesper Limited (“Jesper”) on December 31, 2002. In 2003, ChipMOS Bermuda acquired from Jesper a convertible note in the amount of US$37.5 million issued by ChipMOS BVI that may be converted into a controlling equity interest in ChipMOS BVI at a conversion rate of one ordinary share of ChipMOS BVI for every US$1.00 if the repayment is not made when due. In 2004, ChipMOS Bermuda restructured its control of ChipMOS Shanghai and its Mainland China operations. On July 29, 2004, ChipMOS Bermuda replaced the US$37.5 million convertible note previously issued by ChipMOS BVI in its entirety with a US$62.8 million demand note issued by ChipMOS BVI, with the difference representing a US$25 million loan that ChipMOS Bermuda extended to ChipMOS BVI from the net proceeds of its July 2004 offering of common shares. In addition, ChipMOS Bermuda extended a loan in the aggregate amount of US$50 million to ChipMOS BVI from the net proceeds of its November 2004 convertible debt offering in exchange for demand notes issued by ChipMOS BVI in the same aggregate amount (the “MMT Notes”). The MMT Notes were convertible at any time into common shares representing, immediately after the conversion, almost 100% of the then outstanding common shares of ChipMOS BVI at a conversion rate of US$1.00 for each common share of ChipMOS BVI. Payment under the MMT Notes were fully and unconditionally guaranteed by Jesper and secured by a pledge agreement in respect of the entire equity interest in ChipMOS BVI and ChipMOS Shanghai. ChipMOS Bermuda obtained from Jesper an irrevocable option to acquire at any time the common shares of ChipMOS BVI then owned by Jesper. Under an assignment and assumption agreement signed on April 22, 2011 (the “MMT Assignment Agreement”), ChipMOS Bermuda agreed to sell the MMT Notes to ThaiLin for a purchase price of approximately US$40 million subject to certain closing conditions. Post completion of MMT Assignment Agreement transaction, ThaiLin immediately converted the MMT Notes into common shares of ChipMOS BVI and purchased all of the remaining common shares of ChipMOS BVI from Jesper, with ChipMOS BVI becoming a wholly-owned subsidiary of ThaiLin. The MMT Assignment Agreement was completed on October 3, 2011. In November 2015, ChipMOS BVI’s shareholder approved the change of name to ChipMOS TECHNOLOGIES (BVI) LTD. and was completed on November 18, 2015.
On November 30, 2016, ChipMOS BVI entered into the Equity Interest Transfer Agreements with Unigroup Guowei and other strategic investors. Under the agreements, ChipMOS BVI would sell 54.98% of the equity interests of ChipMOS Shanghai, to the strategic investors. Following the transaction which was completed in March 2017, Unigroup Guowei holds 48% equity interests of ChipMOS Shanghai, the other strategic investors, including a limited partnership owned by ChipMOS Shanghai’s employees, own approximately 6.98% equity interest of ChipMOS Shanghai, and ChipMOS BVI holds 45.02% equity interests of ChipMOS Shanghai. ChipMOS Shanghai is no longer the subsidiary of the Company. ChipMOS BVI and the strategic investors agreed to further invest RMB 1,074 million into ChipMOS Shanghai. The further investment was completed in two tranches, one in July 2017 at RMB 687 million and one in February 2018 at RMB 387 million.
ThaiLin Semiconductor Corp. ThaiLin was incorporated in Taiwan in May 1996, and was listed on the Taipei Exchange in Taiwan. It is engaged in the provision of semiconductor testing services. The Company acquired a 41.8% interest in ThaiLin in December 2002. Under applicable accounting principles, ThaiLin was consolidated into our consolidated financial statements in 2003 because the Company was deemed to exert significant control over ThaiLin through common directors and management. ThaiLin was merged with and into the Company on June 17, 2015.
ChipMOS U.S.A., Inc. ChipMOS USA was incorporated in the United States of America in October 1999. It engages in sales and customer services and all the expenses incurred from these activities are charged to current income. ChipMOS USA began generating revenue in 2001. As of December 31, 2017, ChipMOS Taiwan owned 100% of the outstanding shares of ChipMOS USA.
23
Table of Contents
Industry Background
We provide a broad range of back-end assembly and test services. Test services include engineering test, wafer probing and final test of memory and logic/mixed-signal semiconductors. We also offer a broad selection of leadframe- and organic substrate-based package assembly services for memory and logic/mixed-signal semiconductors. Our advanced leadframe-based packages include thin small outline packages, or TSOPs, and our advanced organic substrate-based packages include fine-pitch ball grid array packages (“fine-pitch BGA”). In addition, we provide gold bumping, reel to reel assembly and test services for LCD and other flat-panel display driver semiconductors by employing TCP, COF and COG technologies.
Semiconductors tested and assembled by us are used in personal computers, graphics applications such as game consoles communications equipment mobile products such as cellular handsets, tablets, consumer electronic products automotive/industry and display applications such as flat-panel displays. In 2017, 26.9% of our revenue was derived from testing services for memory and logic/mixed-signal semiconductors, 29.4% from assembly services for memory and logic/mixed-signal semiconductors, 26.7% from LCD and other flat-panel display driver semiconductor assembly and test services and 17.0% from bumping services for semiconductors, respectively.
Semiconductor Industry Trends
Growth in the semiconductor industry is largely driven by end-user demand for consumer electronics, communications equipment and computers, for which semiconductors are critical components. The worldwide semiconductor industry has experienced peaks and troughs over the last decade, with a severe downturn at the end of 2000 that was followed by a modest recovery in late 2002. Beginning in the fourth quarter of 2008, the semiconductor industry commenced another downturn that increased in unprecedented severity into the first quarter of 2009. The overall semiconductor industry commenced to recover from the downturn in the second quarter of 2009 and is in a steady growth mode.
Selected Key Semiconductor Markets
While a recovery trend in end-user demand for new and improved electronic products and applications continues, various sectors of the semiconductor industry are in turn expected to benefit from a resumption in growth. These sectors include the memory semiconductor market for industrial, mobile and automotive applications, and the LCD and other flat-panel display driver semiconductor market.
Memory Semiconductor Market
The potential for memory market growth is linked to anticipated memory content increases in consumer electronics, industrial, and PC applications (after such time as a recovery occurs in end-user demand for these) due to increasing operating system requirements, increasing use of graphics in gaming and other applications, continued growth of broadband content and a transition to 64-bit PC architecture. The memory market is dominated by two segments-DRAM and flash memory. Potential growth in the DRAM market is expected to be driven by continued growth in both the commodity and niche DRAM market, as well as growth opportunities in mobile DRAM as memory requirements significantly increase for mobile applications. Flash memory market potential growth is expected to be driven by increasing memory requirements for cellular handsets, digital cameras, digital audio/video, server and other mobile applications, and new application demand of NOR flash for automotive/industry, OLED panel and touch with display driver integration (TDDI).
LCD and Other Flat-Panel Display Driver Semiconductor Market
Flat-panel displays are used in applications such as PC monitors, notebook computers, tables, television sets, cellular handsets and digital cameras. The end-user demand for LCD and other flat-panel display driver semiconductors experienced a downturn in 2007 and 2008. The LCD driver market started to recover in the second quarter of 2009. During second half of 2015, we were experiencing inventory corrections of certain market segments. Driven by demand from mobile devices, high resolution (4K/UHD) TVs, TDDI, 12” fine pitch COF for full screen/18:9 screen of new smartphone and OLED implementation, market growth continues.
Logic/Mixed-Signal Semiconductor Market
The communications market is one of the main drivers of potential growth in the semiconductor industry. Logic/mixed-signal semiconductors, which are chips with analog functionality covering more than half of the chip area, are largely used in the communications market. The increasing use of digital technology in communications equipment requires chips with both digital and analog functionality for applications such as modems, network routers, switches, cable set-top boxes and cellular handsets. As the size and cost of cellular handsets and other communications-related devices have decreased, components have increased in complexity. Logic/mixed-signal semiconductors, such as LCD controller, power devices, fingerprint sensors and MEMS products, TV scaler and DVD controllers, are also used in consumer electronic products.
24
Table of Contents
Overview of the Semiconductor Manufacturing Process
The manufacturing of semiconductors is a complex process that requires increasingly sophisticated engineering and manufacturing expertise. The manufacturing process may be broadly divided into the following stages:
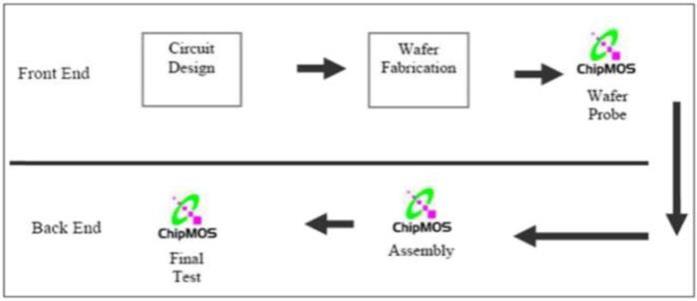
|
Process |
Description |
|
| Circuit Design | The design of a semiconductor is developed by laying out circuit patterns and interconnections. | |
| Wafer Fabrication | Wafer fabrication begins with the generation of a photomask, a photographic negative onto which a circuit design pattern is etched or transferred by an electron beam or laser beam writer. Each completed wafer contains many fabricated chips, each known as a die. | |
| Wafer Probe | Each individual die is then electrically tested, or probed, for defects. Dies that fail this test are discarded, or, in some cases, salvaged using laser repair. | |
| Assembly | The assembly of semiconductors serves to protect the die, facilitates its integration into electronic systems and enables the dissipation of heat. The process begins with the dicing of the wafers into chips. Each die is affixed to a leadframe-based or organic substrate-based substrate. Then, electrical connections are formed, in many cases by connecting the terminals on the die to the inner leads of the package using fine metal wires. Finally, each chip is encapsulated for protection, usually in a molded epoxy enclosure. | |
| Final Test | Assembled semiconductors are tested to ensure that the device meets performance specifications. Testing takes place on specialized equipment using software customized for each application. For memory semiconductors, this process also includes “burn-in” testing to screen out defective devices by applying very high temperatures and voltages onto the memory device. | |
Outsourcing Trends in Semiconductor Manufacturing
Historically, integrated device manufacturers (“IDMs”), designed, manufactured, tested and assembled semiconductors primarily at their own facilities. In recent years, there has been a trend in the industry to outsource various segments of stages in the manufacturing process to reduce the high fixed costs resulting from the increasingly complex manufacturing process. Virtually every significant stage of the manufacturing process can be outsourced. The independent semiconductor manufacturing services market currently consists of wafer fabrication and probing services and semiconductor assembly and test services. Most of the world’s major IDMs now use some independent semiconductor manufacturing services to maintain a strategic mix of internal and external manufacturing capacity. Many of these IDMs are continuously significantly reducing their investments in new semiconductor assembly and test facilities.
25
Table of Contents
The availability of technologically advanced independent semiconductor manufacturing services has also enabled the growth of “fabless” semiconductor companies that focus exclusively on semiconductor design and marketing and outsource their fabrication, assembly and test requirements to independent companies.
We believe the outsourcing of semiconductor manufacturing services, and in particular of assembly and test services, will increase for many reasons, including the following:
Significant Capital Expenditure Requirements. Driven by increasingly sophisticated technological requirements, wafer fabrication, assembly and test processes have become highly complex, requiring substantial investment in specialized equipment and facilities and sophisticated engineering and manufacturing expertise. In addition, product life cycles have been shortened magnifying the need to continuously upgrade or replace manufacturing, assembly and test equipment to accommodate new products. As a result, new investments in in-house fabrication, assembly and test facilities are becoming less desirable for IDMs because of the high investment costs, as well as difficulties in achieving sufficient economies of scale and utilization rates to be competitive with the independent service providers. On the contrary, independent foundry, assembly and test companies are able to realize the benefits of specialization and achieve economies of scale by providing services to a large customer base across a wide range of products. This enables them to reduce costs and shorten production cycles through high capacity utilization and process expertise.
Increasing Focus on Core Competencies. As the costs of semiconductor manufacturing facilities increase, semiconductor companies are expected to further outsource their wafer fabrication, assembly and test requirements to focus their resources on core competencies, such as semiconductor design and marketing.
Time-to-Market Pressure. Increasingly short product life cycles have amplified time-to-market pressure for semiconductor companies, leading them to rely increasingly on independent companies as a key source for effective wafer fabrication, assembly and test services.
Semiconductor Assembly and Test Services Industry
Growth in the semiconductor assembly and test services industry is driven by increased outsourcing of the various stages of the semiconductor manufacturing process by IDMs and fabless semiconductor companies.
The Semiconductor Industry and Conditions of Outsourcing in Taiwan and Mainland China
Taiwan is one of the world’s leading locations for outsourced semiconductor manufacturing. The semiconductor industry supply chain in Taiwan has developed such that the various stages of the semiconductor manufacturing process have been disaggregated, thus allowing for specialization. The disaggregation of the semiconductor manufacturing process in Taiwan permits these semiconductor manufacturing service providers to focus on particular parts of the production process, develop economies of scale, maintain higher capacity utilization rates and remain flexible in responding to customer needs by lowering time-to-market pressure faced by semiconductor companies. There are several leading service providers in Taiwan, each of which offers substantial capacity, high-quality manufacturing, leading semiconductor wafer fabrication, test, assembly and process technologies, and a full range of services. These service providers have access to an educated labor pool and a large number of engineers suitable for sophisticated manufacturing industries. As a result, many of the world’s leading semiconductor companies outsource some or all of their semiconductor manufacturing needs to Taiwan’s semiconductor manufacturing service providers and take advantage of the close proximity among facilities in the supply chain. In addition, companies located in Taiwan are very active in the design and manufacture of electronic systems, which has created significant local demand for semiconductor devices.
Recently, Mainland China has emerged as an attractive location for outsourced semiconductor manufacturing based on the fact. Companies can take advantage of strongly supports by Mainland China government to accelerate the development of the semiconductor industry and a large domestic market. These factors have driven increased relocation of much of the electronics industry manufacturing and supply chain to Mainland China. An increasing number of global electronic systems manufacturers and contract manufacturers are relocating or have relocated production facilities to Mainland China. We believe that these electronic product manufacturers and contract manufacturers will source an increasing portion of their demand for semiconductors from semiconductor suppliers located in Mainland China in order to reduce production cycle times, decrease costs, simplify supply chain logistics and meet local content requirements. In line with this trend, we have in recent years invested in Mainland China.
26
Table of Contents
Our Strategy
Our goal is to reinforce our position as a leading independent provider of semiconductor assembly and test services, concentrating principally on memory, logic/mixed-signal and LCD and other flat-panel display driver semiconductors. The principal components of our business strategy are set forth below.
Focus on Providing Our Services to Potential Growth Segments of the Semiconductor Industry.
We intend to continue our focus on developing and providing advanced assembly and test services for potential growth segments of the semiconductor industry, such as memory, logic/mixed-signal, MEMS, LCD and other flat-panel display driver semiconductors and bumping services. We believe that our investments in equipment and research and development in some of these areas allow us to offer a service differentiated from that of our competition. In order to benefit from the expected resumption of growth in these segments, we intend to continue to invest in capacity to meet the assembly and test requirements of these key semiconductor market segments.
Continue to Invest in the Research and Development of Advanced Assembly and Test Technologies.
Critical to our business growth is the continuation to expand our capabilities in testing and assembly and integrate wafer bumping and assembly core technologies to provide turn-key total solution service to our customers. We typically focus on advanced technologies that consist of greater potentials to generate higher margins. For example, we conducted new product introductions and on an on-going basis continue to expand our capabilities in fine-pitch wafer bumping, multi-chip package (“MCP”), flip chip package, and high speed assembly and test of fine-pitch COFs. We have also introduced low cost metal composite bump (“MCB”) products based on our proprietary Cu plating technology to service flat-panel display market and expand offerings to other business regions. We continue to maintain close working relationships with local and overseas research institutions and universities to keep abreast with leading edge technologies and broaden the scope of applications.
In 2018, we expect to focus our research and development efforts in the following areas:
| • | development of advanced assembly technologies in WLCSP, MEMS, finger print sensors, and flip chip products for memory devices and mixed signal products; |
| • | expand fine-pitch Au and Cu bumping technology for 300mm wafers; |
| • | expand fine-pitch test capabilities for advanced LCD drivers; |
| • | carry out in-process improvement to improve manufacturing yields and shorten turnaround time; |
| • | develop new software conversion programs to increase the capabilities of our testers; and |
| • | continue to focus on delivering environmentally friendly assembly services by eliminating lead and halogen elements from the materials. |
In 2017, we spent approximately 5.5% of our revenue on research and development. We will continue to invest our resources to recruit and retain experienced research and development personnel. As of March 31, 2018, our research and development team comprised 668 persons.
Build on Our Strong Presence in Taiwan and Strong Industrial Position Outside Taiwan.
We intend to build on our strong presence in key centers of semiconductor and electronics manufacturing to grow our business. Currently, most of our operations are in Taiwan, one of the world’s leading locations for outsourced semiconductor manufacturing. This presence provides us with several advantages. Firstly, our proximity to other semiconductor companies is attractive to customers who wish to outsource various stages of the semiconductor manufacturing process. Secondly, our proximity to many of our suppliers, customers and the end-users of our customers’ products enables us to be involved in the early stages of the semiconductor design process, enhances our ability to quickly respond to our customers’ changing requirements and shortens our customers’ time-to-market. Thirdly, we have access to an educated labor pool and a large number of engineers who are able to work closely with our customers and other providers of semiconductor manufacturing services.
We believe that we are strategically positioned to capture the growth opportunities of the semiconductor market in Mainland China by joint venture with Tsinghua Unigroup to ChipMOS Shanghai.
Depending on customer’s demands, market conditions and other relevant considerations, we may from time to time look into other opportunities to expand our operations outside of Taiwan.
27
Table of Contents
Expand Our Offering of Vertically Integrated Services.
We believe that one of our competitive strengths is our ability to provide vertically integrated services to our customers. Vertically integrated services consist of the integrated testing, assembly and direct shipment of semiconductors to end-users designated by our customers. Providing vertically integrated services enables us to shorten lead times for our customers. As time-to-market and cost increasingly become sources of competitive advantage for our customers, they increasingly value our ability to provide them with comprehensive back-end services.
We are able to offer vertically integrated services for a broad range of products, including memory, logic/mixed-signal and LCD and other flat-panel display driver semiconductors. These services offerings include complementary technologies, products and services as well as additional capacity. We believe that these will continue to enhance our own development and expansion efforts into new and potential growth markets. We intend to establish new alliances with leading companies and, if suitable opportunities arise, engage in merger and acquisition activities that will further expand the services we can provide.
Focus on Increasing Sales through Long-Term Agreements with Key Customers as well as Business with Smaller Customers.
From time to time, we strategically agree to commit a portion of our assembly and test capacity to certain of our customers. We intend to continue focus on increasing sales to key customers through long-term capacity agreements. The customers with which we entered long-term agreements include a reputable memory customer based in the US. See “—Customers” below for a more detailed discussion of these long-term agreements.
Global market and economic conditions have been unprecedented and challenging with tight credit conditions and recession in most major economies since 2008 continuing into 2011. Beginning in 2008, we also resumed our focus on our business with smaller customers or customers who do not place orders on a regular basis. We believe that the dual focused strategy will assist us to be better prepared for the current economic volatility and ensure maximum utilization rate of our capacity and help us to develop closer relationships with all types of our customers.
Principal Products and Services
The following table presents, for the periods shown, revenue by service segment as a percentage of our revenue.
| Year ended December 31, | ||||||||
| 2016 | 2017 | |||||||
|
Testing |
||||||||
|
Memory testing revenue |
19.7 | % | 22.1 | % | ||||
|
Logic/mixed-signal testing revenue |
5.3 | 4.8 | ||||||
|
Total testing revenue |
25.0 | 26.9 | ||||||
|
Assembly |
||||||||
|
Memory assembly revenue |
28.7 | 24.3 | ||||||
|
Logic/mixed-signal assembly revenue |
3.2 | 5.1 | ||||||
|
Total assembly revenue |
31.9 | 29.4 | ||||||
|
LCD and other flat-panel display driver semiconductor testing and assembly revenue |
26.8 | 26.7 | ||||||
|
Bumping |
16.3 | 17.0 | ||||||
|
|
|
|
|
|||||
|
Total revenue |
100.0 | % | 100.0 | % | ||||
|
|
|
|
|
|||||
28
Table of Contents
Memory and Logic/Mixed-Signal Semiconductors
Testing
We provide testing services for memory and logic/mixed-signal semiconductors:
Memory. We provide testing services for a variety of memory semiconductors, such as SRAM, DRAM and Flash memory. To speed up the time-consuming process of memory product testing, we provide parallel test, which includes to complete wafer test in one touchdown (up to 1,000 plus devices simultaneously). The memory semiconductors we test are used primarily in desktop computers, laptop, tablet computers, handheld consumer electronic, devices and wireless communication devices.
Logic/Mixed-Signal. We conduct tests on a wide variety of logic/mixed-signal semiconductors, with lead counts ranging from the single digits to over 1024 and data rate of up to 9GHz. The semiconductors we test include audio/video codec, networking/communications, MCU, LCD related, and MEMS used for home entertainment/media center, personal computer applications, network/communication and mobile smart devices. We also test a variety of application specific integrated circuits (“ASICs”), for applications such as FHD/UHD LCD TV, Tablet PC, etc.
The following is a description of our pre-assembly testing services:
Engineering Testing. We provide engineering testing services, including software program development, electrical design validation, reliability and failure analysis.
| • | Software Program Development Design and test engineers develop a customized software program and related hardware to test semiconductors on advanced test equipment. A customized software program is required to test the conformity of each particular semiconductor to its particular function and specification. |
| • | Electrical Design Validation. A prototype of the designed semiconductor is submitted to electrical tests using advanced test equipment, customized software programs and related hardware. These tests assess whether the test result of the prototype semiconductor complies with the designed requirements using a variety of different operating specifications, including functionality, frequency, voltage, current, timing and temperature range. |
| • | Reliability Analysis. Reliability analysis is designed to assess the long-term reliability of the semiconductor and its suitability of use for its intended applications. Reliability testing may include operating-life evaluation, during which the semiconductor is subjected to high temperature and voltage tests. |
| • | Failure Analysis. If the prototype semiconductor does not perform to specifications during either the electrical validation or reliability analysis process, failure analysis is performed to determine the reasons for the failure. As part of this analysis, the prototype semiconductor may be subjected to a variety of tests, including electron beam probing and electrical testing. |
Wafer Probing. Wafer probing is the process stage immediately before the assembly of semiconductors and involves visual inspection and the electrical testing of the processed wafer to ensure that it meets our customers’ specifications. Wafer probing employs sophisticated design and manufacturing technologies to connect the terminals of each chip for testing. Defective chips are marked on the surface or memorized in an electronic file, known as a mapping file, to facilitate subsequent process.
Laser Repairing. This is a unique process in testing operation for special SOC memory products. In laser repairing, specific poly or metal fuses are blown after wafer probing to enable a spare row or column of a memory unit in SOC to replace a defective memory cell.
29
Table of Contents
After assembly, we perform the following testing services:
Burn-In Testing. This process screens out unreliable products using high temperature, high voltage and prolonged stresses environment to ensure that finished products will survive a long period of end-user service. This process is used only for memory products. This process needs customized Burn-In board.
Top Marking . By using either a laser marker or an ink marker, we mark products without heat slug according to our customers’ specification, including the logo, part number, date code and lot number.
Final Testing. Assembled semiconductors are tested to ensure that the devices meet performance specifications. Tests are conducted using specialized equipment with software customized for each application in different temperature conditions ranging from 25 degrees Celsius to 125 degrees Celsius.
Final Inspection and Packing. Final inspection involves visual or auto-inspection of the devices to check any bent leads, ball damage, inaccurate markings or other package defects. Packing involves dry packing, package-in-tray, package-in-tube and tape and reel. According to package level, Dry packing involves heating semiconductors in a tray at 125 to 150 degrees Celsius for about eight to twelve hours to remove the moisture before the semiconductors are vacuum-sealed in an aluminum bag. Package-in-tube involves packing the semiconductors in anti-static tubes for shipment. Tape and reel pack involves transferring semiconductors from a tray or tube onto an anti-static embossed tape and rolling the tape onto a reel for shipment to customers.
Assembly
Our assembly services generally involve the following steps:
| Wafer Lapping | The wafers are ground to their required thickness. | |
| Die Saw | Wafers are cut into individual dies, or chips, in preparation for the die-attach process. | |
| Die Attach | Each individual die is attached to the leadframe or organic substrate. | |
| Wire Bonding | Using gold or silver wires, to connect the I/O pads on the die to the inner lead of leadframe or substrate. | |
| Flip Chip Bonding | Using solder bumps or Cu pillar bumps on die, to connect the leadframe or substrate pad via soldering reflow. | |
| Molding | The die and wires are encapsulated to provide physical support and protection. | |
| Marking | Each individual package is marked to provide product identification. | |
| Dejunking and Trimming | Mold flash is removed from between the lead shoulders through dejunking, and the dambar is cut during the trimming process. | |
| Electrical Plating | A solderable coating is added to the package leads to prevent oxidization and to keep solder wettability of the package leads. | |
| Ball Mount and Reflow | Each electrode pad of the substrate is first printed with flux, after which solder balls are mounted, heated and attached to the electrode pad of the substrate through a reflow oven. | |
| Forming/Singulation | Forming involves the proper configuration of the device packages leads, and singulation separates the packages from each other. | |
30
Table of Contents
We offer a broad range of package formats designed to provide our customers with a broad array of assembly services. The assembly services we offer customers are leadframe-based packages, which include thin small outline packages, and organic substrate-based packages, including fine-pitch BGA.
The differentiating characteristics of these packages include:
| • | the size of the package; |
| • | the number of electrical connections which the package can support; |
| • | the electrical performance and requirements of the package; and |
| • | the heat dissipation requirements of the package. |
As new applications for semiconductor devices require smaller components, the size of packages has also decreased. In leading-edge packages, the size of the package is reduced to just slightly larger than the size of the individual chip itself in a process known as chip scale packaging.
As semiconductor devices increase in complexity, the number of electrical connections required also increases. Leadframe-based products have electrical connections from the semiconductor device to the electronic product through leads on the perimeter of the package. Organic substrate-based products have solder balls on the bottom of the package, which create the electrical connections with the product and can support large numbers of electrical connections.
Leadframe-Based Packages. These are generally considered the most widely used package category. Each package consists of a semiconductor chip encapsulated in a plastic molding compound with metal leads on the perimeter. This design has evolved from a design plugging the leads into holes on the circuit board to a design soldering the leads to the surface of the circuit board.
The following diagram presents the basic components of a standard leadframe-based package for memory semiconductors:
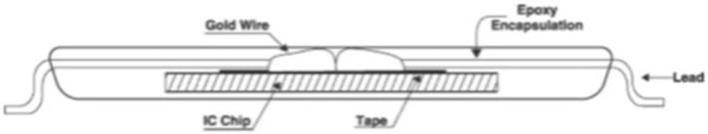
To address the market for miniaturization of portable electronic products, we are currently developing and will continue to develop increasingly smaller versions of leadframe-based packages to keep pace with continually shrinking semiconductor device sizes. Our advanced leadframe-based packages generally are thinner and smaller, have more leads and have advanced thermal and electrical characteristics when compared to traditional packages. As a result of our continual product development, we offer leadframe-based packages with a wide range of lead counts and sizes to satisfy our customers’ requirements.
31
Table of Contents
The following table presents our principal leadframe-based packages, including the number of leads in each package, commonly known as lead-count, a description of each package and the end-user applications of each package.
|
Package |
Lead-count |
Description |
End-User Applications |
|||
| Plastic Leaded Chip Carrier (PLCC) | 32-44 |
Package with leads on four sides used in consumer electronics products in which the size of the package is not vital |
Copiers, printers, scanners, personal computers, electronic games, monitors | |||
| Plastic Dual-in-line Package (PDIP) | 16-56 | Package with insertion leads on longer sides used in consumer electronics products | Electronic games, monitors, copiers, printers, audio and video products, personal computers | |||
| Thin Small Outline Package I (TSOP I) | 28-56 |
Designed for high volume production of low lead-count memory devices, including flash memory, SRAM and MROM |
Notebook computers, personal computers, still and video cameras and standard connections for peripherals for computers | |||
| Thin Small Outline Package II (TSOP II) | 24-86 | Designed for memory devices, including flash memory, SRAM, SDRAM and DDR DRAM | Disk drives, recordable optical disk drives, audio and video products, consumer electronics, communication products | |||
| Quad Flat Package (QFP) | 44-208 | Flat structure with 4-sided peripheral leads designed for SRAM, graphic processors, personal computer chipsets and mixed-signal devices | Wireless communication products, notebook computers, personal computers, consumer electronics | |||
| Quad Flat No Lead (QFN) | 8-132 | Thermal enhanced quad flat no lead package providing small footprint (chip scale), light weight with good thermal and electrical performance | Wireless communication products, notebook computers, PDAs, consumer electronics | |||
| Low-Profile Quad Flat Package (LQFP) | 48-128 | Low-profile and light weight package designed for ASICs, digital signal processors, microprocessors/ controllers, graphics processors, gate arrays, SSRAM, SDRAM, personal computer chipsets and mixed-signal devices | Wireless communication products, notebook computers, digital cameras, cordless/radio frequency devices | |||
| Thin Quad Flat Package (TQFP) | 44-128 | Designed for lightweight portable electronics requiring broad performance characteristics and mixed-signal devices | Notebook computers, personal computers, disk drives, office equipment, audio and video products and wireless communication products | |||
| Small Outline Package (SOP) | 8 | Designed for low lead-count memory and logic semiconductors, including SRAM and micro-controller units | Personal computers, consumer electronics, audio and video products, communication products | |||
| Multi-Chip Package (TSOP with organic substrate) | 24-86 | Our patented design for memory devices, including SRAM, DRAM and SDRAM | Notebook computers, personal computers, disk drives, audio and video products, consumer products, communication products | |||
| Flip Chip Quad Flat No Lead (FCQFN) | 6-24 |
Thermal enhanced quad flat no lead package providing small footprint (chip scale), light weight with good thermal and electrical performance Flip chip process is designed for better electrical performance compared to wire bonding process |
Wireless communication products, notebook computers, PDAs, consumer electronics | |||
32
Table of Contents
Organic Substrate-based Packages. As the number of leads surrounding a traditional leadframe-based package increases, the leads must be placed closer together to reduce the size of the package. The close proximity of one lead to another can create electrical shorting problems and requires the development of increasingly sophisticated and expensive techniques to accommodate the high number of leads on the circuit boards.
The BGA format solves this problem by effectively creating external terminals on the bottom of the package in the form of small bumps or balls. These balls are evenly distributed across the entire bottom surface of the package, allowing greater pitch between the individual terminals. The ball grid array configuration enables high-pin count devices to be manufactured less expensively with less delicate handling at installation.
Our organic substrate-based packages employ a fine-pitch BGA design, which uses a plastic or tape laminate rather than a leadframe and places the electrical connections, or leads, on the bottom of the package rather than around the perimeter. The fine-pitch BGA format was developed to address the need for the smaller footprints required by advanced memory devices. Benefits of ball grid array assembly over leadframe-based assembly include:
| • | smaller size; |
| • | smaller footprint on a printed circuit board; |
| • | better electrical signal integrity; and |
| • | easier attachment to a printed circuit board. |
The following diagram presents the basic component parts of a fine-pitch BGA package:
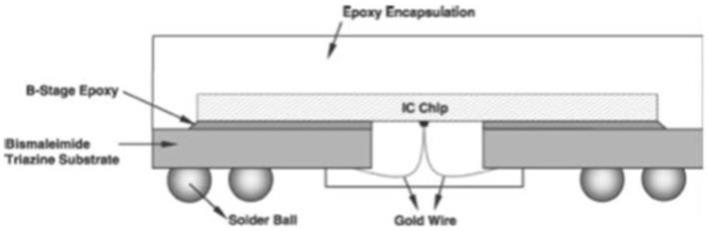
33
Table of Contents
The following table presents the ball-count, description and end-user applications of organic substrate-based packages we currently assemble:
|
Package |
Connections |
Description |
End-User Applications |
|||
| Mini BGA | 24-400 | Low-cost and space-saving assembly designed for low input/output count, suitable for semiconductors that require a smaller package size than standard BGA | Memory, analog, flash memory, ASICs, radio frequency devices, personal digital assistants, cellular handsets, communication products, notebook computers, wireless systems | |||
| Fine-Pitch BGA | 54-126 | Our patented design for DRAM products that require high performance and chip scale package (CSP) | Notebook computers, cellular handsets, global positioning systems, personal digital assistants, wireless systems | |||
| Very Thin Fine-Pitch BGA | 48-176 | Similar structure of Mini BGA package with thinner and finer ball pitch that is designed for use in a wide variety of applications requiring small size, high reliability and low unit cost | Handheld devices, notebook computers, disk drives, wireless and mobile communication products | |||
| Land Grid Array (LGA) | 10-52 | Thinner and lighter assembly designed essential to standard BGA without solder balls, suitable for applications that require high electrical performance | Disk drives, memory controllers, wireless, mobile communication products | |||
| Multi-Chip BGA | 48-137 | Designed for assembly of two or more memory chips (to increase memory density) or combinations of memory and logic chips in one BGA package | Notebook computers, digital cameras, personal digital assistants, global positioning systems, sub-notebooks, board processors, wireless systems | |||
| Stacked-Chip BGA | 24-162 | Designed for assembly of two or more memory chips or logic and memory chips in one CSP, reducing the space required for memory chips | Cellular handsets, digital cameras, personal digital assistants, wireless systems, notebook computers, global positioning systems | |||
| Flip Chip Chip-scale Package (FCCSP) | 16-1500+ | Better IC protection and solder joint reliability compared to direct chip attach (DCA) and chip on board (COB) | Memory, logic, microprocessor, application processor (AP), baseband (BB), solid state device, radio frequency (RF) | |||
| Chip on Wafer (CoW) | 5-30 | Integrated two different functional chips to a closer form into a compact package. Low-cost solution compared to through-silicon via (TSV) | Integrated MEMS | |||
|
Land Grid Array (LGA) for FPS
(finger Print Sensor) |
20-52 | Very thin clearance (50um) between chip & compound hard color coating with scratch resistance for protection and appearance matching of mobile devices | Security protection for mobile devices, home, notebook computershares, etc. | |||
| Wafer Level Chip Scale Package (WLCSP) | 6-116 | WLCSP package size is almost the same as die size. Simple assembly process flow, low cost. Small package suitable to apply on hand-held 3C electronic products | Electronic Compass, audio converter, nor flash product, power control, sensor magnetometer, MEMS magnetometer, CMOS Image Sensor controller, Laser diode driver, power manager IC (PMIC) | |||
34
Table of Contents
Wafer Level CSP
Wafer-level CSP (WLCSP) is the technology of packaging an integrated circuit at wafer level. WLCSP is essentially a true chip scale package (CSP) technology, since the resulting package is practically of the same size as the die. WLCSP has the ability to enable true integration of wafer fab, packaging, test, and burn-in at wafer level in order to streamline the manufacturing process undergone by a device start from silicon wafer to customer shipment.
Most other kinds of packaging does wafer dicing first, and then puts the individual die in a plastic package and attaches the solder bumps. WLCSP involves the RDL, wafer solder bumping, while still in the wafer, and then wafer dicing. Benefits of WLCSP compare to general CSP package assembly include:
| • | ultimate smaller package size; |
| • | smaller footprint on a printed circuit board; |
| • | very short circuit connection; and |
| • | cost effective packaging solution for small ICs. |
|
Package |
Connections |
Description |
End-User Applications |
|||
| WLCSP | 4-64 | Very small package size (identical to die size), suitable for the low pin count and require the small package size application | Memory, ASICs, PMIC, MEMS devices, controllers, for mobile phone, tablet, ultra book computer product |
35
Table of Contents
FC CSP
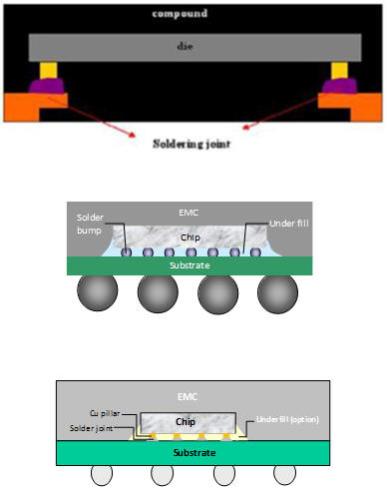
Flip-chip chip scale package (FC CSP) construction utilizes the flip chip bumping (with solder bump or Cu pillar bump) interconnection technology to replace the standard wire-bond interconnect. It allows for a smaller form factor due to wire loop reduction and area array bumping. FC CSP includes the substrate or leadframe type solution making an attractive option for advanced CSP application when electrical performance is a critical factor.
| • | Excellent electrical performance, very low interconnect parasitics and inductance compare to wirebond type. |
| • | High electrical current endurance (Cu pillar bump), ideal for high power solution. |
| • | Smaller package form factor by reducing the wire loop height and wire span compared to conventional wirebond package. |
|
Package |
Connections |
Description |
End-User Applications |
|||
| FC CSP | 8-1120 | Superior electrical performance, smaller form factor | Power device, RF, Logic/Analog device, wireless or portable application |
36
Table of Contents
Display Driver Semiconductors and Gold Bumping
We also offer assembly and test services for display driver semiconductors. We employ TCP, COF and COG technologies for testing and assembling display driver semiconductors. In addition, we offer gold bumping services to our customers.
Tape Carrier Package (TCP) Technology
TCPs offer a high number of inputs and outputs, a thin package profile and a smaller footprint on the circuit board, without compromising performance. Key package features include surface mount technology design, fine-pitch tape format and slide carrier handling. Because of their flexibility and high number of inputs and outputs, TCPs are primarily employed either for STN-LCD or TFT-LCD driver semiconductors.
Testing of TCPs. We conduct full function testing of LCD and other flat-panel display driver semiconductors with a specially designed probe handler to ensure reliable contact to the test pads on the TCP tape. We can test STN-LCD or TFT-LCD driver semiconductors with frequencies of up to 750 MHz and at voltages up to 40V. The test is performed in a temperature-controlled environment with the device in tape form. The assembled and tested LCD and other flat-panel display driver semiconductors in tape form are packed between spacer tapes together with a desiccant in an aluminum bag to avoid contact during shipment.
Assembly of TCPs. TCPs use a tape-automated bonding process to connect die and tape. The printed circuit tape is shipped with a reel. The reel is then placed onto an inner lead bonder, where the LCD or other flat-panel display driver semiconductor is configured onto the printed circuit tape. The resulting TCP component consists of the device interconnected to a three-layer tape, which includes a polyimide carrier film, an epoxy-based adhesive layer and a metal layer. The tape metallization area of the interconnections is tin plated over a metal layer. The silicon chip and inner lead area is encapsulated with a high temperature thermosetting polymer after inner lead bonding. The back face of the chip is left un-sealed for thermal connection to the printed circuit board.
For the limitation of inner lead pitch (>41um) with this kind of package, the volume of TCP nowadays has been trending down to ~1% of total demand.
The following diagram presents the basic components of a TCP:
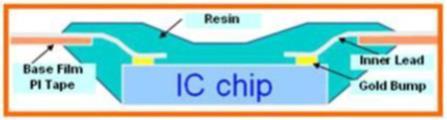
Chip-on-Film (COF) Technology
In 2001, we commenced assembly and test services using COF technology. We have developed this proprietary technology from our existing TCP technology, and it has been widely accepted by our customers. The primary use of the COF module is to replace TCP in certain applications.
COF technology provides several additional advantages. For example, COF is able to meet the size, weight and higher resolution requirements in electronic products, such as flat-panel displays. This is because of its structural design, including an adhesive-free two-layer tape that is highly flexible, bending strength and its capacity to receive finer patterning pitch.
COF package has been using for large-size and high-resolution panel display, especially on TFT-LCD and OLED TV set. In recent years, there has been an observable trend with which the average inner lead pitch of COF package went down to 23um with about 50% of market share. High thermal dissipation packaging technology is available for mass production. And dual IC with high thermal dissipation COF packaging technology is in development for 8K TV market. 18um inner lead pitch of 1-metal layer and 20um inner lead pitch 2-metal layer COF package has been released to mass production for the coming market trend of narrow frame smartphone requirement. And we can test display driver semiconductors with frequencies of up to 4 Gbps to fulfill high speed data rate requirement of semiconductor.
37
Table of Contents
The following diagram presents the basic components of 1-metal layer COF and 2-metal layer COF:
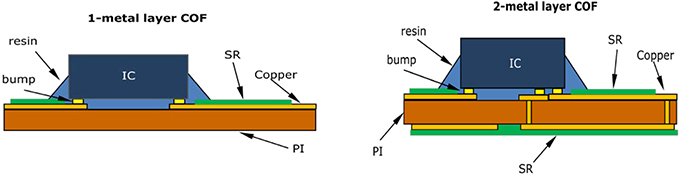
The TCP and COF processes involve the following steps:
| Chip Probing | Screen out the defect chips which fail to meet the device spec. | |
| Wafer Lapping | Wafers are grounded to their required thickness. | |
| Die Saw |
Wafers are cut into individual dies, or chips, in preparation for inner lead bonding process For low-K wafer, laser groove is necessary before mechanical dicing saw. |
|
| Inner Lead Bonding | An inner lead bonder machine connects the chip to the printed circuit tape. | |
| Potting | The package is dispensed a resin to protect the inner lead. | |
| Potting Cure | The potting cure process matures the resin used during the potting oven with high temperatures. | |
| Marking | A laser marker is used to provide product identification. | |
| Final Testing | To verify device spec. within electrical testing after assembly process. | |
| Inspection and Packing | Each individual die with tape is visually or auto inspected for defects. The dies are packed within a reel into an aluminum bag after completion of the inspection process. | |
Chip-on-Glass (COG) Technology
COG technology is an electronic assembly technology that is used in assembling display driver semiconductors including TV/monitor and mobile products. Compared to the traditional bonding process for TCP or COF, the new COG technology requires lower bonding temperature. In addition, the COG technology reduces assembly cost as it does not use tapes for interconnection between the LCD panel and the printed circuit board. The major application of COG products is on TFT-LCD and AMOLED display of smart phone market, it integrates source, gate driver of display driver IC (DDIC) and TDDI or timing Controller IC into one chip, so the output channel is larger than TCP or COF products. For the market trend of thinner smartphone, 150um in IC thickness is released for mass production and more thinner IC thickness is in development.
The COG assembly technology involves the following steps:
| Chip Probing | To screen out the defect chips which fail to meet the device spec. | |
| Wafer Lapping/ polish | Wafers are ground or with polished to their required thickness. | |
| Laser Marking | A laser mark is applied on IC backside in wafer form to provide product traceability. | |
| Laser Grooving | Application in wafer within Low-K material to reduce chipping of chips during dicing process. | |
| Die Saw | Wafers are cut into individual dies, or chips, in preparation for the pick and place process. | |
| Auto Optical Inspection | Process of wafer inspection is detecting defect to separate chips at pick and place station. | |
| Pick and Place | Each individual die is picked and placed into a chip tray. | |
| Inspection and Packing | Each individual die in a tray is visually or auto-inspected for defects. The dies are packed within a tray into an aluminum bag after completion of the inspection process. | |
38
Table of Contents
Bumping
We also offer bumping services to our customers.
Based on the major product portfolio (judged by internal metal composition), we provide:
| • | Gold Family (Pure Au bump, Au metal composite bump and Au RDL) |
Gold bumping technology, which can be used in TCP, COF and other specific. Au wire assembly process is a necessary interconnection technology for LCD and other flat-panel display driver semiconductors. Most gold bumping services are performed on eight or twelve-inches wafers. Gold bumping technology provides the best solution for fine-pitch chips and is able to meet the highly efficient production requirement for LCD and other flat-panel display (for example, LED and OLED) driver semiconductors or other chips that require thin packaging profiles.
| • | Cu/Solder Family (Cu RDL, WLCSP, Solder and Cu Pillar) |
Lots of logical device have applied Cu RDL, WLCSP, Solder and Cu Pillar service for their FC CSP and/or QFN package and other wafer level package (Fan-in, Fan-out, 2.5D & 3DIC). The product scope includes but is not limited to flash, power devices and MEMS.
Both of above two portfolios which fabrication process uses thin film metal deposition, photolighography for both pattern transfer of Photoresist and PI/PBO and electrical plating technologies (WLCSP have extra ball drop procee). A series of barrier and seed metal layers are deposited over the surface of the wafer. A layer of thick photoresist material is spin-coated over these barrier and seed layers. A photomask is used to pattern the locations over each of the bond pads that will be bumped. Broadband spectrum exposure and developing processes open the photoresist material, same as permanent layers (PI/PBO) which defines the bump shape, PI/PBO open size & shape. Both portfolios are then electroplated over the pad and the deposited barrier metal layers. Once the plating is complete, a series of etching steps are used to remove the photoresist material and the metal layers that are covering the rest of the wafer. All of plating structure (Au, Au metal composite bump, RDL, Solder & Cu Pillar) protects the underlying materials from being etched. The gold bumped wafers will go through an annealing furnace to soften the gold bumps to fit the hardness requirement of TCP, COF and COG assembly processes. Other PI/PBO included process need specific thermal process for better dielectric layer cross-linking to strength the film.
Other Services
Drop Shipment
We offer drop shipment of semiconductors directly to end-users designated by our customers. We provide drop shipment services, including assembly in customer-approved and branded boxes, to a majority of our assembly and test customers. Since drop shipment eliminates the additional step of inspection by the customer prior to shipment to end-users, quality of service is a key to successful drop shipment service. We believe that our ability to successfully execute our full range of services, including drop shipment services, is an important factor in maintaining existing customers as well as attracting new customers.
Software Development, Conversion and Optimization Program
We work closely with our customers to provide sophisticated software engineering services, including test program development, conversion and optimization, and related hardware design. Generally, testing requires customized testing software and related hardware to be developed for each particular product. Software is often initially provided by the customer and then converted by us at our facilities for use on one or more of our testing machines and contains varying functionality depending on the specified testing procedures. Once a conversion test program has been developed, we perform correlation and trial tests on the semiconductors.
Customer feedback on the test results enables us to adjust the conversion test programs prior to actual testing. We also typically assist our customers in collecting and analyzing the test results and recommends engineering solutions to improve their design and production process.
39
Table of Contents
Customers
We believe that the following factors have been, and will continue to be, important factors in attracting and retaining customers:
| • | our advanced assembly and test technologies; |
| • | our strong capabilities in testing and assembling DDIC/TDDI and other flat-panel display driver semiconductors; |
| • | our focus on high-density memory products and logic/mixed-signal communications products; and |
| • | our reputation for high quality and reliable customer-focused services. |
The number of our customers as of March 31 of 2016, 2017 and 2018, respectively, was 77, 74 and 78. Our top 15 customers in terms of revenue in 2017 were (in alphabetical order):
Asahi Kasei Microdevices Corporation
Elite Semiconductor Memory Technology Inc.
Etron Technology, Inc.
FocalTech Systems Co., Ltd.
Himax Technologies, Inc.
LAPIS Semiconductor Co., Ltd.
Integrated Circuit Solution Inc.
Mstar Semiconductor, Inc.
Macronix International Co., Ltd.
Micron Technology, Inc.
Novatek Microelectronics Corp.
Raydium Semiconductor Corporation
Synaptics Display Devices GK
Winbond Electronics Corporation
Zentel Electronics Corp.
In 2016, our top three customers accounted for approximately 18%, 17% and 14% of our revenue, respectively. In 2017, our top three customers accounted for approximately 19%, 15% and 10% of our revenue, respectively.
The majority of our customers purchase our services through purchase orders and provide us three-month non-binding rolling forecasts on a monthly basis. The price for our services is typically agreed upon at the time when a purchase order is placed.
Since 2008, we have also focused on our business with smaller customers and customers who do not place orders on a regular basis.
The following table sets forth, for the periods indicated, the percentage breakdown of our revenue, categorized by geographic region based on the jurisdiction in which each customer is headquartered.
| Year ended December 31, | ||||||||
| 2016 | 2017 | |||||||
|
Taiwan |
69 | % | 73 | % | ||||
|
Japan |
10 | 13 | ||||||
|
Singapore |
17 | 10 | ||||||
|
Others |
4 | 4 | ||||||
|
|
|
|
|
|
|
|||
|
Total |
100 | % | 100 | % | ||||
|
|
|
|
|
|
|
|||
40
Table of Contents
Qualification and Correlation by Customers
Our customers generally require that our facilities undergo a stringent “qualification” process during which the customer evaluates our operations, production processes and product reliability, including engineering, delivery control and testing capabilities. The qualification process typically takes up to eight weeks, or longer, depending on the requirements of the customer. For test qualification, after we have been qualified by a customer and before the customer delivers semiconductors to us for testing in volume, a process known as “correlation” is undertaken. During the correlation process, the customer provides us with test criteria; information regarding process flow and sample semiconductors to be tested and either provides us with the test program or requests that we develop a new or conversion program. In some cases, the customer also provides us with a data log of results of any testing of the semiconductor that the customer may have conducted previously. The correlation process typically takes up to two weeks, but can take longer depending on the requirements of the customer.
Sales and Marketing
We maintain sales and marketing offices in Taiwan and the United States. Our sales and marketing strategy is to focus on memory semiconductors in Taiwan, Japan, Korea and the United States, logic/mixed-signal semiconductors in Taiwan, Japan and the United States, LCD and other flat-panel display driver semiconductors in Japan, Taiwan, Hong Kong and Mainland China. As of March 31, 2018, our sales and marketing efforts were primarily carried out by teams of sales professionals, application engineers and technicians, totaling 29 staff members. Each of these teams focuses on specific customers and/or geographic regions. As part of our emphasis on customer service, these teams:
| • | actively participate in the design process at the customers’ facilities; |
| • | resolve customer assembly and test issues; and |
| • | promote timely and individualized resolutions to customers’ issues. |
We conduct marketing research through our in-house customer service personnel and through our relationships with our customers and suppliers to keep abreast of market trends and developments. Furthermore, we do product and system bench marking analysis to understand the application and assembly technology evolution, such as analysis on mobile handsets and Tablet, PC, handfree products. In addition, we regularly collect data from different segments of the semiconductor industry and, when possible, we work closely with our customers to design and develop assembly and test services for their new products. These “co-development” or “sponsorship” projects can be critical when customers seek large-scale, early market entry with a significant new product.
We have appointed a non-exclusive sales agent for promoting our services for memory semiconductors in Korea. Our sales agent helps us promote and market our services, maintain relations with our existing and potential customers and communicate with our customers on quality, specific requirements and delivery issues. We generally pay our sales agent a commission of 3.5% of our revenue from services for memory semiconductors in Korea. In 2016 and 2017, we paid approximately NT$4 million and NT$5 million (US$169 thousand), respectively, in commissions to our sales agent.
Research and Development
To maintain our competitive edge for continued business growth, we continue our focus of our investment in new technology research and development. In 2016 and 2017, we spent approximately NT$839 million, or 4.5% and NT$986 million (US$33 million), or 5.5%, respectively, of our revenue on research and development. We intend to sustain these efforts.
Our research and development efforts have been focused primarily on new technology instruction, improving efficiency and production yields of our assembly and test services. From time to time, we jointly develop new technologies with local and international research institutions and universities. In testing area, our research and development efforts focused particularly on high speed probing, fine pitch probing capability and wafer level burn-in technology. Our projects include:
| • | Grew wafer level BIST testing capability; |
| • | Developed “one touchdown full contact testing capability for 200mm and 300mm wafers”; |
| • | Ramped up high frequency testing capability for LCD and other flat-panel display driver semiconductors; |
| • | Built up fine pitch testing capability for smaller than 10um bump pitch products; |
| • | Developing “wafer level probing on copper pillar bump for 300mm wafers”; and |
| • | Developing centralized server test control system. |
41
Table of Contents
In bumping and assembly areas, our research and development efforts were directed to:
| • | Low-cost alloy wire bonding alternatives for Cu wirebond; |
| • | Au height reduction, as part of cost reduction drive, 10um bump height COF package was released for production; |
| • | Wafer-level chip scale packaging and 3P2M Cu RDL processes; |
| • | Fine-pitch (5/5 um) RDL process for WLCSP and RDL products; |
| • | Flip-chip QFN for power IC applications; |
| • | Flip-chip CSP for DRAM & mixed-signal application; |
| • | Cu pillar bumping for 300mm wafers; |
| • | MEMS packages for mobile devices; |
| • | Multi-chip assembly and module of flash products for SSD and eMMC applications; |
| • | Thin wafer lapping and dicing capabilities for stacked-die chip scale package; |
| • | Biometric sensor package solutions, for example, Fingerprint sensor by LGA; |
| • | Chip on Wafer (CoW) packaging solution for chip integration application; |
| • | Advanced thin core/core-free, & flex substrate solutions for thin & flip chip packages; |
| • | 2-metal layers COF assembly & COF SMT capabilities for TDDI application; |
| • | Qualified thermally enhanced COF and MCB COF and released for manufacturing; and |
| • | 5 side molding WLCSP packaging technology. |
For new product and product enhancement work in 2017, our work concentrates on three key development programs: 3D WLCSP, biometric sensor package solutions, and flip chip technology. In the bumping area, we completed customer qualification of 300mm wafer Au bumping process in 2012 and started volume production in Q4, 2012. Development of Cu plating enables the entry of WLCSP, RDL and flip chip market and Cu RDL applied on DRAM wafer for SiP product is qualified in 2016. Turnkey services of WLCSP and flip chip QFN have been implemented for mass production in 2013 based on the successful technology developments. In 2012, we also initiated both 200mm and 300mm Cu pillar bumping engineering work and, related packaging technologies are being developed for mixed-signal and memory products in 2013. It is also qualified on power management IC product in 2016. By integrating WLCSP bumping, copper pillar bumping and flip chip assembly capability, an integrated WLCSP (CoW or 3D WLCSP) is developing in 2015, and qualified the structure & process verification in 2016. CoW not only provides the cost effective package solution by stacking the different wafer node technology chip, but also could meet integrated function and smallest package footprint. Meanwhile, fingerprint sensor (FPS) packaging solution by LGA was also developed for smartphone demand in 2015. More and more integrated function of DDIC and TDIC, TDDI, is requested for smartphone application, therefore 2-metal layers COF solution and COF SMT are developed to provide the package solution and TDDI since 2016.
In 2013, in-process engineering advancement allowed us to extend our wirebond technology to service MEMS products. To further achieve cost reduction, alloy wire and 0.6 mil Au wirebond processes were also developed. In 2017, we will continue to work on improvements of wafer thinning and polishing operations facilitate the expansion of multi-chip NAND packages offerings. Capability of handling miniature molded packages has been extended to 1x1 mm size and various improvements will also be made in production equipment to enhance throughput and efficiency.
As of March 31, 2018 we employed 668 employees in our research and development activities. In addition, other management and operational personnel are also involved in research and development activities but are not separately identified as research and development professionals.
We maintain laboratory facilities capable for materials and electrical characterizations to support production and new product development. Computer simulation is used to validate both mechanical and electrical models in comparison to measurement results. Enhancement of Shadow Moiré and Micro Moiré equipment was carried out to support MCP and flip chip package warpage and residue stress characterization. In Advanced Packaging Lab, rheology measurement capability and high frequency electric simulation capability were established, aimed at expanding capability for material selection and inspection to support flip chip introduction and various resin characterizations. An analytical laboratory has been built out in our bumping line providing timely support to manufacturing operations.
42
Table of Contents
Quality Control
We believe that our reputation for high quality and reliable services have been an important factor in attracting and retaining leading international semiconductor companies as customers for our assembly and test services. We are committed to delivering semiconductors that meet or exceed our customers’ specifications on time and at a competitive cost. We maintain quality control staff at each of our facilities.
As of March 31, 2018, we employed 337 personnel for our quality control activities. Our quality control staff typically includes engineers, technicians and other employees who monitor assembly and test processes in order to ensure high quality. We employ quality control procedures in the following critical areas:
| • | sales quality assurance: following market trends to anticipate customers’ future needs; |
| • | design quality assurance: when developing new testing and assembly processes; |
| • | supplier quality assurance: consulting with our long-term suppliers; |
| • | manufacturing quality assurance: through a comprehensive monitoring program during mass production; and |
| • | service quality assurance: quickly and effectively responding to customers’ claims after completion of sale. |
All of our facilities have obtained IATF 16949 quality system certification in December 2017. In addition, our facilities in Hsinchu and Tainan have been ISO 9002 certified in September 1997 and December 1998, respectively, and recertified with ISO 9001 for substantial revision since 2015.
IATF 16949 certification system seeks to integrate quality management standards into the operation of a company, and emphasizes the supervision and measurement of process and performance. An ISO 9001 certification is required by many countries for sales of industrial products.
In addition to the quality management system, we also earned the 1998 QC Group Award from The Chinese Society of Quality, which is equivalent to the similar award from the American Society of Quality. In 2003, ChipMOS passed SONY Green Partner (Tier 2) certification through its ProMOS channel, and in 2009, ChipMOS obtained SONY Green Partner (Tier 1) certification due to its direct business relationship with SONY. Our laboratories have also been awarded Chinese National Laboratory accreditation under the categories of reliability test, electricity and temperature calibration.
Our assembly and test operations are carried out in clean rooms where air purity, temperature and humidity are controlled. To ensure the stability and integrity of our operations, we maintain clean rooms at our facilities that meet U.S. federal 209E class 100, 1,000, 10,000 and 100,000 standards. A class 1,000 clean room means a room containing less than 1,000 particles of contaminants per cubic foot.
We have established manufacturing quality control systems that are designed to ensure high-quality services to our customers and maintain reliability and high production yields at our facilities. We employ specialized equipment for manufacturing quality and reliability control, including:
| • | Joint Electron Device Engineering Council (JEDEC) standardized temperature cycling, thermal shock and pressure cook reliability tests; |
| • | high and low temperature storage life tests, temperature humidity bias test and highly accelerated temperature/humidity stress test (HAST); and |
| • | high resolution scanning acoustic tomography, scanning electronic microscope and X-Ray microscopy for physical failure analysis, curve tracer and semi-probe station for electrical failure analysis. |
In addition, to enhance our performance and our research and development capabilities, we also installed a series of high-cost equipment, such as temperature humidity bias testers, low temperature storage-life testers and highly accelerated stress testers. We believe that many of our competitors do not own this equipment.
As a result of our ongoing focus on quality, in 2017, we achieved monthly assembly yields of an average of 99.93% for our memory and logic/mixed-signal assembly packages, 99.97% for our COF packages, 99.95% for our COG packages and 99.95% for our bumping products. The assembly yield, which is the industry standard for measuring production yield, is equal to the number of integrated circuit packages that are shipped back to customers divided by the number of individual integrated circuits that are attached to leadframes or organic substrate.
43
Table of Contents
Raw Materials
Semiconductor testing requires minimal raw materials. Substantially all of the raw materials used in our memory and logic/mixed-signal semiconductor assembly processes are interconnect materials such as leadframes, organic substrates, gold wire and molding compound. Raw materials used in the LCD and other flat-panel display driver semiconductor assembly and test process include carrier tape, resin, spacer tape, plastic reel, aluminum bags, and inner and outer boxes. Cost of raw materials represented 18% and 17% of our revenue in 2016 and 2017, respectively.
We do not maintain large inventories of leadframes, organic substrates, gold wire or molding compound, but generally maintain sufficient stock of each principal raw material for approximately one month’s production based on blanket orders and rolling forecasts of near-term requirements received from customers. In addition, since the commencement of economic downturn in second quarter of 2008, due to the volatility of the semiconductor market, several of our principal suppliers have also ceased to stock inventories to be reserved to meet its customers’ production requirements. Instead, our suppliers now require longer lead time for delivery of our supply orders. Shortage in the supply of materials experienced by the semiconductor industry have in the past resulted in price adjustments. Our principal raw material supplies have not been impacted by the Japan earthquake and tsunami catastrophe. See “Item 3. Key Information—Risk Factors—Risks Relating to Our Business—If we are unable to obtain raw materials and other necessary inputs from our suppliers in a timely and cost-effective manner, our production schedules would be delayed and we may lose customers and growth opportunities and become less profitable” for a discussion of the risks associated with our raw materials purchasing methods. For example, with the exception of aluminum bags and inner and outer boxes, which we acquire from local sources, the raw materials used in our TCP/COF process and for modules are obtained from a limited number of Japanese suppliers.
Competition
The independent assembly and test markets are very competitive. Our competitors include large IDMs with in-house testing and assembly capabilities and other independent semiconductor assembly and test companies, especially those offering vertically integrated assembly and test services, such as Advanced Semiconductor Engineering Inc., Amkor Technology, Inc., Chipbond Technology Corporation, King Yuan Electronics Co., Ltd., Powertech Technology, Siliconware Precision, Jiangsu Changjiang Electronics Technology Co., Ltd. and United Test and Assembly Center Ltd. We believe that the principal measures of competitiveness in the independent semiconductor testing industry are:
| • | engineering capability of software development; |
| • | quality of service; |
| • | flexibility; |
| • | capacity; |
| • | production cycle time; and |
| • | price. |
In assembly services, we compete primarily on the basis of:
| • | production yield; |
| • | production cycle time; |
| • | process technology, including our COF technology for LCD and other flat-panel display driver semiconductor assembly services; |
| • | quality of service; |
| • | capacity; |
| • | location; and |
| • | price. |
44
Table of Contents
IDMs that use our services continually evaluate our performance against their own in-house assembly and test capabilities. These IDMs may have access to more advanced technologies and greater financial and other resources than we do. We believe, however, that we can offer greater efficiency and lower costs while maintaining an equivalent or higher level of quality for three reasons:
| • | firstly, we offer a broader and more complex range of services as compared to the IDMs, which tend to focus their resources on improving their front-end operations; |
| • | secondly, we generally have lower unit costs because of our higher utilization rates and thus enabling us to operate at a more cost-effective structure compared to the IDMs; and |
| • | finally, we offer a wider range of services in terms of complexity and technology. |
Intellectual Property
As of March 31, 2018, we held 504 patents in Taiwan, 178 patents in the United States, 258 patents in the People’s Republic of China and 1 patent in the United Kingdom, France, and Germany, respectively, and 2 patents in Korea and Japan, respectively, relating to various semiconductor assembly and test technologies. These patents will expire at various dates through to 2037. As of March 31, 2018, we also had a total of 6 pending patent applications in the United States, 19 in Taiwan, 77 in the People’s Republic of China, and 1 in Europe. In addition, we have registered “ChipMOS” and its logo and “InPack” as trademarks in Taiwan, and “ChipMOS” and its logo as trademarks in the United States, the People’s Republic of China, Singapore, Hong Kong, Korea, Japan and the European Community.
We expect to continue to file patent applications where appropriate to protect our proprietary technologies. We may need to enforce our patents or other intellectual property rights or to defend ourselves against claimed infringement of the rights of others through litigation, which could result in substantial costs and a diversion of our resources. See “Item 3. Key Information—Risk Factors—Risks Relating to Our Business—Disputes over intellectual property rights could be costly, deprive us of technologies necessary for us to stay competitive, render us unable to provide some of our services and reduce our opportunities to generate revenue”.
Government Regulations
As discussed above under “—Intellectual Property”, governmental regulation of our intellectual property may materially affect our business. The failure to protect our property rights would deprive us of our ability to stay competitive in the semiconductor industry. Our intellectual property rights are protected by the relevant patent and intellectual property agencies of the European Community, United States, the People’s Republic of China, Singapore, Hong Kong, Korea, Japan and Taiwan.
Environmental Matters
Semiconductor testing does not generate significant pollutants. The semiconductor assembly and gold bumping process generate stationary acid, alkali and VOC pollutions, principally at the plating and etching stages. Water waste is produced when silicon wafers are ground thinner, diced into chips with the aid of diamond saws and cleaned with running water. In addition, excess materials, either on lead-frames or molding process, are removed from assembled semiconductors in the trimming and de-junking processes, respectively. We have various treatment equipments for wastewater and air pollutants at our assembly and bumping facilities. Since 2001, we have adopted certain environmentally-friendly production management systems, and have implemented certain measures intended to bring our all processes in compliance with the Restriction of Hazardous Substances Directive 2002/95/EC issued by the European Union and our customers. We believe that we have adequate and effective environmental protection measures that are consistent with semiconductor industry practices in Taiwan. In addition, we believe we are in compliance in all material respects with current environmental laws and regulations applicable to our operations and facilities.
All of our facilities in Taiwan have been certified as meeting the ISO 14001 environmental standards of the International Organization for Standardization, and all of our facilities in Taiwan have been certified as meeting the OHSAS 18001 standards of the International Organization for Standardization. Our facilities at Hsinchu Science Park, Chupei and Southern Taiwan Science Park have won numerous awards including “Green Factory Label”, “Enterprises Environmental Protection Award” and “Occupational Safety and Health Excellent Award”, “Green Building Label” and “Health Promotion Awards” from 2012 to 2017. We continue to encourage our employees to participate in community environmental campaigns and better environmental friendly practices.
45
Table of Contents
We will continue to enhance related management to reduce industrial waste, save energy and control pollution. For products in conformity with Green Product Requirement, the Company obtained Green Partner certification from Sony Corporation of Japan. Furthermore we passed QC 080000 certification and “Greenhouse Gas Verification Statement” (ISO 14064) from 2013 until now. We further confirmed many product’s CFP “Carbon Footprint Verification Statement” (ISO 14067) and WFN “Water Footprint Verification Statement”. At the same time, Tainan and Hsinchu plants passed the certification of energy management program (“ISO 50001”) since 2015. We plan to arrange all of ChipMOS plants to pass the certification of ISO 50001 in the near future. Our policy is to pay attention to the environment issues by standardizing on green, environmental-friendly products, cleaner process and enhance supplier chain management to meet ChipMOS’ Corporate Social Responsibilities.
Insurance
We maintain insurance policies on our buildings, equipment and inventories. These insurance policies cover property damages due to all risks, including but not limited to, fire, lightning and earthquakes. The maximum coverage of property insurance for the Company is approximately NT$74,364 million.
Insurance coverage on facilities under construction is maintained by us and our contractors, who are obligated to procure necessary insurance policies and bear the relevant expenses of which we are the beneficiary. We also maintain insurance on the wafers delivered to us while these wafers are in our possession and during transportation from suppliers to us and from us to our customers.
Employees
See “Item 6. Directors, Senior Management and Employees—Employees” for certain information relating to our employees.
Taxation
See “Item 5. Operating and Financial Review and Prospects—Taxation” for certain information regarding the effect of ROC tax regulations on our operations.
Facilities
We provide testing services through our facilities in Taiwan at following locations: Chupei, the Hsinchu Industrial Park, the Hsinchu Science Park, and the Southern Taiwan Science Park. We provide assembly services through our facility at the Southern Taiwan Science Park. We own the land for our Hsinchu Industrial Park testing facility and Chupei facility and we lease two parcels of land for our Hsinchu Science Park testing facility with lease expiration in year 2027 and 2034, respectively, and two parcels of land for our Southern Taiwan Science Park facility with lease expiration in year 2024 and 2032.
The following table shows the location, primary use and size of each of our facilities, and the principal equipment installed at each facility, as of March 31, 2018.
|
Location of Facility |
Primary Use |
Floor Area (m 2 ) |
Principal Equipment |
|||
| Chupei, Hsinchu | Testing/Gold Bumping | 38,166 |
9 steppers 18 sputters 302 testers |
|||
| Hsinchu Industrial Park | Testing | 25,864 |
102 testers 26 burn-in ovens |
|||
| Hsinchu Science Park | Testing | 31,168 |
154 testers 80 burn-in ovens |
|||
| Southern Taiwan Science Park | Assembly/Testing | 146,186 |
800 wire bonders 101 inner-lead bonders 451 testers |
|||
46
Table of Contents
Equipment
Testing of Memory and Logic/Mixed-Signal Semiconductors
Test equipment is the most capital-intensive component of the memory and logic/mixed-signal semiconductors test business. Upon the acquisition of new test equipment, we install, configure, calibrate and perform burn-in diagnostic tests on the equipment. We also establish parameters for the test equipment based on anticipated requirements of existing and potential customers and considerations relating to market trends. As of March 31, 2018, we operated 521 testers for testing memory and logic/mixed-signal semiconductors. We generally seek to purchase testers with similar functionality that are able to test a variety of different semiconductors. We purchase testers from international manufacturer, Advantest Corporation.
In general, particular semiconductors can be tested using a limited number of specially designed testers. As part of the qualification process, customers will specify the machines on which their semiconductors may be tested. We often develop test program conversion tools that enable us to test semiconductors on multiple equipment platforms. This portability among testers enables us to allocate semiconductor testing across our available testing capacity and thereby improve capacity utilization rates. If a customer requires the testing of a semiconductor that is not yet fully developed, the customer consigns its testing software programs to us to test specific functions. If a customer specifies test equipment that is not widely applicable to other semiconductors we test, we require the customer to furnish the equipment on a consignment basis.
We will continue to acquire additional test equipment in the future to the extent market conditions, cash generated from operations, the availability of financing and other factors make it desirable to do so. Some of the equipment and related spare parts that we require have been in short supply in recent years. Moreover, the equipment is only available from a limited number of vendors or is manufactured in relatively limited quantities and may have lead time from order to delivery in excess of six months.
Assembly of Memory and Logic/Mixed-Signal Semiconductors
The number of wire bonders at a given facility is commonly used as a measure of the assembly capacity of the facility. Typically, wire bonders may be used, with minor modifications, for the assembly of different products. We purchase wire bonders principally from Shinkawa Co., Ltd. and Kulicke & Soffa Industries Inc. As of March 31, 2018, we operated 800 wire bonders. In addition to wire bonders, we maintain a variety of other types of assembly equipment, such as wafer grinders, wafer mounters, wafer saws, die bonders, automated molding machines, laser markers, solder platers, pad printers, dejunkers, trimmers, formers, substrate saws and lead scanners.
Gold Bumping, Assembly and Test of LCD and Other Flat-Panel Display Driver Semiconductors
We acquired TCP-related equipment from Sharp to begin our TCP-related services. We subsequently purchased additional TCP-related testers from Yokogawa Electric Corp. and Advantest Corporation and assembly equipment from Shibaura Mechatronics Corp., SETEC CORPORATION and GMM Corp. As of March 31, 2018, we operated 9 steppers and 18 sputters for gold bumping, 101 inner-lead bonders for assembly and 488 testers for LCD and other flat-panel display driver semiconductors. We are currently in the process of purchasing additional test equipment. The test equipment can be used for the TCP, COF and COG processes, while the inner-lead bonders are only used in the TCP and COF processes. The same types of wafer grinding, auto wafer mount and die saw equipment is used for the TCP, COF and COG processes. In addition, auto inspection machines and manual work are used in the COG process, which is more labor-intensive than the TCP and COF processes.
| Item 4A. | Unresolved Staff Comments |
Not applicable.
47
Table of Contents
| Item 5. | Operating and Financial Review and Prospects |
This discussion and analysis should be read in conjunction with our consolidated financial statements and related notes contained in this Annual Report on Form 20-F.
Overview
We provide a broad range of back-end assembly and test services. Test services include wafer probing and final testing of memory and logic/mixed-signal semiconductors. We also offer a broad selection of leadframe and organic substrate-based package assembly services for memory and logic/mixed-signal semiconductors. Our advanced leadframe-based packages include thin small outline packages, or TSOPs, and our advanced organic substrate-based packages include fine-pitch ball grid array, or fine-pitch BGA, packages. We also offer WLCSP products and turn-key flip chip assembly and test services using variety of leadframe and organic substrate carries. In addition, we provide gold bumping, reel to reel assembly and test services for LCD, OLED and other flat-panel display driver semiconductors by employing TCP, COF and COG technologies. Our copper bumping technology supports non-driver type of products, such as RDL, copper pillar, WLCSP etc. In 2017, our consolidated revenue was NT$17,941 million (US$605 million) and our profit for the year attributable to equity holders of the Company was NT$2,797 million (US$94 million).
We are a company limited by shares, incorporated in ROC on July 28, 1997 as a joint venture company of Mosel and Siliconware Precision and with the participation of other investors. We provide our services through our subsidiaries and affiliates.
Following the completion of the share exchange transaction between ChipMOS Bermuda and the Company on September 14, 2007, the Company became a wholly-owned subsidiary of ChipMOS Bermuda. In February 2010, ChipMOS Bermuda agreed to sell 15.8% of the Company’s outstanding shares to Siliconware Precision. The share purchase transaction was completed in January 2011. As part of the Company’s listing plan on the TWSE, on April 16, 2013, ChipMOS Bermuda completed the sale of 6.5 million outstanding shares or 0.8% of the total number of outstanding shares of the Company, at the price of NT$15.0 per share to the Company’s underwriters and to certain others, including non-US employees of the Company. Also, from September 2, 2013 to October 3, 2013, ChipMOS Bermuda completed another sale of 180 million outstanding shares or 21.4% of the total number of outstanding shares of the Company, at the price of NT$20.0 per share to investors. On April 9, 2014, ChipMOS Bermuda sold approximately 1.3 million shares of the Company as “green shoe” option to market investors. The Company became listed and commenced trading on the main board of TWSE on April 11, 2014. See “Item 3. Key Information—Risk Factors—Risks Relating to Our Common Shares or ADSs—The Company’s ability to maintain its listing and trading status of common shares on the Taiwan Stock Exchange or ADSs on the NASDAQ Stock Market is dependent on factors outside of the Company’s control and satisfaction of stock exchange requirements. The Company may not be able to overcome such factors that disrupt its trading status of common shares on the Taiwan Stock Exchange or ADSs on the NASDAQ Stock Market or satisfy other eligibility requirements that may be required of it in the future” for additional information.
In April 2011, ChipMOS Bermuda entered into the MMT Assignment Agreement with ThaiLin to sell the MMT Notes to ThaiLin for a purchase price of approximately US$40 million. The MMT Assignment Agreement transaction was completed on October 3, 2011 and ChipMOS BVI, then became the wholly-owned subsidiary of ThaiLin. On November 12, 2014, the Company made announcement for the contemplated merger with ThaiLin. The merger completed on June 17, 2015 and the Company continues as the surviving merged entity. ChipMOS BVI then became the wholly-owned subsidiary of the Company.
On December 11, 2015, the board of the Company authorized and the Company and Tsinghua Unigroup executed the Tsinghua Share Subscription Agreement, which is included as Exhibit 4.3, to sell and issue 299,252,000 shares of the Company to Tsinghua Unigroup through the Private Placement at a price of NT$40.0 per common share of the Company representing an aggregate purchase price of approximately NT$12.0 billion. The Company and Tsinghua Unigroup and its subsidiary also have entered into other agreements related to the Tsinghua Share Subscription Agreement. On November 30, 2016, the Company and Tsinghua Unigroup mutually agreed to terminate the Tsinghua Share Subscription Agreement and to form a joint-venture. Under the joint-venture, ChipMOS BVI, a wholly-owned subsidiary of the Company, would sell 54.98% of the equity interests of its wholly-owned subsidiary, ChipMOS Shanghai, to strategic investors, including Unigroup Guowei, a subsidiary of Tsinghua Unigroup, which will hold 48% equity interests of ChipMOS Shanghai, and the other strategic investors, including a limited partnership owned by ChipMOS Shanghai’s employees, will own 6.98% equity interest of ChipMOS Shanghai. In March 2017, ChipMOS BVI completed the sale of 54.98% equity interests of ChipMOS Shanghai to Unigroup Guowei and other strategic investors. ChipMOS Shanghai was no longer the subsidiary of ChipMOS BVI. On June 30, 2017, we completed the first stage capital injection of ChipMOS Shanghai, and on January 19, 2018, completed the second stage capital injection of ChipMOS Shanghai. See “Item 4. Information on the Company—Our Structure and History” for more details.
48
Table of Contents
On January 21, 2016, ChipMOS Bermuda and the Company entered into the Merger Agreement, pursuant to which ChipMOS Bermuda merged with and into the Company, with the latter being the surviving company after the Merger. Pursuant to the Merger Agreement, at the effective time, each ChipMOS Bermuda share issued and outstanding immediately prior to the effective time was cancelled and, in exchange, each former holder of such cancelled ChipMOS Bermuda shares was entitled to receive, with respect to each such ChipMOS Bermuda share, (i) 0.9355 ADS, representing 18.71 the Company share, each ADS representing 20 common shares of the Company, and (ii) US$3.71 in cash, without interest, net of any applicable withholding tax. Upon completion of the Merger, the Company and its subsidiaries owned continued to conduct the business that they conducted in substantially the same manner. For additional information regarding the Merger see “Item 4. Information on the Company”.
We conduct testing operations in our facilities at the Hsinchu Science Park, the Hsinchu Industrial Park and Chupei, gold bumping and wafer testing in our facility at Chupei, and assembly and testing operations in our facility at the Southern Taiwan Science Park. We also conduct operations in Mainland China through ChipMOS Shanghai, a 45.02%-owned affiliate of ChipMOS BVI. ChipMOS Shanghai operates an assembly and test facility at the Qingpu Industrial Zone in Shanghai.
The following key trends are important to understanding our business:
Capital Intensive Nature of Our Business. Our operations, in particular our testing operations, are characterized by relatively high fixed costs. We expect to continue to incur substantial depreciation and other expenses as a result of our previous acquisitions of assembly and test equipment and facilities. Our profitability depends in part not only on absolute pricing levels for our services, but also on capacity utilization rates for our assembly and test equipment. In particular, increases or decreases in our capacity utilization rates could significantly affect our gross margins since the unit cost of assembly and test services generally decreases as fixed costs are allocated over a larger number of units.
The current generation of advanced testers typically cost between US$1 million and US$5 million each, while wire bonders used in assembly typically cost approximately US$68 thousand each and inner-lead bonders for TCP and COF assembly cost approximately US$360 thousand each and COG chip sorters cost approximately US$220 thousand each. We begin depreciating our equipment when it is placed into commercial operation. There may be a time lag between the time when our equipment is placed into commercial operation and when it achieves high levels of utilization. In periods of depressed semiconductor industry conditions, we may experience lower than expected demand from our customers and a sharp decline in the average selling prices of our assembly and test services, resulting in an increase in depreciation expenses relative to revenue. In particular, the capacity utilization rates for our test equipment may be severely adversely affected during a semiconductor industry downturn as a result of the decrease in outsourcing demand from integrated device manufacturers, or IDMs, which typically maintain larger in-house testing capacity than in-house assembly capacity.
Highly Cyclical Nature of the Semiconductor Industry . The worldwide semiconductor industry has experienced peaks and troughs over the last decade, with a severe downturn beginning in the fourth quarter of 2000 that was followed by a recovery in early 2003. The significant decrease in market demand for semiconductors that began in 2000 adversely affected our results of operations for 2001 and 2002. Beginning in the fourth quarter of 2008, the semiconductor industry commenced another significant downturn which continued in 2009 and in 2010. Market demand for semiconductors significantly decreased across our industry during these periods, which adversely affected average selling prices for our services and our results of operations for 2008, 2009 and 2010. The impact on our results of operations caused by the decrease in market demand during these periods was partly offset by increases in our 2009 and 2010 revenue from assembly services for logic/mixed-signal semiconductors due to higher customer demand for these services in 2009 and 2010. The overall outsourced assembly and test services for memory and logic/mixed-signal semiconductors increased gradually each year since 2016. In spite of increased demand for assembled semiconductors, such as DRAM and flash product, which may further increase the demand but average selling prices declined in our services, that also intensify our difficulties related to realizing pricing levels, capacity utilization rates and gross margin.
49
Table of Contents
Declining Average Selling Prices of Our Assembly and Test Services. The semiconductor industry is characterized by a general decrease in prices for products and services over the course of their product and technology life cycles. The rate of decline is particularly steep during periods of intense competition and adverse market conditions. The average selling prices of our assembly and test services experienced sharp declines during such periods as a result of intense price competition from other independent assembly and test companies that attempt to maintain high capacity utilization levels in the face of reduced demand.
To offset the effects of decreasing average selling prices, we will continue to seek to:
| • | improve production efficiency and attain high capacity utilization rates; |
| • | concentrate on testing of potentially high-demand, high-growth semiconductors; |
| • | develop new assembly technologies; and |
| • | implement new technologies and platforms to shift into potentially higher margin services. |
Market Conditions for the End-User Applications for Semiconductors. Market conditions in the semiconductor industry, to a large degree, track those for their end-user applications. Any deterioration in the market conditions for the end-user applications of semiconductors that we test and assemble may reduce demand for our services and, in turn, materially adversely affect our financial condition and results of operations. Despite an increase in the demand for mobile/niche DRAM and NOR flash in 2017, advanced features such as that of enhanced graphic capability, increased power efficiency and increased mobility. Our revenue is largely attributable to fees from testing and assembling semiconductors including DDIC and non-DDIC electronic components, for use in smart mobile devices, automotive and industrial market. Continuous pricing pressure on our assembly and test services would negatively affects our earnings.
Change in Product Mix . Declines in average selling prices since 2017 have been partially offset by a change in our revenue mix. In particular, revenue from assembly and test of LCD and other flat-panel display driver semiconductors, bumping services and 12-inch COF processing have increased as a percentage of our total revenue over the 2016 to 2017 period. We intend to continue focusing on testing and assembling more semiconductors that have the potential to provide higher margins and developing and offering new technologies in testing and assembly services, in order to mitigate the effects of declining average selling prices on our ability to attain profitability.
Recent Acquisitions
As part of the Company’s listing plan on the TWSE, on April 16, 2013, ChipMOS Bermuda completed the sale of 6.5 million or 0.8% of the total number of the Company’s outstanding shares, at the price of NT$15.0 per share to the Company’s underwriters and to certain others, including non-US employees of the Company. Also, from September 2, 2013 to October 3, 2013, ChipMOS Bermuda completed another sale of 180 million or 21.4% of the total number of the Company’s outstanding shares, at the price of NT$20.00 per share to investors. On April 9, 2014, ChipMOS Bermuda sold approximately 1.3 million shares of the Company as “green shoe” option to market investors. The Company became listed and commenced trading on the main board of TWSE on April 11, 2014. On June 17, 2015, ThaiLin was merged into the Company. See “Item 4. Information on the Company—Our Structure and History” for description of our earlier merger events.
On December 11, 2015, the board of the Company authorized and the Company and Tsinghua Unigroup executed the Tsinghua Share Subscription Agreement, which is included as Exhibit 4.3, to sell and issue 299,252,000 shares of the Company to Tsinghua Unigroup through the Private Placement at a price of NT$40.0 per common share representing an aggregate purchase price of approximately NT$12.0 billion. The Company and Tsinghua Unigroup and its subsidiary also have entered into other agreements related to the Tsinghua Share Subscription Agreement. On November 30, 2016, the Company and Tsinghua Unigroup mutually agreed to terminate the Tsinghua Share Subscription Agreement and to form a joint-venture. Under the joint-venture, ChipMOS BVI, a wholly-owned subsidiary of the Company, would sell 54.98% of the equity interests of its wholly-owned subsidiary, ChipMOS Shanghai, to strategic investors, including Unigroup Guowei, a subsidiary of Tsinghua Unigroup, which will hold 48% equity interests of ChipMOS Shanghai, and the other strategic investors, including a limited partnership owned by ChipMOS Shanghai’s employees, will own approximately 6.98% equity interest of ChipMOS Shanghai. As of December 31, 2016, the equity transfer was not completed, and therefore, the assets, liabilities and equity related to ChipMOS Shanghai have been reclassified as held for sale and presented as discontinued operations according to IFRS 5 “Non-current Assets Held for Sale and Discontinued Operations”. The equity transfer was completed in March 2017 and ChipMOS Shanghai is no longer a subsidiary of the Company. For additional information see “Item 4. Information on the Company—Agreements with Tsinghua Unigroup Ltd.”
50
Table of Contents
On January 21, 2016, the board of directors of ChipMOS Bermuda approved the merger with and into the Company, with the later being the surviving company. In accordance with the agreement and plan of merger entered into between the Company and ChipMOS Bermuda on January 21, 2016, the shareholders of ChipMOS Bermuda received (i) US$3.71 in cash and (ii) 0.9355 ADS representing 18.71 shares of the Company (each ADS representing 20 new common shares, par value of NT$10 each, to be issued by the Company) in exchange for each outstanding ChipMOS Bermuda common share. The Merger was completed and effective on October 31, 2016. The transaction was accounted as a capital reorganization within the Group. The Company’s comparative financial statements present financial information as if ChipMOS Bermuda had always been combined with the Company, restated retrospectively. The Company issued 512,405,340 common shares represented by the ADSs and the ADSs were listed on the NASDAQ Global Select Market on November 1, 2016.
Revenue
We conduct our business according to the following main business segments: (1) testing services for memory and logic/mixed-signal semiconductors; (2) assembly services for memory and logic/mixed-signal semiconductors; (3) LCD and other flat-panel display driver semiconductor testing and assembly services; and (4) bumping services for memory, logic/mixed-signal and LCD and other flat-panel display driver semiconductors. The following table sets forth, for the periods indicated, our consolidated revenue for each segment.
| Year ended December 31, | ||||||||||||
| 2016 | 2017 | 2017 | ||||||||||
| NT$ | NT$ | US$ | ||||||||||
| (in millions) | ||||||||||||
|
Testing |
||||||||||||
|
Memory |
$ | 3,620.5 | $ | 3,971.5 | $ | 134.0 | ||||||
|
Logic/mixed-signal |
966.6 | 866.7 | 29.2 | |||||||||
|
Total testing |
4,587.1 | 4,838.2 | 163.2 | |||||||||
|
Assembly |
||||||||||||
|
Memory |
5,283.6 | 4,352.6 | 146.9 | |||||||||
|
Logic/mixed-signal |
597.2 | 906.7 | 30.6 | |||||||||
|
Total assembly |
5,880.8 | 5,259.3 | 177.5 | |||||||||
|
LCD and other flat-panel display driver semiconductor assembly and testing |
4,920.3 | 4,789.9 | 161.6 | |||||||||
|
Bumping |
2,999.4 | 3,053.5 | 103.0 | |||||||||
|
|
|
|
|
|
|
|||||||
|
Total |
$ | 18,387.6 | $ | 17,940.9 | $ | 605.3 | ||||||
|
|
|
|
|
|
|
|||||||
Our revenue consists primarily of service fees for testing and assembling semiconductors, and to a lesser extent, fees from equipment rentals to semiconductor manufacturers for engineering testing, less allowances for product returns. We offer assembly and test services for memory semiconductors, logic/mixed-signal semiconductors, assembly and test services for LCD and other flat-panel display driver semiconductors and bumping services.
Most of our customers do not place purchase orders far in advance and our contracts with customers generally do not require minimum purchases of our products or services. Our customers’ purchase orders have varied significantly from period to period because demand for their products is often volatile. We have strategically entered into long-term capacity agreements with some of our customers. Under certain of those long-term agreements, we have agreed to reserve capacity for our customers and our customers have agreed to place orders in the amount of the reserved capacity (which is subject in certain cases to reduction by the customers). As part of our strategy, we intend to continue entry into additional long-term capacity agreements as well as focus on our business with smaller customers or customers who do not place orders on a regular basis. We believe that the dual focused strategy would assist us to be better prepared for the current economic volatility and ensure maximum utilization rate of our capacity and help us to develop closer relationships with all types of our customers. Depending on customer demands, market conditions and other considerations, we remain to be focused on expansion of our operations with possible future long-term capacity agreements.
51
Table of Contents
Our financial condition and results of operations have also been, and are likely to continue to be, affected by price pressures on our service fees, which tend to decline in tandem with the declining average selling prices of the products we test and assemble over the course of their product and technology life cycles. In order to maintain our margins, it is necessary to offset the fee erosion by continually improving our production efficiency and maintaining high capacity utilization rates. We also plan to continue to develop and implement new technologies and expand our services into potentially higher-margin segments. These efforts require significant upfront investment in advance of incremental revenue, which could impact our margins.
Pricing
We price our testing fees primarily based on the cost of testing the products to our customers’ specifications, including the costs of the required material and components, the depreciation expenses relating to the equipment involved and our overhead expenses, and with reference to prevailing market prices. Accordingly, the testing fee for a particular product would principally depend on the time taken to perform the tests, the complexity of the product and the testing process, and the cost of the equipment used to perform the test. For example, testing fees for memory semiconductors are significantly higher than those for other products because of the longer time required and the need for burn-in testing. In addition, TDDI as a multi-functional product which is DDIC with touch function, its testing process required longer testing time than tranditional DDIC, thus the testing cost also will be higher than DDIC product.
We price our assembly services on a per unit basis, taking into account the complexity of the package, our costs, including the costs of the required material and components, the depreciation expenses relating to the equipment involved and our overhead expenses, prevailing market conditions, the order size, the strength and history of our relationship with the customer and our capacity utilization.
We price our assembly and test services for DDIC/TDDI and other flat-panel display driver semiconductors and bumping services on the basis of our costs, including the costs of the required material and components, the depreciation expenses relating to the equipment involved and our overhead expenses, and the price for comparable services.
On a case by case, we offer volume discounts to customers who purchase large quantities of our services and special discounts to customers who use our vertically integrated services and may offer special payment terms, including longer payment cycles, to key customers during downturns in the market so as to retain business from such key customers.
Revenue Recognition
We generally recognize our revenue upon completion of assembly and test services. We submit invoices at the time of completion of service or shipment or delivery and generally require all customers to pay and collect payment of our invoices within 60 days after the last day of the month during which the invoice was sent.
Related Party Revenues
In 2016 and 2017, nil and less than 1%, respectively, of our net revenue were derived from related parties. We believe that our transactions with related parties were entered into on an arm’s length basis as discussed in the preceding paragraph. See “Item 7. Major Shareholders and Related Party Transactions” for more information concerning our related party transactions.
Geography and Currency
The majority of our revenue is generated from customers headquartered in Taiwan, which represented 69% and 73% of our revenue in 2016 and 2017, respectively. We also generate revenue from customers in Singapore, Japan and other countries. Our service fees and revenue are generally denominated in the currency of the jurisdiction in which our facilities are located, for example NT dollars for our Taiwan operations. As we generate most of our revenue from Taiwanese customers using our Taiwanese operations, and since most of our labor and overhead costs are denominated in NT dollars, we consider the NT dollar to be our functional currency.
See Note 34 to our consolidated financial statements contained in this Annual Report on Form 20-F and “Item 11. Quantitative and Qualitative Disclosure about Market Risk—Market Risks—Foreign Currency Exchange Rate Risks” for certain information on our exchange rate risks.
52
Table of Contents
Cost of Revenue and Gross Profit
Our cost of revenue consists primarily of the following: depreciation and amortization expenses, raw material costs, and labor and overhead expenses, which primarily include expendable equipment, utilities expenses and inventory supplies. Our operations, in particular our testing, are characterized by relatively high fixed costs. We expect to continue to incur substantial depreciation and other expenses as a result of our previous and future acquisitions of assembly and test equipment and facilities. As of March 31, 2018, we had 1,009 testers, 106 burn-in ovens, 800 wire bonders, 101 inner-lead bonders, 9 steppers and 18 sputters. We use inner-lead bonders for the assembly of LCD and other flat-panel display driver semiconductors using TCP or COF technology, and wire bonders for TSOP, BGA, and some other package assembly technologies.
Our profitability depends in part not only on absolute pricing levels for our services, but also on our capacity utilization rates. Our average capacity utilization rate for testing of memory and logic/mixed-signal semiconductors was 70% in 2016 and 79% in 2017. Our average capacity utilization rate for assembly of memory and logic/mixed-signal semiconductors was 64% in 2016 and 66% in 2017. Our average capacity utilization rate for LCD and other flat-panel display driver semiconductor testing and assembly was 77% in 2016 and 85% in 2017. In addition, our average capacity utilization rate for bumping was 68% in 2016 and 69% in 2017.
For each period of time selected, we derived the capacity utilization rate for our testing operations by dividing the total number of hours of actual use of our facilities’ test equipment units by the maximum number of hours that these equipment units were capable of being used. The testing capacity utilization rate generally increases in correlation to increases in the total volume of our customer orders, and generally decreases in correlation to decreases in the total volume of our customer orders.
For each period of time selected, we derived the capacity utilization rate for our assembly operations by dividing the total number of units actually produced by our assembly facilities by the maximum number of units that these facilities are capable of producing. The assembly capacity utilization rate generally increases in correlation to increases in the total volume of our customer orders, and generally decreases in correlation to decreases in the total volume of our customer orders.
Our gross revenue is generally the product of the total volume of our customer orders multiplied by the average selling price per deliverable unit from our assembly or testing services, as the case may be. As a result, in a period where the average selling prices do not fluctuate significantly, increases or decreases in our capacity utilization rates generally correlate to increases or decreases in our gross revenue. Periods with significant increases in the average selling prices reduce the negative impact on our gross revenue from any decreases in our capacity utilization rates. Similarly, periods with significant decreases in the average selling prices reduce the positive impact on our gross revenue from any increases in our capacity utilization rates.
The Company has significant fixed costs in operating our assembly and test facilities. For this reason, decreases in our cost of goods sold during a period generally occur at a slower rate than decreases, during the same period, in our gross revenue due to lower capacity utilization rates, lower average selling prices, or both. Also, as a result, our gross margin and profitability generally decrease in correlation to decreases in our capacity utilization rates, decreases in our average selling prices, or both. Similarly, our gross margin and profitability generally increase in correlation to increases in our capacity utilization rates, increases in our average selling prices, or both. Due to the cyclical nature of the semiconductor industry, customer orders may change significantly, causing fluctuation in our capacity utilization rate and average selling price.
Most of our labor and overhead costs are denominated in NT dollars. However, we also incur costs of revenues and operating expenses associated with assembly and test services in several other currencies, including Japanese yen, US dollars and RMB. In addition, a substantial portion of our capital expenditures, primarily for the purchase of assembly and test equipment, has been, and is expected to continue to be, denominated in Japanese yen with much of the remainder denominated in US dollars.
53
Table of Contents
The following table sets forth, for the periods indicated, our gross profit and our gross profit margin as a percentage of revenue.
| Year ended December 31, | ||||||||||||
| 2016 | 2017 | 2017 | ||||||||||
| NT$ | NT$ | US$ | ||||||||||
| (in millions) | ||||||||||||
|
Gross profit: |
||||||||||||
|
Testing |
||||||||||||
|
Memory |
$ | 1,224.9 | $ | 1,380.2 | $ | 46.6 | ||||||
|
Logic/mixed-signal |
465.0 | 353.2 | 11.9 | |||||||||
|
Total testing |
1,689.9 | 1,733.4 | 58.5 | |||||||||
|
Assembly |
||||||||||||
|
Memory |
346.2 | (93.3 | ) | (3.2 | ) | |||||||
|
Logic/mixed-signal |
315.6 | 358.4 | 12.1 | |||||||||
|
Total assembly |
661.8 | 265.1 | 8.9 | |||||||||
|
LCD and other flat-panel display driver semiconductor assembly and testing |
1,311.3 | 1,221.4 | 41.2 | |||||||||
|
Bumping |
(20.9 | ) | 17.3 | 0.6 | ||||||||
|
|
|
|
|
|
|
|||||||
|
Total |
$ | 3,642.1 | $ | 3,237.2 | $ | 109.2 | ||||||
|
|
|
|
|
|
|
|||||||
|
Gross profit margin: |
||||||||||||
|
Testing |
||||||||||||
|
Memory |
33.8 | % | 34.8 | % | 34.8 | % | ||||||
|
Logic/mixed-signal |
48.1 | 40.7 | 40.7 | |||||||||
|
Total testing |
36.8 | 35.8 | 35.8 | |||||||||
|
Assembly |
||||||||||||
|
Memory |
6.6 | (2.1 | ) | (2.1 | ) | |||||||
|
Logic/mixed-signal |
52.9 | 39.5 | 39.5 | |||||||||
|
Total assembly |
11.3 | 5.0 | 5.0 | |||||||||
|
LCD and other flat-panel display driver semiconductor assembly and testing |
26.7 | 25.5 | 25.5 | |||||||||
|
Bumping |
(0.7 | ) | 0.6 | 0.6 | ||||||||
|
Overall |
19.8 | % | 18.0 | % | 18.0 | % | ||||||
Operating Expenses
Research and Development
Research and development expenses consist primarily of personnel expenses, expenditures to qualify our services for specific customers and other consulting fees and certification fees paid to third parties. Research and development expenses are recognized as they are incurred. We currently expect that research and development expenses will increase in the future as we continue to explore new technologies and service offerings. We also expect to hire additional employees in our research and development department.
Sales and Marketing
Sales and marketing expenses consist primarily of shipping and handling expenses incurred in delivering products to our customers’ designated locations, advertising, corporate communications and other marketing expenses, salary expenses for sales and marketing personnel, sales commission, professional service fees, bad debt provision and service support expenses.
General and Administrative
General and administrative expenses consist of salaries and related expenses for executive, finance and accounting, and management information systems personnel, professional service fees, and other corporate expenses. They also include stock-based compensation that is expensed using the fair value method. See “Item 6. Directors, Senior Management and Employees—Restricted Shares” for more information concerning our plan of restricted shares. We expect general and administrative expenses to increase in absolute terms as we add personnel and incur additional expenses related to the growth of our business and operations.
54
Table of Contents
Other Non-Operating Income (Expenses), Net
Our other non-operating income principally consists of interest income, foreign exchange gains, gain on disposal of financial assets at fair value through profit or loss and share of profit of associates.
Our other non-operating expenses principally consist of impairment of available-for-sale investments, foreign exchange losses and share of loss of associates.
Non-controlling Interests
Non-controlling interests represent the portion of our income that is attributable to the shareholding in our consolidated subsidiaries that we do not own. See “Item 4. Information on the Company—Our Structure and History” for information concerning our consolidated subsidiaries.
Profit for the Year Attributable to Equity Holders of the Company
Our profit for the year attributable to equity holders of the Company were NT$1,707 million and NT$2,797 million (US$94 million) in 2016 and 2017, respectively. We believe our future results will be dependent upon the overall economic conditions in the markets we serve, the competitive environment in which we operate, and our ability to successfully implement our strategy, among other things. For additional information on factors that will affect our future performance, see “Item 3. Key Information—Risk Factors”.
Results of Operations
The following table presents selected operating data as a percentage of revenue for the periods indicated:
| Year ended December 31, | ||||||||
| 2016 | 2017 | |||||||
|
Revenue |
100.0 | % | 100.0 | % | ||||
|
Cost of revenue |
(80.2 | ) | (82.0 | ) | ||||
|
|
|
|
|
|
|
|||
|
Gross profit |
19.8 | 18.0 | ||||||
|
Research and development expenses |
(4.5 | ) | (5.5 | ) | ||||
|
Sales and marketing expenses |
(0.4 | ) | (0.4 | ) | ||||
|
General and administrative expenses |
(4.5 | ) | (3.6 | ) | ||||
|
Other operating income, net |
0.5 | 3.9 | ||||||
|
|
|
|
|
|
|
|||
|
Operating profit |
10.9 | 12.4 | ||||||
|
Finance costs |
(1.0 | ) | (1.2 | ) | ||||
|
Other non-operating expenses, net |
(0.6 | ) | (2.7 | ) | ||||
|
|
|
|
|
|
|
|||
|
Profit before tax |
9.3 | 8.5 | ||||||
|
Income tax expense |
(1.0 | ) | (3.0 | ) | ||||
|
|
|
|
|
|
|
|||
|
Profit from continuing operations |
8.3 | 5.5 | ||||||
|
Profit (loss) from discontinued operations |
(0.7 | ) | 10.1 | |||||
|
|
|
|
|
|
|
|||
|
Profit for the year |
7.6 | % | 15.6 | % | ||||
|
|
|
|
|
|
|
|||
|
Attributable to: |
||||||||
|
Equity holders of the Company—continuing operations |
10.0 | % | 5.5 | % | ||||
|
Equity holders of the Company—discontinued operations |
(0.7 | ) | 10.1 | |||||
|
Predecessors’ interests |
(1.7 | ) | — | |||||
|
|
|
|
|
|
|
|||
| 7.6 | % | 15.6 | % | |||||
|
|
|
|
|
|
|
|||
Year Ended December 31, 2017 Compared to Year Ended December 31, 2016
Revenue . Our revenue decreased by NT$447 million, or 2%, to NT$17,941 million (US$605 million) in 2017 from NT$18,388 million in 2016.
55
Table of Contents
Revenue from test services for memory and logic/mixed-signal semiconductors increased by NT$251 million, or 5%, to NT$4,838 million (US$163 million) in 2017 from NT$4,587 million in 2016. Revenue from test services for memory semiconductors increased by NT$351 million, or 10%, to NT$3,971 million (US$134 million) in 2017 from NT$3,620 million in 2016, principally due to the increased capacity utilization rate resulting from the higher customer demand. Revenue for test services for logic/mixed-signal semiconductors decreased by NT$100 million, or 10%, to NT$867 million (US$29 million) in 2017 from NT$967 million in 2016, principally due to the decreased capacity utilization rate resulting from the lower customer demand.
Revenue from assembly services for memory and logic/mixed-signal semiconductors decreased by NT$622 million, or 11%, to NT$5,259 million (US$177 million) in 2017 from NT$5,881 million in 2016. Revenue from assembly services for memory semiconductors decreased by NT$932 million, or 18%, to NT$4,352 million (US$147 million) in 2017 from NT$5,284 million in 2016, primarily as a result of the decreased average selling price and customer demand. Revenue from assembly services for logic/mixed-signal semiconductors increased by NT$310 million, or 52%, to NT$907 million (US$30 million) in 2017 from NT$597 million in 2016, primarily as a result of the increased capacity utilization rate resulting from the higher customer demand.
Revenue from LCD and other flat-panel display driver semiconductor assembly and test services decreased by NT$131 million, or 3%, to NT$4,790 million (US$162 million) in 2017 from NT$4,921 million in 2016. This decrease was principally as a result of a decrease in average selling price for LCD and other flat-panel display products.
Revenue from bumping services increased by NT$55 million, or 2%, to NT$3,054 million (US$103 million) in 2017 from NT$2,999 million in 2016. This increase was principally due to the increased average selling price and customer demand.
See “— Cost of Revenue and Gross Profit” for more information concerning our assembly and test capacity utilization rates and the impact on our revenue, gross profit and profitability from any increases or decreases in our capacity utilization rate.
Cost of Revenue and Gross Profit . Cost of revenue decreased by NT$42 million, or 1%, to NT$14,704 million (US$496 million) in 2017 from NT$14,746 million in 2016, primarily due to the decrease of direct material expenses, depreciation expenses and expendable equipment of NT$310 million (US$10 million), NT$194 million (US$7 million) and NT$352 million (US$12 million), respectively, and partially offset by the increase of direct labor expenses, employee benefit expenses, maintenance and repair, operating supplies, inventory supplies and subcontract fee of NT$359 million (US$12 million), NT$206 million (US$7 million), NT$68 million (US$2 million) , NT$69 million (US$2 million), NT$65 million (US$2 million) and NT$41 million (US$1 million), respectively.
Our gross profit decreased to NT$3,237 million (US$109 million) in 2017 from NT$3,642 million in 2016. Our gross margin was 18.0% in 2017, compared to 19.8% in 2016.
Our gross profit margin for test services for memory and logic/mixed-signal semiconductors decreased to 35.8% in 2017 from 36.8% in 2016, primarily due to the decreased sales of higher margin logic/mixed-signal semiconductors test services.
Our gross profit margin for assembly services for memory and logic/mixed-signal semiconductors decreased to 5.0% in 2017 from 11.3% in 2016, primarily due to the decrease in revenue resulted from the decreased average selling price.
Our gross profit margin for LCD and other flat-panel display driver semiconductor assembly and test services decreased to 25.5% in 2017 from 26.7% in 2016, primarily due to the decrease in revenue resulted from the decreased average selling price.
Our gross profit margin for bumping services increased to 0.6% in 2017 from -0.7% in 2016, primarily due to the increase in revenue resulted from the increased average selling price and customer demand.
Research and Development Expenses . Research and development expenses increased by NT$147 million, or 18%, to NT$986 million (US$33 million) in 2017 from NT$839 million in 2016, primarily due to the increase of employee benefit expenses resulted from the increase of employees.
Sales and Marketing Expenses . Sales and marketing expenses decreased by NT$9 million, or 12%, to NT$64 million (US$2 million) in 2017 from NT$73 million in 2016, primarily due to the decrease of employee benefit expenses.
General and Administrative Expenses . General and administrative expenses decreased by NT$182 million, or 22%, to NT$640 million (US$22 million) in 2017 from NT$822 million in 2016, primarily due to the decrease of employee benefit expenses and professional service fee resulted from the Merger.
56
Table of Contents
Other Operating Income (Expenses), Net . Other operating income increased by NT$603 million, or 670%, to NT$693 million (US$23 million) in 2017 from NT$90 million in 2016, primarily due to the increase of insurance compensation income of NT$480 million (US$16 million) and gain on disposal of property, plant and equipment of NT$130 million (US$4 million).
Finance Costs . Finance costs increased by NT$38 million, or 21%, to NT$217 million (US$7 million) in 2017 from NT$179 million in 2016. This change was primarily due to the increase of interest expense from bank loans and leasing by NT$46 million (US$2 million) and partially offset by the decrease of financial cost of bank loans by NT$8 million (US$270 thousand).
Other Non-Operating Income (Expenses), Net . Other non-operating expense increased by NT$371 million, or 312%, to NT$490 million (US$17 million) in 2017 from NT$119 million in 2016. This change was primarily due to the increase of foreign exchange losses by NT$224 million (US$8 million) and share of loss of associates by NT$208 million (US$7 million).
Profit before Income Tax . As a result of the foregoing, profit before income tax decreased by 10% to NT$1,532 million (US$52 million) in 2017 from NT$1,700 million in 2016.
Income Tax Expense . We had an income tax expense of NT$551 million (US$19 million) in 2017 compared to income tax expense of NT$177 million for 2016, primarily due to the income tax expense of NT$247 million (US$8 million) in 2017 from additional 10% tax on unappropriated earnings and the tax benefit of NT$175 million in 2016 from reversing the additional 10% tax on respective unappropriated earnings due to the capital reorganization.
Profit for the Year Attributable to Equity Holders of the Company . As a result of the foregoing operations as well as increase in profit from discontinued operations, the profit for the year attributable to the Company was NT$2,797 million (US$94 million) in 2017, compared to NT$1,707 million in 2016.
Year Ended December 31, 2016 Compared to Year Ended December 31, 2015
Revenue . Our revenue decreased by NT$449 million, or 2%, to NT$18,388 million in 2016 from NT$18,837 million in 2015.
Revenue from test services for memory and logic/mixed-signal semiconductors increased by NT$41 million, or 1%, to NT$4,587 million in 2016 from NT$4,546 million in 2015. Revenue from test services for memory semiconductors decreased by NT$170 million, or 5%, to NT$3,620 million in 2016 from NT$3,790 million in 2015, principally due to the decreased average selling price. Revenue for test services for logic/mixed-signal semiconductors increased by NT$211 million, or 28%, to NT$967 million in 2016 from NT$756 million in 2015, principally due to the increased capacity utilization rate resulting from the higher customer demand.
Revenue from assembly services for memory and logic/mixed-signal semiconductors increased by NT$355 million, or 6%, to NT$5,881 million in 2016 from NT$5,526 million in 2015. Revenue from assembly services for memory semiconductors increased by NT$318 million, or 6%, to NT$5,284 million in 2016 from NT$4,966 million in 2015, primarily as a result of the increased average selling price and capacity utilization rate resulting from the higher customer demand. Revenue from assembly services for logic/mixed-signal semiconductors increased by NT$37 million, or 7%, to NT$597 million in 2016 from NT$560 million in 2015, primarily as a result of the increased average selling price and capacity utilization rate resulting from the higher customer demand.
Revenue from LCD and other flat-panel display driver semiconductor assembly and test services decreased by NT$475 million, or 9%, to NT$4,921 million in 2016 from NT$5,396 million in 2015. This decrease was principally as a result of a decrease in average selling price and customer demand for LCD and other flat-panel display products.
Revenue from bumping services decreased by NT$370 million, or 11%, to NT$2,999 million in 2016 from NT$3,369 million in 2015. This decrease was principally due to the decreased average selling price and decrease in customer demand.
See “— Cost of Revenue and Gross Profit” for more information concerning our assembly and test capacity utilization rates and the impact on our revenue, gross profit and profitability from any increases or decreases in our capacity utilization rate.
Cost of Revenue and Gross Profit . Cost of revenue increased by NT$60 million, or 1%, to NT$14,746 million in 2016 from NT$14,686 million in 2015, primarily due to the increase of direct material expenses, depreciation expenses and inventory supplies of NT$75 million, NT$187 million and NT$54 million, respectively, and partially offset by the decrease of direct labor expenses and utilities expenses of NT$134 million and NT$107 million, respectively.
57
Table of Contents
Our gross profit decreased to NT$3,642 million in 2016 from NT$4,152 million in 2015. Our gross margin was 19.8% in 2016, compared to 22.0% in 2015.
Our gross profit margin for test services for memory and logic/mixed-signal semiconductors increased to 36.8% in 2016 from 34.9% in 2015, primarily due to the increased sales of higher margin logic/mixed-signal semiconductors test services.
Our gross profit margin for assembly services for memory and logic/mixed-signal semiconductors increased to 11.3% in 2016 from 10.2% in 2015, primarily due to the increased sales of higher margin memory semiconductors assembly services.
Our gross profit margin for LCD and other flat-panel display driver semiconductor assembly and test services decreased to 26.7% in 2016 from 31.0% in 2015, primarily due to the decrease in revenue resulted from the decreased average selling price and customer demand.
Our gross profit margin for bumping services decreased to -0.7% in 2016 from 9.7% in 2015, primarily due to the decrease in revenue resulted from the decreased average selling price and customer demand.
Research and Development Expenses . Research and development expenses increased by NT$91 million, or 12%, to NT$839 million in 2016 from NT$748 million in 2015, primarily due to the increase of employee benefit expenses resulted from the increase of employees.
Sales and Marketing Expenses . Sales and marketing expenses decreased by NT$17 million, or 19%, to NT$73 million in 2016 from NT$90 million in 2015, primarily due to the decrease of commissions expenses resulted from the decrease of the targeted customer demand.
General and Administrative Expenses . General and administrative expenses increased by NT$52 million, or 7%, to NT$822 million in 2016 from NT$770 million in 2015, primarily due to the increase of professional service fee resulted from the Merger.
Other Operating Income (Expenses), Net. Other operating income decreased by NT$15 million, or 14%, to NT$90 million in 2016 from NT$105 million in 2015, primarily due to the reversal of accrued compensation fee of NT$15 million in 2015.
Finance Costs . Finance costs increased by NT$36 million, or 25%, to NT$179 million in 2016 from NT$143 million in 2015. This change was primarily due to the increase of interest expense and financial cost of bank loans by NT$18 million and NT$19 million.
Other Non-Operating Income (Expenses), Net . Other non-operating income decreased by NT$459 million, or 135%, to other non-operating expense of NT$119 million in 2016 from other non-operating income of NT$340 million in 2015. This change was primarily due to the increase of foreign exchange losses by NT$437 million.
Profit before Income Tax . As a result of the foregoing, profit before income tax decreased by 40% to NT$1,700 million in 2016 from NT$2,846 million in 2015.
Income Tax Expense . We had an income tax expense of NT$177 million in 2016 compared to income tax expense of NT$936 million for 2015, primarily due to the decrease of profit before income tax and the tax benefit of NT$175 million from reversing the additional 10% tax on respective unappropriated earnings due to the capital reorganization.
Profit for the Year Attributable to Non-controlling Interests . The profits of ChipMOS BVI, ChipMOS Shanghai and ThaiLin attributable to non-controlling interests amounted to nil in 2016, compared to NT$37 million in 2015.
Profit for the Year Attributable to Equity Holders of the Company . As a result of the foregoing, the profit for the year attributable to the Company was NT$1,707 million in 2016, compared to NT$2,130 million in 2015.
Critical Accounting Policies
We prepare our consolidated financial statements in conformity with the IFRSs. Under the IFRSs, we are required to make certain estimates, judgments and assumptions about matters that are highly uncertain at the time those estimates, judgments and assumptions are made, and our financial condition or results of operations may be materially impacted if we use different but nonetheless reasonable estimates, judgments or assumptions about those matters for that particular period or if we change our estimates, judgments or assumptions from period to period.
58
Table of Contents
Under the IFRSs, the significant accounting policies are set forth in Note 2 to our consolidated financial statements contained in this Annual Report on Form 20-F. The significant accounting policies that require us to make estimates and assumptions about the effect of matters that are inherently uncertain are discussed below.
Provision for sales allowance
We estimate sales discounts and returns based on historical results and other known factors. Provisions for such liabilities are recorded as a deduction item to sales revenues when the sales are recognized. We reassesses the reasonableness of estimates of discounts and returns periodically. As of December 31, 2017, the ending balances for current provision for sales allowance is NT$70 million (US$2 million).
Provision for deficiency compensation
We are primarily providing high-integration and high-precision integrated circuit of the packaging and testing services. In cases of deficiencies in the assembly and testing services provided, we have to clarify the reason for deficiencies and attribution of responsibility.We follows the guidance of IAS 37 “Provisions, Contingent Liabilities and Contingent Assets” to determine provisions for deficiency compensation. Since the timing and amount of these provisions are based on assumptions and estimates it requires management to make critical judgments. As of December 31, 2017, the ending balances for current provision for deficiency compensation is NT$57 million (US$2 million).
Impairment of receivables
Receivables are assessed for indicators of impairment at the end of each reporting period, and are impaired where there is objective evidence that, as a result of one or more events that occurred after the initial recognition of the receivables, the estimated future cash flows of the receivables have been impacted. For the customer that we have reason to believe may have an inability to meet its financial obligations, we conduct an individual examination based on the available facts and circumstances to record a specific reserve. For the customers other than this, we also provide a reserve for doubtful receivables based upon the available facts and circumstances, historical collection and write-off experiences of all trade and other receivables. As of December 31, 2017, we provided nil for the first type of reserve and nil for the second type of reserve.
The allowance we set aside for doubtful receivables was NT$87 thousand as of December 31, 2016 and nil as of December 31, 2017. The allowances as of December 31, 2016 and 2017 represented 0.002% and nil, respectively, of our accounts receivable as of those dates. The allowance and reversal in 2016 and 2017 reflected an enlargement and reduction of NT$87 thousand and NT$87 thousand (US$3 thousand), respectively, in accounts receivable that increased and decreased the sales and marketing expenses. If we were to change our estimate of the allowance for doubtful receivables either upward or downward 10%, our operating profit would be affected by nil for 2017.
An increase in our allowance for doubtful receivables would increase our sales and marketing expenses, and decrease our current assets.
Depreciation of property, plant and equipment
Property, plant and equipment are depreciated on a straight-line basis over their estimated economic useful lives. The determination of the useful lives involves management’s estimation. The Group assesses annually the useful life of the property, plant and equipment and if the expectation differs from the original estimate, such a difference may impact the depreciation in the year when the estimate is changed and the future period.
By considering the Company’s experience on using similar property, plant and equipment in prior periods as well as by referring to the experience from peer industries, on November 10, 2016, the Board of Directors approved to change the estimated useful lives of certain properties from 11 years to 16 years and certain equipment from 2~6 years to 2~8 years effectively from November 1, 2016, in order to better reflect economic benefits from consumption of those property and equipment.
Deferred Tax Assets
Deferred tax assets are recognized for unused tax losses, temporary differences, and tax credit to the extent that it is probable that taxable profit will be available against which the losses can be utilized. Significant management judgment is required to determine that amount of deferred tax assets that can be recognized, based upon the likely timing and the level of future taxable profits together with future tax planning strategies.
59
Table of Contents
The Company has not recognized deductible and taxable temporary differences associated with investment as deferred tax assets. As of December 31, 2016 and 2017, the amounts of deductible temporary differences unrecognized as deferred tax assets were NT$535 million and NT$29 million (US$964 thousand), respectively.
As of December 31, 2016 and 2017, the ending balances for deferred tax assets were NT$250 million and NT$212 million (US$7 million), respectively.
Deferred Tax Liabilities
Deferred tax liabilities are recognized for all taxable temporary differences, except when the deferred tax liability arises from the initial recognition of goodwill or an asset or liability in a transaction that is not a business combination and, at the time of the transaction, affects neither the accounting profit nor taxable profit or loss; and in respect of taxable temporary differences associated with investments in subsidiaries, associates and joint ventures, when the timing of the reversal of the temporary differences can be controlled and it is probable that the temporary differences will not reverse in the foreseeable future.
The Company has not recognized taxable temporary differences associated with investment as deferred tax liabilities. As of December 31, 2016 and 2017, the amounts of taxable temporary differences unrecognized as deferred tax liabilities were nil and NT$921 million (US$31 million), respectively.
As of December 31, 2016 and 2017, the ending balances for deferred tax liabilities were NT$93 million and NT$174 million (US$6 million), respectively.
Impairment of Non-Financial Assets
Impairment exists when the carrying value of an asset or cash generating unit exceeds its recoverable amount, which is the higher of its fair value less costs of disposal and its value in use. The fair value less costs of disposal calculation is based on available data from binding sales transactions, conducted at arm’s length, for similar assets or observable market prices less incremental costs for disposing of the asset. The value in use calculation is based on a discounted cash flow (“DCF”) model. The cash flows are derived from the budget for the next five years and do not include restructuring activities that the Group is not yet committed to or significant future investments that will enhance the asset’s performance of the cash generating unit being tested. The recoverable amount is sensitive to the discount rate used for the DCF model as well as the expected future cash-inflows and the growth rate used for the extrapolation purposes.
In determining whether any impairment charges were necessary for the property, plant and equipment and other non-current assets for the year ended December 31, 2017, we assumed that the semiconductor industry will continue its growth in the next few years. Based upon our assumption of growth in the semiconductor industry and our other assumptions in our internal budget, for the purpose of determining whether any impairment charges are necessary for the year ended December 31, 2017, an impairment loss of NT$956 thousand (US$32 thousand) and nil were recognized with respect to property, plant and equipment and other non-current assets.
While we believe that our estimates of future cash flows are reasonable, any changes in these estimates based on changed economic conditions or business strategies could result in significant impairment changes in future periods.
Defined Benefit Plans
The cost of the defined benefit pension plan and post-employment benefits and the present value of the pension obligation are determined using actuarial valuations. An actuarial valuation involves making various assumptions that may differ from actual developments in the future. These include the determination of the discount rate, future salary increases, mortality rates and future pension increases. Due to the complexities involved in the valuation and its long-term nature, a defined benefit obligation is highly sensitive to change in these assumptions. All assumptions are reviewed at each reporting date. Further details are disclosed in Note 23 to our consolidated financial statements contained in this Annual Report on Form 20-F.
Share-Based Payments
The Group measures the cost of equity-settled transactions with employees by reference to the fair value of the equity instruments at the date at which they are granted. Estimating fair value for share-based payments requires determining the most appropriate valuation model for a grant of equity instruments, which is dependent on the terms and conditions of the grant. This also requires determining the most appropriate inputs to the valuation model including the expected life of the option, volatility and dividend yield and making assumptions about them. The assumptions and models used for estimating fair value for share-based payments are disclosed in Note 35 to our consolidated financial statements contained in this Annual Report on Form 20-F. In 2017, the share-based compensation expense amounted to NT$123 million (US$4 million), which was taken into account when determining our profit for the year and shareholders’ equity for the year ended December 31, 2017.
60
Table of Contents
Senior Management’s Discussion with the Audit Committee
Our management has discussed the critical accounting policies described above with the audit committee of our board of directors and the audit committee has reviewed our disclosure relating to the critical accounting policies in this section.
Impact of Foreign Currency Fluctuations and Governmental or Political Factors
For a discussion of the impact of foreign currency fluctuations and governmental economics, fiscal, monetary or political policies or factors that may directly or indirect impact us, see “Item 3. Key Information—Risks Factors—Risks Relating to Our Business—Fluctuations in exchange rates could result in foreign exchange losses” and “Item 3. Key Information—Risks Factors—Risks Relating to Countries in Which We Conduct Operations”.
Liquidity and Capital Resources
Since our inception, we have funded our operations and growth primarily through the issuance of equity, a mixture of short- and long-term loans and cash flow from operations. As of December 31, 2017, our primary sources of liquidity were cash and cash equivalents of NT$8,036 million (US$271 million), short-term loans of NT$5,409 million (US$182 million) available to us in undrawn facilities, which have expired or will expire from February 2018 to November 2018, and long-term loans of NT$2,400 million (US$81 million) available to us in undrawn facilities, which will expire in June 2021. We have taken the following steps to meet our liquidity, capital spending and other capital needs.
In May 2016, the Company obtained a syndicated loan facility from banks in Taiwan in the amount of NT$13,200 million for a term of five years, which was used to refinance the existing syndicated loan in May 2016, and to suffice our working capital. See “Item 3. Key Information—Risk Factors—Risks Relating to Our Business—Our significant amount of indebtedness and interest expense will limit our cash flow and could adversely affect our operations” for additional information.
In order to adjust capital structure and increase returns of equity, on March 15, 2018, our board of directors approved a capital reduction plan (the “2018 Capital Reduction Plan”), under which the Company will reduce its share capital by 15%. As a result, 15% of the total number of issued shares will be canceled, proportionately to the shareholding of each Shareholder. The issued shares of the Company include (i) the issued and outstanding shares not held in the ADS deposit facility, 15 % of which will be canceled, and cash will be distributed to the holders of these shares, (ii) the issued and outstanding shares held in the ADS deposit facility, 15% of which will be canceled, and accordingly, 15% of the ADSs representing these shares will be canceled, and cash will be distributed to holders of ADSs representing these canceled shares, (iii) issued shares not outstanding that are treasury stock, 15% of which will be canceled, and no cash will be distributed with respect to these shares, and (iv) issued shares not outstanding acquired by the Company pursuant to the restricted share agreement with the employees, 15% of which will be canceled, and no cash will be distributed with respect to these shares, in each case of (i)-(iv), in accordance with the 2018 Capital Reduction Plan. The ratio between one ADS and the number of underlying Common Shares remain unchanged under the 2018 Capital Reduction Plan. Upon approval by the shareholders in the shareholders’ meeting and competent authority, each holder of the outstanding Common Shares will receive an amount calculated by approximately NT$1.5 per common share and each holder of ADS will receive an amount calculated by approximately NT$30 per ADS under the 2018 Capital Reduction Plan.
As of March 31, 2018, we have a total of 886,144,061 issued Common Shares and 8,701,686 issued and outstanding ADSs. Under the 2018 Capital Reduction Plan, the Company’s share capital is expected to be reduced by NT$1,329,216,090, and 132,921,609 issued Common Shares and 1,305,252 issued and outstanding ADSs are expected to be canceled.
Since November 1, 2016, when the Company first issued ADSs, the total number of issued and outstanding Company ADSs has decreased by 16,918,581 ADSs, representing approximately 66% of the total number of issued and outstanding ADSs first issued, as a result of ADS holders surrendering their ADSs to the depositary for cancellation and withdrawing the underlying shares from the deposit facility, pursuant to the Company’s deposit agreement with the depositary.
61
Table of Contents
Liquidity
The following table sets forth our cash flows with respect to operating activities, investing activities, financing activities and the effect of exchange rate changes on cash for the periods indicated.
| Year ended December 31, | ||||||||||||
| 2016 | 2017 | 2017 | ||||||||||
| NT$ | NT$ | US$ | ||||||||||
| (in millions) | ||||||||||||
|
Net cash generated from (used in): |
||||||||||||
|
Operating activities |
$ | 3,688.0 | $ | 4,157.3 | $ | 140.3 | ||||||
|
Investing activities |
(4,556.7 | ) | (3,493.4 | ) | (117.9 | ) | ||||||
|
Financing activities |
(3,223.9 | ) | (550.8 | ) | (18.6 | ) | ||||||
|
|
|
|
|
|
|
|||||||
|
Net increase in cash and cash equivalents |
$ | (4,092.6 | ) | $ | 113.1 | $ | 3.8 | |||||
|
|
|
|
|
|
|
|||||||
Net Cash Generated from Operating Activities
Net cash generated from operating activities totaled NT$4,157 million (US$140 million) in 2017, compared to NT$3,688 million in 2016. Net cash generated from operating activities was positively impacted by a profit before income tax of NT$3,347 million (US$113 million) with depreciation expenses of NT$2,899 million (US$98 million) in 2017 compared to a profit before income tax of NT$1,578 million with depreciation expenses of NT$3,228 million in 2016. The increase in net cash generated from operating activities was primarily due to a decrease of accounts and notes receivable of NT$128 million (US$4 million) in 2017 compared to an increase of accounts and notes receivable of NT$480 million in 2016, an increase of other payables of NT$439 million (US$15 million) in 2017 compared to a decrease of other payables of NT$250 million in 2016 and partially offset by the increase of gain on disposal of a subsidiary which was NT$1,843 million (US$62 million) in 2017 compared to nil in 2016 and insurance compensation income which was NT$487 million (US$16 million) in 2017 compared to nil in 2016.
Net cash generated from operating activities totaled NT$3,688 million in 2016, compared to NT$5,396 million in 2015. Net cash generated from operating activities was positively impacted by a profit before income tax of NT$1,578 million with depreciation expenses of NT$3,228 million in 2016 compared to a profit before tax of NT$2,812 million with depreciation expenses of NT$3,019 million in 2015. The decrease in net cash generated from operating activities was primarily due to an increase of accounts and notes receivable of NT$480 million in 2016 compared to a decrease of accounts and notes receivable of NT$986 million in 2015 and partially offset by the payment of income tax of NT$499 million in 2016, compared to NT$1,412 million in 2015.
Net Cash Used in Investing Activities
Net cash used in investing activities totaled NT$3,493 million (US$118 million) in 2017, compared to NT$4,557 million in 2016. The decrease in net cash used in investing activities primarily resulted from the increase in net cash flow from disposal of a subsidiary which was NT$1,781 million (US$60 million) in 2017, compared to nil in 2016, proceeds from insurance compensation which was NT$487 million (US$16 million) in 2017, compared to nil in 2016 and proceeds from disposal of property, plant and equipment which was NT$307 million (US$10 million) in 2017, compared to NT$59 million in 2016 and partially offset by the increase in acquisition of investment in associate which was NT$1,373 million (US$46 million) in 2017, compared to nil in 2016.
Net cash used in investing activities totaled NT$4,557 million in 2016, compared to NT$4,504 million in 2015. The increase in net cash used in investing activities primarily resulted from the increase in capital expenditures which was NT$4,471 million in 2016, compared to NT$4,428 million in 2015.
Net Cash Used in Financing Activities
Net cash used in financing activities totaled NT$551 million (US$19 million) in 2017, compared to net cash used in financing activities totaled NT$3,224 million in 2016. The decrease in net cash used in financing activities was primarily the result of the net proceeds of short-term loans of NT$1,282 million (US$43 million) in 2017, compared to net payment on short-term loans of NT$1,149 million in 2016, the payments on repurchase of shares of nil in 2017, compared to NT$1,008 million in 2016, the payments in cash distribution of NT$857 million (US$29 million) in 2017, compared to NT$1,793 million in 2016 and the payments on capital reorganization which was nil in 2017, compared to NT$3,342 million in 2016 and partially offset by the net payments of long-term loans of NT$976 million (US$33 million) in 2017, compared to net proceeds of long-term loans of NT$4,359 million in 2016.
62
Table of Contents
Net cash used in financing activities totaled NT$3,224 million in 2016, compared to net cash used in financing activities totaled NT$4,029 million in 2015. The decrease in net cash used in financing activities was primarily the result of the net proceeds of long-term loans of NT$4,359 million in 2016, compared to net proceeds of long-term loans of NT$492 million in 2015 and partially offset by the payments on capital reorganization of NT$3,342 million in 2016, compared to nil in 2015.
Capital Resources
Capital expenditures in 2016 were funded by NT$3,688 million in cash flows from operating activities. Capital expenditures in 2017 were funded by NT$4,157 million (US$140 million) in cash flows from operating activities.
Steps taken with respect to generating additional working capital and to saving cash are further discussed under “—Liquidity and Capital Resources”.
Loans
As of December 31, 2017, we had long-term loans of NT$9,642 million (US$325 million) (including current portions of such long-term loans of NT$2,143 million (US$72 million). As of December 31, 2017, NT$7,175 million (US$242 million) of our long-term loans were collateralized by land, buildings and equipment. Our long-term loans were floating rate loans with a rate of 1.7895% as of December 31, 2017, repayable semi-annually from December 2017 to June 2021.
We had entered into the following syndicated loan and long-term loans facilities:
| • | On July 14, 2011, we obtained a syndicated loan facility from banks in Taiwan in the amount of NT$8,410 million separated into two parts with its respective term of four years and five years. This loan facility is secured by existing land and buildings and equipment. This loan facility was fully drawn in 2011 and fully repaid in July 2014. |
| • | On May 24, 2013, we obtained a bank loan facility from a bank in Taiwan in the amount of NT$400 million for a term of two years. This loan facility is unsecured credit for us, drawn amount limited to NT$600 million in total long-term loan and short-term loan drawn. This loan facility has expired in May 2014. |
| • | On July 2, 2014, we obtained a syndicated loan facility from banks in Taiwan in the amount of NT$10,000 million in a term of five years. This loan facility is secured by existing land and buildings and equipment. This loan facility was fully drawn in 2016 and fully repaid in June 2016. |
| • | On May 16, 2016, we obtained a syndicated loan from banks in Taiwan in the amount of NT$13,200 million with a term of five years. This loan facility is secured by existing land and buildings and equipment. As of the date of this Annual Report on Form 20-F, this loan facility was drawn of NT$10,800 million. |
Certain of our loan agreements and indentures contain covenants that, if violated, could result in the obligations under these agreements becoming due prior to the originally scheduled maturity dates. These covenants include financial covenants that require us to:
| • | maintain current assets to current liabilities ratio above 1:1; |
| • | maintain total indebtedness to shareholders’ equity ratio below 1.4:1; |
| • | maintain total indebtedness to shareholders’ equity (excluding intangible assets) ratio below 1.5:1; |
| • | maintain the profit before interest, taxes, depreciation and amortization to gross interest expense ratio above 2.5:1. |
We were in compliance with these financial covenants ratio requirements for 2013 to 2017.
In addition, a substantial portion of our short-term and long-term borrowings may be subject to repayment upon a material deterioration of our financial condition, results of operations or our ability to perform under the loan agreements.
63
Table of Contents
Set forth below are the maturities of our long-term bank loans outstanding as of December 31, 2017:
|
As of
December 31, 2017 |
||||||||
| NT$ | US$ | |||||||
| (in millions) | ||||||||
|
During 2018 |
$ | 2,143 | $ | 72 | ||||
|
During 2019 |
2,153 | 73 | ||||||
|
During 2020 |
3,503 | 118 | ||||||
|
During 2021 |
1,843 | 62 | ||||||
|
During 2022 and onwards |
— | — | ||||||
|
|
|
|
|
|||||
| $ | 9,642 | $ | 325 | |||||
|
|
|
|
|
|||||
As of December 31, 2017, certain of our property, plant and equipment and other financial assets-non current with an aggregate net book value of NT$7,164 million (US$242 million) and NT$70 million (US$2 million), respectively, were pledged as collateral mainly for long-term bank loans and leases.
Our unused credit lines for short-term loans, as of December 31, 2017, totaled NT$5,409 million (US$182 million), which have expired or will expire from February 2018 to November 2018. As of December 31, 2017, our unused long-term credit facilities totaled NT$2,400 million (US$81 million) which will expire in June 2021.
As of December 31, 2017, we had unsecured short-term loans of working capital in the total amount of NT$600 million (US$20 million), which were due between January 2018 and February 2018, and unsecured export loan in the total amount of NT$297 million (US$10 million), which was due in January 2018, and unsecured import loan in the total amount of NT$72 million (US$3 million), which was due in Januray 2018.
We believe our current cash and cash equivalents, cash flows from operations and available credit facilities will be sufficient to meet our capital spending, commitments and other capital needs through the end of 2018. There can be no assurance regarding these matters, however, considering prevailing global economic conditions which continue to have a negative impact on our ability to accurately forecast our revenues, results of operations and cash position. See “Item 3. Key Information—Risk Factors—Risks Relating to Our Business—Our significant amount of indebtedness and interest expense will limit our cash flow and could adversely affect our operations”.
Research and development, patents and licenses
See the discussion under “Item 4. Information on the Company—Research and Development”.
Trend Information
See the discussion under “Item 4. Information on the Company—Our Structure and History”, “Item 4. Information on the Company—Industry Background” and “Item 4. Information on the Company—Competition”.
Off-Balance Sheet Arrangements
As of December 31, 2017, we had no off-balance sheet arrangements.
64
Table of Contents
Taxation
The Company is entitled to tax incentives generally available to Taiwan companies under the ROC Statute of Upgrading Industries, a profit-seeking enterprise may deduct up to (i) 15% of its research and development expenditures from its income tax payable for the fiscal year in which these expenditures are incurred; or (ii) 10% of its research and development expenditures from its income tax payable for the fiscal year in which these expenditures are incurred or the following two years. However, the deduction may not exceed 30% of the income tax payable for that fiscal year. In 2016 and 2017, tax credits resulted in tax savings for the Company of approximately nil and NT$7 million (US$236 thousand), respectively.
ThaiLin is also entitled to other tax incentives generally available to Taiwan companies under the ROC Statute of Upgrading Industries, including tax credits of 5% to 7% for certain investment in automated equipment and technology. These tax credits must be utilized within five years from the date on which they were earned. In addition, except for the last year of the five-year period, the aggregate tax reduction from these tax credits for any year cannot exceed 50% of such year’s income tax liability. In 2014 and 2015, tax credits resulted in tax savings for ThaiLin of approximately nil and nil, respectively.
Profit for the year generated by the Company and ThaiLin after January 1, 1998, which is not distributed in the year following the year the profit was generated, is subject to additional income tax at the rate of 10%. If that profit for the year is subsequently distributed, the additional income tax previously paid on that income is credited against the amount of withholding tax payable by shareholders, who are not individuals or entities of the Republic of China (for taxation purposes), in connection with the distribution.
The ROC government enacted the alternative minimum tax (“AMT”) Act that became effective on January 1, 2006. The AMT imposed under the AMT Act is a supplemental tax which is payable if the income tax payable pursuant to the ROC Income Tax Act is below the minimum amount prescribed under the AMT Act. The taxable income for calculating the AMT includes most income that is exempted from income tax under various legislations, such as tax holidays and investment tax credits. The AMT rate for business entities is 12%. However, the AMT Act grandfathered certain tax exemptions and tax credits granted prior to the enactment of the AMT. The effects of the AMT on the tax expenses of the Company was reflected in 2017.
The amendment to the Income Tax Act has been approved and promulgated in February 2018 raising the profit-seeking enterprise income tax rate from 17% to 20%, decrease the tax rate on unappropriated retained earnings from 10% to 5%, and abandon the imputation tax credit account effective from fiscal year starting January 1, 2018.
Tabular Disclosure of Contractual Obligations and Commercial Commitments
The following table summarizes our contractual obligations and commitments as of December 31, 2017, or the periods indicated:
| Payments Due by Period | ||||||||||||||||||||
|
Contractual Obligations |
Total |
Less than
1 year |
2-3 years | 4-5 years |
More than
5 years |
|||||||||||||||
| NT$ | NT$ | NT$ | NT$ | NT$ | ||||||||||||||||
| (in millions) | ||||||||||||||||||||
|
Long-term debts (1) |
$ | 10,062 | $ | 2,322 | $ | 5,876 | $ | 1,864 | $ | — | ||||||||||
|
Short-term loans (1) |
972 | 972 | — | — | — | |||||||||||||||
|
Operating leases |
309 | 39 | 66 | 64 | 140 | |||||||||||||||
|
Capital commitments |
2,178 | 2,178 | — | — | — | |||||||||||||||
|
|
|
|
|
|
|
|
|
|
|
|||||||||||
|
Total contractual cash obligations |
$ | 13,521 | $ | 5,511 | $ | 5,942 | $ | 1,928 | $ | 140 | ||||||||||
|
|
|
|
|
|
|
|
|
|
|
|||||||||||
Note:
| (1) | Includes interest payments. Assumes level of relevant interest rates remains at December 31, 2017, level throughout all relevant periods. |
In addition to the commitments set forth in the contractual obligations table above, we have certain outstanding purchase orders relating to the procurement of raw materials for which there are no definite delivery dates or deadlines.
65
Table of Contents
| Item 6. | Directors, Senior Management and Employees |
Directors and Senior Management
The number of directors must not be less than nine and must not be greater than eleven according to our articles of incorporation. Our board of directors currently comprises of nine directors (eight actually in office and one vacancy) who were elected by our shareholders. The term of office for directors is three years. Of our current eight directors, five are independent directors. The chairman of our board is appointed among the members of our board.
Pursuant to ROC Securities and Exchange Act, a public company is required to either establish an audit committee or to have supervisors. A public company’s audit committee should be composed of all of its independent directors but not less than three, of which at least one member should have accounting or related financial management expertise, and the relevant provisions under the ROC Securities and Exchange Act, the ROC Company Act and other laws applicable to the supervisors are also applicable to the audit committee. We are also required to establish a compensation committee which must be composed of qualified independent members as defined under local law. The Company has established its audit committee and compensation committee.
Pursuant to the ROC Company Act, a person may serve as our director in his or her personal capacity or as the representative of another legal entity. A director who serves as the representative of a legal entity may be removed or replaced at any time at the discretion of that legal entity, and the replacement director may serve the remainder of the term of office of the replaced director. All of our current eight directors are served in his or her personal capacity.
The following table sets out the names of our directors and executive officers, their positions with our company and their ages as of March 31, 2018. The business address for our directors and executive officers is No. 1, R&D Road 1, Hsinchu Science Park, Hsinchu, Taiwan, and Republic of China.
|
Name |
Age |
Position |
Term Expires | |||
| Shih-Jye Cheng | 59 | Chairman and Director/President | 2019 | |||
| Yu-Hu Liu | 59 | Director | 2019 | |||
| Wen-Ching Lin | 61 | Director | 2019 | |||
| Chin-Shyh Ou | 60 | Independent Director | 2019 | |||
| Tai-Haur Kuo | 57 | Independent Director | 2019 | |||
| Yuh-Fong Tang | 63 | Independent Director | 2019 | |||
| Kuei-Ann Wen | 57 | Independent Director | 2019 | |||
| Cho-Lien Chang | 56 | Independent Director | 2019 | |||
| Lafair Cho | 55 | Senior Executive Vice President/Chief Operating Officer | — | |||
| Silvia Su | 47 | Senior Director, Finance and Accounting Management Center | — |
Shih-Jye Cheng has served as a director and president of the Company since 1997 and the chairman of the Company since June 2003. He has been the vice chairman of ChipMOS Shanghai since February 2017. He is the sibling of President of ChipMOS USA. He was the chairman of ThaiLin from 2002 to 2013, a director of Syntax-Brillian Corporation from November 2005 to June 2008, the chairman of ChipMOS Shanghai from 2002 to June 2005, the chairman of CHANTEK ELECTRONIC CO., LTD. from 2002 to November 2005, the chairman of ChipMOS Logic TECHNOLOGIES INC. from January 2004 to November 2005, the chairman of Advanced Micro Chip Technology Co., Ltd. from 2003 to April 2004 and a director of Ultima Electronics Corp. from 2000 to June 2003. He was a division head of the back-end operation of Mosel from 1992 to 1997. Mr. Cheng has a master’s degree in business administration from Saginaw Valley State University. Mr. Cheng was indicted by the Taipei District Prosecutor’s Office for matters relating to the purchase by the Company and ThaiLin of certain repurchase notes in 2004. Mr. Cheng was found not guilty by the Taipei District Court on October 1, 2007 and by the High Court on September 3, 2013. The Taiwan High Court’s Prosecutor’s Office filed a petition for appeal against the High Court’s decision on September 18, 2013. Mr. Cheng was confirmed not guilty by Taiwan’s Supreme Court on August 7, 2014. The Supreme Court’s ruling is not subject to appeal and the litigation closed.
Yu-Hu Liu has served as one of our directors since June 2013. Mr. Liu has been the supervisor of Siliconware Investment Co., Ltd. since June 2011 and supervisor of Yann Yuan Investment Co., Ltd. since 2015. He was supervisor and Vice President of Siliconware Precision from 2011 to 2013 and 2006 to 2011, respectively. Mr. Liu holds a master’s degree from National United University.
66
Table of Contents
Wen-Ching Lin has served as one of our directors since May 2016. Mr. Lin has been the chairman of Yann Fong Investment Co., Ltd., since April 2000, the director and president of Shi Kai Investment Co., Ltd., since December 2015, the president of Zhi Sheng Investment Co., Ltd. since December 2015 and the chairman of Yann Yuan Investment Co., Ltd. since July 2016. He was the supervisor of Siliconware Precision from June 2011 to June 2014. Mr. Lin graduated from Takushoku University.
Chin-Shyh Ou has served as one of our directors since June 2007. He was one of ChipMOS Bermuda’s directors since June 2007 until ChipMOS Bermuda was merged with and into the Company. Mr. Ou joined the National Chengchi University as an associate professor in 1993, a professor from 1997 to January 2018 and a adjunct professor since February 2018. In 1998, he joined National Chung Cheng University as a professor and the chairman of the Department of Accounting. He led a project to establish the Graduate Institute of Accounting and Information Technology at National Chung Cheng University in 1999. Mr. Ou earned a master degree in Public Policy and Management from Carnegie Mellon University, and a Ph.D. degree in Business Administration (Accounting) from the University of Minnesota. Mr. Ou holds several professional licenses and qualifications, including U.S. Certified Public Accountant and Certified Internal Auditor.
Tai-Haur Kuo has served as one of our directors since June 2013. Mr. Kuo has been a professor of the department of Electrical Engineering at National Cheng Kung University since 1992. He has served as the independent director of Holtek Semiconductor Inc. since 2016. He was the director of ZillTek Technology from 2016 to March 2018. He holds a Ph.D. degree in Electrical Engineering from University of Maryland.
Yuh-Fong Tang has served as one of our directors since June 2013. Mr. Tang has served as the independent director of OPNET technologies Co., Ltd. since January 2015 and the consultant of Intelligent Silicon Solution Corporation since February 2018. He was the chairman and chief executive officer of Myson Century, Inc. from June 2012 to January 2018, the chairman of ZAVIO Inc. from December 2015 to January 2018, the chairman of compensation committee of Carnival Industrial Corporation from February 2012 to June 2017. He was the vice chairman of Pack-Link Management Corp. from August 2000 to 2007, the director of Yulon IT Solutions Inc. from 2007 to May 2013, the independent director of Zhengyuan Technology Co., Ltd. from 2007 to May 2013 and the Supervisor of TrueLight Corp. from January 2009 to November 2010. Mr. Tang holds a Ph.D. degree in Electrical Engineering from University of Illinois.
Kuei-Ann Wen has served as one of our directors since June 2015. Ms. Wen has been the professor of the department of Electronic Engineering and Institute of Electronics since 2012, the chief executive officer in strategic development office since 1989, and the vice dean of International College of Semiconductor Technology at National Chiao Tung University. She also served as the independent director of Xintec Inc. since 2016. Ms. Wen was the associate dean in the Office of Research and Development at National Chiao Tung University from 2011 to 2016. She holds a Ph.D. degree from Institute of Electrical Engineering at National Cheng Kung University.
Cho-Lien Chang has served as one of our directors since June 2015. She was the Company’s vice president of LCD Driver production group from June 2004 to 2012, assistant vice president from 2002 to 2004 and manager from 2000 to 2002. Ms. Chang received a bachelor’s degree from Chung Yuan Christian University.
Lafair Cho has served as the chief operating officer and senior executive vice president of the manufacturing operations center of the Company since January 2017. He was the executive vice president of the Company from June 2015 to January 2017. He also served as our vice president of the memory production group from July 2003 to August 2004 and as our director from October 2003 to June 2007. He served as a deputy assistant vice president of our IC testing division from April 2000 to December 2001 and as an assistant vice president of our IC testing division from January 2002 to January 2003. He also served as ThaiLin’s chairman since June 17, 2013, the president since December 1, 2003 and a director since December 30, 2002 until ThaiLin was merged with and into the Company. He was vice president of ThaiLin from February 1, 2003 to November 30, 2003. He served as manager of production material control of Mosel from 1993 to 1997. He holds a master’s degree in industrial management from National Cheng Kung University.
Silvia Su has served as the senior director of finance and accounting management center of the Company since October 1, 2017. She has been the supervisor of ChipMOS Shanghai since February 2018. She joined the Group from 2000. She was the director of finance division of ThaiLin from June 2013 till ThaiLin was merged with and into the Company in June 2015. She was the secretary of ChipMOS Bermuda till ChipMOS Bermuda was merged with and into the Company in October 2016. She holds a bachelor’s degree in Accounting from National Chengchi University and a master’s degree in Business Administration from the University of Leeds.
67
Table of Contents
Share Ownership
The following table sets forth certain information as of March 31, 2018 with respect to our common shares owned by our directors and executive officers.
|
Name |
Number of
Common Shares Held |
Percentage
of Shares Issued |
Number of
Restricted Shares Held |
Expiration Date of
Restricted Shares |
||||||||||||
|
Shih-Jye Cheng |
5,530,000 | 0.62 | % | — | Not applicable | |||||||||||
|
Yu-Hu Liu |
— | — | — | Not applicable | ||||||||||||
|
Wen-Ching Lin |
4,000,200 | 0.45 | % | — | Not applicable | |||||||||||
|
Chin-Shyh Ou |
— | — | — | Not applicable | ||||||||||||
|
Tai-Haur Kuo |
— | — | — | Not applicable | ||||||||||||
|
Yuh-Fong Tang |
— | — | — | Not applicable | ||||||||||||
|
Kuei-Ann Wen |
— | — | — | Not applicable | ||||||||||||
|
Cho-Lien Chang |
— | — | — | Not applicable | ||||||||||||
|
Lafair Cho |
72,000 | 0.01 | % | — | Not applicable | |||||||||||
|
Silvia Su |
89,000 | 0.01 | % | — | Not applicable | |||||||||||
Note:
Indicate actual numbers held and/or including restricted shares vested within 60 days after March 31, 2018.
Compensation Committee
The aggregate compensation paid in 2017 to our directors and our executive officers, including cash and accrued pension payable upon retirement, was approximately NT$92 million (US$3 million).
We do not provide our directors with any benefits upon termination of employment. Our compensation committee currently consists of Mr. Tai-Haur Kuo, Mr. Yuh-Fong Tang and Mr. Chin-Shyh Ou, all of whom are independent directors. This committee reviews and recommends to our board of directors the compensation of all our directors and officers. The compensation committee is required to meet at least semi-annually.
Audit Committee
The audit committee currently consists of Mr. Chin-Shyh Ou, Mr. Tai-Haur Kuo, Mr. Yuh-Fong Tang, Ms. Kuei-Ann Wen and Ms. Cho-Lien Chang, all of whom are independent directors. Mr. Chin-Shyh Ou serves as a financial expert to the audit committee. Our audit committee charter was adopted on June 28, 2007 and amended on November 9, 2017. The audit committee is required to meet at least once every quarter. Our audit committee charter grants the audit committee the authority to conduct any investigation which it deems appropriate to fulfill its responsibilities. It has direct access to all our book, records, facilities, and personnel, as well as our registered public accountants. It has the authority to, among other things, appoint, terminate and approve all fees to be paid to our registered public accountants. The audit committee also has the authority to engage special legal, accounting, or other consultants it deems necessary in the performance of its duties. Beginning on January 1, 2007, the audit committee also assumed the responsibilities of supervisors pursuant to the ROC Securities and Exchange Act.
68
Table of Contents
Employees
The following table sets forth, as of the dates indicated, the number of our full-time employees serving in the functions indicated:
| As of December 31, |
As of
March 31, |
|||||||||||||||
|
Function |
2015 | 2016 | 2017 | 2018 | ||||||||||||
|
General operations |
3,189 | 3,203 | 3,003 | 2,985 | ||||||||||||
|
Quality control |
364 | 359 | 352 | 337 | ||||||||||||
|
Engineering |
1,431 | 1,447 | 1,332 | 1,321 | ||||||||||||
|
Research and development |
599 | 679 | 665 | 668 | ||||||||||||
|
Sales, administration and finance |
177 | 176 | 143 | 138 | ||||||||||||
|
Others |
313 | 350 | 310 | 323 | ||||||||||||
|
|
|
|
|
|
|
|
|
|||||||||
|
Total |
6,073 | 6,214 | 5,805 | 5,772 | ||||||||||||
|
|
|
|
|
|
|
|
|
|||||||||
The following table sets forth, as of the dates indicated, a breakdown of the number of our full-time employees by geographic location:
| As of December 31, |
As of
March 31, |
|||||||||||||||
|
Location |
2015 | 2016 | 2017 | 2018 | ||||||||||||
|
Hsinchu Production Group |
2,126 | 2,173 | 2,230 | 2,242 | ||||||||||||
|
Southern Taiwan Production Group |
3,426 | 3,387 | 3,571 | 3,526 | ||||||||||||
|
Shanghai |
516 | 650 | — | — | ||||||||||||
|
United States |
5 | 4 | 4 | 4 | ||||||||||||
|
|
|
|
|
|
|
|
|
|||||||||
|
Total |
6,073 | 6,214 | 5,805 | 5,772 | ||||||||||||
|
|
|
|
|
|
|
|
|
|||||||||
As of December 31, 2017 and March 31, 2018, employees of ChipMOS Shanghai are excluded due to ChipMOS Shanghai is no longer a subsidiary of the Company following the equity interests transfer completed in March 2017.
Our employees are not covered by any collective bargaining agreements. We have not experienced any strikes or work stoppages by our employees and believe that our relationship with our employees is good.
Restricted Shares
On November 12, 2014, the board of directors of the Company approved 2014 Restricted Stock Award Agreement which has 17,300,000 restricted shares available for issuance. The par value and granting price of the restricted shares were NT$10 and zero, respectively. The issuance of the restricted shares was approved by the Special General Meeting of the Shareholders’ of the Company on December 30, 2014 and approved by the Financial Supervisory Commission of ROC on June 30, 2015. Under the Restricted Stock Award Agreement, the restricted shares will be issued to the employees determined by the board. The restricted shares received will be vested on the vesting ratio when the determined employees accomplish the required years of services and performance conditions. The restricted shares are not restricted for the dividend distribution. The employees are required to return the received restricted shares but not the dividends received if they resign during the vesting period. The returned restricted shares will be retired and cancelled. In 2015, 15,752,000 restricted shares were granted and 410,000 restricted shares were forfeited. In 2016, 1,548,000 restricted shares were granted and 927,000 restricted shares were forfeited. In 2017, 695,000 restricted shares were forfeited.
| Item 7. | Major Shareholders and Related Party Transactions |
Major Shareholders
The following table and information set out certain information known to us concerning the record ownership of our shares as of April 2, 2016, March 28, 2017 and June 19, 2017 (our most recent record date) (1) the largest ten shareholders of the Company as of such record date and (2) our directors and executive officers as a group.
69
Table of Contents
| April 2, 2016 | March 28, 2017 | June 19, 2017 (1) | ||||||||||||||||||||||
|
Name of Beneficial Owners |
Numbers of
Shares Owned |
Percentage of
Shares Owned |
Numbers of
Shares Owned |
Percentage of
Shares Owned |
Numbers of
Shares Owned |
Percentage of
Shares Owned |
||||||||||||||||||
|
Depositary (2) |
— | — | 380,941,160 | 42.95% | 302,785,500 | 35.36% | ||||||||||||||||||
|
Siliconware Precision Industries Co., Ltd. |
132,775,000 | 14.82% | 132,775,000 | 14.97% | 156,045,540 | 18.22% | ||||||||||||||||||
|
Citibank (Taiwan) in its capacity as Master Custodian for Investment Account of GIC Pte Ltd. (Singapore) |
39,649,000 | 4.43% | 39,323,000 | 4.43% | 39,371,000 | 4.60% | ||||||||||||||||||
|
Taiwan Life Insurance Co., Ltd. |
13,483,000 | 1.51% | 13,483,000 | 1.52% | 18,629,000 | 2.18% | ||||||||||||||||||
|
Fubon Life Insurance Co., Ltd. |
13,100,000 | 1.46% | 16,100,000 | 1.82% | 16,100,000 | 1.88% | ||||||||||||||||||
|
Cathay Life Insurance Co., Ltd. |
13,722,000 | 1.53% | 12,639,000 | 1.43% | 12,639,000 | 1.48% | ||||||||||||||||||
|
Tai Shin Bank in its capacity as Master Custodian for Trust Account of ChipMOS’ Restricted Shares (2015-1 issued) |
15,209,499 | 1.7% | 11,584,000 | 1.31% | 10,882,000 | 1.27% | ||||||||||||||||||
|
HSBC Value Partners High-Dividend Stocks Fund |
* | * | * | * | 10,365,000 | 1.21% | ||||||||||||||||||
|
Morgan Stanley & Co. International Plc |
* | * | * | * | 10,313,354 | 1.20% | ||||||||||||||||||
|
Investment Account of Government of Singapore Investment Corp. |
7,370,000 | 0.82% | 7,358,000 | 0.83% | 10,103,000 | 1.18% | ||||||||||||||||||
|
Directors and executive officers, as a group (3) |
528,435,358 | (4) | 58.99% (4) | 10,001,200 | (5) | 1.13% (5) | 9,691,200 | (6) | 1.09% (6) | |||||||||||||||
Notes:
| * | Was not one of the largest ten shareholders of the Company as of the applicable record date. |
| (1) | Our most recent record date. |
| (2) | As record owner of our ADSs. With effect from October 31, 2016, Citibank, N.A. acts as the depositary. |
| (3) | Calculated as the sum of: (a) with respect to directors and executive officers who are serving in their personal capacity, the number of shares held by such directors and executive officers and (b) with respect to directors who are serving in the capacity as legal representatives, the number of shares owned by such institutional or corporate shareholder for which director is a legal representative. |
| (4) | As of March 31, 2016, including the holding of ChipMOS Bermuda as the corporate director of the Company. |
| (5) | As of March 31, 2017. |
| (6) | As of March 31, 2018. |
Except for holders of our ADSs, none of our major shareholders have different voting rights from those of other shareholders.
As of March 31, 2018, a total of 855,896,066 common shares were outstanding. With certain limited exceptions, holders of common shares that are not ROC persons are required to hold their commons shares through their custodians in the ROC. As of March 31, 2018, 174,033,720 common shares were registered in the name of a nominee of Citibank, N.A., the depositary under our ADSs Deposit Agreement. Citibank, N.A., has advised us that, as of March 31, 2018, 8,701,686 ADSs, representing 174,033,720 common shares, were held of record by Cede & Co. and 367 other registered shareholders domiciled in and outside of the United States. We have no further information as to common shares held, or beneficially owned, by US persons.
Related Party Transactions
ChipMOS TECHNOLOGIES (Shanghai) LTD.
We conducted our PRC operations through ChipMOS Shanghai, the 45.02%-owned affiliate of ChipMOS BVI, our controlled subsidiary. Under the MMT Assignment Agreement signed on April 22, 2011, ChipMOS Bermuda agreed to sell the MMT Notes to ThaiLin for a purchase price of approximately US$40 million subject to certain closing conditions. The Assignment Agreement transaction completed in October 2011 and ThaiLin immediately converted the MMT Notes into common shares of ChipMOS BVI and purchased all of the remaining common shares of ChipMOS BVI from Jesper, with ChipMOS Shanghai becoming an indirect wholly-owned subsidiary of ThaiLin, through ThaiLin’s direct wholly-owned subsidiary ChipMOS BVI. November 30, 2016, the Company and Tsinghua Unigroup agreed to form a joint-venture. Under the joint-venture, the Equity Interest Transfer Agreements among ChipMOS BVI, a wholly-owned subsidiary of the Company, and some strategic investors which including Unigroup Guowei, a subsidiary of Tsinghua Unigroup, were executed. Pursuant to the agreement, ChipMOS BVI, would sell, for the aggregate purchase price of approxmiately RMB 484 million, 54.98% equity interests of its wholly-owned subsidiary, ChipMOS Shanghai, to the strategic investors, and Unigroup Guowei would hold 48% equity interests of ChipMOS Shanghai, and the other strategic investors, including a limited partnership owned by ChipMOS Shanghai’s employees, would own approximately 6.98% equity interest of ChipMOS Shanghai. ChipMOS Shanghai is no longer the subsidiary of the Company following the sale of equity interests, which was completed in March 2017.
70
Table of Contents
Under a technology transfer agreement dated August 1, 2002 which expired on August 1, 2012, ChipMOS Bermuda licensed certain technologies and systems, and agreed to provide certain technical support and consulting services to ChipMOS Shanghai relating to those technologies and systems, and ChipMOS Shanghai paid an aggregate of US$25 million to ChipMOS Bermuda in 2002 for the technology and services ChipMOS Bermuda provide under this agreement. Under another technology transfer agreement dated October 3, 2011 which became effective on August 1, 2012, ChipMOS Bermuda licensed certain technologies and systems, and agreed to provide certain technical support and consulting services to ChipMOS Shanghai relating to those technologies and systems, and ChipMOS Shanghai will pay an aggregate of RMB 27 million to ChipMOS Bermuda by forty installments on the last day of each quarter during the term of this agreement. Following the merger of ChipMOS Bermuda and the Company which was effective on October 31, 2016, the Company is the surviving company to provide ChipMOS Shanghai with technical support and consulting services.
Pursuant to the Technology Transfer and License Agreement and Addendums dated May 27, 2016, August 5, 2016 and January 19, 2017 entered between the Company and ChipMOS Shanghai, the Company agreed to transferred certain technologies for LCD driver IC assembly and testing and wafer bumping and provide certain technical assistance and consulting services to ChipMOS Shanghai, and ChipMOS Shanghai agreed to pay the Company the license fee in the amount of US$1 million and a running royalty for the foregoing license equivalent to 0.5% of the total earnings of the sales (excluding rebate, refund and rework) of the licensed technologies with a cap of US$15 million.
| Item 8. | Financial Information |
Consolidated Financial Statements and Other Financial Information
Please see “Item 18. Financial Statements” and pages F-1 through F-74.
Legal Proceedings
We were not involved in any material litigation in 2017 and are not currently involved in any material litigation.
For certain information regarding legal proceedings relating to certain of our current and former directors, see “Item 6. Directors, Senior Management and Employees—Directors and Senior Management”.
Dividends and Dividend Policy
The following table sets forth the distribution per share paid during each of the years indicated in respect of common shares outstanding on the record date eligible to the payment of those distributions. During 2014, 2015, 2016 and 2017, we paid cash distributions in the amounts of NT$1.20, NT$2.22, NT$2.09 and NT$1.00 (US$0.03), respectively.
|
Cash Distributions
per Share |
Stock Dividends
per Share |
Total Shares Issued
as Stock Dividends |
Outstanding Common
Shares at Year End |
|||||||||||||
| (NT$) | (NT$) | |||||||||||||||
|
2014 |
1.20 | — | — | 864,619,358 | ||||||||||||
|
2015 |
2.22 | — | — | 895,893,643 | ||||||||||||
|
2016 |
2.09 | — | — | 856,754,261 | ||||||||||||
|
2017 |
1.00 | — | — | 856,059,061 | ||||||||||||
Under the Company’s articles of incorporation, a proposal on the dividend distribution shall be submitted by the broad of directors annually to the shareholders’ general meeting, and be determined based on factors including the past years’ profit, current and future investment environment, capital needs, market competition, and budgets, with an aim to pursuing shareholders’ interests and balancing the dividend distribution and the long-term financial plan. The distribution of profits can be made in the form of cash or stock dividends, provided that the cash dividend shall account for at least 10% of the total profit distributed as dividends in the given year.
71
Table of Contents
| Item 9. | The Offer and Listing |
Listing
The principal trading market for our common shares is the TWSE. Our common shares have been listed on the TWSE under the symbol “8150” since April 11, 2014, and the ADSs have been listed on the NASDAQ under the symbol “IMOS” since November 1, 2016. The outstanding ADSs are identified by the CUSIP number 16965P103. The table below sets forth, for the periods indicated, the high and low closing prices and the average daily volume of trading activity on the TWSE for our common shares and the high and low closing prices and the average daily volume of trading activity on the NASDAQ for our common shares represented by ADSs.
| Taiwan Stock Exchange | NASDAQ Global Select Market | |||||||||||||||||||||||
|
Closing Price Per
Common Share |
Average Daily
Trading Volume |
Closing Price Per
ADS |
Average Daily
Trading Volume |
|||||||||||||||||||||
| High | Low | High | Low | |||||||||||||||||||||
| (NT$) | (NT$) | (in thousands of shares) | (US$) | (US$) | (in thousands of ADSs) | |||||||||||||||||||
|
2014 |
44.30 | 35.00 | 2,009.1 | * | * | * | ||||||||||||||||||
|
2015 |
50.50 | 27.00 | 1,982.2 | * | * | * | ||||||||||||||||||
|
2016 |
||||||||||||||||||||||||
|
First Quarter |
35.45 | 27.85 | 847.5 | * | * | * | ||||||||||||||||||
|
Second Quarter |
34.35 | 29.80 | 539.4 | * | * | * | ||||||||||||||||||
|
Third Quarter |
34.60 | 30.15 | 255.2 | * | * | * | ||||||||||||||||||
|
Fourth Quarter |
30.25 | 22.80 | 1,136.0 | 16.55 | 14.03 | 105.0 | ||||||||||||||||||
|
2017 |
||||||||||||||||||||||||
|
First Quarter |
27.60 | 24.15 | 7,973.5 | 17.99 | 14.69 | 207.0 | ||||||||||||||||||
|
Second Quarter |
33.80 | 25.55 | 10,831.6 | 21.87 | 16.84 | 135.1 | ||||||||||||||||||
|
Third Quarter |
31.20 | 25.65 | 7,662.0 | 20.43 | 16.62 | 78.2 | ||||||||||||||||||
|
Fourth Quarter |
33.65 | 26.00 | 12,633.7 | 21.65 | 17.25 | 117.9 | ||||||||||||||||||
|
November |
31.50 | 27.25 | 10,405.1 | 20.70 | 17.70 | 114.5 | ||||||||||||||||||
|
December |
28.10 | 26.00 | 9,492.3 | 18.54 | 17.25 | 74.4 | ||||||||||||||||||
|
2018 |
||||||||||||||||||||||||
|
January |
27.30 | 26.05 | 4,723.8 | 18.35 | 17.48 | 50.0 | ||||||||||||||||||
|
February |
26.60 | 23.50 | 4,208.9 | 18.10 | 16.25 | 41.1 | ||||||||||||||||||
|
March |
26.50 | 23.05 | 3,294.9 | 18.03 | 15.70 | 68.8 | ||||||||||||||||||
|
April (through April 17, 2018) |
23.85 | 22.70 | 3,788.9 | 16.13 | 15.41 | 63.3 | ||||||||||||||||||
Source: Taiwan Stock Exchange and NASDAQ Stock Exchange
Note:
| * | Our ADSs were listed onto the NASDAQ Global Select Market on November 1, 2016. |
| Item 10. | Additional Information |
The following information relates to the Company shares, including summaries of certain provisions of the Company’s articles of incorporation, the ROC Company Act, and Securities and Exchange Act.
General
The authorized share capital of the Company will be as provided in its articles of incorporation, of which such number of shares as to be determined will be issued.
Dividends
Except under limited circumstances, the Company will not permitted to distribute dividends or make other distributions to shareholders in any given year in which it did not record net income or retained earnings (excluding reserves). The ROC Company Act also requires that 10% of annual net income (less prior years’ losses, if any, and applicable income taxes) be set aside as a legal reserve until the accumulated legal reserve equals the paid-in capital of the Company. In addition, the articles of incorporation of the Company provides that before a dividend is paid out of the Company’s annual net income:
72
Table of Contents
| • | up to 0.5% of the Company’s annual profits (less prior years’ accumulated losses, if any) should be paid to the directors of the Company as compensation; and |
| • | 10% of the annual profits (less prior years’ accumulated losses, if any) should be paid to the employees of the Company. The employee compensation may be paid in shares or in cash as determined by a majority of directors in attendance at a meeting attended by over two-thirds of the board of directors and such resolution shall be reported to the shareholders’ meeting. Such employees include those of the Company’s subsidiaries. |
At the annual general meeting of shareholders, the board of the Company will submit to the shareholders for their approval any proposal for the distribution of dividends or the making of any other distribution to shareholders from the Company’s net income (less prior years’ losses and legal and special reserves plus the accumulated undistributed profit at the beginning of the preceding fiscal year and the adjusted undistributed profit of the given fiscal year) for the preceding fiscal year. All the outstanding and fully paid shares of the Company as of the relevant record date are entitled to share equally in any dividend or other distribution so approved. Dividends may be distributed in cash, in the form of common shares or a combination of the two, as determined by the shareholders at the meeting. The articles of incorporation of the Company provides that cash dividend distribution should not be lower than 10% of the total dividend amount.
The Company will also be permitted to make distributions to its shareholders in cash or in the form of common shares from reserves if it has no accumulated loss. However, the distribution payable out of the Company’s legal reserve can only come from the amount exceeding 25% of the total paid-in capital.
Changes in Share Capital
Under the ROC Company Act, any change in the authorized share capital of a company limited by shares requires an amendment to its articles of incorporation, which in turn requires approvals each at the meeting of the board of directors and shareholders’ meeting. In the case of a public company such as the Company, it must also make an effective registration with the FSC and an amendment to the corporate registration with the Hsinchu Science Park Bureau of the Ministry of Science and Technology. Authorized but unissued common shares may be issued, subject to applicable ROC law, upon terms as the board of the Company may determine. See“Item 5. Operating and Financial Review and Prospects—Liquidity and Capital Resources” for additional information.
Preemptive Rights
Under the ROC Company Act, when an ROC company issues new shares for cash, existing shareholders who are listed on the shareholders’ register as of the record date have preemptive rights to subscribe for the new issue in proportion to their existing shareholdings, while a company’s employees, whether or not they are shareholders of the Company, have rights to subscribe for 10% to 15% of the new issue. Any new shares that remain unsubscribed at the expiration of the subscription period may be freely offered, subject to compliance with applicable ROC law.
In addition, in accordance with the ROC Securities and Exchange Act, a public company that intends to offer new shares for cash must offer to the public at least 10% of the shares to be sold, except under certain circumstances or when exempted by the FSC. This percentage can be increased by a resolution passed at a shareholders’ meeting, which would diminish the number of new shares subject to the preemptive rights of existing shareholders.
These preemptive rights provisions do not apply to offerings of new shares through a private placement approved at a shareholders’ meeting.
73
Table of Contents
Meeting of Shareholders
The Company will be required to hold an annual general meeting of shareholders within six months following the end of each fiscal year. These meetings are generally held in Hsinchu, Taiwan. Any shareholder who holds 1% or more of the Company’s issued and outstanding shares may submit one written proposal for discussion at the annual general meeting. Extraordinary shareholders’ meetings may be convened by resolution of the board of directors or by the board of directors upon the written request of any shareholder or shareholders who have held 3% or more of the outstanding common shares for a period of one year or longer. Shareholders’ meetings may also be convened by the audit committee. Notice in writing of shareholders’ meetings, stating the place, time and purpose, must be dispatched to each shareholder at least 30 days, in the case of annual general meetings, and 15 days, in the case of extraordinary meetings, before the date set for each meeting. A majority of the holders of all issued and outstanding common shares present at a shareholders’ meeting constitutes a quorum for meetings of shareholders. If a company adopts a nomination procedure for election of directors in its articles of incorporation, shareholders representing 1% or more of the total issued shares of such company may submit a candidate list in writing to the Company along with relevant information and supporting documents in accordance with the requirements under the ROC Company Act. The articles of incorporation of the Company presently adopt such nomination procedure for the election of independent directors.
Voting Rights
Under the ROC Company Act, except under limited circumstances, shareholders have one vote for each common share held. Under the ROC Company Act, the directors are elected at a shareholders’ meeting through cumulative voting.
In general, a resolution can be approved by the holders of at least a majority of the Company shares represented at a shareholders’ meeting at which the holders of a majority of all issued and outstanding common shares are present. Under the ROC Company Act, the approval by at least a majority of the Company shares represented at a shareholders’ meeting in which a quorum of at least two-thirds of all issued and outstanding common shares are represented is required for major corporate actions, including:
| • | amendment to the Articles of Incorporation, including increase of authorized share capital and any changes of the rights of different classes of shares; |
| • | execution, amendment or termination of any contract through which the Company leases its entire business to others, or the Company appoints others to operate its business or the Company operates its business with others on a continuous basis; |
| • | transfer of entire business or assets or a substantial part of its business or assets; |
| • | acquisition of the entire business or assets of any other company, which would have a significant impact on the Company’s operations; |
| • | distribution of any stock dividend; |
| • | dissolution, merger or spin-off of the Company; |
| • | issuance of restricted shares to employees; and |
| • | removal of the directors. |
However, in the case of a public company such as the Company, there is one exception if the total number of shares represented by the shareholders present at a shareholders’ meeting is not sufficient to meet the above criteria (referred to the holders of at least two-thirds of all issued and outstanding common shares presented at the meeting), the resolution may be adopted by the holders of at least two-thirds of the Company shares represented at a shareholders’ meeting at which the holders of at least a majority of all issued and outstanding common shares are present.
A shareholder may be represented at an annual general or extraordinary meeting by proxy if a valid proxy form is delivered to the Company five days before the commencement of the annual general or extraordinary shareholders’ meeting. Shareholders may exercise their voting rights by way of a written ballot or by way of electronic transmission if the voting decision is delivered to us two days before the commencement of the annual general or extraordinary shareholders’ meeting.
Any shareholder who has a personal interest in a matter to be discussed at shareholders’ meeting of the Company, the outcome of which may impair interests of the Company, shall not vote or exercise voting rights on behalf of another shareholder on such matter.
Holders of the Company’s ADSs do not have the right to exercise voting rights with respect to the underlying shares of the Company, except as described in the Deposit Agreement.
74
Table of Contents
Other Rights of Shareholders
Under the ROC Company Act, dissenting shareholders are entitled to appraisal rights in certain major corporate actions such as a proposed amalgamation by the company. If agreement with the company cannot be reached, dissenting shareholders may seek a court order for the company to redeem all of their shares. Shareholders may exercise their appraisal rights by serving written notice on the company prior to or at the related shareholders’ meeting and/or by raising and registering an objection at the shareholders’ meeting. In addition to appraisal rights, shareholders have the right to sue for the annulment of any resolution approved at a shareholders’ meeting where the procedures were legally defective within 30 days after the date of the shareholders’ meeting. One or more shareholders who have held 3% or more of the issued and outstanding shares of a company for a period of one year or longer may require an independent director to bring a derivative action on behalf of the company against a director as a result of the director’s unlawful actions or failure to act.
One or more shareholders who have held 3% or more of the issued and outstanding shares may institute an action with a court to remove a director who has materially violated the applicable laws or the articles of incorporation of the Company or has materially damaged the interests of the Company if a resolution for removal on such grounds has first been voted on and rejected by the shareholders and such suit is filed within thirty days of such shareholders’ vote.
One or more shareholders who have held 3% or more of the issued and outstanding shares for one year or longer may request a court to appoint an inspector to examine the books, accounts and financial conditions of the Company. The court may, if it deems necessary based on the inspector’s report, order the independent director to convene the shareholders’ meeting.
Rights of Holders of Deposited Securities
The voting rights of a holder of the Company ADSs as to the Company shares represented by those the Company ADSs are governed by the Deposit Agreement. Holders of ADSs will be able to exercise voting rights on an individual basis as follows: if a holder of the Company ADSs outstanding at the relevant record date instructs the depositary to vote in a particular manner for or against a resolution, including the election of directors, the depositary will cause all the Company shares represented by such holder’s ADSs to be voted in that manner. If the depositary does not receive timely instructions from a holder of the Company ADSs outstanding at the relevant record date to vote in a particular manner for or against any resolution, including the election of directors, such holders of the Company ADSs will be deemed to have instructed the depositary or its nominee to give a discretionary proxy to a person designated by the Company to vote all the Company shares represented by such holder’s ADSs at the discretion of such person, which may not be in the interest of holders of the Company ADSs.
Register of Shareholders and Record Dates
The Company’s share registrar, KGI Securities Co., Ltd., maintains the Company’s register of shareholders. Under the ROC Company Act and the articles of incorporation of the Company, the Company may, by giving advance public notice, set a record date and close the register of shareholders for a specified period in order for it to determine the shareholders or pledgees that are entitled to rights pertaining to the Company shares. The specified period required is as follows:
| • | annual general meeting—60 days; |
| • | extraordinary shareholders’ meeting—30 days; and |
| • | relevant record date for distribution of dividends, bonuses or other interests —5 days. |
Annual Financial Statements
At least ten days before the annual general meeting, the Company’s annual financial statements, which are prepared in conformity with Taiwan IFRS, must be available at the Company’s principal executive office in Hsinchu, Taiwan for inspection by the shareholders.
Transfer of the Company shares
The transfer of the Company shares in registered form is effected by endorsement and delivery of the related share certificates but, in order to assert shareholders’ rights against the Company, the transferee must have his name and address registered on its register of shareholders. Shareholders are required to file their respective specimen seals, also known as chops, with the Company. Chops are official stamps widely used in Taiwan by individuals and other entities to authenticate the execution of official and commercial documents. The settlement of trading in the Company shares is normally carried out on the book-entry system maintained by the Taiwan Depository & Clearing Corporation.
75
Table of Contents
Acquisition of the Company shares by us
Under the ROC Securities and Exchange Act, the Company may purchase the Company shares as treasury stock under limited circumstances, including:
| • | to transfer shares to the Company’s employees; |
| • | to deliver shares upon the conversion or exercise of bonds with warrants, preferred shares with warrants, convertible bonds, convertible preferred shares or warrants issued by the Company; or |
| • | to maintain the Company’s credit and its shareholders’ equity, provided that the shares so purchased shall be cancelled. |
The Company may purchase the Company shares on the TWSE or by means of a public tender offer. These transactions require the approval of a majority of the board of the Company at a meeting in which at least two-thirds of the directors are in attendance. The total amount of the Company shares purchased for treasury stock may not exceed 10% of the total issued shares. In addition, the total cost of the purchased shares shall not exceed the aggregate amount of the retained earnings, any premium from share issuances and the realized portion of the Company’s capital reserve. The shares purchased by the Company pursuant to the first two items above will be transferred to the intended transferees within three years of the purchase; otherwise the shares will be cancelled. For the shares to be cancelled under the third item above, the Company is required to complete an amendment registration for the cancellation within six months of the purchase.
The Company may not pledge or hypothecate any of its shares purchased by it. In addition, it may not exercise any shareholders’ right attaching to such shares. In the event that the Company purchases its shares on the TWSE, its affiliates, directors, managers, and their respective spouses and minor children and/or nominees are prohibited from selling any shares of the Company during the period in which the Company is purchasing its shares.
Pursuant to the ROC Company Act, an entity in which the Company directly or indirectly owns more than 50% of the voting shares or paid-in capital, which is referred to as a controlled entity, may not purchase the Company shares. Also, if the Company and a controlled entity jointly own, directly or indirectly, more than 50% of the voting shares or paid-in capital of another entity, which is referred to as a third entity, the third entity may not purchase shares in either the Company or a controlled entity.
Liquidation Rights
In the event of the liquidation of the Company, the assets remaining after payment of all assets, liquidation expenses and taxes will be distributed pro rata to the shareholders in accordance with the relevant provisions of the ROC Company Act.
Transfer Restriction
Substantial Shareholders
The ROC Securities and Exchange Act currently requires:
| • | each director, manager, or substantial shareholder (that is, a shareholder who holds more than 10% shares of a company), and their respective spouses, minor children or nominees, to report any change in that person’s shareholding to the issuer of the shares and the FSC; and |
| • | each director, manager, or substantial shareholder, and their respective spouses, minor children or nominees, after acquiring the status of director, manager, or substantial shareholder for a period of six months, to report his or her intent to transfer any shares on the TWSE to the FSC at least three days before the intended transfer, unless the number of shares to be transferred does not exceed 10,000 shares. |
In addition, the number of shares that can be sold or transferred on the TWSE by any person subject to the restrictions described above on any given day may not exceed:
| • | 0.2% of the outstanding shares of the company in the case of a company with no more than 30 million outstanding shares; or |
| • | 0.2% of 30 million shares plus 0.1% of the outstanding shares exceeding 30 million shares in the case of a company with more than 30 million outstanding shares; or |
| • | in any case, 5% of the average trading volume (number of shares) on the TWSE for the ten consecutive trading days preceding the reporting day on which the director, manager or substantial shareholder reports the intended share transfer to the FSC. |
These restrictions do not apply to sales or transfers of the Company’s ADSs.
76
Table of Contents
Material Contracts
We have entered into the following contracts within the two years preceding the date of this Annual Report on Form 20-F that are or may be material:
| • | On January 21, 2016, ChipMOS Bermuda and the Company entered into the Merger Agreement, pursuant to which ChipMOS Bermuda merged with and into the Company, with the Company being the surviving company after the Merger. Pursuant to the terms and subject to the conditions set forth in the Merger Agreement, at the Effective Time, each ChipMOS Bermuda share issued and outstanding immediately prior to the Effective Time was cancelled and, in exchange, each former holder of such cancelled ChipMOS Bermuda share was entitled to receive, with respect to each such ChipMOS Bermuda share, (i) 0.9355 ADS, representing 18.71 the Company shares, each ADS representing 20 common shares of the Company, and (ii) US$3.71 in cash, without interest, net of any applicable withholding tax. Upon completion of the Merger, the Company and its subsidiaries owned continued to conduct the business that they conducted in substantially the same manner. The Merger was effective on October 31, 2016. |
| • | On February 25, 2016, the Company and Tsinghua Unigroup executed the Subscriber Joinder Agreement, under which Tsinghua Unigroup assigned its obligations and liabilities under the Tsinghua Share Subscription Agreement to Tibet MaoYe, which is a subsidiary controlled by Tsinghua Unigroup. From the execution of the Subscriber Joinder Agreement, Tibet MaoYe became the “Subscriber” defined in the Tsinghua Share Subscription Agreement and assumed all the rights, benefits, liabilities and obligations incurred from the Tsinghua Share Subscription Agreement. On the same date, the Company and Tibet MaoYe executed the Tibet MaoYe Share Subscription Agreement, the substantive content of which is consistent with the Tsinghua Share Subscription Agreement. |
| • | On May 16 2016, the Company obtained a syndicated loan facility from banks in Taiwan in the amount of NT$13.2 billion separated into two parts with term of five years. This loan facility was used to refinance the existing bank debts and for general corporate purposes. |
| • | On November 30, 2016, the Company and Tsinghua Unigroup executed the Termination Agreement, under which the Company and Tsinghua Unigroup agreed to terminate the Share Subscription Agreement and Strategic Alliance Agreement executed on December 11, 2015 and the Subscriber Joinder Agreement executed on February 25, 2016. |
| • | On November 30, 2016, the Company and Tibet MaoYe executed the Termination Agreement, under which the Company and Tibet MaoYe agreed to terminate the Subscriber Joinder Agreement executed on February 25, 2016. |
| • | On November 30, 2016, ChipMOS BVI, Unigroup Guowei and the Company entered into the Equity Interest Transfer Agreement, pursuant to which Unigroup Guowei will purchase 48% equity interests of ChipMOS Shanghai. |
| • | On November 30, 2016, ChipMOS BVI and Gongqingcheng Changhou Investment Management Ltd. (“Gongqingcheng Changhou”) entered into the Equity Interest Transfer Agreement, pursuant to which Gongqingcheng Changhou will purchase 2% equity interests of ChipMOS Shanghai. |
| • | On November 30, 2016, ChipMOS BVI and Accretech (China) Co., Ltd. (“Accretech (China)”) entered into the Equity Interest Transfer Agreement, pursuant to which Accretech (China) will purchase 1.4162% equity interests of ChipMOS Shanghai. |
| • | On November 30, 2016, ChipMOS BVI and Chao-Jung Tsai entered into the Equity Interest Transfer Agreement, pursuant to which Chao-Jung Tsai will purchase 1.3443% equity interests of ChipMOS Shanghai. |
| • | On November 30, 2016, ChipMOS BVI and Shanghai Zuzhu Business Consulting Partnership (Limited Partnership) (“Shanghai Zuzhu”) entered into the Equity Interest Transfer Agreement, pursuant to which Shanghai Zuzhu will purchase 0.9401% equity interests of ChipMOS Shanghai. |
| • | On November 30, 2016, ChipMOS BVI and Shih-Jye Cheng entered into the Equity Interest Transfer Agreement, pursuant to which Shih-Jye Cheng will purchase 1.1202% equity interests of ChipMOS Shanghai. |
| • | On November 30, 2016, ChipMOS BVI and Shou-Kang Chen entered into the Equity Interest Transfer Agreement, pursuant to which Shou-Kang Chen will purchase 0.1240% equity interests of ChipMOS Shanghai. |
| • | On November 30, 2016, ChipMOS BVI and David W. Wang entered into the Equity Interest Transfer Agreement, pursuant to which David W. Wang will purchase 0.0310% equity interests of ChipMOS Shanghai. |
| • | On November 30, 2016, ChipMOS BVI, Unigroup Guowei, Gongqingcheng Changhou, Accretech (China), Chao-Jung Tsai, Shanghai Zuzhu, Shih-Jye Cheng, Shou-Kang Chen, David W. Wang and the Company entered into the Agreement for Sino-Foreign Equity Joint Venture, pursuant to which the parties agreed to operate ChipMOS Shanghai’s business together. |
For additional information regarding the Merger see “Item 4. Information on the Company—Our Structure and History”.
77
Table of Contents
Please see also “Item 7. Major Shareholders and Related Party Transactions” for further summary information regarding the contracts listed under “—Material Contracts” that are with certain of our related parties.
Foreign Investment in the ROC
Since 1983, the ROC government has periodically enacted legislation and adopted regulations to permit foreign investment in the ROC securities market.
On September 30, 2003, the ROC Executive Yuan approved an amendment to Regulations Governing Investment in Securities by Overseas Chinese and Foreign National, or the Regulations, which took effect on October 2, 2003. According to the Regulations, the ROC Financial Supervisory Commission (the “ROC FSC”) abolished the mechanism of the so-called “qualified foreign institutional investors” and “general foreign investors” as stipulated in the Regulations before the amendment.
Under the Regulations, foreign investors are classified as either “onshore foreign investors” or “offshore foreign investors” according to their respective geographical location. Both onshore and offshore foreign investors are allowed to invest in ROC securities after they register with the TWSE. The Regulations further classify foreign investors into foreign institutional investors and foreign individual investors. “Foreign institutional investors” refer to those investors incorporated and registered in accordance with foreign laws outside of the ROC (i.e., offshore foreign institutional investors) or their branches set up and recognized within the ROC (i.e., onshore foreign institutional investors). Offshore overseas Chinese and foreign individual investors may be subject to a maximum investment ceiling that will be separately determined by the ROC FSC after consultation with the Central Bank of the Republic of China (Taiwan). Currently, there is no maximum investment ceiling for offshore overseas investment in the ROC securities market.
Except for certain specified industries, such as telecommunications, investments in ROC-listed companies by foreign investors are not subject to individual or aggregate foreign ownership limits. Custodians for foreign investors are required to submit to the Central Bank of the Republic of China (Taiwan) and the TWSE a monthly report of trading activities and status of assets under custody and other matters. Capital remitted to the ROC under these guidelines may be remitted out of the ROC at any time after the date the capital is remitted to the ROC. Capital gains and income on investments may be remitted out of the ROC at any time.
Foreign investors (other than foreign investors who have registered with the TWSE for making investments in the ROC securities market) who wish to make direct investments in the shares of ROC companies are required to submit a foreign investment approval application to the MOEAIC or other applicable government authority. The Investment Commission or such other government authority reviews each foreign investment approval application and approves or disapproves each application after consultation with other governmental agencies (such as the Central Banks of the Republic of China (Taiwan)) and the ROC FSC.
Under current ROC law, any non-ROC person possessing a foreign investment approval may repatriate annual net profits, interest and cash dividends attributable to the approved investment. Stock dividend attributable to this investment, investment capital and capital gains attributable to this investment may be repatriated by the non-ROC person possessing a foreign investment approval after approvals of the MOEAIC or other government authorities have been obtained.
In addition to the general restriction against direct investment by non-ROC persons in securities of ROC companies, non-ROC persons (except in certain limited cases) are currently prohibited from investing in certain industries in the ROC pursuant to a “negative list”, as amended by the ROC Executive Yuan. The prohibition on foreign investment in the prohibited industries specified in the negative list is absolute in the absence of a specific exemption from the application of the negative list. Pursuant to the negative list, certain other industries are restricted so that non-ROC person (except in limited cases) may invest in these industries only up to a specified level and with the specific approval of the relevant competent authority that is responsible for enhancing the relevant legislation that the negative list is intended to implement
78
Table of Contents
The ROC FSC announced on April 30, 2009 the Regulations Governing Mainland Chinese Investors’ Securities Investments (“PRC Regulations”) and amended the same on October 6, 2010. According to the PRC Regulations, a PRC QDII is allowed to invest in ROC securities (including less than 10% shareholding of a ROC company listed in TWSE or Taipei Exchange). Nevertheless, the total investment amount of QDIIs cannot exceed US$500 million. For each QDII, the custodians of such QDII must apply with the TWSE for the remittance amount for each QDII, which cannot exceed US$100 million, and QDII can only invest in the ROC securities market with the amount approved by the TWSE. In addition, QDIIs are currently prohibited from investing in certain industries, and their investment of certain other industries in a given company is restricted to certain percentage pursuant to a list promulgated by the FSC and amended from time to time. PRC investors other than QDII, however, are prohibited from making investments in a ROC company listed on the TWSE or the Taipei Exchange, unless with approval from the MOEAIC for its investment of 10% or more (or other percentage applicable to certain restricted industries) of the equity interest of such ROC company.
In addition to investments permitted under the PRC Regulations, PRC investors who wish to make (i) direct investment in the shares of ROC private companies or (ii) investments, individually or aggregately, in 10% or more (or other percentage applicable to certain restricted industries) of the equity interest of a ROC company listed on the TWSE or Taipei Exchange are required to submit an investment approval application to the MOEAIC or other government authority. The Investment Commission of the ROC Ministry of Economic Affairs or such other government authority reviews investment approval application and approved or disapproves each application after consultation with other governmental agencies. Furthermore, PRC investor who wishes to be elected as a ROC company’s director or supervisor shall also submit an investment approval application to the MOEAIC or other government authority for approval.
Depositary Receipts
In April 1992, the ROC FSC began allowing ROC companies listed on the TWSE, with the prior approval of the FSC, to sponsor the issuance and sale of depositary receipts. The depositary receipts represent depositary shares. In December 1994, the ROC Ministry of Finance began allowing companies whose shares are listed on the Taipei Exchange also to sponsor the issuance and sale of depositary receipts.
After the issuance of a depositary share, a holder of depositary receipts (other than citizens of the PRC and entities organized under the laws of the PRC save for QDII or those which otherwise obtain the approval of MOEAIC) may request the depositary to either cause the underlying shares to be sold in the ROC and to distribute the sale proceeds to the holder or to withdraw from the depositary receipt facility the shares represented by the depositary receipts to the extent permitted under the deposit agreement and transfer the shares to the holder.
Under the current ROC law, if you are a non-ROC holder of our ADSs, you must register with the TWSE as a foreign investor before you will be permitted to withdraw the shares represented by the depositary receipts. In addition to obtaining registration with the TWSE, you must also (i) appoint a qualified local agent to, among other things, open a securities trading account with a local securities brokerage firm and a bank account to remit funds, exercise shareholder’s rights and perform other functions as holders of ADSs may designate, (ii) appoint a custodian to hold the securities and cash proceeds, confirm transactions, settle trades and report and declare other relevant information and; (iii) appoint a tax guarantor as guarantor for the full compliance of the withdrawing depositary receipt holders’ tax filing and payment obligations in the ROC. A depositary receipt holder not registered as a foreign investor with the TWSE, or not has made the necessary appointments as outlined above, will be unable to hold or subsequently transfer the shares withdrawn from the depositary receipt facility.
No deposits of shares may be made in a depositary receipt facility and no depositary shares may be issued against deposits without specific FSC approval, unless they are:
| (i) | stock dividends; |
| (ii) | free distributions of shares; |
| (iii) | due to the exercise by the depositary receipt holder preemptive rights in the event of capital increases for cash; or |
| (iv) | if permitted under the deposit agreement and custody agreement and within the amount of depositary receipts which have been withdrawn, due to the direct purchase by investors or purchase through the depositary on the TWSE or Taipei Exchange or delivery by investors of the shares for deposit in the depositary receipt facility. In this event, the total number of depositary receipts outstanding after an issuance cannot exceed the number of issued depositary receipts previously approved by the FSC in connection with the offering plus and ADSs issued pursuant to the events described in (i), (ii) and (iii) above. |
79
Table of Contents
The depositary, without obtaining further approvals from the Central Bank of the Republic of China (Taiwan) or any other governmental authority or agency of the ROC, may convert NT dollars into other currencies, including US dollars, in respect of:
| • | the proceeds of the sale of common shares represented by ADSs or received as share dividends with respect to the common shares and deposited into the depositary receipt facility; and |
| • | any cash dividend or distributions received from the common shares. |
In addition, the depositary may also convert into NT dollars incoming payments for purchase of common shares for deposit in the depositary receipts facility against the creation of additional ADSs. If you withdraw the common shares underlying your ADSs and become a holder of the Company’s common shares, you may convert into NT dollars subscription payment for rights offerings. The depositary may be required to obtain foreign exchange payment approval from the Central Bank of the Republic of China (Taiwan) on a payment-by-payment basis for conversion from NT dollars into foreign currencies of the proceeds from the sale of subscription rights of new common shares. Although it is expected that the Central Bank of the Republic of China (Taiwan) will grant approval as routine matter, required approvals may not be obtained in a timely manner, or at all.
Exchange Controls
The ROC Foreign Exchange Control Law and regulations provide that all foreign exchange transactions must be executed by banks designated by the FSC and by the Central Bank of the Republic of China (Taiwan) to engage in such transactions. Current regulations favor trade-related or service-related foreign exchange transactions. Consequently, foreign currency earned from exports of merchandise and services may now be retained and used freely by exporters, and all foreign currency needed for the importation of merchandise and services may be purchased freely from the designated foreign exchange banks.
Apart from trade-related or service-related foreign exchange transactions, ROC companies and individual residents of the ROC reaching the age of 20 years old may, without foreign exchange approval, remit foreign currency of up to US$50 million (or its equivalent) and US$5 million (or its equivalent) to and from the ROC, respectively, in each calendar year. The above limits apply to remittances involving either a conversion of NT dollars into a foreign currency or a conversion of foreign currency into NT dollars. In addition, a requirement is also imposed on all enterprises to register medium- and long-term foreign debt with the Central Bank of the Republic of China (Taiwan).
In addition, foreign persons may, subject to specified requirements but without foreign exchange approval of the Central Bank of the Republic of China (Taiwan), remit to and from the ROC foreign currencies of up to US$100,000 (or its equivalent) per remittance if the required documentation is provided to the ROC authorities. The above limit applies to remittances involving either a conversion of NT dollars into a foreign currency or a conversion of foreign currency into NT dollars. The above limit does not, however, apply to the conversion of NT dollars into other currencies, including U.S. dollars, from the proceeds of a sale of any underlying shares withdrawn from a depositary receipt facility.
ROC Taxation
The following summary constitutes the material ROC tax consequences of the ownership and disposition of our shares or ADSs by and to a non-resident individual or non-resident entity (referred to here as a “non-ROC holder”). As used in the preceding sentence, a “non-resident individual” is a non-ROC national who owns the Company shares or ADSs and is not physically present in the ROC for 183 days or more during any calendar year, and a “non-resident entity” is a corporation or a non-corporate body that owns the Company shares or ADSs, is organized under the laws of a jurisdiction other than the ROC and has no fixed place of business or business agent in the ROC. Holders of our ADSs and shares should consult their own tax advisers concerning the tax consequences of owning our ADSs or shares and any other relevant taxing jurisdiction to which they are subject.
80
Table of Contents
Dividends
Dividends (whether in the form of cash or common shares) declared by the Company out of retained earnings and distributed to a non-ROC holder are subject to ROC withholding tax, currently at the rate of 21% (unless a preferable tax rate is provided under a tax treaty between the ROC and the jurisdiction where the non-ROC holder is a resident) on the amount of the distribution (in the case of cash dividends) or on the par value of the distributed the Company shares (in the case of stock dividends). The United States does not have an income tax treaty with the ROC. A 10% undistributed earnings tax was imposed on an ROC company for its after-tax earnings generated after January 1, 1998 which were not distributed in the following year. The undistributed earnings tax was reduced to 5% on January 1, 2018. The undistributed earnings tax so paid will further reduce the retained earnings available for future distribution. Furthermore, if and when the Company distributes any dividends in year 2018, for the portion of dividends out of those retained earnings on which the Company had paid the 10% ROC undistributed earnings tax, a credit of up to 5% of such portion of dividends may be offset against the 21% withholding tax imposed on the non-ROC holders. Starting from year 2019, no undistributed earnings tax paid can be offset as a credit against the 21% withholding tax.
Distributions of our shares or cash out of capital reserves are not subject to ROC withholding tax, except under limited circumstances.
Capital Gains
Starting from January 1, 2016, capital gains realized from the sale or disposal of our shares are exempt from ROC income tax under Article 4-1 of the ROC Income Tax Act.
Sales of our ADSs are not regarded as sales of ROC securities and thus any gains derived from transfers of our ADSs are not regarded as ROC-sourced income. Accordingly, any gains derived from transfers of our ADSs by non- ROC holders are not currently subject to ROC income tax.
Securities Transaction Tax
Securities transaction tax will be imposed on the seller at the rate of 0.3% of the transaction price upon a sale of the Company shares. Transfers of our ADSs are not subject to ROC securities transaction tax.
Subscription Rights
Distributions of statutory subscription rights for our shares in compliance with the ROC Company Act are currently not subject to ROC tax. Proceeds derived from sales of statutory subscription rights evidenced by securities are subject to securities transaction tax, currently at the rate of 0.3% of the gross amount received. Non-ROC holders are exempt from income tax on capital gains from the sale of statutory subscription rights evidenced by securities. Proceeds derived from sales of statutory subscription rights which are not evidenced by securities are not subject to securities transaction tax but are subject to income tax at a fixed rate of 20% of the income if the seller is a non-ROC holder. Subject to compliance with ROC law, the Company, in its sole discretion, may determine whether statutory subscription rights are evidenced by securities.
Estate and Gift Tax
ROC estate tax is payable on any property within the ROC left by a deceased, and ROC gift tax is payable on any property within the ROC donated by an individual. Estate tax and gift tax are currently payable at the progressive rates of 10%, 15% and 20%. Under the ROC Estate and Gift Tax Act, common shares issued by ROC companies are deemed located in the ROC without regard to the location of the owner. It is unclear whether a holder of ADSs will be considered to own common shares for this purpose.
Tax Treaty
At present, the ROC has income tax treaties with Indonesia, Singapore, New Zealand, Australia, the United Kingdom, South Africa, Gambia, Swaziland, Malaysia, Macedonia, the Netherlands, Senegal, Sweden, Belgium, Denmark, Israel, Vietnam, Paraguay, Hungary, France, India, Slovakia, Switzerland, Germany, Thailand, Kiribati, Luxembourg, Austria, Italy, Japan, Canada and Poland. These tax treaties may limit the rate of ROC withholding tax on dividends paid with respect to common shares issued by ROC companies. A non-ROC holder of our ADSs may or may not be considered as the beneficial owner of our shares for the purposes of such treaties. Accordingly, holders of our ADSs who wish to apply a reduced withholding tax rate that is provided under a tax treaty should consult their own tax advisers concerning such application. The United States does not have an income tax treaty with the ROC.
81
Table of Contents
Certain United States Federal Income Tax Consequences
The discussion below is for general information only and is not, and should not be interpreted to be, tax advice to any holder of our ADSs. Each holder or prospective holder of our ADSs is urged to consult his, her or its own tax advisor.
General
This discussion is a general summary of the material United States federal income tax consequences to U.S. and Non-U.S. Holders, as defined below, of the ownership and disposition of our ADSs as of the date of this report. This summary is based on the provisions of the Internal Revenue Code of 1986, as amended, or the Code, the applicable Treasury regulations promulgated and proposed thereunder, judicial decisions and current administrative rulings and practice, all of which are subject to change, possibly on a retroactive basis. The summary applies to you only if you hold our ADSs as a capital asset within the meaning of Section 1221 of the Code. The United States Internal Revenue Service, or the IRS, may challenge the tax consequences described below, and we have not requested, nor will we request, a ruling from the IRS or an opinion of counsel with respect to the United States federal income tax consequences of acquiring, holding or disposing of our ADSs. This summary does not purport to be a comprehensive description of all the tax considerations that may be relevant to the ownership of our ADSs. In particular, the discussion below does not cover tax consequences that depend upon your particular tax circumstances nor does it cover any state, local or foreign law, or the possible application of the United States federal estate or gift tax. You are urged to consult your own tax advisors regarding the application of the United States federal income tax laws to your particular situation as well as any state, local, foreign and United States federal estate and gift tax consequences of the ownership and disposition of our ADSs. In addition, this summary does not take into account any special United States federal income tax rules that apply to a particular U.S. or Non-U.S. Holder of our ADSs, including, without limitation, the following:
| • | a dealer in securities or currencies; |
| • | a trader in securities that elects to use a market-to-market method of accounting for its securities holdings; |
| • | a financial institution or a bank; |
| • | an insurance company; |
| • | a tax-exempt organization; |
| • | a person that holds our ADSs in a hedging transaction or as part of a straddle or a conversion transaction; |
| • | a person required for U.S. federal income tax purposes to conform the timing of income accruals to their financial statements under Section 451 of the Code; |
| • | a person whose functional currency for United States federal income tax purposes is not the U.S. dollar; |
| • | a person liable for alternative minimum tax; |
| • | a person that owns, or is treated as owning, 10% or more, by voting power or value, of our outstanding common stock (including common stock represented by ADSs); |
| • | certain former U.S. citizens and residents who have expatriated; or |
| • | a person that receives our ADSs pursuant to the exercise of employee stock options or otherwise as compensation. |
U.S. Holders
For purposes of the discussion below, you are a “U.S. Holder” if you are a beneficial owner of our ADSs who or that is:
| • | an individual United States citizen or resident alien of the United States (as specifically defined for United States federal income tax purposes); |
| • | a corporation, or other entity treated as a corporation for United States federal income tax purposes, created or organized in or under the laws of the United States, any State or the District of Columbia; |
| • | an estate whose income is subject to United States federal income tax regardless of its source; or |
| • | a trust (x) if a United States court can exercise primary supervision over the trust’s administration and one or more United States persons are authorized to control all substantial decisions of the trust or (y) that, if it was in existence on August 20, 1996, was treated as a United States person prior to that date and has a valid election in effect under applicable Treasury regulations to be treated as a United States person. |
82
Table of Contents
If a partnership holds our ADSs, the tax treatment of a partner will generally depend upon the status of the partner and upon the activities of the partnership. If you are a partnership holding our ADSs or a partner in such partnership, you should consult your tax advisor.
General
In general, a U.S. Holder who owns ADSs will be treated as the owner of the underlying shares represented by those ADSs for U.S. federal income tax purposes. Accordingly, no gain or loss will be recognized if a U.S. Holder exchanges ADSs for the underlying shares represented by those ADSs. The U.S. Treasury has expressed concern that parties to whom American depositary shares are released before shares are delivered to the depositary (“pre-release”), or intermediaries in the chain of ownership between holders and the issuer of the security underlying the American depositary shares, may be taking actions that are inconsistent with the claiming of foreign tax credits by holders of American depositary shares. These actions would also be inconsistent with the claiming of the preferential rate of tax, described below, applicable to dividends received by certain non-corporate holders. Accordingly, the creditability of ROC taxes, and the availability of the preferential tax rate for dividends received by certain non-corporate U.S. Holders, each as described below, could be affected by actions taken by such parties or intermediaries.
Distributions
Subject to the “passive foreign investment company” (“PFIC”) rules discussed below, the amount of any cash distribution (other than in liquidation) that you receive with respect to our ADSs plus the amount of any ROC taxes actually withheld therefrom (described above in “—ROC Taxation”) generally will be taxed to a U.S. Holder as dividend income to the extent such distribution does not exceed ChipMOS Taiwan’s current or accumulated earnings and profits (“E&P”), as calculated for U.S. federal income tax purposes. Such income will be includable in your gross income as ordinary income on the date of receipt by the Depositary. Dividends received by individuals and certain other non-corporate U.S. Holders from “qualified foreign corporations” are taxed at the rate of either 0 percent, 15 percent or 20 percent, depending upon the particular taxpayer’s U.S. federal income tax bracket; provided that the recipient-shareholder has held his or her shares as a beneficial owner for more than 60 days during the 121-day period beginning on the date which is 60 days before the shares’ ex-dividend date. A foreign corporation is a “qualified foreign corporation” if the stock with respect to which it pays dividends is traded on an established securities market in the United States, provided that the foreign corporation is not a PFIC. ChipMOS Taiwan ADSs are traded on an established securities market in the United States, although ChipMOS Taiwan cannot guarantee that its ADSs will be so traded in the future. ChipMOS Taiwan does not expect to be treated as a PFIC for U.S. federal income tax purposes for the current taxable year or the foreseeable future. No assurance can be given, however, that the IRS will not disagree and seek to treat ChipMOS Taiwan as a PFIC. If ChipMOS Taiwan were a PFIC with respect to a particular U.S. Holder, dividends received from ChipMOS Taiwan would be taxed at regular ordinary income tax rates and certain other rules will apply. See “Passive Foreign Investment Company (PFIC),” below. Holders of ChipMOS Taiwan ADSs should consult their own tax advisers regarding the availability of a reduced dividend tax rate in light of their own particular circumstances. To the extent any distribution exceeds ChipMOS Taiwan’s E&P, the distribution will first be treated as a tax-free return of capital to the extent of your adjusted tax basis in ChipMOS Taiwan ADSs and will be applied against and reduce such basis on a dollar-for-dollar basis (thereby increasing the amount of gain and decreasing the amount of loss recognized on a subsequent disposition of such ChipMOS Taiwan ADSs). To the extent that such distribution exceeds your adjusted tax basis, the distribution will be taxed as gain recognized on a sale or exchange of ChipMOS ADSs. However, because ChipMOS Taiwan does not maintain calculations of its E&P under U.S. federal income tax principles, it is expected that distributions will generally be reported to U.S. Holders as dividends. Because ChipMOS Taiwan is not a U.S. corporation, no dividends-received deduction will be allowed to corporations with respect to dividends paid by it.
For United States foreign tax credit limitation purposes, dividends received on ChipMOS Taiwan ADSs will be treated as foreign source income and will generally be “passive category income”, or in the case of certain holders, “general category income.” You may be eligible, subject to a number of complex limitations, to claim a foreign tax credit in respect of ROC taxes actually withheld on dividends paid on ChipMOS Taiwan ADSs. The rules governing United States foreign tax credits are complex, and we recommend that you consult your tax advisor regarding the applicability of such rules to you.
83
Table of Contents
Sale, Exchange or Other Disposition of ChipMOS Taiwan ADSs
Subject to the PFIC rules discussed below, generally, in connection with the sale, exchange or other taxable disposition of ChipMOS Taiwan ADSs:
| • | you will recognize capital gain or loss equal to the difference (if any) between the amount realized on such sale, exchange or other taxable disposition and your adjusted tax basis in such ChipMOS Taiwan ADSs; |
| • | such gain or loss will be long-term capital gain or loss if your holding period for ChipMOS Taiwan ADSs is more than one year at the time of such sale or other disposition; |
| • | such gain or loss will generally be treated as United States source for United States foreign tax credit purposes; and |
| • | your ability to deduct capital losses is subject to limitations. |
Long-term capital gains recognized by individuals and certain other non-corporate taxpayers are taxed at preferential rates.
Passive Foreign Investment Company (PFIC)
ChipMOS Taiwan does not expect to be a PFIC for its current taxable year or the foreseeable future. However, a company’s PFIC status is a legal and factual determination that must be made annually and thus may be subject to change. If ChipMOS Taiwan were treated as a PFIC, gain realized on the sale or other disposition of your ChipMOS Taiwan ADSs would in general not be treated as capital gain. Instead, such gain would be allocated ratably over the U.S. Holder’s holding period for the ChipMOS Taiwan ADSs. The amounts allocated to the taxable year of the sale or other disposition and to any year before ChipMOS Taiwan became a PFIC would be taxed as ordinary income. The amount allocated to each other taxable year would be subject to tax at the highest rate in effect for such year, together with an interest charge on the tax attributable to each such year. If ChipMOS Taiwan were a PFIC for any year during a U.S. Holder’s holding period for ChipMOS Taiwan ADSs, it generally will continue to be treated as a PFIC with respect to the U.S. Holder for all succeeding years during which the U.S. Holder owns the ADSs. Dividends received from ChipMOS Taiwan will not be eligible for the special tax rates applicable to qualified dividend income for certain non-corporate U.S. Holders if ChipMOS Taiwan is treated as a PFIC with respect to the U.S. Holder either in the taxable year of the distribution or the preceding taxable year, but instead will be taxable at rates applicable to ordinary income. Further, any distribution in respect of ChipMOS Taiwan ADSs in excess of 125 percent of the average annual distributions on ChipMOS Taiwan ADSs received by the U.S. Holder during the preceding three years or the U.S. Holder’s holding period, whichever is shorter, would be allocated ratably over the U.S. Holder’s holding period for ChipMOS Taiwan ADSs and subject to taxation as described for sales or other dispositions above. Certain elections may be available that would result in alternative treatments such as mark-to-market treatment of the ADSs.
3.8% Medicare Tax on “Net Investment Income”
Certain U.S. Holders that are individuals, estates, and certain trusts are subject to a 3.8% tax on all or a portion of their “net investment income,” which may include any gain realized or amounts received with respect to their ChipMOS Taiwan ADSs, to the extent of their net investment income that, when added to their other modified adjusted gross income, exceeds $200,000 for an unmarried individual, $250,000 for a married taxpayer filing a joint return (or a surviving spouse), or $125,000 for a married individual filing a separate return. U.S. Holders should consult their own tax advisor with respect to the applicability of the net investment income tax.
Information Reporting and Backup Withholding
Except in the case of corporations or other exempt holders, cash received by a U.S. Holder in connection with dividends, if any, paid by ChipMOS Taiwan may be subject to U.S. information reporting requirements and may be subject to backup withholding unless the U.S. Holder provides an accurate taxpayer identification number and complies with certain certification procedures or otherwise establishes an exemption from backup withholding. Backup withholding is not an additional tax and amounts withheld may be allowed as a credit against the U.S. Holder’s U.S. federal income tax liability and may entitle the U.S. Holder to a refund, provided that certain required information is timely furnished to the IRS.
U.S. Holders who are individuals (and under proposed regulations, certain entities) and who own “specified foreign financial assets” with an aggregate value in excess of $50,000 are generally required to file an information statement along with their tax returns, currently on IRS Form 8938, with respect to such assets. “Specified foreign financial assets” include securities issued by a non-U.S. issuer (which would include ChipMOS Taiwan ADSs) that are not held in accounts maintained by financial institutions. Higher reporting thresholds apply to certain individuals living abroad and to certain married individuals. Individuals who fail to report the required information could be subject to substantial penalties, and such individuals should consult their own tax advisors concerning the application of these rules to their investment in ChipMOS Taiwan ADSs.
84
Table of Contents
TAX MATTERS CAN BE COMPLICATED. THE FOREGOING SUMMARY OF MATERIAL U.S. FEDERAL INCOME TAX CONSEQUENCES IS NOT INTENDED TO BE A COMPLETE ANALYSIS OR DESCRIPTION OF ALL U.S. FEDERAL INCOME TAX CONSEQUENCES OF THE OWNERSHIP AND DISPOSITION OF CHIPMOS TAIWAN ADSs. IN ADDITION, THE SUMMARY DOES NOT ADDRESS TAX CONSEQUENCES THAT DEPEND UPON INDIVIDUAL CIRCUMSTANCES. THIS SUMMARY DOES NOT ADDRESS ANY U.S. FEDERAL TAX CONSEQUENCES OTHER THAN INCOME TAX OR ANY FOREIGN, STATE OR LOCAL TAX CONSIDERATIONS, NOR ANY TAX CONSEQUENCES OF ANY TRANSACTION OTHER THAN THE OWNERSHIP AND DISPOSITION OF CHIPMOS TAIWAN ADSs. ACCORDINGLY, YOU ARE STRONGLY URGED TO CONSULT YOUR OWN TAX ADVISOR TO DETERMINE THE PARTICULAR FEDERAL, STATE, LOCAL, OR FOREIGN INCOME OR OTHER TAX CONSEQUENCES OF THE OWNERSHIP AND DISPOSITION OF CHIPMOS TAIWAN ADSs TO YOU.
Non-U.S. Holders
If you are not a U.S. Holder (as defined above), you are a “Non-U.S. Holder”.
Distributions on Our ADSs
You generally will not be subject to U.S. federal income tax or withholding on distributions made on our ADSs unless:
| • | you conduct a trade or business in the United States, and |
| • | the distributions are effectively connected with the conduct of that trade or business (and, if an applicable income tax treaty so requires as a condition for you to be subject to U.S. federal income tax on a profit for the year basis in respect of income from our ADSs, such distributions are attributable to a permanent establishment that you maintain in the United States). |
If you meet the two tests above, you generally will be subject to tax in respect of such dividends in the same manner as a U.S. Holder, as described above. In addition, any effectively connected dividends received by a non-U.S. corporation may also, under certain circumstances, be subject to an additional “branch profits tax” at a 30 percent rate or such lower rate as may be specified by an applicable income tax treaty.
Sale, Exchange or Other Disposition of Our ADSs
Generally, you will not be subject to U.S. federal income tax or withholding in respect of gain recognized on a sale or other disposition of our ADSs unless:
| • | your gain is effectively connected with a trade or business that you conduct in the United States (and, if an applicable income tax treaty so requires as a condition for you to be subject to U.S. federal income tax on a profit for the year basis in respect of gain from the sale or other disposition of our ADSs, such gain is attributable to a permanent establishment that you maintain in the United States), or |
| • | you are an individual Non-U.S. Holder and are present in the United States for at least 183 days in the taxable year of the sale or other disposition, and certain other conditions exist. |
You will be subject to tax in respect of any gain effectively connected with your conduct of a trade or business in the United States generally in the same manner as a U.S. Holder, as described above. Effectively connected gains realized by a non-U.S. corporation may also, under certain circumstances, be subject to an additional “branch profits tax” at a rate of 30 percent or such lower rate as may be specified by an applicable income tax treaty.
Backup Withholding and Information Reporting
Payments, including dividends and proceeds of sales, in respect of our ADSs that are made in the United States or by a United States related financial intermediary will be subject to United States information reporting rules. In addition, such payments may be subject to United States federal backup withholding. You will not be subject to backup withholding provided that:
| • | you are a corporation or other exempt recipient, or |
| • | you provide your correct United States federal taxpayer identification number and certify, under penalties of perjury, that you are not subject to backup withholding. |
Amounts withheld under the backup withholding rules may be credited against your United States federal income tax, and you may obtain a refund of any excess amounts withheld under the backup withholding rules by filing the appropriate claim for refund with the IRS in a timely manner.
85
Table of Contents
Documents on Display
We are subject to the information requirements of the Securities Exchange Act of 1934, as amended. In accordance with these requirements, we file reports and other information with the SEC. These materials may be inspected and copied at the Commission’s Public Reference Room at 100 F Street, N.E., Washington, D.C. 20549. The public may obtain information on the operation of the Commission’s Public Reference Room by calling the Commission in the United States at 1-800-SEC-0330. The Commission also maintains a web site at http://www.sec.gov that contains reports, proxy statements and other information regarding registrants that file electronically with the Commission.
| Item 11. | Quantitative and Qualitative Disclosure about Market Risk |
Market Risks
Our exposure to financial market risks relates primarily to changes in interest rates and foreign exchange rates. To mitigate these risks, we utilize derivative financial instruments, the application of which is primarily for hedging, and not for speculative, purposes.
Interest Rate Risks
As of December 31, 2017, we had aggregate debts outstanding of NT$10,611 million (US$358 million), which was incurred for capital expenditure and general operating expenses. Of our outstanding debts as of December 31, 2017, 100% bear interest at variable rates. The interest rate for the majority of our variable rate debts varies based on a fixed percentage spread over the prime rate established by our lenders. Our variable rate debts had an annual weighted average interest rate of 1.7395% as of December 31, 2017. Accordingly, we have cash flows and earnings exposure due to market interest rate changes for our variable rate debts. An increase in interest rates of 1% would increase our annual interest charge by NT$106 million (US$4 million) based on our outstanding floating rate indebtedness as of December 31, 2017.
As of December 31, 2016 and 2017, we had no interest rate swap agreements outstanding.
Foreign Currency Exchange Rate Risks
Our foreign currency exposure gives rise to market risks associated with exchange rate movements against the NT dollar, the RMB, the Japanese yen and the US dollar. As of December 31, 2017, 58.6% of our financial assets and 5.4% of our financial liabilities are denominated in the RMB, US dollar and Japanese yen, respectively. We do not hold or issue any derivative for trading purposes or to hedge against fluctuations in foreign exchange rates. We mitigate this risk by conducting sales and purchases transactions in the same currency. These hedging transactions help to reduce, but do not eliminate, the impact of foreign currency exchange rate movements. An average appreciation of the NT dollar against all other relevant foreign currencies of 5% would decrease our exchange gain by NT$320 million (US$11 million) based on our outstanding assets and liabilities denominated in foreign currencies as of December 31, 2017. As of December 31, 2016 and 2017, we had no outstanding forward exchange or foreign currency option contracts.
See Note 34 of our audited consolidated financial statements for additional information on financial risk management.
86
Table of Contents
| Item 12. | Description of Securities Other Than Equity Securities |
American Depositary Shares
Depositary Fees
Under the terms of the Deposit Agreement for our ADSs, an ADS holder is required to pay the following service fees to the depositary bank:
|
Service |
Fees |
|
|
(1) Issuance of ADSs (i.e., an issuance upon a deposit of Shares or upon a change in the ADS(s)-to-Share(s) ratio), excluding issuances as a result of distributions described in paragraph (4) below. |
Up to US$5.00 per 100 ADS (or fraction thereof) issued. | |
|
(2) Cancellation of ADSs (i.e., a cancellation of ADSs for delivery of deposited Shares or upon a change in the ADS(s)-to-Share(s) ratio). |
Up to US$5.00 per 100 ADS (or fraction thereof) cancelled. | |
|
(3) Distribution of cash dividends or other cash distributions (i.e., upon a sale of rights and other entitlements). |
Up to US$5.00 per 100 ADS (or fraction thereof) held. | |
|
(4) Distribution of ADSs pursuant to (i) stock dividends or other free stock distributions, or (ii) an exercise of rights to purchase additional ADSs. |
Up to US$5.00 per 100 ADS (or fraction thereof) held. | |
|
(5) Distribution of securities other than ADSs or rights to purchase additional ADSs (i.e., spin-off shares). |
Up to US$5.00 per 100 ADS (or fraction thereof) held. | |
|
(6) ADS Services. |
Up to US$5.00 per 100 ADS (or fraction thereof) held on the applicable record date(s) established by the Depositary. | |
Depositary Charges
A holder of our ADSs is responsible to pay certain charges such as:
| (i) | taxes (including applicable interest and penalties) and other governmental charges; |
| (ii) | such registration fees as may from time to time be in effect for the registration of Shares or other Deposited Securities on the share register and applicable to transfers of Shares or other Deposited Securities to or from the name of the Custodian, the Depositary or any nominees upon the making of deposits and withdrawals, respectively; |
| (iii) | such cable, telex and facsimile transmission and delivery expenses as are expressly provided in the Deposit Agreement to be at the expense of the person depositing Shares or withdrawing Deposited Securities or of the Holders and Beneficial Owners of ADSs; |
| (iv) | the expenses and charges incurred by the Depositary in the conversion of foreign currency; |
| (v) | such fees and expenses as are incurred by the Depositary in connection with compliance with exchange control regulations and other regulatory requirements applicable to Shares, Deposited Securities, ADSs and ADRs; and |
| (vi) | the fees and expenses incurred by the Depositary, the Custodian, or any nominee in connection with the servicing or delivery of Deposited Property. |
All ADS fees and charges so payable may be deducted from distributions or must be remitted to the Depositary, or its designee, and may, at any time and from time to time, be changed by agreement between the Depositary and the Company, but, in the case of ADS fees and charges payable by Holders and Beneficial Owners, only in the manner contemplated in the Deposit Agreement. The Depositary shall provide, without charge, a copy of its latest ADS fee schedule to anyone upon request.
87
Table of Contents
ADS fees and charges payable upon (i) the issuance of ADSs and (ii) the cancellation of ADSs will be payable by the person to whom the ADSs are so issued by the Depositary (in the case of ADS issuances) and by the person who ADSs are being cancelled (in the case of ADS cancellations). In the case of ADSs issued by the Depositary into DTC or presented to the Depositary via DTC, the ADS issuance and cancellation fees and charges will be payable by the DTC Participant(s) receiving the ADSs from the Depositary or the DTC Participant(s) holding the ADSs being cancelled, as the case may be, on behalf of the Beneficial Owner(s) and will be charged by the DTC Participant(s) to the account(s) of the applicable Beneficial Owner(s) in accordance with the procedures and practices of the DTC participant(s) as in effect at the time. ADS fees and charges in respect of distributions and the ADS service fee are payable by Holders as of the applicable ADS Record Date established by the Depositary. In the case of distributions of cash, the amount of the applicable ADS fees and charges is deducted from the funds being distributed. In the case of (i) distributions other than cash and (ii) the ADS service fee, the applicable Holders as of the ADS Record Date established by the Depositary will be invoiced for the amount of the ADS fees and charges and such ADS fees may be deducted from distributions made to Holders. For ADSs held through DTC, the ADS fees and charges for distributions other than cash and the ADS service fee may be deducted from distributions made through DTC, and may be charged to the DTC Participants in accordance with the procedures and practices prescribed by DTC from time to time and the DTC Participants in turn charge the amount of such ADS fees and charges to the Beneficial Owners for whom they hold ADSs.
The Depositary may reimburse the Company for certain expenses incurred by the Company in respect of the ADR program established pursuant to the Deposit Agreement, by making available a portion of the ADS fees charged in respect of the ADR program or otherwise, upon such terms and conditions as the Company and the Depositary agree from time to time. The Company shall pay to the Depositary such fees and charges, and reimburse the Depositary for such out-of-pocket expenses, as the Depositary and the Company may agree from time to time. Responsibility for payment of such fees, charges and reimbursements may from time to time be changed by agreement between the Company and the Depositary. Unless otherwise agreed, the Depositary shall present its statement for such fees, charges and reimbursements to the Company once every three months. The charges and expenses of the Custodian are for the sole account of the Depositary.
The obligations of Holders and Beneficial Owners to pay ADS fees and charges shall survive the termination of the Deposit Agreement. As to any Depositary, upon the resignation or removal of such Depositary as described in the Deposit Agreement, the right to collect ADS fees and charges shall extend for those ADS fees and charges incurred prior to the effectiveness of such resignation or removal.
Depositary Payment
In 2017, we received US$553.2 thousand from Citi Bank N.A., the Depositary for our ADR program. The table below sets forth details of the amount we received from Citi Bank N.A.
|
Item |
US$
(in thousand) |
|||
|
Reimbursement of SEC Filing Fees |
1.5 | |||
|
Reimbursement of Settlement Infrastructure Fees |
0.2 | |||
|
Reimbursement of Proxy Process Expenses |
13.6 | |||
|
Reimbursement of ADR holders identification expenses |
9.8 | |||
|
Reimbursement of Legal Fees |
207.3 | |||
|
Direct reimbursement to issuer |
553.2 | |||
|
|
|
|||
|
Total Payments (1) |
785.6 | |||
|
|
|
|||
| (1) | Net of U.S. withholding tax. |
| Item 13. | Defaults, Dividend, Arrearages and Delinquencies |
None.
88
Table of Contents
| Item 14. | Material Modifications to the Rights of Security Holders and Use of Proceeds |
Not applicable.
| Item 15. | Controls and Procedures |
Disclosure Controls and Procedures. Our management, including our President, the principal executive officer and Senior Director of the Finance and Accounting Management Center, the principal financial officers, conducted an evaluation of the effectiveness of our disclosure controls and procedures (as defined in Rule 13a-15(e) of the Securities Exchange Act of 1934, as amended). Based upon that evaluation, our management concluded that, our disclosure controls and procedures were effective as of December 31, 2017.
Management’s Annual Report on Internal Control Over Financial Reporting. Management’s Annual Report on Internal Control Over Financial Reporting is set forth below.
Management’s Annual Report on Internal Control Over Financial Reporting
April 19, 2018
Management of ChipMOS TECHNOLOGIES INC. (together with its consolidated subsidiaries, the “Company”) is responsible for establishing and maintaining adequate internal control over financial reporting (as defined in Rule 13a-15(f) of the Securities Exchange Act of 1934, as amended). The Company’s internal control over financial reporting is a process designed under the supervision of the Company’s President, the principal executive officer, and Senior Director of the Finance and Accounting Management Center, the principal financial officer, to provide reasonable assurance regarding the reliability of financial reporting and the preparation of the Company’s financial statements for external reporting purposes in accordance with International Financial Reporting Standards as issued by the International Accounting Standards Board. Our internal control over financial reporting includes those policies and procedures that:
| • | pertain to the maintenance of records that, in reasonable detail, accurately and fairly reflect our transactions and dispositions of our assets; |
| • | provide reasonable assurance that our transactions are recorded as necessary to permit preparation of our financial statements in accordance with IFRS, and that our receipts and expenditures are being made only in accordance with authorizations of our management and our directors; and |
| • | provide reasonable assurance regarding prevention or timely detection of unauthorized acquisition, use or disposition of our assets that could have a material effect on the financial statements. |
Because of its inherent limitations, internal control over financial reporting may not prevent or detect misstatements. Projections of any evaluation of internal control effectiveness to future periods are subject to the risk that controls may become inadequate because of changes in conditions, or that the degree of compliance with the policies or procedures may deteriorate.
Our management assessed the effectiveness of our internal control over financial reporting as of December 31, 2017 based on the criteria set forth in Internal Control – Integrated Framework (2013) issued by the Committee of Sponsoring Organizations of the Treadway Commission (COSO). Based on the assessment, our management believes that our internal control over financial reporting was effective as of December 31, 2017.
Our internal control over financial reporting as of December 31, 2017 has been audited by PricewaterhouseCoopers, Taiwan, an independent registered public accounting firm, as stated in their report included in this Annual Report on Form 20-F.
|
/s/ Shih-Jye Cheng |
/s/ Silvia Su |
|||||||
| Name: | Shih-Jye Cheng | Name: | Silvia Su | |||||
| Title: | Chairman and President | Title: | Senior Director, Finance and Accounting Management Center | |||||
Changes in Internal Control Over Financial Reporting. During the year ended December 31, 2017, there have been no changes in our internal control over financial reporting that may materially affected, or are reasonably likely to materially affect, our internal control over financial reporting.
| Item 16A. | Audit Committee Financial Expert |
Our Board of Directors have determined that Chin-Shyh Ou, one of our independent directors, qualified as audit committee financial expert and meets the independence requirement as defined in Item 16A to Form 20-F.
89
Table of Contents
| Item 16B. | Code of Ethics |
We have adopted a Code of Ethics and Business Conduct, which applies to our employees and contract workers. A copy of our Code of Ethics and Business Conduct is filed as Exhibit 11.1 to this Annual Report on Form 20-F.
| Item 16C. | Principal Accountant Fees and Services |
The table below summarizes the aggregate fees that we paid or accrued for services provided by PricewaterhouseCoopers, Taiwan (“PwC Taiwan”) for the years ended December 31, 2016 and 2017.
| 2016 | 2017 | |||||||
| NT$ | NT$ | |||||||
| (In thousands) | ||||||||
|
Audit Fees |
$ | 15,200 | $ | 16,350 | ||||
|
Audit Related Fees |
7,300 | 200 | ||||||
|
Tax Fees |
1,850 | 3,140 | ||||||
|
All Other Fees |
470 | — | ||||||
|
|
|
|
|
|||||
|
Total |
$ | 24,820 | $ | 19,690 | ||||
|
|
|
|
|
|||||
Audit Fees . This category includes the audit of our annual financial statements and services that are provided by the independent auditors in connection with our annual financial statements, internal control over financial reporting, quarterly financial statements, and related statutory and regulatory filings.
Audit-Related Fees . This category includes fees reasonably related to the performance of the audit or review of our financial statements and not included in the category of Audit Fees (described above).
Tax Fees. This category includes aggregate fees for respective years for services relating to tax compliance, advice and planning.
All Other Fees. This category includes aggregate fees for respective years for services other than the services included in the above.
All non-audit services are pre-approved by our Audit Committee on a case-by-case basis. Accordingly, we have not established any pre-approval policies and procedures.
All audit services that PwC Taiwan was engaged from August 28, 2015, the effective date of revised Rule 2-01(c)(7) of Regulation S-X entitled “Audit Committee Administration of the Engagement” on strengthening requirements regarding auditor independence, were pre-approved by the Audit Committee.
| Item 16D. | Exemptions from the Listing Standards for Audit Committees |
Not applicable.
| Item 16E. | Purchases of Equity Securities by the Issuer and Affiliated Purchasers |
Repurchase Programs.
On August 10, 2015, the board of directors adopted on a share repurchase program to repurchase up to 20.0 million of our shares through open market transactions at a price no more than NT$41.34 per share during the period from August 11, 2015 to October 10, 2015. On September 18, 2015, we completed this share repurchase program under which we repurchased 20.0 million shares for approximately NT$634 million. The repurchased shares were retired and cancelled. (Repurchase Program I)
On February 4, 2016, the board of directors adopted on a share repurchase program to repurchase up to 15.0 million of our shares through open market transactions at a price no more than NT$40.00 per share during the period from February 5, 2016 to April 4, 2016. The purpose for the above share repurchase is to boost the morale of the employees and therefore such repurchased shares will be transferred to the employees of the Company. On April 1, 2016, we completed this share repurchase program under which we repurchased 15.0 million shares for approximately NT$511 million. (Repurchase Program II)
90
Table of Contents
On May 12, 2016, the board of directors adopted on a share repurchase program to repurchase up to 15.0 million of our shares through open market transactions at a price no more than NT$40.00 per share during the period from May 13, 2016 to July 12, 2016. The purpose for the above share repurchase is to boost the morale of the employees and therefore such repurchased shares will be transferred to the employees of the Company. On July 1, 2016, we completed this share repurchase program under which we repurchased 15.0 million shares for approximately NT$494 million. (Repurchase Program III)
Other repurchases.
On September 14, 2016, we repurchased 85 thousand shares from our dissenting shareholders in accordance with the Merger of the Company and ChipMOS Bermuda which was effective on October 31, 2016.
The table sets forth certain information about the purchase of our common shares by the Issuer’s repurchase programs in the periods indicated.
Purchases of Equity Securities by the Issuer
|
Period |
Total Number
of Shares Purchased |
Average Price
Paid Per Share (NT$) |
Total Number of
Shares Purchased as Part of Publicly Announced Plans or Programs |
Maximum Dollar
Value of Shares that May Yet Be Purchased Under the Plans or Programs (NT$ Million) |
||||||||||||
|
August – September, 2015 (Repurchase Program I) |
||||||||||||||||
|
August 2015 |
10,083,000 | |||||||||||||||
|
September 2015 |
9,917,000 | |||||||||||||||
| 20,000,000 | 31.69 | 20,000,000 | None | |||||||||||||
|
February – April, 2016 (Repurchase Program II) |
||||||||||||||||
|
February 2016 |
3,990,000 | |||||||||||||||
|
March 2016 |
10,556,000 | |||||||||||||||
|
April 2016 |
454,000 | |||||||||||||||
| 15,000,000 | 34.05 | 15,000,000 | None | |||||||||||||
|
May – July, 2016 (Repurchase Program III) |
||||||||||||||||
|
May 2016 |
5,184,000 | |||||||||||||||
|
June 2016 |
9,371,000 | |||||||||||||||
|
July 2016 |
445,000 | |||||||||||||||
| 15,000,000 | 32.95 | 15,000,000 | None | |||||||||||||
|
September 2016 (Other Repurchase) (1) |
||||||||||||||||
|
September 2016 |
85,000 | |||||||||||||||
| 85,000 | 31.10 | Not Applicable | ||||||||||||||
|
|
|
|
|
|||||||||||||
|
Total |
50,085,000 | 50,000,000 | ||||||||||||||
|
|
|
|
|
|||||||||||||
Note:
| (1) | The shares repurchased from our dissenting shareholders. |
91
Table of Contents
| Item 16F. | Change in Registrant’s Certifying Accountant |
Not applicable.
| Item 16G. | Corporate Governance |
Our corporate governance practices are governed by applicable ROC law, specifically, the ROC Company Act and Securities and Exchange Act, and our articles of incorporation. Also, because our securities are listed on the NASDAQ, we are subject to corporate governance requirements applicable to NASDAQ-listed foreign private issuers under NASDAQ listing rules.
Under NASDAQ Rule 5615(a)(3), NASDAQ-listed foreign private issuers may, in general, follow their home country corporate governance practices instead of most NASDAQ corporate governance requirements. However, all NASDAQ-listed, foreign private issuers must comply with NASDAQ Rules 5605(c)(2)(A)(ii), 5605(c)(3), 5625 and 5640.
Item 16G requires a foreign private issuer to provide in its annual report filed with the SEC a brief, general summary of any significant ways its corporate governance practices differ from those followed by NASDAQ-listed domestic companies. The table below provides this summary information as required by Item 16G and by NASDAQ Rule 5615(a) (3):
92
Table of Contents
|
NASDAQ Listing Rule |
Corporate Governance Practice To Be
|
Our Corporate Governance Practice |
||
| 5250(b)(3) | Disclosure of third party director and nominee compensation requirements. |
We follow governance practices under ROC law. NASDAQ Rule 5250(b)(3) generally requires a NASDAQ-listed company to disclose at least annually material terms of agreements and arrangements with third parties (other than the company) relating to compensation of or payment to the company’s directors in connection with candidacy or service as a company director, subject to certain limited exceptions. There is no similar regulation requiring disclosure of third party compensation of directors and nominees for director under ROC law. However, certain ROC laws and regulations are designed to enhance transparency by making investors aware of the relationship between independent directors or nominees for independent director of a TWSE-listed company and third party. For instance, the ROC Corporate Governance Best Practice Principles for TWSE/TPEx Listed Companies requires that, in the event that both of a TWSE-listed company and its group enterprises, and another company and its group enterprises, nominate any director, supervisor or managerial officer from the other company or its group enterprises as an independent director candidate, the TWSE-listed company shall disclose the information when receiving the nomination of an independent director candidate, and explain the competence of the independent director candidate. It further requires that, if the candidate becomes the TWSE-listed company’s independent director through election, such company shall disclose the number of votes cast in favor of such independent director-elect. In addition, if an independent director of a TWSE-listed company concurrently serves as a director, supervisor or other position of other company, such concurrently held position shall be disclosed in the Market Observation Post System of the TWSE. |
||
| 5605(b) | Requires a majority independent board and an independent director executive session. |
We follow governance practices under ROC law. We have five independent directors out of a total of nine directors on our board. Our standards in determining director independence substantially comply with the NASDAQ requirement, which include detailed tests for determining director independence. |
||
| 5605(c)(1) | Audit committee charter requirements. | We follow governance practices under ROC law. | ||
| 5605(c)(2)(A)(ii) | Audit committee composition and independence requirements. | We follow the same NASDAQ listing rule governance practice as followed by domestic companies. | ||
|
5605(c)(2)(A)(i), (iii), (iv) |
Audit committee financial sophistication requirements. | We follow the same NASDAQ listing rule governance practice as followed by domestic companies. | ||
| 5605(c)(3) | Audit committee responsibilities and authority requirements. | We follow the same NASDAQ listing rule governance practice as followed by domestic companies. | ||
93
Table of Contents
|
NASDAQ Listing Rule |
Corporate Governance Practice To Be
|
Our Corporate Governance Practice |
||
| 5605(d), (e) | Requires independent director oversight of executive officer compensation and director nominations. |
We follow the same NASDAQ listing rule governance practice regarding the compensation committee as followed by domestic companies. As for the director nominations, we follow governance practices under ROC law. Under the ROC Company Act and the interpretations thereof, candidates to serve as directors are nominated either by the board of directors prior to the shareholders’ meeting or by the shareholders during the election of the director. |
||
| 5610 | Requires a code of conduct for directors, officers and employees. |
We follow governance practices under ROC law. We have adopted the Code of Ethics and Business Conduct that satisfies the requirements promulgated by the TWSE, and applies to all employees, managerial officers and directors of our company. The details of the waiver of such Code for our directors and managerial officers will be disclosed in the Market Observation Post System of the TWSE. |
||
| 5620 | Annual shareholder meeting requirements. |
We follow governance practices under ROC law. We are required by the ROC Company Act and our articles of incorporation to hold a general meeting of our shareholders within six months following the end of each fiscal year, unless for specific legitimate reasons or approved otherwise by the relevant authorities. Further, a majority of the holders of all issued and outstanding common shares present at a shareholders’ meeting constitutes a quorum for meetings of our shareholders. |
||
| 5625 | Requires an issuer to notify NASDAQ of any material noncompliance with the Rule 5600 series. | We follow the same NASDAQ listing rule governance practice as followed by domestic companies. | ||
| 5630 | Requires oversight of related party transactions. |
We follow governance practices under ROC law. According to NASDAQ Rule 5630(a), each company that is not a limited partnership shall conduct an appropriate review and oversight of all related party transactions for potential conflict of interest situations on an ongoing basis by the company’s audit committee or another independent body of the board of directors. According to our Procedures for Acquisition or Disposal of Assets that satisfies the requirements promulgated by the FSC, any related party transaction exceeding a specified threshold shall be required to have an independent expert issue a fairness opinion, and be submitted to our audit committee for its review and approval. |
||
| 5635 | Circumstances that require shareholder approval. |
We follow governance practices under ROC law. According to NASDAQ Rule 5635(c), each issuer shall require shareholder approval when a stock option or purchase plan is to be established or materially amended or other equity compensation arrangement made or materially amended, pursuant to which stock may be acquired by officers, directors, employees, or consultants. However, under the corresponding domestic requirements under the ROC Company Act and the Securities and Exchange Act, the board of directors has authority, subject to the approval of the Securities and Futures Bureau of the FSC, to approve employee stock option plans and to grant options to employees pursuant to such plans. |
||
| 5640 | Shareholder voting rights requirements. | We follow the same NASDAQ listing rule governance practice as followed by domestic companies. | ||
94
Table of Contents
| Item 17. | Financial Statements |
The Company has elected to provide the financial statements and related information specified in Item 18 in lieu of Item 17.
| Item 18. | Financial Statements |
The financial statements and related information of the Company are located at pages F-1 to F-74.
| Item 19. | Exhibits |
95
Table of Contents
| (1) | Incorporated by reference to our Registration Statement on Form F-4 (File No. 333-209733), filed on February 26, 2016. |
| (2) | Incorporated by reference to our Registration Statement on Form F-6/Amendment No. 1 (File No. 333-209736), filed on June 21, 2016. |
| (3) | Incorporated by reference to the Annual Report on Form 20-F (File No. 0-31106) of ChipMOS TECHNOLOGIES (Bermuda) LTD., filed on April 24, 2015. |
| (4) | Incorporated by reference to the Annual Report on Form 20-F (File No. 001-37928) of ChipMOS TECHNOLOGIES INC., filed on April 20, 2017. |
We have not included as exhibits certain instruments with respect to our debt, the amount of debt authorized under each of which does not exceed 10% of our total assets, and we agree to furnish a copy of any such instrument to the Commission upon request.
96
Table of Contents
SIGNATURES
Pursuant to the requirements of Section 12 of the Securities Exchange Act of 1934, the Registrant certifies that it meets all the requirements for filing on Form 20-F and it has duly caused this Annual Report on Form 20-F to be signed on its behalf by the undersigned, thereunto duly authorized, in Hsinchu, Taiwan, Republic of China, on April 19, 2018.
|
ChipMOS TECHNOLOGIES INC. |
||
| By: |
/s/ Shih-Jye Cheng |
|
|
Name: |
Shih-Jye Cheng |
|
|
Title: |
Chairman and President |
|
97
Table of Contents
ChipMOS TECHNOLOGIES INC. AND SUBSIDIARIES
INDEX TO CONSOLIDATED FINANCIAL STATEMENTS
| Page(s) | ||||
| F-2 | ||||
| F-4 | ||||
| F-6 | ||||
| F-8 | ||||
| F-11 | ||||
| F-13 | ||||
F-1
Table of Contents
ChipMOS TECHNOLOGIES INC. AND SUBSIDIARIES
Report of Independent Registered Public Accounting Firm
To the Board of Directors and Shareholders of
ChipMOS TECHNOLOGIES INC.
Opinions on the Financial Statements and Internal Control over Financial Reporting
We have audited the accompanying consolidated statements of financial position of ChipMOS TECHNOLOGIES INC. and its subsidiaries as of December 31, 2016 and 2017, and the related consolidated statements of comprehensive income, of changes in equity and of cash flows for each of the three years in the period ended December 31, 2017, including the related notes (collectively referred to as the “consolidated financial statements”). We also have audited the Company’s internal control over financial reporting as of December 31, 2017, based on criteria established in Internal Control - Integrated Framework (2013) issued by the Committee of Sponsoring Organizations of the Treadway Commission (“COSO”).
In our opinion, the consolidated financial statements referred to above present fairly, in all material respects, the financial position of the Company as of December 31, 2016 and 2017, and the results of their operations and their cash flows for each of the three years in the period ended December 31, 2017 in conformity with International Financial Reporting Standards as issued by the International Accounting Standards Board. Also in our opinion, the Company maintained, in all material respects, effective internal control over financial reporting as of December 31, 2017, based on criteria established in Internal Control - Integrated Framework (2013) issued by the COSO.
Basis for Opinions
The Company’s management is responsible for these consolidated financial statements, for maintaining effective internal control over financial reporting, and for its assessment of the effectiveness of internal control over financial reporting, included in Management’s Annual Report on Internal Control Over Financial Reporting appearing under Item 15. Our responsibility is to express opinions on the Company’s consolidated financial statements and on the Company’s internal control over financial reporting based on our audits. We are a public accounting firm registered with the Public Company Accounting Oversight Board (United States) (“PCAOB”) and are required to be independent with respect to the Company in accordance with the U.S. federal securities laws and the applicable rules and regulations of the Securities and Exchange Commission and the PCAOB.
We conducted our audits in accordance with the standards of the PCAOB. Those standards require that we plan and perform the audits to obtain reasonable assurance about whether the consolidated financial statements are free of material misstatement, whether due to error or fraud, and whether effective internal control over financial reporting was maintained in all material respects.
Our audits of the consolidated financial statements included performing procedures to assess the risks of material misstatement of the consolidated financial statements, whether due to error or fraud, and performing procedures that respond to those risks. Such procedures included examining, on a test basis, evidence regarding the amounts and disclosures in the consolidated financial statements. Our audits also included evaluating the accounting principles used and significant estimates made by management, as well as evaluating the overall presentation of the consolidated financial statements. Our audit of internal control over financial reporting included obtaining an understanding of internal control over financial reporting, assessing the risk that a material weakness exists, and testing and evaluating the design and operating effectiveness of internal control based on the assessed risk. Our audits also included performing such other procedures as we considered necessary in the circumstances. We believe that our audits provide a reasonable basis for our opinions.
F-2
Table of Contents
ChipMOS TECHNOLOGIES INC. AND SUBSIDIARIES
Report of Independent Registered Public Accounting Firm
Definition and Limitations of Internal Control over Financial Reporting
A company’s internal control over financial reporting is a process designed to provide reasonable assurance regarding the reliability of financial reporting and the preparation of financial statements for external purposes in accordance with generally accepted accounting principles. A company’s internal control over financial reporting includes those policies and procedures that (i) pertain to the maintenance of records that, in reasonable detail, accurately and fairly reflect the transactions and dispositions of the assets of the company; (ii) provide reasonable assurance that transactions are recorded as necessary to permit preparation of financial statements in accordance with generally accepted accounting principles, and that receipts and expenditures of the company are being made only in accordance with authorizations of management and directors of the company; and (iii) provide reasonable assurance regarding prevention or timely detection of unauthorized acquisition, use, or disposition of the company’s assets that could have a material effect on the financial statements.
Because of its inherent limitations, internal control over financial reporting may not prevent or detect misstatements. Also, projections of any evaluation of effectiveness to future periods are subject to the risk that controls may become inadequate because of changes in conditions, or that the degree of compliance with the policies or procedures may deteriorate.
/s/ PricewaterhouseCoopers, Taiwan
Taipei, Taiwan
Republic of China
April 19, 2018
We have served as the Company’s auditor since 2015.
F-3
Table of Contents
ChipMOS TECHNOLOGIES INC. AND SUBSIDIARIES
For the years ended December 31, 2015, 2016 and 2017
| Note |
(Adjusted)
2015 |
2016 | 2017 | 2017 | ||||||||||||||
| NT$000 | NT$000 | NT$000 | US$000 | |||||||||||||||
|
Revenue |
4 | 18,837,089 | 18,387,593 | 17,940,855 | 605,292 | |||||||||||||
|
Cost of revenue |
5,15 | (14,685,514 | ) | (14,745,472 | ) | (14,703,729 | ) | (496,077 | ) | |||||||||
|
|
|
|
|
|
|
|
|
|||||||||||
|
Gross profit |
4,151,575 | 3,642,121 | 3,237,126 | 109,215 | ||||||||||||||
|
Research and development expenses |
5 | (747,779 | ) | (838,866 | ) | (985,873 | ) | (33,261 | ) | |||||||||
|
Sales and marketing expenses |
5 | (90,345 | ) | (72,918 | ) | (64,397 | ) | (2,173 | ) | |||||||||
|
General and administrative expenses |
5 | (770,075 | ) | (822,068 | ) | (639,809 | ) | (21,586 | ) | |||||||||
|
Other operating income (expenses), net |
6 | 105,051 | 90,306 | 692,834 | 23,375 | |||||||||||||
|
|
|
|
|
|
|
|
|
|||||||||||
|
Operating profit |
2,648,427 | 1,998,575 | 2,239,881 | 75,570 | ||||||||||||||
|
Finance costs |
7 | (142,511 | ) | (179,116 | ) | (217,283 | ) | (7,331 | ) | |||||||||
|
Other non-operating income (expenses), net |
8 | 340,140 | (119,024 | ) | (490,182 | ) | (16,538 | ) | ||||||||||
|
|
|
|
|
|
|
|
|
|||||||||||
|
Profit before income tax |
2,846,056 | 1,700,435 | 1,532,416 | 51,701 | ||||||||||||||
|
Income tax expense |
9 | (935,855 | ) | (177,120 | ) | (550,487 | ) | (18,572 | ) | |||||||||
|
|
|
|
|
|
|
|
|
|||||||||||
|
Profit from continuing operations |
1,910,201 | 1,523,315 | 981,929 | 33,129 | ||||||||||||||
|
Profit (loss) from discontinued operations |
18 | (34,233 | ) | (122,105 | ) | 1,814,953 | 61,233 | |||||||||||
|
|
|
|
|
|
|
|
|
|||||||||||
|
Profit for the year |
1,875,968 | 1,401,210 | 2,796,882 | 94,362 | ||||||||||||||
|
|
|
|
|
|
|
|
|
|||||||||||
|
Other comprehensive income (loss): |
||||||||||||||||||
|
Other comprehensive income (loss) that will be reclassified to profit or loss in subsequent periods: |
||||||||||||||||||
|
Exchange differences on translation of foreign operations |
(12,376 | ) | (200,280 | ) | (232,652 | ) | (7,849 | ) | ||||||||||
|
Share of other comprehensive income of associates that will be reclassified to profit or loss |
— | — | 678 | 23 | ||||||||||||||
|
|
|
|
|
|
|
|
|
|||||||||||
|
Net other comprehensive loss that will be reclassified to profit or loss in subsequent periods |
(12,376 | ) | (200,280 | ) | (231,974 | ) | (7,826 | ) | ||||||||||
|
|
|
|
|
|
|
|
|
|||||||||||
|
Other comprehensive income (loss) that will not be reclassified to profit or loss in subsequent periods: |
||||||||||||||||||
|
Other comprehensive income (loss) on remeasurements of defined benefit plans |
23 | (41,758 | ) | (43,383 | ) | 50,838 | 1,715 | |||||||||||
|
Share of other comprehensive loss of associates that will not be reclassified to profit or loss |
(165 | ) | (133 | ) | (124 | ) | (4 | ) | ||||||||||
|
Income tax effect that will not be reclassified to profit or loss |
9 | 7,099 | 7,375 | (8,642 | ) | (292 | ) | |||||||||||
|
|
|
|
|
|
|
|
|
|||||||||||
|
Net other comprehensive income (loss) that will not be reclassified to profit or loss in subsequent periods |
(34,824 | ) | (36,141 | ) | 42,072 | 1,419 | ||||||||||||
|
|
|
|
|
|
|
|
|
|||||||||||
|
Other comprehensive loss for the year, net of income tax |
(47,200 | ) | (236,421 | ) | (189,902 | ) | (6,407 | ) | ||||||||||
|
|
|
|
|
|
|
|
|
|||||||||||
|
Total comprehensive income for the year, net of income tax |
1,828,768 | 1,164,789 | 2,606,980 | 87,955 | ||||||||||||||
|
|
|
|
|
|
|
|
|
|||||||||||
F-4
Table of Contents
ChipMOS TECHNOLOGIES INC. AND SUBSIDIARIES
Consolidated Statements of Comprehensive Income (Continued)
For the years ended December 31, 2015, 2016 and 2017
| Note |
(Adjusted)
2015 |
2016 | 2017 | 2017 | ||||||||||||||||
| NT$000 | NT$000 | NT$000 | US$000 | |||||||||||||||||
|
Profit (loss) attributable to: |
||||||||||||||||||||
|
Equity holders of the Company |
||||||||||||||||||||
|
- Continuing operations |
2,164,557 | 1,829,327 | 981,929 | 33,129 | ||||||||||||||||
|
- Discontinued operations |
(34,233 | ) | (122,105 | ) | 1,814,953 | 61,233 | ||||||||||||||
|
Predecessors’ interests |
(291,429 | ) | (306,012 | ) | — | — | ||||||||||||||
|
Non-controlling interests |
37,073 | — | — | — | ||||||||||||||||
|
|
|
|
|
|
|
|
|
|||||||||||||
| 1,875,968 | 1,401,210 | 2,796,882 | 94,362 | |||||||||||||||||
|
|
|
|
|
|
|
|
|
|||||||||||||
|
Total comprehensive income (loss) attributable to: |
||||||||||||||||||||
|
Equity holders of the Company |
||||||||||||||||||||
|
- Continuing operations |
2,167,256 | 1,788,878 | 1,079,672 | 36,426 | ||||||||||||||||
|
- Discontinued operations |
(62,126 | ) | (318,077 | ) | 1,527,308 | 51,529 | ||||||||||||||
|
Predecessors’ interests |
(291,429 | ) | (306,012 | ) | — | — | ||||||||||||||
|
Non-controlling interests |
15,067 | — | — | — | ||||||||||||||||
|
|
|
|
|
|
|
|
|
|||||||||||||
| 1,828,768 | 1,164,789 | 2,606,980 | 87,955 | |||||||||||||||||
|
|
|
|
|
|
|
|
|
|||||||||||||
|
Basic earnings per share: |
10 | |||||||||||||||||||
|
Equity holders of the Company |
||||||||||||||||||||
|
- Continuing operations |
NT$ | 2.47 | NT$ | 2.13 | NT$ | 1.16 | US$ | 0.04 | ||||||||||||
|
- Discontinued operations |
(0.04 | ) | (0.14 | ) | 2.14 | 0.07 | ||||||||||||||
|
|
|
|
|
|
|
|
|
|||||||||||||
|
Equity holders of the Company |
2.43 | 1.99 | 3.30 | 0.11 | ||||||||||||||||
|
Predecessors’ interests |
(0.33 | ) | (0.35 | ) | — | — | ||||||||||||||
|
|
|
|
|
|
|
|
|
|||||||||||||
| NT$ | 2.10 | NT$ | 1.64 | NT$ | 3.30 | US$ | 0.11 | |||||||||||||
|
|
|
|
|
|
|
|
|
|||||||||||||
|
Diluted earnings per share: |
||||||||||||||||||||
|
Equity holders of the Company |
||||||||||||||||||||
|
- Continuing operations |
NT$ | 2.44 | NT$ | 2.11 | NT$ | 1.13 | US$ | 0.04 | ||||||||||||
|
- Discontinued operations |
(0.04 | ) | (0.14 | ) | 2.10 | 0.07 | ||||||||||||||
|
|
|
|
|
|
|
|
|
|||||||||||||
|
Equity holders of the Company |
2.40 | 1.97 | 3.23 | 0.11 | ||||||||||||||||
|
Predecessors’ interests |
(0.33 | ) | (0.35 | ) | — | — | ||||||||||||||
|
|
|
|
|
|
|
|
|
|||||||||||||
| NT$ | 2.07 | NT$ | 1.62 | NT$ | 3.23 | US$ | 0.11 | |||||||||||||
|
|
|
|
|
|
|
|
|
|||||||||||||
|
Basic earnings per equivalent ADS: |
||||||||||||||||||||
|
Equity holders of the Company |
||||||||||||||||||||
|
- Continuing operations |
NT$ | 49.34 | NT$ | 42.56 | NT$ | 23.20 | US$ | 0.78 | ||||||||||||
|
- Discontinued operations |
(0.78 | ) | (2.84 | ) | 42.87 | 1.45 | ||||||||||||||
|
|
|
|
|
|
|
|
|
|||||||||||||
|
Equity holders of the Company |
48.56 | 39.72 | 66.07 | 2.23 | ||||||||||||||||
|
Predecessors’ interests |
(6.64 | ) | (7.12 | ) | — | — | ||||||||||||||
|
|
|
|
|
|
|
|
|
|||||||||||||
| NT$ | 41.92 | NT$ | 32.60 | NT$ | 66.07 | US$ | 2.23 | |||||||||||||
|
|
|
|
|
|
|
|
|
|||||||||||||
|
Diluted earnings per equivalent ADS: |
||||||||||||||||||||
|
Equity holders of the Company |
||||||||||||||||||||
|
- Continuing operations |
NT$ | 48.73 | NT$ | 42.21 | NT$ | 22.68 | US$ | 0.77 | ||||||||||||
|
- Discontinued operations |
(0.77 | ) | (2.82 | ) | 41.93 | 1.41 | ||||||||||||||
|
|
|
|
|
|
|
|
|
|||||||||||||
|
Equity holders of the Company |
47.96 | 39.39 | 64.61 | 2.18 | ||||||||||||||||
|
Predecessors’ interests |
(6.56 | ) | (7.06 | ) | — | — | ||||||||||||||
|
|
|
|
|
|
|
|
|
|||||||||||||
| NT$ | 41.40 | NT$ | 32.33 | NT$ | 64.61 | US$ | 2.18 | |||||||||||||
|
|
|
|
|
|
|
|
|
|||||||||||||
Details of dividend to equity holders of the Company for the years are set out in Note 11 to the consolidated financial statements.
The accompanying notes are an integral part of the consolidated financial statements.
F-5
Table of Contents
ChipMOS TECHNOLOGIES INC. AND SUBSIDIARIES
December 31, 2016 and 2017
| Note |
December 31,
2016 |
December 31,
2017 |
December 31,
2017 |
|||||||||||||
| NT$000 | NT$000 | US$000 | ||||||||||||||
|
Assets |
||||||||||||||||
|
Non-current assets |
||||||||||||||||
|
Available-for-sale financial assets |
12 | 9,960 | 20,890 | 705 | ||||||||||||
|
Investment in associates |
13 | 369,329 | 3,433,332 | 115,834 | ||||||||||||
|
Property, plant and equipment, net |
14,32 | 13,497,218 | 15,265,311 | 515,024 | ||||||||||||
|
Deferred tax assets |
9 | 249,806 | 212,372 | 7,165 | ||||||||||||
|
Refundable deposits |
21,321 | 21,342 | 720 | |||||||||||||
|
Other financial assets – non-current |
32 | 70,677 | 70,241 | 2,370 | ||||||||||||
|
Other non-current assets |
181,692 | 35,474 | 1,197 | |||||||||||||
|
|
|
|
|
|
|
|||||||||||
| 14,400,003 | 19,058,962 | 643,015 | ||||||||||||||
|
|
|
|
|
|
|
|||||||||||
|
Current assets |
||||||||||||||||
|
Inventories |
15 | 1,877,982 | 1,929,239 | 65,089 | ||||||||||||
|
Accounts and notes receivable |
16 | 4,140,246 | 4,015,734 | 135,484 | ||||||||||||
|
Accounts receivable – related parties |
— | 11 | — | |||||||||||||
|
Other receivables |
16 | 57,411 | 56,716 | 1,914 | ||||||||||||
|
Other receivables – related parties |
— | 4,534 | 153 | |||||||||||||
|
Current tax assets |
— | 104,906 | 3,539 | |||||||||||||
|
Other financial assets – current |
1,600 | — | — | |||||||||||||
|
Prepayments |
142,281 | 54,126 | 1,826 | |||||||||||||
|
Cash and cash equivalents |
17 | 7,571,366 | 8,035,714 | 271,110 | ||||||||||||
|
|
|
|
|
|
|
|||||||||||
| 13,790,886 | 14,200,980 | 479,115 | ||||||||||||||
|
Non-current assets held for sale |
18 | 3,105,071 | — | — | ||||||||||||
|
|
|
|
|
|
|
|||||||||||
| 16,895,957 | 14,200,980 | 479,115 | ||||||||||||||
|
|
|
|
|
|
|
|||||||||||
|
Total assets |
31,295,960 | 33,259,942 | 1,122,130 | |||||||||||||
|
|
|
|
|
|
|
|||||||||||
F-6
Table of Contents
ChipMOS TECHNOLOGIES INC. AND SUBSIDIARIES
Consolidated Statements of Financial Position (Continued)
December 31, 2016 and 2017
| Note |
December 31,
2016 |
December 31,
2017 |
December 31,
2017 |
|||||||||||||
| NT$000 | NT$000 | US$000 | ||||||||||||||
|
Equity and liabilities |
||||||||||||||||
|
Capital and reserves |
||||||||||||||||
|
Issued capital |
19 | 8,869,663 | 8,862,971 | 299,021 | ||||||||||||
|
Capital surplus |
20 | 6,888,826 | 6,271,448 | 211,587 | ||||||||||||
|
Retained earnings |
20 | |||||||||||||||
|
Legal reserve |
1,137,837 | 1,166,517 | 39,356 | |||||||||||||
|
Unappropriated retained earnings |
260,989 | 2,815,966 | 95,006 | |||||||||||||
|
Other reserve |
||||||||||||||||
|
Foreign currency translation reserve |
10,600 | 65,593 | 2,213 | |||||||||||||
|
Unrealized gain on valuation of available-for-sale financial assets |
— | 678 | 23 | |||||||||||||
|
Amounts recognized in other comprehensive income and accumulated in equity relating to non-current assets held for sale |
287,645 | — | — | |||||||||||||
|
Unearned employee awards |
(200,204 | ) | (54,570 | ) | (1,841 | ) | ||||||||||
|
Treasury stock |
21 | (1,007,654 | ) | (1,007,654 | ) | (33,997 | ) | |||||||||
|
|
|
|
|
|
|
|||||||||||
|
Total equity |
16,247,702 | 18,120,949 | 611,368 | |||||||||||||
|
|
|
|
|
|
|
|||||||||||
|
Non-current liabilities |
||||||||||||||||
|
Bank loans – non-current |
22,30,32 | 9,687,720 | 7,498,853 | 252,998 | ||||||||||||
|
Long-term deferred revenue |
31 | — | 24,898 | 840 | ||||||||||||
|
Lease payable – non-current |
29,311 | 18,057 | 609 | |||||||||||||
|
Deferred tax liabilities |
9 | 92,543 | 174,293 | 5,880 | ||||||||||||
|
Net defined benefit liability, non-current |
23 | 546,968 | 478,526 | 16,145 | ||||||||||||
|
Guarantee deposits |
30 | 1,404 | 1,371 | 46 | ||||||||||||
|
|
|
|
|
|
|
|||||||||||
| 10,357,946 | 8,195,998 | 276,518 | ||||||||||||||
|
|
|
|
|
|
|
|||||||||||
|
Current liabilities |
||||||||||||||||
|
Accounts payable |
825,062 | 687,960 | 23,210 | |||||||||||||
|
Accounts payable – related parties |
— | 226 | 8 | |||||||||||||
|
Payables to contractors and equipment suppliers |
550,346 | 713,313 | 24,066 | |||||||||||||
|
Other payables |
24 | 1,412,054 | 1,980,182 | 66,808 | ||||||||||||
|
Other payables – related parties |
— | 36 | 1 | |||||||||||||
|
Current tax liabilities |
115,916 | 273,177 | 9,216 | |||||||||||||
|
Provisions – current |
25 | 80,719 | 127,311 | 4,295 | ||||||||||||
|
Receipts in advance |
1,324 | 5,209 | 176 | |||||||||||||
|
Other current liabilities |
43,676 | 31,275 | 1,055 | |||||||||||||
|
Lease payable – current |
11,291 | 11,785 | 398 | |||||||||||||
|
Bank loans – current portion |
22,30,32 | 1,062,285 | 2,143,168 | 72,307 | ||||||||||||
|
Short-term bank loans |
26,30 | — | 969,353 | 32,704 | ||||||||||||
|
|
|
|
|
|
|
|||||||||||
| 4,102,673 | 6,942,995 | 234,244 | ||||||||||||||
|
Liabilities directly related to non-current assets held for sale |
18 | 587,639 | — | — | ||||||||||||
|
|
|
|
|
|
|
|||||||||||
| 4,690,312 | 6,942,995 | 234,244 | ||||||||||||||
|
|
|
|
|
|
|
|||||||||||
|
Total liabilities |
15,048,258 | 15,138,993 | 510,762 | |||||||||||||
|
|
|
|
|
|
|
|||||||||||
|
Total equity and liabilities |
31,295,960 | 33,259,942 | 1,122,130 | |||||||||||||
|
|
|
|
|
|
|
|||||||||||
The accompanying notes are an integral part of the consolidated financial statements.
F-7
Table of Contents
ChipMOS TECHNOLOGIES INC. AND SUBSIDIARIES
Consolidated Statements of Changes in Equity
For the years ended December 31, 2015, 2016 and 2017
| Attributable to equity holders of the Company | ||||||||||||||||||||||||||||||||||||||||||||
| Retained earnings (Note 20) | Other reserve | |||||||||||||||||||||||||||||||||||||||||||
|
Issued
capital (Note 19) |
Capital
surplus (Note 20) |
Legal
reserve |
Unappropriated
retained earnings |
Foreign
currency translation reserve |
Unearned
employee awards |
Treasury
stock (Note 21) |
Total |
Equity
attributable to predecessors’ interests |
Non-controlling
interests |
Total
equity |
||||||||||||||||||||||||||||||||||
| NT$000 | NT$000 | NT$000 | NT$000 | NT$000 | NT$000 | NT$000 | NT$000 | NT$000 | NT$000 | NT$000 | ||||||||||||||||||||||||||||||||||
|
January 1, 2015 (Adjusted) |
8,646,193 | 2,272,838 | 582,927 | 6,545,839 | 36,074 | — | — | 18,083,871 | 2,490,693 | 2,621,685 | 23,196,249 | |||||||||||||||||||||||||||||||||
|
Appropriations of prior year’s earnings: |
||||||||||||||||||||||||||||||||||||||||||||
|
Legal reserve (Note 20) |
— | — | 331,863 | (331,863 | ) | — | — | — | — | — | — | — | ||||||||||||||||||||||||||||||||
|
Cash dividends - the Company (Notes 11 and 20) |
— | — | — | (1,999,225 | ) | — | — | — | (1,999,225 | ) | 1,159,018 | — | (840,207 | ) | ||||||||||||||||||||||||||||||
|
Cash dividends - predecessors’ interests |
— | — | — | — | — | — | — | — | (125,293 | ) | — | (125,293 | ) | |||||||||||||||||||||||||||||||
|
Share-based payments |
— | 51,233 | — | — | — | — | — | 51,233 | 123,168 | 564 | 174,965 | |||||||||||||||||||||||||||||||||
|
Restricted shares |
156,550 | 397,296 | — | — | — | (447,323 | ) | — | 106,523 | — | — | 106,523 | ||||||||||||||||||||||||||||||||
|
Repurchase of shares (Note 21) |
— | — | — | — | — | — | (633,737 | ) | (633,737 | ) | (1,228,625 | ) | — | (1,862,362 | ) | |||||||||||||||||||||||||||||
|
Cancellation of shares (Note 21) |
(200,000 | ) | (56,823 | ) | — | (376,914 | ) | — | — | 633,737 | — | — | — | — | ||||||||||||||||||||||||||||||
|
Acquisition of the interest of a subsidiary (Note 28) |
359,323 | 1,091,305 | — | (275,500 | ) | 17,964 | — | — | 1,193,092 | — | (2,637,316 | ) | (1,444,224 | ) | ||||||||||||||||||||||||||||||
|
Profit (loss) for the year |
— | — | — | 2,130,324 | — | — | — | 2,130,324 | (291,429 | ) | 37,073 | 1,875,968 | ||||||||||||||||||||||||||||||||
|
Other comprehensive income (loss) for the year |
— | — | — | (34,824 | ) | 9,630 | — | — | (25,194 | ) | — | (22,006 | ) | (47,200 | ) | |||||||||||||||||||||||||||||
|
|
|
|
|
|
|
|
|
|
|
|
|
|
|
|
|
|
|
|
|
|
|
|||||||||||||||||||||||
|
December 31, 2015 (Adjusted) |
8,962,066 | 3,755,849 | 914,790 | 5,657,837 | 63,668 | (447,323 | ) | — | 18,906,887 | 2,127,532 | — | 21,034,419 | ||||||||||||||||||||||||||||||||
|
|
|
|
|
|
|
|
|
|
|
|
|
|
|
|
|
|
|
|
|
|
|
|||||||||||||||||||||||
F-8
Table of Contents
ChipMOS TECHNOLOGIES INC. AND SUBSIDIARIES
Consolidated Statements of Changes in Equity (Continued)
For the years ended December 31, 2015, 2016 and 2017
| Attributable to equity holders of the Company | ||||||||||||||||||||||||||||||||||||||||||||
| Retained earnings (Note 20) | Other reserve | |||||||||||||||||||||||||||||||||||||||||||
|
Issued
capital (Note 19) |
Capital
surplus (Note 20) |
Legal
reserve |
Unappropriated
retained earnings |
Foreign
currency translation reserve |
Amounts
recognized in other comprehensive income and accumulated in equity relating to non-current assets held for sale |
Unearned
employee awards |
Treasury
stock (Note 21) |
Total |
Equity
attributable to predecessors’ interests |
Total
equity |
||||||||||||||||||||||||||||||||||
| NT$000 | NT$000 | NT$000 | NT$000 | NT$000 | NT$000 | NT$000 | NT$000 | NT$000 | NT$000 | NT$000 | ||||||||||||||||||||||||||||||||||
|
January 1, 2016 (Adjusted) |
8,962,066 | 3,755,849 | 914,790 | 5,657,837 | 63,668 | — | (447,323 | ) | — | 18,906,887 | 2,127,532 | 21,034,419 | ||||||||||||||||||||||||||||||||
|
Appropriations of prior year’s earnings: |
||||||||||||||||||||||||||||||||||||||||||||
|
Legal reserve (Note 20) |
— | — | 223,047 | (223,047 | ) | — | — | — | — | — | — | — | ||||||||||||||||||||||||||||||||
|
Cash dividends - the Company (Notes 11 and 20) |
— | — | — | (1,792,553 | ) | — | — | — | — | (1,792,553 | ) | — | (1,792,553 | ) | ||||||||||||||||||||||||||||||
|
Share-based payments |
— | 56,689 | — | — | — | — | — | — | 56,689 | (128,602 | ) | (71,913 | ) | |||||||||||||||||||||||||||||||
|
Restricted shares |
4,347 | 10,755 | — | 14 | — | — | 247,119 | — | 262,235 | — | 262,235 | |||||||||||||||||||||||||||||||||
|
Repurchase of shares (Note 21) |
— | — | — | — | — | — | — | (1,007,654 | ) | (1,007,654 | ) | — | (1,007,654 | ) | ||||||||||||||||||||||||||||||
|
Profit (loss) for the year |
— | — | — | 1,707,222 | — | — | — | — | 1,707,222 | (306,012 | ) | 1,401,210 | ||||||||||||||||||||||||||||||||
|
Other comprehensive loss for the year |
— | — | — | (36,141 | ) | (200,280 | ) | — | — | — | (236,421 | ) | — | (236,421 | ) | |||||||||||||||||||||||||||||
|
Reclassification to equity related to non-current assets held for sale |
— | — | — | — | (287,645 | ) | 287,645 | — | — | — | — | — | ||||||||||||||||||||||||||||||||
|
Effect of capital reorganization (Note 29) |
(96,750 | ) | 3,065,533 | — | (5,052,343 | ) | 434,857 | — | — | — | (1,648,703 | ) | (1,692,918 | ) | (3,341,621 | ) | ||||||||||||||||||||||||||||
|
|
|
|
|
|
|
|
|
|
|
|
|
|
|
|
|
|
|
|
|
|
|
|||||||||||||||||||||||
|
December 31, 2016 |
8,869,663 | 6,888,826 | 1,137,837 | 260,989 | 10,600 | 287,645 | (200,204 | ) | (1,007,654 | ) | 16,247,702 | — | 16,247,702 | |||||||||||||||||||||||||||||||
|
|
|
|
|
|
|
|
|
|
|
|
|
|
|
|
|
|
|
|
|
|
|
|||||||||||||||||||||||
F-9
Table of Contents
ChipMOS TECHNOLOGIES INC. AND SUBSIDIARIES
Consolidated Statements of Changes in Equity (Continued)
For the years ended December 31, 2015, 2016 and 2017
| Attributable to equity holders of the Company | ||||||||||||||||||||||||||||||||||||||||
| Retained earnings (Note 20) | Other reserve | |||||||||||||||||||||||||||||||||||||||
|
Issued
capital (Note 19) |
Capital
surplus (Note 20) |
Legal
reserve |
Unappropriated
retained earnings |
Foreign
currency translation reserve |
Amounts
recognized in other comprehensive income (loss) and accumulated in equity relating to non-current assets held for sale |
Unrealized gain
on valuation of available-for-sale financial assets |
Unearned
employee awards |
Treasury stock
(Note 21) |
Total
equity |
|||||||||||||||||||||||||||||||
| NT$000 | NT$000 | NT$000 | NT$000 | NT$000 | NT$000 | NT$000 | NT$000 | NT$000 | NT$000 | |||||||||||||||||||||||||||||||
|
January 1, 2017 |
8,869,663 | 6,888,826 | 1,137,837 | 260,989 | 10,600 | 287,645 | — | (200,204 | ) | (1,007,654 | ) | 16,247,702 | ||||||||||||||||||||||||||||
|
Appropriations of prior year’s earnings: |
||||||||||||||||||||||||||||||||||||||||
|
Legal reserve (Note 20) |
— | — | 28,680 | (28,680 | ) | — | — | — | — | — | — | |||||||||||||||||||||||||||||
|
Cash dividends - the Company (Notes 11 and 20) |
— | — | — | (257,026 | ) | — | — | — | — | — | (257,026 | ) | ||||||||||||||||||||||||||||
|
Cash distribution from capital surplus (Notes 11 and 20) |
— | (599,728 | ) | — | — | — | — | — | — | — | (599,728 | ) | ||||||||||||||||||||||||||||
|
Restricted shares |
(6,692 | ) | (17,650 | ) | — | 1,729 | — | — | — | 145,634 | — | 123,021 | ||||||||||||||||||||||||||||
|
Profit for the year |
— | — | — | 2,796,882 | — | — | — | — | — | 2,796,882 | ||||||||||||||||||||||||||||||
|
Other comprehensive income (loss) for the year |
— | — | — | 42,072 | (232,652 | ) | — | 678 | — | — | (189,902 | ) | ||||||||||||||||||||||||||||
|
Effect of disposal of subsidiary |
— | — | — | — | 287,645 | (287,645 | ) | — | — | — | — | |||||||||||||||||||||||||||||
|
|
|
|
|
|
|
|
|
|
|
|
|
|
|
|
|
|
|
|
|
|||||||||||||||||||||
|
December 31, 2017 |
8,862,971 | 6,271,448 | 1,166,517 | 2,815,966 | 65,593 | — | 678 | (54,570 | ) | (1,007,654 | ) | 18,120,949 | ||||||||||||||||||||||||||||
|
|
|
|
|
|
|
|
|
|
|
|
|
|
|
|
|
|
|
|
|
|||||||||||||||||||||
The accompanying notes are an integral part of the consolidated financial statements.
F-10
Table of Contents
ChipMOS TECHNOLOGIES INC. AND SUBSIDIARIES
For the years ended December 31, 2015, 2016 and 2017
| Note |
(Adjusted)
2015 |
2016 | 2017 | 2017 | ||||||||||||||||
| NT$000 | NT$000 | NT$000 | US$000 | |||||||||||||||||
|
Cash flows from operating activities |
||||||||||||||||||||
|
Profit before income tax – continuing operations |
2,846,056 | 1,700,435 | 1,532,416 | 51,701 | ||||||||||||||||
|
Profit (loss) before income tax – discontinued operations |
18 | (34,233 | ) | (122,105 | ) | 1,814,953 | 61,233 | |||||||||||||
|
|
|
|
|
|
|
|
|
|||||||||||||
|
Profit before income tax including discontinued operations |
2,811,823 | 1,578,330 | 3,347,369 | 112,934 | ||||||||||||||||
|
Adjustments to reconcile profit before income tax to net cash flows : |
||||||||||||||||||||
|
Depreciation of property, plant and equipment |
14 | 3,018,977 | 3,228,441 | 2,899,278 | 97,816 | |||||||||||||||
|
Amortization of assets |
2,946 | 2,838 | — | — | ||||||||||||||||
|
Allowance (reversal) for impairment of accounts and notes receivable |
16 | — | 87 | (87 | ) | (3 | ) | |||||||||||||
|
Interest expense |
127,035 | 145,151 | 192,839 | 6,506 | ||||||||||||||||
|
Interest income |
(68,283 | ) | (42,307 | ) | (53,587 | ) | (1,808 | ) | ||||||||||||
|
Impairment of available-for-sale financial assets |
8 | 8,584 | — | — | — | |||||||||||||||
|
Impairment of property, plant and equipment |
14 | 1,478 | 8,198 | 956 | 32 | |||||||||||||||
|
Gain on disposal of property, plant and equipment, net |
(1,640 | ) | (6,839 | ) | (132,774 | ) | (4,480 | ) | ||||||||||||
|
Gain on disposal of a subsidiary |
18 | — | — | (1,843,234 | ) | (62,187 | ) | |||||||||||||
|
Insurance compensation income |
6 | — | — | (486,858 | ) | (16,426 | ) | |||||||||||||
|
Share of (profit) loss of associates |
4,8 | (31,269 | ) | (28,924 | ) | 179,491 | 6,056 | |||||||||||||
|
Gain on disposal of long-term investment in associates |
8 | — | — | (16,929 | ) | (571 | ) | |||||||||||||
|
Donations |
— | 127 | — | — | ||||||||||||||||
|
Share-based payments |
5 | 207,242 | 356,463 | 123,021 | 4,151 | |||||||||||||||
|
Deferred income |
(2,496 | ) | (2,403 | ) | (11,995 | ) | (405 | ) | ||||||||||||
|
Changes in operating assets and liabilities: |
||||||||||||||||||||
|
Accounts and notes receivable |
986,205 | (480,348 | ) | 127,800 | 4,312 | |||||||||||||||
|
Accounts receivable – related parties |
— | — | (240 | ) | (8 | ) | ||||||||||||||
|
Other receivables |
(42,140 | ) | (124,226 | ) | (15,644 | ) | (528 | ) | ||||||||||||
|
Other receivables – related parties |
— | — | 35,855 | 1,210 | ||||||||||||||||
|
Inventories |
36,974 | (347,133 | ) | (63,910 | ) | (2,156 | ) | |||||||||||||
|
Prepayments |
78,676 | 12,291 | 126,708 | 4,275 | ||||||||||||||||
|
Other financial assets |
191,974 | 17,243 | 1,600 | 54 | ||||||||||||||||
|
Other non-current assets |
(42,061 | ) | 6,914 | 6,914 | 233 | |||||||||||||||
|
Accounts payable |
(366,445 | ) | 215,555 | (147,859 | ) | (4,988 | ) | |||||||||||||
|
Accounts payable – related parties |
— | — | 263 | 9 | ||||||||||||||||
|
Other payables |
46,054 | (249,607 | ) | 438,682 | 14,800 | |||||||||||||||
|
Other payables – related parties |
— | — | (43,144 | ) | (1,456 | ) | ||||||||||||||
|
Provisions – current |
(21,683 | ) | (16,184 | ) | 46,592 | 1,572 | ||||||||||||||
|
Receipts in advance |
(47,230 | ) | 2,150 | (5,913 | ) | (199 | ) | |||||||||||||
|
Other current liabilities |
(12,851 | ) | 22,878 | (15,469 | ) | (522 | ) | |||||||||||||
|
Net defined benefit liability, non-current |
(14,044 | ) | (15,886 | ) | (17,604 | ) | (594 | ) | ||||||||||||
|
|
|
|
|
|
|
|
|
|||||||||||||
|
Cash generated from operations |
6,867,826 | 4,282,809 | 4,672,121 | 157,629 | ||||||||||||||||
|
Interest received |
67,960 | 44,413 | 47,815 | 1,613 | ||||||||||||||||
|
Dividend received |
13 | — | 5,730 | 14,325 | 483 | |||||||||||||||
|
Interest paid |
(127,568 | ) | (145,668 | ) | (189,381 | ) | (6,389 | ) | ||||||||||||
|
Income tax paid |
(1,412,427 | ) | (499,293 | ) | (387,590 | ) | (13,077 | ) | ||||||||||||
|
|
|
|
|
|
|
|
|
|||||||||||||
|
Net cash generated from operating activities |
5,395,791 | 3,687,991 | 4,157,290 | 140,259 | ||||||||||||||||
|
|
|
|
|
|
|
|
|
|||||||||||||
F-11
Table of Contents
ChipMOS TECHNOLOGIES INC. AND SUBSIDIARIES
Consolidated Statements of Cash Flows (Continued)
For the years ended December 31, 2015, 2016 and 2017
| Note |
(Adjusted)
2015 |
2016 | 2017 | 2017 | ||||||||||||||||
| NT$000 | NT$000 | NT$000 | US$000 | |||||||||||||||||
|
Cash flows from investing activities |
||||||||||||||||||||
|
Proceeds from disposal of property, plant and equipment |
48,275 | 59,134 | 306,634 | 10,345 | ||||||||||||||||
|
Proceeds from insurance compensation |
— | — | 486,858 | 16,426 | ||||||||||||||||
|
Net cash flow from disposal of a subsidiary |
30 | — | — | 1,781,213 | 60,095 | |||||||||||||||
|
Acquisition of property, plant and equipment |
30 | (4,428,057 | ) | (4,471,465 | ) | (4,682,705 | ) | (157,986 | ) | |||||||||||
|
Acquisition of available-for-sale financial assets |
— | — | (10,940 | ) | (369 | ) | ||||||||||||||
|
Acquisition of investment in associate |
13 | (116,000 | ) | — | (1,373,486 | ) | (46,339 | ) | ||||||||||||
|
Decrease (increase) in refundable deposits |
(589 | ) | 407 | (11 | ) | (1 | ) | |||||||||||||
|
Increase in other non-current assets |
— | (139,304 | ) | — | — | |||||||||||||||
|
Increase in other financial assets – current |
(7,822 | ) | (5,466 | ) | (964 | ) | (32 | ) | ||||||||||||
|
|
|
|
|
|
|
|
|
|||||||||||||
|
Net cash used in investing activities |
(4,504,193 | ) | (4,556,694 | ) | (3,493,401 | ) | (117,861 | ) | ||||||||||||
|
|
|
|
|
|
|
|
|
|||||||||||||
|
Cash flows from financing activities |
||||||||||||||||||||
|
Prepaid cost of issuing new shares |
(42,774 | ) | — | — | — | |||||||||||||||
|
Proceeds from short-term bank loans |
4,725,030 | 3,820,594 | 5,560,354 | 187,596 | ||||||||||||||||
|
Payments on short-term bank loans |
(5,344,425 | ) | (4,969,469 | ) | (4,278,518 | ) | (144,349 | ) | ||||||||||||
|
Proceeds from long-term bank loans |
2,000,000 | 10,560,000 | 148,829 | 5,021 | ||||||||||||||||
|
Payments on long-term bank loans |
(1,508,153 | ) | (6,200,567 | ) | (1,124,699 | ) | (37,945 | ) | ||||||||||||
|
Increase (decrease) in guarantee deposits |
30 | 405 | (44 | ) | (33 | ) | (1 | ) | ||||||||||||
|
Payments on repurchase of shares |
30 | (1,441,359 | ) | (1,007,654 | ) | — | — | |||||||||||||
|
Acquisition of the interest of a subsidiary |
28 | (1,444,224 | ) | — | — | — | ||||||||||||||
|
Cash paid in respect of share-based payments |
(7,873 | ) | (292,623 | ) | — | — | ||||||||||||||
|
Cash dividend – the Company |
11,20 | (840,207 | ) | (1,792,553 | ) | (257,026 | ) | (8,672 | ) | |||||||||||
|
Cash distribution from capital surplus – the Company |
11 | — | — | (599,728 | ) | (20,234 | ) | |||||||||||||
|
Cash dividend – Predecessors’ interests |
(125,293 | ) | — | — | — | |||||||||||||||
|
Payments on capital reorganization |
29,30 | — | (3,341,621 | ) | — | — | ||||||||||||||
|
|
|
|
|
|
|
|
|
|||||||||||||
|
Net cash used in financing activities |
(4,028,873 | ) | (3,223,937 | ) | (550,821 | ) | (18,584 | ) | ||||||||||||
|
|
|
|
|
|
|
|
|
|||||||||||||
|
Net increase (decrease) in cash and cash equivalents |
(3,137,275 | ) | (4,092,640 | ) | 113,068 | 3,814 | ||||||||||||||
|
Effect of foreign exchange rate changes |
(528 | ) | (73,447 | ) | (38,617 | ) | (1,303 | ) | ||||||||||||
|
Cash and cash equivalents at beginning of year |
17 | 15,265,153 | 12,127,350 | 7,961,263 | 268,599 | |||||||||||||||
|
|
|
|
|
|
|
|
|
|||||||||||||
|
Cash and cash equivalents at end of year |
17 | 12,127,350 | 7,961,263 | 8,035,714 | 271,110 | |||||||||||||||
|
|
|
|
|
|
|
|
|
|||||||||||||
The accompanying notes are an integral part of the consolidated financial statements.
F-12
Table of Contents
ChipMOS TECHNOLOGIES INC. AND SUBSIDIARIES
Notes to the Consolidated Financial Statements
December 31, 2015, 2016 and 2017
| 1. | Corporate and group information |
ChipMOS TECHNOLOGIES INC. (the “Company” or “ChipMOS Taiwan”) was incorporated in the Republic of China (“ROC”) on July 28, 1997. The Company and its subsidiaries (collectively referred herein as the “Group”) are primarily engaged in the research, development, manufacturing and sale of high-integration and high-precision integrated circuits and related assembly and testing services. On April 11, 2014, the Company’s shares were listed on the Taiwan Stock Exchange (“TWSE”). On November 1, 2016, the Company’s American Depositary Shares (“ADSs”) was listed on the NASDAQ Global Select Market and traded under the ticker symbol “IMOS”.
On June 17, 2015, the former 47.54%-owned subsidiary, ThaiLin Semiconductor Corp. (“ThaiLin”) was merged with and into ChipMOS Taiwan, with ChipMOS Taiwan being the surviving company after the merger. The transaction was treated as an equity transaction. Please see note 28 for detailed information.
As of October 31, 2016, the former parent company, ChipMOS TECHNOLOGIES (Bermuda) LTD. (“ChipMOS Bermuda”) owned 60.25% of ChipMOS Taiwan’s outstanding shares, was merged with and into ChipMOS Taiwan, with the latter being the surviving company after the merger, pursuant to the agreement and plan of merger, dated January 21, 2016, by and between ChipMOS Bermuda and ChipMOS Taiwan (the “Merger”). Detailed information about the capital reorganization is provided in Note 2 ee).
As of November 30, 2016, the Board of Directors of the Company approved an agreement to form a joint-venture between the Company and Tsinghua Unigroup Ltd. (“Tsinghua Unigroup”). Under the joint-venture agreement, ChipMOS TECHNOLOGIES (BVI) LTD. (“ChipMOS BVI”), a wholly-owned subsidiary of ChipMOS Taiwan, will sell 54.98% of the equity interests of its wholly-owned subsidiary, ChipMOS TECHNOLOGIES (Shanghai) LTD. (“ChipMOS Shanghai”), to a group led by Tsinghua Unigroup (“strategic investors”). After the consummation of such equity interest transfer, ChipMOS BVI will own 45.02% of the equity interests of ChipMOS Shanghai. As of December 31, 2016, the assets, liabilities and equity related to ChipMOS Shanghai have been reclassified as held for sale and presented as discontinued operations for satisfying the definition of discontinued operations. The equity transfer was completed in March 2017. Please see Note 18 for detailed information.
F-13
Table of Contents
ChipMOS TECHNOLOGIES INC. AND SUBSIDIARIES
Notes to the Consolidated Financial Statements (Continued)
December 31, 2015, 2016 and 2017
| 2. | Basis of preparation of financial statements and principal accounting policies |
| a) | Basis of preparation |
These consolidated financial statements have been prepared in accordance with International Financial Reporting Standards (“IFRSs”), which collective term includes all applicable individual IFRSs, International Accounting Standards (“IASs”) issued by the International Accounting Standards Board (“IASB”) and Interpretations issued by the International Financial Reporting Interpretations Committee (“IFRIC”) of the IASB.
The consolidated financial statements have been prepared on a historical cost basis, except for the defined benefit pension plans – plan assets measured at fair value.
These consolidated financial statements are presented in New Taiwan dollars (“NT$”), which is the Company’s functional currency.
| b) | New and amended standards adopted by the group |
Amendments to IAS 7 “Disclosure Initiative”
This amendment requires that an entity shall provide more disclosures related to changes in liabilities arising from financing activities, including both changes arising from cash flows and non-cash changes. Please refer to Note 30.
| c) | New and revised International Financial Reporting Standards not yet adopted |
Amendments to IFRSs which have been published but are not mandatory for the financial year ending December 31, 2017 are not expected to have a material impact on the Group. Major Amendment to IFRSs that are not yet effective are listed below:
|
New Standards, Interpretations and Amendments |
Effective date by
IASB |
|||
|
IFRS 9, “Financial Instruments” |
January 1, 2018 | |||
|
IFRS 15, “Revenue from Contracts with Customers” |
January 1, 2018 | |||
|
IFRS 16, “Leases” |
January 1, 2019 | |||
When adopting the new standards effective from 2018, the Group will apply the new rules under IFRS 9 “Financial Instruments” (“IFRS 9”) and adopt IFRS 15 “Revenue from Contracts with Customers” (“IFRS 15”) using the modified retrospective approach from January 1, 2018. The significant effects of applying the new standards as of January 1, 2018 are summarized below:
| (a) | Financial assets at fair value through other comprehensive income |
In accordance with IFRS 9, an entity at its sole option may irrevocably designate an investment in an equity instrument not held for dealing or trading purpose at initial recognition as financial assets at fair value through other comprehensive income. The Group expects to reclassify available-for-sale financial assets, which were stated at cost less any impairment losses, in the amount of NT$9,950 thousand (US$336 thousand), to financial assets at fair value through other comprehensive income. Accordingly, as of January 1, 2018, financial assets at fair value through other comprehensive income, retained earnings and other reserve will be increased by NT$89,335 thousand (US$3,014 thousand), NT$28,584 thousand (US$964 thousand) and NT$50,801 thousand (US$1,714 thousand), respectively.
F-14
Table of Contents
ChipMOS TECHNOLOGIES INC. AND SUBSIDIARIES
Notes to the Consolidated Financial Statements (Continued)
December 31, 2015, 2016 and 2017
| 2. | Basis of preparation of financial statements and principal accounting policies (continued) |
| c) | New and revised International Financial Reporting Standards not yet adopted (continued) |
| (b) | Financial assets at fair value through profit or loss |
In accordance with IFRS 9, the Group expects to reclassify available-for-sale financial assets, which were stated at cost less any impairment losses, in the amounts of NT$10,940 thousand (US$369 thousand), to financial assets at fair value through profit or loss. Accordingly, as of January 1, 2018, financial assets at fair value through profit or loss and retained earnings will be increased by NT$11,433 thousand (US$386 thousand) and NT$493 thousand (US$17 thousand), respectively.
| (c) | Provision for impairment |
In line with the regulations under IFRS 9 on provision for impairment based on the expected credit loss model, as of January 1, 2018, contract assets will be decreased by NT$115 thousand (US$4 thousand), accounts receivable decreased by NT$1,819 thousand (US$61 thousand), other receivables decreased by NT$5 thousand (US$169), other receivables – related parties decreased by NT$2 thousand (US$67), and retained earnings decreased by NT$1,941 thousand (US$65 thousand).
| (d) | Revenue recognition of customized products |
The Group provides high-integration and high-precision integrated circuits and related assembly and testing services based on the specifications as required by the customers. The revenue is recognized when the significant risks and rewards are transferred under existing accounting policies (refer to Note 2 u)), and the timing of recognition usually occurred upon service completion. Considering that the Group provides assembly and testing service to create or enhance a highly customized product and the customer controls the asset as it is created or enhanced, the revenue will be recognized over time based on the percentage of completion under IFRS 15. As of January 1, 2018, using the modified retrospective approach, the Group also elects the use of practical expedient to only account for incomplete contracts at the date of initial application. Hence all the work in process and finished goods accounted in inventories will be transferred to retained earnings and contract assets will be recognized. As a result, retained earnings will be increased by NT$46,607 thousand (US$1,572 thousand), inventory decreased by NT$208,505 thousand (US$7,035 thousand) and contract assets increased by NT$255,112 thousand (US$8,607 thousand).
| (e) | Presentation of contract assets and contract liabilities |
In line with IFRS 15 requirements, the Group’s liabilities in relation to sales discounts to customers are recognized as contract liabilities, but were previously presented as current provisions on the consolidated statement of financial position. As of January 1, 2018, the balance is NT$70,156 thousand (US$2,367 thousand).
| (f) | Recognition of deferred tax |
When initially adopting IFRS 9 and IFRS 15, the Group will have to recognize adjustments on the consolidated statement of financial position which would result to temporary differences. Accordingly, as of January 1, 2018, deferred tax assets will be decreased by NT$736 thousand (US$25 thousand) and deferred tax liabilities increased by NT$19,651 thousand (US$663 thousand).
Other Amendments to IFRSs not listed above are not expected to have a material impact on the entity in the current or future reporting periods and on foreseeable future transactions.
F-15
Table of Contents
ChipMOS TECHNOLOGIES INC. AND SUBSIDIARIES
Notes to the Consolidated Financial Statements (Continued)
December 31, 2015, 2016 and 2017
| 2. | Basis of preparation of financial statements and principal accounting policies (continued) |
| d) | Basis of consolidation |
The consolidated financial statements include the accounts of ChipMOS Taiwan and all entities controlled by ChipMOS Taiwan. The financial statements of subsidiaries are prepared for the same reporting period as the Company, using consistent accounting policies. The results of subsidiaries are consolidated from the date on which the Group obtains control, and continue to be consolidated until the date that such control ceases.
Profit or loss and each component of other comprehensive income are attributed to the owners of the parent of the Group and to the non-controlling interests, even if this results in the non-controlling interests having a deficit balance. All intra-group transactions, balances, income and expenses are eliminated in full on consolidation.
The Group reassesses whether or not it controls an investee if facts and circumstances indicate that there are changes to one or more of the three elements of control described in the accounting policy for subsidiaries below.
Changes in the Group’s ownership interests in subsidiaries that do not result in the Group losing control over the subsidiaries are accounted for as equity transactions. The carrying amounts of the Group’s interests and the non-controlling interests are adjusted to reflect the changes in their relative interests in the subsidiaries. Any difference between the amount by which the non-controlling interests are adjusted and the fair value of the consideration paid or received is recognized directly in equity and attributed to owners of the Company.
When the Group loses control of a subsidiary, the profit or loss on disposal is calculated as the difference between (i) the aggregate of the fair value of the consideration received and the fair value of any investment retained and (ii) the previous carrying amount of the assets (including goodwill), and liabilities of the subsidiary and any non-controlling interests. The Group’s share of components previously recognized in other comprehensive income is reclassified to consolidated statements of comprehensive income or retained profits, as appropriate, on the same basis as would be required if the Group had directly disposed of the related assets or liabilities.
Subsidiaries included in the consolidated financial statements:
|
Percentage of
Ownership (%) |
||||||||||||||||||
| December 31, | ||||||||||||||||||
|
Name of investor |
Name of investee |
Main businesses |
Location |
2016 | 2017 | Note | ||||||||||||
|
The Company |
ChipMOS U.S.A., Inc. (“ChipMOS USA”) | Research, development and marketing of semiconductors, circuits, and electronic related products | San Jose, USA | 100 | 100 | |||||||||||||
|
The Company |
ChipMOS BVI | Holding company | British Virgin Islands | 100 | 100 | |||||||||||||
|
ChipMOS BVI |
ChipMOS Shanghai | Semiconductor assembling and testing services | People’s Republic of China (“PRC”) | 100 | — | * | ||||||||||||
| * | On November 30, 2016, the Company’s Board of Directors approved ChipMOS BVI’s disposal of 54.98% shareholding of its subsidiary, ChipMOS Shanghai. The transaction was completed in March 2017, thereafter, ChipMOS Shanghai was excluded from the consolidated financial statements and recorded as “Investment in associates”. Detailed information is provided in Note 13. |
F-16
Table of Contents
ChipMOS TECHNOLOGIES INC. AND SUBSIDIARIES
Notes to the Consolidated Financial Statements (Continued)
December 31, 2015, 2016 and 2017
| 2. | Basis of preparation of financial statements and principal accounting policies (continued) |
| e) | Significant judgments and estimates |
The preparation of consolidated financial statements requires management to make judgments, estimates and assumptions that affect the recorded amounts of assets, liabilities, revenue and expenses of the Group. The Group continually evaluates these estimates, including those related to share-based payments, impairment of receivables, impairment of non-financial assets, depreciation of property, plant and equipment, defined benefit plans, deferred tax assets and deferred tax liabilities. The Group bases its estimates on historical experience and other assumptions, which it believes to be reasonable under the circumstances. Actual results may differ from these estimates under different assumptions and conditions.
The estimates and underlying assumptions are reviewed on an ongoing basis. Revisions to accounting estimates are recognized in the period in which the estimate is revised if the revision affects only that periods, or in the period of the revision and future periods if the revision affects both current and future periods.
Management has considered the development, selection and disclosure of the Group’s critical accounting policies and estimates.
Judgments
In the process of applying the Group’s accounting policies, management has made the following judgments which have the most significant effect on the amounts recognized in the consolidated financial statements:
Provisions – deficiency compensation
The Group is primarily providing high-integration and high-precision integrated circuit of the packaging and testing services. In cases of deficiencies in the assembly and testing services provided, the Group has to clarify the reason for deficiencies and attribution of responsibility. The Group follows the guidance of IAS 37 “Provisions, Contingent Liabilities and Contingent Assets” to determine provisions for deficiency compensation. Since the timing and amount of these provisions are based on assumptions and estimates it requires management to make critical judgments.
Estimates and assumptions
Revenue recognition
The Group estimates sales discounts and returns based on historical results and other known factors. Provisions for such liabilities are recorded as a deduction item to sales revenues when the sales are recognized. The Group reassesses the reasonableness of estimates of discounts and returns periodically.
F-17
Table of Contents
ChipMOS TECHNOLOGIES INC. AND SUBSIDIARIES
Notes to the Consolidated Financial Statements (Continued)
December 31, 2015, 2016 and 2017
| 2. | Basis of preparation of financial statements and principal accounting policies (continued) |
| e) | Significant judgments and estimates (continued) |
Causes and effects of accounting change
By considering the Group’s experience on using similar property, plant and equipment in prior periods as well as by referring to the experience from peer industry, on November 10, 2016, the Board of Directors approved to change the estimated useful lives of certain properties from 11 years to 16 years and certain equipment from 2~6 years to 2~8 years effectively from November 1, 2016, in order to better reflect economic benefits from usage of those properties and equipment. The impact on depreciation expenses of current and future periods were expected as follows:
| 2016 | 2017 | 2018 | 2019 | |||||||||||||
| NT$000 | NT$000 | NT$000 | NT$000 | |||||||||||||
|
Decrease in depreciation expenses |
(119,737 | ) | (605,259 | ) | (389,972 | ) | (164,824 | ) | ||||||||
|
|
|
|
|
|
|
|
|
|||||||||
| f) | Property, plant and equipment and depreciation |
Property, plant and equipment are stated at cost, less provision for depreciation and impairment losses, if any.
The cost of an item of property, plant and equipment comprises its purchase price and any directly attributable cost of bringing the asset to its working condition and location for its intended use. Expenditure incurred after the item has been put into operation, such as repairs and maintenance and overhaul costs, is normally charged to the consolidated statements of comprehensive income in the year in which it is incurred. In situations where it can be clearly demonstrated that the expenditure has resulted in an increase in future economic benefits expected to be obtained from the use of the item, the expenditure is capitalized as an additional cost of the item. When an item of property, plant and equipment is disposed of or retired, its cost and accumulated depreciation are removed from the financial statements and any gain or loss resulting from the disposal or retirement, being the difference between the net proceeds and the carrying amount of the asset, is included in consolidated statements of comprehensive income.
Depreciation is provided on the straight-line method, based on the estimated useful life of the individual assets, as follows:
| Buildings | 6 to 51 years | |
| Machinery and equipment | 2 to 8 years | |
| Tools | 2 to 3 years | |
| Other equipment | 2 to 6 years |
Where parts of an item of property, plant and equipment have different useful lives, the cost of that item is allocated on a reasonable basis among the parts and each part is depreciated separately. Residual values, useful lives and the depreciation method are reviewed, and adjusted if appropriate, at least at each financial year end.
An item of property, plant and equipment including any significant part initially recognized is derecognized upon disposal or when no future economic benefits are expected from its use or disposal. Any gain or loss on disposal or retirement recognized in the consolidated statements of comprehensive income in the year the asset is derecognized is the difference between the net sales proceeds and the carrying amount of the relevant asset.
F-18
Table of Contents
ChipMOS TECHNOLOGIES INC. AND SUBSIDIARIES
Notes to the Consolidated Financial Statements (Continued)
December 31, 2015, 2016 and 2017
| 2. | Basis of preparation of financial statements and principal accounting policies (continued) |
| g) | Impairment of non-financial assets |
Where an indication of impairment exists, or when periodical impairment testing for an asset is required (other than inventories, deferred tax assets and financial assets), the recoverable amount of the asset is estimated. An asset’s recoverable amount is the higher of the value in use of the asset or cash-generating unit to which it belongs and its fair value less costs to sell, and is determined for an individual asset, unless the asset does not generate cash inflows that are largely independent of those from other assets or groups of assets, in which case the recoverable amount is determined for the cash-generating unit to which the asset belongs.
An impairment loss is recognized only if the carrying amount of an asset exceeds its recoverable amount. In assessing value in use, the estimated future cash flows are discounted to their present value using a pre-tax discount rate that reflects current market assessments of the time value of money and the risks specific to the asset. An impairment loss is charged to the consolidated statements of comprehensive income in the period in which it arises in those expense categories consistent with the function of the impaired asset.
An assessment is made at the end of each reporting period as to whether there is any indication that previously recognized impairment losses may no longer exist or may have decreased. If such indication exists, the recoverable amount is estimated. A previously recognized impairment loss of an asset is reversed only if there has been a change in the estimates used to determine the recoverable amount of that asset, but not to an amount higher than the carrying amount that would have been determined (net of any depreciation), had no impairment loss been recognized for the asset in prior years. A reversal of such impairment loss is credited to the consolidated statements of comprehensive income in the period in which it arises.
| h) | Inventories |
Inventories are stated at the lower of cost and net realizable value. Cost is determined on a weighted average cost basis and includes all costs of purchase, costs of conversion, and other costs incurred in bringing the inventories to their present location and condition.
Net realizable value is the estimated selling price in the ordinary course of business less the estimated costs of completion and the estimated costs necessary to make the sale.
When inventories are consumed, the carrying amount of those inventories is recognized as cost of revenue in the period in which the related revenue is recognized. The amount of any write-down of inventories to net realizable value and all losses of inventories are recognized as cost of revenue in the period the write-down or loss occurs. The amount of any reversal of any write-down of inventories is recognized as a reduction in the amount of inventories recognized as cost of revenue in the period in which the reversal occurs.
| i) | Non-current assets held for sale |
Non-current assets are classified as assets held for sale when their carrying amount is to be recovered principally through a sale transaction rather than through continuing use, and a sale is considered highly probable. They are stated at the lower of carrying amount and fair value less costs to sell.
F-19
Table of Contents
ChipMOS TECHNOLOGIES INC. AND SUBSIDIARIES
Notes to the Consolidated Financial Statements (Continued)
December 31, 2015, 2016 and 2017
| 2. | Basis of preparation of financial statements and principal accounting policies (continued) |
| j) | Investments and other financial assets |
Initial recognition and measurement
The Group’s financial assets are classified, at initial recognition, into financial assets at fair value through profit or loss (“FVTPL”), loans and receivables and available-for-sale financial investments. When financial assets are recognized initially, they are measured at fair value plus transaction costs that are attributable to the acquisition of the financial assets.
All regular way purchases or sales of financial assets are recognized on the settlement date, that is, the date that the Group completes the purchase or sell of the asset. Regular way purchases or sales are purchases or sales of financial assets that require delivery of assets within the time frame established by regulation or convention in the marketplace.
Effective interest method
The effective interest method is a method of calculating the amortized cost of loans and receivables and a debt instrument and of allocating interest income over the relevant period. The effective interest rate is the rate that exactly discounts estimated future cash receipts (including all fees on points paid or received that form an integral part of the effective interest rate, transaction costs and other premiums or discounts) through the expected life of the debt instrument, or, where appropriate, a shorter period.
Income is recognized on an effective interest basis for debt instruments.
Subsequent measurement
The subsequent measurement of financial assets depends on their classification as follows:
Financial assets at fair value through profit or loss
Financial assets at FVTPL include financial assets held for trading and those designated as at FVTPL upon initial recognition.
A financial asset is classified as held for trading, mainly for cash management purpose as part of operating activities, if it has been acquired principally for the purpose of selling in the near future; or it is a part of an identified portfolio of financial instruments that the Group manages together and has a recent actual pattern of short-term profit-taking; or it is a derivative that is not designated and effective as a hedging instrument.
A financial asset other than a financial asset held for trading may be designated as at FVTPL upon initial recognition if:
| • | such designation eliminates or significantly reduces a measurement or recognition inconsistency that would otherwise arise; or |
| • | the financial asset forms part of a group of financial assets or financial liabilities or both, which is managed and its performance is evaluated on fair value basis, in accordance with the Group’s documented risk management or investment strategy, and information about the grouping is provided internally on that basis; or |
F-20
Table of Contents
ChipMOS TECHNOLOGIES INC. AND SUBSIDIARIES
Notes to the Consolidated Financial Statements (Continued)
December 31, 2015, 2016 and 2017
| 2. | Basis of preparation of financial statements and principal accounting policies (continued) |
| j) | Investments and other financial assets (continued) |
Subsequent measurement (continued)
| • | it forms part of a contract containing one or more embedded derivatives, and IAS 39 “Financial Instruments: Recognition and Measurement” permits the entire combined contract (asset or liability) to be designated as at FVTPL. |
There were no financial assets at FVTPL at the end of the reporting periods.
Loans and receivables
Loans and receivables are non-derivative financial assets with fixed or determinable payments that are not quoted in an active market. At the end of each reporting period, subsequent to initial recognition, loans and receivables (including accounts and notes receivables, other receivables, refundable deposits, short-term deposits and cash and cash equivalents) are carried at amortized cost using the effective interest method, less any identified impairment losses.
Available-for-sale financial investments
Available-for-sale financial investments are non-derivative financial assets in unlisted equity investments. Equity investments classified as available for sale are those which are neither classified as held for trading nor designated as at fair value through profit or loss.
When the fair value of unlisted equity investments cannot be reliably measured because (a) the variability in the range of reasonable fair value estimates is significant for that investment or (b) the probabilities of the various estimates within the range cannot be reasonably assessed and used in estimating fair value, such investments are stated at cost less any impairment losses.
The Group evaluates whether the ability and intention to sell its available-for-sale financial investments in the near term are still appropriate. When, in rare circumstances, the Group is unable to trade these financial assets due to inactive markets, the Group may elect to reclassify these financial assets if management has the ability and intention to hold the assets for the foreseeable future or until maturity.
| k) | Impairment of financial assets |
The Group assesses at the end of each reporting period whether there is objective evidence that a financial asset or a group of financial assets is impaired. An impairment exists if one or more events that occurred after the initial recognition of the asset have an impact on the estimated future cash flows of the financial asset or the group of financial assets that can be reliably estimated. Evidence of impairment may include indications that a debtor or a group of debtors is experiencing significant financial difficulty, default or delinquency in interest or principal payments, the probability that they will enter bankruptcy or other financial reorganization and observable data indicating that there is a measurable decrease in the estimated future cash flows, such as changes in arrears or economic conditions that correlate with defaults.
F-21
Table of Contents
ChipMOS TECHNOLOGIES INC. AND SUBSIDIARIES
Notes to the Consolidated Financial Statements (Continued)
December 31, 2015, 2016 and 2017
| 2. | Basis of preparation of financial statements and principal accounting policies (continued) |
| k) | Impairment of financial assets (continued) |
Financial assets carried at amortized cost
For financial assets carried at amortized cost, the Group first assesses whether impairment exists individually for financial assets that are individually significant, or collectively for financial assets that are not individually significant. If the Group determines that no objective evidence of impairment exists for an individually assessed financial asset, whether significant or not, it includes the asset in a group of financial assets with similar credit risk characteristics and collectively assesses them for impairment. Assets that are individually assessed for impairment and for which an impairment loss is, or continues to be, recognized are not included in a collective assessment of impairment.
The amount of any impairment loss identified is measured as the difference between the asset’s carrying amount and the present value of estimated future cash flows (excluding future credit losses that have not yet been incurred). The present value of the estimated future cash flows is discounted at the financial asset’s original effective interest rate (i.e., the effective interest rate computed at initial recognition). The carrying amount of the asset is reduced through the use of an allowance account and the loss is recognized in the consolidated statements of comprehensive income. Interest income continues to be accrued on the reduced carrying amount and is accrued using the rate of interest used to discount the future cash flows for the purpose of measuring the impairment loss. Loans and receivables together with any associated allowance are written off when there is no realistic prospect of future recovery and all collateral has been realized or has been transferred to the Group.
If, in a subsequent period, the amount of the estimated impairment loss increases or decreases because of an event occurring after the impairment was recognized, the previously recognized impairment loss is increased or reduced by adjusting the allowance account. If a write-off is later recovered, the recovery is credited to other expenses in the consolidated statements of comprehensive income.
Available-for-sale financial assets
The amount of the impairment loss is measured as the difference between the asset’s acquisition cost (less any principal repayment and amortization) and current fair value, less any impairment loss on that financial asset previously recognized in profit or loss, and is reclassified from “other comprehensive income” to “profit or loss”. If, in a subsequent period, the fair value of an investment in a debt instrument increases, and the increase can be related objectively to an event occurring after the impairment loss was recognized, then such impairment loss is reversed through profit or loss. Impairment loss of an investment in an equity instrument recognized in profit or loss shall not be reversed through profit or loss. Impairment loss is recognized and reversed by adjusting the carrying amount of the asset directly.
F-22
Table of Contents
ChipMOS TECHNOLOGIES INC. AND SUBSIDIARIES
Notes to the Consolidated Financial Statements (Continued)
December 31, 2015, 2016 and 2017
| 2. | Basis of preparation of financial statements and principal accounting policies (continued) |
| l) | Derecognition of financial assets |
A financial asset (or, where applicable, a part of a financial asset or part of a group of similar financial assets) is primarily derecognized (i.e., removed from the Group’s consolidated statement of financial position) when:
| • | the rights to receive cash flows from the asset have expired; or |
| • | the Group has transferred its rights to receive cash flows from the asset or has assumed an obligation to pay the received cash flows in full without material delay to a third party under a “pass-through” arrangement; and either (a) the Group has transferred substantially all the risks and rewards of the asset, or (b) the Group has neither transferred nor retained substantially all the risks and rewards of the asset, but has transferred control of the asset. |
When the Group has transferred its rights to receive cash flows from an asset or has entered into a pass-through arrangement, it evaluates if and to what extent it has retained the risk and rewards of ownership of the asset. When it has neither transferred nor retained substantially all the risks and rewards of the asset nor transferred control of the asset, the Group continues to recognize the transferred asset to the extent of the Group’s continuing involvement. In that case, the Group also recognizes an associated liability. The transferred asset and the associated liability are measured on a basis that reflects the rights and obligations that the Group has retained.
Continuing involvement that takes the form of a guarantee over the transferred asset is measured at the lower of the original carrying amount of the asset and the maximum amount of consideration that the Group could be required to repay.
| m) | Investments in associates |
The Group’s investments in associates are accounted for using the equity method. An associate is an entity over which the Group has significant influence and that is neither a subsidiary nor a joint venture. Significant influence is the power to participate in the financial and operating policy decisions of an entity, but is not control or joint control over those policies. Any difference between the acquisition cost and the Group’s share of the net fair value of the identifiable assets and liabilities of associates is accounted for as follows:
| (a) | Any excess of the acquisition cost over the Group’s share of the net fair value of the identifiable assets and liabilities of an associate at the date of acquisition is recognized as goodwill and is included in the carrying amount of the investment. Amortization of goodwill is not permitted. |
| (b) | Any excess of the Group’s share of the net fair value of the identifiable assets and liabilities of an associate over the acquisition cost, after reassessing the fair value, is recognized as a gain in profit or loss on the acquisition date. |
Under the equity method, the investments in associates are carried on the statements of financial position at cost plus post acquisition changes in the Group’s share of profit or loss and other comprehensive income of associates. The Group’s share of changes in associates’ profit or loss and other comprehensive income are recognized directly in profit or loss and other comprehensive income, respectively, of the Group. Distributions received from an associate reduce the carrying amount of the investment. Any unrealized gains and losses resulting from transactions between the Group and the associate are eliminated to the extent of the Group’s interest in the associate.
F-23
Table of Contents
ChipMOS TECHNOLOGIES INC. AND SUBSIDIARIES
Notes to the Consolidated Financial Statements (Continued)
December 31, 2015, 2016 and 2017
| 2. | Basis of preparation of financial statements and principal accounting policies (continued) |
| m) | Investments in associates (continued) |
Upon an associate’s issuance of new shares, if the Group takes up more shares than its original proportionate holding while maintaining its significant influence over that associate, such increase would be accounted for as an acquisition of an additional equity interest in the associate. Upon an associate’s issuance of new shares, if the Group does not take up proportionate shares and reduces its shareholding while maintaining its significant influence over that associate, the Group will treat the transaction as deemed disposal and reclassify to profit or loss the proportion of the gain or loss previously recognized in other comprehensive income relating to that reduction in ownership interest where appropriate.
The Group ceases to use the equity method upon loss of significant influence over an associate. Any difference between the carrying amount of the investment in an associate upon loss of significant influence and the fair value of the retained investment plus proceeds from disposal will be recognized in profit or loss.
The Group determines at each reporting date whether there is any objective evidence that the investments in associates are impaired. An impairment loss, being the difference between the recoverable amount of the associate and its carrying value, is recognized in profit or loss in the consolidated statements of comprehensive income and forms part of the carrying amount of the investments.
| n) | Financial liabilities |
Initial recognition and measurement
Financial liabilities are classified, at initial recognition, as financial liabilities at fair value through profit or loss, loans and borrowings, or as derivatives designated as hedging instruments in an effective hedge, as appropriate.
All financial liabilities are recognized initially at fair value and, in the case of loans and borrowings, net of directly attributable transaction costs.
The Group’s financial liabilities include bank loans, accounts payable and other monetary liabilities.
Subsequent measurement
The subsequent measurement of financial liabilities depends on their classification as follows:
Loans and borrowings
After initial recognition, interest-bearing loans and borrowings are subsequently measured at amortized cost, using the effective interest rate method unless the effect of discounting would be immaterial, in which case they are stated at cost. Gains and losses are recognized in the consolidated statements of comprehensive income when the liabilities are derecognized through the effective interest rate amortization process.
Amortized cost is calculated by taking into account any discount or premium on acquisition and fees or costs that are an integral part of the effective interest rate. The effective interest rate amortization is included in finance costs in the consolidated statements of comprehensive income.
F-24
Table of Contents
ChipMOS TECHNOLOGIES INC. AND SUBSIDIARIES
Notes to the Consolidated Financial Statements (Continued)
December 31, 2015, 2016 and 2017
| 2. | Basis of preparation of financial statements and principal accounting policies (continued) |
| n) | Financial liabilities (continued) |
Notes and accounts payable
Notes and accounts payable are obligations to pay for goods or services that have been acquired in the ordinary course of business from suppliers. They are recognized initially at fair value and subsequently measured at amortized cost using the effective interest method. However, short-term accounts payable without bearing interest are subsequently measured at initial invoice amount as the effect of discounting is immaterial.
| o) | Derecognition of financial liabilities |
A financial liability is derecognized when the obligation under the liability is discharged or cancelled, or expired. When an existing financial liability is replaced by another from the same lender on substantially different terms, or the terms of an existing liability are substantially modified, such an exchange or modification is treated as a derecognition of the original liability and a recognition of a new liability, and the difference between the respective carrying amounts is recognized in the consolidated statements of comprehensive income.
| p) | Dividends |
Dividends are recommended by the Board of Directors to the Shareholders’ approval pursuant to the Company’s Article of Incorporation.
| q) | Operating lease charges |
Where the Group has the use of assets held under operating leases, payments made under the leases are charged to the consolidated statements of comprehensive income in equal installments over the accounting periods covered by the lease term, except where an alternative basis is more representative of the pattern of benefits to be derived from the leased assets. Lease incentives received are recognized in the consolidated statements of comprehensive income as an integral part of the aggregate net lease payments made. Contingent rentals, if any, are charged to the consolidated statements of comprehensive income in the accounting period in which they are incurred.
| r) | Treasury stock |
Treasury stock is stated at cost and shown as a deduction in equity. When the Company retires treasury stock, the treasury stock account is reduced and the share capital as well as the capital surplus – share premium are reversed on a pro rata basis. When the book value of the treasury stock exceeds the sum of par value and share premium, the difference is charged to respective capital surplus and to retained earnings for any remaining amount. The Company’s stock held by its subsidiary is treated as treasury stock.
F-25
Table of Contents
ChipMOS TECHNOLOGIES INC. AND SUBSIDIARIES
Notes to the Consolidated Financial Statements (Continued)
December 31, 2015, 2016 and 2017
| 2. | Basis of preparation of financial statements and principal accounting policies (continued) |
| s) | Provisions |
A provision is recognized when a present obligation (legal or constructive) has arisen as a result of a past event and it is probable that a future outflow of resources will be required to settle the obligation, provided that a reliable estimate can be made of the amount of the obligation.
When the effect of discounting is material, the amount recognized for a provision is the present value at the end of the reporting period of the future expenditures expected to be required to settle the obligation. The increase in the discounted present value amount arising from the passage of time is included in finance costs in the consolidated statements of comprehensive income.
| t) | Foreign currency translation |
The consolidated financial statements are presented in New Taiwan dollars, which is the Company’s functional currency. Each entity in the Group determines its own functional currency and items included in the financial statements of each entity are measured using that functional currency. Foreign currency transactions are initially recorded using the functional currency rates ruling at the date of the transactions. Monetary assets and liabilities denominated in foreign currencies are retranslated at the functional currency rates of exchange ruling at the end of the reporting period. All differences are taken to profit or loss. Non-monetary items that are measured in terms of historical cost in a foreign currency are translated using the exchange rates at the dates of the initial transactions. Non-monetary items measured at fair value in a foreign currency are translated using the exchange rates at the date when the fair value was determined. The functional currencies of certain overseas subsidiaries are currencies other than the New Taiwan dollars. As at the end of the reporting period, the assets and liabilities of these entities are translated into the presentation currency of the Company at the exchange rates ruling at the end of the reporting period, and their income and expense items are translated into New Taiwan dollars at the weighted average exchange rates for the year.
The resulting exchange differences are recorded in other comprehensive income and the cumulative balance is included in foreign currency translation reserve in the consolidated statements of changes in equity. On disposal of a foreign entity, the deferred cumulative amount recognized in foreign currency translation reserve relating to that particular foreign operation is recognized in the consolidated statements of comprehensive income. For the purpose of the consolidated statements of cash flows, the cash flows of overseas subsidiaries are translated into New Taiwan dollars at the exchange rates ruling at the dates of the cash flows. Frequently recurring cash flows of overseas subsidiaries which arise throughout the year are translated into New Taiwan dollars at the weighted average exchange rates for the year.
F-26
Table of Contents
ChipMOS TECHNOLOGIES INC. AND SUBSIDIARIES
Notes to the Consolidated Financial Statements (Continued)
December 31, 2015, 2016 and 2017
| 2. | Basis of preparation of financial statements and principal accounting policies (continued) |
| u) | Revenue recognition |
Revenue is recognized to the extent that it is probable that the economic benefits arising in the course of business will flow to the Group and the revenue can be reliably measured, regardless of when the payment is being made. Revenue is measured at the fair value of the consideration received or receivable, taking into account contractually defined terms of payment and excluding taxes or duty.
The Group engaged in the research, development, manufacturing and sale of high-integration and high-precision integrated circuits and related assembly and testing services. The criteria that the Group uses to determine when to recognize revenue are: (a) the Group has transferred to the buyer the significant risks and rewards of ownership of the goods; (b) the Group retains neither continuing managerial involvement to the degree usually associated with ownership nor effective control over the goods sold; (c) the amount of revenue can be measured reliably; (d) it is probable that the economic benefits associated with the transaction will flow to the Group ; (e) the stage of completion of the transaction at the end of the reporting period can be measured reliably, and (f) the costs incurred for the transaction and the costs to complete the transaction can be measured reliably.
The Group does not take ownership of: (1) bare semiconductor wafers received from customers that are assembled into finished semiconductors, and (2) assembled semiconductors received from the customers that it tests. The title and risk of loss remains with the customer for those bare semiconductors and/or assembled semiconductors. Accordingly, the customer-supplied semiconductor materials are not included in the consolidated financial statements.
The Group does not provide warranties to customers except in cases of defects in the assembly services provided and deficiencies in testing services provided. An appropriate sales allowance is recognized in the period during which the sale is recognized, and is estimated based on historical experience.
Interest income
Interest income is recognized on an accrual basis using the effective interest method by applying the rate that discounts the estimated future cash receipts through the expected life of the financial instrument to the net carrying amount of the financial asset.
F-27
Table of Contents
ChipMOS TECHNOLOGIES INC. AND SUBSIDIARIES
Notes to the Consolidated Financial Statements (Continued)
December 31, 2015, 2016 and 2017
| 2. | Basis of preparation of financial statements and principal accounting policies (continued) |
| v) | Research and development costs |
Research and development costs that do not meet the criteria of internally generated intangible assets of IAS 38 “Intangible Assets” are expensed in the period in which it is incurred.
| w) | Borrowing costs |
Borrowing costs directly attributable to the acquisition, construction or production of qualifying assets, which are assets that necessarily take a substantial period of time to get ready for their intended use or sale, are added to the cost of those assets, until such time as the assets are substantially ready for their intended use or sale. All other borrowing costs are charged to the consolidated statements of comprehensive income in the period in which they are incurred.
| x) | Pension and other post-employment benefits |
The Group operates defined contribution and defined benefit plans in the ROC and PRC. For defined contribution retirement benefit plans, payments to the benefit plan are recognized as an expense when the employees have rendered service entitling them to the contribution. For defined benefit retirement plans, the cost of providing benefit is recognized based on actuarial calculations.
For defined benefit retirement benefit plans, the cost of providing benefits is determined using the Projected Unit Credit Method, with actuarial valuations being carried out at the year end. Remeasurements are recognized in other comprehensive income in the period which they incur. Past service costs are recognized in the consolidated statements of comprehensive income on the earlier of the date of the plan amendment or curtailment, and the date that the Group recognizes restructuring-related costs. Net interest is calculated by applying the discount rate to the net defined benefit liability or asset. The Group recognizes i) service costs comprising current service costs, past service costs, gains and losses on curtailments and non-routine settlements, and ii) net interest expense or income, under cost of revenue, research and development expenses, sales and marketing expenses and general and administrative expenses in the consolidated statements of comprehensive income.
Employee entitlements to annual leave are recognized when they accrue to employees. An accrual is made for the estimated liability for annual leave as a result of services rendered by employees up to the end of the reporting period.
| y) | Share-based payments |
Employees of the Group receive remuneration in the form of share-based payments, whereby employees render services as consideration for equity instruments (equity-settled transactions) or share appreciation rights, which are settled in cash (cash-settled transactions).
F-28
Table of Contents
ChipMOS TECHNOLOGIES INC. AND SUBSIDIARIES
Notes to the Consolidated Financial Statements (Continued)
December 31, 2015, 2016 and 2017
| 2. | Basis of preparation of financial statements and principal accounting policies (continued) |
| y) | Share-based payments (continued) |
Equity-settled transactions
The cost of equity-settled transactions is determined by the fair value at the date when the grant is made using an appropriate valuation model.
That cost is recognized, together with a corresponding increase in capital surplus in equity, over the period in which the performance and/or service conditions are fulfilled in employee benefit expenses. The cumulative expense recognized for equity-settled transactions at each reporting date until the vesting date reflects the extent to which the vesting period has expired and the Group’s best estimate of the number of equity instruments that will ultimately vest.
When the terms of an equity-settled award are modified, as a minimum, the services received measured at the grant date, fair value of the equity instruments granted should be recognized, unless those equity instruments do not vest because of failure to satisfy a vesting condition (other than a market condition) that was specified at grant date. An additional expense is recognized for any modification that increases the total fair value of the share-based payment transaction, or is otherwise beneficial to the employee as measured at the date of modification.
Where an equity-settled award is cancelled, it is treated as if it had vested on the date of cancellation, and any expense not yet recognized for the award is recognized immediately. This includes any award where non-vesting conditions within the control of either the Group or the employee are not met. However, if a new award is substituted for the cancelled award, and is designated as a replacement award on the date that it is granted, the cancelled and new awards are treated as if they were a modification of the original award, as described in the previous paragraph.
Cash-settled transactions
The cost of cash-settled transactions is measured initially at fair value at the grant date using an appropriate valuation model. This fair value is expensed over the period until the vesting date with recognition of a corresponding liability. The liability is re-measured to fair value at each reporting date up to, and including the settlement date, with changes in fair value recognized in employee benefit expenses.
Restricted shares
Restricted shares issued to employees are measured at the fair value of the equity instruments granted at the grant date, and are recognized as compensation cost over the vesting period.
For restricted shares where those shares do not restrict distribution of dividends to employees and employees are not required to return the dividends received if they resign during the vesting period, the Group recognizes the fair value of the dividends received by the employees who are expected to resign during the vesting period as compensation cost at the date of dividends declared.
For restricted shares where employees do not need to pay to acquire those shares, if the employees who resign during the vesting period, the Group will recover and retire those shares at no cost.
F-29
Table of Contents
ChipMOS TECHNOLOGIES INC. AND SUBSIDIARIES
Notes to the Consolidated Financial Statements (Continued)
December 31, 2015, 2016 and 2017
| 2. | Basis of preparation of financial statements and principal accounting policies (continued) |
| z) | Income tax |
Income tax represents the sum of current and deferred tax. Income tax relating to items recognized outside profit or loss is recognized outside profit or loss, either in other comprehensive income or directly in equity.
Current tax assets and liabilities are measured at the amount expected to be recovered from or paid to the taxation authorities, based on tax rates (and tax laws) that have been enacted or substantively enacted by the end of the reporting period, taking into consideration interpretations and practices prevailing in the countries in which the Group operates.
Deferred tax is provided, using the liability method, on all temporary differences at the end of the reporting period between the tax bases of assets and liabilities and their carrying amounts for financial reporting purposes.
Deferred tax liabilities are recognized for all taxable temporary differences, except:
| • | when the deferred tax liability arises from the initial recognition of goodwill or an asset or liability in a transaction that is not a business combination and, at the time of the transaction, affects neither the accounting profit nor taxable profit or loss; and |
| • | in respect of taxable temporary differences associated with investments in subsidiaries, associates and joint ventures, when the timing of the reversal of the temporary differences can be controlled and it is probable that the temporary differences will not reverse in the foreseeable future. |
Deferred tax assets are recognized for all deductible temporary differences, the carryforward of unused tax credits and any unused tax losses. Deferred tax assets are recognized to the extent that it is probable that taxable profits will be available against which deductible temporary differences, the carryforward of unused tax credits and unused tax losses can be utilized, except:
| • | when the deferred tax asset relating to the deductible temporary differences arises from the initial recognition of an asset or liability in a transaction that is not a business combination and, at the time of the transaction, affects neither the accounting profit nor taxable profit or loss; and |
| • | in respect of deductible temporary differences associated with investments in subsidiaries, associates and joint ventures, deferred tax assets are only recognized to the extent that it is probable that the temporary differences will reverse in the foreseeable future and taxable profit will be available against which the temporary differences can be utilized. |
The carrying amount of deferred tax assets is reviewed at the end of each reporting period and reduced to the extent that it is no longer probable that sufficient taxable profit will be available to allow all or part of the deferred tax asset to be utilized. Unrecognized deferred tax assets are reassessed at the end of each reporting period and are recognized to the
extent that it has become probable that sufficient taxable profit will be available to allow all or part of the deferred tax asset to be recovered.
F-30
Table of Contents
ChipMOS TECHNOLOGIES INC. AND SUBSIDIARIES
Notes to the Consolidated Financial Statements (Continued)
December 31, 2015, 2016 and 2017
| 2. | Basis of preparation of financial statements and principal accounting policies (continued) |
| z) | Income tax (continued) |
Deferred tax is calculated, without discounting, at the tax rates that are expected to apply in the period when the asset is realized or the liability is settled, based on the tax rates (and tax laws) that have been enacted or substantively enacted by the end of the reporting period.
Current income tax assets and liabilities are offset and the net amount reported in the statements of financial position when there is a legally enforceable right to offset the recognized amounts and there is an intention to settle on a net basis or realize the asset and settle the liability simultaneously.
| aa) | Cash and cash equivalents |
Cash and cash equivalents comprise cash on hand and demand deposits, and short-term highly liquid investments which are readily convertible into known amounts of cash, are subject to an insignificant risk of changes in value, and have a short maturity of generally within three months when acquired.
| bb) | Related parties |
| (a) | A person, or a close member of that person’s family, is related to the Group if that person: |
| (i) | has control or joint control over the Group; |
| (ii) | has significant influence over the Group; or |
| (iii) | is a member of key management personnel of the Group or the Group’s parent. |
| or |
| (b) | An entity is related to the Group if any of the following conditions applies: |
| (i) | The entity and the Group are members of the same group. |
| (ii) | One entity is an associate or joint venture of the other entity (or an associate or joint venture of a member of a group of which the other entity is a member). |
| (iii) | The entity and the Group are joint ventures of the same third party. |
| (iv) | One entity is a joint venture of a third entity and the other entity is an associate of the third entity. |
| (v) | The entity is a post-employment benefit plan for the benefit of employees of either the Group or an entity related to the Group. |
| (vi) | The entity is controlled or jointly controlled by a person identified in (a). |
| (vii) | A person identified in (a)(i) has significant influence over the entity or is a member of the key management personnel of the entity (or of a parent of the entity). |
F-31
Table of Contents
ChipMOS TECHNOLOGIES INC. AND SUBSIDIARIES
Notes to the Consolidated Financial Statements (Continued)
December 31, 2015, 2016 and 2017
| 2. | Basis of preparation of financial statements and principal accounting policies (continued) |
| cc) | Subsidiaries |
A subsidiary is an entity (including a structured entity) controlled by the Company. Control is achieved when the Group is exposed, or has rights, to variable returns from its involvement with the investee and has the ability to affect those returns through its power over the investee (i.e., existing rights that give the Group the current ability to direct the relevant activities of the investee).
When the Company has, directly or indirectly, less than a majority of the voting or similar rights of an investee, the Group considers all relevant facts and circumstances in assessing whether it has power over an investee, including:
| • | the contractual arrangement with the other vote holders of the investee; |
| • | rights arising from other contractual arrangements; and |
| • | the Group’s voting rights and potential voting rights |
The Company’s share of its subsidiaries’ post-acquisition profits or losses is recognized in profit or loss, and its share of post-acquisition movements in other comprehensive income is recognized in other comprehensive income. When the Company’s share of losses in a subsidiary equals or exceeds its interest in the subsidiary, the Company continues to recognize its share in the subsidiary’s loss proportionately.
Changes in a parent’s ownership interest in a subsidiary that do not result in the parent losing control of the subsidiary (transactions with non-controlling interests) are accounted for as equity transactions, i.e. transactions with owners in their capacity as owner. Any difference between the amount by which the non-controlling interests are adjusted and the fair value of the consideration paid or received is recognized directly in equity.
| dd) | Fair value measurement |
The Group measures its accrued pension cost at fair value at the end of each reporting period. Fair value is the price that would be received to sell an asset or paid to transfer a liability in an orderly transaction between market participants at the measurement date. The fair value measurement is based on the presumption that the transaction to sell the asset or transfer the liability takes place either in the principal market for the asset or liability, or in the absence of a principal market, in the most advantageous market for the asset or liability. The principal or the most advantageous market must be accessible by the Group. The fair value of an asset or a liability is measured using the assumptions that market participants would use when pricing the asset or liability, assuming that market participants act in their economic best interest.
F-32
Table of Contents
ChipMOS TECHNOLOGIES INC. AND SUBSIDIARIES
Notes to the Consolidated Financial Statements (Continued)
December 31, 2015, 2016 and 2017
| 2. | Basis of preparation of financial statements and principal accounting policies (continued) |
| dd) | Fair value measurement (continued) |
A fair value measurement of a non-financial asset takes into account a market participant’s ability to generate economic benefits by using the asset in its highest and best use or by selling it to another market participant that would use the asset in its highest and best use.
The Group uses valuation techniques that are appropriate in the circumstances and for which sufficient data are available to measure fair value, maximizing the use of relevant observable inputs and minimizing the use of unobservable inputs.
All assets and liabilities for which fair value is measured or disclosed in the financial statements are categorized within the fair value hierarchy, described as follows, based on the lowest level input that is significant to the fair value measurement as a whole:
Level 1 – based on quoted prices (unadjusted) in active markets for identical assets or liabilities
Level 2 – based on valuation techniques for which the lowest level input that is significant to the fair value measurement is observable, either directly or indirectly
Level 3 – based on valuation techniques for which the lowest level input that is significant to the fair value measurement is unobservable
For assets and liabilities that are recognized in the financial statements on a recurring basis, the Group determines whether transfers have occurred between levels in the hierarchy by reassessing categorization (based on the lowest level input that is significant to the fair value measurement as a whole) at the end of each reporting period.
| ee) | Capital reorganization |
The Company merged with ChipMOS Bermuda on October 31, 2016 and the transaction was accounted as capital reorganization within the Group. When presenting comparative financial statements, the Company presented it as if ChipMOS Bermuda had always been combined and the financial statements were restated retrospectively. The assets and liabilities acquired from ChipMOS Bermuda was measured by using book value method, and any differences between the consideration given by the Company and the aggregate book value of the assets and liabilities of ChipMOS Bermuda was first accounted for as addition (deduction) in capital surplus arises from share premium, if the share premium is insufficient, the amount will be accounted for as deduction from retained earnings. In addition, on the effective date of the Merger, the Company reclassified its shares originally held by ChipMOS Bermuda as treasury stock and cancelled those shares with deduction in share premium equal to the proportion of retired shares. If the share premium is insufficient, the amount will be accounted for as deduction from retained earnings. Transaction costs attributable to the Merger are accounted for as deduction from equity.
When presenting comparative financial statements, the Company presented it as if ChipMOS Bermuda had always been combined and the financial statements were restated retrospectively. Net income attributable to ChipMOS Bermuda prior to the Merger were presented as “Predecessors’ interests”.
F-33
Table of Contents
ChipMOS TECHNOLOGIES INC. AND SUBSIDIARIES
Notes to the Consolidated Financial Statements (Continued)
December 31, 2015, 2016 and 2017
| 3. | Translation into U.S. dollar amounts |
The Company maintains its accounts and expresses its consolidated financial statements in New Taiwan dollars. For convenience purposes, U.S. dollar amounts presented in the accompanying consolidated financial statements have been translated from New Taiwan dollars to U.S. dollars at the noon buying rate in the City of New York for cable transfers as certified for customs purposes by the Federal Reserve Bank of New York as of December 29, 2017, which was NT$29.64 to US$1.00. These convenience translations should not be construed as representations that the New Taiwan dollar amounts have been, or could in the future be, converted into U.S. dollars at this or any other rate of exchange.
| 4. | Segment Information |
The Group engages mainly in the assembly and testing of semiconductors, memory module and investing. In accordance with IFRS 8 “Operating Segments”, the Group’s chief operating decision maker has been identified as the Chairman of the Board of Directors, who reviews these segment results by Testing, Assembly, Testing and Assembly for Liquid Crystal Display and other Flat-Panel Display Driver Semiconductors (“LCDD”) and Bumping when making decisions about allocating resources and assessing the performance of the Group. The information of the segments’ other assets and liabilities are not regularly provided to the Chairman of the Board of Directors for decision making. Financial segment information is as below:
The Group uses operating profit (loss) as the measurement for segment profit (loss) and the basis of performance assessment. There was no material inconsistency between the accounting policies of the operating segment and the accounting policies described in Note 2.
| 2015 | ||||||||||||||||||||||||||||||||
| Testing | Assembly | LCDD | Bumping | Others | Elimination |
Total
continuing operations |
Discontinued
operations |
|||||||||||||||||||||||||
| NT$000 | NT$000 | NT$000 | NT$000 | NT$000 | NT$000 | NT$000 | NT$000 | |||||||||||||||||||||||||
|
Revenue |
||||||||||||||||||||||||||||||||
|
External customers |
4,546,394 | 5,525,582 | 5,396,001 | 3,369,112 | — | — | 18,837,089 | 1,032,302 | ||||||||||||||||||||||||
|
Inter-segment |
172,264 | 528 | — | — | 44,577 | (217,369 | ) | — | — | |||||||||||||||||||||||
|
|
|
|
|
|
|
|
|
|
|
|
|
|
|
|
|
|||||||||||||||||
|
Total revenue |
4,718,658 | 5,526,110 | 5,396,001 | 3,369,112 | 44,577 | (217,369 | ) | 18,837,089 | 1,032,302 | |||||||||||||||||||||||
|
|
|
|
|
|
|
|
|
|
|
|
|
|
|
|
|
|||||||||||||||||
|
Operating profit (loss) |
1,203,169 | 117,127 | 1,354,398 | 28,605 | (47,191 | ) | (7,681 | ) | 2,648,427 | (61,214 | ) | |||||||||||||||||||||
|
Depreciation and amortization |
(646,545 | ) | (550,819 | ) | (1,157,809 | ) | (548,234 | ) | (357 | ) | 543 | (2,903,221 | ) | (118,702 | ) | |||||||||||||||||
|
Interest income |
— | — | — | — | 60,552 | (1,690 | ) | 58,862 | 9,421 | |||||||||||||||||||||||
|
Interest expense |
— | — | — | — | (128,311 | ) | 1,690 | (126,621 | ) | (414 | ) | |||||||||||||||||||||
|
Share of profit of associates |
— | — | — | — | 25,346 | 5,923 | 31,269 | — | ||||||||||||||||||||||||
|
Purchase of property, plant and equipment |
796,964 | 895,767 | 1,366,389 | 589,615 | 2,477 | (6,652 | ) | 3,644,560 | — | |||||||||||||||||||||||
F-34
Table of Contents
ChipMOS TECHNOLOGIES INC. AND SUBSIDIARIES
Notes to the Consolidated Financial Statements (Continued)
December 31, 2015, 2016 and 2017
| 4. | Segment Information (continued) |
| 2016 | ||||||||||||||||||||||||||||||||
| Testing | Assembly | LCDD | Bumping | Others | Elimination |
Total
continuing operations |
Discontinued
operations |
|||||||||||||||||||||||||
| NT$000 | NT$000 | NT$000 | NT$000 | NT$000 | NT$000 | NT$000 | NT$000 | |||||||||||||||||||||||||
|
Revenue |
||||||||||||||||||||||||||||||||
|
External customers |
4,587,054 | 5,880,780 | 4,920,302 | 2,999,457 | — | — | 18,387,593 | 1,005,166 | ||||||||||||||||||||||||
|
Inter-segment |
— | 1,103 | — | 510 | 41,670 | (43,283 | ) | — | — | |||||||||||||||||||||||
|
|
|
|
|
|
|
|
|
|
|
|
|
|
|
|
|
|||||||||||||||||
|
Total revenue |
4,587,054 | 5,881,883 | 4,920,302 | 2,999,967 | 41,670 | (43,283 | ) | 18,387,593 | 1,005,166 | |||||||||||||||||||||||
|
|
|
|
|
|
|
|
|
|
|
|
|
|
|
|
|
|||||||||||||||||
|
Operating profit (loss) |
1,346,874 | 143,220 | 963,698 | (341,356 | ) | (82,331 | ) | (31,530 | ) | 1,998,575 | (146,263 | ) | ||||||||||||||||||||
|
Depreciation and amortization |
(664,026 | ) | (635,481 | ) | (1,167,908 | ) | (622,412 | ) | (565 | ) | 488 | (3,089,904 | ) | (141,375 | ) | |||||||||||||||||
|
Interest income |
— | — | — | — | 51,756 | (13,202 | ) | 38,554 | 3,753 | |||||||||||||||||||||||
|
Interest expense |
— | — | — | — | (144,545 | ) | — | (144,545 | ) | (606 | ) | |||||||||||||||||||||
|
Share of profit (loss) of associates |
— | — | — | — | (128,866 | ) | 157,790 | 28,924 | — | |||||||||||||||||||||||
|
Purchase of property, plant and equipment |
771,500 | 554,162 | 910,457 | 887,144 | 49 | — | 3,123,312 | 1,567,683 | ||||||||||||||||||||||||
| 2017 | ||||||||||||||||||||||||||||||||||||||||
| Testing | Assembly | LCDD | Bumping | Others | Elimination |
Total
continuing operations |
Total
continuing operations |
Discontinued
operations |
Discontinued
operations |
|||||||||||||||||||||||||||||||
| NT$000 | NT$000 | NT$000 | NT$000 | NT$000 | NT$000 | NT$000 | US$000 | NT$000 | US$000 | |||||||||||||||||||||||||||||||
|
Revenue |
||||||||||||||||||||||||||||||||||||||||
|
External customers |
4,838,246 | 5,259,281 | 4,789,869 | 3,053,459 | — | — | 17,940,855 | 605,292 | 227,095 | 7,662 | ||||||||||||||||||||||||||||||
|
Inter-segment |
— | — | 247 | — | 35,808 | (36,055 | ) | — | — | — | — | |||||||||||||||||||||||||||||
|
|
|
|
|
|
|
|
|
|
|
|
|
|
|
|
|
|
|
|
|
|||||||||||||||||||||
|
Total revenue |
4,838,246 | 5,259,281 | 4,790,116 | 3,053,459 | 35,808 | (36,055 | ) | 17,940,855 | 605,292 | 227,095 | 7,662 | |||||||||||||||||||||||||||||
|
|
|
|
|
|
|
|
|
|
|
|
|
|
|
|
|
|
|
|
|
|||||||||||||||||||||
|
Operating profit (loss) |
1,448,939 | (55,198 | ) | 1,285,495 | (336,123 | ) | (100,545 | ) | (2,687 | ) | 2,239,881 | 75,570 | (25,394 | ) | (857 | ) | ||||||||||||||||||||||||
|
Depreciation and amortization |
(673,393 | ) | (597,500 | ) | (1,048,587 | ) | (579,605 | ) | (503 | ) | 310 | (2,899,278 | ) | (97,816 | ) | — | — | |||||||||||||||||||||||
|
Interest income |
— | — | — | — | 53,123 | — | 53,123 | 1,792 | 464 | 16 | ||||||||||||||||||||||||||||||
|
Interest expense |
— | — | — | — | (190,425 | ) | — | (190,425 | ) | (6,425 | ) | (2,414 | ) | (81 | ) | |||||||||||||||||||||||||
|
Share of profit (loss) of associates |
— | — | — | — | 1,347,851 | (1,527,342 | ) | (179,491 | ) | (6,056 | ) | — | — | |||||||||||||||||||||||||||
|
Purchase of property, plant and equipment |
836,894 | 655,879 | 2,615,153 | 594,765 | — | — | 4,702,691 | 158,660 | — | — | ||||||||||||||||||||||||||||||
F-35
Table of Contents
ChipMOS TECHNOLOGIES INC. AND SUBSIDIARIES
Notes to the Consolidated Financial Statements (Continued)
December 31, 2015, 2016 and 2017
| 4. | Segment Information (continued) |
Geographic information of revenue:
| 2015 | 2016 | 2017 | 2017 | |||||||||||||
| NT$000 | NT$000 | NT$000 | US$000 | |||||||||||||
|
Area |
||||||||||||||||
|
ROC |
13,529,739 | 12,728,014 | 13,152,419 | 443,739 | ||||||||||||
|
Japan |
986,403 | 1,855,674 | 2,257,296 | 76,157 | ||||||||||||
|
Singapore |
2,928,591 | 3,087,835 | 1,798,585 | 60,681 | ||||||||||||
|
Others |
1,392,356 | 716,070 | 732,555 | 24,715 | ||||||||||||
|
|
|
|
|
|
|
|
|
|||||||||
| 18,837,089 | 18,387,593 | 17,940,855 | 605,292 | |||||||||||||
|
|
|
|
|
|
|
|
|
|||||||||
Net revenue from customers representing at least 10% of the total revenue:
| 2015 | 2016 | 2017 | 2017 | |||||||||||||||||||||||||
| Amount | % | Amount | % | Amount | % | Amount | ||||||||||||||||||||||
| NT$000 | NT$000 | NT$000 | US$000 | |||||||||||||||||||||||||
|
Customers |
||||||||||||||||||||||||||||
|
Customer A |
4,307,855 | 23 | 3,370,285 | 18 | 3,434,873 | 19 | 115,886 | |||||||||||||||||||||
|
Customer K |
2,386,975 | 13 | 2,633,431 | 14 | 2,742,882 | 15 | 92,540 | |||||||||||||||||||||
|
Customer I |
2,935,820 | 16 | 3,085,190 | 17 | 1,798,111 | 10 | 60,665 | |||||||||||||||||||||
|
Customer C |
1,761,049 | 9 | 1,870,675 | 10 | 1,530,209 | 9 | 51,626 | |||||||||||||||||||||
The revenue generated from the above customers is mainly from the segments of Assembly and LCDD.
| 5. | Operating costs and expenses |
| 2015 | 2016 | 2017 | 2017 | |||||||||||||
| NT$000 | NT$000 | NT$000 | US$000 | |||||||||||||
|
Change of finished goods and work in process |
7,899 | (19,498 | ) | 31,977 | 1,079 | |||||||||||
|
Consumption of raw materials and supplies |
3,271,581 | 3,346,540 | 3,036,350 | 102,441 | ||||||||||||
|
Employee benefit expenses |
5,358,962 | 5,317,125 | 5,895,778 | 198,913 | ||||||||||||
|
Depreciation and amortization |
2,903,221 | 3,089,904 | 2,899,278 | 97,816 | ||||||||||||
|
Other expenses |
4,752,050 | 4,745,253 | 4,530,425 | 152,848 | ||||||||||||
|
|
|
|
|
|
|
|
|
|||||||||
|
Total operating costs and expenses |
16,293,713 | 16,479,324 | 16,393,808 | 553,097 | ||||||||||||
|
|
|
|
|
|
|
|
|
|||||||||
|
Employee benefit expenses |
||||||||||||||||
|
Salaries |
4,300,550 | 4,126,203 | 4,874,709 | 164,464 | ||||||||||||
|
Labor and health insurance |
355,331 | 351,232 | 390,788 | 13,184 | ||||||||||||
|
Pension |
179,665 | 183,293 | 198,502 | 6,697 | ||||||||||||
|
Share-based payments |
207,242 | 356,463 | 123,021 | 4,151 | ||||||||||||
|
Other personnel expenses |
316,174 | 299,934 | 308,758 | 10,417 | ||||||||||||
|
|
|
|
|
|
|
|
|
|||||||||
| 5,358,962 | 5,317,125 | 5,895,778 | 198,913 | |||||||||||||
|
|
|
|
|
|
|
|
|
|||||||||
F-36
Table of Contents
ChipMOS TECHNOLOGIES INC. AND SUBSIDIARIES
Notes to the Consolidated Financial Statements (Continued)
December 31, 2015, 2016 and 2017
| 6. | Other operating income (expenses), net |
| 2015 | 2016 | 2017 | 2017 | |||||||||||||
| NT$000 | NT$000 | NT$000 | US$000 | |||||||||||||
|
Gain on disposal of property, plant and equipment, net |
1,562 | 2,575 | 132,777 | 4,480 | ||||||||||||
|
Impairment on property, plant and equipment |
(1,460 | ) | (8,198 | ) | (956 | ) | (32 | ) | ||||||||
|
Gain on disposal of scrapped materials |
31,870 | 30,476 | 27,940 | 943 | ||||||||||||
|
Gain on disposal of items purchased on behalf of others |
22,893 | 48,812 | 26,417 | 891 | ||||||||||||
|
Royalty income |
— | — | 11,998 | 405 | ||||||||||||
|
Insurance compensation income |
— | 7,033 | 486,858 | 16,426 | ||||||||||||
|
Others |
50,186 | 9,608 | 7,800 | 262 | ||||||||||||
|
|
|
|
|
|
|
|
|
|||||||||
| 105,051 | 90,306 | 692,834 | 23,375 | |||||||||||||
|
|
|
|
|
|
|
|
|
|||||||||
| 7. | Finance costs |
| 2015 | 2016 | 2017 | 2017 | |||||||||||||
| NT$000 | NT$000 | NT$000 | US$000 | |||||||||||||
|
Interest on bank loans |
146,003 | 157,254 | 208,486 | 7,034 | ||||||||||||
|
Interest on lease payable |
— | 212 | 708 | 24 | ||||||||||||
|
Less: Amounts capitalized in qualifying assets |
(19,382 | ) | (12,921 | ) | (18,769 | ) | (633 | ) | ||||||||
|
|
|
|
|
|
|
|
|
|||||||||
| 126,621 | 144,545 | 190,425 | 6,425 | |||||||||||||
|
Finance expense |
15,890 | 34,571 | 26,858 | 906 | ||||||||||||
|
|
|
|
|
|
|
|
|
|||||||||
| 142,511 | 179,116 | 217,283 | 7,331 | |||||||||||||
|
|
|
|
|
|
|
|
|
|||||||||
| 8. | Other non-operating income (expenses), net |
| 2015 | 2016 | 2017 | 2017 | |||||||||||||
| NT$000 | NT$000 | NT$000 | US$000 | |||||||||||||
|
Interest income |
58,862 | 38,554 | 53,123 | 1,792 | ||||||||||||
|
Foreign exchange gains (losses), net |
241,983 | (195,326 | ) | (418,970 | ) | (14,135 | ) | |||||||||
|
Impairment of available-for-sale financial assets |
(8,584 | ) | — | — | — | |||||||||||
|
Gain on disposal of financial assets at fair value through profit or loss |
11,483 | 621 | 637 | 22 | ||||||||||||
|
Gain on disposal of long-term investment in associates |
— | — | 16,929 | 571 | ||||||||||||
|
Share of profit (loss) of associates |
31,269 | 28,924 | (179,491 | ) | (6,056 | ) | ||||||||||
|
Reimbursement of ADSs service charge |
— | — | 23,707 | 800 | ||||||||||||
|
Others |
5,127 | 8,203 | 13,883 | 468 | ||||||||||||
|
|
|
|
|
|
|
|
|
|||||||||
| 340,140 | (119,024 | ) | (490,182 | ) | (16,538 | ) | ||||||||||
|
|
|
|
|
|
|
|
|
|||||||||
F-37
Table of Contents
ChipMOS TECHNOLOGIES INC. AND SUBSIDIARIES
Notes to the Consolidated Financial Statements (Continued)
December 31, 2015, 2016 and 2017
| 9. | Income tax expense |
Income tax expense arising in other jurisdictions is calculated at the rates prevailing in the relevant jurisdictions, based on existing legislation, interpretations and practices in respect thereof.
The statutory tax rates for the years ended December 31, 2015, 2016 and 2017 for ChipMOS Taiwan and ChipMOS Shanghai were 17% and 25%, respectively. The statutory tax rate for the year ended December 31, 2015 for ThaiLin was 17%.
| a) | The major components of income tax expense for the years ended December 31, 2015, 2016 and 2017 are: |
| 2015 | 2016 | 2017 | 2017 | |||||||||||||
| NT$000 | NT$000 | NT$000 | US$000 | |||||||||||||
|
Current income tax: |
||||||||||||||||
|
Current income tax on profits for the period |
720,461 | 331,144 | 125,376 | 4,230 | ||||||||||||
|
Income tax (benefit) on unappropriated retained earnings |
198,157 | (174,930 | ) | 246,684 | 8,322 | |||||||||||
|
Prior year income tax (over) under estimation |
(1,732 | ) | 4,527 | 67,885 | 2,290 | |||||||||||
|
|
|
|
|
|
|
|
|
|||||||||
|
Total current income tax |
916,886 | 160,741 | 439,945 | 14,842 | ||||||||||||
|
|
|
|
|
|
|
|
|
|||||||||
|
Deferred income tax: |
||||||||||||||||
|
Relating to origination and reversal of temporary differences |
18,969 | 16,379 | 110,542 | 3,730 | ||||||||||||
|
|
|
|
|
|
|
|
|
|||||||||
|
Total deferred income tax |
18,969 | 16,379 | 110,542 | 3,730 | ||||||||||||
|
|
|
|
|
|
|
|
|
|||||||||
|
Income tax expense reported in the consolidated statements of comprehensive income |
935,855 | 177,120 | 550,487 | 18,572 | ||||||||||||
|
|
|
|
|
|
|
|
|
|||||||||
Unappropriated retained earnings decreased by NT$5,052,343 thousand due to the capital reorganization, and accordingly the Company did not recognize an additional 10% tax on respective unappropriated retained earnings for the year 2015. Information about the capital reorganization for the year ended December 31, 2016 is provided in Note 29.
Deferred tax charged to other comprehensive income:
| 2015 | 2016 | 2017 | 2017 | |||||||||||||
| NT$000 | NT$000 | NT$000 | US$000 | |||||||||||||
|
Remeasurement of defined benefit obligations |
(7,099 | ) | (7,375 | ) | 8,642 | 292 | ||||||||||
|
|
|
|
|
|
|
|
|
|||||||||
F-38
Table of Contents
ChipMOS TECHNOLOGIES INC. AND SUBSIDIARIES
Notes to the Consolidated Financial Statements (Continued)
December 31, 2015, 2016 and 2017
| 9. | Income tax expense (continued) |
| b) | Reconciliation of income tax expense and the accounting profit before income tax: |
| 2015 | 2016 | 2017 | 2017 | |||||||||||||
| NT$000 | NT$000 | NT$000 | US$000 | |||||||||||||
|
Tax calculated based on profit before tax and statutory tax rate |
462,692 | 214,550 | 566,649 | 19,118 | ||||||||||||
|
Expenses disallowed (added) by tax regulations |
5,692 | (2,190 | ) | 10,185 | 344 | |||||||||||
|
Temporary difference not recognized as deferred tax assets |
6,522 | 1,306 | (85,168 | ) | (2,873 | ) | ||||||||||
|
Tax exempted (income) expenses by tax regulation |
(13,483 | ) | 12,057 | (256,788 | ) | (8,664 | ) | |||||||||
|
Taxable loss not recognized as deferred tax assets |
25,737 | 54,012 | — | — | ||||||||||||
|
Effect of different tax rates in countries in which the Group operates |
3,100 | 10,451 | 1,040 | 35 | ||||||||||||
|
Withholding tax |
249,170 | 57,337 | — | — | ||||||||||||
|
Prior year income tax (over) under estimation |
(1,732 | ) | 4,527 | 67,885 | 2,290 | |||||||||||
|
Income tax (benefit) on unappropriated retained earnings |
198,157 | (174,930 | ) | 246,684 | 8,322 | |||||||||||
|
|
|
|
|
|
|
|
|
|||||||||
|
Income tax expense reported in the consolidated statements of comprehensive income |
935,855 | 177,120 | 550,487 | 18,572 | ||||||||||||
|
|
|
|
|
|
|
|
|
|||||||||
F-39
Table of Contents
ChipMOS TECHNOLOGIES INC. AND SUBSIDIARIES
Notes to the Consolidated Financial Statements (Continued)
December 31, 2015, 2016 and 2017
| 9. | Income tax expense (continued) |
| c) | The details of deferred tax assets (liabilities) are as follows: |
| January 1, |
Profit and
(loss) |
Other
comprehensive income |
December 31, | December 31, | ||||||||||||||||
| NT$000 | NT$000 | NT$000 | NT$000 | US$000 | ||||||||||||||||
|
Year of 2016 |
||||||||||||||||||||
|
Deferred tax assets |
||||||||||||||||||||
|
Unrealized exchange losses |
(5,843 | ) | 5,843 | — | — | |||||||||||||||
|
Inventories |
14,823 | 11,501 | — | 26,324 | ||||||||||||||||
|
Property, plant and equipment |
3,672 | 77,197 | — | 80,869 | ||||||||||||||||
|
Deferred income |
50,423 | (9,129 | ) | — | 41,294 | |||||||||||||||
|
Provisions |
16,473 | (5,241 | ) | — | 11,232 | |||||||||||||||
|
Net defined benefit liability, non-current |
86,719 | (4,007 | ) | 7,375 | 90,087 | |||||||||||||||
|
|
|
|
|
|
|
|
|
|||||||||||||
|
Deferred tax assets |
166,267 | 76,164 | 7,375 | 249,806 | ||||||||||||||||
|
|
|
|
|
|
|
|
|
|||||||||||||
|
Deferred tax liabilities |
||||||||||||||||||||
|
Unrealized exchange gains |
— | (14,155 | ) | — | (14,155 | ) | ||||||||||||||
|
Property, plant and equipment |
— | (78,388 | ) | — | (78,388 | ) | ||||||||||||||
|
|
|
|
|
|
|
|
|
|||||||||||||
|
Deferred tax liabilities |
— | (92,543 | ) | — | (92,543 | ) | ||||||||||||||
|
|
|
|
|
|
|
|
|
|||||||||||||
|
Year of 2017 |
||||||||||||||||||||
|
Deferred tax assets |
||||||||||||||||||||
|
Unrealized exchange losses |
— | 8,167 | — | 8,167 | 276 | |||||||||||||||
|
Inventories |
26,324 | (17,192 | ) | — | 9,132 | 308 | ||||||||||||||
|
Property, plant and equipment |
80,869 | (25,375 | ) | — | 55,494 | 1,872 | ||||||||||||||
|
Deferred income |
41,294 | (1,809 | ) | — | 39,485 | 1,332 | ||||||||||||||
|
Provisions |
11,232 | 10,411 | — | 21,643 | 730 | |||||||||||||||
|
Net defined benefit liability, non-current |
90,087 | (2,994 | ) | (8,642 | ) | 78,451 | 2,647 | |||||||||||||
|
|
|
|
|
|
|
|
|
|
|
|||||||||||
|
Deferred tax assets |
249,806 | (28,792 | ) | (8,642 | ) | 212,372 | 7,165 | |||||||||||||
|
|
|
|
|
|
|
|
|
|
|
|||||||||||
|
Deferred tax liabilities |
||||||||||||||||||||
|
Unrealized exchange gains |
(14,155 | ) | 14,155 | — | — | — | ||||||||||||||
|
Property, plant and equipment |
(78,388 | ) | (95,905 | ) | — | (174,293 | ) | (5,880 | ) | |||||||||||
|
|
|
|
|
|
|
|
|
|
|
|||||||||||
|
Deferred tax liabilities |
(92,543 | ) | (81,750 | ) | — | (174,293 | ) | (5,880 | ) | |||||||||||
|
|
|
|
|
|
|
|
|
|
|
|||||||||||
F-40
Table of Contents
ChipMOS TECHNOLOGIES INC. AND SUBSIDIARIES
Notes to the Consolidated Financial Statements (Continued)
December 31, 2015, 2016 and 2017
| 9. | Income tax expense (continued) |
| d) | The Company has not recognized deductible and taxable temporary differences associated with investments as deferred tax assets and liabilities. As of December 31, 2017, the amounts of deductible and taxable temporary differences unrecognized as deferred tax assets and liabilities were NT$28,584 thousand (US$964 thousand) and NT$920,943 thousand (US$31,071 thousand), respectively. As of December 31, 2016, the amount of deductible temporary differences unrecognized as deferred tax assets was NT$534,568 thousand. |
| e) | The Company’s income tax returns through 2015 have been assessed and approved by the Tax Authority. |
| f) | The Company’s unappropriated retained earnings were all generated in and after 1998. |
| g) | The balance of the imputation tax credit account was NT$1,192,119 thousand as of December 31, 2016 and the creditable tax rate was 20.48%. With the abolishment of the imputation tax system under the amendments to the Income Tax Act promulgated in February 2018, the information on the balance of the imputation tax credit account as of December 31, 2017, is no longer disclosed. Please refer to Note 37. |
| 10. | Earnings per share (“EPS”) |
Basic EPS amounts are calculated by dividing the profit for the year attributable to equity holders of the Company by the weighted average number of ordinary shares outstanding during the year.
Diluted EPS amounts are calculated by dividing the profit attributable to equity holders of the Company by the weighted average number of ordinary shares outstanding during the year plus the weighted average number of ordinary shares that would be issued on conversion of all the dilutive potential ordinary shares into ordinary shares.
The following reflects the income and share data used in the basic and diluted EPS computations:
| 2015 | ||||||||||||
|
Amount
after income tax |
Weighted average
number of ordinary shares outstanding* |
Earnings
per share |
||||||||||
|
Basic earnings per share |
NT$000 | in thousands | NT$ | |||||||||
|
Profit (loss) attributable to: |
||||||||||||
|
Equity holders of the Company |
||||||||||||
|
- Continuing operations |
2,164,557 | 2.47 | ||||||||||
|
- Discontinued operations |
(34,233 | ) | (0.04 | ) | ||||||||
|
|
|
|
|
|||||||||
|
Equity holders of the Company |
2,130,324 | 2.43 | ||||||||||
|
Predecessors’ interests |
(291,429 | ) | (0.33 | ) | ||||||||
|
|
|
|
|
|||||||||
| 1,838,895 | 877,402 | 2.10 | ||||||||||
|
|
|
|
|
|
|
|||||||
| Diluted earnings per share | ||||||||||||
|
Employees’ bonuses |
10,867 | |||||||||||
|
Restricted shares |
27 | |||||||||||
|
|
|
|||||||||||
|
Profit (loss) attributable to: |
||||||||||||
|
Equity holders of the Company |
||||||||||||
|
- Continuing operations |
2,164,557 | 2.44 | ||||||||||
|
- Discontinued operations |
(34,233 | ) | (0.04 | ) | ||||||||
|
|
|
|
|
|||||||||
|
Equity holders of the Company |
2,130,324 | 2.40 | ||||||||||
|
Predecessors’ interests |
(291,429 | ) | (0.33 | ) | ||||||||
|
|
|
|
|
|||||||||
| 1,838,895 | 888,296 | 2.07 | ||||||||||
|
|
|
|
|
|
|
|||||||
F-41
Table of Contents
ChipMOS TECHNOLOGIES INC. AND SUBSIDIARIES
Notes to the Consolidated Financial Statements (Continued)
December 31, 2015, 2016 and 2017
| 10. | Earnings per share (“EPS”) (continued) |
| 2016 | ||||||||||||
|
Amount
after income tax |
Weighted average
number of ordinary shares outstanding* |
Earnings
per share |
||||||||||
|
Basic earnings per share |
NT$000 | In thousands | NT$ | |||||||||
|
Profit (loss) attributable to: |
||||||||||||
|
Equity holders of the Company |
||||||||||||
|
- Continuing operations |
1,829,327 | 2.13 | ||||||||||
|
- Discontinued operations |
(122,105 | ) | (0.14 | ) | ||||||||
|
|
|
|
|
|||||||||
|
Equity holders of the Company |
1,707,222 | 1.99 | ||||||||||
|
Predecessors’ interests |
(306,012 | ) | (0.35 | ) | ||||||||
|
|
|
|
|
|||||||||
| 1,401,210 | 859,644 | 1.64 | ||||||||||
|
|
|
|
|
|
|
|||||||
| Diluted earnings per share | ||||||||||||
|
Employees’ bonuses |
3,035 | |||||||||||
|
Restricted shares |
4,122 | |||||||||||
|
|
|
|||||||||||
|
Profit (loss) attributable to: |
||||||||||||
|
Equity holders of the Company |
||||||||||||
|
- Continuing operations |
1,829,327 | 2.11 | ||||||||||
|
- Discontinued operations |
(122,105 | ) | (0.14 | ) | ||||||||
|
|
|
|
|
|||||||||
|
Equity holders of the Company |
1,707,222 | 1.97 | ||||||||||
|
Predecessors’ interests |
(306,012 | ) | (0.35 | ) | ||||||||
|
|
|
|
|
|||||||||
| 1,401,210 | 866,801 | 1.62 | ||||||||||
|
|
|
|
|
|
|
|||||||
| 2017 | ||||||||||||||||
|
Amount
after income tax |
Weighted average
number of ordinary shares outstanding |
Earnings
per share |
Earnings
per share |
|||||||||||||
|
Basic earnings per share |
NT$000 | In thousands | NT$ | US$ | ||||||||||||
|
Profit attributable to: |
||||||||||||||||
|
Equity holders of the Company |
||||||||||||||||
|
- Continuing operations |
981,929 | 1.16 | 0.04 | |||||||||||||
|
- Discontinued operations |
1,814,953 | 2.14 | 0.07 | |||||||||||||
|
|
|
|
|
|
|
|||||||||||
| 2,796,882 | 846,686 | 3.30 | 0.11 | |||||||||||||
|
|
|
|
|
|
|
|
|
|||||||||
|
Diluted earnings per share |
||||||||||||||||
|
Employees’ bonuses |
14,034 | |||||||||||||||
|
Restricted shares |
5,075 | |||||||||||||||
|
|
|
|||||||||||||||
|
Profit attributable to: |
||||||||||||||||
|
Equity holders of the Company |
||||||||||||||||
|
- Continuing operations |
981,929 | 1.13 | 0.04 | |||||||||||||
|
- Discontinued operations |
1,814,953 | 2.10 | 0.07 | |||||||||||||
|
|
|
|
|
|
|
|||||||||||
| 2,796,882 | 865,795 | 3.23 | 0.11 | |||||||||||||
|
|
|
|
|
|
|
|
|
|||||||||
| * | The weighted average number of shares takes into account the weighted average effect of changes in treasury stock transaction during the year. |
F-42
Table of Contents
ChipMOS TECHNOLOGIES INC. AND SUBSIDIARIES
Notes to the Consolidated Financial Statements (Continued)
December 31, 2015, 2016 and 2017
| 11. | Dividend |
A dividend of NT$2.09 per share was approved by the shareholders of the Company on May 31, 2016. The dividend of NT$1,792,553 thousand was fully paid on December 19, 2016 to all ordinary shareholders of record at the close of business on December 3, 2016.
A distribution of NT$1.00 per share (including cash distribution from capital surplus of NT$0.70 per share) was approved by the shareholders of the Company on May 26, 2017. The distribution of NT$856,754 thousand (US$28,906 thousand) was fully paid on July 12, 2017 to all ordinary shareholders of record at the close of business on June 19, 2017.
| 12. | Available-for-sale financial assets |
|
December 31,
2016 |
December 31,
2017 |
December 31,
2017 |
||||||||||
| NT$000 | NT$000 | US$000 | ||||||||||
|
Unlisted equity investments, at cost |
79,880 | 49,474 | 1,669 | |||||||||
|
Less: Allowance for impairment losses |
(69,920 | ) | (28,584 | ) | (964 | ) | ||||||
|
|
|
|
|
|
|
|||||||
| 9,960 | 20,890 | 705 | ||||||||||
|
|
|
|
|
|
|
|||||||
Due to the operation loss and accumulated deficit of VIGOUR TECHNOLOGY Corporation (“VIGOUR”), the Company has recognized full impairment loss of its investments on VIGOUR amounted to NT$41,336 thousand (US$1,395 thousand) in prior years. Based on the Company’s assessment, considering VIGOUR is currently in liquidation process and no residual assets are expected to be available for distributions, the carrying amount of investments and accumulated impairment losses were reclassified to “Other receivables” in the fourth quarter of 2017.
As of December 31, 2016 and 2017, no available-for-sale financial assets were pledged.
F-43
Table of Contents
ChipMOS TECHNOLOGIES INC. AND SUBSIDIARIES
Notes to the Consolidated Financial Statements (Continued)
December 31, 2015, 2016 and 2017
| 13. | Investment in associates |
Details of investment in associates are as follows:
|
Country of
incorporation and business |
Measurement
method |
December 31, 2016 | December 31, 2017 | |||||||||||||||||||||
|
Investee company |
Carrying
amount |
Ownership |
Carrying
amount |
Ownership | ||||||||||||||||||||
| NT$000 | % | NT$000 | US$000 | % | ||||||||||||||||||||
|
JMC ELECTRONICS CO., LTD. (“JMC”) |
Kaohsiung
Taiwan |
Equity
method |
369,329 | 21.22 | 373,276 | 12,593 | 19.10 | |||||||||||||||||
|
ChipMOS Shanghai |
Shanghai
PRC |
Equity
method |
— | — | 3,060,056 | 103,241 | 45.02 | |||||||||||||||||
In January 2017, the Company did not participate in the capital increase of JMC, which reduced the Company’s shareholding from 21.22% to 19.10%. Given that the Company still retains significant influence by holding two seats in JMC’s Board of Directors, JMC was still recognized as “Investment in associates”. As a result of the change in shareholding, the Company recognized disposal gain from long-term investment amounted to NT$16,929 thousand (US$571 thousand) for the year ended December 31, 2017.
On November 30, 2016, the Company’s Board of Directors adopted a resolution to authorize its subsidiary, ChipMOS BVI, to dispose 54.98% of ChipMOS Shanghai’s equity. The equity transfer was completed in March 2017, and subsequently, due to the loss of control but retention of significant influence, ChipMOS Shanghai was excluded from the consolidated financial statements and was accounted for as an investment in associate. Information is provided in Note 18.
In June 2017, ChipMOS BVI participated in ChipMOS Shanghai’s increase of paid-in capital based on its shareholding and paid in total of NT$1,373,486 thousand (US$46,339 thousand).
For the years ended December 31, 2016 and 2017, the Company recognized its share of profit of investments in associates amounted to NT$28,924 thousand and share of loss of NT$179,491 thousand (US$6,056 thousand), respectively.
The tables below provide summarized financial information for the investment in associates that are material to the Group.
Statements of financial position
| JMC | ||||||||||||
|
December 31,
2016 |
December 31,
2017 |
December 31,
2017 |
||||||||||
| NT$000 | NT$000 | US$000 | ||||||||||
|
Current assets |
904,571 | 833,914 | 28,134 | |||||||||
|
Non-current assets |
876,314 | 1,161,620 | 39,191 | |||||||||
|
Current liabilities |
(258,513 | ) | (284,580 | ) | (9,601 | ) | ||||||
|
Non-current liabilities |
(2,491 | ) | (1,756 | ) | (59 | ) | ||||||
|
|
|
|
|
|
|
|||||||
|
Total net assets |
1,519,881 | 1,709,198 | 57,665 | |||||||||
|
|
|
|
|
|
|
|||||||
|
Group’s share |
322,509 | 326,456 | 11,014 | |||||||||
|
Goodwill |
46,820 | 46,820 | 1,579 | |||||||||
|
|
|
|
|
|
|
|||||||
|
Carrying amount |
369,329 | 373,276 | 12,593 | |||||||||
|
|
|
|
|
|
|
|||||||
F-44
Table of Contents
ChipMOS TECHNOLOGIES INC. AND SUBSIDIARIES
Notes to the Consolidated Financial Statements (Continued)
December 31, 2015, 2016 and 2017
| 13. | Investment in associates (continued) |
Statements of financial position
| ChipMOS Shanghai | ||||||||
|
December 31,
2017 |
December 31,
2017 |
|||||||
| NT$000 | US$000 | |||||||
|
Current assets |
3,380,641 | 114,056 | ||||||
|
Non-current assets |
2,766,839 | 93,348 | ||||||
|
Current liabilities |
(460,054 | ) | (15,521 | ) | ||||
|
Non-current liabilities |
(489,097 | ) | (16,501 | ) | ||||
|
|
|
|
|
|||||
|
Total net assets |
5,198,329 | 175,382 | ||||||
|
|
|
|
|
|||||
|
Group’s share |
2,340,506 | 78,965 | ||||||
|
Depreciable assets |
703,536 | 23,736 | ||||||
|
Goodwill |
22,118 | 746 | ||||||
|
Inter-company transactions and amortization |
(6,104 | ) | (206 | ) | ||||
|
|
|
|
|
|||||
|
Carrying amount |
3,060,056 | 103,241 | ||||||
|
|
|
|
|
|||||
Statements of comprehensive income
| JMC | ||||||||||||
| Year ended December 31, | ||||||||||||
| 2016 | 2017 | 2017 | ||||||||||
| NT$000 | NT$000 | US$000 | ||||||||||
|
Revenue |
1,667,761 | 1,322,928 | 44,633 | |||||||||
|
|
|
|
|
|
|
|||||||
|
Profit for the year from continuing operations |
136,303 | 4,414 | 149 | |||||||||
|
Other comprehensive income, net of income tax |
(627 | ) | 2,903 | 98 | ||||||||
|
|
|
|
|
|
|
|||||||
|
Total comprehensive income |
135,676 | 7,317 | 247 | |||||||||
|
|
|
|
|
|
|
|||||||
|
Dividend received from the associate |
5,730 | 14,325 | 483 | |||||||||
|
|
|
|
|
|
|
|||||||
| ChipMOS Shanghai | ||||||||
| Year ended December 31, | ||||||||
| 2017 | 2017 | |||||||
| NT$000 | US$000 | |||||||
|
Revenue |
1,141,415 | 38,509 | ||||||
|
|
|
|
|
|||||
|
Loss for the year from continuing operations |
(348,472 | ) | (11,757 | ) | ||||
|
Other comprehensive income, net of income tax |
— | — | ||||||
|
|
|
|
|
|||||
|
Total comprehensive income |
(348,472 | ) | (11,757 | ) | ||||
|
|
|
|
|
|||||
|
Dividend received from the associate |
— | — | ||||||
|
|
|
|
|
|||||
According to IFRS 5 “Non-current Assets Held for Sale and Discontinued Operations”, total comprehensive income of ChipMOS Shanghai for the three months ended March 31, 2017 was included in the Group’s consolidated statement of comprehensive income with the adjustments of ceasing to recognize depreciation and amortization expenses and the elimination of inter-company transactions. Information about discontinued operations is provided in Note 18.
F-45
Table of Contents
ChipMOS TECHNOLOGIES INC. AND SUBSIDIARIES
Notes to the Consolidated Financial Statements (Continued)
December 31, 2015, 2016 and 2017
| 14. | Property, plant and equipment, net |
| Land | Buildings |
Machinery
and equipment |
Tools |
Other
equipment |
Construction in
progress and equipment to be inspected |
Total | Total | |||||||||||||||||||||||||
| NT$000 | NT$000 | NT$000 | NT$000 | NT$000 | NT$000 | NT$000 | US$000 | |||||||||||||||||||||||||
|
January 1, 2016 |
||||||||||||||||||||||||||||||||
|
Cost |
452,738 | 10,700,236 | 45,945,380 | 3,673,636 | 3,047,001 | 826,103 | 64,645,094 | |||||||||||||||||||||||||
|
Accumulated depreciation and impairment |
— | (5,863,556 | ) | (38,602,675 | ) | (3,323,862 | ) | (2,643,441 | ) | — | (50,433,534 | ) | ||||||||||||||||||||
|
|
|
|
|
|
|
|
|
|
|
|
|
|
|
|||||||||||||||||||
| 452,738 | 4,836,680 | 7,342,705 | 349,774 | 403,560 | 826,103 | 14,211,560 | ||||||||||||||||||||||||||
|
|
|
|
|
|
|
|
|
|
|
|
|
|
|
|||||||||||||||||||
|
January 1, 2016 |
452,738 | 4,836,680 | 7,342,705 | 349,774 | 403,560 | 826,103 | 14,211,560 | |||||||||||||||||||||||||
|
Additions |
— | 255,916 | 934,913 | 358,413 | 351,850 | 2,789,903 | 4,690,995 | |||||||||||||||||||||||||
|
Disposals |
— | (51 | ) | (8,624 | ) | — | (351 | ) | — | (9,026 | ) | |||||||||||||||||||||
|
Reclassifications |
— | 372,448 | 1,509,798 | 22,882 | 37,373 | (1,942,501 | ) | — | ||||||||||||||||||||||||
|
Depreciation expenses |
— | (631,233 | ) | (2,188,976 | ) | (201,755 | ) | (206,477 | ) | — | (3,228,441 | ) | ||||||||||||||||||||
|
Impairment losses |
— | — | — | — | (8,198 | ) | — | (8,198 | ) | |||||||||||||||||||||||
|
Exchange adjustments |
— | (45,814 | ) | (18,196 | ) | (4,871 | ) | (11,134 | ) | (45,689 | ) | (125,704 | ) | |||||||||||||||||||
|
|
|
|
|
|
|
|
|
|
|
|
|
|
|
|||||||||||||||||||
|
December 31, 2016 |
452,738 | 4,787,946 | 7,571,620 | 524,443 | 566,623 | 1,627,816 | 15,531,186 | |||||||||||||||||||||||||
|
|
|
|
|
|
|
|
|
|
|
|
|
|
|
|||||||||||||||||||
|
December 31, 2016 |
||||||||||||||||||||||||||||||||
|
Cost |
452,738 | 11,183,278 | 47,002,228 | 3,999,894 | 3,353,413 | 1,627,816 | 67,619,367 | |||||||||||||||||||||||||
|
Accumulated depreciation and impairment |
— | (6,395,332 | ) | (39,430,608 | ) | (3,475,451 | ) | (2,786,790 | ) | — | (52,088,181 | ) | ||||||||||||||||||||
|
|
|
|
|
|
|
|
|
|
|
|
|
|
|
|||||||||||||||||||
| 452,738 | 4,787,946 | 7,571,620 | 524,443 | 566,623 | 1,627,816 | 15,531,186 | ||||||||||||||||||||||||||
|
Less: Property, plant and equipment classified as held for sale |
— | (710,191 | ) | (433,688 | ) | (90,460 | ) | (168,314 | ) | (631,315 | ) | (2,033,968 | ) | |||||||||||||||||||
|
|
|
|
|
|
|
|
|
|
|
|
|
|
|
|||||||||||||||||||
| 452,738 | 4,077,755 | 7,137,932 | 433,983 | 398,309 | 996,501 | 13,497,218 | ||||||||||||||||||||||||||
|
|
|
|
|
|
|
|
|
|
|
|
|
|
|
|||||||||||||||||||
|
January 1, 2017 |
||||||||||||||||||||||||||||||||
|
Cost |
452,738 | 11,183,278 | 47,002,228 | 3,999,894 | 3,353,413 | 1,627,816 | 67,619,367 | 2,281,355 | ||||||||||||||||||||||||
|
Accumulated depreciation and impairment |
— | (6,395,332 | ) | (39,430,608 | ) | (3,475,451 | ) | (2,786,790 | ) | — | (52,088,181 | ) | (1,757,361 | ) | ||||||||||||||||||
|
|
|
|
|
|
|
|
|
|
|
|
|
|
|
|
|
|||||||||||||||||
| 452,738 | 4,787,946 | 7,571,620 | 524,443 | 566,623 | 1,627,816 | 15,531,186 | 523,994 | |||||||||||||||||||||||||
|
Less: Property, plant and equipment classified as held for sale |
— | (710,191 | ) | (433,688 | ) | (90,460 | ) | (168,314 | ) | (631,315 | ) | (2,033,968 | ) | (68,622 | ) | |||||||||||||||||
|
|
|
|
|
|
|
|
|
|
|
|
|
|
|
|
|
|||||||||||||||||
| 452,738 | 4,077,755 | 7,137,932 | 433,983 | 398,309 | 996,501 | 13,497,218 | 455,372 | |||||||||||||||||||||||||
|
|
|
|
|
|
|
|
|
|
|
|
|
|
|
|
|
|||||||||||||||||
|
January 1, 2017 |
452,738 | 4,077,755 | 7,137,932 | 433,983 | 398,309 | 996,501 | 13,497,218 | 455,372 | ||||||||||||||||||||||||
|
Additions |
— | 211,098 | 2,007,767 | 571,601 | 195,957 | 1,716,268 | 4,702,691 | 158,660 | ||||||||||||||||||||||||
|
Disposals |
— | — | (30,066 | ) | (2,302 | ) | (1,865 | ) | — | (34,233 | ) | (1,155 | ) | |||||||||||||||||||
|
Reclassifications |
— | 141,400 | 1,535,619 | 44,882 | 22,149 | (1,744,050 | ) | — | — | |||||||||||||||||||||||
|
Depreciation expenses |
— | (511,167 | ) | (1,837,482 | ) | (357,695 | ) | (192,934 | ) | — | (2,899,278 | ) | (97,816 | ) | ||||||||||||||||||
|
Impairment losses |
— | — | — | — | (956 | ) | — | (956 | ) | (32 | ) | |||||||||||||||||||||
|
Exchange adjustments |
— | — | (43 | ) | — | (88 | ) | — | (131 | ) | (5 | ) | ||||||||||||||||||||
|
|
|
|
|
|
|
|
|
|
|
|
|
|
|
|
|
|||||||||||||||||
|
December 31, 2017 |
452,738 | 3,919,086 | 8,813,727 | 690,469 | 420,572 | 968,719 | 15,265,311 | 515,024 | ||||||||||||||||||||||||
|
|
|
|
|
|
|
|
|
|
|
|
|
|
|
|
|
|||||||||||||||||
|
December 31, 2017 |
||||||||||||||||||||||||||||||||
|
Cost |
452,738 | 9,809,970 | 45,778,207 | 4,004,703 | 2,624,083 | 968,719 | 63,638,420 | 2,147,045 | ||||||||||||||||||||||||
|
Accumulated depreciation and impairment |
— | (5,890,884 | ) | (36,964,480 | ) | (3,314,234 | ) | (2,203,511 | ) | — | (48,373,109 | ) | (1,632,021 | ) | ||||||||||||||||||
|
|
|
|
|
|
|
|
|
|
|
|
|
|
|
|
|
|||||||||||||||||
| 452,738 | 3,919,086 | 8,813,727 | 690,469 | 420,572 | 968,719 | 15,265,311 | 515,024 | |||||||||||||||||||||||||
|
|
|
|
|
|
|
|
|
|
|
|
|
|
|
|
|
|||||||||||||||||
F-46
Table of Contents
ChipMOS TECHNOLOGIES INC. AND SUBSIDIARIES
Notes to the Consolidated Financial Statements (Continued)
December 31, 2015, 2016 and 2017
| 14. | Property, plant and equipment, net (continued) |
As of December 31, 2016 and 2017, certain of the above property, plant and equipment were pledged as collateral for long-term bank loans (Notes 32).
| 2016 | 2017 | 2017 | ||||||||||
| NT$000 | NT$000 | US$000 | ||||||||||
|
Capitalization interest |
13,435 | 18,769 | 633 | |||||||||
|
Capitalization interest rate applied |
1.7456%~3.6166% | 1.7624% | 1.7624% | |||||||||
| 15. | Inventories |
| December 31, 2016 | ||||||||||||
| Cost |
Allowance for
impairment losses |
Carrying amount | ||||||||||
| NT$000 | NT$000 | NT$000 | ||||||||||
|
Raw materials |
1,787,810 | (140,463 | ) | 1,647,347 | ||||||||
|
Work in process |
190,823 | (14,203 | ) | 176,620 | ||||||||
|
Finished goods |
54,190 | (175 | ) | 54,015 | ||||||||
|
|
|
|
|
|
|
|||||||
| 2,032,823 | (154,841 | ) | 1,877,982 | |||||||||
|
|
|
|
|
|
|
|||||||
| December 31, 2017 | ||||||||||||||||
| Cost |
Allowance for
impairment losses |
Carrying amount | ||||||||||||||
| NT$000 | NT$000 | NT$000 | US$000 | |||||||||||||
|
Raw materials |
1,769,917 | (49,183 | ) | 1,720,734 | 58,054 | |||||||||||
|
Work in process |
180,252 | (4,163 | ) | 176,089 | 5,941 | |||||||||||
|
Finished goods |
32,784 | (368 | ) | 32,416 | 1,094 | |||||||||||
|
|
|
|
|
|
|
|
|
|||||||||
| 1,982,953 | (53,714 | ) | 1,929,239 | 65,089 | ||||||||||||
|
|
|
|
|
|
|
|
|
|||||||||
The cost of inventories recognized as an expense for the year:
| 2016 | 2017 | 2017 | ||||||||||
| NT$000 | NT$000 | US$000 | ||||||||||
|
Cost of revenue |
14,670,711 | 14,766,555 | 498,197 | |||||||||
|
Loss on abandonment |
7,098 | 38,301 | 1,292 | |||||||||
|
Allowance for (reversal of) inventory valuation and obsolescence loss |
67,663 | (101,127 | ) | (3,412 | ) | |||||||
|
|
|
|
|
|
|
|||||||
| 14,745,472 | 14,703,729 | 496,077 | ||||||||||
|
|
|
|
|
|
|
|||||||
Raw materials are utilized throughout the course of provision of semiconductor bumping, assembly and testing services. Items used for manufacturing and product sales are insignificant.
Reversal of allowance for inventory valuation loss was recognized due to the change in market value of replacement costs.
As of December 31, 2016 and 2017, no inventories were pledged.
F-47
Table of Contents
ChipMOS TECHNOLOGIES INC. AND SUBSIDIARIES
Notes to the Consolidated Financial Statements (Continued)
December 31, 2015, 2016 and 2017
| 16. | Accounts and notes and other receivables |
|
December 31,
2016 |
December 31,
2017 |
December 31,
2017 |
||||||||||
| NT$000 | NT$000 | US$000 | ||||||||||
|
Accounts receivable |
4,138,580 | 4,013,705 | 135,415 | |||||||||
|
Notes receivable |
1,753 | 2,029 | 69 | |||||||||
|
Less: Allowance for impairment losses |
(87 | ) | — | — | ||||||||
|
|
|
|
|
|
|
|||||||
| 4,140,246 | 4,015,734 | 135,484 | ||||||||||
|
|
|
|
|
|
|
|||||||
|
Other receivables |
57,411 | 56,716 | 1,914 | |||||||||
|
Less: Allowance for impairment losses |
— | — | — | |||||||||
|
|
|
|
|
|
|
|||||||
| 57,411 | 56,716 | 1,914 | ||||||||||
|
|
|
|
|
|
|
|||||||
| 4,197,657 | 4,072,450 | 137,398 | ||||||||||
|
|
|
|
|
|
|
|||||||
As of December 31, 2016 and 2017, no accounts and notes and other receivables were pledged.
The movements in allowance for impairment of accounts and other receivables during the years are as follows:
| Accounts receivable | Other receivables | |||||||
| NT$000 | NT$000 | |||||||
|
January 1, 2016 |
— | — | ||||||
|
Impairment losses recognized |
87 | — | ||||||
|
|
|
|
|
|||||
|
December 31, 2016 |
87 | — | ||||||
|
Reversal of allowance for impairment losses |
(87 | ) | — | |||||
|
|
|
|
|
|||||
|
December 31, 2017 |
— | — | ||||||
|
|
|
|
|
|||||
|
December 31, 2017 (US$000) |
— | — | ||||||
|
|
|
|
|
|||||
Receivables that were neither past due nor impaired relate to a large number of diversified customers for whom there was no recent history of default.
Receivables that were past due but not impaired relate to a number of independent customers that have a good track record with the Group. Based on past experience, the management of the Company are of the opinion that no provision for impairment is necessary in respect of these balances as there has not been a significant change in credit quality and the balances are still considered fully recoverable.
The individually impaired receivables related to customers that were in financial difficulties or other factors, e.g. the customers were in default or delinquency in interest or principal payments and only a portion of the receivables is expected to be recovered.
The Group’s accounts receivable that were neither past due nor impaired were fully performed in line with the credit standards prescribed based on counterparties’ industrial characteristics, scale of business and profitability.
F-48
Table of Contents
ChipMOS TECHNOLOGIES INC. AND SUBSIDIARIES
Notes to the Consolidated Financial Statements (Continued)
December 31, 2015, 2016 and 2017
| 16. | Accounts and notes and other receivables (continued) |
Ageing of accounts receivable which are past due but not impaired is as follows:
|
December 31,
2016 |
December 31,
2017 |
December 31,
2017 |
||||||||||
| NT$000 | NT$000 | US$000 | ||||||||||
|
£ 1 month |
24,141 | 10,482 | 354 | |||||||||
|
1 – 2 months |
728 | 477 | 16 | |||||||||
|
2 – 3 months |
183 | 426 | 14 | |||||||||
|
3 – 4 months |
245 | 1,431 | 48 | |||||||||
|
> 4 months |
2,013 | 3,056 | 103 | |||||||||
|
|
|
|
|
|
|
|||||||
| 27,310 | 15,872 | 535 | ||||||||||
|
|
|
|
|
|
|
|||||||
| 17. | Cash and cash equivalents |
|
December 31,
2016 |
December 31,
2017 |
December 31,
2017 |
||||||||||
| NT$000 | NT$000 | US$000 | ||||||||||
|
Short-term deposits |
3,854,354 | 3,883,614 | 131,026 | |||||||||
|
Cash |
525 | 470 | 16 | |||||||||
|
Cash at banks |
4,106,384 | 4,151,630 | 140,068 | |||||||||
|
|
|
|
|
|
|
|||||||
| 7,961,263 | 8,035,714 | 271,110 | ||||||||||
|
Less: Cash and cash equivalents classified as non-current assets held for sale |
(389,897 | ) | — | — | ||||||||
|
|
|
|
|
|
|
|||||||
| 7,571,366 | 8,035,714 | 271,110 | ||||||||||
|
|
|
|
|
|
|
|||||||
The cash and cash equivalents of ChipMOS Shanghai as of December 31, 2016, amounted to NT$389,897 thousand was classified and shown as “Non-current assets held for sale”. Information is provided in Note 18.
Cash at banks earns interest at floating rates based on daily bank deposit rates. Short-term deposits are made for varying periods of between 31 days and 3 months, depending on the immediate cash requirements of the Group, and earn interest at the respective short-term deposit rates.
As of December 31, 2016 and 2017, no cash and cash equivalents were pledged.
F-49
Table of Contents
ChipMOS TECHNOLOGIES INC. AND SUBSIDIARIES
Notes to the Consolidated Financial Statements (Continued)
December 31, 2015, 2016 and 2017
| 18. | Non-current assets held for sale and discontinued operations |
| a) | The assets and liabilities related to ChipMOS Shanghai have been classified as non-current assets held for sale and liabilities directly related to non-current assets held for sale and presented as discontinued operations for meeting the definition of discontinued operations following the resolution of the Company’s Board of Directors on November 30, 2016 to sell 54.98% of ChipMOS Shanghai’s equity interest. The transaction was completed in March 2017, and subsequently, due to the loss of control but retention of significant influence, ChipMOS Shanghai was excluded from the consolidated financial statements and recorded as “Investments in associates”. Please refer to Note 13 for more details. |
In March 2017, the Company received NT$2,230,544 thousand (US$75,255 thousand) in cash and recognized total gain on disposal of discontinued operations amounted to NT$1,843,234 thousand (US$62,187 thousand). Based on the fair value received and the book value of its investment, gain on disposal of 54.98% equity interest is equal to NT$999,630 thousand (US$33,726 thousand) and gain on fair value remeasurement of 45.02% retained investment is equal to NT$843,604 thousand (US$28,461 thousand).
| b) | The cash flow information of the discontinued operations is as follows: |
| 2015 | 2016 | 2017 | 2017 | |||||||||||||
| NT$000 | NT$000 | NT$000 | US$000 | |||||||||||||
|
Net cash generated from (used in) operating activities |
1,072,628 | (1,109,029 | ) | (109,079 | ) | (3,680 | ) | |||||||||
|
Net cash used in investing activities |
(205,292 | ) | (1,331,564 | ) | (272,925 | ) | (9,208 | ) | ||||||||
|
Net cash generated from (used in) financing activities |
(91,234 | ) | 1,463,664 | 461,312 | 15,564 | |||||||||||
|
Effect of foreign exchange rate changes |
(18,636 | ) | (61,336 | ) | (19,874 | ) | (671 | ) | ||||||||
|
|
|
|
|
|
|
|
|
|||||||||
|
Net increase (decrease) in cash and cash equivalents |
757,466 | (1,038,265 | ) | 59,434 | 2,005 | |||||||||||
|
|
|
|
|
|
|
|
|
|||||||||
| c) | Assets of disposal group classified as non-current assets held for sale: |
| December 31, | ||||
| 2016 | ||||
| NT$000 | ||||
|
Cash and cash equivalents |
389,897 | |||
|
Accounts receivable |
230,523 | |||
|
Other receivables |
202,909 | |||
|
Inventories |
136,842 | |||
|
Prepayments |
15,943 | |||
|
Other current financial assets |
1,193 | |||
|
Property, plant and equipment, net |
2,033,968 | |||
|
Refundable deposits |
113 | |||
|
Prepaid rent – non-current portion |
82,291 | |||
|
Other non-current assets |
11,392 | |||
|
|
|
|||
| 3,105,071 | ||||
|
|
|
|||
F-50
Table of Contents
ChipMOS TECHNOLOGIES INC. AND SUBSIDIARIES
Notes to the Consolidated Financial Statements (Continued)
December 31, 2015, 2016 and 2017
| 18. | Non-current assets held for sale and discontinued operations (continued) |
| d) | Liabilities of disposal group classified as liabilities directly related to non-current assets held for sale : |
| December 31, | ||||
| 2016 | ||||
| NT$000 | ||||
|
Accounts payable |
98,973 | |||
|
Other payables |
177,178 | |||
|
Receipts in advance |
6,687 | |||
|
Bank loans – current portion |
7,614 | |||
|
Lease payable – current |
27,702 | |||
|
Other current liabilities |
34,276 | |||
|
Bank loans – non-current |
106,461 | |||
|
Lease payable – non-current |
27,702 | |||
|
Long-term deferred revenue |
100,395 | |||
|
Guarantee deposits |
651 | |||
|
|
|
|||
| 587,639 | ||||
|
|
|
|||
| e) | Equity of disposal group classified as amounts recognized in other comprehensive income and accumulated in equity relating to non-current assets held for sale : |
| December 31, | ||||
| 2016 | ||||
| NT$000 | ||||
|
Foreign currency translation reserve |
287,645 | |||
|
|
|
|||
| f) | Cumulative income or expense recognized in other comprehensive income relating to disposal group classified as held for sale: |
| 2015 | 2016 | 2017 | 2017 | |||||||||||||
| NT$000 | NT$000 | NT$000 | US$000 | |||||||||||||
|
Exchange differences on translation of foreign operations |
(27,893 | ) | (195,972 | ) | (287,645 | ) | (9,705 | ) | ||||||||
|
|
|
|
|
|
|
|
|
|||||||||
| g) | The results of discontinued operations are as follows: |
| 2015 | 2016 | 2017 | 2017 | |||||||||||||
| NT$000 | NT$000 | NT$000 | US$000 | |||||||||||||
|
Revenue |
1,032,302 | 1,005,166 | 227,095 | 7,662 | ||||||||||||
|
Cost of revenue |
(1,050,075 | ) | (986,004 | ) | (195,078 | ) | (6,582 | ) | ||||||||
|
Operating expenses |
(51,910 | ) | (179,178 | ) | (58,840 | ) | (1,985 | ) | ||||||||
|
Other operating income (expenses), net |
8,469 | 13,753 | 1,429 | 48 | ||||||||||||
|
Non-operating income (expenses), net |
26,981 | 24,158 | (2,887 | ) | (97 | ) | ||||||||||
|
|
|
|
|
|
|
|
|
|||||||||
|
Loss from discontinued operations before income tax |
(34,233 | ) | (122,105 | ) | (28,281 | ) | (954 | ) | ||||||||
|
Income tax expense |
— | — | — | — | ||||||||||||
|
|
|
|
|
|
|
|
|
|||||||||
|
Loss from discontinued operations after income tax |
(34,233 | ) | (122,105 | ) | (28,281 | ) | (954 | ) | ||||||||
|
Gain on disposal of discontinued operations |
— | — | 1,843,234 | 62,187 | ||||||||||||
|
|
|
|
|
|
|
|
|
|||||||||
|
Profit (loss) from discontinued operations |
(34,233 | ) | (122,105 | ) | 1,814,953 | 61,233 | ||||||||||
|
|
|
|
|
|
|
|
|
|||||||||
Discontinued operations’ revenue is mainly from the segments of testing and assembly.
F-51
Table of Contents
ChipMOS TECHNOLOGIES INC. AND SUBSIDIARIES
Notes to the Consolidated Financial Statements (Continued)
December 31, 2015, 2016 and 2017
| 19. | Issued capital |
|
December 31,
2015 |
December 31,
2016 |
December 31,
2017 |
||||||||||
| in thousands | in thousands | in thousands | ||||||||||
|
Authorized shares |
||||||||||||
|
Ordinary shares |
970,000 | 1,450,000 | 970,000 | |||||||||
|
December 31,
2015 |
December 31,
2016 |
December 31,
2017 |
||||||||||
| in thousands | in thousands | in thousands | ||||||||||
|
Ordinary shares issued and fully paid |
||||||||||||
|
Ordinary shares |
896,206 | 886,966 | 886,297 | |||||||||
|
|
|
|
|
|
|
|||||||
|
Issued capital (NT$000) |
8,962,066 | 8,869,663 | 8,862,971 | |||||||||
|
|
|
|
|
|
|
|||||||
|
|
(US$299,021
thousand |
) |
||||||||||
The par value of ordinary shares issued was NT$10 per share.
The movement of ordinary shares issued is set out below:
| 2015 | 2016 | 2017 | ||||||||||
| in thousands | in thousands | in thousands | ||||||||||
|
January 1 |
864,619 | 896,206 | 886,966 | |||||||||
|
Transactions with non-controlling interests (Note 28) |
35,932 | — | — | |||||||||
|
Restricted shares |
15,752 | 435 | — | |||||||||
|
Unearned restricted shares – cancelled |
(97 | ) | — | (669 | ) | |||||||
|
Share cancellation |
(20,000 | ) | — | — | ||||||||
|
Issuance of ordinary shares for capital reorganization (Note 29) |
— | 512,405 | — | |||||||||
|
Cancellation of ordinary shares from capital reorganization (Note 29) |
— | (522,080 | ) | — | ||||||||
|
|
|
|
|
|
|
|||||||
|
December 31 |
896,206 | 886,966 | 886,297 | |||||||||
|
|
|
|
|
|
|
|||||||
On June 17, 2015, ThaiLin merged with the Company, with the latter being the surviving entity and issued 35,932 thousand ordinary shares in order to exchange for the shares of ThaiLin. Information about the merge is provided in Note 28.
The Board of Directors approved the issuance of restricted shares on July 14, 2015 (Refer to Note 35). Other than the vesting conditions, the rights and obligations of these shares issued are the same as those of other issued ordinary shares.
On August 10, 2015, the Board of Directors of the Company approved a share repurchase program for repurchase of ordinary shares by the Company of up to NT$826,800 thousand. As of December 31, 2015, 20,000 thousand shares were repurchased and recorded as treasury stock and all the repurchased shares were retired and cancelled.
F-52
Table of Contents
ChipMOS TECHNOLOGIES INC. AND SUBSIDIARIES
Notes to the Consolidated Financial Statements (Continued)
December 31, 2015, 2016 and 2017
| 19. | Issued capital (continued) |
On February 4, 2016 and May 12, 2016, the Board of Directors of the Company approved the share repurchase programs for repurchase of ordinary shares by the Company of up to NT$600 million and NT$600 million, respectively. As of December 31, 2016 and 2017, 30,000 thousand shares were repurchased and recorded as treasury stock.
On October 31, 2016, the Company’s former parent company, ChipMOS Bermuda was merged with and into the Company, with the latter being the surviving company. Please refer to Note 29 for details of the capital reorganization. Pursuant to the Merger, the Company issued 25,620,267 units of ADSs, which were listed on the NASDAQ Global Select Market, and each ADS represents 20 ordinary shares of the Company. As of December 31, 2017, the outstanding ADSs were 9,431,486 units representing 188,630 thousand ordinary shares of the Company. Major terms and conditions of the ADSs are summarized as follows:
| a) | Voting rights: |
ADSs holders will have no right to vote directly in shareholders’ meetings with respect to the deposited shares. The depository bank shall vote on behalf of the ADSs holders or provide voting instruction to the designated person of the Company. The depository bank shall vote in the manner as instructed from the ADSs holders.
| b) | Distribution of dividends: |
ADSs holders are deemed to have the same rights as holders of ordinary shares with respect to the distribution of dividends.
| 20. | Capital surplus and retained earnings |
The reconciliation between the opening and closing balances of each component of the Group’s consolidated equity is set out in the consolidated statements of changes in equity.
| a) | Capital surplus |
Details of the Group’s capital surplus are set out below:
|
December 31,
2015 |
December 31,
2016 |
December 31,
2017 |
December 31,
2017 |
|||||||||||||
| NT$000 | NT$000 | NT$000 | US$000 | |||||||||||||
|
Share premium |
2,501,767 | 6,473,471 | 5,873,743 | 198,169 | ||||||||||||
|
Share-based payment |
849,482 | — | — | — | ||||||||||||
|
Restricted shares |
397,296 | 408,051 | 390,401 | 13,171 | ||||||||||||
|
Others |
7,304 | 7,304 | 7,304 | 247 | ||||||||||||
|
|
|
|
|
|
|
|
|
|||||||||
| 3,755,849 | 6,888,826 | 6,271,448 | 211,587 | |||||||||||||
|
|
|
|
|
|
|
|
|
|||||||||
Pursuant to the ROC Company Act, capital surplus arising from paid-in capital in excess of par value on issuance of ordinary shares and donations can be used to cover accumulated deficit or to issue new stocks or cash to shareholders in proportion to their share ownership, provided that the Company has no accumulated deficit. Further, the ROC Securities and Exchange Act requires that the amount of capital surplus to be capitalized mentioned above should not exceed 10% of the paid-in capital each year. Capital surplus should not be used to cover accumulated deficit unless the legal reserve is insufficient.
F-53
Table of Contents
ChipMOS TECHNOLOGIES INC. AND SUBSIDIARIES
Notes to the Consolidated Financial Statements (Continued)
December 31, 2015, 2016 and 2017
| 20. | Capital surplus and retained earnings (continued) |
| b) | Retained earnings |
| (a) | According to the Company’s Articles of Incorporation, current year’s earnings before tax, if any, shall be distributed in the following order: |
| i) | Pay all taxes and duties; |
| ii) | Offset prior years’ operating losses, if any; |
| iii) | Set aside 10% of the remaining amount after deducting i) and ii) as legal reserve; |
| iv) | After items i), ii) and iii) were deducted, the remaining amount may be distributed as shareholders’ dividend. |
| (b) | The Company’s dividend policy is summarized below: as the Company operates in a volatile business environment, the dividend is distributed taking into consideration the Company’s financial structure, operating results and future expansion plans. The earnings distribution of the Company may be made by way of cash dividend or stock dividend; provided that cash dividends shall account for at least 10% of the total dividends distributed. The earnings distribution will be proposed by the Board of Directors and approved at the shareholders’ meeting. |
| (c) | Legal reserve can only be used to offset deficits or increase capital in issuing ordinary shares or in distribution cash. The amount of legal reserve that may be used to increase capital or distribute cash shall be limited to the portion of the reserve balance exceeding 25% of the capital stock. |
| (d) | In accordance with the ROC Securities and Future Bureau regulations, in addition to legal reserve, the Company should set aside a special reserve in an amount equal to the net change in the reduction of prior year’s shareholders’ equity, resulting from adjustments. Such special reserve is not available for dividend distribution. In the subsequent year(s), if the year-end balances no longer had a net reduction in the shareholders’ equity, the special reserve previously set aside will then be available for distribution. |
| (e) | The distribution of 2014, 2015 and 2016 were resolved at the shareholders’ meetings on June 3, 2015 and May 31, 2016 and May 26, 2017, respectively. Details are summarized below: |
| 2014 | 2015 | 2016 | ||||||||||||||||||||||
| Amount |
Distribution
per share |
Amount |
Distribution
per share |
Amount |
Distribution
per share |
|||||||||||||||||||
| NT$000 | NT$ | NT$000 | NT$ | NT$000 | NT$ | |||||||||||||||||||
|
Legal reserve |
331,863 | — | 223,047 | — | 28,680 | — | ||||||||||||||||||
|
Cash dividend |
1,999,225 | 2.22 | 1,792,553 | 2.09 | 257,026 | 0.30 | ||||||||||||||||||
|
Cash distribution from capital surplus |
— | — | — | — | 599,728 | 0.70 | ||||||||||||||||||
F-54
Table of Contents
ChipMOS TECHNOLOGIES INC. AND SUBSIDIARIES
Notes to the Consolidated Financial Statements (Continued)
December 31, 2015, 2016 and 2017
| 21. | Treasury stock |
The movement of treasury stock is set out below:
| 2015 | 2016 | 2017 | ||||||||||||||||||||||||||
|
Shares (in
thousands) |
Amount
(NT$000) |
Shares (in
thousands) |
Amount
(NT$000) |
Shares (in
thousands) |
Amount
(NT$000) |
Amount
(US$000) |
||||||||||||||||||||||
|
January 1 |
— | — | — | — | 30,085 | 1,007,654 | 33,997 | |||||||||||||||||||||
|
Treasury stock (repurchased) |
20,000 | 633,737 | 30,085 | 1,007,654 | — | — | — | |||||||||||||||||||||
|
Treasury stock (cancelled) |
(20,000 | ) | (633,737 | ) | — | — | — | — | — | |||||||||||||||||||
|
|
|
|
|
|
|
|
|
|
|
|
|
|
|
|||||||||||||||
|
December 31 |
— | — | 30,085 | 1,007,654 | 30,085 | 1,007,654 | 33,997 | |||||||||||||||||||||
|
|
|
|
|
|
|
|
|
|
|
|
|
|
|
|||||||||||||||
Pursuant to the ROC Securities and Exchange Act, the number of shares repurchased as treasury stock should not exceed 10% of the number of the Company’s issued and outstanding shares and the amount repurchased should not exceed the sum of retained earnings, paid-in capital in excess of par value and realized capital surplus.
Pursuant to the ROC Securities and Exchange Act, treasury stock should not be pledged as collateral and is not entitled to dividends before it is reissued.
| 22. | Long-term bank loans |
| Type of loans |
Period and payment term |
December 31,
2016 |
December 31,
2017 |
December 31,
2017 |
||||||||||
| NT$000 | NT$000 | US$000 | ||||||||||||
|
Syndicated bank loan |
Borrowing period is from June 30, 2016 to June 30, 2021; interest is repayable monthly; principal is repayable semi-annually from December 30, 2017. | 10,800,000 | 9,675,301 | 326,427 | ||||||||||
|
Less: Fee on syndicated bank loan |
(49,995 | ) | (33,280 | ) | (1,122 | ) | ||||||||
|
Less: Current portion (fee included) |
(1,062,285 | ) | (2,143,168 | ) | (72,307 | ) | ||||||||
|
|
|
|
|
|
|
|||||||||
| 9,687,720 | 7,498,853 | 252,998 | ||||||||||||
|
|
|
|
|
|
|
|||||||||
|
Interest rate range |
1.7895 | % | 1.7895 | % | 1.7895 | % | ||||||||
|
|
|
|
|
|
|
|||||||||
|
Unused credit lines of long-term bank loans NT$000 |
2,400,000 | 2,400,000 | ||||||||||||
|
|
|
|
|
|||||||||||
F-55
Table of Contents
ChipMOS TECHNOLOGIES INC. AND SUBSIDIARIES
Notes to the Consolidated Financial Statements (Continued)
December 31, 2015, 2016 and 2017
| 22. | Long-term bank loans (continued) |
On May 16, 2016, the Company entered into a syndicated loan with ten banks in Taiwan, including Land Bank of Taiwan, in the amount of NT$13.2 billion with a term of five years. Funding from this syndicated loan was used to repay the prior syndicated loan in 2014 and broaden the Company’s working capital. Pursuant to the syndicated loan agreement, the Group is required to maintain certain financial ratios including current ratio, interest protection multiples and debt to equity ratio during the loan periods.
As of December 31, 2016 and 2017, the Group was in compliance with the financial ratio requirements.
The Group’s bank loans are mortgaged by certain land, buildings and equipment as collateral (Note 32).
Details of the repayment schedule in respect of the bank loans are as follows:
|
December 31,
2016 |
December 31,
2017 |
December 31,
2017 |
||||||||||
| NT$000 | NT$000 | US$000 | ||||||||||
|
Less than 1 year |
1,062,285 | 2,143,168 | 72,307 | |||||||||
|
2 to 5 years |
9,687,720 | 7,498,853 | 252,998 | |||||||||
|
|
|
|
|
|
|
|||||||
| 10,750,005 | 9,642,021 | 325,305 | ||||||||||
|
|
|
|
|
|
|
|||||||
| 23. | Retirement benefit plans |
| a) | Defined benefit plans |
| (a) | The Company has a defined benefit pension plan in accordance with the Labor Standards Act, covering all regular employees’ service years prior to the enforcement of the Labor Pension Act on July 1, 2005 and service years thereafter of employees who chose to continue to be subject to the pension mechanism under the Act. Under the defined benefit pension plan, two units are accrued for each year of service for the first 15 years and one unit for each additional year thereafter, subject to a maximum of 45 units. Pension benefits are based on the number of units accrued and the average monthly salaries and wages of the last 6 months prior to retirement. |
The Company contributes monthly an amount equal to 2% of the employees’ monthly salaries and wages to the pension fund deposited with Bank of Taiwan, the trustee, under the name of the independent pension fund committee. Also, the Company would assess the balance in the aforementioned labor pension reserve account by the end of every year. If the account balance is insufficient to pay the pension calculated by the aforementioned method, to the labors expected to be qualified for retirement next year, the Company will make contribution to cover the deficit by March of following year.
F-56
Table of Contents
ChipMOS TECHNOLOGIES INC. AND SUBSIDIARIES
Notes to the Consolidated Financial Statements (Continued)
December 31, 2015, 2016 and 2017
| 23. | Retirement benefit plans (continued) |
| a) | Defined benefit plans (continued) |
| (b) | The amounts recognized in the statements of financial position are as follows: |
|
December 31,
2016 |
December 31,
2017 |
December 31,
2017 |
||||||||||
| NT$000 | NT$000 | US$000 | ||||||||||
|
Present value of defined benefit obligations |
(894,163 | ) | (838,543 | ) | (28,291 | ) | ||||||
|
Fair value of plan assets |
347,195 | 360,017 | 12,146 | |||||||||
|
|
|
|
|
|
|
|||||||
|
Net defined benefit liability |
(546,968 | ) | (478,526 | ) | (16,145 | ) | ||||||
|
|
|
|
|
|
|
|||||||
| (c) | Movements in net defined benefit liability are as follows: |
| 2016 | ||||||||||||
|
Present value of
defined benefit obligations |
Fair value of
plan assets |
Net defined
benefit liability |
||||||||||
| NT$000 | NT$000 | NT$000 | ||||||||||
|
January 1 |
(844,166 | ) | 324,695 | (519,471 | ) | |||||||
|
Current service cost |
(321 | ) | — | (321 | ) | |||||||
|
Interest (expense) income |
(14,644 | ) | 5,768 | (8,876 | ) | |||||||
|
|
|
|
|
|
|
|||||||
| (859,131 | ) | 330,463 | (528,668 | ) | ||||||||
|
|
|
|
|
|
|
|||||||
|
Remeasurements: |
||||||||||||
|
Return of plan assets (not including the amount included in interest income or expense) |
— | (3,413 | ) | (3,413 | ) | |||||||
|
Financial assumption movement effect |
(31,294 | ) | — | (31,294 | ) | |||||||
|
Experience adjustments |
(8,676 | ) | — | (8,676 | ) | |||||||
|
|
|
|
|
|
|
|||||||
| (39,970 | ) | (3,413 | ) | (43,383 | ) | |||||||
|
|
|
|
|
|
|
|||||||
|
Pension fund contribution |
— | 25,083 | 25,083 | |||||||||
|
Paid pension |
4,938 | (4,938 | ) | — | ||||||||
|
|
|
|
|
|
|
|||||||
|
December 31 |
(894,163 | ) | 347,195 | (546,968 | ) | |||||||
|
|
|
|
|
|
|
|||||||
| 2017 | ||||||||||||||||
|
Present value of
defined benefit obligations |
Fair value of
plan assets |
Net defined
benefit liability |
Net defined
benefit liability |
|||||||||||||
| NT$000 | NT$000 | NT$000 | US$000 | |||||||||||||
|
January 1 |
(894,163 | ) | 347,195 | (546,968 | ) | (18,454 | ) | |||||||||
|
Current service cost |
(386 | ) | — | (386 | ) | (13 | ) | |||||||||
|
Interest (expense) income |
(13,236 | ) | 5,226 | (8,010 | ) | (270 | ) | |||||||||
|
|
|
|
|
|
|
|
|
|||||||||
| (907,785 | ) | 352,421 | (555,364 | ) | (18,737 | ) | ||||||||||
|
|
|
|
|
|
|
|
|
|||||||||
|
Remeasurements: |
||||||||||||||||
|
Return of plan assets (not including the amount included in interest income or expense) |
— | (1,842 | ) | (1,842 | ) | (62 | ) | |||||||||
|
Financial assumption movement effect |
28,506 | — | 28,506 | 962 | ||||||||||||
|
Experience adjustments |
24,174 | — | 24,174 | 815 | ||||||||||||
|
|
|
|
|
|
|
|
|
|||||||||
| 52,680 | (1,842 | ) | 50,838 | 1,715 | ||||||||||||
|
|
|
|
|
|
|
|
|
|||||||||
|
Pension fund contribution |
— | 26,000 | 26,000 | 877 | ||||||||||||
|
Paid pension |
16,562 | (16,562 | ) | — | — | |||||||||||
|
|
|
|
|
|
|
|
|
|||||||||
|
December 31 |
(838,543 | ) | 360,017 | (478,526 | ) | (16,145 | ) | |||||||||
|
|
|
|
|
|
|
|
|
|||||||||
F-57
Table of Contents
ChipMOS TECHNOLOGIES INC. AND SUBSIDIARIES
Notes to the Consolidated Financial Statements (Continued)
December 31, 2015, 2016 and 2017
| 23. | Retirement benefit plans (continued) |
| a) | Defined benefit plans (continued) |
| (d) | The Bank of Taiwan was commissioned to manage the Fund of the Company’s defined benefit pension plan (the “Fund”) in accordance with the Fund’s annual investment and utilization plan and the “Regulations for Revenues, Expenditures, Safeguard and Utilization of the Labor Retirement Fund” (Article 6: The scope of utilization for the Fund includes deposit in domestic or foreign financial institutions, investment in domestic or foreign listed, over-the-counter, or private placement equity securities, investment in domestic or foreign real estate securitization products, etc.). With regard to the utilization of the Fund, its minimum earnings in the annual distributions on the final financial statements shall be no less than the earnings attainable from the amounts accrued from two-year time deposits with the interest rates offered by local banks. If the earning is less than aforementioned rates, government shall make payment for the deficit after authorized by the Regulator. The Company has no right to participate in managing and operating that fund and hence the Company is unable to disclose the classification of plan asset fair value in accordance with IAS 19 “Employee Benefits” paragraph 142. The constitution of fair value of plan assets as of December 31, 2016 and 2017 is given in the Annual Labor Retirement Fund Utilization Report announced by the government. |
| (e) | The principal actuarial assumptions used were as follows: |
| 2016 | 2017 | |||||||
|
Discount rate used in determining present values |
1.50 | % | 1.75 | % | ||||
|
Expected future salary increases |
3.50 | % | 3.50 | % | ||||
Assumptions regarding future mortality are set based on actuarial advice in accordance with published statistics and experience in each territory.
Because the main actuarial assumption changed, the present value of defined benefit obligations is affected. The sensitivity analysis of present value of defined benefit obligations effected by the changes of significant actuarial assumptions at December 31, 2016 and 2017 are shown below:
| Discount rate | Future salary increases | |||||||||||||||
|
Increase
0.25% |
Decrease
0.25% |
Increase
0.25% |
Decrease
0.25% |
|||||||||||||
|
December 31, 2016 |
||||||||||||||||
|
Effect on present value of defined benefit obligations |
(31,294 | ) | 32,893 | 32,174 | (30,787 | ) | ||||||||||
|
|
|
|
|
|
|
|
|
|||||||||
|
December 31, 2017 |
||||||||||||||||
|
Effect on present value of defined benefit obligations |
(27,192 | ) | 28,506 | 27,955 | (26,816 | ) | ||||||||||
|
|
|
|
|
|
|
|
|
|||||||||
F-58
Table of Contents
ChipMOS TECHNOLOGIES INC. AND SUBSIDIARIES
Notes to the Consolidated Financial Statements (Continued)
December 31, 2015, 2016 and 2017
| 23. | Retirement benefit plans (continued) |
| a) | Defined benefit plans (continued) |
| (e) | The principal actuarial assumptions used were as follows: (continued) |
The sensitivity analysis above is based on other conditions are unchanged but only one assumption is changed. In practice, more than one assumption may change all at once. The method of sensitivity analysis and the method of calculating net pension liability in the statements of financial position are the same.
The major assumptions of the actuarial valuation remain unchanged from 2016.
| (f) | The Group expects to make contributions of NT$26,910 thousand (US$908 thousand) during 2018. |
| (g) | As of December 31, 2017, the weighted average duration of that retirement plan is 13.4 years. The analysis of timing of the future pension payment is as follows: |
| December 31, 2017 | ||||||||
| NT$000 | US$000 | |||||||
|
Within 1 year |
28,007 | 945 | ||||||
|
1-2 years |
31,702 | 1,070 | ||||||
|
2-5 years |
102,703 | 3,465 | ||||||
|
6-10 years |
178,720 | 6,029 | ||||||
|
|
|
|
|
|||||
| 341,132 | 11,509 | |||||||
|
|
|
|
|
|||||
| b) | Defined contribution plans |
Effective July 1, 2005, the Company established a defined contribution pension plan (the “New Plan”) under the Labor Pension Act, covering all regular employees with ROC nationality. Under the New Plan, the Company contributes monthly an amount based on 6% of the employees’ monthly salaries and wages to the employees’ individual pension accounts at the Bureau of Labor Insurance. The benefits accrued are paid monthly or in lump sum upon termination of employment. The pension costs under defined contribution pension plans of the Company for the years ended December 31, 2016 and 2017 were NT$174,096 thousand and NT$190,106 thousand (US$6,414 thousand), respectively.
F-59
Table of Contents
ChipMOS TECHNOLOGIES INC. AND SUBSIDIARIES
Notes to the Consolidated Financial Statements (Continued)
December 31, 2015, 2016 and 2017
| 24. | Other Payables |
|
December 31,
2016 |
December 31,
2017 |
December 31,
2017 |
||||||||||
| NT$000 | NT$000 | US$000 | ||||||||||
|
Salaries and bonus payable |
443,993 | 601,239 | 20,285 | |||||||||
|
Interest payable |
1,059 | 2,854 | 96 | |||||||||
|
Accrued pension costs |
29,930 | 32,402 | 1,093 | |||||||||
|
Employees’ bonus |
70,553 | 371,912 | 12,548 | |||||||||
|
Directors’ remuneration |
3,528 | 18,596 | 627 | |||||||||
|
Other expense payable |
862,991 | 953,179 | 32,159 | |||||||||
|
|
|
|
|
|
|
|||||||
| 1,412,054 | 1,980,182 | 66,808 | ||||||||||
|
|
|
|
|
|
|
|||||||
| 25. | Provisions – current |
| Movements | in provisions are as follows: |
| 2017 | ||||||||||||||||
|
Provisions for
sales allowance |
Provisions for
deficiency compensation |
Total | Total | |||||||||||||
| NT$000 | NT$000 | NT$000 | US$000 | |||||||||||||
|
January 1 |
66,065 | 14,654 | 80,719 | 2,723 | ||||||||||||
|
Provision |
117,234 | 119,318 | 236,552 | 7,981 | ||||||||||||
|
Payment |
(113,143 | ) | (76,817 | ) | (189,960 | ) | (6,409 | ) | ||||||||
|
|
|
|
|
|
|
|
|
|||||||||
|
December 31 |
70,156 | 57,155 | 127,311 | 4,295 | ||||||||||||
|
|
|
|
|
|
|
|
|
|||||||||
The Company’s provisions include sales allowance and deficiency compensation. The detailed information is provided in
Note 2 e).
| 26. | Short-term bank loans |
|
December 31,
2016 |
December 31,
2017 |
December 31,
2017 |
||||||||||
| NT$000 | NT$000 | US$000 | ||||||||||
|
Unsecured bank loans |
— | 969,353 | 32,704 | |||||||||
|
|
|
|
|
|
|
|||||||
|
Annual interest rate |
— | 0.55%~1.71% | 0.55%~1.71% | |||||||||
Unused credit lines of short-term bank loans are as follows:
|
December 31,
2016 |
December 31,
2017 |
|||||||
|
NT$000 |
3,119,000 | 3,028,357 | ||||||
|
US$000 |
80,000 | 80,000 | ||||||
F-60
Table of Contents
ChipMOS TECHNOLOGIES INC. AND SUBSIDIARIES
Notes to the Consolidated Financial Statements (Continued)
December 31, 2015, 2016 and 2017
| 27. | Significant commitments and contingencies |
Operating leases commitments
ChipMOS Taiwan entered into several operating lease contracts for land. These renewable operating leases will expire by 2032 and 2034.
ChipMOS USA entered into several operating lease contracts for office space. These renewable operating leases will expire by 2018 and 2019.
Future minimum lease payments under those leases are as follows:
|
December 31,
2016 |
December 31,
2017 |
December 31,
2017 |
||||||||||
| NT$000 | NT$000 | US$000 | ||||||||||
|
£ 1 year |
39,929 | 39,342 | 1,327 | |||||||||
|
2 to 5 years |
140,328 | 130,182 | 4,392 | |||||||||
|
> 5 years |
176,897 | 139,899 | 4,720 | |||||||||
|
|
|
|
|
|
|
|||||||
| 357,154 | 309,423 | 10,439 | ||||||||||
|
|
|
|
|
|
|
|||||||
Capital commitments
Capital expenditures that are contracted for, but not provided for are as follows:
|
December 31,
2016 |
December 31,
2017 |
December 31,
2017 |
||||||||||
| NT$000 | NT$000 | US$000 | ||||||||||
|
Property, plant and equipment |
1,615,460 | 2,178,262 | 73,491 | |||||||||
|
|
|
|
|
|
|
|||||||
Other commitments
A letter of guarantee was issued by Bank of Taiwan to the Tariff Bureau of the Ministry of Finance for making payment of customs-duty deposits when importing. The amount of letter of guarantee will occupy the credit lines for short-term loans of ChipMOS Taiwan. As of December 31, 2016 and 2017, the amount of NT$131,000 thousand and NT$97,500 thousand (US$3,289 thousand) are guaranteed by Bank of Taiwan.
As described in Note 29, as of October 31, 2016, the Company merged with its former parent company, ChipMOS Bermuda and as a result, the Company deducted unappropriated retained earnings by NT$5,052,343 thousand. The Company has filed an application to the National Taxation Bureau of the Northern Area, Ministry of Finance to apply the accumulated deficit amount, resulted from subtracting the aforementioned amount, as a deduction in the calculation of years 2015 and 2016 additional 10% tax on unappropriated retained earnings.
F-61
Table of Contents
ChipMOS TECHNOLOGIES INC. AND SUBSIDIARIES
Notes to the Consolidated Financial Statements (Continued)
December 31, 2015, 2016 and 2017
| 28. | Transactions with non-controlling interests |
The merger of ChipMOS Taiwan and ThaiLin was approved by the respective shareholders at the special shareholders’ meetings held on December 30, 2014 and was completed on June 17, 2015 and ChipMOS Taiwan is the surviving entity. ThaiLin’s shareholders were offered a combination of NT$12.5 in cash and 0.311 of one ChipMOS Taiwan ordinary share in exchange for each ThaiLin ordinary share held. ChipMOS Taiwan issued 35,932 thousand shares and paid NT$1,444,224 thousand in cash to exchange for 52.46% of ThaiLin’s shares. The transaction was treated as an equity transaction. The difference between the amount by which the non-controlling interest is adjusted and the fair value of the consideration paid was recognized in equity attributed to the Company. Before the merger, ChipMOS Taiwan held 47.54% of the outstanding shares of ThaiLin, ThaiLin held 100% of the outstanding shares of ChipMOS BVI and ChipMOS BVI held 100% of the outstanding shares of ChipMOS Shanghai. After the merger, ChipMOS BVI and its wholly-owned subsidiary, ChipMOS Shanghai, became wholly-owned subsidiaries of ChipMOS Taiwan.
The effect on the equity attributed to the Company during the period is summarized as follows:
| 2015 | ||||
| NT$000 | ||||
|
Carrying amount of non-controlling interests acquired |
2,637,316 | |||
|
Consideration paid to non-controlling interests |
(2,921,041 | ) | ||
|
Other component of equity |
(17,964 | ) | ||
|
Capital surplus |
26,189 | |||
|
|
|
|||
|
Retained earnings |
(275,500 | ) | ||
|
|
|
|||
| 29. | Capital reorganization |
To integrate resources, the Company’s former parent company, ChipMOS Bermuda, was merged with and into the Company as of October 31, 2016, the record date of the Merger, with the latter being the surviving entity and ChipMOS Bermuda being the dissolved entity. Under the Merger Agreement, each shareholder of ChipMOS Bermuda is entitled to receive, with respect to each ChipMOS Bermuda share, 0.9355 units of the Company’s newly-issued ADSs trading on the NASDAQ Global Select Market (each ADS unit represents 20 shares of the Company’s ordinary shares) and US$3.71 in cash. The Company issued 25,620,267 units of ADSs (representing 512,405 thousand ordinary shares) and paid US$101,657 thousand in cash (equivalent to NT$3,208,310 thousand) as the total consideration. In addition, the Company paid NT$133,311 thousand directly attributable transaction cost for the capital reorganization. As the result, the Company paid NT$3,341,621 thousand in cash for the capital reorganization.
The Company issued 512,405 thousand shares for the capital reorganization, and reduced capital by cancelling 522,080 thousand shares originally held by ChipMOS Bermuda. After the capital reorganization, the Company’s shares was net decreased by 9,675 thousand shares. When cancelling treasury stocks, the Company deducted capital surplus equal to the proportion of cancelled shares. Due to the deficit in capital surplus, the Company deducted unappropriated retained earnings by NT$5,052,343 thousand.
As of October 30, 2016, the ending balance of “Predecessors’ interests” was NT$1,692,918 thousand, which represents ChipMOS Bermuda’s net assets as if it had always been combined. The amount has been eliminated in the record date of the Merger.
F-62
Table of Contents
ChipMOS TECHNOLOGIES INC. AND SUBSIDIARIES
Notes to the Consolidated Financial Statements (Continued)
December 31, 2015, 2016 and 2017
| 30. | Supplementary cash flow information |
Partial cash paid for investing and financing activities
| a) | Property, plant and equipment |
| 2015 | 2016 | 2017 | 2017 | |||||||||||||
| NT$000 | NT$000 | NT$000 | US$000 | |||||||||||||
|
Purchase in property, plant and equipment |
3,644,560 | 4,690,995 | 4,849,331 | 163,608 | ||||||||||||
|
Add: Beginning balance of payable to contractors and equipment suppliers |
1,307,459 | 523,962 | 839,983 | 28,339 | ||||||||||||
|
Add: Beginning balance of lease payable |
— | — | 94,952 | 3,204 | ||||||||||||
|
Less: Ending balance of payable to contractors and equipment suppliers |
(523,962 | ) | (647,486 | ) | (878,065 | ) | (29,624 | ) | ||||||||
|
Less: Ending balance of lease payable |
— | (96,006 | ) | (84,192 | ) | (2,841 | ) | |||||||||
|
Less: Transfer from prepaid equipment (shown as “Other non-current assets”) |
— | — | (139,304 | ) | (4,700 | ) | ||||||||||
|
|
|
|
|
|
|
|
|
|||||||||
|
Cash paid for acquisition of property, plant and equipment |
4,428,057 | 4,471,465 | 4,682,705 | 157,986 | ||||||||||||
|
|
|
|
|
|
|
|
|
|||||||||
| b) | Treasury stock |
| 2015 | 2016 | 2017 | 2017 | |||||||||||||
| NT$000 | NT$000 | NT$000 | US$000 | |||||||||||||
|
Repurchase of shares |
1,862,362 | 1,007,654 | — | — | ||||||||||||
|
Less: Beginning balance of prepayment for the repurchase of shares |
(421,003 | ) | — | — | — | |||||||||||
|
|
|
|
|
|
|
|
|
|||||||||
|
Cash paid for purchase of treasury stock |
1,441,359 | 1,007,654 | — | — | ||||||||||||
|
|
|
|
|
|
|
|
|
|||||||||
| c) | Capital reorganization |
| 2015 | 2016 | 2017 | 2017 | |||||||||||||
| NT$000 | NT$000 | NT$000 | US$000 | |||||||||||||
|
Net assets acquired from ChipMOS Bermuda |
— | 12,987,736 | — | — | ||||||||||||
|
Less: Issuance of shares |
— | (9,779,426 | ) | — | — | |||||||||||
|
|
|
|
|
|
|
|
|
|||||||||
|
Cash consideration |
— | 3,208,310 | — | — | ||||||||||||
|
Directly attributable transaction cost |
— | 133,311 | — | — | ||||||||||||
|
|
|
|
|
|
|
|
|
|||||||||
|
Cash paid for capital reorganization |
— | 3,341,621 | — | — | ||||||||||||
|
|
|
|
|
|
|
|
|
|||||||||
| d) | Disposal of a subsidiary |
| 2015 | 2016 | 2017 | 2017 | |||||||||||||
| NT$000 | NT$000 | NT$000 | US$000 | |||||||||||||
|
Disposal of a subsidiary |
— | — | 2,166,151 | 73,082 | ||||||||||||
|
Add: Ending balance of other payables* |
— | — | 64,393 | 2,173 | ||||||||||||
|
Less: Cash and cash equivalents of discontinued operations |
— | — | (449,331 | ) | (15,160 | ) | ||||||||||
|
|
|
|
|
|
|
|
|
|||||||||
|
Cash received from disposal of a subsidiary |
— | — | 1,781,213 | 60,095 | ||||||||||||
|
|
|
|
|
|
|
|
|
|||||||||
| * | According to the Equity Interest Transfer Agreement, the Group accrued the estimated payment to investor based on the operating performance of ChipMOS Shanghai and as a result, cash received from disposal of discontinued operations amounted to NT$64,393 thousand (US$2,173 thousand) will be payable in 2018. |
F-63
Table of Contents
ChipMOS TECHNOLOGIES INC. AND SUBSIDIARIES
Notes to the Consolidated Financial Statements (Continued)
December 31, 2015, 2016 and 2017
| 30. | Supplementary cash flow information (continued) |
| e) | Reconciliation of liabilities arising from financing activities |
|
Non-Cash
flow |
||||||||||||||||||||
|
As of January 1,
2017 |
Cash flow* |
Amortization of
loans fee |
As of December 31,
2017 |
|||||||||||||||||
| NT$000 | NT$000 | NT$000 | NT$000 | US$000 | ||||||||||||||||
|
Long-term loans (include the current portion) |
10,750,005 | (1,124,699 | ) | 16,715 | 9,642,021 | 325,305 | ||||||||||||||
|
Short-term loans |
— | 969,353 | — | 969,353 | 32,704 | |||||||||||||||
|
Guarantee deposits |
1,404 | (33 | ) | — | 1,371 | 46 | ||||||||||||||
|
|
|
|
|
|
|
|
|
|
|
|||||||||||
| 10,751,409 | (155,379 | ) | 16,715 | 10,612,745 | 358,055 | |||||||||||||||
|
|
|
|
|
|
|
|
|
|
|
|||||||||||
| * | Above movement schedule is exclusively for continuing operations, reconciliation to the statement of cash flow should include movements from discontinued operations for proceeds from long-term and short-term loans amounted to NT$148,829 thousand (US$5,021 thousand) and NT$312,483 thousand (US$10,543 thousand), respectively. |
| 31. | Related party transactions |
| a) | Parent and ultimate controlling party |
On October 31, 2016, the Company’s former parent company, ChipMOS Bermuda, was merged with and into the Company through a share exchange with the latter being the surviving entity and ChipMOS Bermuda being the dissolved entity. After the Merger, the Company has neither a parent company nor an ultimate controlling party. The transactions between the Company and its subsidiaries were eliminated in the accompanying consolidated financial statements and were not disclosed herein. The transactions between the Group and other related parties are as follows.
| b) | Names of related parties and relationship |
|
Name |
Relationship | |||
|
ChipMOS Shanghai |
Associate | |||
|
JMC |
Associate | |||
| c) | Significant related party transactions |
| (a) | Subcontracting fee |
| 2017 | 2017 | |||||||
| NT$000 | US$000 | |||||||
|
ChipMOS Shanghai |
41,183 | 1,389 | ||||||
|
|
|
|
|
|||||
There were no subcontracting fee to related parties for the years ended December 31, 2015 and 2016.
| (b) | Disposal of property, plant and equipment |
| 2017 | ||||||||||||||||
| Selling price | Gain on disposal | |||||||||||||||
| NT$000 | US$000 | NT$000 | US$000 | |||||||||||||
|
ChipMOS Shanghai |
21,982 | 742 | 20,240 | 683 | ||||||||||||
|
|
|
|
|
|
|
|
|
|||||||||
There were no disposal of property, plant, and equipment to related parties for the years ended December 31, 2015 and 2016.
F-64
Table of Contents
ChipMOS TECHNOLOGIES INC. AND SUBSIDIARIES
Notes to the Consolidated Financial Statements (Continued)
December 31, 2015, 2016 and 2017
| 31. | Related party transactions (continued) |
| (c) | Acquisition of financial assets |
In June 2017, ChipMOS BVI participated in ChipMOS Shanghai’s increase of paid-in capital based on its shareholding amounted to NT$1,373,486 thousand (US$46,339 thousand), please refer to Note 13.
| (d) | Patent licensing agreement |
In May 2016, the Company and ChipMOS Shanghai entered into a patent licensing agreement. Under the agreement, ChipMOS Shanghai paid the Company a licensing fee in the aggregate total of US$2,500 thousand (amended to US$1,000 thousand in January 2017) which was accounted for as receipts in advance and long-term deferred revenue, and recognized royalty income for 10 years from the effective date. In addition, ChipMOS Shanghai shall pay the Company a running royalty for the foregoing license equivalent to 0.5% of the total revenue from the licensed products. Given that the related production lines of ChipMOS Shanghai have begun its operations in April 2017, the Company recognized royalty income henceforth. The Company recognized receipts in advance and long-term deferred revenue amounted to NT$3,018 thousand (US$102 thousand) and NT$24,898 thousand (US$840 thousand), respectively, as of December 31, 2017 and royalty income amounted to NT$2,828 thousand (US$96 thousand) for the nine months then ended.
In October 2011, ChipMOS Bermuda and ChipMOS Shanghai entered into a patent licensing agreement which has a term of 10 years starting from August 1, 2012. Under the agreement, ChipMOS Shanghai will pay ChipMOS Bermuda a royalty in the aggregate total of RMB 27,400 thousand, which was accounted as receipts in advance and payable in 40 quarterly installments of RMB 685 thousand. The rights and obligations of this agreement have been transferred to the Company on October 31, 2016. In March 2017, ChipMOS Shanghai was derecognized from the consolidated financial statements and recorded as “Investment in associates”, therefore, royalty income for the three months ended March 31, 2017 were eliminated on a consolidated basis. The Company recognized receipts in advance amounted to NT$1,039 thousand (US$35 thousand) as of December 31, 2017 and royalty income amounted to NT$9,170 thousand (US$309 thousand) for the year then ended.
| d) | Key management personnel compensation |
| 2015 | 2016 | 2017 | 2017 | |||||||||||||
| NT$000 | NT$000 | NT$000 | US$000 | |||||||||||||
|
Short-term employee benefits |
217,091 | 152,319 | 188,105 | 6,346 | ||||||||||||
|
Post-employment compensation |
2,249 | 3,335 | 5,622 | 190 | ||||||||||||
|
Share-based payments |
100,280 | 109,255 | 18,736 | 632 | ||||||||||||
|
|
|
|
|
|
|
|
|
|||||||||
| 319,620 | 264,909 | 212,463 | 7,168 | |||||||||||||
|
|
|
|
|
|
|
|
|
|||||||||
| 32. | Pledged or mortgaged assets |
The Group provided certain assets as collateral mainly for long-term bank loans (Note 22) and leases, which were as follows:
|
December 31,
2016 |
December 31,
2017 |
December 31,
2017 |
||||||||||
| NT$000 | NT$000 | US$000 | ||||||||||
|
Property, plant and equipment, net (Note 14) |
8,020,905 | 7,164,089 | 241,703 | |||||||||
|
Other financial assets – non current |
70,677 | 70,241 | 2,370 | |||||||||
|
|
|
|
|
|
|
|||||||
| 8,091,582 | 7,234,330 | 244,073 | ||||||||||
|
|
|
|
|
|
|
|||||||
F-65
Table of Contents
ChipMOS TECHNOLOGIES INC. AND SUBSIDIARIES
Notes to the Consolidated Financial Statements (Continued)
December 31, 2015, 2016 and 2017
| 33. | Financial instruments by category |
|
December 31,
2016 |
December 31,
2017 |
December 31,
2017 |
||||||||||
| NT$000 | NT$000 | US$000 | ||||||||||
|
Financial assets |
||||||||||||
|
Available-for-sale financial assets |
9,960 | 20,890 | 705 | |||||||||
|
Loans and receivables (including cash and cash equivalents, other financial assets, accounts and notes receivable, other receivables and refundable deposits) |
11,862,621 | 12,204,292 | 411,751 | |||||||||
|
|
|
|
|
|
|
|||||||
| 11,872,581 | 12,225,182 | 412,456 | ||||||||||
|
|
|
|
|
|
|
|||||||
|
Financial liabilities |
||||||||||||
|
Financial liabilities at amortized cost (including bank loans, accounts payable, payables to contractors and equipment suppliers, lease payable, other payables and guarantee deposits) |
13,579,473 | 14,024,304 | 473,155 | |||||||||
|
|
|
|
|
|
|
|||||||
| 34. | Financial risk management and fair values of financial instruments |
| a) | Financial risk management |
The Group’s risk management objective is to manage the market risk, credit risk and liquidity risk related to its operating activities. The Group identifies, measures and manages the aforementioned risks based on policy and risk appetite.
The Group has established appropriate policies, procedures and internal controls for financial risk management. Before entering into significant financial transactions, due approval process by the Board of Directors must be carried out based on related protocols and internal control procedures. The Group complies with its financial risk management policies at all times.
| (a) | Market risk |
Market risk is the risk that the fair value or future cash flows of a financial instrument will fluctuate because of changes in market prices. Market risks comprise foreign currency risk, interest rate risk, and other price risk (such as equity price risk).
| i) | Foreign currency risk |
The Group’s exposure to the risk of changes in foreign exchange rates relates primarily to the Group’s operating activities (when revenue or expense is denominated in a different currency from the Group’s functional currency) and the Group’s net investments in foreign subsidiaries.
The Group applies natural hedges from using accounts receivable and accounts payable denominated in the same currency. However, this natural hedge does not concur with the requirement for hedge accounting. Furthermore, as net investments in foreign subsidiaries are for strategic purposes, they are not hedged by the Group.
The Group’s foreign currency exposure gives rise to market risks associated with exchange rate movements against the NT dollar for cash and cash equivalents, accounts receivable, other receivables, bank loans, accounts payable and other payables.
F-66
Table of Contents
ChipMOS TECHNOLOGIES INC. AND SUBSIDIARIES
Notes to the Consolidated Financial Statements (Continued)
December 31, 2015, 2016 and 2017
| 34. | Financial risk management and fair values of financial instruments (continued) |
| a) | Financial risk management (continued) |
| (a) | Market risk (continued) |
| i) | Foreign currency risk (continued) |
The Group’s businesses involve some non-functional currency operations. The information on the assets and liabilities denominated in foreign currencies whose values would be materially affected by the exchange rate fluctuations is as follows:
| December 31, 2016 | ||||||||||||
|
Foreign
currency |
Exchange rate |
Carrying amount
(NT$000) |
||||||||||
|
Financial assets |
||||||||||||
|
Monetary items |
||||||||||||
|
US$000 |
178,201 | 32.2500 | 5,746,982 | |||||||||
|
JPY000 |
517,114 | 0.2756 | 142,517 | |||||||||
|
Financial liabilities |
||||||||||||
|
Monetary items |
||||||||||||
|
US$000 |
7,802 | 32.2500 | 251,615 | |||||||||
|
JPY000 |
550,456 | 0.2756 | 151,706 | |||||||||
| December 31, 2017 | ||||||||||||
|
Foreign
currency |
Exchange rate |
Carrying amount
(NT$000) |
||||||||||
|
Financial assets |
||||||||||||
|
Monetary items |
||||||||||||
|
US$000 |
208,066 | 29.7600 | 6,192,044 | |||||||||
|
JPY000 |
798,254 | 0.2642 | 210,899 | |||||||||
|
RMB000 |
167,484 | 4.5650 | 764,564 | |||||||||
|
Financial liabilities |
||||||||||||
|
Monetary items |
||||||||||||
|
US$000 |
16,036 | 29.7600 | 477,231 | |||||||||
|
JPY000 |
1,071,432 | 0.2642 | 283,072 | |||||||||
The total exchange gain and the total exchange loss recognized include realized and unrealized gain and loss arising from significant foreign exchange variation on the monetary items held by the Group for the years ended December 31, 2016 and 2017 amounted to loss of NT$195,326 thousand and loss of NT$418,970 thousand (US$14,135 thousand), respectively.
F-67
Table of Contents
ChipMOS TECHNOLOGIES INC. AND SUBSIDIARIES
Notes to the Consolidated Financial Statements (Continued)
December 31, 2015, 2016 and 2017
| 34. | Financial risk management and fair values of financial instruments (continued) |
| a) | Financial risk management (continued) |
| (a) | Market risk (continued) |
| i) | Foreign currency risk (continued) |
The following table details the Group’s exposure at the end of the reporting period to currency risk arising from recognized monetary assets or liabilities denominated in a currency other than the functional currency of the entity to which they relate.
| December 31, 2016 | ||||||||||||
|
Change in
exchange rate |
Effect on profit
(NT$000) |
Effect on other
comprehensive income (NT$000) |
||||||||||
|
Financial assets |
||||||||||||
|
US$000 |
5 | % | 287,349 | — | ||||||||
|
JPY000 |
5 | % | 7,126 | — | ||||||||
|
Financial liabilities |
||||||||||||
|
US$000 |
5 | % | 12,581 | — | ||||||||
|
JPY000 |
5 | % | 7,585 | — | ||||||||
| December 31, 2017 | ||||||||||||
|
Change in
exchange rate |
Effect on profit
(NT$000) |
Effect on other
comprehensive income (NT$000) |
||||||||||
|
Financial assets |
||||||||||||
|
US$000 |
5 | % | 309,602 | — | ||||||||
|
JPY000 |
5 | % | 10,545 | — | ||||||||
|
RMB000 |
5 | % | 38,228 | — | ||||||||
|
Financial liabilities |
||||||||||||
|
US$000 |
5 | % | 23,862 | — | ||||||||
|
JPY000 |
5 | % | 14,154 | — | ||||||||
| ii) | Interest rate risk |
Interest rate risk is the risk that the fair value or future cash flows of a financial instrument will fluctuate because of changes in market interest rates. The Group’s exposure to the risk of changes in market interest rates relates primarily to the Group’s bank loans with floating interest rates.
The Group manages its interest rate risk by having a balanced portfolio of fixed and variable rate bank loans.
At December 31, 2017, it is estimated that a general increase or decrease of 100 basis points (1%) in interest rates, with all other variables held constant, would decrease or increase the Group’s profit by approximately NT$106,447 thousand (US$3,591 thousand) (2016: NT$108,000 thousand).
F-68
Table of Contents
ChipMOS TECHNOLOGIES INC. AND SUBSIDIARIES
Notes to the Consolidated Financial Statements (Continued)
December 31, 2015, 2016 and 2017
| 34. | Financial risk management and fair values of financial instruments (continued) |
| a) | Financial risk management (continued) |
| (a) | Market risk (continued) |
| iii) | Equity price risk |
The Group is exposed to equity price risk through its investments in listed equity securities classified as financial assets at fair value through profit or loss. The Group manages this exposure by maintaining a portfolio of investments with different risk and return profiles. At the reporting date, no aforesaid equity security was held and no sensitivity analysis was disclosed.
| (b) | Credit risk |
Credit risk is the risk that a counterparty will not meet its obligations under a financial instrument or customer contract, leading to a financial loss. The Group is exposed to credit risk from its operating activities (primarily accounts and other receivables) and from its financing activities (primarily deposits with banks and financial instruments).
Each business unit performs ongoing credit evaluation of the debtors’ financial condition according to the Group’s established policy, procedures and control relating to customer credit risk management. The Group maintains an account for allowance for doubtful receivables based upon the available facts and circumstances, historical collection and write-off experiences of all trade and other receivables which consequently minimizes the Group’s exposure to bad debts.
Credit risk from balances with banks and financial institutions is managed by the Group’s finance unit in accordance with the Group’s policy. Bank balances are held with financial institutions of good standing. The Group’s exposure to credit risk arising from the default of counter-parties is limited to the carrying amount of these instruments.
F-69
Table of Contents
ChipMOS TECHNOLOGIES INC. AND SUBSIDIARIES
Notes to the Consolidated Financial Statements (Continued)
December 31, 2015, 2016 and 2017
| 34. | Financial risk management and fair values of financial instruments (continued) |
| a) | Financial risk management (continued) |
| (c) | Liquidity risk |
Liquidity risk is the risk that the Group will encounter difficulty in raising funds to meet commitments associated with financial instruments. The Group monitors and maintains adequate cash and banking facilities to finance the Group’s operations. See Notes 22 and 26 about the unused credit lines of the Group.
The maturity profile of the Group’s non-derivative financial liabilities as of December 31, 2016 and 2017 based on the contracted undiscounted payments is as follows:
| December 31, 2016 | ||||||||||||||||
| £ 1 year | 2 to 5 years | > 5 years | Total | |||||||||||||
| NT$000 | NT$000 | NT$000 | NT$000 | |||||||||||||
|
Long-term bank loans (including current portion) |
1,272,266 | 10,110,289 | — | 11,382,555 | ||||||||||||
|
Accounts payable and payables to contractors and equipment suppliers |
1,375,408 | — | — | 1,375,408 | ||||||||||||
|
Other payables |
1,412,054 | — | — | 1,412,054 | ||||||||||||
|
Lease payable |
12,000 | 30,000 | — | 42,000 | ||||||||||||
|
Guarantee deposits |
— | — | 1,404 | 1,404 | ||||||||||||
|
|
|
|
|
|
|
|
|
|||||||||
| 4,071,728 | 10,140,289 | 1,404 | 14,213,421 | |||||||||||||
|
|
|
|
|
|
|
|
|
|||||||||
| December 31, 2017 | ||||||||||||||||||||
| £ 1 year | 2 to 5 years | > 5 years | Total | Total | ||||||||||||||||
| NT$000 | NT$000 | NT$000 | NT$000 | US$000 | ||||||||||||||||
|
Short-term bank loans |
971,813 | — | — | 971,813 | 32,787 | |||||||||||||||
|
Long-term bank loans (including current portion) |
2,321,459 | 7,740,267 | — | 10,061,726 | 339,465 | |||||||||||||||
|
Accounts payable and payables to contractors and equipment suppliers (including related parties) |
1,401,499 | — | — | 1,401,499 | 47,284 | |||||||||||||||
|
Other payables (including related parties) |
1,980,218 | — | — | 1,980,218 | 66,809 | |||||||||||||||
|
Lease payable |
12,266 | 18,266 | — | 30,532 | 1,030 | |||||||||||||||
|
Guarantee deposits |
— | — | 1,371 | 1,371 | 46 | |||||||||||||||
|
|
|
|
|
|
|
|
|
|
|
|||||||||||
| 6,687,255 | 7,758,533 | 1,371 | 14,447,159 | 487,421 | ||||||||||||||||
|
|
|
|
|
|
|
|
|
|
|
|||||||||||
| b) | Fair values of financial instruments |
The notional amounts of financial assets and financial liabilities are assumed to approximate their fair values.
F-70
Table of Contents
ChipMOS TECHNOLOGIES INC. AND SUBSIDIARIES
Notes to the Consolidated Financial Statements (Continued)
December 31, 2015, 2016 and 2017
| 35. | Share-based payments |
Stock option plan
The former parent company of the Group, ChipMOS Bermuda adopted three option plans in 2001, 2006 and 2011 which have 2,250,000, 1,750,000 and 1,000,000 shares available for issuance, respectively. The stock option plans provide that the directors, officers, employees and consultants of ChipMOS Bermuda and its affiliates may be granted options to purchase ordinary shares of ChipMOS Bermuda at specified exercise prices. All outstanding stock options issued by ChipMOS Bermuda and received by the employees of the Company, whether vested or unvested, were settled in cash by ChipMOS Bermuda prior to the Merger in accordance with the terms of the merger agreement.
The following table illustrates the number and weighted average exercise prices (“WAEP”) of, and movements in, share options during the periods indicated:
|
Ten months ended
October 30, 2016 |
2016 | |||||||
|
Number of
options |
WAEP
US$ |
|||||||
|
Outstanding at the beginning of the period |
1,062,250 | 13.57 | ||||||
|
Forfeited |
(25,084 | ) | 15.35 | |||||
|
Exercised |
(97,715 | ) | 7.21 | |||||
|
Expired |
(49,500 | ) | 20.57 | |||||
|
Early settled |
(889,951 | ) | 13.83 | |||||
|
|
|
|||||||
|
Outstanding at the end of the period |
— | — | ||||||
|
|
|
|||||||
|
Exercisable at the end of the period |
— | — | ||||||
|
|
|
|||||||
The weighted average share price at the date of exercise of these options exercised in 2016 was US$18.10.
There were no outstanding stock options as of December 31, 2016 and 2017.
F-71
Table of Contents
ChipMOS TECHNOLOGIES INC. AND SUBSIDIARIES
Notes to the Consolidated Financial Statements (Continued)
December 31, 2015, 2016 and 2017
| 35. | Share-based payments (continued) |
Share appreciation rights (“SARs”)
The former parent company of the Group, ChipMOS Bermuda adopted three SARs plans in 2006, 2008 and 2013 which have 500,000, 750,000 and 1,000,000 rights available for issuance, respectively. The SARs plans provide that the directors, officers and employees of ChipMOS Bermuda and its affiliates may be granted cash-settled share appreciation rights. All outstanding share appreciation rights issued by ChipMOS Bermuda and received by the employees of the Company, whether vested or unvested, were settled in cash by ChipMOS Bermuda prior to the Merger in accordance with the terms of the merger agreement.
The following table illustrates the number and WAEP of, and movements in, SARs during the periods indicated:
|
Ten months ended
October 30, 2016 |
2016 | |||||||
|
Number of rights |
WAEP
US$ |
|||||||
|
Outstanding at the beginning of the period |
588,596 | 14.07 | ||||||
|
Granted |
37,500 | 19.55 | ||||||
|
Forfeited |
(9,785 | ) | 15.16 | |||||
|
Exercised |
(123,033 | ) | 11.26 | |||||
|
Early settled |
(493,278 | ) | 15.17 | |||||
|
|
|
|||||||
|
Outstanding at the end of the period |
— | — | ||||||
|
|
|
|||||||
|
Exercisable at the end of the period |
— | — | ||||||
|
|
|
|||||||
The weighted average share price at the date of exercise of these SARs exercised in 2016 was US$19.18.
The weighted average fair value of SARs granted during 2016 was US$1.34.
There were no outstanding share appreciation rights as of December 31, 2016 and 2017.
Restricted Shares
On November 12, 2014, the Board of Directors of the Company approved 2014 Restricted Stock Award Agreement which has 17,300 thousand restricted shares available for issuance. The par value and granting price of the restricted shares were NT$10 and zero, respectively. The issuance of the restricted shares was approved by the Special General Meeting of the Shareholders of the Company on December 30, 2014 and approved by the Financial Supervisory Commission ROC on June 30, 2015.
On July 14, 2015 and April 18, 2016, the Board of Directors of the Company approved to set July 21, 2015 and May 10, 2016 as the Record Date of the issuance of 15,752 thousand and 1,548 thousand restricted shares.
F-72
Table of Contents
ChipMOS TECHNOLOGIES INC. AND SUBSIDIARIES
Notes to the Consolidated Financial Statements (Continued)
December 31, 2015, 2016 and 2017
| 35. | Share-based payments (continued) |
When the employees of ChipMOS Taiwan accomplished the following years of service and performance conditions, the received restricted shares will be vested based on the vesting ratio.
| The 1 st year | The 2 nd year | The 3 rd year | ||||
|
Years of service following the receipt of restricted shares |
Continuous service
for one year |
Continuous service
for two years |
Continuous service
for three years |
|||
|
Grade of performance appraisal |
>=B+ | >=B+ | >=B+ | |||
|
Compliance of terms agreed by the staff and the Company |
No violation | No violation | No violation | |||
|
Vesting ratio of numbers of restricted shares received |
30% | 30% | 40% |
The restricted shares issued by the Company cannot be transferred during the vesting period, but voting right and dividend right are not restricted. Employees are required to return the shares but not required to return the dividends received if they resign during the vesting period. When the employees accomplish the years of service and performance conditions, the received restricted shares will be vested based on the vesting ratio.
During 2016 and 2017, the Group recognized NT$356,463 thousand and NT$123,021 thousand (US$4,151 thousand), respectively, compensation expenses in respect of the transactions of share-based payments.
| 36. | Capital management |
The Group manages its capital to ensure that entities in the Group will be able to continue as a going concern while maximizing the return to shareholders through the optimization of the balance between debt and equity.
The Group reviews the capital structure on an ongoing basis. As part of this review, the directors consider the cost of capital and the risks associated with each class of capital. The Group will balance its overall capital structure through the payment of dividends, new share issues and the issue of new debt or the repayment of existing debt.
The Group’s overall strategy remains unchanged from 2016.
The Group monitors capital using the liabilities to assets ratio, the percentages of which as of December 31, 2016 and 2017 were as follows:
| December 31, 2016 | December 31, 2017 | December 31, 2017 | ||||||||||
| NT$000 | NT$000 | US$000 | ||||||||||
|
Total liabilities |
15,048,258 | 15,138,993 | 510,762 | |||||||||
|
|
|
|
|
|
|
|||||||
|
Total assets |
31,295,960 | 33,259,942 | 1,122,130 | |||||||||
|
|
|
|
|
|
|
|||||||
|
Liabilities to assets ratio |
48.08 | % | 45.52 | % | 45.52 | % | ||||||
|
|
|
|
|
|
|
|||||||
Compared to December 31, 2016, the liabilities to assets ratio decreased on December 31, 2017 was due to the acquisition of production equipment required.
F-73
Table of Contents
ChipMOS TECHNOLOGIES INC. AND SUBSIDIARIES
Notes to the Consolidated Financial Statements (Continued)
December 31, 2015, 2016 and 2017
| 37. | Event after the reporting periods |
| a) | The amendment to the Income Tax Act has been approved and promulgated in February 2018 raising the profit-seeking enterprise income tax rate from 17% to 20%, decrease the tax rate on unappropriated retained earnings from 10% to 5%, and abandon the imputation tax credit account effective from fiscal year starting on January 1, 2018. |
| b) | In January 2018, ChipMOS BVI participated in ChipMOS Shanghai’s increase of paid-in capital based on its shareholding amounted to NT$794,694 thousand (US$26,812 thousand). |
| c) | On March 15, 2018, by considering the adjustment of capital structure and increasing of return of equity, the Company’s Board of Directors approved to reduce and return capital stock to shareholders at $1.5 per share. The proposal will be further discussed in shareholders’ meeting. |
| 38. | Approval of the financial statements |
These consolidated financial statements were approved and authorized for issue by the Board of Directors on April 19, 2018.
| 39. | Financial Statements Schedule: Valuation and Qualifying Accounts |
| January 1 |
Additions
charged to expense |
Deduction /
Write-offs |
Exchange
difference on translations of foreign financial statement |
Non-current
assets held for sale |
December 31 | |||||||||||||||||||
| NT$000 | NT$000 | NT$000 | NT$000 | NT$000 | NT$000 | |||||||||||||||||||
|
Year of 2015 : |
||||||||||||||||||||||||
|
Allowance for impairment of property, plant and equipment |
2,110,362 | 1,478 | (85,351 | ) | (31,774 | ) | — | 1,994,715 | ||||||||||||||||
|
Allowance for impairment of obsolescence and decline in market value of inventories |
82,582 | 12,717 | (151 | ) | (112 | ) | — | 95,036 | ||||||||||||||||
|
Year of 2016 : |
||||||||||||||||||||||||
|
Allowance for impairment of property, plant and equipment |
1,994,715 | 8,198 | (45,319 | ) | (118,046 | ) | (1,480,278 | ) | 359,270 | |||||||||||||||
|
Allowance for impairment of obsolescence and decline in market value of inventories |
95,036 | 66,894 | — | (557 | ) | (6,532 | ) | 154,841 | ||||||||||||||||
|
Year of 2017 : |
||||||||||||||||||||||||
|
Allowance for impairment of property, plant and equipment |
359,270 | 956 | (39,771 | ) | — | — | 320,455 | |||||||||||||||||
|
Allowance for impairment of obsolescence and decline in market value of inventories |
154,841 | — | (101,127 | ) | — | — | 53,714 | |||||||||||||||||
F-74