IMMUNIC, INC.
10-Ks and 10-Qs
|
|
|
|
|
|
|
|
|
|
|
|
|
|
|
|
|
|
|
|
|
|
|
|
|
|
|
|
|
|
|
|
|
|
|
|
|
|
|
|
|
|
|
|
|
|
|
|
|
|
UNITED STATES
SECURITIES AND EXCHANGE COMMISSION
Washington, D.C. 20549
FORM 10-K
(Mark One)
|
x
|
ANNUAL REPORT PURSUANT TO SECTION 13 OR 15(d) OF THE SECURITIES EXCHANGE ACT OF 1934
|
For the fiscal year ended
December 31, 2016
or
|
o
|
TRANSITION REPORT PURSUANT TO SECTION 13 OR 15(d) OF THE SECURITIES EXCHANGE ACT OF 1934
|
For the transition period from
to
Commission File Number: 001-36201
Vital Therapies, Inc.
(Exact name of registrant as specified in its charter)
|
Delaware
|
56-2358443
|
|
(State or other jurisdiction of
incorporation or organization)
|
(I.R.S. Employer
Identification No.)
|
|
15010 Avenue of Science, Suite 200
San Diego, CA
|
92128
|
|
(Address of principal executive offices)
|
(Zip Code)
|
Registrant’s telephone number, including area code: (858) 673-6840
Securities registered pursuant to Section 12(b) of the Act:
|
Title of Each Class
|
Name of Each Exchange on Which Registered
|
|
Common Stock, par value $0.0001 per share
|
The NASDAQ Stock Market LLC
(The NASDAQ Global Market)
|
Securities registered pursuant to Section 12(g) of the Act: None
Indicate by check mark if the registrant is a well-known seasoned issuer, as defined in Rule 405 of the Securities Act. Yes
¨
No
ý
Indicate by check mark if the registrant is not required to file reports pursuant to Section 13 or 15(d) of the Act. Yes
¨
No
ý
Indicate by check mark whether the registrant (1) has filed all reports required to be filed by Section 13 or 15(d) of the Securities Exchange Act of 1934 during the preceding 12 months (or for such shorter period that the registrant was required to file such reports), and (2) has been subject to such filing requirements for the past 90 days. Yes
ý
No
¨
Indicate by check mark whether the registrant has submitted electronically and posted on its corporate Web site, if any, every Interactive Data File required to be submitted and posted pursuant to Rule 405 of Regulation S-T (§232.405 of this chapter) during the preceding 12 months (or for such shorter period that the registrant was required to submit and post such files). Yes
ý
No
¨
Indicate by check mark if disclosure of delinquent filers pursuant to Item 405 of Regulation S-K (§229.405 of this chapter) is not contained herein, and will not be contained, to the best of the registrant’s knowledge, in definitive proxy or information statements incorporated by reference in Part III of this Form 10-K or any amendment to this Form 10-K.
ý
Indicate by check mark whether the registrant is a large accelerated filer, an accelerated filer, a non-accelerated filer or a smaller reporting company. See definitions of “large accelerated filer,” “accelerated filer” and “smaller reporting company” in Rule 12b-2 of the Exchange Act.
|
Large accelerated filer
|
o
|
Accelerated filer
|
x
|
|
Non-accelerated filer
|
o
(Do not check if a smaller reporting company)
|
Smaller reporting company
|
o
|
Indicate by check mark whether the registrant is a shell company (as defined in Rule 12b-2 of the Act). Yes
¨
No
ý
The aggregate market value of the voting and non-voting stock held by non-affiliates of the registrant, based on the closing sale price of the registrant’s common stock on
June 30, 2016
, the last business day of the registrant’s most recently completed second fiscal quarter, as reported on The NASDAQ Global Market, was approximately
$126.9
million. Shares of common stock held by each executive officer and director and by each person who owns 10% or more of the outstanding common stock, based on filings with the Securities and Exchange Commission, have been excluded from this computation since such persons may be deemed to be affiliates of the registrant. The determination of affiliate status for this purpose is not necessarily a conclusive determination for other purposes.
There were
32,144,876
shares of the registrant’s common stock, $0.0001 par value per share, outstanding as of
February 28, 2017
.
DOCUMENTS INCORPORATED BY REFERENCE
Portions of the registrant's definitive proxy statement to be filed with the Securities and Exchange Commission in connection with the registrant's 2017 Annual Meeting of Stockholders (to be held on May 23, 2017) are incorporated by reference into Part III, Items 10, 11, 12, 13 and 14 of this Annual Report on Form 10-K. The definitive proxy statement will be filed within 120 days after the end of the fiscal year to which this report relates.
Vital Therapies, Inc.
ANNUAL REPORT ON FORM 10-K
For the Fiscal Year Ended
December 31, 2016
Table of Contents
|
|
Page
|
|
|
Item 1.
|
||
|
Item 1A.
|
||
|
Item 1B.
|
||
|
Item 2.
|
||
|
Item 3.
|
||
|
Item 4.
|
||
|
Item 5.
|
||
|
Item 6.
|
||
|
Item 7.
|
||
|
Item 7A.
|
||
|
Item 8.
|
||
|
Item 9.
|
||
|
Item 9A.
|
||
|
Item 9B.
|
||
|
Item 10.
|
||
|
Item 11.
|
||
|
Item 12.
|
||
|
Item 13.
|
||
|
Item 14.
|
||
|
Item 15.
|
||
Special Note Regarding Forward-Looking Statements
This Annual Report on Form 10-K, or Annual Report, contains forward-looking statements within the meaning of Section 27A of the Securities Act of 1933, as amended, or the Securities Act, and Section 21E of the Securities and Exchange Act of 1934, as amended, or the Exchange Act. These forward-looking statements are based on our management’s beliefs and assumptions and on information currently available to our management, and are contained principally in the sections entitled “Business,” “Risk Factors,” and “Management’s Discussion and Analysis of Financial Condition and Results of Operations.” Forward-looking statements include all statements that are not historical facts and can be identified by terms such as “anticipates,” “believes,” “could,” “seeks,” “estimates,” “expects,” “intends,” “may,” “plans,” “potential,” “predicts,” “projects,” “should,” “will,” “would,” "might," "can," "continue" or similar expressions and the negatives of those terms.
These forward-looking statements include, among other things, statements about:
|
•
|
the cost, timing and results of our clinical programs for the ELAD
®
System, including statements related to our VTL-308 phase 3 clinical trial;
|
|
•
|
the timing of, and our ability to obtain and maintain regulatory approvals for the ELAD System;
|
|
•
|
regulatory developments in the United States and foreign countries;
|
|
•
|
the potential market for the ELAD System, including our anticipated gross margins if commercialized;
|
|
•
|
the rate and degree of market acceptance and clinical utility of the ELAD System;
|
|
•
|
our commercialization, marketing and manufacturing capabilities and strategy;
|
|
•
|
our plans to improve or explore future uses of the ELAD System;
|
|
•
|
our plans to explore other uses for our VTL C3A cells;
|
|
•
|
our plans to obtain funding for our operations;
|
|
•
|
the performance of third parties in connection with the development of the ELAD System, including third parties involved in our clinical trials and third-party suppliers;
|
|
•
|
the development, regulatory approval, efficacy and commercialization of competing products;
|
|
•
|
our ability to retain key scientific or management personnel;
|
|
•
|
our intellectual property position;
|
|
•
|
our estimates regarding expenses, future revenue, capital requirements, projected cash runway and needs for additional financing; and
|
|
•
|
our ability to maintain effective internal control over financial reporting.
|
Forward-looking statements involve known and unknown risks, uncertainties and other factors that may cause our actual results, performance or achievements to be materially different from any future results, performance or achievements expressed or implied by the forward-looking statements including those described in “Risk Factors” and elsewhere in this Annual Report. Given these uncertainties, you should not place undue reliance on these forward-looking statements. Also, forward-looking statements represent our management’s beliefs and assumptions only as of the date of this Annual Report. You should read this Annual Report and the documents that we reference in this Annual Report and have filed with the Securities and Exchange Commission, or SEC, as exhibits hereto completely and with the understanding that our actual future results may be materially different from what we expect.
Except as required by law, we assume no obligation to update these forward-looking statements publicly, or to update the reasons actual results could differ materially from those anticipated in these forward-looking statements, even if new information becomes available in the future.
1
Overview
We are a biotherapeutic company focused on developing a human hepatic cell-based treatment targeting acute forms of liver failure. Our product candidate, the ELAD
System, or ELAD, is an extracorporeal human allogeneic cellular liver therapy designed to allow the patient’s own liver to potentially regenerate to a healthy state or to stabilize the patient until transplant. The ELAD System is the only liver support system containing immortal human liver-derived cells, or VTL C3A cells, to enter phase 3 clinical trials. We designed the ELAD System to supplement key aspects of normal liver function to improve patient survival. We estimate that at least 40,000 patients annually in the United States, or U.S., experience the acute forms of liver failure that may be addressed by the ELAD System, such as severe acute alcoholic hepatitis, or sAAH, surgery-induced liver failure, or SILF, and fulminant hepatic failure, or FHF, for a portion of which the ELAD System may be a life-saving therapy. Except for liver transplant, which is severely limited by the availability of organs and not available to many patients, the current standard of care for these acute forms of liver failure is primarily focused on the management of complications, which does not restore lost liver function and is associated with a high rate of mortality. The ELAD System has received orphan designation in the U.S. and Europe for the treatment of patients with acute liver failure. This designation provides tax credits for qualified clinical testing, seven years of market exclusivity in the U.S. and ten years of market exclusivity in Europe for the first orphan drug approved for a given indication. However, orphan designation does not alter the standard regulatory requirements or the process for obtaining marketing approval.
The ELAD System is currently being tested in a phase 3 randomized, open-label, multicenter, controlled, pivotal study, designed to evaluate ELAD in subjects with sAAH, referred to as VTL-308. VTL-308 is based on pre-specified and post-hoc analyses of our VTI-208 phase 3 clinical trial in alcohol-induced liver decompensation, or AILD, of which sAAH is a subset. VTI-208 was completed in 2015. Although VTI-208 failed to reach either its primary or secondary endpoints, our pre-specified and post-hoc analyses identified criteria for a group of subjects in which favorable survival trends were observed. The inclusion and exclusion criteria for the VTL-308 trial are based on these findings. We expect to enroll at least 150 subjects in VTL-308 at over 50 sites in the U.S. and Europe. As of February 28, 2017, we have enrolled 53 subjects in VTL-308 and had 39 clinical sites open for enrollment. We expect to report top-line data for VTL-308 around mid-2018. While the VTL-308 phase 3 clinical trial has been designed to show statistical significance based on a subset of pre-specified and post-hoc analyses of the VTI-208 trial, there can be no assurance that the data from the trial or that a single trial will be sufficient to support a marketing application in any country.
In early 2015, we completed enrollment of subjects in VTI-208, a phase 3 clinical trial in subjects with AILD, the majority of whom were diagnosed with sAAH. During 2014, we also initiated enrollment in VTI-210, a second phase 3 clinical trial for subjects with sAAH, and a phase 2 clinical trial, VTI-212, for subjects with FHF or SILF. The VTI-210 trial was suggested by the European regulatory authority and was intended to include subjects who had failed conventional therapy and were therefore a sicker population than the VTI-208 subjects.
The VTI-208 study enrolled 203 AILD subjects in the intention-to-treat, or ITT, population mostly in 2013 and 2014, with 96 and 107 subjects randomized to ELAD treatment and control (standard of care only) groups, respectively. In August 2015, we learned that the Kaplan-Meier analysis of the overall survival in the ITT population was not statistically different between groups. However, in a pre-specified subset of 120 subjects with Model for End-stage Liver Disease, or MELD, scores <28 that consisted of 51 and 69 subjects in the ELAD-treated and control groups, respectively, the Kaplan-Meier analysis of overall survival did approach statistical significance. In another pre-specified exploratory analysis of 101 subjects with less than the median age of 46.9 years, the Kaplan-Meier analysis of overall survival also favored the ELAD-treated subjects. Analyses of 83 subjects with MELD scores >28 and of 102 subjects greater than the median age both favored the control subjects. A subject’s MELD score is a tool for characterizing the severity of liver disease and for providing a prognosis for survival over 90 days.
These VTI-208 analyses provided the rationale for our current VTL-308 phase 3 clinical trial in sAAH. The baseline criteria for VTL-308 includes subjects with MELD <30 and age <50. In addition, as suggested by other pre-specified VTI-208 subset analyses, subjects with acute renal dysfunction, defined as serum creatinine ≥1.3 mg/dL, and severe coagulopathy, defined as an international normalization ratio, or INR, >2.5, are excluded from the current study. Baseline serum total bilirubin (a measure of liver function) also must be ≥16 mg/dL in order to ensure a sufficient degree of liver disease severity. Applying these and key safety criteria to the analysis of the primary endpoint of overall survival in the ITT population, and assuming that this prospectively-defined population behaves similarly to this subgroup of the VTI-208 study along with other assumptions outlined in the statistical plan, a sample size for VTL-308 of 75 subjects in each the ELAD and control groups is consistent with a power of at least 95%.
2
Considering the results of the VTI-208 clinical trial and in an effort to focus our personnel and financial resources, we discontinued the VTI-210 and VTI-212 clinical trials, postponed most activities associated with the preparation for filing a biologics license application, or BLA, and reduced our workforce in late 2015.
In 2008, we initiated two phase 2 trials in forms of acute liver failure in the U.S. and Europe. Based on these phase 2 trials, we selected AILD, and sAAH as indications for our VTI-208 and VTI-210 phase 3 clinical trials in the U.S. and Europe as discussed above. We also made significant improvements in the ELAD System's reusable delivery device and our proprietary production process, including (i) the incorporation of an updated version of the extracorporeal pumping unit with improved features, functionalities and reliability; (ii) new and improved cartridges for ultrafiltration, cell filters and the ELAD C3A cell cartridges; (iii) tubing sets optimized to recirculate smaller volumes of ultrafiltrate and blood through the system to reduce the risk of clotting and other potential adverse side effects; and (iv) improvements to our cell culture and growth processes to reduce cost and increase manufacturing efficiency and yield.
Vital Therapies, Inc. was formed in May 2003 to acquire the assets of VitaGen (formerly Hepatix) in a bankruptcy proceeding. Our predecessor companies developed the ELAD System, completing two pilot trials and two randomized, controlled phase 1 and phase 2 trials predominantly in subjects with FHF, but failed to attract funds sufficient to continue development of the ELAD System. Beginning in June 2003, we refocused the company to pursue regulatory approval and commercialization of the ELAD System in China. In 2007, we completed a pivotal trial in subjects suffering from several forms of liver failure, principally viral hepatitis B, in China, and we submitted an application for marketing in China. Our application is still under review in China. However, based on our current understanding of the regulatory environment in China, we do not expect activity or approval by the regulatory authorities in China unless and until we have approval in the U.S.
The ELAD System consists of four disposable ELAD C3A cell cartridges containing our human liver-derived C3A cells attached to a reusable delivery device using customized disposable tubing sets. The patient’s blood plasma is treated by our VTL C3A cells before being returned to the patient, generally in a single continuous session lasting between three and five days.
The four ELAD cartridges collectively contain about 440 grams, or approximately one pound, of VTL C3A cells from our proprietary cell bank. We employ proprietary methods designed to manufacture large quantities of these cells consistently and cost-effectively. These cells have been shown to retain many key synthetic and metabolic processes of normal human hepatocytes, the primary functional cell of the liver. As the treatment with our VTL C3A cells is not patient-specific, we avoid the costly logistical and production challenges typically associated with autologous cellular therapies. To our knowledge, other liver treatments of this type that have reached late-stage clinical trials have been either acellular or contained pig cells. We believe that human liver cells are necessary to replicate key aspects of the intricate biology of normal human liver function.
During clinical studies of the ELAD System prior to the commencement of VTL-308, over 400 subjects have received treatment with the ELAD System, including earlier configurations of the system, in eight clinical studies and through a compassionate use program. Early clinical trials of the ELAD System carried out prior to the VTI-208 clinical trial were primarily designed to identify patient populations and clinical trial designs that were appropriate to pursue in pivotal clinical studies. Although they demonstrated trends towards increased survival, most of the trials carried out prior to VTI-208 were not designed to be adequately powered to demonstrate statistically significant increased survival. For example, randomized controlled clinical trials (PS-0698 and CR-202) conducted in subjects with FHF, suggested that the ELAD System may have value in bridging subjects listed for liver transplant to transplant, thereby potentially improving survival.
Data from a 69-subject randomized, controlled clinical trial (VTIC-301) performed at two hospital centers in Beijing, China, primarily in subjects with an acute form of liver failure caused by viral hepatitis B, showed a statistically significant difference in 28-day and 56-day transplant-free survival rates in the ELAD-treated group as compared with the control group using the pre-defined Log Rank test, a statistical test that compares the survival distributions of the two study groups. This technique is widely used in clinical trials to document the efficacy of a new treatment compared to a control treatment when the measurement is the time to event (such as the time from initial treatment to death, or to a liver transplant). Data from a subset comprising the first 49 subjects in this clinical trial revealed a statistically significant difference in 84-day survival using a more sensitive analytical technique, the Wilcoxon Rank-Sum test. This test is another statistical method used in the analysis of clinical trial data that compares two populations, for example, in respect to their survival times.
Two further randomized controlled trials (VTI-201 and VTI-206) were conducted primarily in U.S. subjects to help better define the population that would be appropriate for study in pivotal clinical trials. The outcomes of these studies suggested that the maximum disease severity should be limited in subjects treated with ELAD and also that subjects in whom alcohol was the predominant factor leading to their acute liver failure were a particularly suitable population for study in pivotal clinical trials.
3
We own exclusive worldwide commercial rights to the ELAD System free of royalties. If marketing applications are submitted and approved, we intend to commercialize the ELAD System in the U.S. and Europe with a targeted sales force focusing on liver transplant centers and other specialist intensive care centers. We intend to opportunistically pursue markets outside the U.S. and Europe either through direct sales or collaborations. We also believe that the ELAD System may have potential use in other forms of acute liver failure, such as that caused by viral hepatitis B, for liver resection support and for liver transplant support, although we have generated limited clinical data to support these indications, except for hepatitis B patients in China.
We are currently the owner of record of five issued U.S. patents and over a dozen issued or allowed foreign patents, including countries in Europe, Asia and Australia. Additionally, we are the owner of record of three pending Patent Corporation Treaty international applications, as well as two pending U.S. provisional patent applications. One granted U.S. patent claims a method of using C3A cells to treat a patient’s blood. The patent has a term that extends to 2027 and may possibly be extended further if the patent is determined to be eligible for patent term extension. Additionally, a second granted U.S. patent includes claims to an extracorporeal device configuration which is cell type independent and which we believe encompasses our ELAD System. The patent has a term that extends to 2025 and may possibly be extended further if the patent is determined to be eligible for patent term extension. Moreover, if approved, the ELAD System will be eligible for 12 years of data exclusivity in the U.S. under the Biologics Price Competition and Innovation Act of 2012, or the 2012 Act. Finally, orphan designation provides market exclusivity for seven years in the U.S. and ten years in Europe upon regulatory approval, but this would run concurrently with the 2012 Act exclusivity in the U.S.
Our Strategy
Key elements of our business strategy include the following:
|
•
|
Successfully complete the ELAD System’s clinical development in sAAH subjects
. For VTL-308, we expect to enroll at least 150 subjects in an event-driven clinical design (a statistical plan that allows the study size to be adjusted according to aggregate mortality) at over 50 sites in the U.S. and Europe, and we expect to report top-line data for VTL-308 around mid-2018.
|
|
•
|
Obtain regulatory approval for the ELAD System in the U.S. and Europe
. If our VTL-308 clinical trial is statistically and clinically successful, we plan to submit a Biologics License Application, or BLA, to the U.S. Food and Drug Administration, or FDA, and a Marketing Authorization Application, or MAA, to the European Medicines Agency, or EMA. An additional phase 3 trial may or may not be required for these approvals.
|
|
•
|
Maximize the commercial potential of the ELAD System in the U.S. and Europe
. If approved, we intend to directly commercialize the ELAD System in the U.S. and Europe with a targeted sales force focusing on liver transplant centers and other specialist intensive care centers. We believe that we can price the ELAD System in a range consistent with other currently marketed lifesaving therapies, such as left ventricular assist devices, orphan biologic medications for hereditary metabolic diseases and monoclonal antibody medications for cancer.
|
|
•
|
Opportunistically explore commercial opportunities for the ELAD System in other international markets
. We have completed a trial for the ELAD System that may be considered pivotal in China. The study predominantly enrolled subjects with viral hepatitis B, and our application for marketing approval, filed in 2007, is still under review. However, we do not currently anticipate receiving approval in China prior to our receipt of regulatory approval, if any, in the U.S. or Europe. We would expect to address the commercial opportunity in China following approval in the U.S. or Europe. We also plan to evaluate commercial opportunities in Australia, Japan, India, other Asian markets, the Middle East, Brazil and Africa.
|
|
•
|
Pursue development of the ELAD System in additional indications
. If the ELAD System is approved for use in patients with sAAH, we may pursue the ELAD System’s clinical development in viral hepatitis B, FHF, SILF and bridge-to-transplant.
|
|
•
|
Technical improvements and new applications
. We plan to continue our development of the ELAD System with the incorporation of technical improvements to our ancillary delivery device, customized disposable sets, and cells. In addition, we plan to explore the development of next generation systems and other uses for VTL C3A cells. We have been exploring the potential commercialization of proteins and other C3A-produced compounds; however, to date, have not identified any economically feasible opportunities.
|
4
Our ELAD System Product Candidate
ELAD System
The ELAD System is a phase 3 investigational, extracorporeal human hepatic cell-based liver treatment designed to supplement hepatic function in order to potentially improve survival rates among patients with acute forms of liver failure. The ELAD System consists of four disposable ELAD C3A cell cartridges attached to a reusable ancillary delivery device using customized disposable tubing. The four ELAD cartridges collectively contain approximately eight thousand hollow fibers and approximately one pound of VTL C3A cells from our proprietary cell bank.
The figure below is a schematic of the ELAD System:
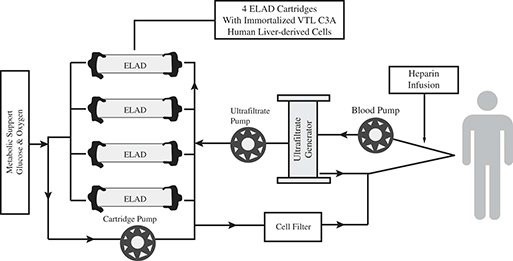
During ELAD treatment, an extracorporeal pumping unit draws blood from the subject via a central venous line which then passes into the system to generate ultra-filtrated plasma (ultrafiltrate). The subject’s ultrafiltrate is pumped through the hollow fibers of the cartridge, wherein the semipermeable membrane permits a bidirectional flow between the cells (grown between the exterior of the hollow fibers) and the ultrafiltrate (contained in the lumen of the hollow fibers). Toxins, nutrients and dissolved gases pass from the ultrafiltrate to the cells, while the potentially beneficial macromolecules and other substances synthesized by the cells simultaneously pass into the subject’s ultrafiltrate.
After circulation through the ELAD C3A cell cartridges, the ultrafiltrate passes through a 0.2-µm pore size filter, is recombined with the cellular components of the subject’s blood, and is returned to the subject via the central venous line. VTL C3A cells’ metabolic byproducts are thereby returned to the subject to be utilized or to be excreted by the renal or gastrointestinal system. This circulation can be maintained continuously for the duration of the ELAD treatment for up to five days, as determined by the treating physician. The ELAD System monitors and enables adjustment of glucose and oxygen concentrations in the ultrafiltrate, as well as temperature and other parameters, in order to maintain the viability of the C3A cells.
Our Proprietary VTL C3A Cell Bank
The liver is a complex organ comprising several different cell types to perform the majority of its biochemical functions, with hepatocytes being most widely recognized for their roles in synthesis and metabolism. Hepatocyte viability is limited when cultured or expanded outside the body as they very quickly de-diffferentiate or die. Therefore, normal hepatocytes present practical and logistical obstacles for use in a liver-assist product. Cell lines derived from liver cells can alleviate many of these practical and logistical obstacles. The specific cell line that was selected for the allogeneic ELAD System, the VTL C3A cell line, is a sub-clone of a human hepatoblastoma cell line, HepG2. The C3A cell line was developed at Baylor College of Medicine and deposited at the American Type Culture Collection. The specific cells stored in our proprietary cell banks and their progeny are referred to as VTL C3A cells. Under the right conditions, VTL C3A cells rapidly proliferate, allowing growth of the large amount of cells necessary to treat the subject with a liver support system, and with cells that remain metabolically active during treatment. Each ELAD treatment uses approximately one pound of cells.
5
Treatment with the ELAD System is not patient-specific, and our VTL C3A cells, which are derived from a single source, are used to treat all patients. This process is known as allogeneic cellular therapy. In contrast, autologous cellular therapy uses a patient’s own cells, which are manipulated in individual production batches, a costly and complex process. As a result, the production and logistics of treatment with our VTL C3A cells does not face some of the challenges commonly associated with autologous cellular therapies.
The VTL C3A cell bank has been subjected to rigorous safety testing for adventitious agents in accordance with regulatory guidance documents. This bank contains enough cells to enable our clinical development and commercialization. We own this VTL C3A cell bank exclusively and on a royalty-free basis. In addition, we have developed proprietary methods for growing, storing and optimizing the function of these cells.
Our proprietary VTL C3A cell bank is stored in three separate locations around the world for security purposes and is used as the basis for growing the cells needed for each patient at our production facility in San Diego, California.
ELAD Mechanism of Action
While the mechanism(s) of action for the ELAD System have not been fully elucidated, several mechanisms are currently under investigation. All this work has been done
in vitro,
and none has yet been related to patient clinical responses.
The VTL C3A cells may:
|
1.
|
Provide acute-phase response proteins to help dampen the pro-inflammatory environment and restore the patient’s immune responses.
The VTL C3A cells secrete several anti-inflammatory proteins, including alpha-1-antitrypsin (AAT) and interleukin-1 receptor antagonist (IL-1Ra), the latter of which is upregulated in response to pro-inflammatory cytokines typically found in alcoholic hepatitis patients. Further, VTL C3A cell-secreted factors were shown to reduce levels of pro-inflammatory interleukin 1-beta (IL-1beta) in activated macrophage cultures.
|
|
2.
|
Provide factors which have been shown to prevent hepatocyte and endothelial cell death, through dampening oxidative stress and/or stimulating survival.
The VTL C3A cells secrete a number of recognized factors that are involved with regeneration and have been shown,
in vitro
, to prevent death and promote survival of hepatocytes including soluble Fas receptor and amphiregulin (a recognized potent mitogen during liver regeneration in small-animal models of partial hepatectomy). These factors have also been shown to increase the ratio of reduced to oxidized glutathione reserves (glutathione being one of the most potent intracellular anti-oxidants). VTL C3A cells secrete a number of proteins involved in angiogenesis such as vascular endothelial growth factor, placental growth factor and angiopoietin, which may be beneficial by improving vascularity in damaged liver sinusoids as well as in other organs. VTL C3A cell-secreted proteins were shown
in vitro
to prevent cell death in endothelial cells and to reduce intracellular oxidative stress.
|
|
3.
|
Produce blood coagulation factors to address blood clotting imbalances that are common in alcoholic hepatitis patients.
Blood coagulation factors, Factor V, Factor VII, Factor VIII, Factor IX, Factor X, Factor XI, Factor XII, Factor XIII, fibrinogen, tissue factor, tissue factor pathway inhibitor, prothrombin, antithrombin III, Protein C, kininogen, prekallikrein, 2-macroglobulin, plasminogen,and plasminogen activator inhibitor-1 have been shown to be produced by the VTL C3A cells.
|
|
4.
|
Assist in in the restoration of liver function by providing liver-specific metabolism and detoxification capabilities.
The VTL C3A cells express messenger RNA, or mRNA, for cytochrome P450, or CYP, isoenzymes CYP1A2, CYP2C9, CYP2C19, CYP2D6, CYP3A4 and CYP3A5, which are collectively responsible for metabolizing nearly 90% of all drugs. Moreover, this CYP expression appears to respond dynamically as evidenced by different expression patterns in VTL C3A cells exposed to different clinical subjects.
|
While a statistically significant reduction in bilirubin has been demonstrated in subjects over the three to five days of ELAD treatment, because the VTL C3A cells lack the transporters required for unconjugated bilirubin uptake, the metabolistic pathway of bilirubin reduction is not supported through our
in vitro
studies. However, bilirubin has been shown to be non-specifically sequestered by the VTL C3A cell membranes, which may help contribute to reducing overall bilirubin levels in ELAD-treated subjects.
VTL C3A cells have also been shown to express mRNA for bile acid gene targets involved in synthesis, conjugation and transport functions. Bile acid metabolism appears to be moderate in comparison to the cholestatic environment (a condition in which substances normally excreted into bile are retained) of alcoholic patients, based on initial studies; however, total bile acid levels trended lower, decreased more rapidly, and showed enhanced secondary bile acid conjugation over 5 days in a survey of subjects receiving ELAD treatment compared to control subjects.
Further studies are continuing to characterize ELAD's mechanisms of action.
6
Differentiating Factors of the ELAD System
Unlike other potential therapies developed for acute forms of liver failure in the past, we believe the ELAD System has a unique combination of attributes:
|
•
|
Biologically active
. The ELAD System contains biologically active VTL C3A cells and is designed to replicate many liver functions. We believe that an acellular solution to liver failure is unlikely to effectively replace lost liver function. We believe that a cellular approach like ours, capable of replicating key biologic processes, is best able to provide the requisite flexibility and breadth of function to sufficiently supplement liver function and improve survival in patients with acute liver failure.
|
|
•
|
Human cellular therapy
. The ELAD System is based on human cells, which confer a considerable advantage over non-human, animal-based cell therapies. Given the widespread availability of animal tissues, much work has been done on the use of animal liver cells, often derived from pigs, to treat humans with liver failure. While immunological risk is always present in cellular therapy, the use of non-human animal tissues presents greater immunological risk compared to human cellular therapy. Humans possess naturally occurring antibodies that react with antigens on porcine cell surfaces. These antibodies can mount an immediate attack in the presence of porcine cells, causing these cells to rapidly lose function and die. Moreover, repeated treatments with a porcine cell may cause subsequent immune responses to become increasingly severe. The infusion of porcine enzymes into a patient’s blood stream also poses immunologic risk. We are not aware of any FDA-approved, non-human animal-based cellular therapy for use in patients.
|
|
•
|
Commercially scalable
. Our VTL C3A cells used in the ELAD System are immortal and can be expanded in quantities to scale production. Each set of four cartridges used to treat a single patient is grown in a production process that takes up to two months. The process is carefully controlled and is performed under ultra-clean conditions to avoid contamination in our current Good Manufacturing Practices, or cGMP, compliant production plant. The process is scalable by modular units.
|
|
•
|
Minimal manipulation needed by site
. Prior to shipment, the ELAD cartridges are put into a dormant state and shipped under cool conditions. They have been validated to survive for up to 60 hours before being used for treatment. When the hospital receives the cartridges, they are unpacked by our ELAD System specialists on site, placed on the system, flushed with saline and are ready to be used for patient treatment. Our VTL C3A cells usually remain viable for the duration of the patient treatment.
|
Liver Failure
The liver performs a wide variety of vital life functions including metabolic, regulatory, detoxification and synthetic activities. The primary liver cell, the hepatocyte, is believed to be responsible for approximately 500 or more specific biologic processes. In addition, the liver also serves as a reservoir for immune cells which clear the blood of pathogens. As a result, the liver’s failure to perform its normal role can have devastating or fatal consequences. Causes of liver failure are numerous, and the condition is typically described in terms of rapidity of onset. The two main categories are acute liver failure and chronic liver failure. In the U.S., according to the Center for Disease Control, chronic liver disease and cirrhosis represented the twelfth leading cause of death in 2014. In China, where viral hepatitis is endemic, liver and liver-related disease including liver cancer and hepatitis B represented the fifth leading cause of death in 2014.
Alcohol-Induced Liver Decompensation (AILD) and Severe Acute Alcoholic Hepatitis (sAAH)
AILD arises when the cause of the acute liver decompensation appears to be directly related to excessive consumption of alcohol. A specific, well-defined subset of AILD is sAAH, generally defined as progressive inflammatory liver disease, leading to an acute form of alcohol-induced liver injury that occurs with the consumption of large amounts of alcohol in patients with relatively mild, underlying chronic alcoholic liver disease. The majority of subjects enrolled in our studies of AILD meet the definition of sAAH.
Various degrees of fibrosis and hepatitis are present in AILD patients. Those patients with characteristics of acute alcoholic hepatitis, or AAH, and a Maddrey Discriminant Function (a calculation used to predict the prognosis of alcoholic hepatitis) of ≥32 are deemed to have sAAH. A second subset of AILD patients (non-AAH AILD) may have underlying chronic liver disease due to other etiologies, but the cause of their acute decompensation is considered to be related to excessive alcohol consumption. In sAAH, there appears to be sufficient hepatocyte mass to allow hepatic regeneration and reversal of the decompensation. It can be discriminated from patients with end-stage liver disease by measurements of liver size using imaging techniques such as ultrasound or CT scan as they tend to present with enlarged livers, rather than with the shrunken livers characteristic of subjects with end-stage liver disease.
7
Treatment options for patients with sAAH are limited. In particular sAAH patients with a Maddrey Discriminant Function of >32 have a poor prognosis, with 90-day survival of around 50%. Regimens that have been used for at least the last 40 years, including corticosteroids, theophylline with corticosteroids, pentoxifylline and infliximab, have had no significant effect on the long-term survival of patients with sAAH. Steroid use has been associated with an increased rate of infections, a frequent complication of liver failure. Other contraindications to steroid use in patients with sAAH include active gastrointestinal bleeding, renal failure, acute pancreatitis, active tuberculosis, uncontrolled diabetes and psychosis. Subjects who do not respond to seven days of steroid therapy have a particularly dismal prognosis, with six-month survival rates of less than 25%. A major study of more than 1,100 subjects with a clinical diagnosis of sAAH demonstrated a reduction in 28-day mortality in subjects administered steroids that did not reach statistical significance, with no improvement in survival at 90 days or one year. This study also revealed no survival benefit at any time point for pentoxifylline relative to placebo. Typically, subjects with sAAH are not eligible for a liver transplant until at least six months of sobriety has been demonstrated.
The Department of Health and Human Services in the U.S. estimates that for 2014 the number of hospital admissions related to sAAH in the U.S. was approximately 102,000, with approximately 15,000 of these admissions identifying sAAH as the primary diagnosis. In addition, approximately 323,000 hospital admissions occurred in 2014 related to alcoholic cirrhosis, alcohol liver damage not-otherwise-specified or alcoholic fatty liver, with approximately 50,000 hospital admissions identifying these conditions as the primary diagnosis. We believe that a subset of these patients have a form of non-sAAH AILD that may be treatable with the ELAD System. Incidence rates for both sAAH and non-sAAH AILD appear to be similar in Europe.
Acute-on-Chronic Liver Failure (ACLF)
Hepatocellular damage, secondary to a variety of insults (infectious agents, alcohol, exogenous drugs autoimmunity, non-alcoholic fatty liver disease, non-alcoholic steatohepatitis etc.), can result in chronic liver disease, if the underlying etiology is not effectively treated. This condition is characterized histopathologically by increasing degrees of fibrosis and cirrhosis, and frequently remains subclinical or undiagnosed. Often as a result of a secondary insult, the liver can decompensate, leading to a life-threatening disorder known as acute-on-chronic liver failure, or ACLF.
The damage to the liver from continuing insults causes the gradual development of fibrosis in the liver over time, which results in a decrease of both liver function and the ability to regenerate after decompensation. The fibrosis progresses to cirrhosis when this process continues for many years. The progression of fibrosis to cirrhosis results in a shrunken liver, distortion of hepatic lobules, and continued loss of hepatocytes (due to replacement with fibrotic tissue) that leads to progressive and recurrent episodes of decompensation. This progressive loss of hepatocyte mass impairs the liver’s inherent ability to regenerate following decompensation.
Fulminant Hepatic Failure (FHF)
Another form of acute liver failure is FHF, a relatively rare condition characterized by a rapid deterioration of liver function with altered mental state and coagulopathy in individuals without known pre-existing liver disease. The most frequent causes include drug or toxin-induced liver injury, viral hepatitis, autoimmune disease and hypoperfusion. Two thousand cases of FHF are estimated to occur in the U.S. each year. The standard of care includes liver transplantation, and these patients get priority on the liver transplant list although they tend to progress very rapidly and may succumb to their disease before a suitable organ becomes available. We believe the ELAD System may provide these patients with a bridge-to-transplant, or potentially, recovery without transplantation.
Surgery-Induced Liver Failure (SILF)
Another form of acute liver failure is SILF, which is comprised of three varieties, as follows:
|
1.
|
Primary Graft Non-Function, which occurs when a newly transplanted liver fails to function. This is a life threatening medical emergency, and can lead to death if a new organ does not become available quickly. We believe the ELAD System may provide patients with a bridge-to-transplant until a second liver becomes available.
|
|
2.
|
Small-For-Size or Split Liver Transplant occurs when the transplanted liver is functioning, but may be too small to sustain the patient, either because only a small donor liver was available, or because a live person donated a portion of their liver for transplantation. We believe the ELAD System may be able to support the patient’s liver function until the donated organ regenerates to a size large enough to become independent of external support. Moreover, the ELAD System may also enable transplantation of smaller liver fragments than typically used, potentially expanding the available pool of donor organs.
|
8
|
3.
|
Other forms of SILF. Primary liver cancer can sometimes be cured by resecting the cancerous part of the liver after which the remaining liver regenerates to full size. Currently, surgeons will typically only resect up to 50% of the liver in order to avoid death from liver failure. However, more extensive resections occasionally occur, and resection of smaller portions can also lead to liver failure. We believe the ELAD System may be able to support these patients while their liver regenerates and may also enable surgeons to perform larger tumor resections.
|
We estimate that the first two categories of SILF account for several hundred patients a year in the U.S., while the third category could represent an annual population of 10,000 or more cases a year in the U.S.
Chronic Liver Failure
Chronic liver failure refers to a gradual loss of liver function and is usually characterized by the presence of widespread cirrhosis, which refers to the replacement of normal liver tissue by fibrosis, scar tissue and regenerative nodules. As normal liver tissue is destroyed, the organ gradually fails to perform its normal metabolic, regulatory and synthetic functions. Unfortunately, damage from cirrhosis cannot be reversed, and lost liver function can only be regained through transplantation. For this reason, we do not believe that the ELAD System would be effective for cirrhotic patients other than possibly to bridge these patients to transplant.
Limitations of Currently Available Treatment Options for Acute Forms of Liver Failure
Given the liver’s complexity, there are no simple or widely effective medical solutions to acute forms of liver failure. The only long-term cure for acute liver failure is surgical transplantation. As published by the U.S. Department of Health and Human Services' Organ Procurement and Transplantation Network, there were 7,127 liver transplants performed in the U.S. in 2015. Also, according to a research report on the 2014 U.S. organ and tissue transplant cost estimates from Milliman, one of the world's largest providers of actuarial and related product services, the average billable charge for a liver transplant in 2014, including the one month before surgery and six months after surgery, was $739,100. There are approximately 15,000 patients currently on the transplant waiting list and approximately 1,400 patients die while waiting each year. Similarly, there are approximately 7,000 liver transplants performed per year in Europe. Outside of transplant, current therapy is defined by the treating facility and is mostly supportive and designed to manage the symptoms and complications associated with acute liver failure.
Pharmaceuticals
N-acetylcysteine is approved by the FDA for the prevention of acute liver injury following the ingestion of toxic amounts of acetaminophen. Other treatments, including steroids and pentoxifylline, are often used off-label to manage symptoms associated with acute forms of liver failure, although steroids in particular have been shown to increase the risk of potentially fatal infections. Results from the Steroids or Pentoxifylline for Alcoholic Hepatitis study, or STOPAH, were presented at the American Association for the Study of Liver Disease, or AASLD, meeting in November 2014. STOPAH enrolled 1,103 subjects with sAAH at 65 sites in the U.K., but failed to demonstrate any significant benefit in the primary analysis of overall survival for subjects treated with either steroids, pentoxifylline or a combination of the two at one, three or twelve months, as compared with placebo. In a secondary, multivariate analysis of the data, a small benefit was observed for those subjects taking steroids at one month, although this benefit was not seen in multivariate analyses at either three months or at twelve months. Despite the availability of these treatments, the mortality rate for acute forms of liver failure remains above approximately 40%. We are not aware of any mechanisms for pharmacologically addressing liver failure specifically or restoring lost liver function.
Liver Support Devices
Two commercially available liver dialysis systems, MARS from Baxter (formerly Gambro) and Prometheus from Fresenius, have undergone extensive clinical development. Another company, Hepa Wash GmbH has begun a limited market introduction of an albumin dialysis system in Europe, and HepaNet has introduced the OPAL system, an evolution of the MARS albumin dialysis system in Germany. All rely on not only traditional dialysis circuits to remove water-soluble toxins, but also albumin dialysis circuits to remove albumin-bound molecules. To our knowledge none of these non-cellular systems has shown an improvement in long-term survival among patients with liver failure. It was also recently reported that a team from the Institute for Liver and Digestive Health, University College London and Yaqrit Ltd is planning to initiate a clinical trial in decompensated liver disease for a novel liver dialysis (non-bioartificial) system to be known as YAQ-002 incorporating albumin dialysis along with selective adsorption technology.
9
Clinical Experience with the ELAD System
The following table summarizes clinical trials using the current configuration of the ELAD System:
|
Trial
|
Date
|
Study Design
|
Indication(s)
|
Sites*
|
Location(s)
|
Total
Subjects
Enrolled
|
||||||
|
VTL-308
(phase 3)
|
Commenced May 2016
|
Randomized, controlled
|
sAAH
|
50+ planned
|
U.S., Europe
|
Minimum of 150
|
||||||
|
VTI-208
(phase 3)
|
2013-2015
|
Randomized, controlled
|
AILD/sAAH
|
59
|
U.S., Europe, Australia
|
203
|
||||||
|
VTI-210
(phase 3)
|
Commenced November 2014 and terminated August 2015
|
Randomized, controlled
|
sAAH
|
46
|
U.S., Europe
|
18
|
||||||
|
VTI-212
(phase 2/3)
|
Commenced June 2014 and terminated August 2015
|
Single-arm in phase 2 component
|
FHF and SILF
|
19
|
U.S.
|
8
|
||||||
|
VTI-206
(phase 2b)
|
2009 – 2011
|
Randomized, controlled
|
AILD and other
|
26
|
U.S., Europe
|
62
|
||||||
|
Compassionate-
use program
|
2008 – 2010
|
Single-arm
|
Various
|
8
|
U.S., U.K., Singapore, Saudi Arabia
|
18
|
||||||
|
VTI-201
(phase 2a)
|
2008 – 2009
|
Randomized, controlled
|
ACLF and other
|
6
|
U.S.
|
18
|
||||||
|
VTIC-301
(Pivotal)
|
2006 – 2007
|
Randomized, controlled
|
Various, primarily viral hepatitis
|
2
|
China
|
69
|
||||||
|
CR-202
(phase 2)
|
2001 – 2003
|
Randomized, controlled
|
FHF
|
8
|
U.S., U.K.
|
19
|
||||||
|
PS-0698
(phase 1)
|
1999 – 2000
|
Randomized, controlled
|
FHF
|
6
|
U.S., U.K.
|
25
|
||||||
______________________
|
*
|
For VTL-308, represents numbers of clinical sites which will fluctuate throughout the trials in part based on resources and competition between trials for subjects.
|
The ELAD System’s Clinical Development in AILD/sAAH
VTI-208
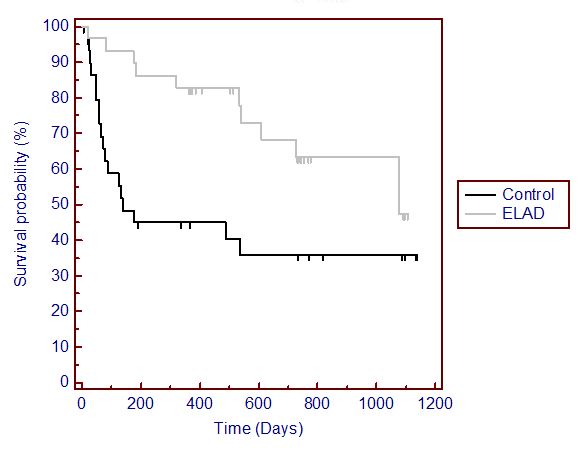
In August 2015, we announced that the VTI-208 clinical trial did not achieve its primary endpoint of overall survival through study day 91. In the extended follow-up of the VTI-208 subjects, referred to as VTI-208E, we have an additional seventeen months of survival data as of December 31, 2016. The year end 2016 survival data continues to support the August 2015 conclusions (N=203; Kaplan Meier: p-value 0.868, hazard ratio 1.029).
10
Kaplan Meier Curve for VTI-208/VTI-208E Overall Survival at December 31, 2016
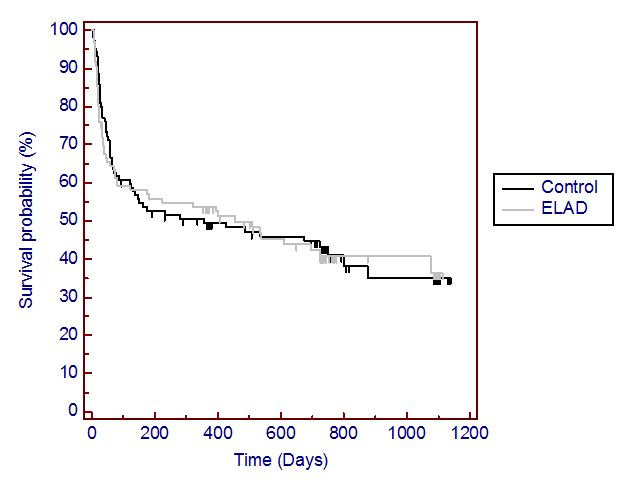
Adjusting for two subjects who withdrew and four lost to follow-up, 79 subjects remained in the VTI-208E extension study at December 31, 2016 and are being monitored annually for survival, transplant and cancer for up to five years. As is frequently the case in large trials with lengthy follow-up, 36 of the subjects are late for follow-up visits. In these cases, the prior follow-up data for these subjects were used in our analysis.
Pre-specified subgroup analyses of overall survival were conducted on medically-pertinent baseline demographic factors to identify the extent of influence these known factors had, if any, on the overall study outcome. These factors had been previously identified as potential influences on outcome based on scientific considerations, including the outcomes of the STOPAH study (Thursz 2015), results from the CLIF-SOFA consortium (Arroyo 2015), and previous ELAD clinical data. Results of these subgroup analyses revealed that overall survival outcomes in the ITT population were substantially influenced by MELD score and, to a lesser degree, age.
The MELD score is a numerical scale, ranging from 6 (less ill) to 40 (gravely ill), developed for use in liver transplant candidates age 12 and older. It gives each person a ‘score’ (number) based on how urgently he or she needs a liver transplant within the next three months. The number is calculated by a formula using three routine lab test results:
- bilirubin, which measures how effectively the liver excretes bile;
- INR (prothrombin time), which measures the liver’s ability to make blood clotting factors; and
- creatinine, which measures kidney function (impaired kidney function is often associated with severe liver disease).
The specific formula is as follows:
MELD = 3.78×ln[serum bilirubin (mg/dL)] + 11.2×ln[INR] + 9.57×ln[serum creatinine (mg/dL)] + 6.43
The MELD score has also been used to assess mortality risk in other types of liver dysfunction, including sAAH. For example an sAAH patient with a MELD score of 28 is projected to have a 54% chance of dying over a period of 90 days.
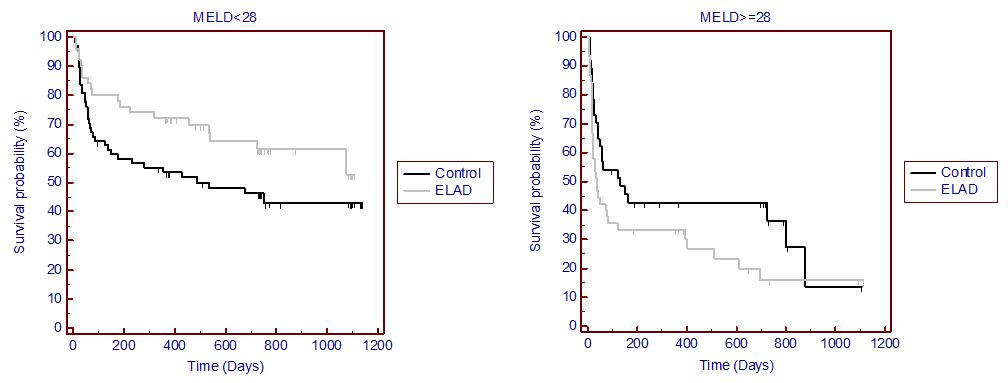
The pre-specified subgroup analysis of MELD, evaluated as a dichotomous variable of <28 and ≥28, identified two distinct populations with respect to ELAD treatment outcomes versus the control group: in subjects with lower MELD scores, treatment outcomes favored ELAD, and, in the similar population with higher MELD scores, outcomes shifted in favor of the control group. Data revealed clinically-meaningful differences as shown by p-value and hazard ratio, or HR, favoring ELAD in the primary endpoint of overall survival up to at least study day 91 in a large subset of subjects with MELD scores <28 (N=120; Kaplan Meier at December 31, 2016: p-value=0.076, HR 0.604). This was also observed in the secondary endpoint of proportion of survivors at study day 91 (N=120; survival: ELAD 80.4% versus control 65.2%, Pearson's chi-squared: p-value=0.068). For those subjects with MELD scores ≥28, the opposite outcome was observed in overall survival (N=83; Kaplan Meier at December 31, 2016: p-value=0.074, HR 1.612) and in the secondary endpoint of proportion of survivors at study day 91 (N=83; survival: ELAD 35.6% versus control 55.3%, Pearson's chi-squared: p-value=0.072).
11
Kaplan Meier Curve for VTI-208/VTI-208E Overall Survival MELD <28 and >=28 at December 31, 2016
A more granular post-hoc analysis of MELD score parameters as compared to outcome revealed an important directional association between MELD scores and relative overall survival outcomes. These additional pre-specified and post-hoc analyses helped to discriminate the contribution of each of the individual MELD parameters (bilirubin, creatinine, and INR) on these dichotomized outcomes. Results indicate that higher creatinine and INR levels, reflective of kidney injury and coagulopathy, respectively, are the key drivers associated with less favorable ELAD treatment outcomes compared with controls. The reduced tolerance of subjects with evidence of acute kidney injury and coagulopathy appears to be due to an interventional effect of the extracorporeal administration of ELAD. The limits set in VTI-208 to control the impact of extracorporeal treatment on subjects with secondary organ dysfunction, which had been established based on these critical indicators from our prior datasets, have been set lower in VTL-308.
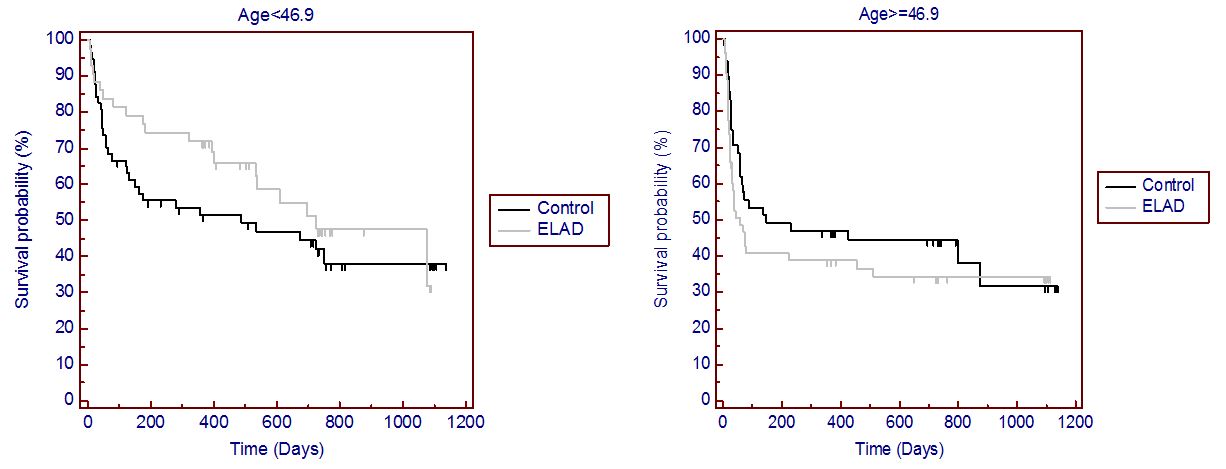
Although less pronounced than the impact of MELD scores on overall survival, subject age was also identified in a pre-specified subgroup analysis as a demographic factor found to influence study outcomes. In subjects with less than the median age of 46.9 years, the Kaplan-Meier analysis of overall survival favored ELAD (N=101; Kaplan Meier at December 31, 2016: p-value=0.271, HR 0.731). This was also observed in the secondary endpoint of proportion of survivors at study day 91 with ELAD survival of 81.4% versus control survival of 67.2% (Pearson's chi-squared: p-value=0.112). In those subjects with greater than the median age, the opposite outcome was observed in overall survival. This finding is consistent with the liver resection literature indicating that the liver’s capacity for regeneration diminishes with age. This effect appears to be somewhat exacerbated if there is evidence of acute kidney injury or coagulopathy.
12
Kaplan Meier Curve for VTI-208/VTI-208E Overall Survival Age <46.9 and >=46.9 at December 31, 2016
VTI-210
The VTI-210 clinical trial was based on a design suggested by the European regulatory authority and sought to only include subjects who had failed conventional therapy. However, the trial was voluntarily discontinued by us after only 18 subjects were enrolled when our August 2015 analysis of the VTI-208 data suggested that the VTI-210 enrollment criteria were unlikely to lead to a successful trial outcome. In particular, within the VTI-208 data set, healthy secondary organ function at baseline appeared to be a critical determinant of positive outcome with ELAD. In contrast, the VTI-210 criteria allowed subjects to be enrolled with severe secondary organ dysfunction.
It is difficult to draw any conclusions from the small sample of subjects enrolled in VTI-210. That said, there were no significant differences in mortality between the ELAD-treated and control groups either at day 28 or day 91, with three deaths in each group at day 28 and one additional death in the ELAD-treated group at day 91. Additional deaths occurred in both groups after 91 days, consistent with the very low survival expectations of patients who have failed conventional therapy. The adverse event profile was consistent with findings in other ELAD studies and typical for subjects treated with extracorporeal therapies.
VTL-308
Based on our pre-specified and post-hoc analyses of VTI-208 subsets, we initiated a new phase 3 clinical trial in sAAH, referred to as VTL-308, in early 2016. VTL-308 is a phase 3 randomized, open-label, multicenter, controlled, pivotal study, designed to evaluate the ELAD System in subjects with sAAH who meet criteria based on the data from the pre-specified and post-hoc analyses of the VTI-208 clinical trial.
The key changes from the VTI-208 clinical trial protocol include restrictions on subjects’ age, MELD score and the three components of the MELD score associated with kidney dysfunction (creatinine), blood clotting dysfunction (INR) and liver function (bilirubin). The VTL-308 inclusion criteria have been established to reflect the same study population as that enrolled in a subset of the VTI-208 population with baseline criteria including MELD <30, age <50, INR ≤2.5, creatinine <1.3mg/dL and serum total bilirubin ≥16mg/dL. Data from this post-hoc analysis indicated that there was a statistically significant difference between treated and control subjects in the primary endpoint of overall survival in this population (N=60; Kaplan Meier at December 31, 2016: p-value=0.019, HR 0.391). This was also observed in the secondary endpoint of proportion of survivors at study day 91 (N=60; survival: ELAD 93.1% versus control 61.3%, Pearson's chi-squared: p-value=0.004).
The Kaplan-Meier graph of this subset in VTI-208 as of December 31, 2016 is shown below. The hazard ratio is maintained below 0.4 and the significant separation between the survival of treated and control patients remains evident. It should be noted that there remain relatively few subjects with three year follow up data. One of the four subjects with three year data in the ELAD-treated group died at day 1,075, an event that can be seen as an apparent sharp drop in the treated subject curve, as this represents 25% of the four subjects that have reached this milestone. As we continue to collect data, the shape of the curves will continue to change as the data mature and more subjects achieve the milestones. While there is no guarantee that VTL-308 will replicate this result, we believe these VTI-208 subset results are a sound basis to proceed with VTL-308.
13
Kaplan Meier Curve for VTI-208/VTI-208E Overall Survival MELD <30, Age <50, INR <=2.5, creatinine <1.3mg/dL and bilirubin >=16 mg/dL at December 31, 2016
The sample size for the VTL-308 study was defined by applying these criteria to the analysis of the primary endpoint of overall survival in the ITT population, and assuming: 1) that this prospectively-defined population behaves similarly to this subgroup of the VTI-208 study; 2) the use of a log-rank test (Kaplan Meier) comparing two survival curves with a two-sided significance level of 0.05; 3) exponential survival curves with proportional hazards; 4) uniform accrual with an accrual time of at least 720 days and a minimum follow-up time of 90 days; and 5) a drop-out rate of 10%. Based on these parameters, a sample size for VTL-308 of 75 subjects per each the ELAD-treated and control groups is consistent with power of at least 0.95 with estimated median survival times of 438 and 175 days, respectively.
In November 2015, we received written responses from the FDA to our Type C meeting request on the planned VTL-308 clinical trial. At the FDA's suggestion, we have incorporated an event-driven feature into the trial design consistent with the primary endpoint of overall survival. Under the modified design, enrollment will continue until at least 150 subjects have been enrolled and 55 events have occurred, consistent with the event rate seen in the target subpopulation from VTI-208. As we approach the enrollment of 150 subjects in the VTL-308 clinical trial, we will assess the overall event rate up to that point and make a determination as to whether additional subjects would need to be enrolled in order to meet the minimum number of events called for in our statistical plan.
We expect to enroll subjects at about 50 sites in the United States and Europe. Many of the sites have been selected based on their high enrollment in the VTI-208 trial or their demonstrated capability to enroll these types of subjects. We expect to report top-line data for VTL-308 around mid-2018. The VTL-308 phase 3 has been designed to demonstrate statistical significance based on the subset results of the VTI-208 trial; however, there can be no assurance that the trial will be successful or that a single trial will be sufficient to support a marketing application in any country.
The ELAD System’s Clinical Development in Acute Flare of Viral Hepatitis
VTIC-301
. Between 2006 and 2007, we enrolled 69 subjects with acute-on-chronic liver failure (ACLF) in a randomized, controlled open-label trial at two hospitals in Beijing, China. Inclusion criteria focused the trial’s enrollment on subjects anticipated to have a 50% chance of death by 84 days, and the majority of enrolled subjects were experiencing an acute flare of viral hepatitis. The study was designed to enroll 120 subjects but was terminated early by one of the hospital’s ethics committee because, in light of the results discussed below, it would have been unethical to continue to treat control subjects with standard of care alone. Endpoints included survival at 14, 28, 56 and 84 days, as analyzed using a log-rank method.
A significant protocol amendment was enacted after the enrollment of the first 49 subjects, in which inclusion criteria were changed, reducing the severity of disease, and a shorter ELAD System treatment time was recommended. This change in study design resulted in far fewer deaths or transplants in the second subset of 20 ELAD-treated and control subjects. A revised statistical plan was prepared to accommodate these differences in subject populations. Separate analyses were performed on the 49-subject subset and the full 69-subject population, and additional statistical analysis techniques were proposed, such as the use of Wilcoxon rank-sum techniques to analyze continuous variables such as survival time.
14
Analysis of the first 49 subjects (32 subjects randomized to be treated with the ELAD System for three days along with standard of care for the treating institution and 17 subjects randomized to be treated with standard of care alone) revealed the following:
|
•
|
significant differences in 28 and 56-day survival using the log-rank test (p=0.015 and 0.026, respectively); (log-rank was not significant at 14 and 84 days, p=0.074 and 0.058, respectively);
|
|
•
|
significant differences in 84-day survival using the Wilcoxon test (HR=0.45; p=0.049); and
|
|
•
|
no unexpected safety issues.
|
Generally, the serious adverse events reported in this study were reflective of the severity of disease and co-morbidities present in the patient population. There were 16 post-treatment adverse events in eight of the 32 treated subjects that the investigators reported as possibly or probably related to treatment.
These efficacy results are depicted in the below Kaplan-Meier curve:
Kaplan Meier Curve for VTIC-301 Transplant Free Survival up to Study Day 84

Analysis of all 68 subjects treated (44 subjects randomized to be treated with the ELAD System for one to three days along with standard of care for the treating institution and 25 subjects randomized to be treated with standard of care alone; note one control subject withdrew consent immediately following randomization and is not included in this analysis, so only 24 controls are included for a total of 68 subjects) revealed the following:
|
•
|
Significant differences in 28-day survival using the log-rank test (p=0.015);
|
|
•
|
No significant differences in 14, 56 and 84-day survival using the log-rank test; and
|
|
•
|
No unexpected safety issues.
|
Based on these results, it was concluded that the Wilcoxon test is a more sensitive technique to elucidate differences between groups in the ELAD System clinical trials, and that a more severely diseased population and more extended treatment times should be evaluated in future clinical studies.
One further observation from the 49 subjects in the first part of this study was that the ELAD System can significantly decrease bilirubin levels, an important biomarker of liver function in patients with ACLF. The overall magnitude of the decrease in mean end of treatment total bilirubin in the ELAD group was 25.1% (17.5 to 13.1 mg/dL) compared to an increase in the control group of 36.8% (17.1 to 23.4 mg/dL). Serum sodium, another biomarker associated with survival in subjects with ACLF, also was significantly improved in the subjects treated with the ELAD System relative to control subjects.
These China pivotal trial data formed the basis of a submission for marketing approval to the China FDA, or CFDA, in September 2007. It should also be noted that this study was not designed, and will not be used, as a pivotal trial to support approval of the ELAD System in the U.S. and Europe.
15
Subsequent to the completion of the VTIC-301 clinical study, an additional protocol was prepared by the treating physicians to explore the long-term survival of subjects enrolled in this study. Following the grant of informed consent, subjects enrolled in VTIC-301 were contacted and invited to return to the treating hospital for examination for recurrence of liver disease or the incidence of cancer. This study was carried out in 23 and 22 subjects, respectively, three and five years following initial randomization.
These data from the first 49 subjects suggest that the survival benefit (statistically significant at three years and five years, Kaplan Meier: p<0.05, log-rank) afforded to those subjects treated with the ELAD System is maintained over a three and five-year period relative to those subjects in the control group. These trends are depicted in the Kaplan-Meier curves below:

While these follow-up analyses were not prospectively defined in the VTIC-301 protocol, we believe they provide valuable information on the long-term survival of this group of patients.
The results of VTIC-301 were submitted to the CFDA for marketing approval in September 2007. However, a regulation enacted in 2009 prevents the approval of novel foreign medical products until they are approved in their home markets first. Accordingly, we would not expect activity or approval by the regulatory authorities in China unless and until we have approval in the U.S.
Commercialization Strategy and Organization
Given our stage of development, we have not yet established a commercial organization or distribution capabilities. If approved, we intend to directly commercialize the ELAD System in the U.S. and Europe with a targeted hospital sales force and to either commercialize directly or utilize a variety of types of collaboration in other markets.
Sales, Marketing and Reimbursement
Following FDA and/or EMA approval, if any, we intend to launch the ELAD System commercially in the U.S. and Europe, respectively. We expect to direct our initial sales and marketing efforts at those sites which will have participated in our phase 3 clinical trials, and which we anticipate will be about 50 in number in the U.S. and Europe. Subsequently, we plan to gradually expand our focus in the U.S. to approximately 100 liver-transplant centers, as well as to another 100 specialist intensive care centers with a similar penetration in Europe. We expect that our commercial infrastructure would be comprised of a targeted hospital sales force led by several experienced sales management personnel, an internal marketing and medical affairs staff, and a reimbursement support team. We currently intend to focus our initial commercial efforts on the U.S. and European markets, which we believe represent the largest and most readily addressable market opportunities for the ELAD System. In addition, we believe that Australia, China, Japan, India, other Asian markets, the Middle East, Brazil, and Africa represent significant opportunities because of the prevalence of liver disease in these geographies, and we intend to pursue the commercialization of the ELAD System in certain of these markets through collaborations.
16
We expect the ELAD System to be reimbursed as an in-patient drug in the U.S. For patients eligible for Medicare, who we anticipate to constitute a minority of the ELAD System-addressable patients, reimbursement to the hospital is expected to occur under a diagnosis related group, which may be eligible for a New Technology Add-on Payment and outlier payments. We have begun the process to request appropriate codes and groupings for the ELAD System therapy from the Centers for Medicare & Medicaid Services, which may take several years to complete, if successful. We have been notified by the American Medical Association, or AMA, that a temporary, or Category III, Current Procedural Terminology, or CPT, code for physician care oversight of an extra-corporeal liver system was accepted in February 2015, and which became effective on January 1, 2016. However, implementation of a permanent, or Category I, CPT code with a predetermined physician payment value is a lengthy process and is not expected to be complete until several years after potential marketing approval in the U.S. We also expect to work with private payors to develop appropriate case-rates for the ELAD System reimbursement in the U.S. We believe we will ultimately be able to price the ELAD System in a range consistent with other currently marketed life-saving therapies, such as left ventricular assist devices, orphan biologic medications for hereditary metabolic diseases, and monoclonal antibody medications for cancer.
Manufacturing and Supply
Our manufacturing facility is licensed as a drug and medical device manufacturer by the California Food and Drug Bureau. This facility was remodeled in 2014 in order to expand manufacturing capacity to support worldwide clinical trials and early marketing demands for the ELAD System. This remodel increased manufacturing clean room, quality control laboratory, and warehouse and refrigeration space. The increased clean room space will allow modular increases in the ELAD cartridge manufacture.
At our facility, we manufacture the ELAD System, which is comprised of our proprietary VTL C3A cells, cartridges and the bedside unit. The system contains both reusable and disposable medical device components. We source certain components of the ELAD System from third-party suppliers. Most components of our ELAD System are FDA-cleared and CE marked. In a few cases, we manufacture a device or a device component ourselves. Based on discussions with the regulatory authorities, we have determined that all components will have to be submitted for approval for use with the ELAD System as part of the BLA.
Training and Support
We also expect to deploy a training and support team at the liver transplant and specialist intensive care centers that our sales and marketing team are expected to target. During the initial commercialization period, it will be essential for us to have our own trained staff present during the delivery of the ELAD System therapy. This may entail the construction and operation of training centers and will require the hiring of personnel capable of being adequately trained.
All biopharmaceutical production activities must be conducted under cGMP, the standards established by the FDA for pharmaceutical and biologics production. Medical devices must be manufactured in accordance with pertinent device regulations. The equipment used in the manufacturing process is based on designs typically encountered in the production of other biotechnology products, and has been customized to tailor their use to the ELAD System production. The ELAD cartridges and bedside units are tested according to the FDA’s and other applicable regulatory bodies’ standards before they can be released for use in humans. All device components shipped from us to our investigational sites are subject to quality control inspection.
Future Commercialization Opportunity
The VTL C3A cells which we grow in our facility produce large quantities of proteins and other cell products, such as albumin, alpha-fetoprotein, alpha-1 antichymotrypsin, alpha-1 antitrypsin, C3 complement, anti-thrombin 3, Factor V, Factor VII, fibrinogen, and transferrin. Many of these compounds have known or potential industrial and/or therapeutic applications. We have been exploring the potential commercialization of proteins and other C3A-produced compounds; however, to date, have not identified any economically feasible opportunities.
17
Intellectual Property
We have a patent portfolio and substantial know-how relating to the ELAD System. Our patent portfolio includes patents with claims directed to our ELAD System, specific clonal cells and cell-lines derived from human liver-derived C3A cells, as well as methods of growing such cells. We are currently the owner of record of five issued U.S. patents and over a dozen issued or allowed foreign patents. Additionally, we are the owner of record of three pending Patent Corporation Treaty international applications, as well as two pending U.S. provisional patent applications. One granted U.S. patent claims a method of using C3A cells to treat a patient’s blood. The patent has a term that extends to 2027 and may possibly be extended further if the patent is determined to be eligible for patent term extension. Additionally, a second granted U.S. patent includes claims to an extracorporeal device configuration which is cell type independent and which we believe encompasses our ELAD System. The patent has a term that extends to 2025 and may possibly be extended further if the patent is determined to be eligible for patent term extension. Foreign counterparts of these patents have been issued in countries throughout the world, including, for example, in Australia, Canada, Indonesia, Israel, Japan, Mexico, New Zealand, Singapore, South Africa, South Korea, Taiwan and the Philippines. Furthermore, related applications remain pending in certain other jurisdictions including, for example, Europe, Brazil, China, Hong Kong, India and the Philippines.
We strive to protect the proprietary technology that underlies the ELAD System. We seek patent protection in the U.S. and internationally for the ELAD System, its methods of use and processes of manufacture, and any other technology to which we have rights, where available and when appropriate. We also rely on trade secrets that may be important to the development of our business.
A predecessor company initially developed the ELAD System after the technology was spun out of Baylor College of Medicine in 1990. In 2003, we acquired substantially all of the assets of the predecessor, including trade secrets, know how, clinical experience and key employees and facilities.
Our success will depend on our ability to obtain and maintain patent and other proprietary rights in commercially important technology, inventions and know-how related to our business, the validity and enforceability of our patents, and the continued confidentiality of our trade secrets as well as our ability to operate without infringing the valid and enforceable patents and proprietary rights of third parties. We also expect to rely on continuing technological innovation and in-licensing opportunities to develop and maintain our proprietary position.
We cannot be sure that patents will be granted with respect to any of our pending patent applications or with respect to any patent applications we may own or license in the future, nor can we be sure that any of our existing patents or any patents we may own or license in the future will be useful in protecting our technology. For this and more comprehensive risks related to our intellectual property, please see “Risk Factors — Risks Related to Intellectual Property.”
The term of individual patents depends upon the legal term of the patents in the countries in which they are obtained. In most countries in which we file, the patent term is 20 years from the date of filing the non-provisional priority application. In the U.S., a patent’s term may be lengthened by patent term adjustment, which compensates a patentee for administrative delays by the U.S. Patent and Trademark Office, or PTO, in granting a patent, or may be shortened if a patent is terminally disclaimed over an earlier-filed patent.
The term of a U.S. patent that covers an FDA-approved biologic may also be eligible for patent term extension, which permits patent term restoration as compensation for the patent term lost during the FDA regulatory review process. The Hatch-Waxman Amendments permit a patent term extension of up to five years beyond the expiration of the patent. The length of the patent term extension is related to the length of time the biologic is under regulatory review. A patent term extension cannot extend the remaining term of a patent beyond a total of 14 years from the date of product approval and only one patent applicable to an approved biologic may be extended. Similar provisions are available in Europe and other foreign jurisdictions to extend the term of a patent that covers an approved drug. When possible, depending upon the length of clinical trials and other factors involved in the filing of our BLA, we expect to apply for patent term extensions.
In addition to patents, we rely on trade secrets and know-how to develop and maintain our competitive position. For example, significant aspects of our proprietary technology are based on unpatented trade secrets and know-how. This includes our methods of expanding, culturing and optimizing the performance of the human VTL C3A cell line.
18
Trade secrets and know-how can be difficult to protect. We seek to protect our proprietary technology and processes, in part, by confidentiality agreements and invention assignment agreements with our employees, consultants, scientific advisors, contractors and commercial partners. These agreements are designed to protect our proprietary information and, in the case of the invention assignment agreements, to grant us ownership of technologies that are developed through a relationship with a third party. We also seek to preserve the integrity and confidentiality of our data and trade secrets by maintaining physical security of our premises and physical and electronic security of our information technology systems. While we have confidence in these individuals, organizations and systems, agreements or security measures may be breached, and we may not have adequate remedies for any breach. In addition, our trade secrets may otherwise become known or be independently discovered by competitors. To the extent that our contractors use intellectual property owned by others in their work for us, disputes may arise as to the rights in related or resulting know-how and inventions.
We seek trademark protection in the U.S. and outside of the U.S. where available and when appropriate. We have registered trademark rights for Vital Therapies in the U.S. and Australia and for ELAD in the U.S., Europe and Australia.
Competitive Environment
The biotherapeutic and medical device industries are highly competitive, and we face potential competition from pharmaceutical, specialty pharmaceutical, medical device and biotechnology companies worldwide. Given the significant unmet medical need for novel therapies to treat liver failure, many companies, universities and research organizations are actively engaged in the discovery, research and development of potential therapies in this field. Several of these entities are engaged in research on cell-based approaches to liver failure. Although we are not aware of any ongoing human clinical trials involving potentially competitive cell-based product candidates, such trials could be taking place or could begin in the near future.
In addition, while we are not aware of any company that is in human clinical trials with a human cell-based product for the treatment of liver failure, at least four companies have prior research work on various human hepatocyte cell lines including Exten Industries, Hepalife Technologies, Fresenius and Hybrid Organ GmbH. In addition, the University College London and the University of Amsterdam and its spinout Hep-Art Medical Devices are actively pursuing animal research in this area. Several companies have also attempted to develop extracorporeal therapy based upon primary porcine hepatocytes. A group from the Mayo Clinic reported that they were filing for regulatory allowance with the FDA to conduct early stage clinical studies with a pig-cell based system designed for the treatment of liver failure. The exact status of the filing is unknown. While we are not aware of any of these other entities being close to undergoing human clinical trials with a human cell-based product for the treatment of liver failure, it is possible that these trials are occurring without our knowledge, and that such a product may get to market much faster than we expect.
Two commercially available liver dialysis systems, MARS from Baxter (formerly Gambro) and Prometheus from Fresenius, have undergone extensive clinical development. Another company, Hepa Wash GmbH has begun a limited market introduction of an albumin dialysis system in Europe, and HepaNet has introduced the OPAL system, an evolution of the MARS albumin dialysis system in Germany. All rely on not only traditional dialysis circuits to remove water-soluble toxins, but also albumin dialysis circuits to remove albumin-bound molecules. To our knowledge none of these non-cellular systems has shown an improvement in long-term survival among patients with liver failure. It was also recently reported that a team from the Institute for Liver and Digestive Health, University College London and Yaqrit Ltd is planning to initiate a clinical trial in decompensated liver disease for a novel liver dialysis (non-bioartificial) system to be known as YAQ-002 incorporating albumin dialysis along with selective adsorption technology.
In addition, there are several drugs available to treat symptoms associated with liver failure, including steroids, pentoxifylline and N-acetylcysteine. These three drugs, alone or in combination, are used frequently in patients with liver failure resulting from acute hepatocellular insult. Gilead Sciences has initiated a phase 2 trial to evaluate the safety of a non-cellular, drug therapy known as GS-4997 in combination with a steroid named prednisolone, compared with prednisolone alone, in subjects with severe alcoholic hepatitis.
Government Regulation
We operate in a highly-regulated industry that is subject to significant federal, state, local and foreign regulation. Our present and future business has been, and will continue to be, subject to a variety of laws including, the Federal Food, Drug, and Cosmetic Act, or FDC Act, and the Public Health Service Act, or PHS Act, among others. Biologics and medical devices are subject to regulation under the PHS Act and FDC Act.
19
Regulation of Combination Products
The FDA has specified a definition for the term “combination product,” which includes: (1) a product comprised of two or more regulated components, i.e., drug/device, biologic/device, drug/biologic, or drug/device/biologic, that are physically, chemically, or otherwise combined or mixed and produced as a single entity; (2) two or more separate products packaged together in a single package or as a unit and comprised of drug and device products, device and biological products, or biological and drug products; (3) a drug, device, or biological product packaged separately that according to its investigational plan or proposed labeling is intended for use only with an approved individually specified drug, device, or biological product where both are required to achieve the intended use, indication, or effect and where upon approval of the proposed product the labeling of the approved product would need to be changed, e.g., to reflect a change in intended use, dosage form, strength, route of administration, or significant change in dose; or (4) any investigational drug, device, or biological product packaged separately that according to its proposed labeling is for use only with another individually specified investigational drug, device, or biological product where both are required to achieve the intended use, indication, or effect.
The FDA is divided into various “Centers” by product type. Different Centers typically review drug, biologic, or device applications. In order to review an application for a combination product, the FDA must decide which Center should be responsible for the review. FDA regulations require that the FDA determine the combination product’s primary mode of action, or PMOA, which is the single mode of a combination product that provides the most important therapeutic action of the combination product. The Center that regulates that portion of the product that generates the PMOA becomes the lead evaluator. If there are two independent modes of action, neither of which is subordinate to the other, the FDA makes a determination as to which Center to assign the product based on consistency with other combination products raising similar types of safety and effectiveness questions or to the Center with the most expertise in evaluating the most significant safety and effectiveness questions raised by the combination product. When evaluating an application, a lead Center may consult other Centers but still retain complete reviewing authority, or it may collaborate with another Center, by which the Center assigns review of a specific section of the application to another Center, delegating its review authority for that section. Typically, the FDA requires a single marketing application submitted to the Center selected to be the lead evaluator, although the agency has the discretion to require separate applications to more than one Center. One reason to submit multiple evaluations is if the applicant wishes to receive some benefit that accrues only from approval under a particular type of application, like new drug product exclusivity. If multiple applications are submitted, each may be evaluated by a different lead Center.
The ELAD System is regulated as a combination biologic/device in the U.S. Based upon the proposed mechanism of action, the primary Center within the FDA responsible for its regulation is the Center for Biologics Evaluation and Research, or CBER. The CBER office responsible for review is the Office of Tissues and Advanced Therapies, and the marketing application will be a BLA. CBER will consult with the Center for Devices and Radiological Health, or CDRH, in reviewing the device components of the ELAD System.
FDA Approval Process
In the U.S., pharmaceutical and biological products and medical devices are subject to extensive regulation by the FDA. The FDC Act, PHS Act, and other federal and state statutes and regulations, govern, among other things, the research, development, testing, manufacture, storage, recordkeeping, approval, labeling, promotion and marketing, distribution, post-approval monitoring and reporting, sampling, and import and export of these products. Failure to comply with applicable U.S. requirements may subject a company to a variety of administrative or judicial sanctions, such as FDA refusal to approve pending license applications, warning and other letters, product recalls, product seizures, total or partial suspension of production or distribution, injunctions, fines, civil penalties and criminal prosecution.
Preclinical Studies
Biological product development in the U.S. typically involves preclinical laboratory and animal tests. Preclinical tests include laboratory evaluation of product chemistry, formulation, and toxicity, as well as animal trials to assess the characteristics and potential safety and efficacy of the product. The conduct of the preclinical tests must comply with federal regulations and requirements including good laboratory practices. The results of preclinical testing are submitted to the FDA as part of an investigational new drug application, or IND, along with other information, including information about product chemistry, manufacturing and controls, and a proposed clinical trial protocol. Long-term preclinical tests, such as animal tests of reproductive toxicity and carcinogenicity, may continue after the IND is submitted.
A 30-day waiting period after the submission of each IND is required prior to the commencement of clinical testing in humans. If the FDA has not objected to the IND within this 30-day period, the clinical trial proposed in the IND may begin.
20
Clinical Studies
Clinical trials involve the administration of the investigational biologic to healthy volunteers or subjects with the targeted indication, or disease, under the supervision of a qualified investigator. Clinical trials must be conducted in compliance with federal regulations and good clinical practices, or GCP, an international standard meant to protect the rights and health of subjects and to define the roles of clinical trial sponsors, administrators, and monitors, as well as under protocols detailing the objectives of the trial, the parameters to be used in monitoring safety and the effectiveness criteria to be evaluated. Each protocol involving testing on U.S. subjects and subsequent protocol amendments must be submitted to the FDA as part of the IND.
The FDA may order the temporary or permanent discontinuation of a clinical trial at any time or impose other sanctions if it believes that the clinical trial is not being conducted in accordance with FDA requirements or presents an unacceptable risk to the clinical trial subjects. The clinical trial protocol, protocol amendments and informed consent information for subjects in clinical trials must also be submitted to an institutional review board, or IRB, for approval. An IRB may also require the clinical trial at the site to be halted, either temporarily or permanently, for failure to comply with the IRB’s requirements, or may impose other conditions.
Disclosure of Clinical Trial Information
Sponsors of clinical trials of investigational products are required to register on clinicaltrials.gov, a National Institute of Health website registry database, and disclose certain clinical trial information. Information related to the product, patient population, phase of investigation, study sites and investigators, and other aspects of the clinical trial is then made public as part of the registration. Sponsors are also obligated to discuss the results of their clinical trials after completion. Disclosure of the results of these trials can be delayed until the new product or new indication being studied has been approved. Competitors may use this publicly available information to gain knowledge regarding the progress of development programs.
Marketing Approval
Clinical trials to support BLAs, which are applications for marketing approval, are typically conducted in three sequential phases, but the phases may overlap. In phase 1, the initial introduction of the investigational biologic candidate into healthy human subjects, the investigational biologic is tested to assess metabolism, pharmacokinetics, pharmacological actions, side effects associated with increasing doses and, if possible, early evidence on effectiveness. Phase 2 usually involves trials in a limited subject population, to determine the effectiveness of the investigational biologic for a particular indication or indications, dosage tolerance and optimum dosage, and identify common adverse effects and safety risks. In the case of product candidates for severe or life-threatening diseases such as cancer, the initial human testing is often conducted in patients rather than in healthy volunteers.
If an investigational biologic demonstrates evidence of effectiveness and an acceptable safety profile in phase 2 evaluations, phase 3 clinical trials are undertaken to obtain additional information about clinical efficacy and safety in a larger number of subjects, typically at geographically dispersed clinical trial sites, to permit the FDA to evaluate the overall benefit-risk relationship of the investigational drug and to provide adequate information for its labeling. In most cases, the FDA requires two adequate and well-controlled phase 3 clinical trials to demonstrate the efficacy and safety of the biologic for use in a specific indication or population. A single phase 3 clinical trial with other confirmatory evidence may be sufficient in rare instances where the study is a large multi-center trial demonstrating internal consistency and a statistically very persuasive finding of a clinically meaningful effect on mortality, irreversible morbidity, or prevention of a disease with a potentially serious outcome and confirmation of the result in a second trial would be practically or ethically impossible.
After completion of the required clinical testing, a BLA is prepared and submitted to the FDA. FDA approval of the BLA is required before marketing of the product may begin in the U.S. The BLA must include the results of all preclinical, clinical and other testing and a compilation of data relating to the product’s manufacture and controls. The cost of preparing and submitting a BLA is substantial. The submission of most BLAs is subject to a substantial application fee and the manufacturer or sponsor of an approved BLA is also subject to annual product and establishment user fees.
The FDA has 60 days from its receipt of a BLA to determine whether the application will be accepted for filing based on the agency’s threshold determination that it is sufficiently complete to permit substantive review. Once the submission is accepted for filing, the FDA begins an in-depth review. The FDA has agreed to certain performance goals in the review of BLAs. Most such applications for standard review biologics products are reviewed within twelve months of submission; most applications for priority review biologics are reviewed within eight months of submission. Priority review for biologics is limited to those products intended to treat a serious or life-threatening disease with unmet medical need relative to the currently approved products. The review process may be extended by the FDA for three additional months to consider certain late-submitted information, or information intended to clarify information already provided in the submission.
21
The FDA may also refer applications for novel biologics products or biologics products that present difficult questions of safety or efficacy, to an advisory committee, typically a panel that includes clinicians and other experts, for review, evaluation and a recommendation as to whether the application should be approved. The FDA is not bound by the recommendation of an advisory committee, but it generally follows such recommendations. Before approving a BLA, the FDA will typically inspect one or more clinical sites to assure compliance with GCP. Additionally, the FDA will inspect the facility or the facilities at which the biologic product is manufactured. The FDA will not approve the BLA unless compliance with current good manufacturing practice, or cGMP, is satisfactory, including compliance with applicable parts of the medical device Quality System Regulation, or QSR, as defined for combination products, and the BLA contains data that provide substantial evidence that the biologic is safe, pure and potent in the indication studied. Manufacturers of biologics also must comply with the FDA’s general biological product standards.
After the FDA evaluates the BLA and the manufacturing facilities, it issues either an approval letter or a complete response letter. A complete response letter outlines the deficiencies in the submission and may require substantial additional testing, including additional large-scale clinical testing or information in order for the FDA to reconsider the application. If, or when, those deficiencies have been addressed to the FDA’s satisfaction in a resubmission of the BLA, the FDA will issue an approval letter. The FDA has committed to reviewing such resubmissions in two or six months depending on the type of information included.
An approval letter authorizes commercial marketing and distribution of the biologic with specific prescribing information for specific indications. As a condition of BLA approval, the FDA may require substantial post-approval testing and surveillance to monitor the product’s safety or efficacy and may impose other conditions, including labeling restrictions, which can materially affect the product’s potential market and profitability. Once granted, product approvals may be withdrawn if compliance with regulatory standards is not maintained or problems or safety issues are identified following initial marketing.
Changes to some of the conditions established in an approved application, including changes in indications, labeling, device components or manufacturing processes or facilities, require submission and FDA approval of a new BLA or BLA supplement before the change can be implemented. A BLA supplement for a new indication typically requires clinical data similar to that in the original application, and the FDA uses the same procedures and actions in reviewing BLA supplements as it does in reviewing BLAs.
Post-Approval Requirements
Once a BLA is approved, a product will be subject to certain post-approval requirements. For instance, the FDA closely regulates the post-approval marketing and promotion of biologics, including standards and regulations, off-label promotion, industry-sponsored scientific and educational activities and promotional activities involving the internet.
Biologics may be marketed only for the approved indications and in accordance with the provisions of the approved labeling.
Adverse event reporting and submission of periodic reports is required following FDA approval of a BLA. The FDA also may require post-marketing testing, known as phase 4 testing, Risk Evaluation and Mitigation Strategies, or REMS, and surveillance to monitor the effects of an approved product or place conditions on an approval that could restrict the distribution or use of the product. In addition, quality control as well as product manufacturing, packaging and labeling procedures must continue to conform to cGMP’s after approval. Manufacturers and certain of their subcontractors are required to register their establishments with the FDA and certain state agencies, and are subject to periodic unannounced inspections by the FDA during which the agency inspects manufacturing facilities to assess compliance with applicable regulations such as cGMPs and the QSR. Accordingly, manufacturers must continue to expend time, money and effort in the areas of production and quality control to maintain compliance with cGMP’s. Regulatory authorities may withdraw product approvals or request product recalls if a company fails to comply with regulatory standards, if it encounters problems following initial marketing, or if previously unrecognized problems are subsequently discovered.
22
Exclusivity and Approval of Competing Products
Biosimilar Exclusivity
The Biologics Price Competition and Innovation Act of 2009, or BPCIA, creates an abbreviated approval pathway for biological products shown to be highly similar to or interchangeable with an FDA-licensed reference biological product. Biosimilarity sufficient to reference a prior FDA-approved product requires that there be no differences in conditions of use, route of administration, dosage form, and strength, and no clinically meaningful differences between the biological product and the reference product in terms of safety, purity, and potency. Biosimilarity must be shown through analytical studies, animal studies, and at least one clinical study, absent a waiver. A biosimilar product may be deemed interchangeable with a prior approved product if it meets the higher hurdle of demonstrating that it can be expected to produce the same clinical results as the reference product and, for products administered multiple times, the biologic and the reference biologic may be switched after one has been previously administered without increasing safety risks or risks of diminished efficacy relative to exclusive use of the reference biologic. Complexities associated with the larger, and often more complex, structures of biological products, as well as the process by which such products are manufactured, pose significant hurdles to implementation.
A reference biologic is granted twelve years of exclusivity from the time of first licensure of the reference product, and no application for a biosimilar can be submitted for four years from the date of licensure of the reference product. The first biologic product submitted under the abbreviated approval pathway that is determined to be interchangeable with the reference product has exclusivity against a finding of interchangeability for other biologics for the same condition of use for the lesser of (i) one year after first commercial marketing of the first interchangeable biosimilar, (ii) eighteen months after the first interchangeable biosimilar is approved if there is no patent challenge, (iii) eighteen months after resolution of a lawsuit over the patents of the reference biologic in favor of the first interchangeable biosimilar applicant, or (iv) 42 months after the first interchangeable biosimilar’s application has been approved if a patent lawsuit is ongoing within the 42-month period.
Orphan Drugs
Under the Orphan Drug Act, the FDA may grant orphan designation to a drug or biologic intended to treat a rare disease or condition, which is generally a disease or condition that affects fewer than 200,000 individuals in the U.S., or more than 200,000 individuals in the U.S. and for which there is no reasonable expectation that the cost of developing and making available in the U.S. a drug or biologic for this type of disease or condition will be recovered from sales in the U.S. for that drug or biologic. Orphan drug designation must be requested before submitting a BLA. After the FDA grants orphan drug designation, the generic identity of the therapeutic agent and its potential orphan use are disclosed publicly by the FDA.
If a product that has orphan drug designation subsequently receives the first FDA approval for the disease for which it has such designation, the product is entitled to orphan product exclusivity, which means that the FDA may not approve any other applications, including a full BLA, to market the same biologic for the same indication for seven years, except in limited circumstances, such as a showing of clinical superiority to the product with orphan drug exclusivity. Orphan drug exclusivity does not prevent FDA from approving a different drug or biologic for the same disease or condition, or the same drug or biologic for a different disease or condition. Among the other benefits of orphan drug designation are tax credits for certain research and a waiver of the BLA application user fee.
A designated orphan drug may not receive orphan drug exclusivity if it is approved for a use that is broader than the indication for which it received orphan designation. In addition, orphan drug exclusive marketing rights in the U.S. may be lost if the FDA later determines that the request for designation was materially defective or if the manufacturer is unable to assure sufficient quantities of the product to meet the needs of patients with the rare disease or condition.
21st Century Cures Act
In December 2016, President Obama signed the 21st Century Cures Act, or Cures Act, into law. The Cures Act is designed to modernize and personalize healthcare, spur innovation and research, and streamline the discovery and development of new therapies through increased federal funding of particular programs. It authorizes increasing funding for the FDA to spend on innovation projects. The new law also amends the Public Health Service Act, or PHSA, to reauthorize and expand funding for the National Institutes of Health, or NIH. The Act establishes the NIH Innovation Fund to pay for the cost of development and implementation of a strategic plan, early stage investigators and research. It also charges NIH with leading and coordinating expanded pediatric research.
23
The Cures Act seeks to accelerate the discovery, development, and delivery of new medicines and medical technologies. To that end, and among other provisions, the Cures Act reauthorizes the priority review voucher program for certain drugs intended to treat rare pediatric diseases; creates a new priority review voucher program for drug applications determined to be material threat medical countermeasure applications; revises the United States Federal Food, Drug, and Cosmetic Act to streamline review of combination product applications; requires the FDA to evaluate the potential use of “real world evidence” to help support approval of new indications for approved drugs; provides a new “limited population” approval pathway for antibiotic and antifungal drugs intended to treat serious or life-threatening infections; and authorizes the FDA to designate a drug as a “regenerative advanced therapy,” thereby making it eligible for certain expedited review and approval designations.
Federal and State Fraud and Abuse, Privacy and Transparency Laws
In addition to FDA restrictions on marketing of pharmaceutical products, several other types of federal and state laws in the U.S. have been applied to restrict certain business operations and activities in the biopharmaceutical and medical device industries in recent years. These laws that may affect our ability to operate include, but are not limited to:
The federal healthcare program anti-kickback statute prohibits, among other things, knowingly and willfully offering, paying, soliciting, or receiving any remuneration (including any kickback, bribe or rebate), directly or indirectly, overtly or covertly, in cash or in kind, to induce, or in return, for purchasing, leasing, ordering, or arranging for or recommending the purchase, lease, or order of any good, facility, service or item for which payment is made, in whole or in part, under a federal health care program. The federal healthcare program anti-kickback statute has been interpreted to apply to arrangements between pharmaceutical manufacturers on one hand and prescribers, purchasers and formulary managers on the other. Although there are a number of statutory exceptions and regulatory safe harbors protecting certain common activities from prosecution, the exceptions and safe harbors are drawn narrowly, and practices that involve remuneration intended to induce prescribing, purchasing, or recommending may be subject to scrutiny if they do not qualify for a statutory exception or a regulatory safe harbor. Failure to meet all of the requirements of a particular applicable statutory exception or regulatory safe harbor does not make the conduct per se illegal under the federal healthcare program anti-kickback statute. Instead, the legality of the arrangement will be evaluated on a case-by-case basis based on a cumulative review of all of its facts and circumstances.
The federal civil False Claims Act prohibits, among other things, any person or entity from knowingly presenting, or causing to be presented, a false or fraudulent claim for payment to, or approval by, the federal government, or knowingly making, using, or causing to be made or used, a false record or statement material to a false or fraudulent claim to the federal government. Recently, the civil False Claims Act has been used to assert liability on the basis of kickbacks and improper referrals, improperly reported government pricing metrics such as Medicaid Best Price or Average Manufacturer Price, improper use of supplier or provider Medicare numbers when detailing a provider of services, improper promotion of drugs or off-label uses not expressly approved by the FDA in a drug’s label, and misrepresentations with respect to the services rendered or items provided. The federal criminal false claims law prohibits, among other things, at any time knowingly and willingly making, or causing to be made, any false statement or representation of a material fact for use in determining rights to a benefit or payment under a federal healthcare program.
Many states also have statutes or regulations similar to the federal fraud and abuse laws, which apply to items and services reimbursed under Medicaid and other state programs, or, in several states, apply regardless of the payor (e.g. private payors). Sanctions under federal, and state healthcare fraud and abuse laws may include, without limitation, civil, criminal and administrative penalties, damages, monetary fines, disgorgement, possible exclusion from participation in Medicare, Medicaid and other federal healthcare program, contractual damages, reputational harm, diminished profits and future earnings, and the curtailment or restructuring of our operations.
Additionally, the civil monetary penalties statute, which, among other things, imposes fines against any person who is determined to have presented, or caused to be presented, claims to a federal healthcare program that the person knows, or should know, is for an item or service that was not provided as claimed or is false or fraudulent. The federal Health Insurance Portability and Accountability Act of 1996, or HIPAA, created new federal criminal statutes that prohibit knowingly and willfully executing, or attempting to execute, a scheme to defraud or to obtain, by means of false or fraudulent pretenses, representations, or promises, any of the money or property owned by, or under the custody or control of, any healthcare benefit program, including private third party payors and knowingly and willfully falsifying, concealing or covering up by trick, scheme or device a material fact or making any materially false, fictitious or fraudulent statement in connection with the delivery of or payment for healthcare benefits, items or services relating to healthcare matters. Many states have similar fraud and abuse statutes and regulations that apply to items and services reimbursed under Medicaid and other state programs, or, in several states, private payors. In addition, we may be subject to, or our marketing activities may be limited by, data privacy and security regulation by both the federal government and the states in which we conduct our business.
24
The risk of our being found in violation of these laws is increased by the fact that many of them have not been fully interpreted by the regulatory authorities or the courts, and their provisions are open to a variety of interpretations. Moreover, recent healthcare reform legislation has strengthened many of these laws. For example, the Patient Protection and Affordable Care Act, as amended by the Health Care and Education Reconciliation Act (collectively, the ACA), among other things, amends the intent requirement of the federal healthcare program anti-kickback statute to a stricter standard such that a person or entity does not need to have actual knowledge of the federal healthcare program anti-kickback statute or specific intent to violate it in order to have committed a violation. In addition, the ACA codified case law that a claim including items or services resulting from a violation of the federal anti-kickback statute constitutes a false or fraudulent claim for purposes of the civil False Claims Act. Because of the breadth of these laws and the narrowness of the statutory exceptions and regulatory safe harbors, it is possible that some of our business activities may not satisfy the statutory exceptions or regulatory safe harbors and we could be subject to challenge under one or more of such laws. State law equivalents to these federal laws may also apply. Such a challenge could have a material adverse effect on our business, financial condition and results of operations.
Additionally, the federal Physician Payments Sunshine Act within the ACA, and its implementing regulations, require that certain manufacturers of drugs, devices, biological, and medical supplies for which payment is available under Medicare, Medicaid, or the Children’s Health Insurance Program (with certain exceptions) to report to the Centers for Medicare & Medicaid Services, or CMS, information related to certain payments or other transfers of value made or distributed to physicians and teaching hospitals, or to entities or individuals at the request of, or designated on behalf of, the physicians and teaching hospitals. The Physician Payments Sunshine Act provisions implemented in final regulation requires applicable manufacturers to report annually to CMS certain ownership and investment interests held by physicians and their immediate family members. Manufacturers are required to report such data to CMS by the 90th day of each subsequent calendar year. Other state laws require pharmaceutical companies to adopt and or disclose specific compliance policies to regulate the Company’s interactions with healthcare professionals. Moreover, some states, such as Minnesota and Vermont, also impose an outright ban on certain gifts to physicians.
Violations of some of these laws may result in substantial fines. These laws affect promotional activities by limiting the kinds of interactions we may have with hospitals, physicians or other potential purchasers or users of our products. Both the disclosure laws and gift bans will impose additional administrative and compliance burdens on us once and if we receive marketing approval of our product. Although we seek to structure our interactions in compliance with all applicable requirements, these laws are broadly written, and it is often difficult to determine precisely how a law will be applied in specific circumstances. If an employee were to offer an inappropriate gift to a customer, we could be subject to a claim under an applicable state law. Similarly if we fail to comply with a reporting requirement, we could be subject to penalties under applicable federal or state laws including, without limitation, civil, criminal and administrative penalties, damages, monetary fines, disgorgement, possible exclusion from participation in Medicare, Medicaid and other federal healthcare programs, contractual damages, reputational harm, diminished profits and future earnings, and the curtailment or restructuring of our operations. In addition to the federal and state disclosure and gift ban laws, certain countries outside of the U.S. have similarly enacted disclosure laws for which the company in its activities may be subjected to from time to time.
Regulation in the European Union
Biologics and medical devices are subject to extensive regulation outside of the U.S. In the European Union, for instance, a centralized approval procedure, or Centralized Procedures, may be used to authorize the marketing of a product in all countries of the European Union, which includes most major European markets. However, for certain products, if this procedure is not used, approval in one country of the European Union can be used to obtain approval in a second country of the European Union under two simplified application processes, either the mutual recognition procedure or the decentralized procedure. Both of these procedures rely on the principle of mutual recognition. In addition to regulatory approval, pricing and reimbursement approvals are also required in most countries.
In Europe, the ELAD System is regulated as a Combination Somatic Cell Advanced Therapy Medicinal Product, or ATMP. The primary regulatory license application in Europe (a Marketing Authorization Application, or MAA), if any, will be made to The Committee for Advanced Therapies, or CAT, and the Committee for Human Medicinal Products, or CHMP, which are the committees at the European Medicines Agency, or EMA, that are responsible for assessing the quality, safety and efficacy of ATMPs. Marketing Authorization Applications for ATMPs can only be filed using the Centralized Procedure. The CHMP and the CAT liaise closely together so the CHMP is able to make a scientific opinion relating to the authorization to place an ATMP on the market in accordance with Regulation (EC) No 1394/2007 and pharmacovigilance. The CAT has also established collaborations with Notified Bodies, or NBs, in Europe in order to review the device components of combination device products, and we anticipate that the device components of our submission would be reviewed by one of those NBs. Currently, during the clinical trial phase in Europe, we are granted authorization to conduct clinical studies at the national level through the health authority agencies in each country, each of which has its own format and regulation for the issuance of clinical trial authorizations, or CTAs. For some countries, it is necessary to obtain separate authorizations in each country for each clinical trial protocol from the medicines and device agencies as there is yet to be developed a procedure for dealing with
25
combination products like the ELAD System. The EMA has provisions for providing companies with advice on topics related to marketing authorization in Europe through the Scientific Advice Working Party, or SAWP. Previously, we sought and obtained advice on the ELAD development program through the SAWP process. We anticipate obtaining further guidance and advice through future interactions with the SAWP.
In other jurisdictions we anticipate that there will be different requirements for authorization for clinical trials and ultimately marketing of the ELAD System due to the complex nature of the combination of biological and device components of our ELAD System.
Other Regulations
We are also subject to numerous, federal, state, local and foreign laws and regulations relating to such matters as safe working conditions, manufacturing practices, fire hazard control, environmental protection and the disposal of hazardous and potentially hazardous substances and biological materials. We may incur significant costs to comply with such laws and their related regulations now or in the future. In addition, we are also subject to laws and regulations in foreign countries outside of the U.S. and Europe where we may seek to commercialize the ELAD System. In certain cases, these foreign laws and regulations may change at inopportune times and prevent the ELAD System’s timely commercialization. For example, several years after we submitted our 2007 regulatory package in China, we were notified of a then-newly-enacted 2009 regulation which prohibits the ELAD System’s approval in China until it is first approved in the U.S. As such, we now do not expect regulatory consideration of approval in China until after approvals are received in the U.S. or Europe.
Research and Development
We recognized
$30.0 million
,
$39.8 million
and
$39.5 million
in research and development expenses in the years ended
December 31, 2016
,
2015
and
2014
, respectively.
Geographic Information
During
2016
,
2015
and
2014
, substantially all of our long-lived assets were located within the U.S.
Financial Information about Segments
We manage our operations as a single reportable segment for the purposes of assessing performance and making operating decisions. Please see Note 1 – "Description of Business and Basis of Financial Statements" in the notes to the consolidated financial statements.
Employees
As of January 31, 2017, we had 87 employees, 15 of whom held Ph.D. or M.D. degrees. Of our employees, 50 were engaged in research and development, 20 in manufacturing and 17 in administration. None of our employees is represented by a labor organization or under any collective bargaining arrangement, and we have never had a work stoppage. We consider our employee relations to be good.
Corporate Information and Website
We were incorporated in California in May 2003 as Vitagen Acquisition Corp., changed our name to Vital Therapies, Inc. in June 2003, and reincorporated in Delaware in January 2004. Our principal executive offices are located at 15010 Avenue of Science, Suite 200, San Diego, CA 92128. Our telephone number is (858) 673-6840. Our website address is http://www.vitaltherapies.com. This Annual Report on Form 10-K, our Quarterly Reports on Form 10-Q, Current Reports on Form 8-K, and any amendments to those reports filed or furnished pursuant to Sections 13(a) and 15(d) of the Securities Exchange Act of 1934, as amended, or the Exchange Act, are available (free of charge) on our website as soon as reasonably practicable after we electronically file such material with, or furnish it to, the Securities and Exchange Commission, or SEC. The public may read and copy any materials filed by us with the SEC at the SEC's Public Reference Room at 100F Street, NE, Room 1580, Washington, DC 20549. The public may obtain information on the operation of the Public Reference Room by calling the SEC at 1-800-SEC-0330. The SEC maintains an internet site that contains reports, proxy and information statements and other information regarding issuers that file electronically with the SEC at www.sec.gov. Information contained on, or that can be accessed through, our website, or from the SEC does not constitute part of this Annual Report on Form 10-K, and the inclusion of our website address in this Annual Report is an inactive textual reference only.
26
“Vital Therapies” and “ELAD” are registered trademarks of Vital Therapies, and the Vital Therapies logo is a trademark of Vital Therapies. Other service marks, trademarks, and tradenames referred to in this Annual Report are the property of their respective owners. Except as set forth above and solely for convenience, the trademarks and tradenames in this Annual Report are referred to without the
®
and
TM
symbols, but such references should not be construed as any indicator that their respective owners will not assert, to the fullest extent under applicable law, their rights thereto. We may remain an “emerging growth company” until as late as December 31, 2019 (the fiscal year-end following the fifth anniversary of the completion of our initial public offering), though we may cease to be an “emerging growth company” earlier under certain circumstances, including (i) if the market value of our common stock that is held by non-affiliates exceeds $700 million as of any June 30, in which case we would cease to be an “emerging growth company” as of the following December 31, or (ii) if our gross revenue exceeds $1 billion in any fiscal year. We refer to the Jumpstart Our Business Startups Act of 2012 herein as the “JOBS Act,” and references herein to “emerging growth company” are intended to have the meaning associated with it in the JOBS Act.
Investing in our common stock involves a high degree of risk. Before deciding to invest in our company or deciding to maintain or increase your investment, you should consider carefully the risks and uncertainties described below. The risks and uncertainties described below and in our other filings with the Securities and Exchange Commission, or SEC, are not the only ones we face. If one or more of the following risks are realized, our business, financial condition and results of operations and prospects could be materially and adversely affected. In that event, the market price for our common stock could decline, and you may lose your entire investment.
Risks Related to Our Business
We have designed our current phase 3 clinical trial for ELAD
®
based on the results of pre-specified and post-hoc analyses of our VTI-208 trial that has no assurance of success and may fail. Since ELAD is our sole product candidate, failure of this new trial could result in failure of the company.
In August 2015, we announced that the ELAD
System, our sole product candidate, failed to meet its primary and secondary endpoints in our VTI-208 phase 3 clinical trial. Following this announcement, we discontinued our VTI-210 and VTI-212 clinical trials and began a series of pre-specified and post-hoc analyses of the VTI-208 data to determine if there was a basis for continuing the development of the ELAD System. Based on these analyses, we prepared a preliminary protocol for a new clinical trial, VTL-308, incorporating changes based on clinically relevant trends we observed in subset data from the VTI-208 clinical trial, including limits on subjects' age, Model for End-stage Liver Disease, or MELD, score and the three components of MELD score associated with kidney dysfunction (creatinine), blood clotting dysfunction defined as international normalization ratio, or INR, and liver function (bilirubin). In November 2015, we received written responses from the U.S. Food and Drug Administration, or the FDA, to our Type C meeting request on the VTL-308 phase 3 clinical trial. At the FDA's suggestion, we have incorporated an event-driven feature into the trial design consistent with the primary endpoint of overall survival. Under the modified design, enrollment will continue until at least 150 subjects have been enrolled and 55 events have occurred, consistent with the event rate seen in the target subpopulation from VTI-208.
The design of and assumptions underlying our new VTL-308 clinical trial, including the inclusion and exclusion criteria, may prove to be incorrect or may not ultimately demonstrate statistical significance in overall survival over a control group. Further, even if statistical significance in overall survival is achieved, the results may not be accepted without a confirmatory study as the basis for the submission of a biologics license application, or BLA, to the FDA or for a similar filing with any other regulatory authority. For example, even if the VTL-308 clinical trial were to meet its primary endpoint, the FDA or other regulatory authorities may still require an additional pivotal trial before granting market approval, which would require substantial additional time and funds in order to complete clinical development. If we are unsuccessful in our clinical development program, we will need to undertake a review of potential business alternatives, which may include, but are not limited to, a merger or sale of the company or ceasing operations and winding down the business.
27
We may not be able to complete the development of, successfully obtain regulatory or marketing approval for, or successfully commercialize, the ELAD System.
To date, we have expended significant time, resources and effort on the development of the ELAD System. The unfavorable VTI-208 outcome has caused a significant delay in our plans to commercialize the ELAD System. In order to complete the development of the ELAD System, we will need to complete one or more additional clinical trials that successfully demonstrate statistical significance in overall survival over a control group, manage clinical and manufacturing activities, obtain necessary regulatory approvals from the FDA in the U.S., from the European Medicines Agency, or EMA, in the European Economic Area, and from foreign regulatory authorities in other jurisdictions, obtain commercial manufacturing supply, build a commercial marketing organization or enter into a commercial marketing collaboration with a third party, and in some jurisdictions, obtain reimbursement authorization, among other things. If we do not successfully complete the necessary clinical trials, do not have sufficient commercial manufacturing supply for the ELAD System, encounter additional difficulties in the development of the ELAD System due to any of the factors discussed in this “Risk Factors” section or otherwise, we do not seek or receive regulatory approval or are unable to successfully commercialize the ELAD System, if approved, then we will not be able to continue our business in its current form, and we would need to undertake a review of the potential business alternatives discussed above.
We are a clinical-stage company with no approved products, which makes assessment of our future viability and performance difficult.
We are a clinical-stage company and we have no approved products or revenues from the sale of products. Our operations to date have been limited to organizing, staffing and financing our company, applying for patent rights, manufacturing on a clinical scale, undertaking clinical trials of our product candidate, and engaging in research and development. Our most recent clinical trials failed to reach both their primary and secondary endpoints or were terminated. We have not yet demonstrated an ability to obtain regulatory approval, manufacture products on a commercial scale, or conduct the sales and marketing activities necessary for successful product commercialization. As a result, there is limited information about us for investors to use when assessing our future viability and our potential to successfully develop product candidates, conduct clinical trials, manufacture our products on a commercial scale, obtain regulatory approval and profitably commercialize any approved products.
We are totally dependent upon the success of the ELAD System, our sole product candidate.
The ELAD System is designed to improve survival rates of patients with certain forms of liver failure resulting from hepatocellular insult. The ELAD System is a novel product candidate whose safety, efficacy and other attributes have not been demonstrated in well-designed, large scale, clinical trials and are not fully understood. As a cell-based therapy, the ELAD System’s mechanism-of-action is complex, and we cannot be certain that our currently-targeted indication of severe acute alcoholic hepatitis, or sAAH, in the U.S. and Europe, and viral hepatitis (predominantly hepatitis B) in China represent suitable applications for the ELAD System, or even ones where the ELAD System therapy can or will ultimately be shown to be safe and effective in well-designed phase 3 clinical trials necessary to support regulatory approval in any jurisdiction. For example, our VTI-208 phase 3 trial in alcohol-induced liver decompensation, or AILD, which included many subjects with sAAH, failed to reach both its primary and secondary endpoints. Finally, even if the ELAD System is proven to be safe and effective and ultimately receives regulatory approval, there is no guarantee that its commercialization will be successful. If the ELAD System fails at any stage in our clinical trials or at the marketing stage, our business and operating results and financial condition will be materially and adversely affected.
28
We cannot give any assurance that we will successfully complete the ELAD System’s clinical development, or that the ELAD System will receive regulatory approval in a timely fashion or at all.
We are subject to all of the uncertainties and complexities affecting a clinical-stage, combination product, biologic and medical device company. We have not successfully completed clinical development for any of the ELAD System’s potential indications in the U.S. or Europe where the ELAD System is regulated as a combination biologic and medical device, and as a combined somatic cell Advanced Therapy Medicinal Product, respectively. We initiated a new phase 3 clinical trial, referred to as VTL-308, designed to establish the safety and efficacy of the ELAD System and to support approval in the U.S. and Europe. This clinical trial is being performed in certain subjects with sAAH. Any additional indications we elect to pursue will require the initiation and completion of additional phase 3 clinical trials demonstrating safety and efficacy for each such indication. For example, even prior to our VTI-208 clinical trial, the FDA had noted its view that preliminary clinical evidence did not indicate that the ELAD System may demonstrate a substantial improvement over standard of care. Since then, our VTI-208 clinical trial failed to meet both its primary and secondary endpoints. There is no guarantee that any future clinical trials will be completed in a timely fashion or will succeed. Our ability ultimately to reach profitability is critically dependent on our future success in obtaining regulatory approval for the ELAD System. However, there can be no assurance that any future clinical trials will be timely, successful, or that regulators will approve the ELAD System in a timely manner, or at all.
If we fail to obtain regulatory approval in the U.S. and Europe, our business would be harmed.
We require regulatory approval for each indication we are seeking before we can market and sell the ELAD System in a particular jurisdiction for such indication. Our ability to obtain regulatory approval of the ELAD System depends on, among other things, successful completion of phase 3 clinical trials, and demonstrating efficacy with statistical significance and acceptable safety in humans. The results of our current clinical trial and any future clinical trials may not meet the FDA, the EMA or other regulatory agencies’ requirements to approve the ELAD System for marketing under any specific indication, and these regulatory agencies may also determine that our manufacturing processes or facilities are insufficient to support approval. For example, the FDA had previously noted its view that preliminary clinical evidence available prior to our VTI-208 clinical trial did not indicate that the ELAD System may demonstrate a substantial improvement over standard of care. Additionally, the negative results of VTI-208 may bias the FDA, EMA and other regulatory authorities against the ELAD System. As such, we may need to conduct more clinical trials than we currently anticipate and upgrade our manufacturing processes and facilities, which may require significant additional time and expense and which could delay or prevent approval. If we fail to obtain regulatory approval in a timely manner, our commercialization of the ELAD System would be further delayed and our business would be harmed.
If we are able to secure marketing approval, our commercial success will be determined by our ability to obtain acceptable pricing and reimbursement for the ELAD System.
Therapies such as the ELAD System are paid for primarily by private and government insurance, although in some markets payment may be made by private individuals and their families. Reimbursement policies and decisions for medical products is a highly bureaucratic, politicized and regulated process that includes consideration of factors such as cost effectiveness and meaningful patient benefit. Government and third-party payors are under great pressure to reduce costs. Furthermore, there are no therapies approved to restore liver function and the lack of an established reimbursement structure introduces additional uncertainty with regard to reimbursement for the ELAD System. Although we commissioned a report in 2013 from pricing study and reimbursement specialists that concluded we should target a commercial price between $150,000 and $275,000 for ELAD therapy in the U.S., we do not know whether this price is achievable or sustainable. Further, this report was prepared prior to the failure of the VTI-208 clinical trial, the discontinuation of our VTI-210 and VTI-212 clinical trials and prior to the commencement of our VTL-308 phase 3 trial, all of which may result in a lower target commercial price if the report was recreated based on the additional information known to us. Although we do not expect to determine a target commercial price for ELAD therapy either within or outside of the U.S. until after completion of a successful clinical trial, we believe it may be difficult to sustain a commercial price outside of the U.S. at or above the commercial price in the U.S. In addition, we will have no control over the reimbursement or conditions that may be set by the government or private insurers, if any, assuming we are able to secure marketing approval for the ELAD System. In markets where payment will be made by private individuals and their families, such private payors may not be prepared to pay an acceptable price.
29
If we are unable to implement our sales, marketing, distribution, training and support strategies in the U.S. and Europe or enter into agreements with third parties to perform these functions in markets outside of the U.S. and Europe, we will not be able to effectively commercialize the ELAD System and may not reach profitability.
Our technology is new and complex, and potential customers will have limited knowledge of, or experience with, the ELAD System. In addition, we have no ELAD System-related sales and marketing experience either domestically or abroad. We have not commercialized the ELAD System anywhere. Our commercial success will depend on our ability to market and receive adequate reimbursement for the ELAD System. This success will also depend on our ability to obtain and maintain adequate pricing for the ELAD System.
We do not have a sales or marketing infrastructure and have no experience in the sale, marketing or distribution of biologic products and medical devices. To achieve commercial success for the ELAD System, if and when we obtain marketing approval, we will need to establish a sales and marketing organization, and we are unable to predict how we will market the ELAD System. In the future, we expect to build a targeted sales, marketing, training and support infrastructure to market the ELAD System in the U.S. and Europe and to establish collaborations with third parties to market, distribute and support the ELAD System outside of the U.S. and Europe. There are risks involved with establishing our own sales, marketing, distribution, training and support capabilities. For example, recruiting and training sales and marketing personnel and personnel necessary to initially provide on-site device support and later device training to end-users is expensive and time consuming and could delay any product launch. If the commercial launch of the ELAD System is delayed or does not occur for any reason, we would have prematurely or unnecessarily incurred these commercialization expenses. This may be costly, and our investment would be lost if we cannot retain or reposition our sales, marketing, training and support personnel.
Factors that may inhibit our efforts to commercialize the ELAD System on our own include:
|
•
|
our inability to recruit, train and retain adequate numbers of effective sales, marketing, training and support personnel;
|
|
•
|
the inability of sales personnel to obtain access to physicians, including key opinion leaders, or to persuade adequate numbers of physicians to use the ELAD System;
|
|
•
|
our inability to properly support the ELAD System therapy with our own qualified personnel at each customer site or our inability to properly train and support our customers to use the ELAD System effectively on their own;
|
|
•
|
the lack of complementary products to be offered by sales personnel, which may put us at a competitive disadvantage relative to companies with more extensive or integrated product offerings; and
|
|
•
|
unforeseen costs and expenses associated with creating an independent sales, marketing, training and support organization.
|
If we are unable to establish our own sales, marketing, distribution, training and support capabilities and instead enter into arrangements with third parties to perform these services, our product revenues, gross margins and our profitability, if any, are likely to be lower than if we were to market, sell and distribute the ELAD System ourselves. In addition, we may not be successful in entering into arrangements with third parties to sell, market and distribute the ELAD System, or may be unable to do so on terms that are favorable to us. We likely will have little control over such third parties, and any of them may fail to devote the necessary resources and attention to commercialize the ELAD System effectively. If we do not establish sales, marketing, distribution, training and support capabilities successfully, either on our own or in collaboration with third parties, we will not be successful in commercializing the ELAD System and achieving profitability, and our business would be harmed.
30
We have incurred losses since our inception and expect to incur significant losses in the foreseeable future and may never become profitable. Even if we ultimately achieve profitability, it may not be sustained, and we may require additional capital.
We are a clinical-stage company, and clinical development of a novel therapy is a highly speculative undertaking. We have incurred significant losses in each fiscal year since our inception, including net losses of
$41.0 million
, $52.0 million and $47.7 million for the years ended December 31, 2016, 2015 and 2014, respectively. As of December 31, 2016, we had an accumulated deficit of
$243.8 million
. We expect to spend a considerable amount of our resources on the completion of our clinical programs and the work necessary to submit and gain approval of our ELAD System, on the production of the ELAD cartridges and bedside units, on investment in production facilities, and on the commercial launch and sales and marketing of the ELAD System. We also expect to expend considerable resources on research and development to develop new and improved products and to understand the mechanism of action of the ELAD System. To date, we have not generated significant revenues, and we anticipate incurring additional losses and negative cash flow from operations for at least the next several years. Even if we do achieve profitability in the future, there is no guarantee that we will be able to sustain this profitability in subsequent periods, and we may need to raise additional capital.
Our ability to use our net operating losses to offset future taxable income may be subject to certain limitations.
As of December 31, 2016, we had net operating loss, or NOL, carryforwards of approximately $168.5 million and $159.6 million, net of estimated limitations caused by certain ownership changes under Section 382 of the Internal Revenue Code, for federal and state income tax purposes, respectively. In general, under Section 382, a corporation that undergoes an “ownership change” is subject to limitations on its ability to utilize its pre-change NOLs to offset future taxable income. We believe our existing NOLs are subject to limitations arising from previous ownership changes, and if we undergo any further ownership changes, our ability to utilize NOLs could be further limited. Future changes in our stock ownership, some of which are outside of our control, could also result in additional ownership changes under Section 382. Furthermore, our ability to utilize NOLs of companies that we may acquire in the future may be subject to limitations. In addition, in 2013, California adopted a single factor, sales, for apportioning income and losses to the state. Although completely offset by our valuation allowance, we had recognized NOL carryforwards from 2013 through 2015 based on a multiple factor apportionment based on salaries, property and sales in the state. This position was based on prior court rulings supporting the use of the multiple factor apportionment. This ruling was overturned by the California Supreme Court in December 2015 and, in October 2016, the U.S. Supreme Court declined to hear the case. California has no regulations or guidiance nor have there been any rulings addressing how a company with no sales should apportion losses to California. As most of our operations are in California, we intend to file our tax returns using a multiple factor apportionment until such time as California provides a ruling or guidance on such an apportionment. For these reasons, we may not be able to utilize a material portion of the NOLs, even if we attain profitability.
Our internal computer systems, cloud-based systems and those used by our clinical investigators, contract research organizations or other contractors or consultants may fail or suffer security breaches, which could result in a material disruption of our development programs for the ELAD System.
We rely on information technology systems to keep financial records, maintain laboratory, clinical data and corporate records, communicate with staff and external parties and operate other critical functions. Despite the implementation of security measures, our internal computer systems, cloud-based systems and those used by our clinical investigators, clinical research organizations, or CROs, and other contractors and consultants are vulnerable to damage from computer viruses, unauthorized access, natural disasters, cyber-attacks, terrorism, war, and telecommunication and electrical failures. The techniques that could be used to attack these computer systems are sophisticated, change frequently and may originate from less regulated and remote areas of the world. As a result, we may not be able to address these risks proactively or implement adequate preventative measures. While, to our knowledge, we have not experienced any significant system failure, theft of information, accident or security breach to date, if such an event were to occur and cause interruptions in our operations, it could result in a material disruption of our clinical development or manufacturing activities. For example, the loss of clinical trial data from future clinical trials could result in delays in regulatory approval efforts and significantly increase costs to recover or reproduce the data. To the extent that any disruption, theft of information, or security breach were to result in a loss of or damage to data or applications, or inappropriate disclosure of confidential or proprietary information, we could incur liability and the clinical development and any future development of the ELAD System could be delayed.
31
In the recent past, we have been involved in securities litigation, and defending against such litigation or an adverse resolution of such litigation may adversely affect our business, financial condition, results of operations and cash flows.
Our industry is characterized by frequent claims and litigation, including claims regarding patent or other intellectual property rights as well as product liability. Following our announcement that the ELAD System, our sole product candidate, failed to meet its primary and secondary endpoints in our VTI-208 phase 3 clinical trial, we became the subject of a lawsuit alleging securities law violations. Although this litigation was dismissed, this type of litigation can be expensive and disruptive to normal business operations, and the outcome can be difficult to predict regardless of the facts involved. An unfavorable outcome with respect to a lawsuit could have a material adverse effect on our business, financial condition, results of operations or cash flows.
Risks Related to the ELAD System’s Clinical Development
We have limited experience in conducting pivotal clinical trials used to support regulatory approval, and our prior clinical trials of the ELAD System did not demonstrate a statistically significant improvement in survival, the primary endpoint that is needed to support regulatory approval.
Our VTI-208 phase 3 randomized, controlled, open-label trial evaluating the ELAD System in subjects with AILD failed to meet the primary endpoint of overall survival through at least 91 days assessed using the Kaplan Meier statistical method. Our protocol for our new clinical trial in sAAH, VTL-308, incorporates limits on subjects' age, MELD score and its three components. While the endpoints and populations for VTL-308 are derived from results of our prior studies, including the results of VTI-208, and based on medical literature, in none of those prior studies have we demonstrated a statistically significant effect on the population based on the endpoints prospectively described in the study plan. Our prior clinical trials of the ELAD System in AILD, of which sAAH is a subset, did not demonstrate statistically significant improvement over standard of care in the primary endpoint of survival through at least study day ninety-one. Similarly, our prior clinical trials of the ELAD System in fulminant hepatic failure, or FHF, did not demonstrate statistically significant improvement in the primary endpoint of 28-day survival. The lack of statistical significance could be attributed to various factors, including the lack of power to demonstrate significance, the design of the studies or the lack of an ELAD System treatment benefit.
Any positive results from previous clinical trials may not be predictive of future results.
Any positive results from our prior clinical trials, including either statistical significance in some endpoints or trends towards statistical significance in other endpoints, should not be relied upon as evidence that our current or future clinical trials will necessarily succeed. While we believe that we have learned valuable lessons from the results of prior trials and have attempted to use these lessons to guide our design of VTL-308, there can be no guarantee that these lessons are correct or that we have effectively incorporated them into the design of VTL-308. For example, our primary endpoint in VTI-208 was based on the results of a subset of subjects in our VTI-206 clinical trial. Although that subset showed a trend toward increased survival up to at least study day ninety-one, it consisted of only 29 subjects. The FDA has noted its belief that this preliminary clinical evidence did not indicate that our product may demonstrate a substantial improvement over standard of care. We cannot provide any guarantee that our possible future clinical trials will provide statistically significant data sufficient to support regulatory approval.
32
If we fail to select appropriate subjects for our phase 3 clinical trials or if these subjects do not progress as expected, it will be difficult for us to demonstrate the statistically significant efficacy of the ELAD System therapy necessary to gain approval.
We designed VTI-208 and VTI-210 in accordance with input provided by regulatory authorities that we must demonstrate a statistically significant improvement in a survival endpoint. VTI-208 and VTI-210 included concurrent control subjects in a 1:1 ratio with treated subjects, and all subjects were to be included in the statistical analysis. Each study was designed to enroll subjects with an expected death rate of about 50% in 90 days without the ELAD System therapy. It was and is necessary to select subjects with high expected death rates in order to be able to determine whether the ELAD System has an effect on treated subjects and to help determine the number of subjects to enroll in a clinical trial in order to be able to achieve statistical significance. We monitor certain baseline characteristics of the subjects we are enrolling in our studies (such as age and MELD scores) to assess that the population characteristics are similar to prior studies in which death rates were in the target range. Although we have incorporated limits on age, MELD scores, creatinine, INR and bilirubin for VTL-308, there is no assurance that the revised parameters will be sufficient to predict survival. Additionally, there is no assurance that the inclusion and exclusion criteria for VTL-308, which will have the same primary and secondary endpoints as the VTI-208 clinical trial, will help the study show statistical significance, and it may be more difficult for us to find subjects with the narrower criteria, which could delay enrollment and increase the costs of VTL-308 beyond our current expectations. Moreover, if we do not succeed in selecting appropriate subjects or if the subjects we select do not progress as expected, we may not be able to demonstrate statistically significant efficacy of the ELAD System therapy necessary to gain approval.
Random variation or changes in standard of care could cause our clinical trials to be delayed and/or fail.
Regulatory authorities worldwide have adopted the standard that, to gain marketing approval, clinical trials should produce a result that has less than a 5% probability of being due to random variation. There is no assurance that our current or any of our possible future clinical trials will meet that standard. In addition, we have designed all of our clinical trials to be judged by a survival primary endpoint, which may be difficult to achieve for many reasons, including unanticipated survival rates of control subjects due to random variations, deficiencies in our exclusion and inclusion criteria, and the standard of care of the subjects, which may vary from site to site and country to country and is continuously evolving. For example, the FDA had expressed concern that the VTI-208 study may not have been adequately designed to provide convincing evidence of efficacy if there are significant differences in how the ELAD System subjects and controls are treated during the treatment period and after hospital discharge. VTL-308 will bear the same risk. Variations in length of hospital stay, rates of hospital re-admission, alcohol recidivism rates, nutritional support, and concomitant medications, which are not within our control, could significantly confound the study results and call into question whether any difference in survival is due to the ELAD System or to these factors. Moreover, evolution in the standard of care for the treatment of patients with acute forms of liver failure could make our trials difficult to enroll and interpret. For instance, the results of the Steroids or Pentoxifylline for Alcoholic Hepatitis, or STOPAH, study funded by the United Kingdom National Institute for Health Research failed to demonstrate any significant benefit in the primary analysis of overall survival for subjects treated with either steroids, pentoxifylline or a combination of the two at one, three or twelve months, as compared with placebo. Any of these factors, which are beyond our control, could materially and adversely affect the results of any of our phase 3 clinical trials and prevent us from gaining regulatory approval of our ELAD System therapy. In addition, even if the results of our clinical programs are positive, our inability to control or adequately account for these factors between treatment arms could cause the FDA or other regulatory authorities to determine that the results are not adequate, or must be reproduced in a confirmatory study, to support marketing approval.
The ELAD System treatment could result in significant clinical risks to the patient, including death.
The ELAD System therapy is targeted towards very sick patients who are likely to die if left untreated. Patients with liver failure resulting from acute hepatocellular insult quickly develop failure of other organs including lungs, kidney, brain, and blood coagulation systems. Patients who receive the ELAD System therapy may die due to other serious health problems even if the ELAD System is effective.
33
All extracorporeal therapy systems, including the ELAD System, cause a decline in blood platelets, which can lead to coagulation problems and uncontrolled bleeding because platelets are critical to clot formation. Patients with liver failure generally have serious blood clotting problems since the liver produces almost all of the body’s blood clotting proteins. These patients therefore have wide variations in their ability to coagulate their blood. To minimize blood clotting issues during ELAD treatment, some subjects require an infusion of anti-coagulants, which can aggravate bleeding. Because every subject is different, the need for anti-coagulant therapy is variable and must be closely monitored during ELAD System therapy. The risk of uncontrolled bleeding may be treated during the ELAD System therapy by administering platelet transfusions or by administering blood coagulation factors. However, there have been cases of uncontrolled bleeding during and after the ELAD System therapy. Additionally, some patients have abnormal red blood cells, which have weakened cell walls subject to rupture by physical force, a process known as hemolysis. The physical force exerted on the red blood cells by the ultrafiltrate generator in the ELAD System line can, in some cases, be enough to cause overt mechanical hemolysis that resolves after ELAD treatment is stopped, but can result in death if it continues too long. The incidence of hemolysis was less than 0.5% in subjects enrolled in our prior clinical trials, and one patient died in the China trial as a result of hemolysis.
Data from our clinical trials suggest that ELAD treatment should not be used in subjects with acute kidney injury (defined as a serum creatinine level of greater than or equal to 1.5 mg/dL). The use of extracorporeal systems such as ELAD may cause harm in patients with pre-existing kidney injury because these subjects are at an increased risk to develop fluid overload due to the renal impairment. Furthermore, ELAD treatment should be stopped if a patient develops any indication for renal replacement therapy, because patients with renal impairment are less likely to be able to tolerate the increased stresses associated with two extracorporeal devices requiring high venous flow rates.
Similarly, data from our prior clinical trials suggest that ELAD treatment should not be used in subjects with severe coagulopathy (problems with blood clotting, defined as an INR of greater than 2.5). The use of extracorporeal systems such as ELAD may cause harm in patients with pre-existing severe coagulopathy because the circulation of blood outside the body can cause a depletion in circulating factors associated with the blood clotting cascade, and reductions in the number of circulating platelets in the blood which are required for the blood to clot properly. As a result, subjects on extracorporeal systems such as ELAD are at an increased risk to develop bleeding issues.
Human liver-derived C3A cells have been shown in animal studies to have the capacity to grow into a tumor mass under certain conditions. While it is possible that some VTL C3A cells could escape from the ELAD cartridges and cause tumors in patients or produce substances that could lead to the development of malignant tumors, it is expected within the natural medical history of this population of patients with chronic liver disease (whether caused by hepatitis B or alcohol) that a certain incidence of cancer will be reported. There was no evidence that the incidence or type of cancer was different between the ELAD and control group in the China study. There has been one reported cancer (colon cancer) in VTI-208 in an ELAD-treated subject. Long term follow up of VTI-208, as required by the regulatory authorities, will provide more information. These or other adverse events, even those that are currently unforeseen, could significantly affect our development and commercialization efforts, cause the regulatory authorities to place our clinical trials on hold or to refuse to grant or maintain the marketing approval or result in withdrawal of the ELAD System from the market.
Ethical considerations require us to conduct open-label clinical trials of the ELAD System where control subjects do not receive a sham treatment and this could introduce unacceptable bias into our trial results.
We are not conducting any of our clinical trials with a sham control extracorporeal circuit that includes empty cartridges. This is due to the potential harm that the extracorporeal circuit can cause to control subjects without the potential for any benefit, which makes it unethical to subject the controls to a sham. Although regulatory agencies agree that, due to the nature of the ELAD System therapy, it is not possible to conduct a blinded study, they have expressed concern that the open-label nature of the study may introduce significant bias in the treatment of the ELAD System or control subjects, since the study subject, physicians and caregivers know who has and has not received the ELAD System therapy. We have developed a protocol that attempts to minimize this bias to the extent possible, including defining a protocol-specific standard of care, specifying steroid treatment, standardizing the discharge criteria for both the ELAD System and control subjects, requiring that follow-up visits are conducted by a blinded reviewer, ensuring home healthcare nurses and other clinical personnel are unaware of treatment assignment, educating subjects not to reveal treatment assignment to their caregivers and monitoring concomitant medications, alcohol recidivism and interaction with the healthcare system to provide evidence that there is no meaningful difference between the groups that could significantly confound the trial data. However, there is no guarantee that bias will not enter into the trial, affect the results or cause regulatory agencies to refuse marketing approval of the ELAD System.
34
If we encounter difficulties enrolling subjects in our clinical trials, our clinical trials could be delayed or otherwise adversely affected.
Clinical trials for the ELAD System require us to identify and enroll a large number of subjects that meet all of the entry criteria set forth in our protocols, including having the disease under investigation. We may not be able to enroll a sufficient number of subjects who meet our protocol requirements in a timely manner. Subject enrollment is affected by numerous factors, many of which fall outside of our control, including:
|
•
|
timeliness of contracting with clinical trial sites, and obtaining approval of the trial by the applicable institutional review boards, or IRBs, or ethics committees;
|
|
•
|
lack of a sufficient number of subjects who meet the enrollment criteria for our clinical trials;
|
|
•
|
perceived risks and benefits of the product candidate under study;
|
|
•
|
availability of competing therapies and clinical trials;
|
|
•
|
efforts to facilitate timely enrollment in clinical trials;
|
|
•
|
scheduling conflicts with participating clinicians; and
|
|
•
|
proximity and availability of clinical trial sites and resources for prospective subjects.
|
In light of disclosures of our VTI-208 data by us and others, it is possible that subjects will be less willing to participate in future trials of the ELAD System. Additionally, we may experience difficulties enrolling new subjects based on the new exclusion and inclusion criteria for VTL-308. Even when we identify an appropriate subject population for a clinical trial, there can be no assurance that the subjects will elect to enroll in the study or complete the study. These difficulties could impact our anticipated budget and timeline for VTL-308.
If we have difficulty enrolling a sufficient number of subjects to conduct our clinical trials as planned or if enrolled subjects fail to complete the study or comply with our protocols, particularly with regard to follow-up appointments, the completion of our clinical trials will be delayed, and our business would be harmed.
We may face delays in completing our clinical trials, and we may be required to suspend, repeat or terminate our clinical trials if they are not conducted in accordance with applicable regulatory requirements, the results are negative or inconclusive, or the clinical trials are not well-designed or executed as expected.
Our clinical trials must be conducted in accordance with regulations governing clinical studies, and are subject to oversight by the FDA, foreign governmental agencies, ethics committees and IRBs at the medical institutions where the clinical trials are conducted. In addition, clinical trials may require large numbers of test subjects. Changes in regulatory requirements may occur at any time, and we may need to amend clinical trial protocols to reflect such changes. In addition, we may voluntarily amend our protocols, as we did for our VTI-210 clinical trial. Amendments may require us to resubmit our clinical trial protocols to ethics committees or IRBs for reexamination, which may impact the costs, timing or successful completion of the underlying trial.
Our clinical trials may require amendment or be delayed, not approved, unsuccessful or terminated as a result of many factors, including:
|
•
|
delays or failures in designing an appropriate clinical trial protocol with sufficient statistical power and in reaching agreement on trial design with investigators and regulatory authorities;
|
|
•
|
delays or failure in reaching agreement on acceptable terms with prospective CROs and clinical trial sites, the terms of which can be subject to extensive negotiation and may vary significantly among different CROs and trial sites;
|
|
•
|
delays or failure by CROs, investigators and clinical trial sites in ensuring the proper and timely conduct of our clinical trials;
|
|
•
|
delays or failure by us in manufacturing sufficient quantities of the ELAD cartridges pursuant to required quality standards for use in our clinical trials and by third-party manufacturers in supplying necessary and suitable components for the ELAD System;
|
|
•
|
delays or failure in transporting the ELAD System and cartridges to clinical trial sites with sufficient rapidity to enable treatment to begin early enough to have an opportunity for clinical benefit;
|
35
|
•
|
delays or failure in completing data analysis and achieving primary and secondary endpoints;
|
|
•
|
delays in subject enrollment or site initiation, including in light of, among other things, our negative results from VTI-208;
|
|
•
|
regulators or clinical site ethics committees or IRBs may not approve, delay, suspend or terminate clinical research for various reasons, including noncompliance with regulatory requirements or concerns about patient safety;
|
|
•
|
we may suspend or terminate our clinical trials if we believe the ELAD System is exposing the participating subjects to unacceptable health risks or for other reasons;
|
|
•
|
subjects may not complete our clinical trials due to safety issues, adverse events, inconvenience or other reasons;
|
|
•
|
subjects in our clinical trials may die or suffer other adverse events for reasons that may be either related or unrelated to the ELAD System, particularly given the critically ill nature of these subjects;
|
|
•
|
we may have difficulty in maintaining contact with subjects after treatment, preventing us from collecting the data required by our study protocol; and
|
|
•
|
final analysis of the data of our clinical trials may conclude that the ELAD System lacks sufficient clinical efficacy or presents unacceptable safety risks.
|
If our clinical trials fail to provide evidence of safety and efficacy sufficient to satisfy the requirements of the regulatory authorities such as with VTI-208, the ELAD System will not be approved unless we are able to perform additional clinical trials showing such safety and efficacy. Delays in the completion of, or termination of, any clinical trial of the ELAD System may harm the future commercial prospects of the ELAD System, and our ability to generate revenues may be delayed or eliminated. In addition, any delays in completing our clinical trials increases our costs, slows down our development and approval process and delays or jeopardizes our ability to commercialize the ELAD System. These occurrences harm our business, financial condition and prospects significantly.
Risks Related to Regulatory Matters
The FDA regulatory approval process is complex, time-consuming and unpredictable. In addition, our negative VTI-208 data may adversely affect the attitude of regulatory authorities toward the development of the ELAD System.
In the U.S., the ELAD System is regulated as a combination biologic and medical device. Before the ELAD System can be marketed in the U.S., we must submit and the FDA must approve a BLA. In addition, the device components of the ELAD System must be found acceptable as part of the BLA. The ELAD System is a novel therapy involving a combination biologic and medical device and the regulatory review process is complex, time-consuming and unpredictable. As a result, our development costs, timelines and approvals are not readily predictable.
The time required to obtain approval by the FDA to market a new therapy is unpredictable but typically takes many years and depends upon many factors, including the substantial discretion of the regulatory authorities.
The ELAD System could fail to receive regulatory approval for many reasons, including the following:
|
•
|
the FDA may disagree with the design or implementation of our clinical trials or study endpoints. For example, it has expressed concern about the open-label design and multiplicity of confounding variables, including the need for delineating the standard of care that both the treated and control groups will receive during our studies;
|
|
•
|
we may be unable to demonstrate to the satisfaction of the FDA that the ELAD System is safe and effective for its proposed indications or that the ELAD System provides significant clinically relevant benefits;
|
|
•
|
the results of our clinical trials may not meet the level of statistical significance required by the FDA for approval or may not support approval of a label that could command a price sufficient for us to be profitable;
|
|
•
|
the FDA may disagree with our interpretation of data from preclinical studies or clinical trials;
|
|
•
|
the opportunity for bias in the clinical trials as a result of the open-label design may not be adequately handled and may cause our trial to fail;
|
36
|
•
|
the ELAD System may be subject to an FDA advisory committee review, which is triggered by an FDA request and is solely within the FDA’s discretion, which may result in unexpected delays or hurdles to approval;
|
|
•
|
the FDA may determine that the manufacturing processes at our facilities or facilities of third party manufacturers with which we contract for clinical and commercial supplies are inadequate;
|
|
•
|
even if VTL-308 is successful in demonstrating a statistically significant improvement over standard of care, in light of the fact that certain confounding factors may be viewed by the FDA as limiting the persuasiveness of the study results, a single successful phase 3 clinical trial may not be sufficient to provide the substantial evidence of effectiveness necessary to support regulatory approval, and therefore we may need more than one phase 3 clinical trial to secure regulatory approval;
|
|
•
|
the FDA has commented that even if one of our phase 3 clinical trials is a statistical and clinical success, a second confirmatory trial that substantiates positive results may be necessary to support a BLA;
|
|
•
|
the approval policies or regulations of the FDA may significantly change in a manner rendering our clinical data insufficient for approval; and
|
|
•
|
the negative results from VTI-208 could result in more stringent requirements being imposed by regulatory bodies and advisory groups.
|
The FDA expressed concern with our past phase 3 clinical trial, VTI-208, that if there are significant differences in how the ELAD and control subjects are treated during the study and after discharge from the hospital, the study may not be able to provide convincing evidence of safety and efficacy. Differences in length of hospital stay, rates of hospital re-admission, alcohol recidivism rates, nutritional support, and concomitant medications could significantly confound the VTL-308 study results.
In addition, even if we were to obtain approval, the FDA may grant approval contingent on the performance of costly post-marketing clinical trials, or may approve the ELAD System with a label that does not include the labeling claims necessary or desirable for successful commercialization of the ELAD System. Any of the above could materially harm the ELAD System’s commercial prospects.
The regulatory approval processes of foreign regulatory authorities are lengthy, time-consuming and inherently unpredictable.
Outside the U.S., our ability to market the ELAD System is contingent upon receiving marketing authorizations from appropriate regulatory authorities. If our clinical programs are successful, we currently anticipate submitting applications for marketing authorization to the EMA in the European Union. The requirements governing the conduct of clinical trials, marketing authorization, pricing and reimbursement vary widely from country to country, and we may be unable to meet such requirements. If the regulatory authority is satisfied that adequate evidence of safety, efficacy, and quality has been presented, a marketing authorization will be granted. The foreign regulatory approval process involves all of the risks associated with FDA approval.
Even if the ELAD System receives regulatory approval, we will be subject to ongoing regulatory requirements and may face regulatory or enforcement action.
If any ELAD System product receives regulatory approval, we will be subject to significant ongoing regulation by the FDA and other regulatory authorities, including regulation of our manufacturing operations and any third-party manufacturing operations for compliance with applicable current Good Manufacturing Practices, or cGMP, and/or Quality System Regulation, or QSR, post-approval clinical data, adverse event reporting and complaint handling, and advertising and promotional activities. Failure to comply with regulatory requirements may subject us to sanctions. These may include warning letters, adverse publicity, civil and criminal penalties, injunctions, product seizures or detention, and refusal to approve pending product marketing applications.
Our employees, independent contractors, principal investigators, CROs, consultants and vendors may engage in misconduct or other improper activities, including non-compliance with regulatory standards and requirements and insider trading.
We are exposed to the risk that our employees, independent contractors, principal investigators, CROs, consultants and vendors may engage in fraudulent conduct or other illegal activity or that they do not comply with regulatory standards and
37
requirements. Misconduct or non-compliance by these parties could include intentional, reckless and/or negligent conduct or unauthorized activities that violate (1) FDA regulations, including those laws that require the reporting of true, complete and accurate information to the FDA, (2) quality standards, including Good Laboratory Practices, or GLP, Good Clinical Practice, or GCP, and cGMP, (3) federal and state healthcare fraud and abuse laws and regulations, (4) laws that require the reporting of true and accurate financial information and data (5) securities laws and regulations or (6) the federal Health Insurance Portability and Accountability Act of 1996, or HIPAA. Sales, marketing and business arrangements in the healthcare industry are also subject to extensive laws and regulations intended to prevent fraud, kickbacks, self-dealing and other abusive practices. These laws and regulations may restrict or prohibit a wide range of pricing, discounting, marketing and promotion, sales commission, customer incentive programs and other business arrangements. We may fail to identify and deter misconduct or non-compliance by employees and third parties, or the precautions we take to detect and prevent this activity may not be effective in controlling unknown or unmanaged risks or losses or in protecting us from governmental investigations or other actions or lawsuits stemming from a failure to be in compliance with such laws or regulations. If any such actions are instituted against us, and we are not successful in defending ourselves or asserting our rights, those actions could have a significant impact on our business, including the imposition of changes to or even the halt of our clinical trials or clinical manufacturing or civil, criminal and administrative penalties, damages, monetary fines, possible exclusion from participation in Medicare, Medicaid and other federal healthcare programs, contractual damages, reputational harm, diminished profits and future earnings, and curtailment of our operations, any of which could adversely affect our ability to operate our business and our results of operations.
Risks Related to the Medical Device Components of the ELAD System
If we or our third-party manufacturers fail to comply with QSR in the U.S. or Medical Device Directives and Standards in Europe, our business would suffer.
We are required to demonstrate and maintain compliance with applicable regulations for the manufacturing of combination biologic products, including specified parts of the QSR and European Medical Device Directives, or MDD. Our third-party medical device manufacturers are required to demonstrate and maintain compliance with the QSR and MDD. The QSR and MDD are complex regulatory schemes that cover the methods and documentation of the design, testing, control, manufacturing, labeling, quality assurance, packaging, storage and shipping of the ELAD System. Regulatory agencies enforce the QSR and MDD through periodic inspections. Prior to approval of the ELAD System, our manufacturing facility will be subject to a preapproval inspection to determine compliance with the applicable regulations, including cGMPs, parts of the QSR, the European drug cGMP regulations, and the MDD. In addition, our third-party medical device component manufacturers will be subject to a preapproval inspection to determine compliance with QSR and MDD requirements. Our failure, or the failure of our third-party manufacturers, to pass a preapproval inspection, or take satisfactory and prompt corrective action in response to an adverse inspection, could prevent or significantly delay approval of the ELAD System.
The ELAD System bedside unit is based on a cardio-pulmonary bypass system that has been replaced with an updated system, and regulatory authorities may not view the systems as interchangeable, which could cause regulatory approvals to be significantly delayed.
The ELAD System bedside unit was originally based exclusively on the Sorin Stöckert Perfusion System S3 Double Head Pump Module, a medical device indicated for use during cardio-pulmonary bypass surgery. All or part of our early clinical trials were carried out using an ELAD System bedside unit based on Sorin’s S3 system. However, Sorin stopped selling the S3 system and replaced it with an updated S5 system. We have carried out testing of an ELAD System bedside unit based on the S5 and we believe that the S3 and S5 systems are equivalent and interchangeable from a clinical and regulatory perspective. We have submitted information to both the U.S. and the European regulatory authorities to support equivalence. Both the S3 and S5 systems were used in our VTI-208 and VTI-210 clinical trials and both are being used in our VTL-308 clinical trial. There can be no assurance that regulatory authorities will continue to view the S3 and S5 systems interchangeably, or that Sorin will cooperate with us or provide us with the documentation necessary for inclusion in a BLA submission, if any, which would be required to obtain regulatory approval of our ELAD System. If regulatory authorities do not view the S3 and S5 systems as equivalent, or Sorin fails to provide the information necessary for inclusion in our regulatory filings, approval of our ELAD System may be significantly delayed or prevented. In addition, we have been notified that Sorin will only support its S3 systems through 2017. Accordingly, if our trial is successful, we would expect to commercialize ELAD with only the Sorin S5 system.
38
One of the ELAD System component suppliers was subject to an FDA consent decree, which could have forced us to find another supplier for this component.
One of the components of the ELAD System bedside unit is manufactured by Terumo Cardiovascular System, or Terumo. In March 2011, Terumo entered into a consent decree with the FDA which limited its ability to ship products from certain of its manufacturing facilities including the one that manufactures the component we use. We received notice from Terumo in June 2016 that all restrictions listed in the 2011 consent decree were lifted. However, if we were unable to source the component we use from Terumo, we would have to source the component from an alternative supplier. If Terumo or another component supplier has similar issues in the future, there is no guarantee that a qualified alternative supplier can be found that will agree to terms reasonably acceptable to us on a timely basis or at all.
Changes in any of the device components could affect our ability to complete our clinical trials and to obtain and maintain approval and commercialization efforts.
The device components of the ELAD System will be reviewed as part of any BLA for the ELAD System. If the manufacturers of those components make modifications, discontinue supplying or are unable to supply sufficient quantities of such components during our clinical testing or after any approval, or if we elect to change a component, we will need to perform validation testing and obtain FDA and other regulatory approval prior to using the modified or replacement component. For example, one of our suppliers had an issue sourcing a raw material that is used in the manufacturing of tubing, which is a component of the ELAD System. If we had not been able to obtain sufficient quantities of this tubing on a timely basis, we would have had to delay enrollment in our clinical trials until additional supplies became available, or we would have been required to validate an alternative tubing to use, which could have delayed our clinical trials and increased our costs. If the FDA or any other regulatory body fails to approve use of those modified or replacement devices, takes significant enforcement action against the manufacturer or if we are unable to validate a replacement component, we would not be able to complete our clinical trials or, in the future, we might not be able to market or could have to suspend marketing of the ELAD System in certain jurisdictions.
We may be unable to demonstrate that devices cleared for different uses may be safe and effective for use in the ELAD System.
Most device components of the ELAD System have been previously cleared for use by the FDA or other regulatory authorities. However, in some instances, we will be using the components outside the scope of their cleared indications. Other device components have no regulatory approvals. We may need to conduct additional testing to bridge the differences between the cleared indications for use and the proposed use in the ELAD System in order to obtain approval, or we could be required to obtain separate clearance for one or more of the components used in the ELAD System. The failure to provide adequate bridging information or to obtain separate clearance of these device components for use in the ELAD System, if required, could delay or prevent approval of the ELAD System.
Risks Related to the Cellular Component of the ELAD System and Related Components
If we fail to comply with cGMPs, our business will suffer.
We are required to demonstrate and maintain compliance with cGMPs. The cGMPs describe the methods to be used in, and the facilities or controls to be used for, the manufacture, processing, packing, or holding of a biologic to assure the biologic meets the requirements for safety, and has the quality, purity, and potency characteristics that it purports or is represented to possess. Regulatory agencies enforce these requirements through periodic inspections. Prior to approval of the ELAD System, our manufacturing facilities will be subject to a preapproval inspection to determine compliance with U.S. and European cGMPs and applicable QSR and MDD requirements. Our failure to pass such an inspection, or take satisfactory and prompt corrective action in response to an adverse inspection, could prevent or significantly delay approval of the ELAD System.
39
We rely on third party suppliers, and in some instances, a single third party supplier, for critical components of the ELAD System, and these suppliers could cease to manufacture the components, go out of business or otherwise not perform as anticipated.
While the growing of our VTL C3A cells is under our control, the manufacture of all of the other parts and components of the ELAD System are undertaken by third party suppliers. We currently rely on a single source of supply for many critical components, including components of the ELAD System bedside unit, the ultrafiltrate generator cartridges, the media we use to grow and ship our VTL C3A cells, the cartridges in which our VTL C3A cells are grown, the final cell filter cartridges and the bioreactors that have been developed to grow and store the ELAD cartridges. We are currently investigating additional sources of supply for these components to support future clinical development and, ultimately, commercialization of the ELAD System. If we fail to develop additional sources of supply, and a single source of supply of a critical component of the ELAD System were to become unavailable, our ability to continue clinical development or to initiate commercialization of the ELAD System would be severely compromised. In addition, we rely on third party suppliers for the safety of products of human and animal origin that are incorporated in the ELAD System production process, and these suppliers could cease to manufacture the components, inadequately test these components, go out of business or otherwise not perform as anticipated. We do not have long-term agreements with our suppliers, and we purchase components on a purchase order basis. For components that are not readily available from other sources, we are subject to the risks that our suppliers will raise their prices or impose other terms or conditions that are less favorable or unacceptable to us.
For instance, bovine serum, which is a component of the cell growth media, is used in the manufacture of the ELAD System cartridges. It is obtained from an outside supplier. We are wholly reliant on the guarantee of our supplier that the calf serum used in our manufacturing procedures is free of transmitted animal viruses and other pathogens. Should the source of supply become infected, or the supplier become unable to continue to supply calf serum of the quality necessary to support human use, or the regulations change such that the calf serum cannot be used for human use, we would have to find alternative sources of supply and manufacturing methods, for which there is no guarantee of success.
Human albumin and Trypsin-EDTA are also used in the manufacture of our ELAD System cartridges and are each provided by a single supplier. In addition, while these products are tested to be free of contamination by the supplier, we cannot guarantee that will continue to be the case.
If our facility becomes inoperable, we will be unable to continue manufacturing our product candidate and as a result, our business will be harmed until we are able to secure a new facility.
We manufacture and assemble the ELAD System at our facility in San Diego, California. No other manufacturing or assembly facilities are currently available to us, and any additional manufacturing or assembly facilities that we use will need to be qualified and approved by regulatory authorities prior to our use. Our facility and the equipment we use to manufacture the ELAD System would be costly to replace and could require substantial lead
-
time to repair or replace. The facility may be harmed or rendered inoperable by natural or man-made disasters, including fire, earthquakes, flooding and power outages, which may render it difficult or impossible for us to perform our research, development and manufacturing for some period of time. The inability to perform our research, development and manufacturing activities, combined with our limited inventory of reserve raw materials and manufactured supplies, may result in the delay of clinical trials or, if approved for sale, the loss of customers, or harm our reputation, and we may be unable to reestablish relationships with those customers in the future. Although we possess insurance for damage to our property and the disruption of our business, this insurance may not be sufficient to cover all of our potential losses and may not continue to be available to us on acceptable terms, or at all.
We may be unable to manage our anticipated manufacturing growth to support our clinical development activities and long-term commercial demand for the ELAD System.
If and when the ELAD System is approved for sale, we will need to expand our manufacturing space in San Diego and build new manufacturing facilities to meet anticipated demand for the ELAD System in the U.S. and abroad. These activities involve significant expense, including the construction and validation of new clean rooms and bioreactors, the movement and installation of key manufacturing equipment and the modification of manufacturing processes. In addition, we must also notify, and in some cases obtain approval from, the FDA and other regulatory authorities of any changes or modifications to our manufacturing facilities and processes, and there can be no assurance that they will authorize us to proceed. If we are not able to expand our manufacturing capacity to meet future demand, our business would be harmed.
Further, commercialization would place additional strain on our organization, employees and third-party suppliers, resulting in an increased need for us to carefully monitor quality. Any failure by us to manage any future growth effectively could have an adverse effect on our ability to achieve our development and commercialization goals.
40
We forecast the requirements for components and materials used in the ELAD System, and if our forecasts are incorrect, we may experience delays in shipments or increased inventory costs.
We keep limited materials, components and finished product on hand. To manage our manufacturing operations with our suppliers, we forecast anticipated product orders and material requirements to predict our future inventory needs and enter into purchase orders on the basis of these requirements. Our limited historical experience may not provide us with enough data to accurately predict future demand. If our business expands, our demand for components and materials would increase and our suppliers may be unable to meet our demand. Many of our components are medical devices, which have fixed future expiration dates. If we overestimate our component and material requirements, we will have excess inventory, which may have to be disposed of if it exceeds approved expiration dates, which would increase our expenses. If we underestimate our component and material requirements, we may have inadequate inventory, which could interrupt, delay or prevent delivery of the ELAD System to our customers. Any of these occurrences would negatively affect our financial performance and the level of satisfaction our customers have with our business.
We may not be able to grow our VTL C3A cells reliably and cost-effectively.
Operations with human cells, even a stable, immortal cell line such as the VTL C3A cells used in the ELAD System, can be subject to conditions and influences that we may not be able to control. Although our VTL C3A cells are stored at three separate locations in the U.S. and the U.K., it is possible that all three locations could be destroyed and we will lose all or a portion of our cell banks. It is also possible that the cells will simply cease to function. While we take precautions to prevent this from happening, the ELAD System employs new technologies and we could encounter unforeseen complications. To date, we have only produced the small number of the ELAD cartridges required to support our clinical trials. As we increase production to support commercial demand, we could experience significant scale-up issues, which may cause quality and cost problems. If we cannot produce the required number of the ELAD cartridges in a cost-effective manner, our business could be materially harmed.
Cellular therapy is complex, and we do not have a complete understanding of the mechanism of action of the ELAD System.
Cellular therapy is a complex treatment with multiple variables that are not fully understood. Our VTL C3A cells used in the ELAD cartridges produce hundreds of metabolites. Likewise, the plasma ultrafiltrate formed from blood, which has been treated by our VTL C3A cells in our ELAD cartridges, is a similarly complex material. The composition and stability of the treated blood can be affected by the conditions of its generation in the ELAD System bedside unit, which could affect treatment outcomes. For instance, while subjects treated with the ELAD System typically only require a single set of cartridges, some subjects require more than one set during their treatment period, which may have implications for not only efficacy, but also cost of goods. While we believe that we have identified the key parameters of the ELAD System VTL C3A cartridges and set them in an appropriate range, it is possible that there are other variables that are important to safety and efficacy that have not been anticipated. We believe that we have set these parameters at realistic levels that can be controlled by the specifications set for a supplier and confirmed by us in our quality control procedures, but it is possible that unanticipated complications will emerge.
Likewise, our research into the potential mechanism of action for the ELAD System is ongoing, and although we are developing theories behind how the ELAD System may exert a clinical effect, the proposed mechanism of action remains unproven and may never be proven. The ELAD System's mechanism of action appears complex, may involve numerous pathways and we may not succeed in ever elucidating the exact role of any given pathway. Moreover, our research on mechanism of action is based on laboratory studies, and needs correlation with
in vivo
studies and patient outcomes. Additional research, some of which is underway, is needed.
Risks Related to the ELAD System’s Future Commercialization
Our financial results may fluctuate unpredictably, making it difficult to forecast our future performance.
Our limited operating history makes it difficult for us to predict our future commercialization efforts. A number of factors, over which we have limited or no control, may contribute to fluctuations in our financial results, such as:
|
•
|
delays in receipt of anticipated purchase orders;
|
|
•
|
our ability to recruit, train and retain sales, marketing, training and support personnel;
|
41
|
•
|
our inability to educate physicians about the ELAD System and drive the adoption of the ELAD System therapy for any approved indications;
|
|
•
|
performance of our targeted sales force in the U.S. and Europe and future partners in other markets;
|
|
•
|
results of clinical trials evaluating the ELAD System therapy;
|
|
•
|
positive or negative media coverage of the ELAD System or products of our competitors or our industry;
|
|
•
|
our ability to obtain further regulatory clearances or approvals, including for other indications;
|
|
•
|
delays in, or failure of, product and component deliveries by our subcontractors and suppliers;
|
|
•
|
changes in the length of the sales process;
|
|
•
|
changes in healthcare coverage and reimbursement policies;
|
|
•
|
customer response to the introduction of new product offerings; and
|
|
•
|
fluctuations in foreign currencies.
|
In addition, because we have only manufactured the ELAD System for clinical use and have never manufactured at commercial scale, we cannot accurately predict the costs of transitioning to commercial scale manufacturing or what our costs would be to manufacture the ELAD System commercially. While we believe we would be able to realize attractive gross margins on sales of the ELAD System, if approved, we may not achieve gross margins that we or our investors deem adequate due to higher costs or lower pricing than we currently expect based on the limited information available to us.
If the market size for the ELAD System is smaller than we anticipate, it could significantly and negatively impact our business, financial condition and results of operations.
It is very difficult to estimate the future commercial potential of the ELAD System due to factors such as changing standards of care, third-party payor reimbursement standards, ability of patients to meet co-payment amounts (if any), patient and physician preferences, the availability of competitive alternatives that may emerge, and indications for use (that may be based on, among other things, certain MELD scores, age ranges, or other factors). Further, the design of our VTL-308 clinical trial incorporates new limits on age, MELD score, creatinine, bilirubin and INR, thereby narrowing any potential future indication for use. If the ELAD System is approved for commercialization, these limitations may restrict the potential market size and opportunity for the ELAD System. For example, we have limited enrollment in the VTL-308 clinical trial to subjects within restrictions on subjects’ age, MELD score and the three components of the MELD score. If we extrapolate the number of subjects in VTI-208 with those characteristics to the overall estimated AILD population, then the AILD population, of which sAAH is a subset, treatable by the ELAD System would be limited further, unless we are able to develop strategies to get patients into treatment before their MELD scores and some of the components of MELD rise above certain thresholds. Through our analysis of the proportion of sAAH subjects from VTI-208 that had the characteristics targeted in VTL-308, we did observe that roughly 60% of VTI-208 subjects were under the age of 50, which is the age limit in VTL-308, and that 90% of subjects were under the age of 60. If the potential eligible patient population is lower than anticipated, our business, financial condition and results of operations could be significantly and negatively impacted.
The human clinical trial results may not be representative of the results that are obtained after the ELAD System product launch.
Human clinical trials are very complicated undertakings and working with subjects in liver failure is particularly difficult because of the serious nature of the disease and the co-morbidities experienced by the subjects. Not enough is known about the function of the liver to understand the progression of liver disease and any single subject can react differently to the ELAD System therapy. This means that clinical trials done at different times in different groups of subjects may obtain different results. Safety risks not identified in our clinical trials may first appear after we obtain approval and commercialize the ELAD System. Any new post-marketing adverse events may significantly impact our ability to market the ELAD System and may require that we recall and discontinue commercialization of the product. Any of these events would harm our business.
42
The ELAD System is a very complicated therapy and will need to be delivered by well-trained staff. There is no guarantee that we will be able to implement such training and find sufficient numbers of people to enable us to grow at an acceptable rate.
In the initial commercialization period, it will be essential for us to have our own trained staff present during the delivery of the ELAD System therapy. This may entail the construction and operation of training centers and will require the hiring of personnel of appropriate ability to be adequately trained. The differences in language and culture may make this a difficult undertaking. If we cannot recruit, train and retain significant numbers of physicians and nurses, our ability to grow will be restrained and we may find that the ELAD System therapy is being delivered by people with a substandard level of training, and with potentially material adverse results. If the ELAD System therapy is delivered improperly, or the bedside device or the ELAD cartridges are not properly maintained by our customers, the ELAD System may not provide the intended benefit or could harm patients. This may in turn result in perceptions, even if unfounded, that the ELAD System is ineffective or that our bedside device or the ELAD cartridges are defective, which could materially harm our reputation and ability to market the ELAD System effectively.
We could lose our key employees. If we are unable to retain our management, scientific staff and scientific advisors, our business will be seriously jeopardized.
Competition among biotechnology companies for qualified employees is intense, and the ability to retain our key employees is critical to our ability to effectively manage our resources. We are highly dependent on the efforts of our key employees, including senior management and senior scientific, clinical, regulatory, operational and other personnel. The development of new therapeutic products requires expertise from a number of different disciplines, some of which are not widely available.
Our key employees have a significant amount of know-how and experience in our company, and the loss of one or more of them could have a material and adverse effect on our operations. While we have taken steps to incentivize and to retain our employees, including the granting of stock options, paying competitive salaries and implementing appropriate bonus programs, these factors may not be enough to retain the key employees that we need.
The loss of the services of existing personnel, the failure to recruit additional key scientific, managerial, clinical, regulatory, operational and other personnel in a timely manner, and the loss of our employees to our competitors would harm our research and development programs and our business. We may experience difficulty in hiring and retaining highly skilled employees with appropriate qualifications. If we fail to attract new personnel or fail to retain and motivate our current personnel, our business and future growth prospects would be harmed.
Furthermore, while we have entered into employment letters with each of our executive officers, any of them could leave our employment at any time, as all of our employees are “at will” employees. It can be challenging to retain qualified personnel, and, considering the failure of VTI-208, it may be more difficult to recruit personnel in the future. The inability to recruit or loss of the services of any executive, key employee, consultant or advisor may impede our ability to identify and execute on our strategy.
Competitive products could be developed which would make the ELAD System obsolete.
The biotherapeutic and medical device industries are highly competitive, and we face potential competition from pharmaceutical, specialty pharmaceutical, medical device and biotechnology companies worldwide. Given the significant unmet medical need for novel therapies to treat liver failure, many companies, universities and research organizations are actively engaged in the discovery, research and development of potential therapies in this field. Several of these entities are engaged in research on cell-based approaches to liver failure. Although we are not aware of any ongoing human clinical trials involving potentially competitive cell-based product candidates, such trials could be taking place or could begin in the near future. While we are not aware of any company that is in human clinical trials with a human cell-based product for the treatment of liver failure, at least four companies have prior research work on various human hepatocyte cell lines including Exten Industries, Hepalife Technologies, Fresenius and Hybrid Organ GmbH. In addition, the University College London and the University of Amsterdam and its spinout Hep-Art Medical Devices are actively pursuing animal research in this area. Several companies have also attempted to develop extracorporeal therapy based upon primary porcine hepatocytes. Recently, a group from the Mayo Clinic reported that they were filing for regulatory allowance with the FDA to conduct early stage clinical studies with a pig-cell based system designed for the treatment of liver failure. The exact status of the filing is unknown. While we are not aware of any of these other entities being close to undergoing human clinical trials with a human cell-based product for the treatment of liver failure, it is possible that these trials are occurring without our knowledge, and that such a product may get to market much faster than we expect.
43
Two commercially available liver dialysis systems, MARS from Baxter (formerly Gambro) and Prometheus from Fresenius, have undergone extensive clinical development. Another company, Hepa Wash GmbH has begun a limited market introduction of an albumin dialysis system in Europe, and HepaNet has introduced the OPAL system, an evolution of the MARS albumin dialysis system in Germany. All rely on not only traditional dialysis circuits to remove water-soluble toxins, but also albumin dialysis circuits to remove albumin-bound molecules. To our knowledge none of these non-cellular systems has shown an improvement in long-term survival among patients with liver failure. It was also recently reported that a team from the Institute for Liver and Digestive Health, University College London and Yaqrit Ltd is planning to initiate a clinical trial in decompensated liver disease for a novel liver dialysis (non-bioartificial) system to be known as YAQ-002 incorporating albumin dialysis along with selective adsorption technology.
In addition, there are several drugs available to treat symptoms associated with liver failure, including steroids, pentoxifylline and N-acetylcysteine. These three drugs, alone or in combination, are used frequently in patients with liver failure resulting from acute hepatocellular insult. Gilead Sciences has initiated a phase 2 trial to evaluate the safety of a non-cellular, drug therapy known as GS-4997 in combination with a steroid named prednisolone, compared with prednisolone alone, in subjects with severe alcoholic hepatitis.
The coverage and reimbursement status of new therapies is uncertain, and failure to obtain adequate coverage and reimbursement for the ELAD System therapy could limit our ability to generate revenue and become profitable.
There is significant uncertainty surrounding the third-party coverage and reimbursement of novel and newly approved therapies, particularly for indications for which there is no current effective treatment or the current standard of care is relatively inexpensive. Due to the novel nature of the ELAD System and the potential for it to offer therapeutic benefit after a single administration of continuous therapy lasting three to five days, we face additional uncertainty related to coverage and reimbursement. We will depend in large part on the availability of coverage and the establishment of adequate reimbursement levels for the ELAD System from third-party payors, including government payors, such as the Medicare and Medicaid programs, and managed care organizations. Although we believe that the single largest category of ELAD-appropriate patients are covered by private insurance, followed by Medicaid and then Medicare, this analysis is based on small numbers, may not be accurate and may change in the future.
Third-party payors are increasingly focused on containing healthcare costs by limiting both coverage and the level of reimbursement for new therapies and, as a result, they may not cover or provide adequate payment for the ELAD System. Obtaining adequate coverage and reimbursement approval for a product from a third-party payor is a time-consuming, costly and sometimes unpredictable process that could require us to provide supporting scientific, clinical and cost-effectiveness data for the use of the ELAD System. However, we cannot guarantee that we will be able to provide data sufficient to gain acceptance with respect to adequate coverage and reimbursement. Payors may conclude that the ELAD System is less safe, less effective or less cost-effective than existing or later introduced therapies, and third-party payors may not approve the ELAD System for coverage and reimbursement or may cease providing or provide inadequate coverage and reimbursement. Coverage and reimbursement determinations are made on a payor-by-payor basis, and it may take several years to obtain appropriate reimbursement codes, if ever. Obtaining acceptable coverage and reimbursement from one payor does not guarantee that we will obtain similar acceptable coverage or reimbursement from another payor. As there is a large number of third-party payors, obtaining coverage and reimbursement in the U.S. and internationally will consume significant time and resources. A third-party payor’s decision to provide coverage does not imply that an adequate reimbursement rate will be approved. There can be no assurance that our clinical data will allow for satisfactory pricing of the ELAD System, and the failure to obtain coverage and adequate reimbursement for the ELAD System would materially and adversely affect our business. Moreover, healthcare cost containment initiatives that limit or deny reimbursement for the ELAD System would also materially and adversely affect our business.
44
Our relationships with investigators, healthcare professionals, institutional providers, consultants, third-party payors and customers are subject to applicable anti-kickback, fraud and abuse and other healthcare laws and regulations, which could expose us to penalties, including without limitation, civil, criminal and administrative penalties, damages, monetary fines, disgorgement, possible exclusion from participation in Medicare, Medicaid and other federal healthcare programs, contractual damages, reputational harm, diminished profits and future earnings, and the curtailment or restructuring of our operations.
Healthcare providers, physicians and others play a primary role in the recommendation and prescribing of any product candidates for which we may obtain marketing approval. In the U.S., our current business operations and future arrangements with investigators, healthcare professionals, institutional providers, consultants, third-party payors and customers, may expose us to broadly applicable fraud and abuse and other healthcare laws and regulations. These laws may constrain the business or financial arrangements and relationships through which we research, market, sell and distribute our products that obtain marketing approval. Restrictions under applicable federal, state and foreign healthcare laws and regulations, include, but are not limited to, the following:
|
•
|
the federal healthcare program anti-kickback statute prohibits, among other things, persons or entities from knowingly and willfully soliciting, offering, receiving or paying any remuneration (including any kickback, bribe, or rebate), directly or indirectly, overtly or covertly, in cash or in kind, to induce or in return for purchasing, leasing, ordering, or arranging for or recommending the purchase, lease, or order of any good, facility, service or item for which payment is made, in whole or in part, under a federal healthcare program;
|
|
•
|
the federal civil and criminal false claims laws and civil monetary penalties laws, including civil whistleblower or qui tam actions, prohibit, among other things, individuals or entities from knowingly presenting, or causing to be presented, to the federal government, claims for payment or approval that are false or fraudulent or from knowingly making a false statement to improperly avoid, decrease or conceal an obligation to pay money to the federal government;
|
|
•
|
HIPAA, imposes criminal liability for, among other things, knowingly and willfully executing, or attempting to execute, a scheme to defraud any healthcare benefit program or to obtain, by means of false or fraudulent pretenses, representations, or promises, any of the money or property owned by, or under the custody or control of, any healthcare benefit program regardless of the payor (e.g., public or private) and knowingly or willfully falsifying, concealing, or covering up by any trick, scheme or device a material fact or making any materially false statement in connection with the delivery of, or payment for, healthcare benefits, items or services relating to healthcare matters;
|
|
•
|
HIPAA, as amended by the Health Information Technology for Economic and Clinical Health Act, or HITECH, and its implementing regulations, and as amended again by the final HIPAA omnibus rule, Modifications to the HIPAA Privacy, Security, Enforcement, and Breach Notification Rules Under HITECH and the Genetic Information Nondiscrimination Act; Other Modifications to HIPAA, published in January 2013, imposes certain obligations, including mandatory contractual terms, with respect to safeguarding the privacy, security and transmission of individually identifiable health information without appropriate authorization by entities subject to the omnibus rule, such as health plans, clearinghouses and healthcare providers, and their associates;
|
|
•
|
the federal transparency law, enacted as part of the Patient Protection and Affordable Care Act, as amended by the Health Care and Education Reconciliation Act (collectively, the ACA), and its implementing regulations, require manufacturers of drugs, devices, biologicals and medical supplies to report to the U.S. Department of Health and Human Services information related to payments and other transfers of value made to physicians and teaching hospitals, as well as ownership and investment interests held by physicians and their immediate family members;
|
|
•
|
analogous state laws and regulations, including but not limited to: state anti-kickback and false claims laws, which may apply to our business practices, including but not limited to, research, distribution, sales and marketing arrangements and claims involving healthcare items or services reimbursed by state governmental and non-governmental third-party payors, including private insurers; state laws that require pharmaceutical companies to comply with the pharmaceutical industry’s voluntary compliance guidelines and the relevant compliance guidance promulgated by the federal government; and state laws and regulations that require manufacturers to file reports relating to pricing and marketing information, which requires tracking gifts and other remuneration and items of value provided to healthcare professionals and entities; and
|
45
|
•
|
European Union, or EU, data protection regulations, which may require member states of the EU to impose minimum restrictions on the collection and use of personal data that, in some respects, are more stringent, and impose more significant burdens on subject businesses, than current privacy standards in the U.S.
|
Efforts to ensure that our business arrangements with third parties will comply with applicable healthcare laws and regulations will involve substantial costs. It is possible that governmental authorities will conclude that our business practices may not comply with current or future statutes, regulations, agency guidance or case law involving applicable fraud and abuse or other healthcare laws and regulations. If our operations are found to be in violation of any of these or any other health regulatory laws or any other governmental regulations that may apply to us, we may be subject to penalties, including without limitation, civil, criminal and administrative penalties, damages, monetary fines, disgorgement, enhanced government reporting and oversight under a corporate integrity agreement or other similar arrangement, possible exclusion from participation in Medicare, Medicaid and other federal healthcare programs, contractual damages, reputational harm, diminished profits and future earnings, and the curtailment or restructuring of our operations. Any action against us for violation of these laws, even if we successfully defend against it, could cause us to incur significant legal expenses or divert our management’s attention from the operation of our business. If any of the physicians or other providers or entities with whom we expect to do business are found to be not in compliance with applicable healthcare laws, they also may be subject to similar penalties.
Healthcare policy changes, including recent laws to reform the U.S. healthcare system, may have a material adverse effect on us.
In the U.S. and in other countries, there have been and we expect there will continue to be a number of legislative and regulatory proposals to change the healthcare system in ways that could significantly and adversely affect the business of developing and marketing new therapies by reducing the costs paid for medical products and services. For instance, the U.S. government and other governments have shown significant interest in pursuing healthcare reform, as evidenced by the passing of the ACA. Such government-adopted reform measures may adversely impact the pricing of healthcare products and services in the U.S. or internationally and the amount of reimbursement available from third-party payors. For instance, under the ACA, there is a 2.3% U.S. federal excise tax on the sale of certain medical devices. While we do not believe the tax will be applicable to us, the U.S. may seek to enforce the tax on us. In addition, in some foreign jurisdictions, there have been a number of legislative and regulatory proposals to change the healthcare system in ways that could affect our ability to sell the ELAD System profitably, if it is ultimately approved. The continuing efforts of the U.S. and other governments, insurance companies, managed care organizations and other payors of healthcare services to contain or reduce healthcare costs may adversely affect the prices we are able to charge for the ELAD System, if approved, and our ability to generate revenues and achieve and maintain profitability.
Risks Related to Doing Business Internationally
We plan to do business internationally, which may prove to be difficult and fraught with economic, regulatory and political issues.
We may commercialize the ELAD System in countries where the business, economic and political climates are very different from those of the U.S. We may not be aware of some of these issues, and it may be difficult for a U.S. company to overcome these issues and ultimately become profitable. For instance, we completed our Chinese pivotal clinical trial in 2007 and submitted our data to the China FDA, or CFDA, showing a statistically significant improvement in transplant-free survival among the ELAD System-treated subjects compared with control subjects. However, in the past nine years this application has been neither approved nor rejected and the timing and nature of any potential decision is highly uncertain. Moreover, currency controls are in effect in many foreign countries and could become much tighter in the future, which will hinder our ability to repatriate any profits or capital. These foreign countries may also favor businesses that are owned by nationals of those countries as opposed to foreign-owned businesses operating locally. As a small company, we may not have the resources to engage in the negotiation and time-consuming work needed to overcome some of these potential issues.
In the event that we receive marketing approval in foreign countries outside of the U.S. and Europe, we currently anticipate, in most cases, creating wholly-owned subsidiaries in those countries. These subsidiaries will need to build an effective sales, marketing, distribution, training and support staff and system, find an effective marketing partner or both. Any internal sales, marketing, training and support capabilities of the subsidiaries will need to be developed by these subsidiaries and will need to be built from scratch. The culture and accepted practices related to selling medical products in many foreign countries are unique, and it is possible that we will not be able to successfully penetrate these markets. A similar consideration applies to selling in the U.S., since each medical system is very different and requires a different strategic approach. We cannot guarantee that our approach to the U.S., European, Chinese or any other international market will be effective.
46
The medical systems in many foreign countries are very different from that of the U.S. and could cause significant problems for the ELAD System.
The medical systems in many countries around the world pose challenges to the commercialization of the ELAD System. For instance, most medical care in China is delivered on a private pay basis, and it may be difficult to receive payment for the ELAD System therapy delivered or the price of our product, which we expect to be relatively high, may prove to be beyond the capability of the targeted Chinese patient to pay. Further, as we have encountered in our clinical trials, the standard and the operation of the delivery of care in China are different, causing problems with the operation of the ELAD System therapy. These issues include the withholding of necessary medicines, the inadequate staffing of Chinese hospitals, the shortage of blood products, the differing practice of delivery of extracorporeal therapies, and the attitude of physicians and nurses. These issues and others are likely to occur in other countries around the world and there is no assurance that we will overcome these challenges or succeed in commercializing the ELAD System in foreign countries.
We face increased risks of doing business due to the extent of our operations internationally.
We currently anticipate our foreign commercialization efforts will be through wholly-owned, foreign domiciled subsidiaries. Our efforts to expand internationally pose risks that could adversely affect our business. These risks include, among others, the effects of:
|
•
|
fluctuations in foreign currency exchange rates and controls;
|
|
•
|
competitive disadvantages to established foreign businesses with significant current market share and business and customer relationships;
|
|
•
|
nationalization;
|
|
•
|
tax and regulatory policies of local governments and the possibility of trade embargoes;
|
|
•
|
political instability, war or other hostilities; and
|
|
•
|
laws and policies of the U.S. and foreign governments affecting foreign trade and investment.
|
Any of these risks could cause significant interruptions in our operations, which would adversely affect our ability to commercialize the ELAD System internationally and our financial condition, results of operations and business.
Revenues, profits and cash flows derived in foreign countries by foreign subsidiaries may be denominated in foreign currency. The value of this currency may be controlled or adjusted periodically by foreign governments, and may be subject to changes in the political and economic conditions.
Foreign economic, political and social conditions and government policies could materially and adversely affect our business.
A significant portion of our operations may be conducted in foreign countries and it is anticipated that a significant percentage of our revenues may be derived from these countries. Accordingly, our results of operations, financial condition and prospects would be subject, to a significant degree, to economic, political, legal and social developments around the world. The economies of many of these countries differ from the economy of the U.S. in many respects, including:
|
•
|
level of government involvement;
|
|
•
|
economic structure;
|
|
•
|
allocation of resources;
|
|
•
|
level of development;
|
|
•
|
inflation rates;
|
|
•
|
growth rate; and
|
|
•
|
control of foreign exchange.
|
47
The legal systems in many foreign countries have inherent uncertainties that could limit the legal protections available to us.
We are subject to the laws and regulations of foreign governments, including those applicable to foreign investment and, in particular, laws applicable to wholly foreign-owned enterprises. Any litigation in these countries may be protracted and may result in substantial costs and diversion of resources and management attention. For example, in 2007, one of our clinical sites in China was sued in connection with the death of a subject of our clinical trial. An expert panel concluded that neither the ELAD System nor the clinical site was at fault and dismissed the lawsuit. Nevertheless, we were later informed that the subject’s family had been awarded approximately $100,000 in a subsequent civil proceeding brought against the clinical site. We ultimately decided to reimburse the clinical site for $100,000, which was partially insured. In addition, these countries may enact new laws or amend current laws that may be detrimental to us, which may have a material adverse effect on our business operations.
We have limited business insurance coverage internationally.
The insurance industry in many parts of the world is still in an early stage of development. Insurance companies in many countries offer only limited business insurance options. As a result, we may not be able to maintain any liability, hazard or other insurance covering our services, business, operations, errors, acts or omissions, personnel or properties in all countries where we ultimately commercialize the ELAD System. To the extent that we are unable to recover from others for any uninsured losses, such losses could result in a loss of capital and significant harm to our business. If any action, suit, or proceeding is brought against us and we are unable to pay a judgment rendered against us or defend ourselves against such action, suit, or proceeding, our business, financial condition and operations could be negatively affected.
We must comply with the U.S. Foreign Corrupt Practices Act and similar foreign anti-corruption laws.
The U.S. Foreign Corrupt Practices Act, to which we are subject, prohibits corporations and individuals from engaging in certain activities to obtain or retain business or to influence a person working in an official capacity. It is illegal to pay, offer to pay or authorize the payment of anything of value to any foreign government official, government staff member, political party or political candidate in an attempt to obtain or retain business or to otherwise influence a person working in an official capacity. Other countries, such as the U.K. and China, have similar laws with which we must comply. Although we attempt to rigidly adhere to the requirements of the U.S. Foreign Corrupt Practices Act and all similar laws to which we are subject, there remains the risk that an employee or agent of ours could be accused of violating one or more of these laws, particularly in geographies where significant overlap exists between local government and healthcare industries. Such an accusation, even if unwarranted, could prove disruptive to our developmental and commercialization efforts.
We could be subject to additional income and other tax liabilities.
We are subject to income and other taxes in the U.S. and may be subject to income and other taxes in various other foreign jurisdictions. Significant planning is required in evaluating a worldwide provision for income and other taxes. During the ordinary course of business, there may be transactions for which the ultimate tax determination is uncertain. We may be subject to audit in various jurisdictions and such jurisdictions may assess additional income or other tax against us. Although we believe our tax positions are reasonable, the final determination of tax audits and any related litigation could be materially different from our historical income tax provisions and accruals. The results of an audit or litigation could have a material and adverse effect on our operating results or cash flows in the period or periods for which that determination is made.
The United Kingdom’s impending departure from the European Union could adversely affect our business.
The United Kingdom held a referendum in June 2016 in which a majority of voters voted to exit the European Union, or Brexit. Negotiations are expected to commence to determine the future terms of the United Kingdom’s relationship with the European Union, including, among other things, the terms of trade between the United Kingdom and the European Union as well as other world trading partners. The effects of Brexit will depend on any agreements the United Kingdom makes to retain access to European Union markets either during a transitional period or more permanently. Brexit could adversely affect European and worldwide economic and market conditions and could contribute to instability in global financial and foreign exchange markets, including volatility in the value of the sterling and euro. In addition, Brexit could lead to legal uncertainty and potentially divergent national laws and regulations as the United Kingdom determines which European Union laws to replace or replicate, including laws that could impact our clinical trials and our ability to obtain approval of our products or sell our products in the United Kingdom. Any of these effects of Brexit, and others we cannot anticipate, could adversely affect our business, results of operations, financial condition and cash flows.
48
Risks Related to Intellectual Property
Our patent rights may prove to be an inadequate barrier to competition.
We hold a patent in the U.S. which claims a method of using C3A cells to treat a patient’s blood, which we believe covers the ELAD System therapy. In addition, we hold another U.S. patent with claims covering an extracorporeal device configuration, which we believe includes our ELAD System, independent of the cell-type used. Foreign counterparts of these patents have been issued in Australia, Canada, Indonesia, Israel, Japan, Mexico, New Zealand, Singapore, South Africa, South Korea, the Philippines and Taiwan and remain under review in certain jurisdictions, including but not limited to Europe, Brazil, China, Hong Kong, India and the Philippines. In addition to these two U.S. patents, we hold three additional patents in the U.S. However, the lifespan of any one patent is limited and each of these patents will ultimately expire, and we cannot be sure that pending applications will be granted, or that we will discover new inventions which we can successfully patent. Moreover, any of our granted patents may be held invalid by a court of competent jurisdiction, and any of these patents may also be construed narrowly by a court of competent jurisdiction in such a way that it is held to not directly cover the entire ELAD System or treatment. Furthermore, even if our patents are held to be valid and of broadly enforceable scope, third parties may find legitimate ways to compete with the ELAD System by inventing around our patents to avoid claims of patent infringement. Finally, the process of obtaining new patents is lengthy and expensive, as is the process for enforcing patent rights against an alleged infringer. Any such litigation could take years, cost large sums of money and pose a significant distraction to management. Indeed, certain jurisdictions outside of the U.S. and Europe where we hope to commercialize the ELAD System have a history of inconsistent, relatively lax or ineffective enforcement of patent rights. In such jurisdictions, even a valid patent may have limited value. Our failure to effectively enforce our patents would likely have a harmful impact on our ability to commercialize the ELAD System in these jurisdictions.
We do not hold any patents covering our VTL C3A cells or the production processes we use to grow the VTL C3A cells in the ELAD cartridges.
C3A cells are publicly available and the proprietary methods and production process that we use to grow our VTL C3A cells in the ELAD cartridges are our trade secrets, but they are not currently covered by a patent and no patents are pending. Although we have sought patent protection for certain aspects of our technology, such as our method of using human liver-derived C3A cells to treat a patient’s blood, and we have obtained orphan designation in the U.S. and Europe for the use of C3A cells to treat acute liver failure, we have not sought patent protection for the proprietary methods we use to grow VTL C3A cells in our facility. Although we believe that some of these methods may be patentable, we prefer to avoid the disclosure requirements inherent in the patenting process, as such disclosure could provide competitors with insights that allow them to invent around any granted patents. We believe that this concern is particularly appropriate since C3A cells are now publicly available, and have been available for research purposes for more than twenty years. Despite this availability, we are not aware of any third parties who have either demonstrated an ability to grow C3A cells in the quantities we do, or succeeded in treating a human subject with such cells. In addition, patent protection expires 20 years after the application’s priority date which does not apply to trade secret protection. In light of the foregoing, we do not currently contemplate seeking patent protection for our production methods and instead intend to keep our production methods protected as trade secrets, which does not require us to publicly disclose these methods and which is not subject to a formal expiration date. However, trade secrets are vulnerable to inadvertent disclosure and misappropriation. In addition, independent discovery and publication of these methods by third parties, which is feasible given the public availability of C3A cells, would also destroy their trade secret protection. If any of these were to occur, our business may be harmed.
49
We protect much of our intellectual property as trade secrets. Confidentiality agreements with employees and third parties may not prevent unauthorized disclosure of trade secrets and other proprietary information.
Trade secrets offer a relatively limited form of protection as they do not create any barrier for third-parties who independently develop this information and who may even patent the information. In the course of our research and development activities and our business activities, we often rely on confidentiality agreements to protect our proprietary information. Such confidentiality agreements may be used, for example, when we talk to vendors of laboratory or clinical development services or potential strategic partners. In addition, each of our employees is required to sign a confidentiality agreement upon joining us. We take steps to protect our proprietary information, and our confidentiality agreements are carefully drafted to protect our proprietary interests. Nevertheless, there can be no assurance that an employee or an outside party will not make an unauthorized disclosure of our proprietary confidential information. This might happen intentionally or inadvertently. It is possible that a competitor will make use of such information, and that our competitive position will be compromised, in spite of any legal action we might take against persons making such unauthorized disclosures. Enforcing a claim that a third party illegally obtained and is using any of our trade secrets is expensive and time consuming, and the outcome is unpredictable. In addition, courts outside the U.S. sometimes are less willing than U.S. courts to protect trade secrets. Moreover, our competitors may independently develop equivalent knowledge, methods and know-how, which would harm our business.
If our ELAD cartridges or our VTL C3A cells are stolen, misappropriated or reverse engineered, others could produce competing products.
Third parties, including those involved in shipping our ELAD System cartridges or in any manufacturing abroad that we may undertake, often have custody or control of our ELAD cartridges. If our ELAD cartridges, or VTL C3A cells from our proprietary VTL C3A cell bank that are stored to grow in these cartridges, were stolen, misappropriated or reverse engineered, they could be used by other parties who may be able to reproduce these cartridges for their own commercial gain. If this were to occur, it would be difficult for us to challenge this type of use, especially in countries with limited intellectual property protection or in countries in which we do not have patents covering the misappropriated ELAD cartridges. In such instance, our business would be harmed.
Ownership of our intellectual property may be claimed by others.
The ELAD System has been under development for over 20 years and certain of our predecessor companies have filed for reorganization and bankruptcy. We were founded in 2003 by acquisition of the assets of a prior company after a bankruptcy. While we believe we have performed extensive diligence on the ownership of the intellectual property rights and have developed our own innovative technology which is independent of prior intellectual property rights, there could be claims by parties associated with the prior entities that could lead to costly and time consuming legal actions. In addition, we have engaged in collaborations with third parties where intellectual property has been developed. In one instance, we were engaged in a dispute over the ownership of intellectual property when a collaborator of ours pursued patent rights over technology which we believe we may have held rights to under the collaboration agreement. Although a patent which claims a different configuration than our ELAD System was ultimately issued in the U.S. to our former collaborator, we do not hold any rights to this patent. We are unaware of any active development with respect to the claimed system. Other such disputes could arise in the future or emerge from past activities which could lead others to claim our intellectual property.
We may be involved in future costly intellectual property litigation, which could impact our future business and financial performance.
Our industry has been characterized by frequent intellectual property litigation. Our competitors or other patent holders may assert that our ELAD System and the methods we employ are covered by their patents. For instance, we are aware of other patents issued in the liver support field which we believe do not cover our ELAD System or its use. If our ELAD System or methods are found to infringe any valid patents, we could be prevented from marketing our ELAD System. In addition, we do not know whether our competitors or potential competitors have applied for, or will apply for or obtain, patents that will prevent, limit or interfere with our ability to make, use, sell, import or export our ELAD System.
Litigation related to infringement and other intellectual property claims, with or without merit, is unpredictable, can be expensive and time-consuming and could divert management’s attention from our core business. If we lose this kind of litigation, a court could require us to pay substantial damages, and prohibit us from using technologies essential to our ELAD System, any of which would have a material adverse effect on our business, results of operations and financial condition. We do not know whether necessary licenses would be available to us on satisfactory terms, or whether we could redesign our ELAD System or processes to avoid infringement.
50
Competing products may also appear in other countries in which our patent coverage might not exist or be as strong. If we lose a foreign patent lawsuit, we could be prevented from marketing our ELAD System in one or more countries.
In addition, we may hereafter become involved in litigation to protect our trademark rights associated with our company name or the names used with our ELAD System. Names used with our ELAD System and procedures may be claimed to infringe names held by others or to be ineligible for proprietary protection. If we have to change the name of our company or our ELAD System, we may experience a loss in goodwill associated with our brand name, customer confusion and a loss of sales.
We may be subject to damages resulting from claims that we or our employees have wrongfully used or disclosed alleged trade secrets owned by third parties.
Many of our employees were previously employed at universities or other life science companies, including our competitors or potential competitors. Although no claims against us are currently pending, we may be subject to claims that these employees or we have inadvertently or otherwise used or disclosed trade secrets or other confidential or proprietary information of their former employers. Litigation may be necessary to defend against these claims. If we fail in defending such claims, in addition to paying monetary damages, we may lose valuable intellectual property rights or personnel. A loss of key personnel could hamper our ability to develop and commercialize the ELAD System, which could severely harm our business. Even if we are successful in defending against these claims, litigation could result in substantial costs and be a distraction to management.
Risks Related to Our Capital Requirements and Finances
To conserve capital, we may undertake workforce and cost reduction activities in the future.
In September 2015, we instituted across the board expense reductions to conserve capital. We may, in the future, need to undertake additional workforce reductions or restructuring activities. We also need to effectively manage our operations and facilities. Following any workforce reduction, it is possible that our infrastructure may be inadequate to support our future efforts and business strategy or to maintain operational, financial and management controls and reporting systems and procedures. If we cannot successfully manage our operations, we may be unsuccessful in executing our business strategy.
Enrollment in our VTL-308 clinical trial could take longer than we expect resulting in the need for additional funds.
While we expect the VTL-308 clinical trial to enroll subjects at a rate similar to VTI-208, it is possible that the changes in enrollment criteria will result in slow enrollment and that we will need to raise more capital than anticipated to complete the trial or that we will exhaust our funds and the company will fail.
Our future capital needs are uncertain, and we will need to raise additional funds in the future.
We will need to raise substantial additional capital to:
|
•
|
complete clinical trials and related regulatory applications;
|
|
•
|
fund our operations;
|
|
•
|
commence and expand the commercialization of our products; and
|
|
•
|
further our research and development.
|
51
Our future funding requirements will depend on many factors, including:
|
•
|
market acceptance of our products;
|
|
•
|
the cost of our research and development activities;
|
|
•
|
the cost and timing of our clinical development activities, in particular the rate of initiation of our clinical sites and the rate of enrollment of our clinical trials;
|
|
•
|
the cost of filing and prosecuting patent applications;
|
|
•
|
the cost of defending litigation or any claims that we infringe third-party patents or violate other intellectual property rights;
|
|
•
|
the cost and timing of regulatory clearances or approvals, if any;
|
|
•
|
the cost and timing of establishing sales, marketing and distribution capabilities;
|
|
•
|
the cost and timing of establishing additional technical support capabilities;
|
|
•
|
the effect of competing technological and market developments; and
|
|
•
|
the extent to which we acquire or invest in businesses, products and technologies, although we currently have no commitments or agreements relating to any of these types of transactions.
|
We may not be able to obtain additional funds on acceptable terms, or at all. If we raise additional funds by issuing equity securities, our stockholders will experience dilution. Debt financing, if available, may involve covenants restricting our operations or our ability to incur additional debt. Any debt or additional equity financing that we raise may contain terms that are not favorable to us or our stockholders. If we raise additional funds through collaboration and licensing arrangements with third parties, which we have no prior experience in, it may be necessary to relinquish some rights to our technologies or our products, or grant licenses on terms that are not favorable to us. If we are unable to raise adequate funds, we may have to liquidate some or all of our assets, or delay, reduce the scope of or eliminate some or all of our development programs.
If we do not have, or are not able to obtain, sufficient funds, we may have to delay development or commercialization of our products or license to third parties the rights to commercialize products or technologies that we would otherwise seek to commercialize. We also may have to reduce marketing, customer support or other resources devoted to our products or cease operations. Any of these factors could harm our operating results.
Any acquisitions that we make could disrupt our business and harm our financial condition.
We expect to evaluate potential strategic acquisitions of complementary businesses, products or technologies. We may also consider joint ventures, licensing and other collaborative projects. We may not be able to identify appropriate acquisition candidates or strategic partners, or successfully negotiate, finance or integrate acquisitions of any businesses, products or technologies. Furthermore, the integration of any acquisition and management of any collaborative project may divert our management’s time and resources from our core business and disrupt our operations. We do not have any experience with acquiring companies or products. Any cash acquisition we pursue would diminish the funds otherwise available to us for other uses, and any stock acquisition would dilute our stockholders’ ownership. While we from time to time evaluate potential collaborative projects and acquisitions of businesses, products and technologies, and anticipate continuing to make these evaluations, we have no present understandings, commitments or agreements with respect to any significant acquisitions or collaborative projects.
52
Raising additional funds through debt or equity financing is likely to be challenging, could be highly dilutive and may cause the market price of our common stock to decline.
To the extent that we raise additional capital through the sale of equity or convertible debt securities, the issuance of those securities could result in substantial dilution for our current stockholders and the terms may include liquidation or other preferences that adversely affect the rights of our current stockholders. Furthermore, the issuance of additional securities, whether equity or debt, by us, or the possibility of such issuance, may cause the market price of our common stock to decline further and existing stockholders may not agree with our financing plans or the terms of such financings. The failure of the VTI-208 clinical trial to meet its primary or secondary endpoints, in addition to general market conditions, may make it very difficult for us to seek and obtain financing from the capital markets on favorable terms, or at all. If we cannot raise additional capital, we may be required to delay, reduce or eliminate certain aspects of our operations, and could cause us and our independent registered public accounting firm to indicate that there may be substantial doubt about our ability to continue as a going concern.
In order to raise required funds we may choose to enter into one or more collaborations. Such collaborations could require us to give up substantial rights to the ELAD System in the U.S. and/or outside the U.S.
We may choose to enter into one or more collaborations in order to continue the development of the ELAD System. These collaborations could require us to relinquish substantial rights, potentially including the grant of an exclusive license to make, use and sell the ELAD System, to another company.
Risks Related to Being a Public Company
The requirements of being a public company may strain our resources, divert management’s attention and affect our ability to attract and retain executive management and qualified board members.
As a public company, we are subject to the reporting requirements of the Exchange Act, the Sarbanes-Oxley Act, the Dodd-Frank Act, the listing requirements of the NASDAQ Stock Market LLC and other applicable securities rules and regulations. Compliance with these rules and regulations increases our legal and financial compliance costs, makes some activities more difficult, time-consuming or costly and increases demand on our systems and resources, and even more so after we are no longer an “emerging growth company,” as defined in the Jumpstart Our Business Startups Act, or the JOBS Act. The Exchange Act requires, among other things, that we file annual, quarterly and current reports with respect to our business and operating results. The Sarbanes-Oxley Act requires, among other things, that we maintain effective disclosure controls and procedures and internal control over financial reporting. In order to maintain and, if required, improve our disclosure controls and procedures and internal control over financial reporting to meet this standard, significant resources and management oversight are required. As a result, management’s attention may be diverted from other business concerns, which could adversely affect our business and operating results. To assist us in complying with these requirements, we may need to hire more employees in the future or engage outside consultants, which will increase our costs and expenses.
In addition, changing laws, regulations and standards relating to corporate governance and public disclosure are creating uncertainty for public companies, increasing legal and financial compliance costs and making some activities more time consuming. These laws, regulations and standards are subject to varying interpretations, in many cases due to their lack of specificity, and, as a result, their application in practice may evolve over time as new guidance is provided by regulatory and governing bodies. This could result in continuing uncertainty regarding compliance matters and higher costs necessitated by ongoing revisions to disclosure and governance practices. We intend to invest resources to comply with evolving laws, regulations and standards, and this investment may result in increased general and administrative expenses and a diversion of management’s time and attention from development activities to compliance activities. If our efforts to comply with new laws, regulations and standards differ from the activities intended by regulatory or governing bodies due to ambiguities related to their application and practice, regulatory authorities may initiate legal proceedings against us and our business may be adversely affected.
For as long as we remain an “emerging growth company,” we may take advantage of certain exemptions from various reporting requirements that are applicable to public companies that are not “emerging growth companies” including, but not limited to, not being required to comply with the auditor attestation requirements of Section 404 of the Sarbanes-Oxley Act, reduced disclosure obligations regarding executive compensation and financial statements in our periodic reports and proxy statements, and exemptions from the requirements of holding a nonbinding advisory vote to approve executive compensation and shareholder approval of any golden parachute payments not previously approved. We will take advantage of these reporting exemptions until we are no longer an “emerging growth company.”
53
We may remain an “emerging growth company” until as late as December 31, 2019 (the fiscal year-end following the fifth anniversary of the completion of our initial public offering), though we may cease to be an “emerging growth company” earlier under certain circumstances, including (i) if the market value of our common stock that is held by non-affiliates exceeds $700 million as of any June 30, in which case we would cease to be an “emerging growth company” as of the following December 31, or (ii) if our gross revenue exceeds $1 billion in any fiscal year.
As a public company it is more expensive for us to maintain and obtain director and officer liability insurance, and we may be required to accept reduced coverage or incur substantially higher costs to obtain coverage. These factors may also make it more difficult for us to attract and retain qualified members of our board of directors, particularly to serve on our audit committee and compensation committee, and qualified executive officers.
Under Section 107(b) of the JOBS Act, "emerging growth companies" can delay adopting new or revised accounting standards until such time as those standards apply to private companies. We have irrevocably elected not to avail our company of this exemption from new or revised accounting standards and, therefore, we are subject to the same new or revised accounting standards as other public companies that are not "emerging growth companies."
As a public company, we are obligated to develop and maintain proper and effective internal control over financial reporting. If we do not maintain a proper and effective system of internal control over financial reporting, or if these internal controls are determined not to be designed or operating effectively, it may adversely affect investor confidence in our company and, as a result, the value of our common stock.
We are required, pursuant to Section 404 of the Sarbanes-Oxley Act, to furnish a report by management on, among other things, the effectiveness of our internal control over financial reporting for the 2016 fiscal year. This assessment will need to include disclosure of any material weaknesses identified by our management in our internal control over financial reporting.
We have and will continue to evaluate and test our system of internal control over financial reporting. If, during the evaluation and testing process, we identify one or more material weaknesses in our internal control over financial reporting, we will be unable to assert that our internal controls are effective, which could result in a loss of investor confidence in the accuracy and completeness of our financial reports. This could cause the price of our common stock to decline, and we may be subject to investigation or sanctions by the SEC.
We are required to disclose changes made in our internal control and procedures on a quarterly basis. However, our independent registered public accounting firm will not be required to report on the effectiveness of our internal control over financial reporting pursuant to Section 404 until we are no longer an “emerging growth company” pursuant to the exemptions contained in the JOBS Act. At such time, our independent registered public accounting firm may issue a report that is adverse in the event it is not satisfied that our internal controls over financial reporting are designed and operating effectively to prevent or detect a material misstatement to the financial statements.
If we do not remediate any material weaknesses in our internal control over financial reporting, the accuracy and timeliness of our financial reporting may be adversely affected.
In prior years, we had not maintained an effective control environment to ensure that the design and execution of our controls consistently resulted in effective review of our financial statements and supervision by appropriate individuals. As a result of these factors, certain misstatements in our annual financial statements for periods prior to becoming a public company were identified and brought to the attention of management by our independent registered public accounting firm for correction. We and our independent registered public accounting firm concluded that these control deficiencies constituted a material weakness in our internal control over financial reporting. A material weakness is a control deficiency, or a combination of control deficiencies, in internal control over financial reporting, indicates that there is a reasonable possibility that a material misstatement of our annual or interim financial statements will not be prevented or detected on a timely basis.
54
Efforts to remediate the control deficiencies that led to the material weakness discussed above have been completed. However, the measures we have taken to date, or any measures we may take in the future, may not be sufficient to avoid potential future material weaknesses. In addition, an independent registered public accounting firm has not performed an evaluation of our internal control over financial reporting in accordance with the provisions of the Sarbanes-Oxley Act because no such evaluation has been required. Had our independent registered public accounting firm performed an evaluation of our internal control over financial reporting in accordance with the provisions of the Sarbanes-Oxley Act, additional significant deficiencies or material weaknesses may have been identified. If we are unable to successfully remediate any significant deficiency or material weakness in our internal control over financial reporting, or identify any additional significant deficiencies or material weaknesses that may exist, the accuracy and timing of our financial reporting may be adversely affected, we may be unable to maintain compliance with securities law requirements regarding timely filing of periodic reports in addition to applicable stock exchange listing requirements, investors may lose confidence in our financial reporting, and our stock price may decline as a result.
Risks Related to our Common Stock
If securities or industry analysts do not continue to publish research or publish unfavorable research about our business, our stock price and trading volume could decline.
The trading market for our common stock will rely in part on the research and reports that equity research analysts publish about us and our business. Although certain equity research analysts currently cover us, we do not have any control of the analysts or the content and opinions included in their reports or whether any such analysts will continue to, or whether new analysts will, cover us for any given period of time. The price of our stock could decline if one or more equity research analysts downgrade our stock or issue other unfavorable commentary or research. If one or more equity research analysts ceases coverage of our company or fails to publish reports on us regularly, demand for our stock could decrease, which in turn could cause our stock price or trading volume to decline.
The market price of our common stock has been, and may continue to be volatile and fluctuate significantly, which could result in substantial losses for investors.
The market price of our common stock has been and is likely to continue to be highly volatile. Since our initial public offering in April 2014 at a price of $12.00 per share, the sale price of stock as reported on The NASDAQ Global Market has ranged from $2.81 to $35.20, through
February 28, 2017
. Our announcement that the VTI-208 clinical trial failed to meet its primary or secondary endpoints resulted in a significant decline in the market price of our common stock. In addition, as with any public company, some investors hold a short position in our common stock. Such investors have published and distributed information about our company including on current and past clinical trials. Activities by these investors may increase the volatility of the market price of our common stock, and may affect our ability to raise additional funds and to complete our clinical trials and operations.
Our stock price could be subject to wide fluctuations due to many factors, including:
|
•
|
clinical data and government approvals relating to the ELAD System;
|
|
•
|
changes in governmental regulations or in the status of our regulatory approvals or applications;
|
|
•
|
disputes or other developments with respect to our intellectual property rights or the intellectual property rights of others;
|
|
•
|
product liability claims or other litigation;
|
|
•
|
sales of large blocks of our common stock, including sales by our executive officers and directors;
|
|
•
|
changes in earnings estimates or recommendations by securities analysts;
|
|
•
|
our ability to meet investors' expectations regarding our future operating performance;
|
|
•
|
media exposure of the ELAD System or products of our competitors;
|
|
•
|
volume and timing of sales of the ELAD System;
|
|
•
|
the introduction of new products or product enhancements by us or our competitors;
|
|
•
|
our ability to develop, obtain regulatory clearance or approval for and market new and enhanced products on a timely basis;
|
|
•
|
quarterly variations in our or our competitors’ results of operations;
|
55
|
•
|
developments in our industry; and
|
|
•
|
general market conditions and other factors, including factors unrelated to our operating performance or the operating performance of our competitors.
|
In addition, an active and liquid market may not develop or persist and you may not be able to sell your shares quickly or at the recently reported price. These and other factors may make the price of our stock volatile and subject to unexpected fluctuations.
Sale of a substantial number of shares of our common stock by existing stockholders or by us may cause the price of our common stock to decline.
Sales of a substantial number of shares of our common stock into the public market or the perception that these sales might occur could depress the market price of our common stock and could impair our ability to raise adequate capital through the sale of additional equity securities. We are unable to predict the effect that sales may have on the prevailing market price of our common stock.
In May 2015, we filed a shelf registration statement that permits: (i) the offering, issuance and sale by us of up to a maximum aggregate offering price of $200.0 million of common stock, preferred stock, warrants, debt securities, and/or units in one or more offerings and in any combination; (ii) sales of up to 2.5 million shares of common stock by certain selling stockholders; and (iii) the offering, issuance and sale by us of up to a maximum aggregate offering price of $75.0 million of our common stock that may be issued and sold under an “at-the-market” sales agreement with Cantor Fitzgerald & Co., or the ATM. In October 2015, we completed a follow-on public offering raising gross proceeds of $34.5 million from the sale of 6,272,727 shares of our common stock. Through
February 28, 2017
, we raised gross proceeds of $12.2 million pursuant to the ATM leaving $153.3 million available under the shelf registration statement of which $62.8 million may be offered, issued and sold under the ATM as of
February 28, 2017
.
In addition, we have filed registration statements on Form S-8 registering a total of 5,384,695 shares of common stock subject to options or reserved for future issuance under our 2012 Stock Option Plan and 2014 Equity Incentive Plan. Shares registered under these registration statements are available for sale in the public market subject to vesting arrangements, the exercise of such options and, in the case of our affiliates, the restrictions of Rule 144. As of
December 31, 2016
, options to purchase
2,968,006
shares of our common stock were exercisable.
Certain of our existing stockholders are also entitled, under contracts providing for registration rights, to require us to register shares of our common stock owned by them for public sale in the U.S. Any additional sales of securities by these stockholders, or the expectation that such sales may occur, could have a material adverse effect on the trading price of our common stock and make it more difficult for investors to sell shares of our common stock.
To the extent we raise additional capital by selling and issuing common stock, convertible securities or other equity securities, it may result in material dilution to our existing stockholders and new investors could gain rights superior to our existing stockholders. Sales by us or by our current stockholders also could cause the price of our common stock to fall and make it more difficult for you to sell shares of our common stock.
Our directors, officers and their affiliates have significant voting power and may take actions that may not be in the best interests of our other stockholders.
Our officers, directors and their affiliates collectively control approximately 24.6% of our outstanding common stock, and in particular, one stockholder and his affiliates control approximately 22.2% of our outstanding common stock as of
December 31, 2016
. As a result, these stockholders, if they act together, will be able to exert substantial influence over the management and affairs of our company and most matters requiring stockholder approval, including the election of directors. This concentration of ownership may have the effect of delaying or preventing a change in control and might adversely affect the market price of our common stock. This concentration of ownership may not be in the best interests of our other stockholders.
56
We have broad discretion in the use of proceeds from our public offerings for working capital and general corporate purposes and may not use them effectively.
The net proceeds of our public offerings are being allocated to fund the continuing clinical development of the ELAD System and the remainder for working capital and other general corporate purposes. Our management has broad discretion over the use and investment of the net proceeds of our public offerings within those categories, and accordingly, investors will need to rely upon the judgment of our management with respect to the use of proceeds.
Anti-takeover provisions in our amended and restated certificate of incorporation, amended and restated bylaws, and Fourth Amended and Restated Investors’ Rights Agreement, as well as Delaware law, could discourage a takeover.
Our amended and restated certificate of incorporation, bylaws, Fourth Amended and Restated Investors’ Rights Agreement, and Delaware law, contain provisions that might enable our management to resist a takeover, and might make it more difficult for an investor to acquire a substantial block of our common stock. These provisions:
|
•
|
authorize our board of directors to issue, without further action by our stockholders, up to 20,000,000 shares of undesignated preferred stock;
|
|
•
|
require that any action to be taken by our stockholders be effected at a duly called annual or special meeting and not by written consent;
|
|
•
|
specify that special meetings of our stockholders can be called only by a supermajority (75%) vote of our directors then in office;
|
|
•
|
specify that our board of directors may amend or repeal our bylaws only pursuant to a supermajority (75%) vote of our directors then in office;
|
|
•
|
specify that our stockholders may amend or repeal our bylaws only pursuant to a supermajority (75% and majority of the minority, if applicable) vote of the outstanding shares of our capital stock;
|
|
•
|
require in general the approval of a supermajority (75% and majority of the minority, if applicable) vote of our outstanding shares of capital stock to amend or repeal certain provisions of our certificate of incorporation;
|
|
•
|
require the approval of a supermajority (75% and majority of the minority, if applicable) vote of our outstanding shares of capital stock to approve the sale or liquidation of the company;
|
|
•
|
establish an advance notice procedure for stockholder approvals to be brought before an annual meeting of our stockholders, including proposed nominations of persons for election to our board of directors;
|
|
•
|
provide that directors may be removed only for cause by a supermajority (75%) vote of our outstanding shares of capital stock;
|
|
•
|
provide that vacancies on our board of directors may be filled only by a majority of directors then in office, even though less than a quorum;
|
|
•
|
provide that in general the number of directors on our board may only be fixed from time to time by a supermajority (75%) vote of our directors then in office;
|
|
•
|
establish that our board of directors is divided into three classes, Class I, Class II and Class III, with each class serving staggered terms; and
|
|
•
|
provide that certain stockholders affiliated with Muneer A. Satter, referred to as the Satter Investors, have rights to nominate up to a specific percentage of our directors (currently 30%) based on the Satter Investors’ ownership percentage in our Company.
|
These provisions might discourage, delay or prevent a change in control of our company or a change in our management. The existence of these provisions could adversely affect the voting power of holders of common stock and limit the price that investors might be willing to pay in the future for shares of our common stock.
57
Our certificate of incorporation also contains a provision that provides us with protections similar to Section 203 of the Delaware General Corporation Law and will prevent us from engaging in a business combination with a person who acquires at least 15% of our common stock for a period of three years from the date such person acquired such common stock, except for certain of our current stockholders, including Mr. Satter and entities affiliated with him, and, in certain instances, persons who purchase common stock from certain of our current stockholders, and unless board or stockholder approval is obtained prior to the acquisitions. These anti-takeover provisions and other provisions under Delaware law could discourage, delay or prevent a transaction involving a change in control of our company, even if doing so would benefit our stockholders. These provisions could also discourage proxy contests and make it more difficult for you and other stockholders to elect or remove directors of your choosing and to cause us to take other corporate actions you desire.
We have not paid dividends in the past and do not expect to pay dividends in the future, and any return on investment may be limited to the value of our stock.
We have never paid cash dividends on our common stock and do not anticipate paying cash dividends on our common stock in the foreseeable future. The payment of dividends on our common stock will depend on our earnings, financial condition and other business and economic factors affecting us at such time as our board of directors may consider relevant. If we do not pay dividends, our stock may be less valuable because a positive return on your investment will only occur if our stock price appreciates.
Not applicable.
We lease 43,000 square feet in San Diego in three different facilities under leases with expiration dates ranging from June 2017 through January 2019. We lease our corporate headquarters in a 19,000 square foot facility, we lease a 18,000 square foot facility for our manufacturing operations and we lease 6,000 square feet of space used for research and development. We believe that these facilities are adequate to meet our existing needs and that additional or substitute facilities will be available on commercially reasonable terms, if required. However, we would incur additional expenses in connection with any such new facilities.
We are not currently a party to any litigation, nor are we aware of any pending or threatened litigation against us that we believe would materially affect our business, operating results, financial condition or cash flows. Our industry is characterized by frequent claims and litigation including securities litigation, claims regarding patent and other intellectual property rights and claims for product liability. As a result, in the future, we may be involved in various legal proceedings from time to
time.
Not applicable.
58
Market Information
Our common stock is listed on The NASDAQ Global Market under the symbol “VTL". The following table sets forth the high and low sales prices per share of our common stock as reported on The NASDAQ Global Market for the periods indicated.
|
|
Price Range
|
||||||
|
|
High
|
Low
|
|||||
|
Year Ended December 31, 2015
|
|||||||
|
First Quarter
|
$
|
28.93
|
|
$
|
18.81
|
|
|
|
Second Quarter
|
$
|
29.67
|
|
$
|
19.01
|
|
|
|
Third Quarter
|
$
|
28.00
|
|
$
|
2.81
|
|
|
|
Fourth Quarter
|
$
|
11.80
|
|
$
|
3.76
|
|
|
|
Year Ended December 31, 2016
|
|||||||
|
First Quarter
|
$
|
11.34
|
|
$
|
6.80
|
|
|
|
Second Quarter
|
$
|
9.71
|
|
$
|
5.82
|
|
|
|
Third Quarter
|
$
|
7.36
|
|
$
|
5.49
|
|
|
|
Fourth Quarter
|
$
|
6.58
|
|
$
|
3.85
|
|
|
Holders
As of
February 28, 2017
, there were approximately 71 holders of record of our common stock, which excludes stockholders whose shares were held in nominee or street name by brokers. The actual number of common stockholders is greater than the number of record holders, and includes stockholders who are beneficial owners, but whose shares are held in street name by brokers and other nominees. This number of holders of record also does not include stockholders whose shares may be held in trust by other entities.
Dividend Policy
We have never declared or paid cash dividends on our common stock. We currently intend to retain all available funds and any future earnings for use in the operation of our business and do not anticipate paying any dividends on our common stock in the foreseeable future. Any future determination to declare dividends will be made at the discretion of our board of directors and will depend on our financial condition, operating results, capital requirements, general business conditions and other factors that our board of directors may deem relevant.
Securities Authorized for Issuance under Equity Compensation Plans
Information about our equity compensation plans is incorporated herein by reference to Item 12 of Part III of this Annual Report.
59
Performance Graph
The following graph shows a comparison from April 17, 2014 (the date our common stock commenced trading on The NASDAQ Global Market) through
December 31, 2016
of the cumulative total return for our common stock, the NASDAQ Composite Index and the NASDAQ Biotechnology Index. The graph assumes an initial investment of $100 on April 17, 2014. The comparisons in the graph are not intended to forecast or be indicative of possible future performance of our common stock.
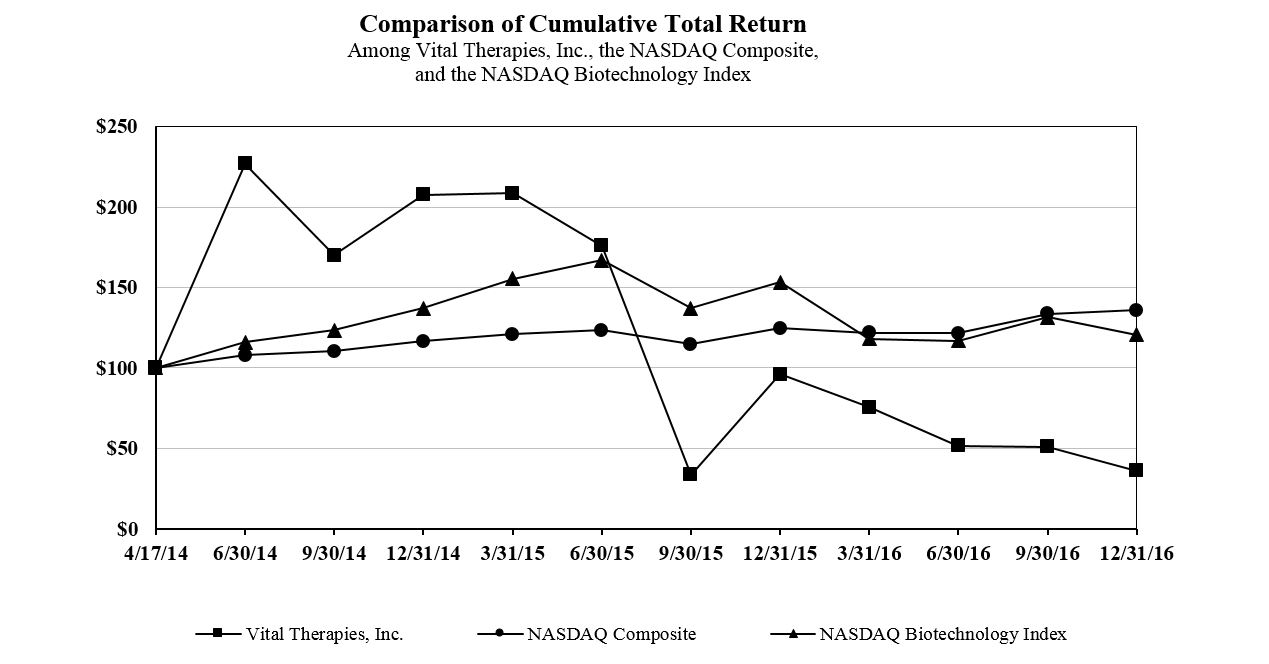
Unregistered Sales of Equity Securities
Information required by this Item regarding sales of equity securities without registration under the Securities Act of 1933, or the Securities Act, as amended, has been previously included in reports filed by us. During the quarter ended September 30, 2016, we entered into a securities purchase agreement, or the Securities Purchase Agreement, with a newly-appointed board member, or the Buyer, pursuant to which we agreed to issue and sell an aggregate of $700,000 of our common stock in a private placement of shares that have not been registered under the Securities Act by reason of a specific exemption from the registration provisions of the Securities Act. We sold 118,243 shares of common stock under the Securities Purchase Agreement at a price of $5.92 per share. The securities were issued in a private placement transaction in reliance on Section 4(2) of the Securities Act. The Buyer represented that the securities were being acquired for investment purposes, for his own account, not as nominee or agent, and not with a view to the resale or distribution of any part thereof in violation of the Securities Act, and that the Buyer was an accredited investor as defined in Regulation D promulgated under the Securities Act.
Issuer Purchases of Equity Securities
None.
60
The following table summarizes our selected consolidated financial data for the periods and as of the dates indicated. We have derived the consolidated statement of operations data for the years ended December 31,
2016
,
2015
and
2014
and the consolidated balance sheet data as of December 31,
2016
and
2015
from our audited financial statements included elsewhere in this Annual Report on Form 10-K. The selected statement of operations data for the years ended December 31,
2013
and
2012
and the balance sheet data as of December 31,
2014
,
2013
and
2012
are derived from our audited financial statements not included in this Annual Report on Form 10-K. This data should be read in conjunction with the section entitled “Management’s Discussion and Analysis of Financial Condition and Results of Operations” and with our audited consolidated financial statements and their related notes, which are included elsewhere in this Annual Report.
|
|
Year Ended December 31,
|
||||||||||||||||||
|
|
2016
|
2015
|
2014
|
2013
|
2012
|
||||||||||||||
|
Consolidated Statement of Operations Data:
|
(in thousands, except share and per share amounts)
|
||||||||||||||||||
|
Operating expenses:
|
|||||||||||||||||||
|
Research and development
|
$
|
30,046
|
|
$
|
39,773
|
|
$
|
39,479
|
|
$
|
21,787
|
|
$
|
5,097
|
|
||||
|
General and administrative
|
11,220
|
|
12,347
|
|
10,863
|
|
9,615
|
|
4,483
|
|
|||||||||
|
Total operating expenses
|
41,266
|
|
52,120
|
|
50,342
|
|
31,402
|
|
9,580
|
|
|||||||||
|
Loss from operations
|
(41,266
|
)
|
(52,120
|
)
|
(50,342
|
)
|
(31,402
|
)
|
(9,580
|
)
|
|||||||||
|
Revaluation of future purchase rights liabilities
|
—
|
|
—
|
|
2,600
|
|
(1,306
|
)
|
3,101
|
|
|||||||||
|
Other income (expense), net
|
297
|
|
97
|
|
75
|
|
(10
|
)
|
(222
|
)
|
|||||||||
|
Net loss
|
(40,969
|
)
|
(52,023
|
)
|
(47,667
|
)
|
(32,718
|
)
|
(6,701
|
)
|
|||||||||
|
Amortization of deemed dividend
|
—
|
|
—
|
|
(4,744
|
)
|
(64
|
)
|
—
|
|
|||||||||
|
Accretion to redemption value of redeemable convertible preferred stock
|
—
|
|
—
|
|
(4,410
|
)
|
(6,303
|
)
|
(942
|
)
|
|||||||||
|
Net loss attributable to common stockholders
|
$
|
(40,969
|
)
|
$
|
(52,023
|
)
|
$
|
(56,821
|
)
|
$
|
(39,085
|
)
|
$
|
(7,643
|
)
|
||||
|
Net loss per share attributable to common stockholders, basic and diluted
|
$
|
(1.31
|
)
|
$
|
(2.07
|
)
|
$
|
(3.54
|
)
|
$
|
(74.86
|
)
|
$
|
(17.89
|
)
|
||||
|
Weighted –average common shares outstanding, basic and diluted
(1)
|
31,387,579
|
|
25,152,948
|
|
16,054,452
|
|
522,102
|
|
427,117
|
|
|||||||||
__________
|
(1)
|
Please refer to Note 2, "
Summary of Significant Accounting Policies
," in the notes to the consolidated financial statements, for an explanation of the method used to calculate basic and diluted net loss per share attributable to common stockholders and the number of shares used in the computation of the per share amounts.
|
|
|
As of December 31,
|
||||||||||||||||||
|
2016
|
2015
|
2014
|
2013
|
2012
|
|||||||||||||||
|
Consolidated Balance Sheet Data:
|
(in thousands)
|
||||||||||||||||||
|
Cash, cash equivalents and short-term investments
|
$
|
59,991
|
|
$
|
83,416
|
|
$
|
102,238
|
|
$
|
38,186
|
|
$
|
18,473
|
|
||||
|
Working capital
|
55,983
|
|
78,433
|
|
94,538
|
|
36,409
|
|
17,403
|
|
|||||||||
|
Total assets
|
64,026
|
|
89,081
|
|
108,082
|
|
46,585
|
|
20,332
|
|
|||||||||
|
Preferred stock
|
—
|
|
—
|
|
—
|
|
83,475
|
|
26,176
|
|
|||||||||
|
Additional paid-in-capital
|
302,185
|
|
285,098
|
|
248,305
|
|
58,413
|
|
62,728
|
|
|||||||||
|
Accumulated deficit
|
(243,825
|
)
|
(202,856
|
)
|
(150,833
|
)
|
(103,166
|
)
|
(70,448
|
)
|
|||||||||
|
Total stockholders’ equity (deficit)
|
58,446
|
|
82,325
|
|
97,563
|
|
(44,657
|
)
|
(7,632
|
)
|
|||||||||
61
The following discussion and analysis of our financial condition and results of operations should be read in conjunction with our consolidated financial statements and related notes included elsewhere in this Annual Report. This discussion contains forward-looking statements that involve risks and uncertainties. Our actual results could differ materially from those discussed below. Factors that could cause or contribute to such differences include, but are not limited to, those identified below and those discussed in “Risk Factors” included elsewhere in this Annual Report. As used in this report, unless the context suggests otherwise,
"
we,
" "
us,
"
our
"
or
"
the Company
"
refer to Vital Therapies, Inc. and its subsidiaries.
Overview
We are a biotherapeutic company focused on developing a human hepatic cell-based treatment targeting acute forms of liver failure. Our product candidate, the ELAD
System, or ELAD, is an extracorporeal human allogeneic cellular liver therapy designed to allow the patient’s own liver to potentially regenerate to a healthy state or to stabilize the patient until transplant. The ELAD System is the only liver support system containing immortal human liver-derived cells, or VTL C3A cells, to enter phase 3 clinical trials. We designed the ELAD System to supplement key aspects of normal liver function to improve patient survival. We estimate that at least 40,000 patients annually in the United States, or U.S., experience the acute forms of liver failure that may be addressed by the ELAD System, such as severe acute alcoholic hepatitis, or sAAH, surgery-induced liver failure, or SILF, and fulminant hepatic failure, or FHF, for a portion of which the ELAD System may be a life-saving therapy. Except for liver transplant, which is severely limited by the availability of organs and not available to many patients, the current standard of care for these acute forms of liver failure is primarily focused on the management of complications, which does not restore lost liver function and is associated with a high rate of mortality. The ELAD System has received orphan designation in the U.S. and Europe for the treatment of patients with acute liver failure. This designation provides tax credits for qualified clinical testing, seven years of market exclusivity in the U.S. and ten years of market exclusivity in Europe for the first orphan drug approved for a given indication. However, orphan designation does not alter the standard regulatory requirements or the process for obtaining marketing approval.
The ELAD System is currently being tested in a phase 3 randomized, open-label, multicenter, controlled, pivotal study, designed to evaluate ELAD in subjects with sAAH, referred to as VTL-308. VTL-308 is based on pre-specified and post-hoc analyses of our VTI-208 phase 3 clinical trial in alcohol-induced liver decompensation, or AILD, of which sAAH is a subset. VTI-208 was completed in 2015. Although VTI-208 failed to reach either its primary or secondary endpoints, our pre-specified and post-hoc analyses identified criteria for a group of subjects in which favorable survival trends were observed. The inclusion and exclusion criteria for the VTL-308 trial are based on these findings. We expect to enroll at least 150 subjects in VTL-308 at over 50 sites in the U.S. and Europe. As of February 28, 2017, we have enrolled 53 subjects in VTL-308 and had 39 clinical sites open for enrollment. We expect to report top-line data for VTL-308 around mid-2018. While the VTL-308 phase 3 clinical trial has been designed to show statistical significance based on a subset of pre-specified and post-hoc analyses of the VTI-208 trial, there can be no assurance that the data from the trial or that a single trial will be sufficient to support a marketing application in any country.
In early 2015, we completed enrollment of subjects in VTI-208, a phase 3 clinical trial in subjects with AILD, the majority of whom were diagnosed with sAAH. During 2014, we also initiated enrollment in VTI-210, a second phase 3 clinical trial for subjects with sAAH, and a phase 2 clinical trial, VTI-212, for subjects with FHF or SILF. The VTI-210 trial was suggested by the European regulatory authority and was intended to include subjects who had failed conventional therapy and were therefore a sicker population than the VTI-208 subjects.
The VTI-208 study enrolled 203 AILD subjects in the intention-to-treat, or ITT, population mostly in 2013 and 2014, with 96 and 107 subjects randomized to ELAD treatment and control (standard of care only) groups, respectively. In August 2015, we learned that the Kaplan-Meier analysis of the overall survival in the ITT population was not statistically different between groups. However, in a pre-specified subset of 120 subjects with Model for End-stage Liver Disease, or MELD, scores <28 that consisted of 51 and 69 subjects in the ELAD-treated and control groups, respectively, the Kaplan-Meier analysis of overall survival did approach statistical significance. In another pre-specified exploratory analysis of 101 subjects with less than the median age of 46.9 years, the Kaplan-Meier analysis of overall survival also favored the ELAD-treated subjects. Analyses of 83 subjects with MELD scores >28 and of 102 subjects greater than the median age both favored the control subjects. A subject’s MELD score is a tool for characterizing the severity of liver disease and for providing a prognosis for survival.
Considering the results of the VTI-208 clinical trial and in an effort to focus our personnel and financial resources, we discontinued the VTI-210 and VTI-212 clinical trials, postponed most activities associated with the preparation for filing a biologics license application, or BLA, and reduced our workforce in late 2015.
62
We have incurred net losses since inception of
$243.8 million
through
December 31, 2016
. We anticipate that we will continue to incur losses for at least the next several years. Due to the uncertainties involved with biological product development and the clinical trial process, we cannot predict the timing or accuracy of future expenses, when product approval for the ELAD System might occur, if ever, or when profitability may be achieved or sustained.
Financial Operations Overview
Research and Development Expenses
Research and development expenses relate to the development of the ELAD System and are expensed as incurred. Our research and development expenses consist primarily of:
|
•
|
expenses incurred under agreements with clinical sites, clinical research organizations, or CROs, and statistical, regulatory and other consultants that assist us with our clinical trials;
|
|
•
|
employee-related expenses, which include salaries, benefits, travel and stock-based compensation;
|
|
•
|
the cost of acquiring and manufacturing clinical trial materials;
|
|
•
|
facilities, depreciation, and other allocated expenses, which include direct and allocated expenses for rent, information systems, maintenance of facilities and equipment, and depreciation of fixed assets; and
|
|
•
|
other costs associated with research, the preparation for a potential BLA filing and other regulatory activities.
|
We do not track our employee and facility-related research and development costs by clinical trial, as we have used our employee and infrastructure resources across multiple clinical trials, and we believe the allocation of such costs would be arbitrary and would not provide a meaningful assessment.
The costs of clinical trials may vary significantly over the life of a project owing to, but not limited to, the following:
|
•
|
per subject trial costs;
|
|
•
|
the number of sites included in the trials;
|
|
•
|
the countries in which the trials are conducted;
|
|
•
|
the number of subjects that participate in the trials;
|
|
•
|
continuing quality assurance activities and standards consistent with the U.S. Food and Drug Administration, or FDA, and other regulatory requirements;
|
|
•
|
potential additional safety monitoring or other studies requested by regulatory agencies;
|
|
•
|
the number of events that occur in our event driven VTL-308 clinical trial; and
|
|
•
|
the frequency and duration of subject follow-up visits.
|
A change in any of these variables could result in a significant change in the costs and timing associated with the development of the ELAD System. For example, if the FDA or other regulatory authorities were to require us to conduct clinical trials beyond what we currently anticipate will be required for the completion of clinical development of the ELAD System or if we experience significant delays in enrollment, we could be required to expend significant additional financial resources and time on the completion of the clinical development of the ELAD System. We also expect to incur an increase in operating costs related to certain tasks associated with the preparation of a BLA prior to the release of the results for the VTL-308 clinical trial. If we have a successful outcome from the VTL-308 clinical trial, we would expect to incur a significant increase in our operating costs related to the preparation of a BLA and the possible commercialization of the ELAD System.
General and Administrative Expenses
General and administrative expenses consist primarily of salaries and related costs for personnel in executive, finance, information technology, marketing and legal functions. Other general and administrative expenses include but are not limited to related facility costs, stock-based compensation, professional fees for legal, consulting, accounting and tax services and insurance costs.
63
Other Income
Interest Income
Our cash and cash equivalents are or have been invested primarily in money market funds, which generate a small amount of interest income, but in our opinion, provide liquidity and protection from loss of principal. We expect to continue to make similar investments with any additional financing proceeds while the funds await use in operations.
Revaluation of Future Purchase Rights Liabilities
Future rights to purchase shares of our senior preferred stock granted in connection with our senior preferred stock financing were accounted for as liabilities, and their value was re-measured at the end of each financial reporting period. The value of these future purchase rights liabilities fluctuated in conjunction with increases or decreases in the fair value of our common stock and the number of preferred and common shares and future purchase rights outstanding relative to our enterprise value at each reporting date. We recognized a gain or loss based on fluctuations in the fair value of these future purchase rights liabilities. In conjunction with our initial public offering, or IPO, in April 2014, the remaining purchase rights liabilities at that date were terminated and the balance of the future purchase rights liabilities was recognized as income.
Critical Accounting Policies and Estimates
The preparation of financial statements in conformity with generally accepted accounting principles in the U.S., or GAAP, requires management to make estimates and assumptions that affect the reported amounts of assets and liabilities and disclosure of contingent assets and liabilities at the date of the financial statements and the reported amounts of expenses during the reporting period. On an on-going basis, management makes its best estimate of the ultimate outcome for these items based on historical trends and other information available when the financial statements are prepared. Changes in estimates are typically recognized in the period when new information regarding estimates becomes available to management. Actual results could differ from those estimates.
Our significant accounting policies are described in more detail in Note 2, "Summary of Significant Accounting Policies," in the notes to the consolidated financial statements. However, we believe that the following accounting policies are the most critical for fully understanding and evaluating our financial condition and results of operations.
Clinical Trial Accruals
As part of the process of preparing our financial statements, we are required to estimate our accrued expenses. Our clinical trial accrual process seeks to account for expenses resulting from our obligations under agreements with clinical sites, CROs, vendors, and consultants in connection with conducting our clinical trials. We account for these expenses according to the progress of each trial as measured by subject enrollment, the timing of various aspects of the trial and if available, information from our service providers. During the course of a clinical trial, we adjust our rate of clinical expense recognition if actual results differ from our estimates. Although we do not expect our estimates to be materially different from amounts actually incurred, our understanding of the status and timing of services performed relative to the actual status and timing of services performed may vary and could result in us reporting amounts that are over or understated for a particular period and adjustments to our research and development expenses may be necessary in future periods.
Stock-Based Compensation
We measure and recognize compensation expense for all stock-based payments made to employees and directors based on estimated fair value at the date of grant, net of an estimated forfeiture rate, and to consultants based on estimated fair value. Currently, our stock-based awards consist only of stock options; however, future grants under our equity compensation plan may also consist of shares of restricted stock, restricted stock units, stock appreciation rights, performance awards and performance units. We estimate the fair value of stock options granted using the Black-Scholes-Merton, or BSM, option pricing model, which requires the use of estimates.
We recognize stock-based compensation cost for employees and directors on a straight-line basis over the requisite service period of the award. For performance-based stock options, we record share-based compensation expense only when the performance-based milestone is deemed probable of achievement. We utilize both quantitative and qualitative criteria to judge whether milestones are probable of achievement.
64
Through 2016, we have recognized stock-based compensation expense only for those awards that were ultimately expected to vest. We estimated forfeitures based on an analysis of our historical employee turnover. We revised our forfeiture estimate, if necessary, when actual forfeitures differed from those estimates. Changes in forfeiture estimates, which have not been material to date, impacted compensation cost in the period in which the change in estimate occured. Begining in 2017, we are changing our method to record forfeitures as they occur. See note 2 to the consolidated financial statements.
The fair value of options granted to consultants is estimated using the BSM option pricing model and is re-measured at each reporting date with changes in fair value recognized as expense in the consolidated statements of operations.
Income Taxes
We account for income taxes under the asset and liability method, which requires the recognition of deferred tax assets and liabilities for the expected future tax consequences of events that have been included in the consolidated financial statements. Under this method, deferred tax assets and liabilities are determined on the basis of the differences between the financial statements and tax basis of assets and liabilities using enacted tax rates in effect for the year in which the differences are expected to reverse. The effect of a change in tax rates on deferred tax assets and liabilities is recognized in income in the period that includes the enactment date.
We recognize net deferred tax assets to the extent we believe these assets are more likely than not to be realized. In making such a determination, management considers all available positive and negative evidence, including future reversals of existing taxable temporary differences, projected future taxable income, tax-planning strategies, and results of recent operations. If management determines that we would be able to realize our deferred tax assets in the future in excess of their net recorded amount, management would make an adjustment to the deferred tax asset valuation allowance, which would reduce the provision for income taxes. As of
December 31, 2016
and
2015
, we maintained a full valuation allowance against our entire balance of deferred tax assets.
We record uncertain tax positions in accordance with Accounting Standards Codification, or ASC, 740 on the basis of a two-step process whereby (1) management determines whether it is more likely than not that the tax positions will be sustained on the basis of the technical merits of the position and (2) for those tax positions that meet the more-likely-than-not recognition threshold, management recognizes the largest amount of tax benefit that is more than 50 percent likely to be realized upon ultimate settlement with the related tax authority. We recognize interest and penalties related to unrecognized tax benefits, if any, within income tax expense, and any accrued interest and penalties are included within the related tax liability line.
Results of Operations
Comparison of Fiscal Years Ended
December 31, 2016
and
2015
The following table summarizes our operating expenses for the years ended
December 31, 2016
and
2015
(dollars in thousands):
|
|
Year Ended
December 31,
|
Change
|
||||||||||||
|
|
2016
|
2015
|
$
|
%
|
||||||||||
|
Operating expenses:
|
||||||||||||||
|
Research and development
|
$
|
30,046
|
|
$
|
39,773
|
|
$
|
(9,727
|
)
|
(24
|
)%
|
|||
|
General and administrative
|
11,220
|
|
12,347
|
|
(1,127
|
)
|
(9
|
)%
|
||||||
|
Total operating expenses
|
$
|
41,266
|
|
$
|
52,120
|
|
$
|
(10,854
|
)
|
(21
|
)%
|
|||
Research and development expense decreased by
$9.7 million
during the year ended
December 31, 2016
as compared to the year ended
December 31, 2015
. The reduction in research and development expenses resulted from an $8.3 million decrease in clinical trial and related consulting, manufacturing and outside service costs. We opened 38 sites during the year ended
December 31, 2016
and enrolled 35 subjects in the VTL-308 clinical trial. Higher costs in the year ended
December 31, 2015
reflected costs associated with locking the database for and analysis of the VTI-208 clinical trial, and costs associated with the opening of 42 sites and the enrollment of 38 subjects in the VTI-208, VTI-210 and VTI-212 clinical trials. In addition, research and development-related salaries and related compensation costs decreased by $1.3 million in the year ended
December 31, 2016
, primarily as a result of the reduction in staff and the recording of related severance costs in the third quarter of 2015.
65
The
$1.1 million
decrease in general and administrative expense during the year ended
December 31, 2016
as compared to the year ended
December 31, 2015
was primarily the result of $503,000, $348,000 and $177,000 of lower salaries, for consulting and outside services and for travel costs, respectively, in part reflecting reductions in costs in conjunction with the reduction in staff completed in the fourth quarter of 2015. The decrease was also driven by a $250,000 reduction in audit and accounting fees and costs associated with being a public company and a $170,000 reduction in insurance costs. These decreases were partially offset by increased stock-based compensation of $640,000, primarily due to performance-based stock options that were granted in the fourth quarter of 2015. In addition, legal expenses increased by $223,000 in 2016, principally reflecting costs associated with securities litigation that was dismissed in 2016.
We expect our research and development costs to increase significantly in 2017 relative to 2016 primarily due to the anticipated higher subject enrollment in the VTL-308 clinical trial during 2017 and due to increased activity related to a possible BLA filing. We expect general and administrative costs to increase slightly in 2017 as compared to 2016.
Comparison of Fiscal Years Ended December 31, 2015 and 2014
The following table summarizes our operating expenses for the years ended December 31, 2015 and 2014 (dollars in thousands):
|
|
Year Ended
December 31,
|
Change
|
||||||||||||
|
|
2015
|
2014
|
$
|
%
|
||||||||||
|
Operating expenses:
|
||||||||||||||
|
Research and development
|
$
|
39,773
|
|
$
|
39,479
|
|
$
|
294
|
|
1
|
%
|
|||
|
General and administrative
|
12,347
|
|
10,863
|
|
1,484
|
|
14
|
%
|
||||||
|
Total operating expenses
|
$
|
52,120
|
|
$
|
50,342
|
|
$
|
1,778
|
|
4
|
%
|
|||
Research and development expense increased by $0.3 million during the year ended December 31, 2015 as compared to the year ended December 31, 2014. The higher research and development expenses were primarily attributable to increases of $3.1 million in third-party consulting and other service fees, $1.8 million in salaries, stock-based compensation and other compensation-related costs and $1.3 million in facilities costs and additional overhead allocations and costs, substantially offset by a reduction of $5.9 million in clinical trial and related costs.
The increased third-party consulting and service fees are principally attributable to fees for clinical trial monitoring, for data management services, for analytical services in preparation for the evaluation of our VTI-208 clinical results and for activities to support a potential BLA filing. Higher salary and other compensation-related costs are principally due to increases in average headcount (i) in research to support mechanism of action and BLA activities, (ii) in manufacturing to support BLA activities, and (iii) for clinical trials as we moved certain third-party CRO activities in house and to support data management. These compensation related costs also included $486,000 for severance primarily related to a reduction in workforce following the termination of our VTI-210 and VTI-212 clinical trials and most of our BLA activities, and an increase of $381,000 for non-cash stock-based compensation costs, including costs for the extension of the post-termination option exercise period in conjunction with the workforce reduction.
The decrease in clinical trial and related costs reflects the completion of enrollment in the VTI-208 clinical trial in January 2015, the termination of the VTI-210 and VTI-212 clinical trials in September 2015 and the transfer of certain CRO activities to company personnel in the year ended December 31, 2015 as compared to the year ended December 31, 2014. This decrease in clinical costs was also due to the change in our estimated clinical accrual, reducing our clinical costs by $750,000 in the year ended December 31, 2015. Costs of manufacturing materials and supplies also decreased by $448,000 due to the completion of enrollment in the VTI-208 clinical trial and the termination of the VTI-210 and VTI-212 clinical trials.
The $1.5 million increase in general and administrative expense during the year ended December 31, 2015 as compared to the year ended December 31, 2014 was primarily attributable to a $1.8 million increase in salaries and wages and other compensation-related expenses principally due to higher stock-based compensation costs and increased average headcount to support our operations. These compensation-related costs included an increase of $1.1 million for non-cash stock-based compensation costs, including costs for the extension of the post-termination option exercise period and an increase of $115,000 for severance costs related to the reduction in workforce for the year ended December 31, 2015. In addition, our insurance and consulting costs increased by $213,000 and $136,000, respectively, in the year ended December 31, 2015 as compared to the year ended December 31, 2014, primarily reflecting higher costs associated with being a public company following our IPO in April 2014. These increases were partially offset by a $595,000 decrease in costs primarily due to a higher allocation of overhead to research and development.
66
Liquidity and Capital Resources
Overview
We have a history of incurring losses and negative cash flows from operations and have an accumulated deficit of
$243.8 million
through
December 31, 2016
. We believe we will need additional capital to fund our operations, which we may seek to obtain through a combination of equity or debt financings, or government or other third-party financing, marketing and distribution arrangements and other collaborations, strategic alliances and licensing arrangements. In this regard, we currently have an effective shelf registration statement on Form S-3 on file with the SEC. The shelf registration statement permits: (i) the offering, issuance and sale by us of up to a maximum aggregate offering price of $200.0 million of common stock, preferred stock, warrants, debt securities, and/or units in one or more offerings and in any combination; (ii) sales of up to 2.5 million shares of common stock by certain selling stockholders; and (iii) the offering, issuance and sale by us of up to a maximum aggregate offering price of $75.0 million of our common stock under an “at-the-market” sales agreement, or ATM, with Cantor Fitzgerald & Co.
In October 2015, we completed a follow-on public offering raising gross proceeds of $34.5 million from the sale of 6,272,727 shares of our common stock, which left $165.5 million available under the shelf registration statement, $75.0 million of which could be offered, issued and sold under the at-the-market sales agreement. Through
February 28, 2017
, we raised gross proceeds of $12.2 million pursuant to the ATM, leaving $153.3 million available under the shelf registration statement, of which $62.8 million may be offered, issued and sold at a future date under the ATM. As of February 28, 2017, we have sold a total of 1.5 million shares of our common stock at a weighted average price of $7.90 per share under the ATM. Through February 28, 2017, the net proceeds to us from the ATM were $11.7 million, after deducting underwriter commissions and offering expenses.
As of
December 31, 2016
, we had cash and cash equivalents of approximately
$60.0 million
. Cash in excess of immediate requirements is invested in accordance with our investment policy, primarily with an intent to maximize liquidity and preserve capital. As of
December 31, 2016
, such funds were held in cash and money market funds.
Cash Flows
The following table shows a summary of our cash flows for each of the years ended
December 31, 2016
,
2015
, and
2014
(in thousands):
|
2016
|
2015
|
2014
|
|||||||||
|
Cash (used in) provided by:
|
|||||||||||
|
Operating activities
|
$
|
(35,774
|
)
|
$
|
(49,952
|
)
|
$
|
(40,825
|
)
|
||
|
Investing activities
|
(21
|
)
|
(1,281
|
)
|
(2,040
|
)
|
|||||
|
Financing activities
|
12,374
|
|
32,421
|
|
106,918
|
|
|||||
Net cash used in operating activities
During the year ended December 31, 2016, operating activities used
$35.8 million
of cash. The use of cash primarily related to our net loss of
$41.0 million
adjusted for non-cash charges of
$4.7 million
related to stock-based compensation and
$1.8 million
related to depreciation and amortization, partially offset by a
$1.4 million
change in our operating assets and liabilities. Changes in our operating assets and liabilities during the year ended December 31, 2016 consisted primarily of a decrease of
$1.0 million
in accrued expenses and accounts payable and an increase of
$232,000
in other current assets and prepaid expenses. The decrease in accrued expenses and accounts payable was primarily attributable to the reduction in amounts due to clinical sites for our VTI-208, VTI-210 and VTI-212 clinical trials, partially offset by increases in amounts due for our VTL-308 clinical trial.
During the year ended December 31, 2015, operating activities used $50.0 million of cash. The use of cash primarily related to our net loss of $52.0 million adjusted for non-cash charges of $4.0 million related to stock-based compensation and $1.3 million related to depreciation and amortization and also related to a $3.3 million net change in our operating assets and liabilities. Changes in our operating assets and liabilities during the year ended December 31, 2015 consisted primarily of a decrease of $3.6 million in accrued expenses, an increase of $281,000 in accounts payable and a decrease of $143,000 in other assets and prepaid expenses. The decrease in accrued expenses was primarily attributable to a decrease of $3.4 million in the clinical trial accrual due to the completion of the VTI-208 clinical trial.
67
During the year ended December 31, 2014, operating activities used $40.8 million of cash. The use of cash was primarily related to our net loss of $47.7 million adjusted for non-cash income of $2.6 million related to the re-measurement of future purchase rights liabilities, non-cash charges of $2.5 million and $1.1 million for stock-based compensation and depreciation, respectively, and $5.9 million of net changes in our operating assets and liabilities. Net cash provided by changes in our operating assets and liabilities during the year ended December 31, 2014 consisted primarily of an increase of $5.4 million in accounts payable and accrued liabilities, reflecting an increase in clinical activities, related research and development expenditures and the timing of payments made by us to vendors since the beginning of the year. The decrease of $279,000 in other current assets and prepaid expenses was attributable to a reduction in prepaid clinical costs of $737,000 related to the utilization of prepayments to our CROs, offset by an increase of $329,000 in prepaid expenses primarily attributable to payments on corporate insurance policies.
Net cash used in investing activities
During the year ended December 31, 2016, net investing activities used
$21,000
of cash, including capital expenditures of
$556,000
principally for purchases of equipment for manufacturing and clinical operations, partially offset by
$533,000
from a decrease in restricted cash requirements relating to our clinical trials and lease commitments.
During the year ended December 31, 2015, investing activities used $1.3 million of cash, including $2.3 million for facilities improvements and purchases of equipment for manufacturing, research and development, partially offset by $1.1 million from a decrease in restricted cash requirements relating to our completed and terminated clinical trials.
During the year ended December 31, 2014, investing activities used $2.0 million of cash, primarily related to $1.4 million in purchases of capital equipment for manufacturing and clinical operations and a net increase of $631,000 in restricted cash requirements. The net increase in our restricted cash is primarily related to an increase in our clinical trial obligations of $917,000, which was offset by $288,000 related to the elimination of certain restrictions associated with an agreement we entered into with certain investors in February 2012 related to the sale of junior preferred stock.
Net cash provided by financing activities
During the year ended December 31, 2016, financing activities provided
$12.4 million
of cash, which included net proceeds of
$12.4 million
after underwriters' commissions and offering costs from the ATM offerings and the private placement completed in the year ended December 31, 2016.
During the year ended December 31, 2015, financing activities provided $32.4 million of cash, which included net proceeds of $32.2 million after underwriters' discounts and commissions and offering costs, from a follow-on offering completed in October 2015. Additionally, cash provided by financing activities included $515,000 received from the exercise of stock options, partially offset by the payment of $283,000 for deferred financing costs.
During the year ended December 31, 2014, financing activities provided $106.9 million of cash, which included net proceeds after underwriters’ discounts and commissions and offering costs of $55.0 million from our IPO, $32.9 million from our follow-on offering and $18.2 million from the sale of senior redeemable convertible preferred stock. In addition to these equity offerings, we received proceeds of $852,000 related to the exercise of options during 2014.
As a result of the expense reductions made in 2015, the structure and timing of the VTL-308 clinical trial, and assuming we limit our BLA activities and do not begin building any significant commercial infrastructure, we believe that our existing cash and cash equivalents of $60.0 million as of December 31, 2016 will be sufficient to fund our operations through the first quarter of 2018. We anticipate needing to raise additional funds prior to releasing topline data for the VTL-308 clinical trial, which we currently expect around mid-2018. If we are not successful in raising additional funds, we expect to significantly reduce our expenditures and focus our existing resources on obtaining VTL-308 topline data. The timing and amount of our actual expenditures will be based on many factors, including, but not limited to, the timing of and enrollment in clinical trials, the timing of any possible filing of a BLA, decisions with respect to building commercial operations, and any unforeseen cash needs. We may raise funds pursuant to our shelf registration statement, including through the ATM, or we may seek to obtain additional funding through a combination of other equity or debt financings, government or other third-party financing, marketing and distribution arrangements or other collaborations, strategic alliances and licensing arrangements.
Our forecast of the period of time through which our financial resources will be adequate to support our operations is a forward-looking statement that involves risks and uncertainties, and actual results could vary materially. Our future capital requirements are difficult to forecast and will depend on many factors, including, but not limited to:
68
|
•
|
the scope, progress, results and costs of research and development and clinical trials related to the ELAD System or any future product candidates;
|
|
•
|
the cost and timing of a potential BLA filing;
|
|
•
|
the cost and timing of scaling up and validating the manufacturing process for the ELAD System or any other product candidates for commercialization;
|
|
•
|
the cost and timing of commercialization activities, including reimbursement, marketing, sales and distribution costs, both before and after product approval (if any);
|
|
•
|
our ability to establish new collaborations, licensing or other arrangements and the financial terms of such agreements;
|
|
•
|
the number and characteristics of any future product candidates we pursue;
|
|
•
|
the costs involved with being a public company;
|
|
•
|
the costs involved in preparing, filing, prosecuting, maintaining, defending and enforcing patents, including litigation costs and the outcome of such litigation; and
|
|
•
|
the timing, receipt and amount of sales of, or royalties, if any, on the ELAD System and any future product candidates.
|
Until such time, if ever, as we can generate substantial product revenues, we expect to finance our cash needs through a combination of stock offerings, debt financings, collaborations and licensing arrangements. We do not expect to achieve revenue from product sales prior to the use of the net proceeds from our public offerings to date. We do not have any committed external source of funds. Additional funds may not be available on acceptable terms, if at all. To the extent that we raise additional capital through the sale of equity securities, the ownership interest of our stockholders will be diluted and may be on terms that are not favorable to us or our stockholders. Debt financing, if available, may involve covenants restricting our operations or our ability to incur additional debt or other terms that are not favorable to us or our stockholders. If we raise additional funds through collaborations and licensing arrangements with third parties, which we have no prior experience in, we may have to relinquish some rights to our technologies or our products, or grant licenses on terms that are not favorable to us. If we are unable to raise adequate funds, we may have to liquidate some or all of our assets, or we may have to delay, reduce the scope of, or eliminate some or all of our development programs or clinical trials. We may also have to delay development or commercialization of our products or license to third parties the rights to commercialize products or technology that we would otherwise seek to commercialize. Any of these factors could harm our operating results.
Off-Balance Sheet Arrangements
Through
December 31, 2016
, we have not entered into and did not have any relationships with unconsolidated entities or financial collaborations, such as entities often referred to as structured finance or special purpose entities, which would have been established for the purpose of facilitating off-balance sheet arrangements or other contractually narrow or limited purpose.
Contractual Obligations
Some of our most significant clinical trial expenditures are to investigative sites and to CROs. These agreements are cancellable by either party at any time upon written notice and do not have any cancellation penalties, but do obligate us to reimburse the providers for any time or costs incurred through the date of termination and to close out clinical sites. These items are not included in the table below. We lease office and manufacturing space in San Diego, California. The following table summarizes our contractual obligations at
December 31, 2016
and the effect such obligations are expected to have on our cash flow in future periods:
|
|
Payments Due by Period
|
||||||||||||||||||
|
|
Total
|
Less Than
1 Year |
1-3
Years |
3-5
Years |
More Than
5 Years |
||||||||||||||
|
|
(In thousands)
|
||||||||||||||||||
|
Operating lease obligations
|
$
|
1,461
|
|
$
|
771
|
|
$
|
690
|
|
$
|
—
|
|
$
|
—
|
|
||||
|
Purchase obligations
|
286
|
|
286
|
|
—
|
|
—
|
|
—
|
|
|||||||||
|
Total contractual obligations
|
$
|
1,747
|
|
$
|
1,057
|
|
$
|
690
|
|
$
|
—
|
|
$
|
—
|
|
||||
69
As of
December 31, 2016
, our purchase obligations include existing purchase commitments of
$167,000
with a vendor for raw materials that will be used in manufacturing on an as needed basis. During the years ended
December 31, 2016
,
2015
and
2014
, we purchased
$943,000
,
$1.2 million
and
$1.2 million
, respectively, of materials from this vendor. Our purchase obligations also include a purchase commitment of
$119,000
with a vendor for a component used in our clinical trials that will be manufactured and delivered on an as agreed upon schedule during 2017. During the years ended
December 31, 2016
,
2015
and
2014
, we purchased
$118,000
,
$335,000
and
$574,000
, respectively, of materials from this vendor. In the course of normal business operations, we also enter into agreements with contract service providers and others. We can elect to discontinue the work under these contracts and purchase orders with notice.
Recent Accounting Pronouncements
In February 2016, the Financial Accounting Standards Board, or FASB, issued Accounting Standards Update, or ASU, No. 2016-02, "Leases," or ASU 2016-02. ASU 2016-02 will require that lease arrangements longer than 12 months result in an entity recognizing an asset and liability equal to the present value of the lease payments in the statement of financial position. ASU 2016-02 is effective for annual periods beginning after December 15, 2018, and interim periods therein. This standard requires a modified retrospective transition approach for all leases existing at, or entered into after, the date of initial application, with an option to use certain transition relief. Early adoption of ASU 2016-02 as of its issuance is permitted. We expect to adopt ASU 2016-02 in 2019. The adoption of this guidance is expected to result in a significant increase in the total assets and liabilities reported on our consolidated balance sheets.
In March 2016, the FASB issued ASU No. 2016-09, "
Compensation-Stock Compensation: Improvements to Employee Share-Based Payment Accounting,
" or ASU 2016-09. ASU 2016-09
will change how companies account for certain aspects of share-based payments to employees
.
The amendments in this update cover such areas as the recognition of excess tax benefits and deficiencies, the classification of those excess tax benefits on the statement of cash flows, an accounting policy election for forfeitures, the amount an employer can withhold to cover income taxes and still qualify for equity classification and the classification of those taxes paid on the statement of cash flows.
The guidance will be effective for annual periods beginning after December 15, 2016, and interim periods therein.
This guidance may be applied either prospectively, retrospectively or using a modified retrospective transition method, depending on the area covered in this update.
We expect to adopt ASU 2016-09 in 2017 including changing our method to account for forfeitures as they occur, which will be applied using the modified retrospective transition method. This guidance will not have a significant impact on our financial statements at the time of adoption.
In November 2016, the FASB issued ASU No. 2016-18, "
Statement of Cash Flows: Restricted Cash
," or ASU 2016-18. ASU 2016-18 provides guidance on the classification of restricted cash in the statement of cash flows. This ASU will require that our statements of cash flows explain the change during the period in the total of cash, cash equivalents and amounts generally described as restricted cash or restricted cash equivalents. The amendments in this ASU are effective for interim periods beginning after December 15, 2017, with early adoption permitted. We will adopt this standard in 2018 and do not currently expect ASU 2016-18 to have a significant impact on our consolidated financial statements at the time of adoption.
JOBS Act
In April 2012, the Jumpstart Our Business Startups Act, or the JOBS Act, was enacted. Section 107 of the JOBS Act provides that an emerging growth company can take advantage of the extended transition period provided in Section 7(a)(2)(B) of the Securities Act for complying with new or revised accounting standards. Thus, an emerging growth company can delay the adoption of certain accounting standards until those standards would otherwise apply to private companies. We have irrevocably elected not to avail ourselves of this extended transition period and, as a result, we will adopt new or revised accounting standards on the relevant dates on which adoption of such standards is required for other companies.
Interest Rate Sensitivity
We had cash and cash equivalents of
$60.0 million
at
December 31, 2016
, which was held for working capital purposes. We do not enter into investments for trading or speculative purposes. We do not believe that we have any material exposure to changes in the fair value of these investments as a result of changes in interest rates due to their short-term nature. Declines in interest rates, however, will reduce future investment income.
70
Foreign Currency Exchange Risk
We have been and are continuing to enter into international agreements, primarily for clinical studies. Accordingly, we have an increasing exposure to foreign currency exchange rates. To date, we have not entered into, and do not have any current plans to enter into, any foreign currency hedging transactions or derivative financial transactions. We expect our transactions outside of the U.S. in the near-term will primarily entail payments for clinical trials, and for vendors and consultants supporting those trials within Europe, which may increase our exposure to foreign currency risk in future periods. We do not expect to maintain any significant amount of assets outside of the U.S.
The functional currencies of our foreign subsidiaries are the local currencies. Accordingly, the effects of exchange rate fluctuations on the net assets of these operations are accounted for as translation gains or losses in accumulated other comprehensive income within stockholders’ equity. Our foreign subsidiaries are currently inactive and, accordingly, a change of 10% in such foreign currency exchange rates would not have a material impact on their financial position or results of operations.
Effects of Inflation
We do not believe that inflation and changing prices had a significant impact on our results of operations for any periods presented herein.
The consolidated financial statements required pursuant to this item are included in Part IV, Item 15 of this Annual Report, and are presented beginning on page F-1.
None.
71
Evaluation of Disclosure Controls and Procedures
Management, with the participation of its Chief Executive Officer and Chief Financial Officer, evaluated the effectiveness of our disclosure controls and procedures as of
December 31, 2016
. The term “disclosure controls and procedures,” as defined in Rule 13a-15(e) of the Securities Exchange Act of 1934, or the Exchange Act, means controls and other procedures of a company that are designed to provide reasonable assurance that information required to be disclosed by a company in the reports that it files or submits under the Exchange Act is recorded, processed, summarized and reported within the time periods specified in the Securities and Exchange Commission’s rules and forms. Disclosure controls and procedures include, without limitation, controls and procedures designed to provide reasonable assurance that information required to be disclosed is accumulated and communicated to our management, including our Chief Executive Officer and Chief Financial Officer, as appropriate, to allow timely decisions regarding required disclosure. Management recognizes that any controls and procedures, no matter how well designed and operated, can provide only reasonable assurance of achieving their desired control objectives, and management necessarily is required to apply its judgment in evaluating the cost-benefit relationship of possible controls and procedures. Based on the evaluation of our disclosure controls and procedures as of
December 31, 2016
, our Chief Executive Officer and Chief Financial Officer have concluded that, as of
December 31, 2016
, our disclosure controls and procedures were effective at the reasonable assurance level.
Management's Report on Internal Control Over Financial Reporting
Management is responsible for establishing and maintaining adequate internal control over financial reporting as such term is defined in Rule 13a-15(f) under the Exchange Act. Internal control over financial reporting is a process designed under the supervision and with the participation of our management, including our Chief Executive Officer and Chief Financial Officer, to provide reasonable assurance regarding the reliability of financial reporting and the preparation of financial statements for external purposes in accordance with generally accepted accounting principles. Our internal control over financial reporting includes those policies and procedures that (i) pertain to the maintenance of records that, in reasonable detail, accurately and fairly reflect the transactions and dispositions of our assets; (ii) provide reasonable assurance (a) transactions are recorded as necessary to permit preparation of financial statements in accordance with generally accepted accounting principles, (b) our receipts and expenditures are being made only in accordance with authorizations of our management and directors; and (c) regarding the prevention or timely detection of the unauthorized acquisition, use or disposition of assets that could have a material effect on our financial statements.
Because of its inherent limitations, internal control over financial reporting may not prevent or detect misstatements. Also, projections of any evaluation of effectiveness to future periods are subject to the risk that controls may become inadequate because of changes in conditions, or that the degree of compliance with the policies or procedures may deteriorate.
As of
December 31, 2016
, our management conducted an evaluation of the effectiveness of our internal control over financial reporting using the criteria set forth by the Committee of Sponsoring Organizations of the Treadway Commission in Internal Control - Integrated Framework (2013). Based on this evaluation, our management concluded that, as of
December 31, 2016
, our internal control over financial reporting was effective.
This annual report does not include an attestation report of our registered public accounting firm regarding internal control over financial reporting. Management’s report was not subject to attestation by our registered public accounting firm pursuant to rules of the Securities and Exchange Commission that permit us to provide only management’s report in this annual report.
Changes in Internal Control over Financial Reporting
There was no change in our internal control over financial reporting that occurred during the quarter ended
December 31, 2016
that has materially affected, or is reasonably likely to materially affect, our internal control over financial reporting.
72
Compensatory Arrangements of Certain Officers.
On January 30, 2017, following the recommendation made by the compensation committee of our board of directors, our board of directors approved base salaries for fiscal year 2017 for our named executive officers and Chief Financial Officer as follows: Terence E. Winters, Ph.D., $504,700; Duane D. Nash, M.D., J.D., $400,000; Robert A. Ashley, M.A., $381,100; and Michael V. Swanson, M.B.A., $383,500.
73
Executive Officers and Directors
The following table sets forth the names, ages and positions of our executive officers and directors as of February 28, 2017:
|
Name
|
|
Age
|
|
Position
|
|
Executive Officers:
|
|
|
||
|
Terence E. Winters, Ph.D.
|
|
74
|
|
Co-Chairman and Chief Executive Officer
|
|
Duane Nash, M.D., J.D.
|
|
46
|
|
President
|
|
Robert A. Ashley, M.A.
|
|
59
|
|
Executive Vice President and Chief Technical Officer
|
|
Michael V. Swanson, M.B.A.
|
|
62
|
|
Executive Vice President and Chief Financial Officer
|
|
Aron P. Stern, M.B.A.
|
|
63
|
|
Chief Administrative Officer
|
|
John M. Dunn, J.D.
|
|
65
|
|
General Counsel and Secretary
|
|
Andrew Henry
|
|
52
|
|
Vice President, Clinical Operations
|
|
Andrea Loewen
|
|
49
|
|
Vice President, Regulatory Affairs and Quality Assurance
|
|
Richard Murawski
|
|
68
|
|
Vice President, Manufacturing
|
|
Non-Employee Directors:
|
|
|
||
|
Muneer A. Satter, J.D., M.B.A
(2)(3)
|
|
56
|
|
Co-Chairman and Lead Director
|
|
Jean-Jacques Bienaimé
(2)(5)
|
|
63
|
|
Director
|
|
Cheryl L. Cohen
(4)(5)
|
51
|
Director
|
||
|
Philip M. Croxford, M.B.A.
(4)(5)
|
|
56
|
|
Director
|
|
Douglas E. Godshall, M.B.A.
(1)(5)
|
|
52
|
|
Director
|
|
Errol R. Halperin, J.D., L.L.M.
(1)(3)
|
|
76
|
|
Director
|
|
Faheem Hasnain
(2)(5)
|
58
|
Director
|
||
|
J. Michael Millis, M.D.
(3)(4)
|
|
58
|
|
Director
|
|
Lowell E. Sears, M.B.A.
(1)(3)
|
|
66
|
|
Director
|
|
Randolph C. Steer, M.D., Ph.D.
(2)(4)
|
|
67
|
|
Director
|
|
(1)
|
Member of the Audit Committee.
|
|
(2)
|
Member of the Compensation Committee.
|
|
(3)
|
Member of Nominating and Governance Committee.
|
|
(4)
|
Member of Quality and Technology Committee.
|
|
(5)
|
Member of Commercialization Committee.
|
74
Executive Officers
Terence E. Winters, Ph.D.
has served as the Chairman of our board of directors from June 2003 to March 2013. Dr. Winters became Co-Chairman of our board of directors in March 2013 and currently serves as such. Dr. Winters has served as our Chief Executive Officer since June 2003. From 2001 to 2015, Dr. Winters was a Special Limited Partner of Valley Ventures, a founding investor in Vital Therapies, and also was a General Partner of Columbine Venture Funds from 1983 to 2005 and Vice President of DS Ventures, a venture capital subsidiary of Diamond Shamrock Corp., a chemical, life science and petroleum company from 1980 to 1983. Dr. Winters was previously a director of three public companies: CollaGenex Pharmaceuticals, Inc., a developer and marketer of proprietary medical therapies to the dermatology market, Orthologic Corp., a biotechnology company focused on development and commercialization of novel synthetic peptides for tissue repair and healing, and Clinuvel Pharmaceuticals, a global biopharmaceutical company committed to developing drugs for the treatment of a range of severe skin disorders. Dr. Winters has also served as a director of over 20 private companies. He earned a B.Sc. as well as a Ph.D. in chemistry from the University of Wales, U.K. He also completed a post-doctoral fellowship at the University of California, Los Angeles.
Duane Nash, M.D., J.D.
has served as our President since March 2016. Between March 2012 and March 2016, he served as our Chief Business Officer, and he served as our Executive Vice President between May 2013 and March 2016. Between March 2012 and May 2013, he also served as our Medical Director. Dr. Nash completed his internship in general surgery at the University of California at San Francisco during which he served as a member of the liver transplant team. Dr. Nash also practiced as an attorney from November 2002 to February 2008, most recently at the law firm of Davis Polk, where he focused on intellectual property litigation and corporate matters. Dr. Nash joined Vital Therapies from Wedbush PacGrow Life Sciences where he was employed from March 2009 to March 2012 serving most recently as Vice President in Equity Research. Before that he was a research analyst at Pacific Growth Equities from April 2008 through March 2009, which was subsequently acquired by Wedbush Securities, Inc. Dr. Nash has served on the board of directors of Akebia Therapeutics, Inc., a publicly-traded biotech company focused on the treatment of anemia and vascular disease, since May 2013, and on the board of directors of Aerpio Therapeutics Inc., a clinical-stage biopharmaceutical company focused on advancing innovative therapies for vascular diseases, since September 2012. Dr. Nash earned a B.A. in biology from Williams College, an M.D. from Dartmouth Medical School, a J.D. from the University of California, Berkeley, and an M.B.A. from the University of Oxford.
Robert A. Ashley, M.A.
has served as our Executive Vice President and Chief Technical Officer since September 2013. Between May 2008 and September 2013 he served as our Vice President and Chief Operating Officer. Mr. Ashley’s career in the pharmaceutical industry extends for 34 years. He was formerly Chairman, President and Chief Executive Officer of AmpliMed Corporation, a privately-held cancer drug development company, from January 2004 to March 2007, and Senior Vice President of Commercial Development at CollaGenex Pharmaceuticals, Inc., a publicly-held pharmaceutical company, from September 1994 to December 2003. Prior to that he held positions of increasing responsibility at Bristol-Myers Squibb from January 1989 to September 1994, and with Amersham International from 1979 to 1989. He earned a Master’s Degree in Biochemistry from Oxford University. Mr. Ashley is the inventor of several issued and pending patents, as well as the author of several scientific papers. He serves on the Board of Directors of Rowpar Pharmaceuticals, a privately-held manufacturer of proprietary dental pharmaceuticals.
Michael V. Swanson, M.B.A.
joined us in August 2013 as our Chief Financial Officer and has also served as our Executive Vice President since March 2016. Mr. Swanson has over 20 years of experience in senior financial positions in both public and private life sciences companies. Mr. Swanson was Chief Financial Officer of Amira Pharmaceuticals, Inc., a pharmaceutical company focused on the discovery and early development of drugs to treat inflammatory and fibrotic diseases, from May 2008 until the company was acquired in September 2011, and of Panmira Pharmaceuticals, LLC, a spin out from Amira from September to December 2011. From January 2012 to October 2015, Mr. Swanson provided financial consulting services to development stage companies. From July 2000 to April 2008, Mr. Swanson served in senior finance positions including Senior Vice President, Finance and Chief Financial Officer at Prometheus Laboratories Inc., a specialty pharmaceutical company marketing and selling pharmaceutical products and diagnostic testing services for gastrointestinal diseases and disorders. Previously, Mr. Swanson was Senior Vice President and Chief Financial Officer of Advanced Tissue Sciences, Inc., a publicly-traded biomedical company, where he served in senior financial positions for over ten years. Mr. Swanson also served as Director of Finance of the Fisher Scientific Group, Inc., a health and scientific technology company, and its parent, The Henley Group, Inc., a widely diversified holding company. Mr. Swanson began his career working approximately nine years with the public accounting firm of Deloitte Haskins & Sells, now Deloitte & Touche LLP. Mr. Swanson earned a B.S. in business administration from the California Polytechnic State University at San Luis Obispo and an M.B.A. from the University of Southern California. He is also a Certified Public Accountant (inactive).
75
Aron P. Stern
,
M.B.A.
has served as our Chief Administrative Officer since August 2013 and as our Secretary from October 2005 to February 2015. Between June 2003 and August 2013, Mr. Stern served as our Treasurer, Vice President and Chief Financial Officer. Mr. Stern has over 20 years of experience in capital formation, acquisitions, financial strategy and financial and operational management in growth-stage high technology and biotechnology companies. He previously was Chief Financial Officer at each of Protein Polymer Technologies, Inc., a developer of a protein-based technology, 4-D Neuroimaging, a medical equipment manufacturing company, and VitaGen, Inc., our predecessor company. Mr. Stern also held positions at Apple Computer and Isis Pharmaceuticals, a developer of antisense drugs. Mr. Stern earned a B.S. in economics and business administration and an M.B.A. in finance and marketing from the University of California, Berkeley.
John M. Dunn, J.D.
has served as our General Counsel since November 2014 and as our Secretary since February 2015. Mr. Dunn has over 25 years of national law firm and in-house general counsel experience. Mr. Dunn was Senior Vice President Legal and Compliance, General Counsel and Secretary of IDEC Pharmaceuticals from 2002 until its merger with Biogen in late 2003. From 2004 to 2012, Mr. Dunn served as an Executive Vice President at Biogen Idec where he was in charge of Biogen Idec’s internal corporate venture fund and Innovation Incubator. Most recently, Mr. Dunn has been providing legal and corporate development advisory services to emerging life science companies. Previously, Mr. Dunn was a partner for 16 years in the Corporate, Securities and Technology Group at the Pillsbury Winthrop law firm where his practice focused on the healthcare industry. Mr. Dunn earned a B.S. in finance and his J.D. from the University of Wyoming. He serves as an advisor to TVM Capital, a life science venture capital firm, and is a member of the Board of Directors of Agility-Clinical, a privately held consulting and contract research organization, and a member of the Board of Directors of Acer Therapeutics, Inc., a privately held specialty orphan pharmaceutical company.
Andrew Henry
has served as our Vice President of Clinical Operations since April 2013. Mr. Henry is responsible for the global implementation of our clinical program. Mr. Henry has 25 years of experience managing clinical trials in life science companies with roles at Schering-Plough Oncology, Novartis Oncology and MedImmune. Between January 2009 and February 2013, Mr. Henry served as Senior Director of Clinical Trial Management and Senior Director of Global Clinical Operational Strategy of MedImmune, a biopharmaceutical company that is under AstraZeneca’s biologics division. At MedImmune Mr. Henry oversaw operations of all clinical studies being performed by the company across all therapeutic areas. From November 1997 to August 2008, Mr. Henry held roles as Senior Clinical Research Scientist and Head Clinical Resources and Development Director at Novartis Oncology, an ethical pharmaceutical company, where he oversaw clinical studies and the Department of Clinical Research Scientists/Clinical Trial Heads. Mr. Henry earned a B.S. in biology and biopsychology from William Paterson University.
Andrea Loewen
became our Vice President of Regulatory Affairs in February 2017, having served as Vice President of Regulatory Affairs and Quality since July 2013. Ms. Loewen oversees our regulatory systems and develops regulatory strategies. Ms. Loewen has 25 years of experience in regulatory and quality management roles, including positions at Baxter Healthcare, Biogen Idec, and Shire Pharmaceuticals. From June 2009 to July 2013, she served as the Head of Regulatory Affairs for Shire Pharmaceuticals Regenerative Medicine business unit, where she was responsible for global regulatory strategy and filings for development stage and commercial combination products. Between March 2008 and June 2009, Ms. Loewen served as Senior Director of Regulatory Affairs for Ceregene, Inc., a development stage biotech company, and was responsible for global regulatory strategy and filings for combination products. Ms. Loewen earned her B.A. in biology from Gustavus Adolphus College.
Richard Murawski
has served as our Vice President of Manufacturing since July 2013. Mr. Murawski has more than 40 years of experience in manufacturing facility design, construction, start-up, validation, and supply chain management, both domestically and internationally, including 17 major plant start-ups. From February 2013 to July 2013, Mr. Murawski was self-employed as a consultant. From June 2010 to February 2013, Mr. Murawski served as the Vice President/General Manager for Dendreon Corporation, a biotech manufacturing company, with responsibility for, among others, manufacturing, engineering, materials management, and facilities. Between June 2008 and July 2010, Mr. Murawski served as Chief Executive Officer of Murawski and Associates, a biotech consulting company, where he consulted companies on managing operations and biopharmaceutical facilities. From June 2002 to July 2008, Mr. Murawski served as Senior Vice President of Operations and Corporate Officer of Favrille, Inc., a biotech manufacturing company, and was responsible for manufacturing, engineering, materials management, facilities, technical services, and environmental, health and safety functions. Mr. Murawski earned his B.S. in chemical engineering from the Newark College of Engineering at the New Jersey Institute of Technology.
Board of Directors
Terence E. Winters, Ph.D.
Please see biographical information above in the section entitled "Executive Officers."
76
Muneer A. Satter, J.D., M.B.A.
has served as co-Chairman of Vital Therapies' Board of Directors since 2012. Mr. Satter has been Founder and Managing Partner of Satter Medical Technology Partners, L.P. since 2016, Chairman of Satter Investment Management LLC since 2012, and he also manages the Satter Foundation. Prior to Satter Investment Management, Mr. Satter was a partner at Goldman Sachs where he spent 24 years in various roles, most recently as the Global Head of the Mezzanine Group in the Merchant Banking Division, where he raised and managed over $30 billion of assets. Mr. Satter is co-chairman of the board of directors of Linq3 Technologies LLC, chairman of the board of directors of Akebia Therapeutics, Aerpio Therapeutics and Restorsea Holdings, LLC and a director of Annexon Biosciences. He also serves as vice chairman of Goldman Sachs Foundation and GS Gives, is a director of the Navy SEAL Foundation, a director of World Business Chicago, is on the Board of Advisors of the American Enterprise Institute and is on the Board of Trustees of Northwestern University where he is Chairman of the Finance Committee. Mr. Satter received a B.A. in Economics from Northwestern University, a J.D. from Harvard Law School and an M.B.A. from Harvard Business School.
We believe Mr. Satter is qualified to serve on our board of directors because of his extensive experience in merchant banking and venture capital investments and his experience as an investor and director of other companies in the life sciences and medical technology industries.
Jean-Jacques Bienaimé, M.B.A.
has served on our board of directors since September 2013. Since May 2005, Mr. Bienaimé has served as the chief executive officer and as a director of BioMarin Pharmaceutical Inc., a publicly-traded company that develops and commercializes innovative pharmaceuticals for serious diseases and medical conditions, and since June 2015 he has served as chairman of its board. From November 2002 to April 2005, Mr. Bienaimé served as chairman, chief executive officer and president of Genencor, a biotechnology company focused on industrial bioproducts and targeted cancer biotherapeutics. Prior to joining Genencor, Mr. Bienaimé was chairman, president and chief executive officer of SangStat Medical Corporation, another biotechnology company. He became president of SangStat Medical Corporation, a global pharmaceutical company, in 1998 and chief executive officer in 1999. Prior to joining SangStat Medical Corporation, Mr. Bienaimé held various management positions from 1992 to 1998 with Rhône-Poulenc Rorer Pharmaceuticals (now known as Sanofi-Aventis), including Senior Vice President of Corporate Marketing and Business Development, and Vice President and General Manager of the Advanced Therapeutic and Oncology division. Mr. Bienaimé has served on the board of BioMarin Pharmaceuticals Inc. since May 2005, and the board of Incyte Corporation, a publicly-traded biopharmaceutical company, since January 2015. In addition, he serves on the board of The Biotech Industry Organization. Mr. Bienaimé served on the boards of Intermune, Inc., a publicly-traded biotechnology company, from March 2012 until its acquisition by Roche Holdings, Inc. in September 2014, and Portola Pharmaceuticals, Inc., a publicly-traded biopharmaceutical company, from September 2010 through June 2014. Mr. Bienaimé earned an M.B.A. from the Wharton School at the University of Pennsylvania and a B.S. in economics from the Ecole Superieure de Commerce de Paris.
We believe that Mr. Bienaimé is qualified to serve on our board of directors based on his extensive experience in the management of biotechnology organizations, business development, and sales and marketing of both biotechnology and pharmaceutical products.
Cheryl L. Cohen
has served on our board of directors since July 2015. Ms. Cohen served as chief commercial officer of Medivation, Inc., a publicly-traded bio-pharmaceutical company, from September 2011 until July 2014. Ms. Cohen currently serves as president of CLC Consulting, a pharmaceutical and biotechnology consulting firm specializing in new product start-up and commercialization, where she also served as president from September 2008 until September 2011. From November 2007 to September 2008, she served as the vice president, strategic commercial group, of Health Care Systems, Inc., a Johnson & Johnson company, and from October 1998 to November 2007, she worked at Janssen Biotech, Inc. (formerly Centocor Biotech, Inc.), a Johnson & Johnson company, in a variety of senior sales roles including vice president, rheumatology franchise. Ms. Cohen has served on the board of Tokai Pharmaceuticals, Inc., a publicly-traded pharmaceutical company focused on new treatments for prostate cancer, since April 2015 and the board of Protein Sciences Corporation, a privately held bio-pharmaceutical company specializing in vaccine development since October 2014. Ms. Cohen also served on the board of Cytrx Corporation, a publicly traded bio-pharmaceutical company specializing in oncology, from June 2015 through October 2016. Ms. Cohen began her career at Solvay Pharmaceuticals in a variety of sales positions. Ms. Cohen received her B.A. from Saint Joseph College.
We believe that Ms. Cohen is qualified to serve on our board of directors based on her experience as an executive officer and director of private and publicly-traded companies, including companies in the pharmaceutical and bio-pharmaceutical industries.
77
Philip M. Croxford, M.B.A.
has served on our board of directors since 2009 and as a healthcare president and chief executive officer for over 15 years. Mr. Croxford currently serves as President and Chief Executive Officer of Gamma Medica, Inc., a breast diagnostic imaging company, since April 2015. Previously, Mr. Croxford held the position of Global President of LifeCell Corporation, a tissue biotechnology engineering company, from September 2013 until September 2014, and was a member of its parent, Acelity (formerly KCI), Executive Leadership Team. From December 2012 to August 2013, Mr. Croxford was Senior Vice President of Global Commercial Operations for LifeCell. From June 2008 to December 2012 he was President and Chief Executive Officer of ArjoHuntleigh, North America, a member of The Getinge AB Group, a global medical and safety technology company listed on the OMX Nordic Exchange. He served on their Executive Leadership Team during his term in office. From February 2006 to October 2007, Mr. Croxford was President and Chief Executive Officer and member of the board of directors of Draeger Medical, Inc., a private medical device company. Mr. Croxford also served as Group Vice President and Worldwide General Manager of Arrow International, Inc. and as an Operating Company Board Member and Vice President for the Worldwide Wound Management Business of Ethicon, a Johnson & Johnson Company. Mr. Croxford also held other executive management positions with Johnson & Johnson Company and Smith & Nephew. He earned a B.Sc. (Honors) degree in pharmacy from the University of Manchester, School of Pharmacy, in England. Mr. Croxford is also a licensed member of the Royal Pharmaceutical Society of Great Britain. He earned a Post Graduate Diploma in marketing from the Royal Chartered Institute of Marketing, and is a Chartered Member of the Institute. He earned his M.B.A. from Heriot-Watt University, Edinburgh Business School, United Kingdom.
We believe Mr. Croxford is qualified to serve on our board of directors based on his significant operational and leadership experience, including, without limitation, senior management experience of public international companies, extensive experience in the life sciences and medical technology industries, and a strong academic background, including degrees in pharmacy, marketing and business.
Douglas E. Godshall, M.B.A.
has served on our board of directors since May 2013. Mr. Godshall was the Chief Executive Officer of HeartWare International, Inc., a developer of a range of implantable mechanical circulatory assist devices, starting in September 2006 and a director since October 2006 until the company was acquired by Medtronic in August 2016. Prior to joining HeartWare, Mr. Godshall served in various executive and managerial positions at Boston Scientific Corporation, a manufacturer and a developer of medical supplies and medical devices in a variety of fields, including as a member of Boston Scientific’s Operating Committee and President, Vascular Surgery. Previously, Mr. Godshall spent five years as Vice President, Business Development, at Boston Scientific, where he was focused on acquisition strategies for the cardiology, electrophysiology, neuroradiology and vascular surgery divisions. In March 2012, Mr. Godshall was appointed a director of pSivida Corp., a developer of drug delivery products for treatment of back-of-the-eye diseases. Mr. Godshall earned a B.A. in business from Lafayette College and an M.B.A from Northeastern University.
We believe that Mr. Godshall is qualified to serve on our board of directors based on his experience as an executive officer and director of several life sciences and medical technology companies.
Errol R. Halperin, J.D., L.L.M.
has served on our board of directors since December 2012. Mr. Halperin was a senior partner of DLA Piper from January 1979 until December 2013. At the present time, Mr. Halperin is a senior strategic advisor to DLA Piper (U.S.). In his practice, Mr. Halperin has provided general business advice to clients in a broad range of sectors, including the manufacturing, real estate industry and real estate investment trust industry. Mr. Halperin’s practice was concentrated in the areas of mergers and acquisitions, corporate law, international transactions, real estate law and federal income tax law. Mr. Halperin has also served on the board of Equity Residential, a public REIT, and private company boards. Currently, he is a director of Elkay Manufacturing Company, a privately held corporation, and Pangea Properties, a private real estate investment and management company. He also currently serves as a director of other late stage private venture companies, including LINQ3, LLC and Restorsea, LLC. Before joining DLA Piper, from June 1972 to January 1979 he was legislation counsel of the Joint Committee on Taxation of the U.S. Congress; and was an assistant branch chief of the Legislation and Regulations Division of the Chief Counsel for the Internal Revenue Service from June 1968 to June 1972. Mr. Halperin earned a B.S. and a J.D. from DePaul University and an L.L.M. in taxation from New York University.
We believe that Mr. Halperin is qualified to serve on our board of directors based on his experience as an attorney practicing for a nationally known firm in the areas of mergers and acquisitions and corporate transactions and his involvement in advising venture capital backed companies.
78
Faheem Hasnain
has served on our board of directors since August 2016. Mr. Hasnain served as the Chief Executive Officer, President, and a director at Receptos, Inc. from November 2010 to August 2015. Prior to joining Receptos, Inc., Mr. Hasnain was the President and Chief Executive Officer and a director of Facet Biotech Corporation, a biology-driven antibody company with a focus in multiple sclerosis and oncology. He held that position from December 2008 until the company’s acquisition by Abbott Laboratories in April 2010. Previously, Mr. Hasnain was President, Chief Executive Officer and a director of PDL BioPharma, Inc. from October 2008 until Facet Biotech was spun off from PDL BioPharma in December 2008. From October 2004 to September 2008, Mr. Hasnain was at Biogen Inc., most recently as Executive Vice President in charge of the oncology/rheumatology strategic business unit. Prior to Biogen, Mr. Hasnain held roles with Bristol Myers Squibb, where he was President of the Oncology Therapeutics Network, and for 14 years at GlaxoSmithKline and its predecessor organizations. He has been Chairman of the Board of Sente, Inc. since 2008 and of Tocagen Inc. since November 2014, and has served as a member of the board of directors of Kura Oncology, Inc. since April 2015. He previously served as a member of the board of directors of Ambit Biosciences Corporation, Seragon Pharmaceuticals, Tercica, Inc., Aragon Pharmaceuticals and Somaxon Pharmaceuticals, Inc. Mr. Hasnain received a B.H.K. and B.Ed. from the University of Windsor Ontario in Canada.
We believe that Mr. Hasnain is qualified to serve on our board of directors based on his extensive operational and leadership experience in biotechnology and pharmaceutical companies and as a director of publicly-traded companies.
J. Michael Millis, M.D.
has served on our board of directors since 2006. Dr. Millis is a Professor of Surgery and Vice Chair of Global Surgery, Chief of the Section of Transplantation at the University of Chicago. Dr. Millis currently serves on the medical staff at the University of Chicago Hospital. His current research explores the application of cellular technology on patient care, including how hepatocyte transplantation, extracorporeal assist technology and stem cells can assist in the care of patients with liver disease or liver tumors. Dr. Millis has been associated with the ELAD System since 1994, and was an investigator on the Phase 1 clinical trial. He has been the chairman of the Vital Therapies Clinical Advisory Board since 2003. Dr. Millis currently serves or has served in the past on a variety of committees, such as the American Association for the Study of Liver Diseases’ Ethics Committee, the American Society of Transplant Surgeons, Studies of Pediatric Liver Transplantation Scientific Advisory Board and Publication and Research Committee, and the ROBI Liver Intestinal Subcommittee, for which he is the former chairman. Dr. Millis is also a member of the Medical Advisory Committee of the American Liver Foundation Illinois Chapter. He also serves on the board of directors of Gift of Hope (the organ procurement organization for Illinois) and the Editorial Board of the American Journal of Transplantation, Transplantation, and Liver Transplantation. He earned a B.A. in chemistry and political science from Emory University and an M.D. with high honors from the University of Tennessee. He completed his surgical residency, clinical and research fellowship in liver transplantation at the University of California, Los Angeles. He also received his M.B.A. from University of Massachusetts, Amherst in 2014.
We believe that Dr. Millis is qualified to serve on our board of directors based on his participation on multiple advisory committees and boards and his research in the treatment of liver disease.
Lowell E. Sears, M.B.A.
has served on our board of directors since May 2013. Mr. Sears is the Chairman and Chief Executive Officer of Sears Capital Management, a venture investment and portfolio management firm specializing in life sciences. From February 2012 to January 2017, he served on the board of directors of Cellerant Therapeutics, Inc., a clinical stage biotechnology company focused on the regulation of the hematopoietic, or blood-forming, system. From September 2005 to March 2017, Mr. Sears has also served on the board of directors of SymBio Pharmaceuticals, KK, Ltd., a biotechnology company that is engaged in identifying and developing therapeutics for the treatment of leukemia, multiple myeloma and lymphoma. He has served on the board of directors of SiteOne Therapeutics, Inc., a privately-held company developing small molecular pain therapies, and has been Chairman of the Board since September 2014. He has also served on the board of directors of Halcyon Medical, a cardiovascular device company, since April 2014. From 1986 until 1994, Mr. Sears was a part of the senior management team of Amgen, Inc., a developer and manufacturer of therapeutics targeting cancers, kidney ailments, inflammatory disorders, and metabolic diseases, where he was Chief Financial Officer as well as the Senior Vice President responsible for the Asia Pacific Region. Prior to joining Amgen, Mr. Sears held senior planning and financial positions with Atlantic Richfield Company, an oil company from 1976 until 1986, including Chief Financial Officer for its Ventures Division. He earned a B.A. in economics from Claremont McKenna College and an M.B.A. from the Stanford University Graduate School of Business.
We believe that Mr. Sears is qualified to serve on our board of directors based on his experience as a senior manager and director of private and publicly-traded companies, including several in the life sciences industry.
79
Randolph C. Steer, M.D., Ph.D.
has served on our board of directors since May 2005. Dr. Steer has been an independent pharmaceutical, biotechnology and medical devices consultant since 1989. Dr. Steer has served as Associate Director of Medical Affairs at Marion Laboratories, a then-public pharmaceutical company; Medical Director at Ciba Consumer Pharmaceuticals (a division of Ciba-Geigy Corporation, a then-public pharmaceutical company); Vice President, Senior Vice President and Member of the Executive Committee at Physicians World Communications Group; Chairman, President and Chief Executive Officer of Advanced Therapeutics Communications International, a drug regulatory group serving the U.S., Mexico, Latin America, the Pacific Rim, Europe and Japan; Chairman and Chief Executive Officer of Vicus.com, Inc.; and President and Chief Operating Officer of Capstone Therapeutics Corp., a public biotechnology company. Dr. Steer is a member of the board of directors of Bio-Techne Corporation, a public biotechnology company, and the Board of Trustees of the Mayo Clinic. He earned his B.A. in Physiology from the University of Minnesota. He earned an M.D. from the Mayo Medical School and a Ph.D. from the University of Minnesota where he also completed a residency and subspecialty training in clinical and chemical pathology. He is a Fellow of the American College of Clinical Pharmacology.
We believe that Dr. Steer is qualified to serve on our board of directors based on his experience as a senior manager in multiple biotechnology and medical device companies and his background and experience in the medical and clinical field.
Family Relationships
There are no family relationships among any of our directors and executive officers.
Board Composition
Our board of directors is currently composed of eleven members. Ten of the eleven directors that comprise our board of directors are independent within the meaning of the independent director guidelines of the NASDAQ Stock Market. Please see the section entitled “
Director Independence
” in Item 13 below for further information. Our certificate of incorporation and bylaws currently in effect provide that the number of directors shall be at least one and will be fixed from time to time by resolution of our board of directors.
Our board of directors is divided into three classes of directors. At each annual meeting of stockholders, a class of directors will be elected for a three-year term to succeed the class whose terms are then expiring. The terms of the directors will expire upon the election and qualification of successor directors at the annual meeting of stockholders to be held during the years 2017 for the Class III directors, 2018 for the Class I directors and 2019 for the Class II directors.
The Class I directors are Mr. Croxford and Drs. Steer and Winters.
The Class II directors are Messrs. Bienaimé, Godshall, Hasnain and Satter.
The Class III directors are Mrs. Cohen, Messrs. Halperin and Sears and Dr. Millis.
The division of our board of directors into three classes with staggered three-year terms may delay or prevent a change of our board of directors or a change in control.
Certain of our stockholders affiliated with Mr. Satter, which we refer to as the Satter Investors, retain, contractual rights to nominate up to 30% of our directors, as provided in our Fourth Amended and Restated Investors’ Rights Agreement, dated as of August 28, 2013, as amended, or the Senior Preferred IRA. To date, the Satter Investors have not exercised their rights to designate any candidates for nomination but reserve the right to do so in the future.
Board Leadership Structure and Lead Director
Our board of directors is currently co-chaired by our Chief Executive Officer, Dr. Winters, and our Lead Director, Mr. Satter. The Senior Preferred IRA provides that for so long as Mr. Satter and Dr. Winters both serve as members of our board of directors, each shall serve as Co-Chairman of our board of directors and Mr. Satter shall serve as our Lead Director. In the event that Mr. Satter serves as a member of our board of directors at a time when Dr. Winters does not, Mr. Satter will serve as our Chairman of the board and Lead Director. Dr. Winters will serve as Co-Chairman only so long as he is both a director and our Chief Executive Officer.
As Lead Director, Mr. Satter, among other responsibilities, coordinates the scheduling of, and prepares the agenda for, meetings of our board of directors, stockholders and independent directors, presides (or designates another director to preside) over such meetings, and defines the scope, quality, quantity and timeliness of the flow of information between management and our board of directors that is necessary for our board of directors to effectively and responsibly perform its duties.
80
Our board of directors believes that the Company and its stockholders are currently best served by having Dr. Winters and Mr. Satter serve as Co-Chairmen of the Board and Mr. Satter serve as Lead Director. As Co-Chairmen, Dr. Winters and Mr. Satter promote unified leadership and direction for our board and management and provide the critical leadership necessary for carrying out our strategic initiatives. As Lead Director, Mr. Satter, together with our board’s strong committee system and substantial majority of independent directors, allow our board to maintain effective oversight of our business operations, including independent oversight of our financial statements, executive compensation, selection of director candidates, and corporate governance programs. We believe our current board leadership structure enhances the board’s ability to effectively carry out its roles and responsibilities on behalf of our stockholders.
Audit Committee
Our board of directors has a separately-designated standing audit committee, which operates pursuant to a charter. Our audit committee members currently consist of Messrs. Godshall, Halperin and Sears. Mr. Sears serves as the chairman. Our board of directors has determined that Mr. Sears qualifies as an audit committee financial expert within the meaning of the rules and regulations of the Securities and Exchange Commission, or SEC, and is independent under Rule 10A-3 of the Exchange Act and the current rules of the NASDAQ Stock Market and financially literate under the rules of the SEC and NASDAQ Stock Market.
The audit committee has (1) reviewed and discussed the audited financial statements with management; (2) discussed with the independent auditors the matters required by Public Company Accounting Oversight Board, or PCAOB, Auditing Standard No. 16, Communications with Audit Committees; (3) received written disclosures and the letter from the independent accountants required by applicable requirements of the PCAOB regarding the independent accountant's communications with the audit committee concerning independence and has discussed with the independent accountant the independent accountant's independence; and (4) recommended to the board of directors that the audited financial statements be included in the annual report on Form 10-K for the last fiscal year.
Section 16(a) Beneficial Ownership Reporting Compliance
Section 16(a) of the Exchange Act requires our executive officers and directors, and persons who own more than 10% of a registered class of our equity securities, to file reports of ownership and changes of ownership on Forms 3, 4 and 5 with the SEC. Such directors, executive officers and 10% stockholders are required by SEC regulations to furnish us with copies of all Section 16(a) forms they file.
Based solely on our review of the copies of such forms we have received and written representations from certain reporting persons that they filed all required reports, we believe that all of our officers, directors and greater than 10% stockholders complied with all Section 16(a) filing requirements applicable to them with respect to transactions during 2016.
Code of Business Conduct and Ethics
Our board of directors has adopted a written code of business conduct and ethics that applies to our directors, officers and employees, including our principal executive officer, principal financial officer, principal accounting officer or controller, or persons performing similar functions. A copy of the code of business conduct and ethics is available on the corporate governance section of our website, which is located at http://ir.vitaltherapies.com/corporate-governance.cfm. If we make any substantive amendments to, or grant any waivers from, the code of business conduct and ethics for any officer or director, we will disclose the nature of such amendment or waiver on our website.
Considerations in Evaluating Director Nominees
In its evaluation of director candidates, including the members of the board of directors eligible for reelection, our nominating and governance committee will consider the following:
|
•
|
The current size and composition of our board of directors and the needs of the board and its respective committees;
|
|
•
|
Factors such as character, integrity, judgment, diversity of experience, independence, area of expertise, corporate experience, length of service, potential conflicts of interest, other commitments, and the like. Our nominating and governance committee evaluates these factors, among others, and does not assign any particular weighting or priority to any of these factors; and
|
|
•
|
Other factors that our nominating and governance committee may consider appropriate.
|
81
The nominating and governance committee also focuses on issues of diversity, such as diversity in experience, international perspective, background, expertise, skills, age, gender, and ethnicity. The nominating and governance committee does not have a formal policy with respect to diversity; however, our board of directors and the nominating and governance committee believe that it is essential that members of our board of directors represent diverse viewpoints. Any nominee for a position on the board must satisfy the following minimum qualifications:
|
•
|
The highest personal and professional ethics and integrity;
|
|
•
|
Proven achievement and competence in the nominee’s field and the ability to exercise sound business judgment;
|
|
•
|
Skills that are complementary to those of the existing board;
|
|
•
|
The ability to assist and support management and make significant contributions to the company’s success; and
|
|
•
|
An understanding of the fiduciary responsibilities required of a member of the board and the commitment of time and energy necessary to diligently carry out those responsibilities.
|
If our nominating and governance committee determines that an additional or replacement director is required, the committee may take such measures as it considers appropriate in connection with its evaluation of a director candidate, including candidate interviews, inquiry of the person or persons making the recommendation or nomination, engagement of an outside search firm to gather additional information, or reliance on the knowledge of the members of the committee, board, or management.
After completing its review and evaluation of director candidates, our nominating and governance committee recommends to our full board of directors the director nominees for selection. Our nominating and governance committee has discretion to decide which individuals to recommend for nomination as directors and our board of directors has the final authority in determining the selection of director candidates for nomination to our board.
Requirements for Stockholder Recommendations of a Candidate to our Board
It is the policy of our nominating and governance committee to consider recommendations for candidates to our board of directors from our stockholders. A stockholder that wishes to recommend a candidate for consideration by the committee as a potential candidate for director must direct the recommendation in writing to Vital Therapies, Inc., 15010 Avenue of Science, Suite 200, San Diego, California 92128, Attention: Secretary, and must include the candidate’s name, home and business contact information, detailed biographical data, relevant qualifications, a signed letter from the candidate confirming willingness to serve, information regarding any relationships between us and the candidate and evidence of the recommending stockholder’s ownership of our stock. Such recommendation must also include a statement from the recommending stockholder in support of the candidate, particularly within the context of the criteria for board membership, including issues of character, integrity, judgment, diversity of experience, independence, area of expertise, corporate experience, potential conflicts of interest, other commitments and the like and personal references. Our nominating and governance committee will consider the recommendation but will not be obligated to take any further action with respect to the recommendation.
Requirements for Stockholder Nominations to be brought before an Annual Meeting
Separately, our bylaws contain specific requirements governing the processes and procedures for stockholders who wish to formally nominate a candidate and ensure that he or she is nominated and eligible for election at an annual meeting of stockholders. Generally, nominations for the election of directors may be made by stockholders of record (both on the date of the applicable written notice and at the time of annual meeting) who have timely delivered written notice to us at Vital Therapies, Inc., 15010 Avenue of Science, Suite 200, San Diego, California 92128, Attention: Secretary in compliance with the advance notice provisions included in our bylaws. Such notice must contain specified information concerning the nominees such as the nominees’ name, age, home and business contact information, principal occupation or employment, the class and number of shares beneficially owned directly or indirectly by the nominee, the date such shares were acquired and the investment intent of such acquisition, a written questionnaire completed by the nominee, a written representation from the nominee that he/she will not become a party to any agreement, arrangement or understanding with any person or entity as to how such person will act or vote and would be in compliance with all applicable publicly disclosed policies and guidelines, and any other information required to be disclosed about the nominee if proxies were to be solicited to elect the nominee as a director pursuant to Regulation 14A of the Exchange Act. In addition, such notice must contain specified information concerning the nominating stockholder such as the stockholder’s name, address, the class and number of shares beneficially owned directly or indirectly by the stockholder, a description of any derivative positions held or beneficially held by the
82
stockholder, whether and the extent to which a hedging transaction has been entered into by or on behalf of the stockholder, a description of all arrangements or understandings between the stockholder and the proposed nominee, a representation that the stockholder is a holder of record entitled to vote at the annual meeting and that the stockholder intends to appear in person or by proxy at the meeting to nominate the person named in its notice, a representation as to whether such stockholder intends to deliver a proxy statement and/or form of proxy to the holders of a sufficient number of our outstanding shares reasonably believed by the stockholder to elect the proposed nominee or otherwise to solicit proxies or votes from stockholders in support of the nomination, and any other information required to be disclosed about the stockholder if proxies were to be solicited to elect the nominee as a director pursuant to Regulation 14A of the Exchange Act. For a stockholder recommendation to be considered by our nominating and governance committee as a potential candidate at an annual meeting, written notice of nominations must be received on or before the deadline for receipt of stockholder proposals for such meeting. In the event a stockholder decides to nominate a candidate for director and solicits proxies for such candidate, the stockholder will need to follow the rules set forth by the SEC and in our bylaws.
Our named executive officers for the year ended December 31, 2016, which consist of our principal executive officer and our two other most highly compensated executive officers, are Terence E. Winters, Ph.D., our Co-Chairman and Chief Executive Officer, Duane Nash, M.D., J.D., our President and Robert A. Ashley our Executive Vice President and Chief Technology Officer.
|
Name and Principal Position
|
|
Year
|
Salary
($)
|
Option
Awards
($)
(1)
|
Non-Equity
Incentive
Plan
Compensation
($)
(2)
|
|
All Other
Compensation
($)
(3)
|
Total
($)
|
|||||||||
|
Terence E. Winters, Ph.D.
|
|
2016
|
490,000
|
|
|
586,400
|
|
73,500
|
|
|
18,808
|
|
1,168,708
|
|
|||
|
Co-Chairman and Chief Executive Officer
|
|
2015
|
469,896
|
|
|
296,560
|
|
100,000
|
|
|
17,397
|
|
883,853
|
|
|||
|
Duane D. Nash, M.D., J.D.
|
|
2016
|
375,550
|
|
|
498,440
|
|
67,820
|
|
|
—
|
|
941,810
|
|
|||
|
President
|
|
2015
|
357,958
|
|
|
222,420
|
|
78,000
|
|
|
—
|
|
658,378
|
|
|||
|
Robert A. Ashley, M.A.
|
2016
|
370,000
|
|
439,800
|
|
83,528
|
|
—
|
|
893,328
|
|
||||||
|
Executive Vice President, Chief
|
2015
|
357,958
|
|
222,420
|
|
78,000
|
|
—
|
|
658,378
|
|
||||||
|
Technology Officer
|
|||||||||||||||||
|
(1)
|
The amounts in the “Option Awards” column reflect the aggregate grant date fair value of stock options granted during the calendar year computed in accordance with the provisions of Accounting Standards Codification, or ASC, 718,
Compensation - Stock Compensation
. The assumptions that we used to calculate these amounts are discussed in Note 8 to our financial statements appearing at the end of this Annual Report. These amounts do not reflect the actual economic value that will be realized by the named executive officer upon the vesting of the stock options, the exercise of the stock options, or the sale of the common stock underlying such stock options.
|
|
(2)
|
2016 and 2015 amounts approved by our board of directors on January 30, 2017 and February 1, 2016, respectively.
|
|
(3)
|
"All Other Compensation" consists of company-paid reimbursement for Medicare and prescription drug coverage.
|
83
Non-Equity Incentive Plan Compensation and Bonus
Executive Incentive Compensation Plan
Our Executive Incentive Compensation Plan, or Incentive Plan, was adopted by our board of directors on July 8, 2013. Our Incentive Plan is administered by our compensation committee; provided, however, that our board of directors must approve any award or any amendment to any award made thereunder. Our compensation committee determines the performance goals applicable to any award, which goals may include, without limitation, the attainment of research and development milestones, sales bookings, business divestitures and acquisitions, cash flow, cash position, earnings (which may include earnings before interest and taxes, earnings before taxes and net earnings) per share, net income, net profit, net sales, operating cash flow, operating expenses, operating income, operating margin, overhead or other expense reduction, product defect measures, product release timelines, productivity, profit, return on assets, return on capital, return on equity, return on investment, return on sales, revenue, revenue growth, sales results, sales growth, stock price, time to market, total shareholder return, working capital, and individual objectives or other subjective or objective criteria. Performance goals that include the Company’s financial results may be determined in accordance with United States generally accepted accounting principles, or GAAP, or such financial results may consist of non-GAAP financial measures. The performance goals may be on an individual, divisional, business unit, functional or company-wide basis. The performance goals may differ from participant to participant and from award to award.
Pursuant to the employment letter agreements entered into between us and our named executive officers, our named executive officers are each eligible to receive annual bonuses as a percentage of their annual base salary based upon achievement of the performance goals determined by our compensation committee. For additional information regarding the terms of these employment letter agreements, see below under “Agreements With Our Named Executive Officers.”
Notwithstanding the eligibility for bonus awards, our board of directors may, in its sole discretion and at any time, increase, reduce or eliminate a participant’s actual award, or increase, reduce or eliminate the amount allocated to the bonus pool for a particular performance period. The actual award may be below, at or above a participant’s target award, in the discretion of our board. Our board may determine the amount of any reduction on the basis of such factors as it deems relevant, and it is not required to establish any allocation or weighting with respect to the factors it considers.
Actual awards are paid in cash only after they are earned, which usually requires continued employment through the date of payment of the award. Payment of bonuses occurs as soon as administratively practicable after they are earned, but no later than the dates set forth in the Incentive Plan.
Our board of directors has the authority to amend, alter, suspend or terminate the Incentive Plan provided such action does not impair the existing rights of any participant with respect to any earned bonus.
For the fiscal year ended December 31, 2016, bonus awards for our named executive officers were based on the achievement of corporate performance goals, which carried a 40% weighting, and individual performance, which carried a 60% weighting, except with respect to Dr. Winters for whom a bonus award was based solely on the achievement of corporate performance goals. Our compensation committee established the categories of corporate performance goals as relating to the attainment of research and development milestones and financings. Our compensation committee determined that the performance goals of our named executive officers were met at a range of 30% to 65% of target, and payments were approved at those payout percentages by our board on January 30, 2017.
Agreements With Our Named Executive Officers
Terence E. Winters
We entered into an employment letter agreement, dated October 31, 2013, with Dr. Winters, which sets forth the terms and conditions of his employment with us. The employment letter agreement has no specific term and provides for at-will employment. This agreement supersedes all existing agreements he may have with us concerning his employment relationship. Dr. Winters’ current annual base salary is $504,700, and he is eligible for an annual bonus equal to 50% of his base salary.
84
Duane Nash
We entered into an employment letter agreement, dated October 30, 2013, with Dr. Nash, our current President, which sets forth the terms and conditions of his employment with us. The employment letter agreement has no specific term and provides for at-will employment. This agreement supersedes all existing agreements he may have with us concerning his employment relationship. Dr. Nash’s current annual base salary is $400,000, and he is eligible for an annual bonus equal to 40% of his annual base salary.
Robert A. Ashley
We entered into an employment letter agreement, dated October 30, 2013, with Mr. Ashley, our current Executive Vice President and Chief Technology Officer, which sets forth the terms and conditions of his employment with us. The employment letter agreement has no specific term and provides for at-will employment. Mr. Ashley’s current annual base salary is $381,100, and he is eligible for an annual bonus equal to 35% of his annual base salary.
Executive Change of Control and Severance Agreements
We have entered into a change of control and severance agreement, with each of our executive officers, which require us to make payments if the executive officer’s employment with us is terminated in certain circumstances.
If prior to the two-month period before or after the twelve-month period following a change of control (such period, the Change of Control Period), an executive officer’s employment is terminated without “cause” or an executive officer resigns for “good reason” (as such terms are defined in the change of control and severance agreement), such officer will be eligible to receive the following benefits if such officer timely signs and does not revoke a release of claims:
|
•
|
continued payment of base salary for a period of six months (12 months in the case of Dr. Winters); and
|
|
•
|
reimbursement by us for up to six months (12 months in the case of Dr. Winters) of COBRA premiums to continue health insurance coverage for such officer and such officer’s eligible dependents, or taxable monthly payments for the equivalent period in the event payment for COBRA premiums would violate applicable law.
|
If, within the Change of Control Period, such officer’s employment is terminated without cause or such officer resigns for good reason, such officer will be entitled to the following benefits if such officer timely signs a release of claims:
|
•
|
a lump sum payment equal to (x) 12 months (18 months in the case of Dr. Winters) his annual base salary (for the year of the change of control or such officer’s termination, whichever is greater), plus (y) 1x (1.5x in the case of Dr. Winters) the greater of: (A) such officer’s target annual bonus (for the year of the change of control or such officer’s termination, whichever is greater) or (B) such officer’s actual bonus for performance relating to the calendar year immediately prior to the calendar year of such officer’s termination;
|
|
•
|
reimbursement by us for up to 12 months (18 months in the case of Dr. Winters) of COBRA premiums to continue health insurance coverage for such officer and such officer’s eligible dependents, or taxable monthly payments for the equivalent period in the event payment for COBRA premiums would violate applicable law; and
|
|
•
|
100% accelerated vesting of all outstanding equity awards.
|
In addition, in the event any of the amounts provided for under these agreements or otherwise payable to our executive officers would constitute “parachute payments” within the meaning of Section 280G of the Internal Revenue Code and could be subject to the related excise tax, the executive officer would be entitled to receive either full payment of benefits under this agreement or such lesser amount which would result in no portion of the benefits being subject to the excise tax, whichever results in the greater amount of after-tax benefits to the executive officer. The agreements do not require us to provide any tax gross-up payments.
With respect to options granted under the 2012 Plan, Drs. Winters and Nash and Mr. Ashley may become eligible for accelerated vesting of their option awards in connection with a change in control under our 2012 Stock Option Plan, or 2012 Plan, and option agreements under the 2012 Plan, as described below. The option grants to Drs. Winters and Nash and Mr. Ashley made pursuant to our 2014 Plan, provide for accelerated vesting in connection with a change in control in limited circumstances, as described below.
85
2014 Equity Incentive Plan
Our 2014 Plan provides that in the event of a merger or change in control, as defined in the 2014 Plan, each outstanding award will be treated as the administrator determines, including, without limitation, that awards may be assumed or substituted for by the acquiring or succeeding corporation, awards may be terminated immediately prior to the consummation of the merger or change in control, awards may vest in whole or in part prior to or upon consummation of the merger or change in control and, to the extent the administrator determines, terminate on or immediately prior to the effectiveness of the merger or change in control, or awards may be terminated in exchange for cash or property or replaced with other rights or property. If a successor corporation does not assume or substitute an equivalent award for any outstanding award, then such award will fully vest, all restrictions on such award will lapse and all performance goals or other vesting criteria applicable to such award will be deemed achieved at one hundred percent (100%) of target levels. Additionally, if a successor corporation does not assume or substitute an option or stock appreciation right, the administrator will notify the participant in writing or electronically that such award will be exercisable for a specified period of time determined by the administrator prior to the transaction, and such award will then terminate upon the expiration of such period.
In addition, pursuant to their stock option agreements, certain optionees, including our named executive officers who have awards under the 2014 Plan, are eligible for full vesting acceleration of their outstanding options in the event their service is terminated other than for cause within twelve months following a change in control.
2012 Stock Option Plan and Option Agreements
Our 2012 Plan provides that in the event of a change in control, as defined in the 2012 Plan, the surviving, continuing, successor, or purchasing corporation or other business entity or parent thereof may assume or substitute an equivalent award for each outstanding option under the 2012 Plan. If there is no assumption or substitution of outstanding options, such options will terminate upon the expiration of a stated notice period unless otherwise specified in the applicable stock option agreement.
In addition, pursuant to their stock option agreements, certain optionees, including our named executive officers who have awards under our 2012 Plan, are eligible for full vesting acceleration of their outstanding options in the event their service is terminated other than for cause or they resign from their service for good reason, in either case, within twelve months following a change in control. Furthermore, if there is no assumption or substitution of outstanding options following a change in control and, provided further that, such optionee’s service has not terminated prior to such change in control, such outstanding options are eligible for full vesting acceleration as of the date ten days prior to the date of the change in control and will terminate upon the expiration of the stated notice period unless exercised or terminated in exchange for cash or property.
86
Outstanding Equity Awards at Fiscal Year-End for Fiscal 2016
The following table sets forth certain information concerning outstanding equity for our named executive officers awards at fiscal year-end December 31, 2016:
|
Name
|
|
Vesting Commencement Date
|
|
|
Number of Securities Underlying Unexercised Options Exercisable
|
|
Number of Securities Underlying Unexercised Options Unexercisable
|
Option
Exercise
Price
|
|
Option Expiration Date
|
|||||
|
Terence E. Winters, Ph.D.
|
|
9/13/2012
|
386,672
|
|
|
—
|
|
|
$
|
8.00
|
|
|
9/25/2022
|
||
|
Co-Chairman and Chief Executive
|
|
10/9/2018
|
(1)
|
—
|
|
|
100,000
|
|
|
$
|
4.57
|
|
|
10/8/2025
|
|
|
Officer
|
4/16/2016
|
(2)
|
16,666
|
|
83,334
|
|
$
|
8.28
|
|
5/12/2026
|
|||||
|
Duane D. Nash, M.D., J.D.
|
|
2/8/2012
|
93,377
|
|
|
—
|
|
|
$
|
0.43
|
|
|
3/31/2022
|
||
|
President
|
|
4/25/2012
|
23,344
|
|
—
|
|
$
|
0.43
|
|
4/24/2022
|
|||||
|
9/13/2012
|
241,670
|
|
—
|
|
$
|
8.00
|
|
9/25/2022
|
|||||||
|
10/9/2018
|
(1)
|
—
|
|
75,000
|
|
$
|
4.57
|
|
10/8/2025
|
||||||
|
4/16/2016
|
(2)
|
14,166
|
|
70,834
|
|
$
|
8.28
|
|
5/12/2026
|
||||||
|
Robert A. Ashley, M.A.
|
|
2/8/2012
|
93,377
|
|
|
—
|
|
|
$
|
0.43
|
|
|
3/31/2022
|
||
|
Executive Vice President and
|
|
4/25/2012
|
23,344
|
|
|
—
|
|
|
$
|
0.43
|
|
|
4/24/2022
|
||
|
Chief Technology Officer
|
9/13/2012
|
241,670
|
|
—
|
|
$
|
8.00
|
|
9/25/2022
|
||||||
|
10/9/2018
|
(1)
|
—
|
|
75,000
|
|
$
|
4.57
|
|
10/8/2025
|
||||||
|
4/16/2016
|
(2)
|
12,500
|
|
62,500
|
|
$
|
8.28
|
|
5/12/2026
|
||||||
|
(1)
|
100% of the shares subject to these options will vest on the third anniversary of the grant date if the VTL-308 clinical trial has achieved statistical significance of at least p≤0.05 in the primary efficacy end point by, and the participant continues to be a service provider through, the third anniversary of the grant date.
|
|
(2)
|
These options vest in equal monthly installments over the four-year period following the vesting commencement date.
|
Perquisites, Health, Welfare and Retirement Benefits
Our named executive officers are eligible to participate in our employee benefit plans, including our medical (except for Dr. Winters who has company-reimbursed Medicare and prescription drug coverage), dental, vision, group life, disability and accidental death and dismemberment insurance plans, in each case on the same basis as all of our other employees. We provide a 401(k) savings plan to our employees, including our current named executive officers, as discussed in the section below entitled “
401(k) Savings Plan
.”
We generally do not provide perquisites or personal benefits to our named executive officers, except in limited circumstances and as noted in the Summary Compensation Table above. Our board of directors may elect to adopt qualified or non-qualified benefit plans in the future if it determines that doing so is in our best interests.
401(k) Plan
We maintain a tax-qualified retirement plan that provides eligible employees, including named executive officers, with an opportunity to save for retirement on a tax advantaged basis. All participants’ interests in their deferrals are 100% vested when contributed. Pre-tax and after-tax contributions are allocated to each participant’s individual account and are then invested in selected investment alternatives according to the participant’s directions. Currently, we do not make matching contributions into the plan. The 401(k) plan is intended to qualify under Sections 401(a) and 501(a) of the Internal Revenue Code. As a tax-qualified retirement plan, contributions to the 401(k) plan and earnings on those contributions are not taxable to the employees until distributed from the 401(k) plan, and all matching contributions, if any, are deductible by us when made.
87
Director Compensation
Our compensation committee has retained Aon Hewitt to, among other things, provide recommendations on non-employee director compensation based on an analysis of market data compiled from comparable companies in the biotechnology industry. The following table summarizes compensation paid to our non-employee directors during or with respect to the fiscal year ended December 31, 2016.
|
Name
|
|
Fees Earned or
Paid in Cash ($)
|
|
Option
Awards
($)
(1)
|
|
All Other
Compensation ($)
(2)
|
Total ($)
|
||||||
|
Jean-Jacques Bienaimé
|
|
41,250
|
|
124,974
|
|
(3
|
)
|
166,224
|
|||||
|
Cheryl L. Cohen
|
41,821
|
|
124,974
|
|
(4
|
)
|
166,795
|
||||||
|
Philip M. Croxford, M.B.A.
|
|
41,250
|
|
124,974
|
|
(5
|
)
|
166,224
|
|||||
|
Douglas E. Godshall, M.B.A.
|
|
43,750
|
|
124,974
|
|
(6
|
)
|
168,724
|
|||||
|
Errol R. Halperin, J.D., L.L.M.
|
|
52,500
|
|
124,974
|
|
(7
|
)
|
177,474
|
|||||
|
Faheem Hasnain
|
17,934
|
|
249,965
|
|
(8
|
)
|
267,899
|
||||||
|
J. Michael Millis, M.D.
|
|
50,000
|
|
124,974
|
|
(9
|
)
|
36,000
|
|
210,974
|
|||
|
Muneer A. Satter, J.D., M.B.A.
|
36,264
|
|
174,966
|
|
(10
|
)
|
211,230
|
||||||
|
Lowell E. Sears, M.B.A.
|
|
55,000
|
|
124,974
|
|
(11
|
)
|
179,974
|
|||||
|
Randolph C. Steer, M.D., Ph.D.
|
|
50,000
|
|
124,974
|
|
(12
|
)
|
5,000
|
|
179,974
|
|||
(1) The amounts in the “Option Awards” column reflect the aggregate grant date fair value of stock options granted during the calendar year computed in accordance with the provisions of ASC 718. The assumptions that we used to calculate these amounts are discussed in Note 8 to our financial statements appearing at the end of this Annual Report. These amounts do not reflect the actual economic value that will be realized by the director upon the vesting of the stock options, the exercise of the stock options, or the sale of the common stock underlying such stock options. As of December 31, 2016, Dr. Winters, our Co-Chairman and Chief Executive Officer had outstanding and unexercised option awards for 586,672 shares.
(2) Dr. Millis’ was paid an aggregate of $36,000 in consideration for services as a consultant and for services rendered as chair of our Clinical Advisory Board in 2016. Dr. Steer was paid an aggregate of $5,000 in consideration for services as a consultant in 2016.
(3) Mr. Bienaimé had a total of 102,203 stock options outstanding as of December 31, 2016.
(4) Ms. Cohen had a total of 34,180 stock options outstanding as of December 31, 2016.
(5) Mr. Croxford had a total of 66,394 stock options outstanding as of December 31, 2016.
(6) Mr. Godshall had a total of 122,021 stock options outstanding as of December 31, 2016.
(7) Mr. Halperin has a total of 66,902 stock options outstanding as of December 31, 2016.
(8) Mr. Hasnain has a total of 58,574 stock options outstanding as of December 31, 2016.
(9) Dr. Millis had a total of 61,037 stock options outstanding as of December 31, 2016.
88
(10) Prior to May 2016, our Co-Chairman and Lead Director Mr. Satter declined board compensation. Mr. Satter has a total of 30,239 stock options outstanding as of December 31, 2016.
(11) Mr. Sears has a total of 122,021 stock options outstanding as of December 31, 2016.
(12) Dr. Steer had a total of 77,378 stock options outstanding as of December 31, 2016.
Dr. Winters is not eligible to receive any board compensation because he is an employee. We reimburse our directors for their reasonable expenses incurred in connection with attending board and committee meetings.
Director Compensation Policy
In May 2013, our board of directors adopted and approved a compensation policy for our non-employee directors, which was subsequently amended on March 2015, December 2015 and May 2016, which provides for the following compensation to our non-employee directors:
|
•
|
each non-employee director receives an annual base retainer of $35,000 except that the Non-Executive Chairman of the Board receives an annual base retainer of $50,000;
|
|
•
|
in addition to the annual base retainer, the chairman of our audit committee receives an annual fee of $15,000 and other members of our audit committee receive an annual fee of $7,500;
|
|
•
|
in addition to the annual base retainer, the chairmen of our other committees receive an annual fee of $10,000 and other members of our other committees receive an annual fee of $5,000;
|
|
•
|
in addition to the fees listed above, each non-employee director shall receive a per-meeting attendance fee of $500 for attending telephonic meetings of the Board. In addition, each Outside Director will be paid a per-meeting attendance fee of $2,500 for attending in-person meetings of the Board in excess of four during each calendar year.
|
Pursuant to this policy, except as approved by our board of directors, each new director will receive an initial grant of non-qualified common stock options with a Black-Scholes value of approximately $250,000 on the date of grant with vesting monthly over forty-eight months, subject to the director’s continued service with us.
Compensation Committee Interlocks and Insider Participation
As of December 31, 2016, the members of our compensation committee were, and currently are, Dr. Steer, Messrs. Bienaimé, Hasnain and Satter. Ms. Cohen was a member of the compensation committee from March 2016 through August 2016, and Mr. Sears was a member of the compensation committee until August 2016. None of the current or past members of our compensation committee is or has been an officer or employee of our company. None of our executive officers currently serves, or in the past year has served, as a member of the compensation committee (or other board committee performing equivalent functions or, in the absence of any such committee, the entire board of directors) or director of any entity that has one or more executive officers serving on our compensation committee or our board of directors.
Compensation Committee Report
The compensation committee has reviewed and discussed the foregoing “Executive Compensation” section of this Annual Report on Form 10-K with management. Based on this review and discussion, the compensation committee recommended to our board of directors that such information be included in this Annual Report on Form 10-K.
The Compensation Committee
Randolph C. Steer, M.D., Ph.D. (Chair)
Jean-Jacques Bienaimé
Faheem Hasnain
Muneer A. Satter
The information contained in the Compensation Committee Report shall not be deemed to be soliciting material or to be filed with the SEC, nor shall such information be incorporated by reference into any future filing under the Securities Act or the Exchange Act, except to the extent that Vital Therapies specifically incorporates it by reference in such filing.
89
Securities Authorized for Issuance Under Equity Compensation Plans
The following table summarizes information about our equity compensation plans as of December 31, 2016. All outstanding option awards relate to our common stock.
|
Plan Category
|
|
Number of Securities to be
Issued Upon Exercise of
Outstanding Options,
Warrants and Rights
(a)
|
|
Weighted-average Exercise
Price of Outstanding Options,
Warrants and Rights
(b)
|
|
Number of Securities Remaining
Available for Future Issuance Under
Equity Compensation Plans (excluding
securities reflected in column (a))
(c)
|
||
|
Equity compensation plans approved by security holders:
|
|
|||||||
|
2012 Stock Option Plan
|
|
2,606,172
|
|
|
$6.85
|
|
-
|
|
|
2014 Equity Incentive Plan (1)
|
|
2,235,102
|
|
|
$8.88
|
|
170,097
|
|
|
Equity compensation plans not approved by security holders:
|
|
—
|
|
|
N/A
|
|
-
|
|
|
Total
|
4,841,274
|
|
|
$7.78
|
|
170,097
|
|
|
|
(1)
|
Our 2014 Equity Incentive Plan provided for an annual increase in the number of shares available for issuance thereunder beginning upon the effectiveness of our initial public offering, and on each anniversary date thereafter, equal to the lower of: (i) 1,200,000 shares of our common stock; (ii) 3% of the outstanding shares of our common stock on the second-to-last day prior to each anniversary date; (iii) an amount as our board of directors may determine.
|
Security Ownership of Certain Beneficial Owners and Management
The following table sets forth the beneficial ownership of our common stock as of February 28, 2017 by:
|
•
|
each person, or group of affiliated persons, who we know to beneficially own more than 5% of our common stock;
|
|
•
|
each of our named executive officers;
|
|
•
|
each of our directors; and
|
|
•
|
all of our executive officers and directors as a group.
|
The percentage ownership information shown in the table is based on an aggregate of 32,144,876 shares of our common stock outstanding as of February 28, 2017.
We have determined beneficial ownership in accordance with the rules of the Securities and Exchange Commission. These rules generally attribute beneficial ownership of securities to persons who possess sole or shared voting power or investment power with respect to those securities. In addition, the rules include shares of common stock issuable pursuant to the exercise of stock options and warrants that are either immediately exercisable or exercisable on or before April 29, 2017, which is 60 days after February 28, 2017. These shares are deemed to be outstanding and beneficially owned by the person holding those options and warrants for the purpose of computing the percentage ownership of that person, but they are not treated as outstanding for the purpose of computing the percentage ownership of any other person. Unless otherwise indicated, the persons or entities identified in this table have sole voting and investment power with respect to all shares shown as beneficially owned by them, subject to applicable community property laws.
Unless otherwise noted below, the address of each of the individuals and entities named in the table below is c/o Vital Therapies, Inc., 15010 Avenue of Science, Suite 200, San Diego, California 92128. Beneficial ownership representing less than 1% is denoted with an asterisk (*).
90
|
|
|
Number of
Shares of
Common
Stock
Beneficially
Owned
|
|
Percentage
of Common
Stock Beneficially
Owned
|
||
|
5% Stockholders:
|
|
|
||||
|
Trusts and Other Entities Affiliated with Muneer A. Satter
(1)
|
|
7,254,449
|
|
|
22.5
|
%
|
|
KCK Ltd.
(2)
|
2,788,181
|
|
8.7
|
%
|
||
|
Victory Capital Management
(3)
|
|
2,326,615
|
|
|
7.2
|
%
|
|
Named Executive Officers and Directors:
|
|
|
||||
|
Terence E. Winters, Ph.D.
(4)
|
|
717,027
|
|
|
2.2
|
%
|
|
Duane Nash, M.D., J.D.
(5)
|
|
383,963
|
|
|
1.2
|
%
|
|
Robert A. Ashley, M.A.
(6)
|
|
377,140
|
|
|
1.2
|
%
|
|
Muneer A. Satter, J.D., M.B.A.
(1)
|
|
7,254,499
|
|
|
22.5
|
%
|
|
Jean-Jacques Bienaimé
(7)
|
|
119,723
|
|
|
*
|
|
|
Cheryl L. Cohen
(8)
|
9,004
|
|
*
|
|
||
|
Philip M. Croxford, M.B.A.
(9)
|
|
69,886
|
|
|
*
|
|
|
Douglas E. Godshall, M.B.A.
(10)
|
|
169,797
|
|
|
*
|
|
|
Errol R. Halperin, J.D., L.L.M.
(11)
|
|
144,720
|
|
|
*
|
|
|
Faheem Hasnain
(12)
|
136,005
|
|
*
|
|
||
|
J. Michael Millis, M.D.
(13)
|
|
57,118
|
|
|
*
|
|
|
Lowell E. Sears, M.B.A.
(14)
|
|
158,994
|
|
|
*
|
|
|
Randolph C. Steer, M.D., Ph.D.
(15)
|
|
57,466
|
|
|
*
|
|
|
All directors and executive officers as a group
(19 people)
(16)
|
|
10,165,706
|
|
|
29.5
|
%
|
(1) Consists of 7,132,277 shares and warrants to acquire 122,172 shares that are held by the Muneer A. Satter Revocable Trust and various other trusts and other entities for which Mr. Satter serves as trustee, investment advisor or manager and, in such capacity, has sole voting and dispositive control over all such shares.
(2) The address of KCK Ltd. is KCK Ltd. A/C KCK Ltd OMC Chambers, Wickhams Cay 1, Road Town, Tortola VG1110 British Virgin Islands. KCK Ltd., through a board of directors consisting of three or more persons, has sole voting and investment power with respect to 2,788,181 shaares of common stock held by KCK Ltd. This information is based solely upon a Schedule 13G filed by KCK Ltd. on February 13, 2017 for beneficial ownership as of December 31, 2016.
(3) The address of Victory Capital Management, Inc. is 4900 Tiedeman Road, 4
th
Floor, Brooklyn, OH 44144. Victory Capital is the beneficial owner of 2,326,615 shares of common stock held on behalf of numerous clients who have the right to receive and the power to direct the receipt of dividends from, or the proceeds of the sale of, such common stock, and Victory Capital disclaims any ownership associated with such rights. No client has the right to receive or the power to direct the receipt of dividends from, or the proceeds from the sale of, more than 5% of the shares outstanding of common stock of the company. This information is based solely upon a Schedule 13G filed by Victory Capital Management, Inc. on February 13, 2017 for beneficial ownership as of December 31, 2016.
(4) Consists of 184,966 shares held by Terence E. Winters, 119,964 shares held by Terence E. Winters and Eileen Y. Winters, 427 shares that may be acquired pursuant to the exercise of warrants held of record by Terence E. Winters, and options to purchase 411,670 shares of common stock that are exercisable or becoming exercisable within 60 days of February 28, 2017.
(5) Consists of 4,324 shares held and options to purchase 379,639 shares of common stock that are exercisable or becoming exercisable within 60 days of February 28, 2017.
(6) Consists of options to purchase shares of common stock that are exercisable or becoming exercisable within 60 days of February 28, 2017.
91
(7) Consists of 39,119 shares held and options to purchase 80,604 shares of common stock.
(8) Consists of 3,500 shares held by the Cheryl L. Cohen Trust Under Agreement dated April 1, 2005, Cheryl L. Cohen Trustee, and options to purchase 5,504 shares of common stock that are exercisable or becoming exercisable within 60 days of February 28, 2017.
(9) Consists of 25,091 shares held and options to purchase 44,795 shares of common stock.
(10) Consists of 69,375 shares held and options to purchase 100,422 shares of common stock.
(11) Consists of 89,417 shares held by Errol R. Halperin, 10,000 shares held by Errol Halperin IRA FBO Errol Halperin, and options to purchase 45,303 shares of common stock.
(12) Consists of 122,743 shares held by Faheem Hasnain, 3,500 shares held by Faheem Hasnain Trust and options to purchase 9,762 shares of common stock that are exercisable or becoming exercisable within 60 days of February 28, 2017.
(13) Consists of 17,680 shares held and options to purchase 39,438 shares of common stock.
(14) Consists of 58,572 shares held and options to purchase 100,422 shares of common stock.
(15) Consists of 1,550 shares held, 137 shares that may be acquired pursuant to the exercise of warrants, and options to purchase 55,779 shares of common stock.
(16) Consists of 7,897,843 shares held or beneficially owned, 122,791 shares that may be acquired pursuant to the exercise of warrants, and options to purchase 2,145,072 shares of common stock that are or will be vested and fully exercisable within 60 days of February 28, 2017.
The following is a summary of transactions since January 1, 2016 to which we have been a party in which the amount involved exceeded $120,000 and in which any of our executive officers, directors, promoters or beneficial holders of more than 5% of our capital stock had or will have a direct or indirect material interest, other than compensation arrangements which are described under the section of this proxy statement titled “Executive Compensation.”
Private Placement of Common Stock
In August 2016, we entered into a securities purchase agreement, or the Securities Purchase Agreement, with a newly-appointed board member pursuant to which we agreed to issue and sell an aggregate of $700,000 of our common stock in a private placement of shares that have not been registered under the Securities Act of 1933, or the Securities Act, by reason of a specific exemption from the registration provisions of the Securities Act. On August 12, 2016, we sold 118,243 shares of common stock under the Securities Purchase Agreement at a price of $5.92 per share.
Senior Preferred Investors’ Rights Agreement
We and certain of our directors, executive officers and stockholders, including the Satter Investors, are parties to the Senior Preferred IRA. The Senior Preferred IRA contains customary registration rights and related provisions, including customary market standoff provisions.
The Senior Preferred IRA also provides that, for so long as the Satter Investors hold at least 30% of our outstanding common stock, the Satter Investors have the right to nominate 40% of our directors (rounded up to the nearest whole number). If the Satter Investors hold less than 30% (but at least 20%) of our outstanding common stock, they have the right to nominate 30% of our directors (rounded up to the nearest whole number). If the Satter Investors hold less than 20% (but at least 10%) of our outstanding common stock, they have the right to nominate 20% of our directors (rounded up to the nearest whole number). If the Satter Investors hold less than 10% (but at least 2%) of our outstanding common stock, they have the right to nominate 10% of our directors (rounded up to the nearest whole number). For so long as the Satter Investors hold less than 2% of our outstanding common stock, they do not have the contractual right to nominate any representatives to our board of directors. To date the Satter Investors have not exercised their rights to nominate any directors, but they have reserved the right to do so in
92
the future.
Series D Investors’ Rights Agreement
We and certain of our directors, executive officers and stockholders, including the Satter Investors, are or were parties to an investors’ rights agreement, dated June 7, 2011, or the Series D IRA. The Series D IRA contains restrictions on transfer (for compliance with applicable securities laws) and customary registration rights. Upon the closing of our initial public offering in April 2014, all covenants in this agreement, except for the rights relating to the registration of shares under the Securities Act, terminated. The rights of any of our directors, officers or stockholders under the Series D IRA, who became parties to the Senior Preferred IRA, were superseded by the Senior Preferred IRA.
Indemnification of Officers and Directors
We have also entered into indemnification agreements with each of our directors and executive officers. The indemnification agreements and our amended and restated certificate of incorporation and amended and restated bylaws require us to indemnify our directors, executive officers and certain controlling persons to the fullest extent permitted by Delaware law.
Related-Person Transactions Policy
We adopted a written Related Person Transactions Policy that sets forth our policies and procedures regarding the identification, review, consideration, approval and oversight of “related person transactions.”
For purposes of our policy only, a “related-person transaction” is a past, present or future transaction, arrangement or relationship (or any series of similar transactions, arrangements or relationships) in which we and any “related person” are participants, the amount involved exceeds $120,000 and a related person has a direct or indirect material interest. Various transactions are not covered by this policy, including transactions involving compensation for services provided to us as an employee, director, consultant or similar capacity by a related person, equity and debt financing transactions with a related person that are approved by the Board, and other transactions not otherwise required to be disclosed under Item 404 of Regulation S-K. A “related person,” as determined since the beginning of our last fiscal year, is any executive officer, director or nominee to become director, a holder of more than 5% of our common stock, including any immediate family members of such persons. Any related-person transaction may only be consummated if approved or ratified by the affirmative vote of seventy-five percent (75%) of our dis-interested directors then in office in accordance with the policy guidelines set forth below.
Under the policy, where a transaction has been identified as a related-person transaction, management must present information regarding the proposed related-person transaction to our audit committee for review and recommendation for approval to our board of directors. In considering related-person transactions, our audit committee and board of directors take into account the relevant available facts and circumstances including, but not limited to whether the terms of such transaction are no less favorable than terms generally available to an unaffiliated third-party under the same or similar circumstances and the extent of the related person’s interest in the transaction. In the event a director has an interest in the proposed transaction, the director must recuse himself or herself from the deliberations and approval process.
Director Independence
As a company listed on the NASDAQ Global Market we are required under the listing rules of NASDAQ, or the NASDAQ listing rules, to maintain a board comprised of a majority of independent directors as determined affirmatively by our board. In addition, the NASDAQ listing rules require that, subject to specified exceptions, each member of our audit, compensation and nominating and governance committees must be independent. Audit committee members and compensation committee members must also satisfy the independence criteria set forth in Rule 10A-3 and Rule 10C-1, respectively, under the Exchange Act. Under the NASDAQ listing rules, a director will only qualify as an “independent director” if, in the opinion of our board of directors, the director does not have a relationship that would interfere with the exercise of independent judgment in carrying out the responsibilities of a director.
93
Our board of directors has undertaken a review of the independence of our directors and considered whether any director has a material relationship with us that could compromise his or her ability to exercise independent judgment in carrying out his or her responsibilities. Based upon information requested from and provided by each director concerning his or her background, employment and affiliations, including family relationships, our board of directors has determined that none of Drs. Millis and Steer, Ms. Cohen and Messrs. Satter, Bienaimé, Croxford, Godshall, Halperin, Hasnain and Sears, representing ten of our eleven directors, has a relationship that would interfere with the exercise of independent judgment in carrying out the responsibilities of a director and that each of these directors is an “independent director” as that term is defined under the NASDAQ listing rules. Dr. Winters is not considered an independent director because of his position as our Chief Executive Officer.
In making these determinations, our board of directors considered the relationships that each non-employee director has with us and all other facts and circumstances our board of directors deemed relevant in determining their independence, including consulting relationships, family relationships and the beneficial ownership of our capital stock by each non-employee director.
The audit committee of our board of directors selected PricewaterhouseCoopers LLP to be our independent registered public accounting firm for the year ended December 31, 2016.
The following table represents aggregate fees for services provided to us in the fiscal years ended December 31, 2016 and 2015 by PricewaterhouseCoopers LLP, our principal accountant. All fees below were pre-approved by the audit committee:
|
|
|
Fiscal Year Ended
|
||||||
|
|
|
2016
|
|
2015
|
||||
|
Audit Fees
(1)
|
|
$
|
486,895
|
|
|
$
|
617,342
|
|
|
Audit-related Fees
(2)
|
|
—
|
|
|
—
|
|
||
|
Tax Fees
(3)
|
|
—
|
|
|
—
|
|
||
|
All Other Fees
(4)
|
|
1,800
|
|
|
1,800
|
|
||
|
Total Fees
|
$
|
488,695
|
|
$
|
619,142
|
|
||
|
(1)
|
Audit fees consist of fees incurred for professional services by PricewaterhouseCoopers LLP for audit and quarterly reviews of our financial statements, reviews of our registration statements on Form S-1, Form S-3 and Form S-8 and related services that are normally provided in connection with statutory and regulatory filings or engagements.
|
|
(2)
|
We did not engage PricewaterhouseCoopers LLP to perform audit-related services.
|
|
(3)
|
We did not engage PricewaterhouseCoopers LLP to perform tax advisory services.
|
|
(4)
|
Represents annual licensing fees for an accounting database subscription.
|
In connection with the audit of the 2016 financial statements, we entered into an engagement agreement with PricewaterhouseCoopers LLP that sets forth the terms by which PricewaterhouseCoopers LLP will perform audit services for us. Such engagement was approved in advance by our audit committee.
Auditor Independence
In 2016, there were no other professional services provided by PricewaterhouseCoopers LLP that would have required our audit committee to consider their compatibility with maintaining the independence of PricewaterhouseCoopers LLP.
94
Pre-Approval Policy
Our audit committee’s policy is to pre-approve all audit and permissible non-audit services provided by the independent accountants. These services may include audit services, audit-related services, tax services and other services. Our audit committee generally pre-approves particular services or categories of services on a case-by-case basis. The independent registered public accounting firm and management are required to periodically report to our audit committee regarding the extent of services provided by the independent registered public accounting firm in accordance with these pre-approvals, and the fees for the services performed to date. All of the services of PricewaterhouseCoopers LLP for 2016 and 2015 described above were pre-approved by our audit committee.
95
|
Page
|
||
|
1. Financial Statements
. We have filed the following documents as part of this Annual Report:
|
||
|
|
||
|
Report of PricewaterhouseCoopers LLP, Independent Registered Public Accounting Firm
|
||
|
Consolidated Balance Sheets
|
||
|
Consolidated Statements of Operations
|
||
|
Consolidated Statements of Comprehensive Loss
|
||
|
Consolidated Statements of Redeemable Convertible Preferred Stock and Stockholders’ Equity (Deficit)
|
||
|
Consolidated Statements of Cash Flows
|
||
|
Notes to Consolidated Financial Statements
|
||
|
2. Financial Statement Schedules.
None.
|
||
|
3. Exhibits.
The following exhibits are filed herewith or are incorporated by reference to exhibits previously
|
||
|
filed with the U.S. Securities and Exchange Commission.
|
||
96
EXHIBITS
|
|
|
Incorporated by Reference
|
|||||||||
|
Exhibit
Number
|
Exhibit Title
|
Form
|
File No.
|
Exhibit
|
Filing Date
|
||||||
|
3.1
|
Amended and Restated Certificate of Incorporation of the Registrant.
|
S-1/A
|
333-191711
|
3.2
|
|
November 6, 2013
|
|||||
|
3.2
|
Second Amended and Restated Bylaws of the Registrant.
|
S-1/A
|
333-191711
|
3.4
|
|
November 6, 2013
|
|||||
|
4.1
|
Specimen Common Stock Certificate of the Registrant.
|
S-1/A
|
333-191711
|
4.1
|
|
November 6, 2013
|
|||||
|
4.2
|
Fourth Amended and Restated Investors’ Rights Agreement, dated August 28, 2013.
|
S-1
|
333-191711
|
4.2
|
|
October 11, 2013
|
|||||
|
4.3
|
Investors’ Rights Agreement, dated February 23, 2012.
|
S-1
|
333-191711
|
4.3
|
|
October 11, 2013
|
|||||
|
4.4
|
Amended and Restated Investors’ Rights Agreement, dated June 7, 2011.
|
S-1
|
333-191711
|
4.4
|
|
October 11, 2013
|
|||||
|
10.1+
|
Form of Indemnification Agreement between the Registrant and its directors and officers.
|
S-1/A
|
333-191711
|
10.1
|
|
November 6, 2013
|
|||||
|
10.2+
|
Employment Letter Agreement between the Registrant and Duane Nash, dated October 30, 2013.
|
S-1/A
|
333-191711
|
10.2
|
|
November 6, 2013
|
|||||
|
10.3+
|
Employment Letter Agreement between the Registrant and Robert A. Ashley, dated October 30, 2013.
|
S-1/A
|
333-191711
|
10.3
|
|
November 6, 2013
|
|||||
|
10.4+
|
Employment Letter Agreement between the Registrant and Terence E. Winters, dated October 31, 2013.
|
S-1/A
|
333-191711
|
10.4
|
|
November 6, 2013
|
|||||
|
10.5+
|
Employment Letter Agreement between the Registrant and Michael V. Swanson, dated August 30, 2013.
|
S-1/A
|
333-191711
|
10.5
|
|
November 6, 2013
|
|||||
|
10.6+
|
Employment Letter Agreement between the Registrant and Andrew Henry, dated October 30, 2013.
|
S-1/A
|
333-191711
|
10.6
|
|
April 3, 2014
|
|||||
|
10.7+
|
Employment Letter Agreement between the Registrant and Aron P. Stern, dated October 30, 2013.
|
S-1/A
|
333-191711
|
10.7
|
|
March 11, 2014
|
|||||
|
10.8+
|
Employment Letter Agreement between the Registrant and Andrea Loewen, dated October 30, 2013.
|
S-1/A
|
333-191711
|
10.8
|
|
April 3, 2014
|
|||||
|
10.9+
|
Employment Letter Agreement between the Registrant and Richard Murawski, dated October 30, 2013.
|
S-1/A
|
333-191711
|
10.9
|
|
March 11, 2014
|
|||||
|
10.10+
|
Employment Letter Agreement between the Registrant and John Dunn, dated March 5, 2015.
|
10-K
|
001-36201
|
10.10
|
|
March 20, 2015
|
|||||
|
10.11+
|
2012 Stock Option Plan and form of agreements.
|
S-1
|
333-191711
|
10.6
|
|
October 11, 2013
|
|||||
|
10.12+
|
2014 Equity Incentive Plan and form of agreements.
|
S-1/A
|
333-191711
|
10.11
|
|
March 11, 2014
|
|||||
|
10.13+
|
Global Stock Option Agreement under 2014 Equity Incentive Plan.
|
10-K
|
001-36201
|
10.13
|
|
March 20, 2015
|
|||||
|
10.14+
|
Executive Incentive Compensation Plan.
|
S-1
|
333-191711
|
10.8
|
|
October 11, 2013
|
|||||
|
10.15+
|
Form Change of Control and Severance Agreement.
|
S-1
|
333-191711
|
10.9
|
|
October 11, 2013
|
|||||
|
10.16+
|
Non-Employee Director Compensation Policy.
|
S-1/A
|
333-191711
|
10.10
|
|
November 15, 2013
|
|||||
|
10.17
|
Standard Industrial/Commercial Multi-Tenant Lease and Addendum between DermTech International and R.E. Hazard Contracting Company, dated April 5, 2001, as amended.
|
S-1
|
333-191711
|
10.11
|
|
October 11, 2013
|
|||||
97
|
10.18
|
Standard Office Lease between Arden Realty Limited Partnership and the Registrant, dated May 7, 2013.
|
S-1
|
333-191711
|
10.12
|
|
October 11, 2013
|
|||||
|
10.19
|
Amended Lease between BRA CA Office Owner LLC and the Company, dated August 23, 2016
|
8-K
|
001-36201
|
10.1
|
|
August 29, 2016
|
|||||
|
10.20+
|
Outside Director Compensation Policy
|
8-K
|
001-36201
|
10.1
|
|
May 27, 2016
|
|||||
|
21.1*
|
List of subsidiaries of the Registrant.
|
||||||||||
|
23.1*
|
Consent of PricewaterhouseCoopers LLP, Independent Registered Public Accounting Firm.
|
||||||||||
|
24.1*
|
Power of Attorney (included on the signature page).
|
||||||||||
|
31.1*
|
Certification of Principal Executive Officer pursuant to Rule 13a-14(a) or Rule 15d-14(a) of the Securities Exchange Act of 1934, as adopted pursuant to Section 302 of the Sarbanes-Oxley Act of 2002.
|
||||||||||
|
31.2*
|
Certification of Principal Financial Officer pursuant to Rule 13a-14(a) or Rule 15d-14(a) of the Securities Exchange Act of 1934, as adopted pursuant to Section 302 of the Sarbanes-Oxley Act of 2002.
|
||||||||||
|
32.1**
|
Certification of Principal Executive Officer pursuant to 18 U.S.C. Section 1350, as adopted pursuant to Section 906 of the Sarbanes-Oxley Act of 2002.
|
||||||||||
|
32.2**
|
Certification of Principal Financial Officer pursuant to 18 U.S.C. Section 1350, as adopted pursuant to Section 906 of the Sarbanes-Oxley Act of 2002.
|
||||||||||
|
101.INS*
|
XBRL Instance Document.
|
||||||||||
|
101.SCH*
|
XBRL Taxonomy Extension Schema Document.
|
||||||||||
|
101.CAL*
|
XBRL Taxonomy Extension Calculation Linkbase Document.
|
||||||||||
|
101.DEF*
|
XBRL Taxonomy Extension Definition Linkbase Database.
|
||||||||||
|
101.LAB*
|
XBRL Taxonomy Extension Label Linkbase Document.
|
||||||||||
|
101.PRE*
|
XBRL Taxonomy Extension Presentation Linkbase Document.
|
||||||||||
|
+
|
Indicates a management contract or compensatory plan or arrangement.
|
|
*
|
Filed herewith.
|
|
**
|
In accordance with Item 601(b)(32)(ii) of Regulation S-K and SEC Release No. 33-8238 and 34-47986, Final Rule: Management’s Reports on Internal Control Over Financial Reporting and Certification of Disclosure in Exchange Act Periodic Reports, the certifications furnished in Exhibits 32.1 and 32.2 hereto are deemed to accompany this Form 10-K and will not be deemed “filed” for purposes of Section 18 of the Exchange Act. Such certifications will not be deemed to be incorporated by reference into any filings under the Securities Act or the Exchange Act, except to the extent that the registrant specifically incorporates it by reference.
|
98
VITAL THERAPIES, INC.
INDEX TO CONSOLIDATED FINANCIAL STATEMENTS
|
|
Page
|
|
F-2
|
|
|
F-3
|
|
|
F-4
|
|
|
F-5
|
|
|
F-6
|
|
|
F-7
|
|
|
F-8
|
|
F- 1
REPORT OF INDEPENDENT REGISTERED PUBLIC ACCOUNTING FIRM
To the Board of Directors and Stockholders of
Vital Therapies, Inc.
In our opinion, the accompanying consolidated balance sheets and the related consolidated statements of operations, of comprehensive loss, of redeemable convertible preferred stock and stockholders’ equity (deficit) and of cash flows present fairly, in all material respects, the financial position of Vital Therapies, Inc. and its subsidiaries at
December 31, 2016
and
2015
, and the results of their operations and their cash flows for each of the three years in the period ended
December 31, 2016
in conformity with accounting principles generally accepted in the United States of America. These financial statements are the responsibility of the Company’s management. Our responsibility is to express an opinion on these financial statements based on our audits. We conducted our audits of these financial statements in accordance with the standards of the Public Company Accounting Oversight Board (United States). Those standards require that we plan and perform the audit to obtain reasonable assurance about whether the financial statements are free of material misstatement. An audit includes examining, on a test basis, evidence supporting the amounts and disclosures in the financial statements, assessing the accounting principles used and significant estimates made by management, and evaluating the overall financial statement presentation. We believe that our audits provide a reasonable basis for our opinion.
/s/ PricewaterhouseCoopers LLP
San Diego, California
March 7, 2017
F- 2
VITAL THERAPIES, INC.
(In thousands, except share and per share amounts)
|
|
December 31,
|
||||||
|
|
2016
|
2015
|
|||||
|
Assets
|
|||||||
|
Current assets:
|
|||||||
|
Cash and cash equivalents
|
$
|
59,991
|
|
$
|
83,416
|
|
|
|
Restricted cash
|
—
|
|
533
|
|
|||
|
Other current assets and prepaid expenses
|
1,472
|
|
1,139
|
|
|||
|
Total current assets
|
61,463
|
|
85,088
|
|
|||
|
Property and equipment, net
|
2,505
|
|
3,809
|
|
|||
|
Other assets
|
58
|
|
184
|
|
|||
|
Total assets
|
$
|
64,026
|
|
$
|
89,081
|
|
|
|
Liabilities and Stockholders’ Equity
|
|||||||
|
Current liabilities:
|
|||||||
|
Accounts payable
|
$
|
780
|
|
$
|
1,221
|
|
|
|
Accrued expenses
|
4,656
|
|
5,271
|
|
|||
|
Other current liabilities
|
44
|
|
163
|
|
|||
|
Total current liabilities
|
5,480
|
|
6,655
|
|
|||
|
Long-term liabilities
|
100
|
|
101
|
|
|||
|
Commitments and contingencies (note 4)
|
|
|
|||||
|
Stockholders’ equity:
|
|||||||
|
Preferred stock, $0.0001 par value; 20,000,000 authorized and no shares issued or outstanding at December 31, 2016 and 2015
|
—
|
|
—
|
|
|||
|
Common stock, $0.0001 par value; 130,000,000 shares authorized at December 31, 2016 and 2015; 32,143,475 and 30,473,083 shares issued and outstanding at December 31, 2016 and 2015, respectively
|
3
|
|
3
|
|
|||
|
Additional paid-in capital
|
302,185
|
|
285,098
|
|
|||
|
Accumulated other comprehensive income
|
83
|
|
80
|
|
|||
|
Accumulated deficit
|
(243,825
|
)
|
(202,856
|
)
|
|||
|
Total stockholders’ equity
|
58,446
|
|
82,325
|
|
|||
|
Total liabilities and stockholders’ equity
|
$
|
64,026
|
|
$
|
89,081
|
|
|
The accompanying notes are an integral part of these financial statements.
F- 3
VITAL THERAPIES, INC.
(In thousands, except share and per share amounts)
|
|
Years Ended December 31,
|
||||||||||
|
|
2016
|
2015
|
2014
|
||||||||
|
Operating expenses:
|
|||||||||||
|
Research and development
|
$
|
30,046
|
|
$
|
39,773
|
|
$
|
39,479
|
|
||
|
General and administrative
|
11,220
|
|
12,347
|
|
10,863
|
|
|||||
|
Total operating expenses
|
41,266
|
|
52,120
|
|
50,342
|
|
|||||
|
Loss from operations
|
(41,266
|
)
|
(52,120
|
)
|
(50,342
|
)
|
|||||
|
Other income:
|
|||||||||||
|
Interest income
|
284
|
|
58
|
|
19
|
|
|||||
|
Other income (expense), net
|
13
|
|
39
|
|
56
|
|
|||||
|
Revaluation of future purchase rights liabilities
|
—
|
|
—
|
|
2,600
|
|
|||||
|
Total other income
|
297
|
|
97
|
|
2,675
|
|
|||||
|
Net loss
|
(40,969
|
)
|
(52,023
|
)
|
(47,667
|
)
|
|||||
|
Amortization of deemed dividend
|
—
|
|
—
|
|
(4,744
|
)
|
|||||
|
Accretion to redemption value of redeemable convertible preferred stock
|
—
|
|
—
|
|
(4,410
|
)
|
|||||
|
Net loss attributable to common stockholders
|
$
|
(40,969
|
)
|
$
|
(52,023
|
)
|
$
|
(56,821
|
)
|
||
|
Net loss per share attributable to common stockholders, basic and diluted
|
$
|
(1.31
|
)
|
$
|
(2.07
|
)
|
$
|
(3.54
|
)
|
||
|
Weighted-average common shares outstanding, basic and diluted
|
31,387,579
|
|
25,152,948
|
|
16,054,452
|
|
|||||
The accompanying notes are an integral part of these financial statements.
F- 4
VITAL THERAPIES, INC.
Consolidated Statements of Comprehensive Loss
(In thousands)
|
|
Years Ended
December 31, |
||||||||||
|
|
2016
|
2015
|
2014
|
||||||||
|
Net loss
|
$
|
(40,969
|
)
|
$
|
(52,023
|
)
|
$
|
(47,667
|
)
|
||
|
Other comprehensive income (loss):
|
|||||||||||
|
Unrealized gains on available-for-sale cash equivalents
|
4
|
|
—
|
|
—
|
|
|||||
|
Foreign currency translation
|
(1
|
)
|
(9
|
)
|
(7
|
)
|
|||||
|
Total comprehensive loss
|
$
|
(40,966
|
)
|
$
|
(52,032
|
)
|
$
|
(47,674
|
)
|
||
The accompanying notes are an integral part of these financial statements.
F- 5
VITAL THERAPIES, INC.
Consolidated Statements of Redeemable Convertible Preferred Stock and Stockholders’ Equity (Deficit)
(In thousands, except shares)
|
|
Junior
Convertible and Senior Redeemable Convertible Preferred Stock |
Common Stock
|
Additional
Paid-In Capital |
Accumulated
Other Comprehensive Income (Loss) |
Accumulated
Deficit |
Total
Stockholders’ Equity (Deficit) |
|||||||||||||||||||||||
|
|
Shares
|
Amount
|
Shares
|
Amount
|
|||||||||||||||||||||||||
|
Balance at January 1, 2014
|
13,713,407
|
|
$
|
83,475
|
|
606,238
|
|
$
|
—
|
|
$
|
58,413
|
|
$
|
96
|
|
$
|
(103,166
|
)
|
$
|
(44,657
|
)
|
|||||||
|
Net loss
|
—
|
|
—
|
|
—
|
|
—
|
|
—
|
|
—
|
|
(47,667
|
)
|
(47,667
|
)
|
|||||||||||||
|
Other comprehensive loss
|
—
|
|
—
|
|
—
|
|
—
|
|
—
|
|
(7
|
)
|
—
|
|
(7
|
)
|
|||||||||||||
|
Exercise of stock options and change in stock option early exercise repurchase liability
|
—
|
|
—
|
|
142,041
|
|
—
|
|
956
|
|
—
|
|
—
|
|
956
|
|
|||||||||||||
|
Stock-based compensation
|
—
|
|
—
|
|
—
|
|
—
|
|
2,510
|
|
—
|
|
—
|
|
2,510
|
|
|||||||||||||
|
Private placement senior redeemable convertible preferred stock — from January to March 2014
|
2,296,016
|
|
18,167
|
|
—
|
|
—
|
|
—
|
|
—
|
|
—
|
|
—
|
|
|||||||||||||
|
Amortization of deemed dividend
|
—
|
|
4,744
|
|
—
|
|
—
|
|
(4,744
|
)
|
—
|
|
—
|
|
(4,744
|
)
|
|||||||||||||
|
Accretion to redemption value of redeemable convertible preferred stock
|
—
|
|
4,410
|
|
—
|
|
—
|
|
(4,410
|
)
|
—
|
|
—
|
|
(4,410
|
)
|
|||||||||||||
|
Initial public offering, net of issuance costs
|
—
|
|
—
|
|
5,175,000
|
|
1
|
|
51,932
|
|
—
|
|
—
|
|
51,933
|
|
|||||||||||||
|
Conversion of redeemable convertible preferred stock to common stock
|
(16,009,423
|
)
|
(110,796
|
)
|
16,009,423
|
|
1
|
|
110,795
|
|
—
|
|
—
|
|
110,796
|
|
|||||||||||||
|
Adjustment for fractional shares
|
—
|
|
—
|
|
84
|
|
—
|
|
—
|
|
—
|
|
—
|
|
—
|
|
|||||||||||||
|
Issuance of common stock, net of issuance costs
|
—
|
|
—
|
|
2,050,000
|
|
—
|
|
32,853
|
|
—
|
|
—
|
|
32,853
|
|
|||||||||||||
|
Balance at December 31, 2014
|
—
|
|
—
|
|
23,982,786
|
|
2
|
|
248,305
|
|
89
|
|
(150,833
|
)
|
97,563
|
|
|||||||||||||
|
Net loss
|
—
|
|
—
|
|
—
|
|
—
|
|
—
|
|
—
|
|
(52,023
|
)
|
(52,023
|
)
|
|||||||||||||
|
Other comprehensive loss
|
—
|
|
—
|
|
—
|
|
—
|
|
—
|
|
(9
|
)
|
—
|
|
(9
|
)
|
|||||||||||||
|
Exercise of stock options and change in stock option early exercise repurchase liability
|
—
|
|
—
|
|
217,570
|
|
—
|
|
615
|
|
—
|
|
—
|
|
615
|
|
|||||||||||||
|
Stock-based compensation
|
—
|
|
—
|
|
—
|
|
—
|
|
4,029
|
|
—
|
|
—
|
|
4,029
|
|
|||||||||||||
|
Issuance of common stock, net of issuance costs
|
—
|
|
—
|
|
6,272,727
|
|
1
|
|
32,149
|
|
—
|
|
—
|
|
32,150
|
|
|||||||||||||
|
Balance at December 31, 2015
|
—
|
|
—
|
|
30,473,083
|
|
3
|
|
285,098
|
|
80
|
|
(202,856
|
)
|
82,325
|
|
|||||||||||||
|
Net loss
|
—
|
|
—
|
|
—
|
|
—
|
|
—
|
|
—
|
|
(40,969
|
)
|
(40,969
|
)
|
|||||||||||||
|
Other comprehensive income
|
—
|
|
—
|
|
—
|
|
—
|
|
—
|
|
3
|
|
—
|
|
3
|
|
|||||||||||||
|
Exercise of stock options and change in stock option early exercise repurchase liability
|
—
|
|
—
|
|
8,098
|
|
—
|
|
54
|
|
—
|
|
—
|
|
54
|
|
|||||||||||||
|
Stock-based compensation
|
—
|
|
—
|
|
—
|
|
—
|
|
4,678
|
|
—
|
|
—
|
|
4,678
|
|
|||||||||||||
|
Issuance of common stock, net of issuance costs
|
—
|
|
—
|
|
1,662,294
|
|
—
|
|
12,355
|
|
—
|
|
—
|
|
12,355
|
|
|||||||||||||
|
Balance at December 31, 2016
|
—
|
|
$
|
—
|
|
32,143,475
|
|
$
|
3
|
|
$
|
302,185
|
|
$
|
83
|
|
$
|
(243,825
|
)
|
$
|
58,446
|
|
|||||||
The accompanying notes are an integral part of these financial statements.
F- 6
VITAL THERAPIES, INC.
(In thousands)
|
|
Years Ended December 31,
|
||||||||||
|
|
2016
|
2015
|
2014
|
||||||||
|
Cash flows from operating activities:
|
|||||||||||
|
Net loss
|
$
|
(40,969
|
)
|
$
|
(52,023
|
)
|
$
|
(47,667
|
)
|
||
|
Adjustments to reconcile net loss to net cash used in operating activities:
|
|||||||||||
|
Depreciation and amortization
|
1,808
|
|
1,328
|
|
1,087
|
|
|||||
|
Stock-based compensation
|
4,678
|
|
4,029
|
|
2,510
|
|
|||||
|
Revaluation of future purchase rights liabilities
|
—
|
|
—
|
|
(2,600
|
)
|
|||||
|
Other
|
85
|
|
—
|
|
(7
|
)
|
|||||
|
Changes in operating assets and liabilities:
|
|||||||||||
|
Other assets and prepaid expenses
|
(232
|
)
|
143
|
|
279
|
|
|||||
|
Accounts payable
|
(459
|
)
|
281
|
|
46
|
|
|||||
|
Accrued expenses
|
(587
|
)
|
(3,584
|
)
|
5,396
|
|
|||||
|
Other liabilities
|
(98
|
)
|
(126
|
)
|
131
|
|
|||||
|
Net cash used in operating activities
|
(35,774
|
)
|
(49,952
|
)
|
(40,825
|
)
|
|||||
|
Cash flows from investing activities:
|
|||||||||||
|
Purchases of property and equipment
|
(556
|
)
|
(2,340
|
)
|
(1,409
|
)
|
|||||
|
Change in restricted cash
|
533
|
|
1,059
|
|
(631
|
)
|
|||||
|
Proceeds from sale of equipment
|
2
|
|
—
|
|
—
|
|
|||||
|
Net cash used in investing activities
|
(21
|
)
|
(1,281
|
)
|
(2,040
|
)
|
|||||
|
Cash flows from financing activities:
|
|||||||||||
|
Proceeds from issuance of common stock, net of issuance costs
|
12,355
|
|
32,189
|
|
87,899
|
|
|||||
|
Proceeds from issuance of preferred stock, net of issuance costs
|
—
|
|
—
|
|
18,167
|
|
|||||
|
Proceeds from exercise of stock options
|
32
|
|
515
|
|
852
|
|
|||||
|
Deferred financing costs
|
(13
|
)
|
(283
|
)
|
—
|
|
|||||
|
Net cash provided by financing activities
|
12,374
|
|
32,421
|
|
106,918
|
|
|||||
|
Effect of exchange rate changes on cash and cash equivalents
|
(4
|
)
|
(10
|
)
|
(1
|
)
|
|||||
|
Net change in cash and cash equivalents
|
(23,425
|
)
|
(18,822
|
)
|
64,052
|
|
|||||
|
Cash and cash equivalents, beginning of period
|
83,416
|
|
102,238
|
|
38,186
|
|
|||||
|
Cash and cash equivalents, end of period
|
$
|
59,991
|
|
$
|
83,416
|
|
$
|
102,238
|
|
||
|
Supplemental disclosure of non-cash investing and financing activities:
|
|||||||||||
|
Purchase of property and equipment included in liabilities
|
$
|
41
|
|
$
|
9
|
|
$
|
277
|
|
||
|
Change in stock option early exercise repurchase liability
|
$
|
23
|
|
$
|
108
|
|
$
|
104
|
|
||
|
Stock offering costs included in liabilities
|
$
|
—
|
|
$
|
39
|
|
$
|
—
|
|
||
|
Conversion of redeemable convertible preferred stock to common stock
|
$
|
—
|
|
$
|
—
|
|
$
|
110,796
|
|
||
|
Accretion to redemption value of redeemable convertible preferred stock
|
$
|
—
|
|
$
|
—
|
|
$
|
4,410
|
|
||
|
Amortization of deemed dividend
|
$
|
—
|
|
$
|
—
|
|
$
|
4,744
|
|
||
The accompanying notes are an integral part of these financial statements.
F- 7
Notes to Consolidated Financial Statements
1. Description of Business and Basis of Financial Statements
Description of Business
We are a biotherapeutic company focused on developing a cell-based therapy targeting the treatment of liver failure. Our product candidate, the ELAD
®
System, or ELAD, is an extracorporeal human allogeneic cellular liver therapy designed to allow the patient’s own liver to regenerate to a healthy state, or to stabilize the patient until transplant. Since inception, we have devoted essentially all of our efforts to product development, clinical testing and pilot manufacturing and have not recognized revenues from our planned principal operations. In August 2015, we reported that our VTI-208 phase 3 clinical trial of ELAD in alcohol-induced liver decompensation, or AILD, failed to reach its primary or secondary endpoints, although medically pertinent pre-specified subsets based on age and disease severity did show trends toward efficacy. Considering the results of the VTI-208 clinical trial and in an effort to focus our personnel and financial resources, we also discontinued our VTI-210 and VTI-212 clinical trials. We are currently enrolling subjects in our new phase 3 clinical trial of ELAD, known as VTL-308, in severe acute alcoholic hepatitis, which is a subset of AILD, based on our analysis of the results of the VTI-208 clinical trial. Our business, operating results, financial condition and growth prospects are subject to significant risks and uncertainties including the failure of our clinical trial to meet its endpoint, failure to obtain regulatory approval to commercialize ELAD and failure to secure additional funding to complete the clinical testing, development and commercialization of ELAD.
We have a history of incurring losses and negative cash flows from operations and have an accumulated deficit of
$243.8 million
through December 31, 2016. Based on our current plans, we believe that our existing cash and cash equivalents of
$60.0 million
as of December 31, 2016 will be sufficient to fund our operations through the first quarter of 2018. We anticipate needing to raise additional funds prior to releasing topline data for the VTL-308 clinical trial, which we currently expect around mid-2018. We may seek to obtain additional funding through a combination of other equity or debt financings, government or other third-party financing, marketing and distribution arrangements or other collaborations, strategic alliances and licensing arrangements. If we are not successful in raising additional funds, we expect to significantly reduce our expenditures and focus our existing resources on obtaining data from our VTL-308. The timing and amount of our actual expenditures will be based on many factors, including, but not limited to, the timing of and enrollment in clinical trials and any unforeseen cash needs. This discussion contains forward-looking statements within the meaning of Section 27A of the Securities Act of 1933, as amended, and Section 21E of the Securities and Exchange Act of 1934, as amended, that are based on beliefs and assumptions currently available to management, and that involve risks and uncertainties and our actual results could differ materially.
Basis of Presentation and Consolidation
The accompanying consolidated financial statements have been prepared in conformity with United States generally accepted accounting principles, or GAAP, and include the accounts of Vital Therapies, Inc. and its wholly-owned subsidiaries located in the United Kingdom and China, both of which are currently inactive. All intercompany accounts and transactions have been eliminated in consolidation. We manage our operations as a single reportable segment for the purposes of assessing performance and making operating decisions.
2. Summary of Significant Accounting Policies
Use of Estimates
The preparation of financial statements in conformity with GAAP requires us to make certain estimates and assumptions that affect the amounts reported in the consolidated financial statements and accompanying notes. Actual results could differ materially from those estimates and assumptions.
Cash and Cash Equivalents
Cash and cash equivalents consist of cash and highly-liquid investments with original maturities of
three
months or less when acquired. Cash equivalents are stated at cost unless they are securities, in which case they are recorded at fair value, which approximates original cost.
Restricted Cash
Restricted cash relates to amounts reserved for various clinical trial obligations and lease arrangements.
F- 8
Fair Value of Financial Instruments
Fair value is defined as the price that would be received to sell an asset or be paid to transfer a liability in an orderly transaction between market participants on the measurement date. Accounting guidance establishes a fair value hierarchy that requires an entity to maximize the use of observable inputs and minimize the use of unobservable inputs when measuring fair value. The standard describes three levels of inputs that may be used to measure fair value:
Level 1—Quoted prices in active markets for identical assets or liabilities. Our Level 1 assets consisted of money market funds for the periods presented. We had no Level 1 liabilities for any period presented.
Level 2—Observable inputs other than Level 1 prices, such as quoted prices for similar assets or liabilities, quoted prices in markets with insufficient volume or infrequent transactions (less active markets), or model-derived valuations in which all significant inputs are observable or can be derived principally from or corroborated with observable market data for substantially the full term of the assets or liabilities. We had no Level 2 assets or liabilities for the periods presented.
Level 3—Unobservable inputs to the valuation methodology that are significant to the measurement of the fair value of assets or liabilities. We had no Level 3 assets or liabilities for the periods presented.
Any transfers into and out of levels within the fair value hierarchy will be recognized at the end of the reporting period in which the actual event or change in circumstances that caused the transfer occurs.
The carrying value of cash and cash equivalents, restricted cash, other current assets and prepaid expenses, accounts payable and accrued expenses approximate fair value due to the short period of time to maturity.
Property and Equipment
Property and equipment are recorded at cost and depreciated using the straight-line method over the estimated useful lives of the assets (generally
three
to
five
years). Leasehold improvements are stated at cost and depreciated on a straight-line basis over the lesser of the remaining term of the related lease or the estimated useful lives of the assets. Construction in progress is not depreciated until the underlying asset is available to be placed in service. Repairs and maintenance costs are charged to expense as incurred.
Impairment of Long-lived Assets
Long-lived assets consist primarily of property and equipment. An impairment loss is recorded if and when events and circumstances indicate that assets might be impaired and the undiscounted cash flows estimated to be generated by those assets are less than the carrying amount of those assets. We have not recognized any impairment losses through
December 31, 2016
.
Clinical Trial Accruals
As part of the process of preparing our financial statements, we are required to estimate our accrued expenses. Our clinical trial accrual process seeks to account for expenses resulting from our obligations under agreements with clinical sites, clinical research organizations, or CROs, vendors, and consultants in connection with conducting our clinical trials. We account for these expenses according to the progress of each trial as measured by subject enrollment, the timing of various aspects of the trial and if available, information from our service providers. During the course of a clinical trial, we adjust our rate of clinical expense recognition if actual results differ from our estimates. Although we do not expect our estimates to be materially different from amounts actually incurred, our understanding of the status and timing of services performed relative to the actual status and timing of services performed may vary and could result in us reporting amounts that are over or understated for a particular period and adjustments to our research and development expenses may be necessary in future periods.
Research and Development
Research and development costs consist primarily of employee-related expenses, costs for clinical trials, contractors, and CROs related to the development of the ELAD, costs related to our investigation of the mechanism of action of the ELAD, the cost of acquiring and manufacturing clinical trial materials, and expenses associated with obtaining regulatory approvals. All research and development costs are expensed as incurred.
F- 9
Stock-Based Compensation
We measure and recognize compensation expense for all stock-based compensation for employees and directors based on the estimated fair value at the date of grant, net of an estimated forfeiture rate, and to consultants based on the ongoing estimated fair value. Currently, our stock-based awards consist only of stock options; however, future grants under our equity compensation plan may also consist of shares of restricted stock, restricted stock units, stock appreciation rights, performance awards and performance units. We estimate the fair value of stock options granted using the Black-Scholes-Merton, or BSM, option pricing model, which requires the use of estimates.
We recognize stock-based compensation cost for employees and directors on a straight-line basis over the requisite service period of the award. For performance-based stock options, we record share-based compensation expense only when the performance-based milestone is deemed probable of achievement. We utilize both quantitative and qualitative criteria to judge whether milestones are probable of achievement.
Stock-based compensation expense is recognized only for those awards that are ultimately expected to vest. Through 2016, we have estimated forfeitures based on an analysis of our historical employee turnover. We revised the forfeiture estimate, if necessary, in subsequent periods if actual forfeitures differed from those estimates. Changes in forfeiture estimates, which have not been material to date, impact compensation cost in the period in which the change in estimate occurs. In 2017, we expect to change our method for recording forfeitures. See "Recently Issued and/or Adopted Accounting Pronouncements" below.
The fair value of options granted to consultants is estimated using the BSM option pricing model and is re-measured at each reporting date with changes in fair value recognized as expense in the consolidated statements of operations.
The BSM option pricing model requires the input of highly subjective assumptions, including the risk-free interest rate, the expected dividend yield of our common stock, the expected volatility of the price of our common stock, and the expected term of the option. These estimates involve inherent uncertainties and the application of management’s judgment. If factors change and different assumptions are used, our stock-based compensation expense could be materially different in the future. These assumptions are estimated as follows:
Risk-free Interest Rate
We base the risk-free interest rate assumption on zero-coupon U.S. treasury instruments appropriate for the expected term of the stock option grants.
Expected Dividend Yield
We base the expected dividend yield assumption on the fact that we have never paid cash dividends and have no present intention to pay cash dividends. Consequently, we used an expected dividend yield of
zero
.
Expected Volatility
The expected stock price volatility for our common stock is estimated based on volatilities of a peer group of similar publicly-traded, biotechnology companies by taking the average historic price volatility for the peers for a period equivalent to the expected term of the stock option grants. We do not use our average historic price volatility as we have only been a publicly-traded company since April 2014.
Expected Term
The expected term represents the period of time that options are expected to be outstanding. As we do not have sufficient historical experience for determining the expected term of the stock option awards granted, we have determined the expected life assumption for employee and director stock options using either the simplified method, which is an average of the contractual term of the option and its ordinary vesting period, or the comparable average expected term utilizing those companies in the peer group as noted above. For consultant stock options, we estimate the expected term based on the period we expect each consultant to provide services to us.
F- 10
Common Stock Valuation
Due to the absence of a public market trading our common stock prior to the completion of our initial public offering, or IPO, in April 2014, it was necessary for us to estimate the fair value of the common stock underlying our stock-based awards when performing fair value calculations using the BSM option pricing model. The fair value of the common stock underlying our stock-based awards was assessed by our board of directors using methodologies, approaches and assumptions consistent with the American Institute of Certified Public Accountants Audit and Accounting Practice Aid Series:
Valuation of Privately Held Company Equity Securities Issued as Compensation
. Subsequent to our IPO, the fair value of our common stock has been based on the grant date closing market price of our common stock. All options to purchase shares of our common stock have been granted with an exercise price per share no less than the fair value per share of our common stock underlying those options on the date of grant.
Leases
We lease all of our office space and enter into various other operating lease agreements in conducting our business. At the inception of each lease, we evaluate the lease agreement to determine whether the lease is an operating or capital lease. Some of our lease agreements may contain renewal options, tenant improvement allowances, rent holidays or rent escalation clauses. When such items are included in a lease agreement, we record a deferred rent asset or liability equal to the difference between the rent expense and future minimum lease payments due. The rent expense related to operating leases is recognized on a straight-line basis in the statements of operations over the term of each lease. In cases where our lessor grants us leasehold improvement allowances that reduce our rent expense, we capitalize the improvements as incurred and recognize deferred rent, which is amortized over the shorter of the lease term or the expected useful life of the improvements.
Comprehensive Loss
Comprehensive loss is defined as the change in equity during a period from transactions and other events and circumstances from non-owner sources. Accumulated other comprehensive income has been reflected as a separate component of stockholders’ equity in the accompanying consolidated balance sheets.
Foreign Currency Translation and Transactions
The functional currency of each of our subsidiaries in the United Kingdom and China is the local currency. Assets and liabilities of the subsidiaries are translated at the rate of exchange at the balance sheet date. Expenses are translated at the average exchange rates in effect during the reporting period. Gains and losses resulting from foreign currency translation are included in accumulated other comprehensive income in the accompanying consolidated balance sheets. Gains and losses resulting from foreign currency transactions are included in the consolidated statements of operations, which to date have not been significant.
Income Taxes
We account for income taxes under the asset and liability method, which requires the recognition of deferred tax assets and liabilities for the expected future tax consequences of events that have been included in the consolidated financial statements. Under this method, deferred tax assets and liabilities are determined on the basis of the differences between the financial statements and tax basis of assets and liabilities using enacted tax rates in effect for the year in which the differences are expected to reverse. The effect of a change in tax rates on deferred tax assets and liabilities is recognized in income in the period that includes the enactment date.
We recognize net deferred tax assets to the extent we believe these assets are more likely than not to be realized. In making such a determination, management considers all available positive and negative evidence, including future reversals of existing taxable temporary differences, projected future taxable income, tax-planning strategies, and results of recent operations. If management determines that we would be able to realize our deferred tax assets in the future in excess of their net recorded amount, management would make an adjustment to the deferred tax asset valuation allowance, which would reduce the provision for income taxes. As of
December 31, 2016
and
2015
, we maintained a full valuation allowance against our entire balance of deferred tax assets.
F- 11
We record uncertain tax positions on the basis of a two-step process whereby (1) management determines whether it is more likely than not that the tax positions will be sustained on the basis of the technical merits of the position and (2) for those tax positions that meet the more-likely-than-not recognition threshold, management recognizes the largest amount of tax benefit that is more than 50 percent likely to be realized upon ultimate settlement with the related tax authority. We recognize interest and penalties related to unrecognized tax benefits, if any, within income tax expense, and any accrued interest and penalties are included within the related tax liability line.
Net Loss Per Share
Basic net loss per share attributable to common stockholders is calculated by dividing the net loss attributable to common stockholders by the weighted-average number of common shares outstanding for the period, without consideration for common stock equivalents. Excluded from the weighted-average number of shares outstanding are shares that were issued upon the early exercise of stock options and were subject to future vesting, which was a total of
11,512
and
24,444
shares as of
December 31, 2015
and
2014
, respectively. There were
no
outstanding shares subject to future vesting at
December 31, 2016
. Diluted net loss per share attributable to common stockholders is computed by dividing the net loss attributable to common stockholders by the weighted-average number of common shares outstanding for the period determined using the treasury-stock method. Common stock equivalents are comprised of options outstanding under our stock option plan and warrants for the purchase of common stock. For all periods presented, there is no difference in the number of shares used to calculate basic and diluted shares outstanding due to our net loss position.
Potentially dilutive securities not included in the calculation of diluted net loss per share attributable to common stockholders because to do so would be anti-dilutive are as follows:
|
|
As of December 31,
|
|||||||
|
|
2016
|
2015
|
2014
|
|||||
|
Options to purchase common stock
|
4,841,274
|
|
3,716,520
|
|
3,210,693
|
|
||
|
Warrants to purchase common stock
|
240,620
|
|
250,646
|
|
250,646
|
|
||
Recently Issued and/or Adopted Accounting Pronouncements
In February 2016, the Financial Accounting Standards Board, or FASB, issued Accounting Standards Update, or ASU, No. 2016-02, "Leases," or ASU 2016-02. ASU 2016-02 will require that lease arrangements longer than 12 months result in an entity recognizing an asset and liability equal to the present value of the lease payments in the statement of financial position. ASU 2016-02 is effective for annual periods beginning after December 15, 2018, and interim periods therein. This standard requires a modified retrospective transition approach for all leases existing at, or entered into after, the date of initial application, with an option to use certain transition relief. Early adoption of ASU 2016-02 as of its issuance is permitted. We expect to adopt ASU 2016-02 in 2019. The adoption of this guidance is expected to result in a significant increase in the total assets and liabilities reported on our consolidated balance sheets.
In March 2016, the FASB issued ASU No. 2016-09, "
Compensation-Stock Compensation: Improvements to Employee Share-Based Payment Accounting,
" or ASU 2016-09. ASU 2016-09
will change how companies account for certain aspects of share-based payments to employees
.
The amendments in this update cover such areas as the recognition of excess tax benefits and deficiencies, the classification of those excess tax benefits on the statement of cash flows, an accounting policy election for forfeitures, the amount an employer can withhold to cover income taxes and still qualify for equity classification and the classification of those taxes paid on the statement of cash flows.
The guidance will be effective for annual periods beginning after December 15, 2016, and interim periods therein.
This guidance may be applied either prospectively, retrospectively or using a modified retrospective transition method, depending on the area covered in this update.
We expect to adopt ASU 2016-09 in 2017 including changing our method to account for forfeitures as they occur, which will be applied using the modified retrospective transition method. This guidance will not have a significant impact on our financial statements at the time of adoption.
In November 2016, the FASB issued ASU No. 2016-18, "
Statement of Cash Flows: Restricted Cash
," or ASU 2016-18. ASU 2016-18 provides guidance on the classification of restricted cash in the statement of cash flows. This ASU will require that our statements of cash flows explain the change during the period in the total of cash, cash equivalents and amounts generally described as restricted cash or restricted cash equivalents. The amendments in this ASU are effective for interim periods beginning after December 15, 2017, with early adoption permitted. We will adopt this standard in 2018 and do not currently expect ASU 2016-18 to have a significant impact on our consolidated financial statements at the time of adoption.
F- 12
3. Other Financial Information
Property and Equipment
Property and equipment, leasehold improvements, and related accumulated depreciation and amortization were as follows (in thousands):
|
|
December 31,
|
||||||
|
|
2016
|
2015
|
|||||
|
Manufacturing, clinical and laboratory equipment
|
$
|
7,325
|
|
$
|
7,040
|
|
|
|
Leasehold improvements
|
4,450
|
|
4,441
|
|
|||
|
Office furniture and equipment
|
220
|
|
264
|
|
|||
|
Construction in progress
|
111
|
|
124
|
|
|||
|
12,106
|
|
11,869
|
|
||||
|
Less: accumulated depreciation and amortization
|
(9,601
|
)
|
(8,060
|
)
|
|||
|
Total
|
$
|
2,505
|
|
$
|
3,809
|
|
|
Depreciation and amortization expense was
$1.8 million
,
$1.3 million
and
$1.1 million
for the years ended
December 31, 2016
,
2015
and
2014
, respectively.
Accrued Expenses
Accrued expenses consist of (in thousands):
|
|
December 31,
|
||||||
|
|
2016
|
2015
|
|||||
|
Accrued clinical and related costs
|
$
|
2,316
|
|
$
|
2,675
|
|
|
|
Accrued compensation and related taxes
|
2,154
|
|
2,165
|
|
|||
|
Accrued other
|
186
|
|
431
|
|
|||
|
Total
|
$
|
4,656
|
|
$
|
5,271
|
|
|
4. Commitments and Contingencies
Operating Leases
We lease office, manufacturing and research and development facilities, and equipment under various non-cancellable operating lease agreements with expiration dates in 2019. In August 2016, we entered into amendments to extend certain leases for office and research and development space to January 2019. Our facility leases generally provide for periodic rent increases and many contain escalation clauses. The amended leases do not include renewal options. Our leases require us to pay property taxes and routine maintenance.
We recognize rent expense for our facility operating leases on a straight-line basis. We account for the difference between the minimum lease payments and the straight-line amount as deferred rent. Total rent, property taxes and routine maintenance expense under our operating leases was
$933,000
,
$862,000
and
$835,000
during the years ended
December 31, 2016
,
2015
and
2014
, respectively. Current and long-term deferred rent totaled
$44,000
and
$99,000
at
December 31, 2016
and
$140,000
and
$101,000
at
December 31, 2015
, respectively.
F- 13
Future minimum annual obligations under all non-cancellable operating lease commitments at
December 31, 2016
are as follows (in thousands):
|
|
Total
|
2017
|
2018
|
2019
|
|||||||||||
|
Operating lease obligations
|
$
|
1,461
|
|
$
|
771
|
|
$
|
632
|
|
$
|
58
|
|
|||
Purchase Commitments
The following table summarizes our purchase obligations at
December 31, 2016
(in thousands):
|
|
Payments Due by Period
|
||||||||||||||||||
|
|
Total
|
Less Than
1 Year |
2-3
Years |
3-5
Years |
More Than
5 Years |
||||||||||||||
|
Purchase obligation
|
$
|
286
|
|
$
|
286
|
|
$
|
—
|
|
$
|
—
|
|
$
|
—
|
|
||||
As of
December 31, 2016
, our purchase obligations include existing purchase commitments of
$167,000
with a vendor for raw materials that will be used in manufacturing on an as needed basis. During the years ended
December 31, 2016
,
2015
and
2014
, we purchased
$943,000
,
$1.2 million
and
$1.2 million
, respectively, of materials from this vendor. Our purchase obligations also include a purchase commitment of
$119,000
with a vendor for a component used in our clinical trials that will be manufactured and delivered on an as agreed upon schedule during 2017. During the years ended
December 31, 2016
,
2015
and
2014
, we purchased
$118,000
,
$335,000
and
$574,000
, respectively, of materials from this vendor.
In the course of normal business operations, we also enter into agreements with contract service providers and others. We can elect to discontinue the work under these contracts and purchase orders with notice.
Legal Proceedings
We are not currently a party to any litigation, nor are we aware of any pending or threatened litigation against us that we believe would materially affect our business, operating results, financial condition or cash flows. Our industry is characterized by frequent claims and litigation including securities litigation, claims regarding patent and other intellectual property rights and claims for product liability. As a result, in the future, we may be involved in various legal proceedings from time to time.
5. Fair Value
The following fair value hierarchy table presents information about each major category of our financial assets and liabilities measured at fair value on a recurring basis (in thousands):
|
|
Fair Value Measurement at December 31, 2016
|
||||||||||||||
|
|
Fair Value
|
Level 1
|
Level 2
|
Level 3
|
|||||||||||
|
Assets
|
|||||||||||||||
|
Money market funds
|
$
|
57,715
|
|
$
|
57,715
|
|
$
|
—
|
|
$
|
—
|
|
|||
|
|
Fair Value Measurement at December 31, 2015
|
||||||||||||||
|
|
Fair Value
|
Level 1
|
Level 2
|
Level 3
|
|||||||||||
|
Assets
|
|||||||||||||||
|
Money market funds
|
$
|
80,078
|
|
$
|
80,078
|
|
$
|
—
|
|
$
|
—
|
|
|||
There were
no
liabilities measured at fair value on a recurring basis as of
December 31, 2016
or
2015
. The carrying amounts of other current assets and prepaid expenses, accounts payable, accrued expenses, and other current liabilities approximate their fair values due to their short-term nature.
For our money market funds, unrealized gains and losses are reported as accumulated other comprehensive income (loss), and realized gains and losses are included in interest income on the consolidated statements of operations. There were
no
transfers between Level 1, Level 2 or Level 3 for our assets or liabilities during the periods presented.
F- 14
6. Convertible Preferred Stock and Warrants
Convertible Preferred Stock
In September 2012, we entered into a Senior Preferred Purchase Agreement that authorized the multi-stage issuance of shares of our senior redeemable convertible preferred stock for
$8.00
per share. Prior to termination upon the completion of our IPO in April 2014,
10,767,007
shares were issued under the Senior Preferred Purchase Agreement. Pursuant to the Senior Preferred Purchase Agreement, we granted the investors in the senior preferred stock financing the right, subject to the satisfaction of certain conditions, to purchase additional shares of senior preferred stock for a purchase price of
$8.00
per share at multiple subsequent closings in accordance with a schedule provided in the Senior Preferred Purchase Agreement, referred to as the future stock purchase rights. Where applicable, the purchase price under the Senior Preferred Stock Purchase Agreement was allocated to the future purchase rights and any related stock options at their estimated fair value, as described under “Future Purchase Rights” below.
In connection with the senior preferred stock financing, we entered into a Fourth Amended and Restated Investors’ Rights Agreement (the “Senior Preferred IRA”). The Senior Preferred IRA contains customary registration rights and related provisions, including customary market standoff provisions.
Pursuant to the Senior Preferred Stock Purchase Agreement, in January 2014 we issued an additional
555,000
shares of senior redeemable convertible preferred stock at
$8.00
per share for proceeds of
$4.3 million
, net of issuance costs of
$135,000
. Also in January 2014, we completed the sale of
1.5 million
shares of our senior redeemable convertible preferred stock at a price of
$8.00
per share in a private placement to new investors for proceeds of
$12.0 million
, net of issuance costs of
$31,000
. In February 2014, we completed a pre-emptive rights offering, triggered by the private placement for
241,016
shares of our senior redeemable convertible preferred stock at a price of
$8.00
per share for proceeds of
$1.9 million
, net of issuance costs of
$35,000
.
In conjunction with the completion of our IPO on April 2014, all the outstanding shares of our senior redeemable convertible preferred stock were converted into common stock on a one-to-one basis and the remaining unamortized discounts of
$3.8 million
and issuance costs of
$727,000
were recognized as a deemed dividend and accretion to redemption value of the redeemable convertible preferred stock, respectively, in the statement of operations, and all shares of our junior convertible preferred stock were converted into common stock on a
one-to-one basis
and the remaining unamortized issuance costs of
$31,000
were recognized as accretion to redemption value of the junior convertible preferred stock in the statement of operations.
Future Purchase Rights
Pursuant to the Senior Preferred Purchase Agreement, we granted to the investors in the senior preferred stock financing the future purchase rights, subject to the satisfaction of certain conditions, to purchase additional shares of senior preferred stock for a purchase price of
$8.00
per share at multiple subsequent closings in accordance with a schedule provided in the Senior Preferred Purchase Agreement. These future purchase rights for additional shares of our senior preferred stock were legally detachable from the shares of the underlying senior preferred stock and, as a result, were considered freestanding instruments accounted for separately from the shares of senior preferred stock. As the future purchase rights were exercisable for shares of our redeemable convertible preferred stock, the future purchase rights were instruments that embodied obligations to transfer assets and were classified as liabilities under the accounting guidance that distinguishes liabilities from equity. All remaining future purchase rights associated with our preferred stock were terminated and the remaining unamortized beneficial conversion balance of
$878,000
was recognized as a reduction to equity at the effective date of our IPO in April 2014.
Warrants
We issued warrants to purchase redeemable convertible preferred stock in connection with financing activities or for consulting services. In connection with a junior preferred stock financing in February 2012, all warrants to purchase Series B, Series C and Series D preferred stock converted to common stock warrants. We had warrants outstanding and exercisable for
240,620
and
250,646
shares of common stock as of
December 31, 2016
and
2015
, respectively, as all
107
of the Series B and all
9,919
of the Series C warrants expired during the year ended December 31, 2016. The Series D warrants outstanding at December 31, 2016 have an exercise price of
$92.99
and expire in September 2019.
F- 15
7. Common Stock
Certificate of Incorporation
The material terms of our amended restated certificate of incorporation, which became effective as of the closing of our IPO, are as follows:
Authorized Shares
Our amended and restated certificate of incorporation authorizes the company to issue
150,000,000
shares of stock consisting of
130,000,000
shares of common stock, par value of
$0.0001
per share and
20,000,000
shares of preferred stock, par value
$0.0001
per share.
Dividends
Subject to preferences that may be applicable to any then outstanding preferred stock, holders of common stock are entitled to receive ratably those dividends, if any, as may be declared from time to time by our board of directors out of legally available funds.
Liquidation Preference
In the event of our liquidation, dissolution or winding up, holders of common stock will be entitled to share ratably in the net assets legally available for distribution to stockholders after the payment of all of our debts and other liabilities and the satisfaction of any liquidation preferences that may be granted to the holders of any then outstanding shares of preferred stock.
Rights and Preferences
Holders of common stock have no preemptive, conversion or subscription rights, and there are no redemption or sinking fund provisions applicable to the common stock. The rights, preferences and privileges of the holders of common stock are subject to, and may be adversely affected by, the rights of the holders of shares of any series of preferred stock, which we may designate and issue in the future.
Voting Rights
Each holder of common stock is entitled to
one
vote for each share on all matters submitted to a vote of the stockholders, including the election of directors. Our amended and restated certificate of incorporation and amended and restated bylaws do not provide for cumulative voting rights. Because of this absence of cumulative voting, the holders of a majority of the shares of common stock entitled to vote in any election of directors can elect all of the directors standing for election, if they should so choose. In addition, our amended and restated certificate of incorporation also provides that our directors may be removed only for cause by the affirmative vote of the holders of at least
75%
of the combined voting power of all our stockholders entitled to vote on the election of directors, voting together as a single class.
Subject to supermajority votes for some matters, matters shall be decided by the affirmative vote of our stockholders having a majority in voting power of the votes cast by the stockholders present or represented and voting on such matter, provided that the holders of our common stock are not allowed to vote on any amendment to our certificate of incorporation that relates solely to the terms of one or more series of preferred stock if the holders of such affected series are entitled, either separately or together with the holders or one or more such series, to approve such amendment. The affirmative vote of the holders of at least
75%
of the votes that all of our stockholders would be entitled to cast in any annual election of directors and, in some cases, the affirmative vote of a majority of minority stockholders entitled to vote in any annual election of directors are required to amend or repeal our bylaws, amend or repeal certain provisions of our certificate of incorporation, approve certain transactions with certain affiliates, or approve the sale or liquidation of the company. The vote of a majority of minority stockholders applies when an individual or entity and its affiliates or associates together own more than
50%
of the voting power of our then outstanding capital stock, excluding any such person that owned
15%
or more of our outstanding voting stock immediately prior to our IPO, and such a vote would require the approval of the majority of our voting stock, excluding the voting stock held by such a majority holder.
F- 16
Public Offerings of Common Stock
In April 2014, we completed an IPO selling
4,500,000
shares of our common stock at
$12.00
per share and received net proceeds of
$50.2 million
after underwriters’ discounts and commissions. In addition, we incurred
$5.8 million
in offering expenses, resulting in total costs of
$9.6 million
and net offering proceeds to us of
$44.4 million
. In May 2014, the underwriters exercised their option to purchase an additional
675,000
shares of our common stock at
$12.00
per share in full. As a result, we received an additional
$7.5 million
in net proceeds after underwriters’ discounts and commissions of
$567,000
, for total net proceeds of
$51.9 million
from the IPO.
In October 2014, we completed a follow-on public offering selling
2,000,000
shares of our common stock at
$17.50
per share and received net proceeds of
$32.6 million
after underwriters’ discounts and commissions. In addition, we incurred
$511,000
in offering expenses, resulting in total costs of
$3.0 million
and net offering proceeds to us of
$32.0 million
. In November 2014, the underwriters exercised a portion of their option and purchased an additional
50,000
shares of our common stock at
$17.50
per share. As a result, we received an additional
$814,000
in net proceeds after underwriters’ discounts and commissions, for total net proceeds from the follow-on public offering of
$32.9 million
, net of discounts, commissions and costs from the offering.
We currently have an effective shelf registration statement on Form S-3 on file. The shelf registration statement permits: (i) the offering, issuance and sale by us of up to a maximum aggregate offering price of
$200.0 million
of common stock, preferred stock, warrants, debt securities, and/or units in one or more offerings and in any combination; (ii) sales of up to
2.5 million
shares of common stock by certain selling stockholders; and (iii) the offering, issuance and sale by us of up to a maximum aggregate offering price of
$75.0 million
of our common stock that may be issued and sold under an “at-the-market” sales agreement, or ATM, with Cantor Fitzgerald & Co.
In October 2015, we completed an additional follow-on public offering raising gross proceeds of
$34.5 million
leaving
$165.5 million
available under the shelf registration statement,
$75.0 million
of which may be offered, issued and sold under the “at-the-market” sales agreement. Under this follow-on public offering we sold
6,272,727
shares of our common stock, which includes an additional
818,181
shares of our common stock sold upon full exercise of the underwriter's option to purchase additional shares of common stock, at a price to the public of
$5.50
per share. The net proceeds to us from the follow-on offering were
$32.1 million
, after deducting underwriting discounts and commissions of
$2.1 million
and estimated offering expenses of
$280,000
.
During the year ended
December 31, 2016
, we raised gross proceeds of
$12.2 million
pursuant to the ATM selling
1.5 million
shares of our common stock at a weighted average price of
$7.90
per share. The net proceeds to us from the ATM were
$11.7 million
after deducting underwriter commissions of
$366,000
and estimated offering expenses of
$173,000
. At
December 31, 2016
, there was
$153.3 million
available under the shelf registration statement, of which
$62.8 million
may be offered, issued and sold at a future date under the ATM.
Private Placement of Common Stock
In August 2016, we entered into a securities purchase agreement, or the Securities Purchase Agreement, with a newly-appointed board member pursuant to which we agreed to issue and sell an aggregate of
$700,000
of our common stock in a private placement of shares that have not been registered under the Securities Act of 1933, or the Securities Act, by reason of a specific exemption from the registration provisions of the Securities Act. On August 12, 2016, we sold
118,243
shares of common stock under the Securities Purchase Agreement at a price of
$5.92
per share.
Stock Reserved for Future Issuance
Shares reserved for future issuance at
December 31, 2016
are as follows:
|
|
Number of
Shares |
|
|
Common stock options outstanding
|
4,841,274
|
|
|
Common stock options available for future grant
|
170,097
|
|
|
Exercise of common stock warrants outstanding
|
240,620
|
|
|
Total common shares reserved for future issuance
|
5,251,991
|
|
F- 17
8. Stock Compensation Plans
Equity Incentive Plans
Our 2014 Equity Incentive Plan, or the 2014 Plan, became effective in April 2014 and replaced our 2012 Stock Option Plan, or the 2012 Plan, with respect to future awards. The 2014 Plan provides for the grant of stock options, restricted stock, restricted stock units, stock appreciation rights, performance awards and performance units to employees, directors, and consultants.
Shares available for grant under the 2014 Plan include any shares remaining available or becoming available in the future under the 2012 Plan due to cancellation or forfeiture. In addition, the 2014 Plan provides for annual increases in the number of shares available for issuance thereunder beginning upon its effective date in April 2014, and on each annual anniversary, equal to the lower of:
|
•
|
1,200,000
shares of our common stock;
|
|
•
|
3%
of the outstanding shares of our common stock on the second-to-the-last day prior to each anniversary date of the effectiveness date of our IPO; or
|
|
•
|
an amount as our board of directors may determine.
|
Pursuant to such provision, the number of shares available for issuance under the 2014 Plans was increased by
932,174
shares effective April 16, 2016. Shares available for grant under the 2014 Plan totaled
170,097
shares as of
December 31, 2016
.
Option grants made under the 2014 Plan and the 2012 Plan generally vest over one or
four
years except for performance-based stock options. Our performance-based stock options will fully vest and become exercisable only on achievement of the performance conditions while the participant is a continuing service provider. Options generally expire ten years from the grant date or earlier in accordance with the terms of the plans and the related stock option agreement.
In 2015, our board of directors (the “Board”) approved grants for
738,660
performance-based stock options to certain employees and consultants under the 2014 Plan. The performance-based stock options will fully vest on the third anniversary of the grant date if (i) our VTL-308 clinical trial has achieved statistical significance in its primary efficacy endpoint and (ii) the participant is a continuing service provider through the third anniversary of the grant date (as such terms are defined in the 2014 Plan). Vesting of the performance-based stock options will not be accelerated if the performance goal is achieved in less than
three years
. As of
December 31, 2016
and
2015
, we deemed the performance condition as being probable and are recording stock-based compensation expense over the requisite service period for all performance-based stock options. The performance-based stock options have exercise prices ranging from
$4.57
to
$7.69
per share, the closing sales price of our common stock on the grant dates, and expire
ten years
from the grant date (or earlier in accordance with the terms of the 2014 Plan and the related stock option agreement).
Our 2012 Stock Option Plan, or the 2012 Plan, provided for the grant of stock options, restricted stock, restricted stock units, stock purchase rights, and performance awards to employees, directors, and consultants. Option grants under our 2012 Plan are exercisable immediately, subject to a repurchase right that lapses as the option vests. Through
December 31, 2016
, options for the purchase of
74,970
shares of our common stock have been exercised prior to vesting, all of which were vested and not subject to repurchase as of
December 31, 2016
. We did not repurchase any shares related to these early exercises.
F- 18
The following table summarizes stock option activity:
|
Options
|
Weighted-
Average Exercise Price |
Weighted-
Average Remaining Contractual Term (Years) |
Aggregate
Intrinsic Value (In thousands) |
|||||||||
|
Outstanding as of January 1, 2016
|
3,716,520
|
|
$
|
7.76
|
|
|||||||
|
Granted
|
1,205,499
|
|
$
|
8.09
|
|
|||||||
|
Exercised
|
(8,098
|
)
|
$
|
3.92
|
|
|||||||
|
Forfeited and expired
|
(72,647
|
)
|
$
|
11.86
|
|
|||||||
|
Outstanding as of December 31, 2016
|
4,841,274
|
|
$
|
7.78
|
|
7.3
|
$
|
1,559
|
|
|||
|
Options vested and expected to vest as of December 31, 2016
|
4,744,348
|
|
$
|
7.78
|
|
7.3
|
$
|
1,559
|
|
|||
|
Options exercisable as of December 31, 2016
|
2,968,006
|
|
$
|
7.86
|
|
6.2
|
$
|
1,559
|
|
|||
The aggregate intrinsic value of options is calculated as the difference between the exercise price of the options and the fair value of our common stock for those shares that had exercise prices lower than the fair value of our common stock as of
December 31, 2016
. The number of options vested and expected to vest is calculated as the total number of options vested plus the number of unvested options remaining after applying our estimated forfeiture rate.
The following table summarizes information about stock options (in thousands):
|
|
Year Ended
December 31, |
||||||||||
|
|
2016
|
2015
|
2014
|
||||||||
|
Aggregate intrinsic value of options exercised
|
$
|
39
|
|
$
|
1,235
|
|
$
|
1,972
|
|
||
We have not capitalized any stock based-compensation into the cost of inventory nor have we recognized an income tax benefit from the exercise of any stock options as we continue to record a full valuation allowance on our deferred tax assets.
Stock-based Compensation Expense
The weighted-average grant date fair value of stock options granted to employees and directors during the years ended
December 31, 2016
,
2015
and
2014
was
$5.70
,
$5.81
and
$11.87
, respectively. The following are the ranges of underlying assumptions used to determine the fair value of stock options granted to employees and non-employees:
|
|
Years Ended December 31,
|
|||||||
|
|
2016
|
2015
|
2014
|
|||||
|
Employees and Directors:
|
||||||||
|
Risk-free interest rate
|
1.47% - 1.72%
|
|
1.71% - 1.85%
|
|
1.53% - 1.89%
|
|
||
|
Expected dividend yield
|
—
|
%
|
—
|
%
|
—
|
%
|
||
|
Expected volatility
|
77% - 86%
|
|
73% - 92%
|
|
80% - 85%
|
|
||
|
Expected term of options (years)
|
5.9 - 6.0
|
|
5.8 - 6.0
|
|
6.0 - 6.2
|
|
||
|
Range of common stock value
|
$5.90 - $8.97
|
|
$4.57 - $26.71
|
|
$7.55 – $24.04
|
|
||
|
Non-Employees:
|
||||||||
|
Risk-free interest rate
|
0.45% - 1.93%
|
|
0.10% - 1.93%
|
|
0.11% - 1.27%
|
|
||
|
Expected dividend yield
|
—
|
%
|
—
|
%
|
—
|
%
|
||
|
Expected volatility
|
77% - 97%
|
|
56% - 94%
|
|
73% - 85%
|
|
||
|
Expected term of options (years)
|
0.2 - 5.5
|
|
0.3 - 6.0
|
|
1.0 - 4.0
|
|
||
|
Range of common stock value
|
$4.35 - $9.07
|
|
$4.04 - $25.01
|
|
$11.31 - $27.24
|
|
||
F- 19
2014 Valuation Analyses
Due to our management’s and board of directors’ decision to pursue an IPO, coupled with our belief that we could reasonably estimate the form and timing of potential liquidity events, we utilized a Probability Weighted Expected Return Method, or PWERM, for our 2014 valuations prior to the completion of our IPO in April 2014. Under this method, the implied fair value of our common stock is estimated based upon an analysis of future values assuming various outcomes. The value is based on the probability-weighted present value of expected future investment returns considering each of the possible outcomes available to us as well as the rights of each share class. The possible outcomes considered are based upon an analysis of future scenarios as described below:
|
•
|
closing of an initial public offering;
|
|
•
|
sale to a strategic acquirer;
|
|
•
|
continuation as a private company with subsequent liquidation event; and
|
|
•
|
dissolution.
|
Critical assumptions required to perform the PWERM include the following:
|
•
|
Scenarios: Expected future events were identified.
|
|
•
|
Scenario probabilities: Estimates of the probability of occurrence of each event were identified.
|
|
•
|
Valuation: Expected future values under each scenario were estimated.
|
|
•
|
Timing: Expected timing to the event under each scenario was estimated.
|
|
•
|
Risk adjusted discount rates: Risk-adjusted discount rates were selected for each equity class based on the rights and preferences of each equity class and market data.
|
|
•
|
Discounts: Appropriate minority or marketability discounts, if any, required to estimate the per share value of the various equity classes were determined.
|
In determining the implied fair value of our common stock in the IPO scenario, we assumed that the redeemable convertible preferred stock then outstanding would be converted into common stock. In allocating value to our common stock in the merger or sale scenario, we first allocated to our outstanding shares of redeemable convertible preferred stock the greater of the liquidation preference of the redeemable convertible preferred stock and the amount that would have been payable had all such shares of redeemable convertible preferred stock been converted to common stock.
There is inherent uncertainty in these estimates and, if we had made different assumptions, the fair value of the underlying common stock and amount of our stock-based compensation expense, net loss and net loss per share amounts would have differed.
F- 20
February 12, 2014 Valuation Analysis
Our analysis considered the following probability-weighted scenarios:
|
Scenario
|
Weight
|
|
|
IPO by May 15, 2014
|
25
|
%
|
|
Sale by September 30, 2015
|
10
|
%
|
|
Private company
|
50
|
%
|
|
Dissolution
|
15
|
%
|
A discount for lack of marketability was applied for common stockholders of
8%
,
20%
and
28%
for the IPO, sale and private company scenarios, respectively, which resulted in an implied fair value of
$7.55
per share. The increase in fair value of our common stock from December 31, 2013 was primarily related to the increase in likelihood of an IPO scenario based on progress toward a public offering, coupled with a slight decrease in discount for lack of marketability for the IPO and sale scenarios. These were partially offset by dilution from the issuance of additional shares of our senior redeemable convertible preferred stock in January 2014.
March 31, 2014 Valuation Analysis
Our analysis considered the following probability-weighted scenarios:
|
Scenario
|
Weight
|
|
|
IPO by April 15, 2014
|
65
|
%
|
|
Sale by September 30, 2015
|
10
|
%
|
|
Private company
|
15
|
%
|
|
Dissolution
|
10
|
%
|
A discount for lack of marketability was applied for common stockholders of
2%
,
17%
and
27%
for the IPO, sale and private company scenarios, respectively, which resulted in an implied fair value of
$11.30
per share. The increase in fair value of our common stock from December 31, 2013 and February 12, 2014, was related to the increase in likelihood of an IPO scenario as significant progress had been completed toward a public offering and the decrease in discount for lack of marketability for the IPO scenario that reflected the proximity to the projected time to liquidity. These were slightly offset by dilution from the issuance of additional shares of our senior redeemable convertible preferred stock in January and February 2014, as applicable.
The following tables summarize the allocation of stock-based compensation expense to employees and non-employees (in thousands):
|
|
Years Ended December 31,
|
||||||||||
|
|
2016
|
2015
|
2014
|
||||||||
|
Employees and Directors:
|
|||||||||||
|
Research and development
|
$
|
1,758
|
|
$
|
1,412
|
|
$
|
763
|
|
||
|
General and administrative
|
2,751
|
|
2,012
|
|
937
|
|
|||||
|
Total
|
$
|
4,509
|
|
$
|
3,424
|
|
$
|
1,700
|
|
||
|
Non-Employees:
|
|||||||||||
|
Research and development
|
$
|
153
|
|
$
|
490
|
|
$
|
757
|
|
||
|
General and administrative
|
16
|
|
115
|
|
53
|
|
|||||
|
Total
|
$
|
169
|
|
$
|
605
|
|
$
|
810
|
|
||
As of
December 31, 2016
, there was
$7.9 million
and
$245,000
of total compensation cost related to unvested employee and non-employee stock option awards, respectively, not yet recognized. The fair value of the non-employee stock options is re-measured at each reporting date and, accordingly, the expense to be recognized will change, primarily with changes in the market value of our common stock. Stock-based compensation expense for both employee and nonemployee stock option awards is expected to be recognized over a remaining weighted-average vesting period of
2.2
years.
F- 21
9. Income Taxes
Our net loss before income tax was subject to tax in the following jurisdictions for the following periods (in thousands):
|
|
Year Ended December 31,
|
||||||||||
|
|
2016
|
2015
|
2014
|
||||||||
|
United States
|
$
|
(40,929
|
)
|
$
|
(51,779
|
)
|
$
|
(47,482
|
)
|
||
|
Foreign
|
(40
|
)
|
(244
|
)
|
(185
|
)
|
|||||
|
$
|
(40,969
|
)
|
$
|
(52,023
|
)
|
$
|
(47,667
|
)
|
|||
Our rate reconciliation consists of the following:
|
|
Year Ended December 31,
|
|||||||
|
|
2016
|
2015
|
2014
|
|||||
|
Federal statutory rate
|
35.0
|
%
|
35.0
|
%
|
35.0
|
%
|
||
|
State tax (net of federal benefit)
|
0.1
|
%
|
5.8
|
%
|
5.4
|
%
|
||
|
Research and development credits
|
2.9
|
%
|
3.0
|
%
|
3.8
|
%
|
||
|
Stock options
|
(1.5
|
)%
|
(1.0
|
)%
|
(0.5
|
)%
|
||
|
Warrants/purchase rights liabilities
|
0.0
|
%
|
0.0
|
%
|
2.2
|
%
|
||
|
Foreign net operating losses
|
(0.2
|
)%
|
(0.2
|
)%
|
(0.4
|
)%
|
||
|
Uncertain tax positions for state net operating loss
|
(16.0
|
)%
|
0.0
|
%
|
0.0
|
%
|
||
|
Other
|
(2.3
|
)%
|
0.7
|
%
|
(0.4
|
)%
|
||
|
Change in valuation allowance
|
(18.0
|
)%
|
(43.3
|
)%
|
(45.1
|
)%
|
||
|
Effective tax rate
|
0.0
|
%
|
0.0
|
%
|
0.0
|
%
|
||
Significant components of our deferred tax assets are shown below. A valuation allowance has been established as realization of such deferred tax assets has not met the more likely-than-not threshold requirement. If our judgment changes and it is determined that we will be able to realize these deferred tax assets, the tax benefits relating to any reversal of the valuation allowance on deferred tax assets will be accounted for as a reduction to income tax expense.
|
|
December 31,
|
||||||
|
|
2016
|
2015
|
|||||
|
|
(in thousands)
|
||||||
|
Deferred tax assets:
|
|||||||
|
Net operating loss carryforwards
|
$
|
58,722
|
|
$
|
53,218
|
|
|
|
Research and development tax credits
|
6,056
|
|
4,903
|
|
|||
|
Stock compensation
|
2,760
|
|
2,000
|
|
|||
|
Foreign net operating loss carryforwards
|
256
|
|
333
|
|
|||
|
Other, net
|
1,816
|
|
1,823
|
|
|||
|
Total deferred tax assets
|
69,610
|
|
62,277
|
|
|||
|
Less valuation allowance
|
(69,610
|
)
|
(62,277
|
)
|
|||
|
$
|
—
|
|
$
|
—
|
|
||
We have incurred net operating losses each year since inception that is due to our history as a development stage company with no realized revenues from our planned principal operations. These cumulative operating losses provide significant negative evidence in the determination of whether or not we will be able to realize our deferred tax assets such as our net operating losses and other favorable temporary differences. Our product candidate is in clinical trials, and there can be no assurance that it will ever be approved or that it will generate taxable income. As a result, we have maintained a full valuation allowance against the entire balance of deferred tax assets since the date of inception. The valuation allowance increased by
$7.3 million
and
$22.5 million
for the years ended
December 31, 2016
and
2015
, respectively.
F- 22
As of
December 31, 2016
, we had available net operating loss, or NOL, carryforwards of approximately
$168.5 million
and
$159.6 million
for federal and state income tax purposes, respectively. The state NOL carryforwards include
$149.1 million
in California NOLs generated in 2013 through 2016, which have been determined to be unrecognized tax positions during 2016 and, accordingly, have not been included in our deferred tax assets as of December 31, 2016. The federal and state NOLs begin to expire in 2023 and 2017, respectively. As of
December 31, 2016
, we have federal and state research and development tax credits available for income tax purposes of approximately
$5.1 million
and
$3.7 million
, respectively. The federal research and development credits begin to expire in 2023 and the state research and development tax credits do not expire. These carryforwards are net of the Section 382 and 383 limitations discussed below.
During the year ended
December 31, 2016
,
$0.3 million
of NOLs from our Chinese subsidiary expired leaving
$1.0 million
of NOLs from our Chinese subsidiary as of
December 31, 2016
. There will be further expirations of this NOL in 2017 and beyond.
Sections 382 and 383 of the Internal Revenue Code (the IRC) limit a company’s ability to utilize certain net operating losses and tax credit carryforwards in the event of a cumulative change in ownership in excess of 50%, as defined. We experienced changes in ownership, as defined in Section 382, in February 2012 and in December 2013. As a result, the deferred tax asset associated with our federal and state net operating loss carryforwards and federal and state research credits have been reduced based on the Section 382 limitations. The amount of the reduction in our deferred tax assets is based on the estimated amount of the NOL carryforwards and federal and state research credits we believe cannot be used based on the estimated amount of our Section 382 annual limitation. We have reduced our deferred tax assets by
$23.2 million
and have estimated that approximately
$58.7 million
and
$45.3 million
, respectively, of our federal and state NOLs for tax purposes cannot be used in future years as a result of this change in ownership. Additionally, we have estimated that approximately
$2.2 million
and
$1.6 million
of our federal and state research credits, respectively, cannot be used in future years. We have not experienced any additional changes as defined in Section 382 through
December 31, 2016
. If additional Section 382 changes occur, limitations against the utilization of net operating losses and credits could further impact our future cash flows, but would not impact our
2016
consolidated financial statements, due to the existence of a full valuation allowance against our deferred tax assets.
The following table summarizes the activity related to our unrecognized tax benefits (in thousands):
|
|
Year Ended
December 31, |
||||||
|
|
2016
|
2015
|
|||||
|
Balance at beginning of year
|
$
|
1,422
|
|
$
|
938
|
|
|
|
Additions based on tax positions related to the current year
|
4,408
|
|
484
|
|
|||
|
Changes for prior period tax positions
|
10,265
|
|
—
|
|
|||
|
Balance at end of year
|
$
|
16,095
|
|
$
|
1,422
|
|
|
Prior to and in 2016, our unrecognized tax positions relate to expenses qualifying for research and development credits. Additions and changes for prior period tax positions in 2016 also includes the apportionment of losses to California. In 2013, California adopted a single factor, sales, for apportioning income and losses to the state. Although completely offset by our valuation allowance, we had recognized NOL carryforwards from 2013 through 2015 based on a multiple factor apportionment based on salaries, property and sales in the state. This position was based on prior court rulings supporting the use of the multiple factor apportionment. This ruling was overturned by the California Supreme Court in December 2015. This ruling was filed with the U.S. Supreme Court and in October 2016, the U.S. Supreme Court declined to hear the case. California has no regulations or guidiance nor have there been any rulings addressing how a company with no sales should apportion losses to California. As most of our operations are in California, we intend to file our tax returns using a multiple factor apportionment until such time as California provides a ruling or guidance on such an apportionment.
We do not anticipate any significant changes in the amount of unrecognized tax positions over the next twelve months; however, should California rule or provide guidance on apportionment to companies operating in the state, we would again recognize deferred tax assets for NOL carryforwards for losses apportioned to California. Due to the full valuation allowance that we have on our net deferred tax asset balance, there are no unrecognized tax positions that would impact the effective tax rate if recognized.
F- 23
We are subject to U.S. federal, California and various other states and Chinese income taxes. We are no longer subject to U.S. federal or state income tax examination by tax authorities for tax returns filed for the years ended on or before December 31, 2011. However, to the extent allowed by law, the taxing authorities may have the right to examine the period from 2003 through 2016 where NOLs were generated and carried forward, and make adjustments to the amount of the NOL carryforward. We are not currently under examination by any federal or state jurisdictions.
10. Selected Quarterly Data (unaudited)
The following financial information reflects all normal recurring adjustments, which are, in the opinion of management, necessary for a fair statement of the results of the interim periods. Summarized quarterly data for
2016
and
2015
are as follows (in thousands, except per share data):
|
|
For the Quarters Ended
|
|
|||||||||||||||||
|
|
March 31
|
June 30
|
September 30
|
December 31
|
Total Year
|
||||||||||||||
|
2016:
|
|||||||||||||||||||
|
Operating expenses
|
$
|
9,656
|
|
$
|
9,546
|
|
$
|
10,239
|
|
$
|
11,825
|
|
$
|
41,266
|
|
||||
|
Net loss and net loss attributable to common stockholders
|
$
|
(9,589
|
)
|
$
|
(9,468
|
)
|
$
|
(10,178
|
)
|
$
|
(11,734
|
)
|
$
|
(40,969
|
)
|
||||
|
Basic and diluted net loss per share attributable to common stockholders (1)
|
$
|
(0.31
|
)
|
$
|
(0.30
|
)
|
$
|
(0.32
|
)
|
$
|
(0.37
|
)
|
|||||||
|
2015:
|
|||||||||||||||||||
|
Operating expenses
|
$
|
14,817
|
|
$
|
15,078
|
|
$
|
12,335
|
|
$
|
9,890
|
|
$
|
52,120
|
|
||||
|
Net loss and net loss attributable to common stockholders
|
$
|
(14,758
|
)
|
$
|
(15,106
|
)
|
$
|
(12,300
|
)
|
$
|
(9,859
|
)
|
$
|
(52,023
|
)
|
||||
|
Basic and diluted net loss per share attributable to common stockholders (1)
|
$
|
(0.62
|
)
|
$
|
(0.63
|
)
|
$
|
(0.51
|
)
|
$
|
(0.34
|
)
|
|||||||
(1) Net loss per share is computed independently for each of the quarters presented. Therefore, the sum of the quarterly per share calculations will not necessarily equal the annual per share calculation.
F- 24
SIGNATURES
Pursuant to the requirements of Section 13 or 15(d) of the Securities Exchange Act of 1934, the registrant has duly caused this Annual Report on Form 10-K to be signed on its behalf by the undersigned, thereunto duly authorized.
|
Vital Therapies, Inc.
|
||
|
Date: March 7, 2017
|
By:
|
/s/ Terence E. Winters, Ph.D.
|
|
Terence E. Winters, Ph.D.
|
||
|
Chief Executive Officer
|
||
POWER OF ATTORNEY
KNOW ALL MEN BY THESE PRESENTS, that each person whose signature appears below constitutes and appoints Terence E. Winters and Michael V. Swanson, and each of them, his or her true and lawful attorneys-in-fact, each with full power of substitution, for him or her in any and all capacities, to sign any amendments to this Annual Report on Form 10-K and to file the same, with exhibits thereto and other documents in connection therewith, with the Securities and Exchange Commission, hereby ratifying and confirming all that each of said attorneys-in-fact or their substitute or substitutes may do or cause to be done by virtue hereof.
Pursuant to the requirements of the Securities Exchange Act of 1934, this Annual Report on Form 10-K has been signed below by the following persons on behalf of the registrant and in the capacities and on the dates indicated.
|
Signature
|
|
Title
|
|
Date
|
|
|
|
|||
|
/s/ TERENCE E. WINTERS, Ph.D.
|
|
Co-Chairman and Chief Executive Officer (Principal Executive Officer)
|
|
March 7, 2017
|
|
Terence E. Winters, Ph.D.
|
||||
|
/s/ MICHAEL V. SWANSON
|
|
Executive Vice President and Chief Financial Officer
(Principal Financial Officer and Principal Accounting Officer)
|
|
March 7, 2017
|
|
Michael V. Swanson
|
||||
|
/s/ MUNEER A. SATTER
|
|
Co-Chairman and Lead Director
|
|
March 7, 2017
|
|
Muneer A. Satter
|
||||
|
/s/ JEAN-JACQUES BIENAIMÉ
|
|
Director
|
|
March 7, 2017
|
|
Jean-Jacques Bienaimé
|
||||
|
/s/ CHERYL L. COHEN
|
|
Director
|
|
March 7, 2017
|
|
Cheryl L. Cohen
|
||||
|
/s/ PHILIP M. CROXFORD
|
|
Director
|
|
March 7, 2017
|
|
Philip M. Croxford
|
||||
|
/s/ DOUGLAS E. GODSHALL
|
|
Director
|
|
March 7, 2017
|
|
Douglas E. Godshall
|
||||
|
/s/ ERROL R. HALPERIN
|
|
Director
|
|
March 7, 2017
|
|
Errol R. Halperin
|
||||
|
/s/ FAHEEM HASNAIN
|
|
Director
|
|
March 7, 2017
|
|
Faheem Hasnain
|
||||
|
/s/ J. MICHAEL MILLIS, M.D.
|
|
Director
|
|
March 7, 2017
|
|
J. Michael Millis, M.D.
|
||||
|
/s/ LOWELL E. SEARS
|
|
Director
|
|
March 7, 2017
|
|
Lowell E. Sears
|
||||
|
/s/ RANDOLPH C. STEER, M.D., PH.D.
|
|
Director
|
|
March 7, 2017
|
|
Randolph C. Steer, M.D., Ph.D.
|
||||
F- 26
TABLE OF CONTENTS
Part IItem 1. BusinessItem 1A. Risk FactorsItem 1B. Unresolved Staff CommentsItem 2. PropertiesItem 3. Legal ProceedingsItem 4. Mine Safety DisclosuresPart IIItem 5. Market For Registrant S Common Equity, Related Stockholder Matters and Issuer Purchases Of Equity SecuritiesItem 6. Selected Financial DataItem 7. Management S Discussion and Analysis Of Financial Condition and Results Of OperationsItem 7A. Quantitative and Qualitative Disclosures About Market RiskItem 8. Financial Statements and Supplementary DataItem 9. Changes in and Disagreements with Accountants on Accounting and Financial DisclosureItem 9A. Controls and ProceduresItem 9B. Other InformationPart IIIItem 10. Directors, Executive Officers and Corporate GovernanceItem 11. Executive CompensationItem 12. Security Ownership Of Certain Beneficial Owners and Management and Related Stockholder MattersItem 13. Certain Relationships and Related Transactions, and Director IndependenceItem 14. Principal Accounting Fees and ServicesPart IVItem 15. Exhibits, Financial Statement Schedules